User login
FFR-Guided or Angiography-Guided Nonculprit Lesion PCI in Patients With STEMI Without Cardiogenic Shock
Study Overview
Objective. To determine whether fractional flow reserve (FFR)-guided percutaneous coronary intervention (PCI) of nonculprit lesion in patients with ST-segment elevation myocardial infarction (STEMI) is superior to angiography-guided PCI.
Design. Multicenter randomized control trial blinded to outcome, conducted in 41 sites in France.
Setting and participants. A total of 1163 patients with STEMI and multivessel coronary disease, who had undergone successful PCI to the culprit lesion were randomized to either FFR-guided PCI or angiography-guided PCI for nonculprit lesions. Randomization was stratified according to the trial site and timing of the procedure (immediate or staged).
Main outcome measures. The primary outcome was a composite of death from any cause, nonfatal myocardial infarction (MI) or unplanned hospitalization leading to urgent revascularization at 1 year.
Main results. At 1 year, the primary outcome occurred in 32 of 586 patients (5.5%) in the FFR-guided group and in 24 of 577 (4.2%) in the angiography-guided group (hazard ratio [HR], 1.32; 95% CI, 0.78-2.23; P = .31). The rate of death (1.5% vs 1.7%), nonfatal MI (3.1% vs 1.7%), and unplanned hospitalization leading to urgent revascularization (3.1% vs 1.7%) were also similar between FFR-guided and angiography-guided groups.
Conclusion. Among patients with STEMI and multivessel disease who had undergone successful PCI of the culprit vessel, an FFR-guided strategy for complete revascularization was not superior to angiography-guided strategy for reducing death, MI, or urgent revascularization at 1 year.
Commentary
Patients presenting with STEMI often have multivessel disease.1 Recently, multiple studies have reported the benefit of nonculprit vessel revascularization in patients presenting with hemodynamically stable STEMI compared to culprit-only strategy including the most recent COMPLETE trial which showed reduction in death and MI.2-6 However, the previous studies have variable design in evaluating the nonculprit vessel, some utilized FFR guidance, while others used angiography guidance. Whether FFR-guided PCI of nonculprit vessel can improve outcome in patients presenting STEMI remains unknown.
In the FLOWER-MI study, Puymirat et al investigated the use of FFR compared to angiography-guided nonculprit vessel PCI. A total of 1163 patients presenting with STEMI and multivessel disease who had undergone successful PCI to the culprit vessel, were randomized to either FFR guidance or angiography guidance among 41 centers in France. The authors found that after 1 year, there was no difference in composite endpoint of death, nonfatal MI or unplanned hospitalization leading to urgent revascularization in the FFR-guided group compared to angiography-guided group (5.5% vs 4.2%, HR, 1.32; 95% CI, 0.678-2.23; P = .31). There was also no difference in individual components of primary outcomes or secondary outcomes such as rate of stent thrombosis, any revascularization, or hospitalization.
There are a few interesting points to consider in this study. Ever since the Fractional Flow Reserve vs Angiography for Multivessel Evaluation (FAME) trial reported the lower incidence of major adverse events in routine FFR measurement during PCI compared to angiography-guided PCI, physiological assessment has become the gold standard for treatment of stable ischemic heart disease.7 However, the results of the current FLOWER-MI trial were not consistent with the FAME trial and there are few possible reasons to consider.
First, the use of FFR in the setting of STEMI is less validated compared to stable ischemic heart disease.8 Microvascular dysfunction during the acute phase can affect the FFR reading and the lesion severity can be underestimated.8 Second, the rate of composite endpoint was much lower in this study compared to FAME despite using the same composite endpoint of death, nonfatal MI, and unplanned hospitalization leading to urgent revascularization. At 1 year, the incidence of primary outcome was 13.5% in the FFR-guided group compared to 18.6% in the angiography-guided group in the FAME study compared to 5.5% and 4.2% in the FLOWER-MI study, despite having a sicker population presenting with STEMI. This is likely due to improvement in the PCI techniques such as radial approach, imaging guidance, and advancement in medical therapy such as use of more potent antiplatelet therapy. With lower incidence of primary outcome, larger number of patients are needed to detect the difference in the composite outcome. Finally, the operators’ visual assessment may have been calibrated to the physiologic assessment as the operators are routinely using FFR assessment which may have diminished the benefit of FFR guidance seen in the early FAME study.
Another interesting finding from this study was that although the study protocol encouraged the operators to perform the nonculprit PCI in the same setting, only 4% had nonculprit PCI in the same setting and 96% of the patients underwent a staged PCI. The advantage of performing the nonculprit PCI on the same setting is to have 1 fewer procedure for the patient. On the other hand, the disadvantage of this approach includes prolongation of the index procedure, theoretically higher risk of complication during the acute phase and vasospasm leading to overestimation of the lesion severity. A recent analysis from the COMPLETE study did not show any difference when comparing staged PCI during the index hospitalization vs after discharge.9 The optimal timing of the staged PCI needs to be investigated in future studies.
A limitation of this study is the lower than expected incidence of clinical events decreasing the statistical power of the study. However, there was no signal that FFR-guided PCI is better compared to the angiography-guided group. In fact, the curve started to diverge at 6 months favoring the angiography-guided group. In addition, there was no core-lab analysis for completeness of revascularization.
Applications for Clinical Practice
In patients presenting with hemodynamically stable STEMI for undergoing nonculprit vessel PCI, both FFR-guided or angiography-guided strategies can be considered.
Financial disclosures: None.
1. Park DW, Clare RM, Schulte PJ, et al. Extent, location, and clinical significance of non-infarct-related coronary artery disease among patients with ST-elevation myocardial infarction. JAMA. 2014;312(19):2019-27. doi:10.1001/jama.2014.15095
2. Wald DS, Morris JK, Wald NJ, et al. Randomized trial of preventive angioplasty in myocardial infarction. N Engl J Med. 2013;369(12):1115-23. doi:10.1056/NEJMoa1305520
3. Gershlick AH, Khan JN, Kelly DJ, et al. Randomized trial of complete versus lesion-only revascularization in patients undergoing primary percutaneous coronary intervention for STEMI and multivessel disease: the CvLPRIT trial. J Am Coll Cardiol. 2015;65(10):963-72. doi:10.1016/j.jacc.2014.12.038
4. Engstrøm T, Kelbæk H, Helqvist S, et al. Complete revascularisation versus treatment of the culprit lesion only in patients with ST-segment elevation myocardial infarction and multivessel disease (DANAMI-3-PRIMULTI): an open-label, randomised controlled trial. Lancet. 2015;386(9994):665-71. doi:10.1016/s0140-6736(15)60648-1
5. Smits PC, Abdel-Wahab M, Neumann FJ, , et al. Fractional Flow Reserve-Guided Multivessel Angioplasty in Myocardial Infarction. N Engl J Med. 2017;376(13):1234-44. doi:10.1056/NEJMoa1701067
6. Mehta SR, Wood DA, Storey RF, et al. Complete Revascularization with Multivessel PCI for Myocardial Infarction. N Engl J Med. 2019;381(15):1411-21. doi:10.1056/NEJMoa1907775
7. Tonino PA, De Bruyne B, Pijls NH, et al. Fractional flow reserve versus angiography for guiding percutaneous coronary intervention. N Engl J Med. 2009;360(3):213-24. doi:10.1056/NEJMoa0807611
8. Thim T, van der Hoeven NW, Musto C, et al. Evaluation and Management of Nonculprit Lesions in STEMI. JACC Cardiovasc Interv. 2020;13(10):1145-54. doi:10.1016/j.jcin.2020.02.030
9. Wood DA, Cairns JA, Wang J, et al. Timing of Staged Nonculprit Artery Revascularization in Patients With ST-Segment Elevation Myocardial Infarction: COMPLETE Trial. J Am Coll Cardiol. 2019;74(22):2713-23. doi:10.1016/j.jacc.2019/09.051
Study Overview
Objective. To determine whether fractional flow reserve (FFR)-guided percutaneous coronary intervention (PCI) of nonculprit lesion in patients with ST-segment elevation myocardial infarction (STEMI) is superior to angiography-guided PCI.
Design. Multicenter randomized control trial blinded to outcome, conducted in 41 sites in France.
Setting and participants. A total of 1163 patients with STEMI and multivessel coronary disease, who had undergone successful PCI to the culprit lesion were randomized to either FFR-guided PCI or angiography-guided PCI for nonculprit lesions. Randomization was stratified according to the trial site and timing of the procedure (immediate or staged).
Main outcome measures. The primary outcome was a composite of death from any cause, nonfatal myocardial infarction (MI) or unplanned hospitalization leading to urgent revascularization at 1 year.
Main results. At 1 year, the primary outcome occurred in 32 of 586 patients (5.5%) in the FFR-guided group and in 24 of 577 (4.2%) in the angiography-guided group (hazard ratio [HR], 1.32; 95% CI, 0.78-2.23; P = .31). The rate of death (1.5% vs 1.7%), nonfatal MI (3.1% vs 1.7%), and unplanned hospitalization leading to urgent revascularization (3.1% vs 1.7%) were also similar between FFR-guided and angiography-guided groups.
Conclusion. Among patients with STEMI and multivessel disease who had undergone successful PCI of the culprit vessel, an FFR-guided strategy for complete revascularization was not superior to angiography-guided strategy for reducing death, MI, or urgent revascularization at 1 year.
Commentary
Patients presenting with STEMI often have multivessel disease.1 Recently, multiple studies have reported the benefit of nonculprit vessel revascularization in patients presenting with hemodynamically stable STEMI compared to culprit-only strategy including the most recent COMPLETE trial which showed reduction in death and MI.2-6 However, the previous studies have variable design in evaluating the nonculprit vessel, some utilized FFR guidance, while others used angiography guidance. Whether FFR-guided PCI of nonculprit vessel can improve outcome in patients presenting STEMI remains unknown.
In the FLOWER-MI study, Puymirat et al investigated the use of FFR compared to angiography-guided nonculprit vessel PCI. A total of 1163 patients presenting with STEMI and multivessel disease who had undergone successful PCI to the culprit vessel, were randomized to either FFR guidance or angiography guidance among 41 centers in France. The authors found that after 1 year, there was no difference in composite endpoint of death, nonfatal MI or unplanned hospitalization leading to urgent revascularization in the FFR-guided group compared to angiography-guided group (5.5% vs 4.2%, HR, 1.32; 95% CI, 0.678-2.23; P = .31). There was also no difference in individual components of primary outcomes or secondary outcomes such as rate of stent thrombosis, any revascularization, or hospitalization.
There are a few interesting points to consider in this study. Ever since the Fractional Flow Reserve vs Angiography for Multivessel Evaluation (FAME) trial reported the lower incidence of major adverse events in routine FFR measurement during PCI compared to angiography-guided PCI, physiological assessment has become the gold standard for treatment of stable ischemic heart disease.7 However, the results of the current FLOWER-MI trial were not consistent with the FAME trial and there are few possible reasons to consider.
First, the use of FFR in the setting of STEMI is less validated compared to stable ischemic heart disease.8 Microvascular dysfunction during the acute phase can affect the FFR reading and the lesion severity can be underestimated.8 Second, the rate of composite endpoint was much lower in this study compared to FAME despite using the same composite endpoint of death, nonfatal MI, and unplanned hospitalization leading to urgent revascularization. At 1 year, the incidence of primary outcome was 13.5% in the FFR-guided group compared to 18.6% in the angiography-guided group in the FAME study compared to 5.5% and 4.2% in the FLOWER-MI study, despite having a sicker population presenting with STEMI. This is likely due to improvement in the PCI techniques such as radial approach, imaging guidance, and advancement in medical therapy such as use of more potent antiplatelet therapy. With lower incidence of primary outcome, larger number of patients are needed to detect the difference in the composite outcome. Finally, the operators’ visual assessment may have been calibrated to the physiologic assessment as the operators are routinely using FFR assessment which may have diminished the benefit of FFR guidance seen in the early FAME study.
Another interesting finding from this study was that although the study protocol encouraged the operators to perform the nonculprit PCI in the same setting, only 4% had nonculprit PCI in the same setting and 96% of the patients underwent a staged PCI. The advantage of performing the nonculprit PCI on the same setting is to have 1 fewer procedure for the patient. On the other hand, the disadvantage of this approach includes prolongation of the index procedure, theoretically higher risk of complication during the acute phase and vasospasm leading to overestimation of the lesion severity. A recent analysis from the COMPLETE study did not show any difference when comparing staged PCI during the index hospitalization vs after discharge.9 The optimal timing of the staged PCI needs to be investigated in future studies.
A limitation of this study is the lower than expected incidence of clinical events decreasing the statistical power of the study. However, there was no signal that FFR-guided PCI is better compared to the angiography-guided group. In fact, the curve started to diverge at 6 months favoring the angiography-guided group. In addition, there was no core-lab analysis for completeness of revascularization.
Applications for Clinical Practice
In patients presenting with hemodynamically stable STEMI for undergoing nonculprit vessel PCI, both FFR-guided or angiography-guided strategies can be considered.
Financial disclosures: None.
1. Park DW, Clare RM, Schulte PJ, et al. Extent, location, and clinical significance of non-infarct-related coronary artery disease among patients with ST-elevation myocardial infarction. JAMA. 2014;312(19):2019-27. doi:10.1001/jama.2014.15095
2. Wald DS, Morris JK, Wald NJ, et al. Randomized trial of preventive angioplasty in myocardial infarction. N Engl J Med. 2013;369(12):1115-23. doi:10.1056/NEJMoa1305520
3. Gershlick AH, Khan JN, Kelly DJ, et al. Randomized trial of complete versus lesion-only revascularization in patients undergoing primary percutaneous coronary intervention for STEMI and multivessel disease: the CvLPRIT trial. J Am Coll Cardiol. 2015;65(10):963-72. doi:10.1016/j.jacc.2014.12.038
4. Engstrøm T, Kelbæk H, Helqvist S, et al. Complete revascularisation versus treatment of the culprit lesion only in patients with ST-segment elevation myocardial infarction and multivessel disease (DANAMI-3-PRIMULTI): an open-label, randomised controlled trial. Lancet. 2015;386(9994):665-71. doi:10.1016/s0140-6736(15)60648-1
5. Smits PC, Abdel-Wahab M, Neumann FJ, , et al. Fractional Flow Reserve-Guided Multivessel Angioplasty in Myocardial Infarction. N Engl J Med. 2017;376(13):1234-44. doi:10.1056/NEJMoa1701067
6. Mehta SR, Wood DA, Storey RF, et al. Complete Revascularization with Multivessel PCI for Myocardial Infarction. N Engl J Med. 2019;381(15):1411-21. doi:10.1056/NEJMoa1907775
7. Tonino PA, De Bruyne B, Pijls NH, et al. Fractional flow reserve versus angiography for guiding percutaneous coronary intervention. N Engl J Med. 2009;360(3):213-24. doi:10.1056/NEJMoa0807611
8. Thim T, van der Hoeven NW, Musto C, et al. Evaluation and Management of Nonculprit Lesions in STEMI. JACC Cardiovasc Interv. 2020;13(10):1145-54. doi:10.1016/j.jcin.2020.02.030
9. Wood DA, Cairns JA, Wang J, et al. Timing of Staged Nonculprit Artery Revascularization in Patients With ST-Segment Elevation Myocardial Infarction: COMPLETE Trial. J Am Coll Cardiol. 2019;74(22):2713-23. doi:10.1016/j.jacc.2019/09.051
Association Between Physiotherapy Outcome Measures and the Functional Independence Measure: A Retrospective Analysis
From Illawarra Shoalhaven Local Health District, New South Wales, Australia (Maren Jones, Dr. Hewitt, Philippa King, Rhiannon Thorn, Edward Davidson, and Tiana-Lee Elphick), and Illawarra Health and Medical Research Institute, University of Wollongong, Wollongong, New South Wales, Australia (Dr. Hewitt)
Objective: To assess the association between change scores in the Functional Independence Measure (FIM) with evaluative measures used in physiotherapy to objectively show that use of the FIM in isolation is limited.
Design: Retrospective observational study.
Setting: Five rehabilitation inpatient wards from 1 public local health district in NSW Australia.
Participants: Patient data over a 5-year time frame (2015 to 2019) were reviewed (N = 2378). The patient data from the 3 most prevalent impairment groups (Australasian Rehabilitation Outcome Centre classification) were identified for inclusion in this study: Reconditioning (n = 742, mean age 76.88 years); Orthopedic Fracture (n = 585, mean age 77.46 years); and Orthopedic Replacement (n = 377, mean age 73.84 years).
Measurements: The difference between the admission and discharge scores were calculated for each measure. Kruskal-Wallis and χ2 tests were used to analyze the data.
Results: Pearson correlation (r) coefficients between FIM Motor change to the de Morton’s Mobility Index (DEMMI) change was r = 0.396, FIM Motor change to the Timed Up and Go (TUG) change was r = -0.217, and the FIM Motor change to the Ten Meter Walk Test (10MWT) change was .194.
Conclusion: The FIM Motor change scores showed a weak positive association to the DEMMI change and no association to the TUG and 10MWT change, demonstrating that the outcome measures do not measure the same attributes. To review rehabilitation effectiveness from a management perspective, it is recommended that all measures are reviewed to assess the burden of care, functional mobility, and dynamic balance.
Keywords: physiotherapy; rehabilitation; clinical outcome measures.
Patients receive interdisciplinary inpatient rehabilitation treatment after they have sustained a lower limb fracture, a lower limb joint replacement, or have generalized deconditioning (muscle wasting and disuse atrophy) following hospitalization for surgery or illness. The degree of a patient’s impairment or loss of functional capacity, as well as their ability to manage at home safely, is assessed using standardized outcome measures during their recovery and rehabilitation.1,2
Physiotherapists routinely use validated outcome measures to assess patient progress and to measure goal attainment through assessment of functional independence, dynamic balance performance, and ambulatory ability. These objective assessments provide clinicians with information about the effectiveness of the rehabilitation program, as well as the patient’s ability to manage in their home environment, to determine the need for assistive devices, level of caregiver support, future level of autonomy, and strategies for falls prevention.3-7
There is a view among service providers that rehabilitation decisions can be based on a singular measure of function known as the Functional Independence Measure (FIM). This is an understandable position because not only is the FIM an internationally recognized, valid, and reliable tool, but, as a singular measure, it also means measurement consistency across rehabilitation sites is more likely. However, rehabilitation is complex, and it is risky to base decisions on a single measure, which might not capture the results of rehabilitation treatment ingredients on individual patient targets.8,9
The patient’s progress is objectively assessed using functional outcome measures such as the FIM. Other measures used typically in our service include the de Morton’s Mobility Index (DEMMI), Timed Up and Go (TUG), and the Ten Meter Walk Test (10MWT), which measure patient mobility, balance during directional changes, and walking ability, respectively. Additional measures include patient progression to a less supportive level of assistance (ie, number of persons required to assist or level of supervision) or the selection of a walking aid (eg, forearm support frame, crutches). This progression—or lack thereof—assists in decision-making regarding the individual’s future once they are discharged from rehabilitation. Such considerations would include the need to modify the home environment, selection of assistive devices, community access (walking indoors, outdoors, and shopping), personal care needs, and age-appropriate care facility recommendations (ie, level of care). The use of outcome measures also indicates the need for further referrals to other care providers upon discharge from the rehabilitation facility.
There is widespread support in the literature for the use of the FIM, DEMMI, TUG, and 10MWT in rehabilitation population groups. For example, DEMMI has been validated in hip fracture patients during rehabilitation,10 as well as among older people hospitalized for medical illness.11-13 It has also been shown to be a predictor of discharge destination for patients living with frailty in geriatric rehabilitation settings,14 and to have moderate predictive validity for functional independence after 4 weeks of rehabilitation.15 Similarly, TUG has been validated for use among hospitalized and community-dwelling individuals,16-18 and for patients after joint arthroplasty19,20 or hip fracture.21 It has also been shown to be an indicator of fall risk,22-24 as well as a predictor of fracture incidence.25 Furthermore, TUG has been identified as an indicator of a patient’s ability to walk in the community without the need for a walking device.26 It has also been shown to be an early identifier of patients in need of rehabilitation.27 Normative values for TUG have been reported, and the association with gait time established.28
Gait speed has been shown to predict adverse outcomes in community-dwelling older people.29 In fact, the 10MWT has been established as a powerful tool to benchmark rehabilitation recovery after a medical event.30 Results of the test relate to overall quality of walking, health status, morbidity, and the rate of mortality.31-33 Meaningful improvement, minimum detectable change (0.19-0.34 m/s), and responsiveness in common physical performance in older adults has been reported.26,34,36
Structural and functional impairment has been used to define rehabilitation classes by the Australasian Rehabilitation Outcome Centre (AROC) in the Australian National Sub-Acute and Non-Acute Patient Classification (AN-SNAP) Version 4.37-43 Variables used for grouping are age, care type, function, and impairment for rehabilitation. FIM was developed in order to assess patients’ outcomes after inpatient multidisciplinary care, and is an internationally accepted measure of functioning.44 It is a holistic outcome measure, which can be used to determine the patient’s level of disability and burden of care, and is widely used in both public and private inpatient rehabilitation settings. Each patient classification is reported separately within the case mix structure.45 Inpatient rehabilitation centers are evaluated and compared by the AROC,46 with an emphasis on length of stay and the FIM change. The most successful centers demonstrate shorter length of stay and greater FIM improvement. Although the FIM is a valuable measure, it does not provide a complete picture of the individual patient’s rehabilitation gain: ie, the specific attributes of patients’ mobility, walking ability, or balance during directional changes.
A large-scale analysis of the association between the holistic disability measure of the FIM and the more mobility- and ambulation-focused physiotherapy outcomes has not been documented.
The well-documented DEMMI accumulates points for the patient’s mobility in a similar fashion to the FIM, but with more mobility detail. These 2 outcome measures allow for the full range of patients, from the very dependent up to and including the independently ambulant patients. The DEMMI may show a positive relationship to the FIM, yet the association is unknown. The association of the TUG to the 10MWT has been established28; however, their relationship to the FIM is unknown.
Current practice in the participating public health inpatient rehabilitation wards is to use the DEMMI, TUG, 10MWT, and FIM to ensure physiotherapy and allow the wider multidisciplinary team to more effectively evaluate patient mobility outcomes. The 3 most frequent patient groups identified within the current patient population are expected to present clinical differences and will be analyzed for comparison. If an association is found between the outcome measures in question, clinical efficiency could be improved.
The aim of the current study is to assess the association between change scores in the FIM with evaluative measures of outcomes typically used in physiotherapy to objectively show that use of the FIM in isolation is limited in our population of patients.
Methods
Study design and setting
This retrospective descriptive observational study complied with the STROBE-RECORD guidance and checklist (available at mdedge.com/jcomjournal) and analyzed the routinely collected data from rehabilitation patients who were admitted to 5 different rehabilitation wards in 4 different public hospitals from 1 regional local health district (20-24 beds per ward) from 2015 to 2019. As this study conducted secondary analyses using existing de-identified data from a public health facility and did not involve interaction with any human subjects, ethical approval was not required.46 Approval to conduct this study was granted by the health district’s institutional review committee, as per the National Statement on Ethical Conduct in Human Research 2015.
Participants
Patient data over a 5-year time frame were reviewed (N = 2378). The patient data from the 3 most prevalent impairment groups were identified for inclusion in this study: reconditioning, orthopedic fracture, and orthopedic replacement. (See Table 1 for the specific AN-SNAP impairment groups used in this study.)

Patient data from the less-frequent impairment groups were excluded (n = 673, 28.19%), including stroke (n = 343), brain dysfunction (n = 45), amputation of limb (n = 45), spinal cord dysfunction (n = 36), neurological dysfunction (n = 34), cardiac (n = 24), and others (n = 25) who may have benefitted from other outcome measures due to their medical condition. Ten patient data sets were excluded for missing discharge outcome measure data, from when the patient became ill and returned to acute services or was discharged at short notice. To be included in the study, both the admission and discharge scores from the FIM and the admission and discharge scores from at least 1 of the physiotherapy outcome measures were required for each patient (n = 1704, 71.39%): Reconditioning (n = 742), Orthopedic Fracture (n = 585), and Orthopedic Replacement (n = 377). Information regarding the type of walking aid and the amount of assistance required for safe ambulation was also recorded. These items were included in the study’s descriptive analysis. Only 1.7% of these descriptors were missing.
Outcome measures
DEMMI tasks of bed mobility, sitting balance, transfers, walking, and balance were scored with an assigned value according to the patient’s performance. This was then tallied and the results scaled, to provide an overall score out of 100 available points. The total score from admission and discharge was then compared. Improvement (change) was identified by the increase in scores.
The TUG assesses a patient’s dynamic balance performance.47 The number of seconds it took the patient to complete the procedure was recorded at admission and discharge. Improvement (change) was identified by the reduction in time taken at discharge from the admission score.
The 10MWT measures the unidirectional walking speed of a person over 10 meters and is recorded in seconds and reported in meters per second. Improvement (change) was identified by the reduction in the time taken to increase walking speed.
Concurrent to the physiotherapy measures were the FIM scores, recorded by the accredited nursing staff from each rehabilitation ward. Improvement is demonstrated by the accumulation of points on the ordinal scale of the FIM Total, including mobility, dressing, bladder and bowel care, cognition, and social interaction, and is represented as a score between 18 and 126. The FIM Motor category is reported as a score between 13 and 91.
The 2 data sets were matched by unique identifier and admission dates, then de-identified for analysis.
Statistical analysis
Patient demographic information was analyzed using descriptive statistics (mean, SD, frequencies, percentages) for each impairment group (orthopedic fracture, orthopedic replacement, reconditioning). Differences in continuous demographic variables for each impairment group were assessed using Kruskal-Wallis tests and χ2 tests for categorical variables. Functional outcome scores were compared at admission, discharge, and change between the impairment groups. Association of the functional outcome change scores was determined with the Pearson correlation coefficient (r) between the FIM and the DEMMI, TUG, and 10MWT. Graphs were plotted for each of these (Figure available online at mdedge.com/jcomjournal). A strong, moderate, and weak association was described as > 0.6, > 0.4, and > 0.2, respectively.46 Statistical significance was set at P < .05. Analyses were conducted using Stata (StataCorp LLC, USA).
Results
The patient descriptive data (site from which data were collected, admission length of stay, age at admission, discharge destination, walk aid improvement, and walk assistance improvement) from the 3 impairment groups are reported in Table 2. The functional outcomes for DEMMI, TUG, 10MWT, FIM Motor, FIM Total at admission, discharge, and the change scores are presented in Table 3.

Orthopedic fracture patients had the greatest improvement in their functional outcomes, with a DEMMI improvement of 18 points, TUG score change of 23.49 seconds (s), 10MWT change of 0.30 meters/second (m/s), FIM Motor change of 20.62, and a FIM Total change of 21.9 points. The outcome measures exceeded the minimum detectable change as reported in the literature for DEMMI (8.8 points48), TUG (2.08 s26), walking speed 0.19 m/s26, and FIM Motor (14.6 points49).

Association of functional outcomes (change scores)
There was a significant weak positive correlation between DEMMI change score and both the FIM Motor (r = 0.396) and FIM Total change scores (r = 0.373). When viewing the specific items within the FIM Motor labelled FIM Walk change, FIM MobilityBedChair change, and FIM stairs change, r values were 0.100, 0.379, and 0.126, respectively. In addition, there was a weak negative correlation between TUG change scores and both FIM Motor (r = -0.217) and FIM Total change scores (r = -0.207). There was a very weak positive correlation between 10MWT (m/s) change scores and both FIM Motor (r = 0.194) and FIM Total change scores (r = 0.187) (Table 4, Figure). There was a moderate correlation between 10MWT change (s) and TUG change (s) (r = 0.72, P < .001).

Discussion
The purpose of this study was to ascertain the association between the DEMMI, TUG, 10MWT, and FIM measures using retrospective data collected from 5 public hospital inpatient rehabilitation wards. The results of this retrospective analysis demonstrate that a variety of objective outcome measures are required for the multidisciplinary team to accurately measure a patient’s functional improvement during their inpatient rehabilitation stay. No single outcome measure in this study fully reported all mobility attributes, and we note the risk of basing decisions on a single measure evaluating rehabilitation outcomes. Although the internationally used FIM has a strong place in rehabilitation reporting and benchmarking, it does not predict change nor provide a proxy for the patient’s whole-body motor control as they extend their mobility, dynamic balance, and ambulatory ability. Multiple objective outcome measures should therefore be required to evaluate the patient’s progress and functional performance toward discharge planning.
The FIM is a measure of disability or care needs, incorporating cognitive, social, and physical components of disability. It is a valid, holistic measure of an individual’s functional ability at a given time. Rehabilitation sites internationally utilize this assessment tool to evaluate a patient’s progress and the efficacy of intervention. The strength of this measure is its widespread use and the inclusion of the personal activities of daily living to provide an overall evaluation encompassing all aspects of a person’s ability to function independently. However, as our study results suggest, patient improvement measured by the FIM Motor components were not correlated to other widely used physiotherapy measures of ambulation and balance, such as the 10MWT or TUG. This is perhaps largely because the FIM Motor components only consider the level of assistance (eg, physical assistance, assistive device, independence) and do not consider assessment of balance and gait ability as assessed in the 10MWT and TUG. The 10MWT and TUG provide assessment of velocity and dynamic balance during walking, which have been shown to predict an individual’s risk of falling.22,23 This is a pertinent issue in the rehabilitation and geriatric population.29 Furthermore, the use of the FIM as a benchmarking tool to compare facility efficiency may not provide a complete assessment of all outcomes achieved on the inpatient rehabilitation ward, such as reduced falls risk or improved ambulatory ability and balance.
Of the objective measures evaluated in our paper, the DEMMI assessment has the most similar components to those of the FIM Motor. It includes evaluating independence with bed mobility, standing up, and ambulation. In addition, the DEMMI includes assessment of both static and dynamic balance. As a result of these commonalities, there was only a weak positive correlation between the change in DEMMI and the change in FIM Motor and FIM Total. However, this correlation is not statistically significant. Therefore, the FIM is not recommended as a replacement of the DEMMI, nor can one be used to predict the other.
It has previously been confirmed that there is a significant positive correlation between the 10MWT and the TUG.27 This retrospective analysis has also supported these findings. This is possibly due to the similarity in the assessments, as they both incorporate ambulation ability and dynamic movement.
Each of the 4 outcome measures assess different yet vital aspects of an individual’s functional mobility and ambulation ability during their subacute rehabilitation journey. The diversity of patient age, functional impairment, and mobility level needs a range of outcomes to provide baselines, targets, and goal attainment for discharge home.
Consistent with the AROC AN-SNAP reporting of Length of Stay and FIM change separated into the weighted impairment groups, the data analysis of this study demonstrated significant differences between the Reconditioning, Orthopedic Fracture, and Orthopedic Replacement patient data. Tables 2 and 3 describe the differences between the groups. The fracture population in this study improved the most across each outcome measure. In contrast, the reconditioning population showed the least improvement. This may be expected due to the pathophysiological differences between the groups. Furthermore, for the elderly who sustain fractures because of a fall, rehabilitation will be required to address not only the presenting injury but also the premorbid falls risk factors which may include polypharmacy or impaired balance.
Any conclusions drawn from the findings of this study need to take into consideration that it has focused on patients from 1 local health district and therefore may not be generalizable to a wider national or international context. As this study was a retrospective study, controlling for data collection quality, measurement bias due to nonblinding and missing data is a limitation. However, clinicians regularly completed these outcome assessments and recorded this information as part of their standard care practices within this health district. There may have been slight differences in definitions of practice between the 5 rehabilitation sites. To ensure reliability, each individual site’s protocols for the FIM, DEMMI, TUG, and 10MWT were reviewed and confirmed to be consistent.
It is important, too, to consider the ceiling effect for the FIM scores. For patients requiring a walking aid well after discharge, the highest level of independence from the walking aid will not be achieved. It is acknowledged that the floor effect of the 10MWT and TUG may also influence the outcomes of this study. In addition, data were not collected on preadmission functional measures to enable further evaluation of the population groups. The proportion of variance in change from admission to discharge for TUG and 10MWT to FIM was less than 5%, so the correlation interpretation from this type of scaling is limited. Further research into outcome measures for inpatient rehabilitation in respect to variables such as patient age, length of stay, discharge destination, and efficacy of intervention is warranted.
Conclusion
The FIM Motor change scores showed a weak positive association to the DEMMI change, and no association to the TUG and 10MWT change, demonstrating that the outcome measures do not measure the same attributes. Thorough reporting of clinical outcomes is much more meaningful to assess and guide the physiotherapy component of rehabilitation. To review rehabilitation effectiveness from a management perspective, it is recommended that all measures are reviewed to assess the burden of care, mobility, functional capacity, and dynamic balance.
Acknowledgements: The authors thank Anne Smith, MSHLM, BAppSc, Head of the Physiotherapy Department, and the physiotherapists and allied health assistants who have contributed to the collection of this valuable data over several years. They also thank Lina Baytieh, MS, BS, from Research Central, Illawarra Shoalhaven Local Health District, for her assistance with the analysis.
Corresponding author: Maren Jones, MPH, BS, Physiotherapy Department, Port Kembla Hospital, Illawarra Shoalhaven Local Health District, Warrawong, New South Wales, 2505 Australia; maren.jones@health.nsw.gov.au.
Financial disclosures: None.
1. Centers for Disease Control and Prevention. Disability and health overview. Impairments, activity limitations and participation restrictions. September 16, 2020. https://www.cdc.gov/ncbddd/disabilityandhealth/disability.html
2. The Royal Australasian College of Physicians. Australasian Faculty of Rehabilitation Medicine. Standards for the Provision of Inpatient Adult Rehabilitation Medicine Services in Public and Private Hospitals. February 2019:7-9. https://www.racp.edu.au/docs/default-source/advocacy-library/afrm-standards-for-the-provision-of-inpatient-adult-rehabilitation-medicine-services-in-public-and-private-hospitals.pdf?sfvrsn=4690171a_4
3. NSW Agency for Clinical Innovation. NSW rehabilitation model of care. June 1, 2015. https://aci.health.nsw.gov.au/resources/rehabilitation/rehabilitation-model-of-care/rehabilitation-moc
4. The State of Queensland (Queensland Health). Clinical task instructions. June 22, 2021. https://www.health.qld.gov.au/ahwac/html/clintaskinstructions
5. Panel on Prevention of Falls in Older Persons, American Geriatrics Society and British Geriatrics Society. Summary of the updated American Geriatrics Society/British Geriatrics Society clinical practice guideline for prevention of falls in older persons. J Am Geriatr Soc. 2011;59(1):148-157. doi:10.1111/j.1532-5415.2010.03234.x
6. Suwannarat P, Kaewsanmung S, Thaweewannakij T, Amatachaya S. The use of functional performance tests by primary health-care providers to determine walking ability with and without a walking device in community-dwelling elderly. Physiother Theory Pract. 2021;37(1):64-72. doi:10.1080/09593985.2019.1606372
7. Lee K-J, Um S-H, Kim Y-H. Postoperative rehabilitation after hip fracture: a literature review. Hip Pelvis. 2020;32(3):125-131. doi:10.5371/hp.2020.32.3.125
8. Wade DT, Smeets RJEM, Verbunt JA. Research in rehabilitation medicine: methodological challenges. J Clin Epidemiol. 2010;63(7):699-704. doi:10.1016/j.clinepi.2009.07.010
9. Wade DT. Outcome measures for clinical rehabilitation trials: impairment, function, quality of life, or value? Am J Phys Med Rehabil. 2003;82(suppl 10):S26-S31. doi:10.1097/01.PHM.0000086996.89383.A1
10. de Morton NA, Harding KE, Taylor NF, Harrison G. Validity of the de Morton NA Mobility Index (DEMMI) for measuring the mobility of patients with hip fracture during rehabilitation. Disabil Rehabil. 2013;35(4):325-333. doi:10.3109/09638288.2012.705220
11. Trøstrup J, Andersen H, Kam CAM, et al. Assessment of mobility in older people hospitalized for medical illness using the de Morton Mobility Index and cumulated ambulation score—validity and minimal clinical important difference. J Geriatr Phys Ther. 2019;42(3):153-160. doi:10.1519/JPT.0000000000000170
12. Gazzoti A, Meyer U, Freystaetter G, et al. Physical performance among patients aged 70+ in acute care: a preliminary comparison between the Short Physical Performance Battery and the De Morton Mobility Index with regard to sensitivity to change and prediction of discharge destination. Aging Clin Exp Res. 2020;32(4):579-586. doi:10.1007/s40520-019-1249-9
13. Tavares LS, Moreno NA, de Aquino BG, et al. Reliability, validity, interpretability and responsiveness of the DEMMI mobility index for Brazilian older hospitalized patients. PLoS One. 2020;15(3):e0230047. doi:10.1371/journal.pone.0230047
14. Braun T, Schulz R-J, Reinke J. Reliability and validity of the German translation of the de Morton Mobility Index performed by physiotherapists in patients admitted to a sub-acute inpatient geriatric rehabilitation hospital. BMC Geriatr. 2015;15:38. doi:10.1186/s12877-015-0035-y
15. Søndergaard K, Petersen LE, Pedersen MK, et al. The responsiveness and predictive validity of the de Morton Mobility Index in geriatric rehabilitation. Disabil Rehabil. 2020 Jun 12. [Epub ahead of print] doi:10.1080/09638288.2020.1771438
16. de Morton NA, Brusco NK, Wood L, et al. The de Morton Mobility Index (DEMMI) provides a valid method for measuring and monitoring the mobility of patients making the transition from hospital to the community: an observational study. J Physiother. 2011;57(2):109-116. doi:10.1016/S1836-9553(11)70021-2
17. Caronni A, Sterpi I, Antoniotti P, et al. Criterion validity of the instrumented Timed Up and Go test: a partial least square regression study. Gait Posture. 2018;61(3):287-293. doi:10.1016/j.gaitpost.2018.01.015
18. Kristensen MT, Bloch ML, Jonsson LR, Jakobsen TL. Interrater reliability of the standardized Timed Up and Go Test when used in hospitalized and community-dwelling individuals. Physiother Res Int. 2019;24(2):e1769. doi:10.1002/pri.1769
19. Yuksel E, Kalkan S, Cekmece S, et al. Assessing minimal detectable changes and test-retest reliability of the timed up and go test and 2-minute walk test in patients with total knee arthroplasty. J Arthroplasty. 2017;32(2):426-430. doi:10.1016/j.arth.2016.07.031
20. Yuksel E, Unver B, Kalkan S, Karatosun V. Reliability and minimal detectable change of the 2-minute walk test and Timed Up and Go test in patients with total hip arthroplasty. Hip Int. 2021;31(1):43-49. doi:10.1177/1120700019888614
21. Faleide AGH, Bogen BE, Magnussen LH. Intra-session test-retest reliability of the Timed “Up & Go” Test when performed by patients with hip fractures. Eur J Physiother. 2015;17(2):89-97. doi:10.3109/21679169.2015.1043579
22. Barry E, Galvin R, Keogh C, et al. Is the timed up and go test a useful predictor of risk of falls in community dwelling older adults: a systematic review and meta- analysis. BMC Geriatr. 2014;14:14. doi:10.1186/1471-2318-14-14
23. Kojima G, Masud T, Kendrick D, et al. Does the timed up and go test predict future falls among British community-dwelling older people? Prospective cohort study nested within a randomised controlled trial. BMC Geriatr. 2015;15:38. doi:10.1186/s12877-015-0039-7
24. Shumway-Cook A, Brauer S, Woollacott M. Predicting the probability for falls in community-dwelling older adults using the timed up & go test. Phys Ther. 2000;80(9):896-903.
25. Jeong SM, Shin DW, Han K, et al. Timed Up-and-Go test is a useful predictor of fracture incidence. Bone. 2019;127:474-481. doi:10.1016/j.bone.2019.07.018
26. Donaghue OA, Savva GM, Börsch-Supan A, Kenny RA. Reliability, measurement error and minimum detectable change in reliability measurement error and minimum detectable change in mobility measures: a cohort study of community dwelling adults aged 50 years and over in Ireland. BMJ Open. 2019;9(11):e030475. doi:10/1136.bmjopen-2019-030475
27. Freter SH, Fruchter N. Relationship between timed ‘up and go’ and gait time in an elderly orthopaedic rehabilitation population. Clin Rehabil. 2000;14(1):96-101. doi:10.1191/026921500675545616
28. Kear BM, Guck TP, McGaha AL. Timed up and go (TUG) test: normative reference values for ages 20 to 59 years and relationships with physical and mental health risk factors. J Prim Care Community Health. 2017;8(1):9-13. doi:10.1177/2150131916659282
29. Abellan van Kan G, Rolland Y, Andrieu S, et al. Gait speed at usual pace as a predictor of adverse outcomes in community-dwelling older people: an International Academy on Nutrition and Aging (IANA) Task Force. J Nutr Health Aging. 2009;13(10)881-889. doi:10.1007/s12603-009-0246-z
30. Unver B, Baris RH, Yusel E, et al. Reliability of 4-meter and 10-meter walk tests after lower extremity surgery. Disabil Rehabil. 2017;39(25):2572-2576. doi:10.1080/09638288.2016.1236153
31. Fritz S, Lusardi M. White paper: “walking speed: the sixth vital sign.” J Geriatr Phys Ther. 2009;32(2):46-49.
32. Studenski S, Perera S, Patel K, et al. Gait speed and survival in older adults. JAMA. 2011;305(1):50-58. doi:10.1001/jama.2010.1923
33. Bohannon R. Comfortable and maximum walking speed of adults aged 20-79 years: reference values and determinants. Age Ageing. 1997;26(1):15-19. doi:10.1093/ageing/26.1.15
34. Perera S, Mody SH, Woodman RC, Studenski SA. Meaningful change and responsiveness in common physical performance in older adults. J Am Geriatr Soc. 2006;54(5):743-749. doi:10.1111/j.1532-5415.2006.00701.x
35. Hollman J, Beckman B, Brandt R, et al. Minimum detectable change in gait velocity during acute rehabilitation following hip fracture. J Geriatr Phys Ther. 2008;31(2):53-56. doi:10.1519/00139143-200831020-00003
36. Bohannon RW, Andrews AW. Normal walking speed: a descriptive meta-analysis. Physiotherapy. 2011;97(3):182-189. doi:10.1016/j.physio.2010.12.004
37. Granger CV, Hamilton BB, Keith RA, et al. Advances in functional assessment for medical rehabilitation. Top Geriatr Rehabil. 1986;1:59-74.
38. Keith RA, Granger CV, Hamilton BB, Sherwin FS. The Functional Independence Measure: a new tool for rehabilitation. In: Eisenberg MG, Grzesiak RC, eds. Advances in Clinical Rehabilitation. Springer-Verlag; 1987:6-18.
39. Linacre JM, Heinemann AW, Wright BD, et al. The structure and stability of the Functional Independence Measure. Arch Phys Med Rehabil. 1994;75(2):127-132.
40. Coster WJ, Haley SM, Jette AM. Measuring patient-reported outcomes after discharge from inpatient rehabilitation settings. J Rehabil Med. 2006;38(4):237-242. doi:10.1080/16501970600609774
41. Street L. Frequently asked questions about FIM. Journal of the Australasian Rehabilitation Nurses Association. 2014;17(1):21-22. https://ro.uow.edu.au/ahsri/296/
42. Green JP, Gordon R, Blanchard MB, et al. Development of the Australian National Subacute and Non-acute Patient (AN-SNAP) Classification. Version 4 Final Report. Australian Health Services Research Institute, University of Wollongong, 2015. https://ro.uow.edu.au/ahsri/760
43. Australasian Rehabilitation Outcomes Centre. University of Wollongong, Australia. https://www.uow.edu.au/ahsri/aroc/
44. Green J, Gordon R, Kobel C, et al; Centre for Health Service Development. The Australian National Subacute and Non-acute Patient Classification. AN-SNAP V4 User Manual. May 2015. https://documents.uow.edu.au/content/groups/public/@web/@chsd/@aroc/documents/doc/uow194637.pdf
45. Alexander TL, Simmonds FD, Capelle JT, Green LJ. Anywhere Hospital AROC Impairment Specific Report on Reconditioning (Inpatient–Pathway 3), July 2018–June 2019. Australasian Rehabilitation Outcomes Centre, Australian Health Services Research Institute, University of Wollongong; 2019. ro.uow.edu.au/ahsri/1110
46. Evans JD. Straightforward Statistics for the Behavioural Sciences. Brooks/Cole Publishing; 1996.
47. Lee SP, Dufek J, Hickman R, Schuerman S. Influence of procedural factors on the reliability and performance of the timed up-and-go test in older adults. Int J Gerontol. 2016;10(1):37-42. doi:10.1016/j.ijge.2015
48. New PW, Scroggie GD, Williams CM. The validity, reliability, responsiveness and minimal clinically important difference of the de Morton Mobility Index in rehabilitation. Disabil Rehabil. 2017;39(10):1039-1043. doi:10.10801/09638288.2016.1179800
49. Nakaguchi T, Ishimoto Y, Akazawa N. Functional Independence Measure for patients with locomotor disorders in convalescent rehabilitation wards. Clinically significant minimum difference in exercise score gain. Physiotherapy Science. 2018;33(2):235-240.
From Illawarra Shoalhaven Local Health District, New South Wales, Australia (Maren Jones, Dr. Hewitt, Philippa King, Rhiannon Thorn, Edward Davidson, and Tiana-Lee Elphick), and Illawarra Health and Medical Research Institute, University of Wollongong, Wollongong, New South Wales, Australia (Dr. Hewitt)
Objective: To assess the association between change scores in the Functional Independence Measure (FIM) with evaluative measures used in physiotherapy to objectively show that use of the FIM in isolation is limited.
Design: Retrospective observational study.
Setting: Five rehabilitation inpatient wards from 1 public local health district in NSW Australia.
Participants: Patient data over a 5-year time frame (2015 to 2019) were reviewed (N = 2378). The patient data from the 3 most prevalent impairment groups (Australasian Rehabilitation Outcome Centre classification) were identified for inclusion in this study: Reconditioning (n = 742, mean age 76.88 years); Orthopedic Fracture (n = 585, mean age 77.46 years); and Orthopedic Replacement (n = 377, mean age 73.84 years).
Measurements: The difference between the admission and discharge scores were calculated for each measure. Kruskal-Wallis and χ2 tests were used to analyze the data.
Results: Pearson correlation (r) coefficients between FIM Motor change to the de Morton’s Mobility Index (DEMMI) change was r = 0.396, FIM Motor change to the Timed Up and Go (TUG) change was r = -0.217, and the FIM Motor change to the Ten Meter Walk Test (10MWT) change was .194.
Conclusion: The FIM Motor change scores showed a weak positive association to the DEMMI change and no association to the TUG and 10MWT change, demonstrating that the outcome measures do not measure the same attributes. To review rehabilitation effectiveness from a management perspective, it is recommended that all measures are reviewed to assess the burden of care, functional mobility, and dynamic balance.
Keywords: physiotherapy; rehabilitation; clinical outcome measures.
Patients receive interdisciplinary inpatient rehabilitation treatment after they have sustained a lower limb fracture, a lower limb joint replacement, or have generalized deconditioning (muscle wasting and disuse atrophy) following hospitalization for surgery or illness. The degree of a patient’s impairment or loss of functional capacity, as well as their ability to manage at home safely, is assessed using standardized outcome measures during their recovery and rehabilitation.1,2
Physiotherapists routinely use validated outcome measures to assess patient progress and to measure goal attainment through assessment of functional independence, dynamic balance performance, and ambulatory ability. These objective assessments provide clinicians with information about the effectiveness of the rehabilitation program, as well as the patient’s ability to manage in their home environment, to determine the need for assistive devices, level of caregiver support, future level of autonomy, and strategies for falls prevention.3-7
There is a view among service providers that rehabilitation decisions can be based on a singular measure of function known as the Functional Independence Measure (FIM). This is an understandable position because not only is the FIM an internationally recognized, valid, and reliable tool, but, as a singular measure, it also means measurement consistency across rehabilitation sites is more likely. However, rehabilitation is complex, and it is risky to base decisions on a single measure, which might not capture the results of rehabilitation treatment ingredients on individual patient targets.8,9
The patient’s progress is objectively assessed using functional outcome measures such as the FIM. Other measures used typically in our service include the de Morton’s Mobility Index (DEMMI), Timed Up and Go (TUG), and the Ten Meter Walk Test (10MWT), which measure patient mobility, balance during directional changes, and walking ability, respectively. Additional measures include patient progression to a less supportive level of assistance (ie, number of persons required to assist or level of supervision) or the selection of a walking aid (eg, forearm support frame, crutches). This progression—or lack thereof—assists in decision-making regarding the individual’s future once they are discharged from rehabilitation. Such considerations would include the need to modify the home environment, selection of assistive devices, community access (walking indoors, outdoors, and shopping), personal care needs, and age-appropriate care facility recommendations (ie, level of care). The use of outcome measures also indicates the need for further referrals to other care providers upon discharge from the rehabilitation facility.
There is widespread support in the literature for the use of the FIM, DEMMI, TUG, and 10MWT in rehabilitation population groups. For example, DEMMI has been validated in hip fracture patients during rehabilitation,10 as well as among older people hospitalized for medical illness.11-13 It has also been shown to be a predictor of discharge destination for patients living with frailty in geriatric rehabilitation settings,14 and to have moderate predictive validity for functional independence after 4 weeks of rehabilitation.15 Similarly, TUG has been validated for use among hospitalized and community-dwelling individuals,16-18 and for patients after joint arthroplasty19,20 or hip fracture.21 It has also been shown to be an indicator of fall risk,22-24 as well as a predictor of fracture incidence.25 Furthermore, TUG has been identified as an indicator of a patient’s ability to walk in the community without the need for a walking device.26 It has also been shown to be an early identifier of patients in need of rehabilitation.27 Normative values for TUG have been reported, and the association with gait time established.28
Gait speed has been shown to predict adverse outcomes in community-dwelling older people.29 In fact, the 10MWT has been established as a powerful tool to benchmark rehabilitation recovery after a medical event.30 Results of the test relate to overall quality of walking, health status, morbidity, and the rate of mortality.31-33 Meaningful improvement, minimum detectable change (0.19-0.34 m/s), and responsiveness in common physical performance in older adults has been reported.26,34,36
Structural and functional impairment has been used to define rehabilitation classes by the Australasian Rehabilitation Outcome Centre (AROC) in the Australian National Sub-Acute and Non-Acute Patient Classification (AN-SNAP) Version 4.37-43 Variables used for grouping are age, care type, function, and impairment for rehabilitation. FIM was developed in order to assess patients’ outcomes after inpatient multidisciplinary care, and is an internationally accepted measure of functioning.44 It is a holistic outcome measure, which can be used to determine the patient’s level of disability and burden of care, and is widely used in both public and private inpatient rehabilitation settings. Each patient classification is reported separately within the case mix structure.45 Inpatient rehabilitation centers are evaluated and compared by the AROC,46 with an emphasis on length of stay and the FIM change. The most successful centers demonstrate shorter length of stay and greater FIM improvement. Although the FIM is a valuable measure, it does not provide a complete picture of the individual patient’s rehabilitation gain: ie, the specific attributes of patients’ mobility, walking ability, or balance during directional changes.
A large-scale analysis of the association between the holistic disability measure of the FIM and the more mobility- and ambulation-focused physiotherapy outcomes has not been documented.
The well-documented DEMMI accumulates points for the patient’s mobility in a similar fashion to the FIM, but with more mobility detail. These 2 outcome measures allow for the full range of patients, from the very dependent up to and including the independently ambulant patients. The DEMMI may show a positive relationship to the FIM, yet the association is unknown. The association of the TUG to the 10MWT has been established28; however, their relationship to the FIM is unknown.
Current practice in the participating public health inpatient rehabilitation wards is to use the DEMMI, TUG, 10MWT, and FIM to ensure physiotherapy and allow the wider multidisciplinary team to more effectively evaluate patient mobility outcomes. The 3 most frequent patient groups identified within the current patient population are expected to present clinical differences and will be analyzed for comparison. If an association is found between the outcome measures in question, clinical efficiency could be improved.
The aim of the current study is to assess the association between change scores in the FIM with evaluative measures of outcomes typically used in physiotherapy to objectively show that use of the FIM in isolation is limited in our population of patients.
Methods
Study design and setting
This retrospective descriptive observational study complied with the STROBE-RECORD guidance and checklist (available at mdedge.com/jcomjournal) and analyzed the routinely collected data from rehabilitation patients who were admitted to 5 different rehabilitation wards in 4 different public hospitals from 1 regional local health district (20-24 beds per ward) from 2015 to 2019. As this study conducted secondary analyses using existing de-identified data from a public health facility and did not involve interaction with any human subjects, ethical approval was not required.46 Approval to conduct this study was granted by the health district’s institutional review committee, as per the National Statement on Ethical Conduct in Human Research 2015.
Participants
Patient data over a 5-year time frame were reviewed (N = 2378). The patient data from the 3 most prevalent impairment groups were identified for inclusion in this study: reconditioning, orthopedic fracture, and orthopedic replacement. (See Table 1 for the specific AN-SNAP impairment groups used in this study.)
Patient data from the less-frequent impairment groups were excluded (n = 673, 28.19%), including stroke (n = 343), brain dysfunction (n = 45), amputation of limb (n = 45), spinal cord dysfunction (n = 36), neurological dysfunction (n = 34), cardiac (n = 24), and others (n = 25) who may have benefitted from other outcome measures due to their medical condition. Ten patient data sets were excluded for missing discharge outcome measure data, from when the patient became ill and returned to acute services or was discharged at short notice. To be included in the study, both the admission and discharge scores from the FIM and the admission and discharge scores from at least 1 of the physiotherapy outcome measures were required for each patient (n = 1704, 71.39%): Reconditioning (n = 742), Orthopedic Fracture (n = 585), and Orthopedic Replacement (n = 377). Information regarding the type of walking aid and the amount of assistance required for safe ambulation was also recorded. These items were included in the study’s descriptive analysis. Only 1.7% of these descriptors were missing.
Outcome measures
DEMMI tasks of bed mobility, sitting balance, transfers, walking, and balance were scored with an assigned value according to the patient’s performance. This was then tallied and the results scaled, to provide an overall score out of 100 available points. The total score from admission and discharge was then compared. Improvement (change) was identified by the increase in scores.
The TUG assesses a patient’s dynamic balance performance.47 The number of seconds it took the patient to complete the procedure was recorded at admission and discharge. Improvement (change) was identified by the reduction in time taken at discharge from the admission score.
The 10MWT measures the unidirectional walking speed of a person over 10 meters and is recorded in seconds and reported in meters per second. Improvement (change) was identified by the reduction in the time taken to increase walking speed.
Concurrent to the physiotherapy measures were the FIM scores, recorded by the accredited nursing staff from each rehabilitation ward. Improvement is demonstrated by the accumulation of points on the ordinal scale of the FIM Total, including mobility, dressing, bladder and bowel care, cognition, and social interaction, and is represented as a score between 18 and 126. The FIM Motor category is reported as a score between 13 and 91.
The 2 data sets were matched by unique identifier and admission dates, then de-identified for analysis.
Statistical analysis
Patient demographic information was analyzed using descriptive statistics (mean, SD, frequencies, percentages) for each impairment group (orthopedic fracture, orthopedic replacement, reconditioning). Differences in continuous demographic variables for each impairment group were assessed using Kruskal-Wallis tests and χ2 tests for categorical variables. Functional outcome scores were compared at admission, discharge, and change between the impairment groups. Association of the functional outcome change scores was determined with the Pearson correlation coefficient (r) between the FIM and the DEMMI, TUG, and 10MWT. Graphs were plotted for each of these (Figure available online at mdedge.com/jcomjournal). A strong, moderate, and weak association was described as > 0.6, > 0.4, and > 0.2, respectively.46 Statistical significance was set at P < .05. Analyses were conducted using Stata (StataCorp LLC, USA).
Results
The patient descriptive data (site from which data were collected, admission length of stay, age at admission, discharge destination, walk aid improvement, and walk assistance improvement) from the 3 impairment groups are reported in Table 2. The functional outcomes for DEMMI, TUG, 10MWT, FIM Motor, FIM Total at admission, discharge, and the change scores are presented in Table 3.
Orthopedic fracture patients had the greatest improvement in their functional outcomes, with a DEMMI improvement of 18 points, TUG score change of 23.49 seconds (s), 10MWT change of 0.30 meters/second (m/s), FIM Motor change of 20.62, and a FIM Total change of 21.9 points. The outcome measures exceeded the minimum detectable change as reported in the literature for DEMMI (8.8 points48), TUG (2.08 s26), walking speed 0.19 m/s26, and FIM Motor (14.6 points49).
Association of functional outcomes (change scores)
There was a significant weak positive correlation between DEMMI change score and both the FIM Motor (r = 0.396) and FIM Total change scores (r = 0.373). When viewing the specific items within the FIM Motor labelled FIM Walk change, FIM MobilityBedChair change, and FIM stairs change, r values were 0.100, 0.379, and 0.126, respectively. In addition, there was a weak negative correlation between TUG change scores and both FIM Motor (r = -0.217) and FIM Total change scores (r = -0.207). There was a very weak positive correlation between 10MWT (m/s) change scores and both FIM Motor (r = 0.194) and FIM Total change scores (r = 0.187) (Table 4, Figure). There was a moderate correlation between 10MWT change (s) and TUG change (s) (r = 0.72, P < .001).
Discussion
The purpose of this study was to ascertain the association between the DEMMI, TUG, 10MWT, and FIM measures using retrospective data collected from 5 public hospital inpatient rehabilitation wards. The results of this retrospective analysis demonstrate that a variety of objective outcome measures are required for the multidisciplinary team to accurately measure a patient’s functional improvement during their inpatient rehabilitation stay. No single outcome measure in this study fully reported all mobility attributes, and we note the risk of basing decisions on a single measure evaluating rehabilitation outcomes. Although the internationally used FIM has a strong place in rehabilitation reporting and benchmarking, it does not predict change nor provide a proxy for the patient’s whole-body motor control as they extend their mobility, dynamic balance, and ambulatory ability. Multiple objective outcome measures should therefore be required to evaluate the patient’s progress and functional performance toward discharge planning.
The FIM is a measure of disability or care needs, incorporating cognitive, social, and physical components of disability. It is a valid, holistic measure of an individual’s functional ability at a given time. Rehabilitation sites internationally utilize this assessment tool to evaluate a patient’s progress and the efficacy of intervention. The strength of this measure is its widespread use and the inclusion of the personal activities of daily living to provide an overall evaluation encompassing all aspects of a person’s ability to function independently. However, as our study results suggest, patient improvement measured by the FIM Motor components were not correlated to other widely used physiotherapy measures of ambulation and balance, such as the 10MWT or TUG. This is perhaps largely because the FIM Motor components only consider the level of assistance (eg, physical assistance, assistive device, independence) and do not consider assessment of balance and gait ability as assessed in the 10MWT and TUG. The 10MWT and TUG provide assessment of velocity and dynamic balance during walking, which have been shown to predict an individual’s risk of falling.22,23 This is a pertinent issue in the rehabilitation and geriatric population.29 Furthermore, the use of the FIM as a benchmarking tool to compare facility efficiency may not provide a complete assessment of all outcomes achieved on the inpatient rehabilitation ward, such as reduced falls risk or improved ambulatory ability and balance.
Of the objective measures evaluated in our paper, the DEMMI assessment has the most similar components to those of the FIM Motor. It includes evaluating independence with bed mobility, standing up, and ambulation. In addition, the DEMMI includes assessment of both static and dynamic balance. As a result of these commonalities, there was only a weak positive correlation between the change in DEMMI and the change in FIM Motor and FIM Total. However, this correlation is not statistically significant. Therefore, the FIM is not recommended as a replacement of the DEMMI, nor can one be used to predict the other.
It has previously been confirmed that there is a significant positive correlation between the 10MWT and the TUG.27 This retrospective analysis has also supported these findings. This is possibly due to the similarity in the assessments, as they both incorporate ambulation ability and dynamic movement.
Each of the 4 outcome measures assess different yet vital aspects of an individual’s functional mobility and ambulation ability during their subacute rehabilitation journey. The diversity of patient age, functional impairment, and mobility level needs a range of outcomes to provide baselines, targets, and goal attainment for discharge home.
Consistent with the AROC AN-SNAP reporting of Length of Stay and FIM change separated into the weighted impairment groups, the data analysis of this study demonstrated significant differences between the Reconditioning, Orthopedic Fracture, and Orthopedic Replacement patient data. Tables 2 and 3 describe the differences between the groups. The fracture population in this study improved the most across each outcome measure. In contrast, the reconditioning population showed the least improvement. This may be expected due to the pathophysiological differences between the groups. Furthermore, for the elderly who sustain fractures because of a fall, rehabilitation will be required to address not only the presenting injury but also the premorbid falls risk factors which may include polypharmacy or impaired balance.
Any conclusions drawn from the findings of this study need to take into consideration that it has focused on patients from 1 local health district and therefore may not be generalizable to a wider national or international context. As this study was a retrospective study, controlling for data collection quality, measurement bias due to nonblinding and missing data is a limitation. However, clinicians regularly completed these outcome assessments and recorded this information as part of their standard care practices within this health district. There may have been slight differences in definitions of practice between the 5 rehabilitation sites. To ensure reliability, each individual site’s protocols for the FIM, DEMMI, TUG, and 10MWT were reviewed and confirmed to be consistent.
It is important, too, to consider the ceiling effect for the FIM scores. For patients requiring a walking aid well after discharge, the highest level of independence from the walking aid will not be achieved. It is acknowledged that the floor effect of the 10MWT and TUG may also influence the outcomes of this study. In addition, data were not collected on preadmission functional measures to enable further evaluation of the population groups. The proportion of variance in change from admission to discharge for TUG and 10MWT to FIM was less than 5%, so the correlation interpretation from this type of scaling is limited. Further research into outcome measures for inpatient rehabilitation in respect to variables such as patient age, length of stay, discharge destination, and efficacy of intervention is warranted.
Conclusion
The FIM Motor change scores showed a weak positive association to the DEMMI change, and no association to the TUG and 10MWT change, demonstrating that the outcome measures do not measure the same attributes. Thorough reporting of clinical outcomes is much more meaningful to assess and guide the physiotherapy component of rehabilitation. To review rehabilitation effectiveness from a management perspective, it is recommended that all measures are reviewed to assess the burden of care, mobility, functional capacity, and dynamic balance.
Acknowledgements: The authors thank Anne Smith, MSHLM, BAppSc, Head of the Physiotherapy Department, and the physiotherapists and allied health assistants who have contributed to the collection of this valuable data over several years. They also thank Lina Baytieh, MS, BS, from Research Central, Illawarra Shoalhaven Local Health District, for her assistance with the analysis.
Corresponding author: Maren Jones, MPH, BS, Physiotherapy Department, Port Kembla Hospital, Illawarra Shoalhaven Local Health District, Warrawong, New South Wales, 2505 Australia; maren.jones@health.nsw.gov.au.
Financial disclosures: None.
1. Centers for Disease Control and Prevention. Disability and health overview. Impairments, activity limitations and participation restrictions. September 16, 2020. https://www.cdc.gov/ncbddd/disabilityandhealth/disability.html
2. The Royal Australasian College of Physicians. Australasian Faculty of Rehabilitation Medicine. Standards for the Provision of Inpatient Adult Rehabilitation Medicine Services in Public and Private Hospitals. February 2019:7-9. https://www.racp.edu.au/docs/default-source/advocacy-library/afrm-standards-for-the-provision-of-inpatient-adult-rehabilitation-medicine-services-in-public-and-private-hospitals.pdf?sfvrsn=4690171a_4
3. NSW Agency for Clinical Innovation. NSW rehabilitation model of care. June 1, 2015. https://aci.health.nsw.gov.au/resources/rehabilitation/rehabilitation-model-of-care/rehabilitation-moc
4. The State of Queensland (Queensland Health). Clinical task instructions. June 22, 2021. https://www.health.qld.gov.au/ahwac/html/clintaskinstructions
5. Panel on Prevention of Falls in Older Persons, American Geriatrics Society and British Geriatrics Society. Summary of the updated American Geriatrics Society/British Geriatrics Society clinical practice guideline for prevention of falls in older persons. J Am Geriatr Soc. 2011;59(1):148-157. doi:10.1111/j.1532-5415.2010.03234.x
6. Suwannarat P, Kaewsanmung S, Thaweewannakij T, Amatachaya S. The use of functional performance tests by primary health-care providers to determine walking ability with and without a walking device in community-dwelling elderly. Physiother Theory Pract. 2021;37(1):64-72. doi:10.1080/09593985.2019.1606372
7. Lee K-J, Um S-H, Kim Y-H. Postoperative rehabilitation after hip fracture: a literature review. Hip Pelvis. 2020;32(3):125-131. doi:10.5371/hp.2020.32.3.125
8. Wade DT, Smeets RJEM, Verbunt JA. Research in rehabilitation medicine: methodological challenges. J Clin Epidemiol. 2010;63(7):699-704. doi:10.1016/j.clinepi.2009.07.010
9. Wade DT. Outcome measures for clinical rehabilitation trials: impairment, function, quality of life, or value? Am J Phys Med Rehabil. 2003;82(suppl 10):S26-S31. doi:10.1097/01.PHM.0000086996.89383.A1
10. de Morton NA, Harding KE, Taylor NF, Harrison G. Validity of the de Morton NA Mobility Index (DEMMI) for measuring the mobility of patients with hip fracture during rehabilitation. Disabil Rehabil. 2013;35(4):325-333. doi:10.3109/09638288.2012.705220
11. Trøstrup J, Andersen H, Kam CAM, et al. Assessment of mobility in older people hospitalized for medical illness using the de Morton Mobility Index and cumulated ambulation score—validity and minimal clinical important difference. J Geriatr Phys Ther. 2019;42(3):153-160. doi:10.1519/JPT.0000000000000170
12. Gazzoti A, Meyer U, Freystaetter G, et al. Physical performance among patients aged 70+ in acute care: a preliminary comparison between the Short Physical Performance Battery and the De Morton Mobility Index with regard to sensitivity to change and prediction of discharge destination. Aging Clin Exp Res. 2020;32(4):579-586. doi:10.1007/s40520-019-1249-9
13. Tavares LS, Moreno NA, de Aquino BG, et al. Reliability, validity, interpretability and responsiveness of the DEMMI mobility index for Brazilian older hospitalized patients. PLoS One. 2020;15(3):e0230047. doi:10.1371/journal.pone.0230047
14. Braun T, Schulz R-J, Reinke J. Reliability and validity of the German translation of the de Morton Mobility Index performed by physiotherapists in patients admitted to a sub-acute inpatient geriatric rehabilitation hospital. BMC Geriatr. 2015;15:38. doi:10.1186/s12877-015-0035-y
15. Søndergaard K, Petersen LE, Pedersen MK, et al. The responsiveness and predictive validity of the de Morton Mobility Index in geriatric rehabilitation. Disabil Rehabil. 2020 Jun 12. [Epub ahead of print] doi:10.1080/09638288.2020.1771438
16. de Morton NA, Brusco NK, Wood L, et al. The de Morton Mobility Index (DEMMI) provides a valid method for measuring and monitoring the mobility of patients making the transition from hospital to the community: an observational study. J Physiother. 2011;57(2):109-116. doi:10.1016/S1836-9553(11)70021-2
17. Caronni A, Sterpi I, Antoniotti P, et al. Criterion validity of the instrumented Timed Up and Go test: a partial least square regression study. Gait Posture. 2018;61(3):287-293. doi:10.1016/j.gaitpost.2018.01.015
18. Kristensen MT, Bloch ML, Jonsson LR, Jakobsen TL. Interrater reliability of the standardized Timed Up and Go Test when used in hospitalized and community-dwelling individuals. Physiother Res Int. 2019;24(2):e1769. doi:10.1002/pri.1769
19. Yuksel E, Kalkan S, Cekmece S, et al. Assessing minimal detectable changes and test-retest reliability of the timed up and go test and 2-minute walk test in patients with total knee arthroplasty. J Arthroplasty. 2017;32(2):426-430. doi:10.1016/j.arth.2016.07.031
20. Yuksel E, Unver B, Kalkan S, Karatosun V. Reliability and minimal detectable change of the 2-minute walk test and Timed Up and Go test in patients with total hip arthroplasty. Hip Int. 2021;31(1):43-49. doi:10.1177/1120700019888614
21. Faleide AGH, Bogen BE, Magnussen LH. Intra-session test-retest reliability of the Timed “Up & Go” Test when performed by patients with hip fractures. Eur J Physiother. 2015;17(2):89-97. doi:10.3109/21679169.2015.1043579
22. Barry E, Galvin R, Keogh C, et al. Is the timed up and go test a useful predictor of risk of falls in community dwelling older adults: a systematic review and meta- analysis. BMC Geriatr. 2014;14:14. doi:10.1186/1471-2318-14-14
23. Kojima G, Masud T, Kendrick D, et al. Does the timed up and go test predict future falls among British community-dwelling older people? Prospective cohort study nested within a randomised controlled trial. BMC Geriatr. 2015;15:38. doi:10.1186/s12877-015-0039-7
24. Shumway-Cook A, Brauer S, Woollacott M. Predicting the probability for falls in community-dwelling older adults using the timed up & go test. Phys Ther. 2000;80(9):896-903.
25. Jeong SM, Shin DW, Han K, et al. Timed Up-and-Go test is a useful predictor of fracture incidence. Bone. 2019;127:474-481. doi:10.1016/j.bone.2019.07.018
26. Donaghue OA, Savva GM, Börsch-Supan A, Kenny RA. Reliability, measurement error and minimum detectable change in reliability measurement error and minimum detectable change in mobility measures: a cohort study of community dwelling adults aged 50 years and over in Ireland. BMJ Open. 2019;9(11):e030475. doi:10/1136.bmjopen-2019-030475
27. Freter SH, Fruchter N. Relationship between timed ‘up and go’ and gait time in an elderly orthopaedic rehabilitation population. Clin Rehabil. 2000;14(1):96-101. doi:10.1191/026921500675545616
28. Kear BM, Guck TP, McGaha AL. Timed up and go (TUG) test: normative reference values for ages 20 to 59 years and relationships with physical and mental health risk factors. J Prim Care Community Health. 2017;8(1):9-13. doi:10.1177/2150131916659282
29. Abellan van Kan G, Rolland Y, Andrieu S, et al. Gait speed at usual pace as a predictor of adverse outcomes in community-dwelling older people: an International Academy on Nutrition and Aging (IANA) Task Force. J Nutr Health Aging. 2009;13(10)881-889. doi:10.1007/s12603-009-0246-z
30. Unver B, Baris RH, Yusel E, et al. Reliability of 4-meter and 10-meter walk tests after lower extremity surgery. Disabil Rehabil. 2017;39(25):2572-2576. doi:10.1080/09638288.2016.1236153
31. Fritz S, Lusardi M. White paper: “walking speed: the sixth vital sign.” J Geriatr Phys Ther. 2009;32(2):46-49.
32. Studenski S, Perera S, Patel K, et al. Gait speed and survival in older adults. JAMA. 2011;305(1):50-58. doi:10.1001/jama.2010.1923
33. Bohannon R. Comfortable and maximum walking speed of adults aged 20-79 years: reference values and determinants. Age Ageing. 1997;26(1):15-19. doi:10.1093/ageing/26.1.15
34. Perera S, Mody SH, Woodman RC, Studenski SA. Meaningful change and responsiveness in common physical performance in older adults. J Am Geriatr Soc. 2006;54(5):743-749. doi:10.1111/j.1532-5415.2006.00701.x
35. Hollman J, Beckman B, Brandt R, et al. Minimum detectable change in gait velocity during acute rehabilitation following hip fracture. J Geriatr Phys Ther. 2008;31(2):53-56. doi:10.1519/00139143-200831020-00003
36. Bohannon RW, Andrews AW. Normal walking speed: a descriptive meta-analysis. Physiotherapy. 2011;97(3):182-189. doi:10.1016/j.physio.2010.12.004
37. Granger CV, Hamilton BB, Keith RA, et al. Advances in functional assessment for medical rehabilitation. Top Geriatr Rehabil. 1986;1:59-74.
38. Keith RA, Granger CV, Hamilton BB, Sherwin FS. The Functional Independence Measure: a new tool for rehabilitation. In: Eisenberg MG, Grzesiak RC, eds. Advances in Clinical Rehabilitation. Springer-Verlag; 1987:6-18.
39. Linacre JM, Heinemann AW, Wright BD, et al. The structure and stability of the Functional Independence Measure. Arch Phys Med Rehabil. 1994;75(2):127-132.
40. Coster WJ, Haley SM, Jette AM. Measuring patient-reported outcomes after discharge from inpatient rehabilitation settings. J Rehabil Med. 2006;38(4):237-242. doi:10.1080/16501970600609774
41. Street L. Frequently asked questions about FIM. Journal of the Australasian Rehabilitation Nurses Association. 2014;17(1):21-22. https://ro.uow.edu.au/ahsri/296/
42. Green JP, Gordon R, Blanchard MB, et al. Development of the Australian National Subacute and Non-acute Patient (AN-SNAP) Classification. Version 4 Final Report. Australian Health Services Research Institute, University of Wollongong, 2015. https://ro.uow.edu.au/ahsri/760
43. Australasian Rehabilitation Outcomes Centre. University of Wollongong, Australia. https://www.uow.edu.au/ahsri/aroc/
44. Green J, Gordon R, Kobel C, et al; Centre for Health Service Development. The Australian National Subacute and Non-acute Patient Classification. AN-SNAP V4 User Manual. May 2015. https://documents.uow.edu.au/content/groups/public/@web/@chsd/@aroc/documents/doc/uow194637.pdf
45. Alexander TL, Simmonds FD, Capelle JT, Green LJ. Anywhere Hospital AROC Impairment Specific Report on Reconditioning (Inpatient–Pathway 3), July 2018–June 2019. Australasian Rehabilitation Outcomes Centre, Australian Health Services Research Institute, University of Wollongong; 2019. ro.uow.edu.au/ahsri/1110
46. Evans JD. Straightforward Statistics for the Behavioural Sciences. Brooks/Cole Publishing; 1996.
47. Lee SP, Dufek J, Hickman R, Schuerman S. Influence of procedural factors on the reliability and performance of the timed up-and-go test in older adults. Int J Gerontol. 2016;10(1):37-42. doi:10.1016/j.ijge.2015
48. New PW, Scroggie GD, Williams CM. The validity, reliability, responsiveness and minimal clinically important difference of the de Morton Mobility Index in rehabilitation. Disabil Rehabil. 2017;39(10):1039-1043. doi:10.10801/09638288.2016.1179800
49. Nakaguchi T, Ishimoto Y, Akazawa N. Functional Independence Measure for patients with locomotor disorders in convalescent rehabilitation wards. Clinically significant minimum difference in exercise score gain. Physiotherapy Science. 2018;33(2):235-240.
Positive Outcomes Following a Multidisciplinary Approach in the Diagnosis and Prevention of Hospital Delirium
From the Department of Neurology, Cedars-Sinai Medical Center, Los Angeles, CA (Drs. Ching, Darwish, Li, Wong, Simpson, and Funk), the Department of Anesthesia, Cedars-Sinai Medical Center, Los Angeles, CA (Keith Siegel), and the Department of Psychiatry, Cedars-Sinai Medical Center, Los Angeles, CA (Dr. Bamgbose).
Objectives: To reduce the incidence and duration of delirium among patients in a hospital ward through standardized delirium screening tools and nonpharmacologic interventions. To advance nursing-focused education on delirium-prevention strategies. To measure the efficacy of the interventions with the aim of reproducing best practices.
Background: Delirium is associated with poor patient outcomes but may be preventable in a significant percentage of hospitalized patients.
Methods: Following nursing-focused education to prevent delirium, we prospectively evaluated patient care outcomes in a consecutive series of patients who were admitted to a hospital medical-surgical ward within a 25-week period. All patients who had at least 1 Confusion Assessment Method (CAM) documented by a nurse during hospitalization met our inclusion criteria (N = 353). Standards for Quality Improvement Reporting Excellence guidelines were adhered to.
Results: There were 187 patients in the control group, and 166 in the postintervention group. Compared to the control group, the postintervention group had a significant decrease in the incidence of delirium during hospitalization (14.4% vs 4.2%) and a significant decrease in the mean percentage of tested nursing shifts with 1 or more positive CAM (4.9% vs 1.1%). Significant differences in secondary outcomes between the control and postintervention groups included median length of stay (6 days vs 4 days), mean length of stay (8.5 days vs 5.9 days), and use of an indwelling urinary catheter (9.1% vs 2.4%).
Conclusion: A multimodal strategy involving nursing-focused training and nonpharmacologic interventions to address hospital delirium is associated with improved patient care outcomes and nursing confidence. Nurses play an integral role in the early recognition and prevention of hospital delirium, which directly translates to reducing burdens in both patient functionality and health care costs.
Delirium is a disorder characterized by inattention and acute changes in cognition. It is defined by the American Psychiatric Association’s fifth edition of the Diagnostic and Statistical Manual of Mental Disorders as a disturbance in attention, awareness, and cognition over hours to a few days that is not better explained by a preexisting, established, or other evolving neurocognitive disorder.1 Delirium is common yet often under-recognized among hospitalized patients, particularly in the elderly. The incidence of delirium in elderly patients on admission is estimated to be 11% to 25%, and an additional 29% to 31% of elderly patients will develop delirium during the hospitalization.2 Delirium costs the health care system an estimated $38 billion to $152 billion per year.3 It is associated with negative outcomes, such as increased new placements to nursing homes, increased mortality, increased risk of dementia, and further cognitive deterioration among patients with dementia.4-6
Despite its prevalence, delirium may be preventable in a significant percentage of hospitalized patients. Targeted intervention strategies, such as frequent reorientation, maximizing sleep, early mobilization, restricting use of psychoactive medications, and addressing hearing or vision impairment, have been demonstrated to significantly reduce the incidence of hospital delirium.7,8 To achieve these goals, we explored the use of a multimodal strategy centered on nursing education. We integrated consistent, standardized delirium screening and nonpharmacologic interventions as part of a preventative protocol to reduce the incidence of delirium in the hospital ward.
Methods
We evaluated a consecutive series of patients who were admitted to a designated hospital medical-surgical ward within a 25-week period between October 2019 and April 2020. All patients during this period who had at least 1 Confusion Assessment Method (CAM) documented by a nurse during hospitalization met our inclusion criteria. Patients who did not have a CAM documented were excluded from the analysis. Delirium was defined according to the CAM diagnostic algorithm.9
Core nursing staff regularly assigned to the ward completed a multimodal training program designed to improve recognition, documentation, and prevention of hospital delirium. Prior to the training, the nurses completed a 5-point Likert scale survey assessing their level of confidence with recognizing delirium risk factors, preventing delirium, addressing delirium, utilizing the CAM tool, and educating others about delirium. Nurses completed the same survey after the study period ended.
The training curriculum for nurses began with an online module reviewing the epidemiology and risk factors for delirium. Nurses then participated in a series of in-service training sessions led by a team of physicians, during which the CAM and nonpharmacologic delirium prevention measures were reviewed then practiced first-hand. Nursing staff attended an in-person lecture reviewing the current body of literature on delirium risk factors and effective nursing interventions. After formal training was completed, nurses were instructed to document CAM screens

Patients admitted to the hospital unit from the start of the training program (week 1) until the order set was made available (week 15) constituted our control group. The postintervention study group consisted of patients admitted for 10 weeks after the completion of the interventions (weeks 16-25). A timeline of the study events is shown in Figure 1.

Patient demographics and hospital-stay metrics determined a priori were attained via the Cedars-Sinai Enterprise Information Services core. Age, sex, medical history, and incidence of surgery with anesthesia during hospitalization were recorded. The Charlson Comorbidity Index was calculated from patients’ listed diagnoses following discharge. Primary outcomes included incidence of patients with delirium during hospitalization, percentage of tested shifts with positive CAM screens, length of hospital stay, and survival. Secondary outcomes included measures associated with delirium, including the use of chemical restraints, physical restraints, sitters, indwelling urinary catheters, and new psychiatry and neurology consults. Chemical restraints were defined as administration of a new antipsychotic medication or benzodiazepine for the specific indication of hyperactive delirium or agitation.
Statistical analysis was conducted by a statistician, using R version 3.6.3.10P values of < .05 were considered significant. Categorical variables were analyzed using Fisher’s exact test. Continuous variables were analyzed with Welch’s t-test or, for highly skewed continuous variables, with Wilcoxon rank-sum test or Mood’s median test. All patient data were anonymized and stored securely in accordance with institutional guidelines.
Our project was deemed to represent nonhuman subject research and therefore did not require Institutional Review Board (IRB) approval upon review by our institution’s IRB committee and Office of Research Compliance and Quality Improvement. Standards for Quality Improvement Reporting Excellence (SQUIRE 2.0) guidelines were adhered to (Supplementary File can be found at mdedge.com/jcomjournal).
Results
We evaluated 353 patients who met our inclusion criteria: 187 in the control group, and 166 in the postintervention group. Ten patients were readmitted to the ward after their initial discharge; only the initial admission encounters were included in our analysis. Median age, sex, median Charlson Comorbidity Index, and incidence of surgery with anesthesia during hospitalization were comparable between the control and postintervention groups and are summarized in Table 2.

In the control group, 1572 CAMs were performed, with 74 positive CAMs recorded among 27 patients with delirium. In the postintervention group, 1298 CAMs were performed, with 12 positive CAMs recorded among 7 patients with delirium (Figure 2). Primary and secondary outcomes, as well as CAM compliance measures, are summarized in Table 3.

Compared to the control group, the postintervention group had a significant decrease in the incidence of delirium during hospitalization (14.4% vs 4.2%, P = .002) and a significant decrease in the mean percentage of tested nursing shifts with 1 or more positive CAM (4.9% vs 1.1%, P = .002). Significant differences in secondary outcomes between the control and postintervention groups included median length of stay (6 days vs 4 days, P = .004), mean length of stay (8.5 days vs 5.9 days, P = .003), and use of an indwelling urinary catheter (9.1% vs 2.4%, P = .012). There was a trend towards decreased incidence of chemical restraints and psychiatry consults, which did not reach statistical significance. Differences in mortality during hospitalization, physical restraint use, and sitter use could not be assessed due to low incidence.

Compliance with nursing CAM assessments was evaluated. Compared to the control group, the postintervention group saw a significant increase in the percentage of shifts with a CAM performed (54.7% vs 69.1%, P < .001). The median and mean number of CAMs performed per patient were similar between the control and postintervention groups.
Results of nursing surveys completed before and after the training program are listed in Table 4. After training, nurses had a greater level of confidence with recognizing delirium risk factors, preventing delirium, addressing delirium, utilizing the CAM tool, and educating others about delirium.

Discussion
Our study utilized a standardized delirium assessment tool to compare patient cohorts before and after nurse-targeted training interventions on delirium recognition and prevention. Our interventions emphasized nonpharmacologic intervention strategies, which are recommended as first-line in the management of patients with delirium.11 Patients were not excluded from the analysis based on preexisting medical conditions or recent surgery with anesthesia, to allow for conditions that are representative of community hospitals. We also did not use an inclusion criterion based on age; however, the majority of our patients were greater than 70 years old, representing those at highest risk for delirium.2 Significant outcomes among patients in the postintervention group include decreased incidence of delirium, lower average length of stay, decreased indwelling urinary catheter use, and increased compliance with delirium screening by nursing staff.
While the study’s focus was primarily on delirium prevention rather than treatment, these strategies may also have conferred the benefit of reversing delirium symptoms. In addition to measuring incidence of delirium, our primary outcome of percentage of tested shifts with 1 or more positive CAM was intended to assess the overall duration in which patients had delirium during their hospitalization. The reduction in shifts with positive CAMs observed in the postintervention group is notable, given that a significant percentage of patients with hospital delirium have the potential for symptom reversibility.12
Multiple studies have shown that admitted patients who develop delirium experience prolonged hospital stays, often up to 5 to 10 days longer.12-14 The decreased incidence and duration of delirium in our postintervention group is a reasonable explanation for the observed decrease in average length of stay. Our study is in line with previously documented initiatives that show that nonpharmacologic interventions can effectively address downstream health and fiscal sequelae of hospital delirium. For example, a volunteer-based initiative named the Hospital Elder Life Program, from which elements in our order set were modeled after, demonstrated significant reductions in delirium incidence, length of stay, and health care costs.14-16 Other initiatives that focused on educational training for nurses to assess and prevent delirium have also demonstrated similar positive results.17-19 Our study provides a model for effective nursing-focused education that can be reproduced in the hospital setting.
Unlike some other studies, which identified delirium based only on physician assessments, our initiative utilized the CAM performed by floor nurses to identify delirium. While this method
Our study demonstrated an increase in the overall compliance with the CAM screening during the postintervention period, which is significant given the under-recognition of delirium by health care professionals.20 We attribute this increase to greater realized importance and a higher level of confidence from nursing staff in recognizing and addressing delirium, as supported by survey data. While the increased screening of patients should be considered a positive outcome, it also poses the possibility that the observed decrease in delirium incidence in the postintervention group was in fact due to more CAMs performed on patients without delirium. Likewise, nurses may have become more adept at recognizing true delirium, as opposed to delirium mimics, in the latter period of the study.
Perhaps the greatest limitation of our study is the variability in performing and recording CAMs, as some patients had multiple CAMs recorded while others did not have any CAMs recorded. This may have been affected in part by the increase in COVID-19 cases in our hospital towards the latter half of the study, which resulted in changes in nursing assignments as well as patient comorbidities in ways that cannot be easily quantified. Given the limited size of our patient cohorts, certain outcomes, such as the use of sitters, physical restraints, and in-hospital mortality, were unable to be assessed for changes statistically. Causative relationships between our interventions and associated outcome measures are necessarily limited in a binary comparison between control and postintervention groups.
Within these limitations, our study demonstrates promising results in core dimensions of patient care. We anticipate further quality improvement initiatives involving greater numbers of nursing staff and patients to better quantify the impact of nonpharmacologic nursing-centered interventions for preventing hospital delirium.
Conclusion
A multimodal strategy involving nursing-focused training and nonpharmacologic interventions to address hospital delirium is associated with improved patient care outcomes and nursing confidence. Nurses play an integral role in the early recognition and prevention of hospital delirium, which directly translates to reducing burdens in both patient functionality and health care costs. Education and tools to equip nurses to perform standardized delirium screening and interventions should be prioritized.
Acknowledgment: The authors thanks Olena Svetlov, NP, Oscar Abarca, Jose Chavez, and Jenita Gutierrez.
Corresponding author: Jason Ching, MD, Department of Neurology, Cedars-Sinai Medical Center, 8700 Beverly Blvd, Los Angeles, CA 90048; jason.ching@cshs.org.
Financial disclosures: None.
Funding: This research was supported by NIH National Center for Advancing Translational Science (NCATS) UCLA CTSI Grant Number UL1TR001881.
1. American Psychiatric Association. Diagnostic and Statistical Manual of Mental Disorders, 5th edition. American Psychiatric Association; 2013.
2. Vasilevskis EE, Han JH, Hughes CG, et al. Epidemiology and risk factors for delirium across hospital settings. Best Pract Res Clin Anaesthesiol. 2012;26(3):277-287. doi:10.1016/j.bpa.2012.07003
3. Leslie DL, Marcantonio ER, Zhang Y, et al. One-year health care costs associated with delirium in the elderly population. Arch Intern Med. 2008;168(1):27-32. doi:10.1001/archinternmed.2007.4
4. McCusker J, Cole M, Abrahamowicz M, et al. Delirium predicts 12-month mortality. Arch Intern Med. 2002;162(4):457-463. doi:10.1001/archinte.162.4.457
5. Witlox J, Eurelings LS, de Jonghe JF, et al. Delirium in elderly patients and the risk of postdischarge mortality, institutionalization, and dementia: a meta-analysis. JAMA. 2010;304(4):443-451. doi:10.1001/jama.2010.1013
6. Gross AL, Jones RN, Habtemariam DA, et al. Delirium and long-term cognitive trajectory among persons with dementia. Arch Intern Med. 2012;172(17):1324-1331. doi:10.1001/archinternmed.2012.3203
7. Inouye SK. Prevention of delirium in hospitalized older patients: risk factors and targeted intervention strategies. Ann Med. 2000;32(4):257-263. doi:10.3109/07853890009011770
8. Siddiqi N, Harrison JK, Clegg A, et al. Interventions for preventing delirium in hospitalised non-ICU patients. Cochrane Database Syst Rev. 2016;3:CD005563. doi:10.1002/14651858.CD005563.pub3
9. Inouye SK, van Dyck CH, Alessi CA, et al. Clarifying confusion: the confusion assessment method. A new method for detection of delirium. Ann Intern Med. 1990;113(12):941-948. doi:10.7326/0003-4819-113-12-941
10. R Core Team. R: A Language and Environment for Statistical Computing. R Foundation for Statistical Computing; 2017.
11. Fong TG, Tulebaev SR, Inouye SK. Delirium in elderly adults: diagnosis, prevention and treatment. Nat Rev Neurol. 2009;5(4):210-220. doi:10.1038/nrneurol.2009.24
12. Siddiqi N, House AO, Holmes JD. Occurrence and outcome of delirium in medical in-patients: a systematic literature review. Age Ageing. 2006;35(4):350-364. doi:10.1093/ageing/afl005
13. Ely EW, Shintani A, Truman B, et al. Delirium as a predictor of mortality in mechanically ventilated patients in the intensive care unit. JAMA. 2004;291(14):1753-1762. doi:10.1001/jama.291.14.1753
14. Chen CC, Lin MT, Tien YW, et al. Modified Hospital Elder Life Program: effects on abdominal surgery patients. J Am Coll Surg. 2011;213(2):245-252. doi:10.1016/j.jamcollsurg.2011.05.004
15. Zaubler TS, Murphy K, Rizzuto L, et al. Quality improvement and cost savings with multicomponent delirium interventions: replication of the Hospital Elder Life Program in a community hospital. Psychosomatics. 2013;54(3):219-226. doi:10.1016/j.psym.2013.01.010
16. Rubin FH, Neal K, Fenlon K, et al. Sustainability and scalability of the Hospital Elder Life Program at a community hospital. J Am Geriatr Soc. 2011;59(2):359-365. doi:10.1111/j.1532-5415.2010.03243.x
17. Milisen K, Foreman MD, Abraham IL, et al. A nurse-led interdisciplinary intervention program for delirium in elderly hip-fracture patients. J Am Geriatr Soc. 2001;49(5):523-532. doi:10.1046/j.1532-5415.2001.49109.x
18. Lundström M, Edlund A, Karlsson S, et al. A multifactorial intervention program reduces the duration of delirium, length of hospitalization, and mortality in delirious patients. J Am Geriatr Soc. 2005;53(4):622-628. doi:10.1111/j.1532-5415.2005.53210.x
19. Tabet N, Hudson S, Sweeney V, et al. An educational intervention can prevent delirium on acute medical wards. Age Ageing. 2005;34(2):152-156. doi:10.1093/ageing/afi0320. Han JH, Zimmerman EE, Cutler N, et al. Delirium in older emergency department patients: recognition, risk factors, and psychomotor subtypes. Acad Emerg Med. 2009;16(3):193-200. doi:10.1111/j.1553-2712.2008.00339.x
From the Department of Neurology, Cedars-Sinai Medical Center, Los Angeles, CA (Drs. Ching, Darwish, Li, Wong, Simpson, and Funk), the Department of Anesthesia, Cedars-Sinai Medical Center, Los Angeles, CA (Keith Siegel), and the Department of Psychiatry, Cedars-Sinai Medical Center, Los Angeles, CA (Dr. Bamgbose).
Objectives: To reduce the incidence and duration of delirium among patients in a hospital ward through standardized delirium screening tools and nonpharmacologic interventions. To advance nursing-focused education on delirium-prevention strategies. To measure the efficacy of the interventions with the aim of reproducing best practices.
Background: Delirium is associated with poor patient outcomes but may be preventable in a significant percentage of hospitalized patients.
Methods: Following nursing-focused education to prevent delirium, we prospectively evaluated patient care outcomes in a consecutive series of patients who were admitted to a hospital medical-surgical ward within a 25-week period. All patients who had at least 1 Confusion Assessment Method (CAM) documented by a nurse during hospitalization met our inclusion criteria (N = 353). Standards for Quality Improvement Reporting Excellence guidelines were adhered to.
Results: There were 187 patients in the control group, and 166 in the postintervention group. Compared to the control group, the postintervention group had a significant decrease in the incidence of delirium during hospitalization (14.4% vs 4.2%) and a significant decrease in the mean percentage of tested nursing shifts with 1 or more positive CAM (4.9% vs 1.1%). Significant differences in secondary outcomes between the control and postintervention groups included median length of stay (6 days vs 4 days), mean length of stay (8.5 days vs 5.9 days), and use of an indwelling urinary catheter (9.1% vs 2.4%).
Conclusion: A multimodal strategy involving nursing-focused training and nonpharmacologic interventions to address hospital delirium is associated with improved patient care outcomes and nursing confidence. Nurses play an integral role in the early recognition and prevention of hospital delirium, which directly translates to reducing burdens in both patient functionality and health care costs.
Delirium is a disorder characterized by inattention and acute changes in cognition. It is defined by the American Psychiatric Association’s fifth edition of the Diagnostic and Statistical Manual of Mental Disorders as a disturbance in attention, awareness, and cognition over hours to a few days that is not better explained by a preexisting, established, or other evolving neurocognitive disorder.1 Delirium is common yet often under-recognized among hospitalized patients, particularly in the elderly. The incidence of delirium in elderly patients on admission is estimated to be 11% to 25%, and an additional 29% to 31% of elderly patients will develop delirium during the hospitalization.2 Delirium costs the health care system an estimated $38 billion to $152 billion per year.3 It is associated with negative outcomes, such as increased new placements to nursing homes, increased mortality, increased risk of dementia, and further cognitive deterioration among patients with dementia.4-6
Despite its prevalence, delirium may be preventable in a significant percentage of hospitalized patients. Targeted intervention strategies, such as frequent reorientation, maximizing sleep, early mobilization, restricting use of psychoactive medications, and addressing hearing or vision impairment, have been demonstrated to significantly reduce the incidence of hospital delirium.7,8 To achieve these goals, we explored the use of a multimodal strategy centered on nursing education. We integrated consistent, standardized delirium screening and nonpharmacologic interventions as part of a preventative protocol to reduce the incidence of delirium in the hospital ward.
Methods
We evaluated a consecutive series of patients who were admitted to a designated hospital medical-surgical ward within a 25-week period between October 2019 and April 2020. All patients during this period who had at least 1 Confusion Assessment Method (CAM) documented by a nurse during hospitalization met our inclusion criteria. Patients who did not have a CAM documented were excluded from the analysis. Delirium was defined according to the CAM diagnostic algorithm.9
Core nursing staff regularly assigned to the ward completed a multimodal training program designed to improve recognition, documentation, and prevention of hospital delirium. Prior to the training, the nurses completed a 5-point Likert scale survey assessing their level of confidence with recognizing delirium risk factors, preventing delirium, addressing delirium, utilizing the CAM tool, and educating others about delirium. Nurses completed the same survey after the study period ended.
The training curriculum for nurses began with an online module reviewing the epidemiology and risk factors for delirium. Nurses then participated in a series of in-service training sessions led by a team of physicians, during which the CAM and nonpharmacologic delirium prevention measures were reviewed then practiced first-hand. Nursing staff attended an in-person lecture reviewing the current body of literature on delirium risk factors and effective nursing interventions. After formal training was completed, nurses were instructed to document CAM screens
Patients admitted to the hospital unit from the start of the training program (week 1) until the order set was made available (week 15) constituted our control group. The postintervention study group consisted of patients admitted for 10 weeks after the completion of the interventions (weeks 16-25). A timeline of the study events is shown in Figure 1.
Patient demographics and hospital-stay metrics determined a priori were attained via the Cedars-Sinai Enterprise Information Services core. Age, sex, medical history, and incidence of surgery with anesthesia during hospitalization were recorded. The Charlson Comorbidity Index was calculated from patients’ listed diagnoses following discharge. Primary outcomes included incidence of patients with delirium during hospitalization, percentage of tested shifts with positive CAM screens, length of hospital stay, and survival. Secondary outcomes included measures associated with delirium, including the use of chemical restraints, physical restraints, sitters, indwelling urinary catheters, and new psychiatry and neurology consults. Chemical restraints were defined as administration of a new antipsychotic medication or benzodiazepine for the specific indication of hyperactive delirium or agitation.
Statistical analysis was conducted by a statistician, using R version 3.6.3.10P values of < .05 were considered significant. Categorical variables were analyzed using Fisher’s exact test. Continuous variables were analyzed with Welch’s t-test or, for highly skewed continuous variables, with Wilcoxon rank-sum test or Mood’s median test. All patient data were anonymized and stored securely in accordance with institutional guidelines.
Our project was deemed to represent nonhuman subject research and therefore did not require Institutional Review Board (IRB) approval upon review by our institution’s IRB committee and Office of Research Compliance and Quality Improvement. Standards for Quality Improvement Reporting Excellence (SQUIRE 2.0) guidelines were adhered to (Supplementary File can be found at mdedge.com/jcomjournal).
Results
We evaluated 353 patients who met our inclusion criteria: 187 in the control group, and 166 in the postintervention group. Ten patients were readmitted to the ward after their initial discharge; only the initial admission encounters were included in our analysis. Median age, sex, median Charlson Comorbidity Index, and incidence of surgery with anesthesia during hospitalization were comparable between the control and postintervention groups and are summarized in Table 2.
In the control group, 1572 CAMs were performed, with 74 positive CAMs recorded among 27 patients with delirium. In the postintervention group, 1298 CAMs were performed, with 12 positive CAMs recorded among 7 patients with delirium (Figure 2). Primary and secondary outcomes, as well as CAM compliance measures, are summarized in Table 3.
Compared to the control group, the postintervention group had a significant decrease in the incidence of delirium during hospitalization (14.4% vs 4.2%, P = .002) and a significant decrease in the mean percentage of tested nursing shifts with 1 or more positive CAM (4.9% vs 1.1%, P = .002). Significant differences in secondary outcomes between the control and postintervention groups included median length of stay (6 days vs 4 days, P = .004), mean length of stay (8.5 days vs 5.9 days, P = .003), and use of an indwelling urinary catheter (9.1% vs 2.4%, P = .012). There was a trend towards decreased incidence of chemical restraints and psychiatry consults, which did not reach statistical significance. Differences in mortality during hospitalization, physical restraint use, and sitter use could not be assessed due to low incidence.
Compliance with nursing CAM assessments was evaluated. Compared to the control group, the postintervention group saw a significant increase in the percentage of shifts with a CAM performed (54.7% vs 69.1%, P < .001). The median and mean number of CAMs performed per patient were similar between the control and postintervention groups.
Results of nursing surveys completed before and after the training program are listed in Table 4. After training, nurses had a greater level of confidence with recognizing delirium risk factors, preventing delirium, addressing delirium, utilizing the CAM tool, and educating others about delirium.
Discussion
Our study utilized a standardized delirium assessment tool to compare patient cohorts before and after nurse-targeted training interventions on delirium recognition and prevention. Our interventions emphasized nonpharmacologic intervention strategies, which are recommended as first-line in the management of patients with delirium.11 Patients were not excluded from the analysis based on preexisting medical conditions or recent surgery with anesthesia, to allow for conditions that are representative of community hospitals. We also did not use an inclusion criterion based on age; however, the majority of our patients were greater than 70 years old, representing those at highest risk for delirium.2 Significant outcomes among patients in the postintervention group include decreased incidence of delirium, lower average length of stay, decreased indwelling urinary catheter use, and increased compliance with delirium screening by nursing staff.
While the study’s focus was primarily on delirium prevention rather than treatment, these strategies may also have conferred the benefit of reversing delirium symptoms. In addition to measuring incidence of delirium, our primary outcome of percentage of tested shifts with 1 or more positive CAM was intended to assess the overall duration in which patients had delirium during their hospitalization. The reduction in shifts with positive CAMs observed in the postintervention group is notable, given that a significant percentage of patients with hospital delirium have the potential for symptom reversibility.12
Multiple studies have shown that admitted patients who develop delirium experience prolonged hospital stays, often up to 5 to 10 days longer.12-14 The decreased incidence and duration of delirium in our postintervention group is a reasonable explanation for the observed decrease in average length of stay. Our study is in line with previously documented initiatives that show that nonpharmacologic interventions can effectively address downstream health and fiscal sequelae of hospital delirium. For example, a volunteer-based initiative named the Hospital Elder Life Program, from which elements in our order set were modeled after, demonstrated significant reductions in delirium incidence, length of stay, and health care costs.14-16 Other initiatives that focused on educational training for nurses to assess and prevent delirium have also demonstrated similar positive results.17-19 Our study provides a model for effective nursing-focused education that can be reproduced in the hospital setting.
Unlike some other studies, which identified delirium based only on physician assessments, our initiative utilized the CAM performed by floor nurses to identify delirium. While this method
Our study demonstrated an increase in the overall compliance with the CAM screening during the postintervention period, which is significant given the under-recognition of delirium by health care professionals.20 We attribute this increase to greater realized importance and a higher level of confidence from nursing staff in recognizing and addressing delirium, as supported by survey data. While the increased screening of patients should be considered a positive outcome, it also poses the possibility that the observed decrease in delirium incidence in the postintervention group was in fact due to more CAMs performed on patients without delirium. Likewise, nurses may have become more adept at recognizing true delirium, as opposed to delirium mimics, in the latter period of the study.
Perhaps the greatest limitation of our study is the variability in performing and recording CAMs, as some patients had multiple CAMs recorded while others did not have any CAMs recorded. This may have been affected in part by the increase in COVID-19 cases in our hospital towards the latter half of the study, which resulted in changes in nursing assignments as well as patient comorbidities in ways that cannot be easily quantified. Given the limited size of our patient cohorts, certain outcomes, such as the use of sitters, physical restraints, and in-hospital mortality, were unable to be assessed for changes statistically. Causative relationships between our interventions and associated outcome measures are necessarily limited in a binary comparison between control and postintervention groups.
Within these limitations, our study demonstrates promising results in core dimensions of patient care. We anticipate further quality improvement initiatives involving greater numbers of nursing staff and patients to better quantify the impact of nonpharmacologic nursing-centered interventions for preventing hospital delirium.
Conclusion
A multimodal strategy involving nursing-focused training and nonpharmacologic interventions to address hospital delirium is associated with improved patient care outcomes and nursing confidence. Nurses play an integral role in the early recognition and prevention of hospital delirium, which directly translates to reducing burdens in both patient functionality and health care costs. Education and tools to equip nurses to perform standardized delirium screening and interventions should be prioritized.
Acknowledgment: The authors thanks Olena Svetlov, NP, Oscar Abarca, Jose Chavez, and Jenita Gutierrez.
Corresponding author: Jason Ching, MD, Department of Neurology, Cedars-Sinai Medical Center, 8700 Beverly Blvd, Los Angeles, CA 90048; jason.ching@cshs.org.
Financial disclosures: None.
Funding: This research was supported by NIH National Center for Advancing Translational Science (NCATS) UCLA CTSI Grant Number UL1TR001881.
1. American Psychiatric Association. Diagnostic and Statistical Manual of Mental Disorders, 5th edition. American Psychiatric Association; 2013.
2. Vasilevskis EE, Han JH, Hughes CG, et al. Epidemiology and risk factors for delirium across hospital settings. Best Pract Res Clin Anaesthesiol. 2012;26(3):277-287. doi:10.1016/j.bpa.2012.07003
3. Leslie DL, Marcantonio ER, Zhang Y, et al. One-year health care costs associated with delirium in the elderly population. Arch Intern Med. 2008;168(1):27-32. doi:10.1001/archinternmed.2007.4
4. McCusker J, Cole M, Abrahamowicz M, et al. Delirium predicts 12-month mortality. Arch Intern Med. 2002;162(4):457-463. doi:10.1001/archinte.162.4.457
5. Witlox J, Eurelings LS, de Jonghe JF, et al. Delirium in elderly patients and the risk of postdischarge mortality, institutionalization, and dementia: a meta-analysis. JAMA. 2010;304(4):443-451. doi:10.1001/jama.2010.1013
6. Gross AL, Jones RN, Habtemariam DA, et al. Delirium and long-term cognitive trajectory among persons with dementia. Arch Intern Med. 2012;172(17):1324-1331. doi:10.1001/archinternmed.2012.3203
7. Inouye SK. Prevention of delirium in hospitalized older patients: risk factors and targeted intervention strategies. Ann Med. 2000;32(4):257-263. doi:10.3109/07853890009011770
8. Siddiqi N, Harrison JK, Clegg A, et al. Interventions for preventing delirium in hospitalised non-ICU patients. Cochrane Database Syst Rev. 2016;3:CD005563. doi:10.1002/14651858.CD005563.pub3
9. Inouye SK, van Dyck CH, Alessi CA, et al. Clarifying confusion: the confusion assessment method. A new method for detection of delirium. Ann Intern Med. 1990;113(12):941-948. doi:10.7326/0003-4819-113-12-941
10. R Core Team. R: A Language and Environment for Statistical Computing. R Foundation for Statistical Computing; 2017.
11. Fong TG, Tulebaev SR, Inouye SK. Delirium in elderly adults: diagnosis, prevention and treatment. Nat Rev Neurol. 2009;5(4):210-220. doi:10.1038/nrneurol.2009.24
12. Siddiqi N, House AO, Holmes JD. Occurrence and outcome of delirium in medical in-patients: a systematic literature review. Age Ageing. 2006;35(4):350-364. doi:10.1093/ageing/afl005
13. Ely EW, Shintani A, Truman B, et al. Delirium as a predictor of mortality in mechanically ventilated patients in the intensive care unit. JAMA. 2004;291(14):1753-1762. doi:10.1001/jama.291.14.1753
14. Chen CC, Lin MT, Tien YW, et al. Modified Hospital Elder Life Program: effects on abdominal surgery patients. J Am Coll Surg. 2011;213(2):245-252. doi:10.1016/j.jamcollsurg.2011.05.004
15. Zaubler TS, Murphy K, Rizzuto L, et al. Quality improvement and cost savings with multicomponent delirium interventions: replication of the Hospital Elder Life Program in a community hospital. Psychosomatics. 2013;54(3):219-226. doi:10.1016/j.psym.2013.01.010
16. Rubin FH, Neal K, Fenlon K, et al. Sustainability and scalability of the Hospital Elder Life Program at a community hospital. J Am Geriatr Soc. 2011;59(2):359-365. doi:10.1111/j.1532-5415.2010.03243.x
17. Milisen K, Foreman MD, Abraham IL, et al. A nurse-led interdisciplinary intervention program for delirium in elderly hip-fracture patients. J Am Geriatr Soc. 2001;49(5):523-532. doi:10.1046/j.1532-5415.2001.49109.x
18. Lundström M, Edlund A, Karlsson S, et al. A multifactorial intervention program reduces the duration of delirium, length of hospitalization, and mortality in delirious patients. J Am Geriatr Soc. 2005;53(4):622-628. doi:10.1111/j.1532-5415.2005.53210.x
19. Tabet N, Hudson S, Sweeney V, et al. An educational intervention can prevent delirium on acute medical wards. Age Ageing. 2005;34(2):152-156. doi:10.1093/ageing/afi0320. Han JH, Zimmerman EE, Cutler N, et al. Delirium in older emergency department patients: recognition, risk factors, and psychomotor subtypes. Acad Emerg Med. 2009;16(3):193-200. doi:10.1111/j.1553-2712.2008.00339.x

Predicting cardiac shock mortality in the ICU
Addition of echocardiogram measurement of biventricular dysfunction improved the accuracy of prognosis among patients with cardiac shock (CS) in the cardiac intensive care unit.
In patients in the cardiac ICU with CS, biventricular dysfunction (BVD), as assessed using transthoracic echocardiography, improves clinical risk stratification when combined with the Society for Cardiovascular Angiography and Interventions shock stage.
No improvements in risk stratification was seen with patients with left or right ventricular systolic dysfunction (LVSD or RVSD) alone, according to an article published in the journal Chest.
Ventricular systolic dysfunction is commonly seen in patients who have suffered cardiac shock, most often on the left side. Although echocardiography is often performed on these patients during diagnosis, previous studies looking at ventricular dysfunction used invasive hemodynamic parameters, which made it challenging to incorporate their findings into general cardiac ICU practice.
Pinning down cardiac shock
Although treatment of acute MI and heart failure has improved greatly, particularly with the implementation of percutaneous coronary intervention (primary PCI) for ST-segment elevation MI. This has reduced the rate of future heart failure, but cardiac shock can occur before or after the procedure, with a 30-day mortality of 30%-40%. This outcome hasn’t improved in the last 20 years.
Efforts to improve cardiac shock outcomes through percutaneous mechanical circulatory support devices have been hindered by the fact that CS patients are heterogeneous, and prognosis may depend on a range of factors.
SCAI was developed as a five-stage classification system for CS to improve communication of patient status, as well as to improve differentiation among patients participation in clinical trials. It does not include measures of ventricular dysfunction.
Simple measure boosts prognosis accuracy
The new work adds an additional layer to the SCAI shock stage. “Adding echocardiography allows discrimination between levels of risk for each SCAI stage,” said David Baran, MD, who was asked for comment. Dr. Baran was the lead author on the original SCAI study and is system director of advanced heart failure at Sentara Heart Hospital, as well as a professor of medicine at Eastern Virginia Medical School, both in Norfolk.
The work also underscores the value of repeated measures of prognosis during a patient’s stay in the ICU. “If a patient is not improving, it may prompt a consideration of whether transfer or consultation with a tertiary center may be of value. Conversely, if a patient doesn’t have high-risk features and is responding to therapy, it is reassuring to have data supporting low mortality with that care plan,” said Dr. Baran.
The study may be biased, since not every patient undergoes an echocardiogram. Still, “the authors make a convincing case that biventricular dysfunction is a powerful negative marker across the spectrum of SCAI stages,” said Dr. Baran.
Echocardiography is simple and generally available, and some are even portable and used with a smartphone. But patient body size interferes with echocardiography, as can the presence of a ventilator or multiple surgical dressings. “The key advantage of echo is that it is completely noninvasive and can be brought to the patient in the ICU, unlike other testing which involves moving the patient to the testing environment,” said Dr. Baran.
The researchers analyzed data from 3,158 patients admitted to the cardiac ICU at the Mayo Clinic Hospital St. Mary’s Campus in Rochester, Minn., 51.8% of whom had acute coronary syndromes. They defined LVSD as a left ventricular ejection fraction less than 40%, and RVSD as at least moderate systolic dysfunction determined by semiquantitative measurement. BVD constituted the presence of both LVSD and RVSD. They examined the association of in-hospital mortality with these parameters combined with SCAI stage.
BVD a risk factor
Overall in-hospital mortality was 10%. A total of 22.3% of patients had LVSD and 11.8% had RVSD; 16.4% had moderate or greater BVD. There was no association between LVSD or RVSD and in-hospital mortality after adjustment for SCAI stage, but there was a significant association for BVD (adjusted hazard ratio, 1.815; P = .0023). When combined with SCAI, BVC led to an improved ability to predict hospital mortality (area under the curve, 0.784 vs. 0.766; P < .001). Adding semiquantitative RVSD and LVSD led to more improvement (AUC, 0.794; P < .01 vs. both).
RVSD was associated with higher in-hospital mortality (adjusted odds ratio, 1.421; P = .02), and there was a trend toward greater mortality with LVSD (aOR, 1.336; P = .06). There was little change when SCAI shock stage A patients were excluded (aOR, 1.840; P < .001).
Patients with BVD had greater in-hospital mortality than those without ventricular dysfunction (aOR, 1.815; P = .0023), but other between-group comparisons were not significant.
The researchers performed a classification and regression tree analysis using left ventricular ejection fraction (LVEF) and semiquantitative RVSD. It found that RVSD was a better predictor of in-hospital mortality than LVSD, and the best cutoff for LVSD was different among patients with RVSD and patients without RVSD.
Patients with mild or greater RVD and LVEF greater than 24% were considered high risk; those with borderline or low RVSD and LVEF less than 33%, or mild or greater RVSD with LVEF of at least 24%, were considered intermediate risk. Patients with borderline or no RVSD and LVEF of at least 33% were considered low risk. Hospital mortality was 22% in the high-risk group, 12.2% in the intermediate group, and 3.3% in the low-risk group (aOR vs. intermediate, 0.493; P = .0006; aOR vs. high risk, 0.357; P < .0001).
The study authors disclosed no relevant financial relationships.
A version of this article first appeared on Medscape.com.
Adjuvant Olaparib Improves Outcomes in High-Risk, HER2-Negative Early Breast Cancer Patients With Germline BRCA1 and BRCA2 Mutations
Study Overview
Objective. To assess the efficacy and safety of olaparib as an adjuvant treatment in patients with BRCA1 or BRCA2 germline mutations who are at a high-risk for relapse.
Design. A randomized, double-blind, placebo-controlled, multicenter phase III study. The published results are from the prespecified interim analysis.
Intervention. Patients were randomized in 1:1 ratio to either receive 300 mg of olaparib orally twice daily or to receive a matching placebo. Randomization was stratified by hormone receptor status (estrogen receptor and/or progesterone receptor positive/HER2-negative vs triple negative), prior neoadjuvant vs adjuvant chemotherapy, and prior platinum use for breast cancer. Treatment was continued for 52 weeks.
Setting and participants. A total of 1836 patients were randomized in a 1:1 fashion to receive olaparib or a placebo. Eligible patients had a germline BRCA1 or BRCA1 pathogenic or likely pathogenic variant. Patients had high-risk, HER2-negative primary breast cancers and all had received definitive local therapy and neoadjuvant or adjuvant chemotherapy. Patients were enrolled between 2 to 12 weeks after completion of all local therapy. Platinum chemotherapy was allowed. Patients received adjuvant endocrine therapy for hormone receptor positive disease as well as adjuvant bisphosphonates per institutional guidelines. Patients with triple negative disease who received adjuvant chemotherapy were required to be lymph node positive or have at least 2 cm invasive disease. Patients who received neoadjuvant chemotherapy were required to have residual invasive disease to be eligible. For hormone receptor positive patients receiving adjuvant chemotherapy to be eligible they had to have at least 4 pathologically confirmed lymph nodes involved. Hormone receptor positive patients who had neoadjuvant chemotherapy were required to have had residual invasive disease.
Main outcome measures. The primary endpoint for the study was invasive disease-free survival which was defined as time from randomization to date of recurrence or death from any cause. The secondary endpoints included overall survival (OS), distant disease-free survival, safety, and tolerability of olaparib.
Main results. At the time of data cutoff, 284 events had occurred with a median follow-up of 2.5 years in the intention to treat population. A total of 81% of patients had triple negative breast cancer. Most patients (94% in the olaparib group and 92% in the placebo group) received both taxane and anthracycline based chemotherapy regimens. Platinum based chemotherapy was used in 26% of patients in each group. The groups were otherwise well balanced. Germline mutations in BRCA1 were present in 72% of patients and BRCA2 in 27% of patients. These were balanced between groups.
At the time of this analysis, adjuvant olaparib reduced the risk of invasive disease-free survival by 42% compared with placebo (P < .001). At 3 years, invasive disease-free survival was 85.9% in the olaparib group and 77.1% in the placebo group (difference, 8.8 percentage points; 95% CI, 4.5-13.0; hazard ratio [HR], 0.58; 99.5% CI, 0.41-0.82; P < .001). The 3-year distant disease-free survival was 87.5% in the olaparib group and 80.4% in the placebo group (HR 0.57; 99.5% CI, 0.39-0.83; P < .001). Results also showed that olaparib was associated with fewer deaths than placebo (59 and 86, respectively) (HR, 0.68; 99% CI, 0.44-1.05; P = .02); however, there was no significant difference between treatment arms at the time of this interim analysis. Subgroup analysis showed a consistent benefit across all groups with no difference noted regarding BRCA mutation, hormone receptor status or use of neoadjuvant vs adjuvant chemotherapy.
The side effects were consistent with the safety profile of olaparib. Adverse events of grade 3 or higher more common with olaparib included anemia (8.7%), leukopenia (3%), and fatigue (1.8%). Early discontinuation of trial regimen due to adverse events of disease recurrence occurred in 25.9% in the olaparib group and 20.7% in the placebo group. Blood transfusions were required in 5.8% of patients in the olaparib group. Myelodysplasia or acute myleoid leukemia was observed in 2 patients in the olaparib group and 3 patients in the placebo group. Adverse events leading to death occurred in 1 patient in the olaparib group and 2 patients in the placebo group.
Conclusion. Among patients with high-risk, HER2-negative early breast cancer and germline BRCA1 or BRCA2 pathogenic or likely pathogenic variants, adjuvant olaparib after completion of local treatment and neoadjuvant or adjuvant chemotherapy was associated with significantly longer invasive disease-free and distant disease-free survival compared with placebo.
Commentary
The results from the current OlympiA trial provide the first evidence that adjuvant therapy with poly adenosine diphosphate-ribose polymerase (PARP) inhibitors can improve outcomes in high-risk, HER2-negative breast cancer in patients with pathogenic BRCA1 and BRCA2 mutations. The OS, while favoring olaparib, is not yet mature at the time of this analysis. Nevertheless, these results represent an important step forward in improving outcomes in this patient population. The efficacy and safety of PARP inhibitors in BRCA-mutated breast cancer has previously been shown in patients with advanced disease leading to FDA approval of both olaparib and talazoparib in this setting.1,2 With the current results, PARP inhibitors will certainly play an important role in the adjuvant setting in patients with deleterious BRCA1 or BRCA2 mutations at high risk for relapse. Importantly, the side effect profile appears acceptable with no unexpected events and a very low rate of secondary myeloid malignancies.
Subgroup analysis appears to indicate a benefit across all groups including hormone receptor–positive disease and triple negative breast cancer. Interestingly, approximately 25% of patients in both cohorts received platinum-based chemotherapy. The efficacy of adjuvant olaparib did not appear to be impacted by prior use of platinum-containing chemotherapy regimens. It is important to consider that postneoadjuvant capecitabine, per the results of the CREATE-X trial, in triple-negative patients was not permitted in the current study. Although, this has been widely adopted in clinical practice.3 The CREATE-X trial did not specify the benefit of adjuvant capecitabine in the BRCA-mutated cohort, thus, it is not clear how this subgroup fares with this approach. Thus, one cannot extrapolate the relative efficacy of olaparib compared with capecitabine, as pointed out by the authors, and whether we consider the use of capecitabine and/or olaparib in triple-negative patients with residual invasive disease after neoadjuvant chemotherapy is not clear at this time.
Nevertheless, the magnitude of benefit seen in this trial certainly provide clinically relevant and potentially practice changing results. It will be imperative to follow these results as the survival data matures and ensure no further long-term toxicity, particularly secondary myeloid malignancies, develop. These results should be discussed with each patient and informed decisions regarding the use of adjuvant olaparib should be considered for this patient population. Lastly, these results highlight the importance of germline testing for patients with breast cancer in accordance with national guideline recommendations. Moreover, these results certainly call into question whether it is time to consider expansion of our current germline testing guidelines to detect all potential patients who may benefit from this therapy.
Application for Clinical Practice
Adjuvant olaparib in high-risk patients with germline BRCA1 or BRCA2 mutations improves invasive and distant disease-free survival and should be considered in patients who meet the enrollment criteria of the current study. Furthermore, this highlights the importance of appropriate germline genetic testing in patients with breast cancer.
Financial disclosures: None.
1. Robson M, Im SA, Senkus E, et al. Olaparib for metastatic breast cancer in patients with a germline BRCA mutation. N Engl J Med. 2017;377(6):523-533. doi:10.1056/NEJMoa1706450
2. Litton JK, Rugo HS, Ettl J, et al. Talazoparib in Patients with Advanced Breast Cancer and a Germline BRCA Mutation. N Engl J Med. 2018;379(8):753-763. doi:10.1056/NEJMoa1802905
3. Masuda N, Lee SJ, Ohtani S, et al. Adjuvant Capecitabine for Breast Cancer after Preoperative Chemotherapy. N Engl J Med. 2017;376(22):2147-2159. doi:10.1056/NEJMoa1612645
Study Overview
Objective. To assess the efficacy and safety of olaparib as an adjuvant treatment in patients with BRCA1 or BRCA2 germline mutations who are at a high-risk for relapse.
Design. A randomized, double-blind, placebo-controlled, multicenter phase III study. The published results are from the prespecified interim analysis.
Intervention. Patients were randomized in 1:1 ratio to either receive 300 mg of olaparib orally twice daily or to receive a matching placebo. Randomization was stratified by hormone receptor status (estrogen receptor and/or progesterone receptor positive/HER2-negative vs triple negative), prior neoadjuvant vs adjuvant chemotherapy, and prior platinum use for breast cancer. Treatment was continued for 52 weeks.
Setting and participants. A total of 1836 patients were randomized in a 1:1 fashion to receive olaparib or a placebo. Eligible patients had a germline BRCA1 or BRCA1 pathogenic or likely pathogenic variant. Patients had high-risk, HER2-negative primary breast cancers and all had received definitive local therapy and neoadjuvant or adjuvant chemotherapy. Patients were enrolled between 2 to 12 weeks after completion of all local therapy. Platinum chemotherapy was allowed. Patients received adjuvant endocrine therapy for hormone receptor positive disease as well as adjuvant bisphosphonates per institutional guidelines. Patients with triple negative disease who received adjuvant chemotherapy were required to be lymph node positive or have at least 2 cm invasive disease. Patients who received neoadjuvant chemotherapy were required to have residual invasive disease to be eligible. For hormone receptor positive patients receiving adjuvant chemotherapy to be eligible they had to have at least 4 pathologically confirmed lymph nodes involved. Hormone receptor positive patients who had neoadjuvant chemotherapy were required to have had residual invasive disease.
Main outcome measures. The primary endpoint for the study was invasive disease-free survival which was defined as time from randomization to date of recurrence or death from any cause. The secondary endpoints included overall survival (OS), distant disease-free survival, safety, and tolerability of olaparib.
Main results. At the time of data cutoff, 284 events had occurred with a median follow-up of 2.5 years in the intention to treat population. A total of 81% of patients had triple negative breast cancer. Most patients (94% in the olaparib group and 92% in the placebo group) received both taxane and anthracycline based chemotherapy regimens. Platinum based chemotherapy was used in 26% of patients in each group. The groups were otherwise well balanced. Germline mutations in BRCA1 were present in 72% of patients and BRCA2 in 27% of patients. These were balanced between groups.
At the time of this analysis, adjuvant olaparib reduced the risk of invasive disease-free survival by 42% compared with placebo (P < .001). At 3 years, invasive disease-free survival was 85.9% in the olaparib group and 77.1% in the placebo group (difference, 8.8 percentage points; 95% CI, 4.5-13.0; hazard ratio [HR], 0.58; 99.5% CI, 0.41-0.82; P < .001). The 3-year distant disease-free survival was 87.5% in the olaparib group and 80.4% in the placebo group (HR 0.57; 99.5% CI, 0.39-0.83; P < .001). Results also showed that olaparib was associated with fewer deaths than placebo (59 and 86, respectively) (HR, 0.68; 99% CI, 0.44-1.05; P = .02); however, there was no significant difference between treatment arms at the time of this interim analysis. Subgroup analysis showed a consistent benefit across all groups with no difference noted regarding BRCA mutation, hormone receptor status or use of neoadjuvant vs adjuvant chemotherapy.
The side effects were consistent with the safety profile of olaparib. Adverse events of grade 3 or higher more common with olaparib included anemia (8.7%), leukopenia (3%), and fatigue (1.8%). Early discontinuation of trial regimen due to adverse events of disease recurrence occurred in 25.9% in the olaparib group and 20.7% in the placebo group. Blood transfusions were required in 5.8% of patients in the olaparib group. Myelodysplasia or acute myleoid leukemia was observed in 2 patients in the olaparib group and 3 patients in the placebo group. Adverse events leading to death occurred in 1 patient in the olaparib group and 2 patients in the placebo group.
Conclusion. Among patients with high-risk, HER2-negative early breast cancer and germline BRCA1 or BRCA2 pathogenic or likely pathogenic variants, adjuvant olaparib after completion of local treatment and neoadjuvant or adjuvant chemotherapy was associated with significantly longer invasive disease-free and distant disease-free survival compared with placebo.
Commentary
The results from the current OlympiA trial provide the first evidence that adjuvant therapy with poly adenosine diphosphate-ribose polymerase (PARP) inhibitors can improve outcomes in high-risk, HER2-negative breast cancer in patients with pathogenic BRCA1 and BRCA2 mutations. The OS, while favoring olaparib, is not yet mature at the time of this analysis. Nevertheless, these results represent an important step forward in improving outcomes in this patient population. The efficacy and safety of PARP inhibitors in BRCA-mutated breast cancer has previously been shown in patients with advanced disease leading to FDA approval of both olaparib and talazoparib in this setting.1,2 With the current results, PARP inhibitors will certainly play an important role in the adjuvant setting in patients with deleterious BRCA1 or BRCA2 mutations at high risk for relapse. Importantly, the side effect profile appears acceptable with no unexpected events and a very low rate of secondary myeloid malignancies.
Subgroup analysis appears to indicate a benefit across all groups including hormone receptor–positive disease and triple negative breast cancer. Interestingly, approximately 25% of patients in both cohorts received platinum-based chemotherapy. The efficacy of adjuvant olaparib did not appear to be impacted by prior use of platinum-containing chemotherapy regimens. It is important to consider that postneoadjuvant capecitabine, per the results of the CREATE-X trial, in triple-negative patients was not permitted in the current study. Although, this has been widely adopted in clinical practice.3 The CREATE-X trial did not specify the benefit of adjuvant capecitabine in the BRCA-mutated cohort, thus, it is not clear how this subgroup fares with this approach. Thus, one cannot extrapolate the relative efficacy of olaparib compared with capecitabine, as pointed out by the authors, and whether we consider the use of capecitabine and/or olaparib in triple-negative patients with residual invasive disease after neoadjuvant chemotherapy is not clear at this time.
Nevertheless, the magnitude of benefit seen in this trial certainly provide clinically relevant and potentially practice changing results. It will be imperative to follow these results as the survival data matures and ensure no further long-term toxicity, particularly secondary myeloid malignancies, develop. These results should be discussed with each patient and informed decisions regarding the use of adjuvant olaparib should be considered for this patient population. Lastly, these results highlight the importance of germline testing for patients with breast cancer in accordance with national guideline recommendations. Moreover, these results certainly call into question whether it is time to consider expansion of our current germline testing guidelines to detect all potential patients who may benefit from this therapy.
Application for Clinical Practice
Adjuvant olaparib in high-risk patients with germline BRCA1 or BRCA2 mutations improves invasive and distant disease-free survival and should be considered in patients who meet the enrollment criteria of the current study. Furthermore, this highlights the importance of appropriate germline genetic testing in patients with breast cancer.
Financial disclosures: None.
1. Robson M, Im SA, Senkus E, et al. Olaparib for metastatic breast cancer in patients with a germline BRCA mutation. N Engl J Med. 2017;377(6):523-533. doi:10.1056/NEJMoa1706450
2. Litton JK, Rugo HS, Ettl J, et al. Talazoparib in Patients with Advanced Breast Cancer and a Germline BRCA Mutation. N Engl J Med. 2018;379(8):753-763. doi:10.1056/NEJMoa1802905
3. Masuda N, Lee SJ, Ohtani S, et al. Adjuvant Capecitabine for Breast Cancer after Preoperative Chemotherapy. N Engl J Med. 2017;376(22):2147-2159. doi:10.1056/NEJMoa1612645
Leadership & Professional Development: Relational Leadership—It’s Not About You
“Lead me, follow me, or get the hell out of my way.”
—George Patton
The concept of leadership is often viewed through the lens of the individual. Terms such as “born leader” are canon in our lexicon, and motivational images are common, frequently paired with a singular majestic animal on a mountain peak, meant to inspire awe in the value of the individual leader. This mindset can be problematically reductive, suggesting that leadership is binary and mutually exclusive: we are either leaders or followers. The terminology can also be pejorative, as few are likely to populate a curriculum vitae with examples of being a great follower.
Leadership can instead be regarded as a role rather than a personality trait or superpower. Many of us inhabit multiple leadership roles in our professional lives. Whether participating on a committee, designing an educational curriculum, overseeing a clinical service line, or supervising learners as ward teaching attending, we function as leaders in the context of our relationships with other members of the numerous cohorts within which we work. As leaders, we must consider our relationships to others in a group as opposed to our intrinsic personalities.1
The following pearls can help operationalize relational leadership concepts2,3:
We are not alone. In any given leadership role, we must understand with whom we work (and often depend upon) and what we need to do to allow others to help us succeed. When entering a leadership role with a new group, it is important to assess the interests and skill sets of the rest of the team by either formal or informal means. Many are used to doing so on the first day of attending on a new ward service, but this concept also applies to other roles, such as chairing a new committee.
Work with individuals and groups whose knowledge, experience, skills, and/or attitudes are complementary to our own. This is not as easy as it sounds; when hiring individuals or assembling groups, we tend to gravitate to those like ourselves. Seeking different opinions and styles can be valuable, and promoting diversity, inclusion, and equity is paramount. To do so, we must make efforts to understand our own personal strengths and limitations, ideally supplemented with observation and feedback from a trusted mentor or coach. Taking an honest look at our preconceptions and assumptions is crucial. Consider how we view other silos with which we interact and the presuppositions we make, such as the “typical” surgeon or emergency department practitioner.
Recognize and publicly share shortcomings. Transparency about our limitations allows us to build relationships that are more effective and impactful. A leader who meaningfully reveals a weakness for which they need other group members to contribute specific expertise can allow team members to feel more connected or engaged with that leader or group by shifting from interpreting an ask as “Do this task” to the more empowering “I need your help.”
Leadership can be effectively conceptualized as a relational skill, fulfilled by various roles in our professional lives. Collaboration, introspection, and transparency are essential to becoming a successful leader.
Acknowledgments
The author gratefully acknowledges Dr David Berg for his invaluable mentorship as well as the core faculty of the SHM-SGIM Academic Hospitalist Academy 2.0 for their support and encouragement.
1. Wood M, Dibben M. Leadership as a relational process. Process Studies. 2015;44(1): 24-47. https://doi.org/10.5840/process20154412
2. Berg DN. Resurrecting the muse: followership in organizations. In: Klein EB, Gabelnick E, Herr R, eds. Psychodynamics of Leadership. Psychosocial Press; 1998.
3. Berg DN, Bradley EH. Leadership: Rhetoric vs. Reality. 2015. Accessed September 22, 2021. https://www.youtube.com/watch?v=77IwJ8wXaM8
“Lead me, follow me, or get the hell out of my way.”
—George Patton
The concept of leadership is often viewed through the lens of the individual. Terms such as “born leader” are canon in our lexicon, and motivational images are common, frequently paired with a singular majestic animal on a mountain peak, meant to inspire awe in the value of the individual leader. This mindset can be problematically reductive, suggesting that leadership is binary and mutually exclusive: we are either leaders or followers. The terminology can also be pejorative, as few are likely to populate a curriculum vitae with examples of being a great follower.
Leadership can instead be regarded as a role rather than a personality trait or superpower. Many of us inhabit multiple leadership roles in our professional lives. Whether participating on a committee, designing an educational curriculum, overseeing a clinical service line, or supervising learners as ward teaching attending, we function as leaders in the context of our relationships with other members of the numerous cohorts within which we work. As leaders, we must consider our relationships to others in a group as opposed to our intrinsic personalities.1
The following pearls can help operationalize relational leadership concepts2,3:
We are not alone. In any given leadership role, we must understand with whom we work (and often depend upon) and what we need to do to allow others to help us succeed. When entering a leadership role with a new group, it is important to assess the interests and skill sets of the rest of the team by either formal or informal means. Many are used to doing so on the first day of attending on a new ward service, but this concept also applies to other roles, such as chairing a new committee.
Work with individuals and groups whose knowledge, experience, skills, and/or attitudes are complementary to our own. This is not as easy as it sounds; when hiring individuals or assembling groups, we tend to gravitate to those like ourselves. Seeking different opinions and styles can be valuable, and promoting diversity, inclusion, and equity is paramount. To do so, we must make efforts to understand our own personal strengths and limitations, ideally supplemented with observation and feedback from a trusted mentor or coach. Taking an honest look at our preconceptions and assumptions is crucial. Consider how we view other silos with which we interact and the presuppositions we make, such as the “typical” surgeon or emergency department practitioner.
Recognize and publicly share shortcomings. Transparency about our limitations allows us to build relationships that are more effective and impactful. A leader who meaningfully reveals a weakness for which they need other group members to contribute specific expertise can allow team members to feel more connected or engaged with that leader or group by shifting from interpreting an ask as “Do this task” to the more empowering “I need your help.”
Leadership can be effectively conceptualized as a relational skill, fulfilled by various roles in our professional lives. Collaboration, introspection, and transparency are essential to becoming a successful leader.
Acknowledgments
The author gratefully acknowledges Dr David Berg for his invaluable mentorship as well as the core faculty of the SHM-SGIM Academic Hospitalist Academy 2.0 for their support and encouragement.
1. Wood M, Dibben M. Leadership as a relational process. Process Studies. 2015;44(1): 24-47. https://doi.org/10.5840/process20154412
2. Berg DN. Resurrecting the muse: followership in organizations. In: Klein EB, Gabelnick E, Herr R, eds. Psychodynamics of Leadership. Psychosocial Press; 1998.
3. Berg DN, Bradley EH. Leadership: Rhetoric vs. Reality. 2015. Accessed September 22, 2021. https://www.youtube.com/watch?v=77IwJ8wXaM8
Simulation-Based Training in Medical Education: Immediate Growth or Cautious Optimism?
For years, professional athletes have used simulation-based training (SBT), a combination of virtual and experiential learning that aims to optimize technical skills, teamwork, and communication.1 In SBT, critical plays and skills are first watched on video or reviewed on a chalkboard, and then run in the presence of a coach who offers immediate feedback to the player. The hope is that the individual will then be able to perfectly execute that play or scenario when it is game time. While SBT is a developing tool in medical education—allowing learners to practice important clinical skills prior to practicing in the higher-stakes clinical environment—an important question remains: what training can go virtual and what needs to stay in person?
In this issue, Carter et al2 present a single-site, telesimulation curriculum that addresses consult request and handoff communication using SBT. Due to the COVID-19 pandemic, the authors converted an in-person intern bootcamp into a virtual, Zoom®-based workshop and compared assessments and evaluations to the previous year’s (2019) in-person bootcamp. Compared to the in-person class, the telesimulation-based cohort were equally or better trained in the consult request portion of the workshop. However, participants were significantly less likely to perform the assessed handoff skills optimally, with only a quarter (26%) appropriately prioritizing patients and less than half (49%) providing an appropriate amount of information in the patient summary. Additionally, postworkshop surveys found that SBT participants were more satisfied with their performance in both the consult request and handoff scenarios and felt more prepared (99% vs 91%) to perform handoffs in clinical practice compared to the previous year’s in-person cohort.
We focus on this work as it explores the role that SBT or virtual training could have in hospital communication and patient safety training. While previous work has highlighted that technical and procedural skills often lend themselves to in-person adaptation (eg, point-of-care ultrasound), this work suggests that nontechnical skills training could be adapted to the virtual environment. Hospitalists and internal medicine trainees perform a myriad of nontechnical activities, such as end-of-life discussions, obtaining informed consent, providing peer-to-peer feedback, and leading multidisciplinary teams. Activities like these, which require no hands-on interactions, may be well-suited for simulation or virtual-based training.3
However, we make this suggestion with some caution. In Carter et al’s study,2 while we assumed that telesimulation would work for the handoff portion of the workshop, interestingly, the telesimulation-based cohort performed worse than the interns who participated in the previous year’s in-person training while simultaneously and paradoxically reporting that they felt more prepared. The authors offer several possible explanations, including alterations in the assessment checklist and a shift in the facilitators from peer observers to faculty hospitalists. We suspect that differences in the participants’ experiences prior to the bootcamp may also be at play. Given the onset of the pandemic during their final year in undergraduate training, many in this intern cohort were likely removed from their fourth-year clinical clerkships,4 taking from them pivotal opportunities to hone and refine this skill set prior to starting their graduate medical education.
As telesimulation and other virtual care educational opportunities continue to evolve, we must ensure that such training does not sacrifice quality for ease and satisfaction. As the authors’ findings show, simply replicating an in-person curriculum in a virtual environment does not ensure equivalence for all skill sets. We remain cautiously optimistic that as we adjust to a postpandemic world, more SBT and virtual-based educational interventions will allow medical trainees to be ready to perform come game time.
1. McCaskill S. Sports tech comes of age with VR training, coaching apps and smart gear. Forbes. March 31, 2020. https://www.forbes.com/sites/stevemccaskill/2020/03/31/sports-tech-comes-of-age-with-vr-training-coaching-apps-and-smart-gear/?sh=309a8fa219c9
2. Carter K, Podczerwinski J, Love L, et al. Utilizing telesimulation for advanced skills training in consultation and handoff communication: a post-COVID-19 GME bootcamp experience. J Hosp Med. 2021;16(12)730-734. https://doi.org/10.12788/jhm.3733
3. Paige JT, Sonesh SC, Garbee DD, Bonanno LS. Comprensive Healthcare Simulation: Interprofessional Team Training and Simulation. 1st ed. Springer International Publishing; 2020. https://doi.org/10.1007/978-3-030-28845-7
4. Goldenberg MN, Hersh DC, Wilkins KM, Schwartz ML. Suspending medical student clerkships due to COVID-19. Med Sci Educ. 2020;30(3):1-4. https://doi.org/10.1007/s40670-020-00994-1
For years, professional athletes have used simulation-based training (SBT), a combination of virtual and experiential learning that aims to optimize technical skills, teamwork, and communication.1 In SBT, critical plays and skills are first watched on video or reviewed on a chalkboard, and then run in the presence of a coach who offers immediate feedback to the player. The hope is that the individual will then be able to perfectly execute that play or scenario when it is game time. While SBT is a developing tool in medical education—allowing learners to practice important clinical skills prior to practicing in the higher-stakes clinical environment—an important question remains: what training can go virtual and what needs to stay in person?
In this issue, Carter et al2 present a single-site, telesimulation curriculum that addresses consult request and handoff communication using SBT. Due to the COVID-19 pandemic, the authors converted an in-person intern bootcamp into a virtual, Zoom®-based workshop and compared assessments and evaluations to the previous year’s (2019) in-person bootcamp. Compared to the in-person class, the telesimulation-based cohort were equally or better trained in the consult request portion of the workshop. However, participants were significantly less likely to perform the assessed handoff skills optimally, with only a quarter (26%) appropriately prioritizing patients and less than half (49%) providing an appropriate amount of information in the patient summary. Additionally, postworkshop surveys found that SBT participants were more satisfied with their performance in both the consult request and handoff scenarios and felt more prepared (99% vs 91%) to perform handoffs in clinical practice compared to the previous year’s in-person cohort.
We focus on this work as it explores the role that SBT or virtual training could have in hospital communication and patient safety training. While previous work has highlighted that technical and procedural skills often lend themselves to in-person adaptation (eg, point-of-care ultrasound), this work suggests that nontechnical skills training could be adapted to the virtual environment. Hospitalists and internal medicine trainees perform a myriad of nontechnical activities, such as end-of-life discussions, obtaining informed consent, providing peer-to-peer feedback, and leading multidisciplinary teams. Activities like these, which require no hands-on interactions, may be well-suited for simulation or virtual-based training.3
However, we make this suggestion with some caution. In Carter et al’s study,2 while we assumed that telesimulation would work for the handoff portion of the workshop, interestingly, the telesimulation-based cohort performed worse than the interns who participated in the previous year’s in-person training while simultaneously and paradoxically reporting that they felt more prepared. The authors offer several possible explanations, including alterations in the assessment checklist and a shift in the facilitators from peer observers to faculty hospitalists. We suspect that differences in the participants’ experiences prior to the bootcamp may also be at play. Given the onset of the pandemic during their final year in undergraduate training, many in this intern cohort were likely removed from their fourth-year clinical clerkships,4 taking from them pivotal opportunities to hone and refine this skill set prior to starting their graduate medical education.
As telesimulation and other virtual care educational opportunities continue to evolve, we must ensure that such training does not sacrifice quality for ease and satisfaction. As the authors’ findings show, simply replicating an in-person curriculum in a virtual environment does not ensure equivalence for all skill sets. We remain cautiously optimistic that as we adjust to a postpandemic world, more SBT and virtual-based educational interventions will allow medical trainees to be ready to perform come game time.
1. McCaskill S. Sports tech comes of age with VR training, coaching apps and smart gear. Forbes. March 31, 2020. https://www.forbes.com/sites/stevemccaskill/2020/03/31/sports-tech-comes-of-age-with-vr-training-coaching-apps-and-smart-gear/?sh=309a8fa219c9
2. Carter K, Podczerwinski J, Love L, et al. Utilizing telesimulation for advanced skills training in consultation and handoff communication: a post-COVID-19 GME bootcamp experience. J Hosp Med. 2021;16(12)730-734. https://doi.org/10.12788/jhm.3733
3. Paige JT, Sonesh SC, Garbee DD, Bonanno LS. Comprensive Healthcare Simulation: Interprofessional Team Training and Simulation. 1st ed. Springer International Publishing; 2020. https://doi.org/10.1007/978-3-030-28845-7
4. Goldenberg MN, Hersh DC, Wilkins KM, Schwartz ML. Suspending medical student clerkships due to COVID-19. Med Sci Educ. 2020;30(3):1-4. https://doi.org/10.1007/s40670-020-00994-1
Techniques and Technologies to Improve Peripheral Intravenous Catheter Outcomes in Pediatric Patients: Systematic Review and Meta-Analysis
Peripheral intravenous catheters (PIVCs) are fundamental to the healthcare practitioners’ ability to provide vital intravenous fluids, medications, and blood products, and as a prophylactic measure prior to some procedures, making insertion of these devices the most common in-hospital invasive procedure in pediatrics.1,2 Despite the prevalence and ubiquity of PIVCs,1 successful insertion in pediatrics is problematic,3-5 and device dysfunction prior to completion of treatment is common.3,6 The inability to attain timely PIVC access and maintain postinsertion function has significant short- and long-term sequelae, including pain and anxiety for children and their parents,3,7 delays in treatment,3 prolonged hospitalization,8 and increased healthcare-associated costs.8-10
Approximately 50% of pediatric PIVC insertions are challenging, often requiring upwards of four insertion attempts, and a similar proportion fail prior to treatment completion.3,11 Exactly why PIVC insertion is difficult in children, and the mechanisms of failure, are unknown. It is likely to be multifaceted and related to factors concerning the patient (eg, comorbidities, age, gender, adiposity),11,12 provider (eg, insertion practice, care, and maintenance),3,13,14 device (eg, size, length, catheter-to-vein ratio),15,16 and therapy (eg, vessel irritation).11,13,17 Observational studies and randomized controlled trials (RCTs) in hospitalized pediatric patients report that the average PIVC dwell is approximately 48 hours, suggesting multiple PIVCs are required to complete a single admission.3,18
Conventionally, PIVC insertion involved physical assessment through palpation and visualization (landmark approach), and although postinsertion care varies among healthcare facilities, minimal requirements are a dressing over the insertion site and regular flushes to ensure device patency.1,3,19 Recently, clinicians have investigated insertion and management practices to improve PIVC outcomes. These can be grouped into techniques—the art of doing (the manner of performance, or the details, of any surgical operation, experiment, or mechanical act) and technologies—the application of scientific knowledge for practical purposes.20 Individual studies have examined the outcomes of new techniques and technologies; however, an overall estimation of their clinical significance or effect is unknown.11,18 Therefore, the aim of this review was to systematically search published studies, conduct a pooled analysis of findings, and report the success of various techniques and technologies to improve insertion success and reduce overall PIVC failure.
METHODS
Design
The protocol for this systematic review was prospectively registered with PROSPERO (CRD42020165288). This review followed Cochrane Collaboration systematic review methods21 and was reported in accordance with the Preferred Reporting Items for Systematic Reviews and Meta-Analyses (PRISMA) statement.22
Inclusion and Exclusion Criteria
Studies were eligible for inclusion if they met predefined criteria: (1) RCT design; (2) included standard-length PIVC; (3) participants aged 0 to 18 years, excluding preterm infants (less than 36 weeks’ gestation); (4) required PIVC insertion in an inpatient healthcare setting; and (5) reported PIVC insertion outcomes (described below). Studies were excluded if they were cluster or crossover RCTs, published before 2010, or not written in English.
Interventions
Interventions were PIVC insertion and management techniques, defined as “the manner of performance, or the details, of any surgical operation, experiment, or mechanical act” (eg, needle-tip positioning, vein selection [site of insertion], comfort measures, and flushing regimen), or technologies, defined as “the application of scientific knowledge for practical purpose” (eg, vessel visualization, catheter material, and catheter design), compared with current practice, defined as commonly known, practiced, or accepted (eg, landmark PIVC insertion).20
Primary and Secondary Outcomes
The primary outcome was first-time insertion success (one skin puncture to achieve PIVC insertion; can aspirate and flush PIVC without resistance).23 Secondary outcomes included: (1) overall PIVC insertion success23; (2) all-cause PIVC failure (cessation of PIVC function prior to treatment completion)6; (3) dwell time14; (4) PIVC insertion time; (5) insertion attempts23; (6) individual elements of failure (dislodgement, extravasation, infection, occlusion, pain, phlebitis, and thrombosis)6; and (7) patient/parent satisfaction. Some outcomes evaluated were author defined within each study (patient/parent satisfaction, pain score).
Systematic Search
A search of the Cochrane Library and Central Register of Controlled Trials (CENTRAL), Cumulative Index to Nursing and Allied Health (CINAHL), US National Institutes of Health National Library of Medicine (PubMed), and Embase databases between 2010 to 2020 was undertaken on June 23, 2020, and updated March 4, 2021. Medical Subject Heading (MeSH) terms and relevant keywords and their variants were used in collaboration with a healthcare librarian (Appendix Table 1). Additional studies were identified through hand searches of bibliographies.19 Studies were included if two authors (TMK and JS) independently agreed they met the inclusion criteria.
Data Extraction
Two authors (TMK/JS) independently abstracted study data using a standardized form managed in Microsoft Excel.
Quality Assessment
Included studies were assessed by two authors (TMK and JS) for quality using the Cochrane risk of bias (RoB2) tool.21,24 The overall quality of evidence for each outcome was assessed using the Grading of Recommendations Assessment, Development and Evaluation (GRADE)25 approach. Individual RCTs began at high quality, downgraded by one level for “serious” or two levels for “very serious” study limitations, including high risk of bias, serious inconsistency, publication bias, or indirectness of evidence.
Data Analysis and Synthesis
Where two or more trials with evidence of study homogeneity (trial interventions and population) were identified, meta-analysis using RevMan 5 (version 5.4.1)26 with random effects was conducted. Descriptive statistics summarized study population, interventions, and results. For dichotomous outcomes, we calculated risk ratio (RR) plus 95% CI. For continuous outcomes, we planned to calculate the mean difference (MD) plus 95% CI and the standardized mean difference (SMD) (difference between experimental and control groups across trials) reported as the summary statistic.
Subgroup analyses, where possible, included: difficult intravenous access (DIVA), defined by study authors; age (0-3 years; >3 years up to 18 years); hospital setting during PIVC insertion (awake clinical environment vs awake emergency department vs asleep operating room setting); and by operator (bedside nurse, anesthesiologist).
RESULTS
Search Strategy
Figure 1 describes study selection in accordance with the PRISMA guidelines.22 We identified 1877 records, and 18 articles met the inclusion criteria. An additional 3 studies were identified in the updated search, totaling 21 studies included in the final review.
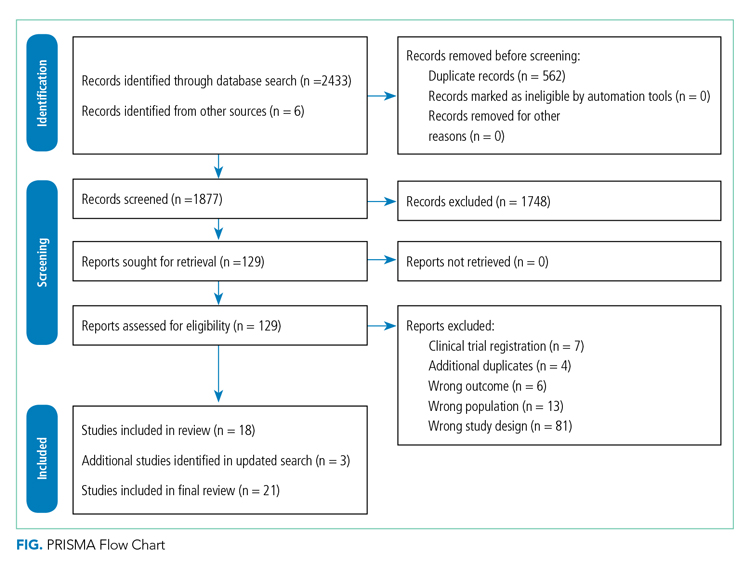
Study Characteristics
Collectively, 3237 patients and 3098 successful PIVC insertions were reported. In the included studies, 139 patients did not receive a PIVC owing to failed insertion. Ten studies examined techniques (needle-tip positioning,27 vein choice for PIVC insertion,28 flushing regimen,29-31 nonpharmacological32,33 dressing and securement,34,35 and pharmacological comfort measures36), and 11 studies examined technologies (vessel visualization including ultrasound,4,37-40 near-infrared [image of vein projected onto the skin],37,41-44 transillumination [transmission of light through the skin],45 and catheter design46). Table 1 outlines characteristics of included studies. Most trials were single center and conducted in an acute inpatient pediatric-specific setting4,27-34,36-41,44-46 or dedicated pediatric unit in a large public hospital35,43,44; one study was a multicenter trial.36 All trials described evidence of ethical review board approval and participant consent for trial participation.
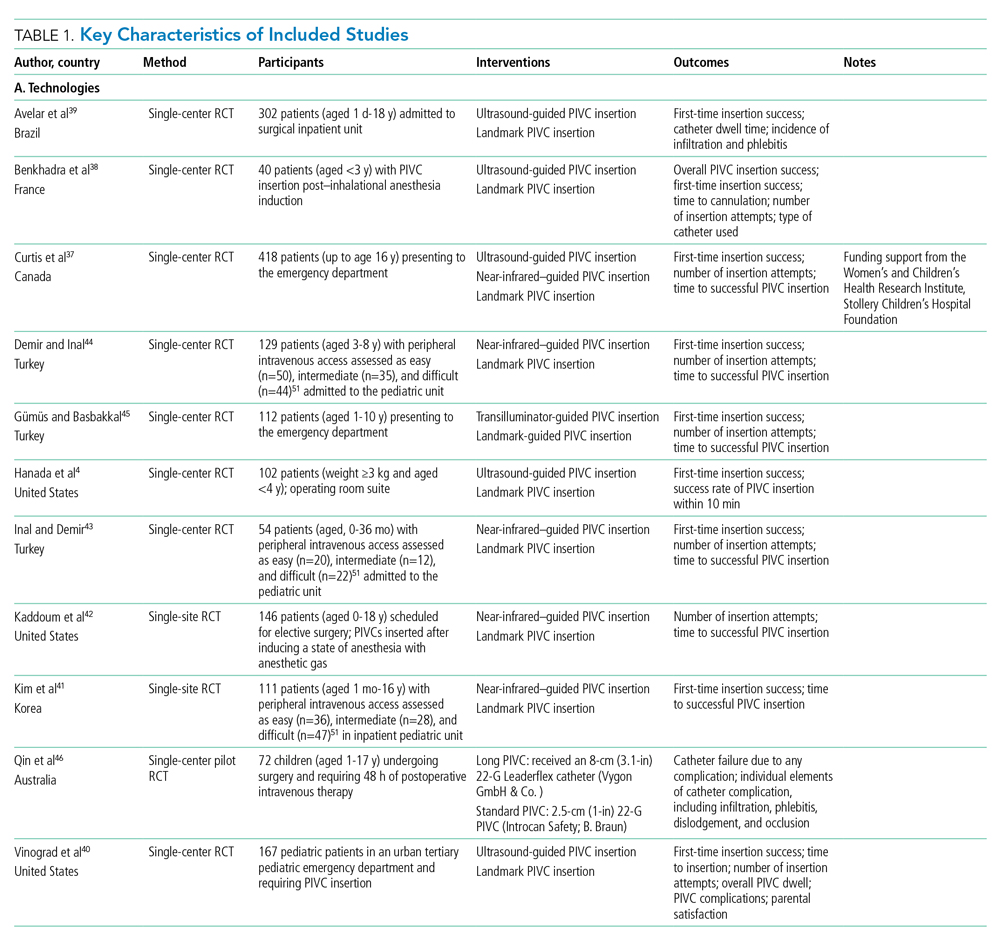
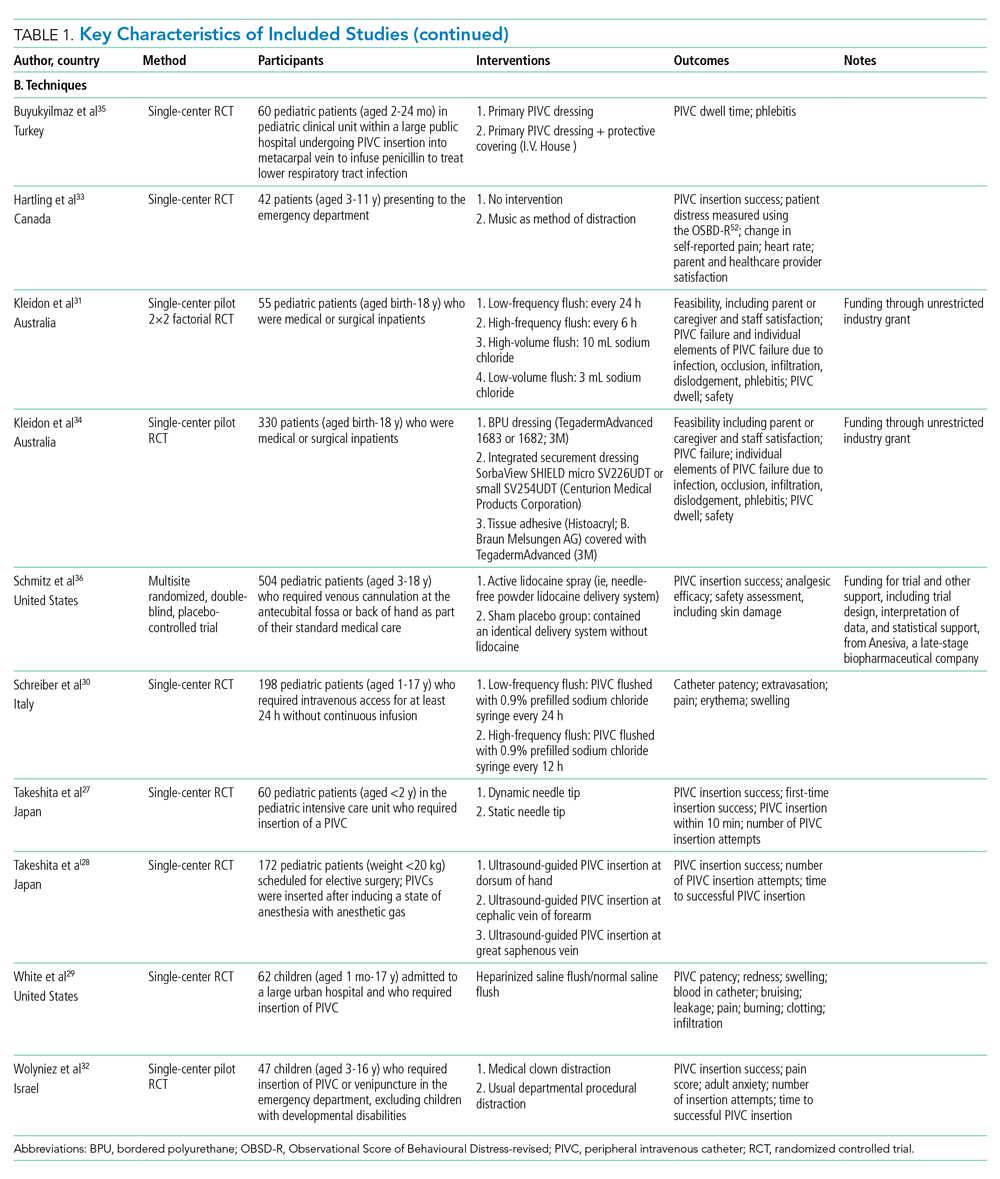
Study Quality
The certainty of evidence at the outcome level varied from moderate to very low. Table 2 and Table 3 outline the summary of findings for landmark insertion compared with ultrasound-guided and landmark insertion compared with near-infrared PIVC insertion, respectively. The remaining summary-of-findings comparisons that included more than one study or addressed clinically relevant questions can be found in Appendix Tables 2, 3, 4, 5, 6, 7, and 8. At the individual study level, most domains were assessed as low risk of bias (Appendix Figure 1).
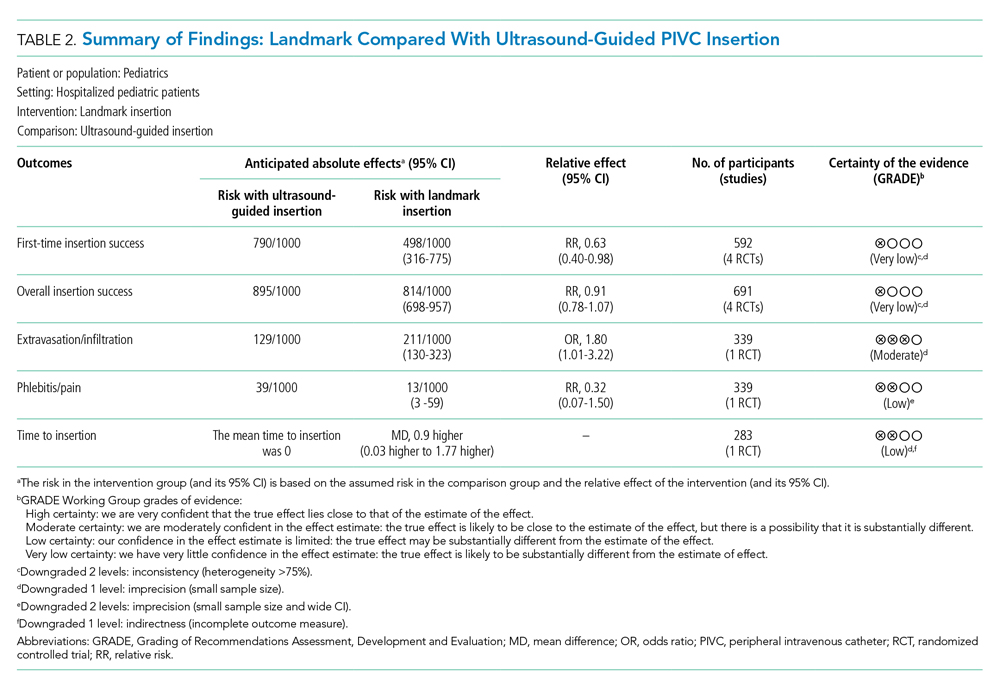
Effectiveness of Interventions
Technology to Improve PIVC Outcomes
Landmark compared with ultrasound-guided PIVC insertion. Five studies compared PIVC insertion success outcomes when traditional landmark technique was used in comparison with ultrasound guidance (Appendix Figure 2). Four studies (592 patients)4,37,38,40 assessed the primary outcome of first-time insertion success. Appendix Figure 2.1 demonstrates PIVCs were 1.5 times more likely to be inserted on first attempt when ultrasound guidance was used compared with landmark insertion (RR, 1.60; 95% CI, 1.02-2.50). When examining only studies that included DIVA,4,38,40 the effect size increased and CIs tightened (RR, 1.87; 95% CI, 1.56-2.24). No evidence of effect was demonstrated when comparing this outcome in children aged 0 to 3 years (RR, 1.39; 95% CI, 0.88-2.18) or >3 years (RR, 0.72; 95% CI, 0.35-1.51. Two studies4,38 demonstrated that first-time insertion success with ultrasound (compared with landmark) was almost twice as likely (RR, 1.87; 95% CI, 1.44-2.42) after induction of anesthesia in contrast to no effect in studies undertaken in the emergency department37,40 (RR, 1.32; 95% CI, 0.68-2.56). One study39 (339 patients) reported the secondary outcomes of extravasation/infiltration and phlebitis. Extravasation/infiltration was nearly twice as likely with ultrasound compared with landmark insertion (RR, 1.80; 95% CI, 1.01-3.22); however, there was no evidence of effect related to phlebitis (RR, 0.32; 95% CI, 0.07-1.50).
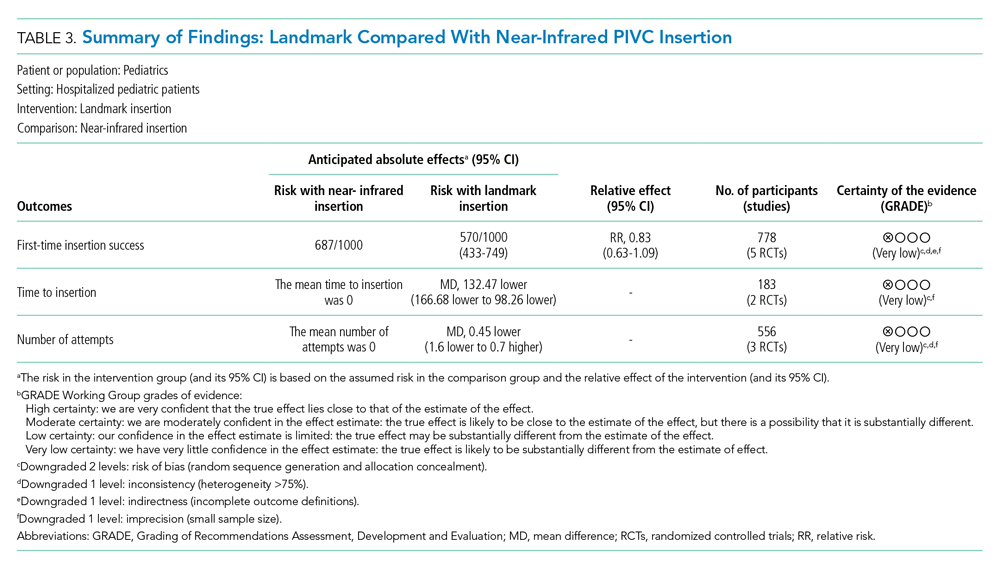
Four studies4,38-40 compared the review’s secondary outcome of PIVC insertion success (Appendix Figure 2.2), with no evidence of an effect (RR, 1.10; 95% CI, 0.94-1.28). No improvement in overall insertion success was demonstrated in the following subgroup analyses: patients with DIVA (RR, 1.18; 95% CI, 0.95-1.47), children under 3 years of age (RR, 1.23; 95% CI, 0.90-1.68), and PIVCs inserted by anesthesiologists (RR, 1.25; 95% CI, 0.91-1.72). One study measured this outcome in children aged >3 years (RR, 1.13; 95% CI, 0.99-1.29) with no effect and in the emergency department (RR, 1.09; 95% CI, 1.00-1.20), where ultrasound guidance improved overall PIVC insertion success.
Landmark compared with near-infrared PIVC insertion. First-time insertion success (Appendix Figure 3.1) was reported in five studies37,41-44 and 778 patients with no evidence of effect (RR, 1.21; 95% CI, 0.91-1.59). Subgroup analysis by DIVA41-44 demonstrated first-time insertion success more than doubled with near-infrared technology compared with landmark (RR, 2.72; 95% CI, 1.02-7.24). Subgroup analysis by age did not demonstrate an effect in children younger than 3 years or children older than 3 years. Subgroup analysis by clinician inserting did not demonstrate an effect. Of the five studies reporting time to insertion,37,41-44 two41,42 reported median rather than mean, so could not be included in the analysis. Of the remaining three studies,37,43,44 near-infrared reduced PIVC time to insertion (Appendix Figure 3.2).
Four studies37,42-44 reported the number of attempts required for successful PIVC insertion where no difference was detected; however, subgroup analysis of patients with DIVA43,44 and insertion by bedside nurse43,44 demonstrated fewer PIVC insertion attempts and a reduction in insertion time, respectively, with the use of near-infrared technology (Appendix Figure 3.3).
Landmark compared with transillumination PIVC insertion. One study45 (112 participants) found a positive effect with the use of transillumination and first-time insertion success (RR, 1.29; 95% CI, 1.07-1.54), reduced time to insertion (MD, –9.70; 95% CI, –17.40 to –2.00), and fewer insertion attempts (MD, –0.24; 95% CI, –0.40 to –0.08) compared with landmark insertion.
Long PIVC compared with short PIVC. A single study46 demonstrated a 70% reduction in PIVC failure (RR, 0.29; 95% CI, 0.14-0.59) when long PIVCs were compared with standard PIVCs. Specifically, PIVC failure due to infiltration was reduced with the use of a long PIVC (RR, 0.08; 95% CI, 0.01-0.61). There was no difference in insertion success (RR, 1.00; 95% CI, 0.95-1.05) or phlebitis (RR, 1.00; 95% CI, 0.07-15.38).
Technique to Improve PIVC Outcomes
Static ultrasound-guided compared with dynamic needle-tip PIVC insertion. In a single study comparing variation in ultrasound-guided PIVC insertion technique27 (60 patients), dynamic needle-tip positioning improved first-time insertion success (RR, 1.44; 95% CI, 1.04-2.00) and overall PIVC insertion success (RR, 1.42; 95% CI, 1.06-1.91).
Variation in vein choice for successful PIVC insertion. Insertion of PIVC in the cephalic vein of the forearm improved insertion success in a single study28 of 172 patients compared with insertion in the dorsal vein of the hand (RR, 1.39; 95% CI, 1.15-1.69) and great saphenous vein (RR, 1.27; 95% CI, 1.08-1.49).
Variation in PIVC flush. Heparinized saline compared with 0.9% sodium chloride flush29 did not reduce infiltration (RR, 0.31; 95% CI, 0.03-2.84), occlusion (RR, 1.88; 95% CI, 0.18-19.63) during dwell, or hematoma (RR, 0.94; 95% CI, 0.06-14.33) at insertion.
Two studies30,31 (253 participants) compared PIVC flush frequency (daily compared with more frequent flush regimes). There was no reduction in overall PIVC failure, extravasation/infiltration, phlebitis, or occlusion during dwell (Appendix Figure 4.1-4.4). Additionally, no effect was demonstrated when a single study31 investigated volume of flush on extravasation/infiltration, dislodgement, phlebitis, or occlusion.
Variation in dressing and securement. One trial (330 participants)34 demonstrated that integrated securement and dressing (ISD) product reduced PIVC failure (RR, 0.65; 95% CI, 0.45-0.93) and occlusion (RR, 0.35; 95% CI, 0.13-0.94) compared with bordered polyurethane (BPU). There was no difference in the proportion of PIVC failure between BPU compared with tissue adhesive (TA) (RR, 0.74; 95% CI, 0.52-1.06). When comparing individual elements of PIVC failure, there was no evidence of effect between BPU and ISD in reducing infiltration (RR, 0.74; 95% CI, 0.43-1.27), dislodgement (RR, 0.49; 95% CI, 0.15-1.58), or phlebitis/pain (RR, 0.54; 95% CI, 0.21-1.39); similarly, the use of TA compared with BPU did not reduce failure due to infiltration (RR, 0.78; 95% CI, 0.45-1.33), dislodgement (RR, 0.37; 95% CI, 0.10-1.35), occlusion (RR, 0.91; 95% CI, 0.45-1.84), or phlebitis/pain (RR, 0.42; 95% CI, 0.17-1.05).
A comparison of protective covering35 (60 participants) did not demonstrate a significant improvement in PIVC dwell (RR, 0.83; 95% CI, 0.25-1.41).
Pharmacological and nonpharmacological interventions. A comparison of nonpharmacological comfort techniques, including music during insertion (one trial, 42 participants), did not improve first-time insertion success between the two groups (RR, 0.74; 95% CI, 0.53-1.03). Similarly, incorporation of a clown32 (47 patients) as method of distraction did not demonstrate an effect on PIVC insertion success (RR, 0.90; 95% CI, 0.77-1.06) or time to PIVC insertion (MD, –0.20; 95% CI, –1.74 to 1.34). In a double-blinded, placebo-controlled RCT36 of pharmacological techniques to reduce PIVC insertion-related pain (504 participants), no evidence of effect was established between the placebo control group and the active analgesia in overall PIVC insertion success (RR, 1.01; 95% CI, 0.97-1.04).
DISCUSSION
Despite their pervasiveness, PIVC insertion in children is problematic and premature device failure is common, yet effective strategies to overcome these challenges have not been systematically reviewed to date. This systematic review (including meta-analysis) examines techniques and technologies to improve PIVC insertion success and reduce overall failure. We demonstrated ultrasound-guided PIVC insertion significantly improved first-time insertion success in general pediatrics.
Analogous to a previous systematic review in adult patients (1660 patients, odds ratio, 2.49; 95% CI, 1.37-4.52; P = .003; I2, 69%),47 we confirm ultrasound improves first-time PIVC insertion success, most notably in pediatric patients with difficult intravenous access. However, widespread use of ultrasound-guided PIVC insertion is limited by operator skills, as it requires practice and dexterity, especially for DIVA patients.5,47 Healthcare facilities should prioritize teaching and training to support acquisition of this skill to reduce the deleterious effects of multiple insertion attempts, including vessel damage, delayed treatment, pain, and anxiety associated with needles.
Other vessel-visualization technologies (near-infrared and transillumination) did not improve PIVC insertion in generic pediatrics.5 However, they significantly improved first-time insertion, time to insertion, and number of insertion attempts in patients with DIVA and should be considered in the absence of ultrasound-proficient clinicians.
Although vessel-visualization technologies provide efficient PIVC insertion, complication-free PIVC dwell is equally important. Few studies examined both insertion outcomes and PIVC postinsertion outcomes (dwell time and complications during treatment). One study reported more postinsertion complications ( eg, infiltration) with ultrasound compared with landmark technique.39 Vessel-visualization tools should be used to assess the vein to guide PIVC choice. Pandurangadu et al15 reported increased PIVC failure when less than 65% of the catheter length resides within the vein; this was consistent with the single RCT46 included in this review that demonstrated reduced infiltration with long PIVCs compared with standard-length PIVCs. To reduce this knowledge practice gap, it is critical that clinicians continue to evaluate and publish findings of novel techniques to improve PIVC outcomes.
The review findings have important implications for future research, clinical practice, and policy. Unlike earlier reviews,48 vessel-visualization technologies, particularly ultrasound, improved PIVC insertion success; however, during-dwell outcomes were inconsistently reported, and future research should include these. In addition, while there is evidence to support these new technologies, adequate training and resources to ensure a sustained, skilled workforce to optimize PIVC insertion are necessary for successful implementation.
Our study had some limitations, including the methodological quality of included studies (small sample size and significant clinical and statistical heterogeneity). Subgroup analyses were undertaken to reduce the heterogeneity inherent in pediatric populations; however, future studies should stratify for patient (age, DIVA, indication for insertion) and setting (conscious/unconscious, emergent/nonemergent) factors. Incomplete or absent outcome definitions and varied reporting measures (eg, median vs mean) prevented calculation of the pooled incidence of catheter failure and dwell time.
Our review also has notable strengths. Two independent investigators performed a rigorous literature search. Only RCTs were included, ensuring the most robust methods to inform clinically important questions. The primary and secondary outcomes were derived from patient-centered outcomes.
CONCLUSION
This systematic review and meta-analysis describes the pooled incidence of PIVC insertion success and outcomes, including complication and failure in pediatric patients. PIVC insertion with ultrasound should be used to improve insertion success in generic pediatric patients, and any form of vessel-visualization technology (ultrasound, near-infrared, transillumination) should be considered for anticipated difficult insertions.
1. Ullman AJ, Takashima M, Kleidon T, Ray-Barruel G, Alexandrou E, Rickard CM. Global pediatric peripheral intravenous catheter practice and performance: a secondary analysis of 4206 catheters. J Pediatr Nurs. 2020;50:e18-e25. https://doi.org/10.1016/j.pedn.2019.09.023
2. Millington SJ, Hendin A, Shiloh AL, Koenig S. Better with ultrasound peripheral intravenous catheter insertion. Chest. 2020;157(2):369-375. https://doi.org/10.1016/j.chest.2019.04.139
3. Kleidon TM, Cattanach P, Mihala G, Ullman AJ. Implementation of a paediatric peripheral intravenous catheter care bundle: a quality improvement initiative. J Paediatr Child Health. 2019;55(10):1214-1223. https://doi.org/10.1111/jpc.14384
4. Hanada S, Van Winkle MT, Subramani S, Ueda K. Dynamic ultrasound-guided short-axis needle tip navigation technique vs. landmark technique for difficult saphenous vein access in children: a randomised study. Anaesthesia. 2017;72(12):1508-1515. https://doi.org/10.1111/anae.14082
5. Heinrichs J, Fritze Z, Klassen T, Curtis S. A systematic review and meta-analysis of new interventions for peripheral intravenous cannulation of children. Pediatr Emerg Care. 2013;29(7):858-866. https://doi.org/10.1097/PEC.0b013e3182999bcd
6. Indarwati F, Mathew S, Munday J, Keogh S. Incidence of peripheral intravenous catheter failure and complications in paediatric patients: systematic review and meta analysis. Int J Nurs Stud. 2020;102:103488. https://doi.org/10.1016/j.ijnurstu.2019.103488
7. Cooke M, Ullman AJ, Ray-Barruel G, Wallis M, Corley A, Rickard CM. Not “just” an intravenous line: consumer perspectives on peripheral intravenous cannulation (PIVC). An international cross-sectional survey of 25 countries. PLoS One. 2018;13(2):e0193436. https://doi.org/10.1371/journal.pone.0193436
8. Goff DA, Larsen P, Brinkley J, et al. Resource utilization and cost of inserting peripheral intravenous catheters in hospitalized children. Hosp Pediatr. 2013;3(3):185-191. https://doi.org/10.1542/hpeds.2012-0089
9. Tuffaha HW, Rickard CM, Webster J, et al. Cost-effectiveness analysis of clinically indicated versus routine replacement of peripheral intravenous catheters. Appl Health Econ Heath Policy. 2014;12(1):51-58. https://doi.org/10.1007/s40258-013-0077-2
10. Suliman M, Saleh W, Al-Shiekh H, Taan W, AlBashtawy M. The incidence of peripheral intravenous catheter phlebitis and risk factors among pediatric patients. J Pediatr Nurs. 2020;50:89-93. https://doi.org/10.1016/j.pedn.2019.11.006
11. Ben Abdelaziz R, Hafsi H, Hajji H, et al. Peripheral venous catheter complications in children: predisposing factors in a multicenter prospective cohort study. BMC Pediatr. 2017;17(1):208. https://doi.org/10.1186/s12887-017-0965-y
12. Reigart JR, Camberlain KH, Eldridge D, et al. Peripheral intravenous access in pediatric inpatients. Clin Pediatr (Phila). 2012;51(1):468-472. https://doi.org/10.1177/0009922811435164
13. Holder MR, Stutzman SE, Olson DM. Impact of ultrasound on short peripheral intravenous catheter placement on vein thrombosis risk. J Infus Nurs. 2017;40(3):176-182. https://doi.org/10.1097/NAN.0000000000000214
14. Marsh N, Webster J, Larsen E, et al. Expert versus generalist inserters for peripheral intravenous catheter insertion: a pilot randomised controlled trial. Trials. 2018;19(1):564. https://doi.org/10.1186/s13063-018-2946-3
15. Pandurangadu AV, Tucker J, Brackney AR, Bahl A. Ultrasound-guided intravenous catheter survival impacted by amount of catheter residing in the vein. Emerg Med J. 2018;35(9):550-555. https://doi.org/10.1136/emermed-2017-206803
16. Bahl A, Hijazi M, Chen NW, Lachapelle-Clavette L, Price J. Ultralong versus standard long peripheral intravenous catheters: a randomized controlled trial of ultrasonographically guided catheter survival. Ann Emerg Med. 2020;76(2):134-142. https://doi.org/10.1016/j.annemergmed.2019.11.013
17. Takahashi T, Murayama R, Abe-Doi M, et al. Preventing peripheral intravenous catheter failure by reducing mechanical irritation. Sci Rep. 2020;10(1):1550. https://doi.org/10.1038/s41598-019-56873-2
18. Vinograd AM, Zorc JJ, Dean AJ, Abbadessa MKF, Chen AE. First-attempt success, longevity, and complication rates of ultrasound-guided peripheral intravenous catheters in children. Pediatr Emerg Care. 2018;34(6):376-380. https://doi.org/10.1097/PEC.0000000000001063
19. Gorski LA, Hadaway L, Hagle ME, et al. Infusion Therapy Standards of Practice, 8th edition. J Infus Nurs. 2021;44(1S Suppl 1):S1-S224. https://doi.org/10.1097/NAN.0000000000000396
20. Stedman’s Medical Dictionary for the Health Professions and Nursing. 7th ed.Lippincott Williams & Wilkins; 2012.
21. Higgins JPT, Thomas J, Chandler J, et al. Cochrane Handbook for Systematic Reviews of Interventions version 6.1. Cochrane; 2020. www.training.cochrane.org/handbook
22. Moher D, Liberati A, Tetzlaff J, Altman DG, PRISMA Group. Preferred reporting items for systematic reviews and meta-analyses: the PRISMA statement. Int J Surg. 2010;8(5):336-341. https://doi.org/10.1016/j.ijsu.2010.02.007
23. Stolz LA, Cappa AR, Minckler MR, et al. Prospective evaluation of the learning curve for ultrasound-guided peripheral intravenous catheter placement. J Vasc Access. 2016;17(4):366-370. https://doi.org/10.5301/jva.5000574
24. Sterne JAC, Savovic J, Page MJ, et al. RoB 2: a revised tool for assessing risk of bias in randomised trials. BMJ. 2019;366:l4898. https://doi.org/10.1136/bmj.l4898
25. Atkins D, Best D, Briss PA, et al. Grading quality of evidence and strength of recommendations. BMJ. 2004;328(7454):1490. https://doi.org/10.1136/bmj.328.7454.1490
26. Diaz-Hennessey S, O’Shea ER, King K. Virtual reality: augmenting the acute pain experience in children. Pediatr Nurs. 2019;45(3):122-127.
27. Takeshita J, Yoshida T, Nakajima Y, et al. Superiority of dynamic needle tip positioning for ultrasound-guided peripheral venous catheterization in patients younger than 2 years old: a randomized controlled trial. Pediatr Crit Care Med. 2019;20(9):e410-e414. https://doi.org/10.1097/PCC.0000000000002034
28. Takeshita J, Nakayama Y, Nakajima Y, et al. Optimal site for ultrasound-guided venous catheterisation in paediatric patients: an observational study to investigate predictors for catheterisation success and a randomised controlled study to determine the most successful site. Crit Care. 2015;19(1):15. https://doi.org/10.1186/s13054-014-0733-4
29. White ML, Crawley J, Rennie EA, Lewandowski LA. Examining the effectiveness of 2 solutions used to flush capped pediatric peripheral intravenous catheters. J Infus Nurs. 2011;34(4):260-270. https://doi.org/10.1097/NAN.0b013e31821da29a
30. Schreiber S, Zanchi C, Ronfani L, et al. Normal saline flushes performed once daily maintain peripheral intravenous catheter patency: a randomised controlled trial. Arch Dis Child. 2015;100(7):700-703. https://doi.org/10.1136/archdischild-2014-307478
31. Kleidon TM, Keogh S, Flynn J, Schults J, Mihala G, Rickard CM. Flushing of peripheral intravenous catheters: a pilot, factorial, randomised controlled trial of high versus low frequency and volume in paediatrics. J Paediatr Child Health. 2019;56(1):22-29. https://doi.org/10.1111/jpc.14482
32. Wolyniez I, Rimon A, Scolnik D, et al. The effect of a medical clown on pain during intravenous access in the pediatric emergency department: a randomized prospective pilot study. Clin Pediatr (Phila). 2013;52(12):1168-1172. https://doi.org/10.1177/0009922813502257
33. Hartling L, Newton AS, Liang Y, et al. Music to reduce pain and distress in the pediatric emergency department: a randomized clinical trial. JAMA Pediatr. 2013;167(9):826‐835. https://doi.org/10.1001/jamapediatrics.2013.200
34. Kleidon TM, Rickard CM, Gibson V, et al. Smile - secure my intravenous line effectively: a pilot randomised controlled trial of peripheral intravenous catheter securement in paediatrics. J Tissue Viability. 2020;29(2):82-90. https://doi.org/10.1016/j.jtv.2020.03.006
35. Büyükyilmaz F, Sahiner NC, Caglar S, Eren H. Effectiveness of an intravenous protection device in pediatric patients on catheter dwell time and phlebitis score. Asian Nurs Res (Korean Soc Nurs Sci). 2019;13(4):236-241. https://doi.org/10.1016/j.anr.2019.09.001
36. Schmitz ML, Zempsky WT, Meyer JM. Safety and efficacy of a needle-free powder lidocaine delivery system in pediatric patients undergoing venipuncture or peripheral venous cannulation: randomized double-blind COMFORT-004 trial. Clin Ther. 2015;37(8):1761-1772. https://doi.org/10.1016/j.clinthera.2015.05.515
37. Curtis SJ, Craig WR, Logue E, Vandermeer B, Hanson A, Klassen T. Ultrasound or near-infrared vascular imaging to guide peripheral intravenous catheterization in children: a pragmatic randomized controlled trial. CMAJ. 2015;187(8):563-570. https://doi.org/10.1503/cmaj.141012
38. Benkhadra M, Collignon M, Fournel I, et al. Ultrasound guidance allows faster peripheral IV cannulation in children under 3 years of age with difficult venous access: a prospective randomized study. Paediatr Anaesth. 2012;22(5):449-454. https://doi.org/10.1111/j.1460-9592.2012.03830.x
39. Avelar AFM, Peterlini MAS, da Luz Gonçalves Pedreira M. Ultrasonography-guided peripheral intravenous access in children: a randomized controlled trial. J Infus Nurs. 2015;38(5):320‐327. https://doi.org/10.1097/NAN.0000000000000126
40. Vinograd AM, Chen AE, Woodford AL, et al. Ultrasonographic guidance to improve first-attempt success in children with predicted difficult intravenous access in the emergency department: a randomized controlled trial. Ann Emerg Med. 2019;74(1):19-27. https://doi.org/10.1016/j.annemergmed.2019.02.019
41. Kim MJ, Park JM, Rhee N, et al. Efficacy of VeinViewer in pediatric peripheral intravenous access: a randomized controlled trial. Eur J Pediatr. 2012;171(7):1121-1125. https://doi.org/10.1007/s00431-012-1713-9
42. Kaddoum RN, Anghelescu DL, et al. A randomized controlled trial comparing the AccuVein AV300 device to standard insertion technique for intravenous cannulation of anesthetized children. Paediatr Anaesth. 2012;22(9):884-889. https://doi.org/10.1111/j.1460-9592.2012.03896.x
43. Inal S, Demir D. Impact of peripheral venous catheter placement with vein visualization device support on success rate and pain levels in pediatric patients aged 0 to 3 years. Pediatr Emerg Care. 2021;37(3):138-144. https://doi.org/10.1097/PEC.0000000000001493
44. Demir D, Inal S. Does the use of a vein visualization device for peripheral venous catheter placement increase success rate in pediatric patients? Pediatr Emerg Care. 2019;35(7):474-479. https://doi.org/10.1097/PEC.0000000000001007
45. Gümüs M, Basbakkal Z. Efficacy of Veinlite PEDI in pediatric peripheral intravenous access: a randomized controlled trial. Pediatr Emerg Care. 2021;37(3):145-149. https://doi.org/10.1097/PEC.0000000000001515
46. Qin KR, Ensor N, Barnes R, Englin A, Nataraja RM, Pacilli M. Standard versus long peripheral catheters for multiday IV therapy: a randomized controlled trial. Pediatrics. 2021;147(2): e2020000877. https://doi.org/10.1542/peds.2020-000877
47. van Loon FHJ, Buise MP, Claassen JJF, Dierick-van Daele ATM, Bouwman ARA. Comparison of ultrasound guidance with palpation and direct visualisation for peripheral vein cannulation in adult patients: a systematic review and meta-analysis. Br J Anaesth. 2018;121(2):358-366. https://doi.org/10.1016/j.bja.2018.04.047
48. Parker SIA, Benzies KM, Hayden KA. A systematic review: effectiveness of pediatric peripheral intravenous catheterization strategies. J Adv Nurs. 2017;73(7):1570-1582. https://doi.org/10.1111/jan.13211
Peripheral intravenous catheters (PIVCs) are fundamental to the healthcare practitioners’ ability to provide vital intravenous fluids, medications, and blood products, and as a prophylactic measure prior to some procedures, making insertion of these devices the most common in-hospital invasive procedure in pediatrics.1,2 Despite the prevalence and ubiquity of PIVCs,1 successful insertion in pediatrics is problematic,3-5 and device dysfunction prior to completion of treatment is common.3,6 The inability to attain timely PIVC access and maintain postinsertion function has significant short- and long-term sequelae, including pain and anxiety for children and their parents,3,7 delays in treatment,3 prolonged hospitalization,8 and increased healthcare-associated costs.8-10
Approximately 50% of pediatric PIVC insertions are challenging, often requiring upwards of four insertion attempts, and a similar proportion fail prior to treatment completion.3,11 Exactly why PIVC insertion is difficult in children, and the mechanisms of failure, are unknown. It is likely to be multifaceted and related to factors concerning the patient (eg, comorbidities, age, gender, adiposity),11,12 provider (eg, insertion practice, care, and maintenance),3,13,14 device (eg, size, length, catheter-to-vein ratio),15,16 and therapy (eg, vessel irritation).11,13,17 Observational studies and randomized controlled trials (RCTs) in hospitalized pediatric patients report that the average PIVC dwell is approximately 48 hours, suggesting multiple PIVCs are required to complete a single admission.3,18
Conventionally, PIVC insertion involved physical assessment through palpation and visualization (landmark approach), and although postinsertion care varies among healthcare facilities, minimal requirements are a dressing over the insertion site and regular flushes to ensure device patency.1,3,19 Recently, clinicians have investigated insertion and management practices to improve PIVC outcomes. These can be grouped into techniques—the art of doing (the manner of performance, or the details, of any surgical operation, experiment, or mechanical act) and technologies—the application of scientific knowledge for practical purposes.20 Individual studies have examined the outcomes of new techniques and technologies; however, an overall estimation of their clinical significance or effect is unknown.11,18 Therefore, the aim of this review was to systematically search published studies, conduct a pooled analysis of findings, and report the success of various techniques and technologies to improve insertion success and reduce overall PIVC failure.
METHODS
Design
The protocol for this systematic review was prospectively registered with PROSPERO (CRD42020165288). This review followed Cochrane Collaboration systematic review methods21 and was reported in accordance with the Preferred Reporting Items for Systematic Reviews and Meta-Analyses (PRISMA) statement.22
Inclusion and Exclusion Criteria
Studies were eligible for inclusion if they met predefined criteria: (1) RCT design; (2) included standard-length PIVC; (3) participants aged 0 to 18 years, excluding preterm infants (less than 36 weeks’ gestation); (4) required PIVC insertion in an inpatient healthcare setting; and (5) reported PIVC insertion outcomes (described below). Studies were excluded if they were cluster or crossover RCTs, published before 2010, or not written in English.
Interventions
Interventions were PIVC insertion and management techniques, defined as “the manner of performance, or the details, of any surgical operation, experiment, or mechanical act” (eg, needle-tip positioning, vein selection [site of insertion], comfort measures, and flushing regimen), or technologies, defined as “the application of scientific knowledge for practical purpose” (eg, vessel visualization, catheter material, and catheter design), compared with current practice, defined as commonly known, practiced, or accepted (eg, landmark PIVC insertion).20
Primary and Secondary Outcomes
The primary outcome was first-time insertion success (one skin puncture to achieve PIVC insertion; can aspirate and flush PIVC without resistance).23 Secondary outcomes included: (1) overall PIVC insertion success23; (2) all-cause PIVC failure (cessation of PIVC function prior to treatment completion)6; (3) dwell time14; (4) PIVC insertion time; (5) insertion attempts23; (6) individual elements of failure (dislodgement, extravasation, infection, occlusion, pain, phlebitis, and thrombosis)6; and (7) patient/parent satisfaction. Some outcomes evaluated were author defined within each study (patient/parent satisfaction, pain score).
Systematic Search
A search of the Cochrane Library and Central Register of Controlled Trials (CENTRAL), Cumulative Index to Nursing and Allied Health (CINAHL), US National Institutes of Health National Library of Medicine (PubMed), and Embase databases between 2010 to 2020 was undertaken on June 23, 2020, and updated March 4, 2021. Medical Subject Heading (MeSH) terms and relevant keywords and their variants were used in collaboration with a healthcare librarian (Appendix Table 1). Additional studies were identified through hand searches of bibliographies.19 Studies were included if two authors (TMK and JS) independently agreed they met the inclusion criteria.
Data Extraction
Two authors (TMK/JS) independently abstracted study data using a standardized form managed in Microsoft Excel.
Quality Assessment
Included studies were assessed by two authors (TMK and JS) for quality using the Cochrane risk of bias (RoB2) tool.21,24 The overall quality of evidence for each outcome was assessed using the Grading of Recommendations Assessment, Development and Evaluation (GRADE)25 approach. Individual RCTs began at high quality, downgraded by one level for “serious” or two levels for “very serious” study limitations, including high risk of bias, serious inconsistency, publication bias, or indirectness of evidence.
Data Analysis and Synthesis
Where two or more trials with evidence of study homogeneity (trial interventions and population) were identified, meta-analysis using RevMan 5 (version 5.4.1)26 with random effects was conducted. Descriptive statistics summarized study population, interventions, and results. For dichotomous outcomes, we calculated risk ratio (RR) plus 95% CI. For continuous outcomes, we planned to calculate the mean difference (MD) plus 95% CI and the standardized mean difference (SMD) (difference between experimental and control groups across trials) reported as the summary statistic.
Subgroup analyses, where possible, included: difficult intravenous access (DIVA), defined by study authors; age (0-3 years; >3 years up to 18 years); hospital setting during PIVC insertion (awake clinical environment vs awake emergency department vs asleep operating room setting); and by operator (bedside nurse, anesthesiologist).
RESULTS
Search Strategy
Figure 1 describes study selection in accordance with the PRISMA guidelines.22 We identified 1877 records, and 18 articles met the inclusion criteria. An additional 3 studies were identified in the updated search, totaling 21 studies included in the final review.
Study Characteristics
Collectively, 3237 patients and 3098 successful PIVC insertions were reported. In the included studies, 139 patients did not receive a PIVC owing to failed insertion. Ten studies examined techniques (needle-tip positioning,27 vein choice for PIVC insertion,28 flushing regimen,29-31 nonpharmacological32,33 dressing and securement,34,35 and pharmacological comfort measures36), and 11 studies examined technologies (vessel visualization including ultrasound,4,37-40 near-infrared [image of vein projected onto the skin],37,41-44 transillumination [transmission of light through the skin],45 and catheter design46). Table 1 outlines characteristics of included studies. Most trials were single center and conducted in an acute inpatient pediatric-specific setting4,27-34,36-41,44-46 or dedicated pediatric unit in a large public hospital35,43,44; one study was a multicenter trial.36 All trials described evidence of ethical review board approval and participant consent for trial participation.
Study Quality
The certainty of evidence at the outcome level varied from moderate to very low. Table 2 and Table 3 outline the summary of findings for landmark insertion compared with ultrasound-guided and landmark insertion compared with near-infrared PIVC insertion, respectively. The remaining summary-of-findings comparisons that included more than one study or addressed clinically relevant questions can be found in Appendix Tables 2, 3, 4, 5, 6, 7, and 8. At the individual study level, most domains were assessed as low risk of bias (Appendix Figure 1).
Effectiveness of Interventions
Technology to Improve PIVC Outcomes
Landmark compared with ultrasound-guided PIVC insertion. Five studies compared PIVC insertion success outcomes when traditional landmark technique was used in comparison with ultrasound guidance (Appendix Figure 2). Four studies (592 patients)4,37,38,40 assessed the primary outcome of first-time insertion success. Appendix Figure 2.1 demonstrates PIVCs were 1.5 times more likely to be inserted on first attempt when ultrasound guidance was used compared with landmark insertion (RR, 1.60; 95% CI, 1.02-2.50). When examining only studies that included DIVA,4,38,40 the effect size increased and CIs tightened (RR, 1.87; 95% CI, 1.56-2.24). No evidence of effect was demonstrated when comparing this outcome in children aged 0 to 3 years (RR, 1.39; 95% CI, 0.88-2.18) or >3 years (RR, 0.72; 95% CI, 0.35-1.51. Two studies4,38 demonstrated that first-time insertion success with ultrasound (compared with landmark) was almost twice as likely (RR, 1.87; 95% CI, 1.44-2.42) after induction of anesthesia in contrast to no effect in studies undertaken in the emergency department37,40 (RR, 1.32; 95% CI, 0.68-2.56). One study39 (339 patients) reported the secondary outcomes of extravasation/infiltration and phlebitis. Extravasation/infiltration was nearly twice as likely with ultrasound compared with landmark insertion (RR, 1.80; 95% CI, 1.01-3.22); however, there was no evidence of effect related to phlebitis (RR, 0.32; 95% CI, 0.07-1.50).
Four studies4,38-40 compared the review’s secondary outcome of PIVC insertion success (Appendix Figure 2.2), with no evidence of an effect (RR, 1.10; 95% CI, 0.94-1.28). No improvement in overall insertion success was demonstrated in the following subgroup analyses: patients with DIVA (RR, 1.18; 95% CI, 0.95-1.47), children under 3 years of age (RR, 1.23; 95% CI, 0.90-1.68), and PIVCs inserted by anesthesiologists (RR, 1.25; 95% CI, 0.91-1.72). One study measured this outcome in children aged >3 years (RR, 1.13; 95% CI, 0.99-1.29) with no effect and in the emergency department (RR, 1.09; 95% CI, 1.00-1.20), where ultrasound guidance improved overall PIVC insertion success.
Landmark compared with near-infrared PIVC insertion. First-time insertion success (Appendix Figure 3.1) was reported in five studies37,41-44 and 778 patients with no evidence of effect (RR, 1.21; 95% CI, 0.91-1.59). Subgroup analysis by DIVA41-44 demonstrated first-time insertion success more than doubled with near-infrared technology compared with landmark (RR, 2.72; 95% CI, 1.02-7.24). Subgroup analysis by age did not demonstrate an effect in children younger than 3 years or children older than 3 years. Subgroup analysis by clinician inserting did not demonstrate an effect. Of the five studies reporting time to insertion,37,41-44 two41,42 reported median rather than mean, so could not be included in the analysis. Of the remaining three studies,37,43,44 near-infrared reduced PIVC time to insertion (Appendix Figure 3.2).
Four studies37,42-44 reported the number of attempts required for successful PIVC insertion where no difference was detected; however, subgroup analysis of patients with DIVA43,44 and insertion by bedside nurse43,44 demonstrated fewer PIVC insertion attempts and a reduction in insertion time, respectively, with the use of near-infrared technology (Appendix Figure 3.3).
Landmark compared with transillumination PIVC insertion. One study45 (112 participants) found a positive effect with the use of transillumination and first-time insertion success (RR, 1.29; 95% CI, 1.07-1.54), reduced time to insertion (MD, –9.70; 95% CI, –17.40 to –2.00), and fewer insertion attempts (MD, –0.24; 95% CI, –0.40 to –0.08) compared with landmark insertion.
Long PIVC compared with short PIVC. A single study46 demonstrated a 70% reduction in PIVC failure (RR, 0.29; 95% CI, 0.14-0.59) when long PIVCs were compared with standard PIVCs. Specifically, PIVC failure due to infiltration was reduced with the use of a long PIVC (RR, 0.08; 95% CI, 0.01-0.61). There was no difference in insertion success (RR, 1.00; 95% CI, 0.95-1.05) or phlebitis (RR, 1.00; 95% CI, 0.07-15.38).
Technique to Improve PIVC Outcomes
Static ultrasound-guided compared with dynamic needle-tip PIVC insertion. In a single study comparing variation in ultrasound-guided PIVC insertion technique27 (60 patients), dynamic needle-tip positioning improved first-time insertion success (RR, 1.44; 95% CI, 1.04-2.00) and overall PIVC insertion success (RR, 1.42; 95% CI, 1.06-1.91).
Variation in vein choice for successful PIVC insertion. Insertion of PIVC in the cephalic vein of the forearm improved insertion success in a single study28 of 172 patients compared with insertion in the dorsal vein of the hand (RR, 1.39; 95% CI, 1.15-1.69) and great saphenous vein (RR, 1.27; 95% CI, 1.08-1.49).
Variation in PIVC flush. Heparinized saline compared with 0.9% sodium chloride flush29 did not reduce infiltration (RR, 0.31; 95% CI, 0.03-2.84), occlusion (RR, 1.88; 95% CI, 0.18-19.63) during dwell, or hematoma (RR, 0.94; 95% CI, 0.06-14.33) at insertion.
Two studies30,31 (253 participants) compared PIVC flush frequency (daily compared with more frequent flush regimes). There was no reduction in overall PIVC failure, extravasation/infiltration, phlebitis, or occlusion during dwell (Appendix Figure 4.1-4.4). Additionally, no effect was demonstrated when a single study31 investigated volume of flush on extravasation/infiltration, dislodgement, phlebitis, or occlusion.
Variation in dressing and securement. One trial (330 participants)34 demonstrated that integrated securement and dressing (ISD) product reduced PIVC failure (RR, 0.65; 95% CI, 0.45-0.93) and occlusion (RR, 0.35; 95% CI, 0.13-0.94) compared with bordered polyurethane (BPU). There was no difference in the proportion of PIVC failure between BPU compared with tissue adhesive (TA) (RR, 0.74; 95% CI, 0.52-1.06). When comparing individual elements of PIVC failure, there was no evidence of effect between BPU and ISD in reducing infiltration (RR, 0.74; 95% CI, 0.43-1.27), dislodgement (RR, 0.49; 95% CI, 0.15-1.58), or phlebitis/pain (RR, 0.54; 95% CI, 0.21-1.39); similarly, the use of TA compared with BPU did not reduce failure due to infiltration (RR, 0.78; 95% CI, 0.45-1.33), dislodgement (RR, 0.37; 95% CI, 0.10-1.35), occlusion (RR, 0.91; 95% CI, 0.45-1.84), or phlebitis/pain (RR, 0.42; 95% CI, 0.17-1.05).
A comparison of protective covering35 (60 participants) did not demonstrate a significant improvement in PIVC dwell (RR, 0.83; 95% CI, 0.25-1.41).
Pharmacological and nonpharmacological interventions. A comparison of nonpharmacological comfort techniques, including music during insertion (one trial, 42 participants), did not improve first-time insertion success between the two groups (RR, 0.74; 95% CI, 0.53-1.03). Similarly, incorporation of a clown32 (47 patients) as method of distraction did not demonstrate an effect on PIVC insertion success (RR, 0.90; 95% CI, 0.77-1.06) or time to PIVC insertion (MD, –0.20; 95% CI, –1.74 to 1.34). In a double-blinded, placebo-controlled RCT36 of pharmacological techniques to reduce PIVC insertion-related pain (504 participants), no evidence of effect was established between the placebo control group and the active analgesia in overall PIVC insertion success (RR, 1.01; 95% CI, 0.97-1.04).
DISCUSSION
Despite their pervasiveness, PIVC insertion in children is problematic and premature device failure is common, yet effective strategies to overcome these challenges have not been systematically reviewed to date. This systematic review (including meta-analysis) examines techniques and technologies to improve PIVC insertion success and reduce overall failure. We demonstrated ultrasound-guided PIVC insertion significantly improved first-time insertion success in general pediatrics.
Analogous to a previous systematic review in adult patients (1660 patients, odds ratio, 2.49; 95% CI, 1.37-4.52; P = .003; I2, 69%),47 we confirm ultrasound improves first-time PIVC insertion success, most notably in pediatric patients with difficult intravenous access. However, widespread use of ultrasound-guided PIVC insertion is limited by operator skills, as it requires practice and dexterity, especially for DIVA patients.5,47 Healthcare facilities should prioritize teaching and training to support acquisition of this skill to reduce the deleterious effects of multiple insertion attempts, including vessel damage, delayed treatment, pain, and anxiety associated with needles.
Other vessel-visualization technologies (near-infrared and transillumination) did not improve PIVC insertion in generic pediatrics.5 However, they significantly improved first-time insertion, time to insertion, and number of insertion attempts in patients with DIVA and should be considered in the absence of ultrasound-proficient clinicians.
Although vessel-visualization technologies provide efficient PIVC insertion, complication-free PIVC dwell is equally important. Few studies examined both insertion outcomes and PIVC postinsertion outcomes (dwell time and complications during treatment). One study reported more postinsertion complications ( eg, infiltration) with ultrasound compared with landmark technique.39 Vessel-visualization tools should be used to assess the vein to guide PIVC choice. Pandurangadu et al15 reported increased PIVC failure when less than 65% of the catheter length resides within the vein; this was consistent with the single RCT46 included in this review that demonstrated reduced infiltration with long PIVCs compared with standard-length PIVCs. To reduce this knowledge practice gap, it is critical that clinicians continue to evaluate and publish findings of novel techniques to improve PIVC outcomes.
The review findings have important implications for future research, clinical practice, and policy. Unlike earlier reviews,48 vessel-visualization technologies, particularly ultrasound, improved PIVC insertion success; however, during-dwell outcomes were inconsistently reported, and future research should include these. In addition, while there is evidence to support these new technologies, adequate training and resources to ensure a sustained, skilled workforce to optimize PIVC insertion are necessary for successful implementation.
Our study had some limitations, including the methodological quality of included studies (small sample size and significant clinical and statistical heterogeneity). Subgroup analyses were undertaken to reduce the heterogeneity inherent in pediatric populations; however, future studies should stratify for patient (age, DIVA, indication for insertion) and setting (conscious/unconscious, emergent/nonemergent) factors. Incomplete or absent outcome definitions and varied reporting measures (eg, median vs mean) prevented calculation of the pooled incidence of catheter failure and dwell time.
Our review also has notable strengths. Two independent investigators performed a rigorous literature search. Only RCTs were included, ensuring the most robust methods to inform clinically important questions. The primary and secondary outcomes were derived from patient-centered outcomes.
CONCLUSION
This systematic review and meta-analysis describes the pooled incidence of PIVC insertion success and outcomes, including complication and failure in pediatric patients. PIVC insertion with ultrasound should be used to improve insertion success in generic pediatric patients, and any form of vessel-visualization technology (ultrasound, near-infrared, transillumination) should be considered for anticipated difficult insertions.
1. Ullman AJ, Takashima M, Kleidon T, Ray-Barruel G, Alexandrou E, Rickard CM. Global pediatric peripheral intravenous catheter practice and performance: a secondary analysis of 4206 catheters. J Pediatr Nurs. 2020;50:e18-e25. https://doi.org/10.1016/j.pedn.2019.09.023
2. Millington SJ, Hendin A, Shiloh AL, Koenig S. Better with ultrasound peripheral intravenous catheter insertion. Chest. 2020;157(2):369-375. https://doi.org/10.1016/j.chest.2019.04.139
3. Kleidon TM, Cattanach P, Mihala G, Ullman AJ. Implementation of a paediatric peripheral intravenous catheter care bundle: a quality improvement initiative. J Paediatr Child Health. 2019;55(10):1214-1223. https://doi.org/10.1111/jpc.14384
4. Hanada S, Van Winkle MT, Subramani S, Ueda K. Dynamic ultrasound-guided short-axis needle tip navigation technique vs. landmark technique for difficult saphenous vein access in children: a randomised study. Anaesthesia. 2017;72(12):1508-1515. https://doi.org/10.1111/anae.14082
5. Heinrichs J, Fritze Z, Klassen T, Curtis S. A systematic review and meta-analysis of new interventions for peripheral intravenous cannulation of children. Pediatr Emerg Care. 2013;29(7):858-866. https://doi.org/10.1097/PEC.0b013e3182999bcd
6. Indarwati F, Mathew S, Munday J, Keogh S. Incidence of peripheral intravenous catheter failure and complications in paediatric patients: systematic review and meta analysis. Int J Nurs Stud. 2020;102:103488. https://doi.org/10.1016/j.ijnurstu.2019.103488
7. Cooke M, Ullman AJ, Ray-Barruel G, Wallis M, Corley A, Rickard CM. Not “just” an intravenous line: consumer perspectives on peripheral intravenous cannulation (PIVC). An international cross-sectional survey of 25 countries. PLoS One. 2018;13(2):e0193436. https://doi.org/10.1371/journal.pone.0193436
8. Goff DA, Larsen P, Brinkley J, et al. Resource utilization and cost of inserting peripheral intravenous catheters in hospitalized children. Hosp Pediatr. 2013;3(3):185-191. https://doi.org/10.1542/hpeds.2012-0089
9. Tuffaha HW, Rickard CM, Webster J, et al. Cost-effectiveness analysis of clinically indicated versus routine replacement of peripheral intravenous catheters. Appl Health Econ Heath Policy. 2014;12(1):51-58. https://doi.org/10.1007/s40258-013-0077-2
10. Suliman M, Saleh W, Al-Shiekh H, Taan W, AlBashtawy M. The incidence of peripheral intravenous catheter phlebitis and risk factors among pediatric patients. J Pediatr Nurs. 2020;50:89-93. https://doi.org/10.1016/j.pedn.2019.11.006
11. Ben Abdelaziz R, Hafsi H, Hajji H, et al. Peripheral venous catheter complications in children: predisposing factors in a multicenter prospective cohort study. BMC Pediatr. 2017;17(1):208. https://doi.org/10.1186/s12887-017-0965-y
12. Reigart JR, Camberlain KH, Eldridge D, et al. Peripheral intravenous access in pediatric inpatients. Clin Pediatr (Phila). 2012;51(1):468-472. https://doi.org/10.1177/0009922811435164
13. Holder MR, Stutzman SE, Olson DM. Impact of ultrasound on short peripheral intravenous catheter placement on vein thrombosis risk. J Infus Nurs. 2017;40(3):176-182. https://doi.org/10.1097/NAN.0000000000000214
14. Marsh N, Webster J, Larsen E, et al. Expert versus generalist inserters for peripheral intravenous catheter insertion: a pilot randomised controlled trial. Trials. 2018;19(1):564. https://doi.org/10.1186/s13063-018-2946-3
15. Pandurangadu AV, Tucker J, Brackney AR, Bahl A. Ultrasound-guided intravenous catheter survival impacted by amount of catheter residing in the vein. Emerg Med J. 2018;35(9):550-555. https://doi.org/10.1136/emermed-2017-206803
16. Bahl A, Hijazi M, Chen NW, Lachapelle-Clavette L, Price J. Ultralong versus standard long peripheral intravenous catheters: a randomized controlled trial of ultrasonographically guided catheter survival. Ann Emerg Med. 2020;76(2):134-142. https://doi.org/10.1016/j.annemergmed.2019.11.013
17. Takahashi T, Murayama R, Abe-Doi M, et al. Preventing peripheral intravenous catheter failure by reducing mechanical irritation. Sci Rep. 2020;10(1):1550. https://doi.org/10.1038/s41598-019-56873-2
18. Vinograd AM, Zorc JJ, Dean AJ, Abbadessa MKF, Chen AE. First-attempt success, longevity, and complication rates of ultrasound-guided peripheral intravenous catheters in children. Pediatr Emerg Care. 2018;34(6):376-380. https://doi.org/10.1097/PEC.0000000000001063
19. Gorski LA, Hadaway L, Hagle ME, et al. Infusion Therapy Standards of Practice, 8th edition. J Infus Nurs. 2021;44(1S Suppl 1):S1-S224. https://doi.org/10.1097/NAN.0000000000000396
20. Stedman’s Medical Dictionary for the Health Professions and Nursing. 7th ed.Lippincott Williams & Wilkins; 2012.
21. Higgins JPT, Thomas J, Chandler J, et al. Cochrane Handbook for Systematic Reviews of Interventions version 6.1. Cochrane; 2020. www.training.cochrane.org/handbook
22. Moher D, Liberati A, Tetzlaff J, Altman DG, PRISMA Group. Preferred reporting items for systematic reviews and meta-analyses: the PRISMA statement. Int J Surg. 2010;8(5):336-341. https://doi.org/10.1016/j.ijsu.2010.02.007
23. Stolz LA, Cappa AR, Minckler MR, et al. Prospective evaluation of the learning curve for ultrasound-guided peripheral intravenous catheter placement. J Vasc Access. 2016;17(4):366-370. https://doi.org/10.5301/jva.5000574
24. Sterne JAC, Savovic J, Page MJ, et al. RoB 2: a revised tool for assessing risk of bias in randomised trials. BMJ. 2019;366:l4898. https://doi.org/10.1136/bmj.l4898
25. Atkins D, Best D, Briss PA, et al. Grading quality of evidence and strength of recommendations. BMJ. 2004;328(7454):1490. https://doi.org/10.1136/bmj.328.7454.1490
26. Diaz-Hennessey S, O’Shea ER, King K. Virtual reality: augmenting the acute pain experience in children. Pediatr Nurs. 2019;45(3):122-127.
27. Takeshita J, Yoshida T, Nakajima Y, et al. Superiority of dynamic needle tip positioning for ultrasound-guided peripheral venous catheterization in patients younger than 2 years old: a randomized controlled trial. Pediatr Crit Care Med. 2019;20(9):e410-e414. https://doi.org/10.1097/PCC.0000000000002034
28. Takeshita J, Nakayama Y, Nakajima Y, et al. Optimal site for ultrasound-guided venous catheterisation in paediatric patients: an observational study to investigate predictors for catheterisation success and a randomised controlled study to determine the most successful site. Crit Care. 2015;19(1):15. https://doi.org/10.1186/s13054-014-0733-4
29. White ML, Crawley J, Rennie EA, Lewandowski LA. Examining the effectiveness of 2 solutions used to flush capped pediatric peripheral intravenous catheters. J Infus Nurs. 2011;34(4):260-270. https://doi.org/10.1097/NAN.0b013e31821da29a
30. Schreiber S, Zanchi C, Ronfani L, et al. Normal saline flushes performed once daily maintain peripheral intravenous catheter patency: a randomised controlled trial. Arch Dis Child. 2015;100(7):700-703. https://doi.org/10.1136/archdischild-2014-307478
31. Kleidon TM, Keogh S, Flynn J, Schults J, Mihala G, Rickard CM. Flushing of peripheral intravenous catheters: a pilot, factorial, randomised controlled trial of high versus low frequency and volume in paediatrics. J Paediatr Child Health. 2019;56(1):22-29. https://doi.org/10.1111/jpc.14482
32. Wolyniez I, Rimon A, Scolnik D, et al. The effect of a medical clown on pain during intravenous access in the pediatric emergency department: a randomized prospective pilot study. Clin Pediatr (Phila). 2013;52(12):1168-1172. https://doi.org/10.1177/0009922813502257
33. Hartling L, Newton AS, Liang Y, et al. Music to reduce pain and distress in the pediatric emergency department: a randomized clinical trial. JAMA Pediatr. 2013;167(9):826‐835. https://doi.org/10.1001/jamapediatrics.2013.200
34. Kleidon TM, Rickard CM, Gibson V, et al. Smile - secure my intravenous line effectively: a pilot randomised controlled trial of peripheral intravenous catheter securement in paediatrics. J Tissue Viability. 2020;29(2):82-90. https://doi.org/10.1016/j.jtv.2020.03.006
35. Büyükyilmaz F, Sahiner NC, Caglar S, Eren H. Effectiveness of an intravenous protection device in pediatric patients on catheter dwell time and phlebitis score. Asian Nurs Res (Korean Soc Nurs Sci). 2019;13(4):236-241. https://doi.org/10.1016/j.anr.2019.09.001
36. Schmitz ML, Zempsky WT, Meyer JM. Safety and efficacy of a needle-free powder lidocaine delivery system in pediatric patients undergoing venipuncture or peripheral venous cannulation: randomized double-blind COMFORT-004 trial. Clin Ther. 2015;37(8):1761-1772. https://doi.org/10.1016/j.clinthera.2015.05.515
37. Curtis SJ, Craig WR, Logue E, Vandermeer B, Hanson A, Klassen T. Ultrasound or near-infrared vascular imaging to guide peripheral intravenous catheterization in children: a pragmatic randomized controlled trial. CMAJ. 2015;187(8):563-570. https://doi.org/10.1503/cmaj.141012
38. Benkhadra M, Collignon M, Fournel I, et al. Ultrasound guidance allows faster peripheral IV cannulation in children under 3 years of age with difficult venous access: a prospective randomized study. Paediatr Anaesth. 2012;22(5):449-454. https://doi.org/10.1111/j.1460-9592.2012.03830.x
39. Avelar AFM, Peterlini MAS, da Luz Gonçalves Pedreira M. Ultrasonography-guided peripheral intravenous access in children: a randomized controlled trial. J Infus Nurs. 2015;38(5):320‐327. https://doi.org/10.1097/NAN.0000000000000126
40. Vinograd AM, Chen AE, Woodford AL, et al. Ultrasonographic guidance to improve first-attempt success in children with predicted difficult intravenous access in the emergency department: a randomized controlled trial. Ann Emerg Med. 2019;74(1):19-27. https://doi.org/10.1016/j.annemergmed.2019.02.019
41. Kim MJ, Park JM, Rhee N, et al. Efficacy of VeinViewer in pediatric peripheral intravenous access: a randomized controlled trial. Eur J Pediatr. 2012;171(7):1121-1125. https://doi.org/10.1007/s00431-012-1713-9
42. Kaddoum RN, Anghelescu DL, et al. A randomized controlled trial comparing the AccuVein AV300 device to standard insertion technique for intravenous cannulation of anesthetized children. Paediatr Anaesth. 2012;22(9):884-889. https://doi.org/10.1111/j.1460-9592.2012.03896.x
43. Inal S, Demir D. Impact of peripheral venous catheter placement with vein visualization device support on success rate and pain levels in pediatric patients aged 0 to 3 years. Pediatr Emerg Care. 2021;37(3):138-144. https://doi.org/10.1097/PEC.0000000000001493
44. Demir D, Inal S. Does the use of a vein visualization device for peripheral venous catheter placement increase success rate in pediatric patients? Pediatr Emerg Care. 2019;35(7):474-479. https://doi.org/10.1097/PEC.0000000000001007
45. Gümüs M, Basbakkal Z. Efficacy of Veinlite PEDI in pediatric peripheral intravenous access: a randomized controlled trial. Pediatr Emerg Care. 2021;37(3):145-149. https://doi.org/10.1097/PEC.0000000000001515
46. Qin KR, Ensor N, Barnes R, Englin A, Nataraja RM, Pacilli M. Standard versus long peripheral catheters for multiday IV therapy: a randomized controlled trial. Pediatrics. 2021;147(2): e2020000877. https://doi.org/10.1542/peds.2020-000877
47. van Loon FHJ, Buise MP, Claassen JJF, Dierick-van Daele ATM, Bouwman ARA. Comparison of ultrasound guidance with palpation and direct visualisation for peripheral vein cannulation in adult patients: a systematic review and meta-analysis. Br J Anaesth. 2018;121(2):358-366. https://doi.org/10.1016/j.bja.2018.04.047
48. Parker SIA, Benzies KM, Hayden KA. A systematic review: effectiveness of pediatric peripheral intravenous catheterization strategies. J Adv Nurs. 2017;73(7):1570-1582. https://doi.org/10.1111/jan.13211
© 2021 Society of Hospital Medicine
Responsibilities and Interests of Pediatricians Practicing Hospital Medicine in the United States
As one of the youngest fields of pediatric practice in the United States, pediatric hospital medicine (PHM) has grown rapidly over the past 2 decades. Approximately 10% of recent graduates from pediatric residency programs in the United States have entered PHM, with two-thirds reporting an intention to remain as hospitalists long term.1,2
In October 2016, the American Board of Medical Specialties (ABMS) approved a petition for PHM to become the newest pediatric subspecialty.3 The application for subspeciality status, led by the Joint Council of Pediatric Hospital Medicine, articulated that subspecialty certification would more clearly define subspecialty hospitalists’ scope of practice, create a “new and larger cadre” of quality improvement (QI) experts, and strengthen opportunities for professional development related to child health safety within healthcare systems.4 Approximately 1500 pediatric hospitalists sat for the first PHM board-certification exam in November 2019, illustrating broad interest and commitment to this subspecialty.5
Characterizing the current responsibilities, practice settings, and professional interests of pediatric hospitalists is critical to understanding the continued development of the field. However, the most recent national survey of pediatric hospitalists’ roles and responsibilities was conducted more than a decade ago, and shared definitions of what constitutes PHM across institutions are lacking.6 Furthermore, studies suggest wide variability in PHM workload.7-9 We therefore aimed to describe the characteristics, responsibilities, and practice settings of pediatricians who reported practicing PHM in the United States and determine how exclusive PHM practice, compared with PHM practice in combination with primary or subspecialty care, was associated with professional responsibilities and interests. We hypothesized that those reporting exclusive PHM practice would be more likely to report interest in QI leadership and intention to take the PHM certifying exam than those practicing PHM in combination with primary or subspecialty care.
METHODS
Participants and Survey
Pediatricians enrolling in the American Board of Pediatrics (ABP) Maintenance of Certification (MOC) program in 2017 and 2018 were asked to complete a voluntary survey about their professional roles and scope of practice (Appendix Methods). The survey, offered to all MOC enrollees, included a hospital medicine module administered to those reporting PHM practice, given the ABP’s interest in characterizing PHM roles, responsibilities, practice settings, and interests in QI. Respondents were excluded if they were practicing outside of the United States, if they were unemployed or in a volunteer position, or if they were in fellowship training.
To ascertain areas of clinical practice, respondents were provided with a list of clinical practice areas and asked, “In which of the following areas are you practicing?” Those selecting “hospital medicine” were classified as self-identified hospitalists (hereafter, “hospitalists”). Given variation across institutions in physician roles and responsibilities, we stratified hospitalists into three groups: (1) exclusive PHM practice, representing those who reported PHM as their only area of practice; (2) PHM in combination with general pediatrics, representing those who reported practicing PHM and general pediatrics; and (3) PHM in combination with other subspecialties, representing those who reported practicing PHM in addition to one or more subspecialties. Respondents who reported practicing hospital medicine, general pediatrics, and another subspecialty were classified in the subspecialty group. The ABP’s institutional review board of record deemed the survey exempt from human subjects review.
Hospitalist Characteristics and Clinical Roles
To characterize respondents, we examined their age, gender, medical school location (American medical school or international medical school), and survey year (2017 or 2018). We also examined the following practice characteristics: US Census region, part-time versus full-time employment, academic appointment (yes or no), proportion of time spent providing direct and/or consultative patient care and fulfilling nonclinical responsibilities (research, administration, medical education, and QI), hospital setting (children’s hospital, community hospital, or mix of these hospital types), and work schedule type (shift schedule, on-service work in blocks, or a combination of shift and block schedules).
To examine variation in clinical roles, we determined the proportion of total direct and/or consultative clinical care that was spent in each of the following areas: (1) inpatient pediatric care, defined as inpatient general or subspecialty care in patients up to 21 years of age; (2) neonatal care, defined as labor and delivery, inpatient normal newborn care, and/or neonatal intensive care; (3) outpatient practice, defined as outpatient general or subspecialty care in patients up to 21 years of age; (4) emergency department care; and (5) other, which included pediatric intensive care as well inpatient adult care. Recognizing that scope of practice may differ at community hospitals and children’s hospitals, we stratified this analysis by practice setting (children’s hospital, community hospital).
Dependent Variables
We examined four dependent variables, two that were hypothesis driven and two that were exploratory. To test our hypothesis that respondents practicing PHM exclusively would be more likely to report interest in QI leadership or consultation (given the emphasis on QI in the ABMS application for subspecialty status), we examined the frequency with which respondents endorsed being “somewhat interested” or “very interested” in “serving as a leader or consultant for QI activities.” To test our hypothesis that respondents practicing PHM exclusively would be more likely to report plans to take the PHM certifying exam, we noted the frequency with which respondents reported “yes” to the question, “Do you plan to take a certifying exam in hospitalist medicine when it becomes available?” As an exploratory outcome, we examined satisfaction with allocation of professional time, available on the 2017 survey only; satisfaction was defined as an affirmative response to the question, “Is the allocation of your total professional time approximately what you wanted in your current position?” Finally, intention to maintain more than one ABP certification, also reported only in 2017 and examined as an exploratory outcome, was defined as a reported intention to maintain more than one ABP certification, including general pediatrics, PHM, or any other subspecialty.
Statistical Analysis
We used chi-square tests and analysis of variance as appropriate to examine differences in sociodemographic and professional characteristics among respondents who reported exclusive PHM practice, PHM in combination with general pediatrics, and PHM in combination with another subspecialty. To examine differences across the three PHM groups in their allocation of time to various clinical responsibilities (eg, inpatient care, newborn care), we used Kruskal-Wallis equality-of-population rank tests, stratifying by hospital type. We used multivariable logistic regression to identify associations between exclusive PHM practice and our four dependent variables, adjusting for the sociodemographic and professional characteristics described above. All analyses were conducted using Stata 15 (StataCorp LLC), using two-sided tests, and defining P < .05 as statistically significant.
RESULTS
Study Sample
Of the 19,763 pediatricians enrolling in MOC in 2017 and 2018, 13,839 responded the survey, representing a response rate of 70.0%. There were no significant differences between survey respondents and nonrespondents with respect to gender; differences between respondents and nonrespondents in age, medical school location, and initial year of ABP certification year were small (mean age, 48.1 years and 47.1 years, respectively [P < .01]; 77.0% of respondents were graduates of US medical schools compared with 73.7% of nonrespondents [P < .01]; mean certification year for respondents was 2003 compared with 2004 for nonrespondents [P < .01]). After applying the described exclusion criteria, 1662 of 12,665 respondents self-identified as hospitalists, reflecting 13.1% of the sample and the focus of this analysis (Appendix Figure).
Participant Characteristics and Areas of Practice
Of 1662 self-identified hospitalists, 881 (53.0%) also reported practicing general pediatrics, and 653 (39.3%) also reported practicing at least one subspecialty in addition to PHM. The most frequently reported additional subspecialty practice areas included: (1) neonatology (n = 155, 9.3%); (2) adolescent medicine (n = 138, 8.3%); (3) pediatric critical care (n = 89, 5.4%); (4) pediatric emergency medicine (n = 80, 4.8%); and (5) medicine-pediatrics (n = 30, 4.7%, asked only on the 2018 survey). When stratified into mutually exclusive groups, 491 respondents (29.5%) identified as practicing PHM exclusively, 518 (31.2%) identified as practicing PHM in combination with general pediatrics, and 653 (39.3%) identified as practicing PHM in combination with one or more other subspecialties.
Table 1 summarizes the characteristics of respondents in these three groups. Respondents reporting exclusive PHM practice were, on average, younger, more likely to be female, and more likely to be graduates of US medical schools than those reporting PHM in combination with general or subspecialty pediatrics. In total, approximately two-thirds of the sample (n = 1068, 64.3%) reported holding an academic appointment, including 72.9% (n = 358) of those reporting exclusive PHM practice compared with 56.9% (n = 295) of those also reporting general pediatrics and 63.6% (n = 415) of those also reporting subspecialty care (P < .001). Respondents who reported practicing PHM exclusively most frequently worked at children’s hospitals (64.6%, n = 317), compared with 40.0% (n = 207) and 42.1% (n = 275) of those practicing PHM in combination with general and subspecialty pediatrics, respectively (P < .001).
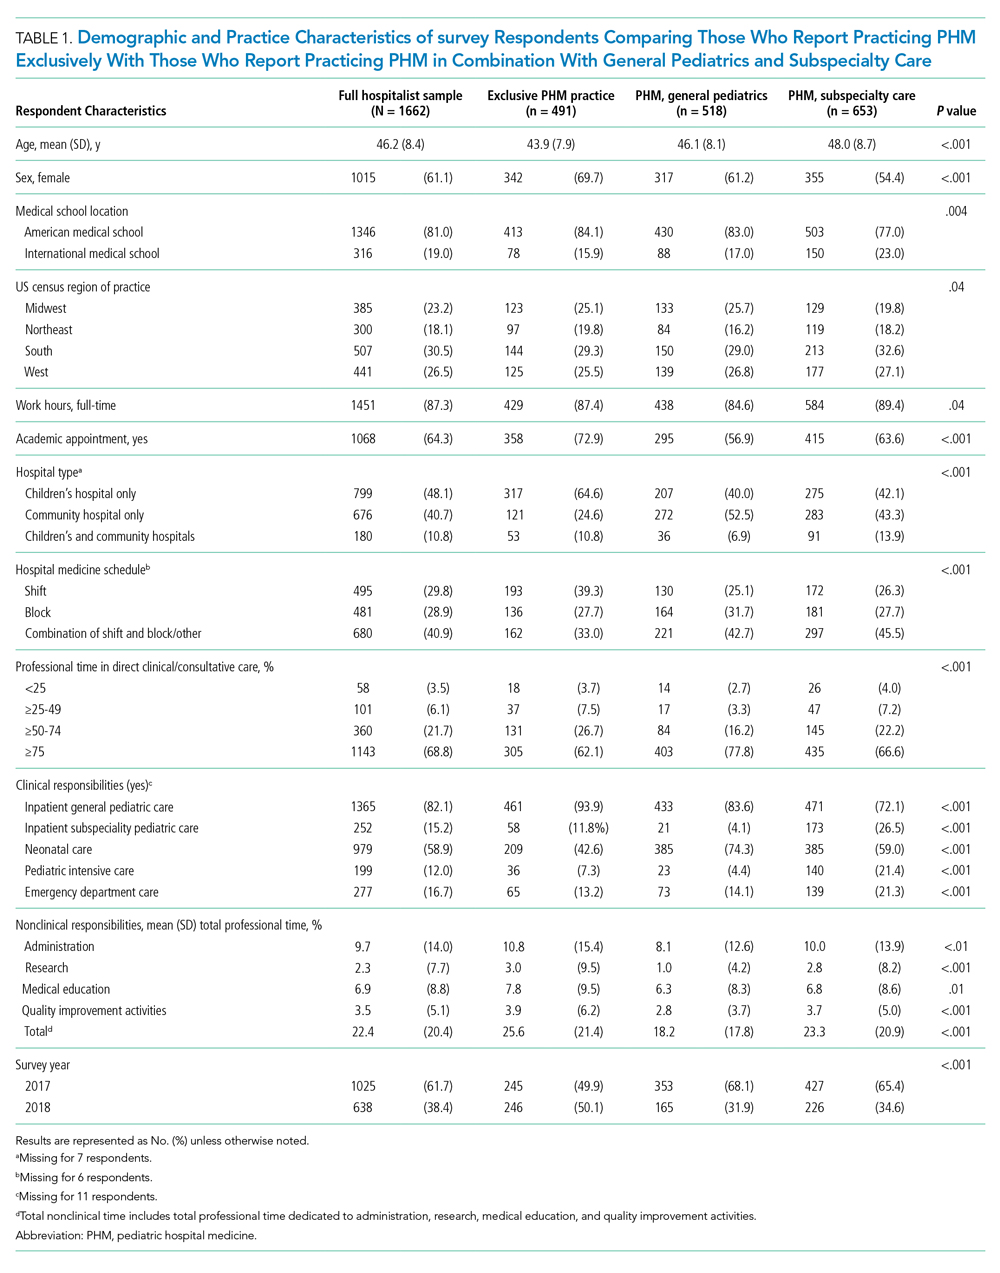
Clinical and Nonclinical Roles and Responsibilities
The majority of respondents reported that they spent >75% of their professional time in direct clinical or consultative care, including 62.1% (n = 305) of those reporting PHM exclusively and 77.8% (n = 403) and 66.6% (n = 435) of those reporting PHM with general and subspecialty pediatrics, respectively (P < .001). Overall, <10% reported spending less than 50% of their time proving direct patient care, including 11.2% (n = 55) of those reporting exclusive PHM practice, 11.2% (n = 73) reporting PHM in combination with a subspecialty, and 6% (n = 31) in combination with general pediatrics. The mean proportion of time spent in nonclinical roles was 22.4% (SD, 20.4%), and the mean proportions of time spent in any one area (administration, research, education, or QI) were all <10%.
The proportion of time allocated to inpatient pediatric care, neonatal care, emergency care, and outpatient pediatric care varied substantially across PHM practice groups and settings. Among respondents who practiced at children’s hospitals, the median percentage of clinical time dedicated to inpatient pediatric care was 66.5% (interquartile range [IQR], 15%-100%), with neonatal care being the second most common clinical practice area (Figure, part A; Appendix Table). At community hospitals, the percentage of clinical time dedicated to inpatient pediatric care was lower, with a median of 10% (IQR, 3%-40%) (Figure, part B). Among those reporting exclusive PHM practice, the median proportion of clinical time spent delivering inpatient pediatric care was 100% (IQR, 80%-100%) at children’s hospitals and 40% (IQR, 20%-85%) at community hospitals. At community hospitals, neonatal care accounted for a similar proportion of clinical time as inpatient pediatric care for these respondents (median, 40% [IQR, 0%-70%]). With the exception of emergency room care, we observed significant differences in how clinical time was allocated by respondents reporting exclusive PHM practice compared with those reporting PHM in combination with general or specialty care (all P values < .001, Appendix Table).

Professional Development Interests
Approximately two-thirds of respondents reported interest in QI leadership or consultation (Table 2), with those reporting exclusive PHM practice significantly more likely to report this (70.3% [n = 345] compared with 57.7% [n = 297] of those practicing PHM with general pediatrics and 66.3% [n = 431] of those practicing PHM with another subspecialty, P < .001). Similarly, 69% (n = 339) of respondents who reported exclusive PHM practice described an intention to take the PHM certifying examination, compared with 20.4% (n = 105) of those practicing PHM and general pediatrics and 17.7% (n = 115) of those practicing PHM and subspeciality pediatrics (P < .001). A total of 82.5% (n = 846) of respondents reported that they were satisfied with the allocation of their professional time; there were no significant differences between those reporting exclusive PHM practice and those reporting PHM in combination with general or subspecialty pediatrics. Of hospitalists reporting exclusive PHM practice, 67.8% (n = 166) reported an intention to maintain more than one ABP certification, compared with 22.1% (n = 78) of those practicing PHM and general pediatrics and 53.9% (n = 230) of those practicing PHM and subspecialty pediatrics (P < .001).
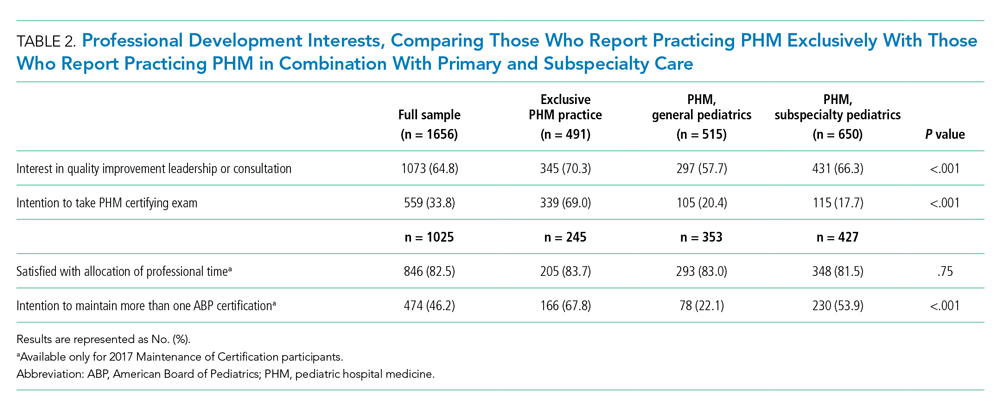
In multivariate regression analyses, hospitalists reporting exclusive PHM practice had significantly greater odds of reported interest in QI leadership or consultation (adjusted odds ratio [OR], 1.39; 95% CI, 1.09-1.79), intention to take the PHM certifying exam (adjusted OR, 7.10; 95% CI, 5.45-9.25), and intention to maintain more than one ABP certification (adjusted OR, 2.64; 95% CI, 1.89-3.68) than those practicing PHM in combination with general or subspecialty pediatrics (Table 3). There was no significant difference across the three groups in the satisfaction with the allocation of professional time.
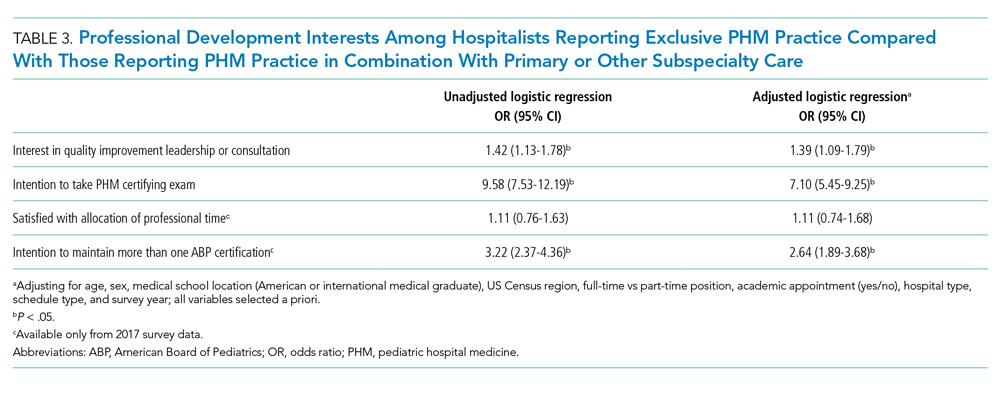
DISCUSSION
In this national survey of pediatricians seeking MOC from the ABP, 13.1% reported that they practiced hospital medicine, with approximately one-third of these individuals reporting that they practiced PHM exclusively. The distribution of clinical and nonclinical responsibilities differed across those reporting exclusive PHM practice relative to those practicing PHM in combination with general or subspecialty pediatrics. Relative to hospitalists who reported practicing PHM in addition to general or subspecialty care, those reporting exclusive PHM practice were significantly more likely to report an interest in QI leadership or consultation, intention to sit for the PHM board-certification exam, and intention to maintain more than one ABP certification.
These findings offer insight into the evolution of PHM and have important implications for workforce planning. The last nationally representative analysis of the PHM workforce was conducted in 2006, at which time 73% of hospitalists reported working at children’s hospitals.6 In the current analysis, less than 50% of hospitalists reported practicing PHM at children’s hospitals only; 10% reported working at both children’s hospitals and community hospitals and 40% at community hospitals alone. This diffusion of PHM from children’s hospitals into community hospitals represents an important development in the field and aligns with the epidemiology of pediatric hospitalization.10 Pediatric hospitalists who practice at community hospitals experience unique challenges, including a relative paucity of pediatric-specific clinical resources, limited mentorship opportunities and resources for scholarly work, and limited access to data from which to prioritize QI interventions.11,12 Our findings also illustrate that the scope of practice for hospitalists differs at community hospitals relative to children’s hospitals. Although the PHM fellowship curriculum requires training at a community hospital, the requirement is limited to one 4-week block, which may not provide sufficient preparation for the unique clinical responsibilities in this setting.13,14
Relative to past analyses of PHM workforce roles and responsibilities, a substantially greater proportion of respondents in the current study reported clinical responsibility for neonatal care, including more than 40% of those self-reporting practicing PHM exclusively and almost three-quarters of those self-reporting PHM in conjunction with general pediatrics.6,15 Given that more than half of the six million US pediatric hospitalizations that occur each year represent birth hospitalizations,16 pediatric hospitalists’ responsibilities for newborn care are consistent with these patterns of hospital-based care. Expanding hospitalists’ responsibilities to provide newborn care has also been shown to improve the financial performance of PHM programs with relatively low pediatric volumes, which may further explain this finding, particularly at community hospitals.17,18 Interestingly, although emergency department care has also been demonstrated as a model to improve the financial stability of PHM programs, relatively few hospitalists reported this as an area of clinical responsibility.19,20 This finding contrasts with past analyses and may reflect how the scope of PHM clinical responsibilities has changed since these prior studies were conducted.6,15
Because PHM had not been recognized as a subspecialty prior to 2016, a national count of pediatric hospitalists is lacking. In this study, approximately one in eight pediatricians reported that they practiced PHM, but less than 4% of the survey sample reported practicing PHM exclusively. Based on these results, we estimate that of the 76,214 to 89,608 ABP-certified pediatricians currently practicing in the United States, between 9984 and 11,738 would self-identify as practicing PHM, with between 2945 and 3462 reporting exclusive PHM practice.
Hospitalists who reported practicing PHM exclusively were significantly more likely to report an interest in QI leadership or consultation and plans to take the PHM certifying exam. These findings are consistent with PHM’s focus on QI, as articulated in the application to the ABMS for subspecialty status as well as the PHM Core Competencies and fellowship curriculum.4,13,21,22 Despite past research questioning the sustainability of some community- and university-based PHM programs and wide variability in workload,7-9 more than 80% of hospitalists reported satisfaction with the allocation of their professional time, with no significant differences between respondents practicing PHM exclusively or in combination with general or subspecialty care.
This analysis should be interpreted in light of its strengths and limitations. Strengths of this work include its national focus, large sample size, and comprehensive characterization of respondents’ professional roles and characteristics. Study limitations include the fact that respondents were classified as hospitalists based on self-report; we were unable to ascertain if they were classified as hospitalists at their place of employment or if they met the ABP’s eligibility criteria to sit for the PHM subspecialty certifying exam.19 Additionally, respondents self-reported their allocations of clinical and nonclinical time, and we are unable to correlate this with actual work hours. Respondents’ reported interest in QI leadership or consultation may not be correlated with QI effort in practice; the mean time reportedly dedicated to QI activities was quite low. Additionally, two of our outcomes were available only for respondents who enrolled in MOC in 2017, and the proportion practicing medicine-pediatrics was available only in 2018. Although this analysis represents approximately 40% of all pediatricians enrolling in MOC (2 years of the 5-year MOC cycle), it may not be representative of pediatricians who are not certified by the ABP. Finally, our outcomes related to board certification examined interest and intentions; future study will be needed to determine how many pediatricians take the PHM exam and maintain certification.
In conclusion, the field of PHM has evolved considerably since its inception, with pediatric hospitalists reporting diverse clinical and nonclinical responsibilities. Hospitalists practicing PHM exclusively were more likely to report an interest in QI leadership and intent to sit for the PHM certifying exam than those practicing PHM in combination with general pediatrics or another specialty. Continuing to monitor the evolution of PHM roles and responsibilities over time and across settings will be important to support the professional development needs of the PHM workforce.
1. House S, Frintner MP, Leyenaar JK. Factors influencing career longevity in pediatric hospital medicine. Hosp Pediatr. 2019;9(12):983-988. https://doi.org/10.1542/hpeds.2019-0151
2. Leyenaar JK, Frintner MP. Graduating pediatric residents entering the hospital medicine workforce, 2006-2015. Acad Pediatr. 2018;18(2):200-207. https://doi.org/10.1016/j.acap.2017.05.001
3. The American Board of Pediatrics. ABMS approves pediatric hospital medicine certification. November 8, 2016. Accessed October 12, 2021. https://www.abp.org/news/abms-approves-pediatric-hospital-medicine-certification
4. American Board of Medical Specialities. Application for a new subspecialty certificate: pediatric hospital medicine.
5. American Board of Pediatrics. 2019 Annual Report. Accessed October 12, 2021. https://www.abp.org/sites/abp/files/pdf/annual-report-2019.pdf
6. Freed GL, Dunham KM, Research Advisory Committee of the American Board of Pediatrics. Pediatric hospitalists: training, current practice, and career goals. J Hosp Med. 2009;4(3):179-186. https://doi.org/10.1002/jhm.458
7. Alvarez F, McDaniel CE, Birnie K, et al. Community pediatric hospitalist workload: results from a national survey. J Hosp Med. 2019;14(11):682-685. https://doi.org/10.12788/jhm.3263
8. Fromme HB, Chen CO, Fine BR, Gosdin C, Shaughnessy EE. Pediatric hospitalist workload and sustainability in university-based programs: results from a national interview-based survey. J Hosp Med. 2018;13(10):702-705. https://doi.org/10.12788/jhm.2977
9. Gosdin C, Simmons J, Yau C, Sucharew H, Carlson D, Paciorkowski N. Survey of academic pediatric hospitalist programs in the US: organizational, administrative, and financial factors. J Hosp Med. 2013;8(6):285-291. https://doi.org/10.1002/jhm.2020
10. Leyenaar JK, Ralston SL, Shieh MS, Pekow PS, Mangione-Smith R, Lindenauer PK. Epidemiology of pediatric hospitalizations at general hospitals and freestanding children’s hospitals in the United States. J Hosp Med. 2016;11(11):743-749. https://doi.org/10.1002/jhm.2624
11. Leary JC, Walsh KE, Morin RA, Schainker EG, Leyenaar JK. Quality and safety of pediatric inpatient care in community hospitals: a scoping review. J Hosp Med. 2019;14:694-703. https://doi.org/10.12788/jhm.3268
12. Leyenaar JK, Capra LA, O’Brien ER, Leslie LK, Mackie TI. Determinants of career satisfaction among pediatric hospitalists: a qualitative exploration. Acad Pediatr. 2014;14(4):361-368. https://doi.org/10.1016/j.acap.2014.03.015
13. Jerardi KE, Fisher E, Rassbach C, et al. Development of a curricular framework for pediatric hospital medicine fellowships. Pediatrics. 2017;140(1):e20170698. https://doi.org/10.1542/peds.2017-0698
14. ACGME Program Requirements for Graduate Medical Education in Pediatric Hospital Medicine. July 1, 2021. Accessed October 4, 2021.https://www.acgme.org/globalassets/PFAssets/ProgramRequirements/334_PediatricHospitalMedicine_2020.pdf?ver=2020-06-29-163350-910&ver=2020-06-29-163350-910
15. Freed GL, Brzoznowski K, Neighbors K, Lakhani I, American Board of Pediatrics, Research Advisory Committee. Characteristics of the pediatric hospitalist workforce: its roles and work environment. Pediatrics. 2007;120(1):33-39. https://doi.org/10.1542/peds.2007-0304
16. Moore B, Freeman W, Jiang H. Costs of Pediatric Hospital Stays, 2016. Healthcare Cost and Utilization Project Statistical Brief #250. Accessed October 25, 2021. https://www.ncbi.nlm.nih.gov/books/NBK547762/
17. Carlson DW, Fentzke KM, Dawson JG. Pediatric hospitalists: fill varied roles in the care of newborns. Pediatr Ann. 2003;32(12):802-810. https://doi.org/10.3928/0090-4481-20031201-09
18. Tieder JS, Migita DS, Cowan CA, Melzer SM. Newborn care by pediatric hospitalists in a community hospital: effect on physician productivity and financial performance. Arch Pediatr Adolesc Med. 2008;162(1):74-78. https://doi.org/10.1001/archpediatrics.2007.15
19. Krugman SD, Suggs A, Photowala HY, Beck A. Redefining the community pediatric hospitalist: the combined pediatric ED/inpatient unit. Pediatr Emerg Care. 2007;23(1):33-37. https://doi.org/10.1097/01.pec.0000248685.94647.01
20. Dudas RA, Monroe D, McColligan Borger M. Community pediatric hospitalists providing care in the emergency department: an analysis of physician productivity and financial performance. Pediatr Emerg Care. 2011;27(11):1099-1103. https://doi.org/10.1097/PEC.0b013e31823606f5
21. Stucky ER, Ottolini MC, Maniscalco J. Pediatric hospital medicine core competencies: development and methodology. J Hosp Med. 2010;5(6):339-343. https://doi.org/10.1002/jhm.843
22. Maniscalco J, Gage S, Teferi S, Fisher ES. The Pediatric Hospital Medicine Core Competencies: 2020 revision. J Hosp Med. 2020;15(7):389-394. https://doi.org/10.12788/jhm.3391
As one of the youngest fields of pediatric practice in the United States, pediatric hospital medicine (PHM) has grown rapidly over the past 2 decades. Approximately 10% of recent graduates from pediatric residency programs in the United States have entered PHM, with two-thirds reporting an intention to remain as hospitalists long term.1,2
In October 2016, the American Board of Medical Specialties (ABMS) approved a petition for PHM to become the newest pediatric subspecialty.3 The application for subspeciality status, led by the Joint Council of Pediatric Hospital Medicine, articulated that subspecialty certification would more clearly define subspecialty hospitalists’ scope of practice, create a “new and larger cadre” of quality improvement (QI) experts, and strengthen opportunities for professional development related to child health safety within healthcare systems.4 Approximately 1500 pediatric hospitalists sat for the first PHM board-certification exam in November 2019, illustrating broad interest and commitment to this subspecialty.5
Characterizing the current responsibilities, practice settings, and professional interests of pediatric hospitalists is critical to understanding the continued development of the field. However, the most recent national survey of pediatric hospitalists’ roles and responsibilities was conducted more than a decade ago, and shared definitions of what constitutes PHM across institutions are lacking.6 Furthermore, studies suggest wide variability in PHM workload.7-9 We therefore aimed to describe the characteristics, responsibilities, and practice settings of pediatricians who reported practicing PHM in the United States and determine how exclusive PHM practice, compared with PHM practice in combination with primary or subspecialty care, was associated with professional responsibilities and interests. We hypothesized that those reporting exclusive PHM practice would be more likely to report interest in QI leadership and intention to take the PHM certifying exam than those practicing PHM in combination with primary or subspecialty care.
METHODS
Participants and Survey
Pediatricians enrolling in the American Board of Pediatrics (ABP) Maintenance of Certification (MOC) program in 2017 and 2018 were asked to complete a voluntary survey about their professional roles and scope of practice (Appendix Methods). The survey, offered to all MOC enrollees, included a hospital medicine module administered to those reporting PHM practice, given the ABP’s interest in characterizing PHM roles, responsibilities, practice settings, and interests in QI. Respondents were excluded if they were practicing outside of the United States, if they were unemployed or in a volunteer position, or if they were in fellowship training.
To ascertain areas of clinical practice, respondents were provided with a list of clinical practice areas and asked, “In which of the following areas are you practicing?” Those selecting “hospital medicine” were classified as self-identified hospitalists (hereafter, “hospitalists”). Given variation across institutions in physician roles and responsibilities, we stratified hospitalists into three groups: (1) exclusive PHM practice, representing those who reported PHM as their only area of practice; (2) PHM in combination with general pediatrics, representing those who reported practicing PHM and general pediatrics; and (3) PHM in combination with other subspecialties, representing those who reported practicing PHM in addition to one or more subspecialties. Respondents who reported practicing hospital medicine, general pediatrics, and another subspecialty were classified in the subspecialty group. The ABP’s institutional review board of record deemed the survey exempt from human subjects review.
Hospitalist Characteristics and Clinical Roles
To characterize respondents, we examined their age, gender, medical school location (American medical school or international medical school), and survey year (2017 or 2018). We also examined the following practice characteristics: US Census region, part-time versus full-time employment, academic appointment (yes or no), proportion of time spent providing direct and/or consultative patient care and fulfilling nonclinical responsibilities (research, administration, medical education, and QI), hospital setting (children’s hospital, community hospital, or mix of these hospital types), and work schedule type (shift schedule, on-service work in blocks, or a combination of shift and block schedules).
To examine variation in clinical roles, we determined the proportion of total direct and/or consultative clinical care that was spent in each of the following areas: (1) inpatient pediatric care, defined as inpatient general or subspecialty care in patients up to 21 years of age; (2) neonatal care, defined as labor and delivery, inpatient normal newborn care, and/or neonatal intensive care; (3) outpatient practice, defined as outpatient general or subspecialty care in patients up to 21 years of age; (4) emergency department care; and (5) other, which included pediatric intensive care as well inpatient adult care. Recognizing that scope of practice may differ at community hospitals and children’s hospitals, we stratified this analysis by practice setting (children’s hospital, community hospital).
Dependent Variables
We examined four dependent variables, two that were hypothesis driven and two that were exploratory. To test our hypothesis that respondents practicing PHM exclusively would be more likely to report interest in QI leadership or consultation (given the emphasis on QI in the ABMS application for subspecialty status), we examined the frequency with which respondents endorsed being “somewhat interested” or “very interested” in “serving as a leader or consultant for QI activities.” To test our hypothesis that respondents practicing PHM exclusively would be more likely to report plans to take the PHM certifying exam, we noted the frequency with which respondents reported “yes” to the question, “Do you plan to take a certifying exam in hospitalist medicine when it becomes available?” As an exploratory outcome, we examined satisfaction with allocation of professional time, available on the 2017 survey only; satisfaction was defined as an affirmative response to the question, “Is the allocation of your total professional time approximately what you wanted in your current position?” Finally, intention to maintain more than one ABP certification, also reported only in 2017 and examined as an exploratory outcome, was defined as a reported intention to maintain more than one ABP certification, including general pediatrics, PHM, or any other subspecialty.
Statistical Analysis
We used chi-square tests and analysis of variance as appropriate to examine differences in sociodemographic and professional characteristics among respondents who reported exclusive PHM practice, PHM in combination with general pediatrics, and PHM in combination with another subspecialty. To examine differences across the three PHM groups in their allocation of time to various clinical responsibilities (eg, inpatient care, newborn care), we used Kruskal-Wallis equality-of-population rank tests, stratifying by hospital type. We used multivariable logistic regression to identify associations between exclusive PHM practice and our four dependent variables, adjusting for the sociodemographic and professional characteristics described above. All analyses were conducted using Stata 15 (StataCorp LLC), using two-sided tests, and defining P < .05 as statistically significant.
RESULTS
Study Sample
Of the 19,763 pediatricians enrolling in MOC in 2017 and 2018, 13,839 responded the survey, representing a response rate of 70.0%. There were no significant differences between survey respondents and nonrespondents with respect to gender; differences between respondents and nonrespondents in age, medical school location, and initial year of ABP certification year were small (mean age, 48.1 years and 47.1 years, respectively [P < .01]; 77.0% of respondents were graduates of US medical schools compared with 73.7% of nonrespondents [P < .01]; mean certification year for respondents was 2003 compared with 2004 for nonrespondents [P < .01]). After applying the described exclusion criteria, 1662 of 12,665 respondents self-identified as hospitalists, reflecting 13.1% of the sample and the focus of this analysis (Appendix Figure).
Participant Characteristics and Areas of Practice
Of 1662 self-identified hospitalists, 881 (53.0%) also reported practicing general pediatrics, and 653 (39.3%) also reported practicing at least one subspecialty in addition to PHM. The most frequently reported additional subspecialty practice areas included: (1) neonatology (n = 155, 9.3%); (2) adolescent medicine (n = 138, 8.3%); (3) pediatric critical care (n = 89, 5.4%); (4) pediatric emergency medicine (n = 80, 4.8%); and (5) medicine-pediatrics (n = 30, 4.7%, asked only on the 2018 survey). When stratified into mutually exclusive groups, 491 respondents (29.5%) identified as practicing PHM exclusively, 518 (31.2%) identified as practicing PHM in combination with general pediatrics, and 653 (39.3%) identified as practicing PHM in combination with one or more other subspecialties.
Table 1 summarizes the characteristics of respondents in these three groups. Respondents reporting exclusive PHM practice were, on average, younger, more likely to be female, and more likely to be graduates of US medical schools than those reporting PHM in combination with general or subspecialty pediatrics. In total, approximately two-thirds of the sample (n = 1068, 64.3%) reported holding an academic appointment, including 72.9% (n = 358) of those reporting exclusive PHM practice compared with 56.9% (n = 295) of those also reporting general pediatrics and 63.6% (n = 415) of those also reporting subspecialty care (P < .001). Respondents who reported practicing PHM exclusively most frequently worked at children’s hospitals (64.6%, n = 317), compared with 40.0% (n = 207) and 42.1% (n = 275) of those practicing PHM in combination with general and subspecialty pediatrics, respectively (P < .001).
Clinical and Nonclinical Roles and Responsibilities
The majority of respondents reported that they spent >75% of their professional time in direct clinical or consultative care, including 62.1% (n = 305) of those reporting PHM exclusively and 77.8% (n = 403) and 66.6% (n = 435) of those reporting PHM with general and subspecialty pediatrics, respectively (P < .001). Overall, <10% reported spending less than 50% of their time proving direct patient care, including 11.2% (n = 55) of those reporting exclusive PHM practice, 11.2% (n = 73) reporting PHM in combination with a subspecialty, and 6% (n = 31) in combination with general pediatrics. The mean proportion of time spent in nonclinical roles was 22.4% (SD, 20.4%), and the mean proportions of time spent in any one area (administration, research, education, or QI) were all <10%.
The proportion of time allocated to inpatient pediatric care, neonatal care, emergency care, and outpatient pediatric care varied substantially across PHM practice groups and settings. Among respondents who practiced at children’s hospitals, the median percentage of clinical time dedicated to inpatient pediatric care was 66.5% (interquartile range [IQR], 15%-100%), with neonatal care being the second most common clinical practice area (Figure, part A; Appendix Table). At community hospitals, the percentage of clinical time dedicated to inpatient pediatric care was lower, with a median of 10% (IQR, 3%-40%) (Figure, part B). Among those reporting exclusive PHM practice, the median proportion of clinical time spent delivering inpatient pediatric care was 100% (IQR, 80%-100%) at children’s hospitals and 40% (IQR, 20%-85%) at community hospitals. At community hospitals, neonatal care accounted for a similar proportion of clinical time as inpatient pediatric care for these respondents (median, 40% [IQR, 0%-70%]). With the exception of emergency room care, we observed significant differences in how clinical time was allocated by respondents reporting exclusive PHM practice compared with those reporting PHM in combination with general or specialty care (all P values < .001, Appendix Table).
Professional Development Interests
Approximately two-thirds of respondents reported interest in QI leadership or consultation (Table 2), with those reporting exclusive PHM practice significantly more likely to report this (70.3% [n = 345] compared with 57.7% [n = 297] of those practicing PHM with general pediatrics and 66.3% [n = 431] of those practicing PHM with another subspecialty, P < .001). Similarly, 69% (n = 339) of respondents who reported exclusive PHM practice described an intention to take the PHM certifying examination, compared with 20.4% (n = 105) of those practicing PHM and general pediatrics and 17.7% (n = 115) of those practicing PHM and subspeciality pediatrics (P < .001). A total of 82.5% (n = 846) of respondents reported that they were satisfied with the allocation of their professional time; there were no significant differences between those reporting exclusive PHM practice and those reporting PHM in combination with general or subspecialty pediatrics. Of hospitalists reporting exclusive PHM practice, 67.8% (n = 166) reported an intention to maintain more than one ABP certification, compared with 22.1% (n = 78) of those practicing PHM and general pediatrics and 53.9% (n = 230) of those practicing PHM and subspecialty pediatrics (P < .001).
In multivariate regression analyses, hospitalists reporting exclusive PHM practice had significantly greater odds of reported interest in QI leadership or consultation (adjusted odds ratio [OR], 1.39; 95% CI, 1.09-1.79), intention to take the PHM certifying exam (adjusted OR, 7.10; 95% CI, 5.45-9.25), and intention to maintain more than one ABP certification (adjusted OR, 2.64; 95% CI, 1.89-3.68) than those practicing PHM in combination with general or subspecialty pediatrics (Table 3). There was no significant difference across the three groups in the satisfaction with the allocation of professional time.
DISCUSSION
In this national survey of pediatricians seeking MOC from the ABP, 13.1% reported that they practiced hospital medicine, with approximately one-third of these individuals reporting that they practiced PHM exclusively. The distribution of clinical and nonclinical responsibilities differed across those reporting exclusive PHM practice relative to those practicing PHM in combination with general or subspecialty pediatrics. Relative to hospitalists who reported practicing PHM in addition to general or subspecialty care, those reporting exclusive PHM practice were significantly more likely to report an interest in QI leadership or consultation, intention to sit for the PHM board-certification exam, and intention to maintain more than one ABP certification.
These findings offer insight into the evolution of PHM and have important implications for workforce planning. The last nationally representative analysis of the PHM workforce was conducted in 2006, at which time 73% of hospitalists reported working at children’s hospitals.6 In the current analysis, less than 50% of hospitalists reported practicing PHM at children’s hospitals only; 10% reported working at both children’s hospitals and community hospitals and 40% at community hospitals alone. This diffusion of PHM from children’s hospitals into community hospitals represents an important development in the field and aligns with the epidemiology of pediatric hospitalization.10 Pediatric hospitalists who practice at community hospitals experience unique challenges, including a relative paucity of pediatric-specific clinical resources, limited mentorship opportunities and resources for scholarly work, and limited access to data from which to prioritize QI interventions.11,12 Our findings also illustrate that the scope of practice for hospitalists differs at community hospitals relative to children’s hospitals. Although the PHM fellowship curriculum requires training at a community hospital, the requirement is limited to one 4-week block, which may not provide sufficient preparation for the unique clinical responsibilities in this setting.13,14
Relative to past analyses of PHM workforce roles and responsibilities, a substantially greater proportion of respondents in the current study reported clinical responsibility for neonatal care, including more than 40% of those self-reporting practicing PHM exclusively and almost three-quarters of those self-reporting PHM in conjunction with general pediatrics.6,15 Given that more than half of the six million US pediatric hospitalizations that occur each year represent birth hospitalizations,16 pediatric hospitalists’ responsibilities for newborn care are consistent with these patterns of hospital-based care. Expanding hospitalists’ responsibilities to provide newborn care has also been shown to improve the financial performance of PHM programs with relatively low pediatric volumes, which may further explain this finding, particularly at community hospitals.17,18 Interestingly, although emergency department care has also been demonstrated as a model to improve the financial stability of PHM programs, relatively few hospitalists reported this as an area of clinical responsibility.19,20 This finding contrasts with past analyses and may reflect how the scope of PHM clinical responsibilities has changed since these prior studies were conducted.6,15
Because PHM had not been recognized as a subspecialty prior to 2016, a national count of pediatric hospitalists is lacking. In this study, approximately one in eight pediatricians reported that they practiced PHM, but less than 4% of the survey sample reported practicing PHM exclusively. Based on these results, we estimate that of the 76,214 to 89,608 ABP-certified pediatricians currently practicing in the United States, between 9984 and 11,738 would self-identify as practicing PHM, with between 2945 and 3462 reporting exclusive PHM practice.
Hospitalists who reported practicing PHM exclusively were significantly more likely to report an interest in QI leadership or consultation and plans to take the PHM certifying exam. These findings are consistent with PHM’s focus on QI, as articulated in the application to the ABMS for subspecialty status as well as the PHM Core Competencies and fellowship curriculum.4,13,21,22 Despite past research questioning the sustainability of some community- and university-based PHM programs and wide variability in workload,7-9 more than 80% of hospitalists reported satisfaction with the allocation of their professional time, with no significant differences between respondents practicing PHM exclusively or in combination with general or subspecialty care.
This analysis should be interpreted in light of its strengths and limitations. Strengths of this work include its national focus, large sample size, and comprehensive characterization of respondents’ professional roles and characteristics. Study limitations include the fact that respondents were classified as hospitalists based on self-report; we were unable to ascertain if they were classified as hospitalists at their place of employment or if they met the ABP’s eligibility criteria to sit for the PHM subspecialty certifying exam.19 Additionally, respondents self-reported their allocations of clinical and nonclinical time, and we are unable to correlate this with actual work hours. Respondents’ reported interest in QI leadership or consultation may not be correlated with QI effort in practice; the mean time reportedly dedicated to QI activities was quite low. Additionally, two of our outcomes were available only for respondents who enrolled in MOC in 2017, and the proportion practicing medicine-pediatrics was available only in 2018. Although this analysis represents approximately 40% of all pediatricians enrolling in MOC (2 years of the 5-year MOC cycle), it may not be representative of pediatricians who are not certified by the ABP. Finally, our outcomes related to board certification examined interest and intentions; future study will be needed to determine how many pediatricians take the PHM exam and maintain certification.
In conclusion, the field of PHM has evolved considerably since its inception, with pediatric hospitalists reporting diverse clinical and nonclinical responsibilities. Hospitalists practicing PHM exclusively were more likely to report an interest in QI leadership and intent to sit for the PHM certifying exam than those practicing PHM in combination with general pediatrics or another specialty. Continuing to monitor the evolution of PHM roles and responsibilities over time and across settings will be important to support the professional development needs of the PHM workforce.
1. House S, Frintner MP, Leyenaar JK. Factors influencing career longevity in pediatric hospital medicine. Hosp Pediatr. 2019;9(12):983-988. https://doi.org/10.1542/hpeds.2019-0151
2. Leyenaar JK, Frintner MP. Graduating pediatric residents entering the hospital medicine workforce, 2006-2015. Acad Pediatr. 2018;18(2):200-207. https://doi.org/10.1016/j.acap.2017.05.001
3. The American Board of Pediatrics. ABMS approves pediatric hospital medicine certification. November 8, 2016. Accessed October 12, 2021. https://www.abp.org/news/abms-approves-pediatric-hospital-medicine-certification
4. American Board of Medical Specialities. Application for a new subspecialty certificate: pediatric hospital medicine.
5. American Board of Pediatrics. 2019 Annual Report. Accessed October 12, 2021. https://www.abp.org/sites/abp/files/pdf/annual-report-2019.pdf
6. Freed GL, Dunham KM, Research Advisory Committee of the American Board of Pediatrics. Pediatric hospitalists: training, current practice, and career goals. J Hosp Med. 2009;4(3):179-186. https://doi.org/10.1002/jhm.458
7. Alvarez F, McDaniel CE, Birnie K, et al. Community pediatric hospitalist workload: results from a national survey. J Hosp Med. 2019;14(11):682-685. https://doi.org/10.12788/jhm.3263
8. Fromme HB, Chen CO, Fine BR, Gosdin C, Shaughnessy EE. Pediatric hospitalist workload and sustainability in university-based programs: results from a national interview-based survey. J Hosp Med. 2018;13(10):702-705. https://doi.org/10.12788/jhm.2977
9. Gosdin C, Simmons J, Yau C, Sucharew H, Carlson D, Paciorkowski N. Survey of academic pediatric hospitalist programs in the US: organizational, administrative, and financial factors. J Hosp Med. 2013;8(6):285-291. https://doi.org/10.1002/jhm.2020
10. Leyenaar JK, Ralston SL, Shieh MS, Pekow PS, Mangione-Smith R, Lindenauer PK. Epidemiology of pediatric hospitalizations at general hospitals and freestanding children’s hospitals in the United States. J Hosp Med. 2016;11(11):743-749. https://doi.org/10.1002/jhm.2624
11. Leary JC, Walsh KE, Morin RA, Schainker EG, Leyenaar JK. Quality and safety of pediatric inpatient care in community hospitals: a scoping review. J Hosp Med. 2019;14:694-703. https://doi.org/10.12788/jhm.3268
12. Leyenaar JK, Capra LA, O’Brien ER, Leslie LK, Mackie TI. Determinants of career satisfaction among pediatric hospitalists: a qualitative exploration. Acad Pediatr. 2014;14(4):361-368. https://doi.org/10.1016/j.acap.2014.03.015
13. Jerardi KE, Fisher E, Rassbach C, et al. Development of a curricular framework for pediatric hospital medicine fellowships. Pediatrics. 2017;140(1):e20170698. https://doi.org/10.1542/peds.2017-0698
14. ACGME Program Requirements for Graduate Medical Education in Pediatric Hospital Medicine. July 1, 2021. Accessed October 4, 2021.https://www.acgme.org/globalassets/PFAssets/ProgramRequirements/334_PediatricHospitalMedicine_2020.pdf?ver=2020-06-29-163350-910&ver=2020-06-29-163350-910
15. Freed GL, Brzoznowski K, Neighbors K, Lakhani I, American Board of Pediatrics, Research Advisory Committee. Characteristics of the pediatric hospitalist workforce: its roles and work environment. Pediatrics. 2007;120(1):33-39. https://doi.org/10.1542/peds.2007-0304
16. Moore B, Freeman W, Jiang H. Costs of Pediatric Hospital Stays, 2016. Healthcare Cost and Utilization Project Statistical Brief #250. Accessed October 25, 2021. https://www.ncbi.nlm.nih.gov/books/NBK547762/
17. Carlson DW, Fentzke KM, Dawson JG. Pediatric hospitalists: fill varied roles in the care of newborns. Pediatr Ann. 2003;32(12):802-810. https://doi.org/10.3928/0090-4481-20031201-09
18. Tieder JS, Migita DS, Cowan CA, Melzer SM. Newborn care by pediatric hospitalists in a community hospital: effect on physician productivity and financial performance. Arch Pediatr Adolesc Med. 2008;162(1):74-78. https://doi.org/10.1001/archpediatrics.2007.15
19. Krugman SD, Suggs A, Photowala HY, Beck A. Redefining the community pediatric hospitalist: the combined pediatric ED/inpatient unit. Pediatr Emerg Care. 2007;23(1):33-37. https://doi.org/10.1097/01.pec.0000248685.94647.01
20. Dudas RA, Monroe D, McColligan Borger M. Community pediatric hospitalists providing care in the emergency department: an analysis of physician productivity and financial performance. Pediatr Emerg Care. 2011;27(11):1099-1103. https://doi.org/10.1097/PEC.0b013e31823606f5
21. Stucky ER, Ottolini MC, Maniscalco J. Pediatric hospital medicine core competencies: development and methodology. J Hosp Med. 2010;5(6):339-343. https://doi.org/10.1002/jhm.843
22. Maniscalco J, Gage S, Teferi S, Fisher ES. The Pediatric Hospital Medicine Core Competencies: 2020 revision. J Hosp Med. 2020;15(7):389-394. https://doi.org/10.12788/jhm.3391
© 2021 Society of Hospital Medicine
Pooled Testing for SARS-CoV-2 for Resource Conservation in the Hospital: A Dynamic Process
Pooled testing for SARS-CoV-2 has been proposed as a strategy to facilitate testing and conserve scarce laboratory resources in a variety of settings. Previously in the Journal of Hospital Medicine, we reported our initial experience with pooled testing in low-risk admitted patients from April 17, 2020, to May 11, 2020, at Saratoga Hospital, Saratoga Springs, New York.1 Early in the pandemic, when testing resources were critically short, pooling allowed us to meet our clinical goal of testing all admitted inpatients. We now present our subsequent experience to emphasize the dynamic nature of this strategy when used to offer testing while conserving resources within a hospital system.
From April 17, 2020, to December 10, 2020, pooled testing using the GeneXpert system (Cepheid) was performed as previously described on all patients admitted from the emergency department (ED) of Saratoga Hospital who met criteria for being at low risk for SARS-CoV-2 infection.1 During this period, we had a low community prevalence (<1%-2%). In our low-risk admitted patients, an overall positive rate of 0.5% allowed us to expand the pool size from our initial reported size of three samples to a maximum of five samples. As ED volumes changed, pool sizes could be adjusted by clinical leaders as supplies allowed the demands of throughput to be met. These adjustments were facilitated by regular discussion of aggregate testing results, pool size, patient-flow issues, and supply levels among our staff. In December 2020, we experienced a marked increase in community prevalence and hospital admissions. This surge ended our use of pooling and required us to test each admitted patient with a single cartridge, which fortunately had become available.
During our period of pooling, we tested 7755 low-risk patients using 1738 cartridges (1177 pools of five samples; 211 pools of four samples; 326 pools of three samples; and 24 pools of two samples). We had 39 positive pooled cartridges, which required the use of 174 additional single cartridges. The instructions for use of this system with single cartridges report a negative percent agreement (sensitivity) of 95.6% and a positive percent agreement (specificity) of 97.8% in the lab.2 We did not have any patients who tested negative in a pool subsequently turn positive during admission unless they had a known in-hospital exposure; however, our public health service alerted us to several patients with high-risk exposures who were excluded from pooling. Our pooling strategy resulted in use of 5843 fewer cartridges than if each test had been performed on a single patient. The total savings on cartridges was $225,000. Pooling did not directly increase staff costs, but required significant individual and organizational energy and commitment. At times, pooling could delay throughput of admitted patients from the ED to inpatient beds. The testing process often added 60 to 90 minutes to throughput time. During the night, waiting for admissions to create a pool could also cause delay. Close and ongoing communication among our ED, inpatient teams, nursing, and laboratory was required to minimize these negative effects.
Pooling can be an effective method of resource conservation in low-risk populations. The theoretical benefits of pooling have been calculated in various scenarios3 and recently comprehensively reviewed with emphasis on selecting the pooling method.4 Practically, pooling has been aptly described as a complex undertaking that should be one part of a broad approach to achieving various COVID-19 control goals.5 Our experience is that, in the hospital setting, it is a dynamic process that requires repeatedly balancing clinical goals, organizational realities, laboratory and mathematical parameters, and competing staff duties. The potential costs and benefits may change over time. We found success was highly dependent on our staff, who were highly motivated by strongly agreeing with our commitment to test all inpatients and our desire to maintain adequate supplies to accomplish this goal.
1. Mastrianni D, Falivena R, Brooks T, et al. Pooled testing for SARS-CoV-2 in hospitalized patients. J Hosp Med. 2020;15:538-539. https://doi.org/10.12788/jhm.3501
2. Xpert Xpress SARS-CoV-2. Instructions for use. Cepheid; 2020. Accessed October 7, 2021. https://www.cepheid.com/Package%20Insert%20Files/Xpert%20Xpress%20SARS-CoV-2%20Assay%20ENGLISH%20Package%20Insert%20302-3787%20Rev.%20B.pdf
3. Abdalhamid B, Bilder CR, McCutchen EL, Hinrichs SH, Koepsell SA, Iwen PC. Assessment of specimen pooling to conserve SARS CoV-2 testing resources. Am J Clin Pathol. 2020;153(6):715-718. https://doi.org/10.1093/ajcp/aqaa064
4. Daniel EA, Esakialraj L BH, Anbalagan S, et al. Pooled testing strategies for SARS-CoV-2 diagnosis: a comprehensive review. Diagn Microbiol Infect Dis. 2021;101(2):115432. https://doi.org/10.1016/j.diagmicrobio.2021.115432
5. Schulte PA, Weissman DN, Luckhaupt SE, et al. Considerations for pooled testing of employees for SARS-CoV-2. J Occup Environ Med. 2021;63(1):1-9. https://doi.org/10.1097/JOM.0000000000002049
Pooled testing for SARS-CoV-2 has been proposed as a strategy to facilitate testing and conserve scarce laboratory resources in a variety of settings. Previously in the Journal of Hospital Medicine, we reported our initial experience with pooled testing in low-risk admitted patients from April 17, 2020, to May 11, 2020, at Saratoga Hospital, Saratoga Springs, New York.1 Early in the pandemic, when testing resources were critically short, pooling allowed us to meet our clinical goal of testing all admitted inpatients. We now present our subsequent experience to emphasize the dynamic nature of this strategy when used to offer testing while conserving resources within a hospital system.
From April 17, 2020, to December 10, 2020, pooled testing using the GeneXpert system (Cepheid) was performed as previously described on all patients admitted from the emergency department (ED) of Saratoga Hospital who met criteria for being at low risk for SARS-CoV-2 infection.1 During this period, we had a low community prevalence (<1%-2%). In our low-risk admitted patients, an overall positive rate of 0.5% allowed us to expand the pool size from our initial reported size of three samples to a maximum of five samples. As ED volumes changed, pool sizes could be adjusted by clinical leaders as supplies allowed the demands of throughput to be met. These adjustments were facilitated by regular discussion of aggregate testing results, pool size, patient-flow issues, and supply levels among our staff. In December 2020, we experienced a marked increase in community prevalence and hospital admissions. This surge ended our use of pooling and required us to test each admitted patient with a single cartridge, which fortunately had become available.
During our period of pooling, we tested 7755 low-risk patients using 1738 cartridges (1177 pools of five samples; 211 pools of four samples; 326 pools of three samples; and 24 pools of two samples). We had 39 positive pooled cartridges, which required the use of 174 additional single cartridges. The instructions for use of this system with single cartridges report a negative percent agreement (sensitivity) of 95.6% and a positive percent agreement (specificity) of 97.8% in the lab.2 We did not have any patients who tested negative in a pool subsequently turn positive during admission unless they had a known in-hospital exposure; however, our public health service alerted us to several patients with high-risk exposures who were excluded from pooling. Our pooling strategy resulted in use of 5843 fewer cartridges than if each test had been performed on a single patient. The total savings on cartridges was $225,000. Pooling did not directly increase staff costs, but required significant individual and organizational energy and commitment. At times, pooling could delay throughput of admitted patients from the ED to inpatient beds. The testing process often added 60 to 90 minutes to throughput time. During the night, waiting for admissions to create a pool could also cause delay. Close and ongoing communication among our ED, inpatient teams, nursing, and laboratory was required to minimize these negative effects.
Pooling can be an effective method of resource conservation in low-risk populations. The theoretical benefits of pooling have been calculated in various scenarios3 and recently comprehensively reviewed with emphasis on selecting the pooling method.4 Practically, pooling has been aptly described as a complex undertaking that should be one part of a broad approach to achieving various COVID-19 control goals.5 Our experience is that, in the hospital setting, it is a dynamic process that requires repeatedly balancing clinical goals, organizational realities, laboratory and mathematical parameters, and competing staff duties. The potential costs and benefits may change over time. We found success was highly dependent on our staff, who were highly motivated by strongly agreeing with our commitment to test all inpatients and our desire to maintain adequate supplies to accomplish this goal.
1. Mastrianni D, Falivena R, Brooks T, et al. Pooled testing for SARS-CoV-2 in hospitalized patients. J Hosp Med. 2020;15:538-539. https://doi.org/10.12788/jhm.3501
2. Xpert Xpress SARS-CoV-2. Instructions for use. Cepheid; 2020. Accessed October 7, 2021. https://www.cepheid.com/Package%20Insert%20Files/Xpert%20Xpress%20SARS-CoV-2%20Assay%20ENGLISH%20Package%20Insert%20302-3787%20Rev.%20B.pdf
3. Abdalhamid B, Bilder CR, McCutchen EL, Hinrichs SH, Koepsell SA, Iwen PC. Assessment of specimen pooling to conserve SARS CoV-2 testing resources. Am J Clin Pathol. 2020;153(6):715-718. https://doi.org/10.1093/ajcp/aqaa064
4. Daniel EA, Esakialraj L BH, Anbalagan S, et al. Pooled testing strategies for SARS-CoV-2 diagnosis: a comprehensive review. Diagn Microbiol Infect Dis. 2021;101(2):115432. https://doi.org/10.1016/j.diagmicrobio.2021.115432
5. Schulte PA, Weissman DN, Luckhaupt SE, et al. Considerations for pooled testing of employees for SARS-CoV-2. J Occup Environ Med. 2021;63(1):1-9. https://doi.org/10.1097/JOM.0000000000002049
© 2021 Society of Hospital Medicine