User login
Bariatric Surgery Improves Long-Term Health—but Not Long-Term Health Care Costs
Veterans have some of the highest rates of overweight and obesity in the country: 78%, compared with 35% of American adults overall. So bariatric surgery can be a boon to many veterans. But while it improves health for those with severe obesity, does it also translate into lower health care costs?
Researchers from the Durham VA Medical Center (VAMC) say no. In a study funded by VA Health Services Research and Development and the National Institute on Drug Abuse, they analyzed data on 2,498 veterans who underwent bariatric surgery between January 2000 and September 2011, and 7,456 patients (also severely obese) who did not have surgery. The researchers compared the 2 groups’ outpatient, inpatient, and pharmacy expenditures from 3 years before surgery to 10 years after surgery.
Mean total expenditures for the surgery cohort were $5,093 at 7 to 12 months before surgery, $1,400 higher than costs for the nonsurgery group. The numbers rose to $7,448 at 6 months after surgery—$3,000 higher than in the nonsurgery group. Postsurgical expenditures dropped to $6,692 at 5 years, then gradually increased to $8,495 at 10 years. Outpatient pharmacy expenditures were significantly lower among the surgery cohort throughout the follow-up, but the cost reductions were offset by higher inpatient and outpatient expenditures.
Total expenditures were higher in the surgery cohort than the nonsurgery cohort during the 3 years before and the first 2 years after surgery, but the numbers of the 2 groups converged 5 to 10 years after surgery.
The researchers offer some possible reasons that the surgery did not lower health care costs. For instance, despite better overall health, patients may still need to be treated for short-term complications of bariatric surgery, such as nausea, anemia, and vitamin deficiencies. The surgery patients also may have needed additional procedures, such as removal of excess skin. They might have become eligible for knee or hip replacement after having lost weight.
Finally, the researchers point out, many conditions linked to obesity, such as diabetes, do not necessarily go away when the patient loses weight.
The study authors noted that “few health care treatments are required to be cost saving or even cost-effective to be widely available, so requiring cost savings of bariatric surgery imposes an unfair standard.”
CPAP vs noninvasive ventilation for obesity hypoventilation syndrome
The conventional approach to treat hypoventilation has been to use noninvasive ventilation (NIV), while continuous positive airway pressure (CPAP) that does not augment alveolar ventilation improves gas exchange by maintaining upper airway patency and increasing functional residual capacity. To understand this rationale, it is important to first review the pathophysiology of OHS.
The hallmark of OHS is resting daytime awake arterial PaCO2of 45 mm Hg or greater in an obese patient (BMI > 30 kg/m2) in absence of any other identifiable cause. To recognize why only some but not all obese subjects develop OHS, it is important to understand the different components of pathophysiology that contribute to hypoventilation: (1) obesity-related reduction in functional residual capacity and lung compliance with resultant increase in work of breathing; (2) central hypoventilation related to leptin resistance and reduction in respiratory drive with REM hypoventilation; and (3) upper airway obstruction caused by upper airway fat deposition along with low FRC contributing to pharyngeal airway narrowing and increased airway collapsibility (Masa JF, et al. Eur Respir Rev. 2019; 28:180097).
CPAP vs NIV for OHS
Let us examine some of the studies that have compared the short-term efficacy of CPAP vs NIV in patients with OHS. In a small randomized controlled trial (RCT), the effectiveness of CPAP and NIV was compared in 36 patients with OHS (Piper AJ, et al. Thorax. 2008;63:395). Reduction in PaCO2 at 3 months was similar between the two groups. However, patients with persistent nocturnal desaturation despite optimal CPAP were excluded from the study. In another RCT of 60 patients with OHS who were either in stable condition or after an episode of acute on chronic hypercapnic respiratory failure, the use of CPAP or NIV showed similar improvements at 3 months in daytime PaCO2, quality of life, and sleep parameters (Howard ME, et al. Thorax. 2017;72:437).
In one of the largest randomized control trials, the Spanish Pickwick study randomized 221 patients with OHS and AHI >30/h to NIV, CPAP, and lifestyle modification (Masa JF, et al. Am J Respir Crit Care Med. 2015:192:86). PAP therapy included NIV that consisted of in-lab titration with bilevel PAP therapy targeted to tidal volume 5-6 mL/kg of actual body weight or CPAP. Life style modification served as the control group. Primary outcome was the change in PaCO2 at 2 months. Secondary outcomes were symptoms, HRQOL, polysomnographic parameters, spirometry, and 6-min walk distance (6 MWD). Mean AHI was 69/h, and mean PAP settings for NIV and CPAP were 20/7.7 cm and 11 cm H2O, respectively. NIV provided the greatest improvement in PaCO2 and serum HCO3 as compared with control group but not relative to CPAP group. CPAP improved PaCO2 as compared with control group only after adjustment of PAP use. Spirometry and 6 MWD and some HRQOL measures improved slightly more with NIV as compared to CPAP. Improvement in symptoms and polysomnographic parameters was similar between the two groups.
In another related study by the same group (Masa JF, et al. Thorax. 2016;71:899), 86 patients with OHS and mild OSA (AHI <30/h), were randomized to NIV and lifestyle modification. Mean AHI was 14/h and mean baseline PaCO2 was 49 +/-4 mm Hg. The NIV group with mean PAP adherence at 6 hours showed greater improvement in PaCO2 as compared with lifestyle modification (6 mm vs 2.8 mm Hg). They concluded that NIV was better than lifestyle modification in patients with OHS and mild OSA.
To determine the long-term clinical effectiveness of CPAP vs NIV, patients in the Pickwick study, who were initially assigned to either CPAP or NIV treatment group, were continued on their respective treatments, while subjects in the control group were again randomized at 2 months to either CPAP or NIV (Masa JF, et al. Lancet. 2019;393:1721). All subjects (CPAP n=107; NIV n=97) were followed for a minimum of 3 years. CPAP and NIV settings (pressure-targeted to desired tidal volume) were determined by in-lab titration without transcutaneous CO2 monitor, and daytime adjustment of PAP to improve oxygen saturation. Primary outcome was the number of hospitalization days per year. Mean CPAP was 10.7 cm H2O pressure and NIV 19.7/8.18 cm H2O pressure with an average respiratory rate of 14/min. Median PAP use and adherence > 4 h, respectively, were similar between the two groups (CPAP 6.0 h, adherence > 4 h 67% vs NIV 6.0/h, adherence >4 h 61%). Median duration of follow-up was 5.44 years (IOR 4.45-6.37 years) for both groups. Mean hospitalization days per patient-year were similar between the two groups (CPAP 1.63 vs NIV 1.44 days; adj RR 0.78, 95% CI 0.34-1.77; p=0.561). Overall mortality, adverse cardiovascular events, and arterial blood gas parameters were similar between the two groups, suggesting equal efficacy of CPAP and NIV in this group of stable patients with OHS with an AHI >30/h. Given the low complexity and cost of CPAP vs NIV, the authors concluded that CPAP may be the preferred PAP treatment modality until more studies are available.
An accompanying editorial (Murphy PB, et al. Lancet. 2019; 393:1674), discussed that since this study was powered for superiority as opposed to noninferiority of NIV (20% reduction in hospitalization with NIV when compared with CPAP), superiority could not be shown, due to the low event rate for hospitalization (NIV 1.44 days vs CPAP 1.63 days). It is also possible optimum NIV titration may not have been determined since TCO2 was not used. Furthermore, since this study was done only in patients with OHS and AHI >30/h, these results may not be applicable to patients with OHS and low AHI < 30/h that are more likely to have central hypoventilation and comorbidities, and this group may benefit from NIV as compared with CPAP.
Novel modes of bi-level PAP therapy
There are limited data on the use of the new bi-level PAP modalities, such as volume-targeted pressure support ventilation (PS) with fixed or auto-EPAP. The use of intelligent volume-assured pressure support ventilation (iVAPS) vs standard fixed pressure support ventilation in select OHS patients (n=18) showed equivalent control of chronic respiratory failure with no worsening of sleep quality and better PAP adherence (Kelly JL, et al. Respirology. 2014;19:596). In another small randomized, double-blind, crossover study, done on two consecutive nights in 11 patients with OHS, the use of auto-adjusting EPAP was noninferior to fixed EPAP (10.8 cm vs 11.8 cm H2O pressure), with no differences in sleep quality and patient preference (McArdle N. Sleep. 2017;40:1). Although the data are limited, these small studies suggest the use of new PAP modalities, such as variable PS to deliver target volumes and auto EPAP could offer the potential to initiate bi-level PAP therapy in outpatients without the in-lab titration. More studies are needed before bi-level PAP therapy can be safely initiated in outpatients with OHS.
Summary
In summary, how can we utilize the most effective PAP therapy for patients with OHS? Can we use a phenotype-dependent approach to PAP treatment options? The answer is probably yes. Recently published ATS Clinical Practice Guideline (Am J Respir Crit Care Med. 2019;200:e6-e24) suggests the use of PAP therapy for stable ambulatory patients with OHS as compared with no PAP therapy, and patients with OHS with AHI >30/h (approximately 70% of the OHS patients) can be initially started on CPAP instead of NIV. Patients who have persistent nocturnal desaturation despite optimum CPAP can be switched to NIV. On the other hand, data are limited on the use of CPAP in patients with OHS with AHI <30/h, and these patients can be started on NIV. PAP adherence >5-6 h, and weight loss using a multidisciplinary approach should be encouraged for all patients with OHS.
Dr. Dewan is Professor and Program Director, Sleep Medicine; Division of Pulmonary, Critical Care and Sleep Medicine; Chief, Pulmonary Section VA Medical Center; Creighton University, Omaha, Nebraska.
Bariatric surgery as safe in adolescents as it is in adults
LAS VEGAS – Bariatric surgery in adolescents was about as safe as it was in adults in the largest U.S. database assembled so far for the procedure in this younger age group.
The data from 1,983 patients aged 10-19 years who underwent bariatric surgery at an accredited U.S. center also showed, not unexpectedly, that laparoscopic sleeve gastrectomy was significantly safer during the perioperative and immediate postoperative periods, compared with the other main surgical option, laparoscopic Roux-en-Y gastric bypass.
The incidence of serious adverse events that occurred in adolescents either during surgery or in the 30 days after surgery was 2.9% in the 1,552 patients (78%) who underwent sleeve gastrectomy and 6.5% in the 431 (22%) patients who underwent gastric bypass, Keith J. King, MD, said at a meeting presented by the Obesity Society and the American Society for Metabolic and Bariatric Surgery.
Despite this safety disparity, “the decision to undergo sleeve gastrectomy or Roux-en-Y gastric bypass should be individualized to account for other factors, such as excess weight loss and long-term success,” said Dr. King, a bariatric surgeon at St. Luke’s Hospital, Allentown, Pa. But he acknowledged that having these recent safety data from a relatively large number of adolescents will help families that are trying to decide on treatment for their child.
The data came from records kept by the Metabolic and Bariatric Surgery Accreditation and Quality Improvement Program, begun in 2012 by the American College of Surgeons and the American Society for Bariatric and Metabolic Surgery, and a registry for every bariatric surgical procedure done at an accredited U.S. program. The database encompassed 840 surgical programs in 2019.
The incidence of perioperative and postoperative complications in the adolescent patients during the first 30 days after surgery was not statistically significant for any measured safety parameter, compared with 353,726 adults (at least 20 years old) enrolled in the same database during 2015-2017, except for the average duration of surgery, which was 8 minutes shorter in adolescents, Dr. King reported. The data showed that adolescents and adults had roughly similar rates of serious adverse events, organ space infections, and need for reoperation, intervention, or hospital readmission. The way in which clinicians applied bariatric surgery to adolescents also seemed similar to their use of the surgery in adults. The average body mass index of adult patients was about 45 kg/m2, and about 48 kg/m2 in adolescents, and in both age groups, nearly 80% of patients were women or girls.
In contrast, the comparison of sleeve gastrectomy and gastric bypass surgery in adolescents showed several statistically significant differences in safety and procedural characteristics. In addition to a more than twofold difference in the incidence of serious adverse events that favored the sleeve, the data also showed a twofold difference in the need for reoperation, 1% with the sleeve and 2% with bypass; and a threefold difference in the need for at least one intervention during 30-day follow-up, 1% in the sleeve recipients and 3% in those treated with gastric bypass. Patients required at least one hospital readmission within 30 days in 3% of the sleeve cases and in 6% of the bypass cases. Average hospital length of stay was 2 days in both groups.
An efficacy review from a different, large, U.S. database that included 544 adolescents who underwent bariatric surgery during 2005-2015 showed that at 3 years after surgery, average reductions in body mass index were 29% for patients who underwent gastric bypass and 25% in those treated with sleeve gastrectomy (Surg Obes Relat Dis. 2018;14[9]:1374-86).
The study received no commercial support. Dr. King had no disclosures.
SOURCE: El Chaar M et al. Obesity Week 2019, Abstract A138.

The comparison of safety outcomes between sleeve gastrectomy and Roux-en-Y gastric bypass appears to favor using sleeves. In obese adolescents the most common complications we see are nonalcoholic fatty liver disease and obstructive sleep apnea, and prior reports have documented that both often improve following sleeve gastrectomy. That fact, plus these new safety findings, may help push the field toward greater sleeve use in adolescents, although the data also show that sleeve gastrectomy is already used in nearly four-fifths of adolescent cases.
Corrigan McBride, MD, is a professor of surgery and director of bariatric surgery at the University of Nebraska Medical Center in Omaha. She had no disclosures. She made these comments in an interview.
LAS VEGAS – Bariatric surgery in adolescents was about as safe as it was in adults in the largest U.S. database assembled so far for the procedure in this younger age group.
The data from 1,983 patients aged 10-19 years who underwent bariatric surgery at an accredited U.S. center also showed, not unexpectedly, that laparoscopic sleeve gastrectomy was significantly safer during the perioperative and immediate postoperative periods, compared with the other main surgical option, laparoscopic Roux-en-Y gastric bypass.
The incidence of serious adverse events that occurred in adolescents either during surgery or in the 30 days after surgery was 2.9% in the 1,552 patients (78%) who underwent sleeve gastrectomy and 6.5% in the 431 (22%) patients who underwent gastric bypass, Keith J. King, MD, said at a meeting presented by the Obesity Society and the American Society for Metabolic and Bariatric Surgery.
Despite this safety disparity, “the decision to undergo sleeve gastrectomy or Roux-en-Y gastric bypass should be individualized to account for other factors, such as excess weight loss and long-term success,” said Dr. King, a bariatric surgeon at St. Luke’s Hospital, Allentown, Pa. But he acknowledged that having these recent safety data from a relatively large number of adolescents will help families that are trying to decide on treatment for their child.
The data came from records kept by the Metabolic and Bariatric Surgery Accreditation and Quality Improvement Program, begun in 2012 by the American College of Surgeons and the American Society for Bariatric and Metabolic Surgery, and a registry for every bariatric surgical procedure done at an accredited U.S. program. The database encompassed 840 surgical programs in 2019.
The incidence of perioperative and postoperative complications in the adolescent patients during the first 30 days after surgery was not statistically significant for any measured safety parameter, compared with 353,726 adults (at least 20 years old) enrolled in the same database during 2015-2017, except for the average duration of surgery, which was 8 minutes shorter in adolescents, Dr. King reported. The data showed that adolescents and adults had roughly similar rates of serious adverse events, organ space infections, and need for reoperation, intervention, or hospital readmission. The way in which clinicians applied bariatric surgery to adolescents also seemed similar to their use of the surgery in adults. The average body mass index of adult patients was about 45 kg/m2, and about 48 kg/m2 in adolescents, and in both age groups, nearly 80% of patients were women or girls.
In contrast, the comparison of sleeve gastrectomy and gastric bypass surgery in adolescents showed several statistically significant differences in safety and procedural characteristics. In addition to a more than twofold difference in the incidence of serious adverse events that favored the sleeve, the data also showed a twofold difference in the need for reoperation, 1% with the sleeve and 2% with bypass; and a threefold difference in the need for at least one intervention during 30-day follow-up, 1% in the sleeve recipients and 3% in those treated with gastric bypass. Patients required at least one hospital readmission within 30 days in 3% of the sleeve cases and in 6% of the bypass cases. Average hospital length of stay was 2 days in both groups.
An efficacy review from a different, large, U.S. database that included 544 adolescents who underwent bariatric surgery during 2005-2015 showed that at 3 years after surgery, average reductions in body mass index were 29% for patients who underwent gastric bypass and 25% in those treated with sleeve gastrectomy (Surg Obes Relat Dis. 2018;14[9]:1374-86).
The study received no commercial support. Dr. King had no disclosures.
SOURCE: El Chaar M et al. Obesity Week 2019, Abstract A138.
REPORTING FROM OBESITY WEEK 2019
Bariatric surgery shows metabolic benefits in lower-BMI patients
LAS VEGAS – It’s time to take bariatric out of bariatric surgery.
“The way forward is to not call it bariatric surgery or weight-loss surgery but surgery to treat diabetes, hypertension, hyperlipidemia, and other metabolic diseases,” said Oliver A. Varban, MD, at a meeting presented by the Obesity Society and the American Society for Metabolic and Bariatric Surgery. “We need to reframe the conversation with patients about what success [with bariatric surgery] looks like. Weight loss can be a side effect of the operation if patients have surgery to resolve their diabetes. It’s not about BMI; it’s about treating metabolic disease.”
Dr. Varban, a bariatric surgeon at the University of Michigan in Ann Arbor, reported data showing that bariatric surgery with sleeve gastrectomy in patients with baseline body mass index (BMI) levels below 35 kg/m2 was as effective at normalizing a range of metabolically associated disorders as it was in more obese patients in an observational study of more than 45,000 patients who underwent surgery in Michigan.
The findings add to an already extensive pool of evidence for loosening current guidelines that restrict bariatric surgery to patients with a BMI of 35 kg/m2 or greater, Dr. Varban said. But an influential bariatric surgery consensus statement from the National Institutes of Health that dates from 1991 and remains in place, recommends this surgery only for people with a BMI of at least 35 kg/m2, and this guidance often limits access to the surgery for patients at lower BMI, he noted.
A more inclusive assessment of patients as potential candidates for bariatric surgery should include a range of considerations in addition to weight and height, he explained in an interview. “Even if people have a BMI of less than 30 kg/m2 but have, or are at high risk for developing, metabolic disease, they should also be offered the operation.”
The guidance from the NIH results in a U.S. bariatric surgery population that effectively centers mainly on women with a BMI of 40 kg/m2 or greater and makes procedures like sleeve gastrectomy unavailable to many other types of patients who could benefit from it, Dr. Varban said. In 2018, the American Society for Metabolic and Bariatric Surgery released a position statement that summarized the evidence for the safety and efficacy of bariatric surgery in people with a BMI of 30-34 kg/m2, and cited the lingering and restrictive impact of the 1991 NIH consensus statement.
The study run by Dr. Varban and his associates used data collected by 43 programs in the Michigan Bariatric Surgery Collaborative during 2006-2018 that included 1,073 patients who had a BMI of less than 35 kg/m2 on the day they underwent sleeve gastrectomy, and 44,511 patients who had the same procedure and had a BMI of at least 35 kg/m2. The operations were performed by any one of 81 surgeons who worked at the centers during this time.
The patients with lower BMIs were older, with an average age of 51 years, compared with 45 years in the higher-BMI group, and they had higher prevalences of certain metabolic disorders. Diabetes affected 37% of those in the lower-BMI group and 31% of those with higher BMIs; hyperlipidemia affected 57% and 45%, respectively; and gastroesophageal reflux disease affected 56% and 49%, respectively. Obstructive sleep apnea was more common in the group with higher BMIs, at 47%, compared with 41% of those with lower BMIs.
The average BMI in the lower group was 33.7 kg/m2; in the higher group it was 46.7 kg/m2. Dr. Varban did not have data on whether any patients in the lower-BMI group had a BMI below 30 kg/m2. Roughly a third of the patients in the lower-BMI group had a BMI of less than 35 kg/m2 at the time of their initial examination, whereas the other two-thirds had a BMI that low only on the day of their surgery.At follow-up 1 year after their surgery, patients who started with lower BMIs had, in general, a very similar pattern of responses as those who started with higher BMIs, with rates of discontinuation of treatments for diabetes, hypertension, hyperlipidemia, obstructive sleep apnea, and gastroesophageal reflux of about 50%-80% and similar in both treatment arms. For example, discontinuation of oral diabetes drugs occurred in 79% and 78% of those with low and high BMIs, respectively, and discontinuation of hypertension medications occurred in 60% and 54%, respectively. Although the average absolute weight loss in the patients with lower BMIs was nearly half that of patients with higher starting BMIs, a much greater percentage of patients in the lower-BMI group achieved a BMI of less than 25 kg/m2, compared with the higher-BMI group (36% vs. 6%, respectively).
Patients from the lower-BMI group also showed high levels of satisfaction with their surgery and its results after 1 year. Questionnaire results from roughly half the patients in each treatment group showed that 90% were very satisfied in the lower-BMI group, compared with 84% of those who began with higher BMIs, with a dissatisfaction rate of 1% and 2%, respectively. The average body-image score at 1 year follow-up was significantly higher in those who started with lower BMIs. The rate of complications was low and similar in the two groups, with a 6% rate in the lower-BMI group and 5% in those with higher BMIs.
The study received no commercial funding. Dr. Varban receives salary support from Blue Cross Blue Shield of Michigan.
SOURCE: Varban et al. Obesity Week 2019, Abstract A105.
This article was updated 11/8/2020.
This is a very important topic and study, and its findings are very positive and reinforcing for more liberal use of bariatric surgery. Results from several prior studies had documented the safety and efficacy of bariatric surgery in patients with lower body mass index, and its fantastic to now have additional data that show the same outcomes. A major challenge is making patients and more physicians aware of the range of comorbidities that can be effectively managed with bariatric surgery, even in patients with lower body mass index.
Mona Misra, MD, is associate director of the Bariatric Program at Cedars-Sinai Marina Del Rey Hospital in Los Angeles. She had no relevant disclosures. She made these comments as designated discussant for the study.
LAS VEGAS – It’s time to take bariatric out of bariatric surgery.
“The way forward is to not call it bariatric surgery or weight-loss surgery but surgery to treat diabetes, hypertension, hyperlipidemia, and other metabolic diseases,” said Oliver A. Varban, MD, at a meeting presented by the Obesity Society and the American Society for Metabolic and Bariatric Surgery. “We need to reframe the conversation with patients about what success [with bariatric surgery] looks like. Weight loss can be a side effect of the operation if patients have surgery to resolve their diabetes. It’s not about BMI; it’s about treating metabolic disease.”
Dr. Varban, a bariatric surgeon at the University of Michigan in Ann Arbor, reported data showing that bariatric surgery with sleeve gastrectomy in patients with baseline body mass index (BMI) levels below 35 kg/m2 was as effective at normalizing a range of metabolically associated disorders as it was in more obese patients in an observational study of more than 45,000 patients who underwent surgery in Michigan.
The findings add to an already extensive pool of evidence for loosening current guidelines that restrict bariatric surgery to patients with a BMI of 35 kg/m2 or greater, Dr. Varban said. But an influential bariatric surgery consensus statement from the National Institutes of Health that dates from 1991 and remains in place, recommends this surgery only for people with a BMI of at least 35 kg/m2, and this guidance often limits access to the surgery for patients at lower BMI, he noted.
A more inclusive assessment of patients as potential candidates for bariatric surgery should include a range of considerations in addition to weight and height, he explained in an interview. “Even if people have a BMI of less than 30 kg/m2 but have, or are at high risk for developing, metabolic disease, they should also be offered the operation.”
The guidance from the NIH results in a U.S. bariatric surgery population that effectively centers mainly on women with a BMI of 40 kg/m2 or greater and makes procedures like sleeve gastrectomy unavailable to many other types of patients who could benefit from it, Dr. Varban said. In 2018, the American Society for Metabolic and Bariatric Surgery released a position statement that summarized the evidence for the safety and efficacy of bariatric surgery in people with a BMI of 30-34 kg/m2, and cited the lingering and restrictive impact of the 1991 NIH consensus statement.
The study run by Dr. Varban and his associates used data collected by 43 programs in the Michigan Bariatric Surgery Collaborative during 2006-2018 that included 1,073 patients who had a BMI of less than 35 kg/m2 on the day they underwent sleeve gastrectomy, and 44,511 patients who had the same procedure and had a BMI of at least 35 kg/m2. The operations were performed by any one of 81 surgeons who worked at the centers during this time.
The patients with lower BMIs were older, with an average age of 51 years, compared with 45 years in the higher-BMI group, and they had higher prevalences of certain metabolic disorders. Diabetes affected 37% of those in the lower-BMI group and 31% of those with higher BMIs; hyperlipidemia affected 57% and 45%, respectively; and gastroesophageal reflux disease affected 56% and 49%, respectively. Obstructive sleep apnea was more common in the group with higher BMIs, at 47%, compared with 41% of those with lower BMIs.
The average BMI in the lower group was 33.7 kg/m2; in the higher group it was 46.7 kg/m2. Dr. Varban did not have data on whether any patients in the lower-BMI group had a BMI below 30 kg/m2. Roughly a third of the patients in the lower-BMI group had a BMI of less than 35 kg/m2 at the time of their initial examination, whereas the other two-thirds had a BMI that low only on the day of their surgery.At follow-up 1 year after their surgery, patients who started with lower BMIs had, in general, a very similar pattern of responses as those who started with higher BMIs, with rates of discontinuation of treatments for diabetes, hypertension, hyperlipidemia, obstructive sleep apnea, and gastroesophageal reflux of about 50%-80% and similar in both treatment arms. For example, discontinuation of oral diabetes drugs occurred in 79% and 78% of those with low and high BMIs, respectively, and discontinuation of hypertension medications occurred in 60% and 54%, respectively. Although the average absolute weight loss in the patients with lower BMIs was nearly half that of patients with higher starting BMIs, a much greater percentage of patients in the lower-BMI group achieved a BMI of less than 25 kg/m2, compared with the higher-BMI group (36% vs. 6%, respectively).
Patients from the lower-BMI group also showed high levels of satisfaction with their surgery and its results after 1 year. Questionnaire results from roughly half the patients in each treatment group showed that 90% were very satisfied in the lower-BMI group, compared with 84% of those who began with higher BMIs, with a dissatisfaction rate of 1% and 2%, respectively. The average body-image score at 1 year follow-up was significantly higher in those who started with lower BMIs. The rate of complications was low and similar in the two groups, with a 6% rate in the lower-BMI group and 5% in those with higher BMIs.
The study received no commercial funding. Dr. Varban receives salary support from Blue Cross Blue Shield of Michigan.
SOURCE: Varban et al. Obesity Week 2019, Abstract A105.
This article was updated 11/8/2020.
REPORTING FROM OBESITY WEEK 2019
Key clinical point:
Major finding: Discontinuation of hypertension drugs occurred in 60% of patients with lower BMIs at baseline and 54% of those with higher BMIs.
Study details: Review of prospectively collected data from 45,584 patients who underwent sleeve gastrectomy in Michigan during 2006-2018.
Disclosures: The study received no commercial funding. Dr. Varban receives salary support from Blue Cross Blue Shield of Michigan. Dr. Misra had no relevant disclosures.
Source: Varban OA et al. Obesity Week 2019, Abstract A105.
Adverse childhood experiences increase the risk of poor long-term health
and societal outcomes, according to a new report by the Centers for Disease Control and Prevention.

“Our analysis suggests that preventing or reducing these adverse childhood experiences [ACEs] could potentially reduce the annual number of coronary heart disease cases by up to 13%,” said Ann Schuchat, MD, the CDC’s principal deputy director. “If we apply this analysis to other national disease estimates, preventing ACEs could prevent 1.9 million cases of heart disease, 2.5 million cases of overweight or obesity, 21 million cases of depression, and 1.5 million high-school incompletions.”
The analysis, conducted by Melissa T. Merrick, PhD, and colleagues at the National Center for Injury Prevention and Control at the CDC, Atlanta, is based on data acquired from more than 144,000 adults in 27 states.
It’s the first time the CDC has waded into this territory, Dr. Schuchat said during a press briefing. But a hard look into the data is long overdue. ACEs have been linked to at least 5 of the top 10 leading causes of death in the United States: heart disease, cancer, respiratory disease, diabetes, and suicide.
“It’s been proven that exposure to abuse, violence, and familial substance abuse and mental health problems can lead to health and social problems during the entire lifespan. Multiple exposures can produce toxic stress and chronic activation of the stress response system,” Dr. Schuchat continued. “Our report found that more than half of adults have experienced at least one type of ACE, and one in six adults has been exposed to four or more. The effects add up – the more types of ACE encountered, the higher the risk for negative outcomes that limit their entire lives.”
Dr. Merrick, a behavioral scientist with the CDC, and her team reviewed data collected from the Behavioral Risk Factor Surveillance System (BRFSS), a telephone survey of noninstitutionalized adults administered every year within each state. During the 2015-2017 data collection years, 27 states included questions about ACEs. The experiences included childhood exposure to three types of abuse (physical, emotional, and sexual) and five types of household challenges (household member substance misuse, incarceration, mental illness, parental divorce, or witnessing intimate partner violence) before age 18 years.
In all, 61% of respondents reported experiencing at least one of the events; 16% reported experiencing four or more. Women, Native Americans, Native Alaskans, and blacks were more likely to have these experiences than were men and whites.
A multivariate regression analysis found that adults with the highest level of ACE exposure had significantly elevated risks of several chronic health issues and social challenges, compared with nonexposed subjects. These included increased risk of overweight or obesity (adjusted odds ratio, 1.2), chronic obstructive pulmonary disease (aOR, 2.8), depression (aOR 5.3), smoking (aOR 3.1), heavy drinking (aOR 1.8), and underemployment (aOR 1.7), compared with adults reporting no ACEs.
Reducing ACE exposures could in turn reduce many of these challenges, especially among people with the highest number of exposures. Among this group, preventing all ACE exposure could cut overweight and obesity by up to 1.7%, chronic obstructive pulmonary disease by up to 27%, depression by up to 44%, smoking by up to 33%, and heavy drinking by 24%. Preventing ACE exposure also could reduce lack of health insurance by 4% and unemployment by 15%, the researchers said.
The good news, Dr. Merrick and associates said, is that ACE exposure can be at least partially offset by positive interactions with adults and in social and community settings.
“Prevention of adverse childhood experiences is possible with state and community efforts to build resilient families and communities, provide parental support to develop positive parenting and coping skills, and increase access to, and use of, comprehensive health services,” they said.
The CDC recommends a comprehensive approach to preventing ACEs and mitigating their impact. The data-driven suggestions include:
- Promoting family economic health, including tax credits and family-focused work policy.
- Endorsing programs to mitigate violence and adversity, including public education programs that support parents.
- Promoting early childhood development with high-quality child care and preschool programs.
- Recommending stress reduction skills for parents and young people, and programs that teach safe dating and healthy relationship skills.
- Supporting youth development by connecting youth to adult mentors and after-school programs.
- Encouraging clinicians to identify and address ACE exposure with screening, referral, and support.
“This is important for reducing the consequences of adverse childhood experiences and for helping to protect the next generation of children from exposure to violence and other adverse experiences, such as witnessing substance misuse in their household,” Dr. Merrick and associates said.
The researchers had no relevant financial disclosures.
SOURCE: Merrick M et al. MMWR. 2019 Nov 5. doi: 10.15585/mmwr.mm6844e1.
Adverse childhood experiences (ACEs) trigger pathophysiologic responses that exert real physical and psychological harm. Thus, clinicians can and should address them as part of good medical care, Christopher M. Jones, PharmD, Melissa T. Merrick, PhD, and Debra E. Houry, MD, MPH, said in a JAMA commentary.
“A large and growing body of research indicates that the underlying mechanism by which ACEs are associated with health outcomes is through the development of toxic stress, a chronic activation of the stress response system. Toxic stress results in dysregulation of the limbic-hypothalamic-pituitary-adrenal axis, elevating levels of catecholamines (“fight or flight” response), cortisol, and proinflammatory cytokines, leading to cascading effects on the nervous, endocrine, and immune systems. These changes can affect attention and other executive functioning, impulsive behavior, brain reward systems, decision-making, and response to stress throughout the life span,” they said.
While societies and communities at large must work together to reduce ACE exposure, clinicians also have a role. Research indicates that many don’t routinely ask questions about these issues, in a large part because they lack training in how and when to screen.
“Incorporating components of primary ACEs prevention into everyday clinical practice may be achievable through talking with parents and caregivers about creating safe, stable, nurturing environments and protective relationships, and reinforcing positive parenting techniques and coping skills at routine clinical visits,” the editorialists said. “In addition, clinicians can refer parents to parenting skills classes or refer higher-risk parents to home visitation programs such as Healthy Families America and Nurse-Family Partnership. Home visitation programs have demonstrated significant reductions in rates of child abuse and neglect and have improved substance use, violence, and parenting outcomes.”
Clinicians also may have a role to play in mitigating the harms of ACEs, by incorporating trauma-informed care and services into their daily practice.
“Important elements of trauma-informed care include understanding how trauma affects health, routinely screening for ACEs and trauma, using culturally responsive assessments, promoting resilience and protective factors, addressing trauma-related somatic and mental health issues, and ensuring appropriate linkage to services and supports for identified issues,” the editorialists concluded.
Dr. Jones is associate director in the Office of Strategy and Innovation in the CDC Injury Center. Dr. Merrick is president and CEO of Prevent Childhood Abuse America, Chicago. Dr. Houry is director of the National Center for Injury Prevention and Control at the CDC, Atlanta. They discussed the MMWR analysis in a commentary (JAMA. 2019 Nov 5. doi: 10.1001/jama.2019.18499). They had no relevant financial disclosures.
and societal outcomes, according to a new report by the Centers for Disease Control and Prevention.
“Our analysis suggests that preventing or reducing these adverse childhood experiences [ACEs] could potentially reduce the annual number of coronary heart disease cases by up to 13%,” said Ann Schuchat, MD, the CDC’s principal deputy director. “If we apply this analysis to other national disease estimates, preventing ACEs could prevent 1.9 million cases of heart disease, 2.5 million cases of overweight or obesity, 21 million cases of depression, and 1.5 million high-school incompletions.”
The analysis, conducted by Melissa T. Merrick, PhD, and colleagues at the National Center for Injury Prevention and Control at the CDC, Atlanta, is based on data acquired from more than 144,000 adults in 27 states.
It’s the first time the CDC has waded into this territory, Dr. Schuchat said during a press briefing. But a hard look into the data is long overdue. ACEs have been linked to at least 5 of the top 10 leading causes of death in the United States: heart disease, cancer, respiratory disease, diabetes, and suicide.
“It’s been proven that exposure to abuse, violence, and familial substance abuse and mental health problems can lead to health and social problems during the entire lifespan. Multiple exposures can produce toxic stress and chronic activation of the stress response system,” Dr. Schuchat continued. “Our report found that more than half of adults have experienced at least one type of ACE, and one in six adults has been exposed to four or more. The effects add up – the more types of ACE encountered, the higher the risk for negative outcomes that limit their entire lives.”
Dr. Merrick, a behavioral scientist with the CDC, and her team reviewed data collected from the Behavioral Risk Factor Surveillance System (BRFSS), a telephone survey of noninstitutionalized adults administered every year within each state. During the 2015-2017 data collection years, 27 states included questions about ACEs. The experiences included childhood exposure to three types of abuse (physical, emotional, and sexual) and five types of household challenges (household member substance misuse, incarceration, mental illness, parental divorce, or witnessing intimate partner violence) before age 18 years.
In all, 61% of respondents reported experiencing at least one of the events; 16% reported experiencing four or more. Women, Native Americans, Native Alaskans, and blacks were more likely to have these experiences than were men and whites.
A multivariate regression analysis found that adults with the highest level of ACE exposure had significantly elevated risks of several chronic health issues and social challenges, compared with nonexposed subjects. These included increased risk of overweight or obesity (adjusted odds ratio, 1.2), chronic obstructive pulmonary disease (aOR, 2.8), depression (aOR 5.3), smoking (aOR 3.1), heavy drinking (aOR 1.8), and underemployment (aOR 1.7), compared with adults reporting no ACEs.
Reducing ACE exposures could in turn reduce many of these challenges, especially among people with the highest number of exposures. Among this group, preventing all ACE exposure could cut overweight and obesity by up to 1.7%, chronic obstructive pulmonary disease by up to 27%, depression by up to 44%, smoking by up to 33%, and heavy drinking by 24%. Preventing ACE exposure also could reduce lack of health insurance by 4% and unemployment by 15%, the researchers said.
The good news, Dr. Merrick and associates said, is that ACE exposure can be at least partially offset by positive interactions with adults and in social and community settings.
“Prevention of adverse childhood experiences is possible with state and community efforts to build resilient families and communities, provide parental support to develop positive parenting and coping skills, and increase access to, and use of, comprehensive health services,” they said.
The CDC recommends a comprehensive approach to preventing ACEs and mitigating their impact. The data-driven suggestions include:
- Promoting family economic health, including tax credits and family-focused work policy.
- Endorsing programs to mitigate violence and adversity, including public education programs that support parents.
- Promoting early childhood development with high-quality child care and preschool programs.
- Recommending stress reduction skills for parents and young people, and programs that teach safe dating and healthy relationship skills.
- Supporting youth development by connecting youth to adult mentors and after-school programs.
- Encouraging clinicians to identify and address ACE exposure with screening, referral, and support.
“This is important for reducing the consequences of adverse childhood experiences and for helping to protect the next generation of children from exposure to violence and other adverse experiences, such as witnessing substance misuse in their household,” Dr. Merrick and associates said.
The researchers had no relevant financial disclosures.
SOURCE: Merrick M et al. MMWR. 2019 Nov 5. doi: 10.15585/mmwr.mm6844e1.
FROM MMWR
A Health Care Provider Intervention to Address Obesity in Patients with Diabetes (FULL)
Obesity is associated with a significant increase in mortality. It increases the risk of type 2 diabetes mellitus (T2DM), hypertension, hyperlipidemia, and coronary artery disease.1 T2DM is strongly associated with obesity in all ethnic groups.
Medical nutrition therapy and weight loss are very important for DM management.2 This includes providing education about diet modification, increased physical activity, daily calorie intake evaluation, and consistent carbohydrate intake. For patients with T2DM, health care providers (HCPs) should emphasize lowering caloric intake and inducing weight loss for those who are overweight (body mass index [BMI] between 25 and 29.9) and obese (BMI ≥ 30). This can improve glycemic control by decreasing insulin resistance. Initial recommendations for weight loss and physical activity are to lose between 5% and 10% of initial body weight and to accumulate at least 30 minutes of moderate physical activity over the course of most days of the week.3,4
Several formulas are available to estimate baseline caloric intake for weight maintenance. For weight loss of 1 to 2 pounds per week, lowering 500 to 1,000 calories from daily weight maintenance calories serves the goal. The American Diabetes Association (ADA) also suggests that HCPs recommend diet, physical activity, and behavioral therapy designed to achieve > 5% weight loss to overweight and obese patients with T2DM.5
Recognizing the clinical benefits of achieving weight loss in overweight or obese patients with T2DM, we aimed to increase the number of visits in the Endocrine Clinic at Central Arkansas Veterans Healthcare System (CAVHS) in Little Rock that addressed obesity, documented calorie goal for patients who are overweight or obese, and performed an intervention with further education for the patient.
Methods
The study population included veterans with either type 1 DM (T1DM) or T2DM with BMI > 25 on any DM control regimen. We performed a health record review of the eligible patients seen in the CAVHS Endocrine Clinic from June 1, 2016 to July 31, 2016 to determine the baseline percentage of visits that addressed obesity and provided weight loss advice to patients. We obtained a list of patients seen in the clinic during the study period from Strategic Management Service Services at CAVHS. We also obtained information that age, gender, medications, BMI, and last Endocrine clinic HCP assessment from the electronic health record. We reviewed the HCPs notes, including fellows and faculty who were involved in the patients’ treatment, to determine whether their notes documented a BMI > 25 and whether they discussed an intervention for overweight or obesity with the patient. The CAVHS Institutional Review Board reviewed and approved the initiative as a quality improvement study.
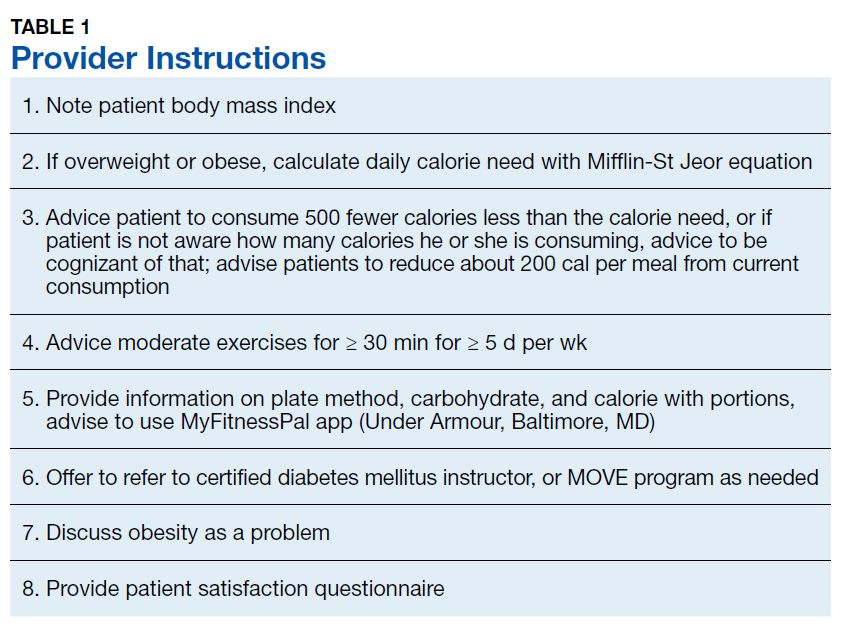
Intervention
Our clinic has a defined group of HCPs that we targeted for the intervention. After getting baseline information, during August 2017 we educated these HCPs on the tools available to calculate calorie goal for the patients. We advised the HCPs to use the Mifflin St Jyor equation for estimating energy expenditure and set a goal of initial weight loss between 5% and 7% of body weight. We gave specific instructions and advice to the providers (Table 1). HCPs also received educational material to distribute to patients that provided information on the healthy plate method, discussed how to count calories, and advised them on ADA goals with carbohydrate limitation. We encouraged HCPs to recommend that patients cut between 500 and 1,000 calories daily from their current diet. HCPs also received advice to seek help from clinical dieticians and the VA MOVE! Weight Management Program when appropriate.
Study of Effect of the Intervention
To study the effect of this intervention, we reviewed documentation by HCPs and assessed patient satisfaction. We obtained a list of patients and reviewed HCP notes on patients with BMI > 25 to assess whether providers addressed obesity in November and December 2017. We also evaluated whether HCPs offered a specific intervention to address the problem, such as providing education material to the patient or an estimate of daily calorie goal, or referring them to clinical dietician and/or the MOVE program. Patients received a 5-question survey that assessed their understanding and satisfaction at the end of the visit (Table 2).
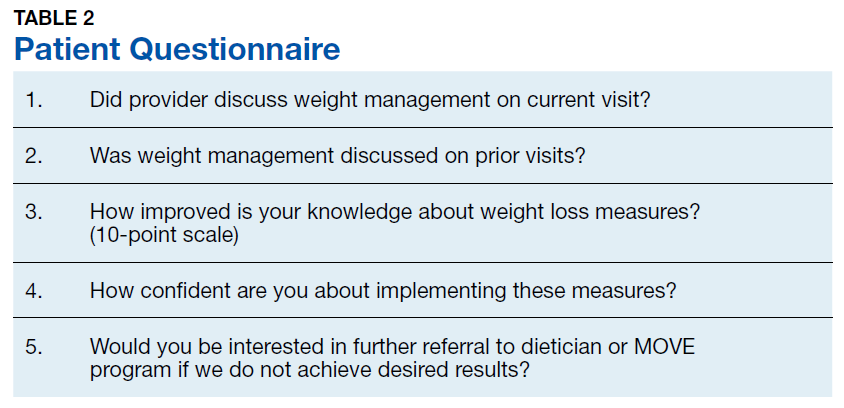
Results
Of the 100 charts reviewed prior to intervention, HCPs discussed obesity management with only 6% of patients. After the intervention, we collected data again through chart review of the patients who were overweight or obese and seen for DM in the same clinic during a 2-month period. Of the 100 charts reviewed, we noticed that recognition and management of obesity improved to 60%.
To evaluate the impact of this intervention, patients received a questionnaire at the end of the visit. Nearly all (97%) patients mentioned that the provider discussed weight management during that visit. Most (83%) patients mentioned that weight management was discussed with them during prior visits, while 70% of patients felt their knowledge on working on weight loss had improved. Almost half (46%) were interested in further referral to a dietician or the MOVE program if they did not achieve desired results, but 78% were confident that they could implement the discussed weight management measures.
Discussion
Increased body weight is associated with worsening of DM and can result in poor glycemic control. Achieving weight loss in overweight or obese patients with DM can lead to clinical benefits; however, this is a challenge. In one study, a DM prevention program with lifestyle intervention leading to weight loss significantly reduced the rate of progression from impaired glucose tolerance to DM over a 3-year period and improved cardiovascular risk factors like elevated blood pressure and dyslipidemia.6 A randomized trial of an intensive lifestyle intervention to increase physical activity and decrease caloric intake vs standard DM education in people with T2DM showed a modest weight loss of 8.6% of initial weight at 1 year.7 This weight loss was associated with significant improvement in blood pressure, glycemic control, fasting blood glucose, high-density lipoprotein (HDL) cholesterol, and triglyceride levels and significant reductions in the use of DM, hypertension, and lipid-lowering medications.7 Obesity attributes to dyslipidemia with increased levels of cholesterol, low-density lipoprotein, very low-density lipoprotein, triglycerides, and decreased levels of HDL by about 5%.8 Obesity also is associated with hypertension, coronary heart disease, heart failure, and cardiovascular and all-cause mortality.9
Limitations
Limitations of this study include the small sample size and that multiple HCPs were involved. The nature of intervention might have differed with different HCPs or in a different setting than a VA clinic. In addition, we did not evaluate the effect on weight loss in specific patients as we only reviewed charts to check whether HCPs addressed weight loss. Nevertheless, our intervention was effective because it improved patient and provider awareness. It also gave us the opportunity to create framework for further collaborations and community building. The Endocrinology department at CAVHS is currently collaborating with the MOVE program, which is a part of the nutrition and food services. We hope to have an endocrinologist involved to provide guidance on medication management for obesity.
Conclusion
At CAVHS a simple intervention was instituted to evaluate whether HCPs were discussing weight loss in patients with DM, providing them with information to assess patients’ daily calorie goal, and prompting them for intervention to achieve weight loss. The intervention led to better management of patients with DM and obesity and greater engagement in weight loss from patients.
This project was a team effort. The clinic nurse documented patient’s BMI on the check in slip. HCPs discussed the problem and specific intervention. The clinical dieticians provided focused education for patients. The clerks collected the patient responses to questionnaire. This project also improved communication within the Endocrine Clinic team. Documentation of HCPs pertaining to addressing obesity improved by 54%. Improved patient satisfaction and insight was evident on patient responses to the questionnaire.
We believe that HCP apathy is a major contributor to the problem of obesity. Small steps like these go a long way for further management of obesity. Most VA hospitals have MOVE programs that provide dietary advice and encourage behavioral changes. However, getting patients to commit to these programs is a challenge. Primary care and endocrine clinics are important services that may help with patient awareness.
This project helped us better recognize patients with obesity and provide them with initial counseling and dietary advice. We received help from clinical dieticians and gave patients the option to join MOVE in situations where initial advice did not yield results and for more consistent follow up.
We tried to improve the care for patients with DM who were overweight or obese at CAVHS by prompting HCPs to focus on obesity as a problem and perform interventions to address this problem. The activities carried out and the data collected were used for internal quality improvement and for encouraging further interventions in the care of these patients.
1. Jensen MD, Ryan DH, Apovian CM, et al; American College of Cardiology/American Heart Association Task Force on Practice Guidelines; Obesity Society. 2013 AHA/ACC/TOS guideline for the management of overweight and obesity in adults: a report of the American College of Cardiology/American Heart Association Task Force on Practice Guidelines and The Obesity Society. Circulation. 2014;129(25 suppl 2):S102-S138.
2. Evert AB, Boucher JL, Cypress M, et al; American Diabetes Association. Nutrition therapy recommendations for the management of adults with diabetes. Diabetes Care. 2013;36(11):3821-3842.
3. NHLBI Obesity Education Initiative Expert Panel on the Identification, Evaluation, and Treatment of Obesity in Adults (US). Clinical Guidelines on the Identification, Evaluation, and Treatment of Overweight and Obesity in Adults: The Evidence Report. Bethesda, MD: National Heart, Lung, and Blood Institute; 1998.
4. US Department of Health and Human Services. Physical Activity and Health: A Report of the Surgeon General. Atlanta, GA: US Department of Health and Human Services, Centers for Disease Control and Prevention, National Center for Chronic Disease Prevention and Health Promotion; 1996.
5. American Diabetes Association. 7. Obesity management for the treatment of type 2 diabetes: Standards of Medical Care in Diabetes-2018. Diabetes Care. 2018;41(Suppl 1):S65-S72.
6. Knowler WC, Barrett-Connor E, Fowler SE, et al; Diabetes Prevention Program Research Group. Reduction in the incidence of type 2 diabetes with lifestyle intervention or metformin. N Engl J Med. 2002;346(6):393-403.
7. Look AHEAD Research Group; Pi-Sunyer X, Blackburn G, et al. Reduction in weight and cardiovascular disease risk factors in individuals with type 2 diabetes: one-year results of the look AHEAD trial. Diabetes Care. 2007;30(6):1374-1383.
8. Poirier P, Giles TD, Bray GA, et al. Obesity and cardiovascular disease: pathophysiology, evaluation, and effect of weight loss. Arterioscler Thromb Vasc Biol. 2006;26(5):968-976.
9. Aune D, Sen A, Norat T, et al. Body mass index, abdominal fatness, and heart failure incidence and mortality: a systematic review and dose-response meta-analysis of prospective studies. Circulation. 2016;133(7):639-649.
Obesity is associated with a significant increase in mortality. It increases the risk of type 2 diabetes mellitus (T2DM), hypertension, hyperlipidemia, and coronary artery disease.1 T2DM is strongly associated with obesity in all ethnic groups.
Medical nutrition therapy and weight loss are very important for DM management.2 This includes providing education about diet modification, increased physical activity, daily calorie intake evaluation, and consistent carbohydrate intake. For patients with T2DM, health care providers (HCPs) should emphasize lowering caloric intake and inducing weight loss for those who are overweight (body mass index [BMI] between 25 and 29.9) and obese (BMI ≥ 30). This can improve glycemic control by decreasing insulin resistance. Initial recommendations for weight loss and physical activity are to lose between 5% and 10% of initial body weight and to accumulate at least 30 minutes of moderate physical activity over the course of most days of the week.3,4
Several formulas are available to estimate baseline caloric intake for weight maintenance. For weight loss of 1 to 2 pounds per week, lowering 500 to 1,000 calories from daily weight maintenance calories serves the goal. The American Diabetes Association (ADA) also suggests that HCPs recommend diet, physical activity, and behavioral therapy designed to achieve > 5% weight loss to overweight and obese patients with T2DM.5
Recognizing the clinical benefits of achieving weight loss in overweight or obese patients with T2DM, we aimed to increase the number of visits in the Endocrine Clinic at Central Arkansas Veterans Healthcare System (CAVHS) in Little Rock that addressed obesity, documented calorie goal for patients who are overweight or obese, and performed an intervention with further education for the patient.
Methods
The study population included veterans with either type 1 DM (T1DM) or T2DM with BMI > 25 on any DM control regimen. We performed a health record review of the eligible patients seen in the CAVHS Endocrine Clinic from June 1, 2016 to July 31, 2016 to determine the baseline percentage of visits that addressed obesity and provided weight loss advice to patients. We obtained a list of patients seen in the clinic during the study period from Strategic Management Service Services at CAVHS. We also obtained information that age, gender, medications, BMI, and last Endocrine clinic HCP assessment from the electronic health record. We reviewed the HCPs notes, including fellows and faculty who were involved in the patients’ treatment, to determine whether their notes documented a BMI > 25 and whether they discussed an intervention for overweight or obesity with the patient. The CAVHS Institutional Review Board reviewed and approved the initiative as a quality improvement study.
Intervention
Our clinic has a defined group of HCPs that we targeted for the intervention. After getting baseline information, during August 2017 we educated these HCPs on the tools available to calculate calorie goal for the patients. We advised the HCPs to use the Mifflin St Jyor equation for estimating energy expenditure and set a goal of initial weight loss between 5% and 7% of body weight. We gave specific instructions and advice to the providers (Table 1). HCPs also received educational material to distribute to patients that provided information on the healthy plate method, discussed how to count calories, and advised them on ADA goals with carbohydrate limitation. We encouraged HCPs to recommend that patients cut between 500 and 1,000 calories daily from their current diet. HCPs also received advice to seek help from clinical dieticians and the VA MOVE! Weight Management Program when appropriate.
Study of Effect of the Intervention
To study the effect of this intervention, we reviewed documentation by HCPs and assessed patient satisfaction. We obtained a list of patients and reviewed HCP notes on patients with BMI > 25 to assess whether providers addressed obesity in November and December 2017. We also evaluated whether HCPs offered a specific intervention to address the problem, such as providing education material to the patient or an estimate of daily calorie goal, or referring them to clinical dietician and/or the MOVE program. Patients received a 5-question survey that assessed their understanding and satisfaction at the end of the visit (Table 2).
Results
Of the 100 charts reviewed prior to intervention, HCPs discussed obesity management with only 6% of patients. After the intervention, we collected data again through chart review of the patients who were overweight or obese and seen for DM in the same clinic during a 2-month period. Of the 100 charts reviewed, we noticed that recognition and management of obesity improved to 60%.
To evaluate the impact of this intervention, patients received a questionnaire at the end of the visit. Nearly all (97%) patients mentioned that the provider discussed weight management during that visit. Most (83%) patients mentioned that weight management was discussed with them during prior visits, while 70% of patients felt their knowledge on working on weight loss had improved. Almost half (46%) were interested in further referral to a dietician or the MOVE program if they did not achieve desired results, but 78% were confident that they could implement the discussed weight management measures.
Discussion
Increased body weight is associated with worsening of DM and can result in poor glycemic control. Achieving weight loss in overweight or obese patients with DM can lead to clinical benefits; however, this is a challenge. In one study, a DM prevention program with lifestyle intervention leading to weight loss significantly reduced the rate of progression from impaired glucose tolerance to DM over a 3-year period and improved cardiovascular risk factors like elevated blood pressure and dyslipidemia.6 A randomized trial of an intensive lifestyle intervention to increase physical activity and decrease caloric intake vs standard DM education in people with T2DM showed a modest weight loss of 8.6% of initial weight at 1 year.7 This weight loss was associated with significant improvement in blood pressure, glycemic control, fasting blood glucose, high-density lipoprotein (HDL) cholesterol, and triglyceride levels and significant reductions in the use of DM, hypertension, and lipid-lowering medications.7 Obesity attributes to dyslipidemia with increased levels of cholesterol, low-density lipoprotein, very low-density lipoprotein, triglycerides, and decreased levels of HDL by about 5%.8 Obesity also is associated with hypertension, coronary heart disease, heart failure, and cardiovascular and all-cause mortality.9
Limitations
Limitations of this study include the small sample size and that multiple HCPs were involved. The nature of intervention might have differed with different HCPs or in a different setting than a VA clinic. In addition, we did not evaluate the effect on weight loss in specific patients as we only reviewed charts to check whether HCPs addressed weight loss. Nevertheless, our intervention was effective because it improved patient and provider awareness. It also gave us the opportunity to create framework for further collaborations and community building. The Endocrinology department at CAVHS is currently collaborating with the MOVE program, which is a part of the nutrition and food services. We hope to have an endocrinologist involved to provide guidance on medication management for obesity.
Conclusion
At CAVHS a simple intervention was instituted to evaluate whether HCPs were discussing weight loss in patients with DM, providing them with information to assess patients’ daily calorie goal, and prompting them for intervention to achieve weight loss. The intervention led to better management of patients with DM and obesity and greater engagement in weight loss from patients.
This project was a team effort. The clinic nurse documented patient’s BMI on the check in slip. HCPs discussed the problem and specific intervention. The clinical dieticians provided focused education for patients. The clerks collected the patient responses to questionnaire. This project also improved communication within the Endocrine Clinic team. Documentation of HCPs pertaining to addressing obesity improved by 54%. Improved patient satisfaction and insight was evident on patient responses to the questionnaire.
We believe that HCP apathy is a major contributor to the problem of obesity. Small steps like these go a long way for further management of obesity. Most VA hospitals have MOVE programs that provide dietary advice and encourage behavioral changes. However, getting patients to commit to these programs is a challenge. Primary care and endocrine clinics are important services that may help with patient awareness.
This project helped us better recognize patients with obesity and provide them with initial counseling and dietary advice. We received help from clinical dieticians and gave patients the option to join MOVE in situations where initial advice did not yield results and for more consistent follow up.
We tried to improve the care for patients with DM who were overweight or obese at CAVHS by prompting HCPs to focus on obesity as a problem and perform interventions to address this problem. The activities carried out and the data collected were used for internal quality improvement and for encouraging further interventions in the care of these patients.
1. Jensen MD, Ryan DH, Apovian CM, et al; American College of Cardiology/American Heart Association Task Force on Practice Guidelines; Obesity Society. 2013 AHA/ACC/TOS guideline for the management of overweight and obesity in adults: a report of the American College of Cardiology/American Heart Association Task Force on Practice Guidelines and The Obesity Society. Circulation. 2014;129(25 suppl 2):S102-S138.
2. Evert AB, Boucher JL, Cypress M, et al; American Diabetes Association. Nutrition therapy recommendations for the management of adults with diabetes. Diabetes Care. 2013;36(11):3821-3842.
3. NHLBI Obesity Education Initiative Expert Panel on the Identification, Evaluation, and Treatment of Obesity in Adults (US). Clinical Guidelines on the Identification, Evaluation, and Treatment of Overweight and Obesity in Adults: The Evidence Report. Bethesda, MD: National Heart, Lung, and Blood Institute; 1998.
4. US Department of Health and Human Services. Physical Activity and Health: A Report of the Surgeon General. Atlanta, GA: US Department of Health and Human Services, Centers for Disease Control and Prevention, National Center for Chronic Disease Prevention and Health Promotion; 1996.
5. American Diabetes Association. 7. Obesity management for the treatment of type 2 diabetes: Standards of Medical Care in Diabetes-2018. Diabetes Care. 2018;41(Suppl 1):S65-S72.
6. Knowler WC, Barrett-Connor E, Fowler SE, et al; Diabetes Prevention Program Research Group. Reduction in the incidence of type 2 diabetes with lifestyle intervention or metformin. N Engl J Med. 2002;346(6):393-403.
7. Look AHEAD Research Group; Pi-Sunyer X, Blackburn G, et al. Reduction in weight and cardiovascular disease risk factors in individuals with type 2 diabetes: one-year results of the look AHEAD trial. Diabetes Care. 2007;30(6):1374-1383.
8. Poirier P, Giles TD, Bray GA, et al. Obesity and cardiovascular disease: pathophysiology, evaluation, and effect of weight loss. Arterioscler Thromb Vasc Biol. 2006;26(5):968-976.
9. Aune D, Sen A, Norat T, et al. Body mass index, abdominal fatness, and heart failure incidence and mortality: a systematic review and dose-response meta-analysis of prospective studies. Circulation. 2016;133(7):639-649.
Should I evaluate my patient with atrial fibrillation for sleep apnea?
Yes. The prevalence of sleep apnea is exceedingly high in patients with atrial fibrillation—50% to 80% compared with 30% to 60% in respective control groups.1–3 Conversely, atrial fibrillation is more prevalent in those with sleep-disordered breathing than in those without (4.8% vs 0.9%).4
Sleep-disordered breathing comprises obstructive sleep apnea and central sleep apnea. Obstructive sleep apnea, characterized by repetitive upper-airway obstruction during sleep, is accompanied by intermittent hypoxia, rises in carbon dioxide, autonomic nervous system fluctuations, and intrathoracic pressure alterations.5 Central sleep apnea may be neurally mediated and, in the setting of cardiac disease, is characterized by alterations in chemosensitivity and chemoresponsiveness, leading to a state of high loop gain—ie, a hypersensitive ventilatory control system leading to ventilatory drive oscillations.6
Both obstructive and central sleep apnea have been associated with atrial fibrillation. Experimental data implicate obstructive sleep apnea as a trigger of atrial arrhythmogenesis,7,8 and epidemiologic studies support an association between central sleep apnea, Cheyne-Stokes respiration, and incident atrial fibrillation.9
HOW SLEEP APNEA COULD LEAD TO ATRIAL FIBRILLATION
In experiments in animals, intermittent upper-airway obstruction led to forced inspiration, substantial negative intrathoracic pressure, subsequent left atrial distention, and increased susceptibility to atrial fibrillation.10 The autonomic nervous system may be a mediator of apnea-induced atrial fibrillation, as apnea-induced atrial fibrillation is suppressed with autonomic blockade.10
Emerging data also support the hypothesis that intermittent hypoxia7 and resolution of hypercapnia,8 as observed in obstructive sleep apnea, exert atrial electrophysiologic changes that increase vulnerability to atrial arrhythmogenesis.
In a case-crossover study,11 the odds of paroxysmal atrial fibrillation occurring after a respiratory disturbance were 17.9 times higher than after normal breathing (95% confidence interval [CI] 2.2–144.2), though the absolute rate of overall arrhythmia events (including both atrial fibrillation and nonsustained ventricular tachycardia) associated with respiratory disturbances was low (1 excess arrhythmia event per 40,000 respiratory disturbances).
EFFECT OF SLEEP APNEA ON ATRIAL FIBRILLATION MANAGEMENT
Sleep apnea also seems to affect the efficacy of a rhythm-control strategy for atrial fibrillation. For example, patients with obstructive sleep apnea have a higher risk of recurrent atrial fibrillation after cardioversion (82% vs 42% in controls)12 and up to a 25% greater risk of recurrence after catheter ablation compared with those without obstructive sleep apnea (risk ratio 1.25, 95% CI 1.08–1.45).13
Several observational studies showed a higher rate of atrial fibrillation after pulmonary vein isolation in obstructive sleep apnea patients who do not use continuous positive airway pressure (CPAP) than in those who do.14–17 CPAP therapy appears to exert beneficial effects on cardiac structural remodeling; cardiac magnetic resonance imaging shows that patients with sleep apnea who received less than 4 hours of CPAP per night had larger left atrial dimensions and increased left ventricular mass compared with those who received more than 4 hours of CPAP at night.17 However, a need remains for high-quality, large randomized controlled trials to eliminate potential unmeasured biases due to differences that may exist between CPAP users and non-users, such as general adherence to medical therapy and healthcare interventions.
An additional consideration is that the overall utility and value of obtaining a diagnosis of obstructive sleep apnea strictly as it pertains to atrial fibrillation management is affected by whether a rhythm- or rate-control strategy is pursued. In other words, if a patient is deemed to be in permanent atrial fibrillation and a rhythm-control strategy is therefore not pursued, the potential effect of untreated obstructive sleep apnea on atrial fibrillation recurrence could be less important. In this case, however, the other beneficial cardiovascular and systemic effects of diagnosing and treating underlying obstructive sleep apnea would remain.
POPULATION STUDIES
Epidemiologic and clinic-based studies have supported an association between sleep apnea (mostly central, but also obstructive) and atrial fibrillation.4,18
Community-based studies such as the Sleep Heart Health Study4 and the Outcomes of Sleep Disorders in Older Men Study (MrOS Sleep),18 involving thousands of participants, have found the strongest cross-sectional associations of both obstructive and central sleep apnea with nocturnal atrial fibrillation. The findings included a 2 to 5 times higher odds of nocturnal atrial fibrillation, particularly in those with a moderate to severe degree of sleep-disordered breathing—even after adjusting for confounding influences (eg, obesity) and self-reported cardiac disease such as heart failure.
In MrOS Sleep, in an older male cohort, both obstructive and central sleep apnea were associated with nocturnal atrial fibrillation, though central sleep apnea and Cheyne-Stokes respirations had a stronger magnitude of association.18
Further insights can be drawn specifically from patients with heart failure. Sin et al,19 in a 1999 study, found that in 450 patients with systolic heart failure (85% men), the prevalence of sleep-disordered breathing was 25% to 33% (depending on the apnea-hypopnea index cutoff used) for central sleep apnea, and similarly 27% to 38% for obstructive sleep apnea. The prevalence of atrial fibrillation in this group was 10% in women and 15% in men. Atrial fibrillation was reported as a significant risk factor for central sleep apnea, but not for obstructive sleep apnea (for which only male sex and increasing body mass index were significant risk factors). Directionality was not clearly reported in this retrospective study in terms of timing of sleep studies and other assessments: ie, the report did not clearly state which came first, the atrial fibrillation or the sleep apnea. Therefore, the possibility that central sleep apnea is a predictor of atrial fibrillation cannot be excluded.
Yumino et al,20 in a study published in 2009, evaluated 218 patients with heart failure (with a left ventricular ejection fraction of ≤ 45%) and reported a prevalence of moderate to severe sleep apnea of 21% for central sleep apnea and 26% for obstructive sleep apnea. In multivariate analysis, atrial fibrillation was independently associated with central sleep apnea but not obstructive sleep apnea.
In recent cohort studies, central sleep apnea was associated with 2 to 3 times higher odds of developing atrial fibrillation, while obstructive sleep apnea was not a predictor of incident atrial fibrillation.9,21
Although most available studies associate sleep apnea with atrial fibrillation, findings of a case-control study22 did not support a difference in the prevalence of sleep apnea syndrome (defined as apnea index ≥ 5 and apnea-hypopnea index ≥ 15, and the presence of sleep symptoms) in patients with lone atrial fibrillation (no evident cardiovascular disease) compared with controls matched for age, sex, and cardiovascular morbidity.
But observational studies are limited by the potential for residual unmeasured confounding factors and lack of objective cardiac structural data, such as left ventricular ejection fraction and atrial enlargement. Moreover, there can be significant differences in sleep apnea definitions among studies, thus limiting the ability to reach a definitive conclusion about the relationship between sleep apnea and atrial fibrillation.
SCREENING AND DIAGNOSIS
The 2014 joint guidelines of the American Heart Association, American College of Cardiology, and Heart Rhythm Society for the management of atrial fibrillation state that a sleep study may be useful if sleep apnea is suspected.23 The 2019 focused update of the 2014 guidelines24 state that for overweight and obese patients with atrial fibrillation, weight loss combined with risk-factor modification is recommended (class I recommendation, level of evidence B-R, ie, data derived from 1 or more randomized trials or meta-analysis of such studies). Risk-factor modification in this case includes assessment and treatment of underlying sleep apnea, hypertension, hyperlipidemia, glucose intolerance, and alcohol and tobacco use.

Laboratory polysomnography has long been considered the gold standard for sleep apnea diagnosis. In one study,13 obstructive sleep apnea was a greater predictor of atrial fibrillation when diagnosed by polysomnography (risk ratio 1.40, 95% CI 1.16–1.68) compared with identification by screening using the Berlin questionnaire (risk ratio 1.07, 95% CI 0.91–1.27). However, a laboratory sleep study is associated with increased patient burden and limited availability.
Home sleep apnea testing is being increasingly used in the diagnostic evaluation of obstructive sleep apnea and may be a less costly, more available alternative. However, since a home sleep apnea test is less sensitive than polysomnography in detecting obstructive sleep apnea, the American Academy of Sleep Medicine guidelines28 state that if a single home sleep apnea test is negative or inconclusive, polysomnography should be done if there is clinical suspicion of sleep apnea. Moreover, current guidelines from this group recommend that patients with significant cardiorespiratory disease should be tested with polysomnography rather than home sleep apnea testing.22
Further study is needed to determine the optimal screening method for sleep apnea in patients with atrial fibrillation and to clarify the role of home sleep apnea testing. While keeping in mind the limitations of a screening questionnaire in this population, as a general approach it is reasonable to use a screening questionnaire for sleep apnea. And if the screen is positive, further evaluation with a sleep study is merited, whether by laboratory polysomnography, a home sleep apnea test, or referral to a sleep specialist.
MULTIDISCIPLINARY CARE MAY BE IDEAL
Overall, given the high prevalence of sleep apnea in patients with atrial fibrillation, the deleterious effects of sleep apnea in general, the influence of sleep apnea on atrial fibrillation, and the cardiovascular and other beneficial effects of adequate treatment of sleep apnea, patients with atrial fibrillation should be assessed for sleep apnea.
While the optimal strategy in evaluating for sleep apnea in these patients needs to be further defined, a multidisciplinary approach to care involving a primary care provider, cardiologist, and sleep specialist may be ideal.
- Braga B, Poyares D, Cintra F, et al. Sleep-disordered breathing and chronic atrial fibrillation. Sleep Med 2009; 10(2):212–216. doi:10.1016/j.sleep.2007.12.007
- Gami AS, Pressman G, Caples SM, et al. Association of atrial fibrillation and obstructive sleep apnea. Circulation 2004; 110(4):364–367. doi:10.1161/01.CIR.0000136587.68725.8E
- Stevenson IH, Teichtahl H, Cunnington D, Ciavarella S, Gordon I, Kalman JM. Prevalence of sleep disordered breathing in paroxysmal and persistent atrial fibrillation patients with normal left ventricular function. Eur Heart J 2008; 29(13):1662–1669. doi:10.1093/eurheartj/ehn214
- Mehra R, Benjamin EJ, Shahar E, et al. Association of nocturnal arrhythmias with sleep-disordered breathing: The Sleep Heart Health Study. Am J Respir Crit Care Med 2006; 173(8):910–916. doi:10.1164/rccm.200509-1442OC
- Cooper VL, Bowker CM, Pearson SB, Elliott MW, Hainsworth R. Effects of simulated obstructive sleep apnoea on the human carotid baroreceptor-vascular resistance reflex. J Physiol 2004; 557(pt 3):1055–1065. doi:10.1113/jphysiol.2004.062513
- Eckert DJ, Jordan AS, Merchia P, Malhotra A. Central sleep apnea: pathophysiology and treatment. Chest 2007; 131(2):595–607. doi:10.1378/chest.06.2287
- Lévy P, Pépin JL, Arnaud C, et al. Intermittent hypoxia and sleep-disordered breathing: current concepts and perspectives. Eur Respir J 2008; 32(4):1082–1095. doi:10.1183/09031936.00013308
- Stevenson IH, Roberts-Thomson KC, Kistler PM, et al. Atrial electrophysiology is altered by acute hypercapnia but not hypoxemia: implications for promotion of atrial fibrillation in pulmonary disease and sleep apnea. Heart Rhythm 2010; 7(9):1263–1270. doi:10.1016/j.hrthm.2010.03.020
- Tung P, Levitzky YS, Wang R, et al. Obstructive and central sleep apnea and the risk of incident atrial fibrillation in a community cohort of men and women. J Am Heart Assoc 2017; 6(7). doi:10.1161/JAHA.116.004500
- Iwasaki YK, Shi Y, Benito B, et al. Determinants of atrial fibrillation in an animal model of obesity and acute obstructive sleep apnea. Heart Rhythm 2012; 9(9):1409–1416.e1. doi:10.1016/j.hrthm.2012.03.024
- Monahan K, Storfer-Isser A, Mehra R, et al. Triggering of nocturnal arrhythmias by sleep-disordered breathing events. J Am Coll Cardiol 2009; 54(19):1797–1804. doi:10.1016/j.jacc.2009.06.038
- Kanagala R, Murali NS, Friedman PA, et al. Obstructive sleep apnea and the recurrence of atrial fibrillation. Circulation 2003; 107(20):2589–2594. doi:10.1161/01.CIR.0000068337.25994.21
- Ng CY, Liu T, Shehata M, Stevens S, Chugh SS, Wang X. Meta-analysis of obstructive sleep apnea as predictor of atrial fibrillation recurrence after catheter ablation. Am J Cardiol 2011; 108(1):47–51. doi:10.1016/j.amjcard.2011.02.343
- Naruse Y, Tada H, Satoh M, et al. Concomitant obstructive sleep apnea increases the recurrence of atrial fibrillation following radiofrequency catheter ablation of atrial fibrillation: clinical impact of continuous positive airway pressure therapy. Heart Rhythm 2013; 10(3):331–337. doi:10.1016/j.hrthm.2012.11.015
- Fein AS, Shvilkin A, Shah D, et al. Treatment of obstructive sleep apnea reduces the risk of atrial fibrillation recurrence after catheter ablation. J Am Coll Cardiol 2013; 62(4):300–305. doi:10.1016/j.jacc.2013.03.052
- Patel D, Mohanty P, Di Biase L, et al. Safety and efficacy of pulmonary vein antral isolation in patients with obstructive sleep apnea: the impact of continuous positive airway pressure. Circ Arrhythm Electrophysiol 2010; 3(5):445–451. doi:10.1161/CIRCEP.109.858381
- Neilan TG, Farhad H, Dodson JA, et al. Effect of sleep apnea and continuous positive airway pressure on cardiac structure and recurrence of atrial fibrillation. J Am Heart Assoc 2013; 2(6):e000421. doi:10.1161/JAHA.113.000421
- Mehra R, Stone KL, Varosy PD, et al. Nocturnal arrhythmias across a spectrum of obstructive and central sleep-disordered breathing in older men: outcomes of sleep disorders in older men (MrOS sleep) study. Arch Intern Med 2009; 169(12):1147–1155. doi:10.1001/archinternmed.2009.138
- Sin DD, Fitzgerald F, Parker JD, Newton G, Floras JS, Bradley TD. Risk factors for central and obstructive sleep apnea in 450 men and women with congestive heart failure. Am J Respir Crit Care Med 1999; 160(4):1101–1106. doi:10.1164/ajrccm.160.4.9903020
- Yumino D, Wang H, Floras JS, et al. Prevalence and physiological predictors of sleep apnea in patients with heart failure and systolic dysfunction. J Card Fail 2009; 15(4):279–285. doi:10.1016/j.cardfail.2008.11.015
- May AM, Blackwell T, Stone PH, et al; MrOS Sleep (Outcomes of Sleep Disorders in Older Men) Study Group. Central sleep-disordered breathing predicts incident atrial fibrillation in older men. Am J Respir Crit Care Med 2016; 193(7):783–791. doi:10.1164/rccm.201508-1523OC
- Porthan KM, Melin JH, Kupila JT, Venho KK, Partinen MM. Prevalence of sleep apnea syndrome in lone atrial fibrillation: a case-control study. Chest 2004; 125(3):879–885. doi:10.1378/chest.125.3.879
- January CT, Wann LS, Alpert JS, et al; ACC/AHA Task Force Members. 2014 AHA/ACC/HRS guideline for the management of patients with atrial fibrillation: a report of the American College of Cardiology/American Heart Association Task Force on practice guidelines and the Heart Rhythm Society. Circulation 2014; 130(23):e199–e267. doi:10.1161/CIR.0000000000000041
- Writing Group Members; January CT, Wann LS, Calkins H, et al. 2019 AHA/ACC/HRS focused update of the 2014 AHA/ACC/HRS guideline for the management of patients with atrial fibrillation: a report of the American College of Cardiology/American Heart Association Task Force on Clinical Practice Guidelines and the Heart Rhythm Society. Heart Rhythm. 2019; 16(8):e66–e93. doi:10.1016/j.hrthm.2019.01.024
- Netzer NC, Stoohs RA, Netzer CM, Clark K, Strohl KP. Using the Berlin Questionnaire to identify patients at risk for the sleep apnea syndrome. Ann Intern Med 1999; 131(7):485–491. doi:10.7326/0003-4819-131-7-199910050-00002
- Chung F, Abdullah HR, Liao P. STOP-bang questionnaire a practical approach to screen for obstructive sleep apnea. Chest 2016; 149(3):631–638. doi:10.1378/chest.15-0903
- Marti-Soler H, Hirotsu C, Marques-Vidal P, et al. The NoSAS score for screening of sleep-disordered breathing: a derivation and validation study. Lancet Respir Med 2016; 4(9):742–748. doi:10.1016/S2213-2600(16)30075-3
- Kapur VK, Auckley DH, Chowdhuri S, et al. Clinical practice guideline for diagnostic testing for adult obstructive sleep apnea: an American Academy of Sleep Medicine clinical practice guideline. J Clin Sleep Med 2017; 13(3):479–504. doi:10.5664/jcsm.6506
Yes. The prevalence of sleep apnea is exceedingly high in patients with atrial fibrillation—50% to 80% compared with 30% to 60% in respective control groups.1–3 Conversely, atrial fibrillation is more prevalent in those with sleep-disordered breathing than in those without (4.8% vs 0.9%).4
Sleep-disordered breathing comprises obstructive sleep apnea and central sleep apnea. Obstructive sleep apnea, characterized by repetitive upper-airway obstruction during sleep, is accompanied by intermittent hypoxia, rises in carbon dioxide, autonomic nervous system fluctuations, and intrathoracic pressure alterations.5 Central sleep apnea may be neurally mediated and, in the setting of cardiac disease, is characterized by alterations in chemosensitivity and chemoresponsiveness, leading to a state of high loop gain—ie, a hypersensitive ventilatory control system leading to ventilatory drive oscillations.6
Both obstructive and central sleep apnea have been associated with atrial fibrillation. Experimental data implicate obstructive sleep apnea as a trigger of atrial arrhythmogenesis,7,8 and epidemiologic studies support an association between central sleep apnea, Cheyne-Stokes respiration, and incident atrial fibrillation.9
HOW SLEEP APNEA COULD LEAD TO ATRIAL FIBRILLATION
In experiments in animals, intermittent upper-airway obstruction led to forced inspiration, substantial negative intrathoracic pressure, subsequent left atrial distention, and increased susceptibility to atrial fibrillation.10 The autonomic nervous system may be a mediator of apnea-induced atrial fibrillation, as apnea-induced atrial fibrillation is suppressed with autonomic blockade.10
Emerging data also support the hypothesis that intermittent hypoxia7 and resolution of hypercapnia,8 as observed in obstructive sleep apnea, exert atrial electrophysiologic changes that increase vulnerability to atrial arrhythmogenesis.
In a case-crossover study,11 the odds of paroxysmal atrial fibrillation occurring after a respiratory disturbance were 17.9 times higher than after normal breathing (95% confidence interval [CI] 2.2–144.2), though the absolute rate of overall arrhythmia events (including both atrial fibrillation and nonsustained ventricular tachycardia) associated with respiratory disturbances was low (1 excess arrhythmia event per 40,000 respiratory disturbances).
EFFECT OF SLEEP APNEA ON ATRIAL FIBRILLATION MANAGEMENT
Sleep apnea also seems to affect the efficacy of a rhythm-control strategy for atrial fibrillation. For example, patients with obstructive sleep apnea have a higher risk of recurrent atrial fibrillation after cardioversion (82% vs 42% in controls)12 and up to a 25% greater risk of recurrence after catheter ablation compared with those without obstructive sleep apnea (risk ratio 1.25, 95% CI 1.08–1.45).13
Several observational studies showed a higher rate of atrial fibrillation after pulmonary vein isolation in obstructive sleep apnea patients who do not use continuous positive airway pressure (CPAP) than in those who do.14–17 CPAP therapy appears to exert beneficial effects on cardiac structural remodeling; cardiac magnetic resonance imaging shows that patients with sleep apnea who received less than 4 hours of CPAP per night had larger left atrial dimensions and increased left ventricular mass compared with those who received more than 4 hours of CPAP at night.17 However, a need remains for high-quality, large randomized controlled trials to eliminate potential unmeasured biases due to differences that may exist between CPAP users and non-users, such as general adherence to medical therapy and healthcare interventions.
An additional consideration is that the overall utility and value of obtaining a diagnosis of obstructive sleep apnea strictly as it pertains to atrial fibrillation management is affected by whether a rhythm- or rate-control strategy is pursued. In other words, if a patient is deemed to be in permanent atrial fibrillation and a rhythm-control strategy is therefore not pursued, the potential effect of untreated obstructive sleep apnea on atrial fibrillation recurrence could be less important. In this case, however, the other beneficial cardiovascular and systemic effects of diagnosing and treating underlying obstructive sleep apnea would remain.
POPULATION STUDIES
Epidemiologic and clinic-based studies have supported an association between sleep apnea (mostly central, but also obstructive) and atrial fibrillation.4,18
Community-based studies such as the Sleep Heart Health Study4 and the Outcomes of Sleep Disorders in Older Men Study (MrOS Sleep),18 involving thousands of participants, have found the strongest cross-sectional associations of both obstructive and central sleep apnea with nocturnal atrial fibrillation. The findings included a 2 to 5 times higher odds of nocturnal atrial fibrillation, particularly in those with a moderate to severe degree of sleep-disordered breathing—even after adjusting for confounding influences (eg, obesity) and self-reported cardiac disease such as heart failure.
In MrOS Sleep, in an older male cohort, both obstructive and central sleep apnea were associated with nocturnal atrial fibrillation, though central sleep apnea and Cheyne-Stokes respirations had a stronger magnitude of association.18
Further insights can be drawn specifically from patients with heart failure. Sin et al,19 in a 1999 study, found that in 450 patients with systolic heart failure (85% men), the prevalence of sleep-disordered breathing was 25% to 33% (depending on the apnea-hypopnea index cutoff used) for central sleep apnea, and similarly 27% to 38% for obstructive sleep apnea. The prevalence of atrial fibrillation in this group was 10% in women and 15% in men. Atrial fibrillation was reported as a significant risk factor for central sleep apnea, but not for obstructive sleep apnea (for which only male sex and increasing body mass index were significant risk factors). Directionality was not clearly reported in this retrospective study in terms of timing of sleep studies and other assessments: ie, the report did not clearly state which came first, the atrial fibrillation or the sleep apnea. Therefore, the possibility that central sleep apnea is a predictor of atrial fibrillation cannot be excluded.
Yumino et al,20 in a study published in 2009, evaluated 218 patients with heart failure (with a left ventricular ejection fraction of ≤ 45%) and reported a prevalence of moderate to severe sleep apnea of 21% for central sleep apnea and 26% for obstructive sleep apnea. In multivariate analysis, atrial fibrillation was independently associated with central sleep apnea but not obstructive sleep apnea.
In recent cohort studies, central sleep apnea was associated with 2 to 3 times higher odds of developing atrial fibrillation, while obstructive sleep apnea was not a predictor of incident atrial fibrillation.9,21
Although most available studies associate sleep apnea with atrial fibrillation, findings of a case-control study22 did not support a difference in the prevalence of sleep apnea syndrome (defined as apnea index ≥ 5 and apnea-hypopnea index ≥ 15, and the presence of sleep symptoms) in patients with lone atrial fibrillation (no evident cardiovascular disease) compared with controls matched for age, sex, and cardiovascular morbidity.
But observational studies are limited by the potential for residual unmeasured confounding factors and lack of objective cardiac structural data, such as left ventricular ejection fraction and atrial enlargement. Moreover, there can be significant differences in sleep apnea definitions among studies, thus limiting the ability to reach a definitive conclusion about the relationship between sleep apnea and atrial fibrillation.
SCREENING AND DIAGNOSIS
The 2014 joint guidelines of the American Heart Association, American College of Cardiology, and Heart Rhythm Society for the management of atrial fibrillation state that a sleep study may be useful if sleep apnea is suspected.23 The 2019 focused update of the 2014 guidelines24 state that for overweight and obese patients with atrial fibrillation, weight loss combined with risk-factor modification is recommended (class I recommendation, level of evidence B-R, ie, data derived from 1 or more randomized trials or meta-analysis of such studies). Risk-factor modification in this case includes assessment and treatment of underlying sleep apnea, hypertension, hyperlipidemia, glucose intolerance, and alcohol and tobacco use.
Laboratory polysomnography has long been considered the gold standard for sleep apnea diagnosis. In one study,13 obstructive sleep apnea was a greater predictor of atrial fibrillation when diagnosed by polysomnography (risk ratio 1.40, 95% CI 1.16–1.68) compared with identification by screening using the Berlin questionnaire (risk ratio 1.07, 95% CI 0.91–1.27). However, a laboratory sleep study is associated with increased patient burden and limited availability.
Home sleep apnea testing is being increasingly used in the diagnostic evaluation of obstructive sleep apnea and may be a less costly, more available alternative. However, since a home sleep apnea test is less sensitive than polysomnography in detecting obstructive sleep apnea, the American Academy of Sleep Medicine guidelines28 state that if a single home sleep apnea test is negative or inconclusive, polysomnography should be done if there is clinical suspicion of sleep apnea. Moreover, current guidelines from this group recommend that patients with significant cardiorespiratory disease should be tested with polysomnography rather than home sleep apnea testing.22
Further study is needed to determine the optimal screening method for sleep apnea in patients with atrial fibrillation and to clarify the role of home sleep apnea testing. While keeping in mind the limitations of a screening questionnaire in this population, as a general approach it is reasonable to use a screening questionnaire for sleep apnea. And if the screen is positive, further evaluation with a sleep study is merited, whether by laboratory polysomnography, a home sleep apnea test, or referral to a sleep specialist.
MULTIDISCIPLINARY CARE MAY BE IDEAL
Overall, given the high prevalence of sleep apnea in patients with atrial fibrillation, the deleterious effects of sleep apnea in general, the influence of sleep apnea on atrial fibrillation, and the cardiovascular and other beneficial effects of adequate treatment of sleep apnea, patients with atrial fibrillation should be assessed for sleep apnea.
While the optimal strategy in evaluating for sleep apnea in these patients needs to be further defined, a multidisciplinary approach to care involving a primary care provider, cardiologist, and sleep specialist may be ideal.
- Braga B, Poyares D, Cintra F, et al. Sleep-disordered breathing and chronic atrial fibrillation. Sleep Med 2009; 10(2):212–216. doi:10.1016/j.sleep.2007.12.007
- Gami AS, Pressman G, Caples SM, et al. Association of atrial fibrillation and obstructive sleep apnea. Circulation 2004; 110(4):364–367. doi:10.1161/01.CIR.0000136587.68725.8E
- Stevenson IH, Teichtahl H, Cunnington D, Ciavarella S, Gordon I, Kalman JM. Prevalence of sleep disordered breathing in paroxysmal and persistent atrial fibrillation patients with normal left ventricular function. Eur Heart J 2008; 29(13):1662–1669. doi:10.1093/eurheartj/ehn214
- Mehra R, Benjamin EJ, Shahar E, et al. Association of nocturnal arrhythmias with sleep-disordered breathing: The Sleep Heart Health Study. Am J Respir Crit Care Med 2006; 173(8):910–916. doi:10.1164/rccm.200509-1442OC
- Cooper VL, Bowker CM, Pearson SB, Elliott MW, Hainsworth R. Effects of simulated obstructive sleep apnoea on the human carotid baroreceptor-vascular resistance reflex. J Physiol 2004; 557(pt 3):1055–1065. doi:10.1113/jphysiol.2004.062513
- Eckert DJ, Jordan AS, Merchia P, Malhotra A. Central sleep apnea: pathophysiology and treatment. Chest 2007; 131(2):595–607. doi:10.1378/chest.06.2287
- Lévy P, Pépin JL, Arnaud C, et al. Intermittent hypoxia and sleep-disordered breathing: current concepts and perspectives. Eur Respir J 2008; 32(4):1082–1095. doi:10.1183/09031936.00013308
- Stevenson IH, Roberts-Thomson KC, Kistler PM, et al. Atrial electrophysiology is altered by acute hypercapnia but not hypoxemia: implications for promotion of atrial fibrillation in pulmonary disease and sleep apnea. Heart Rhythm 2010; 7(9):1263–1270. doi:10.1016/j.hrthm.2010.03.020
- Tung P, Levitzky YS, Wang R, et al. Obstructive and central sleep apnea and the risk of incident atrial fibrillation in a community cohort of men and women. J Am Heart Assoc 2017; 6(7). doi:10.1161/JAHA.116.004500
- Iwasaki YK, Shi Y, Benito B, et al. Determinants of atrial fibrillation in an animal model of obesity and acute obstructive sleep apnea. Heart Rhythm 2012; 9(9):1409–1416.e1. doi:10.1016/j.hrthm.2012.03.024
- Monahan K, Storfer-Isser A, Mehra R, et al. Triggering of nocturnal arrhythmias by sleep-disordered breathing events. J Am Coll Cardiol 2009; 54(19):1797–1804. doi:10.1016/j.jacc.2009.06.038
- Kanagala R, Murali NS, Friedman PA, et al. Obstructive sleep apnea and the recurrence of atrial fibrillation. Circulation 2003; 107(20):2589–2594. doi:10.1161/01.CIR.0000068337.25994.21
- Ng CY, Liu T, Shehata M, Stevens S, Chugh SS, Wang X. Meta-analysis of obstructive sleep apnea as predictor of atrial fibrillation recurrence after catheter ablation. Am J Cardiol 2011; 108(1):47–51. doi:10.1016/j.amjcard.2011.02.343
- Naruse Y, Tada H, Satoh M, et al. Concomitant obstructive sleep apnea increases the recurrence of atrial fibrillation following radiofrequency catheter ablation of atrial fibrillation: clinical impact of continuous positive airway pressure therapy. Heart Rhythm 2013; 10(3):331–337. doi:10.1016/j.hrthm.2012.11.015
- Fein AS, Shvilkin A, Shah D, et al. Treatment of obstructive sleep apnea reduces the risk of atrial fibrillation recurrence after catheter ablation. J Am Coll Cardiol 2013; 62(4):300–305. doi:10.1016/j.jacc.2013.03.052
- Patel D, Mohanty P, Di Biase L, et al. Safety and efficacy of pulmonary vein antral isolation in patients with obstructive sleep apnea: the impact of continuous positive airway pressure. Circ Arrhythm Electrophysiol 2010; 3(5):445–451. doi:10.1161/CIRCEP.109.858381
- Neilan TG, Farhad H, Dodson JA, et al. Effect of sleep apnea and continuous positive airway pressure on cardiac structure and recurrence of atrial fibrillation. J Am Heart Assoc 2013; 2(6):e000421. doi:10.1161/JAHA.113.000421
- Mehra R, Stone KL, Varosy PD, et al. Nocturnal arrhythmias across a spectrum of obstructive and central sleep-disordered breathing in older men: outcomes of sleep disorders in older men (MrOS sleep) study. Arch Intern Med 2009; 169(12):1147–1155. doi:10.1001/archinternmed.2009.138
- Sin DD, Fitzgerald F, Parker JD, Newton G, Floras JS, Bradley TD. Risk factors for central and obstructive sleep apnea in 450 men and women with congestive heart failure. Am J Respir Crit Care Med 1999; 160(4):1101–1106. doi:10.1164/ajrccm.160.4.9903020
- Yumino D, Wang H, Floras JS, et al. Prevalence and physiological predictors of sleep apnea in patients with heart failure and systolic dysfunction. J Card Fail 2009; 15(4):279–285. doi:10.1016/j.cardfail.2008.11.015
- May AM, Blackwell T, Stone PH, et al; MrOS Sleep (Outcomes of Sleep Disorders in Older Men) Study Group. Central sleep-disordered breathing predicts incident atrial fibrillation in older men. Am J Respir Crit Care Med 2016; 193(7):783–791. doi:10.1164/rccm.201508-1523OC
- Porthan KM, Melin JH, Kupila JT, Venho KK, Partinen MM. Prevalence of sleep apnea syndrome in lone atrial fibrillation: a case-control study. Chest 2004; 125(3):879–885. doi:10.1378/chest.125.3.879
- January CT, Wann LS, Alpert JS, et al; ACC/AHA Task Force Members. 2014 AHA/ACC/HRS guideline for the management of patients with atrial fibrillation: a report of the American College of Cardiology/American Heart Association Task Force on practice guidelines and the Heart Rhythm Society. Circulation 2014; 130(23):e199–e267. doi:10.1161/CIR.0000000000000041
- Writing Group Members; January CT, Wann LS, Calkins H, et al. 2019 AHA/ACC/HRS focused update of the 2014 AHA/ACC/HRS guideline for the management of patients with atrial fibrillation: a report of the American College of Cardiology/American Heart Association Task Force on Clinical Practice Guidelines and the Heart Rhythm Society. Heart Rhythm. 2019; 16(8):e66–e93. doi:10.1016/j.hrthm.2019.01.024
- Netzer NC, Stoohs RA, Netzer CM, Clark K, Strohl KP. Using the Berlin Questionnaire to identify patients at risk for the sleep apnea syndrome. Ann Intern Med 1999; 131(7):485–491. doi:10.7326/0003-4819-131-7-199910050-00002
- Chung F, Abdullah HR, Liao P. STOP-bang questionnaire a practical approach to screen for obstructive sleep apnea. Chest 2016; 149(3):631–638. doi:10.1378/chest.15-0903
- Marti-Soler H, Hirotsu C, Marques-Vidal P, et al. The NoSAS score for screening of sleep-disordered breathing: a derivation and validation study. Lancet Respir Med 2016; 4(9):742–748. doi:10.1016/S2213-2600(16)30075-3
- Kapur VK, Auckley DH, Chowdhuri S, et al. Clinical practice guideline for diagnostic testing for adult obstructive sleep apnea: an American Academy of Sleep Medicine clinical practice guideline. J Clin Sleep Med 2017; 13(3):479–504. doi:10.5664/jcsm.6506

Severe hypercalcemia in a 54-year-old woman
A morbidly obese 54-year-old woman presented to the emergency department after experiencing generalized abdominal pain for 3 days. She rated the pain as 5 on a scale of 10 and described it as dull, cramping, waxing and waning, not radiating, and not relieved with changes of position—in fact, not alleviated by anything she had tried. Her pain was associated with nausea and 1 episode of vomiting. She also experienced constipation before the onset of pain.
She denied recent trauma, recent travel, diarrhea, fevers, weakness, shortness of breath, chest pain, other muscle pains, or recent changes in diet. She also denied having this pain in the past. She said she had unintentionally lost some weight but was not certain how much. She denied tobacco, alcohol, or illicit drug use. She had no history of surgery.
Her medical history included hypertension, anemia, and uterine fibroids. Her current medications included losartan, hydrochlorothiazide, and albuterol. She had no family history of significant disease.
INITIAL EVALUATION AND MANAGEMENT
On admission, her temperature was 97.8°F (36.6°C), heart rate 100 beats per minute, blood pressure 136/64 mm Hg, respiratory rate 18 breaths per minute, oxygen saturation 97% on room air, weight 130.6 kg, and body mass index 35 kg/m2.
She was alert and oriented to person, place, and time. She was in mild discomfort but no distress. Her lungs were clear to auscultation, with no wheezing or crackles. Heart rate and rhythm were regular, with no extra heart sounds or murmurs. Bowel sounds were normal in all 4 quadrants, with tenderness to palpation of the epigastric area, but with no guarding or rebound tenderness.
Laboratory test results
Notable results of blood testing at presentation were as follows:
- Hemoglobin 8.2 g/dL (reference range 12.3–15.3)
- Hematocrit 26% (41–50)
- Mean corpuscular volume 107 fL (80–100)
- Blood urea nitrogen 33 mg/dL (8–21); 6 months earlier it was 16
- Serum creatinine 3.6 mg/dL (0.58–0.96); 6 months earlier, it was 0.75
- Albumin 3.3 g/dL (3.5–5)
- Calcium 18.4 mg/dL (8.4–10.2); 6 months earlier, it was 9.6
- Corrected calcium 19 mg/dL.
Findings on imaging, electrocardiography
Chest radiography showed no acute cardiopulmonary abnormalities. Abdominal computed tomography without contrast showed no abnormalities within the pancreas and no evidence of inflammation or obstruction. Electrocardiography showed sinus tachycardia.
DIFFERENTIAL DIAGNOSIS
1. Which is the most likely cause of this patient’s symptoms?
- Primary hyperparathyroidism
- Malignancy
- Her drug therapy
- Familial hypercalcemic hypocalciuria

In total, her laboratory results were consistent with macrocytic anemia, severe hypercalcemia, and acute kidney injury, and she had generalized symptoms.
Primary hyperparathyroidism
A main cause of hypercalcemia is primary hyperparathyroidism, and this needs to be ruled out. Benign adenomas are the most common cause of primary hyperparathyroidism, and a risk factor for benign adenoma is exposure to therapeutic levels of radiation.3
In hyperparathyroidism, there is an increased secretion of parathyroid hormone (PTH), which has multiple effects including increased reabsorption of calcium from the urine, increased excretion of phosphate, and increased expression of 1,25-hydroxyvitamin D hydroxylase to activate vitamin D. PTH also stimulates osteoclasts to increase their expression of receptor activator of nuclear factor kappa B ligand (RANKL), which has a downstream effect on osteoclast precursors to cause bone reabsorption.3
Inherited primary hyperparathyroidism tends to present at a younger age, with multiple overactive parathyroid glands.3 Given our patient’s age, inherited primary hyparathyroidism is thus less likely.
Malignancy
The probability that malignancy is causing the hypercalcemia increases with calcium levels greater than 13 mg/dL. Epidemiologically, in hospitalized patients with hypercalcemia, the source tends to be malignancy.4 Typically, patients who develop hypercalcemia from malignancy have a worse prognosis.5
Solid tumors and leukemias can cause hypercalcemia. The mechanisms include humoral factors secreted by the malignancy, local osteolysis due to tumor invasion of bone, and excessive absorption of calcium due to excess vitamin D produced by malignancies.5 The cancers that most frequently cause an increase in calcium resorption are lung cancer, renal cancer, breast cancer, and multiple myeloma.1
Solid tumors with no bone metastasis and non-Hodgkin lymphoma that release PTH-related protein (PTHrP) cause humoral hypercalcemia in malignancy. The patient is typically in an advanced stage of disease. PTHrP increases serum calcium levels by decreasing the kidney’s ability to excrete calcium and by increasing bone turnover. It has no effect on intestinal absorption because of its inability to stimulate activated vitamin D3. Thus, the increase in systemic calcium comes directly from breakdown of bone and inability to excrete the excess.
PTHrP has a unique role in breast cancer: it is released locally in areas where cancer cells have metastasized to bone, but it does not cause a systemic effect. Bone resorption occurs in areas of metastasis and results from an increase in expression of RANKL and RANK in osteoclasts in response to the effects of PTHrP, leading to an increase in the production of osteoclastic cells.1
Tamoxifen, an endocrine therapy often used in breast cancer, also causes a release of bone-reabsorbing factors from tumor cells, which can partially contribute to hypercalcemia.5
Myeloma cells secrete RANKL, which stimulates osteoclastic activity, and they also release interleukin 6 (IL-6) and activating macrophage inflammatory protein alpha. Serum testing usually shows low or normal intact PTH, PTHrP, and 1,25-dihydroxyvitamin D.1
Patients with multiple myeloma have a worse prognosis if they have a high red blood cell distribution width, a condition shown to correlate with malnutrition, leading to deficiencies in vitamin B12 and to poor response to treatment.6 Up to 14% of patients with multiple myeloma have vitamin B12 deficiency.7
Our patient’s recent weight loss and severe hypercalcemia raise suspicion of malignancy. Further, her obesity makes proper routine breast examination difficult and thus increases the chance of undiagnosed breast cancer.8 Her decrease in renal function and her anemia complicated by hypercalcemia also raise suspicion of multiple myeloma.
Hypercalcemia due to drug therapy
Thiazide diuretics, lithium, teriparatide, and vitamin A in excessive amounts can raise the serum calcium concentration.5 Our patient was taking a thiazide for hypertension, but her extremely high calcium level places drug-induced hypercalcemia as the sole cause lower on the differential list.
Familial hypercalcemic hypocalciuria
Familial hypercalcemic hypocalciuria is a rare autosomal-dominant cause of hypercalcemia in which the ability of the body (and especially the kidneys) to sense levels of calcium is impaired, leading to a decrease in excretion of calcium in the urine.3 Very high calcium levels are rare in hypercalcemic hypocalciuria.3 In our patient with a corrected calcium concentration of nearly 19 mg/dL, familial hypercalcemic hypocalciuria is very unlikely to be the cause of the hypercalcemia.
WHAT ARE THE NEXT STEPS IN THE WORKUP?
As hypercalcemia has been confirmed, the intact PTH level should be checked to determine whether the patient’s condition is PTH-mediated. If the PTH level is in the upper range of normal or is minimally elevated, primary hyperparathyroidism is likely. Elevated PTH confirms primary hyperparathyroidism. A low-normal or low intact PTH confirms a non-PTH-mediated process, and once this is confirmed, PTHrP levels should be checked. An elevated PTHrP suggests humoral hypercalcemia of malignancy. Serum protein electrophoresis, urine protein electrophoresis, and a serum light chain assay should be performed to rule out multiple myeloma.
Vitamin D toxicity is associated with high concentrations of 1,25-dihydroxyvitamin D and 25-hydroxyvitamin D metabolites. These levels should be checked in this patient.
Other disorders that cause hypercalcemia are vitamin A toxicity and hyperthyroidism, so vitamin A and thyroid-stimulating hormone levels should also be checked.5
CASE CONTINUED
After further questioning, the patient said that she had had lower back pain about 1 to 2 weeks before coming to the emergency room; her primary care doctor had said the pain was likely from muscle strain. The pain had almost resolved but was still present.
The results of further laboratory testing were as follows:
- Serum PTH 11 pg/mL (15–65)
- PTHrP 3.4 pmol/L (< 2.0)
- Protein electrophoresis showed a monoclonal (M) spike of 0.2 g/dL (0)
- Activated vitamin D < 5 ng/mL (19.9–79.3)
- Vitamin A 7.2 mg/dL (33.1–100)
- Vitamin B12 194 pg/mL (239–931)
- Thyroid-stimulating hormone 1.21 mIU/ L (0.47–4.68
- Free thyroxine 1.27 ng/dL (0.78–2.19)
- Iron 103 µg/dL (37–170)
- Total iron-binding capacity 335 µg/dL (265–497)
- Transferrin 248 mg/dL (206–381)
- Ferritin 66 ng/mL (11.1–264)
- Urine protein (random) 100 mg/dL (0–20)
- Urine microalbumin (random) 5.9 mg/dL (0–1.6)
- Urine creatinine clearance 88.5 mL/min (88–128)
- Urine albumin-creatinine ratio 66.66 mg/g (< 30).
Imaging reports
A nuclear bone scan showed increased bone uptake in the hip and both shoulders, consistent with arthritis, and increased activity in 2 of the lower left ribs, associated with rib fractures secondary to lytic lesions. A skeletal survey at a later date showed multiple well-circumscribed “punched-out” lytic lesions in both forearms and both femurs.
2. What should be the next step in this patient’s management?
- Intravenous (IV) fluids
- Calcitonin
- Bisphosphonate treatment
- Denosumab
- Hemodialysis
Initial treatment of severe hypercalcemia includes the following:
Start IV isotonic fluids at a rate of 150 mL/h (if the patient is making urine) to maintain urine output at more than 100 mL/h. Closely monitor urine output.
Give calcitonin 4 IU/kg in combination with IV fluids to reduce calcium levels within the first 12 to 48 hours of treatment.
Give a bisphosphonate, eg, zoledronic acid 4 mg over 15 minutes, or pamidronate 60 to 90 mg over 2 hours. Zoledronic acid is preferred in malignancy-induced hypercalcemia because it is more potent. Doses should be adjusted in patients with renal failure.
Give denosumab if hypercalcemia is refractory to bisphosphonates, or when bisphosphonates cannot be used in renal failure.9
Hemodialysis is performed in patients who have significant neurologic symptoms irrespective of acute renal insufficiency.
Our patient was started on 0.9% sodium chloride at a rate of 150 mL/h for severe hypercalcemia. Zoledronic acid 4 mg IV was given once. These measures lowered her calcium level and lessened her acute kidney injury.
ADDITIONAL FINDINGS
Urine testing was positive for Bence Jones protein. Immune electrophoresis, performed because of suspicion of multiple myeloma, showed an elevated level of kappa light chains at 806.7 mg/dL (0.33–1.94) and normal lambda light chains at 0.62 mg/dL (0.57–2.63). The immunoglobulin G level was low at 496 mg/dL (610–1,660). In patients with severe hypercalcemia, these results point to a diagnosis of malignancy. Bone marrow aspiration study showed greater than 10% plasma cells, confirming multiple myeloma.
MULTIPLE MYELOMA
The diagnosis of multiple myeloma is based in part on the presence of 10% or more of clonal bone marrow plasma cells10 and of specific end-organ damage (anemia, hypercalcemia, renal insufficiency, or bone lesions).9
Bone marrow clonality can be shown by the ratio of kappa to lambda light chains as detected with immunohistochemistry, immunofluorescence, or flow cytometry.11 The normal ratio is 0.26 to 1.65 for a patient with normal kidney function. In this patient, however, the ratio was 1,301.08 (806.67 kappa to 0.62 lambda), which was extremely out of range. The patient’s bone marrow biopsy results revealed the presence of 15% clonal bone marrow plasma cells.
Multiple myeloma causes osteolytic lesions through increased activation of osteoclast activating factor that stimulates the growth of osteoclast precursors. At the same time, it inhibits osteoblast formation via multiple pathways, including the action of sclerostin.11 Our patient had lytic lesions in 2 left lower ribs and in both forearms and femurs.
Hypercalcemia in multiple myeloma is attributed to 2 main factors: bone breakdown and macrophage overactivation. Multiple myeloma cells increase the release of macrophage inflammatory protein 1-alpha and tumor necrosis factor, which are inflammatory proteins that cause an increase in macrophages, which cause an increase in calcitriol.11 As noted, our patient’s calcium level at presentation was 18.4 mg/dL uncorrected and 18.96 mg/dL corrected.
Cast nephropathy can occur in the distal tubules from the increased free light chains circulating and combining with Tamm-Horsfall protein, which in turn causes obstruction and local inflammation,12 leading to a rise in creatinine levels and resulting in acute kidney injury,12 as in our patient.
TREATMENT CONSIDERATIONS IN MULTIPLE MYELOMA
Our patient was referred to an oncologist for management.
In the management of multiple myeloma, the patient’s quality of life needs to be considered. With the development of new agents to combat the damages of the osteolytic effects, there is hope for improving quality of life.13,14 New agents under study include anabolic agents such as antisclerostin and anti-Dickkopf-1, which promote osteoblastogenesis, leading to bone formation, with the possibility of repairing existing damage.15
TAKE-HOME POINTS
- If hypercalcemia is mild to moderate, consider primary hyperparathyroidism.
- Identify patients with severe symptoms of hypercalcemia such as volume depletion, acute kidney injury, arrhythmia, or seizures.
- Confirm severe cases of hypercalcemia and treat severe cases effectively.
- Severe hypercalcemia may need further investigation into a potential underlying malignancy.
- Sternlicht H, Glezerman IG. Hypercalcemia of malignancy and new treatment options. Ther Clin Risk Manag 2015; 11:1779–1788. doi:10.2147/TCRM.S83681
- Ahmed R, Hashiba K. Reliability of QT intervals as indicators of clinical hypercalcemia. Clin Cardiol 1988; 11(6):395–400. doi:10.1002/clc.4960110607
- Bilezikian JP, Cusano NE, Khan AA, Liu JM, Marcocci C, Bandeira F. Primary hyperparathyroidism. Nat Rev Dis Primers 2016; 2:16033. doi:10.1038/nrdp.2016.33
- Kuchay MS, Kaur P, Mishra SK, Mithal A. The changing profile of hypercalcemia in a tertiary care setting in North India: an 18-month retrospective study. Clin Cases Miner Bone Metab 2017; 14(2):131–135. doi:10.11138/ccmbm/2017.14.1.131
- Rosner MH, Dalkin AC. Onco-nephrology: the pathophysiology and treatment of malignancy-associated hypercalcemia. Clin J Am Soc Nephrol 2012; 7(10):1722–1729. doi:10.2215/CJN.02470312
- Ai L, Mu S, Hu Y. Prognostic role of RDW in hematological malignancies: a systematic review and meta-analysis. Cancer Cell Int 2018; 18:61. doi:10.1186/s12935-018-0558-3
- Baz R, Alemany C, Green R, Hussein MA. Prevalence of vitamin B12 deficiency in patients with plasma cell dyscrasias: a retrospective review. Cancer 2004; 101(4):790–795. doi:10.1002/cncr.20441
- Elmore JG, Carney PA, Abraham LA, et al. The association between obesity and screening mammography accuracy. Arch Intern Med 2004; 164(10):1140–1147. doi:10.1001/archinte.164.10.1140
- Gerecke C, Fuhrmann S, Strifler S, Schmidt-Hieber M, Einsele H, Knop S. The diagnosis and treatment of multiple myeloma. Dtsch Arztebl Int 2016; 113(27–28):470–476. doi:10.3238/arztebl.2016.0470
- Rajkumar SV. Multiple myeloma: 2016 update on diagnosis, risk-stratification, and management. Am J Hematol 2016; 91(7):719–734. doi:10.1002/ajh.24402
- Silbermann R, Roodman GD. Myeloma bone disease: pathophysiology and management. J Bone Oncol 2013; 2(2):59–69. doi:10.1016/j.jbo.2013.04.001
- Doshi M, Lahoti A, Danesh FR, Batuman V, Sanders PW; American Society of Nephrology Onco-Nephrology Forum. Paraprotein-related kidney disease: kidney injury from paraproteins—what determines the site of injury? Clin J Am Soc Nephrol 2016; 11(12):2288–2294. doi:10.2215/CJN.02560316
- Reece D. Update on the initial therapy of multiple myeloma. Am Soc Clin Oncol Educ Book 2013. doi:10.1200/EdBook_AM.2013.33.e307
- Nishida H. Bone-targeted agents in multiple myeloma. Hematol Rep 2018; 10(1):7401. doi:10.4081/hr.2018.7401
- Ring ES, Lawson MA, Snowden JA, Jolley I, Chantry AD. New agents in the treatment of myeloma bone disease. Calcif Tissue Int 2018; 102(2):196–209. doi:10.1007/s00223-017-0351-7
A morbidly obese 54-year-old woman presented to the emergency department after experiencing generalized abdominal pain for 3 days. She rated the pain as 5 on a scale of 10 and described it as dull, cramping, waxing and waning, not radiating, and not relieved with changes of position—in fact, not alleviated by anything she had tried. Her pain was associated with nausea and 1 episode of vomiting. She also experienced constipation before the onset of pain.
She denied recent trauma, recent travel, diarrhea, fevers, weakness, shortness of breath, chest pain, other muscle pains, or recent changes in diet. She also denied having this pain in the past. She said she had unintentionally lost some weight but was not certain how much. She denied tobacco, alcohol, or illicit drug use. She had no history of surgery.
Her medical history included hypertension, anemia, and uterine fibroids. Her current medications included losartan, hydrochlorothiazide, and albuterol. She had no family history of significant disease.
INITIAL EVALUATION AND MANAGEMENT
On admission, her temperature was 97.8°F (36.6°C), heart rate 100 beats per minute, blood pressure 136/64 mm Hg, respiratory rate 18 breaths per minute, oxygen saturation 97% on room air, weight 130.6 kg, and body mass index 35 kg/m2.
She was alert and oriented to person, place, and time. She was in mild discomfort but no distress. Her lungs were clear to auscultation, with no wheezing or crackles. Heart rate and rhythm were regular, with no extra heart sounds or murmurs. Bowel sounds were normal in all 4 quadrants, with tenderness to palpation of the epigastric area, but with no guarding or rebound tenderness.
Laboratory test results
Notable results of blood testing at presentation were as follows:
- Hemoglobin 8.2 g/dL (reference range 12.3–15.3)
- Hematocrit 26% (41–50)
- Mean corpuscular volume 107 fL (80–100)
- Blood urea nitrogen 33 mg/dL (8–21); 6 months earlier it was 16
- Serum creatinine 3.6 mg/dL (0.58–0.96); 6 months earlier, it was 0.75
- Albumin 3.3 g/dL (3.5–5)
- Calcium 18.4 mg/dL (8.4–10.2); 6 months earlier, it was 9.6
- Corrected calcium 19 mg/dL.
Findings on imaging, electrocardiography
Chest radiography showed no acute cardiopulmonary abnormalities. Abdominal computed tomography without contrast showed no abnormalities within the pancreas and no evidence of inflammation or obstruction. Electrocardiography showed sinus tachycardia.
DIFFERENTIAL DIAGNOSIS
1. Which is the most likely cause of this patient’s symptoms?
- Primary hyperparathyroidism
- Malignancy
- Her drug therapy
- Familial hypercalcemic hypocalciuria
In total, her laboratory results were consistent with macrocytic anemia, severe hypercalcemia, and acute kidney injury, and she had generalized symptoms.
Primary hyperparathyroidism
A main cause of hypercalcemia is primary hyperparathyroidism, and this needs to be ruled out. Benign adenomas are the most common cause of primary hyperparathyroidism, and a risk factor for benign adenoma is exposure to therapeutic levels of radiation.3
In hyperparathyroidism, there is an increased secretion of parathyroid hormone (PTH), which has multiple effects including increased reabsorption of calcium from the urine, increased excretion of phosphate, and increased expression of 1,25-hydroxyvitamin D hydroxylase to activate vitamin D. PTH also stimulates osteoclasts to increase their expression of receptor activator of nuclear factor kappa B ligand (RANKL), which has a downstream effect on osteoclast precursors to cause bone reabsorption.3
Inherited primary hyperparathyroidism tends to present at a younger age, with multiple overactive parathyroid glands.3 Given our patient’s age, inherited primary hyparathyroidism is thus less likely.
Malignancy
The probability that malignancy is causing the hypercalcemia increases with calcium levels greater than 13 mg/dL. Epidemiologically, in hospitalized patients with hypercalcemia, the source tends to be malignancy.4 Typically, patients who develop hypercalcemia from malignancy have a worse prognosis.5
Solid tumors and leukemias can cause hypercalcemia. The mechanisms include humoral factors secreted by the malignancy, local osteolysis due to tumor invasion of bone, and excessive absorption of calcium due to excess vitamin D produced by malignancies.5 The cancers that most frequently cause an increase in calcium resorption are lung cancer, renal cancer, breast cancer, and multiple myeloma.1
Solid tumors with no bone metastasis and non-Hodgkin lymphoma that release PTH-related protein (PTHrP) cause humoral hypercalcemia in malignancy. The patient is typically in an advanced stage of disease. PTHrP increases serum calcium levels by decreasing the kidney’s ability to excrete calcium and by increasing bone turnover. It has no effect on intestinal absorption because of its inability to stimulate activated vitamin D3. Thus, the increase in systemic calcium comes directly from breakdown of bone and inability to excrete the excess.
PTHrP has a unique role in breast cancer: it is released locally in areas where cancer cells have metastasized to bone, but it does not cause a systemic effect. Bone resorption occurs in areas of metastasis and results from an increase in expression of RANKL and RANK in osteoclasts in response to the effects of PTHrP, leading to an increase in the production of osteoclastic cells.1
Tamoxifen, an endocrine therapy often used in breast cancer, also causes a release of bone-reabsorbing factors from tumor cells, which can partially contribute to hypercalcemia.5
Myeloma cells secrete RANKL, which stimulates osteoclastic activity, and they also release interleukin 6 (IL-6) and activating macrophage inflammatory protein alpha. Serum testing usually shows low or normal intact PTH, PTHrP, and 1,25-dihydroxyvitamin D.1
Patients with multiple myeloma have a worse prognosis if they have a high red blood cell distribution width, a condition shown to correlate with malnutrition, leading to deficiencies in vitamin B12 and to poor response to treatment.6 Up to 14% of patients with multiple myeloma have vitamin B12 deficiency.7
Our patient’s recent weight loss and severe hypercalcemia raise suspicion of malignancy. Further, her obesity makes proper routine breast examination difficult and thus increases the chance of undiagnosed breast cancer.8 Her decrease in renal function and her anemia complicated by hypercalcemia also raise suspicion of multiple myeloma.
Hypercalcemia due to drug therapy
Thiazide diuretics, lithium, teriparatide, and vitamin A in excessive amounts can raise the serum calcium concentration.5 Our patient was taking a thiazide for hypertension, but her extremely high calcium level places drug-induced hypercalcemia as the sole cause lower on the differential list.
Familial hypercalcemic hypocalciuria
Familial hypercalcemic hypocalciuria is a rare autosomal-dominant cause of hypercalcemia in which the ability of the body (and especially the kidneys) to sense levels of calcium is impaired, leading to a decrease in excretion of calcium in the urine.3 Very high calcium levels are rare in hypercalcemic hypocalciuria.3 In our patient with a corrected calcium concentration of nearly 19 mg/dL, familial hypercalcemic hypocalciuria is very unlikely to be the cause of the hypercalcemia.
WHAT ARE THE NEXT STEPS IN THE WORKUP?
As hypercalcemia has been confirmed, the intact PTH level should be checked to determine whether the patient’s condition is PTH-mediated. If the PTH level is in the upper range of normal or is minimally elevated, primary hyperparathyroidism is likely. Elevated PTH confirms primary hyperparathyroidism. A low-normal or low intact PTH confirms a non-PTH-mediated process, and once this is confirmed, PTHrP levels should be checked. An elevated PTHrP suggests humoral hypercalcemia of malignancy. Serum protein electrophoresis, urine protein electrophoresis, and a serum light chain assay should be performed to rule out multiple myeloma.
Vitamin D toxicity is associated with high concentrations of 1,25-dihydroxyvitamin D and 25-hydroxyvitamin D metabolites. These levels should be checked in this patient.
Other disorders that cause hypercalcemia are vitamin A toxicity and hyperthyroidism, so vitamin A and thyroid-stimulating hormone levels should also be checked.5
CASE CONTINUED
After further questioning, the patient said that she had had lower back pain about 1 to 2 weeks before coming to the emergency room; her primary care doctor had said the pain was likely from muscle strain. The pain had almost resolved but was still present.
The results of further laboratory testing were as follows:
- Serum PTH 11 pg/mL (15–65)
- PTHrP 3.4 pmol/L (< 2.0)
- Protein electrophoresis showed a monoclonal (M) spike of 0.2 g/dL (0)
- Activated vitamin D < 5 ng/mL (19.9–79.3)
- Vitamin A 7.2 mg/dL (33.1–100)
- Vitamin B12 194 pg/mL (239–931)
- Thyroid-stimulating hormone 1.21 mIU/ L (0.47–4.68
- Free thyroxine 1.27 ng/dL (0.78–2.19)
- Iron 103 µg/dL (37–170)
- Total iron-binding capacity 335 µg/dL (265–497)
- Transferrin 248 mg/dL (206–381)
- Ferritin 66 ng/mL (11.1–264)
- Urine protein (random) 100 mg/dL (0–20)
- Urine microalbumin (random) 5.9 mg/dL (0–1.6)
- Urine creatinine clearance 88.5 mL/min (88–128)
- Urine albumin-creatinine ratio 66.66 mg/g (< 30).
Imaging reports
A nuclear bone scan showed increased bone uptake in the hip and both shoulders, consistent with arthritis, and increased activity in 2 of the lower left ribs, associated with rib fractures secondary to lytic lesions. A skeletal survey at a later date showed multiple well-circumscribed “punched-out” lytic lesions in both forearms and both femurs.
2. What should be the next step in this patient’s management?
- Intravenous (IV) fluids
- Calcitonin
- Bisphosphonate treatment
- Denosumab
- Hemodialysis
Initial treatment of severe hypercalcemia includes the following:
Start IV isotonic fluids at a rate of 150 mL/h (if the patient is making urine) to maintain urine output at more than 100 mL/h. Closely monitor urine output.
Give calcitonin 4 IU/kg in combination with IV fluids to reduce calcium levels within the first 12 to 48 hours of treatment.
Give a bisphosphonate, eg, zoledronic acid 4 mg over 15 minutes, or pamidronate 60 to 90 mg over 2 hours. Zoledronic acid is preferred in malignancy-induced hypercalcemia because it is more potent. Doses should be adjusted in patients with renal failure.
Give denosumab if hypercalcemia is refractory to bisphosphonates, or when bisphosphonates cannot be used in renal failure.9
Hemodialysis is performed in patients who have significant neurologic symptoms irrespective of acute renal insufficiency.
Our patient was started on 0.9% sodium chloride at a rate of 150 mL/h for severe hypercalcemia. Zoledronic acid 4 mg IV was given once. These measures lowered her calcium level and lessened her acute kidney injury.
ADDITIONAL FINDINGS
Urine testing was positive for Bence Jones protein. Immune electrophoresis, performed because of suspicion of multiple myeloma, showed an elevated level of kappa light chains at 806.7 mg/dL (0.33–1.94) and normal lambda light chains at 0.62 mg/dL (0.57–2.63). The immunoglobulin G level was low at 496 mg/dL (610–1,660). In patients with severe hypercalcemia, these results point to a diagnosis of malignancy. Bone marrow aspiration study showed greater than 10% plasma cells, confirming multiple myeloma.
MULTIPLE MYELOMA
The diagnosis of multiple myeloma is based in part on the presence of 10% or more of clonal bone marrow plasma cells10 and of specific end-organ damage (anemia, hypercalcemia, renal insufficiency, or bone lesions).9
Bone marrow clonality can be shown by the ratio of kappa to lambda light chains as detected with immunohistochemistry, immunofluorescence, or flow cytometry.11 The normal ratio is 0.26 to 1.65 for a patient with normal kidney function. In this patient, however, the ratio was 1,301.08 (806.67 kappa to 0.62 lambda), which was extremely out of range. The patient’s bone marrow biopsy results revealed the presence of 15% clonal bone marrow plasma cells.
Multiple myeloma causes osteolytic lesions through increased activation of osteoclast activating factor that stimulates the growth of osteoclast precursors. At the same time, it inhibits osteoblast formation via multiple pathways, including the action of sclerostin.11 Our patient had lytic lesions in 2 left lower ribs and in both forearms and femurs.
Hypercalcemia in multiple myeloma is attributed to 2 main factors: bone breakdown and macrophage overactivation. Multiple myeloma cells increase the release of macrophage inflammatory protein 1-alpha and tumor necrosis factor, which are inflammatory proteins that cause an increase in macrophages, which cause an increase in calcitriol.11 As noted, our patient’s calcium level at presentation was 18.4 mg/dL uncorrected and 18.96 mg/dL corrected.
Cast nephropathy can occur in the distal tubules from the increased free light chains circulating and combining with Tamm-Horsfall protein, which in turn causes obstruction and local inflammation,12 leading to a rise in creatinine levels and resulting in acute kidney injury,12 as in our patient.
TREATMENT CONSIDERATIONS IN MULTIPLE MYELOMA
Our patient was referred to an oncologist for management.
In the management of multiple myeloma, the patient’s quality of life needs to be considered. With the development of new agents to combat the damages of the osteolytic effects, there is hope for improving quality of life.13,14 New agents under study include anabolic agents such as antisclerostin and anti-Dickkopf-1, which promote osteoblastogenesis, leading to bone formation, with the possibility of repairing existing damage.15
TAKE-HOME POINTS
- If hypercalcemia is mild to moderate, consider primary hyperparathyroidism.
- Identify patients with severe symptoms of hypercalcemia such as volume depletion, acute kidney injury, arrhythmia, or seizures.
- Confirm severe cases of hypercalcemia and treat severe cases effectively.
- Severe hypercalcemia may need further investigation into a potential underlying malignancy.
- Sternlicht H, Glezerman IG. Hypercalcemia of malignancy and new treatment options. Ther Clin Risk Manag 2015; 11:1779–1788. doi:10.2147/TCRM.S83681
- Ahmed R, Hashiba K. Reliability of QT intervals as indicators of clinical hypercalcemia. Clin Cardiol 1988; 11(6):395–400. doi:10.1002/clc.4960110607
- Bilezikian JP, Cusano NE, Khan AA, Liu JM, Marcocci C, Bandeira F. Primary hyperparathyroidism. Nat Rev Dis Primers 2016; 2:16033. doi:10.1038/nrdp.2016.33
- Kuchay MS, Kaur P, Mishra SK, Mithal A. The changing profile of hypercalcemia in a tertiary care setting in North India: an 18-month retrospective study. Clin Cases Miner Bone Metab 2017; 14(2):131–135. doi:10.11138/ccmbm/2017.14.1.131
- Rosner MH, Dalkin AC. Onco-nephrology: the pathophysiology and treatment of malignancy-associated hypercalcemia. Clin J Am Soc Nephrol 2012; 7(10):1722–1729. doi:10.2215/CJN.02470312
- Ai L, Mu S, Hu Y. Prognostic role of RDW in hematological malignancies: a systematic review and meta-analysis. Cancer Cell Int 2018; 18:61. doi:10.1186/s12935-018-0558-3
- Baz R, Alemany C, Green R, Hussein MA. Prevalence of vitamin B12 deficiency in patients with plasma cell dyscrasias: a retrospective review. Cancer 2004; 101(4):790–795. doi:10.1002/cncr.20441
- Elmore JG, Carney PA, Abraham LA, et al. The association between obesity and screening mammography accuracy. Arch Intern Med 2004; 164(10):1140–1147. doi:10.1001/archinte.164.10.1140
- Gerecke C, Fuhrmann S, Strifler S, Schmidt-Hieber M, Einsele H, Knop S. The diagnosis and treatment of multiple myeloma. Dtsch Arztebl Int 2016; 113(27–28):470–476. doi:10.3238/arztebl.2016.0470
- Rajkumar SV. Multiple myeloma: 2016 update on diagnosis, risk-stratification, and management. Am J Hematol 2016; 91(7):719–734. doi:10.1002/ajh.24402
- Silbermann R, Roodman GD. Myeloma bone disease: pathophysiology and management. J Bone Oncol 2013; 2(2):59–69. doi:10.1016/j.jbo.2013.04.001
- Doshi M, Lahoti A, Danesh FR, Batuman V, Sanders PW; American Society of Nephrology Onco-Nephrology Forum. Paraprotein-related kidney disease: kidney injury from paraproteins—what determines the site of injury? Clin J Am Soc Nephrol 2016; 11(12):2288–2294. doi:10.2215/CJN.02560316
- Reece D. Update on the initial therapy of multiple myeloma. Am Soc Clin Oncol Educ Book 2013. doi:10.1200/EdBook_AM.2013.33.e307
- Nishida H. Bone-targeted agents in multiple myeloma. Hematol Rep 2018; 10(1):7401. doi:10.4081/hr.2018.7401
- Ring ES, Lawson MA, Snowden JA, Jolley I, Chantry AD. New agents in the treatment of myeloma bone disease. Calcif Tissue Int 2018; 102(2):196–209. doi:10.1007/s00223-017-0351-7

Greater weight loss with sleeve gastroplasty than with diet therapy
Endoscopic sleeve gastroplasty achieves significantly greater weight loss than that of a high-intensity diet and lifestyle therapy program, according to a study published in Gastrointestinal Endoscopy.
In the retrospective case-matched study, 105 patients who underwent endoscopic sleeve gastroplasty, in combination with a low-intensity diet and lifestyle therapy, were compared with 281 patients who participated in a high-intensity diet and lifestyle therapy program.
“As ESG [endoscopic sleeve gastroplasty] continues to gain traction worldwide, a comprehensive understanding of its outcomes and relative place among the battery of weight loss treatments is important,” wrote Lawrence J. Cheskin, MD, of Johns Hopkins Bloomberg School of Public Health, Baltimore, and coauthors, noting that only two studies have compared endoscopic sleeve gastroscopy with another weight loss therapy.
The high-intensity program involved patients being prescribed a low-calorie, high-protein diet of 800-1,200 calories a day, and taking part in behavioral, nutritional, and exercise counseling as well as optional support from psychotherapy, support groups, and meal replacements.
The study found that patients who underwent the gastroplasty lost significantly greater mean percentage of body weight compared with those who participated in the therapy program.
At 1 month, mean percentage body weight loss was 9.3% in the gastroplasty group compared with 7% in the therapy group. At 3 months it was 14% compared with 11.3%, at 6 months it was 17.7% compared with 14.7%, and at 12 months it was 20.6% compared with 14.3%. Significantly more patients in the gastroplasty group reached 5%, 10%, and 20% weight loss compared with the therapy group.
The authors noted that high-intensity diet and lifestyle therapy programs had “notoriously” high rates of noncompliance and withdrawal from treatment; adherence rates of 63.1% and 59.6% had been seen in previous observational studies.
“Therefore, ESG may be a valuable alternative for patients who have had trouble adhering to HIDLT [high-intensity diet and lifestyle therapy],” they wrote. “Given the diversity of the obese population, ESG may begin to fill some gaps in the obesity treatment arsenal.”
A subgroup analysis looked at patients with a baseline body mass index below or above 40 kg/m2, and found even after adjustment for age and sex, both groups showed significantly more weight loss at 1 and 3 months for patients who underwent gastroplasty. However, at 6 and 12 months, the study saw no significant difference between gastroplasty and the therapy program for patients with a baseline BMI above 40 kg/m2.
While the cause of this difference in effect in higher BMI patients was unknown, it may be that sleeve gastroplasty is less effective because it is counteracted by neurohormonal effects that are altered with bariatric surgery, the authors wrote.
“This is worth exploring in future randomized control trials because it will give us insight into which patients are superior candidates for endoscopic bariatric therapy,” they wrote.
There were five moderate to severe adverse events in the gastroplasty cohort and none in the therapy group. There were three cases of upper gastrointestinal bleeding caused by gastric ulceration. In one case, the patient underwent diagnostic endoscopy, admission, and 48-hour monitoring. Another patient developed perigastric fluid collection, and one was admitted for intravenous hydration after experiencing dehydration. Despite this, the authors suggested the adverse event rate associated with the procedure may be acceptable to patients because of the superior weight loss effect compared with therapy programs.
No funding was declared. Three authors declared consultancies, advisory board positions, and personal fees from medical device companies including those in the endoscopy space. No other conflicts of interest were declared.
SOURCE: Cheskin L et al. Gastrointest Endosc. 2019 Sep 27. doi: 10.1016/j.gie.2019.09.029.
FROM GASTROINTESTINAL ENDOSCOPY
SUSTAIN 10: Weight loss, glycemic control better with semaglutide than liraglutide
BARCELONA – Patients with type 2 diabetes who were treated with semaglutide achieved greater reductions in glycated hemoglobin (HbA1c) levels and body weight, compared with those receiving liraglutide, according to results presented at the annual meeting of the European Association for the Study of Diabetes.

In the phase 3b SUSTAIN 10 trial, conducted in 11 European countries, mean glycated hemoglobin at 30 weeks decreased by 1.7% with once-weekly semaglutide and 1.0% for once-daily liraglutide, from the overall baseline level of 8.2%. The estimated treatment difference (ETD) between the two treatments was –0.69 percentage points (95% confidence interval, –0.82 to –0.56; P less than .0001).
Mean body weight decreased during the same period by 5.8 kg with semaglutide and 1.9 kg with liraglutide, from a baseline of 96.9 kg. The ETD was 3.83 kg (95% CI, –4.57 to –3.09; P less than .0001).
The doses of semaglutide and liraglutide used in the study were 1.0 mg and 1.2 mg, respectively, the latter being the dose that is used most commonly in clinical practice, study investigator Matthew Capehorn, MB, CAB, explained in an interview at the meeting.
“We know that at a dose of 1.8 mg, liraglutide is more effective than 1.2 mg, but it’s about whether it is deemed more cost effective,” said Dr. Capehorn, who is clinical manager at Rotherham (England) Institute for Obesity, Clifton Medical Centre. “Certainly, in the United Kingdom, we’re encouraged to use the 1.2-mg dose” according to guidance from the National Institute for Heath and Care Excellence, and “other European countries are the same.”
Dr. Capehorn noted that studies are being done with a higher dose of semaglutide to see if it has potential as a weight loss drug in its own right in patients who do not have type 2 diabetes. “I care as much about obesity and cardiovascular disease as I do about chasing the HbA1c level and getting that reduced, so I would rather pick an agent that covers all three [components], than just looking at the HbA1c,” he said.
In SUSTAIN 10,577 adults with type 2 diabetes and an HbA1c level of between 7.0% and 11.0% who were on stable doses of one to three oral antidiabetic drugs were randomized to receive semaglutide (n = 290) or liraglutide (n = 287) for 30 weeks.
The primary endpoint was the change in HbA1c from baseline to week 30, and the secondary confirmatory endpoint was change in body weight over the same period.
In presenting the findings, which were simultaneously published in Diabetes & Metabolism, Dr. Capehorn noted that the efficacy results were consistent with those of other SUSTAIN trials that compared semaglutide with other glucagonlike peptide–1 receptor antagonists, notably SUSTAIN 3 (with exenatide extended release) and SUSTAIN 7 (with dulaglutide).
Other efficacy findings from SUSTAIN 10 were that semaglutide produced greater mean changes than did liraglutide in both fasting plasma glucose and in a 7-point, self-monitoring of blood glucose profile.
A greater percentage of people treated with semaglutide, compared with liraglutide, also achieved their glycemic targets of less than 7.0% (80% vs. 46%, respectively) and of 6.5% or less (58% vs. 25%), and their weight loss targets of 5% or more (56% vs. 18%) and 10% or more (19% vs. 4%).
In addition, more semaglutide- than liraglutide-treated patients achieved an HbA1c target of less than 7.0% without severe or blood glucose–confirmed symptomatic hypoglycemia, with or without weight gain (76% vs. 37%; P less than .0001). There were also more semaglutide patients who achieved an HbA1c reduction of 1% or more and a weight loss reduction of 10% or more (17% vs. 4% for liraglutide, P less than .0001).
The safety profiles were similar for semaglutide and liraglutide, Dr. Capehorn noted, but gastrointestinal adverse events were more prevalent in patients receiving semaglutide, compared with liraglutide (43.9% vs. 38.3%), and more patients receiving semaglutide discontinued treatment prematurely because of those adverse events (11.4% vs. 6.6% for liraglutide).
Novo Nordisk sponsored the study. Dr. Capehorn reported receiving research funding from, providing advisory board support to, and speaker fees from Novo Nordisk and from several other companies.
SOURCE: Capehorn M et al. EASD 2019, Oral Presentation 53; Capehorn M et al. Diabetes Metab. 2019 Sep 17. doi: 10.1016/j.diabet.2019.101117.
BARCELONA – Patients with type 2 diabetes who were treated with semaglutide achieved greater reductions in glycated hemoglobin (HbA1c) levels and body weight, compared with those receiving liraglutide, according to results presented at the annual meeting of the European Association for the Study of Diabetes.
In the phase 3b SUSTAIN 10 trial, conducted in 11 European countries, mean glycated hemoglobin at 30 weeks decreased by 1.7% with once-weekly semaglutide and 1.0% for once-daily liraglutide, from the overall baseline level of 8.2%. The estimated treatment difference (ETD) between the two treatments was –0.69 percentage points (95% confidence interval, –0.82 to –0.56; P less than .0001).
Mean body weight decreased during the same period by 5.8 kg with semaglutide and 1.9 kg with liraglutide, from a baseline of 96.9 kg. The ETD was 3.83 kg (95% CI, –4.57 to –3.09; P less than .0001).
The doses of semaglutide and liraglutide used in the study were 1.0 mg and 1.2 mg, respectively, the latter being the dose that is used most commonly in clinical practice, study investigator Matthew Capehorn, MB, CAB, explained in an interview at the meeting.
“We know that at a dose of 1.8 mg, liraglutide is more effective than 1.2 mg, but it’s about whether it is deemed more cost effective,” said Dr. Capehorn, who is clinical manager at Rotherham (England) Institute for Obesity, Clifton Medical Centre. “Certainly, in the United Kingdom, we’re encouraged to use the 1.2-mg dose” according to guidance from the National Institute for Heath and Care Excellence, and “other European countries are the same.”
Dr. Capehorn noted that studies are being done with a higher dose of semaglutide to see if it has potential as a weight loss drug in its own right in patients who do not have type 2 diabetes. “I care as much about obesity and cardiovascular disease as I do about chasing the HbA1c level and getting that reduced, so I would rather pick an agent that covers all three [components], than just looking at the HbA1c,” he said.
In SUSTAIN 10,577 adults with type 2 diabetes and an HbA1c level of between 7.0% and 11.0% who were on stable doses of one to three oral antidiabetic drugs were randomized to receive semaglutide (n = 290) or liraglutide (n = 287) for 30 weeks.
The primary endpoint was the change in HbA1c from baseline to week 30, and the secondary confirmatory endpoint was change in body weight over the same period.
In presenting the findings, which were simultaneously published in Diabetes & Metabolism, Dr. Capehorn noted that the efficacy results were consistent with those of other SUSTAIN trials that compared semaglutide with other glucagonlike peptide–1 receptor antagonists, notably SUSTAIN 3 (with exenatide extended release) and SUSTAIN 7 (with dulaglutide).
Other efficacy findings from SUSTAIN 10 were that semaglutide produced greater mean changes than did liraglutide in both fasting plasma glucose and in a 7-point, self-monitoring of blood glucose profile.
A greater percentage of people treated with semaglutide, compared with liraglutide, also achieved their glycemic targets of less than 7.0% (80% vs. 46%, respectively) and of 6.5% or less (58% vs. 25%), and their weight loss targets of 5% or more (56% vs. 18%) and 10% or more (19% vs. 4%).
In addition, more semaglutide- than liraglutide-treated patients achieved an HbA1c target of less than 7.0% without severe or blood glucose–confirmed symptomatic hypoglycemia, with or without weight gain (76% vs. 37%; P less than .0001). There were also more semaglutide patients who achieved an HbA1c reduction of 1% or more and a weight loss reduction of 10% or more (17% vs. 4% for liraglutide, P less than .0001).
The safety profiles were similar for semaglutide and liraglutide, Dr. Capehorn noted, but gastrointestinal adverse events were more prevalent in patients receiving semaglutide, compared with liraglutide (43.9% vs. 38.3%), and more patients receiving semaglutide discontinued treatment prematurely because of those adverse events (11.4% vs. 6.6% for liraglutide).
Novo Nordisk sponsored the study. Dr. Capehorn reported receiving research funding from, providing advisory board support to, and speaker fees from Novo Nordisk and from several other companies.
SOURCE: Capehorn M et al. EASD 2019, Oral Presentation 53; Capehorn M et al. Diabetes Metab. 2019 Sep 17. doi: 10.1016/j.diabet.2019.101117.
REPORTING FROM EASD 2019