User login
Gene-based Zika vaccine proves immunogenic in healthy adults
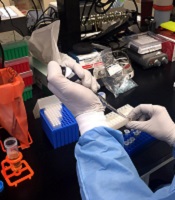
An experimental Zika vaccine is safe and induces an immune response in healthy adults, according to research published in The Lancet.
Investigators tested 2 potential Zika vaccines, VRC5288 and VRC5283, in a pair of phase 1 trials.
Both vaccines were considered well-tolerated, but one of them, VRC5283, induced a greater immune response than the other.
Both vaccines were developed by investigators at the National Institute of Allergy and Infectious Diseases (NIAID).
Now, NIAID is leading an international effort to evaluate VRC5283 in a phase 2/2b trial.
“Following early reports that Zika infection during pregnancy can lead to birth defects, NIAID scientists rapidly created one of the first investigational Zika vaccines using a DNA-based platform and began initial studies in healthy adults less than 1 year later,” said NIAID Director Anthony S. Fauci, MD.
To create their vaccines, the investigators inserted into plasmids genes that encode proteins found on the surface of the Zika virus.
The team developed 2 different plasmids for clinical testing: VRC5288 (Zika virus and Japanese encephalitis virus chimera) and VRC5283 (wild-type Zika virus).
In August 2016, NIAID initiated a phase 1 trial of the VRC5288 plasmid in 80 healthy volunteers ages 18 to 35. Subjects received a 4 mg dose via a needle and syringe injection in the arm muscle.
They received doses of VRC5288 at 0 and 8 weeks; 0 and 12 weeks; 0, 4, and 8 weeks; or 0, 4, and 20 weeks.
In December 2016, NIAID initiated a separate trial testing the VRC5283 plasmid. This study enrolled 45 healthy volunteers ages 18 to 50.
Subjects in this trial received 4 mg doses of VRC5283 at 0, 4, and 8 weeks. They were vaccinated in 3 different ways—via single-dose needle and syringe injection in 1 arm, via split-dose needle and syringe injection in each arm, or via needle-free injection in each arm.
Safety
The vaccinations were considered safe and well-tolerated in both trials, although some participants experienced mild to moderate reactions.
Local reactions (with VRC5288 and VRC5283, respectively) included pain/tenderness (mild—46% and 73%, moderate—0% and 7%), mild swelling (1% and 7%), and mild redness (6% and 2%).
Systemic reactions (with VRC5288 and VRC5283, respectively) included malaise (mild—25% and 33%, moderate—3% and 4%), myalgia (mild—18% and 13%, moderate—4% and 7%), headache (mild—19% and 29%, moderate—4% and 4%), chills (mild—6% and 2%, moderate—1% and 2%), nausea (mild—8% and 4%, moderate—1% and 0%), and joint pain (mild—5% and 16%, moderate—0% and 2%).
Immunogenicity
The investigators analyzed blood samples from all subjects 4 weeks after their final vaccinations.
The team found that 60% to 89% of subjects generated a neutralizing antibody response to VRC5288, and 77% to 100% of subjects generated a neutralizing antibody response to VRC5283.
Subjects who received VRC5283 via the needle-free injector all generated a neutralizing antibody response and had the highest levels of neutralizing antibodies.
Subjects who received VRC5283 in a split-dose administered to both arms had more robust immune responses than those receiving the full dose in 1 arm.
“NIAID has begun phase 2 testing of this candidate to determine if it can prevent Zika virus infection, and the promising phase 1 data . . . support its continued development,” Dr Fauci said. 
An experimental Zika vaccine is safe and induces an immune response in healthy adults, according to research published in The Lancet.
Investigators tested 2 potential Zika vaccines, VRC5288 and VRC5283, in a pair of phase 1 trials.
Both vaccines were considered well-tolerated, but one of them, VRC5283, induced a greater immune response than the other.
Both vaccines were developed by investigators at the National Institute of Allergy and Infectious Diseases (NIAID).
Now, NIAID is leading an international effort to evaluate VRC5283 in a phase 2/2b trial.
“Following early reports that Zika infection during pregnancy can lead to birth defects, NIAID scientists rapidly created one of the first investigational Zika vaccines using a DNA-based platform and began initial studies in healthy adults less than 1 year later,” said NIAID Director Anthony S. Fauci, MD.
To create their vaccines, the investigators inserted into plasmids genes that encode proteins found on the surface of the Zika virus.
The team developed 2 different plasmids for clinical testing: VRC5288 (Zika virus and Japanese encephalitis virus chimera) and VRC5283 (wild-type Zika virus).
In August 2016, NIAID initiated a phase 1 trial of the VRC5288 plasmid in 80 healthy volunteers ages 18 to 35. Subjects received a 4 mg dose via a needle and syringe injection in the arm muscle.
They received doses of VRC5288 at 0 and 8 weeks; 0 and 12 weeks; 0, 4, and 8 weeks; or 0, 4, and 20 weeks.
In December 2016, NIAID initiated a separate trial testing the VRC5283 plasmid. This study enrolled 45 healthy volunteers ages 18 to 50.
Subjects in this trial received 4 mg doses of VRC5283 at 0, 4, and 8 weeks. They were vaccinated in 3 different ways—via single-dose needle and syringe injection in 1 arm, via split-dose needle and syringe injection in each arm, or via needle-free injection in each arm.
Safety
The vaccinations were considered safe and well-tolerated in both trials, although some participants experienced mild to moderate reactions.
Local reactions (with VRC5288 and VRC5283, respectively) included pain/tenderness (mild—46% and 73%, moderate—0% and 7%), mild swelling (1% and 7%), and mild redness (6% and 2%).
Systemic reactions (with VRC5288 and VRC5283, respectively) included malaise (mild—25% and 33%, moderate—3% and 4%), myalgia (mild—18% and 13%, moderate—4% and 7%), headache (mild—19% and 29%, moderate—4% and 4%), chills (mild—6% and 2%, moderate—1% and 2%), nausea (mild—8% and 4%, moderate—1% and 0%), and joint pain (mild—5% and 16%, moderate—0% and 2%).
Immunogenicity
The investigators analyzed blood samples from all subjects 4 weeks after their final vaccinations.
The team found that 60% to 89% of subjects generated a neutralizing antibody response to VRC5288, and 77% to 100% of subjects generated a neutralizing antibody response to VRC5283.
Subjects who received VRC5283 via the needle-free injector all generated a neutralizing antibody response and had the highest levels of neutralizing antibodies.
Subjects who received VRC5283 in a split-dose administered to both arms had more robust immune responses than those receiving the full dose in 1 arm.
“NIAID has begun phase 2 testing of this candidate to determine if it can prevent Zika virus infection, and the promising phase 1 data . . . support its continued development,” Dr Fauci said.
An experimental Zika vaccine is safe and induces an immune response in healthy adults, according to research published in The Lancet.
Investigators tested 2 potential Zika vaccines, VRC5288 and VRC5283, in a pair of phase 1 trials.
Both vaccines were considered well-tolerated, but one of them, VRC5283, induced a greater immune response than the other.
Both vaccines were developed by investigators at the National Institute of Allergy and Infectious Diseases (NIAID).
Now, NIAID is leading an international effort to evaluate VRC5283 in a phase 2/2b trial.
“Following early reports that Zika infection during pregnancy can lead to birth defects, NIAID scientists rapidly created one of the first investigational Zika vaccines using a DNA-based platform and began initial studies in healthy adults less than 1 year later,” said NIAID Director Anthony S. Fauci, MD.
To create their vaccines, the investigators inserted into plasmids genes that encode proteins found on the surface of the Zika virus.
The team developed 2 different plasmids for clinical testing: VRC5288 (Zika virus and Japanese encephalitis virus chimera) and VRC5283 (wild-type Zika virus).
In August 2016, NIAID initiated a phase 1 trial of the VRC5288 plasmid in 80 healthy volunteers ages 18 to 35. Subjects received a 4 mg dose via a needle and syringe injection in the arm muscle.
They received doses of VRC5288 at 0 and 8 weeks; 0 and 12 weeks; 0, 4, and 8 weeks; or 0, 4, and 20 weeks.
In December 2016, NIAID initiated a separate trial testing the VRC5283 plasmid. This study enrolled 45 healthy volunteers ages 18 to 50.
Subjects in this trial received 4 mg doses of VRC5283 at 0, 4, and 8 weeks. They were vaccinated in 3 different ways—via single-dose needle and syringe injection in 1 arm, via split-dose needle and syringe injection in each arm, or via needle-free injection in each arm.
Safety
The vaccinations were considered safe and well-tolerated in both trials, although some participants experienced mild to moderate reactions.
Local reactions (with VRC5288 and VRC5283, respectively) included pain/tenderness (mild—46% and 73%, moderate—0% and 7%), mild swelling (1% and 7%), and mild redness (6% and 2%).
Systemic reactions (with VRC5288 and VRC5283, respectively) included malaise (mild—25% and 33%, moderate—3% and 4%), myalgia (mild—18% and 13%, moderate—4% and 7%), headache (mild—19% and 29%, moderate—4% and 4%), chills (mild—6% and 2%, moderate—1% and 2%), nausea (mild—8% and 4%, moderate—1% and 0%), and joint pain (mild—5% and 16%, moderate—0% and 2%).
Immunogenicity
The investigators analyzed blood samples from all subjects 4 weeks after their final vaccinations.
The team found that 60% to 89% of subjects generated a neutralizing antibody response to VRC5288, and 77% to 100% of subjects generated a neutralizing antibody response to VRC5283.
Subjects who received VRC5283 via the needle-free injector all generated a neutralizing antibody response and had the highest levels of neutralizing antibodies.
Subjects who received VRC5283 in a split-dose administered to both arms had more robust immune responses than those receiving the full dose in 1 arm.
“NIAID has begun phase 2 testing of this candidate to determine if it can prevent Zika virus infection, and the promising phase 1 data . . . support its continued development,” Dr Fauci said.

What Are You Worth? The Basics of Business in Health Care
Dana, an adult nurse practitioner, has been working for two years at a large, suburban primary care practice owned by the regional hospital system. She sees too many patients per day, never has enough time to chart properly, and is concerned by the expanding role of the medical assistants. She sees salary postings on social media and feels she is underpaid. She fantasizes about owning her own practice but would settle for making more money. She’s heard that some NPs have profit-sharing, but she’s not exactly sure what that means.
Kelsey, a PA, is looking for his first job out of school. He’s been offered a full-time, salaried position with benefits at an urgent care center, but he doesn’t know if this is a good deal for him or not. The family physicians there make $85,000 more per year than the PAs, although the roles are quite similar.
DOWN TO BUSINESS
The US health care crisis is, fundamentally, a financial crisis; our system is comprised of both for-profit and not-for-profit (NFP) businesses. Every day, NPs and PAs are making decisions that affect their job satisfaction, performance, and retention. Many lack confidence in their ability to make good decisions about their salaries, because they don’t understand the business of health care.1 To survive and thrive, NPs and PAs must understand the basics of the business end.2
So, what qualifies as a business? Any commercial, retail, or professional entity that earns and spends money. It doesn’t matter if it is a for-profit or NFP organization; it can’t survive unless it makes more money than it spends. How that money is earned varies, from selling services and/or goods to receiving grants, income from interest or rentals, or government subsidies.
The major difference between a for-profit and a NFP organization is who controls the money.3 The owners of a for-profit company control the profits, which may be split among the owners or reinvested in the company. A NFP business may use its profits to provide charity care, offset losses of other programs, or invest in capital improvements (eg, new building, equipment). How the profits are to be used is outlined in the business goals or the mission statement of the entity. There are also federal and state regulations for both types of businesses; visit the Internal Revenue Service website for details (www.irs.gov/charities-non-profits; www.irs.gov/businesses/small-businesses-self-employed).
HOW YOU GET PAID FOR SERVICES
As a PA or NP, you generate income for your employer regardless of whether you work for a for-profit or NFP business. Your patients are billed for services rendered.
If you work for a fee-for-service or NFP practice with insurance contracts, the bill gets coded and electronically submitted for payment. Each insurer, whether private or government (ie, Medicare or Medicaid), has established what they will reimburse you for that service. The reimbursement rate is part of your contract with that insurer. Rates are determined based on your profession, licensure, geographic locale, type of facility, and the market rate. An insurance representative would be able to tell you your reimbursement rate for the most common procedure codes you use. (Your employer has this information but may or may not share it with you.) Medicare rates can be found online at www.cms.gov/Medicare/Medicare-Fee-for-Service-Payment/PhysicianFeeSched/.
If you work for a direct-pay practice, you collect what you bill directly from the patient, often at the time of the visit. A direct-pay practice does not have insurance contracts and does not bill insurers for patients who have insurance; rather, they provide a billing statement with procedure and diagnostic codes and NPI numbers to the patient, who can submit it directly to their insurer. If the insurer accepts out-of-network providers (those with whom they have no contract), they will reimburse the patient directly.
If you work in a fee-for-service or NFP practice, you may see patients who do not have insurance or who have very high deductibles and pay cash for their services. This does not make it a direct-pay practice. Also, by law, fee-for-service and NFP practices can only have one fee schedule for the entire practice. So, you can’t charge one patient $55 for a flu shot and another patient $25. These practices can offer discounts for cash payments at the time of service, to help reduce the set fees, if they choose.
TALKIN’ ’BOUT YOUR (REVENUE) GENERATION
To know how much you can negotiate for your salary and benefits—your total compensation package (of which benefits is often about 30%)—it is critical to know how much revenue you can generate for your employer.4 How can you figure this out?
If you are already working, you can ask your practice manager for some data. In some practices, this information is readily shared, perhaps as a means to boost productivity and even allow comparison between employees. If your practice manager is not forthcoming, you can collect the relevant information yourself. It may be challenging, but it is vital information to have. You need to know how many patients you see per day (keep a log for a month), what their payment source is (specific insurer or self-pay), and what the reimbursement rates are. Although reimbursement rates are deemed confidential per your insurance contract and therefore can’t be shared, you can find Medicare and Medicaid rates online. You can also call the provider representative from each insurer and ask for your reimbursement rates for your five or so most commonly used codes.
Another consideration is payment received (ie, not just what you charge). Do all patients pay everything they owe? Not always. Understand the difference between what you bill, what is allowed, and what you collect. The percentage of what is not collected is called the uncollectable rate. Factor that in.
Furthermore, how much do you contribute to the organization by testing? Dana works for a primary care clinic within a hospital system. Let’s assume her practice doesn’t offer colonoscopies or mammograms; how many referrals does she make to the hospital system for these tests? While she may not know the hospital’s profit margin on them, she can figure out how many she orders in a year. And what about the PA who works for a surgeon? Does he or she do the post-surgical checks? How much time does that save the surgeon, who can be providing higher revenue–producing services with the time saved? That contributes to the income of the practice, too! These are points you can make to justify your salary.
MIX IT UP
There is another major consideration for computing your financial contribution to the practice: understanding case mix. Let’s say your most common visit is billed as a 99213 and you charge $100 for this visit. You use this code 50 times in a week. Do you collect $100 x 50 or $5,000 per week? If you have a direct-pay practice and you collect all of it, yes, you will. If your practice accepts insurance, the number of patients you see with different insurers is called your case mix.
Let’s look at the impact of case mix on what you generate. Remember, it will take you about the same amount of time and effort to see these patients regardless of their insurer. Ask your practice manager what your case mix is. If he/she is not willing to share this information, you can get an estimate by looking at the demographics of your patient community. How many are older than 65? How many are on public assistance? Community needs assessments will provide you with this data; you can also check the patient’s chart or ask what insurance they have and add this to your log.
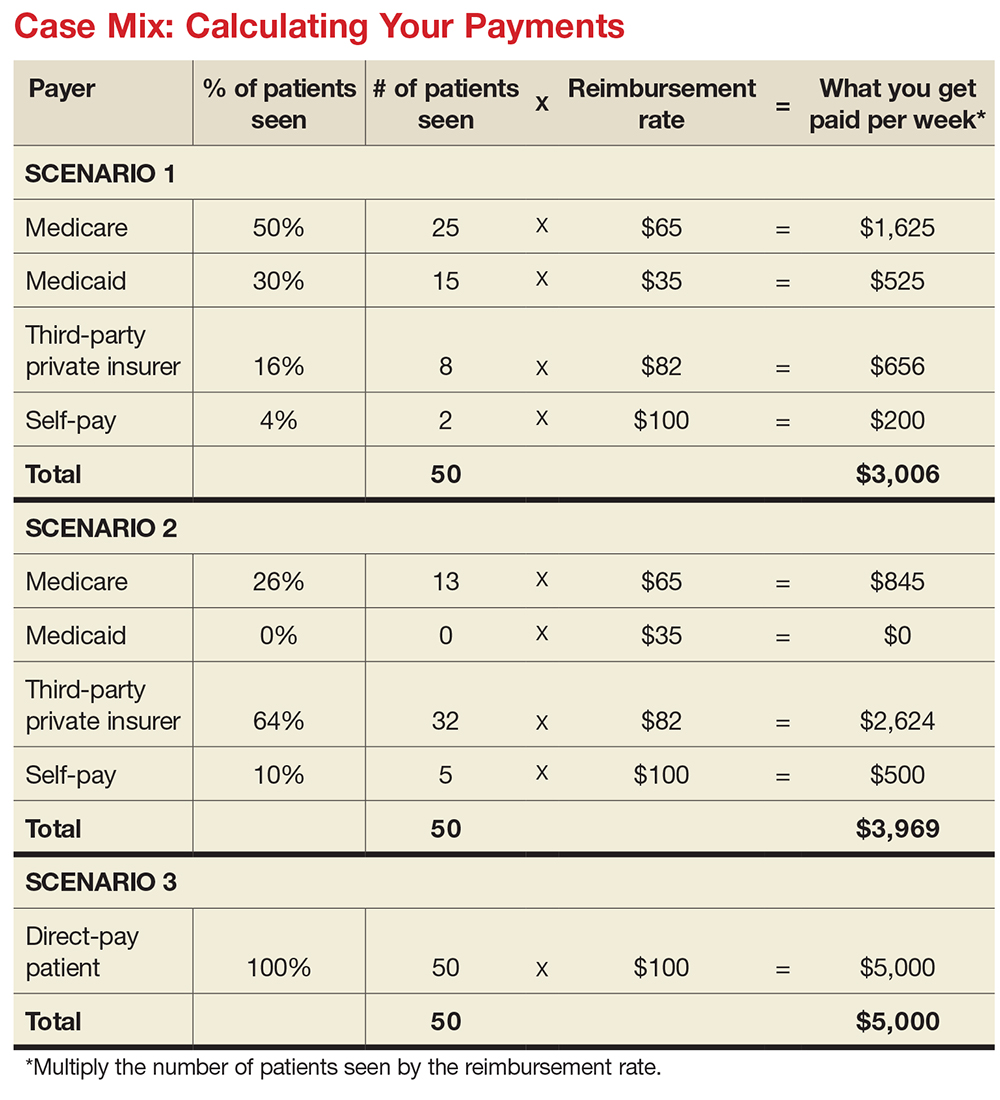
How much will you generate by seeing 50 patients in a week for a 99213 for which you charge $100? Let’s start with sample (not actual) base rates to illustrate the concept: $65 for Medicare, $35 for Medicaid, $82 for third-party private insurance, and $100 for self-pay.
Now let’s explore how case mix impacts revenue, with three different scenarios (see charts). In Scenario 1, 50% of your patients have Medicare, 30% have Medicaid, 16% have third-party private insurance, and 4% pay cash (self-pay). In Scenario 2, 26% have Medicare, 0% have Medicaid, 64% have private insurance, and 10% self-pay. In Scenario 3, your practice is a direct-pay practice with 100% self-payers and a 0% uncollectable rate.
In Scenario 1, with a case mix of 80% of your patient payments from Medicare or Medicaid, you generate $3,006 per week. If you see patients 48 weeks per year, you generate $144,288. In Scenario 2, with a case mix of 74% of your patient payments from private insurance, you generate $3,969 per week. In a year, you generate $190,512. And in Scenario 3, with 100% direct-pay patients, you generate $5,000 per week or $240,000 per year.
This example illustrates how case mix influences health care business, based on the current US reimbursement system. If you work for a practice that serves mostly Medicare and Medicaid patients, you do not command the same salary as an NP or PA who works for a direct-pay practice or one with a majority of privately insured patients.
OVERHEAD, OR IN OVER YOUR HEAD?
Now you have a better understanding of what your worth is to a practice. But what does it cost a practice to employ you? What’s your practice’s overhead?
Overhead includes the cost of processing claims; salaries and benefits; physician collaboration, if needed; rent, utilities, insurance, and depreciation. Overhead rates can range from 20% to 50%—meaning, if you generate $225,000 in revenue, it costs $45,000 to $112,500 to employ you. That leaves $112,500 (with higher overhead) to $180,000 (with lower overhead) for your salary. This revenue generation is an average: Many clinicians generate more than $225,000, while new graduates often generate less.
But in addition to generating more revenue, it can be beneficial to examine what you can do to help decrease the practice overhead. Because the bulk of overhead costs is salary, consider how many full-time-equivalent employees are needed to support you. Some NPs and PAs work with a full-time medical assistant or nurse, while others function very efficiently without one.
While providers like Dana and Kelsey can’t control what their practices pay for rent, utilities, or staffing, they can suggest improvements. Suggestions about scheduling, decreasing no-show rates, and improving recalls, immunization rates, and follow-up visits can all help increase revenue by decreasing day-to-day operating costs.
CONCLUSION
Most NPs and PAs went into their profession to help people—but that altruistic goal doesn’t mean you have to undervalue your own worth. Understanding the basic business of health care can help you negotiate your salary, maximize your income, and create new revenue models for patient care. While this may seem daunting to anyone who went to nursing or medical school, there are great resources to help you educate yourself on the essentials of health care business (see box).

Understanding the infrastructure of the health care system will help NPs and PAs become leaders who can impact health care change. These basic business skills are necessary to ensure fair and full compensation for the roles they play.
1. LaFevers D, Ward-Smith P, Wright W. Essential nurse practitioner business knowledge: an interprofessional perspective. J Am Assoc Nurse Pract. 2015;4:181-184.
2. Buppert C. Nurse Practitioner’s Business and Legal Guide. 6th ed. Burlington, MA: Jones and Bartlett Learning; 2018: 311-324.
3. Fritz J. How is a nonprofit different from a for-profit business? Getting beyond the myths. The Balance. April 3, 2017. www.thebalance.com/how-is-a-nonprofit-different-from-for-profit-business-2502472. Accessed November 20, 2017.
4. Dillon D, Hoyson P. Beginning employment: a guide for the new nurse practitioner. J Nurse Pract. 2014;1:55-59.
Dana, an adult nurse practitioner, has been working for two years at a large, suburban primary care practice owned by the regional hospital system. She sees too many patients per day, never has enough time to chart properly, and is concerned by the expanding role of the medical assistants. She sees salary postings on social media and feels she is underpaid. She fantasizes about owning her own practice but would settle for making more money. She’s heard that some NPs have profit-sharing, but she’s not exactly sure what that means.
Kelsey, a PA, is looking for his first job out of school. He’s been offered a full-time, salaried position with benefits at an urgent care center, but he doesn’t know if this is a good deal for him or not. The family physicians there make $85,000 more per year than the PAs, although the roles are quite similar.
DOWN TO BUSINESS
The US health care crisis is, fundamentally, a financial crisis; our system is comprised of both for-profit and not-for-profit (NFP) businesses. Every day, NPs and PAs are making decisions that affect their job satisfaction, performance, and retention. Many lack confidence in their ability to make good decisions about their salaries, because they don’t understand the business of health care.1 To survive and thrive, NPs and PAs must understand the basics of the business end.2
So, what qualifies as a business? Any commercial, retail, or professional entity that earns and spends money. It doesn’t matter if it is a for-profit or NFP organization; it can’t survive unless it makes more money than it spends. How that money is earned varies, from selling services and/or goods to receiving grants, income from interest or rentals, or government subsidies.
The major difference between a for-profit and a NFP organization is who controls the money.3 The owners of a for-profit company control the profits, which may be split among the owners or reinvested in the company. A NFP business may use its profits to provide charity care, offset losses of other programs, or invest in capital improvements (eg, new building, equipment). How the profits are to be used is outlined in the business goals or the mission statement of the entity. There are also federal and state regulations for both types of businesses; visit the Internal Revenue Service website for details (www.irs.gov/charities-non-profits; www.irs.gov/businesses/small-businesses-self-employed).
HOW YOU GET PAID FOR SERVICES
As a PA or NP, you generate income for your employer regardless of whether you work for a for-profit or NFP business. Your patients are billed for services rendered.
If you work for a fee-for-service or NFP practice with insurance contracts, the bill gets coded and electronically submitted for payment. Each insurer, whether private or government (ie, Medicare or Medicaid), has established what they will reimburse you for that service. The reimbursement rate is part of your contract with that insurer. Rates are determined based on your profession, licensure, geographic locale, type of facility, and the market rate. An insurance representative would be able to tell you your reimbursement rate for the most common procedure codes you use. (Your employer has this information but may or may not share it with you.) Medicare rates can be found online at www.cms.gov/Medicare/Medicare-Fee-for-Service-Payment/PhysicianFeeSched/.
If you work for a direct-pay practice, you collect what you bill directly from the patient, often at the time of the visit. A direct-pay practice does not have insurance contracts and does not bill insurers for patients who have insurance; rather, they provide a billing statement with procedure and diagnostic codes and NPI numbers to the patient, who can submit it directly to their insurer. If the insurer accepts out-of-network providers (those with whom they have no contract), they will reimburse the patient directly.
If you work in a fee-for-service or NFP practice, you may see patients who do not have insurance or who have very high deductibles and pay cash for their services. This does not make it a direct-pay practice. Also, by law, fee-for-service and NFP practices can only have one fee schedule for the entire practice. So, you can’t charge one patient $55 for a flu shot and another patient $25. These practices can offer discounts for cash payments at the time of service, to help reduce the set fees, if they choose.
TALKIN’ ’BOUT YOUR (REVENUE) GENERATION
To know how much you can negotiate for your salary and benefits—your total compensation package (of which benefits is often about 30%)—it is critical to know how much revenue you can generate for your employer.4 How can you figure this out?
If you are already working, you can ask your practice manager for some data. In some practices, this information is readily shared, perhaps as a means to boost productivity and even allow comparison between employees. If your practice manager is not forthcoming, you can collect the relevant information yourself. It may be challenging, but it is vital information to have. You need to know how many patients you see per day (keep a log for a month), what their payment source is (specific insurer or self-pay), and what the reimbursement rates are. Although reimbursement rates are deemed confidential per your insurance contract and therefore can’t be shared, you can find Medicare and Medicaid rates online. You can also call the provider representative from each insurer and ask for your reimbursement rates for your five or so most commonly used codes.
Another consideration is payment received (ie, not just what you charge). Do all patients pay everything they owe? Not always. Understand the difference between what you bill, what is allowed, and what you collect. The percentage of what is not collected is called the uncollectable rate. Factor that in.
Furthermore, how much do you contribute to the organization by testing? Dana works for a primary care clinic within a hospital system. Let’s assume her practice doesn’t offer colonoscopies or mammograms; how many referrals does she make to the hospital system for these tests? While she may not know the hospital’s profit margin on them, she can figure out how many she orders in a year. And what about the PA who works for a surgeon? Does he or she do the post-surgical checks? How much time does that save the surgeon, who can be providing higher revenue–producing services with the time saved? That contributes to the income of the practice, too! These are points you can make to justify your salary.
MIX IT UP
There is another major consideration for computing your financial contribution to the practice: understanding case mix. Let’s say your most common visit is billed as a 99213 and you charge $100 for this visit. You use this code 50 times in a week. Do you collect $100 x 50 or $5,000 per week? If you have a direct-pay practice and you collect all of it, yes, you will. If your practice accepts insurance, the number of patients you see with different insurers is called your case mix.
Let’s look at the impact of case mix on what you generate. Remember, it will take you about the same amount of time and effort to see these patients regardless of their insurer. Ask your practice manager what your case mix is. If he/she is not willing to share this information, you can get an estimate by looking at the demographics of your patient community. How many are older than 65? How many are on public assistance? Community needs assessments will provide you with this data; you can also check the patient’s chart or ask what insurance they have and add this to your log.
How much will you generate by seeing 50 patients in a week for a 99213 for which you charge $100? Let’s start with sample (not actual) base rates to illustrate the concept: $65 for Medicare, $35 for Medicaid, $82 for third-party private insurance, and $100 for self-pay.
Now let’s explore how case mix impacts revenue, with three different scenarios (see charts). In Scenario 1, 50% of your patients have Medicare, 30% have Medicaid, 16% have third-party private insurance, and 4% pay cash (self-pay). In Scenario 2, 26% have Medicare, 0% have Medicaid, 64% have private insurance, and 10% self-pay. In Scenario 3, your practice is a direct-pay practice with 100% self-payers and a 0% uncollectable rate.
In Scenario 1, with a case mix of 80% of your patient payments from Medicare or Medicaid, you generate $3,006 per week. If you see patients 48 weeks per year, you generate $144,288. In Scenario 2, with a case mix of 74% of your patient payments from private insurance, you generate $3,969 per week. In a year, you generate $190,512. And in Scenario 3, with 100% direct-pay patients, you generate $5,000 per week or $240,000 per year.
This example illustrates how case mix influences health care business, based on the current US reimbursement system. If you work for a practice that serves mostly Medicare and Medicaid patients, you do not command the same salary as an NP or PA who works for a direct-pay practice or one with a majority of privately insured patients.
OVERHEAD, OR IN OVER YOUR HEAD?
Now you have a better understanding of what your worth is to a practice. But what does it cost a practice to employ you? What’s your practice’s overhead?
Overhead includes the cost of processing claims; salaries and benefits; physician collaboration, if needed; rent, utilities, insurance, and depreciation. Overhead rates can range from 20% to 50%—meaning, if you generate $225,000 in revenue, it costs $45,000 to $112,500 to employ you. That leaves $112,500 (with higher overhead) to $180,000 (with lower overhead) for your salary. This revenue generation is an average: Many clinicians generate more than $225,000, while new graduates often generate less.
But in addition to generating more revenue, it can be beneficial to examine what you can do to help decrease the practice overhead. Because the bulk of overhead costs is salary, consider how many full-time-equivalent employees are needed to support you. Some NPs and PAs work with a full-time medical assistant or nurse, while others function very efficiently without one.
While providers like Dana and Kelsey can’t control what their practices pay for rent, utilities, or staffing, they can suggest improvements. Suggestions about scheduling, decreasing no-show rates, and improving recalls, immunization rates, and follow-up visits can all help increase revenue by decreasing day-to-day operating costs.
CONCLUSION
Most NPs and PAs went into their profession to help people—but that altruistic goal doesn’t mean you have to undervalue your own worth. Understanding the basic business of health care can help you negotiate your salary, maximize your income, and create new revenue models for patient care. While this may seem daunting to anyone who went to nursing or medical school, there are great resources to help you educate yourself on the essentials of health care business (see box).
Understanding the infrastructure of the health care system will help NPs and PAs become leaders who can impact health care change. These basic business skills are necessary to ensure fair and full compensation for the roles they play.
Dana, an adult nurse practitioner, has been working for two years at a large, suburban primary care practice owned by the regional hospital system. She sees too many patients per day, never has enough time to chart properly, and is concerned by the expanding role of the medical assistants. She sees salary postings on social media and feels she is underpaid. She fantasizes about owning her own practice but would settle for making more money. She’s heard that some NPs have profit-sharing, but she’s not exactly sure what that means.
Kelsey, a PA, is looking for his first job out of school. He’s been offered a full-time, salaried position with benefits at an urgent care center, but he doesn’t know if this is a good deal for him or not. The family physicians there make $85,000 more per year than the PAs, although the roles are quite similar.
DOWN TO BUSINESS
The US health care crisis is, fundamentally, a financial crisis; our system is comprised of both for-profit and not-for-profit (NFP) businesses. Every day, NPs and PAs are making decisions that affect their job satisfaction, performance, and retention. Many lack confidence in their ability to make good decisions about their salaries, because they don’t understand the business of health care.1 To survive and thrive, NPs and PAs must understand the basics of the business end.2
So, what qualifies as a business? Any commercial, retail, or professional entity that earns and spends money. It doesn’t matter if it is a for-profit or NFP organization; it can’t survive unless it makes more money than it spends. How that money is earned varies, from selling services and/or goods to receiving grants, income from interest or rentals, or government subsidies.
The major difference between a for-profit and a NFP organization is who controls the money.3 The owners of a for-profit company control the profits, which may be split among the owners or reinvested in the company. A NFP business may use its profits to provide charity care, offset losses of other programs, or invest in capital improvements (eg, new building, equipment). How the profits are to be used is outlined in the business goals or the mission statement of the entity. There are also federal and state regulations for both types of businesses; visit the Internal Revenue Service website for details (www.irs.gov/charities-non-profits; www.irs.gov/businesses/small-businesses-self-employed).
HOW YOU GET PAID FOR SERVICES
As a PA or NP, you generate income for your employer regardless of whether you work for a for-profit or NFP business. Your patients are billed for services rendered.
If you work for a fee-for-service or NFP practice with insurance contracts, the bill gets coded and electronically submitted for payment. Each insurer, whether private or government (ie, Medicare or Medicaid), has established what they will reimburse you for that service. The reimbursement rate is part of your contract with that insurer. Rates are determined based on your profession, licensure, geographic locale, type of facility, and the market rate. An insurance representative would be able to tell you your reimbursement rate for the most common procedure codes you use. (Your employer has this information but may or may not share it with you.) Medicare rates can be found online at www.cms.gov/Medicare/Medicare-Fee-for-Service-Payment/PhysicianFeeSched/.
If you work for a direct-pay practice, you collect what you bill directly from the patient, often at the time of the visit. A direct-pay practice does not have insurance contracts and does not bill insurers for patients who have insurance; rather, they provide a billing statement with procedure and diagnostic codes and NPI numbers to the patient, who can submit it directly to their insurer. If the insurer accepts out-of-network providers (those with whom they have no contract), they will reimburse the patient directly.
If you work in a fee-for-service or NFP practice, you may see patients who do not have insurance or who have very high deductibles and pay cash for their services. This does not make it a direct-pay practice. Also, by law, fee-for-service and NFP practices can only have one fee schedule for the entire practice. So, you can’t charge one patient $55 for a flu shot and another patient $25. These practices can offer discounts for cash payments at the time of service, to help reduce the set fees, if they choose.
TALKIN’ ’BOUT YOUR (REVENUE) GENERATION
To know how much you can negotiate for your salary and benefits—your total compensation package (of which benefits is often about 30%)—it is critical to know how much revenue you can generate for your employer.4 How can you figure this out?
If you are already working, you can ask your practice manager for some data. In some practices, this information is readily shared, perhaps as a means to boost productivity and even allow comparison between employees. If your practice manager is not forthcoming, you can collect the relevant information yourself. It may be challenging, but it is vital information to have. You need to know how many patients you see per day (keep a log for a month), what their payment source is (specific insurer or self-pay), and what the reimbursement rates are. Although reimbursement rates are deemed confidential per your insurance contract and therefore can’t be shared, you can find Medicare and Medicaid rates online. You can also call the provider representative from each insurer and ask for your reimbursement rates for your five or so most commonly used codes.
Another consideration is payment received (ie, not just what you charge). Do all patients pay everything they owe? Not always. Understand the difference between what you bill, what is allowed, and what you collect. The percentage of what is not collected is called the uncollectable rate. Factor that in.
Furthermore, how much do you contribute to the organization by testing? Dana works for a primary care clinic within a hospital system. Let’s assume her practice doesn’t offer colonoscopies or mammograms; how many referrals does she make to the hospital system for these tests? While she may not know the hospital’s profit margin on them, she can figure out how many she orders in a year. And what about the PA who works for a surgeon? Does he or she do the post-surgical checks? How much time does that save the surgeon, who can be providing higher revenue–producing services with the time saved? That contributes to the income of the practice, too! These are points you can make to justify your salary.
MIX IT UP
There is another major consideration for computing your financial contribution to the practice: understanding case mix. Let’s say your most common visit is billed as a 99213 and you charge $100 for this visit. You use this code 50 times in a week. Do you collect $100 x 50 or $5,000 per week? If you have a direct-pay practice and you collect all of it, yes, you will. If your practice accepts insurance, the number of patients you see with different insurers is called your case mix.
Let’s look at the impact of case mix on what you generate. Remember, it will take you about the same amount of time and effort to see these patients regardless of their insurer. Ask your practice manager what your case mix is. If he/she is not willing to share this information, you can get an estimate by looking at the demographics of your patient community. How many are older than 65? How many are on public assistance? Community needs assessments will provide you with this data; you can also check the patient’s chart or ask what insurance they have and add this to your log.
How much will you generate by seeing 50 patients in a week for a 99213 for which you charge $100? Let’s start with sample (not actual) base rates to illustrate the concept: $65 for Medicare, $35 for Medicaid, $82 for third-party private insurance, and $100 for self-pay.
Now let’s explore how case mix impacts revenue, with three different scenarios (see charts). In Scenario 1, 50% of your patients have Medicare, 30% have Medicaid, 16% have third-party private insurance, and 4% pay cash (self-pay). In Scenario 2, 26% have Medicare, 0% have Medicaid, 64% have private insurance, and 10% self-pay. In Scenario 3, your practice is a direct-pay practice with 100% self-payers and a 0% uncollectable rate.
In Scenario 1, with a case mix of 80% of your patient payments from Medicare or Medicaid, you generate $3,006 per week. If you see patients 48 weeks per year, you generate $144,288. In Scenario 2, with a case mix of 74% of your patient payments from private insurance, you generate $3,969 per week. In a year, you generate $190,512. And in Scenario 3, with 100% direct-pay patients, you generate $5,000 per week or $240,000 per year.
This example illustrates how case mix influences health care business, based on the current US reimbursement system. If you work for a practice that serves mostly Medicare and Medicaid patients, you do not command the same salary as an NP or PA who works for a direct-pay practice or one with a majority of privately insured patients.
OVERHEAD, OR IN OVER YOUR HEAD?
Now you have a better understanding of what your worth is to a practice. But what does it cost a practice to employ you? What’s your practice’s overhead?
Overhead includes the cost of processing claims; salaries and benefits; physician collaboration, if needed; rent, utilities, insurance, and depreciation. Overhead rates can range from 20% to 50%—meaning, if you generate $225,000 in revenue, it costs $45,000 to $112,500 to employ you. That leaves $112,500 (with higher overhead) to $180,000 (with lower overhead) for your salary. This revenue generation is an average: Many clinicians generate more than $225,000, while new graduates often generate less.
But in addition to generating more revenue, it can be beneficial to examine what you can do to help decrease the practice overhead. Because the bulk of overhead costs is salary, consider how many full-time-equivalent employees are needed to support you. Some NPs and PAs work with a full-time medical assistant or nurse, while others function very efficiently without one.
While providers like Dana and Kelsey can’t control what their practices pay for rent, utilities, or staffing, they can suggest improvements. Suggestions about scheduling, decreasing no-show rates, and improving recalls, immunization rates, and follow-up visits can all help increase revenue by decreasing day-to-day operating costs.
CONCLUSION
Most NPs and PAs went into their profession to help people—but that altruistic goal doesn’t mean you have to undervalue your own worth. Understanding the basic business of health care can help you negotiate your salary, maximize your income, and create new revenue models for patient care. While this may seem daunting to anyone who went to nursing or medical school, there are great resources to help you educate yourself on the essentials of health care business (see box).
Understanding the infrastructure of the health care system will help NPs and PAs become leaders who can impact health care change. These basic business skills are necessary to ensure fair and full compensation for the roles they play.
1. LaFevers D, Ward-Smith P, Wright W. Essential nurse practitioner business knowledge: an interprofessional perspective. J Am Assoc Nurse Pract. 2015;4:181-184.
2. Buppert C. Nurse Practitioner’s Business and Legal Guide. 6th ed. Burlington, MA: Jones and Bartlett Learning; 2018: 311-324.
3. Fritz J. How is a nonprofit different from a for-profit business? Getting beyond the myths. The Balance. April 3, 2017. www.thebalance.com/how-is-a-nonprofit-different-from-for-profit-business-2502472. Accessed November 20, 2017.
4. Dillon D, Hoyson P. Beginning employment: a guide for the new nurse practitioner. J Nurse Pract. 2014;1:55-59.
1. LaFevers D, Ward-Smith P, Wright W. Essential nurse practitioner business knowledge: an interprofessional perspective. J Am Assoc Nurse Pract. 2015;4:181-184.
2. Buppert C. Nurse Practitioner’s Business and Legal Guide. 6th ed. Burlington, MA: Jones and Bartlett Learning; 2018: 311-324.
3. Fritz J. How is a nonprofit different from a for-profit business? Getting beyond the myths. The Balance. April 3, 2017. www.thebalance.com/how-is-a-nonprofit-different-from-for-profit-business-2502472. Accessed November 20, 2017.
4. Dillon D, Hoyson P. Beginning employment: a guide for the new nurse practitioner. J Nurse Pract. 2014;1:55-59.

Device-based treatments improved acne in small study, with good safety profile
with a reasonable safety profile, in a small prospective split-face study that compared the two treatments.
Both treatments resulted in similar – and steady – improvements during treatment, but FMR was more effective in long-term maintenance, according to H. H. Kwon, MD, of the Oaro Dermatology Clinic, Seoul, South Korea, and associates.
In the 20-week prospective, randomized, split-face study, published in the Journal of the European Academy of Dermatology and Venereology, 25 Korean patients (Fitzpatrick skin types III or IV), aged 19-37 years, with mild to moderate facial acne, were treated with nonablative 1,450-nm DL and FMR on different sides of their faces every 4 weeks, for a total of three treatments, and were followed up 12 weeks after the third treatment.
During treatment, there were significant improvements in inflammatory acne lesion counts on both sides. At the 12-week follow-up, counts had decreased by 39.3% (from 14.5 at baseline to 9.5) on the DL-treated side and by 58.2% (from 15.6 to 6.0) on the FMR-treated side, a significant difference between the two (P less than .05).
In addition, “both sides demonstrated gradual decreases in sebum output with significant reductions after the second session, and notable difference between the two sides was observed at the follow-up visit,” the authors wrote. Patient self-assessments indicated that they were more satisfied with the degree of improvements in acne, skin texture/enlarged pores, and acne scars on the FMR-treated side.
There was no significant difference in posttreatment erythema and edema associated with the two treatments; mild postinflammatory hyperpigmentation was seen on the DL-treated side in two patients, but not on the FMR-treated side. There were no cases of secondary scarring or infection.
The authors wrote that, as far as they know, this was the first study to compare these two treatments in patients with acne. Based on the results, they concluded, “a few sessions of these devices, as monotherapy or as an element of component of combination therapy, would be a viable option for acne treatment.”
Limitations of the study included the same ethnic background of all the patients, they noted, adding that studies combining treatment with these devices and acne medications in patients with severe acne “would provide clinically interesting data.”
The authors had no disclosures; there was no funding source disclosed.
SOURCE: Kwon HH et al. J Eur Acad Dermatol Venereol. 2017 Nov 24. doi: 10.1111/jdv.14714).
with a reasonable safety profile, in a small prospective split-face study that compared the two treatments.
Both treatments resulted in similar – and steady – improvements during treatment, but FMR was more effective in long-term maintenance, according to H. H. Kwon, MD, of the Oaro Dermatology Clinic, Seoul, South Korea, and associates.
In the 20-week prospective, randomized, split-face study, published in the Journal of the European Academy of Dermatology and Venereology, 25 Korean patients (Fitzpatrick skin types III or IV), aged 19-37 years, with mild to moderate facial acne, were treated with nonablative 1,450-nm DL and FMR on different sides of their faces every 4 weeks, for a total of three treatments, and were followed up 12 weeks after the third treatment.
During treatment, there were significant improvements in inflammatory acne lesion counts on both sides. At the 12-week follow-up, counts had decreased by 39.3% (from 14.5 at baseline to 9.5) on the DL-treated side and by 58.2% (from 15.6 to 6.0) on the FMR-treated side, a significant difference between the two (P less than .05).
In addition, “both sides demonstrated gradual decreases in sebum output with significant reductions after the second session, and notable difference between the two sides was observed at the follow-up visit,” the authors wrote. Patient self-assessments indicated that they were more satisfied with the degree of improvements in acne, skin texture/enlarged pores, and acne scars on the FMR-treated side.
There was no significant difference in posttreatment erythema and edema associated with the two treatments; mild postinflammatory hyperpigmentation was seen on the DL-treated side in two patients, but not on the FMR-treated side. There were no cases of secondary scarring or infection.
The authors wrote that, as far as they know, this was the first study to compare these two treatments in patients with acne. Based on the results, they concluded, “a few sessions of these devices, as monotherapy or as an element of component of combination therapy, would be a viable option for acne treatment.”
Limitations of the study included the same ethnic background of all the patients, they noted, adding that studies combining treatment with these devices and acne medications in patients with severe acne “would provide clinically interesting data.”
The authors had no disclosures; there was no funding source disclosed.
SOURCE: Kwon HH et al. J Eur Acad Dermatol Venereol. 2017 Nov 24. doi: 10.1111/jdv.14714).
with a reasonable safety profile, in a small prospective split-face study that compared the two treatments.
Both treatments resulted in similar – and steady – improvements during treatment, but FMR was more effective in long-term maintenance, according to H. H. Kwon, MD, of the Oaro Dermatology Clinic, Seoul, South Korea, and associates.
In the 20-week prospective, randomized, split-face study, published in the Journal of the European Academy of Dermatology and Venereology, 25 Korean patients (Fitzpatrick skin types III or IV), aged 19-37 years, with mild to moderate facial acne, were treated with nonablative 1,450-nm DL and FMR on different sides of their faces every 4 weeks, for a total of three treatments, and were followed up 12 weeks after the third treatment.
During treatment, there were significant improvements in inflammatory acne lesion counts on both sides. At the 12-week follow-up, counts had decreased by 39.3% (from 14.5 at baseline to 9.5) on the DL-treated side and by 58.2% (from 15.6 to 6.0) on the FMR-treated side, a significant difference between the two (P less than .05).
In addition, “both sides demonstrated gradual decreases in sebum output with significant reductions after the second session, and notable difference between the two sides was observed at the follow-up visit,” the authors wrote. Patient self-assessments indicated that they were more satisfied with the degree of improvements in acne, skin texture/enlarged pores, and acne scars on the FMR-treated side.
There was no significant difference in posttreatment erythema and edema associated with the two treatments; mild postinflammatory hyperpigmentation was seen on the DL-treated side in two patients, but not on the FMR-treated side. There were no cases of secondary scarring or infection.
The authors wrote that, as far as they know, this was the first study to compare these two treatments in patients with acne. Based on the results, they concluded, “a few sessions of these devices, as monotherapy or as an element of component of combination therapy, would be a viable option for acne treatment.”
Limitations of the study included the same ethnic background of all the patients, they noted, adding that studies combining treatment with these devices and acne medications in patients with severe acne “would provide clinically interesting data.”
The authors had no disclosures; there was no funding source disclosed.
SOURCE: Kwon HH et al. J Eur Acad Dermatol Venereol. 2017 Nov 24. doi: 10.1111/jdv.14714).
FROM THE JOURNAL OF THE EUROPEAN ACADEMY OF DERMATOLOGY AND VENEREOLOGY
Key clinical point: Device-based treatments could be a promising for acne, alone or in combination with other treatments.
Major finding: At follow-up, acne lesion counts had decreased by 39.3% on the DL-treated side and 58.2% on the FMR-treated side (P less than.05).
Study details: A 20-week prospective, randomized, split-face study in 25 Korean patients with mild to moderate facial acne.
Disclosures: The authors had no disclosures; there was no funding source disclosed.
Source: Kwon HH et al. J Eur Acad Dermatol Venereol. 2017 Nov 24. doi: 10.1111/jdv.14714.
Ribociclib plus standard of care improves PFS in premenopausal HR+/HER2-negative breast cancer
SAN ANTONIO – For premenopausal women with advanced hormone receptor–positive, HER2-negative breast cancer, the addition of the CDK4/6 inhibitor ribociclib (Kisqali) to endocrine therapy and goserelin was associated with a near doubling in progression-free survival (PFS), improvement in pain scores and a longer time to deterioration of quality of life (Qol) scores, investigators reported.

The hazard ratio for the ribociclib-based combination was 0.553 (P less than .0001), he reported at the San Antonio Breast Cancer Symposium.
“The treatment benefit was seen across all subgroups, and also regardless of the endocrine partner, either tamoxifen or aromastase inhibitors,” he said.
The combination of ribociclib with goserelin and either tamoxifen or a nonsteroidal AI is a potential new treatment option for premenopausal women with hormone receptor–positive, HER2-negative advanced breast cancer, regardless of the disease-free interval or the endocrine partner, he said in a media briefing and in an oral session.
In the United States, approximately 19% of invasive breast cancers are diagnosed in women aged 49 years or younger, and in the Asia/Pacific region, the proportion of patients aged younger than 50 years with invasive breast cancer may be as high as 42%, Dr. Tripathy said.
The need for new therapeutic approaches in this population is clear, with the last randomized clinical trial focused solely on women with advanced premenopausal breast being published 17 years ago, he pointed out.
Given the efficacy of adding ribociclib to standard AI therapy in postmenopausal women with advanced HR+/HER2- breast cancer as seen in the MONALEESA-2 trial, the MONALEESA-7 investigators looked at the same combination as first-line therapy in premenopausal women with similar disease features.
In the trial, 672 pre- or perimenopausal women with HR+/HER2– advanced breast cancer with no prior endocrine therapy for advanced disease and no more than one line of chemotherapy for advanced disease were enrolled. The patients were stratified by the presence of liver/lung metastases, prior chemotherapy, and prior endocrine partner, tamoxifen or nonsteroidal AI, and then randomly assigned to the ribociclib 600 mg/day for 3 weeks, followed by 1-week off, plus tamoxifen or AI and goserelin, or the same combination and schedule with placebo.
Of the 672 patients enrolled, a total of 335 patients assigned to ribociclib and 337 assigned to placebo received treatment.
Investigator-assessed progression-free survival was the primary endpoint, as noted before. The findings were supported by an analysis of the data by a blinded independent review committee, which determined the median PFS to not have been reached in the ribociclib arm, compared with 11.1 months in the placebo arm, with a hazard ratio of 0.427, and a 95% confidence interval showing statistical significance.
The secondary endpoint of overall response rate (ORR) was also significantly better with ribociclib among the entire patient population (40.9% vs. 29.7%; P = .00098), and in patients with measurable disease (50.9% vs. 36.4%; P = .000317).
An analysis of PFS by endocrine agent (tamoxifen or AI) showed similar hazard ratios with each class of agent combined with ribociclib.
Hematologic adverse events occurred in 75.8% of all patients on ribociclib, compared with 7.7% of those on placebo. In the CDK4/6 inhibitor arm, 50.7% of patients had grade 3 neutropenia, and 9.9% had grade 4. Febrile neutropenia occurred in 2.1% of patients on ribociclib, compared with 0.6% of patients on placebo.
Nonhematologic adverse events were generally similar between the trial arms, with the exception of more frequent nausea with ribociclib.
Ribociclib also was associated with significantly better patient-reported outcomes, including longer time to deterioration of QoL scores, and better improvement in pain scores from baseline.

“For me, I would now be very comfortable giving these women an aromatase inhibitor plus goserelin and riboclicib,” she said in an interview.
SABCS fixture Steven “Vogl, New York” Vogl, MD, a medical oncologist in private practice in New York, commented after Dr. Tripathy’s presentation that, “I think that this is a momentous study, and I think it should immediately change the standard of care for symptomatic young women with metastatic breast cancer. More of them get better, and they stay better longer. These are people who we’re trying to buy some good life for, before the inevitable happens.”
The MONALEESA 7 trial was supported by Novartis. Dr. Tripathy disclosed steering committee consulting fees and institutional funding from the company. Dr. Kaklamani reported serving as a consultant to Novartis. Dr. Vogl reported no conflicts of interest.
SAN ANTONIO – For premenopausal women with advanced hormone receptor–positive, HER2-negative breast cancer, the addition of the CDK4/6 inhibitor ribociclib (Kisqali) to endocrine therapy and goserelin was associated with a near doubling in progression-free survival (PFS), improvement in pain scores and a longer time to deterioration of quality of life (Qol) scores, investigators reported.
The hazard ratio for the ribociclib-based combination was 0.553 (P less than .0001), he reported at the San Antonio Breast Cancer Symposium.
“The treatment benefit was seen across all subgroups, and also regardless of the endocrine partner, either tamoxifen or aromastase inhibitors,” he said.
The combination of ribociclib with goserelin and either tamoxifen or a nonsteroidal AI is a potential new treatment option for premenopausal women with hormone receptor–positive, HER2-negative advanced breast cancer, regardless of the disease-free interval or the endocrine partner, he said in a media briefing and in an oral session.
In the United States, approximately 19% of invasive breast cancers are diagnosed in women aged 49 years or younger, and in the Asia/Pacific region, the proportion of patients aged younger than 50 years with invasive breast cancer may be as high as 42%, Dr. Tripathy said.
The need for new therapeutic approaches in this population is clear, with the last randomized clinical trial focused solely on women with advanced premenopausal breast being published 17 years ago, he pointed out.
Given the efficacy of adding ribociclib to standard AI therapy in postmenopausal women with advanced HR+/HER2- breast cancer as seen in the MONALEESA-2 trial, the MONALEESA-7 investigators looked at the same combination as first-line therapy in premenopausal women with similar disease features.
In the trial, 672 pre- or perimenopausal women with HR+/HER2– advanced breast cancer with no prior endocrine therapy for advanced disease and no more than one line of chemotherapy for advanced disease were enrolled. The patients were stratified by the presence of liver/lung metastases, prior chemotherapy, and prior endocrine partner, tamoxifen or nonsteroidal AI, and then randomly assigned to the ribociclib 600 mg/day for 3 weeks, followed by 1-week off, plus tamoxifen or AI and goserelin, or the same combination and schedule with placebo.
Of the 672 patients enrolled, a total of 335 patients assigned to ribociclib and 337 assigned to placebo received treatment.
Investigator-assessed progression-free survival was the primary endpoint, as noted before. The findings were supported by an analysis of the data by a blinded independent review committee, which determined the median PFS to not have been reached in the ribociclib arm, compared with 11.1 months in the placebo arm, with a hazard ratio of 0.427, and a 95% confidence interval showing statistical significance.
The secondary endpoint of overall response rate (ORR) was also significantly better with ribociclib among the entire patient population (40.9% vs. 29.7%; P = .00098), and in patients with measurable disease (50.9% vs. 36.4%; P = .000317).
An analysis of PFS by endocrine agent (tamoxifen or AI) showed similar hazard ratios with each class of agent combined with ribociclib.
Hematologic adverse events occurred in 75.8% of all patients on ribociclib, compared with 7.7% of those on placebo. In the CDK4/6 inhibitor arm, 50.7% of patients had grade 3 neutropenia, and 9.9% had grade 4. Febrile neutropenia occurred in 2.1% of patients on ribociclib, compared with 0.6% of patients on placebo.
Nonhematologic adverse events were generally similar between the trial arms, with the exception of more frequent nausea with ribociclib.
Ribociclib also was associated with significantly better patient-reported outcomes, including longer time to deterioration of QoL scores, and better improvement in pain scores from baseline.
“For me, I would now be very comfortable giving these women an aromatase inhibitor plus goserelin and riboclicib,” she said in an interview.
SABCS fixture Steven “Vogl, New York” Vogl, MD, a medical oncologist in private practice in New York, commented after Dr. Tripathy’s presentation that, “I think that this is a momentous study, and I think it should immediately change the standard of care for symptomatic young women with metastatic breast cancer. More of them get better, and they stay better longer. These are people who we’re trying to buy some good life for, before the inevitable happens.”
The MONALEESA 7 trial was supported by Novartis. Dr. Tripathy disclosed steering committee consulting fees and institutional funding from the company. Dr. Kaklamani reported serving as a consultant to Novartis. Dr. Vogl reported no conflicts of interest.
SAN ANTONIO – For premenopausal women with advanced hormone receptor–positive, HER2-negative breast cancer, the addition of the CDK4/6 inhibitor ribociclib (Kisqali) to endocrine therapy and goserelin was associated with a near doubling in progression-free survival (PFS), improvement in pain scores and a longer time to deterioration of quality of life (Qol) scores, investigators reported.
The hazard ratio for the ribociclib-based combination was 0.553 (P less than .0001), he reported at the San Antonio Breast Cancer Symposium.
“The treatment benefit was seen across all subgroups, and also regardless of the endocrine partner, either tamoxifen or aromastase inhibitors,” he said.
The combination of ribociclib with goserelin and either tamoxifen or a nonsteroidal AI is a potential new treatment option for premenopausal women with hormone receptor–positive, HER2-negative advanced breast cancer, regardless of the disease-free interval or the endocrine partner, he said in a media briefing and in an oral session.
In the United States, approximately 19% of invasive breast cancers are diagnosed in women aged 49 years or younger, and in the Asia/Pacific region, the proportion of patients aged younger than 50 years with invasive breast cancer may be as high as 42%, Dr. Tripathy said.
The need for new therapeutic approaches in this population is clear, with the last randomized clinical trial focused solely on women with advanced premenopausal breast being published 17 years ago, he pointed out.
Given the efficacy of adding ribociclib to standard AI therapy in postmenopausal women with advanced HR+/HER2- breast cancer as seen in the MONALEESA-2 trial, the MONALEESA-7 investigators looked at the same combination as first-line therapy in premenopausal women with similar disease features.
In the trial, 672 pre- or perimenopausal women with HR+/HER2– advanced breast cancer with no prior endocrine therapy for advanced disease and no more than one line of chemotherapy for advanced disease were enrolled. The patients were stratified by the presence of liver/lung metastases, prior chemotherapy, and prior endocrine partner, tamoxifen or nonsteroidal AI, and then randomly assigned to the ribociclib 600 mg/day for 3 weeks, followed by 1-week off, plus tamoxifen or AI and goserelin, or the same combination and schedule with placebo.
Of the 672 patients enrolled, a total of 335 patients assigned to ribociclib and 337 assigned to placebo received treatment.
Investigator-assessed progression-free survival was the primary endpoint, as noted before. The findings were supported by an analysis of the data by a blinded independent review committee, which determined the median PFS to not have been reached in the ribociclib arm, compared with 11.1 months in the placebo arm, with a hazard ratio of 0.427, and a 95% confidence interval showing statistical significance.
The secondary endpoint of overall response rate (ORR) was also significantly better with ribociclib among the entire patient population (40.9% vs. 29.7%; P = .00098), and in patients with measurable disease (50.9% vs. 36.4%; P = .000317).
An analysis of PFS by endocrine agent (tamoxifen or AI) showed similar hazard ratios with each class of agent combined with ribociclib.
Hematologic adverse events occurred in 75.8% of all patients on ribociclib, compared with 7.7% of those on placebo. In the CDK4/6 inhibitor arm, 50.7% of patients had grade 3 neutropenia, and 9.9% had grade 4. Febrile neutropenia occurred in 2.1% of patients on ribociclib, compared with 0.6% of patients on placebo.
Nonhematologic adverse events were generally similar between the trial arms, with the exception of more frequent nausea with ribociclib.
Ribociclib also was associated with significantly better patient-reported outcomes, including longer time to deterioration of QoL scores, and better improvement in pain scores from baseline.
“For me, I would now be very comfortable giving these women an aromatase inhibitor plus goserelin and riboclicib,” she said in an interview.
SABCS fixture Steven “Vogl, New York” Vogl, MD, a medical oncologist in private practice in New York, commented after Dr. Tripathy’s presentation that, “I think that this is a momentous study, and I think it should immediately change the standard of care for symptomatic young women with metastatic breast cancer. More of them get better, and they stay better longer. These are people who we’re trying to buy some good life for, before the inevitable happens.”
The MONALEESA 7 trial was supported by Novartis. Dr. Tripathy disclosed steering committee consulting fees and institutional funding from the company. Dr. Kaklamani reported serving as a consultant to Novartis. Dr. Vogl reported no conflicts of interest.
REPORTING FROM SABCS 2017
Key clinical point: Adding a CDK4/6 inhibitor to endocrine therapy and ovarian suppression significantly improves progression-free survival of advanced breast cancer in premenopausal and postmenopausal women.
Major finding: Median PFS with ribociclib, an aromatase inhibitor or tamoxifen plus goserelin was 23.8 months, compared with 13 months for women treated with ribociclib placebo.
Data source: Randomized phase 3 trial in 672 pre- or perimenopausal women with HR+/HER2– advanced breast cancer.
Disclosures: The MONALEESA 7 trial was supported by Novartis. Dr. Tripathy disclosed steering committee consulting fees and institutional funding from the company. Dr. Kaklamani reported serving as a consultant to Novartis. Dr. Vogl reported no conflicts of interested.

MedPAC: Ditch meaningful use, patient measures under MIPS
WASHINGTON – Population-level outcomes measures are the key focus of a proposed program to replace the Merit-Based Incentive Payment System (MIPS) track in the Medicare Quality Payment Program.
The proposal, under consideration by the Medicare Payment Advisory Commission, also would forgo patient-level outcomes measures, practice-improvement measures, and all measures of the meaningful use of electronic health records.
The Centers for Medicare & Medicaid Services is estimating that the reporting burden for the MIPS program is $1 billion in 2017 alone, MedPAC staff member Kate Blonairz said at a Dec. 7 MedPAC meeting.
The decision to move to outcomes also would take away any reporting on process measures, leaving physicians with more freedom to choose how they reach the outcomes.
Certain previously discussed provisions remain in the proposal, such as withholding a percentage of Medicare fee-for-service payments for clinicians who are not part of an advanced Alternative Payment Model (APM) practice, and giving them the opportunity to earn the funds back via the new Voluntary Value Program (VVP).
The proposal also would remove certain income and beneficiary thresholds in the APM track to expand eligibility and improve retention.
The proposal, which is slated to be refined a little more before being voted on in a January meeting, continued to receive near consensus support from MedPAC commissioners, but concerns were raised.
In particular, the move to a population-based reporting scheme as the way to track and reward performance creates a scaling problem, noted Commissioner David Nerenz, PhD, of the Henry Ford Health System of Detroit.
Virtual reporting groups would be created, and the physicians would be rewarded or penalized based on the numbers reported by that group. However, to get meaningful differences in the reported populations outcomes, Dr. Nerenz noted that the groups will have to be very large.
For example, to detect a 13% difference in readmission rates, you would need 200 cases for each group, he pointed out.
“If I have 200 cases, I can detect a difference of 13% and 0 or I can detect a difference between 13% and 26%, but I sure as heck can’t detect a difference, say, between 13% and 16%,” Dr. Nerenz said, noting that if he wanted to get the difference between 13% and 16%, he would need approximately 7,000 discharges in each group.
The size of the virtual groups, the kinds of outcomes measures, and other fine details would be left to the Centers for Medicare & Medicaid Services to decide via rule making under the current MedPAC proposal.
Commissioner Alice Coombs, MD, of South Shore Hospital, Weymouth, Mass., continued to voice her objection to even the idea of repealing MIPS, noting that the APM reporting model might not line up with value-based purchasing, and process measures would still be in play for APMs; some process measures are actually good in improving quality of care, she argued.
Rita Redberg, MD, of the University of California, San Francisco, called for speedy action on the proposal.
“The time to get rid of MIPS is now because ... as I listen to people, the only thing people say is, well, they have already started getting ready for MIPS,” Dr. Redberg said. “It is not a good reason to continue a terrible system, but the longer it goes on, the more we will hear that.”
WASHINGTON – Population-level outcomes measures are the key focus of a proposed program to replace the Merit-Based Incentive Payment System (MIPS) track in the Medicare Quality Payment Program.
The proposal, under consideration by the Medicare Payment Advisory Commission, also would forgo patient-level outcomes measures, practice-improvement measures, and all measures of the meaningful use of electronic health records.
The Centers for Medicare & Medicaid Services is estimating that the reporting burden for the MIPS program is $1 billion in 2017 alone, MedPAC staff member Kate Blonairz said at a Dec. 7 MedPAC meeting.
The decision to move to outcomes also would take away any reporting on process measures, leaving physicians with more freedom to choose how they reach the outcomes.
Certain previously discussed provisions remain in the proposal, such as withholding a percentage of Medicare fee-for-service payments for clinicians who are not part of an advanced Alternative Payment Model (APM) practice, and giving them the opportunity to earn the funds back via the new Voluntary Value Program (VVP).
The proposal also would remove certain income and beneficiary thresholds in the APM track to expand eligibility and improve retention.
The proposal, which is slated to be refined a little more before being voted on in a January meeting, continued to receive near consensus support from MedPAC commissioners, but concerns were raised.
In particular, the move to a population-based reporting scheme as the way to track and reward performance creates a scaling problem, noted Commissioner David Nerenz, PhD, of the Henry Ford Health System of Detroit.
Virtual reporting groups would be created, and the physicians would be rewarded or penalized based on the numbers reported by that group. However, to get meaningful differences in the reported populations outcomes, Dr. Nerenz noted that the groups will have to be very large.
For example, to detect a 13% difference in readmission rates, you would need 200 cases for each group, he pointed out.
“If I have 200 cases, I can detect a difference of 13% and 0 or I can detect a difference between 13% and 26%, but I sure as heck can’t detect a difference, say, between 13% and 16%,” Dr. Nerenz said, noting that if he wanted to get the difference between 13% and 16%, he would need approximately 7,000 discharges in each group.
The size of the virtual groups, the kinds of outcomes measures, and other fine details would be left to the Centers for Medicare & Medicaid Services to decide via rule making under the current MedPAC proposal.
Commissioner Alice Coombs, MD, of South Shore Hospital, Weymouth, Mass., continued to voice her objection to even the idea of repealing MIPS, noting that the APM reporting model might not line up with value-based purchasing, and process measures would still be in play for APMs; some process measures are actually good in improving quality of care, she argued.
Rita Redberg, MD, of the University of California, San Francisco, called for speedy action on the proposal.
“The time to get rid of MIPS is now because ... as I listen to people, the only thing people say is, well, they have already started getting ready for MIPS,” Dr. Redberg said. “It is not a good reason to continue a terrible system, but the longer it goes on, the more we will hear that.”
WASHINGTON – Population-level outcomes measures are the key focus of a proposed program to replace the Merit-Based Incentive Payment System (MIPS) track in the Medicare Quality Payment Program.
The proposal, under consideration by the Medicare Payment Advisory Commission, also would forgo patient-level outcomes measures, practice-improvement measures, and all measures of the meaningful use of electronic health records.
The Centers for Medicare & Medicaid Services is estimating that the reporting burden for the MIPS program is $1 billion in 2017 alone, MedPAC staff member Kate Blonairz said at a Dec. 7 MedPAC meeting.
The decision to move to outcomes also would take away any reporting on process measures, leaving physicians with more freedom to choose how they reach the outcomes.
Certain previously discussed provisions remain in the proposal, such as withholding a percentage of Medicare fee-for-service payments for clinicians who are not part of an advanced Alternative Payment Model (APM) practice, and giving them the opportunity to earn the funds back via the new Voluntary Value Program (VVP).
The proposal also would remove certain income and beneficiary thresholds in the APM track to expand eligibility and improve retention.
The proposal, which is slated to be refined a little more before being voted on in a January meeting, continued to receive near consensus support from MedPAC commissioners, but concerns were raised.
In particular, the move to a population-based reporting scheme as the way to track and reward performance creates a scaling problem, noted Commissioner David Nerenz, PhD, of the Henry Ford Health System of Detroit.
Virtual reporting groups would be created, and the physicians would be rewarded or penalized based on the numbers reported by that group. However, to get meaningful differences in the reported populations outcomes, Dr. Nerenz noted that the groups will have to be very large.
For example, to detect a 13% difference in readmission rates, you would need 200 cases for each group, he pointed out.
“If I have 200 cases, I can detect a difference of 13% and 0 or I can detect a difference between 13% and 26%, but I sure as heck can’t detect a difference, say, between 13% and 16%,” Dr. Nerenz said, noting that if he wanted to get the difference between 13% and 16%, he would need approximately 7,000 discharges in each group.
The size of the virtual groups, the kinds of outcomes measures, and other fine details would be left to the Centers for Medicare & Medicaid Services to decide via rule making under the current MedPAC proposal.
Commissioner Alice Coombs, MD, of South Shore Hospital, Weymouth, Mass., continued to voice her objection to even the idea of repealing MIPS, noting that the APM reporting model might not line up with value-based purchasing, and process measures would still be in play for APMs; some process measures are actually good in improving quality of care, she argued.
Rita Redberg, MD, of the University of California, San Francisco, called for speedy action on the proposal.
“The time to get rid of MIPS is now because ... as I listen to people, the only thing people say is, well, they have already started getting ready for MIPS,” Dr. Redberg said. “It is not a good reason to continue a terrible system, but the longer it goes on, the more we will hear that.”
REPORTING FROM A MEDPAC MEETING
Hawaii experiencing a statewide outbreak of mumps
As of Nov. 30, 2017, 636 cases of mumps had been confirmed in Hawaii, according to the state’s Department of Health (DOH).
The Hawaii DOH originally reported 14 confirmed mumps cases statewide in April 2017, but the number of confirmed cases has increased by more than 4,000% since that time.
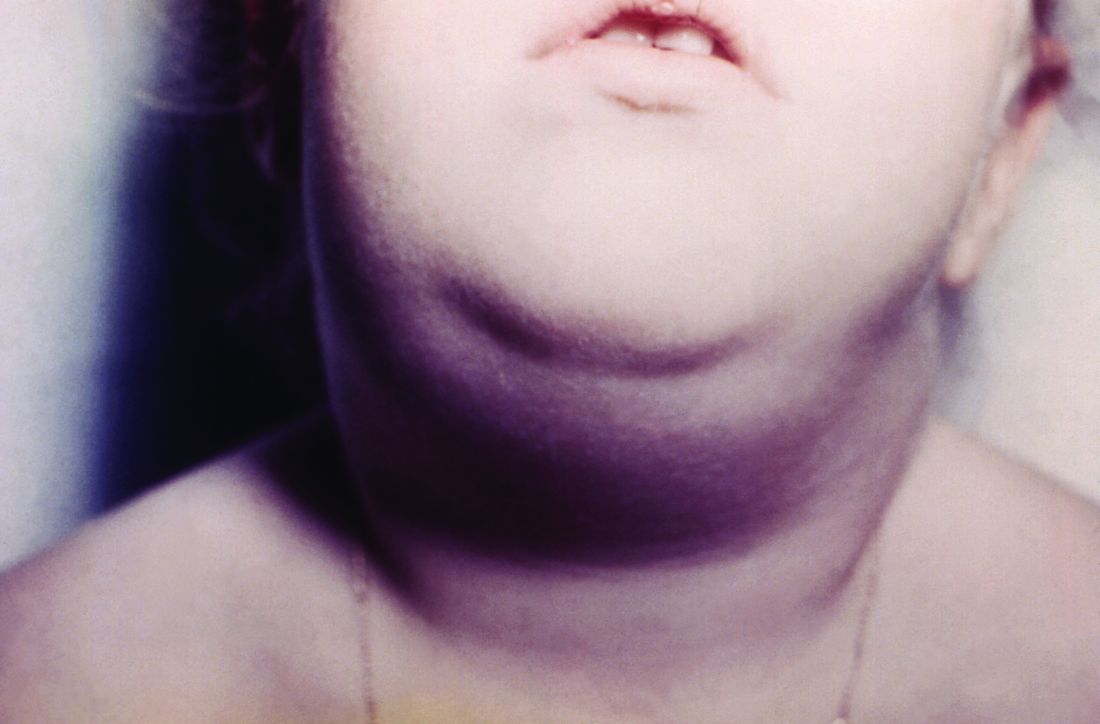
In the midst of the outbreak, the Hawaii DOH recommends that all adolescents between the aged 10-19 years old, and adults born in or after 1957, should receive an additional MMR vaccine dose as soon as possible. The outbreak dose is recommended regardless of previous vaccination or documented immunity to mumps. Administering additional doses of vaccine is not an ideal situation, the DOH noted, but said it should not cause any medical complications.
The Hawaii DOH will investigate mumps cases statewide as the outbreak continues.
As of Nov. 30, 2017, 636 cases of mumps had been confirmed in Hawaii, according to the state’s Department of Health (DOH).
The Hawaii DOH originally reported 14 confirmed mumps cases statewide in April 2017, but the number of confirmed cases has increased by more than 4,000% since that time.
In the midst of the outbreak, the Hawaii DOH recommends that all adolescents between the aged 10-19 years old, and adults born in or after 1957, should receive an additional MMR vaccine dose as soon as possible. The outbreak dose is recommended regardless of previous vaccination or documented immunity to mumps. Administering additional doses of vaccine is not an ideal situation, the DOH noted, but said it should not cause any medical complications.
The Hawaii DOH will investigate mumps cases statewide as the outbreak continues.
As of Nov. 30, 2017, 636 cases of mumps had been confirmed in Hawaii, according to the state’s Department of Health (DOH).
The Hawaii DOH originally reported 14 confirmed mumps cases statewide in April 2017, but the number of confirmed cases has increased by more than 4,000% since that time.
In the midst of the outbreak, the Hawaii DOH recommends that all adolescents between the aged 10-19 years old, and adults born in or after 1957, should receive an additional MMR vaccine dose as soon as possible. The outbreak dose is recommended regardless of previous vaccination or documented immunity to mumps. Administering additional doses of vaccine is not an ideal situation, the DOH noted, but said it should not cause any medical complications.
The Hawaii DOH will investigate mumps cases statewide as the outbreak continues.

The year’s Top 10 in addiction medicine
PARIS – Genetic studies are finally making an impact in addiction medicine, as evidenced by the inclusion of three genomewide association studies in one expert’s list of the year’s top 10 developments in the field.
The three genetic studies that made their way onto this admittedly personal top 10 list of advances in addiction medicine include the surprising results of the first-ever genomewide association study of pathological gambling, a methylomic profiling study implicating a gene that regulates low-density lipoprotein cholesterol in the pathogenesis of alcohol use disorder, and a study that identified a specific microRNA as a regulator of motivation for cocaine, Philip Gorwood, MD, PhD, said at the annual congress of the European College of Neuropsychopharmacology.

“This was an extremely important development, because it means pathologic gambling is a behavioral addiction,” said Dr. Gorwood, also head of the Clinic for Mental Illness and the Brain at Sainte-Anne Central Hospital in Paris. “This makes a difference to research because it means what we observe in the brain is really due to the patient’s behavior, to his or her choice to gamble, and not because they’re taking alcohol or cocaine or nicotine.”
His list of the year’s top 10 studies in addiction medicine follows:
Deep TMS in AUD
There is a general sense within the field of addiction medicine that transcranial magnetic stimulation (TMS) might have efficacy in some addictive disorders, but it has been hard to make a convincing case for the therapy when the mechanism is unknown.
Italian investigators have brought clarity in a study published in European Psychopharmacology (2017 May;27[5]:450-61) in which they randomized 11 patients with alcohol use disorder (AUD) to 4 weeks of real or sham deep TMS sessions, coupled with baseline and follow-up single-photon emission computed tomography (SPECT) imaging of dopamine transporter availability in the striatum of the dorsolateral prefrontal cortex. After 4 weeks, the group receiving real TMS showed a clinically important reduction in alcohol intake accompanied by a significant decrease in their elevated strial dopamine transporter availability, while sham-treated controls were unchanged. “This was a small study, but I loved the way the investigators merged a pilot clinical study with a biologic mechanism study,” Dr. Gorwood commented.
Coffee drinking and mortality
Investigators for a prospective cohort study of 521,330 people enrolled in the 10-country European Prospective Investigation into Cancer and Nutrition concluded that, during a mean 16.4 years of follow-up, participants in the top quartile of coffee consumption had a significantly lower risk of all-cause mortality, compared with those who did not drink coffee: a 12% reduction in men and a 7% reduction in women.
Moreover, the risk of mortality tied to digestive disease was reduced by 59% in high– versus non–coffee-consuming men and by 40% in women in this report from the International Agency for Research on Cancer, in Lyon, France . High–coffee-consuming women, but not men, also had a significant 22% reduction in circulatory disease mortality and a 30% lower risk of cerebrovascular disease mortality, compared with those who did not drink coffee.
Of particular interest to psychiatrists, the investigators also examined suicide risk. In a multivariate analysis, men in the third and fourth quartiles of coffee consumption were at 36% and 29% lower risk of death by suicide than those who did not drink coffee. Suicide in women occurred less frequently and was not related to coffee intake.
These various associations did not vary by country, even though coffee preparation methods vary considerably across Europe. And when the investigators excluded participants who died within 8 years of baseline, the results were unchanged, a finding that makes bias tied to reverse causality less likely as explanation for the results, the findings published in the Annals of Internal Medicine (2017 Aug 15;167[4]:236-47) showed.
“As addiction specialists, our patients often complain that we are forbidding everything. We are the bad guys: Don’t drink too much, don’t eat too much, and so on. The key finding in this European study is that you will not die of coffee drinking, even if you are having 8 cups a day. Yes, we know that coffee has a psychotropic effect, we know that you have a tendency to repeat its consumption, but it is really quite readily distinguishable from other addictive substances,” the psychiatrist said.
Smoking and violence
A few years ago when smoke-free policies were proposed in psychiatric inpatient settings, there was an uproar from staff.
“That was a huge mess,” Dr. Gorwood recalled. “The staff said, ‘Whoa, if you do that, I’m going to be killed by my patients. They are extremely addicted to cigarettes, and if they stop smoking tobacco during their hospitalization – when they already have very high anxiety – we are going to have an increase in violence.’ ”
Not so, as convincingly shown by investigators at King’s College London. They analyzed incident reports of physical assault 30 months before and 12 months after implementation of a no-smoking policy on the inpatient wards of a large London mental health organization. They scrutinized the 4,550 physical assaults that took place during the study period, 4.9% of which were smoking related and found that the number of physical assaults per month fell by 39% after the smoking policy change, according to the study, which was published in the Lancet Psychiatry (2017 Jul;4[7]:540-6).
When an audience member said this reduction in ward violence struck him as counterintuitive and asked for an explanation, Dr. Gorwood noted that the London study wasn’t designed to address the mechanism of benefit. However, he speculated that a reasonable hypothesis prevalent among addiction specialists: Once an addict is no longer being triggered by an addictive substance, he or she will feel better.
“This is why we ask patients with any kind of dependence to stop doing it. They will feel better in terms of mood, well being, and optimistically in terms of violence,” Dr. Gordon said.
Skyrocketing alcohol misuse
The National Epidemiologic Survey on Alcohol and Related Conditions, conducted every 5-6 years by the U.S. National Institute on Alcohol Abuse and Alcoholism, enjoys great respect among addiction medicine specialists worldwide because it surveys tens of thousands of individuals and consistently employs the same methodology and definitions each time. This provides a degree of confidence regarding big-picture trends that’s not often found in European studies. The latest report from the survey is deeply concerning, according to Dr. Gorwood.
Investigators charted changing trends in 12-month rates of alcohol use, high-risk drinking, and AUD between the 2001-2002 survey, which included 43,093 subjects, and the 2012-2013 version, which included 36,309. The rate of alcohol use during the past 12 months increased by 11.2% across this 11-year time span, from 65.4% to 72.7%. Far more troubling: The rate of high-risk drinking climbed by 29.9%, from 9.7% to 12.6%; and the proportion of individuals meeting DSM-IV criteria for AUD jumped by roughly 50%, from 8.5% in 2001-2002 to 12.7% in 2012-2013.
Disproportionate increases in AUD were documented in women, with an 84% jump between the two survey periods; African Americans, with a 93% increase; Asian or Pacific Islanders, 78%; middle-aged individuals ages 45-65, with an 82% increase; and Americans aged 65 or older, with a whopping 107% increase.
These data “constitute a public health crisis,” according to the investigators. “Taken together, these findings portend increases in many chronic comorbidities in which alcohol use has a substantial role,” they added in the article, published in JAMA Psychiatry (2017 Sep 1;74[9]:911-23).
This unwelcome trend is surely not unique to the United States, in Dr. Gorwood’s view. “We need to figure out why we have such a big increase and what we should be doing about it,” he said.
Smoking cessation in pregnancy
A large Finnish prospective study in which virtually all births in the country’s two northernmost provinces in 1986 have been followed from pregnancy onward provides an optimistic new message regarding prevention of teenage smoking.
The adolescent offspring of Finnish women who quit smoking before becoming pregnant and continued to shun smoking as their child achieved age 15-16 years had the same low rate of daily smoking as those whose mothers never smoked: 10%. If the moms quit smoking during their first trimester, the rate of daily smoking by their teenage offspring at age 15-16 years was higher – 16% – but nonetheless lower than if she continued smoking beyond the first trimester – 25% – even if neither she nor the father smoked during their offspring’s teen years. If the mother continued to smoke after the first trimester and either she or the father smoked as their child grew up, the rate of daily smoking at age 15-16 years climbed to 37%; if both parents smoked, it was 41%, according to results of the study published in the journal Addiction (2017 Jan;112[1]:134-43).
“A take-home message: If you are a smoker and you quit before pregnancy, you abolish the increased risk, just as if you’d never been smoking in your life. It’s definitely good news,” Dr. Gorwood said.
ADHD medication and SUDs
All physicians who treat patients with attention-deficit/hyperactivity disorder get an earful from parents and patients who fear that the drugs will lead to addiction to stimulants. Reassuring evidence that this isn’t the case comes from a massive study of nearly 3 million adolescent and adult ADHD patients, median age 21, in a U.S. commercial health care claims database. The study endpoint was visits to emergency departments related to substance use disorders during 16 months of follow-up.
In within-individual comparisons, male patients had an adjusted 35% reduction in the likelihood of trips to the ED for substance use events during the months they received stimulant medications or atomoxetine, compared with the months they were off ADHD medication. Females had a 31% reduction during their on-treatment months (Am J Psychiatry. 2017 Sep 1;174[9]:877-85).
“That’s the kind of information I like to share with my patients,” Dr. Gorwood commented. “It’s very easy to understand, and it gives them objective information that – although they may find surprising – treatment protects against addiction rather than leading to addiction.”
Divorce and new AUD
A Swedish national registry study of 942,366 married people born in 1960-1990, none with a history of AUD when they tied the knot, documented that divorce predicted a six- to sevenfold increase in new-onset AUD, compared with that of individuals who stayed married. Remarriage cut that risk by 50%-60% relative to those who did not remarry.
The relationship between marriage, divorce, and AUD was more complex than that, however. The level of drinking actually started to increase several years before divorce.
“A lot of patients will say, ‘Doctor, I’m drinking so much now because I’ve lost my wife, my life is miserable, and the only thing I have now is alcohol to make things feel better.’ But we could propose a different statement: ‘Maybe you got divorced because you drank too much alcohol.’ We wouldn’t say that to patients, of course, but we could help them to recognize their own paradoxical approach,” Dr. Gorwood said.
Widowhood was associated with a roughly fourfold increased risk of new-onset AUD, according to an article in the American Journal of Psychiatry (2017 May 1;174[5]:451-8).
Study of pathological gambling
A German multicenter team set out to identify genetic pathways involved in pathological gambling. They found a strong association with alcohol dependence, providing novel evidence of genetic overlap between a substance- and non–substance-related addiction. Unexpectedly, they also identified a shared genetic pathway between pathological gambling and Huntington’s disease that will provide a rich new avenue of research. Their results were published in the journal European Psychiatry (2016 Aug;36:38-46).
Gene implicated in alcohol use disorder
For several years, cardiologists have been agog over the unprecedented LDL cholesterol–lowering ability of a novel class of medications that inhibit the protein produced by the PCSK9 (proprotein convertase subtilisin/kexin 9) gene, which slows removal of LDL from the circulation. Ongoing studies of the PCSK9 inhibitors evolocumab and alirocumab are widely expected to report reductions in cardiovascular event rates far beyond what is achievable with statins.
Now investigators at the U.S. National Institute on Alcohol Abuse and Alcoholism have conducted a genomewide methylomic variation study that showed PCSK9 expression in the liver is dysregulated in patients with alcohol use disorder. They coupled this finding with a translational study in a mouse model of alcohol use disorder in which they demonstrated that alcohol exposure leads to PCSK9 downregulation, with resultant lowering of LDL.
Taken together, the results, published in Molecular Psychiatry (2017 Aug 29. doi: 10.1038/mp.2017.168), suggest that epigenetic regulation of PCSK9 by alcohol is a dynamic process in which exposure to small amounts of alcohol leads to less PCSK9 gene expression, less methylation, and lower LDL, while chronic heavy use leads to greater gene expression, unfavorable lipid levels, and eventually to low PCSK9 protein levels as a result of hepatotoxicity.
MicroRNA-495 and cocaine
Using genomewide sequencing techniques, investigators zeroed in on a specific microRNA known as miR-495 as an important posttranscriptional regulator of the expression of genes included in KARG, the Knowledgebase for Addiction Related Genes database. This small RNA is highly expressed in the nucleus accumbens, a key area of the brain involved in motivation and reward.
In rodent studies, the researchers showed that administration of cocaine rapidly downregulated miR-495 expression in the nucleus accumbens with an accompanying increase in expression of addiction-related genes known to be involved in specific substance use disorder–related biologic pathways. Moreover, when the investigators induced miR-495 overexpression in the nucleus accumbens, the animals lost motivation to seek and self-administer cocaine without having any effect on food-seeking, suggesting miR-495 selectively affects addiction-related behaviors, according to results of a study published in Molecular Psychiatry (2017 Jan 3. doi: 10.1038/mp.2016.238).
“I found this really convincing. There is converging evidence that we’re going to hear a lot more about miR-495 later on,” Dr. Gorwood said.
He reported having no financial conflicts of interest regarding his presentation.
PARIS – Genetic studies are finally making an impact in addiction medicine, as evidenced by the inclusion of three genomewide association studies in one expert’s list of the year’s top 10 developments in the field.
The three genetic studies that made their way onto this admittedly personal top 10 list of advances in addiction medicine include the surprising results of the first-ever genomewide association study of pathological gambling, a methylomic profiling study implicating a gene that regulates low-density lipoprotein cholesterol in the pathogenesis of alcohol use disorder, and a study that identified a specific microRNA as a regulator of motivation for cocaine, Philip Gorwood, MD, PhD, said at the annual congress of the European College of Neuropsychopharmacology.
“This was an extremely important development, because it means pathologic gambling is a behavioral addiction,” said Dr. Gorwood, also head of the Clinic for Mental Illness and the Brain at Sainte-Anne Central Hospital in Paris. “This makes a difference to research because it means what we observe in the brain is really due to the patient’s behavior, to his or her choice to gamble, and not because they’re taking alcohol or cocaine or nicotine.”
His list of the year’s top 10 studies in addiction medicine follows:
Deep TMS in AUD
There is a general sense within the field of addiction medicine that transcranial magnetic stimulation (TMS) might have efficacy in some addictive disorders, but it has been hard to make a convincing case for the therapy when the mechanism is unknown.
Italian investigators have brought clarity in a study published in European Psychopharmacology (2017 May;27[5]:450-61) in which they randomized 11 patients with alcohol use disorder (AUD) to 4 weeks of real or sham deep TMS sessions, coupled with baseline and follow-up single-photon emission computed tomography (SPECT) imaging of dopamine transporter availability in the striatum of the dorsolateral prefrontal cortex. After 4 weeks, the group receiving real TMS showed a clinically important reduction in alcohol intake accompanied by a significant decrease in their elevated strial dopamine transporter availability, while sham-treated controls were unchanged. “This was a small study, but I loved the way the investigators merged a pilot clinical study with a biologic mechanism study,” Dr. Gorwood commented.
Coffee drinking and mortality
Investigators for a prospective cohort study of 521,330 people enrolled in the 10-country European Prospective Investigation into Cancer and Nutrition concluded that, during a mean 16.4 years of follow-up, participants in the top quartile of coffee consumption had a significantly lower risk of all-cause mortality, compared with those who did not drink coffee: a 12% reduction in men and a 7% reduction in women.
Moreover, the risk of mortality tied to digestive disease was reduced by 59% in high– versus non–coffee-consuming men and by 40% in women in this report from the International Agency for Research on Cancer, in Lyon, France . High–coffee-consuming women, but not men, also had a significant 22% reduction in circulatory disease mortality and a 30% lower risk of cerebrovascular disease mortality, compared with those who did not drink coffee.
Of particular interest to psychiatrists, the investigators also examined suicide risk. In a multivariate analysis, men in the third and fourth quartiles of coffee consumption were at 36% and 29% lower risk of death by suicide than those who did not drink coffee. Suicide in women occurred less frequently and was not related to coffee intake.
These various associations did not vary by country, even though coffee preparation methods vary considerably across Europe. And when the investigators excluded participants who died within 8 years of baseline, the results were unchanged, a finding that makes bias tied to reverse causality less likely as explanation for the results, the findings published in the Annals of Internal Medicine (2017 Aug 15;167[4]:236-47) showed.
“As addiction specialists, our patients often complain that we are forbidding everything. We are the bad guys: Don’t drink too much, don’t eat too much, and so on. The key finding in this European study is that you will not die of coffee drinking, even if you are having 8 cups a day. Yes, we know that coffee has a psychotropic effect, we know that you have a tendency to repeat its consumption, but it is really quite readily distinguishable from other addictive substances,” the psychiatrist said.
Smoking and violence
A few years ago when smoke-free policies were proposed in psychiatric inpatient settings, there was an uproar from staff.
“That was a huge mess,” Dr. Gorwood recalled. “The staff said, ‘Whoa, if you do that, I’m going to be killed by my patients. They are extremely addicted to cigarettes, and if they stop smoking tobacco during their hospitalization – when they already have very high anxiety – we are going to have an increase in violence.’ ”
Not so, as convincingly shown by investigators at King’s College London. They analyzed incident reports of physical assault 30 months before and 12 months after implementation of a no-smoking policy on the inpatient wards of a large London mental health organization. They scrutinized the 4,550 physical assaults that took place during the study period, 4.9% of which were smoking related and found that the number of physical assaults per month fell by 39% after the smoking policy change, according to the study, which was published in the Lancet Psychiatry (2017 Jul;4[7]:540-6).
When an audience member said this reduction in ward violence struck him as counterintuitive and asked for an explanation, Dr. Gorwood noted that the London study wasn’t designed to address the mechanism of benefit. However, he speculated that a reasonable hypothesis prevalent among addiction specialists: Once an addict is no longer being triggered by an addictive substance, he or she will feel better.
“This is why we ask patients with any kind of dependence to stop doing it. They will feel better in terms of mood, well being, and optimistically in terms of violence,” Dr. Gordon said.
Skyrocketing alcohol misuse
The National Epidemiologic Survey on Alcohol and Related Conditions, conducted every 5-6 years by the U.S. National Institute on Alcohol Abuse and Alcoholism, enjoys great respect among addiction medicine specialists worldwide because it surveys tens of thousands of individuals and consistently employs the same methodology and definitions each time. This provides a degree of confidence regarding big-picture trends that’s not often found in European studies. The latest report from the survey is deeply concerning, according to Dr. Gorwood.
Investigators charted changing trends in 12-month rates of alcohol use, high-risk drinking, and AUD between the 2001-2002 survey, which included 43,093 subjects, and the 2012-2013 version, which included 36,309. The rate of alcohol use during the past 12 months increased by 11.2% across this 11-year time span, from 65.4% to 72.7%. Far more troubling: The rate of high-risk drinking climbed by 29.9%, from 9.7% to 12.6%; and the proportion of individuals meeting DSM-IV criteria for AUD jumped by roughly 50%, from 8.5% in 2001-2002 to 12.7% in 2012-2013.
Disproportionate increases in AUD were documented in women, with an 84% jump between the two survey periods; African Americans, with a 93% increase; Asian or Pacific Islanders, 78%; middle-aged individuals ages 45-65, with an 82% increase; and Americans aged 65 or older, with a whopping 107% increase.
These data “constitute a public health crisis,” according to the investigators. “Taken together, these findings portend increases in many chronic comorbidities in which alcohol use has a substantial role,” they added in the article, published in JAMA Psychiatry (2017 Sep 1;74[9]:911-23).
This unwelcome trend is surely not unique to the United States, in Dr. Gorwood’s view. “We need to figure out why we have such a big increase and what we should be doing about it,” he said.
Smoking cessation in pregnancy
A large Finnish prospective study in which virtually all births in the country’s two northernmost provinces in 1986 have been followed from pregnancy onward provides an optimistic new message regarding prevention of teenage smoking.
The adolescent offspring of Finnish women who quit smoking before becoming pregnant and continued to shun smoking as their child achieved age 15-16 years had the same low rate of daily smoking as those whose mothers never smoked: 10%. If the moms quit smoking during their first trimester, the rate of daily smoking by their teenage offspring at age 15-16 years was higher – 16% – but nonetheless lower than if she continued smoking beyond the first trimester – 25% – even if neither she nor the father smoked during their offspring’s teen years. If the mother continued to smoke after the first trimester and either she or the father smoked as their child grew up, the rate of daily smoking at age 15-16 years climbed to 37%; if both parents smoked, it was 41%, according to results of the study published in the journal Addiction (2017 Jan;112[1]:134-43).
“A take-home message: If you are a smoker and you quit before pregnancy, you abolish the increased risk, just as if you’d never been smoking in your life. It’s definitely good news,” Dr. Gorwood said.
ADHD medication and SUDs
All physicians who treat patients with attention-deficit/hyperactivity disorder get an earful from parents and patients who fear that the drugs will lead to addiction to stimulants. Reassuring evidence that this isn’t the case comes from a massive study of nearly 3 million adolescent and adult ADHD patients, median age 21, in a U.S. commercial health care claims database. The study endpoint was visits to emergency departments related to substance use disorders during 16 months of follow-up.
In within-individual comparisons, male patients had an adjusted 35% reduction in the likelihood of trips to the ED for substance use events during the months they received stimulant medications or atomoxetine, compared with the months they were off ADHD medication. Females had a 31% reduction during their on-treatment months (Am J Psychiatry. 2017 Sep 1;174[9]:877-85).
“That’s the kind of information I like to share with my patients,” Dr. Gorwood commented. “It’s very easy to understand, and it gives them objective information that – although they may find surprising – treatment protects against addiction rather than leading to addiction.”
Divorce and new AUD
A Swedish national registry study of 942,366 married people born in 1960-1990, none with a history of AUD when they tied the knot, documented that divorce predicted a six- to sevenfold increase in new-onset AUD, compared with that of individuals who stayed married. Remarriage cut that risk by 50%-60% relative to those who did not remarry.
The relationship between marriage, divorce, and AUD was more complex than that, however. The level of drinking actually started to increase several years before divorce.
“A lot of patients will say, ‘Doctor, I’m drinking so much now because I’ve lost my wife, my life is miserable, and the only thing I have now is alcohol to make things feel better.’ But we could propose a different statement: ‘Maybe you got divorced because you drank too much alcohol.’ We wouldn’t say that to patients, of course, but we could help them to recognize their own paradoxical approach,” Dr. Gorwood said.
Widowhood was associated with a roughly fourfold increased risk of new-onset AUD, according to an article in the American Journal of Psychiatry (2017 May 1;174[5]:451-8).
Study of pathological gambling
A German multicenter team set out to identify genetic pathways involved in pathological gambling. They found a strong association with alcohol dependence, providing novel evidence of genetic overlap between a substance- and non–substance-related addiction. Unexpectedly, they also identified a shared genetic pathway between pathological gambling and Huntington’s disease that will provide a rich new avenue of research. Their results were published in the journal European Psychiatry (2016 Aug;36:38-46).
Gene implicated in alcohol use disorder
For several years, cardiologists have been agog over the unprecedented LDL cholesterol–lowering ability of a novel class of medications that inhibit the protein produced by the PCSK9 (proprotein convertase subtilisin/kexin 9) gene, which slows removal of LDL from the circulation. Ongoing studies of the PCSK9 inhibitors evolocumab and alirocumab are widely expected to report reductions in cardiovascular event rates far beyond what is achievable with statins.
Now investigators at the U.S. National Institute on Alcohol Abuse and Alcoholism have conducted a genomewide methylomic variation study that showed PCSK9 expression in the liver is dysregulated in patients with alcohol use disorder. They coupled this finding with a translational study in a mouse model of alcohol use disorder in which they demonstrated that alcohol exposure leads to PCSK9 downregulation, with resultant lowering of LDL.
Taken together, the results, published in Molecular Psychiatry (2017 Aug 29. doi: 10.1038/mp.2017.168), suggest that epigenetic regulation of PCSK9 by alcohol is a dynamic process in which exposure to small amounts of alcohol leads to less PCSK9 gene expression, less methylation, and lower LDL, while chronic heavy use leads to greater gene expression, unfavorable lipid levels, and eventually to low PCSK9 protein levels as a result of hepatotoxicity.
MicroRNA-495 and cocaine
Using genomewide sequencing techniques, investigators zeroed in on a specific microRNA known as miR-495 as an important posttranscriptional regulator of the expression of genes included in KARG, the Knowledgebase for Addiction Related Genes database. This small RNA is highly expressed in the nucleus accumbens, a key area of the brain involved in motivation and reward.
In rodent studies, the researchers showed that administration of cocaine rapidly downregulated miR-495 expression in the nucleus accumbens with an accompanying increase in expression of addiction-related genes known to be involved in specific substance use disorder–related biologic pathways. Moreover, when the investigators induced miR-495 overexpression in the nucleus accumbens, the animals lost motivation to seek and self-administer cocaine without having any effect on food-seeking, suggesting miR-495 selectively affects addiction-related behaviors, according to results of a study published in Molecular Psychiatry (2017 Jan 3. doi: 10.1038/mp.2016.238).
“I found this really convincing. There is converging evidence that we’re going to hear a lot more about miR-495 later on,” Dr. Gorwood said.
He reported having no financial conflicts of interest regarding his presentation.
PARIS – Genetic studies are finally making an impact in addiction medicine, as evidenced by the inclusion of three genomewide association studies in one expert’s list of the year’s top 10 developments in the field.
The three genetic studies that made their way onto this admittedly personal top 10 list of advances in addiction medicine include the surprising results of the first-ever genomewide association study of pathological gambling, a methylomic profiling study implicating a gene that regulates low-density lipoprotein cholesterol in the pathogenesis of alcohol use disorder, and a study that identified a specific microRNA as a regulator of motivation for cocaine, Philip Gorwood, MD, PhD, said at the annual congress of the European College of Neuropsychopharmacology.
“This was an extremely important development, because it means pathologic gambling is a behavioral addiction,” said Dr. Gorwood, also head of the Clinic for Mental Illness and the Brain at Sainte-Anne Central Hospital in Paris. “This makes a difference to research because it means what we observe in the brain is really due to the patient’s behavior, to his or her choice to gamble, and not because they’re taking alcohol or cocaine or nicotine.”
His list of the year’s top 10 studies in addiction medicine follows:
Deep TMS in AUD
There is a general sense within the field of addiction medicine that transcranial magnetic stimulation (TMS) might have efficacy in some addictive disorders, but it has been hard to make a convincing case for the therapy when the mechanism is unknown.
Italian investigators have brought clarity in a study published in European Psychopharmacology (2017 May;27[5]:450-61) in which they randomized 11 patients with alcohol use disorder (AUD) to 4 weeks of real or sham deep TMS sessions, coupled with baseline and follow-up single-photon emission computed tomography (SPECT) imaging of dopamine transporter availability in the striatum of the dorsolateral prefrontal cortex. After 4 weeks, the group receiving real TMS showed a clinically important reduction in alcohol intake accompanied by a significant decrease in their elevated strial dopamine transporter availability, while sham-treated controls were unchanged. “This was a small study, but I loved the way the investigators merged a pilot clinical study with a biologic mechanism study,” Dr. Gorwood commented.
Coffee drinking and mortality
Investigators for a prospective cohort study of 521,330 people enrolled in the 10-country European Prospective Investigation into Cancer and Nutrition concluded that, during a mean 16.4 years of follow-up, participants in the top quartile of coffee consumption had a significantly lower risk of all-cause mortality, compared with those who did not drink coffee: a 12% reduction in men and a 7% reduction in women.
Moreover, the risk of mortality tied to digestive disease was reduced by 59% in high– versus non–coffee-consuming men and by 40% in women in this report from the International Agency for Research on Cancer, in Lyon, France . High–coffee-consuming women, but not men, also had a significant 22% reduction in circulatory disease mortality and a 30% lower risk of cerebrovascular disease mortality, compared with those who did not drink coffee.
Of particular interest to psychiatrists, the investigators also examined suicide risk. In a multivariate analysis, men in the third and fourth quartiles of coffee consumption were at 36% and 29% lower risk of death by suicide than those who did not drink coffee. Suicide in women occurred less frequently and was not related to coffee intake.
These various associations did not vary by country, even though coffee preparation methods vary considerably across Europe. And when the investigators excluded participants who died within 8 years of baseline, the results were unchanged, a finding that makes bias tied to reverse causality less likely as explanation for the results, the findings published in the Annals of Internal Medicine (2017 Aug 15;167[4]:236-47) showed.
“As addiction specialists, our patients often complain that we are forbidding everything. We are the bad guys: Don’t drink too much, don’t eat too much, and so on. The key finding in this European study is that you will not die of coffee drinking, even if you are having 8 cups a day. Yes, we know that coffee has a psychotropic effect, we know that you have a tendency to repeat its consumption, but it is really quite readily distinguishable from other addictive substances,” the psychiatrist said.
Smoking and violence
A few years ago when smoke-free policies were proposed in psychiatric inpatient settings, there was an uproar from staff.
“That was a huge mess,” Dr. Gorwood recalled. “The staff said, ‘Whoa, if you do that, I’m going to be killed by my patients. They are extremely addicted to cigarettes, and if they stop smoking tobacco during their hospitalization – when they already have very high anxiety – we are going to have an increase in violence.’ ”
Not so, as convincingly shown by investigators at King’s College London. They analyzed incident reports of physical assault 30 months before and 12 months after implementation of a no-smoking policy on the inpatient wards of a large London mental health organization. They scrutinized the 4,550 physical assaults that took place during the study period, 4.9% of which were smoking related and found that the number of physical assaults per month fell by 39% after the smoking policy change, according to the study, which was published in the Lancet Psychiatry (2017 Jul;4[7]:540-6).
When an audience member said this reduction in ward violence struck him as counterintuitive and asked for an explanation, Dr. Gorwood noted that the London study wasn’t designed to address the mechanism of benefit. However, he speculated that a reasonable hypothesis prevalent among addiction specialists: Once an addict is no longer being triggered by an addictive substance, he or she will feel better.
“This is why we ask patients with any kind of dependence to stop doing it. They will feel better in terms of mood, well being, and optimistically in terms of violence,” Dr. Gordon said.
Skyrocketing alcohol misuse
The National Epidemiologic Survey on Alcohol and Related Conditions, conducted every 5-6 years by the U.S. National Institute on Alcohol Abuse and Alcoholism, enjoys great respect among addiction medicine specialists worldwide because it surveys tens of thousands of individuals and consistently employs the same methodology and definitions each time. This provides a degree of confidence regarding big-picture trends that’s not often found in European studies. The latest report from the survey is deeply concerning, according to Dr. Gorwood.
Investigators charted changing trends in 12-month rates of alcohol use, high-risk drinking, and AUD between the 2001-2002 survey, which included 43,093 subjects, and the 2012-2013 version, which included 36,309. The rate of alcohol use during the past 12 months increased by 11.2% across this 11-year time span, from 65.4% to 72.7%. Far more troubling: The rate of high-risk drinking climbed by 29.9%, from 9.7% to 12.6%; and the proportion of individuals meeting DSM-IV criteria for AUD jumped by roughly 50%, from 8.5% in 2001-2002 to 12.7% in 2012-2013.
Disproportionate increases in AUD were documented in women, with an 84% jump between the two survey periods; African Americans, with a 93% increase; Asian or Pacific Islanders, 78%; middle-aged individuals ages 45-65, with an 82% increase; and Americans aged 65 or older, with a whopping 107% increase.
These data “constitute a public health crisis,” according to the investigators. “Taken together, these findings portend increases in many chronic comorbidities in which alcohol use has a substantial role,” they added in the article, published in JAMA Psychiatry (2017 Sep 1;74[9]:911-23).
This unwelcome trend is surely not unique to the United States, in Dr. Gorwood’s view. “We need to figure out why we have such a big increase and what we should be doing about it,” he said.
Smoking cessation in pregnancy
A large Finnish prospective study in which virtually all births in the country’s two northernmost provinces in 1986 have been followed from pregnancy onward provides an optimistic new message regarding prevention of teenage smoking.
The adolescent offspring of Finnish women who quit smoking before becoming pregnant and continued to shun smoking as their child achieved age 15-16 years had the same low rate of daily smoking as those whose mothers never smoked: 10%. If the moms quit smoking during their first trimester, the rate of daily smoking by their teenage offspring at age 15-16 years was higher – 16% – but nonetheless lower than if she continued smoking beyond the first trimester – 25% – even if neither she nor the father smoked during their offspring’s teen years. If the mother continued to smoke after the first trimester and either she or the father smoked as their child grew up, the rate of daily smoking at age 15-16 years climbed to 37%; if both parents smoked, it was 41%, according to results of the study published in the journal Addiction (2017 Jan;112[1]:134-43).
“A take-home message: If you are a smoker and you quit before pregnancy, you abolish the increased risk, just as if you’d never been smoking in your life. It’s definitely good news,” Dr. Gorwood said.
ADHD medication and SUDs
All physicians who treat patients with attention-deficit/hyperactivity disorder get an earful from parents and patients who fear that the drugs will lead to addiction to stimulants. Reassuring evidence that this isn’t the case comes from a massive study of nearly 3 million adolescent and adult ADHD patients, median age 21, in a U.S. commercial health care claims database. The study endpoint was visits to emergency departments related to substance use disorders during 16 months of follow-up.
In within-individual comparisons, male patients had an adjusted 35% reduction in the likelihood of trips to the ED for substance use events during the months they received stimulant medications or atomoxetine, compared with the months they were off ADHD medication. Females had a 31% reduction during their on-treatment months (Am J Psychiatry. 2017 Sep 1;174[9]:877-85).
“That’s the kind of information I like to share with my patients,” Dr. Gorwood commented. “It’s very easy to understand, and it gives them objective information that – although they may find surprising – treatment protects against addiction rather than leading to addiction.”
Divorce and new AUD
A Swedish national registry study of 942,366 married people born in 1960-1990, none with a history of AUD when they tied the knot, documented that divorce predicted a six- to sevenfold increase in new-onset AUD, compared with that of individuals who stayed married. Remarriage cut that risk by 50%-60% relative to those who did not remarry.
The relationship between marriage, divorce, and AUD was more complex than that, however. The level of drinking actually started to increase several years before divorce.
“A lot of patients will say, ‘Doctor, I’m drinking so much now because I’ve lost my wife, my life is miserable, and the only thing I have now is alcohol to make things feel better.’ But we could propose a different statement: ‘Maybe you got divorced because you drank too much alcohol.’ We wouldn’t say that to patients, of course, but we could help them to recognize their own paradoxical approach,” Dr. Gorwood said.
Widowhood was associated with a roughly fourfold increased risk of new-onset AUD, according to an article in the American Journal of Psychiatry (2017 May 1;174[5]:451-8).
Study of pathological gambling
A German multicenter team set out to identify genetic pathways involved in pathological gambling. They found a strong association with alcohol dependence, providing novel evidence of genetic overlap between a substance- and non–substance-related addiction. Unexpectedly, they also identified a shared genetic pathway between pathological gambling and Huntington’s disease that will provide a rich new avenue of research. Their results were published in the journal European Psychiatry (2016 Aug;36:38-46).
Gene implicated in alcohol use disorder
For several years, cardiologists have been agog over the unprecedented LDL cholesterol–lowering ability of a novel class of medications that inhibit the protein produced by the PCSK9 (proprotein convertase subtilisin/kexin 9) gene, which slows removal of LDL from the circulation. Ongoing studies of the PCSK9 inhibitors evolocumab and alirocumab are widely expected to report reductions in cardiovascular event rates far beyond what is achievable with statins.
Now investigators at the U.S. National Institute on Alcohol Abuse and Alcoholism have conducted a genomewide methylomic variation study that showed PCSK9 expression in the liver is dysregulated in patients with alcohol use disorder. They coupled this finding with a translational study in a mouse model of alcohol use disorder in which they demonstrated that alcohol exposure leads to PCSK9 downregulation, with resultant lowering of LDL.
Taken together, the results, published in Molecular Psychiatry (2017 Aug 29. doi: 10.1038/mp.2017.168), suggest that epigenetic regulation of PCSK9 by alcohol is a dynamic process in which exposure to small amounts of alcohol leads to less PCSK9 gene expression, less methylation, and lower LDL, while chronic heavy use leads to greater gene expression, unfavorable lipid levels, and eventually to low PCSK9 protein levels as a result of hepatotoxicity.
MicroRNA-495 and cocaine
Using genomewide sequencing techniques, investigators zeroed in on a specific microRNA known as miR-495 as an important posttranscriptional regulator of the expression of genes included in KARG, the Knowledgebase for Addiction Related Genes database. This small RNA is highly expressed in the nucleus accumbens, a key area of the brain involved in motivation and reward.
In rodent studies, the researchers showed that administration of cocaine rapidly downregulated miR-495 expression in the nucleus accumbens with an accompanying increase in expression of addiction-related genes known to be involved in specific substance use disorder–related biologic pathways. Moreover, when the investigators induced miR-495 overexpression in the nucleus accumbens, the animals lost motivation to seek and self-administer cocaine without having any effect on food-seeking, suggesting miR-495 selectively affects addiction-related behaviors, according to results of a study published in Molecular Psychiatry (2017 Jan 3. doi: 10.1038/mp.2016.238).
“I found this really convincing. There is converging evidence that we’re going to hear a lot more about miR-495 later on,” Dr. Gorwood said.
He reported having no financial conflicts of interest regarding his presentation.
EXPERT ANALYSIS FROM THE ECNP CONGRESS

Attack on asthma: Scrubbing homes of allergens may tame disease and its costs
After years of studying the causes of asthma, a pediatrician-turned-public health sleuth thinks there’s a way to substantially reduce its impact.
But the approach faces a big hurdle: getting someone to pay for it, said Elizabeth C. Matsui, MD, a professor at Johns Hopkins University in Baltimore.
Dr. Matsui, who suffered from asthma as a child, has spent much of her career studying the link between poor housing and asthma in low-income neighborhoods. In particular, she’s looked at the effects of mouse allergens, typically found in high concentrations in urban homes.
Dr. Matsui cited a 2004 study in the New England Journal of Medicine that described measures to reduce home allergen levels and concluded that they were linked to reductions in asthma symptoms.
That research “was highly successful and impactful,” but the approach wasn’t widely adopted, according to Dr. Matsui.
“So here we have this trial that was published more than 10 years ago that shows [indoor allergen control] works,” said Dr. Matsui, who did not participate in the study. “But the families who need it most can’t afford to do these things, don’t have control oftentimes over their home environment, and insurance or other payers don’t cover these things.”
Dr. Matsui has proposed new incentives for hospitals to provide home intervention, including Medicaid waivers. But, she said, scientists can’t use research money for these programs. “Delivery of community health care programs would require a different type of funding.”
As a result, doctors and scientists doubted if a plan to control home allergens would scale up, and insurers questioned whether benefits to their bottom line would justify the added cost.
“We have this enormous public health problem in that there are housing conditions that directly affect allergen exposure in this population of kids,” Dr. Matsui said. “We have dedicated individuals and groups who are trying to solve the problem. But we don’t have a system that is able to solve the problem.”
A 2017 study by Dr. Matsui, published in JAMA, suggests that even without intensive professional cleaning services, families that receive some training can substantially reduce home allergens on their own.
That finding suggests health agencies should routinely offer to educate asthma-affected families in home allergen control. “There’s potentially a large benefit,” Dr. Matsui said.
In a separate study, Dr. Matsui’s group is following 200 Baltimore children to see if those in homes scrubbed of allergens need fewer treatments with rescue inhalers. If they do, that could give health insurers an incentive to pay for the approach.
There’s another incentive: Clearing the air in a child’s home may be critical in cases where medications alone don’t work. “We continue to see a lot of kids that, despite being on medication, don’t have well-controlled asthma,” Dr. Matsui said.
Asthma drugs can also have serious side effects, she said, especially at higher doses, and may suppress symptoms without halting lung damage.
Dr. Matsui’s work on asthma began while working as a pediatrician at Baltimore’s Franklin Square Hospital in 1998. As part of her job, she spent a half-day each week in a school health clinic in a low-income area.
Dr. Matsui was struck by the number of kids she saw with severe asthma, she said, and set up a home health visit program to help them. But she wasn’t certain the program was working, so she consulted with experts at Hopkins.
In 2004, she earned a master’s from the Johns Hopkins School of Public Health. Today, she is one of the nation’s leading asthma researchers.
Dr. Matsui said her career was shaped by her own struggle with childhood asthma. “I think that that probably played a role, consciously or unconsciously,” she said.
KHN’s coverage of health disparities in east Baltimore is supported by The Annie E. Casey Foundation. Kaiser Health News is a nonprofit news service covering health issues. It is an editorially independent program of the Kaiser Family Foundation that is not affiliated with Kaiser Permanente.
Environment is certainly a factor in asthma control. We are lucky enough to have a network in our county that will take pediatric asthma cases to help with asthma education. The nurse will even accompany the child and parent to their outpatient visits to help advocate for help with their asthma management and go into the home to see if there is a cockroach problem or a dusty environment, for example. They will also help families learn how to better organize the child’s bedroom so there is less dust! Some Medicaid HMOs will pay for this care management plan but not all of the insurances in our area.

Environment is certainly a factor in asthma control. We are lucky enough to have a network in our county that will take pediatric asthma cases to help with asthma education. The nurse will even accompany the child and parent to their outpatient visits to help advocate for help with their asthma management and go into the home to see if there is a cockroach problem or a dusty environment, for example. They will also help families learn how to better organize the child’s bedroom so there is less dust! Some Medicaid HMOs will pay for this care management plan but not all of the insurances in our area.
Environment is certainly a factor in asthma control. We are lucky enough to have a network in our county that will take pediatric asthma cases to help with asthma education. The nurse will even accompany the child and parent to their outpatient visits to help advocate for help with their asthma management and go into the home to see if there is a cockroach problem or a dusty environment, for example. They will also help families learn how to better organize the child’s bedroom so there is less dust! Some Medicaid HMOs will pay for this care management plan but not all of the insurances in our area.
After years of studying the causes of asthma, a pediatrician-turned-public health sleuth thinks there’s a way to substantially reduce its impact.
But the approach faces a big hurdle: getting someone to pay for it, said Elizabeth C. Matsui, MD, a professor at Johns Hopkins University in Baltimore.
Dr. Matsui, who suffered from asthma as a child, has spent much of her career studying the link between poor housing and asthma in low-income neighborhoods. In particular, she’s looked at the effects of mouse allergens, typically found in high concentrations in urban homes.
Dr. Matsui cited a 2004 study in the New England Journal of Medicine that described measures to reduce home allergen levels and concluded that they were linked to reductions in asthma symptoms.
That research “was highly successful and impactful,” but the approach wasn’t widely adopted, according to Dr. Matsui.
“So here we have this trial that was published more than 10 years ago that shows [indoor allergen control] works,” said Dr. Matsui, who did not participate in the study. “But the families who need it most can’t afford to do these things, don’t have control oftentimes over their home environment, and insurance or other payers don’t cover these things.”
Dr. Matsui has proposed new incentives for hospitals to provide home intervention, including Medicaid waivers. But, she said, scientists can’t use research money for these programs. “Delivery of community health care programs would require a different type of funding.”
As a result, doctors and scientists doubted if a plan to control home allergens would scale up, and insurers questioned whether benefits to their bottom line would justify the added cost.
“We have this enormous public health problem in that there are housing conditions that directly affect allergen exposure in this population of kids,” Dr. Matsui said. “We have dedicated individuals and groups who are trying to solve the problem. But we don’t have a system that is able to solve the problem.”
A 2017 study by Dr. Matsui, published in JAMA, suggests that even without intensive professional cleaning services, families that receive some training can substantially reduce home allergens on their own.
That finding suggests health agencies should routinely offer to educate asthma-affected families in home allergen control. “There’s potentially a large benefit,” Dr. Matsui said.
In a separate study, Dr. Matsui’s group is following 200 Baltimore children to see if those in homes scrubbed of allergens need fewer treatments with rescue inhalers. If they do, that could give health insurers an incentive to pay for the approach.
There’s another incentive: Clearing the air in a child’s home may be critical in cases where medications alone don’t work. “We continue to see a lot of kids that, despite being on medication, don’t have well-controlled asthma,” Dr. Matsui said.
Asthma drugs can also have serious side effects, she said, especially at higher doses, and may suppress symptoms without halting lung damage.
Dr. Matsui’s work on asthma began while working as a pediatrician at Baltimore’s Franklin Square Hospital in 1998. As part of her job, she spent a half-day each week in a school health clinic in a low-income area.
Dr. Matsui was struck by the number of kids she saw with severe asthma, she said, and set up a home health visit program to help them. But she wasn’t certain the program was working, so she consulted with experts at Hopkins.
In 2004, she earned a master’s from the Johns Hopkins School of Public Health. Today, she is one of the nation’s leading asthma researchers.
Dr. Matsui said her career was shaped by her own struggle with childhood asthma. “I think that that probably played a role, consciously or unconsciously,” she said.
KHN’s coverage of health disparities in east Baltimore is supported by The Annie E. Casey Foundation. Kaiser Health News is a nonprofit news service covering health issues. It is an editorially independent program of the Kaiser Family Foundation that is not affiliated with Kaiser Permanente.
After years of studying the causes of asthma, a pediatrician-turned-public health sleuth thinks there’s a way to substantially reduce its impact.
But the approach faces a big hurdle: getting someone to pay for it, said Elizabeth C. Matsui, MD, a professor at Johns Hopkins University in Baltimore.
Dr. Matsui, who suffered from asthma as a child, has spent much of her career studying the link between poor housing and asthma in low-income neighborhoods. In particular, she’s looked at the effects of mouse allergens, typically found in high concentrations in urban homes.
Dr. Matsui cited a 2004 study in the New England Journal of Medicine that described measures to reduce home allergen levels and concluded that they were linked to reductions in asthma symptoms.
That research “was highly successful and impactful,” but the approach wasn’t widely adopted, according to Dr. Matsui.
“So here we have this trial that was published more than 10 years ago that shows [indoor allergen control] works,” said Dr. Matsui, who did not participate in the study. “But the families who need it most can’t afford to do these things, don’t have control oftentimes over their home environment, and insurance or other payers don’t cover these things.”
Dr. Matsui has proposed new incentives for hospitals to provide home intervention, including Medicaid waivers. But, she said, scientists can’t use research money for these programs. “Delivery of community health care programs would require a different type of funding.”
As a result, doctors and scientists doubted if a plan to control home allergens would scale up, and insurers questioned whether benefits to their bottom line would justify the added cost.
“We have this enormous public health problem in that there are housing conditions that directly affect allergen exposure in this population of kids,” Dr. Matsui said. “We have dedicated individuals and groups who are trying to solve the problem. But we don’t have a system that is able to solve the problem.”
A 2017 study by Dr. Matsui, published in JAMA, suggests that even without intensive professional cleaning services, families that receive some training can substantially reduce home allergens on their own.
That finding suggests health agencies should routinely offer to educate asthma-affected families in home allergen control. “There’s potentially a large benefit,” Dr. Matsui said.
In a separate study, Dr. Matsui’s group is following 200 Baltimore children to see if those in homes scrubbed of allergens need fewer treatments with rescue inhalers. If they do, that could give health insurers an incentive to pay for the approach.
There’s another incentive: Clearing the air in a child’s home may be critical in cases where medications alone don’t work. “We continue to see a lot of kids that, despite being on medication, don’t have well-controlled asthma,” Dr. Matsui said.
Asthma drugs can also have serious side effects, she said, especially at higher doses, and may suppress symptoms without halting lung damage.
Dr. Matsui’s work on asthma began while working as a pediatrician at Baltimore’s Franklin Square Hospital in 1998. As part of her job, she spent a half-day each week in a school health clinic in a low-income area.
Dr. Matsui was struck by the number of kids she saw with severe asthma, she said, and set up a home health visit program to help them. But she wasn’t certain the program was working, so she consulted with experts at Hopkins.
In 2004, she earned a master’s from the Johns Hopkins School of Public Health. Today, she is one of the nation’s leading asthma researchers.
Dr. Matsui said her career was shaped by her own struggle with childhood asthma. “I think that that probably played a role, consciously or unconsciously,” she said.
KHN’s coverage of health disparities in east Baltimore is supported by The Annie E. Casey Foundation. Kaiser Health News is a nonprofit news service covering health issues. It is an editorially independent program of the Kaiser Family Foundation that is not affiliated with Kaiser Permanente.
VIDEO: Dr. Matteo Lambertini answers questions on temporary ovarian suppression
SAN ANTONIO – A meta-analysis of five trials among 873 premenopausal women with early breast cancer finds that temporarily suppressing ovarian function with a gonadotropin-releasing hormone analog during chemotherapy helps preserve fertility, reducing risk of premature ovarian insufficiency by 62% and nearly doubling the posttreatment pregnancy rate. In an interview at the San Antonio Breast Cancer Symposium, lead investigator Matteo Lambertini, MD, of the Institut Jules Bordet in Brussels, Belgium, discussed subgroup findings, the risk-benefit profile, and appropriate patient selection, as well as avenues for future research in this area.
The video associated with this article is no longer available on this site. Please view all of our videos on the MDedge YouTube channel
SAN ANTONIO – A meta-analysis of five trials among 873 premenopausal women with early breast cancer finds that temporarily suppressing ovarian function with a gonadotropin-releasing hormone analog during chemotherapy helps preserve fertility, reducing risk of premature ovarian insufficiency by 62% and nearly doubling the posttreatment pregnancy rate. In an interview at the San Antonio Breast Cancer Symposium, lead investigator Matteo Lambertini, MD, of the Institut Jules Bordet in Brussels, Belgium, discussed subgroup findings, the risk-benefit profile, and appropriate patient selection, as well as avenues for future research in this area.
The video associated with this article is no longer available on this site. Please view all of our videos on the MDedge YouTube channel
SAN ANTONIO – A meta-analysis of five trials among 873 premenopausal women with early breast cancer finds that temporarily suppressing ovarian function with a gonadotropin-releasing hormone analog during chemotherapy helps preserve fertility, reducing risk of premature ovarian insufficiency by 62% and nearly doubling the posttreatment pregnancy rate. In an interview at the San Antonio Breast Cancer Symposium, lead investigator Matteo Lambertini, MD, of the Institut Jules Bordet in Brussels, Belgium, discussed subgroup findings, the risk-benefit profile, and appropriate patient selection, as well as avenues for future research in this area.
The video associated with this article is no longer available on this site. Please view all of our videos on the MDedge YouTube channel
REPORTING FROM SABCS 2017
Metabolic Complications of HIV Infection
From the University of Connecticut School of Medicine, Farmington, CT.
Abstract
- Objective: To review the metabolic complications of HIV infection.
- Methods: Review of the literature in the context of 3 clinical cases.
- Results: People with HIV infection are living longer thanks to the advent of potent antiretroviral therapy. This has led to increased incidence of age-related metabolic complications, including a higher risk of cardiovascular disease, hyperlipidemia, metabolic syndrome, and osteoporosis. Appropriate management of these complications requires an understanding of disease-related and drug-related side effects as well as the potential for drug-drug interactions. A multidisciplinary approach to patient management is most effective.
- Conclusion: Awareness of the metabolic complications frequently encountered in HIV infection, drug interactions, and possible toxicities is critical to the successful management of HIV-infected individuals.
Key words: HIV; antiretroviral therapy; hyperlipidemia; metabolic syndrome; diabetes; hypogonadism.
According to the most recent data from the Joint United Nations Programme on HIV/AIDS (UNAIDS), 36 million people worldwide are living with HIV/AIDS, with 18 million accessing effective antiretroviral therapy (ART) [1]. The past 2 decades have witnessed enormous advances in the field from prevention to diagnosis and therapeutics, and modern ART largely allows HIV-infected persons to live near-normal life spans [2,3]. However, from the beginning of the epidemic, HIV-infected persons on effective therapy have suffered from myriad metabolic consequences, many of which affect quality of life and result in excess mortality [4]. It is also true that untreated HIV infection portends an increased risk of metabolic complications, likely related to abnormal immune activation, as demonstrated in structured interruption trials [5,6]. It is worth noting, however, that while many of these metabolic dyscrasias and associated risks have historically been attributed primarily to the treatment of HIV infection with ART, data from cohort studies and randomized clinical trials have repeatedly demonstrated significant reductions in morbidity and mortality when ART is initiated early [7]. In this paper, we review HIV-related metabolic complications frequently encountered in clinical practice (hyperlipidemia, diabetes, and bone disease) and best practice considerations in the context of 3 clinical cases.
Case Patient 1
Initial Presentation and History
A 58-year-old male with a history of hypertension and mixed hyperlipidemia is referred for evaluation of newly diagnosed HIV infection. He has no history of intravenous drug use but has had multiple male and female sex partners in the past few years, and requested testing after a partner tested positive. His last negative test was 2 years ago. The patient does not smoke cigarettes. Overall he feels well and tolerates his regimen of lisinopril 10 mg and simvastatin 20 mg daily. On initial evaluation, his exam is unremarkable other than subtle white plaques on the dorsal surface of the tongue and buccal mucosa, and moderate central obesity. Vital signs including blood pressure are normal. Initial laboratory evaluation reveals a CD4 cell count of 150 cells/mm3 and an HIV RNA level of 200,000 copies/mL. Fasting serum total cholesterol is 220 mg/dL, triglycerides 250 mg/dL, LDL 170 mg/dL, and HDL 35 mg/dL. Serum BUN, creatinine, and liver function testing results are normal.
What initial regimen might be recommended based on the status of his HIV infection and comorbidities?
The most recent iteration of the US Department of Health and Human Services (DHHS) guidelines on use of antiretroviral agents (ARVs) in HIV recommends an initial ART regimen that includes a backbone of 2 nucleoside reverse transcriptase inhibitors (NRTIs), generally tenofovir disoproxil fumarate or tenofovir alafenamide, abacavir (ABC), emtricitabine (FTC), or lamivudine (3TC) [2]. To this backbone should be added a third agent; the majority of those currently recommended are integrase strand transfer inhibitors (INSTIs) (dolutegravir, elvitegravir, raltegravir); one recommended protease inhibitor (PI) (ritonavir-boosted darunavir) is also an option. Some of these initial recommended regimens are available as fixed-dosed combinations in 1 pill, making them attractive options.
The latest guidelines also clearly recommend starting ART in all HIV-infected individuals, irrespective of CD4 count. The patient described above has a very low CD4 count, so there is no question he needs to begin therapy promptly. Given his low CD4 count and relatively high viral load, one may consider a ritonavir-boosted PI as perhaps the most robust option and with a relatively high barrier to resistance development, in contrast to other options. Assuming the patient’s baseline resistance testing reveals a fully sensitive wild-type virus without meaningful resistance mutations, he will begin a regimen of TDF/FTC plus ritonavir-boosted darunavir, 3 pills once daily. Given his low CD4 count (below 200 cells/mm3), he will also need prophylaxis for Pneumocystis jirovecii pneumonia, in the form of trimethoprim/sulfamethoxazole (TMP/SMX) daily. Given the potential for interaction between the boosted PI and simvastatin, his lipid-lowering agent is switched to atorvastatin 10 mg daily.
What is the association between hyperlipidemia and HIV infection and treatment?
Hyperlipidemia represents a key modifiable risk factor for the development of cardiovascular disease (CVD) in HIV-infected individuals [8]. Indeed, a multicenter cross-sectional study of older HIV-infected individuals performed in Spain revealed a 54% prevalence of dyslipidemia and 23% CVD [9]. Most experts believe that metabolic abnormalities observed in HIV-infected individuals are the result of a combination of factors: those resulting from abnormal immune activation and inflammation related to viral replication, and those related to certain ARVs [10].
Early after HIV seroconversion, decline in HDL is one of the first proatherogenic changes observed. This, along with increased triglyceride and LDL levels, likely contribute to increased risk of CVD in this population. Increased microbial translocation, evidenced by increased levels of lipopolysaccharide (LPS), may drive immune activation, leading to dyslipidemia via a multitude of hypothesized mechanisms [4]. It has been theorized that HDL lipoproteins are less stable on ART, leading to potentially impaired plasma lipolytic activities or hepatic cholesteryl ester uptake [6,11]. Increased VLDL from release of free fatty acids may lead to higher triglyceride levels and triglyceride-rich LDL and HDL, all associated with increased risk of CVD [11].
In terms of effects of specific ARV classes, although newer agents have less of a propensity to cause dyslipidemia, the PI class arguably remains most problematic. In comparison to other classes, the PIs tend to result in greater increases in triglycerides, total cholesterol, and LDL, and have frequent drug-drug interactions with lipid-lowering agents [10,12]. Estimated prevalence of dyslipidemia in patients receiving PI therapy varies from 28% to 80% [13]. The prospective multinational cohort Data collection on Adverse events of Anti-HIV Drugs (DAD) study found significantly higher rates of hypertriglyceridemia, hypercholesterolemia, and low HDL in patients on PIs in comparison to non–nucleoside reverse transcriptase inhibitors (NNRTIs) [14]. Various mechanisms have been proposed to explain the PIs adverse effects on lipids, including inhibition of lipogenesis and adipocyte differentiation, decreased hepatocyte clearance of chylomicrons and VLDL, and increased hepatic synthesis of triglycerides [15]. Of the available PIs, atazanavir and darunavir have less potential to lead to dyslipidemia [10], while lopinavir/ritonavir, fosamprenavir, and tipranavir may have the highest [13]. Of the NNRTIs, efavirenz is most frequently associated with dyslipidemia, specifically increased triglycerides and total cholesterol [13]. However, these increased values seen on efavirenz therapy may be offset by relative increases in HDL, with little resultant effect on the total cholesterol:HDL ratio. Rilpivirine, etravirine, and nevirapine are relatively less likely to drive lipid changes, although certain drug interactions are important to recognize in clinical practice, such as the interaction between rilpivirine and proton pump inhibitors [2,13,16]. It is also worth noting that no NNRTIs are included in current guidelines as preferred therapy [2].
Historically, the thymidine analogue NRTIs (stavudine, didanosine, zidovudine) have been associated with lipid dyscrasias and lipoatrophy, but fortunately these are no longer used frequenty except in cases requiring deep salvage therapy for highly treatment-experienced patients. Two newer NRTIs, tenofovir and abacavir, have relatively neutral to favorable effects on lipids. The combination of tenofovir disoproxil (TDF) and emtricitabine (trade name Truvada) was associated with significantly lower triglycerides, total cholesterol and LDL than other NRTI pairs [6]. TDF has been postulated to have lipid-lowering effects. Switch studies in which patients were taken off thymidine analogues and placed on TDF, demonstrated recovery of limb fat in patients with lipoatrophy, and those switched off abacavir-based ART to TDF showed statistically significant lower fasting total cholesterol at week 12, without differences of viral suppression [8]. Tenofovir alafenamide (TAF) is a next-generation prodrug of tenofovir that results in improved stability in plasma and higher intracellular levels in comparison to TDF [17]. Although randomized controlled trials of TAF vs TDF-based ARV regimens have suggested statistically higher total cholesterol, serum HDL is also increased resulting in unchanged total:HDL ratios and no differences in risk classifications [18]. Integrase inhibitors (INSTI) now represent first-line therapy in combination with an NRTI backbone, and since their availability in 2007 have been evaluated in comparison to various PIs and NNRTIs. Both raltegravir and dolutegravir have consistently shown broad neutral effects on lipids and are among the most metabolically friendly agents available [19–21]. Because it is given in fixed-dose combination with non-ritonavir pharmacologic booster cobicistat, elvitegravir has effects similar to ritonavir-boosted PIs on lipids [6].
What are management considerations in the treatment of hyperlipidemia in HIV-infected patients?
Patients with HIV and hyperlipidemia may benefit from lipid-lowering therapy in addition to ART, although in certain cases appropriate switches may make a difference. Careful consideration of drug interactions between ARVs and lipid-lowering agents, in addition to ARV history and known drug resistance, is warranted prior to selecting a regimen in these patients. In addition, the latest American College of Cardiology/American Heart Association guidelines suggest evaluating 10-year risk of atherosclerotic cardiovascular disease (ASCVD) using the pooled cohort equation to determine the type and dose of statin required (moderate vs high intensity) [22]. It is noteworthy that HIV infection and its therapies are not taken into account as potential risk factors in this model. Primary prevention in non-diabetic patients with a statin is recommended for patients with a 10-year absolute risk of ≥ 7.5% [22]. This patient’s risk is estimated at between 12% and 13% based on this equation, so primary prevention with a moderate-or high-intensity statin is recommended (Table 1) [23]. Data from more than 80,000 patients in the Veterans Aging Cohort Study (VACS) showed that HIV-infected patients with no baseline ASCVD had 50% increased risk of acute myocardial infarction when compared to HIV-uninfected patients over 6 years of follow-up [24]. Thus, consideration of the virus itself or its therapy as an additional risk factor may be valid. 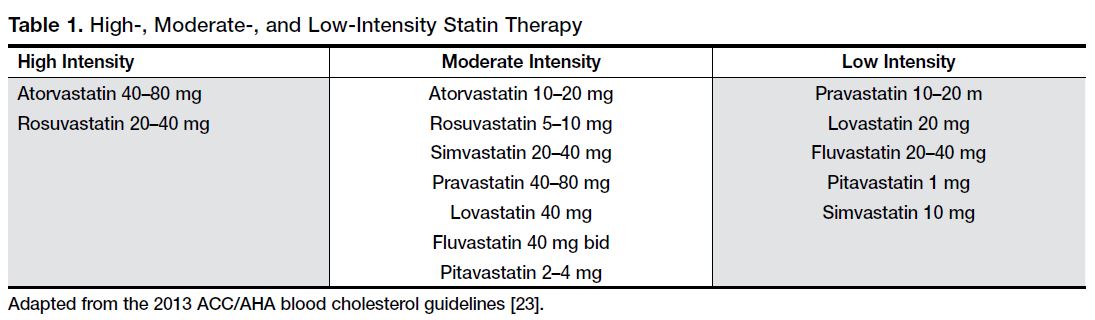
Screening and Monitoring of Hyperlipidemia
The most recent iteration of the DHHS primary care guidelines for the management of HIV-infected individuals recommends obtaining fasting (ideally 12 hours) lipid profiles upon initiation of care, and within 1 to 3 months of beginning therapy [12,13]. These initial levels, along with other elements of the patient’s history and calculation of risk may help determine whether lipid-lowering therapy is indicated, and if so, which therapy would be best. In general, after regimen switches or additions of either ARV or statin therapy, repeating fasting lipid levels 6 weeks later is recommended to gauge the effects of the switch. This is especially critical when interactions between ARVs and lipid-lowering therapies are possible. Some experts recommend performing annual screening of patients with normal baseline lipids or with well-controlled hyperlipidemia on therapy. Assessment of 10-year ASCVD risk is also recommended annually, in addition to baseline risk assessment, to determine the need and appropriateness of statin therapy [25]. The question of primary prevention in HIV has yet to be definitively answered. Small studies in this population have demonstrated that statins have the potential to slow progression of carotid intima media thickness and reduce noncalcified plaque volume [24]. An NIH/AIDS Clinical Trial Group–sponsored randomized clinical trial (“REPRIEVE”) is currently underway to address this question. More than 6000 HIV-infected men and women with no history of ASCVD at 100 sites in several countries are enrolled to assess the benefit of pitavastatin as primary prevention in this risk group [24]. Metabolized via glucuronidation primarily, as opposed to cytochrome p450 (CYP 3A4 isoenzyme), pitavastatin is thought to have fewer drug interactions with ARVs in general [6] (Table 2). 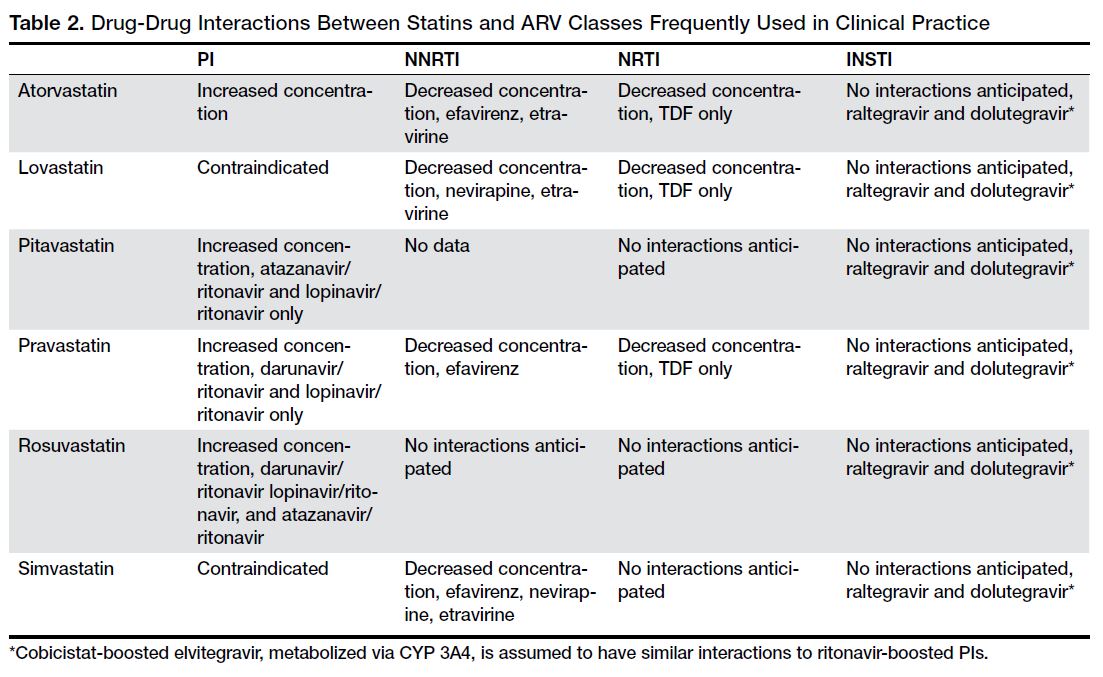
Relevant Drug-Drug Interactions
Deciding which statin to begin in HIV-infected patients depends on whether moderate- or high-intensity therapy is warranted and whether the potential for drug interaction with ARVs exists. Table 2 [6,12] depicts available statins and the potential for pharmacokinetic interaction with the primary ARV classes. Simvastatin and lovastatin are heavily metabolized via the CYP 3A4 pathway, resulting in the highest potential risk of interaction with CYP 3A4 inhibitors, such as the PIs, or inducers (eg, NNRTIs, in particular efavirenz) [6]. The former may inhibit metabolism of these statins, resulting in increased risk of toxicity, while co-administration with efavirenz, for example, may result in inadequate serum concentration and therefore inadequate lipid-lowering effects. Although less lipophilic, atorvastatin results in similar interactions with PIs and NNRTIs, and therefore low starting doses with close monitoring is recommended [6]. Fewer interactions have been noted with rosuvastatin, pravastatin, and pitavastatin, as these do not require CYP 3A4 for their metabolism and are thus less likely to be affected by ARVs. These therefore represent potentially safer first choices for certain patients on ARVs, although of these, only rosuvastatin is classified as a high-intensity statin [22,23] (Table 1). When compared directly to pravastatin 40 mg daily in patients receiving ritonavir-boosted PIs, rosuvastatin performed superiorly at 10 mg per day, resulting in more significant reductions in LDL and triglyceride levels [15]. Although it is eliminated largely unchanged through the kidney and liver, pravastatin has been reported to idiosyncratically interact with darunavir, resulting in potentially increased pravastatin levels and associated toxicity [25]. Treatment of pure hypertriglyceridemia in HIV-infected patients should begin with fibrates, which have little to no risk of interaction with most clinically relevant ARVs [6,10]. Alternatives to lower triglycerides include niacin and N-3 polyunsaturated fatty acids [25].
Case 1 Continued
The patient has an impressive response to his initial regimen of TDF/FTC plus boosted darunavir, with repeat CD4 count after 12 weeks of 275 (18%) cells/mm3 and an undetectable viral load (< 20 copies/mL). Other lab parameters are favorable and he is tolerating the regimen well without notable side effects. However, at his next visit, although his viral load remains undetectable, his triglyceride level has increased to 350 mg/dL, although other lipid parameters are comparable to the prior result. He complains of diffuse body aches, concentrated in large muscle groups of the extremities, and dark-colored urine. A creatine phosphokinase (CPK) level is elevated at 300 IU/L (normal, 22–269, negative MB fraction). Serum creatinine is 1.4 mg/dL (had been 1.1 mg/dL at baseline). Given he has done so well otherwise on these ARVs, he is reluctant to make any changes.
What drug-drug interaction is most likely causing this patient's problem, and how should it be managed?
This scenario is not uncommon in clinical practice, and changes to regimens are sometimes necessary in order to avoid drug interactions. Care must be taken to thoroughly review antiretroviral history and available resistance testing (in this case a relatively short history) in order to ensure a fully active and suppressive regimen is chosen. This description could be the result of an interaction between lipid-lowering therapy and ARVs resulting in increased relative concentrations of one drug or the other and therefore leading to toxicity. Given this possibility, and suboptimal control of hyperlipidemia, consideration should be given to switching both his ART and his statin therapy.
Safety and Potential Toxicities of Lipid-Lowering Therapy
Increased serum concentration of certain statins when co-administered with CYP 3A4 inhibitors like the PIs leads to heightened risk of statin-associated toxicities. In general, this includes muscle inflammation, leading to increases in serum CPK level and associated symptoms, including myalgias, myositis, or in extreme cases, rhabdomyolysis [6]. Although rare, this toxicity can be serious and may lead to acute renal injury if not recognized and managed appropriately. In theory, the potential for statin-associated hepatotoxicity may also be increased in patients receiving PIs, although this has not been borne out in clinical trials [26]. In fact, quite the opposite may be true, in that statins have been shown to improve liver function in patients with hepatitis C virus (HCV) coinfection and with nonalcoholic fatty liver disease [6,15].
Case 1 Conclusion
The patient does well on his new ARV regimen of TAF/FTC and dolutegravir, 2 pills once daily. He no longer requires TMP/SMX, as his CD4 count has been reliably above 200 cells/mm3 on several occasions. Serum creatinine is back down to baseline and CPK has normalized. Fasting lipids have improved since the switch, and he no longer has symptoms of myositis on rosuvastatin 10 mg daily.
Summary
Consideration of statin therapy is complicated by potential drug interactions with ARVs and associated toxicity. However, given known effects of ARVs on lipids, and of immune activation and inflammation related to the virus itself, these patients should be carefully evaluated for statin therapy for their anti-inflammatory and immune modulatory effects as much as for their lipid-lowering ability. Utilization of HIV infection and its therapies as additional cardiovascular risk factors when calculating 10-year risk deserves further consideration; forthcoming results of the REPRIEVE trial are certain to contribute valuable information to this field of study.
Case Patient 2
Initial Presentation and History
A 45-year-old female with history of HIV infection since 2008 presents to the office for new-onset diabetes, diagnosed 2 weeks ago. She has had symptoms of polyuria and polydipsia for the last 1 month. She denies diarrhea, nausea, vomiting or weight loss. She is currently on a regimen consisting of zidovudine/lamivudine plus lopinavir/ritonavir. There is no family history of diabetes. Her examination is unremarkable, including normal vital signs (weight 150 lb, blood pressure 114/70, heart rate 76) and no evidence of insulin resistance, including acanthosis nigricans or striae. Glycosylated hemoglobin level (HbA1c) is 8%. Creatinine and liver function tests are within reference ranges.
Do HIV-infected patients have a higher incidence of type 2 diabetes mellitus (DM)?
Prevalence of type 2 DM in HIV-infected patients varies between 2% to 14% [27]. This variation is due to the different cutoffs used for diagnosis, differences in cohorts studied, and how risk factors are analyzed [28–31]. In a recent nationally representative estimate of DM prevalence among HIV-infected adults receiving medical care in the United States in 2009–2010, the prevalence of DM was noted to be 10.3%. In comparison to the general adult US population, HIV-infected individuals have a 3.8% higher prevalence of DM after adjusting for age, sex, race/ethnicity, education, poverty-level, obesity, and HCV infection [27].
There is controversy over whether HIV infection itself increases the risk of type 2 DM, with some studies showing increased risk [28,32,33] and others showing no independent effect or an inverse effect [30,34,35]. Studies on the impact of ethnicity and race on prevalence of DM are limited [36].
Certain traditional risk factors (age, ethnicity, obesity) are still responsible for most of the increased risk of diabetes in the HIV-infected population [35,37]. HIV infection itself is associated with metabolic dysfunction, independent of ARV. In HIV-infected patients, impaired glucose metabolism is associated with altered levels of adipokines, increased adiponectin and soluble-tumor necrosis factor receptor 1 (sTNFR1) and decreased leptin [38,39]. HIV-associated alterations in CD4+ and CD8+ T cell function also impair glycolysis, which may adversely impact glucose metabolism [40].
Other contributing factors in HIV-infected patients are HCV co-infection [41], medications (atypical antipsychotics, corticosteroids), opiates, and low testosterone [42]. HCV co-infection may lead to hepatic steatosis and liver fibrosis, and increasing insulin resistance.
Recent genomic studies show several common single-nucleotide polymorphisms (SNPs) associated with diabetes in the general population. In the Swiss HIV Cohort Study, SNPs accounted for 14% of type 2 DM risk variability, whereas ARV exposure accounted for 3% and age for 19% of the variability in DM [43].
ARVs also increase the risk of type 2 DM by both direct and indirect effects. Certain ARVs causes lipoatrophy [30] and visceral fat accumulation/lipohypertrophy [29,44]. PIs increase insulin resistance via effects on GLUT-4 transporter and decrease insulin secretion through effects on B cell function [45]. NRTIs (eg, stavudine, zidovudine and didanosine) can cause direct mitochondrial toxicity [46–48]. Utilization of newer ARV agents has decreased the prevalence of severe lipoatrophy, but lipohypertrophy and the underlying metabolic abnormalities persist. The DHHS “preferred” nucleoside analogues, tenofovir and abacavir, do not induce mitochondrial toxicity and have more favorable metabolic profiles [49,50]. In ACTG Study 5142, thymidine-sparing regimens were found to cause less lipoatrophy [51]. In addition, darunavir and atazanavir, the preferred and alternative PIs and the integrase strand transfer inhibitor have limited or modest impact on insulin sensitivity [20,52,53]. This has led to a recent decline in the incidence of type 2 DM in HIV-infected patients.
Statins can also increase insulin resistance and DM [54], although studies have shown mixed results [55–57]. The benefits of statin therapy likely outweigh the risk of DM since there is a significant cardiovascular event reduction with their use [58,59].
How is diabetes diagnosed in HIV-infected patients?
Optimal diabetes screening guidelines have not been established specifically for HIV-infected patients. The American Diabetes Association (ADA) guidelines recommend that diabetes in the general population be diagnosed by 2 elevated fasting blood glucose levels, HbA1c, oral glucose tolerance test (OGTT), or high random glucose with classic symptoms of hyperglycemia [60]. Repeat testing is recommended every 3 years. The OGTT is recommended for diagnosis in pregnant women.
HbA1c may underestimate glycemic burden in HIV-infected individual due to higher mean corpuscular volume, NRTI use (specifically abacavir), or lower CD4 count [61–65]. The Infectious Diseases Society of America (IDSA) 2013 primary care guidelines for HIV-infected patients recommends obtaining a fasting glucose and/or HbA1c prior to and within 1–3 months after starting ARV [12]. Use of HbA1c threshold cutoff of 5.8% for the diagnosis of DM and testing every 6–12 months are recommended.
How should this patient’s diabetes be managed?
The ADA guidelines suggest a patient-centered approach to management of diabetes [66]. All patients should be educated about lifestyle modifications with medical nutrition therapy and moderate-intensity aerobic activity and weight loss [67]. If a patient is on lopinavir/ritonavir or a thymidine analogue (zidovudine, stavudine), one should consider switching the ARV regimen [2].
There are currently no randomized controlled trials of diabetes treatment specific to patients with HIV infection. Metformin is the first-line agent. It improves insulin sensitivity by reducing hepatic glucose production and improving peripheral glucose uptake and lipid parameters [68,69]. Other oral hypoglycemic agents used in the treatment of type 2 diabetes are shown in Table 3. 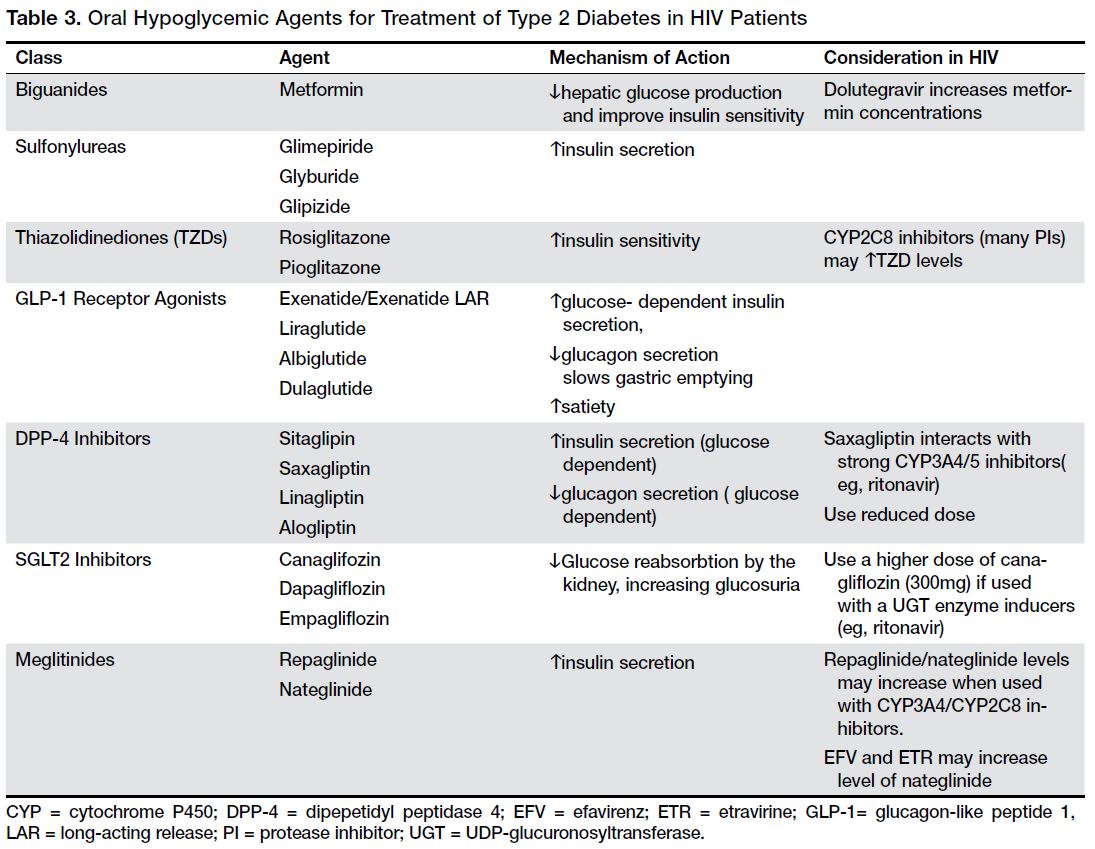
Case 2 Continued
The patient is switched to TAF/FTC plus dolutegravir with improvement in blood sugars. She is also started on metformin. Co-administration of metformin and dolutegravir will be carefully monitored since dolutegravir increases metformin concentration [70]. When dolutegravir is used with metformin, the total daily dose of metformin should be limited to 1000 mg.
• How should this patient be followed?
If the patient is still not at goal HbAb1c at follow-up, there are multiple other treatment options, including use of insulin. Goal HbA1c for most patients with type 2 DM is < 7%; however, this goal should be individualized for each patient in accordance with the ADA guidelines [12]. A longitudinal cohort study of 11,346 veterans with type 2 diabetes compared the glycemic effectiveness of oral diabetic medications ( metformin, sulfonylurea and a thiazolidinedione) among veterans with and without HIV infection. This study did not find any significant difference in HbA1c based on different diabetes medications. However the HBA1c reduction was less in black and Hispanic patients. The mechanism for the poorer response among these patients need to be evaluated further [71]. In addition to management of blood sugar, other CVD risk factors, hyperlipidemia, hypertension, smoking, etc, should be assessed and managed aggressively.
Case Patient 3
Initial Presentation and History
A 45-year-old male with a history of HIV infection diagnosed 10 years ago, on TDF/FTC/efavirenz (trade name Atripla) for the last 7 years, presents with a left femoral neck fracture after he missed the pavement and fell on his left hip. His history is significant for IV drug abuse for 10 years prior to diagnosis of HIV, and he has been on methadone for the last 6 years.
Is HIV infection associated with increased prevalence of osteopenia and osteoporosis and increased risk of fractures?
With recent advancements in antiretroviral therapy and improved survival of the HIV-infected population, osteoporosis and increased fracture risk have become important causes of morbidity and mortality. Osteoporosis is a skeletal disorder characterized by compromised bone strength, which predisposes to an increased risk of fracture. The World Health Organization defines osteoporosis as a bone mineral density (BMD) measurement by dual X-ray absorptiometry (DXA) at the spine, hip, or forearm that is more than 2.5 standard deviations below that of a "young normal" adult (T-score < –2.5) or a history of one or more fragility fractures. Fragility fractures result from mechanical forces that would not ordinarily result in fracture, such as fall from standing height [40]. Osteopenia is characterized by low BMD (T-score between –1.0 and –2.5) and can be a precursor to osteoporosis.
Several observational, retrospective, and prospective studies have shown lower bone density and an increased risk of fractures in the HIV-infected population compared to age-, race- and sex-matched HIV-negative adults. In a large meta-analysis of pooled prevalence data on 884 HIV-infected patients compared with 654 HIV-uninfected age- and sex-matched controls [72], overall, HIV-infected patients had a significant 6.4-fold increased odds of reduced BMD and a 3.7-fold increased odds of osteoporosis compared to the control population. This meta-analysis also compared ARV-treated subjects to ARV-naive subjects and showed that ARV-treated subjects (n = 824) had a higher prevalence of reduced BMD compared with ARV-naive subjects (n= 202; odds ratio 2.5, 95% CI 1.8–3.7). The odds of osteoporosis was increased 2.4 times (95% CI 1.2 – 4.8) in ARV-treated subjects compared with ARV-naive subjects. None of the studies adjusted for potentially important confounding factors, such as age or duration of HIV infection. PI-treated patients (n = 791) were also found to have a higher prevalence of reduced BMD compared with PI-untreated patients (n = 410; OR 1.5, 95% CI 1.1–2.0). The odds of osteoporosis in PI-treated patients (n = 666) was also 1.6-fold greater (95% CI 1.1–2.3) than those not treated with PI (n = 367).
Low bone density has also been reported in HIV- positive premenopausal women irrespective of ARV status. In a recent study of 89 premenopausal women (mean age, 37 years) predominantly of African origin with HIV infection, osteopenia and osteoporosis were prevalent in one-third of these women, irrespective of ARV use and were associated with low BMI [73]. In a sub-study of the INSIGHT trial evaluating prevalence of and risk factors for low BMD in untreated HIV infection, performed at several sites across 6 continents involving 424 subjects, osteopenia was present in a third of this relatively young predominantly non-white ART-naive population (mean age 34 + 10 years) with normal CD4 cell counts, while only 2% had osteoporosis. Factors independently associated with lower BMD at the hip and spine were female sex, Latino/Hispanic ethnicity, lower BMI, and higher estimated glomerular filtration rate. Longer duration of HIV infection was also associated with lower hip BMD. Current or nadir CD4 cell count and HIV viral load were not associated with low BMD [74].
Many studies have reported increased fracture prevalence in the HIV population. In a retrospective study of fracture prevalence in a large US health care system, a significantly higher rate of fractures was reported in HIV-infected men and women compared to non-HIV-infected controls (2.87 vs. 1.77 fractures per 100 persons, P < 0.001). The difference in the increased fracture prevalence was greater in HIV positive men compared to women (3.08 vs. 1.83; P < 0.001). Vertebral, wrist and hip fractures were more prevalent in men compared to vertebral and wrist fractures only in women. Fracture prevalence was higher in both Caucasian females and males and only in African-American women [75].
In the HIV Outpatient Study (HOPS) [76], age-adjusted fracture rates in the HIV population were noted to be 1.98 to 3.69 times higher than rates in the general population. The HOPS was an open prospective cohort study of HIV-infected adults who were followed at 10 US HIV clinics. Rates of first fractures at any anatomic site from 2000–2008 were assessed among 5826 active HOPS patients (median age 40 years, 79% male, 52% Caucasian, and 73% exposed to ART). Among persons aged 25–54 years, both fracture rates and relative proportion of fragility fractures were higher among HOPS patients than among outpatient controls. Older age, substance abuse, nadir CD4+ cell count <200 cells/mm, HCV infection and DM were associated with incident fractures [76].
What factors contribute to poor bone health in the HIV population?
Several factors that contribute to low bone density are present at a higher rate in the HIV population (Table 4). These include poor nutritional status in terms of suboptimal calcium and vitamin D intake, hypogonadism, low body weight, and alcohol, tobacco and substance abuse. 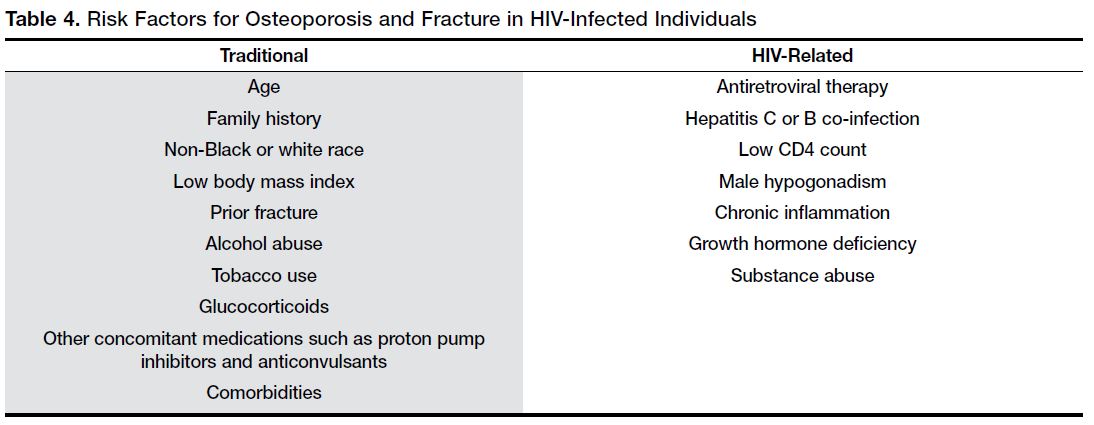
Vitamin D deficiency is very common in HIV-infected patients, with a prevalence of up to 60% to 75% [77]. Hypogonadism is also relatively common among HIV population [78], contributing to lower bone density. Co-infection with HCV is also associated with increased risk of fractures. In a large cohort of Medicaid beneficiaries, a significant increase in the risk of hip fracture was demonstrated in HCV/HIV co-infected subjects compared either with HCV mono-infected, HIV mono-infected or non-infected individuals [79]. In another large database study, a significantly higher risk of osteoporotic fracture (closed wrist, vertebral or hip fracture) was reported in HCV/HIV co-infected versus HIV mono-infected individuals [80] with fracture rates of 2.57 and 2.07/1000 patient-years (P < 0.001). Dual treatment for HIV/hepatitis B co-infection has also been shown to be associated with a higher risk of hip fracture compared to treatment of HIV mono-infected individuals [81].
HIV infection itself can increase bone loss and reduce bone formation through direct effects related to the HIV antigen load or indirect effects related to activation of the pro-inflammatory cytokines resulting in bone resorption and loss [82]. Co-infection with HCV and/or hepatitis B also contributes to lower bone density in this population. Certain ARVs may also contribute to low bone density in the HIV population. Lipoatrophy related to HIV may also mediate bone loss through complex relationship between central signaling of adipocyte hormones [82,83].
Direct Viral Effects
Several HIV viral proteins have been shown to promote osteoclast activity (vpr and gp120), suppress osteoblast activity (p55-gag) and increase osteoblast apoptosis [84], resulting in increased bone resorption and reduced bone formation, leading to low bone mass. High HIV RNA viral load and T-cell activation are also associated with elevated levels of receptor activator of nuclear factor kappa-B ligand (RANKL), which results in osteoclast formation and increased bone resorption [85]. Other endogenous physiological inhibitors of osteoclastogenesis such as osteoprotegrin and interferon-γ levels are also remarkably downregulated in advanced HIV infection, resulting in increased bone resorption [86]. At a cellular level, HIV proteins including Tat and Nef reduce the number of available mesenchymal stem cell (MSC) precursors that proliferate into osteoblasts by inducing MSC senescence, due to increased oxidative stress and mitochondrial dysfunction resulting in reduced proliferation of osteoblasts and lower rates of bone formation [87]. Collectively, these mechanisms result in significant uncoupling of bone formation and resorption, resulting in less bone formation and greater rate of bone loss and lower bone density.
Pro-inflammatory Pathways
Cytokines and other soluble immune factors play a major role in the physiology of osteoblast maturation and osteoclastic bone resorption [88,89]. Immune dysfunction and persistent inflammation in HIV result in increased levels of several inflammatory cytokines, including tumor necrosis factor (TNF)-α, interleukin-6 (IL-6), and RANKL, resulting in stimulation of osteoclastogenesis and bone resorption [90]. Due to a disruption between T and B cells in HIV and decreased osteoprotegrin (OPG) production and increased RANKL level, RANKL/OPG ratio is elevated, favoring osteoclastogenesis [91].
Is antiretroviral therapy associated with bone loss?
The initiation of ART has been reported to cause 2% to 6% bone loss irrespective of the regimen used, similar to that sustained in the first 2 years after menopause [92]. Certain NRTIs and PIs are associated with higher rates of bone loss than others. TDF has been associated most commonly with decreased bone mineral density, which usually stabilizes with continued use [93]. In a randomized trial comparing 4 treatment arms of ABC/3TC or TDF/FTC with EFV or ATV/ritonavir, TDF was associated with a greater reduction in BMD compared to abacavir-based regimens [94]. The likely cause of this may be TDF-mediated renal toxicity, including proximal tubular dysfunction and hypophosphatemia, resulting in increased PTH and bone resorption, and nephrogenic diabetes insipidus [95]. TAF is another prodrug of tenofovir diphosphate associated with less renal and bone toxicity compared with TDF. TAF has been associated with significantly less decrease in bone mineral density and renal dysfunction in randomized studies compared to regimen using TDF [17]. Vitamin D deficiency and hypophosphatemia associated with TDF therapy may present with osteomalacia, which predisposes to bone pain and fractures. Treatment with TDF may rarely be associated with the development of Fanconi syndrome and osteomalacia [96]. BMD is often severely reduced and bone pain and pathological fractures are characteristic features. Certain PI regimens containing ritonavir-boosted atazanavir have also been associated with greater bone loss in the spine than the hip, compared to efavirenz-containing regimens [97].
The universal bone loss associated with ART is thought to be a result of the "immune reconstitution inflammatory syndrome" (IRIS). This occurs as a result of rapid improvement in immune function after the commencement of ARV as a result of systemic or local inflammation, resulting in increased levels of cytokines that may contribute to bone loss. This has been shown in animal studies where T cell transplantation into immunocompromised mice to mimic ARV-induced T-cell expansion resulted in increased RANKL and TNF-α production by B cells and/or T cells, accompanied by enhanced bone resorption and BMD loss. When TNF-α or RANKL-null T-cells or TNF-α antagonists were used instead, the loss of cortical bone was prevented [98]. In a prospective study evaluating changes in bone turnover markers and inflammatory cytokines with ARV therapy in HIV infected subjects, a significant increase in bone resorption markers, RANKL and TNF-α were seen after initiation of ARV. The magnitude of CD4-cell recovery correlated with the increase in markers of bone resorption [99], suggesting that recovery of the immune system contributes to the increase in cytokine-mediated bone resorption.
How is bone health and fracture risk assessed in the HIV-positive population?
The predictive value of low BMD for fracture risk assessment in the HIV-positive population has not been established. In the absence of definitive data, the fracture risk assessment and standard methods of measuring bone density using DXA are utilized. In a large study of 1000 men and women, osteoporosis defined as a BMD T-score –2.5 as measured by DXA, was associated with a significantly increased risk of incident fractures but was not a good predictor of morphometric vertebral fractures [100]. In the absence of prospective longitudinal studies evaluating the bone density parameters at which fracture risk is significantly increased in the HIV population, it is reasonable to follow the guidelines used in the non-HIV population.
The approach to treatment of osteopenia and osteoporosis is similar to that in non HIV-infected population and is directed at lifestyle changes and treatment of secondary causes of osteoporosis [101], followed by initiation of antiresorptive therapy.
Management of Bone Disease
There are several guidelines available for the management of bone disease in the HIV population. The most recent guidelines from the IDSA [12] recommend assessing the risk of fragility fracture using the Fracture Risk Assessment Tool (FRAX), without DXA, in all HIV-infected men aged 40–49 years and HIV-infected premenopausal women aged ≥ 40 years. DXA should be performed in men aged ≥ 50 years, postmenopausal women, patients with a history of fragility fracture, patients receiving chronic glucocorticoid treatment, and patients at high risk of falls. In resource-limited settings, FRAX without bone mineral density can be substituted for DXA. ART guidelines should be followed. TDF and boosted PIs should be avoided if possible in at-risk patients. Dietary and lifestyle management strategies for high-risk patients should be employed and anti-osteoporosis treatment initiated if indicated [102].
The FRAX tool is available at www.shef.ac.uk/FRAX/ and is used to calculate 10-year fracture risk using patient clinical data, including presence of risk factors for osteoporosis. The tool is population-specific by race and region. It has not been validated for the HIV-positive population and may underestimate fracture risk [103]. HIV status is considered a secondary cause of osteoporosis in FRAX calculation.
The National Osteoporosis Foundation recommends screening with DXA for all women > 65 years of age, all men > 70 years of age, and adults > 50 years of age with additional risk factors for osteoporosis. Evaluation for secondary causes for low BMD should always be considered in the HIV-positive population including evaluation of calcium and vitamin D intake. Laboratory testing may include complete blood count, calcium, phosphate, albumin, creatinine, PTH, 25 hydroxy vitamin D (25,OHD) and 24 hour urine for evaluation of calcium, creatinine and phosphate (especially if on TDF) excretion. Testosterone level can be checked in men and estradiol, prolactin, FSH and LH in women for evaluation of hypogonadism. Bone turnover markers (bone specific alkaline phosphatase and serum C-terminal telopeptide) can also be assessed at baseline.
Studies using high-resolution peripheral quantitative computed tomography (HSPQCT) have shown significant reductions in tibial trabecular bone density and trabecular number in pre-menopausal and postmenopausal HIV-infected women [104], with reduced bone stiffness measured using finite element analysis [105]. Co-infection with HCV is also associated with significantly lower trabecular volumetric BMD and smaller cortical dimensions in the tibia, compared to healthy subjects [106]. HSPQCT is not widely available for clinical use at this time. Lateral imaging of the spine or vertebral morphometric analysis may be done in cases of height loss to assess for occult vertebral compression fractures.
There is a high prevalence of vitamin D deficiency in the HIV-infected population [107]. Treatment goal is to have a vitamin D level of at least 30 ng/mL, based on Endocrine Society practice guidelines [108], and may require supplementation with 1000–2000 units of vitamin D daily. Calcium intake should be optimized, averaging 1000 mg per day including diet and supplements, to be taken in divided amounts through the day for optimal absorption. Secondary causes of low bone density as mentioned in Table 4 should also be addressed. Patients should be counseled on tobacco and alcohol abuse. Corticosteroids should be dosed at the lowest dose needed. Medications such as proton pump inhibitors can impair the absorption of calcium carbonate, in which case calcium citrate supplements should be used if there is suboptimal calcium intake in the diet.
Which medications have been shown to be effective in treatment of osteoporosis in the HIV population?
Bisphosphonates are the mainstay of therapy for osteoporosis in the HIV-infected population. Only alendronate and zoledronate have substantial evidence of safety and effectiveness in the HIV-infected population, but these studies have been small and of limited duration.
Bisphosphonates are pyrophosphate analogues that inhibit bone resorption by binding to the hydroxyapatite crystals in the bone. Several prospective studies have shown alendronate to increase bone density compared to calcium and vitamin D alone in the HIV infected patients with reduced bone density [109,110], with significant reduction in markers of bone resorption [111].
Zoledronic acid (ZA), an amino-bisphosphonate which is infused intravenously, has also been used in smaller studies in HIV-infected persons. In a prospective study evaluating yearly ZA infusion to biennial ZA infusion in subjects with HIV and low bone density [112], biennial ZA infusions were found to be effective in improving and maintaining bone density in the HIV population. In another prospective study evaluating the effects of ZA in HIV-positive men, ZA infusion was given at baseline and at 12 months. Compared to placebo, treatment group had significantly higher bone density and lower bone turnover markers till 5 years after the last infusion [113].
In a meta-analysis evaluating the effect of bisphosphonates on bone mineral density in 328 adults with HIV infection from 8 randomized controlled trials (5 with alendronate and 3 with ZA as the intervention), a significant increase in BMD at the lumbar spine and hip was observed in the treatment groups at 48 and 96 weeks. However, these studies were not long enough to detect the impact of bisphosphonates on fracture risk [114]. ZA has also been shown to be effective in preventing ARV induced bone loss after a single infusion [115].
These studies confirm that both alendronate and ZA are effective in improving BMD in the HIV-infected population, with early studies showing a beneficial effect of ZA in mitigating ARV-induced bone loss as well. DXA may be repeated 1 to 2 years after initiation of osteoporosis therapy and less often subsequently if BMD is stable to improved [116].
Although these studies show significant improvement in bone density with treatment, longitudinal data on fracture reduction with these medications in the HIV-infected population are not available. Additionally, these patients have onset of osteoporosis at a younger age and the need for osteoporosis treatment needs to be assessed carefully before initiating treatment. There are other medications available for the treatment of osteoporosis in the non-HIV population such as raloxifene, teriparatide and denosumab, but no randomized controlled studies of these agents are available in the HIV-infected population.
Summary
The advent of highly potent antiretroviral therapy capable of early and prolonged viral suppression in HIV-infected patients has resulted in significant increases in life span. As we have already seen, this will likely lead to a rising incidence of various metabolic complications of HIV and ARV, including hyperlipidemia and diabetes with associated cardiovascular disease risk. A keen awareness of these potential complications, drug interactions, and possible toxicities will be paramount to their successful management. Appropriate care of HIV-infected individuals going forward will likely require multidisciplinary collaboration as the epidemic evolves to allow our patients to live not only longer, but healthier lives.
Corresponding author: Lisa M. Chirch, MD, UCONN Health, Farmington, CT 06030, chirch@uchc.edu.
Financial disclosures: None
Author contributions: All authors contributed equally to this article
1. UNAIDS. Fact sheet - Latest statistics on the status of the AIDS epidemic. Accessed 10 Nov 2017 at http://www.unaids.org/en/resources/fact-sheet.
2. Panel on Antiretroviral Guidelines for Adults and Adolescents. Guidelines for the use of antiretroviral agents in HIV-1-infected adults and adolescents. Department of Health and Human Services. Accessed 10 Nov 2017 at https://aidsinfo.nih.gov/contentfiles/lvguidelines/adultandadolescentgl.pdf.
3. Samji H, Cescon A, Hogg RS, et al. Closing the gap: increases in life expectancy among treated HIV-positive individuals in the United States and Canada. PloS One 2013;8:e81355.
4. Pedersen KK, Pedersen M, Troseid M, et al. Microbial translocation in HIV infection is associated with dyslipidemia, insulin resistance, and risk of myocardial infarction. J Acquir Immune Defic Syndr 2013;64:425–33.
5. Strategies for Management of Antiretroviral Therapy Study Group, El-Sadr WM, Lundgren J, et al. CD4+ count-guided interruption of antiretroviral treatment. N Engl J Med 2006;355:2283–96.
6. Chastain DB, Henderson H, Stover KR. Epidemiology and management of antiretroviral-associated cardiovascular disease. Open AIDS J 2015;9:23–37.
7. Group ISS, Lundgren JD, Babiker AG, et al. Initiation of antiretroviral therapy in early asymptomatic HIV infection. N Engl J Med 2015;373:795–807.
8. Moyle GJ, Orkin C, Fisher M, et al. A randomized comparative trial of continued abacavir/lamivudine plus efavirenz or replacement with efavirenz/emtricitabine/tenofovir DF in hypercholesterolemic HIV-1 infected individuals. PloS One 2015;10:e0116297.
9. Mothe B, Perez I, Domingo P, et al. HIV-1 infection in subjects older than 70: a multicenter cross-sectional assessment in Catalonia, Spain. Curr HIV Res 2009;7:597–600.
10. Calvo M, Martinez E. Update on metabolic issues in HIV patients. Curr Opin HIV AIDS 2014;9:332–9.
11. Gillard BK, Raya JL, Ruiz-Esponda R, et al. Impaired lipoprotein processing in HIV patients on antiretroviral therapy: aberrant high-density lipoprotein lipids, stability, and function. Arterioscler Thromb Vasc Biol 2013;33:1714-21.
12. Aberg JA, Gallant JE, Ghanem KG, et al. Primary care guidelines for the management of persons infected with HIV: 2013 update by the HIV Medicine Association of the Infectious Diseases Society of America. Clin Infect Dis 2014;58:1–10.
13. Calza L, Colangeli V, Manfredi R, et al. Clinical management of dyslipidaemia associated with combination antiretroviral therapy in HIV-infected patients. J Antimicrob Chemother 2016;71:1451–65.
14. Friis-Moller N, Weber R, Reiss P, et al. Cardiovascular disease risk factors in HIV patients--association with antiretroviral therapy. Results from the DAD study. AIDS 2003;17:1179–93.
15. Husain NE, Ahmed MH. Managing dyslipidemia in HIV/AIDS patients: challenges and solutions. HIV/AIDS (Auckl) 2015;7:1–10.
16. Panel on Antiretroviral Guidelines for Adults and Adolescents. Guidelines for the use of antiretroviral agents in adults and adolescents living with HIV. Department of Health and Human Services. Accessed at www.aidsinfo.nih.gov/ContentFiles/AdultandAdolescentGL.pdf.
17. Sax PE, Wohl D, Yin MT, et al. Tenofovir alafenamide versus tenofovir disoproxil fumarate, coformulated with elvitegravir, cobicistat, and emtricitabine, for initial treatment of HIV-1 infection: two randomised, double-blind, phase 3, non-inferiority trials. Lancet 2015;385:2606–15.
18. Sax PE, Zolopa A, Brar I, et al. Tenofovir alafenamide vs. tenofovir disoproxil fumarate in single tablet regimens for initial HIV-1 therapy: a randomized phase 2 study. J Acquir Immune Defic Syndr 2014;67:52–8.
19. Eron JJ, Young B, Cooper DA, et al. Switch to a raltegravir-based regimen versus continuation of a lopinavir-ritonavir-based regimen in stable HIV-infected patients with suppressed viraemia (SWITCHMRK 1 and 2): two multicentre, double-blind, randomised controlled trials. Lancet 2010;375:396–407.
20. Quercia R, Roberts J, Martin-Carpenter L, Zala C. Comparative changes of lipid levels in treatment-naive, HIV-1-infected adults treated with dolutegravir vs. efavirenz, raltegravir, and ritonavir-boosted darunavir-based regimens over 48 weeks. Clin Drug Investig 2015;35:211–9.
21. Lennox JL, DeJesus E, Berger DS, et al. Raltegravir versus efavirenz regimens in treatment-naive hiv-1–infected patients: 96-week efficacy, durability, subgroup, safety, and metabolic analyses. J Acquir Immune Defic Syndr 2010;55:39–48.
22. Nayor M, Vasan RS. Recent update to the US cholesterol treatment guidelines. a comparison with international guidelines. Circulation 2016;133:1795–806.
23. Stone NJ, Robinson JG, Lichtenstein AH, et al. 2013 ACC/AHA guideline on the treatment of blood cholesterol to reduce atherosclerotic cardiovascular risk in adults: a report of the American College of Cardiology/American Heart Association Task Force on Practice Guidelines. J Am Coll Cardiol 2014;63:2889–934.
24. Mitka M. Exploring statins to decrease HIV-related heart disease risk. JAMA 2015;314:657–9.
25. Dube MP, Stein JH, Aberg JA, et al. Guidelines for the evaluation and management of dyslipidemia in human immunodeficiency virus (HIV)-infected adults receiving antiretroviral therapy: recommendations of the HIV Medical Association of the Infectious Diseases Society of America and the Adult AIDS Clinical Trials Group. Clin Infect Dis 2003;37:613–27.
26. Milazzo L, Menzaghi B, Corvasce S, et al. Safety of statin therapy in HIV/hepatitis C virus-coinfected patients. J Acquir Immune Defic Syndr 2007;46:258–60.
27. Hernandez-Romieu AC, Garg S, Rosenberg ES, et al. Is diabetes prevalence higher among HIV-infected individuals compared with the general population? Evidence from MMP and NHANES 2009-2010. BMJ Open Diab Res Care 2017;5:e000304.
28. Brown TT, Cole SR, Li X, et al. Antiretroviral therapy and the prevalence and incidence of diabetes mellitus in the multicenter AIDS cohort study. Arch Intern Med 2005;165:1179–84.
29. De Wit S, Sabin CA, Weber R, et al. Incidence and risk factors for new-onset diabetes in HIV-infected patients: the Data Collection on Adverse Events of Anti-HIV Drugs (D:A:D) study. Diabetes Care 2008;31:1224–9.
30. Rasmussen LD, Mathiesen ER, Kronborg G, et al. Risk of diabetes mellitus in persons with and without HIV: a Danish nationwide population-based cohort study. PloS One 2012;7:e44575.
31. Polsky S, Floris-Moore M, Schoenbaum EE, et al. Incident hyperglycaemia among older adults with or at-risk for HIV infection. Antivir Ther 2011;16:181–8.
32. Triant VA, Lee H, Hadigan C, Grinspoon SK. Increased acute myocardial infarction rates and cardiovascular risk factors among patients with human immunodeficiency virus disease. J Clin Endocrinol Metab 2007;92:2506–12.
33. Galli L, Salpietro S, Pellicciotta G, et al. Risk of type 2 diabetes among HIV-infected and healthy subjects in Italy. Eur J Epidemiol 2012;27:657–65.
34. Howard AA, Hoover DR, Anastos K, et al. The effects of opiate use and hepatitis C virus infection on risk of diabetes mellitus in the Women’s Interagency HIV Study. J Acquir Immune Defic Syndr 2010;54:152–9.
35. Butt AA, McGinnis K, Rodriguez-Barradas MC, et al. HIV infection and the risk of diabetes mellitus. AIDS 2009;23:1227–34.
36. Hadigan C, Kattakuzhy S. Diabetes mellitus type 2 and abnormal glucose metabolism in the setting of human immunodeficiency virus. Endocrin Metab Clin North Am 2014;43:685–96.
37. Butt AA, Fultz SL, Kwoh CK, Kelley D, et al. Risk of diabetes in HIV infected veterans pre- and post-HAART and the role of HCV coinfection. Hepatology 2004;40:115–9.
38. Veloso S, Escote X, Ceperuelo-Mallafre V, et al. Leptin and adiponectin, but not IL18, are related with insulin resistance in treated HIV-1-infected patients with lipodystrophy. Cytokine 2012;58:253–60.
39. Vigouroux C, Maachi M, Nguyen TH, et al. Serum adipocytokines are related to lipodystrophy and metabolic disorders in HIV-infected men under antiretroviral therapy. AIDS 2003;17:1503–11.
40. Palmer CS, Hussain T, Duette G, et al. Regulators of glucose metabolism in CD4+ and CD8+ T cells. Int Rev Immunol 2016;35:477–88.
41. Mehta SH, Moore RD, Thomas DL, et al. The effect of HAART and HCV infection on the development of hyperglycemia among HIV-infected persons. J Acquir Immune Defic Syndr 2003;33:577–84.
42. Monroe AK, Dobs AS, Xu X, et al. Sex hormones, insulin resistance, and diabetes mellitus among men with or at risk for HIV infection. J Acquir Immune Defic Syndr 2011;58:173–80.
43. Rotger M, Gsponer T, Martinez R, et al. Impact of single nucleotide polymorphisms and of clinical risk factors on new-onset diabetes mellitus in HIV-infected individuals. Clin Infect Dis 2010;51:1090–8.
44. Ledergerber B, Furrer H, Rickenbach M, et al. Factors associated with the incidence of type 2 diabetes mellitus in HIV-infected participants in the Swiss HIV Cohort Study. Clin Infect Dis 2007;45:111–9.
45. Hruz PW. Molecular mechanisms for insulin resistance in treated HIV-infection. Best practice & research. Clin Endocrin Metab 2011;25:459–68.
46. Brown TT, Li X, Cole SR, et al. Cumulative exposure to nucleoside analogue reverse transcriptase inhibitors is associated with insulin resistance markers in the Multicenter AIDS Cohort Study. AIDS 2005;19:1375–83.
47. Cossarizza A, Moyle G. Antiretroviral nucleoside and nucleotide analogues and mitochondria. AIDS 2004;18:137–51.
48. Lowell BB, Shulman GI. Mitochondrial dysfunction and type 2 diabetes. Science 2005;307:384-7.
49. McComsey GA, Paulsen DM, Lonergan JT, et al. Improvements in lipoatrophy, mitochondrial DNA levels and fat apoptosis after replacing stavudine with abacavir or zidovudine. AIDS 2005;19:15–23.
50. Venhoff N, Setzer B, Melkaoui K, Walker UA. Mitochondrial toxicity of tenofovir, emtricitabine and abacavir alone and in combination with additional nucleoside reverse transcriptase inhibitors. Antivir Ther 2007;12:1075–85.
51. Haubrich RH, Riddler SA, DiRienzo AG, et al. Metabolic outcomes in a randomized trial of nucleoside, nonnucleoside and protease inhibitor-sparing regimens for initial HIV treatment. AIDS 2009;23:1109–18.
52. Aberg JA, Tebas P, Overton ET, et al. Metabolic effects of darunavir/ritonavir versus atazanavir/ritonavir in treatment-naive, HIV type 1-infected subjects over 48 weeks. AIDS Res Hum Retrovir 2012;28:1184–95.
53. Overton ET, Tebas P, Coate B, et al. Effects of once-daily darunavir/ritonavir versus atazanavir/ritonavir on insulin sensitivity in HIV-infected persons over 48 weeks: results of an exploratory substudy of METABOLIK, a phase 4, randomized trial. HIV Clin Trials 2016;17:72–7.
54. Sattar N, Preiss D, Murray HM, et al. Statins and risk of incident diabetes: a collaborative meta-analysis of randomised statin trials. Lancet 2010;375:735–42.
55. McComsey G, Jiang Y, Erlandson KM, et al. Rosuvastatin improves hip bone mineral density but worsens insulin resistance. Boston, MA: Conference on Retroviruses and Opportunistic Infections; 2014.
56. Lichtenstein K DR, Wood K, et al. Statin use is associated with incident diabetes mellitus among patients in the HIV Outpatient Study. Atlanta, GA: Conference on Retroviruses and Opportunistic Infections; 2013.
57. Spagnuolo V GL, Poli A, et al. Association between statin use and type 2 diabetes mellitus occurrence among HIV-1+ patients receiving ART. Atlanta, GA: Conference on Retroviruses and Opportunistic Infections; 2013.
58. Wang KL, Liu CJ, Chao TF, et al. Statins, risk of diabetes, and implications on outcomes in the general population. J Am Coll Cardiol 2012;60:1231–8.
59. Ridker PM, Pradhan A, MacFadyen JG, et al. Cardiovascular benefits and diabetes risks of statin therapy in primary prevention: an analysis from the JUPITER trial. Lancet 2012;380:565–71.
60. Bloomgarden ZT, Handelsman Y. Approaches to treatment 2: Comparison of American Association of Clinical Endocrinologists (AACE) and American Diabetes Association (ADA) type 2 diabetes treatment guidelines. J Diabetes 2016;8:4–6.
61. Kim PS, Woods C, Georgoff P, et al. A1C underestimates glycemia in HIV infection. Diabetes Care 2009;32:1591–3.
62. Diop ME, Bastard JP, Meunier N, et al. Inappropriately low glycated hemoglobin values and hemolysis in HIV-infected patients. AIDS Res Hum Retrovir 2006;22:1242–7.
63. Polgreen PM, Putz D, Stapleton JT. Inaccurate glycosylated hemoglobin A1C measurements in human immunodeficiency virus-positive patients with diabetes mellitus. Clin Infect Dis 2003;37:e53–56.
64. Glesby MJ, Hoover DR, Shi Q, et al. Glycated haemoglobin in diabetic women with and without HIV infection: data from the Women’s Interagency HIV Study. Antivir Ther 2010;15:571–7.
65. Slama L, Palella FJ Jr, Abraham AG, et al. Inaccuracy of haemoglobin A1c among HIV-infected men: effects of CD4 cell count, antiretroviral therapies and haematological parameters. J Antimicrob Chemother 2014;69:3360–7.
66. Inzucchi SE, Bergenstal RM, Buse JB, et al. Management of hyperglycaemia in type 2 diabetes: a patient-centered approach. Position statement of the American Diabetes Association (ADA) and the European Association for the Study of Diabetes (EASD). Diabetologia 2012;55:1577–96.
67. Look ARG, Pi-Sunyer X, Blackburn G, et al. Reduction in weight and cardiovascular disease risk factors in individuals with type 2 diabetes: one-year results of the look AHEAD trial. Diabetes Care 2007;30:1374–83.
68. Hajjar J, Habra MA, Naing A. Metformin: an old drug with new potential. Expert Opin Investig Drugs 2013;22:1511–7.
69. Kohli R, Shevitz A, Gorbach S, Wanke C. A randomized placebo-controlled trial of metformin for the treatment of HIV lipodystrophy. HIV Med 2007;8:420–6.
70. Tivicay prescribing information. Accessed at www.gsksource.com/pharma/content/dam/GlaxoSmithKline/US/en/Prescribing_Information/Tivicay/pdf/TIVICAY-PI-PIL.PDF.
71. Han JH, Gordon K, Womack JA, et al. Comparative effectiveness of diabetic oral medications among HIV-infected and HIV-uninfected veterans. Diabetes Care 2017;40:218–25.
72. Brown TT, Qaqish RB. Antiretroviral therapy and the prevalence of osteopenia and osteoporosis: a meta-analytic review. AIDS 2006;20:2165–74.
73. Libois A, Clumeck N, Kabeya K, et al. Risk factors of osteopenia in HIV-infected women: no role of antiretroviral therapy. Maturitas 2010;65:51–4.
74. Carr A, Grund B, Neuhaus J, et al. Prevalence of and risk factors for low bone mineral density in untreated HIV infection: a substudy of the INSIGHT Strategic Timing of AntiRetroviral Treatment (START) trial. HIV Med 2015;16 Suppl 1:137–46.
75. Triant VA, Brown TT, Lee H, Grinspoon SK. Fracture prevalence among human immunodeficiency virus (HIV)-infected versus non-HIV-infected patients in a large U.S. healthcare system. J Clin Endocrinol Metab 2008;93:3499–504.
76. Young B, Dao CN, Buchacz K, Baker R, Brooks JT, Investigators HIVOS. Increased rates of bone fracture among HIV-infected persons in the HIV Outpatient Study (HOPS) compared with the US general population, 2000-2006. Clin Infect Dis 2011;52:1061–8.
77. Rodriguez M, Daniels B, Gunawardene S, Robbins GK. High frequency of vitamin D deficiency in ambulatory HIV-Positive patients. AIDS Res Hum Retrovir 2009;25:9–14.
78. Teichmann J, Lange U, Discher T, et al. Bone mineral density in human immunodeficiency virus-1 infected men with hypogonadism prior to highly-active-antiretroviral-therapy (HAART). Eur J Med Res 2009;14:59–64.
79. Lo Re V 3rd, Volk J, Newcomb CW, et al. Risk of hip fracture associated with hepatitis C virus infection and hepatitis C/human immunodeficiency virus coinfection. Hepatology 2012;56:1688–98.
80. Maalouf NM, Zhang S, Drechsler H, et al. Hepatitis C co-infection and severity of liver disease as risk factors for osteoporotic fractures among HIV-infected patients. J Bone Miner Res 2013;28:2577–83.
81. Byrne DD, Newcomb CW, Carbonari DM, et al. Increased risk of hip fracture associated with dually treated HIV/hepatitis B virus coinfection. J Viral Hepat 2015;22:936–47.
82. Gilsanz V, Chalfant J, Mo AO, et al. Reciprocal relations of subcutaneous and visceral fat to bone structure and strength. J Clin Endocrinol Metab 2009;94:3387–93.
83. Rosen CJ, Klibanski A. Bone, fat, and body composition: evolving concepts in the pathogenesis of osteoporosis. Am J Med 2009;122:409–14.
84. Fakruddin JM, Laurence J. HIV envelope gp120-mediated regulation of osteoclastogenesis via receptor activator of nuclear factor kappa B ligand (RANKL) secretion and its modulation by certain HIV protease inhibitors through interferon-gamma/RANKL cross-talk. J Biol Chem 2003;278:48251–8.
85. Gazzola L, Bellistri GM, Tincati C, et al. Association between peripheral T-Lymphocyte activation and impaired bone mineral density in HIV-infected patients. J Transl Med 2013;11:51.
86. Clerici M, Shearer GM. A TH1-->TH2 switch is a critical step in the etiology of HIV infection. Immunol Today 1993;14:107–11.
87. Chew N, Tan E, Li L, Lim R. HIV-1 tat and rev upregulates osteoclast bone resorption. J Int AIDS Soc 2014;17(4 Suppl 3):19724.
88. McComsey GA, Tebas P, Shane E, et al. Bone disease in HIV infection: a practical review and recommendations for HIV care providers. Clin Infect Dis 2010;51:937–46.
89. Panayiotopoulos A, Bhat N, Bhangoo A. Bone and vitamin D metabolism in HIV. Rev Endocr Metab Disord 2013;14:119–25.
90. Fakruddin JM, Laurence J. Interactions among human immunodeficiency virus (HIV)-1, interferon-gamma and receptor of activated NF-kappa B ligand (RANKL): implications for HIV pathogenesis. Clin Exp Immunol 2004;137:538–45.
91. Li Y, Toraldo G, Li A, et al. B cells and T cells are critical for the preservation of bone homeostasis and attainment of peak bone mass in vivo. Blood 2007;109:3839–48.
92. Finkelstein JS, Brockwell SE, Mehta V, et al. Bone mineral density changes during the menopause transition in a multiethnic cohort of women. J Clin Endocrinol Metab 2008;93:861–8.
93. Huang JS, Hughes MD, Riddler SA, Haubrich RH, Aids Clinical Trials Group AST. Bone mineral density effects of randomized regimen and nucleoside reverse transcriptase inhibitor selection from ACTG A5142. HIV Clin Trials 2013;145:224–34.
94. McComsey GA, Kitch D, Daar ES, et al. Bone mineral density and fractures in antiretroviral-naive persons randomized to receive abacavir-lamivudine or tenofovir disoproxil fumarate-emtricitabine along with efavirenz or atazanavir-ritonavir: Aids Clinical Trials Group A5224s, a substudy of ACTG A5202. J Infect Dis 2011;203:1791–801.
95. Schafer JJ, Manlangit K, Squires KE. Bone health and human immunodeficiency virus infection. Pharmacotherapy 2013;33:665–82.
96. Mateo L, Holgado S, Marinoso ML, et al. Hypophosphatemic osteomalacia induced by tenofovir in HIV-infected patients. Clin Rheumatol 2016;35:1271–9.
97. Brown TT, Moser C, Currier JS, et al. Changes in bone mineral density after initiation of antiretroviral treatment with tenofovir disoproxil fumarate/emtricitabine plus atazanavir/ritonavir, darunavir/ritonavir, or raltegravir. J Infect Dis 2015;212:1241–9.
98. Ofotokun I, Titanji K, Vikulina T, et al. Role of T-cell reconstitution in HIV-1 antiretroviral therapy-induced bone loss. Nat Commun 2015;6:8282.
99. Ofotokun I, Titanji K, Vunnava A, et al. Antiretroviral therapy induces a rapid increase in bone resorption that is positively associated with the magnitude of immune reconstitution in HIV infection. AIDS 2016;30:405–14.
100. Stephens KI, Rubinsztain L, Payan J, et al. Dual-energy x-ray absorptiometry and calculated FRAX risk scores may underestimate osteoporotic fracture risk in vitamin d-deficient veterans with HIV infection. Endocr Pract 2016;22:440–6.
101. Mirza F, Canalis E. Management of endocrine disease: Secondary osteoporosis: pathophysiology and management. Eur J Endocrinol 2015;173:R131–151.
102. Brown TT, Hoy J, Borderi M, et al. Recommendations for evaluation and management of bone disease in HIV. Clin Infect Dis 2015;60:1242–51.
103. Mazzotta E, Ursini T, Agostinone A, et al. Prevalence and predictors of low bone mineral density and fragility fractures among HIV-infected patients at one Italian center after universal DXA screening: sensitivity and specificity of current guidelines on bone mineral density management. AIDS Patient Care STDS 2015;29:169–80.
104. Calmy A, Chevalley T, Delhumeau C, et al. Long-term HIV infection and antiretroviral therapy are associated with bone microstructure alterations in premenopausal women. Osteoporos Int 2013;24:1843–52.
105. Yin MT, Lund E, Shah J, et al. Lower peak bone mass and abnormal trabecular and cortical microarchitecture in young men infected with HIV early in life. AIDS 2014;28:345–53.
106. Lo Re V, 3rd, Lynn K, Stumm ER, et al. Structural bone deficits in HIV/HCV-coinfected, HCV-monoinfected, and HIV-monoinfected women. J Infect Dis 2015;212:924–33.
107. Allavena C, Delpierre C, Cuzin L, et al. High frequency of vitamin D deficiency in HIV-infected patients: effects of HIV-related factors and antiretroviral drugs. J Antimicrob Chemother 2012;67:2222–30.
108. Holick MF, Binkley NC, Bischoff-Ferrari HA, et al. Evaluation, treatment, and prevention of vitamin D deficiency: an Endocrine Society clinical practice guideline. J Clin Endocrinol Metab 2011;96:1911–30.
109. Mondy K, Powderly WG, Claxton SA, et al. Alendronate, vitamin D, and calcium for the treatment of osteopenia/osteoporosis associated with HIV infection. J Acquir Immune Defic Syndr 2005;38:426–31.
110. McComsey GA, Kendall MA, Tebas P, et al. Alendronate with calcium and vitamin D supplementation is safe and effective for the treatment of decreased bone mineral density in HIV. AIDS 2007;21:2473–82.
111. Guaraldi G, Orlando G, Madeddu G, et al. Alendronate reduces bone resorption in HIV-associated osteopenia/osteoporosis. HIV Clin Trials 2004;5:269–77.
112. Negredo E, Bonjoch A, Perez-Alvarez N, et al. Comparison of two different strategies of treatment with zoledronate in HIV-infected patients with low bone mineral density: single dose versus two doses in 2 years. HIV Med 2015;16:441–8.
113. Bolland MJ, Grey A, Horne AM, et al. Effects of intravenous zoledronate on bone turnover and bone density persist for at least five years in HIV-infected men. J Clin Endocrinol Metab 2012;97:1922–8.
114. Pinzone MR, Moreno S, Cacopardo B, Nunnari G. Is there enough evidence to use bisphosphonates in HIV-infected patients? A systematic review and meta-analysis. AIDS Rev 2014;16:213–22.
115. Ofotokun I, Titanji K, Lahiri CD, et al. A Single-dose zoledronic acid infusion prevents antiretroviral therapy-induced bone loss in treatment-naive HIV-infected patients: a phase IIb trial. Clin Infect Dis 2016;63:663–71.
116. Lewiecki EM, Gordon CM, Baim S, et al. International Society for Clinical Densitometry 2007 adult and pediatric official positions. Bone 2008;43:1115–21.
From the University of Connecticut School of Medicine, Farmington, CT.
Abstract
- Objective: To review the metabolic complications of HIV infection.
- Methods: Review of the literature in the context of 3 clinical cases.
- Results: People with HIV infection are living longer thanks to the advent of potent antiretroviral therapy. This has led to increased incidence of age-related metabolic complications, including a higher risk of cardiovascular disease, hyperlipidemia, metabolic syndrome, and osteoporosis. Appropriate management of these complications requires an understanding of disease-related and drug-related side effects as well as the potential for drug-drug interactions. A multidisciplinary approach to patient management is most effective.
- Conclusion: Awareness of the metabolic complications frequently encountered in HIV infection, drug interactions, and possible toxicities is critical to the successful management of HIV-infected individuals.
Key words: HIV; antiretroviral therapy; hyperlipidemia; metabolic syndrome; diabetes; hypogonadism.
According to the most recent data from the Joint United Nations Programme on HIV/AIDS (UNAIDS), 36 million people worldwide are living with HIV/AIDS, with 18 million accessing effective antiretroviral therapy (ART) [1]. The past 2 decades have witnessed enormous advances in the field from prevention to diagnosis and therapeutics, and modern ART largely allows HIV-infected persons to live near-normal life spans [2,3]. However, from the beginning of the epidemic, HIV-infected persons on effective therapy have suffered from myriad metabolic consequences, many of which affect quality of life and result in excess mortality [4]. It is also true that untreated HIV infection portends an increased risk of metabolic complications, likely related to abnormal immune activation, as demonstrated in structured interruption trials [5,6]. It is worth noting, however, that while many of these metabolic dyscrasias and associated risks have historically been attributed primarily to the treatment of HIV infection with ART, data from cohort studies and randomized clinical trials have repeatedly demonstrated significant reductions in morbidity and mortality when ART is initiated early [7]. In this paper, we review HIV-related metabolic complications frequently encountered in clinical practice (hyperlipidemia, diabetes, and bone disease) and best practice considerations in the context of 3 clinical cases.
Case Patient 1
Initial Presentation and History
A 58-year-old male with a history of hypertension and mixed hyperlipidemia is referred for evaluation of newly diagnosed HIV infection. He has no history of intravenous drug use but has had multiple male and female sex partners in the past few years, and requested testing after a partner tested positive. His last negative test was 2 years ago. The patient does not smoke cigarettes. Overall he feels well and tolerates his regimen of lisinopril 10 mg and simvastatin 20 mg daily. On initial evaluation, his exam is unremarkable other than subtle white plaques on the dorsal surface of the tongue and buccal mucosa, and moderate central obesity. Vital signs including blood pressure are normal. Initial laboratory evaluation reveals a CD4 cell count of 150 cells/mm3 and an HIV RNA level of 200,000 copies/mL. Fasting serum total cholesterol is 220 mg/dL, triglycerides 250 mg/dL, LDL 170 mg/dL, and HDL 35 mg/dL. Serum BUN, creatinine, and liver function testing results are normal.
What initial regimen might be recommended based on the status of his HIV infection and comorbidities?
The most recent iteration of the US Department of Health and Human Services (DHHS) guidelines on use of antiretroviral agents (ARVs) in HIV recommends an initial ART regimen that includes a backbone of 2 nucleoside reverse transcriptase inhibitors (NRTIs), generally tenofovir disoproxil fumarate or tenofovir alafenamide, abacavir (ABC), emtricitabine (FTC), or lamivudine (3TC) [2]. To this backbone should be added a third agent; the majority of those currently recommended are integrase strand transfer inhibitors (INSTIs) (dolutegravir, elvitegravir, raltegravir); one recommended protease inhibitor (PI) (ritonavir-boosted darunavir) is also an option. Some of these initial recommended regimens are available as fixed-dosed combinations in 1 pill, making them attractive options.
The latest guidelines also clearly recommend starting ART in all HIV-infected individuals, irrespective of CD4 count. The patient described above has a very low CD4 count, so there is no question he needs to begin therapy promptly. Given his low CD4 count and relatively high viral load, one may consider a ritonavir-boosted PI as perhaps the most robust option and with a relatively high barrier to resistance development, in contrast to other options. Assuming the patient’s baseline resistance testing reveals a fully sensitive wild-type virus without meaningful resistance mutations, he will begin a regimen of TDF/FTC plus ritonavir-boosted darunavir, 3 pills once daily. Given his low CD4 count (below 200 cells/mm3), he will also need prophylaxis for Pneumocystis jirovecii pneumonia, in the form of trimethoprim/sulfamethoxazole (TMP/SMX) daily. Given the potential for interaction between the boosted PI and simvastatin, his lipid-lowering agent is switched to atorvastatin 10 mg daily.
What is the association between hyperlipidemia and HIV infection and treatment?
Hyperlipidemia represents a key modifiable risk factor for the development of cardiovascular disease (CVD) in HIV-infected individuals [8]. Indeed, a multicenter cross-sectional study of older HIV-infected individuals performed in Spain revealed a 54% prevalence of dyslipidemia and 23% CVD [9]. Most experts believe that metabolic abnormalities observed in HIV-infected individuals are the result of a combination of factors: those resulting from abnormal immune activation and inflammation related to viral replication, and those related to certain ARVs [10].
Early after HIV seroconversion, decline in HDL is one of the first proatherogenic changes observed. This, along with increased triglyceride and LDL levels, likely contribute to increased risk of CVD in this population. Increased microbial translocation, evidenced by increased levels of lipopolysaccharide (LPS), may drive immune activation, leading to dyslipidemia via a multitude of hypothesized mechanisms [4]. It has been theorized that HDL lipoproteins are less stable on ART, leading to potentially impaired plasma lipolytic activities or hepatic cholesteryl ester uptake [6,11]. Increased VLDL from release of free fatty acids may lead to higher triglyceride levels and triglyceride-rich LDL and HDL, all associated with increased risk of CVD [11].
In terms of effects of specific ARV classes, although newer agents have less of a propensity to cause dyslipidemia, the PI class arguably remains most problematic. In comparison to other classes, the PIs tend to result in greater increases in triglycerides, total cholesterol, and LDL, and have frequent drug-drug interactions with lipid-lowering agents [10,12]. Estimated prevalence of dyslipidemia in patients receiving PI therapy varies from 28% to 80% [13]. The prospective multinational cohort Data collection on Adverse events of Anti-HIV Drugs (DAD) study found significantly higher rates of hypertriglyceridemia, hypercholesterolemia, and low HDL in patients on PIs in comparison to non–nucleoside reverse transcriptase inhibitors (NNRTIs) [14]. Various mechanisms have been proposed to explain the PIs adverse effects on lipids, including inhibition of lipogenesis and adipocyte differentiation, decreased hepatocyte clearance of chylomicrons and VLDL, and increased hepatic synthesis of triglycerides [15]. Of the available PIs, atazanavir and darunavir have less potential to lead to dyslipidemia [10], while lopinavir/ritonavir, fosamprenavir, and tipranavir may have the highest [13]. Of the NNRTIs, efavirenz is most frequently associated with dyslipidemia, specifically increased triglycerides and total cholesterol [13]. However, these increased values seen on efavirenz therapy may be offset by relative increases in HDL, with little resultant effect on the total cholesterol:HDL ratio. Rilpivirine, etravirine, and nevirapine are relatively less likely to drive lipid changes, although certain drug interactions are important to recognize in clinical practice, such as the interaction between rilpivirine and proton pump inhibitors [2,13,16]. It is also worth noting that no NNRTIs are included in current guidelines as preferred therapy [2].
Historically, the thymidine analogue NRTIs (stavudine, didanosine, zidovudine) have been associated with lipid dyscrasias and lipoatrophy, but fortunately these are no longer used frequenty except in cases requiring deep salvage therapy for highly treatment-experienced patients. Two newer NRTIs, tenofovir and abacavir, have relatively neutral to favorable effects on lipids. The combination of tenofovir disoproxil (TDF) and emtricitabine (trade name Truvada) was associated with significantly lower triglycerides, total cholesterol and LDL than other NRTI pairs [6]. TDF has been postulated to have lipid-lowering effects. Switch studies in which patients were taken off thymidine analogues and placed on TDF, demonstrated recovery of limb fat in patients with lipoatrophy, and those switched off abacavir-based ART to TDF showed statistically significant lower fasting total cholesterol at week 12, without differences of viral suppression [8]. Tenofovir alafenamide (TAF) is a next-generation prodrug of tenofovir that results in improved stability in plasma and higher intracellular levels in comparison to TDF [17]. Although randomized controlled trials of TAF vs TDF-based ARV regimens have suggested statistically higher total cholesterol, serum HDL is also increased resulting in unchanged total:HDL ratios and no differences in risk classifications [18]. Integrase inhibitors (INSTI) now represent first-line therapy in combination with an NRTI backbone, and since their availability in 2007 have been evaluated in comparison to various PIs and NNRTIs. Both raltegravir and dolutegravir have consistently shown broad neutral effects on lipids and are among the most metabolically friendly agents available [19–21]. Because it is given in fixed-dose combination with non-ritonavir pharmacologic booster cobicistat, elvitegravir has effects similar to ritonavir-boosted PIs on lipids [6].
What are management considerations in the treatment of hyperlipidemia in HIV-infected patients?
Patients with HIV and hyperlipidemia may benefit from lipid-lowering therapy in addition to ART, although in certain cases appropriate switches may make a difference. Careful consideration of drug interactions between ARVs and lipid-lowering agents, in addition to ARV history and known drug resistance, is warranted prior to selecting a regimen in these patients. In addition, the latest American College of Cardiology/American Heart Association guidelines suggest evaluating 10-year risk of atherosclerotic cardiovascular disease (ASCVD) using the pooled cohort equation to determine the type and dose of statin required (moderate vs high intensity) [22]. It is noteworthy that HIV infection and its therapies are not taken into account as potential risk factors in this model. Primary prevention in non-diabetic patients with a statin is recommended for patients with a 10-year absolute risk of ≥ 7.5% [22]. This patient’s risk is estimated at between 12% and 13% based on this equation, so primary prevention with a moderate-or high-intensity statin is recommended (Table 1) [23]. Data from more than 80,000 patients in the Veterans Aging Cohort Study (VACS) showed that HIV-infected patients with no baseline ASCVD had 50% increased risk of acute myocardial infarction when compared to HIV-uninfected patients over 6 years of follow-up [24]. Thus, consideration of the virus itself or its therapy as an additional risk factor may be valid.
Screening and Monitoring of Hyperlipidemia
The most recent iteration of the DHHS primary care guidelines for the management of HIV-infected individuals recommends obtaining fasting (ideally 12 hours) lipid profiles upon initiation of care, and within 1 to 3 months of beginning therapy [12,13]. These initial levels, along with other elements of the patient’s history and calculation of risk may help determine whether lipid-lowering therapy is indicated, and if so, which therapy would be best. In general, after regimen switches or additions of either ARV or statin therapy, repeating fasting lipid levels 6 weeks later is recommended to gauge the effects of the switch. This is especially critical when interactions between ARVs and lipid-lowering therapies are possible. Some experts recommend performing annual screening of patients with normal baseline lipids or with well-controlled hyperlipidemia on therapy. Assessment of 10-year ASCVD risk is also recommended annually, in addition to baseline risk assessment, to determine the need and appropriateness of statin therapy [25]. The question of primary prevention in HIV has yet to be definitively answered. Small studies in this population have demonstrated that statins have the potential to slow progression of carotid intima media thickness and reduce noncalcified plaque volume [24]. An NIH/AIDS Clinical Trial Group–sponsored randomized clinical trial (“REPRIEVE”) is currently underway to address this question. More than 6000 HIV-infected men and women with no history of ASCVD at 100 sites in several countries are enrolled to assess the benefit of pitavastatin as primary prevention in this risk group [24]. Metabolized via glucuronidation primarily, as opposed to cytochrome p450 (CYP 3A4 isoenzyme), pitavastatin is thought to have fewer drug interactions with ARVs in general [6] (Table 2).
Relevant Drug-Drug Interactions
Deciding which statin to begin in HIV-infected patients depends on whether moderate- or high-intensity therapy is warranted and whether the potential for drug interaction with ARVs exists. Table 2 [6,12] depicts available statins and the potential for pharmacokinetic interaction with the primary ARV classes. Simvastatin and lovastatin are heavily metabolized via the CYP 3A4 pathway, resulting in the highest potential risk of interaction with CYP 3A4 inhibitors, such as the PIs, or inducers (eg, NNRTIs, in particular efavirenz) [6]. The former may inhibit metabolism of these statins, resulting in increased risk of toxicity, while co-administration with efavirenz, for example, may result in inadequate serum concentration and therefore inadequate lipid-lowering effects. Although less lipophilic, atorvastatin results in similar interactions with PIs and NNRTIs, and therefore low starting doses with close monitoring is recommended [6]. Fewer interactions have been noted with rosuvastatin, pravastatin, and pitavastatin, as these do not require CYP 3A4 for their metabolism and are thus less likely to be affected by ARVs. These therefore represent potentially safer first choices for certain patients on ARVs, although of these, only rosuvastatin is classified as a high-intensity statin [22,23] (Table 1). When compared directly to pravastatin 40 mg daily in patients receiving ritonavir-boosted PIs, rosuvastatin performed superiorly at 10 mg per day, resulting in more significant reductions in LDL and triglyceride levels [15]. Although it is eliminated largely unchanged through the kidney and liver, pravastatin has been reported to idiosyncratically interact with darunavir, resulting in potentially increased pravastatin levels and associated toxicity [25]. Treatment of pure hypertriglyceridemia in HIV-infected patients should begin with fibrates, which have little to no risk of interaction with most clinically relevant ARVs [6,10]. Alternatives to lower triglycerides include niacin and N-3 polyunsaturated fatty acids [25].
Case 1 Continued
The patient has an impressive response to his initial regimen of TDF/FTC plus boosted darunavir, with repeat CD4 count after 12 weeks of 275 (18%) cells/mm3 and an undetectable viral load (< 20 copies/mL). Other lab parameters are favorable and he is tolerating the regimen well without notable side effects. However, at his next visit, although his viral load remains undetectable, his triglyceride level has increased to 350 mg/dL, although other lipid parameters are comparable to the prior result. He complains of diffuse body aches, concentrated in large muscle groups of the extremities, and dark-colored urine. A creatine phosphokinase (CPK) level is elevated at 300 IU/L (normal, 22–269, negative MB fraction). Serum creatinine is 1.4 mg/dL (had been 1.1 mg/dL at baseline). Given he has done so well otherwise on these ARVs, he is reluctant to make any changes.
What drug-drug interaction is most likely causing this patient's problem, and how should it be managed?
This scenario is not uncommon in clinical practice, and changes to regimens are sometimes necessary in order to avoid drug interactions. Care must be taken to thoroughly review antiretroviral history and available resistance testing (in this case a relatively short history) in order to ensure a fully active and suppressive regimen is chosen. This description could be the result of an interaction between lipid-lowering therapy and ARVs resulting in increased relative concentrations of one drug or the other and therefore leading to toxicity. Given this possibility, and suboptimal control of hyperlipidemia, consideration should be given to switching both his ART and his statin therapy.
Safety and Potential Toxicities of Lipid-Lowering Therapy
Increased serum concentration of certain statins when co-administered with CYP 3A4 inhibitors like the PIs leads to heightened risk of statin-associated toxicities. In general, this includes muscle inflammation, leading to increases in serum CPK level and associated symptoms, including myalgias, myositis, or in extreme cases, rhabdomyolysis [6]. Although rare, this toxicity can be serious and may lead to acute renal injury if not recognized and managed appropriately. In theory, the potential for statin-associated hepatotoxicity may also be increased in patients receiving PIs, although this has not been borne out in clinical trials [26]. In fact, quite the opposite may be true, in that statins have been shown to improve liver function in patients with hepatitis C virus (HCV) coinfection and with nonalcoholic fatty liver disease [6,15].
Case 1 Conclusion
The patient does well on his new ARV regimen of TAF/FTC and dolutegravir, 2 pills once daily. He no longer requires TMP/SMX, as his CD4 count has been reliably above 200 cells/mm3 on several occasions. Serum creatinine is back down to baseline and CPK has normalized. Fasting lipids have improved since the switch, and he no longer has symptoms of myositis on rosuvastatin 10 mg daily.
Summary
Consideration of statin therapy is complicated by potential drug interactions with ARVs and associated toxicity. However, given known effects of ARVs on lipids, and of immune activation and inflammation related to the virus itself, these patients should be carefully evaluated for statin therapy for their anti-inflammatory and immune modulatory effects as much as for their lipid-lowering ability. Utilization of HIV infection and its therapies as additional cardiovascular risk factors when calculating 10-year risk deserves further consideration; forthcoming results of the REPRIEVE trial are certain to contribute valuable information to this field of study.
Case Patient 2
Initial Presentation and History
A 45-year-old female with history of HIV infection since 2008 presents to the office for new-onset diabetes, diagnosed 2 weeks ago. She has had symptoms of polyuria and polydipsia for the last 1 month. She denies diarrhea, nausea, vomiting or weight loss. She is currently on a regimen consisting of zidovudine/lamivudine plus lopinavir/ritonavir. There is no family history of diabetes. Her examination is unremarkable, including normal vital signs (weight 150 lb, blood pressure 114/70, heart rate 76) and no evidence of insulin resistance, including acanthosis nigricans or striae. Glycosylated hemoglobin level (HbA1c) is 8%. Creatinine and liver function tests are within reference ranges.
Do HIV-infected patients have a higher incidence of type 2 diabetes mellitus (DM)?
Prevalence of type 2 DM in HIV-infected patients varies between 2% to 14% [27]. This variation is due to the different cutoffs used for diagnosis, differences in cohorts studied, and how risk factors are analyzed [28–31]. In a recent nationally representative estimate of DM prevalence among HIV-infected adults receiving medical care in the United States in 2009–2010, the prevalence of DM was noted to be 10.3%. In comparison to the general adult US population, HIV-infected individuals have a 3.8% higher prevalence of DM after adjusting for age, sex, race/ethnicity, education, poverty-level, obesity, and HCV infection [27].
There is controversy over whether HIV infection itself increases the risk of type 2 DM, with some studies showing increased risk [28,32,33] and others showing no independent effect or an inverse effect [30,34,35]. Studies on the impact of ethnicity and race on prevalence of DM are limited [36].
Certain traditional risk factors (age, ethnicity, obesity) are still responsible for most of the increased risk of diabetes in the HIV-infected population [35,37]. HIV infection itself is associated with metabolic dysfunction, independent of ARV. In HIV-infected patients, impaired glucose metabolism is associated with altered levels of adipokines, increased adiponectin and soluble-tumor necrosis factor receptor 1 (sTNFR1) and decreased leptin [38,39]. HIV-associated alterations in CD4+ and CD8+ T cell function also impair glycolysis, which may adversely impact glucose metabolism [40].
Other contributing factors in HIV-infected patients are HCV co-infection [41], medications (atypical antipsychotics, corticosteroids), opiates, and low testosterone [42]. HCV co-infection may lead to hepatic steatosis and liver fibrosis, and increasing insulin resistance.
Recent genomic studies show several common single-nucleotide polymorphisms (SNPs) associated with diabetes in the general population. In the Swiss HIV Cohort Study, SNPs accounted for 14% of type 2 DM risk variability, whereas ARV exposure accounted for 3% and age for 19% of the variability in DM [43].
ARVs also increase the risk of type 2 DM by both direct and indirect effects. Certain ARVs causes lipoatrophy [30] and visceral fat accumulation/lipohypertrophy [29,44]. PIs increase insulin resistance via effects on GLUT-4 transporter and decrease insulin secretion through effects on B cell function [45]. NRTIs (eg, stavudine, zidovudine and didanosine) can cause direct mitochondrial toxicity [46–48]. Utilization of newer ARV agents has decreased the prevalence of severe lipoatrophy, but lipohypertrophy and the underlying metabolic abnormalities persist. The DHHS “preferred” nucleoside analogues, tenofovir and abacavir, do not induce mitochondrial toxicity and have more favorable metabolic profiles [49,50]. In ACTG Study 5142, thymidine-sparing regimens were found to cause less lipoatrophy [51]. In addition, darunavir and atazanavir, the preferred and alternative PIs and the integrase strand transfer inhibitor have limited or modest impact on insulin sensitivity [20,52,53]. This has led to a recent decline in the incidence of type 2 DM in HIV-infected patients.
Statins can also increase insulin resistance and DM [54], although studies have shown mixed results [55–57]. The benefits of statin therapy likely outweigh the risk of DM since there is a significant cardiovascular event reduction with their use [58,59].
How is diabetes diagnosed in HIV-infected patients?
Optimal diabetes screening guidelines have not been established specifically for HIV-infected patients. The American Diabetes Association (ADA) guidelines recommend that diabetes in the general population be diagnosed by 2 elevated fasting blood glucose levels, HbA1c, oral glucose tolerance test (OGTT), or high random glucose with classic symptoms of hyperglycemia [60]. Repeat testing is recommended every 3 years. The OGTT is recommended for diagnosis in pregnant women.
HbA1c may underestimate glycemic burden in HIV-infected individual due to higher mean corpuscular volume, NRTI use (specifically abacavir), or lower CD4 count [61–65]. The Infectious Diseases Society of America (IDSA) 2013 primary care guidelines for HIV-infected patients recommends obtaining a fasting glucose and/or HbA1c prior to and within 1–3 months after starting ARV [12]. Use of HbA1c threshold cutoff of 5.8% for the diagnosis of DM and testing every 6–12 months are recommended.
How should this patient’s diabetes be managed?
The ADA guidelines suggest a patient-centered approach to management of diabetes [66]. All patients should be educated about lifestyle modifications with medical nutrition therapy and moderate-intensity aerobic activity and weight loss [67]. If a patient is on lopinavir/ritonavir or a thymidine analogue (zidovudine, stavudine), one should consider switching the ARV regimen [2].
There are currently no randomized controlled trials of diabetes treatment specific to patients with HIV infection. Metformin is the first-line agent. It improves insulin sensitivity by reducing hepatic glucose production and improving peripheral glucose uptake and lipid parameters [68,69]. Other oral hypoglycemic agents used in the treatment of type 2 diabetes are shown in Table 3.
Case 2 Continued
The patient is switched to TAF/FTC plus dolutegravir with improvement in blood sugars. She is also started on metformin. Co-administration of metformin and dolutegravir will be carefully monitored since dolutegravir increases metformin concentration [70]. When dolutegravir is used with metformin, the total daily dose of metformin should be limited to 1000 mg.
• How should this patient be followed?
If the patient is still not at goal HbAb1c at follow-up, there are multiple other treatment options, including use of insulin. Goal HbA1c for most patients with type 2 DM is < 7%; however, this goal should be individualized for each patient in accordance with the ADA guidelines [12]. A longitudinal cohort study of 11,346 veterans with type 2 diabetes compared the glycemic effectiveness of oral diabetic medications ( metformin, sulfonylurea and a thiazolidinedione) among veterans with and without HIV infection. This study did not find any significant difference in HbA1c based on different diabetes medications. However the HBA1c reduction was less in black and Hispanic patients. The mechanism for the poorer response among these patients need to be evaluated further [71]. In addition to management of blood sugar, other CVD risk factors, hyperlipidemia, hypertension, smoking, etc, should be assessed and managed aggressively.
Case Patient 3
Initial Presentation and History
A 45-year-old male with a history of HIV infection diagnosed 10 years ago, on TDF/FTC/efavirenz (trade name Atripla) for the last 7 years, presents with a left femoral neck fracture after he missed the pavement and fell on his left hip. His history is significant for IV drug abuse for 10 years prior to diagnosis of HIV, and he has been on methadone for the last 6 years.
Is HIV infection associated with increased prevalence of osteopenia and osteoporosis and increased risk of fractures?
With recent advancements in antiretroviral therapy and improved survival of the HIV-infected population, osteoporosis and increased fracture risk have become important causes of morbidity and mortality. Osteoporosis is a skeletal disorder characterized by compromised bone strength, which predisposes to an increased risk of fracture. The World Health Organization defines osteoporosis as a bone mineral density (BMD) measurement by dual X-ray absorptiometry (DXA) at the spine, hip, or forearm that is more than 2.5 standard deviations below that of a "young normal" adult (T-score < –2.5) or a history of one or more fragility fractures. Fragility fractures result from mechanical forces that would not ordinarily result in fracture, such as fall from standing height [40]. Osteopenia is characterized by low BMD (T-score between –1.0 and –2.5) and can be a precursor to osteoporosis.
Several observational, retrospective, and prospective studies have shown lower bone density and an increased risk of fractures in the HIV-infected population compared to age-, race- and sex-matched HIV-negative adults. In a large meta-analysis of pooled prevalence data on 884 HIV-infected patients compared with 654 HIV-uninfected age- and sex-matched controls [72], overall, HIV-infected patients had a significant 6.4-fold increased odds of reduced BMD and a 3.7-fold increased odds of osteoporosis compared to the control population. This meta-analysis also compared ARV-treated subjects to ARV-naive subjects and showed that ARV-treated subjects (n = 824) had a higher prevalence of reduced BMD compared with ARV-naive subjects (n= 202; odds ratio 2.5, 95% CI 1.8–3.7). The odds of osteoporosis was increased 2.4 times (95% CI 1.2 – 4.8) in ARV-treated subjects compared with ARV-naive subjects. None of the studies adjusted for potentially important confounding factors, such as age or duration of HIV infection. PI-treated patients (n = 791) were also found to have a higher prevalence of reduced BMD compared with PI-untreated patients (n = 410; OR 1.5, 95% CI 1.1–2.0). The odds of osteoporosis in PI-treated patients (n = 666) was also 1.6-fold greater (95% CI 1.1–2.3) than those not treated with PI (n = 367).
Low bone density has also been reported in HIV- positive premenopausal women irrespective of ARV status. In a recent study of 89 premenopausal women (mean age, 37 years) predominantly of African origin with HIV infection, osteopenia and osteoporosis were prevalent in one-third of these women, irrespective of ARV use and were associated with low BMI [73]. In a sub-study of the INSIGHT trial evaluating prevalence of and risk factors for low BMD in untreated HIV infection, performed at several sites across 6 continents involving 424 subjects, osteopenia was present in a third of this relatively young predominantly non-white ART-naive population (mean age 34 + 10 years) with normal CD4 cell counts, while only 2% had osteoporosis. Factors independently associated with lower BMD at the hip and spine were female sex, Latino/Hispanic ethnicity, lower BMI, and higher estimated glomerular filtration rate. Longer duration of HIV infection was also associated with lower hip BMD. Current or nadir CD4 cell count and HIV viral load were not associated with low BMD [74].
Many studies have reported increased fracture prevalence in the HIV population. In a retrospective study of fracture prevalence in a large US health care system, a significantly higher rate of fractures was reported in HIV-infected men and women compared to non-HIV-infected controls (2.87 vs. 1.77 fractures per 100 persons, P < 0.001). The difference in the increased fracture prevalence was greater in HIV positive men compared to women (3.08 vs. 1.83; P < 0.001). Vertebral, wrist and hip fractures were more prevalent in men compared to vertebral and wrist fractures only in women. Fracture prevalence was higher in both Caucasian females and males and only in African-American women [75].
In the HIV Outpatient Study (HOPS) [76], age-adjusted fracture rates in the HIV population were noted to be 1.98 to 3.69 times higher than rates in the general population. The HOPS was an open prospective cohort study of HIV-infected adults who were followed at 10 US HIV clinics. Rates of first fractures at any anatomic site from 2000–2008 were assessed among 5826 active HOPS patients (median age 40 years, 79% male, 52% Caucasian, and 73% exposed to ART). Among persons aged 25–54 years, both fracture rates and relative proportion of fragility fractures were higher among HOPS patients than among outpatient controls. Older age, substance abuse, nadir CD4+ cell count <200 cells/mm, HCV infection and DM were associated with incident fractures [76].
What factors contribute to poor bone health in the HIV population?
Several factors that contribute to low bone density are present at a higher rate in the HIV population (Table 4). These include poor nutritional status in terms of suboptimal calcium and vitamin D intake, hypogonadism, low body weight, and alcohol, tobacco and substance abuse.
Vitamin D deficiency is very common in HIV-infected patients, with a prevalence of up to 60% to 75% [77]. Hypogonadism is also relatively common among HIV population [78], contributing to lower bone density. Co-infection with HCV is also associated with increased risk of fractures. In a large cohort of Medicaid beneficiaries, a significant increase in the risk of hip fracture was demonstrated in HCV/HIV co-infected subjects compared either with HCV mono-infected, HIV mono-infected or non-infected individuals [79]. In another large database study, a significantly higher risk of osteoporotic fracture (closed wrist, vertebral or hip fracture) was reported in HCV/HIV co-infected versus HIV mono-infected individuals [80] with fracture rates of 2.57 and 2.07/1000 patient-years (P < 0.001). Dual treatment for HIV/hepatitis B co-infection has also been shown to be associated with a higher risk of hip fracture compared to treatment of HIV mono-infected individuals [81].
HIV infection itself can increase bone loss and reduce bone formation through direct effects related to the HIV antigen load or indirect effects related to activation of the pro-inflammatory cytokines resulting in bone resorption and loss [82]. Co-infection with HCV and/or hepatitis B also contributes to lower bone density in this population. Certain ARVs may also contribute to low bone density in the HIV population. Lipoatrophy related to HIV may also mediate bone loss through complex relationship between central signaling of adipocyte hormones [82,83].
Direct Viral Effects
Several HIV viral proteins have been shown to promote osteoclast activity (vpr and gp120), suppress osteoblast activity (p55-gag) and increase osteoblast apoptosis [84], resulting in increased bone resorption and reduced bone formation, leading to low bone mass. High HIV RNA viral load and T-cell activation are also associated with elevated levels of receptor activator of nuclear factor kappa-B ligand (RANKL), which results in osteoclast formation and increased bone resorption [85]. Other endogenous physiological inhibitors of osteoclastogenesis such as osteoprotegrin and interferon-γ levels are also remarkably downregulated in advanced HIV infection, resulting in increased bone resorption [86]. At a cellular level, HIV proteins including Tat and Nef reduce the number of available mesenchymal stem cell (MSC) precursors that proliferate into osteoblasts by inducing MSC senescence, due to increased oxidative stress and mitochondrial dysfunction resulting in reduced proliferation of osteoblasts and lower rates of bone formation [87]. Collectively, these mechanisms result in significant uncoupling of bone formation and resorption, resulting in less bone formation and greater rate of bone loss and lower bone density.
Pro-inflammatory Pathways
Cytokines and other soluble immune factors play a major role in the physiology of osteoblast maturation and osteoclastic bone resorption [88,89]. Immune dysfunction and persistent inflammation in HIV result in increased levels of several inflammatory cytokines, including tumor necrosis factor (TNF)-α, interleukin-6 (IL-6), and RANKL, resulting in stimulation of osteoclastogenesis and bone resorption [90]. Due to a disruption between T and B cells in HIV and decreased osteoprotegrin (OPG) production and increased RANKL level, RANKL/OPG ratio is elevated, favoring osteoclastogenesis [91].
Is antiretroviral therapy associated with bone loss?
The initiation of ART has been reported to cause 2% to 6% bone loss irrespective of the regimen used, similar to that sustained in the first 2 years after menopause [92]. Certain NRTIs and PIs are associated with higher rates of bone loss than others. TDF has been associated most commonly with decreased bone mineral density, which usually stabilizes with continued use [93]. In a randomized trial comparing 4 treatment arms of ABC/3TC or TDF/FTC with EFV or ATV/ritonavir, TDF was associated with a greater reduction in BMD compared to abacavir-based regimens [94]. The likely cause of this may be TDF-mediated renal toxicity, including proximal tubular dysfunction and hypophosphatemia, resulting in increased PTH and bone resorption, and nephrogenic diabetes insipidus [95]. TAF is another prodrug of tenofovir diphosphate associated with less renal and bone toxicity compared with TDF. TAF has been associated with significantly less decrease in bone mineral density and renal dysfunction in randomized studies compared to regimen using TDF [17]. Vitamin D deficiency and hypophosphatemia associated with TDF therapy may present with osteomalacia, which predisposes to bone pain and fractures. Treatment with TDF may rarely be associated with the development of Fanconi syndrome and osteomalacia [96]. BMD is often severely reduced and bone pain and pathological fractures are characteristic features. Certain PI regimens containing ritonavir-boosted atazanavir have also been associated with greater bone loss in the spine than the hip, compared to efavirenz-containing regimens [97].
The universal bone loss associated with ART is thought to be a result of the "immune reconstitution inflammatory syndrome" (IRIS). This occurs as a result of rapid improvement in immune function after the commencement of ARV as a result of systemic or local inflammation, resulting in increased levels of cytokines that may contribute to bone loss. This has been shown in animal studies where T cell transplantation into immunocompromised mice to mimic ARV-induced T-cell expansion resulted in increased RANKL and TNF-α production by B cells and/or T cells, accompanied by enhanced bone resorption and BMD loss. When TNF-α or RANKL-null T-cells or TNF-α antagonists were used instead, the loss of cortical bone was prevented [98]. In a prospective study evaluating changes in bone turnover markers and inflammatory cytokines with ARV therapy in HIV infected subjects, a significant increase in bone resorption markers, RANKL and TNF-α were seen after initiation of ARV. The magnitude of CD4-cell recovery correlated with the increase in markers of bone resorption [99], suggesting that recovery of the immune system contributes to the increase in cytokine-mediated bone resorption.
How is bone health and fracture risk assessed in the HIV-positive population?
The predictive value of low BMD for fracture risk assessment in the HIV-positive population has not been established. In the absence of definitive data, the fracture risk assessment and standard methods of measuring bone density using DXA are utilized. In a large study of 1000 men and women, osteoporosis defined as a BMD T-score –2.5 as measured by DXA, was associated with a significantly increased risk of incident fractures but was not a good predictor of morphometric vertebral fractures [100]. In the absence of prospective longitudinal studies evaluating the bone density parameters at which fracture risk is significantly increased in the HIV population, it is reasonable to follow the guidelines used in the non-HIV population.
The approach to treatment of osteopenia and osteoporosis is similar to that in non HIV-infected population and is directed at lifestyle changes and treatment of secondary causes of osteoporosis [101], followed by initiation of antiresorptive therapy.
Management of Bone Disease
There are several guidelines available for the management of bone disease in the HIV population. The most recent guidelines from the IDSA [12] recommend assessing the risk of fragility fracture using the Fracture Risk Assessment Tool (FRAX), without DXA, in all HIV-infected men aged 40–49 years and HIV-infected premenopausal women aged ≥ 40 years. DXA should be performed in men aged ≥ 50 years, postmenopausal women, patients with a history of fragility fracture, patients receiving chronic glucocorticoid treatment, and patients at high risk of falls. In resource-limited settings, FRAX without bone mineral density can be substituted for DXA. ART guidelines should be followed. TDF and boosted PIs should be avoided if possible in at-risk patients. Dietary and lifestyle management strategies for high-risk patients should be employed and anti-osteoporosis treatment initiated if indicated [102].
The FRAX tool is available at www.shef.ac.uk/FRAX/ and is used to calculate 10-year fracture risk using patient clinical data, including presence of risk factors for osteoporosis. The tool is population-specific by race and region. It has not been validated for the HIV-positive population and may underestimate fracture risk [103]. HIV status is considered a secondary cause of osteoporosis in FRAX calculation.
The National Osteoporosis Foundation recommends screening with DXA for all women > 65 years of age, all men > 70 years of age, and adults > 50 years of age with additional risk factors for osteoporosis. Evaluation for secondary causes for low BMD should always be considered in the HIV-positive population including evaluation of calcium and vitamin D intake. Laboratory testing may include complete blood count, calcium, phosphate, albumin, creatinine, PTH, 25 hydroxy vitamin D (25,OHD) and 24 hour urine for evaluation of calcium, creatinine and phosphate (especially if on TDF) excretion. Testosterone level can be checked in men and estradiol, prolactin, FSH and LH in women for evaluation of hypogonadism. Bone turnover markers (bone specific alkaline phosphatase and serum C-terminal telopeptide) can also be assessed at baseline.
Studies using high-resolution peripheral quantitative computed tomography (HSPQCT) have shown significant reductions in tibial trabecular bone density and trabecular number in pre-menopausal and postmenopausal HIV-infected women [104], with reduced bone stiffness measured using finite element analysis [105]. Co-infection with HCV is also associated with significantly lower trabecular volumetric BMD and smaller cortical dimensions in the tibia, compared to healthy subjects [106]. HSPQCT is not widely available for clinical use at this time. Lateral imaging of the spine or vertebral morphometric analysis may be done in cases of height loss to assess for occult vertebral compression fractures.
There is a high prevalence of vitamin D deficiency in the HIV-infected population [107]. Treatment goal is to have a vitamin D level of at least 30 ng/mL, based on Endocrine Society practice guidelines [108], and may require supplementation with 1000–2000 units of vitamin D daily. Calcium intake should be optimized, averaging 1000 mg per day including diet and supplements, to be taken in divided amounts through the day for optimal absorption. Secondary causes of low bone density as mentioned in Table 4 should also be addressed. Patients should be counseled on tobacco and alcohol abuse. Corticosteroids should be dosed at the lowest dose needed. Medications such as proton pump inhibitors can impair the absorption of calcium carbonate, in which case calcium citrate supplements should be used if there is suboptimal calcium intake in the diet.
Which medications have been shown to be effective in treatment of osteoporosis in the HIV population?
Bisphosphonates are the mainstay of therapy for osteoporosis in the HIV-infected population. Only alendronate and zoledronate have substantial evidence of safety and effectiveness in the HIV-infected population, but these studies have been small and of limited duration.
Bisphosphonates are pyrophosphate analogues that inhibit bone resorption by binding to the hydroxyapatite crystals in the bone. Several prospective studies have shown alendronate to increase bone density compared to calcium and vitamin D alone in the HIV infected patients with reduced bone density [109,110], with significant reduction in markers of bone resorption [111].
Zoledronic acid (ZA), an amino-bisphosphonate which is infused intravenously, has also been used in smaller studies in HIV-infected persons. In a prospective study evaluating yearly ZA infusion to biennial ZA infusion in subjects with HIV and low bone density [112], biennial ZA infusions were found to be effective in improving and maintaining bone density in the HIV population. In another prospective study evaluating the effects of ZA in HIV-positive men, ZA infusion was given at baseline and at 12 months. Compared to placebo, treatment group had significantly higher bone density and lower bone turnover markers till 5 years after the last infusion [113].
In a meta-analysis evaluating the effect of bisphosphonates on bone mineral density in 328 adults with HIV infection from 8 randomized controlled trials (5 with alendronate and 3 with ZA as the intervention), a significant increase in BMD at the lumbar spine and hip was observed in the treatment groups at 48 and 96 weeks. However, these studies were not long enough to detect the impact of bisphosphonates on fracture risk [114]. ZA has also been shown to be effective in preventing ARV induced bone loss after a single infusion [115].
These studies confirm that both alendronate and ZA are effective in improving BMD in the HIV-infected population, with early studies showing a beneficial effect of ZA in mitigating ARV-induced bone loss as well. DXA may be repeated 1 to 2 years after initiation of osteoporosis therapy and less often subsequently if BMD is stable to improved [116].
Although these studies show significant improvement in bone density with treatment, longitudinal data on fracture reduction with these medications in the HIV-infected population are not available. Additionally, these patients have onset of osteoporosis at a younger age and the need for osteoporosis treatment needs to be assessed carefully before initiating treatment. There are other medications available for the treatment of osteoporosis in the non-HIV population such as raloxifene, teriparatide and denosumab, but no randomized controlled studies of these agents are available in the HIV-infected population.
Summary
The advent of highly potent antiretroviral therapy capable of early and prolonged viral suppression in HIV-infected patients has resulted in significant increases in life span. As we have already seen, this will likely lead to a rising incidence of various metabolic complications of HIV and ARV, including hyperlipidemia and diabetes with associated cardiovascular disease risk. A keen awareness of these potential complications, drug interactions, and possible toxicities will be paramount to their successful management. Appropriate care of HIV-infected individuals going forward will likely require multidisciplinary collaboration as the epidemic evolves to allow our patients to live not only longer, but healthier lives.
Corresponding author: Lisa M. Chirch, MD, UCONN Health, Farmington, CT 06030, chirch@uchc.edu.
Financial disclosures: None
Author contributions: All authors contributed equally to this article
From the University of Connecticut School of Medicine, Farmington, CT.
Abstract
- Objective: To review the metabolic complications of HIV infection.
- Methods: Review of the literature in the context of 3 clinical cases.
- Results: People with HIV infection are living longer thanks to the advent of potent antiretroviral therapy. This has led to increased incidence of age-related metabolic complications, including a higher risk of cardiovascular disease, hyperlipidemia, metabolic syndrome, and osteoporosis. Appropriate management of these complications requires an understanding of disease-related and drug-related side effects as well as the potential for drug-drug interactions. A multidisciplinary approach to patient management is most effective.
- Conclusion: Awareness of the metabolic complications frequently encountered in HIV infection, drug interactions, and possible toxicities is critical to the successful management of HIV-infected individuals.
Key words: HIV; antiretroviral therapy; hyperlipidemia; metabolic syndrome; diabetes; hypogonadism.
According to the most recent data from the Joint United Nations Programme on HIV/AIDS (UNAIDS), 36 million people worldwide are living with HIV/AIDS, with 18 million accessing effective antiretroviral therapy (ART) [1]. The past 2 decades have witnessed enormous advances in the field from prevention to diagnosis and therapeutics, and modern ART largely allows HIV-infected persons to live near-normal life spans [2,3]. However, from the beginning of the epidemic, HIV-infected persons on effective therapy have suffered from myriad metabolic consequences, many of which affect quality of life and result in excess mortality [4]. It is also true that untreated HIV infection portends an increased risk of metabolic complications, likely related to abnormal immune activation, as demonstrated in structured interruption trials [5,6]. It is worth noting, however, that while many of these metabolic dyscrasias and associated risks have historically been attributed primarily to the treatment of HIV infection with ART, data from cohort studies and randomized clinical trials have repeatedly demonstrated significant reductions in morbidity and mortality when ART is initiated early [7]. In this paper, we review HIV-related metabolic complications frequently encountered in clinical practice (hyperlipidemia, diabetes, and bone disease) and best practice considerations in the context of 3 clinical cases.
Case Patient 1
Initial Presentation and History
A 58-year-old male with a history of hypertension and mixed hyperlipidemia is referred for evaluation of newly diagnosed HIV infection. He has no history of intravenous drug use but has had multiple male and female sex partners in the past few years, and requested testing after a partner tested positive. His last negative test was 2 years ago. The patient does not smoke cigarettes. Overall he feels well and tolerates his regimen of lisinopril 10 mg and simvastatin 20 mg daily. On initial evaluation, his exam is unremarkable other than subtle white plaques on the dorsal surface of the tongue and buccal mucosa, and moderate central obesity. Vital signs including blood pressure are normal. Initial laboratory evaluation reveals a CD4 cell count of 150 cells/mm3 and an HIV RNA level of 200,000 copies/mL. Fasting serum total cholesterol is 220 mg/dL, triglycerides 250 mg/dL, LDL 170 mg/dL, and HDL 35 mg/dL. Serum BUN, creatinine, and liver function testing results are normal.
What initial regimen might be recommended based on the status of his HIV infection and comorbidities?
The most recent iteration of the US Department of Health and Human Services (DHHS) guidelines on use of antiretroviral agents (ARVs) in HIV recommends an initial ART regimen that includes a backbone of 2 nucleoside reverse transcriptase inhibitors (NRTIs), generally tenofovir disoproxil fumarate or tenofovir alafenamide, abacavir (ABC), emtricitabine (FTC), or lamivudine (3TC) [2]. To this backbone should be added a third agent; the majority of those currently recommended are integrase strand transfer inhibitors (INSTIs) (dolutegravir, elvitegravir, raltegravir); one recommended protease inhibitor (PI) (ritonavir-boosted darunavir) is also an option. Some of these initial recommended regimens are available as fixed-dosed combinations in 1 pill, making them attractive options.
The latest guidelines also clearly recommend starting ART in all HIV-infected individuals, irrespective of CD4 count. The patient described above has a very low CD4 count, so there is no question he needs to begin therapy promptly. Given his low CD4 count and relatively high viral load, one may consider a ritonavir-boosted PI as perhaps the most robust option and with a relatively high barrier to resistance development, in contrast to other options. Assuming the patient’s baseline resistance testing reveals a fully sensitive wild-type virus without meaningful resistance mutations, he will begin a regimen of TDF/FTC plus ritonavir-boosted darunavir, 3 pills once daily. Given his low CD4 count (below 200 cells/mm3), he will also need prophylaxis for Pneumocystis jirovecii pneumonia, in the form of trimethoprim/sulfamethoxazole (TMP/SMX) daily. Given the potential for interaction between the boosted PI and simvastatin, his lipid-lowering agent is switched to atorvastatin 10 mg daily.
What is the association between hyperlipidemia and HIV infection and treatment?
Hyperlipidemia represents a key modifiable risk factor for the development of cardiovascular disease (CVD) in HIV-infected individuals [8]. Indeed, a multicenter cross-sectional study of older HIV-infected individuals performed in Spain revealed a 54% prevalence of dyslipidemia and 23% CVD [9]. Most experts believe that metabolic abnormalities observed in HIV-infected individuals are the result of a combination of factors: those resulting from abnormal immune activation and inflammation related to viral replication, and those related to certain ARVs [10].
Early after HIV seroconversion, decline in HDL is one of the first proatherogenic changes observed. This, along with increased triglyceride and LDL levels, likely contribute to increased risk of CVD in this population. Increased microbial translocation, evidenced by increased levels of lipopolysaccharide (LPS), may drive immune activation, leading to dyslipidemia via a multitude of hypothesized mechanisms [4]. It has been theorized that HDL lipoproteins are less stable on ART, leading to potentially impaired plasma lipolytic activities or hepatic cholesteryl ester uptake [6,11]. Increased VLDL from release of free fatty acids may lead to higher triglyceride levels and triglyceride-rich LDL and HDL, all associated with increased risk of CVD [11].
In terms of effects of specific ARV classes, although newer agents have less of a propensity to cause dyslipidemia, the PI class arguably remains most problematic. In comparison to other classes, the PIs tend to result in greater increases in triglycerides, total cholesterol, and LDL, and have frequent drug-drug interactions with lipid-lowering agents [10,12]. Estimated prevalence of dyslipidemia in patients receiving PI therapy varies from 28% to 80% [13]. The prospective multinational cohort Data collection on Adverse events of Anti-HIV Drugs (DAD) study found significantly higher rates of hypertriglyceridemia, hypercholesterolemia, and low HDL in patients on PIs in comparison to non–nucleoside reverse transcriptase inhibitors (NNRTIs) [14]. Various mechanisms have been proposed to explain the PIs adverse effects on lipids, including inhibition of lipogenesis and adipocyte differentiation, decreased hepatocyte clearance of chylomicrons and VLDL, and increased hepatic synthesis of triglycerides [15]. Of the available PIs, atazanavir and darunavir have less potential to lead to dyslipidemia [10], while lopinavir/ritonavir, fosamprenavir, and tipranavir may have the highest [13]. Of the NNRTIs, efavirenz is most frequently associated with dyslipidemia, specifically increased triglycerides and total cholesterol [13]. However, these increased values seen on efavirenz therapy may be offset by relative increases in HDL, with little resultant effect on the total cholesterol:HDL ratio. Rilpivirine, etravirine, and nevirapine are relatively less likely to drive lipid changes, although certain drug interactions are important to recognize in clinical practice, such as the interaction between rilpivirine and proton pump inhibitors [2,13,16]. It is also worth noting that no NNRTIs are included in current guidelines as preferred therapy [2].
Historically, the thymidine analogue NRTIs (stavudine, didanosine, zidovudine) have been associated with lipid dyscrasias and lipoatrophy, but fortunately these are no longer used frequenty except in cases requiring deep salvage therapy for highly treatment-experienced patients. Two newer NRTIs, tenofovir and abacavir, have relatively neutral to favorable effects on lipids. The combination of tenofovir disoproxil (TDF) and emtricitabine (trade name Truvada) was associated with significantly lower triglycerides, total cholesterol and LDL than other NRTI pairs [6]. TDF has been postulated to have lipid-lowering effects. Switch studies in which patients were taken off thymidine analogues and placed on TDF, demonstrated recovery of limb fat in patients with lipoatrophy, and those switched off abacavir-based ART to TDF showed statistically significant lower fasting total cholesterol at week 12, without differences of viral suppression [8]. Tenofovir alafenamide (TAF) is a next-generation prodrug of tenofovir that results in improved stability in plasma and higher intracellular levels in comparison to TDF [17]. Although randomized controlled trials of TAF vs TDF-based ARV regimens have suggested statistically higher total cholesterol, serum HDL is also increased resulting in unchanged total:HDL ratios and no differences in risk classifications [18]. Integrase inhibitors (INSTI) now represent first-line therapy in combination with an NRTI backbone, and since their availability in 2007 have been evaluated in comparison to various PIs and NNRTIs. Both raltegravir and dolutegravir have consistently shown broad neutral effects on lipids and are among the most metabolically friendly agents available [19–21]. Because it is given in fixed-dose combination with non-ritonavir pharmacologic booster cobicistat, elvitegravir has effects similar to ritonavir-boosted PIs on lipids [6].
What are management considerations in the treatment of hyperlipidemia in HIV-infected patients?
Patients with HIV and hyperlipidemia may benefit from lipid-lowering therapy in addition to ART, although in certain cases appropriate switches may make a difference. Careful consideration of drug interactions between ARVs and lipid-lowering agents, in addition to ARV history and known drug resistance, is warranted prior to selecting a regimen in these patients. In addition, the latest American College of Cardiology/American Heart Association guidelines suggest evaluating 10-year risk of atherosclerotic cardiovascular disease (ASCVD) using the pooled cohort equation to determine the type and dose of statin required (moderate vs high intensity) [22]. It is noteworthy that HIV infection and its therapies are not taken into account as potential risk factors in this model. Primary prevention in non-diabetic patients with a statin is recommended for patients with a 10-year absolute risk of ≥ 7.5% [22]. This patient’s risk is estimated at between 12% and 13% based on this equation, so primary prevention with a moderate-or high-intensity statin is recommended (Table 1) [23]. Data from more than 80,000 patients in the Veterans Aging Cohort Study (VACS) showed that HIV-infected patients with no baseline ASCVD had 50% increased risk of acute myocardial infarction when compared to HIV-uninfected patients over 6 years of follow-up [24]. Thus, consideration of the virus itself or its therapy as an additional risk factor may be valid.
Screening and Monitoring of Hyperlipidemia
The most recent iteration of the DHHS primary care guidelines for the management of HIV-infected individuals recommends obtaining fasting (ideally 12 hours) lipid profiles upon initiation of care, and within 1 to 3 months of beginning therapy [12,13]. These initial levels, along with other elements of the patient’s history and calculation of risk may help determine whether lipid-lowering therapy is indicated, and if so, which therapy would be best. In general, after regimen switches or additions of either ARV or statin therapy, repeating fasting lipid levels 6 weeks later is recommended to gauge the effects of the switch. This is especially critical when interactions between ARVs and lipid-lowering therapies are possible. Some experts recommend performing annual screening of patients with normal baseline lipids or with well-controlled hyperlipidemia on therapy. Assessment of 10-year ASCVD risk is also recommended annually, in addition to baseline risk assessment, to determine the need and appropriateness of statin therapy [25]. The question of primary prevention in HIV has yet to be definitively answered. Small studies in this population have demonstrated that statins have the potential to slow progression of carotid intima media thickness and reduce noncalcified plaque volume [24]. An NIH/AIDS Clinical Trial Group–sponsored randomized clinical trial (“REPRIEVE”) is currently underway to address this question. More than 6000 HIV-infected men and women with no history of ASCVD at 100 sites in several countries are enrolled to assess the benefit of pitavastatin as primary prevention in this risk group [24]. Metabolized via glucuronidation primarily, as opposed to cytochrome p450 (CYP 3A4 isoenzyme), pitavastatin is thought to have fewer drug interactions with ARVs in general [6] (Table 2).
Relevant Drug-Drug Interactions
Deciding which statin to begin in HIV-infected patients depends on whether moderate- or high-intensity therapy is warranted and whether the potential for drug interaction with ARVs exists. Table 2 [6,12] depicts available statins and the potential for pharmacokinetic interaction with the primary ARV classes. Simvastatin and lovastatin are heavily metabolized via the CYP 3A4 pathway, resulting in the highest potential risk of interaction with CYP 3A4 inhibitors, such as the PIs, or inducers (eg, NNRTIs, in particular efavirenz) [6]. The former may inhibit metabolism of these statins, resulting in increased risk of toxicity, while co-administration with efavirenz, for example, may result in inadequate serum concentration and therefore inadequate lipid-lowering effects. Although less lipophilic, atorvastatin results in similar interactions with PIs and NNRTIs, and therefore low starting doses with close monitoring is recommended [6]. Fewer interactions have been noted with rosuvastatin, pravastatin, and pitavastatin, as these do not require CYP 3A4 for their metabolism and are thus less likely to be affected by ARVs. These therefore represent potentially safer first choices for certain patients on ARVs, although of these, only rosuvastatin is classified as a high-intensity statin [22,23] (Table 1). When compared directly to pravastatin 40 mg daily in patients receiving ritonavir-boosted PIs, rosuvastatin performed superiorly at 10 mg per day, resulting in more significant reductions in LDL and triglyceride levels [15]. Although it is eliminated largely unchanged through the kidney and liver, pravastatin has been reported to idiosyncratically interact with darunavir, resulting in potentially increased pravastatin levels and associated toxicity [25]. Treatment of pure hypertriglyceridemia in HIV-infected patients should begin with fibrates, which have little to no risk of interaction with most clinically relevant ARVs [6,10]. Alternatives to lower triglycerides include niacin and N-3 polyunsaturated fatty acids [25].
Case 1 Continued
The patient has an impressive response to his initial regimen of TDF/FTC plus boosted darunavir, with repeat CD4 count after 12 weeks of 275 (18%) cells/mm3 and an undetectable viral load (< 20 copies/mL). Other lab parameters are favorable and he is tolerating the regimen well without notable side effects. However, at his next visit, although his viral load remains undetectable, his triglyceride level has increased to 350 mg/dL, although other lipid parameters are comparable to the prior result. He complains of diffuse body aches, concentrated in large muscle groups of the extremities, and dark-colored urine. A creatine phosphokinase (CPK) level is elevated at 300 IU/L (normal, 22–269, negative MB fraction). Serum creatinine is 1.4 mg/dL (had been 1.1 mg/dL at baseline). Given he has done so well otherwise on these ARVs, he is reluctant to make any changes.
What drug-drug interaction is most likely causing this patient's problem, and how should it be managed?
This scenario is not uncommon in clinical practice, and changes to regimens are sometimes necessary in order to avoid drug interactions. Care must be taken to thoroughly review antiretroviral history and available resistance testing (in this case a relatively short history) in order to ensure a fully active and suppressive regimen is chosen. This description could be the result of an interaction between lipid-lowering therapy and ARVs resulting in increased relative concentrations of one drug or the other and therefore leading to toxicity. Given this possibility, and suboptimal control of hyperlipidemia, consideration should be given to switching both his ART and his statin therapy.
Safety and Potential Toxicities of Lipid-Lowering Therapy
Increased serum concentration of certain statins when co-administered with CYP 3A4 inhibitors like the PIs leads to heightened risk of statin-associated toxicities. In general, this includes muscle inflammation, leading to increases in serum CPK level and associated symptoms, including myalgias, myositis, or in extreme cases, rhabdomyolysis [6]. Although rare, this toxicity can be serious and may lead to acute renal injury if not recognized and managed appropriately. In theory, the potential for statin-associated hepatotoxicity may also be increased in patients receiving PIs, although this has not been borne out in clinical trials [26]. In fact, quite the opposite may be true, in that statins have been shown to improve liver function in patients with hepatitis C virus (HCV) coinfection and with nonalcoholic fatty liver disease [6,15].
Case 1 Conclusion
The patient does well on his new ARV regimen of TAF/FTC and dolutegravir, 2 pills once daily. He no longer requires TMP/SMX, as his CD4 count has been reliably above 200 cells/mm3 on several occasions. Serum creatinine is back down to baseline and CPK has normalized. Fasting lipids have improved since the switch, and he no longer has symptoms of myositis on rosuvastatin 10 mg daily.
Summary
Consideration of statin therapy is complicated by potential drug interactions with ARVs and associated toxicity. However, given known effects of ARVs on lipids, and of immune activation and inflammation related to the virus itself, these patients should be carefully evaluated for statin therapy for their anti-inflammatory and immune modulatory effects as much as for their lipid-lowering ability. Utilization of HIV infection and its therapies as additional cardiovascular risk factors when calculating 10-year risk deserves further consideration; forthcoming results of the REPRIEVE trial are certain to contribute valuable information to this field of study.
Case Patient 2
Initial Presentation and History
A 45-year-old female with history of HIV infection since 2008 presents to the office for new-onset diabetes, diagnosed 2 weeks ago. She has had symptoms of polyuria and polydipsia for the last 1 month. She denies diarrhea, nausea, vomiting or weight loss. She is currently on a regimen consisting of zidovudine/lamivudine plus lopinavir/ritonavir. There is no family history of diabetes. Her examination is unremarkable, including normal vital signs (weight 150 lb, blood pressure 114/70, heart rate 76) and no evidence of insulin resistance, including acanthosis nigricans or striae. Glycosylated hemoglobin level (HbA1c) is 8%. Creatinine and liver function tests are within reference ranges.
Do HIV-infected patients have a higher incidence of type 2 diabetes mellitus (DM)?
Prevalence of type 2 DM in HIV-infected patients varies between 2% to 14% [27]. This variation is due to the different cutoffs used for diagnosis, differences in cohorts studied, and how risk factors are analyzed [28–31]. In a recent nationally representative estimate of DM prevalence among HIV-infected adults receiving medical care in the United States in 2009–2010, the prevalence of DM was noted to be 10.3%. In comparison to the general adult US population, HIV-infected individuals have a 3.8% higher prevalence of DM after adjusting for age, sex, race/ethnicity, education, poverty-level, obesity, and HCV infection [27].
There is controversy over whether HIV infection itself increases the risk of type 2 DM, with some studies showing increased risk [28,32,33] and others showing no independent effect or an inverse effect [30,34,35]. Studies on the impact of ethnicity and race on prevalence of DM are limited [36].
Certain traditional risk factors (age, ethnicity, obesity) are still responsible for most of the increased risk of diabetes in the HIV-infected population [35,37]. HIV infection itself is associated with metabolic dysfunction, independent of ARV. In HIV-infected patients, impaired glucose metabolism is associated with altered levels of adipokines, increased adiponectin and soluble-tumor necrosis factor receptor 1 (sTNFR1) and decreased leptin [38,39]. HIV-associated alterations in CD4+ and CD8+ T cell function also impair glycolysis, which may adversely impact glucose metabolism [40].
Other contributing factors in HIV-infected patients are HCV co-infection [41], medications (atypical antipsychotics, corticosteroids), opiates, and low testosterone [42]. HCV co-infection may lead to hepatic steatosis and liver fibrosis, and increasing insulin resistance.
Recent genomic studies show several common single-nucleotide polymorphisms (SNPs) associated with diabetes in the general population. In the Swiss HIV Cohort Study, SNPs accounted for 14% of type 2 DM risk variability, whereas ARV exposure accounted for 3% and age for 19% of the variability in DM [43].
ARVs also increase the risk of type 2 DM by both direct and indirect effects. Certain ARVs causes lipoatrophy [30] and visceral fat accumulation/lipohypertrophy [29,44]. PIs increase insulin resistance via effects on GLUT-4 transporter and decrease insulin secretion through effects on B cell function [45]. NRTIs (eg, stavudine, zidovudine and didanosine) can cause direct mitochondrial toxicity [46–48]. Utilization of newer ARV agents has decreased the prevalence of severe lipoatrophy, but lipohypertrophy and the underlying metabolic abnormalities persist. The DHHS “preferred” nucleoside analogues, tenofovir and abacavir, do not induce mitochondrial toxicity and have more favorable metabolic profiles [49,50]. In ACTG Study 5142, thymidine-sparing regimens were found to cause less lipoatrophy [51]. In addition, darunavir and atazanavir, the preferred and alternative PIs and the integrase strand transfer inhibitor have limited or modest impact on insulin sensitivity [20,52,53]. This has led to a recent decline in the incidence of type 2 DM in HIV-infected patients.
Statins can also increase insulin resistance and DM [54], although studies have shown mixed results [55–57]. The benefits of statin therapy likely outweigh the risk of DM since there is a significant cardiovascular event reduction with their use [58,59].
How is diabetes diagnosed in HIV-infected patients?
Optimal diabetes screening guidelines have not been established specifically for HIV-infected patients. The American Diabetes Association (ADA) guidelines recommend that diabetes in the general population be diagnosed by 2 elevated fasting blood glucose levels, HbA1c, oral glucose tolerance test (OGTT), or high random glucose with classic symptoms of hyperglycemia [60]. Repeat testing is recommended every 3 years. The OGTT is recommended for diagnosis in pregnant women.
HbA1c may underestimate glycemic burden in HIV-infected individual due to higher mean corpuscular volume, NRTI use (specifically abacavir), or lower CD4 count [61–65]. The Infectious Diseases Society of America (IDSA) 2013 primary care guidelines for HIV-infected patients recommends obtaining a fasting glucose and/or HbA1c prior to and within 1–3 months after starting ARV [12]. Use of HbA1c threshold cutoff of 5.8% for the diagnosis of DM and testing every 6–12 months are recommended.
How should this patient’s diabetes be managed?
The ADA guidelines suggest a patient-centered approach to management of diabetes [66]. All patients should be educated about lifestyle modifications with medical nutrition therapy and moderate-intensity aerobic activity and weight loss [67]. If a patient is on lopinavir/ritonavir or a thymidine analogue (zidovudine, stavudine), one should consider switching the ARV regimen [2].
There are currently no randomized controlled trials of diabetes treatment specific to patients with HIV infection. Metformin is the first-line agent. It improves insulin sensitivity by reducing hepatic glucose production and improving peripheral glucose uptake and lipid parameters [68,69]. Other oral hypoglycemic agents used in the treatment of type 2 diabetes are shown in Table 3.
Case 2 Continued
The patient is switched to TAF/FTC plus dolutegravir with improvement in blood sugars. She is also started on metformin. Co-administration of metformin and dolutegravir will be carefully monitored since dolutegravir increases metformin concentration [70]. When dolutegravir is used with metformin, the total daily dose of metformin should be limited to 1000 mg.
• How should this patient be followed?
If the patient is still not at goal HbAb1c at follow-up, there are multiple other treatment options, including use of insulin. Goal HbA1c for most patients with type 2 DM is < 7%; however, this goal should be individualized for each patient in accordance with the ADA guidelines [12]. A longitudinal cohort study of 11,346 veterans with type 2 diabetes compared the glycemic effectiveness of oral diabetic medications ( metformin, sulfonylurea and a thiazolidinedione) among veterans with and without HIV infection. This study did not find any significant difference in HbA1c based on different diabetes medications. However the HBA1c reduction was less in black and Hispanic patients. The mechanism for the poorer response among these patients need to be evaluated further [71]. In addition to management of blood sugar, other CVD risk factors, hyperlipidemia, hypertension, smoking, etc, should be assessed and managed aggressively.
Case Patient 3
Initial Presentation and History
A 45-year-old male with a history of HIV infection diagnosed 10 years ago, on TDF/FTC/efavirenz (trade name Atripla) for the last 7 years, presents with a left femoral neck fracture after he missed the pavement and fell on his left hip. His history is significant for IV drug abuse for 10 years prior to diagnosis of HIV, and he has been on methadone for the last 6 years.
Is HIV infection associated with increased prevalence of osteopenia and osteoporosis and increased risk of fractures?
With recent advancements in antiretroviral therapy and improved survival of the HIV-infected population, osteoporosis and increased fracture risk have become important causes of morbidity and mortality. Osteoporosis is a skeletal disorder characterized by compromised bone strength, which predisposes to an increased risk of fracture. The World Health Organization defines osteoporosis as a bone mineral density (BMD) measurement by dual X-ray absorptiometry (DXA) at the spine, hip, or forearm that is more than 2.5 standard deviations below that of a "young normal" adult (T-score < –2.5) or a history of one or more fragility fractures. Fragility fractures result from mechanical forces that would not ordinarily result in fracture, such as fall from standing height [40]. Osteopenia is characterized by low BMD (T-score between –1.0 and –2.5) and can be a precursor to osteoporosis.
Several observational, retrospective, and prospective studies have shown lower bone density and an increased risk of fractures in the HIV-infected population compared to age-, race- and sex-matched HIV-negative adults. In a large meta-analysis of pooled prevalence data on 884 HIV-infected patients compared with 654 HIV-uninfected age- and sex-matched controls [72], overall, HIV-infected patients had a significant 6.4-fold increased odds of reduced BMD and a 3.7-fold increased odds of osteoporosis compared to the control population. This meta-analysis also compared ARV-treated subjects to ARV-naive subjects and showed that ARV-treated subjects (n = 824) had a higher prevalence of reduced BMD compared with ARV-naive subjects (n= 202; odds ratio 2.5, 95% CI 1.8–3.7). The odds of osteoporosis was increased 2.4 times (95% CI 1.2 – 4.8) in ARV-treated subjects compared with ARV-naive subjects. None of the studies adjusted for potentially important confounding factors, such as age or duration of HIV infection. PI-treated patients (n = 791) were also found to have a higher prevalence of reduced BMD compared with PI-untreated patients (n = 410; OR 1.5, 95% CI 1.1–2.0). The odds of osteoporosis in PI-treated patients (n = 666) was also 1.6-fold greater (95% CI 1.1–2.3) than those not treated with PI (n = 367).
Low bone density has also been reported in HIV- positive premenopausal women irrespective of ARV status. In a recent study of 89 premenopausal women (mean age, 37 years) predominantly of African origin with HIV infection, osteopenia and osteoporosis were prevalent in one-third of these women, irrespective of ARV use and were associated with low BMI [73]. In a sub-study of the INSIGHT trial evaluating prevalence of and risk factors for low BMD in untreated HIV infection, performed at several sites across 6 continents involving 424 subjects, osteopenia was present in a third of this relatively young predominantly non-white ART-naive population (mean age 34 + 10 years) with normal CD4 cell counts, while only 2% had osteoporosis. Factors independently associated with lower BMD at the hip and spine were female sex, Latino/Hispanic ethnicity, lower BMI, and higher estimated glomerular filtration rate. Longer duration of HIV infection was also associated with lower hip BMD. Current or nadir CD4 cell count and HIV viral load were not associated with low BMD [74].
Many studies have reported increased fracture prevalence in the HIV population. In a retrospective study of fracture prevalence in a large US health care system, a significantly higher rate of fractures was reported in HIV-infected men and women compared to non-HIV-infected controls (2.87 vs. 1.77 fractures per 100 persons, P < 0.001). The difference in the increased fracture prevalence was greater in HIV positive men compared to women (3.08 vs. 1.83; P < 0.001). Vertebral, wrist and hip fractures were more prevalent in men compared to vertebral and wrist fractures only in women. Fracture prevalence was higher in both Caucasian females and males and only in African-American women [75].
In the HIV Outpatient Study (HOPS) [76], age-adjusted fracture rates in the HIV population were noted to be 1.98 to 3.69 times higher than rates in the general population. The HOPS was an open prospective cohort study of HIV-infected adults who were followed at 10 US HIV clinics. Rates of first fractures at any anatomic site from 2000–2008 were assessed among 5826 active HOPS patients (median age 40 years, 79% male, 52% Caucasian, and 73% exposed to ART). Among persons aged 25–54 years, both fracture rates and relative proportion of fragility fractures were higher among HOPS patients than among outpatient controls. Older age, substance abuse, nadir CD4+ cell count <200 cells/mm, HCV infection and DM were associated with incident fractures [76].
What factors contribute to poor bone health in the HIV population?
Several factors that contribute to low bone density are present at a higher rate in the HIV population (Table 4). These include poor nutritional status in terms of suboptimal calcium and vitamin D intake, hypogonadism, low body weight, and alcohol, tobacco and substance abuse.
Vitamin D deficiency is very common in HIV-infected patients, with a prevalence of up to 60% to 75% [77]. Hypogonadism is also relatively common among HIV population [78], contributing to lower bone density. Co-infection with HCV is also associated with increased risk of fractures. In a large cohort of Medicaid beneficiaries, a significant increase in the risk of hip fracture was demonstrated in HCV/HIV co-infected subjects compared either with HCV mono-infected, HIV mono-infected or non-infected individuals [79]. In another large database study, a significantly higher risk of osteoporotic fracture (closed wrist, vertebral or hip fracture) was reported in HCV/HIV co-infected versus HIV mono-infected individuals [80] with fracture rates of 2.57 and 2.07/1000 patient-years (P < 0.001). Dual treatment for HIV/hepatitis B co-infection has also been shown to be associated with a higher risk of hip fracture compared to treatment of HIV mono-infected individuals [81].
HIV infection itself can increase bone loss and reduce bone formation through direct effects related to the HIV antigen load or indirect effects related to activation of the pro-inflammatory cytokines resulting in bone resorption and loss [82]. Co-infection with HCV and/or hepatitis B also contributes to lower bone density in this population. Certain ARVs may also contribute to low bone density in the HIV population. Lipoatrophy related to HIV may also mediate bone loss through complex relationship between central signaling of adipocyte hormones [82,83].
Direct Viral Effects
Several HIV viral proteins have been shown to promote osteoclast activity (vpr and gp120), suppress osteoblast activity (p55-gag) and increase osteoblast apoptosis [84], resulting in increased bone resorption and reduced bone formation, leading to low bone mass. High HIV RNA viral load and T-cell activation are also associated with elevated levels of receptor activator of nuclear factor kappa-B ligand (RANKL), which results in osteoclast formation and increased bone resorption [85]. Other endogenous physiological inhibitors of osteoclastogenesis such as osteoprotegrin and interferon-γ levels are also remarkably downregulated in advanced HIV infection, resulting in increased bone resorption [86]. At a cellular level, HIV proteins including Tat and Nef reduce the number of available mesenchymal stem cell (MSC) precursors that proliferate into osteoblasts by inducing MSC senescence, due to increased oxidative stress and mitochondrial dysfunction resulting in reduced proliferation of osteoblasts and lower rates of bone formation [87]. Collectively, these mechanisms result in significant uncoupling of bone formation and resorption, resulting in less bone formation and greater rate of bone loss and lower bone density.
Pro-inflammatory Pathways
Cytokines and other soluble immune factors play a major role in the physiology of osteoblast maturation and osteoclastic bone resorption [88,89]. Immune dysfunction and persistent inflammation in HIV result in increased levels of several inflammatory cytokines, including tumor necrosis factor (TNF)-α, interleukin-6 (IL-6), and RANKL, resulting in stimulation of osteoclastogenesis and bone resorption [90]. Due to a disruption between T and B cells in HIV and decreased osteoprotegrin (OPG) production and increased RANKL level, RANKL/OPG ratio is elevated, favoring osteoclastogenesis [91].
Is antiretroviral therapy associated with bone loss?
The initiation of ART has been reported to cause 2% to 6% bone loss irrespective of the regimen used, similar to that sustained in the first 2 years after menopause [92]. Certain NRTIs and PIs are associated with higher rates of bone loss than others. TDF has been associated most commonly with decreased bone mineral density, which usually stabilizes with continued use [93]. In a randomized trial comparing 4 treatment arms of ABC/3TC or TDF/FTC with EFV or ATV/ritonavir, TDF was associated with a greater reduction in BMD compared to abacavir-based regimens [94]. The likely cause of this may be TDF-mediated renal toxicity, including proximal tubular dysfunction and hypophosphatemia, resulting in increased PTH and bone resorption, and nephrogenic diabetes insipidus [95]. TAF is another prodrug of tenofovir diphosphate associated with less renal and bone toxicity compared with TDF. TAF has been associated with significantly less decrease in bone mineral density and renal dysfunction in randomized studies compared to regimen using TDF [17]. Vitamin D deficiency and hypophosphatemia associated with TDF therapy may present with osteomalacia, which predisposes to bone pain and fractures. Treatment with TDF may rarely be associated with the development of Fanconi syndrome and osteomalacia [96]. BMD is often severely reduced and bone pain and pathological fractures are characteristic features. Certain PI regimens containing ritonavir-boosted atazanavir have also been associated with greater bone loss in the spine than the hip, compared to efavirenz-containing regimens [97].
The universal bone loss associated with ART is thought to be a result of the "immune reconstitution inflammatory syndrome" (IRIS). This occurs as a result of rapid improvement in immune function after the commencement of ARV as a result of systemic or local inflammation, resulting in increased levels of cytokines that may contribute to bone loss. This has been shown in animal studies where T cell transplantation into immunocompromised mice to mimic ARV-induced T-cell expansion resulted in increased RANKL and TNF-α production by B cells and/or T cells, accompanied by enhanced bone resorption and BMD loss. When TNF-α or RANKL-null T-cells or TNF-α antagonists were used instead, the loss of cortical bone was prevented [98]. In a prospective study evaluating changes in bone turnover markers and inflammatory cytokines with ARV therapy in HIV infected subjects, a significant increase in bone resorption markers, RANKL and TNF-α were seen after initiation of ARV. The magnitude of CD4-cell recovery correlated with the increase in markers of bone resorption [99], suggesting that recovery of the immune system contributes to the increase in cytokine-mediated bone resorption.
How is bone health and fracture risk assessed in the HIV-positive population?
The predictive value of low BMD for fracture risk assessment in the HIV-positive population has not been established. In the absence of definitive data, the fracture risk assessment and standard methods of measuring bone density using DXA are utilized. In a large study of 1000 men and women, osteoporosis defined as a BMD T-score –2.5 as measured by DXA, was associated with a significantly increased risk of incident fractures but was not a good predictor of morphometric vertebral fractures [100]. In the absence of prospective longitudinal studies evaluating the bone density parameters at which fracture risk is significantly increased in the HIV population, it is reasonable to follow the guidelines used in the non-HIV population.
The approach to treatment of osteopenia and osteoporosis is similar to that in non HIV-infected population and is directed at lifestyle changes and treatment of secondary causes of osteoporosis [101], followed by initiation of antiresorptive therapy.
Management of Bone Disease
There are several guidelines available for the management of bone disease in the HIV population. The most recent guidelines from the IDSA [12] recommend assessing the risk of fragility fracture using the Fracture Risk Assessment Tool (FRAX), without DXA, in all HIV-infected men aged 40–49 years and HIV-infected premenopausal women aged ≥ 40 years. DXA should be performed in men aged ≥ 50 years, postmenopausal women, patients with a history of fragility fracture, patients receiving chronic glucocorticoid treatment, and patients at high risk of falls. In resource-limited settings, FRAX without bone mineral density can be substituted for DXA. ART guidelines should be followed. TDF and boosted PIs should be avoided if possible in at-risk patients. Dietary and lifestyle management strategies for high-risk patients should be employed and anti-osteoporosis treatment initiated if indicated [102].
The FRAX tool is available at www.shef.ac.uk/FRAX/ and is used to calculate 10-year fracture risk using patient clinical data, including presence of risk factors for osteoporosis. The tool is population-specific by race and region. It has not been validated for the HIV-positive population and may underestimate fracture risk [103]. HIV status is considered a secondary cause of osteoporosis in FRAX calculation.
The National Osteoporosis Foundation recommends screening with DXA for all women > 65 years of age, all men > 70 years of age, and adults > 50 years of age with additional risk factors for osteoporosis. Evaluation for secondary causes for low BMD should always be considered in the HIV-positive population including evaluation of calcium and vitamin D intake. Laboratory testing may include complete blood count, calcium, phosphate, albumin, creatinine, PTH, 25 hydroxy vitamin D (25,OHD) and 24 hour urine for evaluation of calcium, creatinine and phosphate (especially if on TDF) excretion. Testosterone level can be checked in men and estradiol, prolactin, FSH and LH in women for evaluation of hypogonadism. Bone turnover markers (bone specific alkaline phosphatase and serum C-terminal telopeptide) can also be assessed at baseline.
Studies using high-resolution peripheral quantitative computed tomography (HSPQCT) have shown significant reductions in tibial trabecular bone density and trabecular number in pre-menopausal and postmenopausal HIV-infected women [104], with reduced bone stiffness measured using finite element analysis [105]. Co-infection with HCV is also associated with significantly lower trabecular volumetric BMD and smaller cortical dimensions in the tibia, compared to healthy subjects [106]. HSPQCT is not widely available for clinical use at this time. Lateral imaging of the spine or vertebral morphometric analysis may be done in cases of height loss to assess for occult vertebral compression fractures.
There is a high prevalence of vitamin D deficiency in the HIV-infected population [107]. Treatment goal is to have a vitamin D level of at least 30 ng/mL, based on Endocrine Society practice guidelines [108], and may require supplementation with 1000–2000 units of vitamin D daily. Calcium intake should be optimized, averaging 1000 mg per day including diet and supplements, to be taken in divided amounts through the day for optimal absorption. Secondary causes of low bone density as mentioned in Table 4 should also be addressed. Patients should be counseled on tobacco and alcohol abuse. Corticosteroids should be dosed at the lowest dose needed. Medications such as proton pump inhibitors can impair the absorption of calcium carbonate, in which case calcium citrate supplements should be used if there is suboptimal calcium intake in the diet.
Which medications have been shown to be effective in treatment of osteoporosis in the HIV population?
Bisphosphonates are the mainstay of therapy for osteoporosis in the HIV-infected population. Only alendronate and zoledronate have substantial evidence of safety and effectiveness in the HIV-infected population, but these studies have been small and of limited duration.
Bisphosphonates are pyrophosphate analogues that inhibit bone resorption by binding to the hydroxyapatite crystals in the bone. Several prospective studies have shown alendronate to increase bone density compared to calcium and vitamin D alone in the HIV infected patients with reduced bone density [109,110], with significant reduction in markers of bone resorption [111].
Zoledronic acid (ZA), an amino-bisphosphonate which is infused intravenously, has also been used in smaller studies in HIV-infected persons. In a prospective study evaluating yearly ZA infusion to biennial ZA infusion in subjects with HIV and low bone density [112], biennial ZA infusions were found to be effective in improving and maintaining bone density in the HIV population. In another prospective study evaluating the effects of ZA in HIV-positive men, ZA infusion was given at baseline and at 12 months. Compared to placebo, treatment group had significantly higher bone density and lower bone turnover markers till 5 years after the last infusion [113].
In a meta-analysis evaluating the effect of bisphosphonates on bone mineral density in 328 adults with HIV infection from 8 randomized controlled trials (5 with alendronate and 3 with ZA as the intervention), a significant increase in BMD at the lumbar spine and hip was observed in the treatment groups at 48 and 96 weeks. However, these studies were not long enough to detect the impact of bisphosphonates on fracture risk [114]. ZA has also been shown to be effective in preventing ARV induced bone loss after a single infusion [115].
These studies confirm that both alendronate and ZA are effective in improving BMD in the HIV-infected population, with early studies showing a beneficial effect of ZA in mitigating ARV-induced bone loss as well. DXA may be repeated 1 to 2 years after initiation of osteoporosis therapy and less often subsequently if BMD is stable to improved [116].
Although these studies show significant improvement in bone density with treatment, longitudinal data on fracture reduction with these medications in the HIV-infected population are not available. Additionally, these patients have onset of osteoporosis at a younger age and the need for osteoporosis treatment needs to be assessed carefully before initiating treatment. There are other medications available for the treatment of osteoporosis in the non-HIV population such as raloxifene, teriparatide and denosumab, but no randomized controlled studies of these agents are available in the HIV-infected population.
Summary
The advent of highly potent antiretroviral therapy capable of early and prolonged viral suppression in HIV-infected patients has resulted in significant increases in life span. As we have already seen, this will likely lead to a rising incidence of various metabolic complications of HIV and ARV, including hyperlipidemia and diabetes with associated cardiovascular disease risk. A keen awareness of these potential complications, drug interactions, and possible toxicities will be paramount to their successful management. Appropriate care of HIV-infected individuals going forward will likely require multidisciplinary collaboration as the epidemic evolves to allow our patients to live not only longer, but healthier lives.
Corresponding author: Lisa M. Chirch, MD, UCONN Health, Farmington, CT 06030, chirch@uchc.edu.
Financial disclosures: None
Author contributions: All authors contributed equally to this article
1. UNAIDS. Fact sheet - Latest statistics on the status of the AIDS epidemic. Accessed 10 Nov 2017 at http://www.unaids.org/en/resources/fact-sheet.
2. Panel on Antiretroviral Guidelines for Adults and Adolescents. Guidelines for the use of antiretroviral agents in HIV-1-infected adults and adolescents. Department of Health and Human Services. Accessed 10 Nov 2017 at https://aidsinfo.nih.gov/contentfiles/lvguidelines/adultandadolescentgl.pdf.
3. Samji H, Cescon A, Hogg RS, et al. Closing the gap: increases in life expectancy among treated HIV-positive individuals in the United States and Canada. PloS One 2013;8:e81355.
4. Pedersen KK, Pedersen M, Troseid M, et al. Microbial translocation in HIV infection is associated with dyslipidemia, insulin resistance, and risk of myocardial infarction. J Acquir Immune Defic Syndr 2013;64:425–33.
5. Strategies for Management of Antiretroviral Therapy Study Group, El-Sadr WM, Lundgren J, et al. CD4+ count-guided interruption of antiretroviral treatment. N Engl J Med 2006;355:2283–96.
6. Chastain DB, Henderson H, Stover KR. Epidemiology and management of antiretroviral-associated cardiovascular disease. Open AIDS J 2015;9:23–37.
7. Group ISS, Lundgren JD, Babiker AG, et al. Initiation of antiretroviral therapy in early asymptomatic HIV infection. N Engl J Med 2015;373:795–807.
8. Moyle GJ, Orkin C, Fisher M, et al. A randomized comparative trial of continued abacavir/lamivudine plus efavirenz or replacement with efavirenz/emtricitabine/tenofovir DF in hypercholesterolemic HIV-1 infected individuals. PloS One 2015;10:e0116297.
9. Mothe B, Perez I, Domingo P, et al. HIV-1 infection in subjects older than 70: a multicenter cross-sectional assessment in Catalonia, Spain. Curr HIV Res 2009;7:597–600.
10. Calvo M, Martinez E. Update on metabolic issues in HIV patients. Curr Opin HIV AIDS 2014;9:332–9.
11. Gillard BK, Raya JL, Ruiz-Esponda R, et al. Impaired lipoprotein processing in HIV patients on antiretroviral therapy: aberrant high-density lipoprotein lipids, stability, and function. Arterioscler Thromb Vasc Biol 2013;33:1714-21.
12. Aberg JA, Gallant JE, Ghanem KG, et al. Primary care guidelines for the management of persons infected with HIV: 2013 update by the HIV Medicine Association of the Infectious Diseases Society of America. Clin Infect Dis 2014;58:1–10.
13. Calza L, Colangeli V, Manfredi R, et al. Clinical management of dyslipidaemia associated with combination antiretroviral therapy in HIV-infected patients. J Antimicrob Chemother 2016;71:1451–65.
14. Friis-Moller N, Weber R, Reiss P, et al. Cardiovascular disease risk factors in HIV patients--association with antiretroviral therapy. Results from the DAD study. AIDS 2003;17:1179–93.
15. Husain NE, Ahmed MH. Managing dyslipidemia in HIV/AIDS patients: challenges and solutions. HIV/AIDS (Auckl) 2015;7:1–10.
16. Panel on Antiretroviral Guidelines for Adults and Adolescents. Guidelines for the use of antiretroviral agents in adults and adolescents living with HIV. Department of Health and Human Services. Accessed at www.aidsinfo.nih.gov/ContentFiles/AdultandAdolescentGL.pdf.
17. Sax PE, Wohl D, Yin MT, et al. Tenofovir alafenamide versus tenofovir disoproxil fumarate, coformulated with elvitegravir, cobicistat, and emtricitabine, for initial treatment of HIV-1 infection: two randomised, double-blind, phase 3, non-inferiority trials. Lancet 2015;385:2606–15.
18. Sax PE, Zolopa A, Brar I, et al. Tenofovir alafenamide vs. tenofovir disoproxil fumarate in single tablet regimens for initial HIV-1 therapy: a randomized phase 2 study. J Acquir Immune Defic Syndr 2014;67:52–8.
19. Eron JJ, Young B, Cooper DA, et al. Switch to a raltegravir-based regimen versus continuation of a lopinavir-ritonavir-based regimen in stable HIV-infected patients with suppressed viraemia (SWITCHMRK 1 and 2): two multicentre, double-blind, randomised controlled trials. Lancet 2010;375:396–407.
20. Quercia R, Roberts J, Martin-Carpenter L, Zala C. Comparative changes of lipid levels in treatment-naive, HIV-1-infected adults treated with dolutegravir vs. efavirenz, raltegravir, and ritonavir-boosted darunavir-based regimens over 48 weeks. Clin Drug Investig 2015;35:211–9.
21. Lennox JL, DeJesus E, Berger DS, et al. Raltegravir versus efavirenz regimens in treatment-naive hiv-1–infected patients: 96-week efficacy, durability, subgroup, safety, and metabolic analyses. J Acquir Immune Defic Syndr 2010;55:39–48.
22. Nayor M, Vasan RS. Recent update to the US cholesterol treatment guidelines. a comparison with international guidelines. Circulation 2016;133:1795–806.
23. Stone NJ, Robinson JG, Lichtenstein AH, et al. 2013 ACC/AHA guideline on the treatment of blood cholesterol to reduce atherosclerotic cardiovascular risk in adults: a report of the American College of Cardiology/American Heart Association Task Force on Practice Guidelines. J Am Coll Cardiol 2014;63:2889–934.
24. Mitka M. Exploring statins to decrease HIV-related heart disease risk. JAMA 2015;314:657–9.
25. Dube MP, Stein JH, Aberg JA, et al. Guidelines for the evaluation and management of dyslipidemia in human immunodeficiency virus (HIV)-infected adults receiving antiretroviral therapy: recommendations of the HIV Medical Association of the Infectious Diseases Society of America and the Adult AIDS Clinical Trials Group. Clin Infect Dis 2003;37:613–27.
26. Milazzo L, Menzaghi B, Corvasce S, et al. Safety of statin therapy in HIV/hepatitis C virus-coinfected patients. J Acquir Immune Defic Syndr 2007;46:258–60.
27. Hernandez-Romieu AC, Garg S, Rosenberg ES, et al. Is diabetes prevalence higher among HIV-infected individuals compared with the general population? Evidence from MMP and NHANES 2009-2010. BMJ Open Diab Res Care 2017;5:e000304.
28. Brown TT, Cole SR, Li X, et al. Antiretroviral therapy and the prevalence and incidence of diabetes mellitus in the multicenter AIDS cohort study. Arch Intern Med 2005;165:1179–84.
29. De Wit S, Sabin CA, Weber R, et al. Incidence and risk factors for new-onset diabetes in HIV-infected patients: the Data Collection on Adverse Events of Anti-HIV Drugs (D:A:D) study. Diabetes Care 2008;31:1224–9.
30. Rasmussen LD, Mathiesen ER, Kronborg G, et al. Risk of diabetes mellitus in persons with and without HIV: a Danish nationwide population-based cohort study. PloS One 2012;7:e44575.
31. Polsky S, Floris-Moore M, Schoenbaum EE, et al. Incident hyperglycaemia among older adults with or at-risk for HIV infection. Antivir Ther 2011;16:181–8.
32. Triant VA, Lee H, Hadigan C, Grinspoon SK. Increased acute myocardial infarction rates and cardiovascular risk factors among patients with human immunodeficiency virus disease. J Clin Endocrinol Metab 2007;92:2506–12.
33. Galli L, Salpietro S, Pellicciotta G, et al. Risk of type 2 diabetes among HIV-infected and healthy subjects in Italy. Eur J Epidemiol 2012;27:657–65.
34. Howard AA, Hoover DR, Anastos K, et al. The effects of opiate use and hepatitis C virus infection on risk of diabetes mellitus in the Women’s Interagency HIV Study. J Acquir Immune Defic Syndr 2010;54:152–9.
35. Butt AA, McGinnis K, Rodriguez-Barradas MC, et al. HIV infection and the risk of diabetes mellitus. AIDS 2009;23:1227–34.
36. Hadigan C, Kattakuzhy S. Diabetes mellitus type 2 and abnormal glucose metabolism in the setting of human immunodeficiency virus. Endocrin Metab Clin North Am 2014;43:685–96.
37. Butt AA, Fultz SL, Kwoh CK, Kelley D, et al. Risk of diabetes in HIV infected veterans pre- and post-HAART and the role of HCV coinfection. Hepatology 2004;40:115–9.
38. Veloso S, Escote X, Ceperuelo-Mallafre V, et al. Leptin and adiponectin, but not IL18, are related with insulin resistance in treated HIV-1-infected patients with lipodystrophy. Cytokine 2012;58:253–60.
39. Vigouroux C, Maachi M, Nguyen TH, et al. Serum adipocytokines are related to lipodystrophy and metabolic disorders in HIV-infected men under antiretroviral therapy. AIDS 2003;17:1503–11.
40. Palmer CS, Hussain T, Duette G, et al. Regulators of glucose metabolism in CD4+ and CD8+ T cells. Int Rev Immunol 2016;35:477–88.
41. Mehta SH, Moore RD, Thomas DL, et al. The effect of HAART and HCV infection on the development of hyperglycemia among HIV-infected persons. J Acquir Immune Defic Syndr 2003;33:577–84.
42. Monroe AK, Dobs AS, Xu X, et al. Sex hormones, insulin resistance, and diabetes mellitus among men with or at risk for HIV infection. J Acquir Immune Defic Syndr 2011;58:173–80.
43. Rotger M, Gsponer T, Martinez R, et al. Impact of single nucleotide polymorphisms and of clinical risk factors on new-onset diabetes mellitus in HIV-infected individuals. Clin Infect Dis 2010;51:1090–8.
44. Ledergerber B, Furrer H, Rickenbach M, et al. Factors associated with the incidence of type 2 diabetes mellitus in HIV-infected participants in the Swiss HIV Cohort Study. Clin Infect Dis 2007;45:111–9.
45. Hruz PW. Molecular mechanisms for insulin resistance in treated HIV-infection. Best practice & research. Clin Endocrin Metab 2011;25:459–68.
46. Brown TT, Li X, Cole SR, et al. Cumulative exposure to nucleoside analogue reverse transcriptase inhibitors is associated with insulin resistance markers in the Multicenter AIDS Cohort Study. AIDS 2005;19:1375–83.
47. Cossarizza A, Moyle G. Antiretroviral nucleoside and nucleotide analogues and mitochondria. AIDS 2004;18:137–51.
48. Lowell BB, Shulman GI. Mitochondrial dysfunction and type 2 diabetes. Science 2005;307:384-7.
49. McComsey GA, Paulsen DM, Lonergan JT, et al. Improvements in lipoatrophy, mitochondrial DNA levels and fat apoptosis after replacing stavudine with abacavir or zidovudine. AIDS 2005;19:15–23.
50. Venhoff N, Setzer B, Melkaoui K, Walker UA. Mitochondrial toxicity of tenofovir, emtricitabine and abacavir alone and in combination with additional nucleoside reverse transcriptase inhibitors. Antivir Ther 2007;12:1075–85.
51. Haubrich RH, Riddler SA, DiRienzo AG, et al. Metabolic outcomes in a randomized trial of nucleoside, nonnucleoside and protease inhibitor-sparing regimens for initial HIV treatment. AIDS 2009;23:1109–18.
52. Aberg JA, Tebas P, Overton ET, et al. Metabolic effects of darunavir/ritonavir versus atazanavir/ritonavir in treatment-naive, HIV type 1-infected subjects over 48 weeks. AIDS Res Hum Retrovir 2012;28:1184–95.
53. Overton ET, Tebas P, Coate B, et al. Effects of once-daily darunavir/ritonavir versus atazanavir/ritonavir on insulin sensitivity in HIV-infected persons over 48 weeks: results of an exploratory substudy of METABOLIK, a phase 4, randomized trial. HIV Clin Trials 2016;17:72–7.
54. Sattar N, Preiss D, Murray HM, et al. Statins and risk of incident diabetes: a collaborative meta-analysis of randomised statin trials. Lancet 2010;375:735–42.
55. McComsey G, Jiang Y, Erlandson KM, et al. Rosuvastatin improves hip bone mineral density but worsens insulin resistance. Boston, MA: Conference on Retroviruses and Opportunistic Infections; 2014.
56. Lichtenstein K DR, Wood K, et al. Statin use is associated with incident diabetes mellitus among patients in the HIV Outpatient Study. Atlanta, GA: Conference on Retroviruses and Opportunistic Infections; 2013.
57. Spagnuolo V GL, Poli A, et al. Association between statin use and type 2 diabetes mellitus occurrence among HIV-1+ patients receiving ART. Atlanta, GA: Conference on Retroviruses and Opportunistic Infections; 2013.
58. Wang KL, Liu CJ, Chao TF, et al. Statins, risk of diabetes, and implications on outcomes in the general population. J Am Coll Cardiol 2012;60:1231–8.
59. Ridker PM, Pradhan A, MacFadyen JG, et al. Cardiovascular benefits and diabetes risks of statin therapy in primary prevention: an analysis from the JUPITER trial. Lancet 2012;380:565–71.
60. Bloomgarden ZT, Handelsman Y. Approaches to treatment 2: Comparison of American Association of Clinical Endocrinologists (AACE) and American Diabetes Association (ADA) type 2 diabetes treatment guidelines. J Diabetes 2016;8:4–6.
61. Kim PS, Woods C, Georgoff P, et al. A1C underestimates glycemia in HIV infection. Diabetes Care 2009;32:1591–3.
62. Diop ME, Bastard JP, Meunier N, et al. Inappropriately low glycated hemoglobin values and hemolysis in HIV-infected patients. AIDS Res Hum Retrovir 2006;22:1242–7.
63. Polgreen PM, Putz D, Stapleton JT. Inaccurate glycosylated hemoglobin A1C measurements in human immunodeficiency virus-positive patients with diabetes mellitus. Clin Infect Dis 2003;37:e53–56.
64. Glesby MJ, Hoover DR, Shi Q, et al. Glycated haemoglobin in diabetic women with and without HIV infection: data from the Women’s Interagency HIV Study. Antivir Ther 2010;15:571–7.
65. Slama L, Palella FJ Jr, Abraham AG, et al. Inaccuracy of haemoglobin A1c among HIV-infected men: effects of CD4 cell count, antiretroviral therapies and haematological parameters. J Antimicrob Chemother 2014;69:3360–7.
66. Inzucchi SE, Bergenstal RM, Buse JB, et al. Management of hyperglycaemia in type 2 diabetes: a patient-centered approach. Position statement of the American Diabetes Association (ADA) and the European Association for the Study of Diabetes (EASD). Diabetologia 2012;55:1577–96.
67. Look ARG, Pi-Sunyer X, Blackburn G, et al. Reduction in weight and cardiovascular disease risk factors in individuals with type 2 diabetes: one-year results of the look AHEAD trial. Diabetes Care 2007;30:1374–83.
68. Hajjar J, Habra MA, Naing A. Metformin: an old drug with new potential. Expert Opin Investig Drugs 2013;22:1511–7.
69. Kohli R, Shevitz A, Gorbach S, Wanke C. A randomized placebo-controlled trial of metformin for the treatment of HIV lipodystrophy. HIV Med 2007;8:420–6.
70. Tivicay prescribing information. Accessed at www.gsksource.com/pharma/content/dam/GlaxoSmithKline/US/en/Prescribing_Information/Tivicay/pdf/TIVICAY-PI-PIL.PDF.
71. Han JH, Gordon K, Womack JA, et al. Comparative effectiveness of diabetic oral medications among HIV-infected and HIV-uninfected veterans. Diabetes Care 2017;40:218–25.
72. Brown TT, Qaqish RB. Antiretroviral therapy and the prevalence of osteopenia and osteoporosis: a meta-analytic review. AIDS 2006;20:2165–74.
73. Libois A, Clumeck N, Kabeya K, et al. Risk factors of osteopenia in HIV-infected women: no role of antiretroviral therapy. Maturitas 2010;65:51–4.
74. Carr A, Grund B, Neuhaus J, et al. Prevalence of and risk factors for low bone mineral density in untreated HIV infection: a substudy of the INSIGHT Strategic Timing of AntiRetroviral Treatment (START) trial. HIV Med 2015;16 Suppl 1:137–46.
75. Triant VA, Brown TT, Lee H, Grinspoon SK. Fracture prevalence among human immunodeficiency virus (HIV)-infected versus non-HIV-infected patients in a large U.S. healthcare system. J Clin Endocrinol Metab 2008;93:3499–504.
76. Young B, Dao CN, Buchacz K, Baker R, Brooks JT, Investigators HIVOS. Increased rates of bone fracture among HIV-infected persons in the HIV Outpatient Study (HOPS) compared with the US general population, 2000-2006. Clin Infect Dis 2011;52:1061–8.
77. Rodriguez M, Daniels B, Gunawardene S, Robbins GK. High frequency of vitamin D deficiency in ambulatory HIV-Positive patients. AIDS Res Hum Retrovir 2009;25:9–14.
78. Teichmann J, Lange U, Discher T, et al. Bone mineral density in human immunodeficiency virus-1 infected men with hypogonadism prior to highly-active-antiretroviral-therapy (HAART). Eur J Med Res 2009;14:59–64.
79. Lo Re V 3rd, Volk J, Newcomb CW, et al. Risk of hip fracture associated with hepatitis C virus infection and hepatitis C/human immunodeficiency virus coinfection. Hepatology 2012;56:1688–98.
80. Maalouf NM, Zhang S, Drechsler H, et al. Hepatitis C co-infection and severity of liver disease as risk factors for osteoporotic fractures among HIV-infected patients. J Bone Miner Res 2013;28:2577–83.
81. Byrne DD, Newcomb CW, Carbonari DM, et al. Increased risk of hip fracture associated with dually treated HIV/hepatitis B virus coinfection. J Viral Hepat 2015;22:936–47.
82. Gilsanz V, Chalfant J, Mo AO, et al. Reciprocal relations of subcutaneous and visceral fat to bone structure and strength. J Clin Endocrinol Metab 2009;94:3387–93.
83. Rosen CJ, Klibanski A. Bone, fat, and body composition: evolving concepts in the pathogenesis of osteoporosis. Am J Med 2009;122:409–14.
84. Fakruddin JM, Laurence J. HIV envelope gp120-mediated regulation of osteoclastogenesis via receptor activator of nuclear factor kappa B ligand (RANKL) secretion and its modulation by certain HIV protease inhibitors through interferon-gamma/RANKL cross-talk. J Biol Chem 2003;278:48251–8.
85. Gazzola L, Bellistri GM, Tincati C, et al. Association between peripheral T-Lymphocyte activation and impaired bone mineral density in HIV-infected patients. J Transl Med 2013;11:51.
86. Clerici M, Shearer GM. A TH1-->TH2 switch is a critical step in the etiology of HIV infection. Immunol Today 1993;14:107–11.
87. Chew N, Tan E, Li L, Lim R. HIV-1 tat and rev upregulates osteoclast bone resorption. J Int AIDS Soc 2014;17(4 Suppl 3):19724.
88. McComsey GA, Tebas P, Shane E, et al. Bone disease in HIV infection: a practical review and recommendations for HIV care providers. Clin Infect Dis 2010;51:937–46.
89. Panayiotopoulos A, Bhat N, Bhangoo A. Bone and vitamin D metabolism in HIV. Rev Endocr Metab Disord 2013;14:119–25.
90. Fakruddin JM, Laurence J. Interactions among human immunodeficiency virus (HIV)-1, interferon-gamma and receptor of activated NF-kappa B ligand (RANKL): implications for HIV pathogenesis. Clin Exp Immunol 2004;137:538–45.
91. Li Y, Toraldo G, Li A, et al. B cells and T cells are critical for the preservation of bone homeostasis and attainment of peak bone mass in vivo. Blood 2007;109:3839–48.
92. Finkelstein JS, Brockwell SE, Mehta V, et al. Bone mineral density changes during the menopause transition in a multiethnic cohort of women. J Clin Endocrinol Metab 2008;93:861–8.
93. Huang JS, Hughes MD, Riddler SA, Haubrich RH, Aids Clinical Trials Group AST. Bone mineral density effects of randomized regimen and nucleoside reverse transcriptase inhibitor selection from ACTG A5142. HIV Clin Trials 2013;145:224–34.
94. McComsey GA, Kitch D, Daar ES, et al. Bone mineral density and fractures in antiretroviral-naive persons randomized to receive abacavir-lamivudine or tenofovir disoproxil fumarate-emtricitabine along with efavirenz or atazanavir-ritonavir: Aids Clinical Trials Group A5224s, a substudy of ACTG A5202. J Infect Dis 2011;203:1791–801.
95. Schafer JJ, Manlangit K, Squires KE. Bone health and human immunodeficiency virus infection. Pharmacotherapy 2013;33:665–82.
96. Mateo L, Holgado S, Marinoso ML, et al. Hypophosphatemic osteomalacia induced by tenofovir in HIV-infected patients. Clin Rheumatol 2016;35:1271–9.
97. Brown TT, Moser C, Currier JS, et al. Changes in bone mineral density after initiation of antiretroviral treatment with tenofovir disoproxil fumarate/emtricitabine plus atazanavir/ritonavir, darunavir/ritonavir, or raltegravir. J Infect Dis 2015;212:1241–9.
98. Ofotokun I, Titanji K, Vikulina T, et al. Role of T-cell reconstitution in HIV-1 antiretroviral therapy-induced bone loss. Nat Commun 2015;6:8282.
99. Ofotokun I, Titanji K, Vunnava A, et al. Antiretroviral therapy induces a rapid increase in bone resorption that is positively associated with the magnitude of immune reconstitution in HIV infection. AIDS 2016;30:405–14.
100. Stephens KI, Rubinsztain L, Payan J, et al. Dual-energy x-ray absorptiometry and calculated FRAX risk scores may underestimate osteoporotic fracture risk in vitamin d-deficient veterans with HIV infection. Endocr Pract 2016;22:440–6.
101. Mirza F, Canalis E. Management of endocrine disease: Secondary osteoporosis: pathophysiology and management. Eur J Endocrinol 2015;173:R131–151.
102. Brown TT, Hoy J, Borderi M, et al. Recommendations for evaluation and management of bone disease in HIV. Clin Infect Dis 2015;60:1242–51.
103. Mazzotta E, Ursini T, Agostinone A, et al. Prevalence and predictors of low bone mineral density and fragility fractures among HIV-infected patients at one Italian center after universal DXA screening: sensitivity and specificity of current guidelines on bone mineral density management. AIDS Patient Care STDS 2015;29:169–80.
104. Calmy A, Chevalley T, Delhumeau C, et al. Long-term HIV infection and antiretroviral therapy are associated with bone microstructure alterations in premenopausal women. Osteoporos Int 2013;24:1843–52.
105. Yin MT, Lund E, Shah J, et al. Lower peak bone mass and abnormal trabecular and cortical microarchitecture in young men infected with HIV early in life. AIDS 2014;28:345–53.
106. Lo Re V, 3rd, Lynn K, Stumm ER, et al. Structural bone deficits in HIV/HCV-coinfected, HCV-monoinfected, and HIV-monoinfected women. J Infect Dis 2015;212:924–33.
107. Allavena C, Delpierre C, Cuzin L, et al. High frequency of vitamin D deficiency in HIV-infected patients: effects of HIV-related factors and antiretroviral drugs. J Antimicrob Chemother 2012;67:2222–30.
108. Holick MF, Binkley NC, Bischoff-Ferrari HA, et al. Evaluation, treatment, and prevention of vitamin D deficiency: an Endocrine Society clinical practice guideline. J Clin Endocrinol Metab 2011;96:1911–30.
109. Mondy K, Powderly WG, Claxton SA, et al. Alendronate, vitamin D, and calcium for the treatment of osteopenia/osteoporosis associated with HIV infection. J Acquir Immune Defic Syndr 2005;38:426–31.
110. McComsey GA, Kendall MA, Tebas P, et al. Alendronate with calcium and vitamin D supplementation is safe and effective for the treatment of decreased bone mineral density in HIV. AIDS 2007;21:2473–82.
111. Guaraldi G, Orlando G, Madeddu G, et al. Alendronate reduces bone resorption in HIV-associated osteopenia/osteoporosis. HIV Clin Trials 2004;5:269–77.
112. Negredo E, Bonjoch A, Perez-Alvarez N, et al. Comparison of two different strategies of treatment with zoledronate in HIV-infected patients with low bone mineral density: single dose versus two doses in 2 years. HIV Med 2015;16:441–8.
113. Bolland MJ, Grey A, Horne AM, et al. Effects of intravenous zoledronate on bone turnover and bone density persist for at least five years in HIV-infected men. J Clin Endocrinol Metab 2012;97:1922–8.
114. Pinzone MR, Moreno S, Cacopardo B, Nunnari G. Is there enough evidence to use bisphosphonates in HIV-infected patients? A systematic review and meta-analysis. AIDS Rev 2014;16:213–22.
115. Ofotokun I, Titanji K, Lahiri CD, et al. A Single-dose zoledronic acid infusion prevents antiretroviral therapy-induced bone loss in treatment-naive HIV-infected patients: a phase IIb trial. Clin Infect Dis 2016;63:663–71.
116. Lewiecki EM, Gordon CM, Baim S, et al. International Society for Clinical Densitometry 2007 adult and pediatric official positions. Bone 2008;43:1115–21.
1. UNAIDS. Fact sheet - Latest statistics on the status of the AIDS epidemic. Accessed 10 Nov 2017 at http://www.unaids.org/en/resources/fact-sheet.
2. Panel on Antiretroviral Guidelines for Adults and Adolescents. Guidelines for the use of antiretroviral agents in HIV-1-infected adults and adolescents. Department of Health and Human Services. Accessed 10 Nov 2017 at https://aidsinfo.nih.gov/contentfiles/lvguidelines/adultandadolescentgl.pdf.
3. Samji H, Cescon A, Hogg RS, et al. Closing the gap: increases in life expectancy among treated HIV-positive individuals in the United States and Canada. PloS One 2013;8:e81355.
4. Pedersen KK, Pedersen M, Troseid M, et al. Microbial translocation in HIV infection is associated with dyslipidemia, insulin resistance, and risk of myocardial infarction. J Acquir Immune Defic Syndr 2013;64:425–33.
5. Strategies for Management of Antiretroviral Therapy Study Group, El-Sadr WM, Lundgren J, et al. CD4+ count-guided interruption of antiretroviral treatment. N Engl J Med 2006;355:2283–96.
6. Chastain DB, Henderson H, Stover KR. Epidemiology and management of antiretroviral-associated cardiovascular disease. Open AIDS J 2015;9:23–37.
7. Group ISS, Lundgren JD, Babiker AG, et al. Initiation of antiretroviral therapy in early asymptomatic HIV infection. N Engl J Med 2015;373:795–807.
8. Moyle GJ, Orkin C, Fisher M, et al. A randomized comparative trial of continued abacavir/lamivudine plus efavirenz or replacement with efavirenz/emtricitabine/tenofovir DF in hypercholesterolemic HIV-1 infected individuals. PloS One 2015;10:e0116297.
9. Mothe B, Perez I, Domingo P, et al. HIV-1 infection in subjects older than 70: a multicenter cross-sectional assessment in Catalonia, Spain. Curr HIV Res 2009;7:597–600.
10. Calvo M, Martinez E. Update on metabolic issues in HIV patients. Curr Opin HIV AIDS 2014;9:332–9.
11. Gillard BK, Raya JL, Ruiz-Esponda R, et al. Impaired lipoprotein processing in HIV patients on antiretroviral therapy: aberrant high-density lipoprotein lipids, stability, and function. Arterioscler Thromb Vasc Biol 2013;33:1714-21.
12. Aberg JA, Gallant JE, Ghanem KG, et al. Primary care guidelines for the management of persons infected with HIV: 2013 update by the HIV Medicine Association of the Infectious Diseases Society of America. Clin Infect Dis 2014;58:1–10.
13. Calza L, Colangeli V, Manfredi R, et al. Clinical management of dyslipidaemia associated with combination antiretroviral therapy in HIV-infected patients. J Antimicrob Chemother 2016;71:1451–65.
14. Friis-Moller N, Weber R, Reiss P, et al. Cardiovascular disease risk factors in HIV patients--association with antiretroviral therapy. Results from the DAD study. AIDS 2003;17:1179–93.
15. Husain NE, Ahmed MH. Managing dyslipidemia in HIV/AIDS patients: challenges and solutions. HIV/AIDS (Auckl) 2015;7:1–10.
16. Panel on Antiretroviral Guidelines for Adults and Adolescents. Guidelines for the use of antiretroviral agents in adults and adolescents living with HIV. Department of Health and Human Services. Accessed at www.aidsinfo.nih.gov/ContentFiles/AdultandAdolescentGL.pdf.
17. Sax PE, Wohl D, Yin MT, et al. Tenofovir alafenamide versus tenofovir disoproxil fumarate, coformulated with elvitegravir, cobicistat, and emtricitabine, for initial treatment of HIV-1 infection: two randomised, double-blind, phase 3, non-inferiority trials. Lancet 2015;385:2606–15.
18. Sax PE, Zolopa A, Brar I, et al. Tenofovir alafenamide vs. tenofovir disoproxil fumarate in single tablet regimens for initial HIV-1 therapy: a randomized phase 2 study. J Acquir Immune Defic Syndr 2014;67:52–8.
19. Eron JJ, Young B, Cooper DA, et al. Switch to a raltegravir-based regimen versus continuation of a lopinavir-ritonavir-based regimen in stable HIV-infected patients with suppressed viraemia (SWITCHMRK 1 and 2): two multicentre, double-blind, randomised controlled trials. Lancet 2010;375:396–407.
20. Quercia R, Roberts J, Martin-Carpenter L, Zala C. Comparative changes of lipid levels in treatment-naive, HIV-1-infected adults treated with dolutegravir vs. efavirenz, raltegravir, and ritonavir-boosted darunavir-based regimens over 48 weeks. Clin Drug Investig 2015;35:211–9.
21. Lennox JL, DeJesus E, Berger DS, et al. Raltegravir versus efavirenz regimens in treatment-naive hiv-1–infected patients: 96-week efficacy, durability, subgroup, safety, and metabolic analyses. J Acquir Immune Defic Syndr 2010;55:39–48.
22. Nayor M, Vasan RS. Recent update to the US cholesterol treatment guidelines. a comparison with international guidelines. Circulation 2016;133:1795–806.
23. Stone NJ, Robinson JG, Lichtenstein AH, et al. 2013 ACC/AHA guideline on the treatment of blood cholesterol to reduce atherosclerotic cardiovascular risk in adults: a report of the American College of Cardiology/American Heart Association Task Force on Practice Guidelines. J Am Coll Cardiol 2014;63:2889–934.
24. Mitka M. Exploring statins to decrease HIV-related heart disease risk. JAMA 2015;314:657–9.
25. Dube MP, Stein JH, Aberg JA, et al. Guidelines for the evaluation and management of dyslipidemia in human immunodeficiency virus (HIV)-infected adults receiving antiretroviral therapy: recommendations of the HIV Medical Association of the Infectious Diseases Society of America and the Adult AIDS Clinical Trials Group. Clin Infect Dis 2003;37:613–27.
26. Milazzo L, Menzaghi B, Corvasce S, et al. Safety of statin therapy in HIV/hepatitis C virus-coinfected patients. J Acquir Immune Defic Syndr 2007;46:258–60.
27. Hernandez-Romieu AC, Garg S, Rosenberg ES, et al. Is diabetes prevalence higher among HIV-infected individuals compared with the general population? Evidence from MMP and NHANES 2009-2010. BMJ Open Diab Res Care 2017;5:e000304.
28. Brown TT, Cole SR, Li X, et al. Antiretroviral therapy and the prevalence and incidence of diabetes mellitus in the multicenter AIDS cohort study. Arch Intern Med 2005;165:1179–84.
29. De Wit S, Sabin CA, Weber R, et al. Incidence and risk factors for new-onset diabetes in HIV-infected patients: the Data Collection on Adverse Events of Anti-HIV Drugs (D:A:D) study. Diabetes Care 2008;31:1224–9.
30. Rasmussen LD, Mathiesen ER, Kronborg G, et al. Risk of diabetes mellitus in persons with and without HIV: a Danish nationwide population-based cohort study. PloS One 2012;7:e44575.
31. Polsky S, Floris-Moore M, Schoenbaum EE, et al. Incident hyperglycaemia among older adults with or at-risk for HIV infection. Antivir Ther 2011;16:181–8.
32. Triant VA, Lee H, Hadigan C, Grinspoon SK. Increased acute myocardial infarction rates and cardiovascular risk factors among patients with human immunodeficiency virus disease. J Clin Endocrinol Metab 2007;92:2506–12.
33. Galli L, Salpietro S, Pellicciotta G, et al. Risk of type 2 diabetes among HIV-infected and healthy subjects in Italy. Eur J Epidemiol 2012;27:657–65.
34. Howard AA, Hoover DR, Anastos K, et al. The effects of opiate use and hepatitis C virus infection on risk of diabetes mellitus in the Women’s Interagency HIV Study. J Acquir Immune Defic Syndr 2010;54:152–9.
35. Butt AA, McGinnis K, Rodriguez-Barradas MC, et al. HIV infection and the risk of diabetes mellitus. AIDS 2009;23:1227–34.
36. Hadigan C, Kattakuzhy S. Diabetes mellitus type 2 and abnormal glucose metabolism in the setting of human immunodeficiency virus. Endocrin Metab Clin North Am 2014;43:685–96.
37. Butt AA, Fultz SL, Kwoh CK, Kelley D, et al. Risk of diabetes in HIV infected veterans pre- and post-HAART and the role of HCV coinfection. Hepatology 2004;40:115–9.
38. Veloso S, Escote X, Ceperuelo-Mallafre V, et al. Leptin and adiponectin, but not IL18, are related with insulin resistance in treated HIV-1-infected patients with lipodystrophy. Cytokine 2012;58:253–60.
39. Vigouroux C, Maachi M, Nguyen TH, et al. Serum adipocytokines are related to lipodystrophy and metabolic disorders in HIV-infected men under antiretroviral therapy. AIDS 2003;17:1503–11.
40. Palmer CS, Hussain T, Duette G, et al. Regulators of glucose metabolism in CD4+ and CD8+ T cells. Int Rev Immunol 2016;35:477–88.
41. Mehta SH, Moore RD, Thomas DL, et al. The effect of HAART and HCV infection on the development of hyperglycemia among HIV-infected persons. J Acquir Immune Defic Syndr 2003;33:577–84.
42. Monroe AK, Dobs AS, Xu X, et al. Sex hormones, insulin resistance, and diabetes mellitus among men with or at risk for HIV infection. J Acquir Immune Defic Syndr 2011;58:173–80.
43. Rotger M, Gsponer T, Martinez R, et al. Impact of single nucleotide polymorphisms and of clinical risk factors on new-onset diabetes mellitus in HIV-infected individuals. Clin Infect Dis 2010;51:1090–8.
44. Ledergerber B, Furrer H, Rickenbach M, et al. Factors associated with the incidence of type 2 diabetes mellitus in HIV-infected participants in the Swiss HIV Cohort Study. Clin Infect Dis 2007;45:111–9.
45. Hruz PW. Molecular mechanisms for insulin resistance in treated HIV-infection. Best practice & research. Clin Endocrin Metab 2011;25:459–68.
46. Brown TT, Li X, Cole SR, et al. Cumulative exposure to nucleoside analogue reverse transcriptase inhibitors is associated with insulin resistance markers in the Multicenter AIDS Cohort Study. AIDS 2005;19:1375–83.
47. Cossarizza A, Moyle G. Antiretroviral nucleoside and nucleotide analogues and mitochondria. AIDS 2004;18:137–51.
48. Lowell BB, Shulman GI. Mitochondrial dysfunction and type 2 diabetes. Science 2005;307:384-7.
49. McComsey GA, Paulsen DM, Lonergan JT, et al. Improvements in lipoatrophy, mitochondrial DNA levels and fat apoptosis after replacing stavudine with abacavir or zidovudine. AIDS 2005;19:15–23.
50. Venhoff N, Setzer B, Melkaoui K, Walker UA. Mitochondrial toxicity of tenofovir, emtricitabine and abacavir alone and in combination with additional nucleoside reverse transcriptase inhibitors. Antivir Ther 2007;12:1075–85.
51. Haubrich RH, Riddler SA, DiRienzo AG, et al. Metabolic outcomes in a randomized trial of nucleoside, nonnucleoside and protease inhibitor-sparing regimens for initial HIV treatment. AIDS 2009;23:1109–18.
52. Aberg JA, Tebas P, Overton ET, et al. Metabolic effects of darunavir/ritonavir versus atazanavir/ritonavir in treatment-naive, HIV type 1-infected subjects over 48 weeks. AIDS Res Hum Retrovir 2012;28:1184–95.
53. Overton ET, Tebas P, Coate B, et al. Effects of once-daily darunavir/ritonavir versus atazanavir/ritonavir on insulin sensitivity in HIV-infected persons over 48 weeks: results of an exploratory substudy of METABOLIK, a phase 4, randomized trial. HIV Clin Trials 2016;17:72–7.
54. Sattar N, Preiss D, Murray HM, et al. Statins and risk of incident diabetes: a collaborative meta-analysis of randomised statin trials. Lancet 2010;375:735–42.
55. McComsey G, Jiang Y, Erlandson KM, et al. Rosuvastatin improves hip bone mineral density but worsens insulin resistance. Boston, MA: Conference on Retroviruses and Opportunistic Infections; 2014.
56. Lichtenstein K DR, Wood K, et al. Statin use is associated with incident diabetes mellitus among patients in the HIV Outpatient Study. Atlanta, GA: Conference on Retroviruses and Opportunistic Infections; 2013.
57. Spagnuolo V GL, Poli A, et al. Association between statin use and type 2 diabetes mellitus occurrence among HIV-1+ patients receiving ART. Atlanta, GA: Conference on Retroviruses and Opportunistic Infections; 2013.
58. Wang KL, Liu CJ, Chao TF, et al. Statins, risk of diabetes, and implications on outcomes in the general population. J Am Coll Cardiol 2012;60:1231–8.
59. Ridker PM, Pradhan A, MacFadyen JG, et al. Cardiovascular benefits and diabetes risks of statin therapy in primary prevention: an analysis from the JUPITER trial. Lancet 2012;380:565–71.
60. Bloomgarden ZT, Handelsman Y. Approaches to treatment 2: Comparison of American Association of Clinical Endocrinologists (AACE) and American Diabetes Association (ADA) type 2 diabetes treatment guidelines. J Diabetes 2016;8:4–6.
61. Kim PS, Woods C, Georgoff P, et al. A1C underestimates glycemia in HIV infection. Diabetes Care 2009;32:1591–3.
62. Diop ME, Bastard JP, Meunier N, et al. Inappropriately low glycated hemoglobin values and hemolysis in HIV-infected patients. AIDS Res Hum Retrovir 2006;22:1242–7.
63. Polgreen PM, Putz D, Stapleton JT. Inaccurate glycosylated hemoglobin A1C measurements in human immunodeficiency virus-positive patients with diabetes mellitus. Clin Infect Dis 2003;37:e53–56.
64. Glesby MJ, Hoover DR, Shi Q, et al. Glycated haemoglobin in diabetic women with and without HIV infection: data from the Women’s Interagency HIV Study. Antivir Ther 2010;15:571–7.
65. Slama L, Palella FJ Jr, Abraham AG, et al. Inaccuracy of haemoglobin A1c among HIV-infected men: effects of CD4 cell count, antiretroviral therapies and haematological parameters. J Antimicrob Chemother 2014;69:3360–7.
66. Inzucchi SE, Bergenstal RM, Buse JB, et al. Management of hyperglycaemia in type 2 diabetes: a patient-centered approach. Position statement of the American Diabetes Association (ADA) and the European Association for the Study of Diabetes (EASD). Diabetologia 2012;55:1577–96.
67. Look ARG, Pi-Sunyer X, Blackburn G, et al. Reduction in weight and cardiovascular disease risk factors in individuals with type 2 diabetes: one-year results of the look AHEAD trial. Diabetes Care 2007;30:1374–83.
68. Hajjar J, Habra MA, Naing A. Metformin: an old drug with new potential. Expert Opin Investig Drugs 2013;22:1511–7.
69. Kohli R, Shevitz A, Gorbach S, Wanke C. A randomized placebo-controlled trial of metformin for the treatment of HIV lipodystrophy. HIV Med 2007;8:420–6.
70. Tivicay prescribing information. Accessed at www.gsksource.com/pharma/content/dam/GlaxoSmithKline/US/en/Prescribing_Information/Tivicay/pdf/TIVICAY-PI-PIL.PDF.
71. Han JH, Gordon K, Womack JA, et al. Comparative effectiveness of diabetic oral medications among HIV-infected and HIV-uninfected veterans. Diabetes Care 2017;40:218–25.
72. Brown TT, Qaqish RB. Antiretroviral therapy and the prevalence of osteopenia and osteoporosis: a meta-analytic review. AIDS 2006;20:2165–74.
73. Libois A, Clumeck N, Kabeya K, et al. Risk factors of osteopenia in HIV-infected women: no role of antiretroviral therapy. Maturitas 2010;65:51–4.
74. Carr A, Grund B, Neuhaus J, et al. Prevalence of and risk factors for low bone mineral density in untreated HIV infection: a substudy of the INSIGHT Strategic Timing of AntiRetroviral Treatment (START) trial. HIV Med 2015;16 Suppl 1:137–46.
75. Triant VA, Brown TT, Lee H, Grinspoon SK. Fracture prevalence among human immunodeficiency virus (HIV)-infected versus non-HIV-infected patients in a large U.S. healthcare system. J Clin Endocrinol Metab 2008;93:3499–504.
76. Young B, Dao CN, Buchacz K, Baker R, Brooks JT, Investigators HIVOS. Increased rates of bone fracture among HIV-infected persons in the HIV Outpatient Study (HOPS) compared with the US general population, 2000-2006. Clin Infect Dis 2011;52:1061–8.
77. Rodriguez M, Daniels B, Gunawardene S, Robbins GK. High frequency of vitamin D deficiency in ambulatory HIV-Positive patients. AIDS Res Hum Retrovir 2009;25:9–14.
78. Teichmann J, Lange U, Discher T, et al. Bone mineral density in human immunodeficiency virus-1 infected men with hypogonadism prior to highly-active-antiretroviral-therapy (HAART). Eur J Med Res 2009;14:59–64.
79. Lo Re V 3rd, Volk J, Newcomb CW, et al. Risk of hip fracture associated with hepatitis C virus infection and hepatitis C/human immunodeficiency virus coinfection. Hepatology 2012;56:1688–98.
80. Maalouf NM, Zhang S, Drechsler H, et al. Hepatitis C co-infection and severity of liver disease as risk factors for osteoporotic fractures among HIV-infected patients. J Bone Miner Res 2013;28:2577–83.
81. Byrne DD, Newcomb CW, Carbonari DM, et al. Increased risk of hip fracture associated with dually treated HIV/hepatitis B virus coinfection. J Viral Hepat 2015;22:936–47.
82. Gilsanz V, Chalfant J, Mo AO, et al. Reciprocal relations of subcutaneous and visceral fat to bone structure and strength. J Clin Endocrinol Metab 2009;94:3387–93.
83. Rosen CJ, Klibanski A. Bone, fat, and body composition: evolving concepts in the pathogenesis of osteoporosis. Am J Med 2009;122:409–14.
84. Fakruddin JM, Laurence J. HIV envelope gp120-mediated regulation of osteoclastogenesis via receptor activator of nuclear factor kappa B ligand (RANKL) secretion and its modulation by certain HIV protease inhibitors through interferon-gamma/RANKL cross-talk. J Biol Chem 2003;278:48251–8.
85. Gazzola L, Bellistri GM, Tincati C, et al. Association between peripheral T-Lymphocyte activation and impaired bone mineral density in HIV-infected patients. J Transl Med 2013;11:51.
86. Clerici M, Shearer GM. A TH1-->TH2 switch is a critical step in the etiology of HIV infection. Immunol Today 1993;14:107–11.
87. Chew N, Tan E, Li L, Lim R. HIV-1 tat and rev upregulates osteoclast bone resorption. J Int AIDS Soc 2014;17(4 Suppl 3):19724.
88. McComsey GA, Tebas P, Shane E, et al. Bone disease in HIV infection: a practical review and recommendations for HIV care providers. Clin Infect Dis 2010;51:937–46.
89. Panayiotopoulos A, Bhat N, Bhangoo A. Bone and vitamin D metabolism in HIV. Rev Endocr Metab Disord 2013;14:119–25.
90. Fakruddin JM, Laurence J. Interactions among human immunodeficiency virus (HIV)-1, interferon-gamma and receptor of activated NF-kappa B ligand (RANKL): implications for HIV pathogenesis. Clin Exp Immunol 2004;137:538–45.
91. Li Y, Toraldo G, Li A, et al. B cells and T cells are critical for the preservation of bone homeostasis and attainment of peak bone mass in vivo. Blood 2007;109:3839–48.
92. Finkelstein JS, Brockwell SE, Mehta V, et al. Bone mineral density changes during the menopause transition in a multiethnic cohort of women. J Clin Endocrinol Metab 2008;93:861–8.
93. Huang JS, Hughes MD, Riddler SA, Haubrich RH, Aids Clinical Trials Group AST. Bone mineral density effects of randomized regimen and nucleoside reverse transcriptase inhibitor selection from ACTG A5142. HIV Clin Trials 2013;145:224–34.
94. McComsey GA, Kitch D, Daar ES, et al. Bone mineral density and fractures in antiretroviral-naive persons randomized to receive abacavir-lamivudine or tenofovir disoproxil fumarate-emtricitabine along with efavirenz or atazanavir-ritonavir: Aids Clinical Trials Group A5224s, a substudy of ACTG A5202. J Infect Dis 2011;203:1791–801.
95. Schafer JJ, Manlangit K, Squires KE. Bone health and human immunodeficiency virus infection. Pharmacotherapy 2013;33:665–82.
96. Mateo L, Holgado S, Marinoso ML, et al. Hypophosphatemic osteomalacia induced by tenofovir in HIV-infected patients. Clin Rheumatol 2016;35:1271–9.
97. Brown TT, Moser C, Currier JS, et al. Changes in bone mineral density after initiation of antiretroviral treatment with tenofovir disoproxil fumarate/emtricitabine plus atazanavir/ritonavir, darunavir/ritonavir, or raltegravir. J Infect Dis 2015;212:1241–9.
98. Ofotokun I, Titanji K, Vikulina T, et al. Role of T-cell reconstitution in HIV-1 antiretroviral therapy-induced bone loss. Nat Commun 2015;6:8282.
99. Ofotokun I, Titanji K, Vunnava A, et al. Antiretroviral therapy induces a rapid increase in bone resorption that is positively associated with the magnitude of immune reconstitution in HIV infection. AIDS 2016;30:405–14.
100. Stephens KI, Rubinsztain L, Payan J, et al. Dual-energy x-ray absorptiometry and calculated FRAX risk scores may underestimate osteoporotic fracture risk in vitamin d-deficient veterans with HIV infection. Endocr Pract 2016;22:440–6.
101. Mirza F, Canalis E. Management of endocrine disease: Secondary osteoporosis: pathophysiology and management. Eur J Endocrinol 2015;173:R131–151.
102. Brown TT, Hoy J, Borderi M, et al. Recommendations for evaluation and management of bone disease in HIV. Clin Infect Dis 2015;60:1242–51.
103. Mazzotta E, Ursini T, Agostinone A, et al. Prevalence and predictors of low bone mineral density and fragility fractures among HIV-infected patients at one Italian center after universal DXA screening: sensitivity and specificity of current guidelines on bone mineral density management. AIDS Patient Care STDS 2015;29:169–80.
104. Calmy A, Chevalley T, Delhumeau C, et al. Long-term HIV infection and antiretroviral therapy are associated with bone microstructure alterations in premenopausal women. Osteoporos Int 2013;24:1843–52.
105. Yin MT, Lund E, Shah J, et al. Lower peak bone mass and abnormal trabecular and cortical microarchitecture in young men infected with HIV early in life. AIDS 2014;28:345–53.
106. Lo Re V, 3rd, Lynn K, Stumm ER, et al. Structural bone deficits in HIV/HCV-coinfected, HCV-monoinfected, and HIV-monoinfected women. J Infect Dis 2015;212:924–33.
107. Allavena C, Delpierre C, Cuzin L, et al. High frequency of vitamin D deficiency in HIV-infected patients: effects of HIV-related factors and antiretroviral drugs. J Antimicrob Chemother 2012;67:2222–30.
108. Holick MF, Binkley NC, Bischoff-Ferrari HA, et al. Evaluation, treatment, and prevention of vitamin D deficiency: an Endocrine Society clinical practice guideline. J Clin Endocrinol Metab 2011;96:1911–30.
109. Mondy K, Powderly WG, Claxton SA, et al. Alendronate, vitamin D, and calcium for the treatment of osteopenia/osteoporosis associated with HIV infection. J Acquir Immune Defic Syndr 2005;38:426–31.
110. McComsey GA, Kendall MA, Tebas P, et al. Alendronate with calcium and vitamin D supplementation is safe and effective for the treatment of decreased bone mineral density in HIV. AIDS 2007;21:2473–82.
111. Guaraldi G, Orlando G, Madeddu G, et al. Alendronate reduces bone resorption in HIV-associated osteopenia/osteoporosis. HIV Clin Trials 2004;5:269–77.
112. Negredo E, Bonjoch A, Perez-Alvarez N, et al. Comparison of two different strategies of treatment with zoledronate in HIV-infected patients with low bone mineral density: single dose versus two doses in 2 years. HIV Med 2015;16:441–8.
113. Bolland MJ, Grey A, Horne AM, et al. Effects of intravenous zoledronate on bone turnover and bone density persist for at least five years in HIV-infected men. J Clin Endocrinol Metab 2012;97:1922–8.
114. Pinzone MR, Moreno S, Cacopardo B, Nunnari G. Is there enough evidence to use bisphosphonates in HIV-infected patients? A systematic review and meta-analysis. AIDS Rev 2014;16:213–22.
115. Ofotokun I, Titanji K, Lahiri CD, et al. A Single-dose zoledronic acid infusion prevents antiretroviral therapy-induced bone loss in treatment-naive HIV-infected patients: a phase IIb trial. Clin Infect Dis 2016;63:663–71.
116. Lewiecki EM, Gordon CM, Baim S, et al. International Society for Clinical Densitometry 2007 adult and pediatric official positions. Bone 2008;43:1115–21.