User login
Topical JAK inhibitor showed promise in facial vitiligo
PORTLAND – Twice-daily topical therapy with the Janus kinase (JAK) inhibitor ruxolitinib led to significant improvements in facial vitiligo in a small, uncontrolled, open-label, proof-of-concept study.
Four patients with significant baseline facial involvement improved by an average of 76% on the facial Vitiligo Area Scoring Index, or VASI (95% confidence interval, 53%-99%, P = .001), Brooke Rothstein reported at the annual meeting of the Society for Investigative Dermatology. The results suggest that topical JAK inhibition might help treat facial vitiligo, while potentially sparing patients from the side effects of oral therapy, said Ms. Rothstein, a medical student at Tufts University, Boston, who conducted the study under the mentorship of David Rosmarin, MD, of the department of dermatology at Tufts.
The study included 11 patients with vitiligo affecting at least 1% of body surface area. In all, 54% were male and the average age was 52 years. Patients applied ruxolitinib 1.5% phosphate cream to affected areas twice daily for 20 weeks. The primary outcome was percent improvement in VASI from baseline, Ms. Rothstein said.
By week 20, eight (73%) patients responded to treatment. Overall VASI scores improved by 23% (95% CI, 4%-43%; P = .02) when considering all patients and affected body regions. Three of eight patients responded on the body, and one of these eight patients also improved on acral surfaces, but these improvements were modest – less than 10%, compared with baseline, which was statistically insignificant.
Adverse events were generally mild and included erythema, hyperpigmentation, and transient acne, Ms. Rothstein reported. Despite the small sample size and open-label design of this study, the findings support further studies of topical JAK inhibition in vitiligo and add to mounting evidence that targeting interferon-gamma and its associated chemokines might stimulate repigmentation of skin in affected patients, she concluded.
This study also was published online in the Journal of the American Academy of Dermatology (J Am Acad Dermatol. 2017 Apr 5. doi: 10.1016/j.jaad.2017.02.049). The work was partially supported by Incyte, manufacturer of ruxolitinib (Jakafi), which supplied the study drug and reviewed the manuscript, but did not have final approval or control over the decision to submit for publication. An Alpha Omega Alpha Carolyn L. Kuckein Student Research Fellowship also helped support the work. Ms. Rothstein and her coinvestigators reported having no financial conflicts of interest.
Ruxolitinib, in a tablet formulation, is approved by the Food and Drug Administration for treating myelofibrosis and polycythemia vera.
AT SID 2017
Key clinical point:
Major finding: Four patients with significant facial vitiligo improved by 76% on the facial Vitiligo Area Scoring Index, from baseline (P = .001).
Data source: An uncontrolled, open-label pilot study of 11 patients with vitiligo affecting more than 1% of body surface area.
Disclosures: The work was partially supported by Incyte, manufacturer of ruxolitinib, which supplied the study drug and reviewed the manuscript, but did not have final approval or control over the decision to submit for publication. An Alpha Omega Alpha Carolyn L. Kuckein Student Research Fellowship also helped support the work. Ms. Rothstein and her coinvestigators reported having no financial conflicts of interest.
Dependence of Elevated Eosinophil Levels on Geographic Location
A primary care physician in the VA San Diego Healthcare System (VASDHS) clinically observed an unexpected rate of elevated eosinophil levels on routine blood tests of patients residing in inland areas of San Diego County and Imperial County. The majority of the affected patients did not present with symptoms or associated pathology, leaving the significance of these laboratory results unclear and creating question of what intervention, if any, might be most appropriate for these patients. A preliminary chart review of clinic visits at community-based clinic sites confirmed higher rates of elevated eosinophil levels compared with those of patients seen at the San Diego-based medical center. Based on this finding, a more formal investigation was initiated.
Eosinophils are leukocyte components of the cell-mediated immune response and may be elevated in conditions that include hypersensitivity reactions, adrenal insufficiency, neoplastic disorders, and parasitic infections, among others.1 An elevated percentage of eosinophils can be attributed to a variety of causes, and isolated elevations in a particular individual may not necessarily reflect an underlying pathology. Furthermore, elevated eosinophil levels alone do not necessarily indicate eosinophilia, as the latter is defined by absolute eosinophil counts. However, the occurrence of elevated eosinophil levels that remain unexplained at the population level raises the possibility of a common exposure and warrants further investigation. If such a phenomenon appears to be geographically distributed, as was noted by VA physicians in San Diego and Imperial County, it becomes important to consider what exposures might be unique to a particular site.
Coccidioides immitis
The soil fungus Coccidioides immitis (C immitis) is a growing public health concern for inland areas of San Diego County and Imperial County. While its presence in the northern California San Joaquin Valley has been of particular research interest and has gained traction in public discourse, the organism also is endemic to much of southern California, Arizona, New Mexico, and Texas, with its range extending as far north as parts of Nevada and Utah.2 Although C immitis has been identified as endemic to the dry climate of Imperial County, the precise degree of its endemicity and clinical significance are less clear.
From 2006 to 2010, Imperial County reported a comparatively low incidence rate of coccidioidomycosis (C immitis infection) compared with that of similar adjacent climates, such as Yuma, Arizona. A 2011 Imperial County survey found that only 23% of clinicians considered coccidioidomycosis a problem in California, and only 43% would consider the diagnosis in a patient presenting with respiratory problems.3 These findings have raised the concern that cases are being missed either from failure to diagnose or from underreporting. Furthermore, in light of a 1997 study that found intestinal parasites in about 28% of the population in Mexico, there is concern that given the close proximity to northern Mexico (where C immitis also is found), rates of Strongyloides stercoralis, Giardia lamblia, Entamoeba histolytica, Cryptosporidium, Ascaris lumbricoides, and other parasitic infections might be higher in border counties, such as Imperial County, compared with other sites in California.4
While coccidioidomycosis and parasitic infections are potential causes of the elevated eosinophil levels at VASDHS, recent studies have demonstrated an association between cardiovascular risk factors, such as dyslipidemia and diabetes mellitus, and eosinophil count.5 The association between dyslipidemia and elevated eosinophil levels is not well understood, although recent studies have described it as likely multifactorial with contributing mechanisms involving oxidative stress, endothelial dysfunction, and inflammatory changes.6 Consideration of these cardiovascular risk factors is of particular importance in this population because of its high rate of overweight and obesity. According to the 2011-2012 California Health Interview Survey, 71% of Imperial Valley adults were found to be either overweight or obese compared with the California state average of 55% and the San Diego County average of 57%.7,8
This investigation aimed to identify whether geographically distributed elevated eosinophil levels can be identified using population-level data, whether eosinophil levels are found to be elevated at a particular site, and whether such observations might be explained by known characteristics of the patient population based on existing patient data.
Methods
The percentage of eosinophils on complete blood counts (CBCs) were acquired for all VASDHS patients who had laboratory visits from May 1 to June 30, 2010, based on patient records. For patients with multiple laboratory visits during the period, only data from the earliest visit were included for this investigation. Initially, patients were sorted according to the site of their laboratory blood draw: Chula Vista, Escondido, Imperial Valley, La Jolla, Mission Valley, and Oceanside. Descriptive statistical analyses were carried out for each specific site as well as with patients from all sites pooled.
Sites With Elevated Eosinophil Levels
In addition to descriptive statistics, Pearson χ2 tests were initially performed to determine whether the proportions of elevated eosinophil levels at inland VASDHS sites in San Diego and Imperial counties deviated significantly from the expected levels at the coastal La Jolla hospital comparison site. Additional Pearson χ2 tests were performed subsequently to compare all sites involved in the study against all other sites. The goal of these Pearson χ2 tests was to identify potential sites for further investigation with no adjustment made for multiple testing. Sites with eosinophil levels significantly higher or lower than the expected levels when compared with the other sites included in the study were investigated further with a chart review.
Based on the VA Clinical Laboratory standards, a peripheral eosinophil percentage > 3% was considered elevated. Absolute eosinophil levels also were calculated to determine whether elevated eosinophil levels were associated with absolute counts reflective of eosinophilia. Counts of 500 to 1,499 eosinophils/mL were considered mild eosinophilia, 1,500 to 4,999 eosinophils/mL considered moderate eosinophilia, and ≥ 5,000 considered severe eosinophilia.9
Site-Specific Subgroup Analysis
A structured chart review was conducted for all patient notes, laboratory findings, studies, and communications for sites identified with elevated eosinophil levels. Demographic information was collected for all subjects, including age, race, occupation, and gender. Each record was systematically evaluated for information relating to possible causes of eosinophilia, including recent or prior data on the following: CBC, eosinophil percentage; HIV, C immitis, or Strongyloides stercoralis serology, stool ova and parasites, diagnoses of dyslipidemia, diabetes mellitus, malignancy, or adrenal insufficiency; and histories of atopy, allergies, and/or allergic rhinitis. In addition, given the unique exposures of the veteran population, data on service history and potential exposures during service, such as to Agent Orange, also were collected.
A multivariate analysis using logistic regression was conducted to determine whether conditions or exposures often associated with eosinophilia might explain any observed elevations in eosinophil levels. For the logistic regression model, the response variable was eosinophil levels > 3%. Explanatory variables included parasitic infection diagnosis, including C immitis, dyslipidemia diagnosis, malignancy diagnosis, allergy and/or atopy diagnosis, and HIV diagnosis. In addition, the analysis controlled for demographic variables, such as age, sex, race, period of service, and Agent Orange exposure and were included as explanatory variables in the model. Categorical variables were coded as 0 for negative results and 1 for positive results and were identified as missing if no data were recorded for that variable. Statistics were performed using Stata 13 (College Station, TX).
Results
A total of 6,777 VASDHS patient records were acquired. Two records included CBC without differentials and were omitted from the study. Among those included, the median eosinophil percentage was 2.3% (SD 2.51). Eosinophil percentages ranged from 0% to 39.3%. The 25th percentile and 75th percentile eosinophil levels were 1.3% and 3.6%, respectively. Nine percent of patients had percentages below 11.6%, and 4 patients had eosinophil percentages ranging from 30% to 39% (Figure 1).
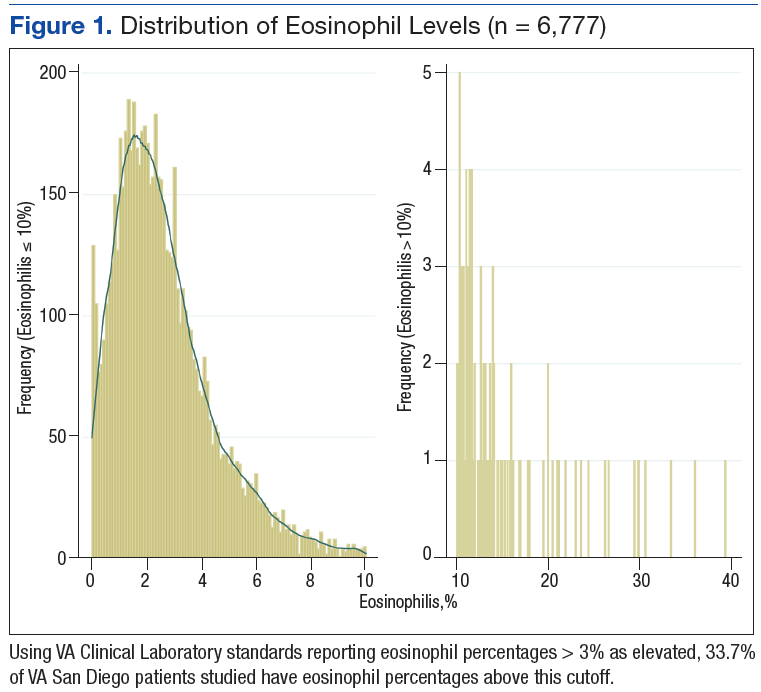
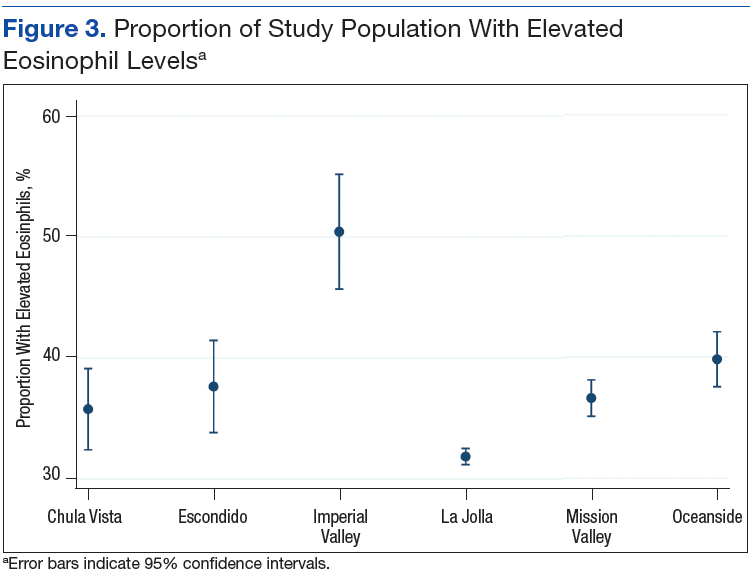
Grouping the records by clinic, 30% to 40% of patients had elevated eosinophil levels at all sites except for Imperial Valley (Figure 2). At the Imperial Valley site, 50.5% of patients had elevated eosinophil levels, which was statistically higher than those of all other sites (Figure 3).
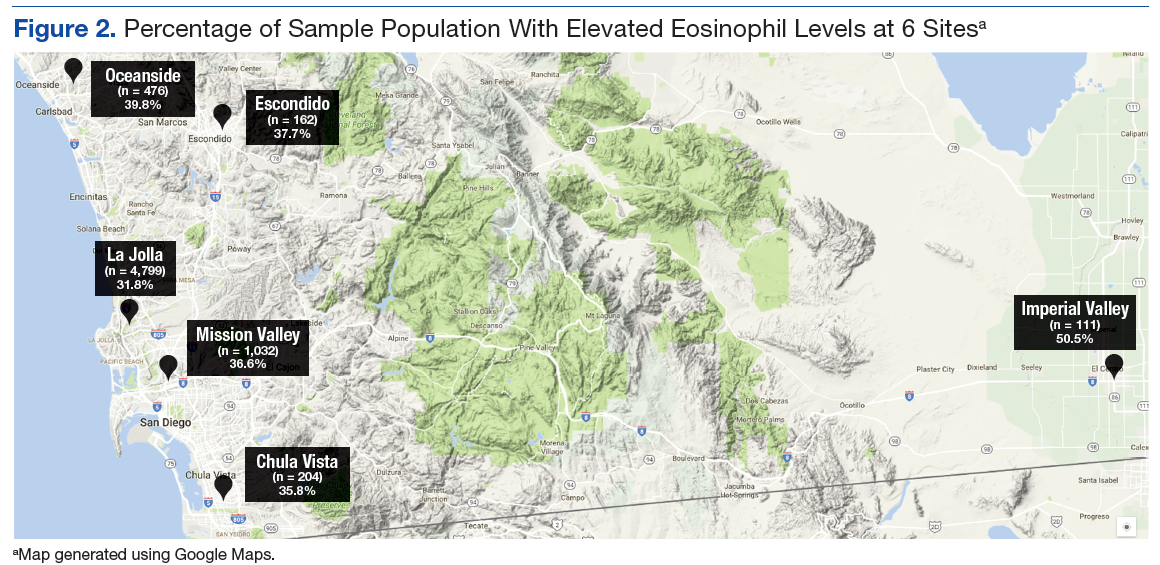
The authors tested the null hypothesis that there is no association between geographic location and the proportion of the population with elevated eosinophil levels. A Pearson χ2 test of the proportion of elevated eosinophil level (P < .001) indicated that the observed differences in elevated eosinophil levels were unlikely due to chance. Further sets of exploratory χ2 tests comparing only 2 sites at a time identified Imperial Valley as differing significantly from all other sites at α = .05. Eosinophil proportions at the Mission Valley (P = .003) and Oceanside (P < .001) sites also were found to differ significantly from the La Jolla site. In contrast, eosinophil proportions at the Escondido (P = .199) and Chula Vista (P = .237) sites did not differ significantly from those of the La Jolla site using χ2 testing.
Imperial Valley Clinic
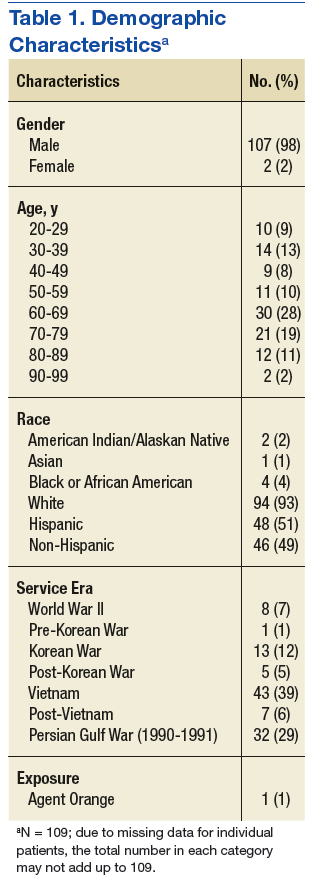
Records were acquired for 109 patients at the Imperial Valley clinic (107 male and 2 female). Fifty-five patients (50.5%) were identified as having elevated eosinophil levels. However, only 5 patients were classified as having mild eosinophilia. No patients were found to have moderate or severe eosinophilia (Table 1).
On review of the data for Imperial Valley patients, 68 had a diagnosis of dyslipidemia and 17 had asthma, atopic dermatitis, allergic rhinitis, and/or atopy not otherwise specified diagnoses. Three patients were identified with diagnoses of malignancies or premalignant conditions, including 1 patient with chronic lymphocytic leukemia, 1 patient with renal cell carcinoma with metastasis to the lungs, and 1 patient with myelodysplastic syndrome. No patients were identified with a diagnosis of HIV. There were no diagnostic laboratory tests on record for C immitis serology, stool ova and parasites, Strongyloides stercoralis serology, or clinical diagnoses of related conditions.
Logistic regressions assessed whether elevated eosinophil levels > 3% might be explained by predictor variables, such as a history of dyslipidemia, malignancy, or asthma/allergies/atopy (Table 2). As no parasitic infections or HIV diagnoses were identified in the patient population, they were noncontributory in the model. The probability of obtaining the χ2 statistic given the assumption that the null hypothesis is true equals .027 for the model, suggesting that the overall model was statistically significant at the α = .05 level.
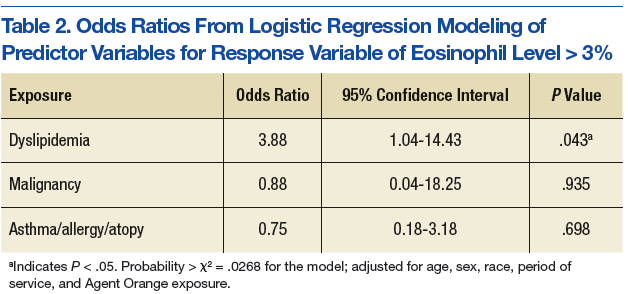
Of the key predictor variables of interest, only dyslipidemia was found to predict elevated eosinophil levels. Patients with a diagnosis of dyslipidemia were found to have nearly 4 times greater likelihood of having elevated eosinophil levels compared with patients without dyslipidemia (odds ratio 3.88, 95% confidence interval: 1.04-14.43). Patients with malignancy or a history of asthma, allergy, or atopy were not found to have significantly different odds of having elevated eosinophil levels compared with baseline within the study population.
Discussion
High proportions of elevated eosinophil levels among VASDHS patients were found to be geographically concentrated at sites that included Imperial Valley, Oceanside, and Mission Valley. Although initial exploratory Pearson χ2 tests did not accommodate for multiple comparisons, a particularly consistent finding was that the proportion of patients with elevated eosinophil levels seemed to be notably high at the Imperial Valley site in particular, which corresponded with the clinical observations made by physicians.
It was initially thought that the elevated eosinophil levels might be due to exposure to geographically distributed pathogens, such as C immitis, but there were no clinically diagnosed cases in the population studied. However, it also is true that no C immitis serologies or other parasitic serologies were ordered for the patients during the study period. In the context of possible undertesting and underdiagnosis of coccidioidomycosis, it may be possible that these cases were simply missed.
Nonetheless, alternative explanations for elevated eosinophil levels also must be considered. Of the possible explanatory exposures considered, only dyslipidemia was found to be statistically significant in the study population. Patients with dyslipidemia had 4 times greater odds of also having elevated eosinophil levels compared with those who did not have dyslipidemia, which is in line with recent literature identifying conditions such as dyslipidemia and diabetes mellitus as independent predictors of elevated eosinophil levels.6
In light of the known high rates of obesity in the Imperial Valley in comparison with rates of obesity in San Diego County from previous studies and questionnaires, the increased levels of dyslipidemia in the Imperial Valley compared with those of the other sites included in the study may help explain the geographic distribution of observed elevated eosinophil levels.7,8 Although data on dyslipidemia rates among study participants at sites other than Imperial Valley were not collected for this study, this explanation represents a promising area of further investigation.
Furthermore, although about 50% of the population in the Imperial Valley had CBCs with eosinophil levels > 3%, only 5% of the population was found to have eosinophilia based on absolute eosinophil counts, and all such cases were mild. Although excluding infection or other causes of elevated eosinophil levels is difficult, it is reasonable to believe that such low-grade elevations that do not meet the criteria for true eosinophilia may be more consistent with chronic processes, such as dyslipidemia, as opposed to frank infection in which one might expect a morerobust response.
Limitations
The cause of this phenomenon is not yet clear, with the investigation limited by several factors. Possibly the sample size of 109 patients in the Imperial Valley was not sufficient to capture some causes of elevated eosinophil levels, particularly if the effect size of an exposure is low or the exposure infrequent. Of note, no cases of HIV, C immitis infection, or other parasitic infections were observed. Furthermore, only 3 cases of malignancy and 17 cases of asthma, allergies, and/or atopy were identified. Malignancy, asthma, and allergy and/or atopy were not statistically significant as predictors of eosinophilia at the α = .05 level, although the analysis of these variables was likely limited by the small number of patients with these conditions in the sample population. While all these exposures are known to be associated with eosinophilia in the literature, none were identified as predictors in the logistic regression model, likely due, in part, to the limited sample size.
Given the high proportion of the Imperial Valley population with elevated eosinophil levels compared with those of all other sites investigated, a rare or subtle exposure of the types noted would be less likely to explain such a large difference. It is important to look more carefully at a number of possible factors—including gathering more detailed data on dyslipidemia and C immitis infection rates among other possible contributors—to determine more precisely the cause of the notably elevated eosinophil levels in this and other sites in the region.
Conclusion
Using a convenience sample of the VA population based on routine laboratory testing, this study has established that geographically distributed elevated eosinophil levels can be identified in the San Diego region. However, it is less clear why notably elevated eosinophil levels were found at these sites. Although there was no evidence of a correlation between certain environmental factors and elevated eosinophil levels, this may have been due to insufficiently detailed consideration of environmental factors.
Logistic regression analysis associated dyslipidemia with a notably increased risk of elevated eosinophil levels in the Imperial Valley population, but it would be premature to conclude that this association is necessarily causal. Further research would help elucidate this. Increasing the investigational time frame and a chart review of additional sites could provide informative data points for analysis and would allow for a more in-depth comparison between sites. More immediately, given the possibility that dyslipidemia may be a source of the observed elevated eosinophil levels in the Imperial Valley population, it would be worth investigating the rates of dyslipidemia at comparison sites to see whether the lower rates of elevated eosinophil levels at these other sites correspond to lower rates of dyslipidemia.
In future work, it may be valuable to test the study population for C immitis, given the prevalence of the fungus in the area and the concern among many public health professionals of its undertesting and underdiagnosis. Because many cases of C immitis are subclinical, it may be worth investigating whether these are being missed and to what degree such cases might be accompanied by elevations in eosinophil levels.
Given that much remains unknown regarding the causes of elevated eosinophil levels in the Imperial Valley and other sites in the region, further study of such elevations across sites and over time—as well as careful consideration of noninfectious causes of elevated eosinophil levels, such as dyslipidemia—may be of important value to both local clinicians and public health professionals in this region. ˜
Acknowledgments
The authors thank Ms. Robin Nuspl and Mr. Ben Clark for their assistance with the data and guidance. The authors also are grateful to the staff members at the VA San Diego Healthcare System for their many contributions to this project.
1. Tefferi A. Blood eosinophilia: a new paradigm in disease classification, diagnosis, and treatment. Mayo Clin Proc. 2005;80(1):75-83.
2. Wardlaw AJ. Eosinophils and their disorders. In: Kaushansky K, Lichtman MA, Beutler E, Kipps TJ, Seligsohn U, Prchal JT, eds. Williams Hematology. 8th ed. New York, NY: The McGraw-Hill Companies; 2010:897-914.
3. MacLean ML. The epidemiology of coccidioidomycosis—15 California counties, 2007-2011. http://vfce.arizona.edu/sites/vfce/files/the_epidemiology_of_coccidioidomycosis_collaborative_county_report.pdf. Published January 22, 2014. Accessed February 28, 2017.
4. Guarner J, Matilde-Nava T, Villaseñor-Flores R, Sanchez-Mejorada G. Frequency of intestinal parasites in adult cancer patients in Mexico. Arch Med Res. 1997;28(2):219-222.
5. Tanaka M, Fukui M, Tomiyasu K, et al. Eosinophil count is positively correlated with coronary artery calcification. Hypertens Res. 2012;35(3):325-328.
6. Altas Y, Kurtoglu E, Yaylak B, et al. The relationship between eosinophilia and slow coronary flow. Ther Clin Risk Manag. 2015;11:1187-1191.
7. Imperial County Comprehensive Economic Development Strategy Committee. Imperial County Comprehensive Economic Development Strategy: 2014-2015 Annual Update. http://www.co.imperial.ca.us/announcements/PDFs/2014-2015FinalCEDS.pdf. Accessed March 6, 2017.
8. California Health Interview Survey. CHIS 2009 Adult Public Use File. Version November 2012 [computer file]. Los Angeles, CA: UCLA Center for Health Policy Research, November 2012. http://healthpolicy.ucla.edu/chis/data/public-use-data-file/Pages/2009.aspx. Accessed March 29, 2016. 9. Roufosse F, Weller PF. Practical approach to the patient with hypereosinophilia. J Allergy Clin Immun. 2010;126(1):39-44.
A primary care physician in the VA San Diego Healthcare System (VASDHS) clinically observed an unexpected rate of elevated eosinophil levels on routine blood tests of patients residing in inland areas of San Diego County and Imperial County. The majority of the affected patients did not present with symptoms or associated pathology, leaving the significance of these laboratory results unclear and creating question of what intervention, if any, might be most appropriate for these patients. A preliminary chart review of clinic visits at community-based clinic sites confirmed higher rates of elevated eosinophil levels compared with those of patients seen at the San Diego-based medical center. Based on this finding, a more formal investigation was initiated.
Eosinophils are leukocyte components of the cell-mediated immune response and may be elevated in conditions that include hypersensitivity reactions, adrenal insufficiency, neoplastic disorders, and parasitic infections, among others.1 An elevated percentage of eosinophils can be attributed to a variety of causes, and isolated elevations in a particular individual may not necessarily reflect an underlying pathology. Furthermore, elevated eosinophil levels alone do not necessarily indicate eosinophilia, as the latter is defined by absolute eosinophil counts. However, the occurrence of elevated eosinophil levels that remain unexplained at the population level raises the possibility of a common exposure and warrants further investigation. If such a phenomenon appears to be geographically distributed, as was noted by VA physicians in San Diego and Imperial County, it becomes important to consider what exposures might be unique to a particular site.
Coccidioides immitis
The soil fungus Coccidioides immitis (C immitis) is a growing public health concern for inland areas of San Diego County and Imperial County. While its presence in the northern California San Joaquin Valley has been of particular research interest and has gained traction in public discourse, the organism also is endemic to much of southern California, Arizona, New Mexico, and Texas, with its range extending as far north as parts of Nevada and Utah.2 Although C immitis has been identified as endemic to the dry climate of Imperial County, the precise degree of its endemicity and clinical significance are less clear.
From 2006 to 2010, Imperial County reported a comparatively low incidence rate of coccidioidomycosis (C immitis infection) compared with that of similar adjacent climates, such as Yuma, Arizona. A 2011 Imperial County survey found that only 23% of clinicians considered coccidioidomycosis a problem in California, and only 43% would consider the diagnosis in a patient presenting with respiratory problems.3 These findings have raised the concern that cases are being missed either from failure to diagnose or from underreporting. Furthermore, in light of a 1997 study that found intestinal parasites in about 28% of the population in Mexico, there is concern that given the close proximity to northern Mexico (where C immitis also is found), rates of Strongyloides stercoralis, Giardia lamblia, Entamoeba histolytica, Cryptosporidium, Ascaris lumbricoides, and other parasitic infections might be higher in border counties, such as Imperial County, compared with other sites in California.4
While coccidioidomycosis and parasitic infections are potential causes of the elevated eosinophil levels at VASDHS, recent studies have demonstrated an association between cardiovascular risk factors, such as dyslipidemia and diabetes mellitus, and eosinophil count.5 The association between dyslipidemia and elevated eosinophil levels is not well understood, although recent studies have described it as likely multifactorial with contributing mechanisms involving oxidative stress, endothelial dysfunction, and inflammatory changes.6 Consideration of these cardiovascular risk factors is of particular importance in this population because of its high rate of overweight and obesity. According to the 2011-2012 California Health Interview Survey, 71% of Imperial Valley adults were found to be either overweight or obese compared with the California state average of 55% and the San Diego County average of 57%.7,8
This investigation aimed to identify whether geographically distributed elevated eosinophil levels can be identified using population-level data, whether eosinophil levels are found to be elevated at a particular site, and whether such observations might be explained by known characteristics of the patient population based on existing patient data.
Methods
The percentage of eosinophils on complete blood counts (CBCs) were acquired for all VASDHS patients who had laboratory visits from May 1 to June 30, 2010, based on patient records. For patients with multiple laboratory visits during the period, only data from the earliest visit were included for this investigation. Initially, patients were sorted according to the site of their laboratory blood draw: Chula Vista, Escondido, Imperial Valley, La Jolla, Mission Valley, and Oceanside. Descriptive statistical analyses were carried out for each specific site as well as with patients from all sites pooled.
Sites With Elevated Eosinophil Levels
In addition to descriptive statistics, Pearson χ2 tests were initially performed to determine whether the proportions of elevated eosinophil levels at inland VASDHS sites in San Diego and Imperial counties deviated significantly from the expected levels at the coastal La Jolla hospital comparison site. Additional Pearson χ2 tests were performed subsequently to compare all sites involved in the study against all other sites. The goal of these Pearson χ2 tests was to identify potential sites for further investigation with no adjustment made for multiple testing. Sites with eosinophil levels significantly higher or lower than the expected levels when compared with the other sites included in the study were investigated further with a chart review.
Based on the VA Clinical Laboratory standards, a peripheral eosinophil percentage > 3% was considered elevated. Absolute eosinophil levels also were calculated to determine whether elevated eosinophil levels were associated with absolute counts reflective of eosinophilia. Counts of 500 to 1,499 eosinophils/mL were considered mild eosinophilia, 1,500 to 4,999 eosinophils/mL considered moderate eosinophilia, and ≥ 5,000 considered severe eosinophilia.9
Site-Specific Subgroup Analysis
A structured chart review was conducted for all patient notes, laboratory findings, studies, and communications for sites identified with elevated eosinophil levels. Demographic information was collected for all subjects, including age, race, occupation, and gender. Each record was systematically evaluated for information relating to possible causes of eosinophilia, including recent or prior data on the following: CBC, eosinophil percentage; HIV, C immitis, or Strongyloides stercoralis serology, stool ova and parasites, diagnoses of dyslipidemia, diabetes mellitus, malignancy, or adrenal insufficiency; and histories of atopy, allergies, and/or allergic rhinitis. In addition, given the unique exposures of the veteran population, data on service history and potential exposures during service, such as to Agent Orange, also were collected.
A multivariate analysis using logistic regression was conducted to determine whether conditions or exposures often associated with eosinophilia might explain any observed elevations in eosinophil levels. For the logistic regression model, the response variable was eosinophil levels > 3%. Explanatory variables included parasitic infection diagnosis, including C immitis, dyslipidemia diagnosis, malignancy diagnosis, allergy and/or atopy diagnosis, and HIV diagnosis. In addition, the analysis controlled for demographic variables, such as age, sex, race, period of service, and Agent Orange exposure and were included as explanatory variables in the model. Categorical variables were coded as 0 for negative results and 1 for positive results and were identified as missing if no data were recorded for that variable. Statistics were performed using Stata 13 (College Station, TX).
Results
A total of 6,777 VASDHS patient records were acquired. Two records included CBC without differentials and were omitted from the study. Among those included, the median eosinophil percentage was 2.3% (SD 2.51). Eosinophil percentages ranged from 0% to 39.3%. The 25th percentile and 75th percentile eosinophil levels were 1.3% and 3.6%, respectively. Nine percent of patients had percentages below 11.6%, and 4 patients had eosinophil percentages ranging from 30% to 39% (Figure 1).
Grouping the records by clinic, 30% to 40% of patients had elevated eosinophil levels at all sites except for Imperial Valley (Figure 2). At the Imperial Valley site, 50.5% of patients had elevated eosinophil levels, which was statistically higher than those of all other sites (Figure 3).
The authors tested the null hypothesis that there is no association between geographic location and the proportion of the population with elevated eosinophil levels. A Pearson χ2 test of the proportion of elevated eosinophil level (P < .001) indicated that the observed differences in elevated eosinophil levels were unlikely due to chance. Further sets of exploratory χ2 tests comparing only 2 sites at a time identified Imperial Valley as differing significantly from all other sites at α = .05. Eosinophil proportions at the Mission Valley (P = .003) and Oceanside (P < .001) sites also were found to differ significantly from the La Jolla site. In contrast, eosinophil proportions at the Escondido (P = .199) and Chula Vista (P = .237) sites did not differ significantly from those of the La Jolla site using χ2 testing.
Imperial Valley Clinic
Records were acquired for 109 patients at the Imperial Valley clinic (107 male and 2 female). Fifty-five patients (50.5%) were identified as having elevated eosinophil levels. However, only 5 patients were classified as having mild eosinophilia. No patients were found to have moderate or severe eosinophilia (Table 1).
On review of the data for Imperial Valley patients, 68 had a diagnosis of dyslipidemia and 17 had asthma, atopic dermatitis, allergic rhinitis, and/or atopy not otherwise specified diagnoses. Three patients were identified with diagnoses of malignancies or premalignant conditions, including 1 patient with chronic lymphocytic leukemia, 1 patient with renal cell carcinoma with metastasis to the lungs, and 1 patient with myelodysplastic syndrome. No patients were identified with a diagnosis of HIV. There were no diagnostic laboratory tests on record for C immitis serology, stool ova and parasites, Strongyloides stercoralis serology, or clinical diagnoses of related conditions.
Logistic regressions assessed whether elevated eosinophil levels > 3% might be explained by predictor variables, such as a history of dyslipidemia, malignancy, or asthma/allergies/atopy (Table 2). As no parasitic infections or HIV diagnoses were identified in the patient population, they were noncontributory in the model. The probability of obtaining the χ2 statistic given the assumption that the null hypothesis is true equals .027 for the model, suggesting that the overall model was statistically significant at the α = .05 level.
Of the key predictor variables of interest, only dyslipidemia was found to predict elevated eosinophil levels. Patients with a diagnosis of dyslipidemia were found to have nearly 4 times greater likelihood of having elevated eosinophil levels compared with patients without dyslipidemia (odds ratio 3.88, 95% confidence interval: 1.04-14.43). Patients with malignancy or a history of asthma, allergy, or atopy were not found to have significantly different odds of having elevated eosinophil levels compared with baseline within the study population.
Discussion
High proportions of elevated eosinophil levels among VASDHS patients were found to be geographically concentrated at sites that included Imperial Valley, Oceanside, and Mission Valley. Although initial exploratory Pearson χ2 tests did not accommodate for multiple comparisons, a particularly consistent finding was that the proportion of patients with elevated eosinophil levels seemed to be notably high at the Imperial Valley site in particular, which corresponded with the clinical observations made by physicians.
It was initially thought that the elevated eosinophil levels might be due to exposure to geographically distributed pathogens, such as C immitis, but there were no clinically diagnosed cases in the population studied. However, it also is true that no C immitis serologies or other parasitic serologies were ordered for the patients during the study period. In the context of possible undertesting and underdiagnosis of coccidioidomycosis, it may be possible that these cases were simply missed.
Nonetheless, alternative explanations for elevated eosinophil levels also must be considered. Of the possible explanatory exposures considered, only dyslipidemia was found to be statistically significant in the study population. Patients with dyslipidemia had 4 times greater odds of also having elevated eosinophil levels compared with those who did not have dyslipidemia, which is in line with recent literature identifying conditions such as dyslipidemia and diabetes mellitus as independent predictors of elevated eosinophil levels.6
In light of the known high rates of obesity in the Imperial Valley in comparison with rates of obesity in San Diego County from previous studies and questionnaires, the increased levels of dyslipidemia in the Imperial Valley compared with those of the other sites included in the study may help explain the geographic distribution of observed elevated eosinophil levels.7,8 Although data on dyslipidemia rates among study participants at sites other than Imperial Valley were not collected for this study, this explanation represents a promising area of further investigation.
Furthermore, although about 50% of the population in the Imperial Valley had CBCs with eosinophil levels > 3%, only 5% of the population was found to have eosinophilia based on absolute eosinophil counts, and all such cases were mild. Although excluding infection or other causes of elevated eosinophil levels is difficult, it is reasonable to believe that such low-grade elevations that do not meet the criteria for true eosinophilia may be more consistent with chronic processes, such as dyslipidemia, as opposed to frank infection in which one might expect a morerobust response.
Limitations
The cause of this phenomenon is not yet clear, with the investigation limited by several factors. Possibly the sample size of 109 patients in the Imperial Valley was not sufficient to capture some causes of elevated eosinophil levels, particularly if the effect size of an exposure is low or the exposure infrequent. Of note, no cases of HIV, C immitis infection, or other parasitic infections were observed. Furthermore, only 3 cases of malignancy and 17 cases of asthma, allergies, and/or atopy were identified. Malignancy, asthma, and allergy and/or atopy were not statistically significant as predictors of eosinophilia at the α = .05 level, although the analysis of these variables was likely limited by the small number of patients with these conditions in the sample population. While all these exposures are known to be associated with eosinophilia in the literature, none were identified as predictors in the logistic regression model, likely due, in part, to the limited sample size.
Given the high proportion of the Imperial Valley population with elevated eosinophil levels compared with those of all other sites investigated, a rare or subtle exposure of the types noted would be less likely to explain such a large difference. It is important to look more carefully at a number of possible factors—including gathering more detailed data on dyslipidemia and C immitis infection rates among other possible contributors—to determine more precisely the cause of the notably elevated eosinophil levels in this and other sites in the region.
Conclusion
Using a convenience sample of the VA population based on routine laboratory testing, this study has established that geographically distributed elevated eosinophil levels can be identified in the San Diego region. However, it is less clear why notably elevated eosinophil levels were found at these sites. Although there was no evidence of a correlation between certain environmental factors and elevated eosinophil levels, this may have been due to insufficiently detailed consideration of environmental factors.
Logistic regression analysis associated dyslipidemia with a notably increased risk of elevated eosinophil levels in the Imperial Valley population, but it would be premature to conclude that this association is necessarily causal. Further research would help elucidate this. Increasing the investigational time frame and a chart review of additional sites could provide informative data points for analysis and would allow for a more in-depth comparison between sites. More immediately, given the possibility that dyslipidemia may be a source of the observed elevated eosinophil levels in the Imperial Valley population, it would be worth investigating the rates of dyslipidemia at comparison sites to see whether the lower rates of elevated eosinophil levels at these other sites correspond to lower rates of dyslipidemia.
In future work, it may be valuable to test the study population for C immitis, given the prevalence of the fungus in the area and the concern among many public health professionals of its undertesting and underdiagnosis. Because many cases of C immitis are subclinical, it may be worth investigating whether these are being missed and to what degree such cases might be accompanied by elevations in eosinophil levels.
Given that much remains unknown regarding the causes of elevated eosinophil levels in the Imperial Valley and other sites in the region, further study of such elevations across sites and over time—as well as careful consideration of noninfectious causes of elevated eosinophil levels, such as dyslipidemia—may be of important value to both local clinicians and public health professionals in this region. ˜
Acknowledgments
The authors thank Ms. Robin Nuspl and Mr. Ben Clark for their assistance with the data and guidance. The authors also are grateful to the staff members at the VA San Diego Healthcare System for their many contributions to this project.
1. Tefferi A. Blood eosinophilia: a new paradigm in disease classification, diagnosis, and treatment. Mayo Clin Proc. 2005;80(1):75-83.
2. Wardlaw AJ. Eosinophils and their disorders. In: Kaushansky K, Lichtman MA, Beutler E, Kipps TJ, Seligsohn U, Prchal JT, eds. Williams Hematology. 8th ed. New York, NY: The McGraw-Hill Companies; 2010:897-914.
3. MacLean ML. The epidemiology of coccidioidomycosis—15 California counties, 2007-2011. http://vfce.arizona.edu/sites/vfce/files/the_epidemiology_of_coccidioidomycosis_collaborative_county_report.pdf. Published January 22, 2014. Accessed February 28, 2017.
4. Guarner J, Matilde-Nava T, Villaseñor-Flores R, Sanchez-Mejorada G. Frequency of intestinal parasites in adult cancer patients in Mexico. Arch Med Res. 1997;28(2):219-222.
5. Tanaka M, Fukui M, Tomiyasu K, et al. Eosinophil count is positively correlated with coronary artery calcification. Hypertens Res. 2012;35(3):325-328.
6. Altas Y, Kurtoglu E, Yaylak B, et al. The relationship between eosinophilia and slow coronary flow. Ther Clin Risk Manag. 2015;11:1187-1191.
7. Imperial County Comprehensive Economic Development Strategy Committee. Imperial County Comprehensive Economic Development Strategy: 2014-2015 Annual Update. http://www.co.imperial.ca.us/announcements/PDFs/2014-2015FinalCEDS.pdf. Accessed March 6, 2017.
8. California Health Interview Survey. CHIS 2009 Adult Public Use File. Version November 2012 [computer file]. Los Angeles, CA: UCLA Center for Health Policy Research, November 2012. http://healthpolicy.ucla.edu/chis/data/public-use-data-file/Pages/2009.aspx. Accessed March 29, 2016. 9. Roufosse F, Weller PF. Practical approach to the patient with hypereosinophilia. J Allergy Clin Immun. 2010;126(1):39-44.
Gene variant reduces risk of severe malaria
New research indicates that some Africans carry a gene variant that reduces the risk of severe malaria.
The study suggests this variant results from the rearrangement of 2 glycophorin receptors found on the surface of red blood cells.
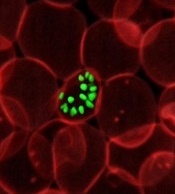
The malaria parasite Plasmodium falciparum uses these receptors—GYPA and GYPB—to enter the cells.
Researchers identified a gene variant that results in altered GYPA and GYPB receptors and may reduce the risk of severe malaria by 40%.
Ellen Leffler, of the University of Oxford in the UK, and her colleagues reported these findings in Science.
The researchers performed genome sequencing of 765 individuals from 10 ethnic groups in Gambia, Burkina Faso, Cameroon, and Tanzania.
The team also conducted a study across the Gambia, Kenya, and Malawi that included 5310 individuals from the general population and 4579 people who were hospitalized with severe malaria.
These analyses revealed copy number variants affecting GYPA and GYPB.
“[W]e found strong evidence that variation in the glycophorin gene cluster influences malaria susceptibility,” Dr Leffler said.
“We found some people have a complex rearrangement of GYPA and GYPB genes, forming a hybrid glycophorin, and these people are less likely to develop severe complications of the disease.”
The rearrangement involves the loss of GYPB and gain of 2 GYPB-A hybrid genes. The hybrid GYPB-A gene is found in a rare blood group—part of the MNS blood group system—where it is known as Dantu.
DUP4, the most common Dantu gene variant, is a result of the rearrangement. And the researchers found that DUP4 reduced the risk of severe malaria by an estimated 40%.
DUP4 was only present in certain populations, particularly in individuals of East African descent.
The researchers proposed a number of reasons as to why DUP4 may not be more widespread, including the possibility that it emerged recently. Alternatively, it may only protect against certain strains of P falciparum that are specific to east Africa.
Though more research is needed, the team said these findings link the structural variation of glycophorin receptors with resistance to severe malaria.
“We are starting to find that the glycophorin region of the genome has an important role in protecting people against malaria,” said study author Dominic Kwiatkowski, MD, of the University of Oxford.
“Our discovery that a specific variant of glycophorin invasion receptors can give substantial protection against severe malaria will hopefully inspire further research on exactly how Plasmodium falciparum invade red blood cells. This could also help us discover novel parasite weaknesses that could be exploited in future interventions against this deadly disease.” ![]()
New research indicates that some Africans carry a gene variant that reduces the risk of severe malaria.
The study suggests this variant results from the rearrangement of 2 glycophorin receptors found on the surface of red blood cells.
The malaria parasite Plasmodium falciparum uses these receptors—GYPA and GYPB—to enter the cells.
Researchers identified a gene variant that results in altered GYPA and GYPB receptors and may reduce the risk of severe malaria by 40%.
Ellen Leffler, of the University of Oxford in the UK, and her colleagues reported these findings in Science.
The researchers performed genome sequencing of 765 individuals from 10 ethnic groups in Gambia, Burkina Faso, Cameroon, and Tanzania.
The team also conducted a study across the Gambia, Kenya, and Malawi that included 5310 individuals from the general population and 4579 people who were hospitalized with severe malaria.
These analyses revealed copy number variants affecting GYPA and GYPB.
“[W]e found strong evidence that variation in the glycophorin gene cluster influences malaria susceptibility,” Dr Leffler said.
“We found some people have a complex rearrangement of GYPA and GYPB genes, forming a hybrid glycophorin, and these people are less likely to develop severe complications of the disease.”
The rearrangement involves the loss of GYPB and gain of 2 GYPB-A hybrid genes. The hybrid GYPB-A gene is found in a rare blood group—part of the MNS blood group system—where it is known as Dantu.
DUP4, the most common Dantu gene variant, is a result of the rearrangement. And the researchers found that DUP4 reduced the risk of severe malaria by an estimated 40%.
DUP4 was only present in certain populations, particularly in individuals of East African descent.
The researchers proposed a number of reasons as to why DUP4 may not be more widespread, including the possibility that it emerged recently. Alternatively, it may only protect against certain strains of P falciparum that are specific to east Africa.
Though more research is needed, the team said these findings link the structural variation of glycophorin receptors with resistance to severe malaria.
“We are starting to find that the glycophorin region of the genome has an important role in protecting people against malaria,” said study author Dominic Kwiatkowski, MD, of the University of Oxford.
“Our discovery that a specific variant of glycophorin invasion receptors can give substantial protection against severe malaria will hopefully inspire further research on exactly how Plasmodium falciparum invade red blood cells. This could also help us discover novel parasite weaknesses that could be exploited in future interventions against this deadly disease.” ![]()
Bivalirudin not superior to heparin in real-world analysis
A new study suggests bivalirudin does not produce better outcomes than heparin in patients undergoing transradial primary percutaneous coronary intervention (PCI) for ST elevation myocardial infarction (STEMI).
Researchers found no significant difference in the rate of a composite of death, myocardial infarction, and stroke in patients who received bivalirudin or heparin, with or without glycoprotein (GP) IIb/IIIa inhibitors.
Likewise, the incidence of bleeding was not significantly different between the heparin and bivalirudin groups.
However, the rate of stent thrombosis was significantly higher in patients who received bivalirudin.
Ion S. Jovin, MD, of Virginia Commonwealth University in Richmond, and colleagues reported these results in JACC: Cardiovascular Interventions.
Using data from the National Cardiovascular Data Registry CathPCI Registry, the researchers examined the records of 67,368 patients with STEMI. The patients underwent primary PCI via radial access at 1584 sites between 2009 to 2015.
Patients received anticoagulation with bivalirudin (n=29,660) or heparin (n=37,708). Twenty-three percent (n=6781) of patients on bivalirudin received GP IIb/IIIa inhibitors, as did 59% of patients on heparin (n=22,416).
Results
In an unadjusted analysis, the researchers found no significant difference in the rate of the composite endpoint, which included death, myocardial infarction, and stroke. The incidence was 4.6% with bivalirudin and 4.7% with heparin (P=0.47).
However, patients who received bivalirudin had a significantly higher rate of acute stent thrombosis—1.03%—than patients who received heparin—0.602% (P<0.001).
And there were significantly fewer bleeding episodes with bivalirudin than with heparin—6.8% and 8.1%, respectively, (P<0.001).
The researchers adjusted their analysis for multiple variables, including a propensity score reflecting the probability of receiving bivalirudin to account for patient differences between groups.
After these adjustments, the odds ratio (OR) of the composite endpoint for bivalirudin versus heparin was 0.95 (P=0.152).
The OR ratio for acute stent thrombosis was 2.11 (P<0.001), and the OR for bleeding was 0.98 (P=0.57).
The researchers did note that, among patients who were not receiving GP IIb/IIIa inhibitors, outcomes were better in patients who received bivalirudin. They had a significantly lower risk of bleeding and the composite endpoint than patients who received heparin.
“Our sensitivity analysis provides some insights into direct comparisons of bivalirudin and heparin when GPIIb/IIIa inhibitors are forced out of the equation and suggests that, in the direct comparison, bivalirudin may have superior outcomes,” Dr Jovin said.
“However, our study showed that, in the real world, over a third of the patients with STEMI undergoing transradial PCI who receive heparin and about a fifth of patients who receive bivalirudin also receive GPIIb/IIIa inhibitors.”
The researchers suggested a need for a randomized trial in patients treated exclusively via transradial primary PCI and anticoagulated with bivalirudin versus heparin as well as a cost-effectiveness analysis comparing heparin and bivalirudin. ![]()
Drug receives breakthrough designation for relapsed/refractory AML
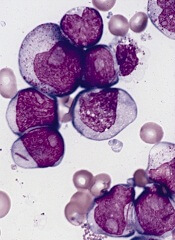
The US Food and Drug Administration (FDA) has granted GMI-1271 breakthrough therapy designation for the treatment of adults with relapsed/refractory acute myeloid leukemia (AML).
GMI-1271 is an E-selectin antagonist being developed by GlycoMimetics, Inc.
The product already has orphan and fast track designations from the FDA for the treatment of AML.
GMI-1271 is currently being evaluated in a phase 1/2 trial of patients with relapsed or refractory AML and patients age 60 and older with newly diagnosed AML.
The patients are receiving GM-1271 in combination with chemotherapy. The relapsed/refractory group is receiving mitoxantrone, etoposide, and cytarabine. The newly diagnosed patients are receiving cytarabine and idarubicin (7+3).
GlycoMimetics plans to present data from this trial at the 2017 American Society of Clinical Oncology (ASCO) Annual Meeting as abstracts 2520 and 2560.
The company also plans to present the research at the 22nd Congress of the European Hematology Association (EHA) as abstracts P547 and P203.
About breakthrough designation
The FDA’s breakthrough therapy designation is intended to expedite the development and review of new treatments for serious or life-threatening conditions.
Breakthrough designation entitles the company developing a therapy to more intensive FDA guidance on an efficient and accelerated development program, as well as eligibility for other actions to expedite FDA review, such as a rolling submission and priority review.
To earn breakthrough designation, a treatment must show encouraging early clinical results demonstrating substantial improvement over available therapies with regard to a clinically significant endpoint, or it must fulfill an unmet need.
About fast track designation
The FDA’s fast track program is designed to facilitate the development and expedite the review of products intended to treat or prevent serious or life-threatening conditions and address unmet medical need.
Through the fast track program, a product may be eligible for priority review. In addition, the company developing the product may be allowed to submit sections of the new drug application or biologic license application on a rolling basis as data become available.
Fast track designation also provides the company with opportunities for more frequent meetings and written communications with the FDA.
About orphan designation
The FDA grants orphan designation to products intended to treat, diagnose, or prevent diseases/disorders that affect fewer than 200,000 people in the US.
The designation provides incentives for sponsors to develop products for rare diseases. This may include tax credits toward the cost of clinical trials, prescription drug user fee waivers, and 7 years of market exclusivity if the product is approved. ![]()
New device that treats esophageal atresia in infants has been authorized
The FDA has authorized a medical device to treat infants up to age 1 year for esophageal atresia, called the Flourish Pediatric Esophageal Atresia Anastomosis.
The device uses magnets attached to two catheters to pull the upper and lower esophagus together, closing the gap for several days until a connection is formed. The catheters are then removed, and the infant can begin feeding via mouth.
Cook Medical provided data on 16 patients implanted with Flourish devices. All patients had successful joining of their esophagus within 3-10 days after receiving the device. A total of 13 of the 16 patients developed anastomotic stricture that required a balloon dilation procedure, a stent, or both to repair. Such strictures also occur with traditional surgery.
The Flourish device should not be used in patients older than 1 year. Other potential complications that may occur include stomach or mouth irritation near the catheter insertion sites and gastroesophageal reflux.
Learn more about the study at www.fda.gov/newsevents/newsroom/pressannouncements/ucm558241.htm.
Key clinical point:
Major finding: All of the 16 patients implanted with the Flourish device were successfully treated for esophageal atresia.
Data source: Data was provided by Cook Medical under a humanitarian device exemption. A total of 16 patients were implanted with the Flourish device.
Disclosures: This study was sponsored by Cook Medical.
Open-capsule technique improves AIE
CHICAGO – A thrice-daily regimen of open-capsule budesonide has the potential to manage a rare and severe illness – adult autoimmune enteropathy (AIE) – according to Ayush Sharma, MD.
Most patients who received the treatment responded to it, with about half experiencing a complete cessation of the chronic diarrhea that is the clinical hallmark of adult autoimmune enteropathy, Dr. Sharma said at the annual Digestive Disease Week®.
“AIE is a very rare disease, with only about 50 cases reported in the literature,” said Dr. Sharma. But part of its rarity may result from misdiagnosis. AIE is frequently mistaken for severe treatment-refractory celiac disease. Both are clinically characterized by refractory diarrhea, malabsorption of nutrients, and anorexia. However, unlike celiac disease, which is caused by genetic gluten intolerance and limited to the large intestine, AIE is a pangastrointestinal disorder that also involves the pancreas and liver. On histology, the small intestine displays often complete villous atrophy. AIE also has a very specific immune marker: gut epithelial cell antibodies, which attack enterocytes and goblet cells. These cells are often completely absent as the disease progresses.
AIE has typically been treated with immunosuppressive therapy, including corticosteroids and azathioprine. Resistant cases have been treated with adalimumab, infliximab, and tacrolimus, which are moderately successful. Because it’s an autoimmune disorder, patients need long-term maintenance therapy, which exposes them to all the risks associated with these powerful medicines.
Recently, physicians at the Mayo Clinic have adopted Dr. Murray’s open-capsule budesonide regimen as an AIE treatment. It employs three daily doses of 3-mg enteric-coated budesonide capsules, which are consumed in three different ways:
- Morning dose: Open the capsule, empty the contents in applesauce, grind between the teeth, and swallow with water.
- Afternoon dose: Open the capsule, empty the contents in applesauce, and swallow without chewing.
- Evening dose: Swallow the whole capsule.
Dr. Sharma presented a retrospective analysis comparing patient characteristics and treatment response among 43 patients with treatment-refractory celiac disease (RCD) and 26 with AIE. Patients were treated at the Mayo Clinic in Rochester from 2001 to 2016.
AIE patients were younger than RCD patients (44 vs. 57 years) and, more often, male (62% vs. 28%). They were more likely to report diarrhea (100% vs. 70%), weight loss (84% vs. 69%), and fatigue (50% vs. 14%), and to be on total parenteral nutrition (35% vs. 7%).
A large proportion (69%) had tried a gluten-free diet, but none responded to it. Gut epithelial cell antibodies were often present (82% of AIE patients vs. 12.5% of RCD patients). AIE patients more often had hypoalbuminemia (64% vs. 16%). Nearly half (46%) showed complete villous atrophy, compared with 30% of those with RCD. However, they showed intraepithelial lymphocytes less often than did those with RCD (54% vs. 91%).
Patients in both the AIE and RCD cohorts were initially treated with other drugs, including azathioprine (27% and 35%, respectively) and systemic corticosteroids (96% and 14%). Only three of the AIE patients responded well to these. Additionally, about a quarter of each cohort had already taken a course of enteric-coated budesonide, but none had responded to it. All patients except the three responders were given a trial of open-capsule budesonide.
Clinical response was defined as complete cessation of diarrhea after treatment. Partial response was an improvement in stool frequency or weight gain but not complete resolution. After subtracting the numbers lost to follow-up and the patients who responded to initial therapy, clinical outcomes were available for 17 AIE patients and 37 RCD patients (about 85% of each group).
Almost half of those with AIE (8; 47%) and a majority of those with RCD (25; 68%) experienced a complete response to open-capsule budesonide. A partial response occurred in seven of those with AIE (41%) and nine of those with RCD (24%). Only two patients with AIE and three with RCD failed to respond to the regimen.
“We were very happy to see that 89% of our AIE patients responded to open-label budesonide,” Dr. Sharma said. “We need prospective clinical trials of this treatment. Open-label budesonide may be useful as an initial treatment in AIE, with the benefit of a safer therapeutic profile than systemic steroids.”
Dr. Sharma had no relevant financial disclosures.
msullivan@frontlinemedcom.com
On Twitter @alz_gal
Key clinical point:
Major finding: Most patients (89%) experienced complete or partial remission after treatment.
Data source: A retrospective study comparing 26 patients with adult autoimmune enteropathy and 43 with treatment-refractory celiac disease.
Disclosures: Dr. Sharma had no relevant financial disclosures.
Plecanatide improves bowel function, abdominal pain
CHICAGO – Plecanatide, a drug recently approved for chronic idiopathic constipation, bested placebo in two randomized studies evaluating its effect in irritable bowel syndrome with constipation.
Results of the identical, 12-week, phase III studies propelled plecanatide (Trulance; Synergy Pharmaceuticals) into a supplemental new drug application for adult irritable bowel syndrome–constipation predominant (IBS-C), Ronald Fogel, MD, said at the annual Digestive Disease Week®.
During the question-and-answer period, though, clinicians didn’t quite echo the corporate enthusiasm for plecanatide. Several pointed out that overall responder rates were somewhat low for both the 3-mg and 6-mg dose (study -04, 30% both doses; study -05, 21% and 24%), with a drug-placebo differential of about 12% and 7%, respectively. When questioned, Dr. Fogel didn’t have data on the number needed to treat to improve one case. But, he asserted, such response numbers are typical for drug trials in patients with functional bowel disorders and meaningful to those who did respond.
“The differences were statistically significant, and, as someone who was there for both trials, I would say they are also clinically significant,” said Dr. Fogel, founder of the Digestive Health Center of Michigan, Chesterfield. “Patients who did respond were very happy.”
The drug was also quite well-tolerated, with diarrhea as the only important treatment-related adverse event and. This occurred in less than 2% of patients, and only about 1% of either cohort discontinued the medication because of severe diarrhea.
Plecanatide, structurally, is almost identical to uroguanylin, a peptide that regulates sodium and bicarbonate secretion into the intestine but with 8 times greater binding potential to the guanylate cyclase-C receptor. Both the natural and manmade molecules promote fluid secretion into the lumen and inhibit fluid absorption. Uroguanylin is most active in an acidic environment; therefore, plecanatide exerts most of its action in the proximal small intestine.
Synergy also asserts on its website that activation of the GC-C-receptor “may lead to decreased inflammation and pain sensation in the GI tract.” Abdominal pain was not a primary outcome in the pivotal trials for plecanatide’s idiopathic constipation studies, but it was a coprimary endpoint, with stool frequency, for the IBS-C trials.
The studies enrolled a total of 2,189 patients with a diagnosis of IBS-S. They were equally randomized to placebo or plecanatide 3 mg or 6 mg, once daily. Most (75%) were women. The mean age was about 43 years. At baseline, they reported less than one complete, spontaneous bowel movement per week. They also completed an 11-point scale on abdominal symptoms of pain (mean, 6), discomfort (mean, 6.2), and bloating (mean, 6.5).
The study included a 2-week pretreatment assessment period, 12 weeks of daily therapy during which patients filled out an electronic diary of stool frequency and abdominal pain/discomfort, and a 2-week follow-up. The primary endpoint was the number of overall responders, who had to experience both a decrease of at least 30% in their weekly abdominal pain score and an increase of at least one complete, spontaneous bowel movement per week.
Both studies posted statistically significant overall responder rates, relative to placebo, in both doses.
In study -04, the final overall placebo response rate was 17.8%, compared with 30% in the plecanatide 3-mg group and 29.5% in the plecanatide 6-mg group. In study -05, the placebo responder rate was 14%, compared with 21.5% in the 3-mg group and 24% in the 6-mg group.
Dr. Fogel showed stool frequency data but not abdominal pain data. About 41% of patients taking the study drug had increased bowel movements for at least 6 weeks of treatment, compared with 31.4% of those taking placebo. This 9% absolute difference was remarked on during the question-and-answer period as a surprisingly small separation. However, Dr. Fogel said that it was clinically significant as well as statistically so, with a P value of less than 0.001.
Plecanatide worked quickly. By the end of treatment week 1, the placebo and both active groups had already significantly separated, and that separation remained significant throughout the entire treatment period. During the 2-week follow-up period, the effect of both active doses tailed off and fell to the same as placebo by the end of 2 weeks.
One of the drug’s strongest points was its low rate of treatment-related diarrhea. Any diarrhea occurred in about 4% of both dosage groups, compared to 1% of the placebo group. Severe diarrhea occurred in 1% of the 3-mg and 0.4% of the 6-mg group, compared with 0.1% of the placebo group. This caused about 1% of patients to discontinue the study medication.
The adverse event profile was notably better than that of linaclotide (Linzess; Allergan), plecanatide’s close competitor. Also a guanylate cyclase–C agonist, linaclotide provoked diarrhea in almost 20% of patients in its pivotal phase III trials. Symptoms were severe in 2%. Lincalotide’s effectiveness in promoting bowel movements was slightly higher than that of plecanatide (about 48% in the pivotal trials), with a similar placebo response rate.
Plecanatide was approved earlier this year for chronic idiopathic constipation in adults.
Synergy Pharmaceuticals sponsored the study. Dr. Fogel has no financial interest in the company or in plecanatide.
msullivan@frontlinemedcom.com
On Twitter @alz_gal
Key clinical point:
Major finding: In study -04, the placebo response rate was 17.8%, compared with 30% in the plecanatide 3-mg group and 29.5% in the plecanatide 6-mg group. In study -05, the placebo responder rate was 14%, compared with 21.5% in the 3-mg group and 24% in the 6-mg group.
Data source: The studies enrolled almost 2,200 patients.
Disclosures: Synergy Pharmaceuticals sponsored the trials. Dr. Fogel has no financial interest in the company or in plecanatide.
Challenges facing independent integrated gastroenterology in 2017
The practice of gastroenterology is challenging for community physicians, those employed in multi-specialty clinics or large health care systems and those in academic health centers. Unique challenges confront independent GI practices, and there are mounting regulatory, financial, and operational barriers. Election results of 2016 have thrown us into an even more confusing future. In this month’s Road Ahead column, national GI leaders summarize the major challenges facing independent practices. Each leads (or has led) large GI practices and each has extensive experience with the policies, politics, payers, and pitfalls that impact our specialty. They have written a clear and helpful article for all physicians trying to maintain their independence and patient-focused practices. I have worked in many settings from the VA, to small and then large, independent practice, within a health system and in 2 academic medical centers. There is much to treasure in every type of practice and also many challenges. Physician leaders, both old and young, need to be informed and active in shaping medical policy.
John I. Allen, MD, MBA, AGAF, Editor in Chief
Physicians practicing in independent settings report greater satisfaction with their careers compared with those employed in hospital systems. In a recent survey,1 nearly two-thirds of independent practitioners strongly agreed with the statement, “I like being a physician,” compared with approximately half of those employed by hospital systems. The rapid pace of change in care delivery is forcing all caregivers to modify how they provide care. For physicians practicing in independent settings, understanding, reacting, and adapting to these changes is especially challenging.
It is particularly difficult for physicians and practices to remain abreast and cognizant of the ever-changing rules governing how we deliver care for our patients. The Digestive Health Physicians Association was formed 2 years ago to provide an active voice specifically for independent gastroenterology (GI) practices. The mission of the Digestive Health Physicians Association is to promote and protect the high-quality and cost-efficient care provided in the integrated GI practice model.
In the past decade, meeting the goal of the Triple Aim (improving population health, improving patient experience of care, and reducing the per-capita cost of health care) has become a central tenet of our national health policy strategy, especially since the enactment of the Affordable Care Act. Achieving the goals of the Triple Aim and complying with the changes and new requirements challenges all gastroenterologists, but particularly those working in the independent practice setting, and especially those in small group practices. The Centers for Medicare and Medicaid Services (CMS) recently estimated that under the Merit-Based Incentive Payment System, payment reductions resulting from the first year of reporting in 2017 will occur in 87% of solo practices, in 70% of groups with 2 to 9 physicians, and in 60% of groups with 10 to 24 physicians.2
Preparing yourself and your practice for the changes ahead will require an understanding of the rules, an assessment of your practice’s readiness, and the creation of a plan for compliance to ensure success.
The care model has undergone major changes in the past decade. The development of regional hospital systems has resulted in increasing numbers of employed physicians. Independent gastroenterology practices also have made changes in how they provide care. Vertical integration by independent practices has been a major, positive, and continuing development. As practices have grown more sophisticated with greater areas of specialization, they are increasingly capable of providing services directly to their patients rather than outsourcing them to external providers. Beginning first with endoscopic procedures and now extending to anesthesia, pathology, infusion, and other critical services, increased integration of services across the entire continuum of care has led to improved efficiency and care coordination, benefitting patients with improved outcomes as well as lower costs to our health care system.
The benefits and successes of practice integration, unfortunately, also have made vertically integrated practices a target for regulators and policy makers. Attacks on the integrated delivery model in gastroenterology have at times been supported, if not directly initiated, by our own colleagues in the house of medicine. In this article, we describe some of the threats and challenges confronting independent GI practice.
Anesthesia services
In April 2016, the Florida Society of Anesthesiologists (FSA) made headlines by drawing attention to its role as the relator in a qui tam (whistleblower) lawsuit that it had filed against more than 50 physicians, Ambulatory Surgery Centers, and anesthesia entities. This legal action — which the FSA filed in October 2013 but remained under seal until earlier this year — alleged that the defendants perpetrated Medicare and Medicaid fraud through violations of the federal Anti-Kickback Statute and the False Claims Act. In this lawsuit, the FSA specifically targeted the company model used to provide anesthesia services. Based on publicly available documents, the case currently is in its early stages, although the FSA has made it clear that it views the lawsuit as a blueprint for attacking integrated anesthesia services.
The FSA’s qui tam action in Florida is part of a broader agenda by those who seek to undermine the integrated care model that enables gastroenterologists and other physician specialists to integrate anesthesia services into lawful care models. A website describing the Florida qui tam action hailed the American Society of Anesthesiology for having “repeatedly petitioned the Office of the Inspector General, brought the issue up with Congressional leaders and executive branch regulators, and provided information and legal resources to its members.”3 These efforts to undermine integrated, coordinated care at the federal level also have extended to the state level, in which efforts have been made in front of licensing boards and state legislatures – albeit unsuccessfully – to restrict the integration of anesthesia services.
In-Office Ancillary Services Exception
The In-Office Ancillary Services Exception (IOASE) to the federal physician self-referral statute (the Stark Law), allows physician practices to provide certain services, including diagnostic imaging and anatomic pathology, in an integrated and coordinated fashion within their respective practices when strict criteria are met.
Not surprisingly, competing providers of these services have long fought for the elimination of the IOASE. In 2013, Representative Jackie Speier (D-CA) introduced the Promoting Integrity in Medicare Act. This bill sought to eliminate those legal protections for providing those integrated medical services under the IOASE. Vigorous support for the legislation was provided by a group called the Alliance for Integrity in Medicine, a coalition of organizations including the College of American Pathologists, the American Society for Clinical Pathology, the American Clinical Laboratory Association, and the American College of Radiology. Although that bill did not even receive a vote during the last Congress, Representative Speier has re-introduced it in this current session, and continues to lobby aggressively in support of this legislation. President Obama’s budget for 2016, as the President’s budget proposal had done for the past several years, also included elimination of the IOASE provision. Extensive advocacy efforts by a broad range of specialty organizations have been instrumental to date in defeating this proposal. A study commissioned by the Digestive Health Physicians Association,4 using Medicare data, showed that GI-related anatomic pathology services actually increased more slowly in professional settings (physician offices and laboratories), at an annual rate of 1.2% from 2009 to 2013, compared with the outpatient hospital setting of 3.5% during that same period. Efforts to restrict practice integration similarly are being made at the state level. In California, legislation to eliminate the IOASE under the State’s self-referral law was introduced in 2014. Coordinated efforts by California patient- and physician-interest groups were successful in educating legislators on the value of the integrated care mode and the bill was soundly defeated.
Medicare Part B Drug Benefit
In March 2016, a new threat to integrated care in GI surfaced when the CMS released a proposed rule that would test a new Medicare Part B payment model for infused drugs including infliximab and vedolizumab. Under the proposal, the CMS would reduce the current reimbursement of 6% above average sales price (ASP) to ASP plus 2.5%, plus a flat fee of $16.85 per infusion. CMS calculations in this proposal failed to include the mandatory 2% sequestration of Medicare payments under the Budget Control Act, which means that the actual reimbursement will be less than 1% over ASP. Because many practices are unable to negotiate discounts for these drugs, unintended consequences of this proposal may disrupt care coordination efforts, resulting in movement of infusions performed in the office setting into the more costly hospital setting. Perversely, although the stated intent of this proposal was to reduce incentives for prescribing more expensive drugs, infused biologic agents are actually treatments of last choice for many inflammatory bowel disease patients.
In the absence of less-expensive alternatives, this proposed change in reimbursement likely will reduce access to effective therapy for some of our sickest patients and will not reduce costs. It is hoped that the vigorous advocacy by a coalition of more than 300 medical societies and patient-interest groups along with a majority of members of Congress may result in modifications to this proposal when the final rule is released later this year.
Stark Law
The Stark Law, commonly known as the Physician Self-Referral Law, originally was passed by Congress in 1989 and was substantially amended last in 1993. The Stark Law was enacted to address concerns of potential overuse or inappropriate use of services in a fee-for-service payment system. Health care delivery has changed dramatically since the Stark law was passed 27 years ago, but this statute has not kept pace and is incompatible with new and innovative delivery models that now mandate a shift from fee-for-service payment models to value-based care and the development of risk-sharing arrangements and bundling of services. In 2011, the CMS created a set of waivers for Accountable Care Organizations in the Medicare Shared Savings Program, but these waivers do not apply to many of the alternative payment models under development by independent physicians.
In the past year, Congress repealed the Sustainable Growth Rate formula. Both the Affordable Care Act and the Medicare Access and Children’s Health Insurance Program Reauthorization Act of 2015 were designed to move our health care system away from fee for service (volume) and toward payment for value. The current Stark Law was created to control arrangements in a fee-for-service system, but the Stark Law now obstructs the ability of physicians in independent practices to coordinate care and work as teams across specialties and with their colleagues who care for patients in other sites of service such as hospitals and academic medical centers.
Congress and CMS recently have heard from dozens of physician organizations, including all of the GI societies, about the need to modernize the Stark Law (by way of updates to the Stark statute and its corresponding regulations) to keep pace with the changes in health care delivery and to ensure successful implementation of the Medicare Access and Children’s Health Insurance Program Reauthorization Act. The changes sought include modifications to the definition of the term group practice to permit coordinated care across specialties and sites of service as well as to promote value-based compensation for all physicians.
Conclusions
To maximally amplify our voices as well our ability to effect positive change, gastroenterologists and other specialists should be actively engaged with the GI societies to help influence those changes proposed. Joining together will facilitate the adaptation by practices to change as it is mandated. The American Gastroenterological Association has long advocated for independent practices promoting optimal patient care delivery. Working cooperatively and collectively with colleagues in all GI professional organizations will enhance our ability to advance the best interests of our patients and our practices.
References
1. Great American Physician Survey 2013. Available from: Physicianspractice.com. Accessed: May 8, 2016.
2. Lowes, R. New Medicare penalty hits small groups, solo physicians hardest. Medscape Medical News. April 28, 2016;
3. The Anesthesia Company Model - FAQs. Available from: http://www.fsahq.org/anesthesia-company-model-faqs. Accessed: May 8, 2016.
4. Milliman White Paper, Medicare anatomic pathology utilization 2009-2013. Available: http://www.dhpassociation.org/wordpress/wp-content/uploads/2015/07/milliman-03-2009-2013-medicare-utilization-analysis.pdf. Accessed: May 8, 2016.
Dr. Rosenberg is a board-certified gastroenterologist who is currently the president of Illinois Gastroenterology Group, Highland Park, Ill; Dr Kim is a gastroenterologist at South Denver Gastroenterology, P.C., Lone Tree, Colo.; and Dr. Ketover is a gastroenterologist and is president and CEO of Minnesota Gastroenterology, P.A.; St. Paul. The authors disclose no conflicts.
FDA approves pembrolizumab for advanced urothelial carcinoma
The Food and Drug Administration has granted regular approval to pembrolizumab (Keytruda) for patients with locally advanced or metastatic urothelial carcinoma who have disease progression during or following platinum-containing chemotherapy or within 12 months of neoadjuvant or adjuvant treatment with platinum-containing chemotherapy.
Accelerated approval was granted for patients with locally advanced or metastatic urothelial carcinoma who are not eligible for cisplatin-containing chemotherapy.
Approval of pembrolizumab for the second-line indication was based on an improvement in overall survival and objective response rate (ORR) in the KEYNOTE-045 trial. Median overall survival was 10.3 months for patients randomized to receive pembrolizumab (n = 270) every 3 weeks, compared with 7.4 months for patients randomized to receive the investigator’s choice of a chemotherapy regimen (paclitaxel [n = 84], docetaxel [n = 84], or vinflunine [n = 87]) every 3 weeks (hazard ratio, 0.73; 95% confidence interval: 0.59-0.91, P =.004). ORR was 21% for pembrolizumab and 11% for chemotherapy (P = .002). All patients had locally advanced or metastatic urothelial carcinoma with disease progression on or after platinum-containing chemotherapy. No statistically significant difference in progression-free survival between the two arms was observed, the FDA said in a statement.
The accelerated approval for the first-line indication was based on an ORR of 28.6% (95% CI, 24-34) in KEYNOTE-052, a single-arm, open-label trial in 370 patients with locally advanced or metastatic urothelial carcinoma who were deemed not eligible for cisplatin-containing chemotherapy. The median response duration was not reached (range, 1.4+-17.8+ months).
The most common adverse reactions reported for those receiving pembrolizumab in either of the two trials included fatigue, musculoskeletal pain, pruritus, decreased appetite, nausea, diarrhea, constipation, and rash. Discontinuation of pembrolizumab occurred in 8% of patients in KEYNOTE-045 and in 11% in KEYNOTE-052. Serious adverse reactions occurred in approximately 40% of pembrolizumab-treated patients, the FDA said.
The recommended pembrolizumab dose and schedule for the treatment of urothelial carcinoma is 200 mg as an intravenous infusion over 30 minutes every 3 weeks. Full prescribing information is available the FDA website.