User login
Screening catches breast cancer early in HL survivors
Results of a new study indicate that MRI and mammography can detect invasive breast tumors at very early stages in female survivors of Hodgkin lymphoma (HL).
Researchers said the findings underscore the need for at-risk childhood HL survivors and their physicians to be aware of screening guidelines.
The guidelines recommend survivors undergo breast MRI screening beginning at age 25 or 8 years after they received chest radiation, whichever is later.
“Female survivors of childhood HL who had chest radiation should speak with their family doctor about after-care assessment and breast cancer screening,” said David Hodgson, MD, of Princess Margaret Cancer Centre in Toronto, Canada.
“We estimate that 75% of women who are at high risk because of prior radiotherapy to the chest are not being screened. So my hope is that this new evidence will encourage these survivors to discuss early screening with their doctors.”
Dr Hodgson and his colleagues reported this evidence in Cancer.
The researchers evaluated the results of breast MRI and mammography screening among 96 female survivors of childhood HL who had been treated with chest radiotherapy.
The median patient age at first screening was 30 years, and the median number of MRI screening rounds was 3. Ten breast cancers—half of them invasive tumors—were diagnosed in 9 women during 363 person-years follow up.
The median age at breast cancer diagnosis was 39 years (range, 24 to 43 years), and the median latency period between HL diagnosis and age at breast cancer diagnoses was 21 years (range, 12 to 27 years).
“This illustrates the young age at which these cancers can occur,” Dr Hodgson said. “For some of these women, if they had been screened starting at age 40 or 50, like average-risk women, it would have been too late.”
MRI alone detected tumors with 80% sensitivity and 93.5% specificity. Mammography alone detected tumors with 70% sensitivity and 95% specificity. And both modalities combined detected tumors with 100% sensitivity and 88.6% specificity. All invasive tumors were detected by MRI.
In other words, of the 10 breast tumors, 5 were visible on both MRI and mammogram, 3 were visible only on MRI, and 2 were detected via mammogram alone (but were non-invasive). The median size of invasive tumors size was 8 mm (range, 3-15 mm), and none had spread to the lymph nodes.
The researchers noted that these results are substantially better than prior studies using only mammographic screening in young patients.
Dr Hodgson also pointed out that, because MRI screening is so much more sensitive to small changes in the appearance of the breast tissue than mammography, up to a third of patients may be called back for further testing of suspicious findings. But many of these are benign or not clinically significant and, therefore, require no treatment. ![]()
Prevention of Inpatient Hypoglycemia
Insulin therapy in the hospital setting can cause hypoglycemia, which may lead to increased mortality and length of stay (LOS).[1, 2, 3] Hypoglycemia is associated with cardiovascular, cerebrovascular, and patient fall events.[4, 5] The Centers for Medicare and Medicaid Services have designated both severe hypoglycemia (SH) with harm and diabetic ketoacidosis as hospital acquired conditions (HAC) or never events. The Society for Hospital Medicine (SHM) defines SH in the hospital as a blood glucose (BG) <40 mg/dL. Minimizing episodes of SH is important for patient health outcomes, patient safety, and for healthcare facilities' safety metrics.
Many factors contribute to SH including excessive insulin doses, medication errors, inappropriate timing of insulin doses with food intake, changes in nutritional status, impaired renal function, and changes in medications such as steroids.[6] As part of a multiyear project in patient safety, an inpatient hypoglycemia alert algorithm was developed based on a multivariate analysis of individual patient demographic, pharmacy, laboratory, and glucometric data. The algorithm was previously shown to have a 75% sensitivity to predict episodes of SH.[7] In this study, we tested whether a predictive real‐time informatics hypoglycemia alert based on the tested algorithm, along with trained nurses, would result in a decreased frequency of SH events compared to usual care. We hypothesized that this alert would result in a reduction of SH events in those patients at high risk for hypoglycemia.
METHODS
Study Design and Population
This prospective cohort‐intervention study involved inpatients admitted to Barnes‐Jewish Hospital in St. Louis, Missouri, the academic hospital of Washington University School of Medicine (WUSM), from August 2011 through December 2011. Fourteen floors, including 10 internal medicine and 4 cardiology medicine floors, were selected based upon a high frequency of severe hypoglycemic events noted in 2010. Six of the internal medicine floors were designated as intervention floors, and 8 were designated as control floors, including the 4 cardiology units. The study population consisted of patients receiving diabetic medications on study floors who had a BG <90 mg/dL during their hospital stay (Figure 1). The study was approved by the WUSM institutional review board and included a waiver of consent for individual patients.
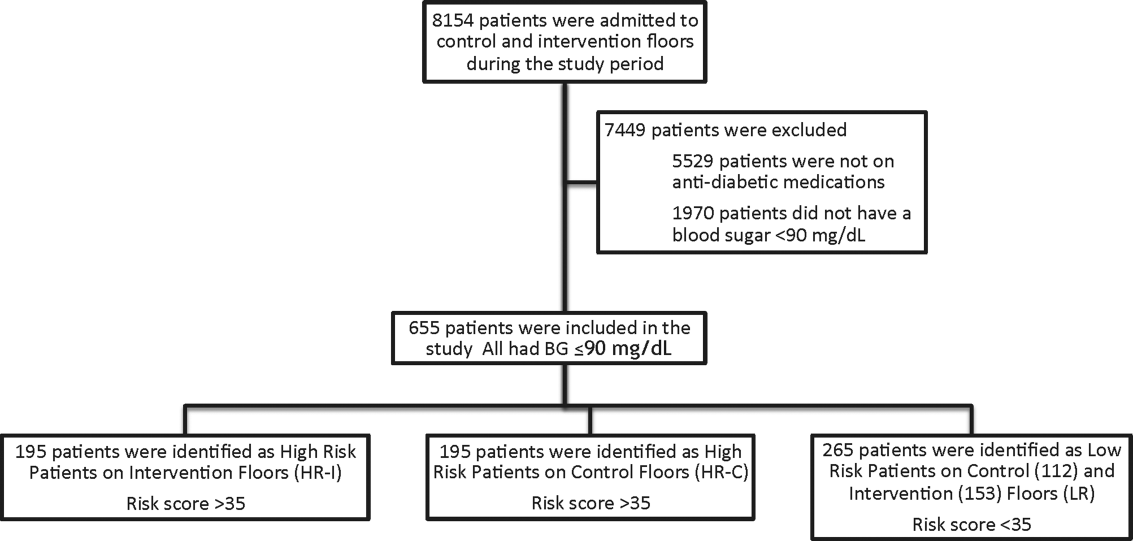
The pharmacy informatics system was programmed with the previously developed hypoglycemia alert to prospectively identify those patients at high risk of hypoglycemia based on real‐time patient information.[7] Patients were identified as high risk on study floors if insulin or an oral antihyperglycemic agent was prescribed and if their hypoglycemia informatics generated risk score was >35 within 24 hours of having a capillary or venous BG<90 mg/dL. The risk score of 35 corresponded to a 50% sensitivity for a subsequent BG <60 mg/dL and a 75% sensitivity for a BG <40 mg/dL. Patients who generated an alert once during their hospital stay were assigned to 1 of 3 categories based on their admission division and risk score: high‐risk intervention (HR‐I), high‐risk control (HR‐C), or low risk (LR). LR patients also had a BG <90 mg/dL during their stay, but a risk score of <35.
The electronic alert for HR‐I patients was sent by pager to division‐specific charge nurses. Fourteen charge nurses on intervention divisions were trained to assess the alert, interview the patient, identify an alternate dosing strategy, and collaborate with the patient's physicians. HR‐C patients were identified on control divisions based on the same criteria as intervention patients, but no alert was generated. Control patients' charts were reviewed and evaluated upon discharge by the research team‐certified diabetes nurse educator to determine whether the treating physician had identified the SH risk and had changed insulin orders.
Nurses and physicians caring for patients on study divisions provided informed consent to participate in the study. Nurses' satisfaction with the alert process and physician interaction was assessed with a collaboration scale that was completed after each alert (see Supporting Information, Appendix A, in the online version of this article).[8]
Alert Development Process
The alert equation algorithm was developed at Barnes‐Jewish Hospital after a retrospective analysis of hospital glucometric data, including capillary and venous BG measurements, and demographic and pharmacy data over a 6‐month time period.[9] The analysis identified factors that were independently associated with hypoglycemia and used these variables in a mathematical model to achieve a 50% sensitivity to predict a subsequent BG of <60 mg/dL and a 75% sensitivity to predict SH.[7] Table 1 outlines the variables in the model and provides the risk‐score equation used to generate an alert.
| Variable | Description of Variable |
|---|---|
| Body weight | Patients at a lower weight were at an increased risk. The variable had a linear response, and 3 levels were used to modify the risk equation: <69 kg, 7079 kg, and >80 kg. |
| Creatinine clearance | Patients with a lower creatinine clearance were at an increased risk. This variable had a linear response, and 2 levels were used to modify the risk equation: <48 mL/min or >48 mL/min. |
| Basal insulin dose | Increased risk was noted at a doses of basal insulin >0.25 U/kg. |
| Basal‐only dosing | Dosing of basal insulin without meal‐time insulin conferred increased risk. |
| Nonstandard insulin therapy | The use of 70/30 insulin was associated with increased risk. |
| Oral diabetic therapy | Use of sulfonylureas was associated with increased risk. |
| Risk score equation | (Value <60)=0.055+1.062 * (Basal <0.25 U/kg)+1.234 * (Basal 0.25 U/kg) & minus;0.294 * (Weight <6069 kg)0.540 * (Weight 7079 kg)0.786 * (Weight 80 kg) & minus;0.389 * (Creatinine Clearance <3847) 0.680 * (Creatinine Clearance 48) 0.239 * (Sliding Yes) 0.556*(Meal Yes)+0.951 * (Sliding and Meal)+0.336 * (Sulfonylurea Yes) Score=100 * (Exp (Value <60)/(1+Exp (Value <60)) |
The alert used a BG cutoff of 90 mg/dL in accordance with the American College of Endocrinology Hospital Guideline. Although current guidelines from the SHM recommend keeping BG values >100 mg/dL for patient safety, our analysis found that the cutoff of 90 mg/dL had better sensitivity and specificity than the <100 mg/dL guideline for the risk algorithm.[10, 11]
Nurse and Physician Training
Charge nurses received 5 hours of hyperglycemia management training in 3 sessions utilizing a structured curriculum. Session 1 included a pretest followed by diabetes management education. Session 2 was devoted to an interactive workshop utilizing case‐based scenarios of diabetes management problems and hypoglycemia prevention. The final session provided instructions on the electronic alert communication process. Nurses were empowered with tools for effective communication practices using the situation‐background‐assessment‐recommendation (SBAR) technique.[12]
Physicians, including hospitalists and medicine residents on intervention and control floors, took a pretest, received a 1‐hour lecture, and completed the same curriculum of case‐based scenarios in an online self‐directed learning module. Physicians did not receive SBAR training. Both nurses and physicians received pocket cards with insulin management guidelines developed by our research team to ensure that all clinicians had common prescribing practices.[13]
Outcomes
The primary outcome was the incidence of SH occurring in HR‐I versus HR‐C patients. Secondary outcomes included: episodes of SH in LR study patients, incidence of BG<60 mg/dL frequency of transfer to a higher level of care, incidence of severe hyperglycemia defined as BG >299 mg/dL, frequency that high‐risk patient's orders were changed to reduce hypoglycemia risk in response to the alert‐intervention process, LOS, mortality, and a nurse‐physician collaboration scale score.[14]
Statistical Analysis
Demographic and clinical metrics were compared between HR‐I and HR‐C patients to evaluate potential sources of bias. These included age, weight, serum creatinine, creatinine clearance (measured by Cockcroft‐Gault), hemoglobin A1c (HbA1c) if available, LOS, gender, admitting diagnosis, type of diabetes, and Charlson Comorbidity Index score. The alert risk‐score was also compared between intervention and control floors. Two‐tailed t tests assessed differences between the study groups on normally distributed variables, whereas Wilcoxon rank sum tests were used for non‐normally distributed variables, and 2 tests were used for categorical variables. Two‐tailed Fisher exact tests compared the prevalence of hypoglycemia thresholds between the study groups. 2 analysis was used to compare the proportion of patients who experienced a BG >299 mg/dL between intervention and controls and the proportion of orders changed in HR‐I versus HR‐C patients. Logistic regression was used to test the association of nurse collaboration score with the likelihood of orders being changed.
Based on previous research, we estimated a 48% rate of hypoglycemia <60 mg/dL in HR‐C patients on control floors.[7] We calculated a sample size of 195 subjects in each high‐risk group as the number needed for the intervention to produce a clinically meaningful reduction in hypoglycemia of 25% on the intervention floor compared to the control floors with 90% power.
RESULTS
Study Cohort and Patient Characteristics
One hundred ninety‐five patients who met criteria for high‐risk status were enrolled on HR‐I floors and HR‐C floors for a total of 390 high‐risk patients. During the same time period, 265 LR patients were identified on intervention (153 patients) and control (112 patients) floors. The HR‐I patients were similar to the HR‐C patients by baseline demographics, as shown in Table 2. HbA1c was not available on all patients, but the mean HbA1c in the HR‐I group was 7.93% versus 7.40% in the HR‐C group (P=0.048). The Charlson Comorbidity Index score was significantly different between the high‐risk groups (HR‐I: 6.48 vs HR‐C: 7.48, P=0.002), indicating that the HR‐C patients had more comorbidities.[15] There were significant differences in 2 of the 3 most common admitting diagnoses between groups, with more HR‐C patients admitted for circulatory system diseases (HR‐C: 22.3% vs HR‐I: 4.4%, P=0.001), and more HR‐I patients admitted for digestive system diseases (HR‐I: 13.7% vs HR‐C: 3.3%, P<0.001). The proportion of patients with preexisting type 2 diabetes did not differ by intervention status (HR‐I: 89.8% vs HR‐C: 92.0%, P=0.462).
| Demographic | HR‐I, Mean SD/Frequency (%), N=195 | HR‐C, Mean, SD/Frequency (%), N=195 | Low Risk, Mean, SD/Frequency (%), N=265 | P Value* |
|---|---|---|---|---|
| ||||
| Age, y | 60.2 (15.1) | 60.3 (16.9) | 61.0 (13.8) | 0.940 |
| Weight, kg | 84.9 (31.9) | 80.8 (26.6) | 93.6 (28.7) | 0.173 |
| Serum creatinine, mg/dL | 2.06 (2.56) | 2.03 (1.87) | 1.89 (2.17) | 0.910 |
| Creatinine clearance, mL/min | 50.6 (29.8) | 45.4 (27.1) | 55.5 (29.3) | 0.077 |
| Hemoglobin A1c, n (%) with data | 7.93 (2.46), n=130 (67%) | 7.40 (1.75), n=115 (59%) | 6.65 (2.05), n=152 (57%) | 0.048 |
| Risk score | 52 (11) | 54 (11) | 26 (6) | 0.111 |
| Length of stay, median, d | 5.83 | 5.88 | 5.79 | 0.664 |
| Male gender | 84 (43.1%) | 98 (50.3%) | 145 (54.7%) | 0.155 |
| Type 2 diabetes | 167 (89.8%) | 172 (92.0%) | 219 (95.6%) | 0.462 |
| Charlson Comorbidity Index score | 6.48 (3.06) | 7.48 (3.28) | 6.66 (3.24) | 0.002 |
| Admit diagnosis endocrine, nutritional, metabolic diseases, and immunity disorders (codes 240279) | 17 (9.3%) | 10 (5.4%) | 11 (4.3%) | 0.153 |
| Admit diagnosis disease of circulatory system (codes 390459) | 8 (4.4%) | 41 (22.3%) | 26 (10.1%) | <0.001 |
| Admit diagnosis disease of digestive system (codes 520579) | 25 (13.7%) | 6 (3.3%) | 27 (10.5%) | <0.001 |
| Admit diagnosis diseases of the genitourinary system (codes 580629) | 6 (3.3%) | 4 (2.2%) | 15 (5.8%) | 0.510 |
| Admit diagnosis reported only as signs, symptoms, or ill‐defined conditions (codes 780799) | 77 (42.3%) | 92 (50.0%) | 121 (46.9%) | 0.140 |
Study Outcomes
The rate of hypoglycemia was compared between 195 HR‐I and 195 HR‐C patients, and it should be noted that each patient could generate only 1 episode of hypoglycemia during an admission. As shown in Table 3, the incidence of a BG <60 mg/dL was significantly lower in the HR‐I patients versus the HR‐C patients (13.3% vs 26.7%, P=0.002) as was the incidence of a BG <40 mg/dL (3.1% HR‐I vs 9.7% HR‐C, P=0.012). This represents a decrease of 50% in moderate hypoglycemia (BG <60 mg/dL) and a decrease of 68% in SH (BG <40 mg/dL) between HR‐I and HR‐C patients. Severe hyperglycemia occurrences were not significantly different between intervention and control floors at 28% each.
| Alerted Patients Glucose Threshold | HR‐I (%), N=195 | HR‐C (%), N=195 | Low Risk (%), N=265 | P Value* |
|---|---|---|---|---|
| ||||
| With BG <40 mg/dL | 6 (3.1%) | 19 (9.7%) | 10 (3.8%) | 0.012 |
| With BG <60 mg/dL | 26 (13.3%) | 51 (26.7%) | 50 (18.9%) | 0.002 |
| With BG >299 mg/dL | 53 (28.0%) | 53 (27.9%) | 29 (11.9%) | 0.974 |
The sensitivity, specificity, and predictive values of the alert for BG thresholds of <40 mg/dL and <60 mg/dL are presented in Table 4. On control floors, the alert exhibited a modest sensitivity and high negative predictive value for BG <40 mg/dL. Sensitivity for a BG <40 mg/dL was 76% and 51.5% for BG <60 mg/dL. The alert was developed with a 50% sensitivity for a BG of <60 mg/dL, and the sensitivities calculated on control floors were consistent with the original modeling. The predictive value of an LR classification was 98.2% for not having a BG <40 mg/dL. The predictive value of a positive alert was 9.7% for BG <40 mg/dL.
| Variable | 40 mg/dL Threshold | 60 mg/dL Threshold |
|---|---|---|
| ||
| Sensitivity: probability of an alert given BG <40 or 60 mg/dL | 76.0% | 51.5% |
| Specificity: probability of no alert given BG >40 or 60 mg/dL | 64.6% | 66.0% |
| Positive predictive value | 9.7% | 26.7% |
| Negative predictive value (nonalerted patients identified as low risk) | 98.2% | 85.0% |
There was no significant difference in mortality (P=0.726), transfer to a higher level of care (P=0.296), or LOS between the 2 groups (HR‐I: 5.83 days vs HR‐C: 5.88 days, P=0.664). However, patients with a BG <40 mg/dL had an LOS of 12.2 days (N=45) versus 8.1 days for those without an SH event (N=610), which was statistically significant (P=0.005). There was no increase in the incidence of BG >299 mg/dL in the HR‐I versus HR‐C groups (P=0.53).
Nurse‐physician satisfaction with the alert process was evaluated using a collaboration scale completed after each alert.[8] Of the 195 hypoglycemia alerts, there were 167 (85.6%) nurse and 25 (12.8%) physician collaboration scales completed. Scores were similar among nurses (average 1.52) and physicians (average 1.72), reflecting positive experiences with collaboration. Orders were changed in 40.7% HR‐I patients in response to the collaboration, but in only 20.5% of HR‐C patients after the initial BG of <90 mg/dL occurred. A change in orders constituted a modification consistent with lowering the risk of hypoglycemia and included discontinuing an oral antidiabetic agent, lowering the dose of insulin, and rarely the addition of dextrose‐containing fluids. The most common change in orders was a reduction in the total dose of insulin. A difference in orders changed was partially explained by the collaboration score; a 1‐unit increase in the score correlated to an odds ratio of 2.10 that the orders would be changed (P=0.002).
DISCUSSION
Hospitals are accountable for safe and effective care of patients with hyperglycemia, which includes prevention of medication‐induced hypoglycemia. We have developed a predictive informatics hypoglycemia risk alert that, when tested in a real‐world situation, significantly reduced the rate of SH in hospitalized patients without increasing severe hyperglycemia. The alert algorithm correctly identified patients who were at high risk for hypoglycemia and allowed caretakers the opportunity to lower that risk. The positive predictive value of the alert was low but acceptable at 9.7%, owing to the overall low rate of hypoglycemia in the patient population.
The alert model tested involved 3 components for success: the automated alert, trained charge nurse responders, and an interaction between the nurse responder and the care provider. HR‐I patients were interviewed and assessed for problems associated with oral intake, dietary habits, medication compliance, and hypoglycemia at home prior to communicating with physicians. The extensive training and proficiency in patient assessment and SBAR communication process required by nurses was paramount in the success of the alert. However, the alert provided a definitive risk assessment that was actionable, versus more global instruction, which has not had the same impact in risk reduction. Based on feedback collected from nurses at the study end, they felt the alert process was within their scope of practice and was not unduly burdensome. They also found that the training in diabetes management and SBAR communication techniques, in addition to the alert system, were useful in protecting patients from medication harm.
Physicians for HR‐C patients missed many opportunities to effectively intervene and thereby reduce the likelihood of an SH event. Our assumption is that the clinicians did not ascertain the risk of SH, which was reflected by the fact that orders were changed in 40.7% of HR‐I patients versus only 20.5% in the HR‐C group. Having alerts go directly to nurses rather than physicians permitted inclusion of additional information, such as caloric intake and testing schedules, so that changes in orders would have greater context, and the importance of mild hypoglycemia would not be overlooked.[16] Glycemic control is challenging for providers in the inpatient setting, as there is little time to test and titrate doses of insulin to achieve control. Tight glycemic control has become the primary focus of diabetes management in the outpatient setting to reduce long‐term risks of microvascular complications.[17, 18] However, establishing glycemic targets in the inpatient setting has been difficult because the risk for hypoglycemia increases with tighter control.[19, 20] Inpatient hypoglycemia has been associated with increased mortality, particularly in critically ill patients.[21, 22] Many factors contribute to hypoglycemia including low creatinine clearance, low body weight, untested insulin doses, errors in insulin administration, unexpected dietary changes, changes in medications affecting BG levels, poor communication during times of patient transfer to different care teams, and poor coordination of BG testing with insulin administration at meal times. A multifaceted approach aimed at improving both clinician and nurse awareness, and providing real‐time risk assessment is clearly required to insure patient safety.[6, 13, 23, 24]
There are significant economic benefits to avoiding SH in the hospital given the adverse outcomes associated with HACs and the extra cost associated with these conditions. In hospitalized patients, hypoglycemia worsens outcomes leading to higher costs due to longer LOS (by 3 days), higher inpatient charges (38.9%), and higher risk of discharge to a skilled nursing facility.[1, 3, 25, 26] Conversely, improved glycemic control can reduce surgical site infections, perioperative morbidity, and hospital LOS.[27] The high prevalence of insulin use among inpatients, many of whom have high‐risk characteristics, creates a milieu for both hyper‐ and hypoglycemia. Other groups have described a drop in hypoglycemia rates related to the use of standardized diabetes order sets and nurse and physician education, but this is the first study that used informatics in a prospective manner to identify patients who are at high risk for developing hypoglycemia and then specifically targeted those patients.[28] The alert process was modeled after a similar alert developed in our institution for identifying medicine patients at risk for sepsis.[29] Given the paucity of data related to inpatient glycemia risk reduction, this study is particularly relevant for improving patient safety.
The major limitation of this study is that it was not randomized at the patient level. Patients were assigned to intervention and control groups based on their occupancy on specific hospital floors to avoid treatment bias. Bias was assessed due to this nonrandom assignment by comparing demographic and clinical factors of HR patients between intervention and control floors, and found significant differences in HbA1c and admitting diagnosis. As the control group had lower HbA1c values than the intervention group, and it is known from the Diabetes Control and Complications Trial and Action to Control Cardiovascular Risk in Diabetes trial that lower HbA1c increases the risk of hypoglycemia, our results may be biased by the level of glucose control on admission.[30, 31] Admitting diagnoses differed significantly between intervention and control patients as did the Charlson Comorbidity Index score; however, the hypoglycemia alert system does not include patient diagnoses or comorbidities, and as such provided equipoise with regard to risk reduction regardless of presenting illness. This study included trained nurses, which may be beyond the scope of every institution and thereby limit the effectiveness of the alert in reducing risk. However, as a result of this study, the alert was expanded to other acute care floors at our hospital as well as other hospitals in the Barnes‐Jewish Hospital system.
In summary, this study showed a 68% decrease in episodes of SH in a high‐risk patient cohort on diabetic medications using a hypoglycemia alert system. The results of this study demonstrate the validity of a systems‐based approach to reduce SH in high‐risk inpatients.
Disclosures
This work was funded by the Barnes‐Jewish Hospital Foundation The authors report no conflicts of interest.
- , , , , , . Hypoglycaemia is associated with increased length of stay and mortality in people with diabetes who are hospitalized. Diabet Med. 2012;29:e445–e448.
- , , , et al. Hypoglycemia as a predictor of mortality in hospitalized elderly patients. Arch Intern Med. 2003;163:1825–1829.
- , , , , , . Hypoglycemia and clinical outcomes in patients with diabetes hospitalized in the general ward. Diabetes Care. 2009;32:1153–1157.
- , , , , . Association of hypoglycemia and cardiac ischemia: a study based on continuous glucose monitoring. Diabetes Care. 2003;26:1485–1489.
- , , , et al. Diabetes‐related complications, glycemic control, and falls in older adults. Diabetes Care. 2008;31:391–396.
- , , , , . Inpatient insulin orders: are patients getting what is prescribed? J Hosp Med. 2011;9:526–529.
- , , , . Prediction and prevention of treatment‐related inpatient hypoglycemia. J Diabetes Sci Technol. 2012;6:302–309.
- , . Collaboration between nurses and physicians. Image J Nurs Sch. 1988;20:145–149.
- , , , et al. Glucometrics—assessing the quality of inpatient glucose management. Diabetes Technol Ther. 2005;8:560–569.
- ACE/ADA Task Force on Inpatient Diabetes. American College of Endocrinology and American Diabetes Association consensus statement on inpatient diabetes and glycemic control. Diabetes Care. 2006;29:1955–1962.
- , , , et al. American Association of Clinical Endocrinologists and American Diabetes Association consensus statement on inpatient glycemic control. Endocr Pract. 2009;15:353–369.
- . Role‐play using SBAR technique to improve observed communication skills in senior nursing students. J Nurs Educ. 2011;50:79–87.
- SHM Glycemic Control Task Force. Workbook for improvement: improving glycemic control, preventing hypoglycemia, and optimizing care of the inpatient with hyperglycemia and diabetes. Society of Hospital Medicine website, Glycemic Control Quality Improvement Resource Room. Available at: http://www.hospitalmedicine.org. Accessed on February 12, 2011.
- , . An internet service supporting quality assessment of inpatient glycemic control. J Diabetes Sci and Technol. 2008;2:402–408.
- , , , et al. Updating and validating the Charlson Comorbidity Index and score for risk adjustment in hospital discharge abstracts using data from 6 countries. Am J Epidemiol. 2011;173:676–682.
- , , . Glycemic management in medical and surgical patients in the non‐ICU setting. Curr Diab Rep. 2013;13:96–106.
- The Diabetes Control and Complications Trial Research Group. The effect of intensive treatment of diabetes on the development and progression of long‐term complications in insulin‐dependent diabetes mellitus. N Engl J Med. 1993;329:977–986.
- UK Prospective Diabetes Study Group. Intensive blood‐glucose control with sulphonylureas or insulin compared with conventional treatment and risk of complications in patients with type 2 diabetes. Lancet. 1998;352:837–853.
- , , . Hypoglycemia in diabetes. Diabetes Care. 2003;26:1902–1912.
- . Hypoglycemia: still the limiting factor in the glycemic management of diabetes. Endocr Pract. 2008;14:750–756.
- , , , et al.; for the NICE‐SUGAR Study Investigators. Hypoglycemia and risk of death in critically ill patients. N Engl J Med. 2012;367:1108–1118.
- , , , , , . Increased mortality of patients with diabetes reporting severe hypoglycemia. Diabetes Care. 2012;35:1897–1901.
- , , , et al. Risk factors for inpatient hypoglycemia during subcutaneous insulin therapy in non‐critically ill patients with type 2 diabetes. J Diabetes Sci Technol. 2012;6:1022–1029.
- , , . Minimizing hypoglycemia in the wake of a tight glycemic control protocol in hospitalized patients. J Nurs Care Qual. 2010;25:255–260.
- , , , . The economic and quality of life impact of hypoglycemia. Eur J Health Econ. 2005;6:197–202.
- , , , , , . Economic and clinical impact of inpatient diabetic hypoglycemia. Endocr Pract. 2009;15:302–312.
- , , , et al. Mild hypoglycemia is strongly associated with increased intensive care unit length of stay. Ann Intensive Care. 2011;49:1–49.
- , , , et al. Implementing and evaluating a multicomponent inpatient diabetes management program: putting research into practice. Jt Comm J Qual Patient Saf. 2012;38:195–206.
- , , , et al. Implementation of a real‐time computerized sepsis alert in nonintensive care unit patients. Crit Care Med. 2011;39:469–473.
- The Diabetes Control and Complications Trial Research Group. Epidemiology of severe hypoglycemia in the Diabetes Control and Complications Trial. Am J Med. 1991;90:450–459.
- , , , et al. The effects of baseline characteristics, glycemia treatment approach, and glycated hemoglobin concentration on the risk of severe hypoglycaemia: post hoc epidemiological analysis of the ACCORD study. BMJ. 2010;340:1–12.
Insulin therapy in the hospital setting can cause hypoglycemia, which may lead to increased mortality and length of stay (LOS).[1, 2, 3] Hypoglycemia is associated with cardiovascular, cerebrovascular, and patient fall events.[4, 5] The Centers for Medicare and Medicaid Services have designated both severe hypoglycemia (SH) with harm and diabetic ketoacidosis as hospital acquired conditions (HAC) or never events. The Society for Hospital Medicine (SHM) defines SH in the hospital as a blood glucose (BG) <40 mg/dL. Minimizing episodes of SH is important for patient health outcomes, patient safety, and for healthcare facilities' safety metrics.
Many factors contribute to SH including excessive insulin doses, medication errors, inappropriate timing of insulin doses with food intake, changes in nutritional status, impaired renal function, and changes in medications such as steroids.[6] As part of a multiyear project in patient safety, an inpatient hypoglycemia alert algorithm was developed based on a multivariate analysis of individual patient demographic, pharmacy, laboratory, and glucometric data. The algorithm was previously shown to have a 75% sensitivity to predict episodes of SH.[7] In this study, we tested whether a predictive real‐time informatics hypoglycemia alert based on the tested algorithm, along with trained nurses, would result in a decreased frequency of SH events compared to usual care. We hypothesized that this alert would result in a reduction of SH events in those patients at high risk for hypoglycemia.
METHODS
Study Design and Population
This prospective cohort‐intervention study involved inpatients admitted to Barnes‐Jewish Hospital in St. Louis, Missouri, the academic hospital of Washington University School of Medicine (WUSM), from August 2011 through December 2011. Fourteen floors, including 10 internal medicine and 4 cardiology medicine floors, were selected based upon a high frequency of severe hypoglycemic events noted in 2010. Six of the internal medicine floors were designated as intervention floors, and 8 were designated as control floors, including the 4 cardiology units. The study population consisted of patients receiving diabetic medications on study floors who had a BG <90 mg/dL during their hospital stay (Figure 1). The study was approved by the WUSM institutional review board and included a waiver of consent for individual patients.
The pharmacy informatics system was programmed with the previously developed hypoglycemia alert to prospectively identify those patients at high risk of hypoglycemia based on real‐time patient information.[7] Patients were identified as high risk on study floors if insulin or an oral antihyperglycemic agent was prescribed and if their hypoglycemia informatics generated risk score was >35 within 24 hours of having a capillary or venous BG<90 mg/dL. The risk score of 35 corresponded to a 50% sensitivity for a subsequent BG <60 mg/dL and a 75% sensitivity for a BG <40 mg/dL. Patients who generated an alert once during their hospital stay were assigned to 1 of 3 categories based on their admission division and risk score: high‐risk intervention (HR‐I), high‐risk control (HR‐C), or low risk (LR). LR patients also had a BG <90 mg/dL during their stay, but a risk score of <35.
The electronic alert for HR‐I patients was sent by pager to division‐specific charge nurses. Fourteen charge nurses on intervention divisions were trained to assess the alert, interview the patient, identify an alternate dosing strategy, and collaborate with the patient's physicians. HR‐C patients were identified on control divisions based on the same criteria as intervention patients, but no alert was generated. Control patients' charts were reviewed and evaluated upon discharge by the research team‐certified diabetes nurse educator to determine whether the treating physician had identified the SH risk and had changed insulin orders.
Nurses and physicians caring for patients on study divisions provided informed consent to participate in the study. Nurses' satisfaction with the alert process and physician interaction was assessed with a collaboration scale that was completed after each alert (see Supporting Information, Appendix A, in the online version of this article).[8]
Alert Development Process
The alert equation algorithm was developed at Barnes‐Jewish Hospital after a retrospective analysis of hospital glucometric data, including capillary and venous BG measurements, and demographic and pharmacy data over a 6‐month time period.[9] The analysis identified factors that were independently associated with hypoglycemia and used these variables in a mathematical model to achieve a 50% sensitivity to predict a subsequent BG of <60 mg/dL and a 75% sensitivity to predict SH.[7] Table 1 outlines the variables in the model and provides the risk‐score equation used to generate an alert.
| Variable | Description of Variable |
|---|---|
| Body weight | Patients at a lower weight were at an increased risk. The variable had a linear response, and 3 levels were used to modify the risk equation: <69 kg, 7079 kg, and >80 kg. |
| Creatinine clearance | Patients with a lower creatinine clearance were at an increased risk. This variable had a linear response, and 2 levels were used to modify the risk equation: <48 mL/min or >48 mL/min. |
| Basal insulin dose | Increased risk was noted at a doses of basal insulin >0.25 U/kg. |
| Basal‐only dosing | Dosing of basal insulin without meal‐time insulin conferred increased risk. |
| Nonstandard insulin therapy | The use of 70/30 insulin was associated with increased risk. |
| Oral diabetic therapy | Use of sulfonylureas was associated with increased risk. |
| Risk score equation | (Value <60)=0.055+1.062 * (Basal <0.25 U/kg)+1.234 * (Basal 0.25 U/kg) & minus;0.294 * (Weight <6069 kg)0.540 * (Weight 7079 kg)0.786 * (Weight 80 kg) & minus;0.389 * (Creatinine Clearance <3847) 0.680 * (Creatinine Clearance 48) 0.239 * (Sliding Yes) 0.556*(Meal Yes)+0.951 * (Sliding and Meal)+0.336 * (Sulfonylurea Yes) Score=100 * (Exp (Value <60)/(1+Exp (Value <60)) |
The alert used a BG cutoff of 90 mg/dL in accordance with the American College of Endocrinology Hospital Guideline. Although current guidelines from the SHM recommend keeping BG values >100 mg/dL for patient safety, our analysis found that the cutoff of 90 mg/dL had better sensitivity and specificity than the <100 mg/dL guideline for the risk algorithm.[10, 11]
Nurse and Physician Training
Charge nurses received 5 hours of hyperglycemia management training in 3 sessions utilizing a structured curriculum. Session 1 included a pretest followed by diabetes management education. Session 2 was devoted to an interactive workshop utilizing case‐based scenarios of diabetes management problems and hypoglycemia prevention. The final session provided instructions on the electronic alert communication process. Nurses were empowered with tools for effective communication practices using the situation‐background‐assessment‐recommendation (SBAR) technique.[12]
Physicians, including hospitalists and medicine residents on intervention and control floors, took a pretest, received a 1‐hour lecture, and completed the same curriculum of case‐based scenarios in an online self‐directed learning module. Physicians did not receive SBAR training. Both nurses and physicians received pocket cards with insulin management guidelines developed by our research team to ensure that all clinicians had common prescribing practices.[13]
Outcomes
The primary outcome was the incidence of SH occurring in HR‐I versus HR‐C patients. Secondary outcomes included: episodes of SH in LR study patients, incidence of BG<60 mg/dL frequency of transfer to a higher level of care, incidence of severe hyperglycemia defined as BG >299 mg/dL, frequency that high‐risk patient's orders were changed to reduce hypoglycemia risk in response to the alert‐intervention process, LOS, mortality, and a nurse‐physician collaboration scale score.[14]
Statistical Analysis
Demographic and clinical metrics were compared between HR‐I and HR‐C patients to evaluate potential sources of bias. These included age, weight, serum creatinine, creatinine clearance (measured by Cockcroft‐Gault), hemoglobin A1c (HbA1c) if available, LOS, gender, admitting diagnosis, type of diabetes, and Charlson Comorbidity Index score. The alert risk‐score was also compared between intervention and control floors. Two‐tailed t tests assessed differences between the study groups on normally distributed variables, whereas Wilcoxon rank sum tests were used for non‐normally distributed variables, and 2 tests were used for categorical variables. Two‐tailed Fisher exact tests compared the prevalence of hypoglycemia thresholds between the study groups. 2 analysis was used to compare the proportion of patients who experienced a BG >299 mg/dL between intervention and controls and the proportion of orders changed in HR‐I versus HR‐C patients. Logistic regression was used to test the association of nurse collaboration score with the likelihood of orders being changed.
Based on previous research, we estimated a 48% rate of hypoglycemia <60 mg/dL in HR‐C patients on control floors.[7] We calculated a sample size of 195 subjects in each high‐risk group as the number needed for the intervention to produce a clinically meaningful reduction in hypoglycemia of 25% on the intervention floor compared to the control floors with 90% power.
RESULTS
Study Cohort and Patient Characteristics
One hundred ninety‐five patients who met criteria for high‐risk status were enrolled on HR‐I floors and HR‐C floors for a total of 390 high‐risk patients. During the same time period, 265 LR patients were identified on intervention (153 patients) and control (112 patients) floors. The HR‐I patients were similar to the HR‐C patients by baseline demographics, as shown in Table 2. HbA1c was not available on all patients, but the mean HbA1c in the HR‐I group was 7.93% versus 7.40% in the HR‐C group (P=0.048). The Charlson Comorbidity Index score was significantly different between the high‐risk groups (HR‐I: 6.48 vs HR‐C: 7.48, P=0.002), indicating that the HR‐C patients had more comorbidities.[15] There were significant differences in 2 of the 3 most common admitting diagnoses between groups, with more HR‐C patients admitted for circulatory system diseases (HR‐C: 22.3% vs HR‐I: 4.4%, P=0.001), and more HR‐I patients admitted for digestive system diseases (HR‐I: 13.7% vs HR‐C: 3.3%, P<0.001). The proportion of patients with preexisting type 2 diabetes did not differ by intervention status (HR‐I: 89.8% vs HR‐C: 92.0%, P=0.462).
| Demographic | HR‐I, Mean SD/Frequency (%), N=195 | HR‐C, Mean, SD/Frequency (%), N=195 | Low Risk, Mean, SD/Frequency (%), N=265 | P Value* |
|---|---|---|---|---|
| ||||
| Age, y | 60.2 (15.1) | 60.3 (16.9) | 61.0 (13.8) | 0.940 |
| Weight, kg | 84.9 (31.9) | 80.8 (26.6) | 93.6 (28.7) | 0.173 |
| Serum creatinine, mg/dL | 2.06 (2.56) | 2.03 (1.87) | 1.89 (2.17) | 0.910 |
| Creatinine clearance, mL/min | 50.6 (29.8) | 45.4 (27.1) | 55.5 (29.3) | 0.077 |
| Hemoglobin A1c, n (%) with data | 7.93 (2.46), n=130 (67%) | 7.40 (1.75), n=115 (59%) | 6.65 (2.05), n=152 (57%) | 0.048 |
| Risk score | 52 (11) | 54 (11) | 26 (6) | 0.111 |
| Length of stay, median, d | 5.83 | 5.88 | 5.79 | 0.664 |
| Male gender | 84 (43.1%) | 98 (50.3%) | 145 (54.7%) | 0.155 |
| Type 2 diabetes | 167 (89.8%) | 172 (92.0%) | 219 (95.6%) | 0.462 |
| Charlson Comorbidity Index score | 6.48 (3.06) | 7.48 (3.28) | 6.66 (3.24) | 0.002 |
| Admit diagnosis endocrine, nutritional, metabolic diseases, and immunity disorders (codes 240279) | 17 (9.3%) | 10 (5.4%) | 11 (4.3%) | 0.153 |
| Admit diagnosis disease of circulatory system (codes 390459) | 8 (4.4%) | 41 (22.3%) | 26 (10.1%) | <0.001 |
| Admit diagnosis disease of digestive system (codes 520579) | 25 (13.7%) | 6 (3.3%) | 27 (10.5%) | <0.001 |
| Admit diagnosis diseases of the genitourinary system (codes 580629) | 6 (3.3%) | 4 (2.2%) | 15 (5.8%) | 0.510 |
| Admit diagnosis reported only as signs, symptoms, or ill‐defined conditions (codes 780799) | 77 (42.3%) | 92 (50.0%) | 121 (46.9%) | 0.140 |
Study Outcomes
The rate of hypoglycemia was compared between 195 HR‐I and 195 HR‐C patients, and it should be noted that each patient could generate only 1 episode of hypoglycemia during an admission. As shown in Table 3, the incidence of a BG <60 mg/dL was significantly lower in the HR‐I patients versus the HR‐C patients (13.3% vs 26.7%, P=0.002) as was the incidence of a BG <40 mg/dL (3.1% HR‐I vs 9.7% HR‐C, P=0.012). This represents a decrease of 50% in moderate hypoglycemia (BG <60 mg/dL) and a decrease of 68% in SH (BG <40 mg/dL) between HR‐I and HR‐C patients. Severe hyperglycemia occurrences were not significantly different between intervention and control floors at 28% each.
| Alerted Patients Glucose Threshold | HR‐I (%), N=195 | HR‐C (%), N=195 | Low Risk (%), N=265 | P Value* |
|---|---|---|---|---|
| ||||
| With BG <40 mg/dL | 6 (3.1%) | 19 (9.7%) | 10 (3.8%) | 0.012 |
| With BG <60 mg/dL | 26 (13.3%) | 51 (26.7%) | 50 (18.9%) | 0.002 |
| With BG >299 mg/dL | 53 (28.0%) | 53 (27.9%) | 29 (11.9%) | 0.974 |
The sensitivity, specificity, and predictive values of the alert for BG thresholds of <40 mg/dL and <60 mg/dL are presented in Table 4. On control floors, the alert exhibited a modest sensitivity and high negative predictive value for BG <40 mg/dL. Sensitivity for a BG <40 mg/dL was 76% and 51.5% for BG <60 mg/dL. The alert was developed with a 50% sensitivity for a BG of <60 mg/dL, and the sensitivities calculated on control floors were consistent with the original modeling. The predictive value of an LR classification was 98.2% for not having a BG <40 mg/dL. The predictive value of a positive alert was 9.7% for BG <40 mg/dL.
| Variable | 40 mg/dL Threshold | 60 mg/dL Threshold |
|---|---|---|
| ||
| Sensitivity: probability of an alert given BG <40 or 60 mg/dL | 76.0% | 51.5% |
| Specificity: probability of no alert given BG >40 or 60 mg/dL | 64.6% | 66.0% |
| Positive predictive value | 9.7% | 26.7% |
| Negative predictive value (nonalerted patients identified as low risk) | 98.2% | 85.0% |
There was no significant difference in mortality (P=0.726), transfer to a higher level of care (P=0.296), or LOS between the 2 groups (HR‐I: 5.83 days vs HR‐C: 5.88 days, P=0.664). However, patients with a BG <40 mg/dL had an LOS of 12.2 days (N=45) versus 8.1 days for those without an SH event (N=610), which was statistically significant (P=0.005). There was no increase in the incidence of BG >299 mg/dL in the HR‐I versus HR‐C groups (P=0.53).
Nurse‐physician satisfaction with the alert process was evaluated using a collaboration scale completed after each alert.[8] Of the 195 hypoglycemia alerts, there were 167 (85.6%) nurse and 25 (12.8%) physician collaboration scales completed. Scores were similar among nurses (average 1.52) and physicians (average 1.72), reflecting positive experiences with collaboration. Orders were changed in 40.7% HR‐I patients in response to the collaboration, but in only 20.5% of HR‐C patients after the initial BG of <90 mg/dL occurred. A change in orders constituted a modification consistent with lowering the risk of hypoglycemia and included discontinuing an oral antidiabetic agent, lowering the dose of insulin, and rarely the addition of dextrose‐containing fluids. The most common change in orders was a reduction in the total dose of insulin. A difference in orders changed was partially explained by the collaboration score; a 1‐unit increase in the score correlated to an odds ratio of 2.10 that the orders would be changed (P=0.002).
DISCUSSION
Hospitals are accountable for safe and effective care of patients with hyperglycemia, which includes prevention of medication‐induced hypoglycemia. We have developed a predictive informatics hypoglycemia risk alert that, when tested in a real‐world situation, significantly reduced the rate of SH in hospitalized patients without increasing severe hyperglycemia. The alert algorithm correctly identified patients who were at high risk for hypoglycemia and allowed caretakers the opportunity to lower that risk. The positive predictive value of the alert was low but acceptable at 9.7%, owing to the overall low rate of hypoglycemia in the patient population.
The alert model tested involved 3 components for success: the automated alert, trained charge nurse responders, and an interaction between the nurse responder and the care provider. HR‐I patients were interviewed and assessed for problems associated with oral intake, dietary habits, medication compliance, and hypoglycemia at home prior to communicating with physicians. The extensive training and proficiency in patient assessment and SBAR communication process required by nurses was paramount in the success of the alert. However, the alert provided a definitive risk assessment that was actionable, versus more global instruction, which has not had the same impact in risk reduction. Based on feedback collected from nurses at the study end, they felt the alert process was within their scope of practice and was not unduly burdensome. They also found that the training in diabetes management and SBAR communication techniques, in addition to the alert system, were useful in protecting patients from medication harm.
Physicians for HR‐C patients missed many opportunities to effectively intervene and thereby reduce the likelihood of an SH event. Our assumption is that the clinicians did not ascertain the risk of SH, which was reflected by the fact that orders were changed in 40.7% of HR‐I patients versus only 20.5% in the HR‐C group. Having alerts go directly to nurses rather than physicians permitted inclusion of additional information, such as caloric intake and testing schedules, so that changes in orders would have greater context, and the importance of mild hypoglycemia would not be overlooked.[16] Glycemic control is challenging for providers in the inpatient setting, as there is little time to test and titrate doses of insulin to achieve control. Tight glycemic control has become the primary focus of diabetes management in the outpatient setting to reduce long‐term risks of microvascular complications.[17, 18] However, establishing glycemic targets in the inpatient setting has been difficult because the risk for hypoglycemia increases with tighter control.[19, 20] Inpatient hypoglycemia has been associated with increased mortality, particularly in critically ill patients.[21, 22] Many factors contribute to hypoglycemia including low creatinine clearance, low body weight, untested insulin doses, errors in insulin administration, unexpected dietary changes, changes in medications affecting BG levels, poor communication during times of patient transfer to different care teams, and poor coordination of BG testing with insulin administration at meal times. A multifaceted approach aimed at improving both clinician and nurse awareness, and providing real‐time risk assessment is clearly required to insure patient safety.[6, 13, 23, 24]
There are significant economic benefits to avoiding SH in the hospital given the adverse outcomes associated with HACs and the extra cost associated with these conditions. In hospitalized patients, hypoglycemia worsens outcomes leading to higher costs due to longer LOS (by 3 days), higher inpatient charges (38.9%), and higher risk of discharge to a skilled nursing facility.[1, 3, 25, 26] Conversely, improved glycemic control can reduce surgical site infections, perioperative morbidity, and hospital LOS.[27] The high prevalence of insulin use among inpatients, many of whom have high‐risk characteristics, creates a milieu for both hyper‐ and hypoglycemia. Other groups have described a drop in hypoglycemia rates related to the use of standardized diabetes order sets and nurse and physician education, but this is the first study that used informatics in a prospective manner to identify patients who are at high risk for developing hypoglycemia and then specifically targeted those patients.[28] The alert process was modeled after a similar alert developed in our institution for identifying medicine patients at risk for sepsis.[29] Given the paucity of data related to inpatient glycemia risk reduction, this study is particularly relevant for improving patient safety.
The major limitation of this study is that it was not randomized at the patient level. Patients were assigned to intervention and control groups based on their occupancy on specific hospital floors to avoid treatment bias. Bias was assessed due to this nonrandom assignment by comparing demographic and clinical factors of HR patients between intervention and control floors, and found significant differences in HbA1c and admitting diagnosis. As the control group had lower HbA1c values than the intervention group, and it is known from the Diabetes Control and Complications Trial and Action to Control Cardiovascular Risk in Diabetes trial that lower HbA1c increases the risk of hypoglycemia, our results may be biased by the level of glucose control on admission.[30, 31] Admitting diagnoses differed significantly between intervention and control patients as did the Charlson Comorbidity Index score; however, the hypoglycemia alert system does not include patient diagnoses or comorbidities, and as such provided equipoise with regard to risk reduction regardless of presenting illness. This study included trained nurses, which may be beyond the scope of every institution and thereby limit the effectiveness of the alert in reducing risk. However, as a result of this study, the alert was expanded to other acute care floors at our hospital as well as other hospitals in the Barnes‐Jewish Hospital system.
In summary, this study showed a 68% decrease in episodes of SH in a high‐risk patient cohort on diabetic medications using a hypoglycemia alert system. The results of this study demonstrate the validity of a systems‐based approach to reduce SH in high‐risk inpatients.
Disclosures
This work was funded by the Barnes‐Jewish Hospital Foundation The authors report no conflicts of interest.
- , , , , , . Hypoglycaemia is associated with increased length of stay and mortality in people with diabetes who are hospitalized. Diabet Med. 2012;29:e445–e448.
- , , , et al. Hypoglycemia as a predictor of mortality in hospitalized elderly patients. Arch Intern Med. 2003;163:1825–1829.
- , , , , , . Hypoglycemia and clinical outcomes in patients with diabetes hospitalized in the general ward. Diabetes Care. 2009;32:1153–1157.
- , , , , . Association of hypoglycemia and cardiac ischemia: a study based on continuous glucose monitoring. Diabetes Care. 2003;26:1485–1489.
- , , , et al. Diabetes‐related complications, glycemic control, and falls in older adults. Diabetes Care. 2008;31:391–396.
- , , , , . Inpatient insulin orders: are patients getting what is prescribed? J Hosp Med. 2011;9:526–529.
- , , , . Prediction and prevention of treatment‐related inpatient hypoglycemia. J Diabetes Sci Technol. 2012;6:302–309.
- , . Collaboration between nurses and physicians. Image J Nurs Sch. 1988;20:145–149.
- , , , et al. Glucometrics—assessing the quality of inpatient glucose management. Diabetes Technol Ther. 2005;8:560–569.
- ACE/ADA Task Force on Inpatient Diabetes. American College of Endocrinology and American Diabetes Association consensus statement on inpatient diabetes and glycemic control. Diabetes Care. 2006;29:1955–1962.
- , , , et al. American Association of Clinical Endocrinologists and American Diabetes Association consensus statement on inpatient glycemic control. Endocr Pract. 2009;15:353–369.
- . Role‐play using SBAR technique to improve observed communication skills in senior nursing students. J Nurs Educ. 2011;50:79–87.
- SHM Glycemic Control Task Force. Workbook for improvement: improving glycemic control, preventing hypoglycemia, and optimizing care of the inpatient with hyperglycemia and diabetes. Society of Hospital Medicine website, Glycemic Control Quality Improvement Resource Room. Available at: http://www.hospitalmedicine.org. Accessed on February 12, 2011.
- , . An internet service supporting quality assessment of inpatient glycemic control. J Diabetes Sci and Technol. 2008;2:402–408.
- , , , et al. Updating and validating the Charlson Comorbidity Index and score for risk adjustment in hospital discharge abstracts using data from 6 countries. Am J Epidemiol. 2011;173:676–682.
- , , . Glycemic management in medical and surgical patients in the non‐ICU setting. Curr Diab Rep. 2013;13:96–106.
- The Diabetes Control and Complications Trial Research Group. The effect of intensive treatment of diabetes on the development and progression of long‐term complications in insulin‐dependent diabetes mellitus. N Engl J Med. 1993;329:977–986.
- UK Prospective Diabetes Study Group. Intensive blood‐glucose control with sulphonylureas or insulin compared with conventional treatment and risk of complications in patients with type 2 diabetes. Lancet. 1998;352:837–853.
- , , . Hypoglycemia in diabetes. Diabetes Care. 2003;26:1902–1912.
- . Hypoglycemia: still the limiting factor in the glycemic management of diabetes. Endocr Pract. 2008;14:750–756.
- , , , et al.; for the NICE‐SUGAR Study Investigators. Hypoglycemia and risk of death in critically ill patients. N Engl J Med. 2012;367:1108–1118.
- , , , , , . Increased mortality of patients with diabetes reporting severe hypoglycemia. Diabetes Care. 2012;35:1897–1901.
- , , , et al. Risk factors for inpatient hypoglycemia during subcutaneous insulin therapy in non‐critically ill patients with type 2 diabetes. J Diabetes Sci Technol. 2012;6:1022–1029.
- , , . Minimizing hypoglycemia in the wake of a tight glycemic control protocol in hospitalized patients. J Nurs Care Qual. 2010;25:255–260.
- , , , . The economic and quality of life impact of hypoglycemia. Eur J Health Econ. 2005;6:197–202.
- , , , , , . Economic and clinical impact of inpatient diabetic hypoglycemia. Endocr Pract. 2009;15:302–312.
- , , , et al. Mild hypoglycemia is strongly associated with increased intensive care unit length of stay. Ann Intensive Care. 2011;49:1–49.
- , , , et al. Implementing and evaluating a multicomponent inpatient diabetes management program: putting research into practice. Jt Comm J Qual Patient Saf. 2012;38:195–206.
- , , , et al. Implementation of a real‐time computerized sepsis alert in nonintensive care unit patients. Crit Care Med. 2011;39:469–473.
- The Diabetes Control and Complications Trial Research Group. Epidemiology of severe hypoglycemia in the Diabetes Control and Complications Trial. Am J Med. 1991;90:450–459.
- , , , et al. The effects of baseline characteristics, glycemia treatment approach, and glycated hemoglobin concentration on the risk of severe hypoglycaemia: post hoc epidemiological analysis of the ACCORD study. BMJ. 2010;340:1–12.
© 2014 Society of Hospital Medicine

Telemedicine on Capitol Hill
Hospitalist Ateev Mehrotra, MD, MPH, garnered an audience in Congress last month with his speech on telemedicine that called on lawmakers to take a deliberate approach to the healthcare strategy.
Dr. Mehrotra, a staff physician at Beth Israel Deaconess Medical Center in Boston and a policy analyst for RAND Corporation in Santa Monica, Calif., testified before a health subcommittee of the Energy & Commerce Committee[PDF]. He urged politicians to understand that telemedicine has immense potential but needs to be implemented deliberately to ensure that it provides quality care, improves access to those who need it most, and is used in the most cost-efficient manner.
He spoke with The Hospitalist after testifying:
Question: What do you hope the committee took away from your speech?
Answer: Go in with [your] eyes wide open. Experience tells us this is going to work in some ways and is not going to work in some ways. I think some people are naive and think telemedicine is perfect.
Q: Overutilization is a fear of yours. Tell me why.
A: For every great and remarkable intervention we have introduced in medicine, there has been this potential concern. I gave the example of cardiac catheterization, [which] has saved tens of thousands of lives probably. I can cite many other examples from MRIs to CTs [computed tomography] to robot-assisted surgery, etc., where that overuse issue is very significant. Economists believe [new technologies] are one of the greatest drivers of increased healthcare spending in the United States. With that as background, one shouldn’t be surprised that telemedicine would face the same issues.
Q: With a national push for telemedicine, is that overall a good thing?
A: Maybe I’m just too much of a doctor, but I think about this very much like I think about a drug. You have positive benefits, and you’ve got side effects. You need to be aware of the side effects … it doesn’t mean in many cases you don’t prescribe the drug because the drug is helping overall. If you take that same framework to telemedicine, I would say I’m overall very enthusiastic about the multitude of benefits … but not all telemedicine is the same. TH
Visit our website for more information on telemedicine and hospitalists.
Overworked Hospitalists Linked to Higher Costs, Longer Lengths of Stay
As hospitalist workloads increase, so do hospital costs and patients' lengths of stay (LOS), according to findings in a recent study.
Those results, says SHM President Burke T. Kealey, MD, SFHM, provide a good starting point to determine an ideal patient census for hospitalists.
"Pushing hospitalist workloads ever higher to meet the demands of patient-care needs or flawed payment models has costs associated with it," says Dr. Kealey, associate medical director of hospital specialties at HealthPartners Medical Group in St. Paul, Minn. "The costs may be borne by the system or by patients, but there are costs."
For the study published in JAMA Internal Medicine, researchers analyzed data from 20,241 hospitalizations involving 13,916 patients seen by hospitalists at the Christiana Care Health System in Newark, Del., between February 2008 and January 2011.
For hospital occupancies less than 75%, they found that LOS increased from 5.5 to 7.5 days as workload increased. For occupancies of 75% to 85%, LOS increased to about 8 days with higher workloads. For occupancies greater than 85%, the LOS decreased slightly and then increased significantly with higher workloads, with this change occurring at about 15 patients or more per hospitalist.
Costs were also significantly associated with an increase in workload. As the study notes, benchmark recommendations for an individual hospitalist’s workload range from 10 to 15 patient encounters per day.
Dr. Kealey says the findings seem to support the conventional wisdom that hospitalists should ideally see no more than 15 patients a day. He notes, however, that deciding the optimal number of cases for a given practice depends on several factors, including duration of shift, the availability of physician extenders, and the addition of surgical or cardiology cases.
"We won't be able as a specialty to fully realize our potential until we understand and apply the learnings about workload into our practices to ensure hospitalist career sustainability, system health, and best patient care," Dr. Kealey says. "This paper really gets the discussion going."
For more from Dr. Kealey on hospitalist workloads, read his recent blog post on "The Hospital Leader." TH
Visit our website for more information about hospitalist workloads.
What Matters: Prediction rule for kidney stones
Nephrolithiasis affects 1 in 11 people in the United States resulting in several million emergency department visits annually. The prevalence of nephrolithiasis is higher among men, obese individuals, and white non-Hispanics. The prevalence of kidney stones also appears to be increasing.
Our patients tell us that few things hurt worse than kidney stones. We may feel especially compelled to make a diagnosis given pain severity in otherwise healthy adults who have "never experienced this kind of pain before." Perhaps because of this, lots of patients are undergoing CT imaging for kidney stones ... in the United States. Interestingly, the European Urology Association recommends ultrasonography as the first-line test for urolithiasis.
Can we predict who has a kidney stone?
Moore and colleagues derived and validated a clinical prediction rule for uncomplicated ureteral stone. The derivation cohort was 1,040 patients undergoing noncontrast CT for suspected uncomplicated kidney stone. The validation cohort was 491 consecutively enrolled patients.
Data analysis revealed five factors that were significantly associated with the presence of a ureteral stone: male sex (2 points), duration of pain to presentation (greater than 24 hours: 0 points; 6-24 hours: 1 point; less than 6 hours: 3 points), nonblack race (3 points), presence of nausea or vomiting (nausea alone: 1 point; vomiting alone: 2 points), and microscopic hematuria (3 points). The points add up to low probability (0-5 points = 10% chance of stone), moderate probability (6-9 points = about 50% chance of stone), and high probability (10-13 points = about 90% chance of stone). Acutely important alternative causes were found in 1.6% of the high-probability group in the validation set. These causes were diverticulitis, appendicitis, mass, pyelonephritis, cholecystitis, pneumonia, bowel obstruction, colitis, aortic aneurysm, and pancreatitis.
This algorithm was derived and validated in the emergency setting so it will have different performance characteristics in the outpatient, ambulatory, phone-triage world. However, as the authors discuss, this algorithm could be used to help institutions make decisions about lowering radiation doses for "stone protocol" scans. Scales such as these should be incorporated into electronic medical record systems to improve care delivery.
Dr. Ebbert is professor of medicine, a general internist at the Mayo Clinic in Rochester, Minn., and a diplomate of the American Board of Addiction Medicine. The opinions expressed are those of the author. He reports no disclosures.

Atrial fibrillation: The unknown known
For a problem that has been on the back burner for decades, the treatment of atrial fibrillation has suddenly become a "marquis" diagnosis.
Age and technology have led to an explosion of interest in this arcane cardiac problem. Advertisements for new anticoagulants and thrombin inhibitors for "A Fib" have become almost as common as those for male impotency. The aging of the world population certainly has been a major factor in its increased incidence. New technology and pharmacology has driven the increase in clinical interest and has advanced our knowledge about the disease. Epidemiology data have provided important information about the natural history of paroxysmal atrial fibrillation (AF), and its relationship to chronic AF and its adverse effects on long-term mortality.
The importance of anticoagulant therapy for the prevention of systemic emboli and stroke has been the mainstay of therapy for almost 50 years. Although we have struggled with a variety of antiarrhythmic drugs, their shortcomings have been more than apparent. Most of us now use a rate-control strategy to control the tachycardia inherent in AF. The development of new factor Xa and direct thrombin inhibitor drugs have made the logistics of providing adequate thrombus prevention much simpler, if somewhat more expensive.
The elephant in the room is the increasing use of radiofrequency catheter ablation technology that has had some success in the prevention of AF arising from the tissue in the pulmonary vein–atrial interface. Numerous small studies have reported that this technology surpasses rhythm control with antiarrhythmic agents, a hurdle not too difficult to beat. The best results have been observed in patients with recurrent paroxysmal AF where maintenance of regular sinus rhythm has been the primary outcome measurement (JAMA 2014;311:692-700). Even here, recurrence after ablation has been common. The benefit of ablation therapy in patients with initial paroxysmal AF (N. Engl. J. Med. 2012;367:1587-95) or chronic persistent AF has been uncertain at best. As a result, the AHA/ACC/HRS (American Heart Association/American College of Cardiology/Heart Rhythm Society) guidelines have given a class I (evidence level A) recommendation for ablation therapy for symptomatic paroxysmal AF and class IIa (evidence level A) and IIb (evidence level B) for symptomatic recurrent paroxysmal and longstanding persistent AF when balanced against drug tolerability, respectively (J. Am. Coll. Cardiol. 2014 [doi:10.1016/j.jacc.2014.03.021]).
All of these clinical data are exciting and have led to enthusiasm for ablation technology despite the potential for nonfatal and rare fatal complication, based almost entirely on its ability to improve upon the dismal benefits of antiarrhythmic rhythm control. Even as we consider the benefit of ablation therapy, new techniques are being developed. The lack of mortality and morbidity data is a result of the short follow-up, usually limited to a year or two, and small sample size. This lack of long-term outcome data for ablation therapy should be of some concern to clinicians who have lived through the last few years. Many of my readers had not been born when we embarked on the ineffective and dangerous pharmacologic prevention of sudden death by pharmacologic suppression of ambient ventricular premature beats. Numerous surrogate measures of clinical benefit of a variety of therapeutic interventions have been disproven and disposed of in the subsequent years. The use of surrogate measures like the partial suppression of AF rather than morbidity and mortality outcomes to establish clinical benefit, have been largely discarded as a dead end.
The Catheter Ablation Versus Anti-arrhythmic Drug Therapy for Atrial Fibrillation Trial (CABANA), which is beginning to recruit more than 2,000 patients with new-onset or undertreated paroxysmal, persistent, or longstanding AF to be followed for over 4 years may answer the question of whether radiofrequency ablation therapy, rate control, or rhythm control provides the best clinical treatment of atrial fibrillation. The primary outcome will be the composite endpoint of total mortality, disabling stroke or serious bleeding, or cardiac arrest. An important secondary endpoint will be total mortality. Until its conclusion, we should proceed cautiously with expanding radiofrequency ablation therapy for the treatment of AF.
Dr. Goldstein, medical editor of Cardiology News, is professor of medicine at Wayne State University and division head emeritus of cardiovascular medicine at Henry Ford Hospital, both in Detroit. He is on data safety monitoring committees for the National Institutes of Health and several pharmaceutical companies.
Punctate Depigmented Macules
The Diagnosis: Blaschkoid Punctate Vitiligo
Based on the patient’s clinical appearance as well as the histologic findings, the diagnosis of vitiligo was made. Although vitiligo is certainly not uncommon and punctate vitiligo is a known clinical presentation,1 punctate vitiliginous depigmentation conforming to lines of Blaschko is unique. Follicular repigmentation in a patch of vitiligo potentially could lead to this “spotty” appearance, but our patient maintained that the band was never confluently depigmented and that small macules arose within normally pigmented skin. The patient’s adult age at onset makes this case even more unusual.
Follicular repigmentation in vitiligo is fairly well understood, as the perifollicular pigment is formed by upward migration of activated melanoblasts in the outer root sheath.2 Follicular depigmentation as well as selective or initial loss of melanocytes around hair follicles in early vitiligo has not been described. It is unclear if the seemingly folliculocentric nature of the patient’s vitiliginous macules was a false observation, coincidental, or actually related to selective melanocyte loss around follicles.
Blaschkoid distribution has been described in numerous skin disorders and is known to be based on genetic mosaicism.3 Most of these disorders are X-linked and/or congenital. However, many acquired skin conditions have been described exhibiting blaschkoid distribution, such as vitiligo, psoriasis, lichen planus, atopic dermatitis, and mycosis fungoides.4,5
Confettilike depigmentation has been described as an unusual clinical variant of vitiligo.1 It also has been reported after psoralen plus UVA therapy in patients with more classic vitiligo,6 numerous domestic chemicals,7 and in association with mycosis fungoides.8 In these cases, punctate lesions were disseminated, symmetric on extremities, or limited to areas exposed to chemicals.
1. Ortonne J-P. Vitiligo and other disorders of hypopigmentation. In: Bolognia JL, Jorizzo JL, Rapini RP, eds. Dermatology. Vol 1. 2nd ed. St. Louis, MO: Mosby; 2003:913-938.
2. Cui J, Shen LY, Wang GC. Role of hair follicles in the repigmentation of vitiligo. J Invest Dermatol. 1991;97:410-416.
3. Happle R. X-chromosome inactivation: role in skin disease expression. Acta Paediatr Suppl. 2006;95:16-23.
4. Taieb A. Linear atopic dermatitis (“naevus atopicus”): a pathogenetic clue? Br J Dermatol. 1994;131:134-135.
5. Bolognia JL, Orlow SJ, Glick SA. Lines of Blaschko. J Am Acad Dermatol. 1994;31:157-190.
6. Falabella R, Escobar CE, Carrascal E, et al. Leukoderma punctata. J Am Acad Dermatol. 1988;18:485-494.
7. Ghosh S, Mukhopadhyay S. Chemical leucoderma: a clinico-aetiological study of 864 cases in the perspective of a developing country. Br J Dermatol. 2009;160:40-47.
8. Loquai C, Metza D, Nashan D, et al. Confetti-like lesions with hyperkeratosis: a novel ultraviolet-induced hypomelanotic disorder? Br J Dermatol. 2005;153:190-193.
The Diagnosis: Blaschkoid Punctate Vitiligo
Based on the patient’s clinical appearance as well as the histologic findings, the diagnosis of vitiligo was made. Although vitiligo is certainly not uncommon and punctate vitiligo is a known clinical presentation,1 punctate vitiliginous depigmentation conforming to lines of Blaschko is unique. Follicular repigmentation in a patch of vitiligo potentially could lead to this “spotty” appearance, but our patient maintained that the band was never confluently depigmented and that small macules arose within normally pigmented skin. The patient’s adult age at onset makes this case even more unusual.
Follicular repigmentation in vitiligo is fairly well understood, as the perifollicular pigment is formed by upward migration of activated melanoblasts in the outer root sheath.2 Follicular depigmentation as well as selective or initial loss of melanocytes around hair follicles in early vitiligo has not been described. It is unclear if the seemingly folliculocentric nature of the patient’s vitiliginous macules was a false observation, coincidental, or actually related to selective melanocyte loss around follicles.
Blaschkoid distribution has been described in numerous skin disorders and is known to be based on genetic mosaicism.3 Most of these disorders are X-linked and/or congenital. However, many acquired skin conditions have been described exhibiting blaschkoid distribution, such as vitiligo, psoriasis, lichen planus, atopic dermatitis, and mycosis fungoides.4,5
Confettilike depigmentation has been described as an unusual clinical variant of vitiligo.1 It also has been reported after psoralen plus UVA therapy in patients with more classic vitiligo,6 numerous domestic chemicals,7 and in association with mycosis fungoides.8 In these cases, punctate lesions were disseminated, symmetric on extremities, or limited to areas exposed to chemicals.
1. Ortonne J-P. Vitiligo and other disorders of hypopigmentation. In: Bolognia JL, Jorizzo JL, Rapini RP, eds. Dermatology. Vol 1. 2nd ed. St. Louis, MO: Mosby; 2003:913-938.
2. Cui J, Shen LY, Wang GC. Role of hair follicles in the repigmentation of vitiligo. J Invest Dermatol. 1991;97:410-416.
3. Happle R. X-chromosome inactivation: role in skin disease expression. Acta Paediatr Suppl. 2006;95:16-23.
4. Taieb A. Linear atopic dermatitis (“naevus atopicus”): a pathogenetic clue? Br J Dermatol. 1994;131:134-135.
5. Bolognia JL, Orlow SJ, Glick SA. Lines of Blaschko. J Am Acad Dermatol. 1994;31:157-190.
6. Falabella R, Escobar CE, Carrascal E, et al. Leukoderma punctata. J Am Acad Dermatol. 1988;18:485-494.
7. Ghosh S, Mukhopadhyay S. Chemical leucoderma: a clinico-aetiological study of 864 cases in the perspective of a developing country. Br J Dermatol. 2009;160:40-47.
8. Loquai C, Metza D, Nashan D, et al. Confetti-like lesions with hyperkeratosis: a novel ultraviolet-induced hypomelanotic disorder? Br J Dermatol. 2005;153:190-193.
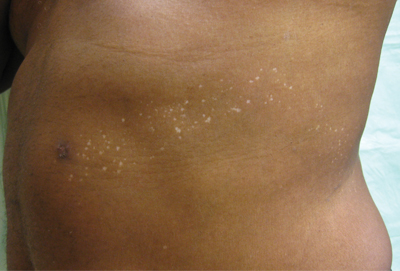
An otherwise healthy 54-year-old black man presented with a 10-year history of spotty pigmentary loss in a band on the left side of the abdomen, flank, and back. He denied a history of rash or inflammation in the area and had not experienced confluent depigmentation. He reported that initially he had only a few “white dots,” and over the next 5 to 7 years, he developed more of them confined within the same area. On presentation, he stated new areas of depigmentation had not developed in several years. The band was completely asymptomatic and had not been treated with any prescription or over-the-counter medications. On examination he had multiple 2- to 3-mm confettilike depigmented macules that seemed to be centered around follicles in a band with blaschkoid distribution extending across the left side of the abdomen, flank, and back. The band did not cross the midline and similar lesions were not present elsewhere. A punch biopsy of one of the depigmented macules revealed a markedly diminished number of melanocytes along the junction as well as a decrease in melanin, which was confirmed by Melan-A and Fontana stains, respectively.

Team identifies mechanism of resistance in AML
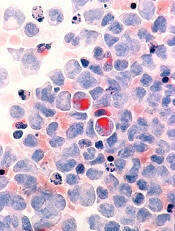
Credit: Lance Liotta
New research has revealed a mechanism of drug resistance in acute myeloid leukemia (AML) that may also occur in other cancers.
Investigators found evidence suggesting that glioma-associated protein 1 (GLI1) and the UDP glucuronosyltransferase (UGT1A) family of enzymes drive resistance to 2 drugs—ribavirin and cytarabine—in AML.
But the researchers were able to overcome this resistance by genetic or pharmacologic inhibition of GLI1.
They described this research in a letter to Nature.
“By studying drug-resistant cancer cells from AML patients and head and neck tumors, we found that a gene called GLI1 is dramatically overactive in these cells,” said study author Hiba Zahreddine, a doctoral student at the University of Montreal in Canada.
“[W[e were then able to show that this results in a specific chemical change to the drugs that prevents their toxicity toward the cancer cells,” said author Kathy Borden, PhD, of the University of Montreal’s Institute for Research in Immunology and Cancer.
Specifically, the investigators found that UGT1A enzymes add glucuronic acid to the drugs, thereby modifying their activity. And GLI1 alone is sufficient to drive UGT1A-dependent glucuronidation of ribavirin and cytarabine, which fuels drug resistance.
Fortunately, the researchers found that inhibiting GLI1, either genetically or with pharmacologic inhibitors, could force cancer cells to revert to a treatment-sensitive state.
The team therefore hopes that using GLI1 inhibitors in combination with ribavirin, cytarabine, or other therapies can overcome treatment resistance in patients with AML. The investigators have received approval from Health Canada to conduct a new clinical trial to test this theory.
“If this new approach is successful, it could have very broad applications, since the mode of action of ribavirin suggests that it could be effective against up to 30% of all cancers, including some types of breast, prostate, colon, stomach, and head and neck cancers, in addition to AML,” said Morris Goodman, co-founder and Chairman of the Board of Pharmascience Inc., the company that manufactured the ribavirin for this research. ![]()
Tests may help before liver transplant, not after
CHICAGO – Two laboratory measurements that are commonly used to assess the cause of symptomatic ascites before liver transplant may be deceptive when used to assess posttransplant ascites, a retrospective study of 15 patients suggested.
Before liver transplant, a serum-ascites albumin gradient (SAAG) greater than 1.1 g/dL differentiates ascites due to portal hypertension rather than other causes 97% of the time. An ascites total protein (aTP) measurement has a lower accuracy for portal hypertension of 57%, but when used in conjunction with SAAG, an aTP of 2.5 g/dL or greater suggests that the cause is cardiac ascites, tuberculous ascites, or peritoneal carcinomatosis, Dr. Jeffrey LaFond explained at the annual Digestive Disease Week.
He and his associates studied the records of 15 patients who developed symptomatic post-transplant ascites that had enough volume to require therapeutic paracentesis. The ascites occurred a mean of 515 days after transplantation (ranging from 14 to 2,744 days). In the work-up for ascites, the sensitivity of SAAG for portal hypertension was 82% and the sensitivity of aTP for portal hypertension was 50%.
Three of 12 patients who had a posttransplant SAAG had a gradient below 1.1 g/dL even though other tests found no evidence of another cause for ascites besides portal hypertension, and two of those three patients had confirmed portal hypertension, he reported. Five of 10 patients with an aTP had a value greater than 2.5 g/dL, even though they had confirmed portal hypertension and normal cardiac function, he reported.
"Assessment of ascites due to portal hypertension and/or vascular stricture in the posttransplant period using SAAG and aTP can be deceiving and cannot be relied upon to make diagnostic interventional decisions," said Dr. LaFond of the University of Virginia, Charlottesville. "A hepatic venogram should be performed early on in patients with posttransplant ascites to evaluate for strictures and portal hypertension.
Records showed that all patients in the study had ascites confirmed by imaging and/or paracenteses and had diagnostic studies to rule out heart failure, opportunistic infection, or malignancy as the source of ascites. Suspected portal hypertension was confirmed by pressure measurements or the presence of vascular strictures on venogram, with portal hypertension defined as a sinusoidal or portosystemic gradient greater than 5 or the presence of a stricture with a gradient of at least 3.
An estimated 3%-7% of patients develop ascites after liver transplant, which has been associated with an increased risk of renal impairment, prolonged hospitalization, and abdominal infections, he said.
Dr. LaFond reported having no financial disclosures.
On Twitter @sherryboschert
*This story was updated 6/3/2014.
AT DDW 2014
Key clinical point: Serum-ascites albumin gradient and ascites total protein cannot be relied upon to differentiate the cause of ascites after liver transplant.
Major finding: The sensitivity for portal hypertension as the cause of ascites after liver transplant was 82% for SAAG and 50% for aTP.
Data source: A retrospective study of 15 patients who developed symptomatic ascites after liver transplantation that required intervention.
Disclosures: Dr. LaFond reported having no financial disclosures.

Four questions address stigma
Naomi is a 61-year-old woman who has lived with bipolar disorder and its stigma for 30 years. After a major manic episode and hospitalization, she entered into family treatment at the urging of her three daughters. Previously, her husband had been the primary force in guiding her psychiatric care, and she had been in treatment with a psychiatrist who is his professional colleague.
The patient’s first depressive episode began in the postpartum period, but she did not seek help at that time because she thought that her feelings were normal for a new mother. She did not receive any psychiatric attention until she cycled into mania and called the police for fear her child was being poisoned by neighbors. Her most recent manic episode occurred after she stopped her medications because of concerns about side effects. She was too embarrassed to tell her husband or doctor. She routinely fails to tell her other medical doctors that she is on mood stabilizers, because she does not want them to know she has bipolar disorder.
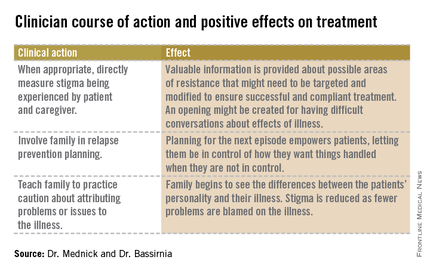
As Naomi recovers from the most recent manic episode and settles into family treatment, she is struggling with the consequences of her actions to her family. In family therapy in the past, her husband has revealed his belief that he has been protecting the family from Naomi’s mania and protecting Naomi from "embarrassing herself." This is difficult for Naomi to hear as she has always prided herself on being a good mother and protecting her daughters. Naomi’s situation illustrates the difficulty of coping with a diagnosis of bipolar disorder, the consequences of the illness on the family, and the importance of addressing stigma.
How stigma gets in the way
As discussed previously by Dr. Alison M. Heru ("Mental illness stigma is a family affair," Clinical Psychiatry News, April 2014, p. 8), stigma, when internalized or self-directed, can lead to psychological distress, decreased self-esteem and life satisfaction, and increased depression and suicidality (Compr. Psychiatry 2010;51:603-6). Close family members of those with mental disorders are affected by stigma, commonly referred to as "stigma by association" or "courtesy stigma."
Up to 92% of caregivers of people with psychiatric disorders have reported internalized stigma (J. Psychiatr. Ment. Health Nurs. 2012;19:665-71). These family members become distant and avoidant, resulting in a reduced quality of life and an impaired ability to provide critical support for their loved ones. Caregiver anxiety is inversely related to patient anxiety, stigma, and poor alliance (J. Nerv. Ment. Disease 2011;199:18-24).
As a result of these factors, while people with psychiatric disorders have to cope with their own mental illness as well as the public and self-stigma that alienate them from society, they also are at risk of losing their family connections.
In order to confront stigma, the Family Center for Bipolar Disorder in New York City, for example, uses a Family Inclusive Treatment (FIT) model. The FIT model includes an engagement period at the initiation of treatment that is focused on psychoeducation and relapse prevention planning. FIT is unique in that every patient is required to sign a release of information giving permission for full, open communication at all times between the patient’s clinician and a treatment partner of their choice. After the initial engagement period, there are quarterly family visits to supplement regular individual treatment sessions. FIT treatment promotes open communication about symptoms and medications. FIT strives to minimize patient isolation from families; they can talk openly with one another and their clinician.

After seeing many families enter treatment, FIT staff noticed the prominence of stigma.
We have begun to ask about stigma directly. Do people with more stigma do worse in treatment? Do they adhere more poorly to treatment? Do their families tend to become less involved over time? To begin, Dr. Mednick and staff examined demographic data looking for factors that might predispose a person to experience increased stigma.
In terms of diagnosis, people with more internalizing disorders such as depression and anxiety disorders tend to experience more stigma. Distress is experienced internally. As Dr. Bassirnia and her colleagues wrote in a poster presented at the recent American Psychiatric Association meeting, people with externalizing disorders, such as substance abuse and antisocial disorders, are more likely to express their distress outwardly and are less likely to suffer from stigma ("The relationship between personality traits and perceived internalized stigma in bipolar patients and their caregivers," 2014).
Meanwhile, two systematic review studies have reported moderate to high levels of internalized stigma in people with bipolar disorder. In these studies, a higher level of internalized stigma had a negative correlation with self-esteem, social adjustment, and perceived social support, and positive correlation with severity of symptoms, functional impairment, and rehospitalization. In spite of having more severe symptoms; people with higher levels of self-stigma are less likely to seek professional help and adhere to their treatment. Stigma by association and its negative consequences in caregivers of people with mental disorders also have been reported (J. Affect. Disord. 2013;150:181-91).
A useful and easy to administer scale that helps to identify stigma is the "Perceived Criticism Scale" (J. Abnorm. Psychol. 1989;98:225-35). By asking four questions, the clinician can get a good sense of family dynamics and can monitor the progress and change over time. The questions rate perception on a scale of 1-10, where "X" is the other person involved in treatment, either patient or caregiver. Here are the questions:
1. How critical do you think you are of X?
2. How critical do you think X is of you?
3. When X criticizes you, how upset do you get?
4. When you criticize X, how upset does he/she get?
For families with high scores, follow-up is needed. The Internalized Stigma of Mental Illness (ISMI) scale (Psychiatry Res. 2003;121:31-49) can be used. The ISMI scale makes statements about stigma for which participants rate their agreement on a Likert scale, such as:
• I don’t talk about myself much because I don’t want to burden others with my mental illness.
• Being around people who don’t have a mental illness makes me feel out of place or inadequate.
• People can tell that I have a mental illness by the way I look.
• Mentally ill people tend to be violent.
• I feel out of place in the world because I have a mental illness.
The ISMI scale contains 29 short, simple statements like the ones above and can be completed in less than 10 minutes. The statements are designed to avoid hypothetical situations, stay focused in the present, and address the participant’s own identity and experience.
Using the tools in practice
Naomi entered family treatment with her husband and daughters. Using the ISMI to measure the stigma of mental illness that each family member was experiencing, Naomi was shocked to see that her daughters felt far less stigma about having a mother with mental illness than she had assumed. In turn, her daughters were shocked at how much stigma Naomi was experiencing. Naomi’s husband scored between them. This data paved the way for an open family conversation about how Naomi’s illness had affected their lives, and especially how Naomi’s husband and his perceptions of her illness had affected her treatment course.
Caregivers play a very important role in bipolar disorder. After all, the illness can lead to difficulty functioning and can threaten the family’s stability. Sometimes caregivers can serve as a source of strength and a beacon of stability in the occasional storm. It is hard for the family between the storms, when the same flashing beacon can be a constant reminder to the patient of their illness. Often, well intentioned concerns become constant checking up, making the patient feel stigmatized and expected to fail.
"Good" caregivers will be aware of the stigma and the impact it has on their loved one and on themselves, without becoming a source of stigma.
Dr. Mednick is an attending psychiatrist at the Family Center for Bipolar at Mount Sinai Beth Israel in New York City. Dr. Bassirnia is a second-year psychiatry resident at Mount Sinai Beth Israel. Scan the QR code to read more Families in Psychiatry columns at clinicalpsychiatrynews.com.
Naomi is a 61-year-old woman who has lived with bipolar disorder and its stigma for 30 years. After a major manic episode and hospitalization, she entered into family treatment at the urging of her three daughters. Previously, her husband had been the primary force in guiding her psychiatric care, and she had been in treatment with a psychiatrist who is his professional colleague.
The patient’s first depressive episode began in the postpartum period, but she did not seek help at that time because she thought that her feelings were normal for a new mother. She did not receive any psychiatric attention until she cycled into mania and called the police for fear her child was being poisoned by neighbors. Her most recent manic episode occurred after she stopped her medications because of concerns about side effects. She was too embarrassed to tell her husband or doctor. She routinely fails to tell her other medical doctors that she is on mood stabilizers, because she does not want them to know she has bipolar disorder.
As Naomi recovers from the most recent manic episode and settles into family treatment, she is struggling with the consequences of her actions to her family. In family therapy in the past, her husband has revealed his belief that he has been protecting the family from Naomi’s mania and protecting Naomi from "embarrassing herself." This is difficult for Naomi to hear as she has always prided herself on being a good mother and protecting her daughters. Naomi’s situation illustrates the difficulty of coping with a diagnosis of bipolar disorder, the consequences of the illness on the family, and the importance of addressing stigma.
How stigma gets in the way
As discussed previously by Dr. Alison M. Heru ("Mental illness stigma is a family affair," Clinical Psychiatry News, April 2014, p. 8), stigma, when internalized or self-directed, can lead to psychological distress, decreased self-esteem and life satisfaction, and increased depression and suicidality (Compr. Psychiatry 2010;51:603-6). Close family members of those with mental disorders are affected by stigma, commonly referred to as "stigma by association" or "courtesy stigma."
Up to 92% of caregivers of people with psychiatric disorders have reported internalized stigma (J. Psychiatr. Ment. Health Nurs. 2012;19:665-71). These family members become distant and avoidant, resulting in a reduced quality of life and an impaired ability to provide critical support for their loved ones. Caregiver anxiety is inversely related to patient anxiety, stigma, and poor alliance (J. Nerv. Ment. Disease 2011;199:18-24).
As a result of these factors, while people with psychiatric disorders have to cope with their own mental illness as well as the public and self-stigma that alienate them from society, they also are at risk of losing their family connections.
In order to confront stigma, the Family Center for Bipolar Disorder in New York City, for example, uses a Family Inclusive Treatment (FIT) model. The FIT model includes an engagement period at the initiation of treatment that is focused on psychoeducation and relapse prevention planning. FIT is unique in that every patient is required to sign a release of information giving permission for full, open communication at all times between the patient’s clinician and a treatment partner of their choice. After the initial engagement period, there are quarterly family visits to supplement regular individual treatment sessions. FIT treatment promotes open communication about symptoms and medications. FIT strives to minimize patient isolation from families; they can talk openly with one another and their clinician.
After seeing many families enter treatment, FIT staff noticed the prominence of stigma.
We have begun to ask about stigma directly. Do people with more stigma do worse in treatment? Do they adhere more poorly to treatment? Do their families tend to become less involved over time? To begin, Dr. Mednick and staff examined demographic data looking for factors that might predispose a person to experience increased stigma.
In terms of diagnosis, people with more internalizing disorders such as depression and anxiety disorders tend to experience more stigma. Distress is experienced internally. As Dr. Bassirnia and her colleagues wrote in a poster presented at the recent American Psychiatric Association meeting, people with externalizing disorders, such as substance abuse and antisocial disorders, are more likely to express their distress outwardly and are less likely to suffer from stigma ("The relationship between personality traits and perceived internalized stigma in bipolar patients and their caregivers," 2014).
Meanwhile, two systematic review studies have reported moderate to high levels of internalized stigma in people with bipolar disorder. In these studies, a higher level of internalized stigma had a negative correlation with self-esteem, social adjustment, and perceived social support, and positive correlation with severity of symptoms, functional impairment, and rehospitalization. In spite of having more severe symptoms; people with higher levels of self-stigma are less likely to seek professional help and adhere to their treatment. Stigma by association and its negative consequences in caregivers of people with mental disorders also have been reported (J. Affect. Disord. 2013;150:181-91).
A useful and easy to administer scale that helps to identify stigma is the "Perceived Criticism Scale" (J. Abnorm. Psychol. 1989;98:225-35). By asking four questions, the clinician can get a good sense of family dynamics and can monitor the progress and change over time. The questions rate perception on a scale of 1-10, where "X" is the other person involved in treatment, either patient or caregiver. Here are the questions:
1. How critical do you think you are of X?
2. How critical do you think X is of you?
3. When X criticizes you, how upset do you get?
4. When you criticize X, how upset does he/she get?
For families with high scores, follow-up is needed. The Internalized Stigma of Mental Illness (ISMI) scale (Psychiatry Res. 2003;121:31-49) can be used. The ISMI scale makes statements about stigma for which participants rate their agreement on a Likert scale, such as:
• I don’t talk about myself much because I don’t want to burden others with my mental illness.
• Being around people who don’t have a mental illness makes me feel out of place or inadequate.
• People can tell that I have a mental illness by the way I look.
• Mentally ill people tend to be violent.
• I feel out of place in the world because I have a mental illness.
The ISMI scale contains 29 short, simple statements like the ones above and can be completed in less than 10 minutes. The statements are designed to avoid hypothetical situations, stay focused in the present, and address the participant’s own identity and experience.
Using the tools in practice
Naomi entered family treatment with her husband and daughters. Using the ISMI to measure the stigma of mental illness that each family member was experiencing, Naomi was shocked to see that her daughters felt far less stigma about having a mother with mental illness than she had assumed. In turn, her daughters were shocked at how much stigma Naomi was experiencing. Naomi’s husband scored between them. This data paved the way for an open family conversation about how Naomi’s illness had affected their lives, and especially how Naomi’s husband and his perceptions of her illness had affected her treatment course.
Caregivers play a very important role in bipolar disorder. After all, the illness can lead to difficulty functioning and can threaten the family’s stability. Sometimes caregivers can serve as a source of strength and a beacon of stability in the occasional storm. It is hard for the family between the storms, when the same flashing beacon can be a constant reminder to the patient of their illness. Often, well intentioned concerns become constant checking up, making the patient feel stigmatized and expected to fail.
"Good" caregivers will be aware of the stigma and the impact it has on their loved one and on themselves, without becoming a source of stigma.
Dr. Mednick is an attending psychiatrist at the Family Center for Bipolar at Mount Sinai Beth Israel in New York City. Dr. Bassirnia is a second-year psychiatry resident at Mount Sinai Beth Israel. Scan the QR code to read more Families in Psychiatry columns at clinicalpsychiatrynews.com.