User login
Placenta fails to deliver: Mother dies of hemorrhage
PLACENTA FAILS TO DELIVER: MOTHER DIES OF HEMORRHAGE
After a 38-year-old woman gave birth, the placenta did not deliver. The ObGyn was unable remove the entire placenta and the mother began to hemorrhage. After an hour, the patient was given a blood transfusion. She could not be stabilized and died.
ESTATE’S CLAIM The ObGyn was negligent. He failed to remove the entire placenta and did not treat the hemorrhage in a timely manner. The hospital staff was negligent in failing to properly address the massive hemorrhage. A prompt transfusion would have saved the woman’s life, but the anesthesiologist who had to approve the procedure could not be located. Other procedures, including a hysterectomy, could have saved the mother’s life.
DEFENDANTS’ DEFENSE The ObGyn claimed that incomplete delivery of the placenta and postpartum hemorrhage are known complications of a delivery. The hospital claimed that the staff had acted appropriately and that it was not responsible for the actions of the anesthesiologist, an independent contractor. The anesthesiologist denied negligence.
VERDICT A $2 million New York settlement was reached that included $200,000 from the hospital and $1.8 million from the physicians’ insurers.
Related Article: Postpartum hemorrhage: 11 critical questions, answered by an expert Haywood L. Brown, MD (January 2011)
DECREASED FETAL MOVEMENT OVERLOOKED; SEVERE INJURY TO BABY
At her 39th-week prenatal visit at a clinic, the mother reported decreased fetal movement. Acoustic stimulation of the fetus was attempted twice without response. The fetal heart-rate monitor identified a normal heart rate without variability or accelerations. The mother was taken by wheelchair to the hospital next door. A note explaining the nonreassuring findings allegedly accompanied her.
The mother waited to be admitted. When a fetal heart-rate monitor was connected 30 minutes after admission, results were still nonreassuring.
A resident examined the mother 45 minutes later. He called the attending ObGyn, and they decided to postpone cesarean delivery because the mother had eaten breakfast.
When the fetal heart rate crashed 4 hours later, a second-year resident began emergency cesarean delivery. The ObGyn, who had never examined the patient, observed some of the procedure in the OR.
The baby was born with catastrophic brain damage, and has spastic quadriplegia cerebral palsy, feeding problems, and significant cognitive and developmental delays.
PARENTS’ CLAIM A cesarean delivery should have been performed immediately after the mother’s admission. Even if the cesarean had been begun 15 to 20 minutes earlier, the injury could have been avoided. The ObGyn never examined the mother nor did he participate in the cesarean delivery.
DEFENDANTS’ DEFENSE The ObGyn and hospital denied negligence. The note was not attached to the patient’s chart. At trial, the ObGyn admitted that a delivery 15 to 20 minutes earlier might have avoided the injury.
VERDICT A $33,591,900 Tennessee verdict was returned.
WOMAN BECOMES PREGNANT AFTER TUBAL LIGATION
A 32-year-old woman requested sterilization after the birth of her third child. A Falope ring tubal ligation procedure was performed by a gynecologist in April 2006. During surgery, the device used by the gynecologist ejected 2 silastic bands on the right side instead of one.
The patient learned she was pregnant in March 2007. Her high-risk pregnancy ended with cesarean delivery in September 2007. The delivering ObGyn found the patient’s right fallopian tube in its natural, unscarred state. A silastic band was applied to the right ovarian ligament, not the right fallopian tube.
PATIENT’S CLAIM The gynecologist banded the ovarian ligament instead of the fallopian tube.
PHYSICIAN’S DEFENSE The procedure was properly performed. The rings initially enclosed the fallopian tube and ovarian ligament, but the top ring subsequently migrated off the structures, allowing the fallopian tube to slip out of the attachment. Failure to sterilize is a known risk of the procedure.
VERDICT An Illinois defense verdict was returned.
ABORTION ATTEMPTED BUT PREGNANCY IS ECTOPIC
A 14-year-old patient went to a clinic for elective abortion at 8 weeks’ gestation. Ultrasonography (US) prior to the procedure showed an intrauterine pregnancy. After dilating the cervix, the ObGyn inserted a semi-rigid vacuum aspiration curette to suction the uterine contents, but received nothing. A second US confirmed an intrauterine pregnancy. The ObGyn was able to locate the pregnancy and indent the gestational sac with 3 different dilators and the curette. The pregnancy decreased in size on US after the suction was applied. However, the patient’s vital signs dropped dramatically, and she was rushed to the hospital. During emergency surgery, severe pelvic adhesive disease complicated the ability to stop the hemorrhage. Four physicians concurred that supracervical hysterectomy was needed to save the patient’s life. Postoperative pathology identified a cornual or interstitial ectopic pregnancy.
PATIENT’S CLAIM The ObGyn failed to heed several warning signs of ectopic pregnancy. Further testing should have been done before the second round of vacuum. If ectopic pregnancy had been discovered earlier, the patient could have undergone surgery that would have preserved her uterus and allowed her to bear children. The ObGyn tore the uterus multiple times when he turned on the suction, causing massive hemorrhage.
PHYSICIAN’S DEFENSE Ultrasonography clearly showed an intrauterine pregnancy. There was nothing to cause suspicion that the pregnancy was ectopic. She might be able to have a child through surrogacy.
VERDICT A $950,000 Illinois verdict was returned.
Related Article: Is the hCG discriminatory zone a reliable indicator of intrauterine or ectopic pregnancy? Andrew M. Kaunitz, MD (Examining the Evidence, February 2012)
MACROSOMIC FETUS: MOTHER AND BABY BOTH INJURED
When prenatal ultrasonography indicated the fetal weight was 10 lbs, the patient and her mother expressed concern over delivery of such a large baby. The ObGyn reassured them that it would not be a problem.
Four days later, the mother went into labor. She was 9-cm dilated 4.5 hours later, but only progressed to 9.5 cm over the next 7 hours. She was told to begin to push, but, after 2 hours, birth had not occurred. The ObGyn used forceps to deliver the head 45 minutes later. Shoulder dystocia was encountered and there was a 3.5-minute delivery delay. The baby suffered oxygen deprivation and the mother experienced a 4th-degree perineal tear.
After the NICU team resuscitated the baby, she was transferred to another hospital, where she underwent “head cooling” in an attempt to mitigate her injuries. The child has mild cerebral palsy, with right hemiparesis, speech delay, and additional neurologic injuries.
PARENTS' CLAIM Cesarean delivery was unnecessarily delayed. The ObGyn was negligent in not performing an emergency cesarean delivery after 2 hours of pushing was not effective. The ObGyn never suggested a cesarean delivery, it was not noted in the chart, and no one else present at the time remembered the option being offered.
PHYSICIAN’S DEFENSE There was nothing during labor to contraindicate a vaginal birth. The ObGyn claimed that he offered a cesarean delivery after 2 hours of pushing. The baby’s blood gas reading at delivery was normal. Any brain injuries to the baby were from resuscitation.
VERDICT A $4,080,500 Pennsylvania verdict was returned.
Related Articles:
When macrosomia is suspected at term, does induction of labor lower the risk of cesarean delivery? Jennifer T. Ahn, MD (Examining the Evidence, May 2012)
Develop and use a checklist for 3rd- and 4th-degree perinatal lacerations Robert L. Barbieri, MD (Editorial, August 2013)
BOWEL INJURY DURING CESAREAN DELIVERY
During cesarean delivery, the mother suffered a bowel injury that led to infection and several abdominal abscesses. She required two procedures for drain placement plus two additional operations.
PATIENT’S CLAIM The ObGyn was negligent in how he performed the cesarean delivery and for not treating the injury and subsequent infection in a timely manner. The abscesses took 3 years to resolve; additional procedures left scarring and aggravated a spinal injury.
PHYSICIAN’S DEFENSE Bowel perforation is a known complication of cesarean delivery. It probably occurred during manipulation of the uterus in an area that was not visible.
VERDICT A $750,000 New Jersey verdict was returned.
Related Article: How to avoid intestinal and urinary tract injuries during gynecologic laparoscopy Michael Baggish, MD (Surgical Technique, October 2012)
These cases were selected by the editors of OBG Management from Medical Malpractice Verdicts, Settlements & Experts, with permission of the editor, Lewis Laska (www.verdictslaska.com). The information available to the editors about the cases presented here is sometimes incomplete. Moreover, the cases may or may not have merit. Nevertheless, these cases represent the types of clinical situations that typically result in litigation and are meant to illustrate nationwide variation in jury verdicts and awards.
TELL US WHAT YOU THINK!
Share your thoughts on this article or on any topic relevant to ObGyns and women’s health practitioners. Tell us which topics you’d like to see covered in future issues, and what challenges you face in daily practice. We will consider publishing your letter and in a future issue.
Send your letter to: obg@frontlinemedcom.com Please include the city and state in which you practice.
Stay in touch! Your feedback is important to us!
Is there a primary care tool to detect aberrant drug-related behaviors in patients on opioids?
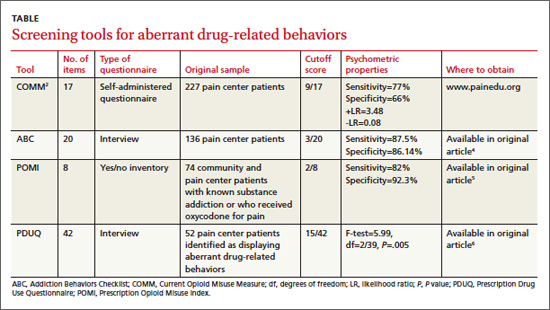
Yes. Of the several screening instruments developed and originally validated in patients in a pain center population (TABLE), one also has been validated in primary care. The Current Opioid Misuse Measure (COMM) predicts aberrant drug-related behaviors in primary care patients who have been prescribed opioids within the past 12 months with a sensitivity of 77% and specificity of 77% (strength of recommendation [SOR]: B, cohort studies).
Although not validated in primary care populations, 3 other instruments (the Addiction Behaviors Checklist [ABC], Prescription Opioid Misuse Index [POMI], and Prescription Drug Use Questionnaire [PDUQ]) detect aberrant drug-related behaviors in pain center patients with chronic pain with sensitivities of 82% to 87.5% and specificities of 86.14% to 92.3% (SOR: B, cohort studies).
EVIDENCE SUMMARY
The COMM—originally designed to detect recent aberrant drug-related behaviors in pain center patients—was validated by a cross-sectional study involving 238 primary care patients who had been prescribed an opioid within the previous 12 months.1
The study authors defined aberrant drug-related behaviors as meeting the criteria for prescription drug use disorder in the Diagnostic and Statistical Manual of Mental Disorders, 4th edition (DSM-IV). High COMM scores significantly predicted this diagnosis (P<.001). A COMM cutoff score >13 yielded a sensitivity of 77% and a specificity of 77% (positive predictive value=0.30; negative predictive value=0.96).
Development of the COMM. The authors of the COMM developed questions by expert consensus for use in a population of patients in a pain center. They established the validity of the questions by correlating COMM results from a cohort of pain center patients with 2 previously validated instruments: The Marlowe-Crowne Social Desirability Scale and the Aberrant Drug Behavior Index. They also tested COMM’s validity for monitoring changes in aberrant drug-related behaviors in a second cohort (sensitivity=94%; specificity=73%).2 They later cross-validated COMM with another group of 226 patients treated at pain management clinics, achieving similar results.3
Three additional tools have been validated only among pain clinic patients
The ABC was developed based on literature review and validated against the PDUQ and clinician judgment of opioid misuse. Scores on the ABC differed significantly between patients who were discontinued from opioid therapy (based on urine toxicology, for example) and patients who weren’t (P=.021).4
The authors of the POMI determined sensitivity and specificity by comparing the POMI with DSM-IV diagnostic criteria for opiate addiction. One weakness of this index is that it is based on a small, homogenous sample.5
Items in the PDUQ were based on a literature review and extracts from the charts of patients with chronic pain.6
Additional reviews
Two systematic reviews of screening tools used to predict aberrant behaviors in pain center populations included several studies with methodologic limitations.7,8
RECOMMENDATIONS
A guideline from the American Pain Society based on a systematic review concluded that the most predictive factor for aberrant drug-related behaviors is a personal or family history of drug or alcohol abuse.9,10 In 2009, APS and American Academy of Pain Medicine developed guidelines to assist in selecting, risk-stratifying, and monitoring patients on chronic pain medication.9,10 The American Society of Interventional Pain Physicians recommends evaluation of misuse risk, but considers screening tools an optional measure during initial assessment for opioid prescribing.11
1. Meltzer EC, Rybin D, Saitz R, et al. Identifying prescription opioid use disorder in primary care: diagnostic characteristics of the Current Opioid Misuse Measure (COMM). Pain. 2011;152:397-402.
2. Butler SF, Budham SH, Fernandez KC, et al. Development and validation of the Current Opioid Misuse Measure. Pain. 2007;130:144-156.
3. Butler SF, Budman SH, Fanciullo GJ, et al. Cross validation of the current opioid misuse measure (COMM) to monitor chronic pain patients on opioid therapy. Clin J Pain. 2010;26:770-776.
4. Wu SM, Compton P, Bolus R, et. al. The addiction behaviors checklist: validation of a new clinician-based measure of inappropriate opioid use in chronic pain. J Pain Symptom Manage. 2006;32:342-351.
5. Knisely JS, Wunsch MJ, Cropsey KL, et al. Prescription Opioid Misuse Index: A brief questionnaire to assess misuse. J Subst Abuse Treat. 2008;35:380-386.
6. Compton P, Darakjian J, Miotto K. Screening for addiction in patients with chronic pain and “problematic” substance use: evaluation of a pilot assessment tool. J Pain Symptom Manage. 1998;16:355-363.
7. Sehgal N, Manchikanti L, Smith HS. Prescription opioid abuse in chronic pain: a review of opioid abuse predictors and strategies to curb opioid abuse. Pain Physician. 2012;15(3 suppl):ES67-ES92.
8. Solanki DR, Koyyalagunta D, Shah RV, et al. Monitoring opioid adherence in chronic pain patients: assessment of risk of substance misuse. Pain Physician. 2011;14:E119-E131.
9. Chou R. 2009 Clinical guidelines from the American Pain Society and the American Academy of Pain Medicine on the use of chronic opioid therapy in chronic noncancer pain: what are the key messages for clinical practice? Pol Arch Med Wewn. 2009;119:469-477.
10. Chou R, Fanciullo GJ, Fine PG, et al. Clinical guidelines for the use of chronic opioid therapy in chronic noncancer pain. J Pain. 2009;10:113-130.
11. Manchikanti L, Abdi S, Alturi S, et al; American Pain Society-American Academy of Pain Medicine Opioids Guidelines Panel. American Society of Interventional Pain Physicians (ASIPP) guidelines for responsible opioid prescribing in chronic non-cancer pain: Part 2—guidance. Pain Physician. 2012;15(3 suppl):S67-S116.
Yes. Of the several screening instruments developed and originally validated in patients in a pain center population (TABLE), one also has been validated in primary care. The Current Opioid Misuse Measure (COMM) predicts aberrant drug-related behaviors in primary care patients who have been prescribed opioids within the past 12 months with a sensitivity of 77% and specificity of 77% (strength of recommendation [SOR]: B, cohort studies).
Although not validated in primary care populations, 3 other instruments (the Addiction Behaviors Checklist [ABC], Prescription Opioid Misuse Index [POMI], and Prescription Drug Use Questionnaire [PDUQ]) detect aberrant drug-related behaviors in pain center patients with chronic pain with sensitivities of 82% to 87.5% and specificities of 86.14% to 92.3% (SOR: B, cohort studies).
EVIDENCE SUMMARY
The COMM—originally designed to detect recent aberrant drug-related behaviors in pain center patients—was validated by a cross-sectional study involving 238 primary care patients who had been prescribed an opioid within the previous 12 months.1
The study authors defined aberrant drug-related behaviors as meeting the criteria for prescription drug use disorder in the Diagnostic and Statistical Manual of Mental Disorders, 4th edition (DSM-IV). High COMM scores significantly predicted this diagnosis (P<.001). A COMM cutoff score >13 yielded a sensitivity of 77% and a specificity of 77% (positive predictive value=0.30; negative predictive value=0.96).
Development of the COMM. The authors of the COMM developed questions by expert consensus for use in a population of patients in a pain center. They established the validity of the questions by correlating COMM results from a cohort of pain center patients with 2 previously validated instruments: The Marlowe-Crowne Social Desirability Scale and the Aberrant Drug Behavior Index. They also tested COMM’s validity for monitoring changes in aberrant drug-related behaviors in a second cohort (sensitivity=94%; specificity=73%).2 They later cross-validated COMM with another group of 226 patients treated at pain management clinics, achieving similar results.3
Three additional tools have been validated only among pain clinic patients
The ABC was developed based on literature review and validated against the PDUQ and clinician judgment of opioid misuse. Scores on the ABC differed significantly between patients who were discontinued from opioid therapy (based on urine toxicology, for example) and patients who weren’t (P=.021).4
The authors of the POMI determined sensitivity and specificity by comparing the POMI with DSM-IV diagnostic criteria for opiate addiction. One weakness of this index is that it is based on a small, homogenous sample.5
Items in the PDUQ were based on a literature review and extracts from the charts of patients with chronic pain.6
Additional reviews
Two systematic reviews of screening tools used to predict aberrant behaviors in pain center populations included several studies with methodologic limitations.7,8
RECOMMENDATIONS
A guideline from the American Pain Society based on a systematic review concluded that the most predictive factor for aberrant drug-related behaviors is a personal or family history of drug or alcohol abuse.9,10 In 2009, APS and American Academy of Pain Medicine developed guidelines to assist in selecting, risk-stratifying, and monitoring patients on chronic pain medication.9,10 The American Society of Interventional Pain Physicians recommends evaluation of misuse risk, but considers screening tools an optional measure during initial assessment for opioid prescribing.11
1. Meltzer EC, Rybin D, Saitz R, et al. Identifying prescription opioid use disorder in primary care: diagnostic characteristics of the Current Opioid Misuse Measure (COMM). Pain. 2011;152:397-402.
2. Butler SF, Budham SH, Fernandez KC, et al. Development and validation of the Current Opioid Misuse Measure. Pain. 2007;130:144-156.
3. Butler SF, Budman SH, Fanciullo GJ, et al. Cross validation of the current opioid misuse measure (COMM) to monitor chronic pain patients on opioid therapy. Clin J Pain. 2010;26:770-776.
4. Wu SM, Compton P, Bolus R, et. al. The addiction behaviors checklist: validation of a new clinician-based measure of inappropriate opioid use in chronic pain. J Pain Symptom Manage. 2006;32:342-351.
5. Knisely JS, Wunsch MJ, Cropsey KL, et al. Prescription Opioid Misuse Index: A brief questionnaire to assess misuse. J Subst Abuse Treat. 2008;35:380-386.
6. Compton P, Darakjian J, Miotto K. Screening for addiction in patients with chronic pain and “problematic” substance use: evaluation of a pilot assessment tool. J Pain Symptom Manage. 1998;16:355-363.
7. Sehgal N, Manchikanti L, Smith HS. Prescription opioid abuse in chronic pain: a review of opioid abuse predictors and strategies to curb opioid abuse. Pain Physician. 2012;15(3 suppl):ES67-ES92.
8. Solanki DR, Koyyalagunta D, Shah RV, et al. Monitoring opioid adherence in chronic pain patients: assessment of risk of substance misuse. Pain Physician. 2011;14:E119-E131.
9. Chou R. 2009 Clinical guidelines from the American Pain Society and the American Academy of Pain Medicine on the use of chronic opioid therapy in chronic noncancer pain: what are the key messages for clinical practice? Pol Arch Med Wewn. 2009;119:469-477.
10. Chou R, Fanciullo GJ, Fine PG, et al. Clinical guidelines for the use of chronic opioid therapy in chronic noncancer pain. J Pain. 2009;10:113-130.
11. Manchikanti L, Abdi S, Alturi S, et al; American Pain Society-American Academy of Pain Medicine Opioids Guidelines Panel. American Society of Interventional Pain Physicians (ASIPP) guidelines for responsible opioid prescribing in chronic non-cancer pain: Part 2—guidance. Pain Physician. 2012;15(3 suppl):S67-S116.
Evidence-based answers from the Family Physicians Inquiries Network
The list of things FPs do just keeps getting shorter
In his editorial, Dr. Hickner posed an important question: Have family physicians abandoned acute care? (J Fam Pract. 2013;62:333). My answer is Yes, they have abandoned acute care—and a lot more. FPs no longer do hospital care, obstetrics, pediatrics, orthopedics, gynecology, procedures, or continuity care. FPs have been so dumbed down, there is nothing they do that a mid-level cannot do.
I have been practicing family medicine for more than 25 years. I’m still delivering babies, doing hospital work and office surgical procedures, and coming in after hours to see patients, but I am looked upon as a museum piece by other physicians in my area.
So I’ll pose another question to my colleagues here: What, exactly, is the role of a family physician in today’s brave new health care model?
Keith Stafford, MD
Greer, SC
Computerized checklist can reduce CLABSI rate

Staphylococcus infection
Credit: Bill Branson
A computerized safety checklist that pulls information from patients’ electronic medical records can reduce the incidence of central line-associated bloodstream infections (CLABSIs), according to a study published in Pediatrics.
The study was conducted among children admitted to the pediatric intensive care unit at Lucile Packard Children’s Hospital Stanford in California.
Researchers found the safety checklist increased overall staff compliance with best practices for CLABSI prevention and resulted in a 3-fold reduction in CLABSI incidence.
The automated checklist, and a dashboard-style interface used to interact with it, was designed to help caregivers follow national guidelines for CLABSI prevention. The system combed through data in a patient’s electronic medical record and pushed alerts to physicians and nurses when a patient’s central line was due for care.
The dashboard interface displayed real-time alerts on a large LCD screen in the nurses’ station. Alerts—shown as red, yellow, or green dots beside patients’ names—were generated if, for example, the dressing on a patient’s central line was due to be changed, or if it was time for caregivers to re-evaluate whether medications given in the central line could be switched to oral formulations instead.
“The information was visible and easy to digest,” said study author Deborah Franzon, MD. “We improved compliance with best-care practices and pulled information that otherwise would have been difficult to look for. It reduced busy work and made it possible for the healthcare team to perform their jobs more efficiently and effectively.”
The system was implemented on May 1, 2011, but the researchers considered the rollout period to extend to August 31, 2011. So this period was not included in the analysis.
The team compared data on CLABSI rates, compliance with bundle elements, and staff perceptions/knowledge before the intervention began—from June 1, 2009, to April 30, 2011—and after the system was fully implemented—September 1, 2011, to December 31, 2012.
CLABSI rates decreased from 2.6 per 1000 line-days before the intervention to 0.7 per 1000 line-days afterward (P=0.02). There were a total of 19 CLABSIs per 7322 line-days pre-intervention and 7 CLABSIs per 6155 line-days post-intervention.
The researchers estimated that the intervention saved approximately $260,000 per year in healthcare costs. Treating a single CLABSI costs approximately $39,000.
The team also found that daily documentation of line necessity increased from 30% before the intervention to 73% after (P<0.001). Compliance with dressing changes increased from 87% to 90% (P=0.003).
Compliance with cap changes increased from 87% to 93% (P<0.001). And compliance with port needle changes increased from 69% to 95% (P<0.001). However, compliance with insertion bundle documentation decreased from 67% to 62% (P=0.001).
After the system was implemented, there was a significant increase in staff perception that the medical team addressed central line necessity during rounds (P=0.02). But there was no significant difference in communication among team members (P=0.73) or knowledge regarding the components of the maintenance bundle (P=0.39).
Nevertheless, the researchers concluded that their system promotes compliance with best practices for CLABSI prevention, thereby reducing the risk of harm to patients.
The team hopes to use the system in other ways, such as monitoring the recovery of children who have received organ transplants.
“[The system] lets physicians focus on taking care of the patient while automating some of the background safety checks,” said study author Natalie Pageler, MD. “The nice thing about this tool is that it’s integrated into the electronic medical record, which we use every single day.” ![]()
Transfusion increases risks in PCI patients, study shows
![]()
Credit: UAB Hospital
In a large study, patients who received red blood cell (RBC) transfusions after percutaneous coronary intervention (PCI) had a higher risk of in-hospital heart attack, stroke, and death than their non-transfused peers.
The retrospective study included data on nearly 2 million patients who underwent a PCI at hospitals across the US.
The research revealed considerable variation in transfusion practices for this patient population, although the overall rate of transfusion was low.
This makes sense, as giving RBC transfusions to patients with coronary artery disease is controversial, according to the study authors.
They said there is a growing body of evidence suggesting that transfusion in the setting of acute coronary syndromes (ACS) and in hospitalized patients with a history of coronary artery disease may be associated with an increased risk of heart attack and death.
Furthermore, current guideline statements are cautious about recommending transfusion in hospitalized patients with a history of coronary artery disease and make no recommendation on transfusion in the setting of ACS, citing an absence of definitive evidence.
With this in mind, Matthew W. Sherwood, MD, of Duke Clinical Research Institute in Durham, North Carolina, and his colleagues examined transfusion practice patterns and outcomes in 1,967,218 patients (2,258,711 visits) who underwent PCI from July 2009 to March 2013 at 1431 US hospitals.
The team reported their findings in JAMA.
Overall, 2.1% of patients had a transfusion. However, transfusion practices varied among the hospitals. The unadjusted transfusion rates ranged from 0% to 13%. Overall, 96.3% of hospitals transfused less than 5% of patients, and 3.7% of hospitals transfused 5% of patients or more.
Risk-standardized rates of transfusion by hospital ranged from 0.3% to 9.3%. The risk was adjusted for factors such as age, sex, body mass index, ACS presentation, PCI status, history of congestive heart failure, etc.
Compared to no transfusion, receiving an RBC transfusion was associated with a greater risk of heart attack (4.5% vs 1.8%), stroke (2.0% vs 0.2%), and in-hospital death (12.5% vs 1.2%), irrespective of bleeding complications.
Patients were more likely to receive a transfusion if they were older, female, and had hypertension, diabetes, advanced renal dysfunction, and prior heart attack or heart failure.
The researchers speculated that the variation in transfusion practice patterns observed in this study may be related to several factors, including previously held beliefs about the benefit of transfusion and recently published data indicating the lack of benefit and potential hazard associated with transfusion.
The team said these data highlight the need for randomized trials of transfusion strategies to guide practice in patients undergoing PCI. And until these trials provide more definitive answers, clinicians should try to reduce the risk of bleeding and, therefore, the need for transfusion in patients undergoing PCI. ![]()
Peer‐Reviewed Journals and Social Media
Only 20 years ago, science from peer‐reviewed journals was still distributed and consumed in the same fashion that evolved from the earliest days of medical science: in print at monthly or weekly intervals. The Internet radically accelerated this paradigm but left the essential processes intact; journals could publish the information and readers could read it more easily, but the basic forums for interaction and discussion over the content remained the same. Enter Web 2.0 and the era of social media. Authors, editors, and readers can now interact easily with each other over the content in real time and across great distances.
Social media may not have changed the way science is produced and reviewed, but it is certainly changing how people consume and use the science. Some have suggested that social media activity around particular articles or journals may be a more important measure of impact than traditional measures of citation,[1] and others have suggested that Twitter activity in particular has changed both the speed and quality of discussion about new studies within the scientific community.[2] In the face of these trends, the Journal of Hospital Medicine (JHM) has decided to develop a bold strategy for leadership in this emerging area, with an initial focus on increasing JHM's activity and visibility on Twitter.
As part of this initial focus, JHM has successfully developed and implemented a protocol for use by authors to compose 2 Tweets describing their publications: the first announces the article's publication (e.g., New evidence on white coats and risk for hospital‐acquired infections), and the second promotes a key point from the article (e.g., Does the doctor's white coat spread hospital infection?). These Tweets are encouraged (but not required) from the corresponding author for every article in every edition, and JHM's editorial staff works with individual authors to refine their message and maximize their impact. To help authors, we have developed several tips for effective tweeting (Table 1).
| 1. Make it short:The limit is 140 characters, but getting retweets requires additional room for others to add their 2 cents, so try to get it under 100 characters. |
| 2. Make it simple: If your tweet includes complex terminology or analytic methods, it is not likely to get picked up. Make it easy to read for the lay public. |
| 3. Make it clear: Your article may have several conclusions, but pick the most newsworthy for the general public. It is usually best to focus on the main finding. |
| 4. Pose a question: Raise interest by piquing the curiosity of potential readers. A good question can motivate readers to click on your article to find the answer. |
| 5. Add a hashtag: Hashtags index tweets on Twitter. It is best to pick 1 or 2 existing tags from the healthcare hashtag project that fit the focus of your article ( |
| 6. Build your following: Include your Twitter handle to alert current/prospective followers of your publication. |
Even after just 1 year of this Twitter‐focused strategy, we are already seeing noteworthy impact and have learned several lessons.
AUTHORS CAN AND WILL GENERATE TWEETS FOR THEIR ARTICLES
When we started asking authors to generate tweets for their articles, Twitter was relatively new, and we were unsure if authors would be willing and able to participate. Since we started, we have noticed a steady increase in the number of author‐generated tweets. Today, more than three‐quarters of tweets per issue are author generated. Anecdotal feedback has been very positive, and authors have expressed interest in the plan for tweeting as well as feedback on how well their tweets were written. If authors or institutions are on Twitter, we also encourage using the Twitter name or handle in the tweet, which serves as a way for others on Twitter to identify directly with the author or institution and often results in greater interest in a particular tweet. Of note, authors have no obligation to become regular users of Twitter or engage with followers of JHM's Twitter feed, but many find themselves following the journal's feed more closely (and responding to posts by other authors) once they have joined Twitter and tweeted about their own work via JHM.
#HASHTAGS MAKE IT HAPPEN
Because Twitter users are a very large crowd of people with diverse interests, it is important to target tweets to the groups that would be most interested in studies. The use of hashtags makes it easy to index tweets. One of the major edits of author‐generated tweets that we provide is to index the articles to the most popular hashtags. For example, medical education studies can be indexed under #meded, which is a popular hashtag for clinician educators. Other important hashtags for hospitalists include #ptsafety, #readmissions, #healthpolicy, #healthcosts, or #infectiousdisease. To select hashtags, we have found the healthcare hashtag directory maintained by Symplur (Upland, CA;
HIGH IMPACT STUDIES MAKE A BIGGER IMPACT ON TWITTER
We observed a high number of retweets and comments about articles that were the most viewed studies on JHM online, referring to Project BOOST (Better Outcomes for Older Adults Through Safe Transitions) and the Society of Hospital Medicine's Choosing Wisely campaign. This is not surprising given the national focus on readmissions as well as cost‐conscious care. Moreover, our experience is in line with observations that Twitter provides an additional source of page views and article downloads for medical journals[3] and research, which demonstrates that studies that are tweeted will eventually be cited more.[4, 5]
TECHNOLOGY STUDIES ARE ADORED BY TWITTER
Studies and research examining the use of smartphones, apps, or social media in healthcare draw a lot of attention on Twitter, particularly from other technophiles in healthcare who often use the #hscm healthcare social media hashtag. Such studies often resonate with Twitter users, who tend to be engaged in technology at a high level and are interested in how to advance the use of technology in the healthcare workplace.
JHM's social media strategy has already been very successful in its early implementation; the JHM twitter feed has >600 followers. Although most authors submit their own tweets (71/117 or 61% of articles over the last year), JHM has also created social media roles for editors to fill in tweets when missing and ensure timely and consistent output from the JHM feed. We have also started a Facebook page, with a rapidly growing number of followers, and we continue to see our social media influence scores rise. In the next year we hope to develop a JHM blog, with invited commentary as well as a process for unsolicited submissions from our readership.
Increasingly, a journal's impact (small i) is measured not only in the traditional metric of impact factor (a representation of the number of papers cited in a given journal publication year), but also by the journal's ability to disseminate knowledge and awareness of issues key to the field. Social media is a major element of the next phase of evidence dissemination, and JHM is pleased to be developing and growing its footprint in the digital world.
- , . Exploring the use of social media to measure journal article impact. AMIA Annu Symp Proc. 2011;2011:374–381.
- . Peer review: trial by Twitter. Nature. 2011;469(7330):286–287.
- , , , . Social media release increases dissemination of original articles in the clinical pain sciences. PLoS One. 2013;8(7):e68914.
- . Can tweets predict citations? Metrics of social impact based on Twitter and correlation with traditional metrics of scientific impact. J Med Internet Res. 2011;13(4):e123.
- , , , . Do altmetrics work? Twitter and ten other social web services. PLoS One. 2013;8(5):e64841.
Only 20 years ago, science from peer‐reviewed journals was still distributed and consumed in the same fashion that evolved from the earliest days of medical science: in print at monthly or weekly intervals. The Internet radically accelerated this paradigm but left the essential processes intact; journals could publish the information and readers could read it more easily, but the basic forums for interaction and discussion over the content remained the same. Enter Web 2.0 and the era of social media. Authors, editors, and readers can now interact easily with each other over the content in real time and across great distances.
Social media may not have changed the way science is produced and reviewed, but it is certainly changing how people consume and use the science. Some have suggested that social media activity around particular articles or journals may be a more important measure of impact than traditional measures of citation,[1] and others have suggested that Twitter activity in particular has changed both the speed and quality of discussion about new studies within the scientific community.[2] In the face of these trends, the Journal of Hospital Medicine (JHM) has decided to develop a bold strategy for leadership in this emerging area, with an initial focus on increasing JHM's activity and visibility on Twitter.
As part of this initial focus, JHM has successfully developed and implemented a protocol for use by authors to compose 2 Tweets describing their publications: the first announces the article's publication (e.g., New evidence on white coats and risk for hospital‐acquired infections), and the second promotes a key point from the article (e.g., Does the doctor's white coat spread hospital infection?). These Tweets are encouraged (but not required) from the corresponding author for every article in every edition, and JHM's editorial staff works with individual authors to refine their message and maximize their impact. To help authors, we have developed several tips for effective tweeting (Table 1).
| 1. Make it short:The limit is 140 characters, but getting retweets requires additional room for others to add their 2 cents, so try to get it under 100 characters. |
| 2. Make it simple: If your tweet includes complex terminology or analytic methods, it is not likely to get picked up. Make it easy to read for the lay public. |
| 3. Make it clear: Your article may have several conclusions, but pick the most newsworthy for the general public. It is usually best to focus on the main finding. |
| 4. Pose a question: Raise interest by piquing the curiosity of potential readers. A good question can motivate readers to click on your article to find the answer. |
| 5. Add a hashtag: Hashtags index tweets on Twitter. It is best to pick 1 or 2 existing tags from the healthcare hashtag project that fit the focus of your article ( |
| 6. Build your following: Include your Twitter handle to alert current/prospective followers of your publication. |
Even after just 1 year of this Twitter‐focused strategy, we are already seeing noteworthy impact and have learned several lessons.
AUTHORS CAN AND WILL GENERATE TWEETS FOR THEIR ARTICLES
When we started asking authors to generate tweets for their articles, Twitter was relatively new, and we were unsure if authors would be willing and able to participate. Since we started, we have noticed a steady increase in the number of author‐generated tweets. Today, more than three‐quarters of tweets per issue are author generated. Anecdotal feedback has been very positive, and authors have expressed interest in the plan for tweeting as well as feedback on how well their tweets were written. If authors or institutions are on Twitter, we also encourage using the Twitter name or handle in the tweet, which serves as a way for others on Twitter to identify directly with the author or institution and often results in greater interest in a particular tweet. Of note, authors have no obligation to become regular users of Twitter or engage with followers of JHM's Twitter feed, but many find themselves following the journal's feed more closely (and responding to posts by other authors) once they have joined Twitter and tweeted about their own work via JHM.
#HASHTAGS MAKE IT HAPPEN
Because Twitter users are a very large crowd of people with diverse interests, it is important to target tweets to the groups that would be most interested in studies. The use of hashtags makes it easy to index tweets. One of the major edits of author‐generated tweets that we provide is to index the articles to the most popular hashtags. For example, medical education studies can be indexed under #meded, which is a popular hashtag for clinician educators. Other important hashtags for hospitalists include #ptsafety, #readmissions, #healthpolicy, #healthcosts, or #infectiousdisease. To select hashtags, we have found the healthcare hashtag directory maintained by Symplur (Upland, CA;
HIGH IMPACT STUDIES MAKE A BIGGER IMPACT ON TWITTER
We observed a high number of retweets and comments about articles that were the most viewed studies on JHM online, referring to Project BOOST (Better Outcomes for Older Adults Through Safe Transitions) and the Society of Hospital Medicine's Choosing Wisely campaign. This is not surprising given the national focus on readmissions as well as cost‐conscious care. Moreover, our experience is in line with observations that Twitter provides an additional source of page views and article downloads for medical journals[3] and research, which demonstrates that studies that are tweeted will eventually be cited more.[4, 5]
TECHNOLOGY STUDIES ARE ADORED BY TWITTER
Studies and research examining the use of smartphones, apps, or social media in healthcare draw a lot of attention on Twitter, particularly from other technophiles in healthcare who often use the #hscm healthcare social media hashtag. Such studies often resonate with Twitter users, who tend to be engaged in technology at a high level and are interested in how to advance the use of technology in the healthcare workplace.
JHM's social media strategy has already been very successful in its early implementation; the JHM twitter feed has >600 followers. Although most authors submit their own tweets (71/117 or 61% of articles over the last year), JHM has also created social media roles for editors to fill in tweets when missing and ensure timely and consistent output from the JHM feed. We have also started a Facebook page, with a rapidly growing number of followers, and we continue to see our social media influence scores rise. In the next year we hope to develop a JHM blog, with invited commentary as well as a process for unsolicited submissions from our readership.
Increasingly, a journal's impact (small i) is measured not only in the traditional metric of impact factor (a representation of the number of papers cited in a given journal publication year), but also by the journal's ability to disseminate knowledge and awareness of issues key to the field. Social media is a major element of the next phase of evidence dissemination, and JHM is pleased to be developing and growing its footprint in the digital world.
- , . Exploring the use of social media to measure journal article impact. AMIA Annu Symp Proc. 2011;2011:374–381.
- . Peer review: trial by Twitter. Nature. 2011;469(7330):286–287.
- , , , . Social media release increases dissemination of original articles in the clinical pain sciences. PLoS One. 2013;8(7):e68914.
- . Can tweets predict citations? Metrics of social impact based on Twitter and correlation with traditional metrics of scientific impact. J Med Internet Res. 2011;13(4):e123.
- , , , . Do altmetrics work? Twitter and ten other social web services. PLoS One. 2013;8(5):e64841.
FIM at Discharge and Rehospitalization
Federally mandated pay‐for‐performance initiatives promote minimizing 30‐day hospital readmissions to improve healthcare quality and reduce costs. Although the reasons for readmissions are multifactorial, many patients are readmitted for a condition other than their initial hospital admitting diagnosis.[1] Impairments in functional status experienced during acute care hospitalization contribute to patients being discharged in a debilitated state and being vulnerable to postdischarge complications and potentially hospital readmission.[2] As such, decreased functional status may be an important and potentially modifiable risk factor for acute care hospital readmission.[3]
Previous studies have suggested that impaired functional status may be an important predictor of rehospitalization.[4, 5, 6, 7] However, inferences from existing studies are limited because they did not consider functional status as their primary focus, they only considered specific patient populations (eg, stroke) or readmissions occurring well beyond the 30‐day period defined by federal pay‐for‐performance standards.[4, 5, 6, 8, 9, 10] Our objective was to evaluate the association between functional status near the time of discharge from acute care hospital and 30‐day readmission for patients admitted to an acute inpatient rehabilitation facility. As a secondary objective, we sought to investigate the relationship between functional status and readmission by diagnostic category (medical, neurologic, or orthopedic).
METHODS
Study Population and Setting
We conducted a single‐center, retrospective study of patients admitted to an inpatient rehabilitation facility at a community hospital between July 1, 2006 and December 31, 2012. This facility provides intensive rehabilitation consisting of 3 hours of therapy per day, skilled nursing care on a 24‐hour basis, and medical care by a physiatrist. We excluded patients who died during inpatient rehabilitation (n=15, 0.2%) and patients not admitted directly from an acute care setting (n=178, 2.0%).
Data Source and Covariates
Data were derived from the Uniform Data System for Medical Rehabilitation (UDSMR), which is an administrative database providing the following data upon admission to an inpatient rehabilitation facility[11, 12, 13]: age, gender, race/ethnicity, marital status, the discharge setting, the admission Functional Independence Measure (FIM) score (details further below), and admission diagnostic category as defined by the primary discharge diagnosis from the acute care hospital and grouped by functional related groups (a case‐mix system for medical rehabilitation).[12, 14] The 3M ClinTrac management software (3M, St. Paul, MN), used for mandatory reporting to the State of Maryland, provided all‐payerrefined diagnosis related group (APRDRG) and severity of illness (SOI) combinations (a tool to group patients into clinically comparable disease and severity‐of‐illness categories expected to use similar resources and experience similar outcomes). The University HealthSystem Consortium (UHC) database provided national readmission rates for all APRDRG‐SOI combinations using a methodology that has been previously described.[15, 16] Expected readmission rates for APRDRG‐SOI combinations served as a patient risk stratification tool based on clinical logic that evaluates age, comorbidities, principal diagnosis during hospitalization, and procedures conducted during hospitalization.[17]
Primary Outcome: Acute Care Readmission
The primary outcome was all‐cause acute care readmission, defined as patient transfer to an acute care hospital during inpatient rehabilitation within 30 days from admission to inpatient rehabilitation. The care model for our inpatient rehabilitation unit is such that when patients become sick or develop a complication, they are admitted directly to a clinical unit (eg, intensive care unit) at the community hospital through a rapid‐response intervention, or the physiatrist arranges with an admitting inpatient attending to accept the patient directly to his or her service.
Primary Exposure: Functional Independence Measure
Functional status was measured using the FIM score.[18] The FIM score is an 18‐item measure of functional status, with each item scored on a scale from 1 to 7 (dependent to independent). Various aspects of motor function and cognitive function are assessed. The FIM has been validated and shown to be reliable and reproducible.[13, 19, 20] By definition for the FIM instrument, admission FIM scores are assessed by trained multidisciplinary personnel first over the 72 hours of the rehabilitation stay, and for this study served as a proxy for patient functional status upon discharge from the acute care setting in our analysis. This 72‐hour time window allows for full assessment by therapists and nurses; however, in clinical practice at the inpatient rehabilitation unit involved in this study, much of the FIM assessment occurs within the first 24 hours of the rehabilitation stay. For our analysis, we divided FIM scores into low, medium, and high functional groups. The thresholds for these groups were based on total FIM score tertiles from a prior study<60, 60 to 76, and >76.[16] As a secondary analysis we created 6 subscales of the overall FIM score based on previous research. These subscales included: transfers (transfer to chair/wheelchair, toilet, and tub/shower), locomotion (walking and stairs), self‐care (eating, grooming, bathing, dressing, and toileting), sphincter control (bladder and bowel management), communication (comprehension and expression), and social cognition (social interaction, problem solving, and memory).[21]
Statistical Analysis
To evaluate differences in patient characteristics by diagnostic category, analysis of variance and 2 tests were used for continuous and dichotomous variables, respectively. Logistic regression was used to evaluate the association between FIM score category and readmission status, adjusting for potentially confounding variables available from the UDSMR and UHC databases. We used interaction terms to test whether the association between the FIM score and readmissions varied significantly across diagnostic categories and by age. As a secondary analysis, we modeled FIM score as a continuous variable. We expressed the odds ratio in this analysis per 10‐point change in FIM, because this represents a clinically relevant change in function.[22] Logistic regression was also used to evaluate the association between FIM subscale scores (transfers, locomotion, self‐care, sphincter control, communication, and social cognition) and readmission status. Statistical significance was defined as a 2‐sided P<0.05. Data were analyzed with R (version 2.15.0;
RESULTS
Readmitted Patients and Diagnostic Categories
A total of 9405 consecutive eligible patients were admitted to the acute inpatient rehabilitation facility between July 1, 2006 and December 31, 2012. A total of 1182 (13%) patients were readmitted back to an acute care hospital from inpatient rehabilitation. Median (interquartile range) time to readmission from acute care hospital discharge was 6 days (310 days), and median length of stay for patients who were discharged to the community from inpatient rehabilitation was 8 days (612 days).
Table 1 shows characteristics of all inpatient rehabilitation patients by diagnostic category. For the neurologic category, the most common primary diagnoses were stroke and spinal cord injury; for the medical category, infection, renal failure, congestive heart failure, and chronic obstructive pulmonary disease; and for the orthopedic category, spinal arthrodesis, knee and hip replacements. Mean FIM scores were lowest and highest for patients admitted with a primarily neurologic and orthopedic diagnosis, respectively.
| Characteristic | All Patients, N=9405 | Diagnostic Category | |||
|---|---|---|---|---|---|
| Neurologic, n=3706 | Medical, n=2135 | Orthopedic, n=3564 | P Valueb | ||
| |||||
| Age, y | 67.8 (14.2) | 66.7 (15.3) | 67.0 (14.9) | 69.3 (12.4) | <0.001 |
| Male | 4,068 (43%) | 1,816 (49%) | 1,119 (52%) | 1,133 (32%) | <0.001 |
| Race | <0.001 | ||||
| Caucasian | 6,106 (65%) | 2344 (63%) | 1,320 (62%) | 2,442 (69%) | |
| African American | 2,501 (27%) | 984 (27%) | 658 (31%) | 859 (24%) | |
| Other | 798 (8%) | 378 (10%) | 157 (7%) | 263 (7%) | |
| Married | 4,330 (46%) | 1,683 (45%) | 931 (44%) | 1,716 (48%) | 0.002 |
| APRDRG‐SOI expected readmission rate | 18.0 (7.4) | 20.5 (6.8) | 21.3 (7.5) | 13.5 (5.6) | <0.001 |
| Total admission FIM score | 68.7 (17.2) | 60.4 (18.6) | 69.1 (15.5) | 77.2 (11.7) | <0.001 |
FIM Score Category and Risk of Readmission
Figure 1 shows that patients in the low admission FIM score category had the highest unadjusted rate of readmission for each diagnostic category. In unadjusted analysis, Table 2 shows that younger age, male sex, APDRG‐SOI expected readmission rate, and orthopedic and medical diagnostic categories were associated with readmission. As a continuous variable, FIM scores were linearly associated with readmission (Figure 2), with an unadjusted odds ratio (OR) and 95% confidence interval (CI) of 1.4 (1.4‐1.4, P<0.001) for a 10‐point decrease in FIM. Compared to patients with high admission FIM scores, patients with low and middle FIM scores had higher unadjusted odds of readmission (OR: 4.0; 95% CI: 3.4‐4.7; P<0.001 and OR: 1.8; 95% CI: 1.5‐2.1; P<0.001, respectively). Mean FIM subscale scores for patients readmitted versus not readmitted were transfers (5.3 vs 7.0, P<0.001), locomotion (1.6 vs 2.3, P<0.001), self‐care (17.0 vs 20.8, P<0.001), communication (10.6 vs 11.5, P<0.001), and social cognition (15.1 vs 16.6, P<0.001).
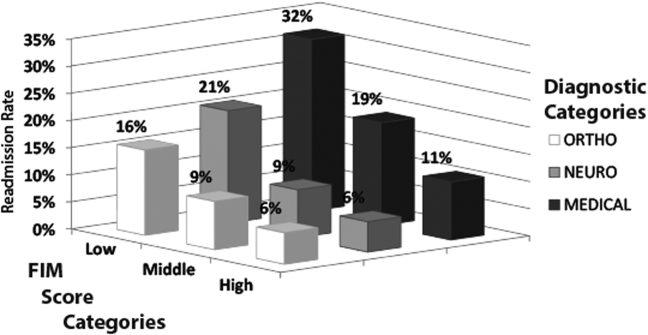
| Bivariable Analysisb | Multivariable Analysisb | |||||
|---|---|---|---|---|---|---|
| Characteristic | All Patients, N=9405 | Readmitted, n=1,182 | OR (95% CI) | P Value | OR (95% CI) | P Value |
| ||||||
| Age, y | 68.0 (14.2) | 66.4 (14.5) | 0.9 (0.91.0) | <0.001 | 0.9 (0.91.0) | <0.001 |
| Male | 3,431 (42%) | 637 (54%) | 1.6 (1.41.8) | <0.001 | 1.3 (1.11.5) | < 0.001 |
| Race | ||||||
| Caucasian | 5,340 (65%) | 766 (65%) | 1.0 | 1.0 | ||
| African American | 2,177 (26%) | 324 (27%) | 1.0 (0.91.2) | 0.60 | 1.0 (0.81.1) | 0.75 |
| Other | 706 (9%) | 92 (8%) | 0.9 (0.71.1) | 0.41 | 0.8 (0.61.0) | 0.12 |
| Married | 3,775 (46%) | 555 (47%) | 1.0 (0.91.2) | 0.50 | 1.0 (0.91.2) | 0.67 |
| Admission diagnosis category | ||||||
| Neurologic | 3,205 (39%) | 501 (42%) | 1.0 | 1.0 | ||
| Medical | 1,726 (21%) | 409 (35%) | 1.5 (1.31.7) | <0.001 | 1.8 (1.62.1) | < 0.001 |
| Orthopedic | 3,292 (40%) | 272 (23%) | 0.5 (0.50.6) | <0.001 | 1.3 (1.11.6) | 0.005 |
| APDRG‐SOI expected readmission rate | 17.4 (7.1%) | 22.2 (8.0%) | 1.1 (1.11.1) | <0.001 | 1.1 (1.01.1) | < 0.001 |
| Total FIM score category | ||||||
| High FIM, >76 points | 3,517 (43%) | 257 (22%) | 1.0 | 1.0 | ||
| Middle FIM, 60points | 2,742 (33%) | 353 (30%) | 1.8 (1.52.1) | <0.001 | 1.5 (1.31.8) | < 0.001 |
| Low FIM, <60 points | 1,964 (24%) | 572 (48%) | 4.0 (3.44.7) | <0.001 | 3.0 (2.53.6) | < 0.001 |
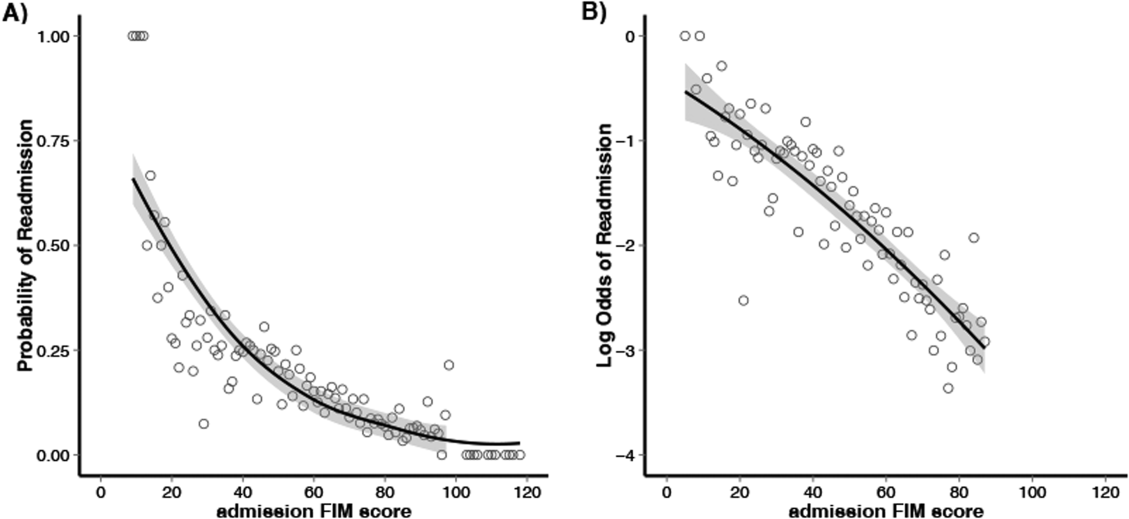
Multivariable and Subset Analyses
Patients with a primary medical diagnosis had higher odds of readmission to the hospital, (OR: 1.8; 95% CI: 1.6‐2.1, P<0.001), relative to patients with a neurologic or orthopedic diagnosis (Table 2). Across all diagnoses, the adjusted odds ratios (95% CIs) for the low and middle versus high FIM score category were 3.0 (2.5‐3.6; P<0.001) and 1.5 (1.3‐1.8; P<0.001) respectively (Table 2). When modeled as a continuous variable, a 10‐point decrease in FIM score was associated with a significantly increased adjusted readmission rate (OR: 1.4; 95% CI: 1.3‐1.4; P<0.001). In adjusted analysis including all subscales of the FIM, only the physical subscales, transfers (P<0.001), locomotion (P=0.002), and self‐care (P<0.001), were significantly associated with readmission. For each diagnostic category, there were similar significant associations between admission FIM score group and readmission status (Table 3). The odds of readmission by FIM score did not differ significantly across the 3 major diagnostic categories (P=0.20 for interaction term), suggesting that the effect of functional status was similar across various types of patients. We also did not observe a statistical interaction between age and FIM score group in predicting readmission (P=0.58). Patients in the lowest FIM group with a medical diagnosis had the highest adjusted readmission rate of 28.7% (Table 3).
| Multivariable Analysisa | Adjusted Readmission Ratesb | |||
|---|---|---|---|---|
| No. | OR (95% CI) | P Value | % (95% CI) | |
| ||||
| Neurologic | ||||
| High FIM (>76 points) | 755 | 1.0 | 7.3 (4.710.0) | |
| Middle FIM (6076 points) | 1,283 | 1.4 (1.02.1) | 0.06 | 9.1 (7.011.1) |
| Low FIM (<60 points) | 1,668 | 3.3 (2.34.7) | <0.001 | 18.7 (16.820.6) |
| Medical | ||||
| High FIM (>76 points) | 807 | 1.0 | 11.2 (8.114.3) | |
| Middle FIM (6076 points) | 766 | 1.8 (1.32.4) | <0.001 | 17.7 (14.520.9) |
| Low FIM (<60 points) | 562 | 3.2 (2.44.3) | <0.001 | 28.7 (25.132.4) |
| Orthopedic | ||||
| High FIM (>76 points) | 2,212 | 1.0 | 6.1 (4.77.6) | |
| Middle FIM (6076 points) | 1,046 | 1.4 (1.11.9) | 0.02 | 8.3 (6.410.1) |
| Low FIM (<60 points) | 306 | 2.2 (1.53.3) | <0.001 | 13.5 (10.416.7) |
DISCUSSION
In this study of 9405 consecutive patients admitted from acute care hospitals to a single inpatient rehabilitation facility, we investigated the association between functional status and readmission to an acute care hospital. We found that low functional status near the time of acute care hospital discharge was strongly associated with higher readmission rates. This relationship was consistently observed across major patient diagnostic categories, with low functioning medical patients having the highest rate of readmission (28.7%). Efforts to maintain or improve functional status during acute care hospitalization may be an important modifiable risk factor for acute care hospital readmission.
Previous studies have suggested that functional status may serve as an indicator of physiological reserve, and therefore vulnerability to medical complications and readmission.[6, 16, 23, 24, 25] Physiologic reserve refers to a person's ability to endure acute illness and is influenced by a number of factors, such as the adequacy of oxygen delivery to tissues, cardiovascular health, immune state, and nutritional status.[26] We found that motor subscales of the FIM score (transfers, locomotion, and self‐care), but not the other subscales, were independently associated with readmissions, which may suggest that lower motor scores are a stronger marker of physiologic reserve.[10, 16, 27] Although not our primary focus, we did note in our multivariable models that after adjusting for functional status, patients in a medical diagnostic category had higher readmission rates compared to patients with a primary neurologic or orthopedic diagnosis, but the impact of FIM score was consistent across all these diagnostic categories. We speculate that medical conditions that result in hospitalization, such as sepsis or acute kidney failure, may be more likely to result in multiorgan dysfunction that may impair physiological reserve and increase susceptibility to medical complications.[28, 29, 30, 31] In comparison, acute neurologic and orthopedic diagnoses, such as stroke or hip arthroplasty, directly impair gross motor function,[32, 33, 34, 35] with relative sparing of overall physiologic reserve.
The association between low functional status and readmissions is supported by previous studies across multiple hospital settings.[4, 5, 7, 8, 9, 27, 36] Despite this finding, routine inpatient medical practice may not fully address functional impairments. For instance, systematic measurement and documentation of functional status on admission and during hospitalization are not routine and may be a barrier to identifying medical patients at high risk for readmission.[37, 38, 39] Moreover, without recognition of functional impairment and its implications, current clinical practice may suboptimally prevent and treat physical impairments during inpatient care. However, such barriers can be surmounted. For example, in the medical intensive care unit setting, there is growing recognition that proactive and aggressive management of hospital‐acquired functional impairments through early rehabilitation is safe and feasible, improving patient outcomes while reducing hospital costs and readmissions.[3, 40, 41, 42, 43, 44, 45, 46, 47, 48, 49, 50, 51] Moreover, 2 recent meta‐analyses have shown that physical therapy hospital‐based exercise programs can improve length of stay, overall hospital costs, and rates of discharge to home.[52, 53] Finally, a randomized trial has demonstrated that an individualized exercise regimen started in the acute hospital setting with long‐term telephone follow‐up can significantly reduce emergency hospital readmissions and improve quality of life in older adults.[54] Therefore, decreased functional status likely represents a modifiable risk factor for hospital readmission, and further research is necessary to more systematically identify low‐functioning patients and implement early mobility and activity programs to reduce hospital‐acquired functional impairment.[2, 49, 55]
Our analysis has potential limitations. First, this was an observational study and we are unable to demonstrate a direct cause‐and‐effect relationship between functional status and readmission. However, our results are consistent with prior literature in this field. Second, our cohort only included patients who were discharged from an acute hospital to a rehabilitation facility, which may limit its generalizability. However, we included a large patient sample size with a broad range of admission FIM scores, and our findings are consistent with other studies conducted in different clinical settings. Third, although 1 of our goals was to evaluate how readmission rates differed by diagnostic category, it is possible that individual diagnoses within each category may have different risks for readmission, and future larger studies could evaluate more detailed diagnostic grouping approaches. Fourth, we also recognize that although FIM score assessment has been validated, admission assessment occurs over a 72‐hour time period, during which patients' function could potentially change a clinically meaningful degree. Fifth, there may be residual confounding because of limitations in available data within our administrative dataset; however, we did account for severity of illness using a standardized measure, and prior research has demonstrated that the relationship between functional status and readmissions may be minimally confounded by demographic and clinical variables.[8, 16, 27, 56] Finally, we lacked readmission data following discharge from rehabilitation; it is possible that the association between FIM score at the time of rehabilitation initiation may have had limited predictive value among patients who successfully completed rehabilitation and were sent home.
CONCLUSION
In conclusion, in this study of patients admitted from acute care hospitals to a single inpatient rehabilitation facility, we observed a strong association between decreased functional status and increased hospital readmission. In particular, medical patients with lower physical functioning exhibited an especially high rate of readmission. Incorporating functional status assessment into routine medical care may help identify patients at higher risk of readmission. Moreover, preventing and treating impaired functional status during inpatient admission, through early activity and mobility, should be evaluated as a way of improving patient outcomes and reducing hospital readmissions.
Disclosures: Erik Hoyer, MD, is supported by the Rehabilitation Medicine Scientist Training Program (RMSTP; 5K12HD001097). The authors report no conflicts of interest.
- , , . Rehospitalizations among patients in the Medicare fee‐for‐service program. N Engl J Med. 2009;360(14):1418–1428.
- . Post‐hospital syndrome—an acquired, transient condition of generalized risk. N Engl J Med. 2013;368(2):100–102.
- , , , et al. Receiving early mobility during an intensive care unit admission is a predictor of improved outcomes in acute respiratory failure. Am J Med Sci. 2011;341(5):373–377.
- , . Association of physical functioning with same‐hospital readmission after stroke. Am J Phys Med Rehabil. 2004;83(6):434–438.
- , , , . Posthospital care transitions: patterns, complications, and risk identification. Health Serv Res. 2004;39(5):1449–1465.
- , , , , , . Risk factors for nonelective hospital readmissions. J Gen Intern Med. 1996;11(12):762–764.
- , , , et al. Risk prediction models for hospital readmission: a systematic review. JAMA. 2011;306(15):1688–1698.
- , , , et al. Hospital readmission in persons with stroke following postacute inpatient rehabilitation. J Gerontol A Biol Sci Med Sci. 2012;67(8):875–881.
- , , , , , . Hospital readmission of persons with hip fracture following medical rehabilitation. Arch Gerontol Geriatr. 2003;36(1):15–22.
- , , , , , . Characteristics of persons rehospitalized after stroke rehabilitation. Arch Phys Med Rehabil. 2001;82(10):1367–1374.
- , , , et al. A classification system for inpatient rehabilitation patients: a review and proposed revisions to the functional independence measure‐function related groups. PB98–105992, September. Washington, DC: US Department of Commerce, National Technical Information Services; 1997.
- , , , , , . A case‐mix classification system for medical rehabilitation. Med Care. 1994;32(4):366–379.
- , , , . The reliability of the functional independence measure: a quantitative review. Arch Phys Med Rehabil. 1996;77(12):1226–1232.
- , , , , , . Four methods for characterizing disability in the formation of function related groups. Arch Phys Med Rehabil. 1994;75(12):1277–1283.
- , , , et al. Association of self‐reported hospital discharge handoffs with 30‐day readmissions. JAMA Intern Med. 2013;173(8):624–629.
- , , , , , . Functional status impairment is associated with unplanned readmissions. Arch Phys Med Rehabil. 2013;94(10):1951–1958.
- , , , et al. All patient refined diagnosis related groups (APR‐DRGs). Version 15.0. Report No.: 98‐054 Rev. 00. Wallingford, CT: 3M Health Information Systems; 1998.
- The inpatient rehabilitation facility–patient assessment instrument (IRF‐PAI) training manual. 2012. http://www.cms.gov/.
- , , , et al. Relationships between disability measures and nursing effort during medical rehabilitation for patients with traumatic brain and spinal cord injury. Arch Phys Med Rehabil. 1997;78(2):143–149.
- , , , . Interrater reliability of the 7‐level functional independence measure (FIM). Scand J Rehabil Med. 1994;26(3):115–119.
- , , , , , . Comparison of logistic regression and neural networks to predict rehospitalization in patients with stroke. J Clin Epidemiol. 2001;54(11):1159–1165.
- , , . Comparison of the responsiveness of the Barthel Index and the motor component of the Functional Independence Measure in stroke: the impact of using different methods for measuring responsiveness. J Clin Epidemiol. 2002;55(9):922–928.
- , . Prediction of hospital readmission for heart failure: development of a simple risk score based on administrative data. J Am Coll Cardiol. 1999;33(6):1560–1566.
- , , . Are all readmissions bad readmissions? N Engl J Med. 2010;363(3):297–298.
- , . Hospital readmission as an accountability measure. JAMA. 2011;305(5):504–505.
- . Susceptibility to critical illness: reserve, response and therapy. Intensive Care Med. 2000;26(suppl 1):S57–S63.
- , , , , . Predictors of discharge to acute care after inpatient rehabilitation in severely affected stroke patients. Am J Phys Med Rehabil. 2012;91(5):387–392.
- , , , et al. Clinical characteristics and outcomes of sepsis‐related vs non‐sepsis‐related ARDS. Chest. 2010;138(3):559–567.
- , . Long‐term outcomes from sepsis. Curr Infect Dis Rep. 2007;9(5):382–386.
- , . Heart failure performance measures and outcomes: real or illusory gains. JAMA. 2009;302(7):792–794.
- , , , , . Patients' self‐assessed functional status in heart failure by new york heart association class: a prognostic predictor of hospitalizations, quality of life and death. J Card Fail. 2010;16(2):150–156.
- , , , et al. Knee arthroplasty: disabilities in comparison to the general population and to hip arthroplasty using a French national longitudinal survey. PLoS One. 2008;3(7):e2561.
- , , , et al. Gait asymmetry in community‐ambulating stroke survivors. Arch Phys Med Rehabil. 2008;89(2):304–310.
- , , , . Recovery of upper extremity function in stroke patients: The Copenhagen Stroke Study. Arch Phys Med Rehabil. 1994;75(4):394–398.
- , , , , , . The effect of admission physiological variables on 30 day outcome after stroke. J Clin Neurosci. 2005;12(8):905–910.
- , , , et al. Unplanned readmissions after hospital discharge among patients identified as being at high risk for readmission using a validated predictive algorithm. Open Med. 2011;5(2):e104–e111.
- . Can hospitalization‐associated disability be prevented? JAMA. 2011;306(16):1800–1801.
- , , . Hospitalization‐associated disability: “she was probably able to ambulate, but I'm not sure.” JAMA. 2011;306(16):1782–1793.
- , , , , , . Importance of functional measures in predicting mortality among older hospitalized patients. JAMA. 1998;279(15):1187–1193.
- . Mobilizing patients in the intensive care unit: improving neuromuscular weakness and physical function. JAMA. 2008;300(14):1685–1690.
- , , . Technology to enhance physical rehabilitation of critically ill patients. Crit Care Med. 2009;37(10 suppl):S436–S441.
- , , , et al. Early physical medicine and rehabilitation for patients with acute respiratory failure: a quality improvement project. Arch Phys Med Rehabil. 2010;91(4):536–542.
- , , , et al. ICU early physical rehabilitation programs: financial modeling of cost savings. Crit Care Med. 2013;41(3):717–724.
- , , , et al. Early physical and occupational therapy in mechanically ventilated, critically ill patients: a randomised controlled trial. Lancet. 2009;373(9678):1874–1882.
- , , , et al. Early intensive care unit mobility therapy in the treatment of acute respiratory failure. Crit Care Med. 2008;36(8):2238–2243.
- , , , et al. Early activity is feasible and safe in respiratory failure patients. Crit Care Med. 2007;35(1):139–145.
- , . Rehabilitation quality improvement in an intensive care unit setting: implementation of a quality improvement model. Top Stroke Rehabil. 2010;17(4):271–281.
- , , , , . Sustainability and scalability of the hospital elder life program at a community hospital. J Am Geriatr Soc. 2011;59(2):359–365.
- , , , et al. A multicomponent intervention to prevent delirium in hospitalized older patients. N Engl J Med. 1999;340(9):669–676.
- , , , et al. Functional disability 5 years after acute respiratory distress syndrome. N Engl J Med. 2011;364(14):1293–1304.
- , , , et al. Rehabilitation therapy and outcomes in acute respiratory failure: an observational pilot project. J Crit Care. 2010;25(2):254–262.
- , , . Exercise for acutely hospitalised older medical patients. Cochrane Database Syst Rev. 2007;(1):CD005955.
- , , . Extra physical therapy reduces patient length of stay and improves functional outcomes and quality of life in people with acute or subacute conditions: a systematic review. Arch Phys Med Rehabil. 2011;92(9):1490–1500.
- , , , , , . Fewer emergency readmissions and better quality of life for older adults at risk of hospital readmission: a randomized controlled trial to determine the effectiveness of a 24‐week exercise and telephone follow‐up program. J Am Geriatr Soc. 2009;57(3):395–402.
- , , , , , . Effects of an acute care for elders unit on costs and 30‐day readmissions. JAMA Intern Med. 2013:1–7.
- , , , , . Risks of acute hospital transfer and mortality during stroke rehabilitation. Arch Phys Med Rehabil. 2003;84(5):712–718.
Federally mandated pay‐for‐performance initiatives promote minimizing 30‐day hospital readmissions to improve healthcare quality and reduce costs. Although the reasons for readmissions are multifactorial, many patients are readmitted for a condition other than their initial hospital admitting diagnosis.[1] Impairments in functional status experienced during acute care hospitalization contribute to patients being discharged in a debilitated state and being vulnerable to postdischarge complications and potentially hospital readmission.[2] As such, decreased functional status may be an important and potentially modifiable risk factor for acute care hospital readmission.[3]
Previous studies have suggested that impaired functional status may be an important predictor of rehospitalization.[4, 5, 6, 7] However, inferences from existing studies are limited because they did not consider functional status as their primary focus, they only considered specific patient populations (eg, stroke) or readmissions occurring well beyond the 30‐day period defined by federal pay‐for‐performance standards.[4, 5, 6, 8, 9, 10] Our objective was to evaluate the association between functional status near the time of discharge from acute care hospital and 30‐day readmission for patients admitted to an acute inpatient rehabilitation facility. As a secondary objective, we sought to investigate the relationship between functional status and readmission by diagnostic category (medical, neurologic, or orthopedic).
METHODS
Study Population and Setting
We conducted a single‐center, retrospective study of patients admitted to an inpatient rehabilitation facility at a community hospital between July 1, 2006 and December 31, 2012. This facility provides intensive rehabilitation consisting of 3 hours of therapy per day, skilled nursing care on a 24‐hour basis, and medical care by a physiatrist. We excluded patients who died during inpatient rehabilitation (n=15, 0.2%) and patients not admitted directly from an acute care setting (n=178, 2.0%).
Data Source and Covariates
Data were derived from the Uniform Data System for Medical Rehabilitation (UDSMR), which is an administrative database providing the following data upon admission to an inpatient rehabilitation facility[11, 12, 13]: age, gender, race/ethnicity, marital status, the discharge setting, the admission Functional Independence Measure (FIM) score (details further below), and admission diagnostic category as defined by the primary discharge diagnosis from the acute care hospital and grouped by functional related groups (a case‐mix system for medical rehabilitation).[12, 14] The 3M ClinTrac management software (3M, St. Paul, MN), used for mandatory reporting to the State of Maryland, provided all‐payerrefined diagnosis related group (APRDRG) and severity of illness (SOI) combinations (a tool to group patients into clinically comparable disease and severity‐of‐illness categories expected to use similar resources and experience similar outcomes). The University HealthSystem Consortium (UHC) database provided national readmission rates for all APRDRG‐SOI combinations using a methodology that has been previously described.[15, 16] Expected readmission rates for APRDRG‐SOI combinations served as a patient risk stratification tool based on clinical logic that evaluates age, comorbidities, principal diagnosis during hospitalization, and procedures conducted during hospitalization.[17]
Primary Outcome: Acute Care Readmission
The primary outcome was all‐cause acute care readmission, defined as patient transfer to an acute care hospital during inpatient rehabilitation within 30 days from admission to inpatient rehabilitation. The care model for our inpatient rehabilitation unit is such that when patients become sick or develop a complication, they are admitted directly to a clinical unit (eg, intensive care unit) at the community hospital through a rapid‐response intervention, or the physiatrist arranges with an admitting inpatient attending to accept the patient directly to his or her service.
Primary Exposure: Functional Independence Measure
Functional status was measured using the FIM score.[18] The FIM score is an 18‐item measure of functional status, with each item scored on a scale from 1 to 7 (dependent to independent). Various aspects of motor function and cognitive function are assessed. The FIM has been validated and shown to be reliable and reproducible.[13, 19, 20] By definition for the FIM instrument, admission FIM scores are assessed by trained multidisciplinary personnel first over the 72 hours of the rehabilitation stay, and for this study served as a proxy for patient functional status upon discharge from the acute care setting in our analysis. This 72‐hour time window allows for full assessment by therapists and nurses; however, in clinical practice at the inpatient rehabilitation unit involved in this study, much of the FIM assessment occurs within the first 24 hours of the rehabilitation stay. For our analysis, we divided FIM scores into low, medium, and high functional groups. The thresholds for these groups were based on total FIM score tertiles from a prior study<60, 60 to 76, and >76.[16] As a secondary analysis we created 6 subscales of the overall FIM score based on previous research. These subscales included: transfers (transfer to chair/wheelchair, toilet, and tub/shower), locomotion (walking and stairs), self‐care (eating, grooming, bathing, dressing, and toileting), sphincter control (bladder and bowel management), communication (comprehension and expression), and social cognition (social interaction, problem solving, and memory).[21]
Statistical Analysis
To evaluate differences in patient characteristics by diagnostic category, analysis of variance and 2 tests were used for continuous and dichotomous variables, respectively. Logistic regression was used to evaluate the association between FIM score category and readmission status, adjusting for potentially confounding variables available from the UDSMR and UHC databases. We used interaction terms to test whether the association between the FIM score and readmissions varied significantly across diagnostic categories and by age. As a secondary analysis, we modeled FIM score as a continuous variable. We expressed the odds ratio in this analysis per 10‐point change in FIM, because this represents a clinically relevant change in function.[22] Logistic regression was also used to evaluate the association between FIM subscale scores (transfers, locomotion, self‐care, sphincter control, communication, and social cognition) and readmission status. Statistical significance was defined as a 2‐sided P<0.05. Data were analyzed with R (version 2.15.0;
RESULTS
Readmitted Patients and Diagnostic Categories
A total of 9405 consecutive eligible patients were admitted to the acute inpatient rehabilitation facility between July 1, 2006 and December 31, 2012. A total of 1182 (13%) patients were readmitted back to an acute care hospital from inpatient rehabilitation. Median (interquartile range) time to readmission from acute care hospital discharge was 6 days (310 days), and median length of stay for patients who were discharged to the community from inpatient rehabilitation was 8 days (612 days).
Table 1 shows characteristics of all inpatient rehabilitation patients by diagnostic category. For the neurologic category, the most common primary diagnoses were stroke and spinal cord injury; for the medical category, infection, renal failure, congestive heart failure, and chronic obstructive pulmonary disease; and for the orthopedic category, spinal arthrodesis, knee and hip replacements. Mean FIM scores were lowest and highest for patients admitted with a primarily neurologic and orthopedic diagnosis, respectively.
| Characteristic | All Patients, N=9405 | Diagnostic Category | |||
|---|---|---|---|---|---|
| Neurologic, n=3706 | Medical, n=2135 | Orthopedic, n=3564 | P Valueb | ||
| |||||
| Age, y | 67.8 (14.2) | 66.7 (15.3) | 67.0 (14.9) | 69.3 (12.4) | <0.001 |
| Male | 4,068 (43%) | 1,816 (49%) | 1,119 (52%) | 1,133 (32%) | <0.001 |
| Race | <0.001 | ||||
| Caucasian | 6,106 (65%) | 2344 (63%) | 1,320 (62%) | 2,442 (69%) | |
| African American | 2,501 (27%) | 984 (27%) | 658 (31%) | 859 (24%) | |
| Other | 798 (8%) | 378 (10%) | 157 (7%) | 263 (7%) | |
| Married | 4,330 (46%) | 1,683 (45%) | 931 (44%) | 1,716 (48%) | 0.002 |
| APRDRG‐SOI expected readmission rate | 18.0 (7.4) | 20.5 (6.8) | 21.3 (7.5) | 13.5 (5.6) | <0.001 |
| Total admission FIM score | 68.7 (17.2) | 60.4 (18.6) | 69.1 (15.5) | 77.2 (11.7) | <0.001 |
FIM Score Category and Risk of Readmission
Figure 1 shows that patients in the low admission FIM score category had the highest unadjusted rate of readmission for each diagnostic category. In unadjusted analysis, Table 2 shows that younger age, male sex, APDRG‐SOI expected readmission rate, and orthopedic and medical diagnostic categories were associated with readmission. As a continuous variable, FIM scores were linearly associated with readmission (Figure 2), with an unadjusted odds ratio (OR) and 95% confidence interval (CI) of 1.4 (1.4‐1.4, P<0.001) for a 10‐point decrease in FIM. Compared to patients with high admission FIM scores, patients with low and middle FIM scores had higher unadjusted odds of readmission (OR: 4.0; 95% CI: 3.4‐4.7; P<0.001 and OR: 1.8; 95% CI: 1.5‐2.1; P<0.001, respectively). Mean FIM subscale scores for patients readmitted versus not readmitted were transfers (5.3 vs 7.0, P<0.001), locomotion (1.6 vs 2.3, P<0.001), self‐care (17.0 vs 20.8, P<0.001), communication (10.6 vs 11.5, P<0.001), and social cognition (15.1 vs 16.6, P<0.001).
| Bivariable Analysisb | Multivariable Analysisb | |||||
|---|---|---|---|---|---|---|
| Characteristic | All Patients, N=9405 | Readmitted, n=1,182 | OR (95% CI) | P Value | OR (95% CI) | P Value |
| ||||||
| Age, y | 68.0 (14.2) | 66.4 (14.5) | 0.9 (0.91.0) | <0.001 | 0.9 (0.91.0) | <0.001 |
| Male | 3,431 (42%) | 637 (54%) | 1.6 (1.41.8) | <0.001 | 1.3 (1.11.5) | < 0.001 |
| Race | ||||||
| Caucasian | 5,340 (65%) | 766 (65%) | 1.0 | 1.0 | ||
| African American | 2,177 (26%) | 324 (27%) | 1.0 (0.91.2) | 0.60 | 1.0 (0.81.1) | 0.75 |
| Other | 706 (9%) | 92 (8%) | 0.9 (0.71.1) | 0.41 | 0.8 (0.61.0) | 0.12 |
| Married | 3,775 (46%) | 555 (47%) | 1.0 (0.91.2) | 0.50 | 1.0 (0.91.2) | 0.67 |
| Admission diagnosis category | ||||||
| Neurologic | 3,205 (39%) | 501 (42%) | 1.0 | 1.0 | ||
| Medical | 1,726 (21%) | 409 (35%) | 1.5 (1.31.7) | <0.001 | 1.8 (1.62.1) | < 0.001 |
| Orthopedic | 3,292 (40%) | 272 (23%) | 0.5 (0.50.6) | <0.001 | 1.3 (1.11.6) | 0.005 |
| APDRG‐SOI expected readmission rate | 17.4 (7.1%) | 22.2 (8.0%) | 1.1 (1.11.1) | <0.001 | 1.1 (1.01.1) | < 0.001 |
| Total FIM score category | ||||||
| High FIM, >76 points | 3,517 (43%) | 257 (22%) | 1.0 | 1.0 | ||
| Middle FIM, 60points | 2,742 (33%) | 353 (30%) | 1.8 (1.52.1) | <0.001 | 1.5 (1.31.8) | < 0.001 |
| Low FIM, <60 points | 1,964 (24%) | 572 (48%) | 4.0 (3.44.7) | <0.001 | 3.0 (2.53.6) | < 0.001 |
Multivariable and Subset Analyses
Patients with a primary medical diagnosis had higher odds of readmission to the hospital, (OR: 1.8; 95% CI: 1.6‐2.1, P<0.001), relative to patients with a neurologic or orthopedic diagnosis (Table 2). Across all diagnoses, the adjusted odds ratios (95% CIs) for the low and middle versus high FIM score category were 3.0 (2.5‐3.6; P<0.001) and 1.5 (1.3‐1.8; P<0.001) respectively (Table 2). When modeled as a continuous variable, a 10‐point decrease in FIM score was associated with a significantly increased adjusted readmission rate (OR: 1.4; 95% CI: 1.3‐1.4; P<0.001). In adjusted analysis including all subscales of the FIM, only the physical subscales, transfers (P<0.001), locomotion (P=0.002), and self‐care (P<0.001), were significantly associated with readmission. For each diagnostic category, there were similar significant associations between admission FIM score group and readmission status (Table 3). The odds of readmission by FIM score did not differ significantly across the 3 major diagnostic categories (P=0.20 for interaction term), suggesting that the effect of functional status was similar across various types of patients. We also did not observe a statistical interaction between age and FIM score group in predicting readmission (P=0.58). Patients in the lowest FIM group with a medical diagnosis had the highest adjusted readmission rate of 28.7% (Table 3).
| Multivariable Analysisa | Adjusted Readmission Ratesb | |||
|---|---|---|---|---|
| No. | OR (95% CI) | P Value | % (95% CI) | |
| ||||
| Neurologic | ||||
| High FIM (>76 points) | 755 | 1.0 | 7.3 (4.710.0) | |
| Middle FIM (6076 points) | 1,283 | 1.4 (1.02.1) | 0.06 | 9.1 (7.011.1) |
| Low FIM (<60 points) | 1,668 | 3.3 (2.34.7) | <0.001 | 18.7 (16.820.6) |
| Medical | ||||
| High FIM (>76 points) | 807 | 1.0 | 11.2 (8.114.3) | |
| Middle FIM (6076 points) | 766 | 1.8 (1.32.4) | <0.001 | 17.7 (14.520.9) |
| Low FIM (<60 points) | 562 | 3.2 (2.44.3) | <0.001 | 28.7 (25.132.4) |
| Orthopedic | ||||
| High FIM (>76 points) | 2,212 | 1.0 | 6.1 (4.77.6) | |
| Middle FIM (6076 points) | 1,046 | 1.4 (1.11.9) | 0.02 | 8.3 (6.410.1) |
| Low FIM (<60 points) | 306 | 2.2 (1.53.3) | <0.001 | 13.5 (10.416.7) |
DISCUSSION
In this study of 9405 consecutive patients admitted from acute care hospitals to a single inpatient rehabilitation facility, we investigated the association between functional status and readmission to an acute care hospital. We found that low functional status near the time of acute care hospital discharge was strongly associated with higher readmission rates. This relationship was consistently observed across major patient diagnostic categories, with low functioning medical patients having the highest rate of readmission (28.7%). Efforts to maintain or improve functional status during acute care hospitalization may be an important modifiable risk factor for acute care hospital readmission.
Previous studies have suggested that functional status may serve as an indicator of physiological reserve, and therefore vulnerability to medical complications and readmission.[6, 16, 23, 24, 25] Physiologic reserve refers to a person's ability to endure acute illness and is influenced by a number of factors, such as the adequacy of oxygen delivery to tissues, cardiovascular health, immune state, and nutritional status.[26] We found that motor subscales of the FIM score (transfers, locomotion, and self‐care), but not the other subscales, were independently associated with readmissions, which may suggest that lower motor scores are a stronger marker of physiologic reserve.[10, 16, 27] Although not our primary focus, we did note in our multivariable models that after adjusting for functional status, patients in a medical diagnostic category had higher readmission rates compared to patients with a primary neurologic or orthopedic diagnosis, but the impact of FIM score was consistent across all these diagnostic categories. We speculate that medical conditions that result in hospitalization, such as sepsis or acute kidney failure, may be more likely to result in multiorgan dysfunction that may impair physiological reserve and increase susceptibility to medical complications.[28, 29, 30, 31] In comparison, acute neurologic and orthopedic diagnoses, such as stroke or hip arthroplasty, directly impair gross motor function,[32, 33, 34, 35] with relative sparing of overall physiologic reserve.
The association between low functional status and readmissions is supported by previous studies across multiple hospital settings.[4, 5, 7, 8, 9, 27, 36] Despite this finding, routine inpatient medical practice may not fully address functional impairments. For instance, systematic measurement and documentation of functional status on admission and during hospitalization are not routine and may be a barrier to identifying medical patients at high risk for readmission.[37, 38, 39] Moreover, without recognition of functional impairment and its implications, current clinical practice may suboptimally prevent and treat physical impairments during inpatient care. However, such barriers can be surmounted. For example, in the medical intensive care unit setting, there is growing recognition that proactive and aggressive management of hospital‐acquired functional impairments through early rehabilitation is safe and feasible, improving patient outcomes while reducing hospital costs and readmissions.[3, 40, 41, 42, 43, 44, 45, 46, 47, 48, 49, 50, 51] Moreover, 2 recent meta‐analyses have shown that physical therapy hospital‐based exercise programs can improve length of stay, overall hospital costs, and rates of discharge to home.[52, 53] Finally, a randomized trial has demonstrated that an individualized exercise regimen started in the acute hospital setting with long‐term telephone follow‐up can significantly reduce emergency hospital readmissions and improve quality of life in older adults.[54] Therefore, decreased functional status likely represents a modifiable risk factor for hospital readmission, and further research is necessary to more systematically identify low‐functioning patients and implement early mobility and activity programs to reduce hospital‐acquired functional impairment.[2, 49, 55]
Our analysis has potential limitations. First, this was an observational study and we are unable to demonstrate a direct cause‐and‐effect relationship between functional status and readmission. However, our results are consistent with prior literature in this field. Second, our cohort only included patients who were discharged from an acute hospital to a rehabilitation facility, which may limit its generalizability. However, we included a large patient sample size with a broad range of admission FIM scores, and our findings are consistent with other studies conducted in different clinical settings. Third, although 1 of our goals was to evaluate how readmission rates differed by diagnostic category, it is possible that individual diagnoses within each category may have different risks for readmission, and future larger studies could evaluate more detailed diagnostic grouping approaches. Fourth, we also recognize that although FIM score assessment has been validated, admission assessment occurs over a 72‐hour time period, during which patients' function could potentially change a clinically meaningful degree. Fifth, there may be residual confounding because of limitations in available data within our administrative dataset; however, we did account for severity of illness using a standardized measure, and prior research has demonstrated that the relationship between functional status and readmissions may be minimally confounded by demographic and clinical variables.[8, 16, 27, 56] Finally, we lacked readmission data following discharge from rehabilitation; it is possible that the association between FIM score at the time of rehabilitation initiation may have had limited predictive value among patients who successfully completed rehabilitation and were sent home.
CONCLUSION
In conclusion, in this study of patients admitted from acute care hospitals to a single inpatient rehabilitation facility, we observed a strong association between decreased functional status and increased hospital readmission. In particular, medical patients with lower physical functioning exhibited an especially high rate of readmission. Incorporating functional status assessment into routine medical care may help identify patients at higher risk of readmission. Moreover, preventing and treating impaired functional status during inpatient admission, through early activity and mobility, should be evaluated as a way of improving patient outcomes and reducing hospital readmissions.
Disclosures: Erik Hoyer, MD, is supported by the Rehabilitation Medicine Scientist Training Program (RMSTP; 5K12HD001097). The authors report no conflicts of interest.
- , , . Rehospitalizations among patients in the Medicare fee‐for‐service program. N Engl J Med. 2009;360(14):1418–1428.
- . Post‐hospital syndrome—an acquired, transient condition of generalized risk. N Engl J Med. 2013;368(2):100–102.
- , , , et al. Receiving early mobility during an intensive care unit admission is a predictor of improved outcomes in acute respiratory failure. Am J Med Sci. 2011;341(5):373–377.
- , . Association of physical functioning with same‐hospital readmission after stroke. Am J Phys Med Rehabil. 2004;83(6):434–438.
- , , , . Posthospital care transitions: patterns, complications, and risk identification. Health Serv Res. 2004;39(5):1449–1465.
- , , , , , . Risk factors for nonelective hospital readmissions. J Gen Intern Med. 1996;11(12):762–764.
- , , , et al. Risk prediction models for hospital readmission: a systematic review. JAMA. 2011;306(15):1688–1698.
- , , , et al. Hospital readmission in persons with stroke following postacute inpatient rehabilitation. J Gerontol A Biol Sci Med Sci. 2012;67(8):875–881.
- , , , , , . Hospital readmission of persons with hip fracture following medical rehabilitation. Arch Gerontol Geriatr. 2003;36(1):15–22.
- , , , , , . Characteristics of persons rehospitalized after stroke rehabilitation. Arch Phys Med Rehabil. 2001;82(10):1367–1374.
- , , , et al. A classification system for inpatient rehabilitation patients: a review and proposed revisions to the functional independence measure‐function related groups. PB98–105992, September. Washington, DC: US Department of Commerce, National Technical Information Services; 1997.
- , , , , , . A case‐mix classification system for medical rehabilitation. Med Care. 1994;32(4):366–379.
- , , , . The reliability of the functional independence measure: a quantitative review. Arch Phys Med Rehabil. 1996;77(12):1226–1232.
- , , , , , . Four methods for characterizing disability in the formation of function related groups. Arch Phys Med Rehabil. 1994;75(12):1277–1283.
- , , , et al. Association of self‐reported hospital discharge handoffs with 30‐day readmissions. JAMA Intern Med. 2013;173(8):624–629.
- , , , , , . Functional status impairment is associated with unplanned readmissions. Arch Phys Med Rehabil. 2013;94(10):1951–1958.
- , , , et al. All patient refined diagnosis related groups (APR‐DRGs). Version 15.0. Report No.: 98‐054 Rev. 00. Wallingford, CT: 3M Health Information Systems; 1998.
- The inpatient rehabilitation facility–patient assessment instrument (IRF‐PAI) training manual. 2012. http://www.cms.gov/.
- , , , et al. Relationships between disability measures and nursing effort during medical rehabilitation for patients with traumatic brain and spinal cord injury. Arch Phys Med Rehabil. 1997;78(2):143–149.
- , , , . Interrater reliability of the 7‐level functional independence measure (FIM). Scand J Rehabil Med. 1994;26(3):115–119.
- , , , , , . Comparison of logistic regression and neural networks to predict rehospitalization in patients with stroke. J Clin Epidemiol. 2001;54(11):1159–1165.
- , , . Comparison of the responsiveness of the Barthel Index and the motor component of the Functional Independence Measure in stroke: the impact of using different methods for measuring responsiveness. J Clin Epidemiol. 2002;55(9):922–928.
- , . Prediction of hospital readmission for heart failure: development of a simple risk score based on administrative data. J Am Coll Cardiol. 1999;33(6):1560–1566.
- , , . Are all readmissions bad readmissions? N Engl J Med. 2010;363(3):297–298.
- , . Hospital readmission as an accountability measure. JAMA. 2011;305(5):504–505.
- . Susceptibility to critical illness: reserve, response and therapy. Intensive Care Med. 2000;26(suppl 1):S57–S63.
- , , , , . Predictors of discharge to acute care after inpatient rehabilitation in severely affected stroke patients. Am J Phys Med Rehabil. 2012;91(5):387–392.
- , , , et al. Clinical characteristics and outcomes of sepsis‐related vs non‐sepsis‐related ARDS. Chest. 2010;138(3):559–567.
- , . Long‐term outcomes from sepsis. Curr Infect Dis Rep. 2007;9(5):382–386.
- , . Heart failure performance measures and outcomes: real or illusory gains. JAMA. 2009;302(7):792–794.
- , , , , . Patients' self‐assessed functional status in heart failure by new york heart association class: a prognostic predictor of hospitalizations, quality of life and death. J Card Fail. 2010;16(2):150–156.
- , , , et al. Knee arthroplasty: disabilities in comparison to the general population and to hip arthroplasty using a French national longitudinal survey. PLoS One. 2008;3(7):e2561.
- , , , et al. Gait asymmetry in community‐ambulating stroke survivors. Arch Phys Med Rehabil. 2008;89(2):304–310.
- , , , . Recovery of upper extremity function in stroke patients: The Copenhagen Stroke Study. Arch Phys Med Rehabil. 1994;75(4):394–398.
- , , , , , . The effect of admission physiological variables on 30 day outcome after stroke. J Clin Neurosci. 2005;12(8):905–910.
- , , , et al. Unplanned readmissions after hospital discharge among patients identified as being at high risk for readmission using a validated predictive algorithm. Open Med. 2011;5(2):e104–e111.
- . Can hospitalization‐associated disability be prevented? JAMA. 2011;306(16):1800–1801.
- , , . Hospitalization‐associated disability: “she was probably able to ambulate, but I'm not sure.” JAMA. 2011;306(16):1782–1793.
- , , , , , . Importance of functional measures in predicting mortality among older hospitalized patients. JAMA. 1998;279(15):1187–1193.
- . Mobilizing patients in the intensive care unit: improving neuromuscular weakness and physical function. JAMA. 2008;300(14):1685–1690.
- , , . Technology to enhance physical rehabilitation of critically ill patients. Crit Care Med. 2009;37(10 suppl):S436–S441.
- , , , et al. Early physical medicine and rehabilitation for patients with acute respiratory failure: a quality improvement project. Arch Phys Med Rehabil. 2010;91(4):536–542.
- , , , et al. ICU early physical rehabilitation programs: financial modeling of cost savings. Crit Care Med. 2013;41(3):717–724.
- , , , et al. Early physical and occupational therapy in mechanically ventilated, critically ill patients: a randomised controlled trial. Lancet. 2009;373(9678):1874–1882.
- , , , et al. Early intensive care unit mobility therapy in the treatment of acute respiratory failure. Crit Care Med. 2008;36(8):2238–2243.
- , , , et al. Early activity is feasible and safe in respiratory failure patients. Crit Care Med. 2007;35(1):139–145.
- , . Rehabilitation quality improvement in an intensive care unit setting: implementation of a quality improvement model. Top Stroke Rehabil. 2010;17(4):271–281.
- , , , , . Sustainability and scalability of the hospital elder life program at a community hospital. J Am Geriatr Soc. 2011;59(2):359–365.
- , , , et al. A multicomponent intervention to prevent delirium in hospitalized older patients. N Engl J Med. 1999;340(9):669–676.
- , , , et al. Functional disability 5 years after acute respiratory distress syndrome. N Engl J Med. 2011;364(14):1293–1304.
- , , , et al. Rehabilitation therapy and outcomes in acute respiratory failure: an observational pilot project. J Crit Care. 2010;25(2):254–262.
- , , . Exercise for acutely hospitalised older medical patients. Cochrane Database Syst Rev. 2007;(1):CD005955.
- , , . Extra physical therapy reduces patient length of stay and improves functional outcomes and quality of life in people with acute or subacute conditions: a systematic review. Arch Phys Med Rehabil. 2011;92(9):1490–1500.
- , , , , , . Fewer emergency readmissions and better quality of life for older adults at risk of hospital readmission: a randomized controlled trial to determine the effectiveness of a 24‐week exercise and telephone follow‐up program. J Am Geriatr Soc. 2009;57(3):395–402.
- , , , , , . Effects of an acute care for elders unit on costs and 30‐day readmissions. JAMA Intern Med. 2013:1–7.
- , , , , . Risks of acute hospital transfer and mortality during stroke rehabilitation. Arch Phys Med Rehabil. 2003;84(5):712–718.
© 2014 Society of Hospital Medicine

Functional Status
Hospital readmission is not a new problem, but ever since the Centers for Medicaid and Medicare Services (CMS) announced that hospital reimbursement would be linked to readmission rates, the quest to understand drivers of this outcome has taken on new and remarkable vigor. Despite the avalanche of new studies on readmission factors[1] and transition interventions,[2, 3] surprisingly few have focused on conditions more prevalent in the aging Medicare population such as functional limitations. This trend in the literature reflects what is perhaps the greatest irony of the CMS readmission policy itself: while focused on improving care for a predominantly over 65‐year‐old population, it is agnostic to core geriatric vulnerabilities like function and cognition.
In this issue of the Journal of Hospital Medicine, Hoyer and colleagues take an important first step toward exploring such vulnerabilities.[4] Although it may not surprise many hospitalists that these play a role in complex outcomes such as readmission, the effects reported here are striking. The odds for readmission were 300% higher for patients with the lowest functional scores compared to those with highest scores after adjusting for other known factors such as comorbidities, age, and severity of illness. In terms of readmission rates, 29% of functionally impaired medical patients were readmitted compared to 11% of those with high function. Similar but less profound trends were seen in patients discharged from neurology and orthopedic services.
Although this was a single‐site study, and functional assessments were made on admission to an acute rehabilitation facility after hospital discharge, these findings are compelling and suggest many important areas for future research. First, these results suggest a need for replication in nationally representative data to better understand their scope and generalizability. Certainly, the number of participants (9405 patients) gives this study plenty of power; however, the sample is limited in that presumably all patients had some level of functional decline, but enough potential for functional recovery to warrant discharge to acute rehabilitation. We do not know what effects functional limitations might have on patients discharged to other settings (eg, community with home rehabilitation or skilled nursing facility with rehabilitation). Thus, future research should examine whether the impact of functional limitations described in this sample applies to the larger universe of hospital discharges.
We also do not know anything about the functional status of these patients at admission or their functional trajectory prior to hospitalization, which limits conclusions about whether the disabilities observed were hospital acquired. Functional ability, like vital signs, can be quite variable during the course of acute illness and should be interpreted in the context of each patient's baseline. The functional trajectory for a patient who was impaired at the time of hospital discharge, but independent before hospitalization, is likely very different than one who was chronically impaired at baseline. Thus, postdischarge is only half the story at best, and future research should explore the functional status and trajectory of patients before admission too.
Finally, to assess functional status, the authors of this study used the Functional Independence Measure (FIM) score, a well‐validated instrument used in rehabilitation facilities. One advantage of using this measure to predict readmission is that in addition to 12 items that assess physical domains overlapping with the Activities of Daily Living (ADL) measures commonly used in hospitals, it also includes 5 items about cognition and thus gives an overall view of both physical and mental status in context of functional ability. On the down side, the FIM score is less well known in the acute care setting and does not include instrumental ADLs, such as shopping, housekeeping, food preparation/cleanup, telephone, transportation, and technology like computers, that are often important for patients returning home. Given the interesting findings by Hoyer et al., future research should explore possible associations with these activities in patients discharged to community as well.
The results by Hoyer et al. also have important implications for policy and practice. At the level of national policy and ongoing healthcare reform, Medicare should consider ways to incentivize hospitals to collect data on functional status of patients more consistently. Currently, there is no International Classification of Diseases, 9th Revision code to capture functional limitation during hospitalization as a diagnosis or comorbidity (whether hospital acquired or not), which precludes any discussion about including functional status as an adjustor in the current CMS model for expected readmission rates for hospitals. Regardless of CMS policy and performance incentives or penalties, a lot more could be done at the level of hospital policy and practice to improve screening for functional vulnerabilities on admission and prior to discharge. Although this may require greater investment in standardizing physical therapy evaluation for most patients (especially those over 65 years old), the increased readmission rates found by Hoyer et al. in functionally impaired patients suggest it would be penny wise but pound foolish not to do so. In other words, if hospitals want to reduce their readmission rates by identifying and intervening on high‐risk patients, identifying functionally impaired patients seems to be the low‐hanging fruit.
In summary, Hoyer and colleagues have made an important contribution to the ever‐expanding literature on readmission risk factors, but they have likely just identified the tip of the iceberg. As Medicare enrollment continues to climb with the growth of baby boomers over 65 years old, the demand for acute care in older adults will continue to grow.[5] Moreover, as pressure mounts to improve the quality and reduce the costs of hospital care, greater understanding of geriatric vulnerabilities in this population will be increasingly important.
- , , , et al. Risk prediction models for hospital readmission: a systematic review. JAMA. 2011;306(15):1688–1698.
- , , , , . Interventions to reduce 30‐day rehospitalization: a systematic review. Ann Intern Med. 2011;155(8):520–528.
- , , , , , . Hospital‐initiated transitional care interventions as a patient safety strategy: a systematic review. Ann Intern Med. 2013;158:433–440.
- et al. J Hosp Med. 2014;9(5):277–282.
- et al. US population aging and demand for inpatient services. J Hosp Med. 2014;9(3):193–196.
Hospital readmission is not a new problem, but ever since the Centers for Medicaid and Medicare Services (CMS) announced that hospital reimbursement would be linked to readmission rates, the quest to understand drivers of this outcome has taken on new and remarkable vigor. Despite the avalanche of new studies on readmission factors[1] and transition interventions,[2, 3] surprisingly few have focused on conditions more prevalent in the aging Medicare population such as functional limitations. This trend in the literature reflects what is perhaps the greatest irony of the CMS readmission policy itself: while focused on improving care for a predominantly over 65‐year‐old population, it is agnostic to core geriatric vulnerabilities like function and cognition.
In this issue of the Journal of Hospital Medicine, Hoyer and colleagues take an important first step toward exploring such vulnerabilities.[4] Although it may not surprise many hospitalists that these play a role in complex outcomes such as readmission, the effects reported here are striking. The odds for readmission were 300% higher for patients with the lowest functional scores compared to those with highest scores after adjusting for other known factors such as comorbidities, age, and severity of illness. In terms of readmission rates, 29% of functionally impaired medical patients were readmitted compared to 11% of those with high function. Similar but less profound trends were seen in patients discharged from neurology and orthopedic services.
Although this was a single‐site study, and functional assessments were made on admission to an acute rehabilitation facility after hospital discharge, these findings are compelling and suggest many important areas for future research. First, these results suggest a need for replication in nationally representative data to better understand their scope and generalizability. Certainly, the number of participants (9405 patients) gives this study plenty of power; however, the sample is limited in that presumably all patients had some level of functional decline, but enough potential for functional recovery to warrant discharge to acute rehabilitation. We do not know what effects functional limitations might have on patients discharged to other settings (eg, community with home rehabilitation or skilled nursing facility with rehabilitation). Thus, future research should examine whether the impact of functional limitations described in this sample applies to the larger universe of hospital discharges.
We also do not know anything about the functional status of these patients at admission or their functional trajectory prior to hospitalization, which limits conclusions about whether the disabilities observed were hospital acquired. Functional ability, like vital signs, can be quite variable during the course of acute illness and should be interpreted in the context of each patient's baseline. The functional trajectory for a patient who was impaired at the time of hospital discharge, but independent before hospitalization, is likely very different than one who was chronically impaired at baseline. Thus, postdischarge is only half the story at best, and future research should explore the functional status and trajectory of patients before admission too.
Finally, to assess functional status, the authors of this study used the Functional Independence Measure (FIM) score, a well‐validated instrument used in rehabilitation facilities. One advantage of using this measure to predict readmission is that in addition to 12 items that assess physical domains overlapping with the Activities of Daily Living (ADL) measures commonly used in hospitals, it also includes 5 items about cognition and thus gives an overall view of both physical and mental status in context of functional ability. On the down side, the FIM score is less well known in the acute care setting and does not include instrumental ADLs, such as shopping, housekeeping, food preparation/cleanup, telephone, transportation, and technology like computers, that are often important for patients returning home. Given the interesting findings by Hoyer et al., future research should explore possible associations with these activities in patients discharged to community as well.
The results by Hoyer et al. also have important implications for policy and practice. At the level of national policy and ongoing healthcare reform, Medicare should consider ways to incentivize hospitals to collect data on functional status of patients more consistently. Currently, there is no International Classification of Diseases, 9th Revision code to capture functional limitation during hospitalization as a diagnosis or comorbidity (whether hospital acquired or not), which precludes any discussion about including functional status as an adjustor in the current CMS model for expected readmission rates for hospitals. Regardless of CMS policy and performance incentives or penalties, a lot more could be done at the level of hospital policy and practice to improve screening for functional vulnerabilities on admission and prior to discharge. Although this may require greater investment in standardizing physical therapy evaluation for most patients (especially those over 65 years old), the increased readmission rates found by Hoyer et al. in functionally impaired patients suggest it would be penny wise but pound foolish not to do so. In other words, if hospitals want to reduce their readmission rates by identifying and intervening on high‐risk patients, identifying functionally impaired patients seems to be the low‐hanging fruit.
In summary, Hoyer and colleagues have made an important contribution to the ever‐expanding literature on readmission risk factors, but they have likely just identified the tip of the iceberg. As Medicare enrollment continues to climb with the growth of baby boomers over 65 years old, the demand for acute care in older adults will continue to grow.[5] Moreover, as pressure mounts to improve the quality and reduce the costs of hospital care, greater understanding of geriatric vulnerabilities in this population will be increasingly important.
- , , , et al. Risk prediction models for hospital readmission: a systematic review. JAMA. 2011;306(15):1688–1698.
- , , , , . Interventions to reduce 30‐day rehospitalization: a systematic review. Ann Intern Med. 2011;155(8):520–528.
- , , , , , . Hospital‐initiated transitional care interventions as a patient safety strategy: a systematic review. Ann Intern Med. 2013;158:433–440.
- et al. J Hosp Med. 2014;9(5):277–282.
- et al. US population aging and demand for inpatient services. J Hosp Med. 2014;9(3):193–196.
No Benefits to Therapeutic Hypothermia for Severe Bacterial Meningitis
Clinical question
Can therapeutic hypothermia improve functional outcomes in comatose patients with severe bacterial meningitis?
Bottom line
For critically ill patients with severe bacterial meningitis, induced hypothermia using intravascular cooling or other cooling techniques does not improve outcomes and may lead to increased mortality. This trial was stopped early and thus lacked the statistical power to make definitive conclusions about the potential harmful effects of this intervention. (LOE = 1b-)
Reference
Mourvillier B, Tubach F, van de Beek D, et al. Induced hypothermia in severe bacterial meningitis: A randomized clinical trial. JAMA 2013;310(20):2174-2183.
Study design
Randomized controlled trial (nonblinded)
Funding source
Industry + govt
Allocation
Concealed
Setting
Inpatient (ICU only)
Synopsis
Adult patients with suspected or confirmed bacterial meningitis who had a Glasgow Coma Scale (GCS) score of less than 8 for fewer than 12 hours were randomized, using concealed allocation, into the induced hypothermia group or to usual care. All patients received appropriate antimicrobial therapy. In the hypothermia group, intravascular cooling was achieved by a loading dose of 1500 mL 40C saline over 30 minutes, and additional 500 mL boluses over 10 minutes as needed, to achieve a temperature of 33.50C or lower. Other cooling techniques, including ice packs, cooling air, and cooling pads, were also used. Temperatures were maintained between 32C and 34C for 48 hours, and the rewarming phase was passive. Baseline characteristics in the intervention group and control group were similar: mean age was 59 years, median GCS score was 7, all patients were mechanically ventilated, and the causative organism was identified as Streptococcus pneumoniae in the majority of patients. Analysis was by intention to treat. The primary outcome was the score on the Glasgow Outcome Scale. A favorable outcome was a score of 5, indicating mild or no disability; an unfavorable outcome was any score 1 through 4, with 1 indicating death. At 3 months, there was a trend toward unfavorable outcomes in the hypothermia group (86% vs 73% in the control group; relative risk = 1.17; 0.95-1.43; P = .13), as well as a trend toward increased mortality (hazard ratio = 1.76; 0.89-3.45; P = .10). The trial was stopped early because of the higher mortality in the hypothermia group.
Dr. Kulkarni is an assistant professor of hospital medicine at Northwestern University in Chicago.
ACP Guidelines on Treatment of Anemia in Patients With Heart Disease
Clinical question
How should anemia and iron deficiency be treated in adults with heart disease?
Bottom line
For hospitalized patients with anemia and coronary heart disease, the American College of Physicians recommends a restrictive transfusion strategy and a trigger hemoglobin of 7 g/dL to 8 g/dL. Furthermore, erythropoiesis-stimulating agents (ESAs) should be avoided in patients with coronary heart disease or congestive heart failure and mild to moderate anemia. Evidence regarding intravenous iron for this patient population is inconclusive. (LOE = 1a)
Reference
Kansagara D, Dyer E, Englander H, Fu R, Freeman M, Kagen D. Treatment of anemia in patients with heart disease: A systematic review. Ann Intern Med 2013;159(11):746-757. Qaseem A, Humphrey LL, Fitterman N, Starkey M, Shekelle P; Clinical Guidelines Committee of the American College of Physicians. Treatment of anemia in patients with heart disease: A clinical practice guideline from the American College of Physicians. Ann Intern Med 2013;159(11):770-779.
Study design
Practice guideline
Funding source
Government
Allocation
Uncertain
Setting
Various (meta-analysis)
Synopsis
The American College of Physicians developed this guideline based on a systematic review of the literature that evaluated the benefits and harms of anemia treatment in adults with heart disease. The authors searched multiple databases including MEDLINE and the Cochrane Library, to identify trials that studied the effects of blood transfusions, ESAs, and iron in patients with anemia and congestive heart failure or coronary heart disease. Observational transfusion studies were also included. Two reviewers independently assessed studies for inclusion, extracted data, and assessed study quality. Data was combined for meta-analysis when possible. Although it was low-quality evidence, liberal transfusion strategies as compared with restrictive strategies in treating anemia showed no effect on mortality for patients with heart disease. Moderate-strength to high-strength evidence from the ESA studies also showed no benefit, but did show a potential for harm, including an increased risk of venous thromboembolism. Finally, although few studies evaluated intravenous iron therapy, one good-quality study showed that it increased short-term exercise tolerance and quality of life in patients with heart failure. Based on these findings, the American College of Physicians guideline committee makes the following recommendations: (1) Use a restrictive red blood cell transfusion strategy with a hemoglobin threshold of 7 g/dL to 8 g/dL in hospitalized patients with coronary heart disease; and (2) avoid ESAs in patients with mild to moderate anemia and congestive heart failure or coronary heart disease. Because of lack of evidence regarding long-term outcomes and possible harms, as well as limited overall data, there was no recommendation made regarding the use of intravenous iron.
Dr. Kulkarni is an assistant professor of hospital medicine at Northwestern University in Chicago.