User login
Sports concussion: A return-to-play guide
• Prohibit sports participation as long as a patient exhibits concussive symptoms after a head injury. C
• Evaluate a patient’s balance and cognitive function to help gauge the severity of concussion and the likely delay in a return to sports activity. C
• Use a stepwise protocol in returning an asymptomatic patient to full sports activity. C
Strength of recommendation (SOR)
A Good-quality patient-oriented evidence
B Inconsistent or limited-quality patient-oriented evidence
C Consensus, usual practice, opinion, disease-oriented evidence, case series
CASE KD is an 18-year-old high school basketball player who was knocked backwards during a game, hitting her head on the floor. She had immediate head and neck pain but no loss of consciousness; she was transported by EMS to the local emergency department (ED) for further evaluation. Results of head and neck CT scans were normal, and she was discharged home. Four days later, KD’s parents brought her to our office because she was experiencing ongoing headache, phonophobia, nausea, light-headedness, poor balance, increased sleepiness, and irritability.
The Centers for Disease Control and Prevention estimate that approximately 300,000 sports concussions occur yearly in the United States,1 and that 135,000 of these cases are treated in EDs.2 These numbers have not gone unnoticed in the consumer press. Over the past 18 months, Sports Illustrated, Newsweek, and Time3-5 have published stories on sports-related concussion, helping to raise public awareness of its risks.
Recommendations for practitioners have changed. In 1997, the American Academy of Neurology6 published one-size-fits-all guidelines on managing concussion, using levels of symptomatology and loss of consciousness to grade the severity of concussion from 1 to 3. These guidelines were similar to the Cantu and Colorado guidelines of the early 1990s.7,8 Since then, however, the diagnostic criteria and expert opinion about treatment and return to physical activity have changed. Indeed, several medical organizations9-12 now recommend a more individualized approach to evaluation and management, which we describe here.
It begins with a definition
While there is no single agreed-upon characterization of “concussion,” the 3rd International Conference on Concussion in Sport (ICCS)12 provides this definition:
Concussion is defined as a complex pathophysiological process affecting the brain, induced by traumatic biomechanical forces. Several common features that incorporate clinical, pathologic, and biomechanical injury constructs that may be utilized in defining the nature of a concussive head injury include:
- Concussion may be caused either by a direct blow to the head, face, or neck or a blow elsewhere on the body with an ‘‘impulsive’’ force transmitted to the head.
- Concussion typically results in the rapid onset of short-lived impairment of neurologic function that resolves spontaneously.
- Concussion may result in neuropathological changes but the acute clinical symptoms largely reflect a functional disturbance rather than a structural injury.
- Concussion results in a graded set of clinical symptoms that may or may not involve loss of consciousness. Resolution of the clinical and cognitive symptoms typically follows a sequential course.… In a small percentage of cases, however, postconcussive symptoms may be prolonged.
- No abnormality on standard structural neuroimaging studies is seen in concussion.
Office evaluation
Obtain a thorough history and conduct a neurologic evaluation and musculoskeletal examination of the head and neck.
Clues to expected length of recovery
A patient with a concussion may lose consciousness after the impact, or have a brief convulsion that is not a seizure.13 In the periodimmediately after the injury, the patient may exhibit a constellation of such signs and symptoms as headache, confusion, a dazed look, dilated pupils, amnesia, poor balance, nausea, or vomiting. These features typically resolve over time, but may persist for weeks or months. Anterograde or retrograde amnesia may also occur. TABLE 1 details a more complete list of concussion symptoms. If the patient is a child or young adult, it is useful to have a parent present at the office visit to describe the patient’s mood, sleep, appetite, and overall health after the injury.
Factors that may portend a longer recovery include a previous concussion, retrograde or anterograde amnesia, younger age, and female sex.14
Dire problems beyond concussion. Complaints or historical elements inconsistent with concussion that should be considered red flags include any focal neurologic complaints, vomiting or headache that worsens after a period of improvement, or obtundation or disorientation that has worsened since the injury. With such findings, consider more serious head injuries and arrange for a more complete immediate neurologic work-up.
CASE Our neurologic examination yielded normal results. However, our patient was unable to balance correctly on one leg. The cognitive exam revealed a deficit in short-term memory. We diagnosed a concussion, advised her to refrain from sports, and prescribed cognitive rest. A return to school for half days would be considered once her symptoms began to resolve.
TABLE 1
Signs and symptoms commonly associated with concussion
| Headache “Pressure in head” Neck pain Nausea or vomiting Dizziness Blurred vision Balance problems | Sensitivity to light Sensitivity to noise Feeling slowed down Feeling like “in a fog” “Don’t feel right” Difficulty concentrating Difficulty remembering | Fatigue or low energy Confusion Drowsiness Trouble falling asleep Irritability Sadness Nervousness or anxiety |
| Adapted from SCAT2 in Appendix 1 of: McCrory P, Meeuwisse W, Johnston K, et al. Br J Sports Med. 2009;43(suppl 1):i76-i90.12 | ||
Options for the neurologic exam
With a simple concussion, expect a normal neurologic examination, with the possible exception of the ability to balance. Head imaging is not necessary in the setting of suspected concussion, because results of computed tomography (CT) and magnetic resonance imaging (MRI) will likely be normal.12
Balance testing can assist in the diagnosis of concussion and the monitoring of recovery from injury.15-17 The Balance Error Scoring System (BESS)15 is a validated and simple test that can be done in the office. The test involves 3 consecutive stances: (a) normal stance with feet comfortably apart and hands on hips, (b) with feet aligned heel to toe with the dominant leg in front, and (c) standing on the nondominant leg with the dominant leg flexed 30 degrees at the hip. Have the patient repeat each version of the test for 20 seconds with eyes closed, on a stable and then unstable surface (eg, foam mat).
It’s recommended that another staff member be present to spot the patient in case of a fall. A link to a complete description of the test and scoring details is provided in the Web resources box.
Assess cognitive function. One tool for assessing cognitive function is the Sports Concussion Assessment Tool 2 (SCAT2).12 SCAT2 includes newer, as yet unvalidated sections and several sections that have been independently studied and proven useful in diagnosing concussion. Validated sections are the Maddocks questions, used only at the time and place of injury18 ; the modified BESS15 ; and the Standardized Assessment of Concussion (SAC).19 The SCAT2 and the SAC (which may be used separately) include questions that assist in evaluating short-term memory and attention, and are useful in the physician’s office.
Do computer-based tools help? Another option for cognitive assessment is computer-based neuropsychologic testing developed specifically for use with suspected concussion. Any of these programs can be used in the office by a trained practitioner. Schools may also use the programs under the supervision of an athletic trainer or team physician. Available programs are ImPACT, developed by the University of Pittsburgh (http://impacttest.com); the Cognitive Stability Index (CSI), by HeadMinder (http://www.headminder.com/site/csi/home.html); and the Computerized Cognitive Assessment Tool (CCAT), by CogState/Axon Sports (http://www.axonsports.com). Multiple studies have shown such programs to be useful in diagnosing and monitoring recovery from sports concussion.20-23
However, among sports medicine practitioners, there seems to be a consensus that computer-based neuropsychologic testing is most useful when a baseline score exists. Baseline testing is usually done preseason on athletes in a healthy state. If a baseline score is not available, a patient’s postinjury score is compared with normative data produced by the developer of the individual test.
Few, if any, outcome studies have been conducted to determine whether computer-basedneuropsychologic testing provides any meaningful improvement in the care of athletes who have suffered concussions. There is also concern that few studies by independent sources have replicated the data disseminated by developers of the tests.24,25 The most recent guidelines by the 3rd ICCS recommend using neuropsychologic testing only as an aid to an overall medical evaluation, not as the sole determinant of recovery from concussion.12 Numerous studies now underway may help clarify the role of neuropsychologic testing in concussion.
CASE By the time of our follow-up exam 7 days later (11 days from injury), KD had returned to school for half days, but her phonophobia and headaches worsened at school and she had difficulty focusing on academic tasks. Neurologic, balance, and cognitive exams were all normal. We advised her to gradually return to school full time while abstaining from sporting activity.
At 16 days’ follow-up (20 days from injury), KD had returned to school full time and said she felt more like herself, although she continued to have daily headaches and phonophobia. All exam results were normal. Sports were still off limits, and we told her to expect at least 7 more days of respite before any return to exercise would be allowed.
At 23 days’ follow-up (27 days from injury), KD’s symptoms had completely resolved, and all exam results were normal. We prescribed a stepwise return to athletic activity over the next 10 days and discussed this plan with the school’s athletic trainer, who would supervise her return to play.
American Academy of Neurology (AAN). Position Statement on Sports Concussion. http://www.aan.com/globals/axon/assets/7913.pdf
American Academy of Pediatrics (AAP). Sports-Related Concussion in Children and Adolescents. http://pediatrics.aappublications.org/cgi/content/abstract/126/3/597
The Balance Error Scoring System (BESS). http://www.sportsconcussion.com/pdf/management/BESSProtocolNATA09.pdf
Centers for Disease Control and Prevention. Concussion and Mild TBI. http://www.cdc.gov/concussion/index.html
Sport Concussion Assessment Tool 2 (SCAT2). http://www.athletictherapy.org/en/pdf/SCAT2.pdf
3rd International Conference on Concussion in Sport. http://bjsm.bmj.com/content/43/Suppl_1/i76.full
Individualize management
The one-size-fits-all approach previously recommended6 is no longer the standard of care. In your initial encounter with the patient (and parents, as appropriate), explain the nature of the injury, expected course of recovery, and requirements for a return to play. Also discuss the possibility of postconcussive syndrome and the risk of rare sequelae such as second impact syndrome.
If the patient is symptomatic or exhibits examination findings consistent with concussion, recommend immediate cessation of sports activity.9-12 With a school-aged athlete, if symptoms reported by the patient or parents are significant, consider prescribing cognitive rest, which can be provided through quiet accommodations at school or perhaps even time off from school or exams.12,24 In the early period of recovery, increased cognitive or physical activity can cause symptoms to worsen. With improvement, the patient may return to school half time to lessen the chance of a significant return of symptoms. If half days are tolerated, the patient may transition to full days. Make sure the diagnosis and expectations for recovery are communicated to the appropriate school officials so that necessary accommodationscan be made. If symptoms after the initial office visit are mild, a one-week return to school is appropriate to evaluate the patient’s recovery.
Allowing a return to sports. Once the patient is asymptomatic, and physical and cognitive test results are normal, discuss a return-to-play protocol with the patient (and with parents and athletic trainer or coach, as appropriate). Multiple sources10,11,26 now recommend a stepwise return to play, as detailed by the 3rd ICCS ( TABLE 2 ).12 Increase or decrease the length of the protocol depending on the patient and the specifics of the case.
There is little science to guide the treatment of children with concussion. However, given that their brains are still developing, it’s prudent to be more conservative than with older adolescents or adults. Multiple sources apart from the 3rd ICCS agree with this recommendation. Several authors suggest more cognitive rest and a longer return-to-play protocol in all cases.10,27 In fact, the ICCS committee additionally recommends observing a symptom-free waiting period for pediatric athletes before even starting a return-to-play protocol.
McCrory et al26 suggest that children under age 15 be treated more conservatively than those 15 and older. They suggest treating those 15 and older with the protocol for older adolescents. Specifying an age at which one should always make a decision for or against conservative care can be problematic. However, based on the recommendations above, it would seem reasonable to provide conservative treatment for children younger than high school age and perhaps even those in the early years of high school.
Consider legal implications. Become familiar with state laws that require certain steps in managing sports concussion. The Web site http://www.sportsconcussions.org/laws.html28 lists states with sports concussion statutes, as well as states with bills working their way through the legislative system. Currently, 29 states are listed with laws; 14 more and the District of Columbia have pending legislation.
TABLE 2
Stepwise protocol for return to play
| If symptoms recur at any step, have patient return to prior level | |
| 1. Light aerobic activity | Walking, swimming, exercise bike; keeping exertion <70% of maximum heart rate |
| 2. Sport-specific exercises | Exertional drills in sport, eg, running drills in football/soccer, skating drills in hockey |
| 3. Noncontact training drills | Progression to more complex noncontact drills, eg, passing/catching drills in football, shooting/passing in basketball, hitting drills in volleyball |
| 4. Full-contact practice | Return to full practice if no recurrence of symptoms through first 3 steps and cleared by physician |
| 5. Game activity | Return to full sport participation if no recurrence of symptoms with above steps |
| Adapted from: McCrory P, Meeuwisse W, Johnston K, et al. Br J Sports Med. 2009;43(suppl 1):i76-i90.12 | |
Anticipate complications
Most patients with concussions who are managed appropriately do well. However, complications can occur. The most serious complication is second impact syndrome, which usually occurs when concussion is unrecognized or not well managed. While not well understood, this condition is thought to result from a sudden increase in intracranial pressure after a second head injury in an athlete already suffering from concussion symptoms. The injury typically results in serious long-term neurologic deficits, or even fatality.29 Second impact syndrome has been documented as occurring in the same game after an initial injury, as well as in subsequent games.29
A more common, but less serious, complication is postconcussion syndrome.30 This is an ill-defined condition in which the patient suffers from concussive symptoms for an extended period of time, generally for more than 3 months.30 As with acute concussion, the constellation of symptoms ranges from headache to cognitive impairment. In cases of postconcussion syndrome, it is appropriate to consult with neuropsychologists, psychiatrists, or neurologists for assistance with symptoms and associated mood disorders. Similar to acute concussion management, it is generally recommended that athletes not be cleared to resume play while struggling with the symptoms of postconcussion syndrome.30
There have also been recent reports of late-life sequelae in those who have sustained multiple concussions. Depression and dementia have been suggested in surveys of retired NFL players.31,32 There have also been studies both suggesting14 and questioning33,34 whether multiple concussions result in long-term cognitive deficits. While the evidence available at this time is not firm, there seems to be an increasing belief that multiple concussions can affect long-term cognitive abilities. For these reasons, use caution in making return-to-play decisions for patients with multiple concussions or concussions with long-lasting symptoms.
CORRESPONDENCE Aaron M. Lear, MD, 224 West Exchange Street, Suite 440, Akron, OH 44302; aaron.lear@akrongeneral.org
1. CDC. Sports-related recurrent brain injuries—United States. MMWR Morb Mortal Wkly Rep. 1997;46:224-227.
2. CDC. Brain injury awareness month—March 2010. MMWR Morb Mortal Wkly Rep. 2010;59:235.-
3. Epstein D. The damage done. Sports Illustrated. November 1, 2010:42. Available at: http://sportsillustrated.cnn.com/vault/article/magazine/MAG1176377/index.htm. Accessed May 16, 2012.
4. Kliff S. Heading off sports injuries. Newsweek. February 4, 2010. Available at: http://www.newsweek.com/2010/02/04/heading-off-sports-injuries.html. Accessed February 9, 2011.
5. Kluger J. Headbanger nation. Health special: kids and concussions. Time. February 3, 2011. Available at: http://www.time.com/time/specials/packages/article/0,28804,2043395_2043506_2043494,00.html. Accessed February 9, 2011.
6. American Academy of Neurology. Practice parameter: the management of concussion in sports (summary statement). Report of the quality standards subcommittee. Neurology. 1997;48:581-585.
7. Cantu R. Cerebral concussion in sport. Management and prevention. Sports Med. 1992;14:64-74.
8. Kelly J, Nichols J, Filley C, et al. Concussion in sports. Guidelines for the prevention of catastrophic outcome. JAMA. 1991;266:2867-2869.
9. American Academy of Neurology. Position statement on sports concussion. October 2010. AAN policy 2010-36. Available at: http://www.aan.com/globals/axon/assets/7913.pdf. Accessed February 23, 2011.
10. Halstead M, Walter K. Council on Sports Medicine and Fitness. American Academy of Pediatrics. Clinical report—sport-related concussion in children and adolescents. Pediatrics. 2010;126:597-615.
11. Herring SA, Cantu RC, Guskiewicz KM, et al. Concussion (mild traumatic brain injury) and the team physician: a consensus statement—2011 update. Med Sci Sports Exerc. 2011;43:2412-2422.Available at: http://journals.lww.com/acsm-msse/Fulltext/2011/12000/Concussion__Mild_Traumatic_Brain_Injury__and_the.24.aspx. Accessed February 23, 2011.
12. McCrory P, Meeuwisse W, Johnston K, et al. Consensus statement on concussion in sport: the 3rd International Conference on Concussion in Sport held in Zurich, November 2008. Br J Sports Med. 2009;43(suppl 1):i76-i90.
13. Ropper A, Gorson K. Clinical practice. Concussion. N Engl J Med. 2007;356:166-172.
14. Reddy C, Collins MW. Sports concussion: management and predictors of outcome. Curr Sports Med Rep. 2009;8:10-15.
15. Guskiewicz KM. Assessment of postural stability following sport-related concussion. Curr Sports Med Rep. 2003;2:24-30.
16. Broglio S, Sosnoff J, Ferrara M. The relationship of athlete-reported concussion symptoms and objective measures of neurocognitive function and postural control. Clin J Sport Med. 2009;19:377-382.
17. Reimann B, Guskiewicz K. Effects of mild head injury on postural stability as measured through clinical balance testing. J Athl Train. 2000;35:19-25.
18. Maddocks D, Dicker G, Saling M. The assessment of orientation following concussion in athletes. Clin J Sport Med. 1995;5:32-35.
19. McCrea M. Standardized mental status assessment of sports concussion. Clin J Sport Med. 2001;11:176-181.
20. Collie A, Maruff P, Makdissi M, et al. CogSport: reliability and correlation with conventional cognitive tests used in postconcussion medical evaluations. Clin J Sport Med. 2003;13:28-32.
21. Erlanger D, Saliba E, Barth J, et al. Monitoring resolution of postconcussion symptoms in athletes: preliminary results of a web-based neuropsychological test protocol. J Athl Train. 2001;36:280-287.
22. Schatz P, Pardini J, Lovell M, et al. Sensitivity and specificity of the ImPACT Test battery for concussion in athletes. Arch Clin Neuropsychol. 2006;21:91-99.
23. Schatz P, Putz B. Cross-validation of measures used for computer-based assessment of concussion. Appl Neuropsychol. 2006;13:151-159.
24. Kirkwood M, Randolph C, Yeates K. Returning pediatric athletes to play after concussion: the evidence (or lack thereof) behind baseline neuropsychological testing. Acta Pædiatr. 2009;98:1409-1411.
25. Randolph C. Baseline neuropsychological testing in managing sport-related concussion: does it modify risk? Curr Sports Med Rep. 2011;10:21-26.
26. McCrory P, Collie A, Anderson V, et al. Can we manage sport related concussion in children the same as in adults? Br J Sports Med. 2004;38:516-519.
27. d’Hemecourt P. Subacute symptoms of sports-related concussion outpatient management and return to play. Clin Sports Med. 2011;30:63-72.
28. Concussion laws. Available at: http://www.sportsconcussions.org/laws.html. Accessed July 5, 2011.
29. Wetjen N, Pichelmann M, Atkinson J. Second impact syndrome: concussion and second injury brain complications. J Am Coll Surg. 2010;211:553-557.
30. Jotwani V, Harmon KG. Postconcussion syndrome in athletes. Curr Sports Med Rep. 2010;9:21-26.
31. Guskiewicz K, Marshall S, Bailes J, et al. Association between recurrent concussion and late-life cognitive impairment in retired professional football players. Neurosurgery. 2005;57:719-726.
32. Guskiewicz K, Marshall S, Bailes J, et al. Recurrent concussion and risk of depression in retired professional football players. Med Sci Sports Exerc. 2007;39:903-909.
33. Belanger H, Spiegel E, Vanderploeg R. Neuropsychological performance following a history of multiple self-reported concussions: a meta-analysis. J Int Neuropsychol Soc. 2010;16:262-267.
34. Burce J, Echemendia R. History of multiple self-reported concussions is not associated with reduced cognitive abilities. Neurosurgery. 2009;64:100-106.
• Prohibit sports participation as long as a patient exhibits concussive symptoms after a head injury. C
• Evaluate a patient’s balance and cognitive function to help gauge the severity of concussion and the likely delay in a return to sports activity. C
• Use a stepwise protocol in returning an asymptomatic patient to full sports activity. C
Strength of recommendation (SOR)
A Good-quality patient-oriented evidence
B Inconsistent or limited-quality patient-oriented evidence
C Consensus, usual practice, opinion, disease-oriented evidence, case series
CASE KD is an 18-year-old high school basketball player who was knocked backwards during a game, hitting her head on the floor. She had immediate head and neck pain but no loss of consciousness; she was transported by EMS to the local emergency department (ED) for further evaluation. Results of head and neck CT scans were normal, and she was discharged home. Four days later, KD’s parents brought her to our office because she was experiencing ongoing headache, phonophobia, nausea, light-headedness, poor balance, increased sleepiness, and irritability.
The Centers for Disease Control and Prevention estimate that approximately 300,000 sports concussions occur yearly in the United States,1 and that 135,000 of these cases are treated in EDs.2 These numbers have not gone unnoticed in the consumer press. Over the past 18 months, Sports Illustrated, Newsweek, and Time3-5 have published stories on sports-related concussion, helping to raise public awareness of its risks.
Recommendations for practitioners have changed. In 1997, the American Academy of Neurology6 published one-size-fits-all guidelines on managing concussion, using levels of symptomatology and loss of consciousness to grade the severity of concussion from 1 to 3. These guidelines were similar to the Cantu and Colorado guidelines of the early 1990s.7,8 Since then, however, the diagnostic criteria and expert opinion about treatment and return to physical activity have changed. Indeed, several medical organizations9-12 now recommend a more individualized approach to evaluation and management, which we describe here.
It begins with a definition
While there is no single agreed-upon characterization of “concussion,” the 3rd International Conference on Concussion in Sport (ICCS)12 provides this definition:
Concussion is defined as a complex pathophysiological process affecting the brain, induced by traumatic biomechanical forces. Several common features that incorporate clinical, pathologic, and biomechanical injury constructs that may be utilized in defining the nature of a concussive head injury include:
- Concussion may be caused either by a direct blow to the head, face, or neck or a blow elsewhere on the body with an ‘‘impulsive’’ force transmitted to the head.
- Concussion typically results in the rapid onset of short-lived impairment of neurologic function that resolves spontaneously.
- Concussion may result in neuropathological changes but the acute clinical symptoms largely reflect a functional disturbance rather than a structural injury.
- Concussion results in a graded set of clinical symptoms that may or may not involve loss of consciousness. Resolution of the clinical and cognitive symptoms typically follows a sequential course.… In a small percentage of cases, however, postconcussive symptoms may be prolonged.
- No abnormality on standard structural neuroimaging studies is seen in concussion.
Office evaluation
Obtain a thorough history and conduct a neurologic evaluation and musculoskeletal examination of the head and neck.
Clues to expected length of recovery
A patient with a concussion may lose consciousness after the impact, or have a brief convulsion that is not a seizure.13 In the periodimmediately after the injury, the patient may exhibit a constellation of such signs and symptoms as headache, confusion, a dazed look, dilated pupils, amnesia, poor balance, nausea, or vomiting. These features typically resolve over time, but may persist for weeks or months. Anterograde or retrograde amnesia may also occur. TABLE 1 details a more complete list of concussion symptoms. If the patient is a child or young adult, it is useful to have a parent present at the office visit to describe the patient’s mood, sleep, appetite, and overall health after the injury.
Factors that may portend a longer recovery include a previous concussion, retrograde or anterograde amnesia, younger age, and female sex.14
Dire problems beyond concussion. Complaints or historical elements inconsistent with concussion that should be considered red flags include any focal neurologic complaints, vomiting or headache that worsens after a period of improvement, or obtundation or disorientation that has worsened since the injury. With such findings, consider more serious head injuries and arrange for a more complete immediate neurologic work-up.
CASE Our neurologic examination yielded normal results. However, our patient was unable to balance correctly on one leg. The cognitive exam revealed a deficit in short-term memory. We diagnosed a concussion, advised her to refrain from sports, and prescribed cognitive rest. A return to school for half days would be considered once her symptoms began to resolve.
TABLE 1
Signs and symptoms commonly associated with concussion
| Headache “Pressure in head” Neck pain Nausea or vomiting Dizziness Blurred vision Balance problems | Sensitivity to light Sensitivity to noise Feeling slowed down Feeling like “in a fog” “Don’t feel right” Difficulty concentrating Difficulty remembering | Fatigue or low energy Confusion Drowsiness Trouble falling asleep Irritability Sadness Nervousness or anxiety |
| Adapted from SCAT2 in Appendix 1 of: McCrory P, Meeuwisse W, Johnston K, et al. Br J Sports Med. 2009;43(suppl 1):i76-i90.12 | ||
Options for the neurologic exam
With a simple concussion, expect a normal neurologic examination, with the possible exception of the ability to balance. Head imaging is not necessary in the setting of suspected concussion, because results of computed tomography (CT) and magnetic resonance imaging (MRI) will likely be normal.12
Balance testing can assist in the diagnosis of concussion and the monitoring of recovery from injury.15-17 The Balance Error Scoring System (BESS)15 is a validated and simple test that can be done in the office. The test involves 3 consecutive stances: (a) normal stance with feet comfortably apart and hands on hips, (b) with feet aligned heel to toe with the dominant leg in front, and (c) standing on the nondominant leg with the dominant leg flexed 30 degrees at the hip. Have the patient repeat each version of the test for 20 seconds with eyes closed, on a stable and then unstable surface (eg, foam mat).
It’s recommended that another staff member be present to spot the patient in case of a fall. A link to a complete description of the test and scoring details is provided in the Web resources box.
Assess cognitive function. One tool for assessing cognitive function is the Sports Concussion Assessment Tool 2 (SCAT2).12 SCAT2 includes newer, as yet unvalidated sections and several sections that have been independently studied and proven useful in diagnosing concussion. Validated sections are the Maddocks questions, used only at the time and place of injury18 ; the modified BESS15 ; and the Standardized Assessment of Concussion (SAC).19 The SCAT2 and the SAC (which may be used separately) include questions that assist in evaluating short-term memory and attention, and are useful in the physician’s office.
Do computer-based tools help? Another option for cognitive assessment is computer-based neuropsychologic testing developed specifically for use with suspected concussion. Any of these programs can be used in the office by a trained practitioner. Schools may also use the programs under the supervision of an athletic trainer or team physician. Available programs are ImPACT, developed by the University of Pittsburgh (http://impacttest.com); the Cognitive Stability Index (CSI), by HeadMinder (http://www.headminder.com/site/csi/home.html); and the Computerized Cognitive Assessment Tool (CCAT), by CogState/Axon Sports (http://www.axonsports.com). Multiple studies have shown such programs to be useful in diagnosing and monitoring recovery from sports concussion.20-23
However, among sports medicine practitioners, there seems to be a consensus that computer-based neuropsychologic testing is most useful when a baseline score exists. Baseline testing is usually done preseason on athletes in a healthy state. If a baseline score is not available, a patient’s postinjury score is compared with normative data produced by the developer of the individual test.
Few, if any, outcome studies have been conducted to determine whether computer-basedneuropsychologic testing provides any meaningful improvement in the care of athletes who have suffered concussions. There is also concern that few studies by independent sources have replicated the data disseminated by developers of the tests.24,25 The most recent guidelines by the 3rd ICCS recommend using neuropsychologic testing only as an aid to an overall medical evaluation, not as the sole determinant of recovery from concussion.12 Numerous studies now underway may help clarify the role of neuropsychologic testing in concussion.
CASE By the time of our follow-up exam 7 days later (11 days from injury), KD had returned to school for half days, but her phonophobia and headaches worsened at school and she had difficulty focusing on academic tasks. Neurologic, balance, and cognitive exams were all normal. We advised her to gradually return to school full time while abstaining from sporting activity.
At 16 days’ follow-up (20 days from injury), KD had returned to school full time and said she felt more like herself, although she continued to have daily headaches and phonophobia. All exam results were normal. Sports were still off limits, and we told her to expect at least 7 more days of respite before any return to exercise would be allowed.
At 23 days’ follow-up (27 days from injury), KD’s symptoms had completely resolved, and all exam results were normal. We prescribed a stepwise return to athletic activity over the next 10 days and discussed this plan with the school’s athletic trainer, who would supervise her return to play.
American Academy of Neurology (AAN). Position Statement on Sports Concussion. http://www.aan.com/globals/axon/assets/7913.pdf
American Academy of Pediatrics (AAP). Sports-Related Concussion in Children and Adolescents. http://pediatrics.aappublications.org/cgi/content/abstract/126/3/597
The Balance Error Scoring System (BESS). http://www.sportsconcussion.com/pdf/management/BESSProtocolNATA09.pdf
Centers for Disease Control and Prevention. Concussion and Mild TBI. http://www.cdc.gov/concussion/index.html
Sport Concussion Assessment Tool 2 (SCAT2). http://www.athletictherapy.org/en/pdf/SCAT2.pdf
3rd International Conference on Concussion in Sport. http://bjsm.bmj.com/content/43/Suppl_1/i76.full
Individualize management
The one-size-fits-all approach previously recommended6 is no longer the standard of care. In your initial encounter with the patient (and parents, as appropriate), explain the nature of the injury, expected course of recovery, and requirements for a return to play. Also discuss the possibility of postconcussive syndrome and the risk of rare sequelae such as second impact syndrome.
If the patient is symptomatic or exhibits examination findings consistent with concussion, recommend immediate cessation of sports activity.9-12 With a school-aged athlete, if symptoms reported by the patient or parents are significant, consider prescribing cognitive rest, which can be provided through quiet accommodations at school or perhaps even time off from school or exams.12,24 In the early period of recovery, increased cognitive or physical activity can cause symptoms to worsen. With improvement, the patient may return to school half time to lessen the chance of a significant return of symptoms. If half days are tolerated, the patient may transition to full days. Make sure the diagnosis and expectations for recovery are communicated to the appropriate school officials so that necessary accommodationscan be made. If symptoms after the initial office visit are mild, a one-week return to school is appropriate to evaluate the patient’s recovery.
Allowing a return to sports. Once the patient is asymptomatic, and physical and cognitive test results are normal, discuss a return-to-play protocol with the patient (and with parents and athletic trainer or coach, as appropriate). Multiple sources10,11,26 now recommend a stepwise return to play, as detailed by the 3rd ICCS ( TABLE 2 ).12 Increase or decrease the length of the protocol depending on the patient and the specifics of the case.
There is little science to guide the treatment of children with concussion. However, given that their brains are still developing, it’s prudent to be more conservative than with older adolescents or adults. Multiple sources apart from the 3rd ICCS agree with this recommendation. Several authors suggest more cognitive rest and a longer return-to-play protocol in all cases.10,27 In fact, the ICCS committee additionally recommends observing a symptom-free waiting period for pediatric athletes before even starting a return-to-play protocol.
McCrory et al26 suggest that children under age 15 be treated more conservatively than those 15 and older. They suggest treating those 15 and older with the protocol for older adolescents. Specifying an age at which one should always make a decision for or against conservative care can be problematic. However, based on the recommendations above, it would seem reasonable to provide conservative treatment for children younger than high school age and perhaps even those in the early years of high school.
Consider legal implications. Become familiar with state laws that require certain steps in managing sports concussion. The Web site http://www.sportsconcussions.org/laws.html28 lists states with sports concussion statutes, as well as states with bills working their way through the legislative system. Currently, 29 states are listed with laws; 14 more and the District of Columbia have pending legislation.
TABLE 2
Stepwise protocol for return to play
| If symptoms recur at any step, have patient return to prior level | |
| 1. Light aerobic activity | Walking, swimming, exercise bike; keeping exertion <70% of maximum heart rate |
| 2. Sport-specific exercises | Exertional drills in sport, eg, running drills in football/soccer, skating drills in hockey |
| 3. Noncontact training drills | Progression to more complex noncontact drills, eg, passing/catching drills in football, shooting/passing in basketball, hitting drills in volleyball |
| 4. Full-contact practice | Return to full practice if no recurrence of symptoms through first 3 steps and cleared by physician |
| 5. Game activity | Return to full sport participation if no recurrence of symptoms with above steps |
| Adapted from: McCrory P, Meeuwisse W, Johnston K, et al. Br J Sports Med. 2009;43(suppl 1):i76-i90.12 | |
Anticipate complications
Most patients with concussions who are managed appropriately do well. However, complications can occur. The most serious complication is second impact syndrome, which usually occurs when concussion is unrecognized or not well managed. While not well understood, this condition is thought to result from a sudden increase in intracranial pressure after a second head injury in an athlete already suffering from concussion symptoms. The injury typically results in serious long-term neurologic deficits, or even fatality.29 Second impact syndrome has been documented as occurring in the same game after an initial injury, as well as in subsequent games.29
A more common, but less serious, complication is postconcussion syndrome.30 This is an ill-defined condition in which the patient suffers from concussive symptoms for an extended period of time, generally for more than 3 months.30 As with acute concussion, the constellation of symptoms ranges from headache to cognitive impairment. In cases of postconcussion syndrome, it is appropriate to consult with neuropsychologists, psychiatrists, or neurologists for assistance with symptoms and associated mood disorders. Similar to acute concussion management, it is generally recommended that athletes not be cleared to resume play while struggling with the symptoms of postconcussion syndrome.30
There have also been recent reports of late-life sequelae in those who have sustained multiple concussions. Depression and dementia have been suggested in surveys of retired NFL players.31,32 There have also been studies both suggesting14 and questioning33,34 whether multiple concussions result in long-term cognitive deficits. While the evidence available at this time is not firm, there seems to be an increasing belief that multiple concussions can affect long-term cognitive abilities. For these reasons, use caution in making return-to-play decisions for patients with multiple concussions or concussions with long-lasting symptoms.
CORRESPONDENCE Aaron M. Lear, MD, 224 West Exchange Street, Suite 440, Akron, OH 44302; aaron.lear@akrongeneral.org
1. CDC. Sports-related recurrent brain injuries—United States. MMWR Morb Mortal Wkly Rep. 1997;46:224-227.
2. CDC. Brain injury awareness month—March 2010. MMWR Morb Mortal Wkly Rep. 2010;59:235.-
3. Epstein D. The damage done. Sports Illustrated. November 1, 2010:42. Available at: http://sportsillustrated.cnn.com/vault/article/magazine/MAG1176377/index.htm. Accessed May 16, 2012.
4. Kliff S. Heading off sports injuries. Newsweek. February 4, 2010. Available at: http://www.newsweek.com/2010/02/04/heading-off-sports-injuries.html. Accessed February 9, 2011.
5. Kluger J. Headbanger nation. Health special: kids and concussions. Time. February 3, 2011. Available at: http://www.time.com/time/specials/packages/article/0,28804,2043395_2043506_2043494,00.html. Accessed February 9, 2011.
6. American Academy of Neurology. Practice parameter: the management of concussion in sports (summary statement). Report of the quality standards subcommittee. Neurology. 1997;48:581-585.
7. Cantu R. Cerebral concussion in sport. Management and prevention. Sports Med. 1992;14:64-74.
8. Kelly J, Nichols J, Filley C, et al. Concussion in sports. Guidelines for the prevention of catastrophic outcome. JAMA. 1991;266:2867-2869.
9. American Academy of Neurology. Position statement on sports concussion. October 2010. AAN policy 2010-36. Available at: http://www.aan.com/globals/axon/assets/7913.pdf. Accessed February 23, 2011.
10. Halstead M, Walter K. Council on Sports Medicine and Fitness. American Academy of Pediatrics. Clinical report—sport-related concussion in children and adolescents. Pediatrics. 2010;126:597-615.
11. Herring SA, Cantu RC, Guskiewicz KM, et al. Concussion (mild traumatic brain injury) and the team physician: a consensus statement—2011 update. Med Sci Sports Exerc. 2011;43:2412-2422.Available at: http://journals.lww.com/acsm-msse/Fulltext/2011/12000/Concussion__Mild_Traumatic_Brain_Injury__and_the.24.aspx. Accessed February 23, 2011.
12. McCrory P, Meeuwisse W, Johnston K, et al. Consensus statement on concussion in sport: the 3rd International Conference on Concussion in Sport held in Zurich, November 2008. Br J Sports Med. 2009;43(suppl 1):i76-i90.
13. Ropper A, Gorson K. Clinical practice. Concussion. N Engl J Med. 2007;356:166-172.
14. Reddy C, Collins MW. Sports concussion: management and predictors of outcome. Curr Sports Med Rep. 2009;8:10-15.
15. Guskiewicz KM. Assessment of postural stability following sport-related concussion. Curr Sports Med Rep. 2003;2:24-30.
16. Broglio S, Sosnoff J, Ferrara M. The relationship of athlete-reported concussion symptoms and objective measures of neurocognitive function and postural control. Clin J Sport Med. 2009;19:377-382.
17. Reimann B, Guskiewicz K. Effects of mild head injury on postural stability as measured through clinical balance testing. J Athl Train. 2000;35:19-25.
18. Maddocks D, Dicker G, Saling M. The assessment of orientation following concussion in athletes. Clin J Sport Med. 1995;5:32-35.
19. McCrea M. Standardized mental status assessment of sports concussion. Clin J Sport Med. 2001;11:176-181.
20. Collie A, Maruff P, Makdissi M, et al. CogSport: reliability and correlation with conventional cognitive tests used in postconcussion medical evaluations. Clin J Sport Med. 2003;13:28-32.
21. Erlanger D, Saliba E, Barth J, et al. Monitoring resolution of postconcussion symptoms in athletes: preliminary results of a web-based neuropsychological test protocol. J Athl Train. 2001;36:280-287.
22. Schatz P, Pardini J, Lovell M, et al. Sensitivity and specificity of the ImPACT Test battery for concussion in athletes. Arch Clin Neuropsychol. 2006;21:91-99.
23. Schatz P, Putz B. Cross-validation of measures used for computer-based assessment of concussion. Appl Neuropsychol. 2006;13:151-159.
24. Kirkwood M, Randolph C, Yeates K. Returning pediatric athletes to play after concussion: the evidence (or lack thereof) behind baseline neuropsychological testing. Acta Pædiatr. 2009;98:1409-1411.
25. Randolph C. Baseline neuropsychological testing in managing sport-related concussion: does it modify risk? Curr Sports Med Rep. 2011;10:21-26.
26. McCrory P, Collie A, Anderson V, et al. Can we manage sport related concussion in children the same as in adults? Br J Sports Med. 2004;38:516-519.
27. d’Hemecourt P. Subacute symptoms of sports-related concussion outpatient management and return to play. Clin Sports Med. 2011;30:63-72.
28. Concussion laws. Available at: http://www.sportsconcussions.org/laws.html. Accessed July 5, 2011.
29. Wetjen N, Pichelmann M, Atkinson J. Second impact syndrome: concussion and second injury brain complications. J Am Coll Surg. 2010;211:553-557.
30. Jotwani V, Harmon KG. Postconcussion syndrome in athletes. Curr Sports Med Rep. 2010;9:21-26.
31. Guskiewicz K, Marshall S, Bailes J, et al. Association between recurrent concussion and late-life cognitive impairment in retired professional football players. Neurosurgery. 2005;57:719-726.
32. Guskiewicz K, Marshall S, Bailes J, et al. Recurrent concussion and risk of depression in retired professional football players. Med Sci Sports Exerc. 2007;39:903-909.
33. Belanger H, Spiegel E, Vanderploeg R. Neuropsychological performance following a history of multiple self-reported concussions: a meta-analysis. J Int Neuropsychol Soc. 2010;16:262-267.
34. Burce J, Echemendia R. History of multiple self-reported concussions is not associated with reduced cognitive abilities. Neurosurgery. 2009;64:100-106.
Hearing loss: Help for the young and old
•Ensure that all the infants you care for underwent hearing screening shortly after birth and that those who tested positive are retested in ≤3 months. B
•Evaluate elderly patients for hearing loss during their initial visit and annually thereafter. A
•Speak clearly, maintain eye contact, and use nonverbal gestures when communicating with patients with hearing loss. C
Strength of recommendation (SOR)
A Good-quality patient-oriented evidence
B Inconsistent or limited-quality patient-oriented evidence
C Consensus, usual practice, opinion, disease-oriented evidence, case series
Hearing impairment is a widespread problem, affecting approximately 36 million US adults1 and an increasing number of children.2 Yet it often goes undetected. The consequences of untreated or undertreated hearing loss can be severe.
Adverse effects are often age-dependent: In children, hearing loss is associated with a broad range of complications, including delays in language development, decreased reading comprehension, and poor academic performance, as well as social and emotional problems.2,3 In adults—particularly the elderly—hearing impairment can lead to social isolation, depression, and a diminished quality of life.4,5
Early detection and treatment can do much to alleviate these adverse effects. But many physicians received little training in the identification and treatment of hearing loss in medical school. What’s more, people with significant hearing loss tend to have fewer interactions with health care providers than their counterparts with no hearing impairment6—a finding that some attribute to fear, mistrust, and frustration.7
Physician awareness of the problems facing people with hearing loss, the importance of screening, and the need to improve communication with hearing-impaired patients (TABLE 1)8 can help change that. The strategies presented here were developed with this in mind.
TABLE 1
How to better communicate with patients who have hearing loss8
| Maintain eye contact and avoid covering your lips while speaking; avoid shouting |
| Use gestures and other nonverbal cues |
| Draw diagrams or use pictures to make a point |
| Reduce background noise (eg, by closing a door or finding a quiet corner) |
| Use the “teach-back” method to ensure understanding |
| Use sign language or provide a sign language interpreter or an oral transliterator* |
| *Ask whether the patient is comfortable with sign language or oral transliteration, which is sometimes used to facilitate oral communication with people who have hearing loss. |
The scope of hearing loss across the lifespan
Hearing loss affects 1 to 3 in every 1000 newborns.9 The prevalence increases to 2% among 5-year-olds, and to 10% to 20% by age 18.10,11 The risk accelerates in “early older life” (defined as ages 50-69 years), with men affected more often than women.12 Hearing loss is the fourth most common chronic condition among older adults, and it is estimated that ≥70% of nursing home residents have some degree of impairment.13
Hearing loss can be categorized as mild (a loss of 20-40 decibels [dB]), moderate (41-55 dB loss), moderate to severe (56-70 dB loss), severe (71-90 dB loss), or profound (>91 dB loss), but any degree of hearing loss should be considered noteworthy.
In children, the impact of mild impairment is often minimized by both professionals and parents, especially among those whose speech developed normally. Unfortunately, the failure to respond appropriately in such cases often increases the adverse effects of the hearing loss.14
In adults, even mild to moderate impairment can lead to significant functional impairment and, therefore, a decreased quality of life.5 And in elderly patients, any undetected hearing loss can adversely affect their performance on cognitive tests, leading to an incorrect diagnosis of cognitive impairment. Elderly patients often minimize hearing deficits, and many believe—incorrectly—that hearing loss due to aging is not amenable to treatment.15
Hearing loss in children may be congenital or acquired
In children, hearing loss can be divided into 2 main categories: congenital and acquired. Congenital etiologies include genetic diseases such as Down syndrome, Usher syndrome, and Alport syndrome—thought to account for 50% of pediatric hearing loss—and intrauterine infections. Causes of acquired hearing loss include recurrent otitis media—most common among infants and young children—and environmental noise (TABLE 2).16-18
TABLE 2
Common causes of hearing loss16-18
| Newborns, children, and adolescents |
|---|
| Childhood infection (eg, measles, mumps, meningitis) |
| Genetic syndrome (eg, Down syndrome, Usher syndrome, Alport syndrome) |
| Head trauma |
| In utero infection (eg, toxoplasmosis, rubella, HSV, CMV, syphilis) |
| Noise exposure |
| Otitis media (recurrent) |
| Ototoxic medication* |
| Premature delivery |
| Adults and the elderly |
| Acoustic neuroma |
| Head trauma |
| Impacted cerumen |
| Noise exposure |
| Otitis media (recurrent) |
| Otosclerosis |
| Ototoxic medication* |
| Presbycusis |
| *Includes aminoglycosides, cisplatin, and loop diuretics, among others. CMV, cytomegalovirus; HSV, herpes simplex virus. |
Adolescents and young adults often expose themselves to loud noises from personal electronic devices, and the use of hearing protection in this population is low.19 The results of one small study suggest that almost a third of adolescents regularly use the highest volume on their iPods or MP3 players, which can cause hearing damage over time.20 Noise levels at which hearing loss occurs can be found at http://www.cdc.gov/niosh/topics/noise/noisemeter.html.21 It is important for adolescents as well as adults to be aware of the risk of hearing loss from repeated exposure to loud noise, but evidence suggests that education about this danger is more likely to lead to behavior change in working-age adults than in teens.22
Screening parameters for infants and children
The US Preventive Services Task Force (USPSTF) recommends universal newborn hearing screening,23 but this does not always happen. That’s why it’s important to ask all new parents whether their baby underwent hearing screening shortly after birth. If the answer is No (or they’re not sure), you may want to order it at this time.
Infants at increased risk for hearing loss—those who spent >2 days on a neonatal intensive care unit; have a congenital syndrome, family history of hereditary childhood sensorineural hearing loss, or craniofacial abnormalities; or were exposed to certain intrauterine infections—should be screened again at 24 to 30 months of age.23 Those with positive results on a newborn hearing screen require repeat screening within 3 months.24,25 If the repeat screen is also positive, a full audiologic evaluation is necessary.
Testing newborns. The most common methods of screening newborns for hearing loss are otoacoustic emissions (OAE) and automated auditory brainstem response (AABR). The average age of detection of congenital hearing loss prior to the availability of these tests was 2 to 3 years. Earlier detection is associated with better developmental outcomes.26
OAE assesses cochlear integrity and measures outer hair cell function. AABR assesses auditory function from the eighth nerve through the auditory brainstem.
Testing toddlers and older children. Any child exhibiting signs of possible hearing loss, such as learning disabilities or speech delay, should be referred for audiometric testing, as should those who have had recurrent otitis media. Tympanograms can be used to diagnose conductive hearing loss, which often results from middle ear effusion. A parent’s expression of concern about a child’s hearing also warrants a referral, as parents can be 12 months ahead of physicians in identifying hearing loss.27
“Play audiometry,” a behavioral test of auditory thresholds in response to speech and frequency-specific stimuli, is commonly used for children between the ages of 2 and 4 years. In this test, the child is instructed to place a block into a box whenever he or she hears a sound.
Children >4 years are typically tested with conventional audiometry, and instructed to raise their hand in response to speech and frequency-specific stimuli. This technique may also be used in adolescents.
Consults, resources required after diagnosis
All children diagnosed with hearing loss after an audiologic evaluation require consultation with specialists in otolaryngology, ophthalmology, and genetics. They should also be offered special educational services, beginning with early intervention and continuing with appropriate monitoring and support throughout the school years. In addition, their parents should be given contact information for hearing loss resources ( TABLE 3). Adolescents and young adults with any degree of hearing loss should also receive counseling about noise exposure.28,29 We’ll review treatment options for hearing-impaired patients of all ages in a bit.
TABLE 3
Hearing loss resources for parents and patients
| Resource | What it offers |
|---|---|
| American Speech-Language-Hearing Association (ASHA) (www.asha.org) | Information about hearing loss in people of all ages |
| Beginnings for Parents of Children Who Are Deaf or Hard of Hearing (www.ncbegin.org) | Communication options for children with hearing loss |
| Better Hearing Institute (www.betterhearing.org) | Resources related to hearing loss for health care providers and patients |
| My Baby’s Hearing (www.babyhearing.org) | Information about newborn screening |
| National Institute on Deafness and Other Communication Disorders (www.nidcd.nih.gov ) | Information about hearing loss for the general public and health care providers |
In adults, most hearing loss is age-related
Advancing age is the single most important (and nonmodifiable) risk factor for hearing loss among older adults. Physiologic changes, including cerumen buildup, tympanic membrane thickening, degeneration of middle ear auditory structures, and decreased central auditory processing all may contribute to presbycusis—age-related sensorineural hearing impairment.30 High-frequency hearing loss is characteristic of presbycusis, and since consonants are high-frequency sounds, patients with this type of hearing loss often complain that they’re unable to understand speech.
Conductive hearing loss may be caused by cerumen buildup, foreign bodies, otosclerosis, cholesteatoma, or tympanic membrane perforation—all of which may be treatable. Potentially modifiable risk factors for hearing loss include smoking, diabetes, exposure to ototoxic medications, and occupational noise, as well as cerumen buildup.17
Maintain an index of suspicion
The most important factor in diagnosing hearing loss in older adults is simply remembering to screen. Elderly patients should be evaluated for hearing loss during their initial visit, and once a year thereafter.31 But all too often, that doesn’t happen. One study found that only 18% of patients between the ages of 65 and 74 years and 22% of patients ages 75 and older had undergone screening for hearing loss during their most recent physical examination.4
But what impact does screening actually have on patients’ quality of life? The evidence is mixed. One study in which asymptomatic individuals >50 years (mean age=61 years) underwent hearing screening found that, although screening increased hearing aid use at one year, it did not lead to an improvement in quality of life.32,33 Another study with a significantly older population (mean age=72 years) found that screening did positively affect quality of life.13
Screening tools—and a question
Several testing techniques have about the same accuracy rates in diagnosing hearing loss in adult patients. These include:
- the whisper test (which should be administered from a distance of 2 feet)
- handheld audiometry testing (with frequencies of 500-4000 Hertz [Hz] at 40 dB, these devices are 94% sensitive and 72% specific for detecting hearing loss)15
- the 10-question Hearing Handicap Inventory for the Elderly-Screening version (HHIE-S), available at http://www.asha.org/docs/html/GL1997-00199-T19.html.
The HHIE-S takes <5 minutes to administer and can be used in conjunction with audiometry testing for increased accuracy in diagnosing hearing loss. An alternative is to ask just one question:
“Do you have a hearing problem now?” This question alone appears to be as effective as the HHIE-S in identifying older patients with hearing loss,34 and is likely to be the most efficient screening method for busy primary care physicians.
Consultation is needed when hearing loss is suspected
An audiology consultation should be considered when a patient’s caregiver or family member—or the patient himself—expresses concern about hearing loss. A positive result on a hearing screen, as well as clinical expression of hearing loss, also indicates a need for referral.
An otolaryngology consult is required for complicated presentations, including persistent cerumen impaction, foreign bodies, otosclerosis, cholesteatoma, tympanic membrane perforation, and asymmetrical hearing loss, which could be caused by a tumor.
Treating hearing loss in patients of all ages
Cerumen can contribute to hearing loss in children and adults alike, and can often be treated in an outpatient setting. A recent Cochrane review of various means of cerumen removal found the strongest evidence for irrigation, followed by cerumenolytic treatment and manual removal.35 The use of cerumenolytic agents appears to be more effective than no treatment, but there is no evidence favoring one product over another. (To learn more about self-removal, see “Wax removal: Help patients help themselves” (J Fam Pract. 2011;60:671-673).
Hearing aids are first-line treatment
Hearing aids should be considered as first-line treatment for children and adults with hearing loss in which easily treatable etiologies such as cerumen impaction have been excluded. They have been shown to improve the ability to understand speech and environmental sounds, as well as the quality of life, for patients of all ages.36 Even infants can be fitted with hearing aids, which are appropriate for mild, moderate, and severe hearing loss.37 But only about 20% of older patients who could benefit from hearing aids ever buy them—and an estimated 25% to 40% of those who have hearing aids use them only occasionally, stop using them completely, or continue to wear them despite receiving limited benefit.4
Cost is one potential barrier to greater use. Hearing aids range in price from about $1000 to $4000 or more for a pair. And, while insurance coverage varies from one health plan to another, hearing aids are not covered by Medicare.
What’s more, elderly patients sometimes have difficulty adjusting to hearing aids (see “Hearing aids don’t work if patients don’t wear them”).38 Cognitive deficits, difficulty manipulating hearing aids, and embarrassment often contribute to suboptimal use of hearing aids.
According to the National Institute on Deafness and Other Communication Disorders, only one out of 5 people who could benefit from hearing aids actually wears them. The use of hearing aids is relatively low even among those who own them: It is estimated that 25% to 40% of older people who have hearing aids wear them only occasionally—or not at all—or wear hearing aids that are of lim-ited benefit (eg, because they’re not adjusted properly, fit poorly, or do not provide adequate amplification).
Here’s some help in overcoming 6 common objections to their use:
- “They hurt my ears.” Explain that discomfort is not unusual at first but often resolves in time. Advise the patient to wear the hearing aids for short periods initially, and then use them for longer periods of time once he or she gets used to them.
- “My voice sounds too loud.” This is known as an “occlusion effect.” It occurs because of the trapping of bone-conducted sound vibrations between a hearing aid and tympanic membrane, and is usually self-limiting. If the problem persists, tell the patient to ask the audiologist to adjust the hearing aids.
- “The hearing aids whistle.” Feedback, such as a whistling noise, is an indication of a poorly fitting hearing aid, cerumen impaction, or fluid in the ear. If you inspect the patient’s ears and find no problem (and the whistling continues), recommend that the patient ask the audiologist for a hearing aid adjustment.
- “I’m bothered by background noise.” Explain that hearing aids may not be able to totally block background sounds, but that they can be adjusted to minimize this effect. Recommend a visit to the audiologist if the problem persists.
- “They don’t work with my cell phone.” Suggest that the patient bring the phone on the next visit to the audiologist and ask that the hearing aids be adjusted, as needed, to minimize interference.
- “I’m embarrassed to wear them.” Tell patients who are embarrassed by the need for hearing aids or don’t want to be seen wearing them that many hearing aids can be concealed, and advise them to discuss this with the audiologist. You might also point out that many people find it more embarrassing not to wear hearing aids, because they have to keep asking friends and family to repeat themselves. You might also refer them to “Guess who wears a hearing aid”—a blog with a lengthy list of actors, politicians, athletes, and even a former Miss America, who have worn hearing aids (http://newgenerationhearing.wordpress.com/2010/03/01/guess-who-uses-hearing-aids/).
Adapted from: National Institute on Deafness and Other Communication Disorders. Hearing aids.38
Is a cochlear implant a viable alternative?
For older adults for whom the cost of hearing aids is prohibitive, a less expensive pocket amplifier with headphones may be a good choice. Middle ear implants, which mechanically vibrate the middle ear structures to produce amplification, are another option for patients with presbycusis.
National Institute for Health and Clinical Excellence (NICE) guidelines recommend consideration of cochlear implantation for children and adults after multidisciplinary team assessment.37 Cochlear implants are indicated for severe to profound hearing loss, and have been shown to improve speech recognition abilities equally in adolescents and older adults.39 And, unlike hearing aids, cochlear implants are covered by most health insurance plans.
CORRESPONDENCE Paul George, MD, Alpert Medical School of Brown University, 222 Richmond Street, Providence, RI 02912; Paul_George@brown.edu
1. National Institute on Deafness and Other Communication Disorders. Quick statistics. Available at: http://www.nidcd.nih.gov/health/statistics/Pages/quick.aspx. Accessed March 30, 2012.
2. American Speech-Language-Hearing Association. The prevalence and incidence of hearing loss in children. Available at: http://www.asha.org/public/hearing/disorders/children.htm. Accessed March 26, 2012.
3. The Children’s Hearing Institute. Frequently asked questions about hearing loss. Available at: http://www.childrenshearing.org/custom/faq_hearing_loss.html. Accessed April 11, 2012.
4. Sprinzl GM, Riechelmann H. Current trends in hearing loss in elderly people: a review of the technology and treatment options-a mini-review. Gerontology. 2010;56:351-358.
5. Mulrow CD. Association between hearing impairment and the quality of life of elderly individuals. J Am Geriatr Soc. 1990;38:45-50.
6. Meador HF, Zazove P. Health care interactions with deaf culture. J Am Board Fam Pract. 2005;18:218-222.
7. Steinberg AG, Barnett S, Meador HE, et al. Health care system accessibility: experiences and perceptions of deaf people. J Gen Intern Med. 2006;21:260-266.
8. Scheier DB. Barriers to health care for people with hearing loss: a review of the literature. J NY State Nurses Assoc. 2009;40:4-10.
9. Nelson HD, Bougatsos C, Nygren P. Universal newborn hearing screening: systematic review to update the 2001 U.S. Preventive Services Task Force recommendation. Pediatrics. 2008;122:e266-e276.
10. National Institute for Deafness and Communication Disorders. Age at which hearing loss begins. Available at: http://www.nidcd.nih.gov/health/statistics/Pages/begins.aspx. Accessed April 16, 2012.
11. Shargorodsky J, Curhan SG, Curhan GC, et al. Change in prevalence of hearing loss in US adolescents. JAMA. 2010;304:772-778.
12. Chao TK, Chen TH. Predictive model for progression of hearing loss: meta-analysis of multi-state outcome. J Eval Clin Pract. 2009;15:32-40.
13. Cohen-Mansfield J, Taylor JW. Hearing aid use in nursing homes. Part 1: prevalence rates of hearing impairment and hearing aid use. J Am Med Dir Assoc. 2004;5:283-288.
14. Wake M, Hughes EK, Collins CM, et al. Parent-reported health-related quality of life in children with congenital hearing loss: a population study. Ambul Pediatr. 2004;4:411-417.
15. Lichtenstein MJ, Bess FH, Logan SA. Validation of screening tools for identifying hearing-impaired elderly in primary care. JAMA. 1988;259:2875-2878.
16. Centers for Disease Control and Prevention. Adolescent and school health. About hearing loss. Available at: http://www.cdc.gov/healthyyouth/noise/signs.htm. Accessed March 20, 2012.
17. Agrawal Y, Platz EA, Niparko JK. Risk factors for hearing loss in US adults: data from the National Health and Nutrition Examination Survey, 1999 to 2002. Otol Neurotol. 2009;30:139-145.
18. American Speech-Language-Hearing Association. Causes of hearing loss. Available at: http://www.asha.org/public/hearing/Causes-of-Hearing-Loss. Accessed April 11, 2012.
19. Widen SE, Holmes AE, Johnson T, et al. Hearing, use of hearing protection, and attitudes towards noise among young American adults. Int J Audiol.. 2009;48:537-545.
20. Hoover A, Krishnamurti S. Survey of college students’ MP3 listening: habits, safety issues, attitudes, and education. Am J Audiol. 2010;19:73-83.
21. Centers for Disease Control and Prevention. Noise and hearing loss prevention. Noise meter. Available at: http://www.cdc.gov/niosh/topics/noise/noisemeter.html. Accessed April 11, 2012.
22. El Dib RP, Mathew JL. Interventions to promote the wearing of hearing protection. Cochrane Database Syst Rev. 2009;(4):CD005234.-
23. US Preventive Services Task Force Universal screening for hearing loss in newborns: US Preventive Services Task Force recommendation statement. Pediatrics. 2008;122:143-148.
24. Hall JW, 3rd, Smith SD, Popelka GR. Newborn hearing screening with combined otoacoustic emissions and auditory brainstem responses. J Am Acad Audiol. 2004;15:414-425.
25. Norton SJ, Gorga MP, Widen JE, et al. Identification of neonatal hearing impairment: a multicenter investigation. Ear Hear. 2000;21:348-356.
26. Korver AM, Konings S, Dekker FW, et al. DECIBEL Collaborative Study Group. Newborn hearing screening vs later hearing screening and developmental outcomes in children with permanent childhood hearing impairment. JAMA. 2010;304:1701-1708.
27. American Academy of Pediatrics Joint Committee on Infant Hearing Year 2007 position statement: principles and guidelines for early hearing detection and intervention programs. Pediatrics. 2007;120:898-921.
28. Vogel I, Brug J, Hosli EJ, et al. MP3 players and hearing loss: adolescents’ perceptions of loud music and hearing conservation. J Pediatr. 2008;152:400-404.
29. Verbeek JH, Kateman E, Morata TC, et al. Interventions to prevent occupational noise induced hearing loss. Cochrane Database Syst Rev. 2009;(3):CD006396.-
30. Bade PF. Hearing impairment. In: Pacala JT, Sullivan GS, eds. Geriatrics Review Syllabus. 7th ed. New York, NY: American Geriatrics Society; 2010:197-206.
31. Yueh B, Shekelle P. Quality indicators for the care of hearing loss in vulnerable elders. J Am Geriatr Soc. 2007;55(suppl 2):S335-S339.
32. Chou R, Dana T, Bougatsos C, et al. Screening adults aged 50 years or older for hearing loss: a review of the evidence for the U.S. Preventive Services Task Force. Ann Intern Med. 2011;154:347-355.
33. Yueh B, Collins MP, Souza PE, et al. Long-term effectiveness of screening for hearing loss: the screening for auditory impairment—which hearing assessment test (SAI-WHAT) randomized trial. J Am Geriatr Soc. 2010;58:427-434.
34. Gates GA, Murphy M, Rees TS, et al. Screening for handicapped hearing loss in the elderly. J Fam Pract. 2003;52:56-62.
35. Burton MJ, Doree C. Ear drops for the removal of ear wax. Cochrane Database Syst Rev. 2009;(1):CD004326.-
36. McDermott AL, Williams J, Kuo M, et al. Quality of life in children with a bone-anchored hearing aid. Otol Neurotol. 2009;30:344-349.
37. Fitzpatrick EM, Olds J, Gaboury I, et al. Comparison of outcomes in children with hearing aids and cochlear implants. Cochlear Implants Int. 2012;13:5-15.
38. National Institute on Deafness and Other Communication Disorders. Hearing aids. How can I adjust my hearing aid? Available at: http://www.nidcd.nih.gov/health/hearing/pages/hearingaid.aspx#hearingaid_08. Accessed March 27, 2012.
39. National Institute for Health and Clinical Excellence (NICE). Cochlear implants for children and adults with severe to profound deafness. London, UK: NICE; 2009:41.
•Ensure that all the infants you care for underwent hearing screening shortly after birth and that those who tested positive are retested in ≤3 months. B
•Evaluate elderly patients for hearing loss during their initial visit and annually thereafter. A
•Speak clearly, maintain eye contact, and use nonverbal gestures when communicating with patients with hearing loss. C
Strength of recommendation (SOR)
A Good-quality patient-oriented evidence
B Inconsistent or limited-quality patient-oriented evidence
C Consensus, usual practice, opinion, disease-oriented evidence, case series
Hearing impairment is a widespread problem, affecting approximately 36 million US adults1 and an increasing number of children.2 Yet it often goes undetected. The consequences of untreated or undertreated hearing loss can be severe.
Adverse effects are often age-dependent: In children, hearing loss is associated with a broad range of complications, including delays in language development, decreased reading comprehension, and poor academic performance, as well as social and emotional problems.2,3 In adults—particularly the elderly—hearing impairment can lead to social isolation, depression, and a diminished quality of life.4,5
Early detection and treatment can do much to alleviate these adverse effects. But many physicians received little training in the identification and treatment of hearing loss in medical school. What’s more, people with significant hearing loss tend to have fewer interactions with health care providers than their counterparts with no hearing impairment6—a finding that some attribute to fear, mistrust, and frustration.7
Physician awareness of the problems facing people with hearing loss, the importance of screening, and the need to improve communication with hearing-impaired patients (TABLE 1)8 can help change that. The strategies presented here were developed with this in mind.
TABLE 1
How to better communicate with patients who have hearing loss8
| Maintain eye contact and avoid covering your lips while speaking; avoid shouting |
| Use gestures and other nonverbal cues |
| Draw diagrams or use pictures to make a point |
| Reduce background noise (eg, by closing a door or finding a quiet corner) |
| Use the “teach-back” method to ensure understanding |
| Use sign language or provide a sign language interpreter or an oral transliterator* |
| *Ask whether the patient is comfortable with sign language or oral transliteration, which is sometimes used to facilitate oral communication with people who have hearing loss. |
The scope of hearing loss across the lifespan
Hearing loss affects 1 to 3 in every 1000 newborns.9 The prevalence increases to 2% among 5-year-olds, and to 10% to 20% by age 18.10,11 The risk accelerates in “early older life” (defined as ages 50-69 years), with men affected more often than women.12 Hearing loss is the fourth most common chronic condition among older adults, and it is estimated that ≥70% of nursing home residents have some degree of impairment.13
Hearing loss can be categorized as mild (a loss of 20-40 decibels [dB]), moderate (41-55 dB loss), moderate to severe (56-70 dB loss), severe (71-90 dB loss), or profound (>91 dB loss), but any degree of hearing loss should be considered noteworthy.
In children, the impact of mild impairment is often minimized by both professionals and parents, especially among those whose speech developed normally. Unfortunately, the failure to respond appropriately in such cases often increases the adverse effects of the hearing loss.14
In adults, even mild to moderate impairment can lead to significant functional impairment and, therefore, a decreased quality of life.5 And in elderly patients, any undetected hearing loss can adversely affect their performance on cognitive tests, leading to an incorrect diagnosis of cognitive impairment. Elderly patients often minimize hearing deficits, and many believe—incorrectly—that hearing loss due to aging is not amenable to treatment.15
Hearing loss in children may be congenital or acquired
In children, hearing loss can be divided into 2 main categories: congenital and acquired. Congenital etiologies include genetic diseases such as Down syndrome, Usher syndrome, and Alport syndrome—thought to account for 50% of pediatric hearing loss—and intrauterine infections. Causes of acquired hearing loss include recurrent otitis media—most common among infants and young children—and environmental noise (TABLE 2).16-18
TABLE 2
Common causes of hearing loss16-18
| Newborns, children, and adolescents |
|---|
| Childhood infection (eg, measles, mumps, meningitis) |
| Genetic syndrome (eg, Down syndrome, Usher syndrome, Alport syndrome) |
| Head trauma |
| In utero infection (eg, toxoplasmosis, rubella, HSV, CMV, syphilis) |
| Noise exposure |
| Otitis media (recurrent) |
| Ototoxic medication* |
| Premature delivery |
| Adults and the elderly |
| Acoustic neuroma |
| Head trauma |
| Impacted cerumen |
| Noise exposure |
| Otitis media (recurrent) |
| Otosclerosis |
| Ototoxic medication* |
| Presbycusis |
| *Includes aminoglycosides, cisplatin, and loop diuretics, among others. CMV, cytomegalovirus; HSV, herpes simplex virus. |
Adolescents and young adults often expose themselves to loud noises from personal electronic devices, and the use of hearing protection in this population is low.19 The results of one small study suggest that almost a third of adolescents regularly use the highest volume on their iPods or MP3 players, which can cause hearing damage over time.20 Noise levels at which hearing loss occurs can be found at http://www.cdc.gov/niosh/topics/noise/noisemeter.html.21 It is important for adolescents as well as adults to be aware of the risk of hearing loss from repeated exposure to loud noise, but evidence suggests that education about this danger is more likely to lead to behavior change in working-age adults than in teens.22
Screening parameters for infants and children
The US Preventive Services Task Force (USPSTF) recommends universal newborn hearing screening,23 but this does not always happen. That’s why it’s important to ask all new parents whether their baby underwent hearing screening shortly after birth. If the answer is No (or they’re not sure), you may want to order it at this time.
Infants at increased risk for hearing loss—those who spent >2 days on a neonatal intensive care unit; have a congenital syndrome, family history of hereditary childhood sensorineural hearing loss, or craniofacial abnormalities; or were exposed to certain intrauterine infections—should be screened again at 24 to 30 months of age.23 Those with positive results on a newborn hearing screen require repeat screening within 3 months.24,25 If the repeat screen is also positive, a full audiologic evaluation is necessary.
Testing newborns. The most common methods of screening newborns for hearing loss are otoacoustic emissions (OAE) and automated auditory brainstem response (AABR). The average age of detection of congenital hearing loss prior to the availability of these tests was 2 to 3 years. Earlier detection is associated with better developmental outcomes.26
OAE assesses cochlear integrity and measures outer hair cell function. AABR assesses auditory function from the eighth nerve through the auditory brainstem.
Testing toddlers and older children. Any child exhibiting signs of possible hearing loss, such as learning disabilities or speech delay, should be referred for audiometric testing, as should those who have had recurrent otitis media. Tympanograms can be used to diagnose conductive hearing loss, which often results from middle ear effusion. A parent’s expression of concern about a child’s hearing also warrants a referral, as parents can be 12 months ahead of physicians in identifying hearing loss.27
“Play audiometry,” a behavioral test of auditory thresholds in response to speech and frequency-specific stimuli, is commonly used for children between the ages of 2 and 4 years. In this test, the child is instructed to place a block into a box whenever he or she hears a sound.
Children >4 years are typically tested with conventional audiometry, and instructed to raise their hand in response to speech and frequency-specific stimuli. This technique may also be used in adolescents.
Consults, resources required after diagnosis
All children diagnosed with hearing loss after an audiologic evaluation require consultation with specialists in otolaryngology, ophthalmology, and genetics. They should also be offered special educational services, beginning with early intervention and continuing with appropriate monitoring and support throughout the school years. In addition, their parents should be given contact information for hearing loss resources ( TABLE 3). Adolescents and young adults with any degree of hearing loss should also receive counseling about noise exposure.28,29 We’ll review treatment options for hearing-impaired patients of all ages in a bit.
TABLE 3
Hearing loss resources for parents and patients
| Resource | What it offers |
|---|---|
| American Speech-Language-Hearing Association (ASHA) (www.asha.org) | Information about hearing loss in people of all ages |
| Beginnings for Parents of Children Who Are Deaf or Hard of Hearing (www.ncbegin.org) | Communication options for children with hearing loss |
| Better Hearing Institute (www.betterhearing.org) | Resources related to hearing loss for health care providers and patients |
| My Baby’s Hearing (www.babyhearing.org) | Information about newborn screening |
| National Institute on Deafness and Other Communication Disorders (www.nidcd.nih.gov ) | Information about hearing loss for the general public and health care providers |
In adults, most hearing loss is age-related
Advancing age is the single most important (and nonmodifiable) risk factor for hearing loss among older adults. Physiologic changes, including cerumen buildup, tympanic membrane thickening, degeneration of middle ear auditory structures, and decreased central auditory processing all may contribute to presbycusis—age-related sensorineural hearing impairment.30 High-frequency hearing loss is characteristic of presbycusis, and since consonants are high-frequency sounds, patients with this type of hearing loss often complain that they’re unable to understand speech.
Conductive hearing loss may be caused by cerumen buildup, foreign bodies, otosclerosis, cholesteatoma, or tympanic membrane perforation—all of which may be treatable. Potentially modifiable risk factors for hearing loss include smoking, diabetes, exposure to ototoxic medications, and occupational noise, as well as cerumen buildup.17
Maintain an index of suspicion
The most important factor in diagnosing hearing loss in older adults is simply remembering to screen. Elderly patients should be evaluated for hearing loss during their initial visit, and once a year thereafter.31 But all too often, that doesn’t happen. One study found that only 18% of patients between the ages of 65 and 74 years and 22% of patients ages 75 and older had undergone screening for hearing loss during their most recent physical examination.4
But what impact does screening actually have on patients’ quality of life? The evidence is mixed. One study in which asymptomatic individuals >50 years (mean age=61 years) underwent hearing screening found that, although screening increased hearing aid use at one year, it did not lead to an improvement in quality of life.32,33 Another study with a significantly older population (mean age=72 years) found that screening did positively affect quality of life.13
Screening tools—and a question
Several testing techniques have about the same accuracy rates in diagnosing hearing loss in adult patients. These include:
- the whisper test (which should be administered from a distance of 2 feet)
- handheld audiometry testing (with frequencies of 500-4000 Hertz [Hz] at 40 dB, these devices are 94% sensitive and 72% specific for detecting hearing loss)15
- the 10-question Hearing Handicap Inventory for the Elderly-Screening version (HHIE-S), available at http://www.asha.org/docs/html/GL1997-00199-T19.html.
The HHIE-S takes <5 minutes to administer and can be used in conjunction with audiometry testing for increased accuracy in diagnosing hearing loss. An alternative is to ask just one question:
“Do you have a hearing problem now?” This question alone appears to be as effective as the HHIE-S in identifying older patients with hearing loss,34 and is likely to be the most efficient screening method for busy primary care physicians.
Consultation is needed when hearing loss is suspected
An audiology consultation should be considered when a patient’s caregiver or family member—or the patient himself—expresses concern about hearing loss. A positive result on a hearing screen, as well as clinical expression of hearing loss, also indicates a need for referral.
An otolaryngology consult is required for complicated presentations, including persistent cerumen impaction, foreign bodies, otosclerosis, cholesteatoma, tympanic membrane perforation, and asymmetrical hearing loss, which could be caused by a tumor.
Treating hearing loss in patients of all ages
Cerumen can contribute to hearing loss in children and adults alike, and can often be treated in an outpatient setting. A recent Cochrane review of various means of cerumen removal found the strongest evidence for irrigation, followed by cerumenolytic treatment and manual removal.35 The use of cerumenolytic agents appears to be more effective than no treatment, but there is no evidence favoring one product over another. (To learn more about self-removal, see “Wax removal: Help patients help themselves” (J Fam Pract. 2011;60:671-673).
Hearing aids are first-line treatment
Hearing aids should be considered as first-line treatment for children and adults with hearing loss in which easily treatable etiologies such as cerumen impaction have been excluded. They have been shown to improve the ability to understand speech and environmental sounds, as well as the quality of life, for patients of all ages.36 Even infants can be fitted with hearing aids, which are appropriate for mild, moderate, and severe hearing loss.37 But only about 20% of older patients who could benefit from hearing aids ever buy them—and an estimated 25% to 40% of those who have hearing aids use them only occasionally, stop using them completely, or continue to wear them despite receiving limited benefit.4
Cost is one potential barrier to greater use. Hearing aids range in price from about $1000 to $4000 or more for a pair. And, while insurance coverage varies from one health plan to another, hearing aids are not covered by Medicare.
What’s more, elderly patients sometimes have difficulty adjusting to hearing aids (see “Hearing aids don’t work if patients don’t wear them”).38 Cognitive deficits, difficulty manipulating hearing aids, and embarrassment often contribute to suboptimal use of hearing aids.
According to the National Institute on Deafness and Other Communication Disorders, only one out of 5 people who could benefit from hearing aids actually wears them. The use of hearing aids is relatively low even among those who own them: It is estimated that 25% to 40% of older people who have hearing aids wear them only occasionally—or not at all—or wear hearing aids that are of lim-ited benefit (eg, because they’re not adjusted properly, fit poorly, or do not provide adequate amplification).
Here’s some help in overcoming 6 common objections to their use:
- “They hurt my ears.” Explain that discomfort is not unusual at first but often resolves in time. Advise the patient to wear the hearing aids for short periods initially, and then use them for longer periods of time once he or she gets used to them.
- “My voice sounds too loud.” This is known as an “occlusion effect.” It occurs because of the trapping of bone-conducted sound vibrations between a hearing aid and tympanic membrane, and is usually self-limiting. If the problem persists, tell the patient to ask the audiologist to adjust the hearing aids.
- “The hearing aids whistle.” Feedback, such as a whistling noise, is an indication of a poorly fitting hearing aid, cerumen impaction, or fluid in the ear. If you inspect the patient’s ears and find no problem (and the whistling continues), recommend that the patient ask the audiologist for a hearing aid adjustment.
- “I’m bothered by background noise.” Explain that hearing aids may not be able to totally block background sounds, but that they can be adjusted to minimize this effect. Recommend a visit to the audiologist if the problem persists.
- “They don’t work with my cell phone.” Suggest that the patient bring the phone on the next visit to the audiologist and ask that the hearing aids be adjusted, as needed, to minimize interference.
- “I’m embarrassed to wear them.” Tell patients who are embarrassed by the need for hearing aids or don’t want to be seen wearing them that many hearing aids can be concealed, and advise them to discuss this with the audiologist. You might also point out that many people find it more embarrassing not to wear hearing aids, because they have to keep asking friends and family to repeat themselves. You might also refer them to “Guess who wears a hearing aid”—a blog with a lengthy list of actors, politicians, athletes, and even a former Miss America, who have worn hearing aids (http://newgenerationhearing.wordpress.com/2010/03/01/guess-who-uses-hearing-aids/).
Adapted from: National Institute on Deafness and Other Communication Disorders. Hearing aids.38
Is a cochlear implant a viable alternative?
For older adults for whom the cost of hearing aids is prohibitive, a less expensive pocket amplifier with headphones may be a good choice. Middle ear implants, which mechanically vibrate the middle ear structures to produce amplification, are another option for patients with presbycusis.
National Institute for Health and Clinical Excellence (NICE) guidelines recommend consideration of cochlear implantation for children and adults after multidisciplinary team assessment.37 Cochlear implants are indicated for severe to profound hearing loss, and have been shown to improve speech recognition abilities equally in adolescents and older adults.39 And, unlike hearing aids, cochlear implants are covered by most health insurance plans.
CORRESPONDENCE Paul George, MD, Alpert Medical School of Brown University, 222 Richmond Street, Providence, RI 02912; Paul_George@brown.edu
1. National Institute on Deafness and Other Communication Disorders. Quick statistics. Available at: http://www.nidcd.nih.gov/health/statistics/Pages/quick.aspx. Accessed March 30, 2012.
2. American Speech-Language-Hearing Association. The prevalence and incidence of hearing loss in children. Available at: http://www.asha.org/public/hearing/disorders/children.htm. Accessed March 26, 2012.
3. The Children’s Hearing Institute. Frequently asked questions about hearing loss. Available at: http://www.childrenshearing.org/custom/faq_hearing_loss.html. Accessed April 11, 2012.
4. Sprinzl GM, Riechelmann H. Current trends in hearing loss in elderly people: a review of the technology and treatment options-a mini-review. Gerontology. 2010;56:351-358.
5. Mulrow CD. Association between hearing impairment and the quality of life of elderly individuals. J Am Geriatr Soc. 1990;38:45-50.
6. Meador HF, Zazove P. Health care interactions with deaf culture. J Am Board Fam Pract. 2005;18:218-222.
7. Steinberg AG, Barnett S, Meador HE, et al. Health care system accessibility: experiences and perceptions of deaf people. J Gen Intern Med. 2006;21:260-266.
8. Scheier DB. Barriers to health care for people with hearing loss: a review of the literature. J NY State Nurses Assoc. 2009;40:4-10.
9. Nelson HD, Bougatsos C, Nygren P. Universal newborn hearing screening: systematic review to update the 2001 U.S. Preventive Services Task Force recommendation. Pediatrics. 2008;122:e266-e276.
10. National Institute for Deafness and Communication Disorders. Age at which hearing loss begins. Available at: http://www.nidcd.nih.gov/health/statistics/Pages/begins.aspx. Accessed April 16, 2012.
11. Shargorodsky J, Curhan SG, Curhan GC, et al. Change in prevalence of hearing loss in US adolescents. JAMA. 2010;304:772-778.
12. Chao TK, Chen TH. Predictive model for progression of hearing loss: meta-analysis of multi-state outcome. J Eval Clin Pract. 2009;15:32-40.
13. Cohen-Mansfield J, Taylor JW. Hearing aid use in nursing homes. Part 1: prevalence rates of hearing impairment and hearing aid use. J Am Med Dir Assoc. 2004;5:283-288.
14. Wake M, Hughes EK, Collins CM, et al. Parent-reported health-related quality of life in children with congenital hearing loss: a population study. Ambul Pediatr. 2004;4:411-417.
15. Lichtenstein MJ, Bess FH, Logan SA. Validation of screening tools for identifying hearing-impaired elderly in primary care. JAMA. 1988;259:2875-2878.
16. Centers for Disease Control and Prevention. Adolescent and school health. About hearing loss. Available at: http://www.cdc.gov/healthyyouth/noise/signs.htm. Accessed March 20, 2012.
17. Agrawal Y, Platz EA, Niparko JK. Risk factors for hearing loss in US adults: data from the National Health and Nutrition Examination Survey, 1999 to 2002. Otol Neurotol. 2009;30:139-145.
18. American Speech-Language-Hearing Association. Causes of hearing loss. Available at: http://www.asha.org/public/hearing/Causes-of-Hearing-Loss. Accessed April 11, 2012.
19. Widen SE, Holmes AE, Johnson T, et al. Hearing, use of hearing protection, and attitudes towards noise among young American adults. Int J Audiol.. 2009;48:537-545.
20. Hoover A, Krishnamurti S. Survey of college students’ MP3 listening: habits, safety issues, attitudes, and education. Am J Audiol. 2010;19:73-83.
21. Centers for Disease Control and Prevention. Noise and hearing loss prevention. Noise meter. Available at: http://www.cdc.gov/niosh/topics/noise/noisemeter.html. Accessed April 11, 2012.
22. El Dib RP, Mathew JL. Interventions to promote the wearing of hearing protection. Cochrane Database Syst Rev. 2009;(4):CD005234.-
23. US Preventive Services Task Force Universal screening for hearing loss in newborns: US Preventive Services Task Force recommendation statement. Pediatrics. 2008;122:143-148.
24. Hall JW, 3rd, Smith SD, Popelka GR. Newborn hearing screening with combined otoacoustic emissions and auditory brainstem responses. J Am Acad Audiol. 2004;15:414-425.
25. Norton SJ, Gorga MP, Widen JE, et al. Identification of neonatal hearing impairment: a multicenter investigation. Ear Hear. 2000;21:348-356.
26. Korver AM, Konings S, Dekker FW, et al. DECIBEL Collaborative Study Group. Newborn hearing screening vs later hearing screening and developmental outcomes in children with permanent childhood hearing impairment. JAMA. 2010;304:1701-1708.
27. American Academy of Pediatrics Joint Committee on Infant Hearing Year 2007 position statement: principles and guidelines for early hearing detection and intervention programs. Pediatrics. 2007;120:898-921.
28. Vogel I, Brug J, Hosli EJ, et al. MP3 players and hearing loss: adolescents’ perceptions of loud music and hearing conservation. J Pediatr. 2008;152:400-404.
29. Verbeek JH, Kateman E, Morata TC, et al. Interventions to prevent occupational noise induced hearing loss. Cochrane Database Syst Rev. 2009;(3):CD006396.-
30. Bade PF. Hearing impairment. In: Pacala JT, Sullivan GS, eds. Geriatrics Review Syllabus. 7th ed. New York, NY: American Geriatrics Society; 2010:197-206.
31. Yueh B, Shekelle P. Quality indicators for the care of hearing loss in vulnerable elders. J Am Geriatr Soc. 2007;55(suppl 2):S335-S339.
32. Chou R, Dana T, Bougatsos C, et al. Screening adults aged 50 years or older for hearing loss: a review of the evidence for the U.S. Preventive Services Task Force. Ann Intern Med. 2011;154:347-355.
33. Yueh B, Collins MP, Souza PE, et al. Long-term effectiveness of screening for hearing loss: the screening for auditory impairment—which hearing assessment test (SAI-WHAT) randomized trial. J Am Geriatr Soc. 2010;58:427-434.
34. Gates GA, Murphy M, Rees TS, et al. Screening for handicapped hearing loss in the elderly. J Fam Pract. 2003;52:56-62.
35. Burton MJ, Doree C. Ear drops for the removal of ear wax. Cochrane Database Syst Rev. 2009;(1):CD004326.-
36. McDermott AL, Williams J, Kuo M, et al. Quality of life in children with a bone-anchored hearing aid. Otol Neurotol. 2009;30:344-349.
37. Fitzpatrick EM, Olds J, Gaboury I, et al. Comparison of outcomes in children with hearing aids and cochlear implants. Cochlear Implants Int. 2012;13:5-15.
38. National Institute on Deafness and Other Communication Disorders. Hearing aids. How can I adjust my hearing aid? Available at: http://www.nidcd.nih.gov/health/hearing/pages/hearingaid.aspx#hearingaid_08. Accessed March 27, 2012.
39. National Institute for Health and Clinical Excellence (NICE). Cochlear implants for children and adults with severe to profound deafness. London, UK: NICE; 2009:41.
Targeting tachycardia: Diagnostic tips and tools
•Analyze P wave axis, morphology, and timing for help in diagnosing narrow QRS complex tachycardia. C
•Review the modes of onset and termination for clues to the specific type of tachycardia, including features such as the rate of acceleration and the response to medication and the Valsalva maneuver. C
•Compare a baseline 12-lead EKG with one taken during an episode of tachycardia, looking for clues to the mechanism of the arrhythmia. C
Strength of recommendation (SOR)
A Good-quality patient-oriented evidence
B Inconsistent or limited-quality patient-oriented evidence
C Consensus, usual practice, opinion, disease-oriented evidence, case series
Sinus tachycardia educational video for patients
Courtesy of: WirelessDx
Go to http://www.wirelessdx.com/sinustachycardia.htm

Narrow QRS complex tachycardias—rhythms with a rate >100 beats per minute (bpm) and a QRS duration <120 ms—are frequently encountered in both inpatient and outpatient settings. Therapeutic strategy ranges from simple reassurance to acute inpatient intervention, depending on the specific arrhythmia.
Early and accurate diagnosis is paramount to avoid unnecessary testing, ensure timely management, and prevent complications and long-term adverse outcomes. While most narrow QRS complex tachycardias are easily diagnosed, some pose a diagnostic challenge.

This review can help. We start with a summary of the various types of narrow QRS complex tachycardias, accompanied in some cases with 12-lead electrocardiogram (EKG) strips. Next, we highlight key characteristics to consider in the differential and provide an algorithm to help you zero in on the diagnosis.
Narrow QRS complex tachycardias: What you’ll find
Narrow QRS complex tachycardias fall into 2 broad categories: those that are sinus node-generated, and those that are not. Here’s a look at both.
Sinus node-generated tachycardias
Sinus node tachycardia (FIGURE 1), the most common arrhythmia,1 is an appropriate response to physiologic or emotional stress or disease processes. It is defined as a heart rate >100 bpm with the presence of P waves of normal sinus morphology on a 12-lead EKG.
FIGURE 1
Sinus tachycardia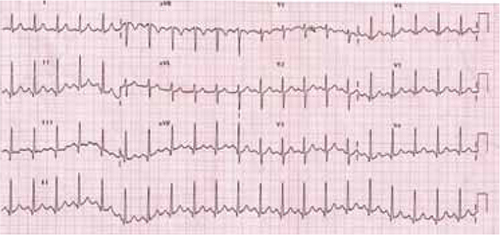
The P waves show normal sinus morphology. Note superior-to-inferior axis with positive P deflections in leads II, III, and aVF.
Inappropriate sinus tachycardia is a nonparoxysmal arrhythmia with a resting daytime heart rate >100 bpm (or an average heart rate >90 bpm over a 24-hour period), normal P wave morphology, and an exaggerated response to physical activity.2,3 What distinguishes it from simple sinus tachycardia is the disproportionate degree of the arrhythmia to the level of physiologic stress.
Inappropriate sinus tachycardia is a diagnosis of exclusion, established only after other reversible pathologic or pharmacologic causes of tachycardia, such as hyperthyroidism, pheochromocytoma, infection, or theophylline toxicity, have been ruled out. Possible mechanisms may include autonomic dysfunction with increased cardiac sympathetic or reduced vagal output.4
Paroxysmal orthostatic tachycardia syndrome (POTS) is an abnormal sinus tachycardia response to an upright position.5,6 It is diagnosed by a heart rate ≥120 bpm or an increase ≥30 bpm within 5 minutes of standing up or being on a tilt table, with simultaneous development of orthostatic symptoms, such as dizziness, light-headedness, or even syncope, without the corresponding drop in blood pressure. Symptoms usually resolve after the patient assumes a supine position. The presentation may overlap with that of inappropriate sinus tachycardia, although patients with POTS usually develop autonomic symptoms such as constipation, tremor, or heat/cold intolerance, as well.7,8
Sinus node reentry tachycardia is a paroxysmal tachycardia with a normal P wave on a 12-lead EKG. The paroxysmal nature of the arrhythmia and a positive response to atropine and vagal maneuvers, as well as identification by electrophysiologic studies, differentiate this condition from inappropriate sinus tachycardia.9
Nonsinus node-generated tachycardias
Focal atrial tachycardia (FIGURE 2) is caused by an automatic, triggered, or microreentrant mechanism that can be localized to a specific area of atrial tissue.10 The diagnosis can often be made by a careful review of the EKG, which will reveal P waves that differ from those of the sinus beat.11 This can be tricky, however, as a P wave on a 12-lead EKG from a focal point close to the sinoatrial node may resemble that of a normal sinus rhythm.
FIGURE 2
Focal atrial tachycardia
The P waves differ from those of the sinus beat. Note the positive P wave in lead aVR.
The atrial rate associated with this condition can vary from 120 to 300 bpm, depending on the focus, and may be associated with variable degrees of atrioventricular (AV) block. The crista terminalis in the right atrium and pulmonary vein ostia are frequent origins of focal atrial arrhythmias.12,13
Multifocal atrial tachycardia (FIGURE 3) is a supraventricular arrhythmia with ≥3 different P wave morphologies, as well as varying PR and RR intervals on the 12-lead EKG. It is typically associated with lung disorders but may occur in patients with other conditions, such as theophylline toxicity.14
FIGURE 3
Multifocal atrial tachycardia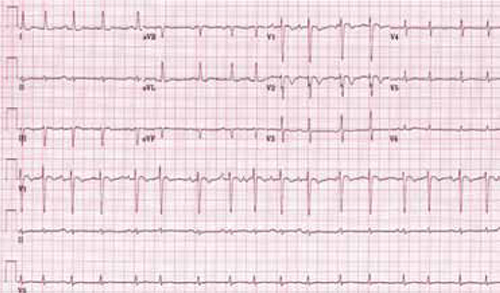
The P waves have varied morphologies; the PR and RR intervals also vary, which is best seen in lead V1.
Atrioventricular nodal reentrant tachycardia (AVNRT), a reentrant form of narrow QRS complex tachycardia, is based on a dual (slow and fast) pathway of the compact AV node (FIGURE 4). In the typical form—constituting 90% of cases15—antegrade conduction is via the slow pathway and retrograde conduction is via the fast pathway.16 In the atypical form, it’s the other way around.
FIGURE 4
Atrioventricular nodal reentrant tachycardia
Note the “pseudo S” waves, which is best seen in leads II, III, and aVF. This represents retrograde activation of the atria with an inferior-to-superior axis. The RP interval is very short.
Orthodromic atrioventricular reciprocating tachycardia (AVRT), or Wolff-Parkinson-White syndrome, is a narrow QRS complex tachycardia in which antegrade conduction is via the AV node and retrograde conduction is via an accessory pathway (bundle of Kent). The accessory pathway consists of a band of muscle tissue that connects the atrium directly to the ventricles, allowing electrical impulses to bypass the AV node. Antidromic AVRT, a wide QRS complex tachycardia, is the most common supraventricular arrhythmia in patients with accessory pathways.17
Atrial fibrillation (FIGURE 5), the most common arrhythmia for which medical treatment is required,18 is an irregular rhythm with an undulating baseline.19
FIGURE 5
Atrial fibrillation
This strip shows an irregularly irregular rhythm with no distinct P waves. The undulating baseline represents fibrillatory waves.
Atrial flutter is a reentrant tachycardia originating in either atrium, with regular flutter (F) waves on a 12-lead EKG (FIGURE 6). A counterclockwise propagating isthmus-dependent atrial flutter originating in the right atrium produces the typical “sawtooth” pattern of negative F waves in the inferior electrocardiographic leads.
FIGURE 6
Atrial flutter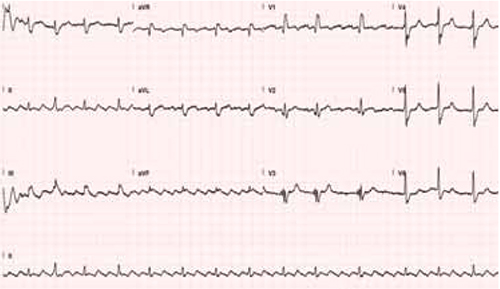
Note the regular flutter waves (“sawtooth waves”) best seen in lead II with variable AV conduction.
Junctional ectopic tachycardia is a rare arrhythmia caused by increased automaticity within the bundle of His.20,21 It is typically diagnosed in childhood and usually presents as a narrow QRS tachycardia with AV dissociation,22 but retrograde conduction to the atrium has also been found.21
How to approach the differential diagnosis
There are a number of characteristics to consider in the differential diagnosis of a patient with narrow QRS complex tachycardia (ALGORITHM).1,23-29 These include:
- rhythm regularity
- P wave axis and morphology
- relative duration of RP and PR intervals
- P wave position relative to the QRS complex
- ST elevation in lead aVR
- onset and termination mode.
ALGORITHM
Narrow QRS complex tachycardia: Zeroing in on the diagnosis1,23-29
AVNRT, atrioventricular nodal reentrant tachycardia; AVRT, atrioventricular reciprocating tachycardia; EKG, electrocardiogram; MAT, multifocal atrial tachycardia.
*Or technically poor EKG.
Rhythm regularity is a key consideration. An irregular rhythm and the absence of P waves (or the presence of fibrillatory waves) characterizes atrial fibrillation; irregularity and ≥3 different P wave morphologies is suggestive of multifocal atrial tachycardia. Other possibilities include frequent premature atrial contractions or a sinoatrial or AV nodal conduction block.
AV dissociation is rarely seen in narrow QRS complex tachycardia. Its presence raises the possibility of junctional ectopic tachycardia, ventricular tachycardia, or complete AV node block.
P wave axis and morphology can help with both the differentiation and the origin of narrow QRS complex tachycardias. A superior-to-inferior axis of P waves (positivity in leads II, III, and aVF) is seen in sinus node-generated tachycardias and sometimes in focal atrial tachycardia. An inferior-superior P wave axis (negativity in leads II, III, and aVF) is observed in AVNRT, AVRT, and a subset of focal atrial tachycardia.23,24
The specific P wave axis and morphology in focal atrial tachycardia depends on the site of atrial automaticity. If the origin is near the sinus node region or high in the atrium, the result would be a superior-to-inferior P wave axis; if it originates lower in the atrium, the resulting atrial depolarization would be an inferior-to-superior axis.23,24
Relative duration of RP and PR intervals can help to differentiate narrow QRS complex tachycardias based on the timing of the P wave with respect to adjacent QRS complexes. Those in which the RP interval is longer than the PR interval are called long RP tachycardias and include sinus tachycardia, intra-atrial tachycardia, atypical AVNRT, and AVRT with a slowly conducting ventriculoatrial pathway.25,26
Short RP tachycardias are characterized by an RP interval that’s shorter than the PR interval. Only 2 arrhythmias present as short RP tachycardias: AVNRT and AVRT.27 If the RP interval is <70 ms, AVNRT is the likely diagnosis.28
P wave position. A careful review of the position of the P wave with respect to the QRS complex can provide additional help in distinguishing between AVNRT and AVRT. In 66% of AVNRTs, the P wave is hidden within the QRS complex;29 in 30%, a retrograde P wave closely follows the QRS complex, creating a “pseudo-S” wave; and 4% of the time, the P wave precedes the QRS complex.
In AVRT, a retrograde P wave follows the QRS complex. This creates a potential dilemma in differentiating 30% of AVNRTs from AVRT. In AVNRT, the retrograde P wave typically appears very close to the QRS complex, creating a pseudo-S wave. In the orthodromic AVRT, there is usually a separation between the QRS and retrograde P wave. In general, if the RP interval is <70 ms, the arrhythmia is usually due to typical AVNRT.28
ST segment elevation in lead aVR on a 12-lead EKG in a supraventricular tachycardia is about 70% sensitive and 70% to 83% specific for a diagnosis of AVRT.30,31 ST depression of more than 2 mm or T wave inversion is more common in AVRT than in AVNRT.32 QRS alternans, which refers to variations in QRS amplitude or direction with every other beat, has been reported to be indicative of AVRT, 33,34 but may in fact be a rate-dependent phenomenon that has little to do with the mechanism of tachycardias.35
Onset and termination and other indicators. Still uncertain? Patterns of arrhythmias and modes of onset and termination may provide additional help with the differential diagnosis.
Sinus tachycardias and atrial tachycardias frequently demonstrate a “warm up” in rate, for instance, while AVNRT and AVRT are often triggered by premature atrial contractions. A positive response to the Valsalva maneuver or to adenosine is typically characteristic of reentrant tachycardias using the AV node, such as AVNRT and AVRT.
Comparing a baseline 12-lead EKG with an EKG taken during an episode of tachycardia often provides further information about the mechanism of the arrhythmia. The presence of pre-excitation, the morphology of P waves, and the lack of retrograde P waves on a baseline EKG can be useful in narrowing the differential diagnosis.
Figures courtesy of: University of Buffalo and Buffalo General Hospital.
CORRESPONDENCE Vipul Gupta, MD, MPH, State University of New York at Buffalo, 131 Biomedical Education Building, Buffalo, NY 14214;
1. Yusuf S, Camm AJ. Deciphering the sinus tachycardias. Clin Cardiol. 2005;28:267-276.
2. Lee RJ, Shinbane JS. Inappropriate sinus tachycardia. Diagnosis and treatment. Cardiol Clin. 1997;15:599-605.
3. Morillo CA, Klein GJ, Thakur RK, et al. Mechanism of ‘inappropriate’ sinus tachycardia. Circulation. 1994;90:873-877.
4. Bauernfeind RA, Amat-y-Leon F, Dhingra RC, et al. Chronic nonparoxysmal sinus tachycardia in otherwise healthy persons. Ann Intern Med. 1979;91:702-710.
5. Low PA, Opfer-Gehrking TL, Textor SC, et al. Postural tachycardia syndrome (POTS). Neurology. 1995;45(suppl 5):S19-S25.
6. Raj SR. The postural tachycardia syndrome (POTS): pathophysiology, diagnosis & management. Indian Pacing Electrophysiol J. 2006;6:84-99.
7. Grubb BP, Kanjwal MY, Kosinski DJ. Review: the postural orthostatic tachycardia syndrome. J Interv Card Electrophysiol. 2001;5:9-16.
8. Kanjwal MY, Kosinski DJ, Grubb BP. Treatment of postural orthostatic tachycardia syndrome and inappropriate sinus tachycardia. Curr Cardiol Rep. 2003;5:402-406.
9. Simmers TA, Sreeram N. Sinoatrial reentry tachycardia: a review. Indian Pacing Electrophysiol J. 2003;3:109-116.
10. Saoudi N, Cosío F, Waldo A, et al. Working Group of Arrhythmias of the European Society of Cardiology and the North American Society of Pacing and Electrophysiology. A classification of atrial flutter and regular atrial tachycardia according to electrophysiological mechanisms and anatomical bases. Eur Heart J. 2001;22:1162-1182.
11. Teh AW, Kistler PM, Kalman JM. Using the 12-lead ECG to localize the origin of ventricular and atrial tachycardias: part 1.J Cardiovasc Electrophysiol. 2009;20:706-709.
12. Roberts-Thomson KC, Kistler PM, Kalman JM. Focal atrial tachycardia I: clinical features, diagnosis, mechanisms, and anatomic location. Pacing Clin Electrophysiol. 2006;29:643-652.
13. Rosso R, Kistler PM. Focal atrial tachycardia. Heart. 2010;96:181-185.
14. Schwartz M, Rodman D, Lowenstein SR. Recognition and treatment of multifocal atrial tachycardia: a critical review. J Emerg Med. 1994;12:353-360.
15. Kwaku KF, Josephson ME. Typical AVNRT-an update on mechanisms and therapy. Cardiol Electrophysiol Rev. 2002;6:414-421.
16. Nawata H, Yamamoto N, Hirao K, et al. Heterogeneity of anterograde fast-pathway and retrograde slow-pathway conduction patterns in patients with the fast-slow form of atrioventricular nodal reentrant tachycardia. J Am Coll Cardiol. 1998;32:1731-1740.
17. Fox DJ, Tischenko A, Krahn AD, et al. Supraventricular tachycardia. Mayo Clin Proc. 2008;83:1400-1411.
18. Go AS, Hylek EM, Phillips KA, et al. Prevalence of diagnosed atrial fibrillation in adults: national implications for rhythm management and stroke prevention. JAMA. 2001;285:2370-2375.
19. Falk RH. Atrial fibrillation. N Engl J Med. 2001;344:1067-1078.
20. Garson A, Gillette PC. Junctional ectopic tachycardia in children: electrocardiography, electrophysiology and pharmacologic response. Am J Cardiol. 1979;44:298-302.
21. Villain E, Vetter VL, Garcia JM, et al. Evolving concepts in the management of congenital junctional ectopic tachycardia. A multicenter study. Circulation. 1990;81:1544-1549.
22. Sarubbi B, Vergara P, D’Alto M, et al. Congenital junctional ectopic tachycardia: presentation and outcome. Indian Pacing Electrophysiol J. 2003;3:143-147.
23. Tada H, Nogami A, Naito S, et al. Simple electrocardiographic criteria for identifying the site of origin of focal right atrial tachycardia. Pacing Clin Electrophysiol. 2006;21:2431-2439.
24. Kistler PM, Roberts-Thomson KC, Haqqani HM, et al. P wave morphology in focal atrial tachycardia. J Am Coll Cardiol. 2006;48:1010-1017.
25. Divakara Menon SM, Healey JS, Nair GM, et al. A case of long-RP tachycardia. J Cardiovasc Electrophysiol. 2009;20:702-704.
26. Lerman BB, Greenberg M, Overholt ED, et al. Differential electrophysiologic properties of decremental retrograde pathways in long RP’ tachycardia. Circulation. 1987;76:21-31.
27. Zipes DP. Clinical application of the electrocardiogram. J Am Coll Cardiol. 2000;36:1746-1748.
28. Blomström-Lundqvist C, Scheinman MM, Aliot EM, et al. ACC/AHA/ESC guidelines for the management of patients with supraventricular arrhythmias-executive summary. Circulation. 2003;108:1871-1909.
29. Farre J, Wellens HJJ. The value of electrocardiogram in diagnosing site of origin and mechanism of supraventricular tachycardia Wellens HJJ, Kulbertus HE, eds. What’s New in Electrocardiography. Boston, Mass: Martinus Nijhoff; 1981:131.
30. Ho YL, Lin LY, Lin JL, et al. Usefulness of ST-segment elevation in lead aVR during tachycardia for determining the mechanism of narrow QRS complex tachycardia. Am J Cardiol. 2003;92:1424-1428.
31. Zhong YM, Guo JH, Hou AJ, et al. A modified electrocardiographic algorithm for differentiating typical atrioventricular node reentrant tachycardia from atrioventricular reciprocating tachycardia mediated by concealed accessory pathway. Int J Clin Pract. 2006;60:1371-1377.
32. Riva SI, Della Bella P, Fassini G, et al. Value of analysis of ST segment changes during tachycardia in determining type of narrow QRS complex tachycardia. J Am Coll Cardiol. 1996;27:1480-1485.
33. Green M, Heddle B, Dassen W, et al. Value of QRS alteration in determining the site of origin of narrow QRS supraventricular tachycardia. Circulation. 1983;68:368-373.
34. Kalbfleisch SJ, el-Atassi R, Calkins H, et al. Differentiation of paroxysmal narrow QRS complex tachycardias using the 12-lead electrocardiogram. J Am Coll Cardiol. 1993;21:85-89.
35. Morady F. Significance of QRS alternans during narrow QRS tachycardias. Pacing Clin Electrophysiol. 1991;14:2193-2198.
•Analyze P wave axis, morphology, and timing for help in diagnosing narrow QRS complex tachycardia. C
•Review the modes of onset and termination for clues to the specific type of tachycardia, including features such as the rate of acceleration and the response to medication and the Valsalva maneuver. C
•Compare a baseline 12-lead EKG with one taken during an episode of tachycardia, looking for clues to the mechanism of the arrhythmia. C
Strength of recommendation (SOR)
A Good-quality patient-oriented evidence
B Inconsistent or limited-quality patient-oriented evidence
C Consensus, usual practice, opinion, disease-oriented evidence, case series
Sinus tachycardia educational video for patients
Courtesy of: WirelessDx
Go to http://www.wirelessdx.com/sinustachycardia.htm
Narrow QRS complex tachycardias—rhythms with a rate >100 beats per minute (bpm) and a QRS duration <120 ms—are frequently encountered in both inpatient and outpatient settings. Therapeutic strategy ranges from simple reassurance to acute inpatient intervention, depending on the specific arrhythmia.
Early and accurate diagnosis is paramount to avoid unnecessary testing, ensure timely management, and prevent complications and long-term adverse outcomes. While most narrow QRS complex tachycardias are easily diagnosed, some pose a diagnostic challenge.
This review can help. We start with a summary of the various types of narrow QRS complex tachycardias, accompanied in some cases with 12-lead electrocardiogram (EKG) strips. Next, we highlight key characteristics to consider in the differential and provide an algorithm to help you zero in on the diagnosis.
Narrow QRS complex tachycardias: What you’ll find
Narrow QRS complex tachycardias fall into 2 broad categories: those that are sinus node-generated, and those that are not. Here’s a look at both.
Sinus node-generated tachycardias
Sinus node tachycardia (FIGURE 1), the most common arrhythmia,1 is an appropriate response to physiologic or emotional stress or disease processes. It is defined as a heart rate >100 bpm with the presence of P waves of normal sinus morphology on a 12-lead EKG.
FIGURE 1
Sinus tachycardia
The P waves show normal sinus morphology. Note superior-to-inferior axis with positive P deflections in leads II, III, and aVF.
Inappropriate sinus tachycardia is a nonparoxysmal arrhythmia with a resting daytime heart rate >100 bpm (or an average heart rate >90 bpm over a 24-hour period), normal P wave morphology, and an exaggerated response to physical activity.2,3 What distinguishes it from simple sinus tachycardia is the disproportionate degree of the arrhythmia to the level of physiologic stress.
Inappropriate sinus tachycardia is a diagnosis of exclusion, established only after other reversible pathologic or pharmacologic causes of tachycardia, such as hyperthyroidism, pheochromocytoma, infection, or theophylline toxicity, have been ruled out. Possible mechanisms may include autonomic dysfunction with increased cardiac sympathetic or reduced vagal output.4
Paroxysmal orthostatic tachycardia syndrome (POTS) is an abnormal sinus tachycardia response to an upright position.5,6 It is diagnosed by a heart rate ≥120 bpm or an increase ≥30 bpm within 5 minutes of standing up or being on a tilt table, with simultaneous development of orthostatic symptoms, such as dizziness, light-headedness, or even syncope, without the corresponding drop in blood pressure. Symptoms usually resolve after the patient assumes a supine position. The presentation may overlap with that of inappropriate sinus tachycardia, although patients with POTS usually develop autonomic symptoms such as constipation, tremor, or heat/cold intolerance, as well.7,8
Sinus node reentry tachycardia is a paroxysmal tachycardia with a normal P wave on a 12-lead EKG. The paroxysmal nature of the arrhythmia and a positive response to atropine and vagal maneuvers, as well as identification by electrophysiologic studies, differentiate this condition from inappropriate sinus tachycardia.9
Nonsinus node-generated tachycardias
Focal atrial tachycardia (FIGURE 2) is caused by an automatic, triggered, or microreentrant mechanism that can be localized to a specific area of atrial tissue.10 The diagnosis can often be made by a careful review of the EKG, which will reveal P waves that differ from those of the sinus beat.11 This can be tricky, however, as a P wave on a 12-lead EKG from a focal point close to the sinoatrial node may resemble that of a normal sinus rhythm.
FIGURE 2
Focal atrial tachycardia
The P waves differ from those of the sinus beat. Note the positive P wave in lead aVR.
The atrial rate associated with this condition can vary from 120 to 300 bpm, depending on the focus, and may be associated with variable degrees of atrioventricular (AV) block. The crista terminalis in the right atrium and pulmonary vein ostia are frequent origins of focal atrial arrhythmias.12,13
Multifocal atrial tachycardia (FIGURE 3) is a supraventricular arrhythmia with ≥3 different P wave morphologies, as well as varying PR and RR intervals on the 12-lead EKG. It is typically associated with lung disorders but may occur in patients with other conditions, such as theophylline toxicity.14
FIGURE 3
Multifocal atrial tachycardia
The P waves have varied morphologies; the PR and RR intervals also vary, which is best seen in lead V1.
Atrioventricular nodal reentrant tachycardia (AVNRT), a reentrant form of narrow QRS complex tachycardia, is based on a dual (slow and fast) pathway of the compact AV node (FIGURE 4). In the typical form—constituting 90% of cases15—antegrade conduction is via the slow pathway and retrograde conduction is via the fast pathway.16 In the atypical form, it’s the other way around.
FIGURE 4
Atrioventricular nodal reentrant tachycardia
Note the “pseudo S” waves, which is best seen in leads II, III, and aVF. This represents retrograde activation of the atria with an inferior-to-superior axis. The RP interval is very short.
Orthodromic atrioventricular reciprocating tachycardia (AVRT), or Wolff-Parkinson-White syndrome, is a narrow QRS complex tachycardia in which antegrade conduction is via the AV node and retrograde conduction is via an accessory pathway (bundle of Kent). The accessory pathway consists of a band of muscle tissue that connects the atrium directly to the ventricles, allowing electrical impulses to bypass the AV node. Antidromic AVRT, a wide QRS complex tachycardia, is the most common supraventricular arrhythmia in patients with accessory pathways.17
Atrial fibrillation (FIGURE 5), the most common arrhythmia for which medical treatment is required,18 is an irregular rhythm with an undulating baseline.19
FIGURE 5
Atrial fibrillation
This strip shows an irregularly irregular rhythm with no distinct P waves. The undulating baseline represents fibrillatory waves.
Atrial flutter is a reentrant tachycardia originating in either atrium, with regular flutter (F) waves on a 12-lead EKG (FIGURE 6). A counterclockwise propagating isthmus-dependent atrial flutter originating in the right atrium produces the typical “sawtooth” pattern of negative F waves in the inferior electrocardiographic leads.
FIGURE 6
Atrial flutter
Note the regular flutter waves (“sawtooth waves”) best seen in lead II with variable AV conduction.
Junctional ectopic tachycardia is a rare arrhythmia caused by increased automaticity within the bundle of His.20,21 It is typically diagnosed in childhood and usually presents as a narrow QRS tachycardia with AV dissociation,22 but retrograde conduction to the atrium has also been found.21
How to approach the differential diagnosis
There are a number of characteristics to consider in the differential diagnosis of a patient with narrow QRS complex tachycardia (ALGORITHM).1,23-29 These include:
- rhythm regularity
- P wave axis and morphology
- relative duration of RP and PR intervals
- P wave position relative to the QRS complex
- ST elevation in lead aVR
- onset and termination mode.
ALGORITHM
Narrow QRS complex tachycardia: Zeroing in on the diagnosis1,23-29
AVNRT, atrioventricular nodal reentrant tachycardia; AVRT, atrioventricular reciprocating tachycardia; EKG, electrocardiogram; MAT, multifocal atrial tachycardia.
*Or technically poor EKG.
Rhythm regularity is a key consideration. An irregular rhythm and the absence of P waves (or the presence of fibrillatory waves) characterizes atrial fibrillation; irregularity and ≥3 different P wave morphologies is suggestive of multifocal atrial tachycardia. Other possibilities include frequent premature atrial contractions or a sinoatrial or AV nodal conduction block.
AV dissociation is rarely seen in narrow QRS complex tachycardia. Its presence raises the possibility of junctional ectopic tachycardia, ventricular tachycardia, or complete AV node block.
P wave axis and morphology can help with both the differentiation and the origin of narrow QRS complex tachycardias. A superior-to-inferior axis of P waves (positivity in leads II, III, and aVF) is seen in sinus node-generated tachycardias and sometimes in focal atrial tachycardia. An inferior-superior P wave axis (negativity in leads II, III, and aVF) is observed in AVNRT, AVRT, and a subset of focal atrial tachycardia.23,24
The specific P wave axis and morphology in focal atrial tachycardia depends on the site of atrial automaticity. If the origin is near the sinus node region or high in the atrium, the result would be a superior-to-inferior P wave axis; if it originates lower in the atrium, the resulting atrial depolarization would be an inferior-to-superior axis.23,24
Relative duration of RP and PR intervals can help to differentiate narrow QRS complex tachycardias based on the timing of the P wave with respect to adjacent QRS complexes. Those in which the RP interval is longer than the PR interval are called long RP tachycardias and include sinus tachycardia, intra-atrial tachycardia, atypical AVNRT, and AVRT with a slowly conducting ventriculoatrial pathway.25,26
Short RP tachycardias are characterized by an RP interval that’s shorter than the PR interval. Only 2 arrhythmias present as short RP tachycardias: AVNRT and AVRT.27 If the RP interval is <70 ms, AVNRT is the likely diagnosis.28
P wave position. A careful review of the position of the P wave with respect to the QRS complex can provide additional help in distinguishing between AVNRT and AVRT. In 66% of AVNRTs, the P wave is hidden within the QRS complex;29 in 30%, a retrograde P wave closely follows the QRS complex, creating a “pseudo-S” wave; and 4% of the time, the P wave precedes the QRS complex.
In AVRT, a retrograde P wave follows the QRS complex. This creates a potential dilemma in differentiating 30% of AVNRTs from AVRT. In AVNRT, the retrograde P wave typically appears very close to the QRS complex, creating a pseudo-S wave. In the orthodromic AVRT, there is usually a separation between the QRS and retrograde P wave. In general, if the RP interval is <70 ms, the arrhythmia is usually due to typical AVNRT.28
ST segment elevation in lead aVR on a 12-lead EKG in a supraventricular tachycardia is about 70% sensitive and 70% to 83% specific for a diagnosis of AVRT.30,31 ST depression of more than 2 mm or T wave inversion is more common in AVRT than in AVNRT.32 QRS alternans, which refers to variations in QRS amplitude or direction with every other beat, has been reported to be indicative of AVRT, 33,34 but may in fact be a rate-dependent phenomenon that has little to do with the mechanism of tachycardias.35
Onset and termination and other indicators. Still uncertain? Patterns of arrhythmias and modes of onset and termination may provide additional help with the differential diagnosis.
Sinus tachycardias and atrial tachycardias frequently demonstrate a “warm up” in rate, for instance, while AVNRT and AVRT are often triggered by premature atrial contractions. A positive response to the Valsalva maneuver or to adenosine is typically characteristic of reentrant tachycardias using the AV node, such as AVNRT and AVRT.
Comparing a baseline 12-lead EKG with an EKG taken during an episode of tachycardia often provides further information about the mechanism of the arrhythmia. The presence of pre-excitation, the morphology of P waves, and the lack of retrograde P waves on a baseline EKG can be useful in narrowing the differential diagnosis.
Figures courtesy of: University of Buffalo and Buffalo General Hospital.
CORRESPONDENCE Vipul Gupta, MD, MPH, State University of New York at Buffalo, 131 Biomedical Education Building, Buffalo, NY 14214;
1. Yusuf S, Camm AJ. Deciphering the sinus tachycardias. Clin Cardiol. 2005;28:267-276.
2. Lee RJ, Shinbane JS. Inappropriate sinus tachycardia. Diagnosis and treatment. Cardiol Clin. 1997;15:599-605.
3. Morillo CA, Klein GJ, Thakur RK, et al. Mechanism of ‘inappropriate’ sinus tachycardia. Circulation. 1994;90:873-877.
4. Bauernfeind RA, Amat-y-Leon F, Dhingra RC, et al. Chronic nonparoxysmal sinus tachycardia in otherwise healthy persons. Ann Intern Med. 1979;91:702-710.
5. Low PA, Opfer-Gehrking TL, Textor SC, et al. Postural tachycardia syndrome (POTS). Neurology. 1995;45(suppl 5):S19-S25.
6. Raj SR. The postural tachycardia syndrome (POTS): pathophysiology, diagnosis & management. Indian Pacing Electrophysiol J. 2006;6:84-99.
7. Grubb BP, Kanjwal MY, Kosinski DJ. Review: the postural orthostatic tachycardia syndrome. J Interv Card Electrophysiol. 2001;5:9-16.
8. Kanjwal MY, Kosinski DJ, Grubb BP. Treatment of postural orthostatic tachycardia syndrome and inappropriate sinus tachycardia. Curr Cardiol Rep. 2003;5:402-406.
9. Simmers TA, Sreeram N. Sinoatrial reentry tachycardia: a review. Indian Pacing Electrophysiol J. 2003;3:109-116.
10. Saoudi N, Cosío F, Waldo A, et al. Working Group of Arrhythmias of the European Society of Cardiology and the North American Society of Pacing and Electrophysiology. A classification of atrial flutter and regular atrial tachycardia according to electrophysiological mechanisms and anatomical bases. Eur Heart J. 2001;22:1162-1182.
11. Teh AW, Kistler PM, Kalman JM. Using the 12-lead ECG to localize the origin of ventricular and atrial tachycardias: part 1.J Cardiovasc Electrophysiol. 2009;20:706-709.
12. Roberts-Thomson KC, Kistler PM, Kalman JM. Focal atrial tachycardia I: clinical features, diagnosis, mechanisms, and anatomic location. Pacing Clin Electrophysiol. 2006;29:643-652.
13. Rosso R, Kistler PM. Focal atrial tachycardia. Heart. 2010;96:181-185.
14. Schwartz M, Rodman D, Lowenstein SR. Recognition and treatment of multifocal atrial tachycardia: a critical review. J Emerg Med. 1994;12:353-360.
15. Kwaku KF, Josephson ME. Typical AVNRT-an update on mechanisms and therapy. Cardiol Electrophysiol Rev. 2002;6:414-421.
16. Nawata H, Yamamoto N, Hirao K, et al. Heterogeneity of anterograde fast-pathway and retrograde slow-pathway conduction patterns in patients with the fast-slow form of atrioventricular nodal reentrant tachycardia. J Am Coll Cardiol. 1998;32:1731-1740.
17. Fox DJ, Tischenko A, Krahn AD, et al. Supraventricular tachycardia. Mayo Clin Proc. 2008;83:1400-1411.
18. Go AS, Hylek EM, Phillips KA, et al. Prevalence of diagnosed atrial fibrillation in adults: national implications for rhythm management and stroke prevention. JAMA. 2001;285:2370-2375.
19. Falk RH. Atrial fibrillation. N Engl J Med. 2001;344:1067-1078.
20. Garson A, Gillette PC. Junctional ectopic tachycardia in children: electrocardiography, electrophysiology and pharmacologic response. Am J Cardiol. 1979;44:298-302.
21. Villain E, Vetter VL, Garcia JM, et al. Evolving concepts in the management of congenital junctional ectopic tachycardia. A multicenter study. Circulation. 1990;81:1544-1549.
22. Sarubbi B, Vergara P, D’Alto M, et al. Congenital junctional ectopic tachycardia: presentation and outcome. Indian Pacing Electrophysiol J. 2003;3:143-147.
23. Tada H, Nogami A, Naito S, et al. Simple electrocardiographic criteria for identifying the site of origin of focal right atrial tachycardia. Pacing Clin Electrophysiol. 2006;21:2431-2439.
24. Kistler PM, Roberts-Thomson KC, Haqqani HM, et al. P wave morphology in focal atrial tachycardia. J Am Coll Cardiol. 2006;48:1010-1017.
25. Divakara Menon SM, Healey JS, Nair GM, et al. A case of long-RP tachycardia. J Cardiovasc Electrophysiol. 2009;20:702-704.
26. Lerman BB, Greenberg M, Overholt ED, et al. Differential electrophysiologic properties of decremental retrograde pathways in long RP’ tachycardia. Circulation. 1987;76:21-31.
27. Zipes DP. Clinical application of the electrocardiogram. J Am Coll Cardiol. 2000;36:1746-1748.
28. Blomström-Lundqvist C, Scheinman MM, Aliot EM, et al. ACC/AHA/ESC guidelines for the management of patients with supraventricular arrhythmias-executive summary. Circulation. 2003;108:1871-1909.
29. Farre J, Wellens HJJ. The value of electrocardiogram in diagnosing site of origin and mechanism of supraventricular tachycardia Wellens HJJ, Kulbertus HE, eds. What’s New in Electrocardiography. Boston, Mass: Martinus Nijhoff; 1981:131.
30. Ho YL, Lin LY, Lin JL, et al. Usefulness of ST-segment elevation in lead aVR during tachycardia for determining the mechanism of narrow QRS complex tachycardia. Am J Cardiol. 2003;92:1424-1428.
31. Zhong YM, Guo JH, Hou AJ, et al. A modified electrocardiographic algorithm for differentiating typical atrioventricular node reentrant tachycardia from atrioventricular reciprocating tachycardia mediated by concealed accessory pathway. Int J Clin Pract. 2006;60:1371-1377.
32. Riva SI, Della Bella P, Fassini G, et al. Value of analysis of ST segment changes during tachycardia in determining type of narrow QRS complex tachycardia. J Am Coll Cardiol. 1996;27:1480-1485.
33. Green M, Heddle B, Dassen W, et al. Value of QRS alteration in determining the site of origin of narrow QRS supraventricular tachycardia. Circulation. 1983;68:368-373.
34. Kalbfleisch SJ, el-Atassi R, Calkins H, et al. Differentiation of paroxysmal narrow QRS complex tachycardias using the 12-lead electrocardiogram. J Am Coll Cardiol. 1993;21:85-89.
35. Morady F. Significance of QRS alternans during narrow QRS tachycardias. Pacing Clin Electrophysiol. 1991;14:2193-2198.
Is your patient sick—or hungry?
Late last year, news outlets nationwide confirmed what many had long suspected: America’s middle class is shrinking. The latest data from the US Census Bureau found that nearly half (48%) of Americans are poor or low income.1,2
That means 46.2 million people—more than 15% of US citizens—are living below the federal poverty level (FPL), which is $23,050 for a family of 4. Another 97.3 million (about 33%) meet the criterion for low income—earning between $23,050 and $45,869 for a family of 4.1,2 These numbers are based on the Census Bureau’s new supplemental poverty measure, which considers costs like medical and housing and benefits such as food stamps in calculating poverty.3
The way that census data are analyzed is a key consideration for policy makers and legislators. For primary care physicians, the findings simply serve as a critical reminder that millions of Americans—including some of your patients—are struggling to stay afloat.
In some cases, the problems patients face will be so severe that there won’t be much you can do about them. In others, there are steps you can take to lend a helping hand (TABLE).
TABLE
Help the poor and uninsured: 9 things you can do
|
Death by poverty?
That’s the title of a summary of a recent study, posted on the Web site of Columbia University’s Mailman School of Public Health.4 The researchers found that poverty, low levels of education, and a lack of social support, among other “social” factors, account for as many deaths as heart attack, stroke, and lung cancer.5
A related study, also by researchers at Columbia, attempted to quantify the health impact of some leading medical and nonmedical factors. Their findings: The detrimental effects of poverty, smoking, and being a high school dropout exceed those of binge drinking, being overweight or obese, and being uninsured.6 The average low-income individual loses 8.2 years of good health simply because of his or her economic status, the lead researcher reported. In contrast, the average loss associated with obesity is 4.2 years and 6.6 years with smoking. The overall health of the US population won’t improve until poverty rates are reduced and educational deficits are addressed, the lead researcher concluded.7
That’s not to negate the importance of health coverage, however: A Kaiser Family Foundation study of low-income adults found that fully half (51%) of those who lacked health insurance had not gone to a doctor or clinic in the previous 12 months—and 69% had received no preventive care in the course of the year.8
Another survey, completed in 2007, asked adults younger than 65 about their use of medication. About 1 in 7 (13.9%) said they had failed to fill a prescription in the previous year because they couldn’t afford it. Four years earlier, 10.3% had done so.9
Recently, however, the situation appears to have gotten even worse. In a 2011 Consumer Reports survey, just under half of adults taking prescription medication reported that they had cut costs by engaging in what the surveyors described as “risky health care tradeoffs”—eg, not filling a prescription, skipping doses, or taking an expired medication.10
Poverty in childhood has long-lasting effects
Children may be less likely than adults to require prescription drugs, but they are typically the hardest hit by poverty—both in numbers and long-term effects. The poverty rate for those younger than 18 is 22%, according to the National Center for Children in Poverty.11 For kids under the age of 5, it’s more than 25%.12
Children of poor, uneducated parents have worse health and die earlier than those whose families are wealthier and better educated, research suggests.13-16 Even kids from middle class families fall short on measures of health and well-being compared with children whose families are more affluent. What’s more, being poor in early childhood appears to have lasting effects. Regardless of social or economic status or individual behavior later in life, studies suggest that the stress of poverty in the early years is associated with chronic illness and disability in adulthood.13-16
The bottom line, according to the Robert Wood Johnson Commission to Build a Healthier America: “For the first time in our history, the United States is raising a generation of children who may live sicker, shorter lives than their parents.”13 Hunger, or the lack of an adequate supply of nutritious food, is a key factor.17
Hunger hits home
In an op-ed in the San Francisco Chronicle, family physician Laura Gottlieb told the story of an 8-year-old boy whose family she’d known for years. Brought to her office because of abdominal pain, the boy underwent multiple tests, including urine and stool examinations, blood work, and imaging studies. As soon as one test came back, Dr. Gottlieb ordered another. All were negative, and no cause for GI distress was found.18
Only later did she discover that hunger was the source of the pain. “It had never even occurred to me to ask his mother about how much food there was in the house,” Dr. Gottlieb wrote.18
In a similar vein, CBS News recently ran a story about a high school football team that seemed to be down on its luck. Besides being on a losing streak, many of the players were lethargic. Eventually, an astute coach realized that a mental pickup wasn’t what the team members needed—nutrition was. In this impoverished Burke County, Georgia school, about 85% of the student body qualify for in-school breakfast and lunch. But for many kids, those 2 meals were all they had to eat.19
With the help of a school nutritionist and the federal Healthy Hunger-Free Kids Act, hundreds of students now receive dinner, too. And last season, in late 2011, the properly fueled team members went on to win the state championship.19
Who is “food insecure”? In 2010, the latest year for which figures are available, 14.5% of US households (representing a total of 48.8 million people) were “food insecure,” as the problem of having too little to eat is officially known.20 Most of these families managed without substantially disrupting their normal eating patterns or reducing their intake, the US Department of Agriculture reports. This was accomplished by cutting back on the variety of foods they ate, getting federal food assistance, or getting food from food banks, among other coping strategies. But for 6.4 million households, the problem was severe enough to disrupt normal eating patterns and cause those affected to eat less than usual at least part of the time in the course of the year.20
Here, too, the toll on children is especially high. Twenty percent of households with children face food insecurity, nearly twice the rate of childless households.20 In a child’s earliest years, too little energy, protein, and other nutrients can result in long-lasting deficits in social, cognitive, and emotional development; malnutrition and deficiencies in vitamins and minerals may even result in brain impairment.18 In addition, school-age children who don’t have enough to eat have more behavioral problems and are more likely than those who are not struggling with hunger to be in special education classes.17
The hunger and obesity link
Ironically, hunger is also associated with obesity. High calorie, high carbohydrate foods like pasta and bread typically cost considerably less than nutrient-rich low-carb foods like cheese, fruit, fish, and vegetables, and are more filling. And in poor neighborhoods, food that is high in carbohydrates and low in protein and other nutrients tends to be more available than fresh, healthy—and more perishable—food.21
What’s more, people living in poverty may find it especially difficult to exercise. In many neighborhoods, exercising outdoors can be dangerous, gyms are unaffordable, and safe parks and playgrounds may be few and far between.21
Identifying poor and hungry patients
In a survey conducted by the Childhood Hunger Initiative of Oregon, most of the nearly 200 physicians and nurse practitioners who responded expressed a desire to learn more about the consequences of hunger and how to address them. Besides being uncomfortable broaching the subject of hunger and other poverty-related issues, the providers cited time constraints as a barrier to doing so.22
Ask this question
Citing similar obstacles, Canadian researchers conducted a pilot study in search of an easy-to-use, evidence-based “case-finding” tool. They offered questionnaires to patients at 4 clinics in British Columbia to determine which questions had the highest likelihood of determining whether an individual was struggling with hunger, poverty, or homelessness. Participants, which included patients above (n=94) and below (n=51) the poverty line, were also asked how they felt about being asked such questions.23
One particular question—“Do you (ever) have difficulty making ends meet at the end of the month?”—proved to be the best predictor of poverty. Although 2 additional questions about food and housing were identified as suitable for a 3-item screening tool, this single question alone had 98% sensitivity and 60% specificity (odds ratio, 32.3; 95% confidence interval, 5.4-191.5). Equally important, 85% of study participants with income below the poverty level thought that poverty screening was important, and 67% said they felt comfortable talking to their family physician about it.23
Take this course
In response to the results of the provider survey conducted by the Childhood Hunger Initiative of Oregon, a team at the Oregon State University Extension Service developed an online training program. The free 5-module course, available at http://oregonstate.edu/instruct/dce/chi/modules.html, addresses the impact of childhood hunger and provides screening and intervention tips.24
A recommended strategy is to incorporate a question related to hunger and food insecurity into the medical history or physical assessment. Noting that you’ll learn more by asking whether a family has sufficient resources to provide a healthy diet than by simply inquiring about a balanced diet, a narrator uses this wording:
“In the past month, was there any day when you or anyone in your family went hungry because you didn’t have enough money for food?”24
What you can do to help needy patients
Some patients who are out of work, uninsured, and barely able to pay for food and shelter will simply put off doctor visits—or come in only after their condition is so dire that you have no recourse but to send them to the emergency department (ED). The result, of course, is just the opposite of what they had hoped for. They end up with a much larger bill—or, if they have coverage, with a much bigger copay—not to mention a far more serious condition than they would likely have had if they’d come in sooner.
Here are some ways you can help.
Discuss costs with uninsured patients. To encourage uninsured patients to come in before their condition worsens, make them aware of the comparatively low cost of a visit to your office vs that of, say, imaging studies, specialist visits, and lab tests, as well as ED costs. That’s one of the interventions recommended by Robert A. Forester, MD, and Richard J. Heck, MD, the authors of “What You Can Do to Help Your Uninsured Patients.”25 Consider offering discounts to low-income patients (within the bounds of Medicare and other insurance provisions), they also suggest.
Use fewer diagnostic tests. Ordering a battery of tests when a diagnosis is not readily apparent is a “cost-insensitive” way to practice medicine, authors Forester and Heck observe. Spending additional time with such patients, using your cognitive and diagnostic skills and performing a complete history and physical, frequently results in a diagnosis and treatment plan, they note.25 If patients are aware that you’re trying to minimize costs, they’ll often consent to a step-by-step diagnostic work-up that can be stopped at any time it is appropriate.
Do it yourself. Expand your practice to include a variety of minor procedures, such as removal or biopsy of common skin lesions, colposcopy, or setting simple fractures. These measures can help keep costs down to better serve poor and low-income patients. The American Academy of Family Physicians offers courses and training in various procedures that family physicians can competently perform in their own offices.
Request a courtesy consult. On occasion, you may be able to avoid a costly referral by calling a colleague and asking for a courtesy consult. The specialist will often tell you how he or she would handle a clinical presentation like the one you describe and suggest you try a similar approach, suggests Doug Campos-Outcalt, MD, MPA. Dr. Campos-Outcalt, a faculty member at the University of Arizona College of Medicine and the author of JFP’s bimonthly Practice Alert column, has extensive experience working with underserved communities.
Connect patients with community services. Poor patients typically have many social and psychological needs, as well as the need for medical care, and integrated care is particularly important for those facing hunger, homelessness, and chronic illness, says Jonathan Cartsonis, MD, medical director of Healthcare for the Homeless in Phoenix. Maintain contact with hospital social services and emergency psychiatric services, and have information—and handouts—about local food banks, homeless shelters, and community clinics, among other resources. (See the resources listed in the box.)
Feeding America Food Bank Locator
http://feedingamerica.org/foodbank-results.aspx
Insure Kids Now
http://www.insurekidsnow.gov/state/index.html/
National Association of Free and Charitable Clinics
http://www.freemedicalcamps.com
Nutrition Standards for School Meals (Healthy, Hunger-Free Kids Act)
http://www.fns.usda.gov/cnd/Governance/Legislation/nutritionstandards.htm
Partnership for Prescription Assistance
www.pparx.org
Rx Outreach
http://rxoutreach.com/
SNAP (Supplemental Nutrition Assistance Program)
http://www.fns.usda.gov/snap/applicant_recipients/eligibility.htm#income
WIC (Supplemental Nutrition Program for Women, Infants and Children)
http://stars.fns.usda.gov/wps/pages/start.jsf
In Seattle, for example, “Project Access” is an organization that helps give the underserved access to specialists. And in many parts of the country, local Rotary clubs sponsor free clinics staffed with volunteer and retired physicians, working cooperatively with local pharmacies to provide at-cost generic drugs.
Keep drug costs down
Physicians can help to insulate their poor and low-income patients from high drug costs in a number of ways:
Reduce polypharmacy. Half of Americans take at least one prescription drug, according to the 2011 Consumer Reports survey. Among this group, people with limited income—those earning less than $40,000—take, on average, 5.7 different drugs.10 Eliminating unnecessary medications, including supplements, herbs, and any other over-the-counter products, can lead to substantial savings. To determine what can be eliminated, ask patients to bring in everything they’re taking and conduct a brown bag medication review. To learn more, see “Help your patient ‘get’ what you just said: A health literacy guide” (J Fam Pract. 2012;61:190-196).
Prescribe generics. Newer brand-name drugs may not be markedly better than older, established agents. And many generics are available at major retailers like Wal-Mart for just a few dollars for a 30-day supply or at CVS for $9.99 for a 3-month supply.26 Yet some physicians routinely order newer medications, even for indigent patients.
Be upfront about drug costs. When you prescribe a new drug, whether generic or branded, it is important to discuss the cost (easily accessible online and in many electronic medical record systems) with the patient. Yet only 5% of respondents to the 2011 Consumer Reports survey said their health care providers had done so. Two-thirds of those surveyed (64%) did not discover the cost of a drug until they went to a pharmacy to pick it up.10
Think twice before handing out samples. Drug samples would appear to benefit the poor and the uninsured, but evidence suggests otherwise.27,28 In a study that assessed out-of-pocket costs associated with the use of samples, patients who had never received samples had lower out-of-pocket costs.28 That’s partly because most samples are newer, more expensive drugs, and patients who start taking them are often unable to afford the cost of a prescription. Another study found that the use of generic drugs for uninsured patients rose (from 12% to 30%) after the clinic discontinued the use of samples.27
CORRESPONDENCE Laura C. Lippman, MD, 2311 North 45th Street, No. 171, Seattle, WA 98103; lclippman@gmail.com
1. Tavernise S, Gebeloff R. New way to tally poor recasts view of poverty. New York Times. November 7, 2011. Available at: http://www.nytimes.com/2011/11/08/us/poverty-gets-new-measure-at-census-bureau.html?_r=2&scp=1&sq=poverty&st=cse. Accessed March 12, 2012.
2. Income poverty and health insurance coverage in the United States: 2010 [press release]. Washington, DC: US Census Bureau; September 13, 2011. Available at: http://www.census.gov/newsroom/releases/archives/income_wealth/cb11-157.html. Accessed March 12, 2012.
3. Short K. The research supplemental poverty measure: 2010. Washington, DC: US Census Bureau; November 2011. Available at: http://www.census.gov/hhes/povmeas/methodology/supplemental/research/Short_ResearchSPM2010.pdf. Accessed March 13, 2012.
4. University Mailman School of Public Health. Death by poverty? June 16, 2011. Available at: http://www.mailman.columbia.edu/academic-departments/epidemiology/research-service/death-poverty. Accessed March 5, 2012.
5. Galea S, Tracy M, Hoggatt KJ, et al. Estimated deaths attributable to social factors in the United States. Am J Public Health. 2011;101:1456-1465
6. Muennig P, Fiscella K, Tancredi D, et al. The relative health burden of selected social and behavioral risk factors in the United States: implications for policy. Am J Public Health. 2010;100:1758-1764.
7. Columbia University Mailman School of Public Health. Poor face greater health burden than smokers or the obese. Available at: http://www.mailman.columbia.edu/academic-departments/health-policy/news-events/poor-face-greater-health-burden-smokers-or-obese. Accessed March 13, 2012.
8. Schwartz K. How trends in the health care system affect low-income adults: identifying access problems and financial burdens. December 21, 2007. Kaiser Family Foundation. Available at: http://www.kff.org/uninsured/7705.cfm. Accessed March 2, 2012.
9. Felland LE, Reschovsky JD. More nonelderly Americans face problems affording prescription drugs. Tracking report no. 22. January 2009. Center for Studying Health System Change. Available at: http://www.hschange.com/CONTENT/1039/. Accessed January 25, 2012.
10. Consumer Reports poll: 48 percent of Americans on meds making risky health care tradeoffs [press release]. Yonkers, NY: Consumer Reports; September 27, 2011. Available at: http://www.prnewswire.com/news-releases/consumer-reports-poll—48-percent-of-americans-on-meds-making-risky-health-care-tradeoffs-130618778.html. Accessed January 3, 2012.
11. A job-loss recovery hurts children most: statistics tell an alarming story [press release] New York, NY: National Center for Children in Poverty; September 15, 2011. Available at: http://www.nccp.org/media/releases/release_135.html. Accessed January 24, 2012.
12. Child Trends Data Bank. Children in poverty. Updated September 2011. Available at: http://www.childtrendsdatabank.org/?q=node/221. Accessed March 13, 2012.
13. Robert Wood Johnson Foundation. Overcoming obstacles to health. Princeton, NJ: RWJF Commission to Build a Healthier America; February 2008. Available at: http://www.rwjf.org/files/research/obstaclestohealth.pdf. Accessed March 22, 2012.
14. Shonkoff JP, Garner AS. Committee on Psychosocial Aspects of Child and Family Health; Committee on Early Childhood, Adoption, and Dependent Care; Section on Developmental and Behavioral Pediatrics. The lifelong effects of early childhood adversity and toxic stress. Pediatrics. 2012;129:e232-e246.
15. Stein DJ, Scott K, Haro Abad JM, et al. Early childhood adversity and later hypertension: data from the World Mental Health Survey. Ann Clin Psychiatry. 2010;22:19-28.
16. O’Rand AM, Hamil-Luker J. Processes of cumulative adversity: childhood disadvantage and increased risk of heart attack across the life course. J Gerontol B Psychol Sci Soc Sci. 2005;60(spec no 2):117-124.
17. American Psychological Association. Effects of poverty, hunger, and homelessness on children and youth. Available at: http://www.apa.org/pi/families/poverty.aspx. Accessed November 29, 2011.
18. Gottlieb L. Funding healthy society helps cure health care. San Francisco Chronicle. August 23, 2010:A-8.
19. Doane S. High school football team battles malnutrition. December 20, 2011. CBS News. Available at: http://www.cbsnews.com/8301-18563_162-57345857/high-school-football-team-battles-malnutrition/. Accessed March 13, 2012.
20. US Department of Agriculture Economic Research Service. Food security in the United States: key statistics and graphics. Updated September 7, 2011. Available at: http://www.ers.usda.gov/Briefing/FoodSecurity/stats_graphs.htm. Accessed March 1, 2012.
21. Drewnowski A, Damon N. Food choices and diet costs: an economic analysis. J Nutr. 2005;135:900-904.
22. Survey helps doctors help hungry patients [press release]. Portland, Ore: Oregon State University Extension Service; May 27, 2008. Available at: http://extension.oregonstate.edu/news/release/2008/05/survey-helps-doctors-help-hungry-patients. Accessed February 29, 2012.
23. Brcic V, Eberdt C, Kaczorowski J. Development of a tool to identify poverty in a family practice setting: a pilot study. Int J Family Med. 2011;2011:812182.
24. Childhood food insecurity: health impacts, screening and intervention [course summary]. Corvallis, Ore: Oregon State University Extended Campus; 2010. Available at: http://oregonstate.edu/instruct/dce/chi/module5_8.html. Accessed March 13, 2012.
25. Forester RA, Heck RJ. What you can do to help your uninsured patients. Fam Pract Manag. 2009;16:21-24.
26. Byrd C. CVS drug prices takes on Wal-Mart’s generic drug prices—with a gimmicky twist. eDrugSearch. Available at: http://www.edrugsearch.com/edsblog/cvs-takes-on-wal-marts-generic-drug-prices-with-a-gimmicky-twist/. Accessed March 13, 2012.
27. Miller DP, Mansfield RJ, Woods JB, et al. The impact of drug samples on prescribing to the uninsured. South Med J. 2008;101:888-893.
28. Chimonas S, Kassirer JP. No more free drug samples? PLoS Med. 2009;6:e1000074.
Late last year, news outlets nationwide confirmed what many had long suspected: America’s middle class is shrinking. The latest data from the US Census Bureau found that nearly half (48%) of Americans are poor or low income.1,2
That means 46.2 million people—more than 15% of US citizens—are living below the federal poverty level (FPL), which is $23,050 for a family of 4. Another 97.3 million (about 33%) meet the criterion for low income—earning between $23,050 and $45,869 for a family of 4.1,2 These numbers are based on the Census Bureau’s new supplemental poverty measure, which considers costs like medical and housing and benefits such as food stamps in calculating poverty.3
The way that census data are analyzed is a key consideration for policy makers and legislators. For primary care physicians, the findings simply serve as a critical reminder that millions of Americans—including some of your patients—are struggling to stay afloat.
In some cases, the problems patients face will be so severe that there won’t be much you can do about them. In others, there are steps you can take to lend a helping hand (TABLE).
TABLE
Help the poor and uninsured: 9 things you can do
|
Death by poverty?
That’s the title of a summary of a recent study, posted on the Web site of Columbia University’s Mailman School of Public Health.4 The researchers found that poverty, low levels of education, and a lack of social support, among other “social” factors, account for as many deaths as heart attack, stroke, and lung cancer.5
A related study, also by researchers at Columbia, attempted to quantify the health impact of some leading medical and nonmedical factors. Their findings: The detrimental effects of poverty, smoking, and being a high school dropout exceed those of binge drinking, being overweight or obese, and being uninsured.6 The average low-income individual loses 8.2 years of good health simply because of his or her economic status, the lead researcher reported. In contrast, the average loss associated with obesity is 4.2 years and 6.6 years with smoking. The overall health of the US population won’t improve until poverty rates are reduced and educational deficits are addressed, the lead researcher concluded.7
That’s not to negate the importance of health coverage, however: A Kaiser Family Foundation study of low-income adults found that fully half (51%) of those who lacked health insurance had not gone to a doctor or clinic in the previous 12 months—and 69% had received no preventive care in the course of the year.8
Another survey, completed in 2007, asked adults younger than 65 about their use of medication. About 1 in 7 (13.9%) said they had failed to fill a prescription in the previous year because they couldn’t afford it. Four years earlier, 10.3% had done so.9
Recently, however, the situation appears to have gotten even worse. In a 2011 Consumer Reports survey, just under half of adults taking prescription medication reported that they had cut costs by engaging in what the surveyors described as “risky health care tradeoffs”—eg, not filling a prescription, skipping doses, or taking an expired medication.10
Poverty in childhood has long-lasting effects
Children may be less likely than adults to require prescription drugs, but they are typically the hardest hit by poverty—both in numbers and long-term effects. The poverty rate for those younger than 18 is 22%, according to the National Center for Children in Poverty.11 For kids under the age of 5, it’s more than 25%.12
Children of poor, uneducated parents have worse health and die earlier than those whose families are wealthier and better educated, research suggests.13-16 Even kids from middle class families fall short on measures of health and well-being compared with children whose families are more affluent. What’s more, being poor in early childhood appears to have lasting effects. Regardless of social or economic status or individual behavior later in life, studies suggest that the stress of poverty in the early years is associated with chronic illness and disability in adulthood.13-16
The bottom line, according to the Robert Wood Johnson Commission to Build a Healthier America: “For the first time in our history, the United States is raising a generation of children who may live sicker, shorter lives than their parents.”13 Hunger, or the lack of an adequate supply of nutritious food, is a key factor.17
Hunger hits home
In an op-ed in the San Francisco Chronicle, family physician Laura Gottlieb told the story of an 8-year-old boy whose family she’d known for years. Brought to her office because of abdominal pain, the boy underwent multiple tests, including urine and stool examinations, blood work, and imaging studies. As soon as one test came back, Dr. Gottlieb ordered another. All were negative, and no cause for GI distress was found.18
Only later did she discover that hunger was the source of the pain. “It had never even occurred to me to ask his mother about how much food there was in the house,” Dr. Gottlieb wrote.18
In a similar vein, CBS News recently ran a story about a high school football team that seemed to be down on its luck. Besides being on a losing streak, many of the players were lethargic. Eventually, an astute coach realized that a mental pickup wasn’t what the team members needed—nutrition was. In this impoverished Burke County, Georgia school, about 85% of the student body qualify for in-school breakfast and lunch. But for many kids, those 2 meals were all they had to eat.19
With the help of a school nutritionist and the federal Healthy Hunger-Free Kids Act, hundreds of students now receive dinner, too. And last season, in late 2011, the properly fueled team members went on to win the state championship.19
Who is “food insecure”? In 2010, the latest year for which figures are available, 14.5% of US households (representing a total of 48.8 million people) were “food insecure,” as the problem of having too little to eat is officially known.20 Most of these families managed without substantially disrupting their normal eating patterns or reducing their intake, the US Department of Agriculture reports. This was accomplished by cutting back on the variety of foods they ate, getting federal food assistance, or getting food from food banks, among other coping strategies. But for 6.4 million households, the problem was severe enough to disrupt normal eating patterns and cause those affected to eat less than usual at least part of the time in the course of the year.20
Here, too, the toll on children is especially high. Twenty percent of households with children face food insecurity, nearly twice the rate of childless households.20 In a child’s earliest years, too little energy, protein, and other nutrients can result in long-lasting deficits in social, cognitive, and emotional development; malnutrition and deficiencies in vitamins and minerals may even result in brain impairment.18 In addition, school-age children who don’t have enough to eat have more behavioral problems and are more likely than those who are not struggling with hunger to be in special education classes.17
The hunger and obesity link
Ironically, hunger is also associated with obesity. High calorie, high carbohydrate foods like pasta and bread typically cost considerably less than nutrient-rich low-carb foods like cheese, fruit, fish, and vegetables, and are more filling. And in poor neighborhoods, food that is high in carbohydrates and low in protein and other nutrients tends to be more available than fresh, healthy—and more perishable—food.21
What’s more, people living in poverty may find it especially difficult to exercise. In many neighborhoods, exercising outdoors can be dangerous, gyms are unaffordable, and safe parks and playgrounds may be few and far between.21
Identifying poor and hungry patients
In a survey conducted by the Childhood Hunger Initiative of Oregon, most of the nearly 200 physicians and nurse practitioners who responded expressed a desire to learn more about the consequences of hunger and how to address them. Besides being uncomfortable broaching the subject of hunger and other poverty-related issues, the providers cited time constraints as a barrier to doing so.22
Ask this question
Citing similar obstacles, Canadian researchers conducted a pilot study in search of an easy-to-use, evidence-based “case-finding” tool. They offered questionnaires to patients at 4 clinics in British Columbia to determine which questions had the highest likelihood of determining whether an individual was struggling with hunger, poverty, or homelessness. Participants, which included patients above (n=94) and below (n=51) the poverty line, were also asked how they felt about being asked such questions.23
One particular question—“Do you (ever) have difficulty making ends meet at the end of the month?”—proved to be the best predictor of poverty. Although 2 additional questions about food and housing were identified as suitable for a 3-item screening tool, this single question alone had 98% sensitivity and 60% specificity (odds ratio, 32.3; 95% confidence interval, 5.4-191.5). Equally important, 85% of study participants with income below the poverty level thought that poverty screening was important, and 67% said they felt comfortable talking to their family physician about it.23
Take this course
In response to the results of the provider survey conducted by the Childhood Hunger Initiative of Oregon, a team at the Oregon State University Extension Service developed an online training program. The free 5-module course, available at http://oregonstate.edu/instruct/dce/chi/modules.html, addresses the impact of childhood hunger and provides screening and intervention tips.24
A recommended strategy is to incorporate a question related to hunger and food insecurity into the medical history or physical assessment. Noting that you’ll learn more by asking whether a family has sufficient resources to provide a healthy diet than by simply inquiring about a balanced diet, a narrator uses this wording:
“In the past month, was there any day when you or anyone in your family went hungry because you didn’t have enough money for food?”24
What you can do to help needy patients
Some patients who are out of work, uninsured, and barely able to pay for food and shelter will simply put off doctor visits—or come in only after their condition is so dire that you have no recourse but to send them to the emergency department (ED). The result, of course, is just the opposite of what they had hoped for. They end up with a much larger bill—or, if they have coverage, with a much bigger copay—not to mention a far more serious condition than they would likely have had if they’d come in sooner.
Here are some ways you can help.
Discuss costs with uninsured patients. To encourage uninsured patients to come in before their condition worsens, make them aware of the comparatively low cost of a visit to your office vs that of, say, imaging studies, specialist visits, and lab tests, as well as ED costs. That’s one of the interventions recommended by Robert A. Forester, MD, and Richard J. Heck, MD, the authors of “What You Can Do to Help Your Uninsured Patients.”25 Consider offering discounts to low-income patients (within the bounds of Medicare and other insurance provisions), they also suggest.
Use fewer diagnostic tests. Ordering a battery of tests when a diagnosis is not readily apparent is a “cost-insensitive” way to practice medicine, authors Forester and Heck observe. Spending additional time with such patients, using your cognitive and diagnostic skills and performing a complete history and physical, frequently results in a diagnosis and treatment plan, they note.25 If patients are aware that you’re trying to minimize costs, they’ll often consent to a step-by-step diagnostic work-up that can be stopped at any time it is appropriate.
Do it yourself. Expand your practice to include a variety of minor procedures, such as removal or biopsy of common skin lesions, colposcopy, or setting simple fractures. These measures can help keep costs down to better serve poor and low-income patients. The American Academy of Family Physicians offers courses and training in various procedures that family physicians can competently perform in their own offices.
Request a courtesy consult. On occasion, you may be able to avoid a costly referral by calling a colleague and asking for a courtesy consult. The specialist will often tell you how he or she would handle a clinical presentation like the one you describe and suggest you try a similar approach, suggests Doug Campos-Outcalt, MD, MPA. Dr. Campos-Outcalt, a faculty member at the University of Arizona College of Medicine and the author of JFP’s bimonthly Practice Alert column, has extensive experience working with underserved communities.
Connect patients with community services. Poor patients typically have many social and psychological needs, as well as the need for medical care, and integrated care is particularly important for those facing hunger, homelessness, and chronic illness, says Jonathan Cartsonis, MD, medical director of Healthcare for the Homeless in Phoenix. Maintain contact with hospital social services and emergency psychiatric services, and have information—and handouts—about local food banks, homeless shelters, and community clinics, among other resources. (See the resources listed in the box.)
Feeding America Food Bank Locator
http://feedingamerica.org/foodbank-results.aspx
Insure Kids Now
http://www.insurekidsnow.gov/state/index.html/
National Association of Free and Charitable Clinics
http://www.freemedicalcamps.com
Nutrition Standards for School Meals (Healthy, Hunger-Free Kids Act)
http://www.fns.usda.gov/cnd/Governance/Legislation/nutritionstandards.htm
Partnership for Prescription Assistance
www.pparx.org
Rx Outreach
http://rxoutreach.com/
SNAP (Supplemental Nutrition Assistance Program)
http://www.fns.usda.gov/snap/applicant_recipients/eligibility.htm#income
WIC (Supplemental Nutrition Program for Women, Infants and Children)
http://stars.fns.usda.gov/wps/pages/start.jsf
In Seattle, for example, “Project Access” is an organization that helps give the underserved access to specialists. And in many parts of the country, local Rotary clubs sponsor free clinics staffed with volunteer and retired physicians, working cooperatively with local pharmacies to provide at-cost generic drugs.
Keep drug costs down
Physicians can help to insulate their poor and low-income patients from high drug costs in a number of ways:
Reduce polypharmacy. Half of Americans take at least one prescription drug, according to the 2011 Consumer Reports survey. Among this group, people with limited income—those earning less than $40,000—take, on average, 5.7 different drugs.10 Eliminating unnecessary medications, including supplements, herbs, and any other over-the-counter products, can lead to substantial savings. To determine what can be eliminated, ask patients to bring in everything they’re taking and conduct a brown bag medication review. To learn more, see “Help your patient ‘get’ what you just said: A health literacy guide” (J Fam Pract. 2012;61:190-196).
Prescribe generics. Newer brand-name drugs may not be markedly better than older, established agents. And many generics are available at major retailers like Wal-Mart for just a few dollars for a 30-day supply or at CVS for $9.99 for a 3-month supply.26 Yet some physicians routinely order newer medications, even for indigent patients.
Be upfront about drug costs. When you prescribe a new drug, whether generic or branded, it is important to discuss the cost (easily accessible online and in many electronic medical record systems) with the patient. Yet only 5% of respondents to the 2011 Consumer Reports survey said their health care providers had done so. Two-thirds of those surveyed (64%) did not discover the cost of a drug until they went to a pharmacy to pick it up.10
Think twice before handing out samples. Drug samples would appear to benefit the poor and the uninsured, but evidence suggests otherwise.27,28 In a study that assessed out-of-pocket costs associated with the use of samples, patients who had never received samples had lower out-of-pocket costs.28 That’s partly because most samples are newer, more expensive drugs, and patients who start taking them are often unable to afford the cost of a prescription. Another study found that the use of generic drugs for uninsured patients rose (from 12% to 30%) after the clinic discontinued the use of samples.27
CORRESPONDENCE Laura C. Lippman, MD, 2311 North 45th Street, No. 171, Seattle, WA 98103; lclippman@gmail.com
1. Tavernise S, Gebeloff R. New way to tally poor recasts view of poverty. New York Times. November 7, 2011. Available at: http://www.nytimes.com/2011/11/08/us/poverty-gets-new-measure-at-census-bureau.html?_r=2&scp=1&sq=poverty&st=cse. Accessed March 12, 2012.
2. Income poverty and health insurance coverage in the United States: 2010 [press release]. Washington, DC: US Census Bureau; September 13, 2011. Available at: http://www.census.gov/newsroom/releases/archives/income_wealth/cb11-157.html. Accessed March 12, 2012.
3. Short K. The research supplemental poverty measure: 2010. Washington, DC: US Census Bureau; November 2011. Available at: http://www.census.gov/hhes/povmeas/methodology/supplemental/research/Short_ResearchSPM2010.pdf. Accessed March 13, 2012.
4. University Mailman School of Public Health. Death by poverty? June 16, 2011. Available at: http://www.mailman.columbia.edu/academic-departments/epidemiology/research-service/death-poverty. Accessed March 5, 2012.
5. Galea S, Tracy M, Hoggatt KJ, et al. Estimated deaths attributable to social factors in the United States. Am J Public Health. 2011;101:1456-1465
6. Muennig P, Fiscella K, Tancredi D, et al. The relative health burden of selected social and behavioral risk factors in the United States: implications for policy. Am J Public Health. 2010;100:1758-1764.
7. Columbia University Mailman School of Public Health. Poor face greater health burden than smokers or the obese. Available at: http://www.mailman.columbia.edu/academic-departments/health-policy/news-events/poor-face-greater-health-burden-smokers-or-obese. Accessed March 13, 2012.
8. Schwartz K. How trends in the health care system affect low-income adults: identifying access problems and financial burdens. December 21, 2007. Kaiser Family Foundation. Available at: http://www.kff.org/uninsured/7705.cfm. Accessed March 2, 2012.
9. Felland LE, Reschovsky JD. More nonelderly Americans face problems affording prescription drugs. Tracking report no. 22. January 2009. Center for Studying Health System Change. Available at: http://www.hschange.com/CONTENT/1039/. Accessed January 25, 2012.
10. Consumer Reports poll: 48 percent of Americans on meds making risky health care tradeoffs [press release]. Yonkers, NY: Consumer Reports; September 27, 2011. Available at: http://www.prnewswire.com/news-releases/consumer-reports-poll—48-percent-of-americans-on-meds-making-risky-health-care-tradeoffs-130618778.html. Accessed January 3, 2012.
11. A job-loss recovery hurts children most: statistics tell an alarming story [press release] New York, NY: National Center for Children in Poverty; September 15, 2011. Available at: http://www.nccp.org/media/releases/release_135.html. Accessed January 24, 2012.
12. Child Trends Data Bank. Children in poverty. Updated September 2011. Available at: http://www.childtrendsdatabank.org/?q=node/221. Accessed March 13, 2012.
13. Robert Wood Johnson Foundation. Overcoming obstacles to health. Princeton, NJ: RWJF Commission to Build a Healthier America; February 2008. Available at: http://www.rwjf.org/files/research/obstaclestohealth.pdf. Accessed March 22, 2012.
14. Shonkoff JP, Garner AS. Committee on Psychosocial Aspects of Child and Family Health; Committee on Early Childhood, Adoption, and Dependent Care; Section on Developmental and Behavioral Pediatrics. The lifelong effects of early childhood adversity and toxic stress. Pediatrics. 2012;129:e232-e246.
15. Stein DJ, Scott K, Haro Abad JM, et al. Early childhood adversity and later hypertension: data from the World Mental Health Survey. Ann Clin Psychiatry. 2010;22:19-28.
16. O’Rand AM, Hamil-Luker J. Processes of cumulative adversity: childhood disadvantage and increased risk of heart attack across the life course. J Gerontol B Psychol Sci Soc Sci. 2005;60(spec no 2):117-124.
17. American Psychological Association. Effects of poverty, hunger, and homelessness on children and youth. Available at: http://www.apa.org/pi/families/poverty.aspx. Accessed November 29, 2011.
18. Gottlieb L. Funding healthy society helps cure health care. San Francisco Chronicle. August 23, 2010:A-8.
19. Doane S. High school football team battles malnutrition. December 20, 2011. CBS News. Available at: http://www.cbsnews.com/8301-18563_162-57345857/high-school-football-team-battles-malnutrition/. Accessed March 13, 2012.
20. US Department of Agriculture Economic Research Service. Food security in the United States: key statistics and graphics. Updated September 7, 2011. Available at: http://www.ers.usda.gov/Briefing/FoodSecurity/stats_graphs.htm. Accessed March 1, 2012.
21. Drewnowski A, Damon N. Food choices and diet costs: an economic analysis. J Nutr. 2005;135:900-904.
22. Survey helps doctors help hungry patients [press release]. Portland, Ore: Oregon State University Extension Service; May 27, 2008. Available at: http://extension.oregonstate.edu/news/release/2008/05/survey-helps-doctors-help-hungry-patients. Accessed February 29, 2012.
23. Brcic V, Eberdt C, Kaczorowski J. Development of a tool to identify poverty in a family practice setting: a pilot study. Int J Family Med. 2011;2011:812182.
24. Childhood food insecurity: health impacts, screening and intervention [course summary]. Corvallis, Ore: Oregon State University Extended Campus; 2010. Available at: http://oregonstate.edu/instruct/dce/chi/module5_8.html. Accessed March 13, 2012.
25. Forester RA, Heck RJ. What you can do to help your uninsured patients. Fam Pract Manag. 2009;16:21-24.
26. Byrd C. CVS drug prices takes on Wal-Mart’s generic drug prices—with a gimmicky twist. eDrugSearch. Available at: http://www.edrugsearch.com/edsblog/cvs-takes-on-wal-marts-generic-drug-prices-with-a-gimmicky-twist/. Accessed March 13, 2012.
27. Miller DP, Mansfield RJ, Woods JB, et al. The impact of drug samples on prescribing to the uninsured. South Med J. 2008;101:888-893.
28. Chimonas S, Kassirer JP. No more free drug samples? PLoS Med. 2009;6:e1000074.
Torture survivors: What to ask, how to document
• Screen for a history of torture if an individual from an immigrant group exhibits signs of depression or post-traumatic stress disorder, complains of unexplained pain, or is known to be seeking asylum. C
• Document a report of torture and any associated physical or psychological findings from your examination, and refer the individual for appropriate care. C
Strength of recommendation (SOR)
A Good-quality patient-oriented evidence
B Inconsistent or limited-quality patient-oriented evidence
C Consensus, usual practice, opinion, disease-oriented evidence, case series
Nearly half of the world’s 200 nations torture their citizens.1 Although survivors have high rates of physical and psychiatric morbidity, and in coming to this country tend to live in highly concentrated refugee groups, physicians rarely discover torture histories.2,3
Torture survivors may avoid speaking of it because they do not understand that treatment is available for their physical, psychiatric, and pain disorders. A lack of detection delays the diagnosis and treatment of the sequelae of torture. It may also affect their future safety: Individuals seeking asylum are deprived of the medical documentation needed to support their petitions.
Your involvement in recording histories and exam findings and in referring patients for specialized care can restore lives. It can also aid in reversing the “invisibility” of torture survivors that perpetuates inadequate clinical education, research, and development of appropriate therapies.
Are you caring for a survivor—and don’t know it? Approximately 500,000 torture survivors live in the United States.4 This equals the number of individuals with Parkinson’s disease and outnumbers those with multiple sclerosis.5,6 Physicians may encounter torture survivors in primary care settings, emergency departments, or while consulting with colleagues about patients who have specialized medical needs. There are no evidence-based guidelines for assessing and treating torture survivors. Most studies are from single institutions and have modest sample sizes. Most use univariate analyses, and the effect of confounding variables is often unexamined. Moreover, the diversity of torture survivors’ cultures limits the generalizability of findings from particular groups.
In this article, we propose an approach—based on studies that address cross-cultural issues or use multicenter, multivariate, meta-analytic methods—that can enable you to better identify survivors of torture, assess and document consequent morbidities, and refer them to appropriate treatment programs. We focus on individuals who were tortured months or years earlier rather than on recently traumatized patients.
Facts that justify targeted screening
Although the number of torture survivors is not so high as to warrant population-wide screening, the prevalence of such victims in easily identified refugee groups does justify screening in this setting. Tortured individuals are more likely to emigrate than are their unmolested fellow nationals.7 Six percent to 12% of immigrants from countries where torture is practiced say they have been tortured.2,3 Torture rates are highest in people seeking political asylum. Twenty percent to 40% of asylum-seeking refugees from Somalia, Ethiopia, Eritrea, Senegal, Sierra Leone, Tibet, and Bhutan report being tortured.7-9 In this context, the lack of data on refugees from countries such as Zimbabwe or Myanmar is not reassuring.
The plight of children. About 4% of torture survivors are children.10,11 Some are street children brutalized by police; some are tortured to terrorize family members; some belonged to “enemy” communities. Investigation is warranted if an immigrant child comes from a country where torture is common and if the child was old enough to be imprisoned or forced to serve as a child soldier before entering a safe refugee camp prior to immigration.12 It is more appropriate to screen such children for post-traumatic stress disorder (PTSD) than torture. A meta-analysis found that 11% of refugee children (vs 9% of adults) have PTSD, regardless of whether they were tortured or experienced war or pandemic political violence.10 The American Academy of Child and Adolescent Psychiatry provides a summary of findings typically seen in children with PTSD.13
How to broach the subject with adults. Screening for torture survivors is reliable and takes little time. You might want to ask a question that mentions torture specifically. For example, you might say: “Some people in your situation have experienced torture. Has that ever happened to you?”2 Other questions could be less direct and follow the legal definition of torture from the Convention Against Torture: “While in captivity, did you ever experience physical or mental suffering that was deliberately and systematically inflicted by a soldier, policeman, or militant, or other person acting with government approval?”14,15 The sensitivity and specificity of screening questions are estimated at 80% and 90%, respectively.8 Patient factors that can dampen sensitivity are shame and stigmatization (especially for survivors of sexual torture) and the trauma-amnestic component of PTSD. Secondary gain with regard to immigration appeals, however, rarely causes overreporting.3
If a patient answers Yes to a screening question, your responsibility is 2-fold. First, begin compiling a medical record that accurately reflects the patient’s description of torture and the medical findings relevant to those statements. Accurate documentation is important because medical records are used as evidence in hearings to rule on petitions for asylum. Second, refer the patient for proper treatment that can reduce disability, pain, and psychiatric distress.
Assess physical morbidity
Torture survivors’ physical symptoms and signs are as varied16-18 as the methods by which they have been abused.19-21 Let a patient’s complaints and report of the techniques used guide your examination.9,14,15,22,23
Concussive trauma is nearly universally reported. This includes beatings with fists, clubs, and batons. Caning causes horizontal lesions typically on the buttocks and back or sometimes on the backs of the legs. Whipping is typically applied to the back, where it produces downsloping lesions that curl laterally off the trunk.18 Torturers sometimes place layers of cloth over the skin before beatings to minimize incriminating cuts and scars. In men, genital beatings are so common that researchers include them with general beatings rather than categorizing them as sexual torture.24 A third to half of survivors report beatings on the feet, a technique that produces chronic neuralgias and disability from fascial injuries, which can be evaluated by MRI.25-27 Prolonged pain and disability from foot beatings is associated with PTSD. Concussive trauma to ears can produce hearing loss. Deformities or healed fractures may be signs of blunt force trauma. Gunfire into joints leaves bony injuries and metallic fragments.
Suspension, hyperflexion. Many survivors report being suspended by an extremity or digit or forced into positions of extreme hyperflexion, hyperextension, or rotation. A variant of suspension is the use of stress positions such as confinement in a tight box. These techniques often tear ligaments, tendons, nerves, neural plexi, or other soft tissues, or cause subluxations, dislocations (eg, reverse rotation of the shoulder), fractures, or even amputating avulsions.16,28 Careful examination and imaging of joints can detect such bone and soft tissue injuries.
Ligatures, binding, and compression to extremities or genitalia are used to restrain or to cause pain or injury. The long-term sequelae include scars, neuropathies, ligamentous injuries, muscle trauma, and ischemic injuries. Thumbscrews—small vises clamped on fingers, thumbs, or toes—produce destructive compressive fractures and deformities in the distal bones and joints of the fingers or toes.16
Burns, electrical shock, and mutilation by cutting are widely inflicted. Shock is applied to the skin, genitalia, or within body cavities with wires, cattle prods, or electrified grids such as bedsprings. Muscle spasms caused by intra-oral cattle prods can cause jaw dislocations. Intense shocks on the back can cause muscle spasms that result in vertebral compression fractures.16 Although nontherapeutic, biopsies of electrical scars have evidentiary value.18 Teeth are often extracted as a form of mutilation.
Sexual torture is substantially under-reported. Five percent to 15% of male torture survivors report being sexually abused.24,29 Of these, 50% report threats of castration or rape, 33% are raped or forced to perform sex on, or in view of, others, and 10% report genital shocks or mutilation.24,29 Although fewer women than men are tortured, about half of women survivors report sexual torture, usually rape, sometimes in front of family members.30,31 Given the prevalence of rape among female torture survivors, case finding during or before prenatal care may enable a practitioner to desensitize or sedate a woman before using gynecological instruments or techniques like paracervical injections that can trigger PTSD arousal reactions.
Injurious environments. Nearly all torture survivors report being subjected to extremes of heat or cold, a lack of water or food or sanitation or medical care, or crowding, filth, and extreme noise. Some survivors report asphyxia with a dry or wet cloth over the face or by being immersed in water. A few report being given substances that cause dystonia, diarrhea, or loss of consciousness.
Assess psychological morbidity
The distinction between physical and psychological torture is imperfect. Fear of physical violence is a psychological stressor. Psychological torture has physical sequelae such as sexual dysfunction. Psychological torture uses various methods to humiliate, degrade, or cause extreme fear (sham executions, being forced to watch torture), or to isolate or disorient (blindfolding, sleep deprivation) a prisoner.9,15,21 The combination of physical and psychological torture causes severe, chronic psychological morbidity.7 The nature and severity of this morbidity is shaped by the nature of the torture, personal resilience, social supports, stressors in life after torture, and therapy.
The main psychological sequelae of torture are PTSD, depression, anxiety disorders, and chronic pain syndromes. Of torture survivors seeking treatment, 50% to 67% have PTSD, 33% have depression, 10% have generalized anxiety disorders, and another 10% have other psychiatric diagnoses.32,33 Forty percent to 70% of torture survivors have chronic pain or somatoform disorders,7,22,31,34 making it critical that physicians screen for a history of torture with any refugee presenting with recurrent, complex, or unexplained pain.
Many tortured refugees have experienced multiple traumas, including political terror, war, and dislocation. A complex meta-analysis involving 82,000 refugees found that torture is especially correlated with PTSD, whereas stressors such as exposure to conflict and displacement were more strongly associated with depression.35,36
Researchers have not found correlations between the types, severity, or duration of torture (including physical vs psychological techniques) and the severity of post-torture PTSD or depression.7,37 Head trauma received during torture may lead to frontal and temporal cortical thinning that is highly associated with post-torture depression.38 Rape during torture is associated with high levels of chronic distress and sexual dysfunction.30,39,40 Psychological resilience may be somewhat more robust in individuals who expected to be tortured.21
The social situation of resettled refugees affects the severity of psychiatric distress in torture survivors. Two large studies found that refugees were more distressed if they were institutionalized (in camps or compounds as opposed to homes), feared repatriation, were underemployed, or lacked economic opportunities in their new homeland.35,41 Persistent pain or physical disability related to tissue damage or a superimposed somatoform disorder correlates strongly with persistent psychiatric morbidity.42 Although the intensity of PTSD decreases over years, the core symptom complex often endures and may be disabling.32,37,43
How to connect patients with resources
The International Rehabilitation Council for Torture Victims (www.IRCT.org) and the Center for Victims of Torture (www.CVT.org) offer links to many torture survivor treatment programs. Other torture treatment centers can be found with Web searches or through international clinics or community organizations serving specific ethnic groups. Treatment programs help clients—many of whom are uninsured and, as non-US nationals, ineligible for public entitlement programs—navigate barriers to getting help. Treatment centers must address language barriers between therapists and clients. One caution: In small ethnic communities, translators may know clients and thereby raise fears of lack
of confidentiality. Treatment options. Standard interventions recommended for torture survivors include physical therapy and cognitive behavioral therapy, especially for flashbacks and disabling social avoidance behaviors that are part of PTSD.7 Narrative exposure therapy, a brief psychotherapy in which the patient repeatedly retells and re-experiences painful events, shows promise.44,45 Psychological care for depression and anxiety, interdisciplinary pain desensitization, psychosocial supports, and assistance with asylum petitions are also important. The lack of validated torture survivor treatments reflects a paucity of research on this issue. It does not mean that standard effective therapies for PTSD or depression are ineffective.32,46 It is reasonable to assume that inadequate treatment of PTSD, depression, and pain disorders magnifies and prolongs the personal, familial, and social cost of torture sequelae.
Following through on medical documentation. About 41,000 people, nearly all from countries where torture is common, sought asylum from persecution in the United States in 2011.47 The United States grants asylum if an otherwise eligible immigrant can establish a “significant possibility” of future persecution on account of race, religion, nationality, membership in a particular social group, or political opinion.48 This is a government determination, not a medical certification. A study of 2400 asylum seekers found that 90% who had medical documentation of past torture were granted asylum, compared with just 37% of those lacking such medical support.49
CORRESPONDENCE Steven H. Miles, MD, Center for Bioethics, N504 Boynton, 410 Church Street SE, Minneapolis, MN 55455; Miles001@umn.edu
1. Rejali D. Torture and Democracy. 1st ed. Princeton, NJ: Princeton University Press; 2007.
2. Crosby SS, Norredam M, Paasche-Orlow MK, et al. Prevalence of torture survivors among foreign-born patients presenting to an urban ambulatory care practice. J Gen Intern Med. 2006;21:764-768.
3. Eisenman D, Keller A, Kim G. Survivors of torture in a general medical setting: how often have patients been tortured and how often is it missed?. West J Med. 2000;172:301-304.
4. United States Department of Justice. Survivors of politically motivated torture: a large, growing, and invisible population of crime victims. January 2000. Available at: http://www.ncjrs.gov/ovc_archives/reports/motivatedtorture/torture.pdf. Accessed March 8, 2012.
5. National Institute of Neurological Disorders and Stroke. Parkinson’s disease backgrounder. Available at: http://www.ninds.nih.gov/disorders/parkinsons_disease/parkinsons_disease_backgrounder.htm. Accessed March 13, 2012.
6. National Multiple Sclerosis Society.. FAQs about MS. Available at: http://www.nationalmssociety.org/about-multiple-sclerosis/what-we-know-about-ms/faqs-about-ms/index.aspx#howmany. Accessed March 13, 2012.
7. Quiroga J, Jaranson JM. Politically–motivated torture and its survivors. Torture. 2005;15:1-112.
8. Montgomery E, Foldspang A. Criterion-related validity of screening for exposure to torture. Dan Med Bull. 1994;41:588-591.
9. Masmas TN, Moller E, Buhmanner C, et al. Asylum seekers in Denmark—a study of health status and grade of traumatization of newly arrived asylum seekers. Torture. 2008;18:77-86.
10. Fazel M, Wheeler J, Danesh J. Prevalence of serious mental disorder in 7000 refugees resettled in western countries: a systematic review. Lancet. 2005;365:1309-1314.
11. Torture in children. Torture. 2009;19(theme issue):64-175.
12. Volpellier M. Physical forensic signs of sexual torture in children. A guideline for non specialized medical examiners. Torture. 2009;19:157-166.
13. American Academy of Child and Adolescent Psychiatry. Facts for families. Posttraumatic stress disorder. No. 70. March 2011. Available at: http://aacap.org/cs/root/facts_for_families/posttraumatic_stress_disorder_ptsd. Accessed March 12, 2012.
14. Office of the United Nations High Commissioner for Human Rights. Convention against torture and other cruel, inhuman or degrading treatment or punishment. 1984. Available at: http://www2.ohchr.org/english/law/cat.htm. Accessed March 8, 2012.
15. Mollica RF. Surviving torture. N Engl J Med. 2004;351:5-7.
16. Vogel H, Schmitz-Engels F, Grillo C. Radiology of torture. Eur J Radiol. 2007;63:187-204.
17. Brogdon BG, Vogel H, McDowell JD. A Radiologic Atlas of Abuse, Torture, Terrorism, and Inflicted Trauma. Boca Raton, Fla: CRC Press; 2003.
18. Danielsen L, Rasmussen OV. Dermatological findings after alleged torture. Torture. 2006;16:108-127.
19. Domovitch E, Berger PB, Wawer MJ, et al. Human torture: description and sequelae of 104 cases. Can Fam Phys. 1984;30:827-830.
20. Sanders J, Schuman MW, Marbella AM. The epidemiology of torture: a case series of 58 survivors of torture. Forens Sci Int. 2009;189:e1-e7.
21. Basoglu M, Livanou M, Crnobaric C. Torture vs other cruel, inhuman and degrading treatment: is the distinction real or apparent? Arch Gen Psychiatry. 2007;64:277-285.
22. Olsen DR, Montgomery E, Bojholm S, et al. Prevalent musculoskeletal pain as a correlate of previous exposure to torture. Scand J Public Health. 2006;34:496-503.
23. Office of the United Nations High Commissioner for Human Rights.. Istanbul protocol: manual on the effective investigation and documentation of torture and other cruel, inhuman or degrading treatment or punishment. 2004. Available at: http://www.ohchr.org/Documents/Publications/training8Rev1en.pdf. Accessed March 8, 2012.
24. Loncar M, Henigsberg N, Hrabac P. Mental health consequences in men exposed to sexual abuse during the war in Croatia and Bosnia. J Interpers Violence. 2010;25:191-203.
25. Prip K, Persson AL. Clinical findings in men with chronic pain after falanga torture. Clin J Pain. 2008;24:135-141.
26. Edston E. The epidemiology of falanga: incidence among Swedish asylum seekers. Torture. 2009;19:27-32.
27. Amris K, Top-Pedersen ST, Rasmussen OV. Long-term consequences of falanga torture—what do we know and what do we need to know? Torture. 2009;19:33-40.
28. Moreno A, Grodin MA. Torture and its neurological sequelae. Spinal Cord. 2002;40:213-223.
29. Oosterhoff P, Zwanikken P, Ketting E. Sexual torture of men in Croatia and other conflict situations: an open secret. Reprod Health Matters. 2004;12:68-77.
30. Robertson CL, Halcon L, Savik K, et al. Somali and Oromo refugee women: trauma and associated factors. J Adv Nursing. 2006;56:577-587.
31. Hooberman JB, Rosenfeld B, Lhewa D, et al. Classifying the torture experiences of refugees living in the United States. J Interpers Violence. 2007;22:108-123.
32. Olsen DR, Montgomery E, Carlsson J, et al. Prevalent pain and pain level among torture survivors: a follow-up study. Dan Med Bull. 2006;53:210-214.
33. McColl H, Higson-Smith C, Gjerding S, et al. Rehabilitation of torture survivors in five countries: common themes and challenges. Int J Ment Health Syst. 2010;4:16.
34. Van Ommeren M, de Jong JT, Sharma B, et al. Psychiatric disorders among tortured Bhutanese refugees in Nepal. Arch Gen Psychiatry. 2001;58:475-482.
35. Steel Z, Chey T, Silove D, et al. Association of torture and other potentially traumatic events with mental health outcomes among populations exposed to mass conflict and displacement: a systematic review and meta-analysis. JAMA. 2009;302:537-549.
36. Basoglu M, Livanou M, Crnobaric C, et al. Psychiatric and cognitive effects of war in former Yugoslavia: association of lack of redress for trauma and posttraumatic stress reactions. JAMA. 2005;294:580-590.
37. Carlsson JM, Olsen DR, Mortensen EL, et al. Mental health and health-related quality of life: a 10-year follow-up of tortured refugees. J Nerv Ment Dis. 2006;194:725-731.
38. Mollica RF, Lyoo IK, Chernoff MC, et al. Brain structural abnormalities and mental health sequelae in South Vietnamese ex-political detainees who survived traumatic head injury and torture. Arch Gen Psychiatry. 2009;66:1221-1232.
39. Keller A, Lhewa D, Rosenfeld B, et al. Traumatic experiences and psychological distress in an urban refugee population seeking treatment services. J Nerv Ment Dis. 2006;194:188-194.
40. Lunde I, Ortmann J. Prevalence and sequelae of sexual torture. Lancet. 1990;336:289-291.
41. Porter M, Haslam N. Predisplacement and postdisplacement factors associated with mental health of refugees and internally displaced persons. JAMA. 2005;294:602-612.
42. Rasmussen A, Rosenfeld B, Reeves K, et al. The effects of torture-related injuries on long-term psychological distress in a Punjabi Sikh sample. J Abnorm Psychol. 2007;116:734-740.
43. Lie B. A 3-year follow-up study of psychosocial functioning and general symptoms in settled refugees. Acta Psychiatr Scand. 2002;106:415-425.
44. Crumlish N, O’Rourke K. A systematic review of treatments for post-traumatic stress disorder among refugees and asylum-seekers. J Nerv Ment Dis. 2010;198:237-251.
45. Neuner F, Kurreck S, Ruf M, et al. Can asylum-seekers with posttraumatic stress disorder be successfully treated? A randomized controlled pilot study. Cog Behav Ther. 2010;39:81-91.
46. Sjölund BH, Kastrup M, Montgomery E, et al. Rehabilitating torture survivors. J Rehabil Med. 2009;41:689-696.
47. US Department of Justice. FY 2011 asylum statistics. Available at: www.justice.gov/eoir/efoia/FY11AsyStats-Current.pdf. Accessed March 13, 2012.
48. US Citizenship and Immigration Services. Questions & answers: credible fear screening. September 4, 2009. Available at: http://www.uscis.gov/portal/site/uscis/menuitem.5af9bb95919f35e66f614176543f6d1a/?vgnextoid=897f549bf0683210VgnVCM100000082ca60aRCRD&vgnextchannel=f39d3e4d77d73210VgnVCM100000082ca60aRCRD. Accessed March 12, 2012.
49. Lustig SL, Kureshi S, Delucchi KL, et al. Asylum grant rates following medical evaluations of maltreatment among political asylum applicants in the United States. J Immigr Minor Health. 2008;10:7-15.
• Screen for a history of torture if an individual from an immigrant group exhibits signs of depression or post-traumatic stress disorder, complains of unexplained pain, or is known to be seeking asylum. C
• Document a report of torture and any associated physical or psychological findings from your examination, and refer the individual for appropriate care. C
Strength of recommendation (SOR)
A Good-quality patient-oriented evidence
B Inconsistent or limited-quality patient-oriented evidence
C Consensus, usual practice, opinion, disease-oriented evidence, case series
Nearly half of the world’s 200 nations torture their citizens.1 Although survivors have high rates of physical and psychiatric morbidity, and in coming to this country tend to live in highly concentrated refugee groups, physicians rarely discover torture histories.2,3
Torture survivors may avoid speaking of it because they do not understand that treatment is available for their physical, psychiatric, and pain disorders. A lack of detection delays the diagnosis and treatment of the sequelae of torture. It may also affect their future safety: Individuals seeking asylum are deprived of the medical documentation needed to support their petitions.
Your involvement in recording histories and exam findings and in referring patients for specialized care can restore lives. It can also aid in reversing the “invisibility” of torture survivors that perpetuates inadequate clinical education, research, and development of appropriate therapies.
Are you caring for a survivor—and don’t know it? Approximately 500,000 torture survivors live in the United States.4 This equals the number of individuals with Parkinson’s disease and outnumbers those with multiple sclerosis.5,6 Physicians may encounter torture survivors in primary care settings, emergency departments, or while consulting with colleagues about patients who have specialized medical needs. There are no evidence-based guidelines for assessing and treating torture survivors. Most studies are from single institutions and have modest sample sizes. Most use univariate analyses, and the effect of confounding variables is often unexamined. Moreover, the diversity of torture survivors’ cultures limits the generalizability of findings from particular groups.
In this article, we propose an approach—based on studies that address cross-cultural issues or use multicenter, multivariate, meta-analytic methods—that can enable you to better identify survivors of torture, assess and document consequent morbidities, and refer them to appropriate treatment programs. We focus on individuals who were tortured months or years earlier rather than on recently traumatized patients.
Facts that justify targeted screening
Although the number of torture survivors is not so high as to warrant population-wide screening, the prevalence of such victims in easily identified refugee groups does justify screening in this setting. Tortured individuals are more likely to emigrate than are their unmolested fellow nationals.7 Six percent to 12% of immigrants from countries where torture is practiced say they have been tortured.2,3 Torture rates are highest in people seeking political asylum. Twenty percent to 40% of asylum-seeking refugees from Somalia, Ethiopia, Eritrea, Senegal, Sierra Leone, Tibet, and Bhutan report being tortured.7-9 In this context, the lack of data on refugees from countries such as Zimbabwe or Myanmar is not reassuring.
The plight of children. About 4% of torture survivors are children.10,11 Some are street children brutalized by police; some are tortured to terrorize family members; some belonged to “enemy” communities. Investigation is warranted if an immigrant child comes from a country where torture is common and if the child was old enough to be imprisoned or forced to serve as a child soldier before entering a safe refugee camp prior to immigration.12 It is more appropriate to screen such children for post-traumatic stress disorder (PTSD) than torture. A meta-analysis found that 11% of refugee children (vs 9% of adults) have PTSD, regardless of whether they were tortured or experienced war or pandemic political violence.10 The American Academy of Child and Adolescent Psychiatry provides a summary of findings typically seen in children with PTSD.13
How to broach the subject with adults. Screening for torture survivors is reliable and takes little time. You might want to ask a question that mentions torture specifically. For example, you might say: “Some people in your situation have experienced torture. Has that ever happened to you?”2 Other questions could be less direct and follow the legal definition of torture from the Convention Against Torture: “While in captivity, did you ever experience physical or mental suffering that was deliberately and systematically inflicted by a soldier, policeman, or militant, or other person acting with government approval?”14,15 The sensitivity and specificity of screening questions are estimated at 80% and 90%, respectively.8 Patient factors that can dampen sensitivity are shame and stigmatization (especially for survivors of sexual torture) and the trauma-amnestic component of PTSD. Secondary gain with regard to immigration appeals, however, rarely causes overreporting.3
If a patient answers Yes to a screening question, your responsibility is 2-fold. First, begin compiling a medical record that accurately reflects the patient’s description of torture and the medical findings relevant to those statements. Accurate documentation is important because medical records are used as evidence in hearings to rule on petitions for asylum. Second, refer the patient for proper treatment that can reduce disability, pain, and psychiatric distress.
Assess physical morbidity
Torture survivors’ physical symptoms and signs are as varied16-18 as the methods by which they have been abused.19-21 Let a patient’s complaints and report of the techniques used guide your examination.9,14,15,22,23
Concussive trauma is nearly universally reported. This includes beatings with fists, clubs, and batons. Caning causes horizontal lesions typically on the buttocks and back or sometimes on the backs of the legs. Whipping is typically applied to the back, where it produces downsloping lesions that curl laterally off the trunk.18 Torturers sometimes place layers of cloth over the skin before beatings to minimize incriminating cuts and scars. In men, genital beatings are so common that researchers include them with general beatings rather than categorizing them as sexual torture.24 A third to half of survivors report beatings on the feet, a technique that produces chronic neuralgias and disability from fascial injuries, which can be evaluated by MRI.25-27 Prolonged pain and disability from foot beatings is associated with PTSD. Concussive trauma to ears can produce hearing loss. Deformities or healed fractures may be signs of blunt force trauma. Gunfire into joints leaves bony injuries and metallic fragments.
Suspension, hyperflexion. Many survivors report being suspended by an extremity or digit or forced into positions of extreme hyperflexion, hyperextension, or rotation. A variant of suspension is the use of stress positions such as confinement in a tight box. These techniques often tear ligaments, tendons, nerves, neural plexi, or other soft tissues, or cause subluxations, dislocations (eg, reverse rotation of the shoulder), fractures, or even amputating avulsions.16,28 Careful examination and imaging of joints can detect such bone and soft tissue injuries.
Ligatures, binding, and compression to extremities or genitalia are used to restrain or to cause pain or injury. The long-term sequelae include scars, neuropathies, ligamentous injuries, muscle trauma, and ischemic injuries. Thumbscrews—small vises clamped on fingers, thumbs, or toes—produce destructive compressive fractures and deformities in the distal bones and joints of the fingers or toes.16
Burns, electrical shock, and mutilation by cutting are widely inflicted. Shock is applied to the skin, genitalia, or within body cavities with wires, cattle prods, or electrified grids such as bedsprings. Muscle spasms caused by intra-oral cattle prods can cause jaw dislocations. Intense shocks on the back can cause muscle spasms that result in vertebral compression fractures.16 Although nontherapeutic, biopsies of electrical scars have evidentiary value.18 Teeth are often extracted as a form of mutilation.
Sexual torture is substantially under-reported. Five percent to 15% of male torture survivors report being sexually abused.24,29 Of these, 50% report threats of castration or rape, 33% are raped or forced to perform sex on, or in view of, others, and 10% report genital shocks or mutilation.24,29 Although fewer women than men are tortured, about half of women survivors report sexual torture, usually rape, sometimes in front of family members.30,31 Given the prevalence of rape among female torture survivors, case finding during or before prenatal care may enable a practitioner to desensitize or sedate a woman before using gynecological instruments or techniques like paracervical injections that can trigger PTSD arousal reactions.
Injurious environments. Nearly all torture survivors report being subjected to extremes of heat or cold, a lack of water or food or sanitation or medical care, or crowding, filth, and extreme noise. Some survivors report asphyxia with a dry or wet cloth over the face or by being immersed in water. A few report being given substances that cause dystonia, diarrhea, or loss of consciousness.
Assess psychological morbidity
The distinction between physical and psychological torture is imperfect. Fear of physical violence is a psychological stressor. Psychological torture has physical sequelae such as sexual dysfunction. Psychological torture uses various methods to humiliate, degrade, or cause extreme fear (sham executions, being forced to watch torture), or to isolate or disorient (blindfolding, sleep deprivation) a prisoner.9,15,21 The combination of physical and psychological torture causes severe, chronic psychological morbidity.7 The nature and severity of this morbidity is shaped by the nature of the torture, personal resilience, social supports, stressors in life after torture, and therapy.
The main psychological sequelae of torture are PTSD, depression, anxiety disorders, and chronic pain syndromes. Of torture survivors seeking treatment, 50% to 67% have PTSD, 33% have depression, 10% have generalized anxiety disorders, and another 10% have other psychiatric diagnoses.32,33 Forty percent to 70% of torture survivors have chronic pain or somatoform disorders,7,22,31,34 making it critical that physicians screen for a history of torture with any refugee presenting with recurrent, complex, or unexplained pain.
Many tortured refugees have experienced multiple traumas, including political terror, war, and dislocation. A complex meta-analysis involving 82,000 refugees found that torture is especially correlated with PTSD, whereas stressors such as exposure to conflict and displacement were more strongly associated with depression.35,36
Researchers have not found correlations between the types, severity, or duration of torture (including physical vs psychological techniques) and the severity of post-torture PTSD or depression.7,37 Head trauma received during torture may lead to frontal and temporal cortical thinning that is highly associated with post-torture depression.38 Rape during torture is associated with high levels of chronic distress and sexual dysfunction.30,39,40 Psychological resilience may be somewhat more robust in individuals who expected to be tortured.21
The social situation of resettled refugees affects the severity of psychiatric distress in torture survivors. Two large studies found that refugees were more distressed if they were institutionalized (in camps or compounds as opposed to homes), feared repatriation, were underemployed, or lacked economic opportunities in their new homeland.35,41 Persistent pain or physical disability related to tissue damage or a superimposed somatoform disorder correlates strongly with persistent psychiatric morbidity.42 Although the intensity of PTSD decreases over years, the core symptom complex often endures and may be disabling.32,37,43
How to connect patients with resources
The International Rehabilitation Council for Torture Victims (www.IRCT.org) and the Center for Victims of Torture (www.CVT.org) offer links to many torture survivor treatment programs. Other torture treatment centers can be found with Web searches or through international clinics or community organizations serving specific ethnic groups. Treatment programs help clients—many of whom are uninsured and, as non-US nationals, ineligible for public entitlement programs—navigate barriers to getting help. Treatment centers must address language barriers between therapists and clients. One caution: In small ethnic communities, translators may know clients and thereby raise fears of lack
of confidentiality. Treatment options. Standard interventions recommended for torture survivors include physical therapy and cognitive behavioral therapy, especially for flashbacks and disabling social avoidance behaviors that are part of PTSD.7 Narrative exposure therapy, a brief psychotherapy in which the patient repeatedly retells and re-experiences painful events, shows promise.44,45 Psychological care for depression and anxiety, interdisciplinary pain desensitization, psychosocial supports, and assistance with asylum petitions are also important. The lack of validated torture survivor treatments reflects a paucity of research on this issue. It does not mean that standard effective therapies for PTSD or depression are ineffective.32,46 It is reasonable to assume that inadequate treatment of PTSD, depression, and pain disorders magnifies and prolongs the personal, familial, and social cost of torture sequelae.
Following through on medical documentation. About 41,000 people, nearly all from countries where torture is common, sought asylum from persecution in the United States in 2011.47 The United States grants asylum if an otherwise eligible immigrant can establish a “significant possibility” of future persecution on account of race, religion, nationality, membership in a particular social group, or political opinion.48 This is a government determination, not a medical certification. A study of 2400 asylum seekers found that 90% who had medical documentation of past torture were granted asylum, compared with just 37% of those lacking such medical support.49
CORRESPONDENCE Steven H. Miles, MD, Center for Bioethics, N504 Boynton, 410 Church Street SE, Minneapolis, MN 55455; Miles001@umn.edu
1. Rejali D. Torture and Democracy. 1st ed. Princeton, NJ: Princeton University Press; 2007.
2. Crosby SS, Norredam M, Paasche-Orlow MK, et al. Prevalence of torture survivors among foreign-born patients presenting to an urban ambulatory care practice. J Gen Intern Med. 2006;21:764-768.
3. Eisenman D, Keller A, Kim G. Survivors of torture in a general medical setting: how often have patients been tortured and how often is it missed?. West J Med. 2000;172:301-304.
4. United States Department of Justice. Survivors of politically motivated torture: a large, growing, and invisible population of crime victims. January 2000. Available at: http://www.ncjrs.gov/ovc_archives/reports/motivatedtorture/torture.pdf. Accessed March 8, 2012.
5. National Institute of Neurological Disorders and Stroke. Parkinson’s disease backgrounder. Available at: http://www.ninds.nih.gov/disorders/parkinsons_disease/parkinsons_disease_backgrounder.htm. Accessed March 13, 2012.
6. National Multiple Sclerosis Society.. FAQs about MS. Available at: http://www.nationalmssociety.org/about-multiple-sclerosis/what-we-know-about-ms/faqs-about-ms/index.aspx#howmany. Accessed March 13, 2012.
7. Quiroga J, Jaranson JM. Politically–motivated torture and its survivors. Torture. 2005;15:1-112.
8. Montgomery E, Foldspang A. Criterion-related validity of screening for exposure to torture. Dan Med Bull. 1994;41:588-591.
9. Masmas TN, Moller E, Buhmanner C, et al. Asylum seekers in Denmark—a study of health status and grade of traumatization of newly arrived asylum seekers. Torture. 2008;18:77-86.
10. Fazel M, Wheeler J, Danesh J. Prevalence of serious mental disorder in 7000 refugees resettled in western countries: a systematic review. Lancet. 2005;365:1309-1314.
11. Torture in children. Torture. 2009;19(theme issue):64-175.
12. Volpellier M. Physical forensic signs of sexual torture in children. A guideline for non specialized medical examiners. Torture. 2009;19:157-166.
13. American Academy of Child and Adolescent Psychiatry. Facts for families. Posttraumatic stress disorder. No. 70. March 2011. Available at: http://aacap.org/cs/root/facts_for_families/posttraumatic_stress_disorder_ptsd. Accessed March 12, 2012.
14. Office of the United Nations High Commissioner for Human Rights. Convention against torture and other cruel, inhuman or degrading treatment or punishment. 1984. Available at: http://www2.ohchr.org/english/law/cat.htm. Accessed March 8, 2012.
15. Mollica RF. Surviving torture. N Engl J Med. 2004;351:5-7.
16. Vogel H, Schmitz-Engels F, Grillo C. Radiology of torture. Eur J Radiol. 2007;63:187-204.
17. Brogdon BG, Vogel H, McDowell JD. A Radiologic Atlas of Abuse, Torture, Terrorism, and Inflicted Trauma. Boca Raton, Fla: CRC Press; 2003.
18. Danielsen L, Rasmussen OV. Dermatological findings after alleged torture. Torture. 2006;16:108-127.
19. Domovitch E, Berger PB, Wawer MJ, et al. Human torture: description and sequelae of 104 cases. Can Fam Phys. 1984;30:827-830.
20. Sanders J, Schuman MW, Marbella AM. The epidemiology of torture: a case series of 58 survivors of torture. Forens Sci Int. 2009;189:e1-e7.
21. Basoglu M, Livanou M, Crnobaric C. Torture vs other cruel, inhuman and degrading treatment: is the distinction real or apparent? Arch Gen Psychiatry. 2007;64:277-285.
22. Olsen DR, Montgomery E, Bojholm S, et al. Prevalent musculoskeletal pain as a correlate of previous exposure to torture. Scand J Public Health. 2006;34:496-503.
23. Office of the United Nations High Commissioner for Human Rights.. Istanbul protocol: manual on the effective investigation and documentation of torture and other cruel, inhuman or degrading treatment or punishment. 2004. Available at: http://www.ohchr.org/Documents/Publications/training8Rev1en.pdf. Accessed March 8, 2012.
24. Loncar M, Henigsberg N, Hrabac P. Mental health consequences in men exposed to sexual abuse during the war in Croatia and Bosnia. J Interpers Violence. 2010;25:191-203.
25. Prip K, Persson AL. Clinical findings in men with chronic pain after falanga torture. Clin J Pain. 2008;24:135-141.
26. Edston E. The epidemiology of falanga: incidence among Swedish asylum seekers. Torture. 2009;19:27-32.
27. Amris K, Top-Pedersen ST, Rasmussen OV. Long-term consequences of falanga torture—what do we know and what do we need to know? Torture. 2009;19:33-40.
28. Moreno A, Grodin MA. Torture and its neurological sequelae. Spinal Cord. 2002;40:213-223.
29. Oosterhoff P, Zwanikken P, Ketting E. Sexual torture of men in Croatia and other conflict situations: an open secret. Reprod Health Matters. 2004;12:68-77.
30. Robertson CL, Halcon L, Savik K, et al. Somali and Oromo refugee women: trauma and associated factors. J Adv Nursing. 2006;56:577-587.
31. Hooberman JB, Rosenfeld B, Lhewa D, et al. Classifying the torture experiences of refugees living in the United States. J Interpers Violence. 2007;22:108-123.
32. Olsen DR, Montgomery E, Carlsson J, et al. Prevalent pain and pain level among torture survivors: a follow-up study. Dan Med Bull. 2006;53:210-214.
33. McColl H, Higson-Smith C, Gjerding S, et al. Rehabilitation of torture survivors in five countries: common themes and challenges. Int J Ment Health Syst. 2010;4:16.
34. Van Ommeren M, de Jong JT, Sharma B, et al. Psychiatric disorders among tortured Bhutanese refugees in Nepal. Arch Gen Psychiatry. 2001;58:475-482.
35. Steel Z, Chey T, Silove D, et al. Association of torture and other potentially traumatic events with mental health outcomes among populations exposed to mass conflict and displacement: a systematic review and meta-analysis. JAMA. 2009;302:537-549.
36. Basoglu M, Livanou M, Crnobaric C, et al. Psychiatric and cognitive effects of war in former Yugoslavia: association of lack of redress for trauma and posttraumatic stress reactions. JAMA. 2005;294:580-590.
37. Carlsson JM, Olsen DR, Mortensen EL, et al. Mental health and health-related quality of life: a 10-year follow-up of tortured refugees. J Nerv Ment Dis. 2006;194:725-731.
38. Mollica RF, Lyoo IK, Chernoff MC, et al. Brain structural abnormalities and mental health sequelae in South Vietnamese ex-political detainees who survived traumatic head injury and torture. Arch Gen Psychiatry. 2009;66:1221-1232.
39. Keller A, Lhewa D, Rosenfeld B, et al. Traumatic experiences and psychological distress in an urban refugee population seeking treatment services. J Nerv Ment Dis. 2006;194:188-194.
40. Lunde I, Ortmann J. Prevalence and sequelae of sexual torture. Lancet. 1990;336:289-291.
41. Porter M, Haslam N. Predisplacement and postdisplacement factors associated with mental health of refugees and internally displaced persons. JAMA. 2005;294:602-612.
42. Rasmussen A, Rosenfeld B, Reeves K, et al. The effects of torture-related injuries on long-term psychological distress in a Punjabi Sikh sample. J Abnorm Psychol. 2007;116:734-740.
43. Lie B. A 3-year follow-up study of psychosocial functioning and general symptoms in settled refugees. Acta Psychiatr Scand. 2002;106:415-425.
44. Crumlish N, O’Rourke K. A systematic review of treatments for post-traumatic stress disorder among refugees and asylum-seekers. J Nerv Ment Dis. 2010;198:237-251.
45. Neuner F, Kurreck S, Ruf M, et al. Can asylum-seekers with posttraumatic stress disorder be successfully treated? A randomized controlled pilot study. Cog Behav Ther. 2010;39:81-91.
46. Sjölund BH, Kastrup M, Montgomery E, et al. Rehabilitating torture survivors. J Rehabil Med. 2009;41:689-696.
47. US Department of Justice. FY 2011 asylum statistics. Available at: www.justice.gov/eoir/efoia/FY11AsyStats-Current.pdf. Accessed March 13, 2012.
48. US Citizenship and Immigration Services. Questions & answers: credible fear screening. September 4, 2009. Available at: http://www.uscis.gov/portal/site/uscis/menuitem.5af9bb95919f35e66f614176543f6d1a/?vgnextoid=897f549bf0683210VgnVCM100000082ca60aRCRD&vgnextchannel=f39d3e4d77d73210VgnVCM100000082ca60aRCRD. Accessed March 12, 2012.
49. Lustig SL, Kureshi S, Delucchi KL, et al. Asylum grant rates following medical evaluations of maltreatment among political asylum applicants in the United States. J Immigr Minor Health. 2008;10:7-15.
How to recognize a patient who’s high on “bath salts”
• Include cathinone use in the differential diagnosis for any patient exhibiting paranoid psychotic behavior or hallucinatory delirium. C
• Keep in mind that cathinone effects can mimic the “excited delirium” attributed to cocaine, methamphetamine, PCP, and Ecstasy. C
• Consider using benzodiazepines to control agitation, or low-dose antipsychotics to treat hallucinations. C
Strength of recommendation (SOR)
A Good-quality patient-oriented evidence
B Inconsistent or limited-quality patient-oriented evidence
C Consensus, usual practice, opinion, disease-oriented evidence, case series
A 31-year-old construction worker with a history of intermittent cocaine use was brought to the emergency department (ED) by the police. He was handcuffed and appeared confused and frightened. The patient’s wife had phoned the police after he began running through a field in pursuit of perceived invaders of their home. The wife reported that a few hours earlier, the patient had begun to hallucinate and had become very fearful after getting high.
His heart rate was 126, blood pressure 136/96 mm Hg, and temperature 99.6°F. During the initial exam, the patient became agitated, attempted to assault a nurse, and tried to leave the ED before being subdued. A urine screen for drugs was negative for cocaine. His creatine phosphokinase was 850 U/L, creatinine 2.32 mg/dL, and blood urea nitrogen 27 mg/dL.
The health care team learned that the drug he’d been snorting earlier that day—and the day before—was “bath salts.”
This patient was one of the 30 that we’ve seen at our university hospital over the past year.
Since early 2010, EDs, psychiatric facilities, and poison control centers have seen a surge in the number of patients abusing novel synthetic stimulants—cathinones—that had once been sold in convenience stores and tobacco shops and often labeled innocuously as “bath salts” or “plant food.” Sales have largely gone underground, sold by those trafficking in methamphetamine and cocaine. These products are also available for online purchase and may be sold under such provocative names as “Cloud Nine” or “Rave.”1 In 2010, poison control centers received 304 calls related to the use of these substances; in 2011, the number was 6138.2
Cathinone: An emerging recreational drug
For centuries the peoples of East Africa and the Arabian Peninsula have used the leaves of the indigenous khat plant (Catha edulis) for its amphetamine-like properties.3 Its active ingredient, cathinone, is a central nervous system stimulant that inhibits dopamine reuptake.4 In 2005, extracts from the plant were imported to Israel as “Hagigat” and promoted as a stimulant or aphrodisiac. These products were banned by the Israeli government in 2008 following documented cases of cardiovascular and neurologic sequelae.5
The growing problem of synthetic cathinone analogs in the United States. In 2008, synthetic analogs of cathinone were first identified in an analysis of drugs seized in the United States from individuals suffering psychological reactions to their use.1 Two such substances, 4-methylmethcathinone (mephedrone) and 3,4-methylenedioxypyrovalerone (MDPV), have since circulated worldwide, publicized by information on the Internet. Although the packets sold as “bath salts” clearly state that the contents are not for human consumption, Web sites promote the chemicals as “legal highs.”6
While these substances were being banned in many Western European countries, their use rapidly increased throughout the United States and elsewhere, often as an alternative to cocaine. Increases in the number of reports to poison control centers throughout the United States provide evidence of the increasing use of these drugs, despite legislation outlawing possession and sale in many states.7 In September 2011, the US Drug Enforcement Agency, using its emergency scheduling authority, made possession and sale of MDPV and mephedrone illegal throughout the United States.8
Who’s using bath salts? A review of calls to 2 poison control centers involving 236 patients over a 7-month period ending in February 2011 suggests that users of cathinones are primarily male (78%) and young (modal age 26).7 Many users of cathinones do not regularly use other drugs recreationally, and they believe the open sale of these substances implies low risk.7 However, one reported series from a hospital in Michigan indicated that 69% of users presenting to the ED had acknowledged past use of illicit drugs.9
What the drugs look like. Mephedrone and MDPV are supplied as white powders packaged in small packets of 500 mg and sell for about $25. Most users take the drug by nasal insufflation, although there is an alarming trend toward intravenous use.7 The intended effects in using these stimulants are improved attention and energy, as well as euphoria. Doses of about 25 mg produce these effects in most individuals and last for 2 to 3 hours, leading some users to compulsively re-dose to maintain the effects.
Use of bath salts leads to paranoid delusions, violent behavior
Both mephedrone and MDPV are strong inhibitors of dopamine reuptake in areas of the brain regulating reward and motivation.10,11 With prolonged exposure, the resultant stimulant effect of dopamine in reward centers of the brain moves a user from recreational pleasure seeking to addictive use just to maintain normal function.12 This transition occurs in a matter of days or weeks in some individuals, and we have seen multiple readmissions for paranoid psychotic reactions shortly after discharge from hospitalization.
Multiple serious complications of use have been described. The mainstream media have reported bizarre suicides and some homicides.13,14 Our clinic has reported on a unique hallucinatory delirium after use of MDPV, resulting in paranoid delusions and violent behavior in response to vivid hallucinations.15 Other patients suffer prolonged anxiety and panic reactions or depressive symptoms with suicidal ideation.16
Cardiovascular and other sequelae
About half of patients presenting to hospital EDs have cardiovascular complications such as tachycardia, chest pain, and hypertension from the sympathomimetic effects of these agents.9,16 There have also been reports of rhabdomyolysis and renal failure requiring intensive medical treatment.7,9,16
Taken together, mental status changes and physiologic reactions are similar to the “excited delirium” attributed to cocaine, methamphetamine, phencyclidine (PCP), and methylenedioxymethamphetamine (Ecstasy), all drugs that act on central monoamines.17–20 There have also been reports of death after the use of these drugs.21
Cathinones do not show up on routine drug screens
A routine urine screen for synthetic cathinones is not available, although a specific test arranged through commercial laboratories is available for cases when use is suspected. According to a written communication from A. Macher, MD, in 2011 (manuscript in preparation), urine drug screens for PCP using the immunoassay method may yield a false-positive result in the presence of MDPV. Simply asking patients whether they’ve been using these products often elicits an honest answer.
Treatment is largely supportive
Management guidance based on clinical trials is lacking. Cardiovascular complications require usual treatment.9,16 Serious psychiatric reactions may necessitate hospitalization to assure patient safety, particularly with evidence suggesting the potential to act on paranoid delusions or suicidal ideation. Benzodiazepines may be needed to control agitation, and low-dose antipsychotics, such as risperidone 1 mg, can aid in treating hallucinations.9,15
The hallucinatory psychosis seen with these substances is best characterized as a toxic delirium.15 Aggressive use of antipsychotic agents is not advised, given the risk of treatment-related morbidity in patients with a history of repeated stimulant use.22 Many patients presenting with acute delirium may require restraints. These procedures should be used with caution to minimize muscle tissue damage; patients should be monitored frequently for hyperthermia, dehydration, and rhabdomyolysis.16
Nothing is known about the long-term effects of these drugs, although substances with similar actions are associated with long-term cognitive and memory deficits after repeated use.4
CORRESPONDENCE Thomas M. Penders, MD, LFAPA, Department of Psychiatry, Brody School of Medicine, East Carolina University, 600 Moye Boulevard, Greenville, NC 27834; penderst@ecu.edu
1. National Drug Intelligence Center. Synthetic Cathinones (Bath Salts): An Emerging Domestic Threat. Washington, DC: Department of Justice; July 2011. Publication no. 2011-S0787-004.
2. American Association of Poison Control Centers. Bath salts data, updated February 8, 2012. Available at: http://www.aapcc.org/dnn/Portals/0/Bath%20Salts%20Data%20for%20Website%202.8.2012.pdf. Accessed March 2, 2012.
3. Kalix P. Catha edulis, a plant that has amphetamine effects. Pharm World Sci. 1996;18:69-73.
4. Hadlock GC, Webb KM, McFadden LM, et al. 4-Methylmethcathinone (mephedrone): neuropharmacologic effects of a designer stimulant of abuse. J Pharmacol Exp Ther. 2011;339:530-536.
5. Bentur Y, Bloom-Krasik A, Raikhlin-Eisenkraft B. Illicit cathinone (“Hagigat”) poisoning. Clin Toxicol (Phila). 2008;46:206-210.
6. Winstock AR, Mitcheson LR, Deluca P, et al. Mephedrone, new kid for the chop? Addiction. 2010;106:154-161.
7. Spiller HA, Ryan ML, Weston RG, et al. Clinical experience with and analytic confirmation of “bath salts” and “legal highs” (synthetic cathinones) in the United States. Clin Toxicol (Phila). 2011;49:499-505.
8. DeNoon DJ. “Bath salts” used to get high are now illegal. WebMD. Available at: http://www.webmd.com/mental-health/news/20110908/bath-salts-used-to-get-high-are-now-illegal. Accessed October 10, 2011.
9. Centers for Disease Control and Prevention. Emergency department visits after use of a drug sold as “bath salts”—Michigan, November 13, 2010 – March 31, 2011. MMWR Morb Mortal Wkly Rep. 2011;60:624-627.
10. Kelly JP. Cathinone derivatives: a review of the chemistry, pharmacology and toxicology. Drug Test Anal. 2011;3:439-453.
11. Advisory Council on the Misuse of Drugs (ACMD). ACMD report on the consideration of the cathinones. London, UK: Home Office; March 31, 2010. Available at: http://www.homeoffice.gov.uk/publications/drugs/acmd1/acmd-cathinodes-report-2010. Accessed October 10, 2011.
12. Koob GF, Volkow ND. Neurocircuitry of addiction. Neuropsychopharmacology. 2010;35:217-238.
13. Lewis B. Man commits suicide after using bath salts. WNDU.com: 2011. Available at: http://www.wndu.com/hometop/headlines/Man_commits_suicide_after_doing_bath_salts_123520219.html. Accessed October 9, 2011.
14. Goodnough A, Zezima K. An alarming new stimulant, legal in many states. The New York Times; July 16, 2011. Available at: http://www.nytimes.com/2011/07/17/us/17salts.html?pagewanted=all. Accessed October 12, 2011.
15. Penders T, Gestring R. Hallucinatory delirium following use of MDPV (“bath salts”). Gen Hosp Psychiatry. 2011;33:525-526.
16. Ross EA, Watson M, Goldberger B. “Bath salts” intoxication. N Engl J Med. 2011;365:967-968.
17. Ruttenber AJ, McAnally HB, Wetli CV. Cocaine-associated rhabdomyolysis and excited delirium: different stages of the same syndrome. Am J Forensic Med Pathol. 1999;20:120-127.
18. Richards JR, Johnson EB, Stark RW, et al. Methamphetamine abuse and rhabdomyolysis in the ED: a 5-year study. Am J Emerg Med. 1999;17:681-685.
19. Henry JA, Jeffreys KJ, Dawling S. Toxicity and deaths from 3,4 methylenedioxymethamphetamine (“ecstasy”). Lancet. 1992;340:384-387.
20. Lahmeyer HW, Stock PG. Phencyclidine intoxication, physical restraint, and acute renal failure: case report. J Clin Psychiatry. 1983;44:184-185.
21. Murray BL, Murphy CM, Beuhler MC. Death following recreational use of designer drug “Bath Salts” containing 3,4, methylenedioxypyrovalerone (MDPV). J Med Toxicol. 2012;8:69-75.
22. Akpaffiong MJ, Ruiz P. Neuroleptic malignant syndrome: a complication of neuroleptics and cocaine abuse. Psychiatr Q. 1991;62:299-309.
• Include cathinone use in the differential diagnosis for any patient exhibiting paranoid psychotic behavior or hallucinatory delirium. C
• Keep in mind that cathinone effects can mimic the “excited delirium” attributed to cocaine, methamphetamine, PCP, and Ecstasy. C
• Consider using benzodiazepines to control agitation, or low-dose antipsychotics to treat hallucinations. C
Strength of recommendation (SOR)
A Good-quality patient-oriented evidence
B Inconsistent or limited-quality patient-oriented evidence
C Consensus, usual practice, opinion, disease-oriented evidence, case series
A 31-year-old construction worker with a history of intermittent cocaine use was brought to the emergency department (ED) by the police. He was handcuffed and appeared confused and frightened. The patient’s wife had phoned the police after he began running through a field in pursuit of perceived invaders of their home. The wife reported that a few hours earlier, the patient had begun to hallucinate and had become very fearful after getting high.
His heart rate was 126, blood pressure 136/96 mm Hg, and temperature 99.6°F. During the initial exam, the patient became agitated, attempted to assault a nurse, and tried to leave the ED before being subdued. A urine screen for drugs was negative for cocaine. His creatine phosphokinase was 850 U/L, creatinine 2.32 mg/dL, and blood urea nitrogen 27 mg/dL.
The health care team learned that the drug he’d been snorting earlier that day—and the day before—was “bath salts.”
This patient was one of the 30 that we’ve seen at our university hospital over the past year.
Since early 2010, EDs, psychiatric facilities, and poison control centers have seen a surge in the number of patients abusing novel synthetic stimulants—cathinones—that had once been sold in convenience stores and tobacco shops and often labeled innocuously as “bath salts” or “plant food.” Sales have largely gone underground, sold by those trafficking in methamphetamine and cocaine. These products are also available for online purchase and may be sold under such provocative names as “Cloud Nine” or “Rave.”1 In 2010, poison control centers received 304 calls related to the use of these substances; in 2011, the number was 6138.2
Cathinone: An emerging recreational drug
For centuries the peoples of East Africa and the Arabian Peninsula have used the leaves of the indigenous khat plant (Catha edulis) for its amphetamine-like properties.3 Its active ingredient, cathinone, is a central nervous system stimulant that inhibits dopamine reuptake.4 In 2005, extracts from the plant were imported to Israel as “Hagigat” and promoted as a stimulant or aphrodisiac. These products were banned by the Israeli government in 2008 following documented cases of cardiovascular and neurologic sequelae.5
The growing problem of synthetic cathinone analogs in the United States. In 2008, synthetic analogs of cathinone were first identified in an analysis of drugs seized in the United States from individuals suffering psychological reactions to their use.1 Two such substances, 4-methylmethcathinone (mephedrone) and 3,4-methylenedioxypyrovalerone (MDPV), have since circulated worldwide, publicized by information on the Internet. Although the packets sold as “bath salts” clearly state that the contents are not for human consumption, Web sites promote the chemicals as “legal highs.”6
While these substances were being banned in many Western European countries, their use rapidly increased throughout the United States and elsewhere, often as an alternative to cocaine. Increases in the number of reports to poison control centers throughout the United States provide evidence of the increasing use of these drugs, despite legislation outlawing possession and sale in many states.7 In September 2011, the US Drug Enforcement Agency, using its emergency scheduling authority, made possession and sale of MDPV and mephedrone illegal throughout the United States.8
Who’s using bath salts? A review of calls to 2 poison control centers involving 236 patients over a 7-month period ending in February 2011 suggests that users of cathinones are primarily male (78%) and young (modal age 26).7 Many users of cathinones do not regularly use other drugs recreationally, and they believe the open sale of these substances implies low risk.7 However, one reported series from a hospital in Michigan indicated that 69% of users presenting to the ED had acknowledged past use of illicit drugs.9
What the drugs look like. Mephedrone and MDPV are supplied as white powders packaged in small packets of 500 mg and sell for about $25. Most users take the drug by nasal insufflation, although there is an alarming trend toward intravenous use.7 The intended effects in using these stimulants are improved attention and energy, as well as euphoria. Doses of about 25 mg produce these effects in most individuals and last for 2 to 3 hours, leading some users to compulsively re-dose to maintain the effects.
Use of bath salts leads to paranoid delusions, violent behavior
Both mephedrone and MDPV are strong inhibitors of dopamine reuptake in areas of the brain regulating reward and motivation.10,11 With prolonged exposure, the resultant stimulant effect of dopamine in reward centers of the brain moves a user from recreational pleasure seeking to addictive use just to maintain normal function.12 This transition occurs in a matter of days or weeks in some individuals, and we have seen multiple readmissions for paranoid psychotic reactions shortly after discharge from hospitalization.
Multiple serious complications of use have been described. The mainstream media have reported bizarre suicides and some homicides.13,14 Our clinic has reported on a unique hallucinatory delirium after use of MDPV, resulting in paranoid delusions and violent behavior in response to vivid hallucinations.15 Other patients suffer prolonged anxiety and panic reactions or depressive symptoms with suicidal ideation.16
Cardiovascular and other sequelae
About half of patients presenting to hospital EDs have cardiovascular complications such as tachycardia, chest pain, and hypertension from the sympathomimetic effects of these agents.9,16 There have also been reports of rhabdomyolysis and renal failure requiring intensive medical treatment.7,9,16
Taken together, mental status changes and physiologic reactions are similar to the “excited delirium” attributed to cocaine, methamphetamine, phencyclidine (PCP), and methylenedioxymethamphetamine (Ecstasy), all drugs that act on central monoamines.17–20 There have also been reports of death after the use of these drugs.21
Cathinones do not show up on routine drug screens
A routine urine screen for synthetic cathinones is not available, although a specific test arranged through commercial laboratories is available for cases when use is suspected. According to a written communication from A. Macher, MD, in 2011 (manuscript in preparation), urine drug screens for PCP using the immunoassay method may yield a false-positive result in the presence of MDPV. Simply asking patients whether they’ve been using these products often elicits an honest answer.
Treatment is largely supportive
Management guidance based on clinical trials is lacking. Cardiovascular complications require usual treatment.9,16 Serious psychiatric reactions may necessitate hospitalization to assure patient safety, particularly with evidence suggesting the potential to act on paranoid delusions or suicidal ideation. Benzodiazepines may be needed to control agitation, and low-dose antipsychotics, such as risperidone 1 mg, can aid in treating hallucinations.9,15
The hallucinatory psychosis seen with these substances is best characterized as a toxic delirium.15 Aggressive use of antipsychotic agents is not advised, given the risk of treatment-related morbidity in patients with a history of repeated stimulant use.22 Many patients presenting with acute delirium may require restraints. These procedures should be used with caution to minimize muscle tissue damage; patients should be monitored frequently for hyperthermia, dehydration, and rhabdomyolysis.16
Nothing is known about the long-term effects of these drugs, although substances with similar actions are associated with long-term cognitive and memory deficits after repeated use.4
CORRESPONDENCE Thomas M. Penders, MD, LFAPA, Department of Psychiatry, Brody School of Medicine, East Carolina University, 600 Moye Boulevard, Greenville, NC 27834; penderst@ecu.edu
1. National Drug Intelligence Center. Synthetic Cathinones (Bath Salts): An Emerging Domestic Threat. Washington, DC: Department of Justice; July 2011. Publication no. 2011-S0787-004.
2. American Association of Poison Control Centers. Bath salts data, updated February 8, 2012. Available at: http://www.aapcc.org/dnn/Portals/0/Bath%20Salts%20Data%20for%20Website%202.8.2012.pdf. Accessed March 2, 2012.
3. Kalix P. Catha edulis, a plant that has amphetamine effects. Pharm World Sci. 1996;18:69-73.
4. Hadlock GC, Webb KM, McFadden LM, et al. 4-Methylmethcathinone (mephedrone): neuropharmacologic effects of a designer stimulant of abuse. J Pharmacol Exp Ther. 2011;339:530-536.
5. Bentur Y, Bloom-Krasik A, Raikhlin-Eisenkraft B. Illicit cathinone (“Hagigat”) poisoning. Clin Toxicol (Phila). 2008;46:206-210.
6. Winstock AR, Mitcheson LR, Deluca P, et al. Mephedrone, new kid for the chop? Addiction. 2010;106:154-161.
7. Spiller HA, Ryan ML, Weston RG, et al. Clinical experience with and analytic confirmation of “bath salts” and “legal highs” (synthetic cathinones) in the United States. Clin Toxicol (Phila). 2011;49:499-505.
8. DeNoon DJ. “Bath salts” used to get high are now illegal. WebMD. Available at: http://www.webmd.com/mental-health/news/20110908/bath-salts-used-to-get-high-are-now-illegal. Accessed October 10, 2011.
9. Centers for Disease Control and Prevention. Emergency department visits after use of a drug sold as “bath salts”—Michigan, November 13, 2010 – March 31, 2011. MMWR Morb Mortal Wkly Rep. 2011;60:624-627.
10. Kelly JP. Cathinone derivatives: a review of the chemistry, pharmacology and toxicology. Drug Test Anal. 2011;3:439-453.
11. Advisory Council on the Misuse of Drugs (ACMD). ACMD report on the consideration of the cathinones. London, UK: Home Office; March 31, 2010. Available at: http://www.homeoffice.gov.uk/publications/drugs/acmd1/acmd-cathinodes-report-2010. Accessed October 10, 2011.
12. Koob GF, Volkow ND. Neurocircuitry of addiction. Neuropsychopharmacology. 2010;35:217-238.
13. Lewis B. Man commits suicide after using bath salts. WNDU.com: 2011. Available at: http://www.wndu.com/hometop/headlines/Man_commits_suicide_after_doing_bath_salts_123520219.html. Accessed October 9, 2011.
14. Goodnough A, Zezima K. An alarming new stimulant, legal in many states. The New York Times; July 16, 2011. Available at: http://www.nytimes.com/2011/07/17/us/17salts.html?pagewanted=all. Accessed October 12, 2011.
15. Penders T, Gestring R. Hallucinatory delirium following use of MDPV (“bath salts”). Gen Hosp Psychiatry. 2011;33:525-526.
16. Ross EA, Watson M, Goldberger B. “Bath salts” intoxication. N Engl J Med. 2011;365:967-968.
17. Ruttenber AJ, McAnally HB, Wetli CV. Cocaine-associated rhabdomyolysis and excited delirium: different stages of the same syndrome. Am J Forensic Med Pathol. 1999;20:120-127.
18. Richards JR, Johnson EB, Stark RW, et al. Methamphetamine abuse and rhabdomyolysis in the ED: a 5-year study. Am J Emerg Med. 1999;17:681-685.
19. Henry JA, Jeffreys KJ, Dawling S. Toxicity and deaths from 3,4 methylenedioxymethamphetamine (“ecstasy”). Lancet. 1992;340:384-387.
20. Lahmeyer HW, Stock PG. Phencyclidine intoxication, physical restraint, and acute renal failure: case report. J Clin Psychiatry. 1983;44:184-185.
21. Murray BL, Murphy CM, Beuhler MC. Death following recreational use of designer drug “Bath Salts” containing 3,4, methylenedioxypyrovalerone (MDPV). J Med Toxicol. 2012;8:69-75.
22. Akpaffiong MJ, Ruiz P. Neuroleptic malignant syndrome: a complication of neuroleptics and cocaine abuse. Psychiatr Q. 1991;62:299-309.
Thyroid nodules: When is an aggressive evaluation warranted?
• Suspect malignancy if a patient with a thyroid nodule also exhibits hoarseness, persistent lymphadenopathy, or dysphagia. C
• Direct your evaluation toward hyperthyroidism instead of malignancy if the level of thyroid stimulating hormone is <0.5 μIU/mL. B
• Arrange for ultrasound imaging when there is a need to assess the size, consistency, and additional features of a nodule. B
Strength of recommendation (SOR)
A Good-quality patient-oriented evidence
B Inconsistent or limited-quality patient-oriented evidence
C Consensus, usual practice, opinion, disease-oriented evidence, case series
You detect a solitary thyroid nodule during a patient’s annual physical examination. He’s 50 years old, in generally good health, and has no symptoms suggestive of thyroid disease. How far would you go in your investigation?
Thyroid nodules are fairly prevalent in the United States. Although the estimated prevalence of palpable thyroid nodules is 5%,1 autopsy studies show the prevalence of all nodules to be 49% to 57%.2 Ultrasound studies of asymptomatic individuals have reported incidental detection of thyroid nodules in 35% to 67% of patients,3-5 and similar findings occur with other imaging modalities.
The main concerns with thyroid nodules are malignancy and hyperactivity. The good news is that both palpable and nonpalpable nodules carry just a 5% risk of malignancy.6 Thus, it makes sense to limit screening of nodules to individuals at high risk—eg, males, those who are younger than 30 or older than 60 years, and patients who have had radiation treatment to the head and neck, have a family history of thyroid cancer or multiple endocrine neoplasia, or have had rapid growth of a nodule and associated lymphadenopathy.6
For the estimated 300,000 new nodules detected annually in the United States,7 we present a cost-effective approach to optimal diagnostic evaluation (ALGORITHM), reflecting guidelines issued by the American Thyroid Association and the American Association of Clinical Endocrinologists.6,8
ALGORITHM
Recommended evaluation of a thyroid nodule6,8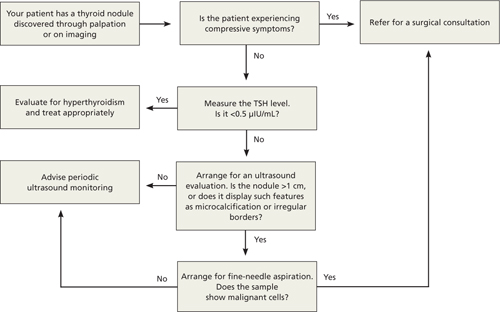
How signs and symptoms can direct your investigation
Most thyroid nodules are asymptomatic and are discovered during physical evaluation or during neck imaging for unrelated reasons. When symptoms occur, they are due either to hormonal dysfunction (hyper- or hypothyroidism) or mechanical compression.
Signs and symptoms of hyperthyroidism—eg, weight loss, tachycardia, irritability, sweating—suggest a “hot” nodule, which has very low malignancy potential.6
A sudden increase in nodule size accompanied by pain usually signifies acute hemorrhage into a cystic lesion. But because some cystic lesions also exhibit solid components, malignancy is a possibility.
Hoarseness, persistent lymphadenopathy, and dysphagia signal possible malignancy and should prompt aggressive evaluation.
Laboratory testing: Recommendations and cautions
Obtain a measurement of serum thyroid-stimulating hormone (TSH).6 A suppressed level (<0.5 μIU/mL) is found in about 10% of patients with a solitary nodule9; it significantly decreases the likelihood of thyroid malignancy10 and should redirect efforts toward uncovering a nonmalignant cause of hyperactivity. On the other hand, a normal or elevated TSH level does not preclude the presence of malignancy.
If the TSH level is normal, no additional information is gained by measuring thyroid hormone levels, serum thyroid autoantibodies titers (antithyroglobulin, antithyroid peroxidase), or serum thyroglobulin.
Routine measurement of serum calcitonin has been proposed as a cost-effective screen for medullary thyroid carcinoma11 in individuals at high risk, such as those with a family history of multiple endocrine neoplasia.12 However, there is no clear recommendation for its use in screening all patients with thyroid nodules.6
Imaging: Generally limit to ultrasound
Ultrasound is the best imaging modality for evaluating the size and consistency (cystic vs solid) of the thyroid nodule.13 It can also detect microcalcifications, irregular margins, lymphadenopathy, and intranodular vascularity—features suggestive of malignancy, although not confirmatory. The ultrasound finding that probably correlates most strongly with benignity is a predominantly cystic lesion.14
I123 radioactive iodine uptake and scanning is not recommended for the routine evaluation of thyroid nodules. Its role is limited to cases with suppressed TSH, as only 5% of all thyroid nodules are “hot.”15 Computed tomography, magnetic resonance imaging, 18fluorodeoxyglucose positron emission tomography (18FDG-PET), and sestamibi scans are not cost effective in the work-up of thyroid nodules, although thyroid lesions commonly appear on these scans when they are obtained for other reasons. In particular, 18FDG-PET and sestamibi scans assess function rather than anatomy, and a finding of thyroid “incidentaloma” often leads to confusion regarding its clinical significance. Multiple reports have, however, suggested an increased incidence of cancer in 18FDG-PET-avid thyroid lesions (14%-30%)16-18; should a patient undergo this procedure and exhibit such a lesion, further investigation by fine-needle aspiration (FNA) is warranted.18,19 The significance of a positive sestamibi scan for a thyroid lesion appears to be more controversial, with conflicting reports about its ability to predict thyroid malignancy.20-22
Who is a candidate for fine-needle aspiration?
FNA is unequivocally the most cost-effective tool for establishing the benignity or malignancy of a thyroid nodule. Its estimated sensitivity is 83%, specificity is 92%, and positive predictive value is 75%.7 Selecting nodules and biopsy technique appropriately can decrease sampling error. Nodules that are purely cystic and those that appear “hot” on radioactive iodine scanning do not require sampling. Neither do nodules <1 cm in diameter that lack features associated with malignancy. However, any nodule >5 mm in diameter with high-risk or otherwise suspicious features (eg, microcalcifications, irregular margins) on ultrasound are candidates for FNA.6
With the exception of easily palpable nodules, ultrasound imaging is widely used to guide biopsy (UG-FNA) so as to minimize the rate of nondiagnostic samples. Historically, less than 10% of FNA results are malignant and 60% to 80% are confirmed benign.6
Management decisions
Confirmation of a benign nodule obviates the need for surgical resection, although follow-up is required with serial ultrasound evaluations to assess any increase in size. Slow growth is the natural history of thyroid nodules,23 and there are no clear data to indicate a rate or degree of growth suggestive of malignancy.24 Order a repeat ultrasound examination 6 to 18 months after the initial evaluation. Should a nodule show more than 50% change in volume (20% change in 2 dimensions), consider referring for UG-FNA6 or surgical resection.7 Referral for surgical resection is also warranted if compressive symptoms occur despite a nodule’s benign nature. A meta-analysis of the use of levothyroxine supplementation to prevent nodular growth did not show a statistically significant effect, although a trend toward shrinkage was noted.25
A clear diagnosis of malignancy on FNA necessitates a surgical referral for total thyroidectomy, as well as an endocrinology consultation for possible postoperative radioactive iodine remnant ablation and thyroid hormone replacement. Suspicious cytology results and follicular lesions in the presence of normal thyroid function usually require surgical resection due to high rates of malignancy confirmed postoperatively (60% and 20%, respectively).6
If the FNA result is nondiagnostic on the first attempt, a second attempt is warranted, preferably under ultrasound guidance (UG-FNA) to improve yield. A second nondiagnostic sample is an indication for surgical resection. Up to 12% of such scenarios lead to histologically confirmed malignancy postoperatively.6
Radioactive iodine therapy is commonly used to treat hyperfunctioning “hot” nodules, yielding a rate of return to normal function between 85% and 100%, and a median reduction in size of 45% at 2 years.6 Using radioactive iodine to treat nodular disease in euthyroid individuals with normal uptake on a scan had variable results, with 20% of patients having no change in nodule size and 80% having up to a 60% decrease in size at 5 years.6 Large-scale studies are needed to compare radioactive iodine therapy with surgical resection.
CORRESPONDENCE Armand Krikorian, MD, Division of Clinical and Molecular Endocrinology, Case Western Reserve University, 11100 Euclid Avenue, Cleveland, OH 44106; armand.krikorian@UHhospitals.org
1. Singer PA, Cooper DS, Daniels GH, et al. Treatment guidelines for patients with thyroid nodules and well-differentiated thyroid cancer. American Thyroid Association. Arch Intern Med. 1996;156:2165-2172.
2. Pinchera A. Thyroid incidentalomas. Horm Res. 2007;68(suppl 5):199-201.
3. Brander A, Viikinkoski P, Nickels J, et al. Thyroid gland: US screening in middle-aged women with no previous thyroid disease. Radiology. 1989;173:507-510.
4. Ezzat S, Sarti DA, Cain DR, et al. Thyroid incidentalomas. Prevalence by palpation and ultrasonography. Arch Intern Med. 1994;154:1838-1840.
5. Guth S, Theune U, Aberle J, et al. Very high prevalence of thyroid nodules detected by high frequency (13 MHz) ultrasound examination. Eur J Clin Invest. 2009;39:699-706.
6. Gharib H, Papini E, Paschke R, et al. American Association of Clinical Endocrinologists, Associazione Medici Endocrinologi, and European Thyroid Association medical guidelines for clinical practice for the diagnosis and management of thyroid nodules. Endocr Pract. 2010;16(suppl 1):1-43.
7. Gharib H, Papini E. Thyroid nodules: clinical importance, assessment, and treatment. Endocrinol Metab Clin North Am. 2007;36:707-735, vi.
8. Cooper DS, Doherty GM, Haugen BR, et al. Revised American Thyroid Association management guidelines for patients with thyroid nodules and differentiated thyroid cancer. Thyroid. 2009;19:1167-1214.
9. Bomeli SR, LeBeau SO, Ferris RL. Evaluation of a thyroid nodule. Otolaryngol Clin North Am. 2010;43:229-238, vii.
10. Fiore E, Rago T, Provenzale MA, et al. Lower levels of TSH are associated with a lower risk of papillary thyroid cancer in patients with thyroid nodular disease: thyroid autonomy may play a protective role. Endocr Relat Cancer. 2009;16:1251-1260.
11. Cheung K, Roman SA, Wang TS, et al. Calcitonin measurement in the evaluation of thyroid nodules in the United States: a cost-effectiveness and decision analysis. J Clin Endocr Metab. 2008;93:2173-2180.
12. Brandi ML, Gagel RF, Angeli A, et al. Guidelines for diagnosis and therapy of MEN type 1 and type 2. J Clin Endocrinol Metab. 2001;86:5658-5671.
13. Solbiati L, Osti V, Cova L, et al. Ultrasound of thyroid, parathyroid glands and neck lymph nodes. Eur Radiol. 2001;11:2411-2424.
14. Frates MC, Benson CB, Doubilet PM, et al. Prevalence and distribution of carcinoma in patients with solitary and multiple thyroid nodules on sonography. J Clin Endocrinol Metab. 2006;91:3411-3417.
15. Cases JA, Surks MI. The changing role of scintigraphy in the evaluation of thyroid nodules. Semin Nucl Med. 2000;30:81-87.
16. Chen YK, Ding HJ, Chen KT, et al. Prevalence and risk of cancer of focal thyroid incidentaloma identified by 18F-fluorodeoxyglucose positron emission tomography for cancer screening in healthy subjects. Anticancer Res. 2005;25:1421-1426.
17. Choi JY, Lee KS, Kim HJ, et al. Focal thyroid lesions incidentally identified by integrated 18F-FDG PET/CT: clinical significance and improved characterization. J Nucl Med. 2006;47:609-615.
18. Shie P, Cardarelli R, Sprawls K, et al. Systematic review: prevalence of malignant incidental thyroid nodules identified on fluorine-18 fluorodeoxyglucose positron emission tomography. Nucl Med Commun. 2009;30:742-748.
19. Cibas ES. Fine-needle aspiration in the work-up of thyroid nodules. Otolaryngol Clin North Am. 2010;43:257-271, vii-viii.
20. Giovanella L, Suriano S, Maffioli M, et al. (99m)Tc-sestamibi scanning in thyroid nodules with nondiagnostic cytology. Head Neck. 2010;32:607-611.
21. Kresnik E, Gallowitsch HJ, Mikosch P, et al. Technetium-99m-MIBI scintigraphy of thyroid nodules in an endemic goiter area. J Nucl Med. 1997;38:62-65.
22. Sathekge MM, Mageza RB, Muthuphei MN, et al. Evaluation of thyroid nodules with technetium-99m MIBI and technetium-99m pertechnetate. Head Neck. 2001;23:305-310.
23. Alexander EK, Hurwitz S, Heering JP, et al. Natural history of benign solid and cystic thyroid nodules. Ann Intern Med. 2003;138:315-318.
24. Asanuma K, Kobayashi S, Shingu K, et al. The rate of tumour growth does not distinguish between malignant and benign thyroid nodules. Eur J Surg. 2001;167:102-105.
25. Castro MR, Caraballo PJ, Morris JC. Effectiveness of thyroid hormone suppressive therapy in benign solitary thyroid nodules: a meta-analysis. J Clin Endocrinol Metab. 2002;87:4154-4159.
• Suspect malignancy if a patient with a thyroid nodule also exhibits hoarseness, persistent lymphadenopathy, or dysphagia. C
• Direct your evaluation toward hyperthyroidism instead of malignancy if the level of thyroid stimulating hormone is <0.5 μIU/mL. B
• Arrange for ultrasound imaging when there is a need to assess the size, consistency, and additional features of a nodule. B
Strength of recommendation (SOR)
A Good-quality patient-oriented evidence
B Inconsistent or limited-quality patient-oriented evidence
C Consensus, usual practice, opinion, disease-oriented evidence, case series
You detect a solitary thyroid nodule during a patient’s annual physical examination. He’s 50 years old, in generally good health, and has no symptoms suggestive of thyroid disease. How far would you go in your investigation?
Thyroid nodules are fairly prevalent in the United States. Although the estimated prevalence of palpable thyroid nodules is 5%,1 autopsy studies show the prevalence of all nodules to be 49% to 57%.2 Ultrasound studies of asymptomatic individuals have reported incidental detection of thyroid nodules in 35% to 67% of patients,3-5 and similar findings occur with other imaging modalities.
The main concerns with thyroid nodules are malignancy and hyperactivity. The good news is that both palpable and nonpalpable nodules carry just a 5% risk of malignancy.6 Thus, it makes sense to limit screening of nodules to individuals at high risk—eg, males, those who are younger than 30 or older than 60 years, and patients who have had radiation treatment to the head and neck, have a family history of thyroid cancer or multiple endocrine neoplasia, or have had rapid growth of a nodule and associated lymphadenopathy.6
For the estimated 300,000 new nodules detected annually in the United States,7 we present a cost-effective approach to optimal diagnostic evaluation (ALGORITHM), reflecting guidelines issued by the American Thyroid Association and the American Association of Clinical Endocrinologists.6,8
ALGORITHM
Recommended evaluation of a thyroid nodule6,8
How signs and symptoms can direct your investigation
Most thyroid nodules are asymptomatic and are discovered during physical evaluation or during neck imaging for unrelated reasons. When symptoms occur, they are due either to hormonal dysfunction (hyper- or hypothyroidism) or mechanical compression.
Signs and symptoms of hyperthyroidism—eg, weight loss, tachycardia, irritability, sweating—suggest a “hot” nodule, which has very low malignancy potential.6
A sudden increase in nodule size accompanied by pain usually signifies acute hemorrhage into a cystic lesion. But because some cystic lesions also exhibit solid components, malignancy is a possibility.
Hoarseness, persistent lymphadenopathy, and dysphagia signal possible malignancy and should prompt aggressive evaluation.
Laboratory testing: Recommendations and cautions
Obtain a measurement of serum thyroid-stimulating hormone (TSH).6 A suppressed level (<0.5 μIU/mL) is found in about 10% of patients with a solitary nodule9; it significantly decreases the likelihood of thyroid malignancy10 and should redirect efforts toward uncovering a nonmalignant cause of hyperactivity. On the other hand, a normal or elevated TSH level does not preclude the presence of malignancy.
If the TSH level is normal, no additional information is gained by measuring thyroid hormone levels, serum thyroid autoantibodies titers (antithyroglobulin, antithyroid peroxidase), or serum thyroglobulin.
Routine measurement of serum calcitonin has been proposed as a cost-effective screen for medullary thyroid carcinoma11 in individuals at high risk, such as those with a family history of multiple endocrine neoplasia.12 However, there is no clear recommendation for its use in screening all patients with thyroid nodules.6
Imaging: Generally limit to ultrasound
Ultrasound is the best imaging modality for evaluating the size and consistency (cystic vs solid) of the thyroid nodule.13 It can also detect microcalcifications, irregular margins, lymphadenopathy, and intranodular vascularity—features suggestive of malignancy, although not confirmatory. The ultrasound finding that probably correlates most strongly with benignity is a predominantly cystic lesion.14
I123 radioactive iodine uptake and scanning is not recommended for the routine evaluation of thyroid nodules. Its role is limited to cases with suppressed TSH, as only 5% of all thyroid nodules are “hot.”15 Computed tomography, magnetic resonance imaging, 18fluorodeoxyglucose positron emission tomography (18FDG-PET), and sestamibi scans are not cost effective in the work-up of thyroid nodules, although thyroid lesions commonly appear on these scans when they are obtained for other reasons. In particular, 18FDG-PET and sestamibi scans assess function rather than anatomy, and a finding of thyroid “incidentaloma” often leads to confusion regarding its clinical significance. Multiple reports have, however, suggested an increased incidence of cancer in 18FDG-PET-avid thyroid lesions (14%-30%)16-18; should a patient undergo this procedure and exhibit such a lesion, further investigation by fine-needle aspiration (FNA) is warranted.18,19 The significance of a positive sestamibi scan for a thyroid lesion appears to be more controversial, with conflicting reports about its ability to predict thyroid malignancy.20-22
Who is a candidate for fine-needle aspiration?
FNA is unequivocally the most cost-effective tool for establishing the benignity or malignancy of a thyroid nodule. Its estimated sensitivity is 83%, specificity is 92%, and positive predictive value is 75%.7 Selecting nodules and biopsy technique appropriately can decrease sampling error. Nodules that are purely cystic and those that appear “hot” on radioactive iodine scanning do not require sampling. Neither do nodules <1 cm in diameter that lack features associated with malignancy. However, any nodule >5 mm in diameter with high-risk or otherwise suspicious features (eg, microcalcifications, irregular margins) on ultrasound are candidates for FNA.6
With the exception of easily palpable nodules, ultrasound imaging is widely used to guide biopsy (UG-FNA) so as to minimize the rate of nondiagnostic samples. Historically, less than 10% of FNA results are malignant and 60% to 80% are confirmed benign.6
Management decisions
Confirmation of a benign nodule obviates the need for surgical resection, although follow-up is required with serial ultrasound evaluations to assess any increase in size. Slow growth is the natural history of thyroid nodules,23 and there are no clear data to indicate a rate or degree of growth suggestive of malignancy.24 Order a repeat ultrasound examination 6 to 18 months after the initial evaluation. Should a nodule show more than 50% change in volume (20% change in 2 dimensions), consider referring for UG-FNA6 or surgical resection.7 Referral for surgical resection is also warranted if compressive symptoms occur despite a nodule’s benign nature. A meta-analysis of the use of levothyroxine supplementation to prevent nodular growth did not show a statistically significant effect, although a trend toward shrinkage was noted.25
A clear diagnosis of malignancy on FNA necessitates a surgical referral for total thyroidectomy, as well as an endocrinology consultation for possible postoperative radioactive iodine remnant ablation and thyroid hormone replacement. Suspicious cytology results and follicular lesions in the presence of normal thyroid function usually require surgical resection due to high rates of malignancy confirmed postoperatively (60% and 20%, respectively).6
If the FNA result is nondiagnostic on the first attempt, a second attempt is warranted, preferably under ultrasound guidance (UG-FNA) to improve yield. A second nondiagnostic sample is an indication for surgical resection. Up to 12% of such scenarios lead to histologically confirmed malignancy postoperatively.6
Radioactive iodine therapy is commonly used to treat hyperfunctioning “hot” nodules, yielding a rate of return to normal function between 85% and 100%, and a median reduction in size of 45% at 2 years.6 Using radioactive iodine to treat nodular disease in euthyroid individuals with normal uptake on a scan had variable results, with 20% of patients having no change in nodule size and 80% having up to a 60% decrease in size at 5 years.6 Large-scale studies are needed to compare radioactive iodine therapy with surgical resection.
CORRESPONDENCE Armand Krikorian, MD, Division of Clinical and Molecular Endocrinology, Case Western Reserve University, 11100 Euclid Avenue, Cleveland, OH 44106; armand.krikorian@UHhospitals.org
1. Singer PA, Cooper DS, Daniels GH, et al. Treatment guidelines for patients with thyroid nodules and well-differentiated thyroid cancer. American Thyroid Association. Arch Intern Med. 1996;156:2165-2172.
2. Pinchera A. Thyroid incidentalomas. Horm Res. 2007;68(suppl 5):199-201.
3. Brander A, Viikinkoski P, Nickels J, et al. Thyroid gland: US screening in middle-aged women with no previous thyroid disease. Radiology. 1989;173:507-510.
4. Ezzat S, Sarti DA, Cain DR, et al. Thyroid incidentalomas. Prevalence by palpation and ultrasonography. Arch Intern Med. 1994;154:1838-1840.
5. Guth S, Theune U, Aberle J, et al. Very high prevalence of thyroid nodules detected by high frequency (13 MHz) ultrasound examination. Eur J Clin Invest. 2009;39:699-706.
6. Gharib H, Papini E, Paschke R, et al. American Association of Clinical Endocrinologists, Associazione Medici Endocrinologi, and European Thyroid Association medical guidelines for clinical practice for the diagnosis and management of thyroid nodules. Endocr Pract. 2010;16(suppl 1):1-43.
7. Gharib H, Papini E. Thyroid nodules: clinical importance, assessment, and treatment. Endocrinol Metab Clin North Am. 2007;36:707-735, vi.
8. Cooper DS, Doherty GM, Haugen BR, et al. Revised American Thyroid Association management guidelines for patients with thyroid nodules and differentiated thyroid cancer. Thyroid. 2009;19:1167-1214.
9. Bomeli SR, LeBeau SO, Ferris RL. Evaluation of a thyroid nodule. Otolaryngol Clin North Am. 2010;43:229-238, vii.
10. Fiore E, Rago T, Provenzale MA, et al. Lower levels of TSH are associated with a lower risk of papillary thyroid cancer in patients with thyroid nodular disease: thyroid autonomy may play a protective role. Endocr Relat Cancer. 2009;16:1251-1260.
11. Cheung K, Roman SA, Wang TS, et al. Calcitonin measurement in the evaluation of thyroid nodules in the United States: a cost-effectiveness and decision analysis. J Clin Endocr Metab. 2008;93:2173-2180.
12. Brandi ML, Gagel RF, Angeli A, et al. Guidelines for diagnosis and therapy of MEN type 1 and type 2. J Clin Endocrinol Metab. 2001;86:5658-5671.
13. Solbiati L, Osti V, Cova L, et al. Ultrasound of thyroid, parathyroid glands and neck lymph nodes. Eur Radiol. 2001;11:2411-2424.
14. Frates MC, Benson CB, Doubilet PM, et al. Prevalence and distribution of carcinoma in patients with solitary and multiple thyroid nodules on sonography. J Clin Endocrinol Metab. 2006;91:3411-3417.
15. Cases JA, Surks MI. The changing role of scintigraphy in the evaluation of thyroid nodules. Semin Nucl Med. 2000;30:81-87.
16. Chen YK, Ding HJ, Chen KT, et al. Prevalence and risk of cancer of focal thyroid incidentaloma identified by 18F-fluorodeoxyglucose positron emission tomography for cancer screening in healthy subjects. Anticancer Res. 2005;25:1421-1426.
17. Choi JY, Lee KS, Kim HJ, et al. Focal thyroid lesions incidentally identified by integrated 18F-FDG PET/CT: clinical significance and improved characterization. J Nucl Med. 2006;47:609-615.
18. Shie P, Cardarelli R, Sprawls K, et al. Systematic review: prevalence of malignant incidental thyroid nodules identified on fluorine-18 fluorodeoxyglucose positron emission tomography. Nucl Med Commun. 2009;30:742-748.
19. Cibas ES. Fine-needle aspiration in the work-up of thyroid nodules. Otolaryngol Clin North Am. 2010;43:257-271, vii-viii.
20. Giovanella L, Suriano S, Maffioli M, et al. (99m)Tc-sestamibi scanning in thyroid nodules with nondiagnostic cytology. Head Neck. 2010;32:607-611.
21. Kresnik E, Gallowitsch HJ, Mikosch P, et al. Technetium-99m-MIBI scintigraphy of thyroid nodules in an endemic goiter area. J Nucl Med. 1997;38:62-65.
22. Sathekge MM, Mageza RB, Muthuphei MN, et al. Evaluation of thyroid nodules with technetium-99m MIBI and technetium-99m pertechnetate. Head Neck. 2001;23:305-310.
23. Alexander EK, Hurwitz S, Heering JP, et al. Natural history of benign solid and cystic thyroid nodules. Ann Intern Med. 2003;138:315-318.
24. Asanuma K, Kobayashi S, Shingu K, et al. The rate of tumour growth does not distinguish between malignant and benign thyroid nodules. Eur J Surg. 2001;167:102-105.
25. Castro MR, Caraballo PJ, Morris JC. Effectiveness of thyroid hormone suppressive therapy in benign solitary thyroid nodules: a meta-analysis. J Clin Endocrinol Metab. 2002;87:4154-4159.
Not just a sprain: 4 foot and ankle injuries you may be missing
• Treat a nondisplaced shaft fracture of the fifth metatarsal conservatively, with 6 to 8 weeks of immobilization with a protective orthosis. B
• Suspect a navicular fracture in patients who describe a gradual onset of vague, dorsal midfoot pain associated with athletic activity. C
• Order magnetic resonance imaging when you suspect osteochondritis dissecans, as radiographs are insensitive for identifying these lesions. C
Strength of recommendation (SOR)
A Good-quality patient-oriented evidence
B Inconsistent or limited-quality patient-oriented evidence
C Consensus, usual practice, opinion, disease-oriented evidence, case series
Ankle sprain, one of the more common injuries that primary care physicians evaluate, is usually managed with conservative treatment. Not uncommonly, however, lateral ankle sprain is diagnosed without consideration of a broader differential diagnosis.
Contributing to the problem is the fact that the clinical presentation of some fractures and tendon injuries is similar to that of a routine sprain. In some cases, the mechanism of injury—sprains are usually caused by excessive inversion of the ankle on a plantar-flexed foot—is similar, as well. What’s more, radiographs are often omitted or misinterpreted.
In the pages that follow, we highlight 4 commonly misdiagnosed injuries: fifth metatarsal fractures, navicular fractures, talar dome lesions, and peroneal tendon injuries. These injuries should be included in the differential diagnosis of an acute ankle injury—or a subacute foot or ankle injury that fails to respond as expected. Prompt recognition and appropriate treatment result in optimal outcomes. When foot and ankle fractures and tendon injuries are misdiagnosed (or simply missed) and do not receive adequate treatment, long-term morbidity, including frequent reinjury and disability, may result.1
Are x-rays needed? Turn to the Ottawa rules
Ankle sprains represent a disruption in a ligament supporting a joint, and result in pain, edema, and ecchymosis, and often affect a patient’s ability to bear weight. While uncomplicated sprains generally heal with conservative treatment, other common foot and ankle injuries may require a different approach.
The Ottawa foot and ankle rules are an evidence-based guide to the use of initial radiographs after acute ankle injury (TABLE 1).2-4 Pain—near the malleoli (for the ankle) or in the midfoot—is the key criterion, but x-rays are recommended only if at least one other specified criterion is also met. With a sensitivity of nearly 100%, the rules have been shown to reliably exclude, and diagnose, ankle and midfoot fractures in children >5 years and adults.2,5
Table 1
Ottawa ankle and foot rules2-4
| Ankle |
X-rays are required only if the patient has pain near the malleolus and one or more of the following:
|
| Foot |
X-rays are required only if the patient has pain in the midfoot and one or more of the following:
|
Fifth metatarsal fractures are easily missed
The mechanism of injury for a fifth metatarsal fracture is often similar to that of a lateral ankle sprain. In addition, isolated ankle radiographs may not adequately evaluate the fifth metatarsal, which increases the risk of misdiagnosis.6
3 types of fifth metatarsal fractures
Fifth metatarsal fractures involve one of the following:
- an avulsion fracture, caused by the pull of the plantar aponeurosis and the peroneus brevis tendon at the tuberosity of the bone
- a Jones fracture, at the base of the fourth and fifth metatarsal (FIGURE 1)
- a shaft fracture, distal to the fifth metatarsal joint in the proximal diaphysis.6-8
FIGURE 1
Jones fractures heal slowly
This 50-year-old patient presented with pain and swelling in the ankle and lateral foot shortly after an inversion ankle injury. A radiograph (A) taken at that time reveals a Jones fracture. The second radiograph (B) was taken 6 weeks later, after continued immobilization with no weight-bearing. Three months after the injury (C), the patient was clinically asymptomatic.
While avulsion fractures are generally the result of an inversion ankle injury, Jones fractures are usually caused by a large adductive force applied to the forefoot on a plantar-flexed ankle.6 Shaft fractures, also known as diaphyseal stress fractures, are overuse injuries from chronic overload, usually after a sudden increase in running or walking.9
Patients with fifth metatarsal fractures typically have tenderness with palpation over the area of injury, with edema and ecchymosis when the injury is acute. Evidence-based guidelines recommend x-rays of the foot, including anteroposterior (AP), lateral, and oblique views.2-4 One study supports the use of an additional x-ray—an AP view of the ankle, including the base of the fifth metatarsal—if clinical suspicion is high and initial radiographs are negative or inconclusive.10
Shaft fractures may not be seen on x-rays in the first 3 weeks, but a periosteal reaction or linear lucency near the symptomatic area may be noticeable on radiographs taken at a later date.11 If this overuse injury seems likely but does not show up on the initial x-rays, however, magnetic resonance imaging (MRI) or a technetium bone scan can reliably identify a stress fracture.9
How to treat, when to refer
Treatment of fifth metatarsal fractures range from conservative to surgical, depending on the type (and extent) of injury (TABLE 2).1,5,6,12-14
TABLE 2
Nondisplaced avulsion fractures can be treated conservatively, with relative immobilization. In one prospective study, the use of a stiff-soled shoe, with weight-bearing as tolerated, was associated with excellent long-term outcomes.11 Orthopedic referral for probable reduction and fixation is indicated for avulsion fractures that are comminuted or >2 mm displaced, or have >30% involvement of the cubometatarsal joint.15,16
Jones fractures are known for prolonged healing and nonunion, as well as a high rate of complications. If the fracture is nondisplaced, start with conservative treatment, consisting of nonweight-bearing immobilization for 6 to 8 weeks, with additional immobilization dependent on radiographs. One randomized controlled trial of patients with Jones fractures showed a relatively high failure rate (44%) with casting; patients for whom casting was successful still had a median time to bony union of 15 weeks.17 Specialty consultation may be needed when there is fracture displacement, absence of bony union, or high clinical concern.6,17
Is your patient an athlete? Surgical fixation is favored for injured athletes with Jones fractures because failure rates are lower and both clinical union and return to play are shorter.18,19 In a case series involving 23 athletic patients with Jones fractures, the success rate for immediate surgical screw fixation approached 100% within 6 to 8 weeks.18
Nondisplaced shaft fractures may be treated conservatively, with 6 to 8 weeks of immobilization with a protective orthosis. An orthopedic referral is recommended for patients whose fractures have >3 mm displacement or >10 degree angulation.15
Navicular fractures are overuse injuries
The navicular is predisposed to stress injury because the central third of the bone is relatively avascular. In addition, the navicular is the area of greatest stress and impingement between the talus and cuneiform bones during repetitive foot strikes.12,20 Navicular fractures occur predominantly in track and field athletes.12
Patients presenting with a navicular stress fracture often report a gradual onset of vague dorsal midfoot pain associated with their workout.17 Examination typically reveals tenderness on palpation over the dorsal aspect of the navicular; passive eversion and active inversion may be painful, but edema and ecchymosis are usually absent.21
When pain is elicited by palpation of the navicular, radiographs are recommended.2,6 X-rays have a relatively low sensitivity (33%), however, for detecting acute navicular stress fractures. If initial radiographs are negative but there is a high clinical suspicion, advanced studies—with either MRI or a technetium bone scan—are recommended for a definitive diagnosis.12,22 While both are highly sensitive for navicular stress fractures, MRI provides greater specificity and anatomic detail.23
Most navicular fractures are nondisplaced
Nondisplaced navicular fractures can be treated conservatively, with nonweight-bearing immobilization for 6 to 8 weeks followed by progressive activity.24 Prospective studies have found that conservative treatment has a high success rate, with athletes usually able to return to play within 6 months.22,24,25 If tenderness remains after 6 to 8 weeks of immobilization, treatment choices are continued immobilization with no weight-bearing or orthopedic referral.26
Referral is indicated for navicular fractures that are comminuted or displaced, or involve more than one bone cortex.26 Surgical screw fixation may be recommended for navicular stress fractures in selected athletes because of its high success rate—and likelihood of an earlier return to play.27
Talar injuries are characterized by persistent pain
Injuries to the talus commonly occur at the same time as ankle sprains and may cause persistent pain, even after the sprain has healed.28 Evidence suggests that up to 90% of residual pain is related to an underlying cartilage injury.29,30 Most talar injuries are associated with the disruption of the cartilage overlaying the talar dome, which may lead to osteochondritis dissecans.29 Subtle talus fractures are also a concern after an acute ankle injury.
Osteochondral lesions are associated with a dull ankle pain deep in a location with a prior ankle injury; in some cases, the pain will become chronic.31 Physical exam findings typically include ankle joint effusion with localized tenderness around the joint.31
Ankle radiographs are insensitive for identifying osteochondral lesions, and MRI is recommended for evaluating suspected lesions.29,31 Treatment varies, depending on symptoms and severity. Patients with minimal symptoms may be treated conservatively; however, high failure rates have been reported.32 Surgical treatment depends on the size and site of the lesion and the degree of cartilage injury, and surgical consultation is recommended.31
Fractures of the talar dome (FIGURE 2) may be either medial or lateral and are often the result of inversion ankle injuries.14 History and clinical findings vary depending on the type of fracture.
FIGURE 2
Talar dome injuries often result from inversion ankle injuries
As with osteochondral lesions, ankle radiographs may fail to identify talus fractures. Computed tomography (CT) should be used to evaluate acute fractures of the talus, as CT scan is better able to define displacement, size, and intra-articular involvement.33 Talar fractures may be managed conservatively with immobilization and nonweight-bearing for 4 to 6 weeks, but specialty consultation should be considered.14,33
A tarsal coalition—an incomplete, congenital separation of the bones, occasionally involving the talus and the calcaneus—can also be a cause of persistent pain after a sprain.28 Physical exam typically demonstrates decreased range of motion in the subtalar or transverse tarsal joint. Radiographs may identify the coalition, but MRI or CT scan provides optimal visualization. Immobilization for 6 weeks is the recommended initial treatment, but if that fails, surgical excision or fusion may be necessary.
Peroneal tendon injuries may cause ankle instability
Peroneal tendon injuries, which include strains, subluxation, dislocation, and tears of one or both of the peroneal tendons, are often caused by ankle inversion similar to that of an uncomplicated sprain. Subsequent ankle instability may result from untreated peroneal tendon injuries.34 Peroneal tendon subluxation accounts for a very small number (0.3%-0.5%) of traumatic ankle injuries.35
Peroneal tendon injuries often occur during sports that involve frequent lateral movement or cutting—eg, football, basketball, and soccer—and are often caused by sudden dorsiflexion of the inverted foot, with coincident contraction of the peroneal muscles.36,37 This mechanism can disrupt the superior peroneal retinaculum, leading to recurrent subluxation or dislocation and subsequent ankle instability.36,38 Chronic subluxation can also result in longitudinal tears of the peroneal tendons, especially of the peroneus brevis.36,38,39
Patients with peroneal tendon injuries may report a “pop” at the time of injury. Pain is typically located posterior to the lateral malleolus, and recurrent subluxation is often described as a “snapping” around the lateral ankle during athletic activities.37,38 Instability is common in patients with subacute or chronic peroneal tendon injuries, especially on uneven surfaces.38
Acute peroneal tendon injuries cause posterolateral ankle pain, swelling, and weakness; exam findings include tenderness along the course of the peroneal tendons with associated edema.37 Subluxation or dislocation of the peroneal brevis tendon may be confirmed by placing the foot in plantar flexion and inversion and asking the patient to forcibly dorsiflex and evert the injured ankle.
Plain radiographs are usually normal in an isolated injury to the peroneal tendons. A fracture of the posterolateral margin of the fibula is a rare finding but indicates disruption of the peroneal retinaculum.36 MRI provides the best imaging for peroneal tendons and the stabilizing retinaculum, although a CT scan can provide detailed bony anatomy when subtle fractures are suspected or additional evaluation is needed.
Subluxation or dislocation indicate a need for surgery
Conservative management is recommended for peroneal tendon strains, but surgical treatment is increasingly recommended for subluxation or dislocation, especially if the problem is recurrent.36,37 Conservative treatment consists of short-term immobilization with a walking boot or brace, followed by physical therapy to improve strength and motion. Surgical treatment of subluxation and dislocation by stabilizing the peroneal tendons within the peroneal groove has been shown to provide lasting stability and improvement.37,38,40,41
CORRESPONDENCE Scott Hall, MD, University of Nevada-Reno, Brigham Building 316, Reno, NV 89557; shallmd@specialtyhealth.com
1. van Rijn RM, van Os AG, Bernsen RM, et al. What is the clinical course of acute ankle sprains? A systematic literature review. Am J Med. 2008;121:324-331.
2. Nugent PJ. Ottawa ankle rules accurately assess injuries and reduce reliance on radiographs. J Fam Pract. 2004;53:785-788.
3. Stiell IG, McKnight RD, Greenberg GH, et al. Implementation of the Ottawa ankle rules. JAMA. 1994;271:827-832.
4. Stiell IG, Greenberg GH, McKnight RD, et al. Decision rules for the use of radiography in acute ankle injuries. JAMA. 1993;269:1127-1132.
5. Judd DB, Kim DH. Foot fractures frequently misdiagnosed as ankle sprains. Am Fam Physician. 2002;66:785-795.
6. Den Hartog BD. Fracture of the proximal fifth metatarsal. J Am Acad Orthop Surg. 2009;17:458-464.
7. Torg JS, Balduini FC, Zelko RR, et al. Fractures of the base of the fifth metatarsal distal to the tuberosity. J Bone Joint Surg Am. 1984;66:209-214.
8. Dameron TB. Fractures and anatomical variations of the proximal portion of the fifth metatarsal. J Bone Joint Surg Am. 1975;57:788-792.
9. Boden BP, Oshbahr DC, Jimenez C. Low-risk stress fractures. Am J Sports Med. 2001;29:100-113.
10. Pao DG. Avulsion fracture of the base of the fifth metatarsal not seen on conventional radiography of the foot: the need for an additional projection. Am J Roentgenol. 2000;175:549-552.
11. Egol K. Avulsion fractures of the fifth metatarsal base: a prospective outcome study. Foot Ankle Int. 2007;28:581-583.
12. Jones MH, Amendola AS. Navicular stress fractures. Clin Sports Med. 2006;25:151-158.
13. Fitch KD, Blackwell JB, Gilmour WN. Operation for non-union of stress fracture of the tarsal navicular. J Bone Joint Surg Br. 1989;71:105-110.
14. Judd DB, Kim DH. Foot fractures frequently misdiagnosed as ankle sprains. Am Fam Physician. 2002;66:785-794.
15. Zwitser EW, Breederveld BS. Fractures of the fifth metatarsal; diagnosis and treatment. Injury. 2010;41:555-562.
16. Koslowsky TC, Gausepohl T, Mader K, et al. Treatment of displaced proximal fifth metatarsal fractures using a new one-step fixation technique. J Trauma. 2010;68:122-125.
17. Mologne TS. Early screw fixation versus casting in the treatment of acute Jones fractures. Am J Sports Med. 2005;33:970-975.
18. Porter DA, Duncan M, Meyer SJF. Fifth metatarsal Jones fracture fixation with a 4.5-mm cannulated stainless steel screw in the competitive and recreational athlete. Am J Sports Med. 2005;33:726-733.
19. Vu D, McDiarmid T, Brown M. What is the most effective management of acute fractures of the base of the fifth metatarsal? J Fam Pract. 2006;55:713-717.
20. Monteleone GP. Stress fractures in the athlete. Orthop Clin North Am. 1995;26:423-432.
21. Torg JS, Pavlov H, Cooley LH, et al. Stress fractures of the tarsal navicular. A retrospective review of twenty-one cases. J Bone Joint Surg Am. 1982;64:700-712.
22. Khan KM, Fuller PJ, Brukner PD, et al. Outcome of conservative and surgical management of navicular stress fracture in athletes. Eighty-six cases proven with computerized tomography. Am J Sports Med. 1992;20:657-666.
23. Sizensky JA, Marks RM. Imaging of the navicular. Foot Ankle Clin. 2004;9:181-209.
24. Torg JS, Moyer J, Gaughan JP, et al. Management of tarsal navicular stress fractures: conservative versus surgical treatment: a meta-analysis. Am J Sports Med. 2010;38:1048-1053.
25. Bojanic I. Conservative treatment of stress fractures of the tarsal navicular in athletes. Rev Chir Orthop Reparatrice Appar Mot. 1997;83:133-138.
26. Ostlie DK, Simons SM. Tarsal navicular stress fracture in a young athlete: case report with clinical, radiologic, and pathophysiologic correlations. J Am Board Fam Pract. 2001;14:381-385.
27. Towne LC, Blazina ME, Cozen LN. Fatigue fracture of the tarsal navicular. J Bone Joint Surg Am. 1970;52:376-378.
28. Strauss JE, Fornberg JA, Lippert FG. Chronic lateral ankle instability and associated conditions: a rationale for treatment. Foot Ankle Int. 2007;28:1041-1044.
29. Schachter AK, Chen AL, Reddy PD, et al. Osteochondral lesions of the talus. J Am Acad Orthop Surg. 2005;13:152-158.
30. Taga I, Shino K, Inoue M, et al. Articular cartilage lesion in ankles with lateral ligament injury. Am J Sport Med. 1993;21:120-127.
31. O’Loughlin PF, Heyworth BE, Kennedy JG. Current concepts in the diagnosis and treatment of osteochondral lesions of the ankle. Am J Sports Med. 2010;38:392-404.
32. Shearer C, Loomer R, Clement D. Nonoperatively managed stage 5 osteochondral talar lesions. Foot Ankle Int. 2002;23:651-654.
33. Haverstock BD. Foot and ankle imaging in the athlete. Clin Podiatr Med Surg. 2008;25:249-262.
34. Geppert M, Sobel M, Bohne W. Lateral ankle instability as a cause of superior peroneal retinacular laxity: an anatomic and biomechanical study of cadaveric feet. Foot Ankle. 1993;14:330-334.
35. Butler BW, Lanthier J, Wertheimer SJ. Subluxing peroneals: a review of the literature and case report. J Foot Ankle Surg. 1993;32:134-139.
36. Roth JA, Taylor WC, Whalen J. Peroneal tendon subluxation: the other lateral ankle injury. Br J Sports Med. 2010;44:1047-1053.
37. Maffulli N, Ferran NA, Oliva F, et al. Recurrent subluxation of the peroneal tendons. Am J Sports Med. 2006;34:986-992.
38. Mason RB, Henderson JP. Traumatic peroneal tendon instability. Am J Sports Med. 1996;24:652-658.
39. Brodsky J, Krause J. Peroneus brevis tendon tears: pathophysiology, surgical reconstruction, and clinical results. Foot Ankle Int. 1998;19:271-279.
40. Marten MA, Noyez JF, Mulier JC. Recurrent dislocation of the peroneal tendons. Results of rerouting the tendons under the calcaneofibular ligament. Am J Sports Med. 1986;14:148-150.
41. Escalas F, Figueras JM, Merino JA. Dislocation of the peroneal tendons. Long-term results of surgical treatment. J Bone Joint Surg Am. 1980;62:451-453.
• Treat a nondisplaced shaft fracture of the fifth metatarsal conservatively, with 6 to 8 weeks of immobilization with a protective orthosis. B
• Suspect a navicular fracture in patients who describe a gradual onset of vague, dorsal midfoot pain associated with athletic activity. C
• Order magnetic resonance imaging when you suspect osteochondritis dissecans, as radiographs are insensitive for identifying these lesions. C
Strength of recommendation (SOR)
A Good-quality patient-oriented evidence
B Inconsistent or limited-quality patient-oriented evidence
C Consensus, usual practice, opinion, disease-oriented evidence, case series
Ankle sprain, one of the more common injuries that primary care physicians evaluate, is usually managed with conservative treatment. Not uncommonly, however, lateral ankle sprain is diagnosed without consideration of a broader differential diagnosis.
Contributing to the problem is the fact that the clinical presentation of some fractures and tendon injuries is similar to that of a routine sprain. In some cases, the mechanism of injury—sprains are usually caused by excessive inversion of the ankle on a plantar-flexed foot—is similar, as well. What’s more, radiographs are often omitted or misinterpreted.
In the pages that follow, we highlight 4 commonly misdiagnosed injuries: fifth metatarsal fractures, navicular fractures, talar dome lesions, and peroneal tendon injuries. These injuries should be included in the differential diagnosis of an acute ankle injury—or a subacute foot or ankle injury that fails to respond as expected. Prompt recognition and appropriate treatment result in optimal outcomes. When foot and ankle fractures and tendon injuries are misdiagnosed (or simply missed) and do not receive adequate treatment, long-term morbidity, including frequent reinjury and disability, may result.1
Are x-rays needed? Turn to the Ottawa rules
Ankle sprains represent a disruption in a ligament supporting a joint, and result in pain, edema, and ecchymosis, and often affect a patient’s ability to bear weight. While uncomplicated sprains generally heal with conservative treatment, other common foot and ankle injuries may require a different approach.
The Ottawa foot and ankle rules are an evidence-based guide to the use of initial radiographs after acute ankle injury (TABLE 1).2-4 Pain—near the malleoli (for the ankle) or in the midfoot—is the key criterion, but x-rays are recommended only if at least one other specified criterion is also met. With a sensitivity of nearly 100%, the rules have been shown to reliably exclude, and diagnose, ankle and midfoot fractures in children >5 years and adults.2,5
Table 1
Ottawa ankle and foot rules2-4
| Ankle |
X-rays are required only if the patient has pain near the malleolus and one or more of the following:
|
| Foot |
X-rays are required only if the patient has pain in the midfoot and one or more of the following:
|
Fifth metatarsal fractures are easily missed
The mechanism of injury for a fifth metatarsal fracture is often similar to that of a lateral ankle sprain. In addition, isolated ankle radiographs may not adequately evaluate the fifth metatarsal, which increases the risk of misdiagnosis.6
3 types of fifth metatarsal fractures
Fifth metatarsal fractures involve one of the following:
- an avulsion fracture, caused by the pull of the plantar aponeurosis and the peroneus brevis tendon at the tuberosity of the bone
- a Jones fracture, at the base of the fourth and fifth metatarsal (FIGURE 1)
- a shaft fracture, distal to the fifth metatarsal joint in the proximal diaphysis.6-8
FIGURE 1
Jones fractures heal slowly
This 50-year-old patient presented with pain and swelling in the ankle and lateral foot shortly after an inversion ankle injury. A radiograph (A) taken at that time reveals a Jones fracture. The second radiograph (B) was taken 6 weeks later, after continued immobilization with no weight-bearing. Three months after the injury (C), the patient was clinically asymptomatic.
While avulsion fractures are generally the result of an inversion ankle injury, Jones fractures are usually caused by a large adductive force applied to the forefoot on a plantar-flexed ankle.6 Shaft fractures, also known as diaphyseal stress fractures, are overuse injuries from chronic overload, usually after a sudden increase in running or walking.9
Patients with fifth metatarsal fractures typically have tenderness with palpation over the area of injury, with edema and ecchymosis when the injury is acute. Evidence-based guidelines recommend x-rays of the foot, including anteroposterior (AP), lateral, and oblique views.2-4 One study supports the use of an additional x-ray—an AP view of the ankle, including the base of the fifth metatarsal—if clinical suspicion is high and initial radiographs are negative or inconclusive.10
Shaft fractures may not be seen on x-rays in the first 3 weeks, but a periosteal reaction or linear lucency near the symptomatic area may be noticeable on radiographs taken at a later date.11 If this overuse injury seems likely but does not show up on the initial x-rays, however, magnetic resonance imaging (MRI) or a technetium bone scan can reliably identify a stress fracture.9
How to treat, when to refer
Treatment of fifth metatarsal fractures range from conservative to surgical, depending on the type (and extent) of injury (TABLE 2).1,5,6,12-14
TABLE 2
Nondisplaced avulsion fractures can be treated conservatively, with relative immobilization. In one prospective study, the use of a stiff-soled shoe, with weight-bearing as tolerated, was associated with excellent long-term outcomes.11 Orthopedic referral for probable reduction and fixation is indicated for avulsion fractures that are comminuted or >2 mm displaced, or have >30% involvement of the cubometatarsal joint.15,16
Jones fractures are known for prolonged healing and nonunion, as well as a high rate of complications. If the fracture is nondisplaced, start with conservative treatment, consisting of nonweight-bearing immobilization for 6 to 8 weeks, with additional immobilization dependent on radiographs. One randomized controlled trial of patients with Jones fractures showed a relatively high failure rate (44%) with casting; patients for whom casting was successful still had a median time to bony union of 15 weeks.17 Specialty consultation may be needed when there is fracture displacement, absence of bony union, or high clinical concern.6,17
Is your patient an athlete? Surgical fixation is favored for injured athletes with Jones fractures because failure rates are lower and both clinical union and return to play are shorter.18,19 In a case series involving 23 athletic patients with Jones fractures, the success rate for immediate surgical screw fixation approached 100% within 6 to 8 weeks.18
Nondisplaced shaft fractures may be treated conservatively, with 6 to 8 weeks of immobilization with a protective orthosis. An orthopedic referral is recommended for patients whose fractures have >3 mm displacement or >10 degree angulation.15
Navicular fractures are overuse injuries
The navicular is predisposed to stress injury because the central third of the bone is relatively avascular. In addition, the navicular is the area of greatest stress and impingement between the talus and cuneiform bones during repetitive foot strikes.12,20 Navicular fractures occur predominantly in track and field athletes.12
Patients presenting with a navicular stress fracture often report a gradual onset of vague dorsal midfoot pain associated with their workout.17 Examination typically reveals tenderness on palpation over the dorsal aspect of the navicular; passive eversion and active inversion may be painful, but edema and ecchymosis are usually absent.21
When pain is elicited by palpation of the navicular, radiographs are recommended.2,6 X-rays have a relatively low sensitivity (33%), however, for detecting acute navicular stress fractures. If initial radiographs are negative but there is a high clinical suspicion, advanced studies—with either MRI or a technetium bone scan—are recommended for a definitive diagnosis.12,22 While both are highly sensitive for navicular stress fractures, MRI provides greater specificity and anatomic detail.23
Most navicular fractures are nondisplaced
Nondisplaced navicular fractures can be treated conservatively, with nonweight-bearing immobilization for 6 to 8 weeks followed by progressive activity.24 Prospective studies have found that conservative treatment has a high success rate, with athletes usually able to return to play within 6 months.22,24,25 If tenderness remains after 6 to 8 weeks of immobilization, treatment choices are continued immobilization with no weight-bearing or orthopedic referral.26
Referral is indicated for navicular fractures that are comminuted or displaced, or involve more than one bone cortex.26 Surgical screw fixation may be recommended for navicular stress fractures in selected athletes because of its high success rate—and likelihood of an earlier return to play.27
Talar injuries are characterized by persistent pain
Injuries to the talus commonly occur at the same time as ankle sprains and may cause persistent pain, even after the sprain has healed.28 Evidence suggests that up to 90% of residual pain is related to an underlying cartilage injury.29,30 Most talar injuries are associated with the disruption of the cartilage overlaying the talar dome, which may lead to osteochondritis dissecans.29 Subtle talus fractures are also a concern after an acute ankle injury.
Osteochondral lesions are associated with a dull ankle pain deep in a location with a prior ankle injury; in some cases, the pain will become chronic.31 Physical exam findings typically include ankle joint effusion with localized tenderness around the joint.31
Ankle radiographs are insensitive for identifying osteochondral lesions, and MRI is recommended for evaluating suspected lesions.29,31 Treatment varies, depending on symptoms and severity. Patients with minimal symptoms may be treated conservatively; however, high failure rates have been reported.32 Surgical treatment depends on the size and site of the lesion and the degree of cartilage injury, and surgical consultation is recommended.31
Fractures of the talar dome (FIGURE 2) may be either medial or lateral and are often the result of inversion ankle injuries.14 History and clinical findings vary depending on the type of fracture.
FIGURE 2
Talar dome injuries often result from inversion ankle injuries
As with osteochondral lesions, ankle radiographs may fail to identify talus fractures. Computed tomography (CT) should be used to evaluate acute fractures of the talus, as CT scan is better able to define displacement, size, and intra-articular involvement.33 Talar fractures may be managed conservatively with immobilization and nonweight-bearing for 4 to 6 weeks, but specialty consultation should be considered.14,33
A tarsal coalition—an incomplete, congenital separation of the bones, occasionally involving the talus and the calcaneus—can also be a cause of persistent pain after a sprain.28 Physical exam typically demonstrates decreased range of motion in the subtalar or transverse tarsal joint. Radiographs may identify the coalition, but MRI or CT scan provides optimal visualization. Immobilization for 6 weeks is the recommended initial treatment, but if that fails, surgical excision or fusion may be necessary.
Peroneal tendon injuries may cause ankle instability
Peroneal tendon injuries, which include strains, subluxation, dislocation, and tears of one or both of the peroneal tendons, are often caused by ankle inversion similar to that of an uncomplicated sprain. Subsequent ankle instability may result from untreated peroneal tendon injuries.34 Peroneal tendon subluxation accounts for a very small number (0.3%-0.5%) of traumatic ankle injuries.35
Peroneal tendon injuries often occur during sports that involve frequent lateral movement or cutting—eg, football, basketball, and soccer—and are often caused by sudden dorsiflexion of the inverted foot, with coincident contraction of the peroneal muscles.36,37 This mechanism can disrupt the superior peroneal retinaculum, leading to recurrent subluxation or dislocation and subsequent ankle instability.36,38 Chronic subluxation can also result in longitudinal tears of the peroneal tendons, especially of the peroneus brevis.36,38,39
Patients with peroneal tendon injuries may report a “pop” at the time of injury. Pain is typically located posterior to the lateral malleolus, and recurrent subluxation is often described as a “snapping” around the lateral ankle during athletic activities.37,38 Instability is common in patients with subacute or chronic peroneal tendon injuries, especially on uneven surfaces.38
Acute peroneal tendon injuries cause posterolateral ankle pain, swelling, and weakness; exam findings include tenderness along the course of the peroneal tendons with associated edema.37 Subluxation or dislocation of the peroneal brevis tendon may be confirmed by placing the foot in plantar flexion and inversion and asking the patient to forcibly dorsiflex and evert the injured ankle.
Plain radiographs are usually normal in an isolated injury to the peroneal tendons. A fracture of the posterolateral margin of the fibula is a rare finding but indicates disruption of the peroneal retinaculum.36 MRI provides the best imaging for peroneal tendons and the stabilizing retinaculum, although a CT scan can provide detailed bony anatomy when subtle fractures are suspected or additional evaluation is needed.
Subluxation or dislocation indicate a need for surgery
Conservative management is recommended for peroneal tendon strains, but surgical treatment is increasingly recommended for subluxation or dislocation, especially if the problem is recurrent.36,37 Conservative treatment consists of short-term immobilization with a walking boot or brace, followed by physical therapy to improve strength and motion. Surgical treatment of subluxation and dislocation by stabilizing the peroneal tendons within the peroneal groove has been shown to provide lasting stability and improvement.37,38,40,41
CORRESPONDENCE Scott Hall, MD, University of Nevada-Reno, Brigham Building 316, Reno, NV 89557; shallmd@specialtyhealth.com
1. van Rijn RM, van Os AG, Bernsen RM, et al. What is the clinical course of acute ankle sprains? A systematic literature review. Am J Med. 2008;121:324-331.
2. Nugent PJ. Ottawa ankle rules accurately assess injuries and reduce reliance on radiographs. J Fam Pract. 2004;53:785-788.
3. Stiell IG, McKnight RD, Greenberg GH, et al. Implementation of the Ottawa ankle rules. JAMA. 1994;271:827-832.
4. Stiell IG, Greenberg GH, McKnight RD, et al. Decision rules for the use of radiography in acute ankle injuries. JAMA. 1993;269:1127-1132.
5. Judd DB, Kim DH. Foot fractures frequently misdiagnosed as ankle sprains. Am Fam Physician. 2002;66:785-795.
6. Den Hartog BD. Fracture of the proximal fifth metatarsal. J Am Acad Orthop Surg. 2009;17:458-464.
7. Torg JS, Balduini FC, Zelko RR, et al. Fractures of the base of the fifth metatarsal distal to the tuberosity. J Bone Joint Surg Am. 1984;66:209-214.
8. Dameron TB. Fractures and anatomical variations of the proximal portion of the fifth metatarsal. J Bone Joint Surg Am. 1975;57:788-792.
9. Boden BP, Oshbahr DC, Jimenez C. Low-risk stress fractures. Am J Sports Med. 2001;29:100-113.
10. Pao DG. Avulsion fracture of the base of the fifth metatarsal not seen on conventional radiography of the foot: the need for an additional projection. Am J Roentgenol. 2000;175:549-552.
11. Egol K. Avulsion fractures of the fifth metatarsal base: a prospective outcome study. Foot Ankle Int. 2007;28:581-583.
12. Jones MH, Amendola AS. Navicular stress fractures. Clin Sports Med. 2006;25:151-158.
13. Fitch KD, Blackwell JB, Gilmour WN. Operation for non-union of stress fracture of the tarsal navicular. J Bone Joint Surg Br. 1989;71:105-110.
14. Judd DB, Kim DH. Foot fractures frequently misdiagnosed as ankle sprains. Am Fam Physician. 2002;66:785-794.
15. Zwitser EW, Breederveld BS. Fractures of the fifth metatarsal; diagnosis and treatment. Injury. 2010;41:555-562.
16. Koslowsky TC, Gausepohl T, Mader K, et al. Treatment of displaced proximal fifth metatarsal fractures using a new one-step fixation technique. J Trauma. 2010;68:122-125.
17. Mologne TS. Early screw fixation versus casting in the treatment of acute Jones fractures. Am J Sports Med. 2005;33:970-975.
18. Porter DA, Duncan M, Meyer SJF. Fifth metatarsal Jones fracture fixation with a 4.5-mm cannulated stainless steel screw in the competitive and recreational athlete. Am J Sports Med. 2005;33:726-733.
19. Vu D, McDiarmid T, Brown M. What is the most effective management of acute fractures of the base of the fifth metatarsal? J Fam Pract. 2006;55:713-717.
20. Monteleone GP. Stress fractures in the athlete. Orthop Clin North Am. 1995;26:423-432.
21. Torg JS, Pavlov H, Cooley LH, et al. Stress fractures of the tarsal navicular. A retrospective review of twenty-one cases. J Bone Joint Surg Am. 1982;64:700-712.
22. Khan KM, Fuller PJ, Brukner PD, et al. Outcome of conservative and surgical management of navicular stress fracture in athletes. Eighty-six cases proven with computerized tomography. Am J Sports Med. 1992;20:657-666.
23. Sizensky JA, Marks RM. Imaging of the navicular. Foot Ankle Clin. 2004;9:181-209.
24. Torg JS, Moyer J, Gaughan JP, et al. Management of tarsal navicular stress fractures: conservative versus surgical treatment: a meta-analysis. Am J Sports Med. 2010;38:1048-1053.
25. Bojanic I. Conservative treatment of stress fractures of the tarsal navicular in athletes. Rev Chir Orthop Reparatrice Appar Mot. 1997;83:133-138.
26. Ostlie DK, Simons SM. Tarsal navicular stress fracture in a young athlete: case report with clinical, radiologic, and pathophysiologic correlations. J Am Board Fam Pract. 2001;14:381-385.
27. Towne LC, Blazina ME, Cozen LN. Fatigue fracture of the tarsal navicular. J Bone Joint Surg Am. 1970;52:376-378.
28. Strauss JE, Fornberg JA, Lippert FG. Chronic lateral ankle instability and associated conditions: a rationale for treatment. Foot Ankle Int. 2007;28:1041-1044.
29. Schachter AK, Chen AL, Reddy PD, et al. Osteochondral lesions of the talus. J Am Acad Orthop Surg. 2005;13:152-158.
30. Taga I, Shino K, Inoue M, et al. Articular cartilage lesion in ankles with lateral ligament injury. Am J Sport Med. 1993;21:120-127.
31. O’Loughlin PF, Heyworth BE, Kennedy JG. Current concepts in the diagnosis and treatment of osteochondral lesions of the ankle. Am J Sports Med. 2010;38:392-404.
32. Shearer C, Loomer R, Clement D. Nonoperatively managed stage 5 osteochondral talar lesions. Foot Ankle Int. 2002;23:651-654.
33. Haverstock BD. Foot and ankle imaging in the athlete. Clin Podiatr Med Surg. 2008;25:249-262.
34. Geppert M, Sobel M, Bohne W. Lateral ankle instability as a cause of superior peroneal retinacular laxity: an anatomic and biomechanical study of cadaveric feet. Foot Ankle. 1993;14:330-334.
35. Butler BW, Lanthier J, Wertheimer SJ. Subluxing peroneals: a review of the literature and case report. J Foot Ankle Surg. 1993;32:134-139.
36. Roth JA, Taylor WC, Whalen J. Peroneal tendon subluxation: the other lateral ankle injury. Br J Sports Med. 2010;44:1047-1053.
37. Maffulli N, Ferran NA, Oliva F, et al. Recurrent subluxation of the peroneal tendons. Am J Sports Med. 2006;34:986-992.
38. Mason RB, Henderson JP. Traumatic peroneal tendon instability. Am J Sports Med. 1996;24:652-658.
39. Brodsky J, Krause J. Peroneus brevis tendon tears: pathophysiology, surgical reconstruction, and clinical results. Foot Ankle Int. 1998;19:271-279.
40. Marten MA, Noyez JF, Mulier JC. Recurrent dislocation of the peroneal tendons. Results of rerouting the tendons under the calcaneofibular ligament. Am J Sports Med. 1986;14:148-150.
41. Escalas F, Figueras JM, Merino JA. Dislocation of the peroneal tendons. Long-term results of surgical treatment. J Bone Joint Surg Am. 1980;62:451-453.
Help your patient “get” what you just said: A health literacy guide
• Prioritize patient teaching, and present no more than 3 to 5 key points per visit. C
• Confirm that patients understand what you’ve told them by asking them to explain it to you (the “teach back” method). B
• Whenever possible, use simple visual aids—eg, draw pictures, use illustrations, or show a video—to get your point across. B
Strength of recommendation (SOR)
A Good-quality patient-oriented evidence
B Inconsistent or limited-quality patient-oriented evidence
C Consensus, usual practice, opinion, disease-oriented evidence, case series
Half of all adults are unable to understand basic health information and services needed well enough to make appropriate health decisions, according to the Institute of Medicine.1 Findings from the 2003 National Assessment of Adult Literacy (NAAL), the National Center for Education Statistics’ only study of Americans’ ability to understand health-related information, painted a similarly grim picture. Although 53% of US adults had “intermediate” health literacy (HL), the NAAL found that up to 90% lacked the skills needed to manage their health and prevent disease.2
The National Patient Safety Foundation reports that low HL is associated with an additional $106 to $238 billion in health care costs per year.3 Among the reasons:
- Up to half of all prescription and over-the-counter medications are taken incorrectly,4 which helps explain why roughly 1.5 million preventable adverse drug reactions occur each year.1
- Chronically ill patients incur higher health care costs as a result of low HL. Consider, for instance, that patients with asthma have more frequent hospitalizations,5 and patients with diabetes have higher glycohemoglobin (HbA1c) and a higher incidence of nephropathy and retinopathy.6
- Elderly patients with low HL are more likely to use the emergency department, and have significantly worse mental health and greater all-cause mortality than their counterparts with higher HL.7
Clearly, this is a problem primary care physicians cannot afford to ignore. The strategies discussed in the text and tables that follow will increase your awareness of the effects of limited HL—and help you take positive steps to address them.
Put health literacy on your radar screen
Anyone can have trouble comprehending medical information at times, but patients who are elderly (≥65 years), cognitively impaired, or have limited education face the highest risk.8 Half of adults who never completed high school have “below basic” HL, compared with 15% of high school graduates.2
Education alone is not an accurate measure of HL, however. Reading comprehension is often 2 to 5 grade levels lower than an individual’s actual educational level. Socioeconomic status, race, and age affect the extent of the discrepancy, with the largest gap found among low-income minority patients.9
HL status is not shaped by reading comprehension alone, however. It also depends on the ability to decode symbols and charts and to formulate decisions and subsequent actions related to health. Thus, limited English proficiency (LEP) is a key risk factor for low HL, as well.10
Among Hispanic adults, those with LEP have higher rates of unemployment and are less likely to have health insurance or to have a usual source of health care.10 Compared with English-speaking patients with higher HL, those with lower HL and LEP are less likely to use health services or to adhere to clinicians’ recommendations—and more likely to have worse outcomes.11
While behavioral markers for low HL may be evident, clinicians often fail to recognize them.12,13 Patients with low HL may ask for help with forms they’re asked to fill out, submit incomplete forms, or fill out the forms with multiple misspellings. In the exam room, patients with limited HL are likely to identify a drug by its appearance—“the little yellow pill”—rather than by the name on the label. In one study, patients with limited HL were 10 to 18 times less likely than those with higher HL to correctly identify their medications.14 Rather than request clarification, however, such individuals are frequently ashamed of their lack of understanding and attempt to mask it by asking few questions.
Incorporate an HL assessment tool
According to the National Healthcare Disparities Report, poor HL contributes not only to differences in access to care, but also to provider bias and to poor patient-provider communication,15 which directly affects patients’ understanding of, and adherence to, medications and treatment plans. But in a busy practice setting, clinicians may have limited time to screen for HL or to devote to patient education. They may also be concerned about embarrassing patients who have low HL and unsure of how to appropriately address the issue.16
Routinely using an HL assessment tool is an important first step. There are several screening tests that reliably assess HL, but they vary in their approach and the time needed to administer them. (See TABLE 1 for details on the most widely used screening tools.17-21)
Assessing time and cost. The Newest Vital Sign (NVS), a screening tool in which patients are asked to use a sample product label to determine things like fat content, calories, and serving size, was included in a study assessing the time and cost of HL interventions. Distributing the NVS and explaining how to complete it added <30 seconds to the patient intake process. Scoring the test and recording the results in the patient’s electronic medical record, tasks completed by the front office staff, took <2 minutes. The office visit itself took 2 to 5 minutes more than it otherwise would have—the extra time needed for the clinician to adapt his or her communication style to the patient’s documented HL level and to assess patient recall and understanding.22
Implementation added up to $8,000 in start-up and training costs, plus costs for refresher training and system maintenance.22 Using free materials, such as the Agency for Healthcare Research and Quality (AHRQ)’s Health Literacy Universal Precautions Toolkit (detailed in a bit),23 limiting training fees, and relying on existing staff members to do the training could significantly cut the cost of an HL intervention.22
Table 1
Health literacy assessment: Validated screening tools17-21
| Assessment tool | Description | Administration time | Scoring | Advantages |
|---|---|---|---|---|
| Newest Vital Sign (NVS) http://www.annfammed.org/content/3/6/514.figures-only | 6-question test of ability to interpret an ice cream nutrition label | <3 minutes | 0-1 correct=high likelihood of limited HL; 2-3 correct=possibility of limited HL; ≥4 correct= adequate health literacy | Quick, widely accepted; available in English and Spanish |
| Rapid Estimate of Adult Literacy in Medicine, Short Form (REALM-SF) http://www.ahrq.gov/populations/sahlsatool.html | 7-item health word recognition test | 2-3 minutes | 0 correct=≤3rd grade;* 1-3 correct=4th-6th grade; 4-6 correct= 7th-8th grade; 7 correct=high school | Quick; large font available |
| Test of Functional Health Literacy in Adults (TOFHLA) http://www.peppercornbooks.com/catalog/information.php?info_id=5 | Timed reading comprehension test† | 18-22 minutes (7 minutes for S-TOFHLA) | 75-100=adequate HL; 60-74=marginal HL; 0-59= inadequate HL | Available in short version, very short version, and in Spanish |
| *≤3rd grade: unable to read most low-literacy materials; 4th-6th grades: needs low-literacy material and may be unable to read prescription labels; 7th-8th grades: will struggle with most patient education material; high school: able to read most patient education material. †Uses modified Cloze procedure (every 5th to 7th word is replaced with a blank space and the patient selects the word from 4 multiple choice options). HL, health literacy; S-TOFHLA, Short Test of Functional Health Literacy in Adults. | ||||
Tools to help boost your communication skills
A number of online resources are available to help health care professionals address HL. Take a look at the following examples to see which might be most helpful to you:
AHRQ Health Literacy Toolkit. Available at http://www.ahrq.gov/qual/literacy/index.html, the AHRQ’s HL toolkit starts with the assumption that most patients have difficulty understanding health information at times. It outlines a systematic approach to assessing clinical practices, evaluating patients’ HL, improving provider-patient communication, and teaching patients self-management skills. AHRQ provides 20 tools, specific implementation steps, worksheets, and sample forms, among other resources.
Communication course for providers. The Health Resources and Services Administration (HRSA) is another valuable resource. Noting that ensuring effective health communication is a shared responsibility, HRSA offers a free online course (http://www.hrsa.gov/publichealth/healthliteracy/) titled “Effective Communication Tools for Healthcare Professionals.” The curriculum incorporates HL, cultural competence, and LEP.
“Ask Me 3” campaign. Developed by the National Patient Safety Foundation, this program (available at http://www.npsf.org/for-healthcare-professionals/programs/ask-me-3/) is designed to promote provider-patient communication by encouraging patients to ask 3 questions at each visit:
- What is my main problem?
- What do I need to do?
- Why is it important for me to do this?
The role of providers is to ensure that patients understand the answers. Ask Me 3 brochures, posters, and patient handouts, which can be purchased on the foundation’s Web site, are designed to remind patients to speak up.
Assess comprehension and recall
Studies suggest that up to 80% of medical information received is forgotten by patients immediately, and nearly half of the content that’s retained is incorrect.24 Prioritizing information you wish to provide and limiting yourself to 3 to 5 key points per visit is one way to increase the likelihood that patients will remember what you said. Using open-ended questions (eg, “Tell me what you’ll do when you get home”) and the “teach back” method—that is, asking patients to repeat in their own words what you’ve taught them about their medications and treatment plan—helps to reinforce key take-home points.
The focus of “teach back” should be on how well the provider has explained things, AHRQ emphasizes. Thus, the toolkit suggests saying something along the lines of, “I want to be sure that I explained your medication correctly. Can you tell me how you’re going to take this medicine?”23 In a study of patients with diabetes, those whose providers assessed their recall or comprehension of new concepts were almost 9 times more likely to achieve HbA1c targets than patients whose doctors did not do so.25
Zero in on medication adherence
Another method highlighted in AHRQ’s toolkit is the “brown bag” medication review—asking patients to bring every prescription drug and over-the-counter product they take every time they come in and carefully reviewing each one (TABLE 2).23 The NAAL found that 36% of patients do not read at the level required to understand medication labeling.23 The percentage of adults who do not adhere to prescribed medication regimens is considerably higher.
In one study in which 9 practices implemented brown bag medication reviews, errors were found in 80% of the reviews. Among the most common errors: patients who stopped—or started—taking a drug without the knowledge of their provider, or continued to take a medication after it had been discontinued.23
Table 2
How to conduct a “brown bag” medication review
| Before the visit | Tell the patient what to bring to the next visit:
|
| During the visit | Display the medications
|
| After the visit | Document and code the medication review
|
| OTC, over-the-counter. *This code alone may not always be reimbursable, but may be used as a practice tracking tool in conjunction with the appropriate diagnosis. Adapted from: Agency for Healthcare Research and Quality. Health Literacy Universal Precautions Toolkit. Available at: http://www.ahrq.gov/qual/literacy/index.html. Accessed February 8, 2012. | |
Consider visual aids, group visits, and other interventions
In attempting to simplify patient handouts, consider using simple graphics (TABLE 3).23-30 In a randomized controlled trial (RCT) including 120 women—48% of whom had limited HL—a graphics-based educational tool significantly improved patient understanding of preeclampsia.26 Another RCT demonstrated that patients who had inadequate or marginal reading skills, had not completed high school, or were cognitively impaired were most likely to regularly refer to a medication schedule illustrated with pictures of their pills. More than 90% of the study group agreed that the illustrated schedule was easy to understand and helped them remember the name and purpose of their medications, as well as the time to take them.27
For patients who have low HL and are chronically ill, having the support of family or friends—any trusted confidante—is associated with better medication adherence. Group visits (in which a physician or other health care professional meets with a group of patients who have the same condition or diagnosis) is one way to provide such support. In one study, patients with diabetes who participated in group visits had higher rates of breast and cervical cancer screening and were more likely to get influenza and pneumococcal vaccinations and take ACE inhibitors, among other measures recommended by the American Diabetes Association.26
Table 3
Tips for helping patients with limited health literacy23-30
| Strategy | Key points |
|---|---|
| Warmly greet each patient | Maintain eye contact when you greet patients and during the interaction to encourage questions and disclosure |
| Use plain language (eg, high blood pressure rather than hypertension; liver instead of hepatic; heart attack, not myocardial infarction) and nonmedical terms, and speak clearly and at a moderate pace | Notice what words your patients use to describe a symptom or condition, and use those words throughout the interaction |
| Limit content | Prioritize what needs to be discussed, and present no more than 3 to 5 key points |
| Use visual aids | Draw simple pictures, use illustrations, demonstrate with 3-D models, or show videos that use nonmedical terms (adapted, as needed, for patients with LEP) |
| Provide encouragement | Encourage patients to ask questions about their health and treatment plans and to take an active role in managing their own health care |
| Assess recall and comprehension | Be specific and concrete, and repeat key points; confirm understanding by using “teach back”—asking patients to explain to you the information you provided to them |
| Take steps to provide additional patient support | Promote adherence and self-management skills by:
|
| LEP, limited English proficiency. | |
Take advantage of telemedicine … Health care delivered by telephone, Internet, video conference, or any other remote network may also be helpful. A Cochrane review found that patients with asthma who were the recipients of such interventions had a significant reduction in hospitalizations, particularly among those with more severe asthma.29 A systematic review found that for patients with diabetes, mobile phone interventions were associated with a statistically significant improvement in glycemic control and self-management.30
… and other providers. Interdisciplinary care has also been found to have a positive effect on management of chronic disease. One study found that patients with diabetes who received telephone coaching by nurses or nutritionists achieved a greater reduction in cholesterol and adherence to lipid-lowering medications than those who received the usual care.31 Direct patient care provided by pharmacists has also been associated with increased medication adherence and improvements in blood pressure, cholesterol levels, and HbA1c levels.32
CORRESPONDENCE Michelle A. Roett, MD, MPH, FAAFP, Fort Lincoln Family Medicine Center, 4151 Bladensburg Road, Colmar Manor, MD 20722; mar2@georgetown.edu
1. Institute of Medicine. Health Literacy: A Prescription to End Confusion. Washington, DC: National Academies Press; 2004.
2. Kutner M, Greenburg E, Jin Y. The Health Literacy of America’s Adults: Results from the 2003 National Assessment of Adult Literacy. Washington, DC: National Center for Education Statistics; 2006.
3. Vernon JA, Trujillo A, Rosenbaum S, et al. Low health literacy: implications for national health policy. National Patient Safety Foundation; 2007. Available at: http://www.npsf.org/askme3/pdfs/Case_Report_10_07.pdf. Accessed March 21, 2011.
4. Schillinger D, Machtinger EL, Wang F, et al. Language, literacy, and communication regarding medication in an anticoagulation clinic: a comparison of verbal vs. visual assessment. J Health Commun. 2006;11:651-664.
5. Adams RJ, Appleton SL, Hill CL, et al. Inadequate health literacy is associated with increased asthma morbidity in a population sample. J Allergy Clin Immunol. 2009;124:601-602.
6. Schillinger D, Piette J, Grumbach K, et al. Closing the loop: physician communication with diabetic patients who have low health literacy. Arch Intern Med. 2003;163:83-90.
7. Herndon JB, Chaney M, Carden D. Health literacy and emergency department outcomes: a systematic review. Ann Emerg Med. 2011;57:334-345.
8. Kirsch I, Jungeblut A, Jenkins L, et al. Adult Literacy in America: A First Look at the Findings of the National Adult Literacy Survey. 3rd ed. Washington, DC: National Center for Education, US Department of Education; 2002:201.
9. Davis T, Crouch M, Wills G, et al. The gap between patient reading and comprehension and the readability of patient education materials. J Fam Pract. 1990;31:533-538.
10. Brach CP, Cheyarley FM. Research findings #28: Demographics and health care access and utilization of limited-English-proficient and English-proficient Hispanics. 2008. Agency for Healthcare Research and Quality. Available at: http://www.meps.ahrq.gov/mepsweb/data_files/publications/rf28/rf28.pdf. Accessed May 20, 2011.
11. Ngo-Metzger Q, Telfair J, Sorkin DH, et al. Cultural Competency and Quality of Care: Obtaining the Patient’s Perspective. New York, NY: The Commonwealth Fund; 2006:963.
12. Bass PF, Wilson JF, Griffith CH, et al. Residents’ ability to identify patients with poor literacy skills. Acad Med. 2002;77:1039-1041.
13. Schwartzberg JG, Van Geest JB, Wang CC. eds. Understanding Health Literacy: Implications for Medicine and Public Health. Chicago, Ill: American Medical Association Press; 2005.
14. Kripalani S, Henderson LE, Chiu EY, et al. Predictors of medication self-management skill in a low-literacy population. J Gen Intern Med. 2006;21:852-856.
15. US Department of Health and Human Services. National Healthcare Disparities Report. 2010. Available at: http//www.ahrq.gov/qual/nhdr10/nhdr10.pdf. Accessed March 9, 2011.
16. Chew LD, Bradley KA, Boyko EJ. Brief questions to identify patients with inadequate health literacy. Fam Med. 2004;36:588-594.
17. Davis TC, Long SW, Jackson RH, et al. Rapid estimate of adult literacy in medicine: a shortened screening instrument. Fam Med. 1993;25:391-395.
18. Parker RM, Baker DW, Williams MV, et al. The test of functional health literacy in adults: a new instrument for measuring patients’ literacy skills. J Gen Intern Med. 1995;10:537-541.
19. Baker DW, Williams MV, Parker RM, et al. Development of a brief test to measure functional health literacy. Patient Educ Couns. 1999;38:33-42.
20. Shah LC, West P, Bremmeyr K, et al. Health literacy instrument in family medicine: the “Newest Vital Sign” ease of use and correlates. J Am Board Fam Med. 2010;23:195-203.
21. Weiss BD, Mays MZ, Martz W, et al. Quick assessment of literacy in primary care: the Newest Vital Sign. Ann Fam Med. 2005;3:514-522.
22. Welch VL, VanGeest JB, Caskey R. Time, costs, and clinical utilization of screening for health literacy: a case study using the Newest Vital Sign (NVS) instrument. J Am Board Fam Med. 2011;24:281-289.
23. DeWalt DA, Callahan LF, Hawk VH, et al. Health Literacy Universal Precautions Toolkit. Rockville, MD: Agency for Healthcare Research and Quality; April 2010. 10-0046-EF. Available at: http://www.ahrq.gov/qual/literacy/healthliteracytoolkit.pdf. Accessed March 21, 2011.
24. Kessels RP. Patients’ memory for medical information. J R Soc Med. 2003;96:219-222.
25. Shillinger D, Piette J, Grumbach K, et al. Closing the loop: physician communication with diabetic patients who have low health literacy. Arch Intern Med. 2003;163:83-90.
26. Wolf M, Bailey S, You W, et al. Improving patient understanding of preeclampsia, a randomized controlled trial. Am J Obstet Gynecol. 2011;206(suppl 1):S312.-
27. Kripalani S, Robertson R, Love-Ghaffari MH, et al. Development of an illustrated medication schedule as a low-literacy patient education tool. Patient Educ Couns. 2007;66:368-377.
28. Clancy DE, Huang P, Okonofua E, et al. Group visits: promoting adherence to diabetes guidelines. J Gen Intern Med. 2007;22:620-624.
29. McLean S, Chandler D, Nurmatov U, et al. Telehealthcare for asthma. Cochrane Database Syst Rev. 2011;(1):CD007717.-
30. Liang X, Wang Q, Yang X, et al. Effect of mobile phone intervention for diabetes on glycaemic control: a meta-analysis. Diabet Med. 2011;28:455-463.
31. Vale MJ, Jelinek MV, Best JD, et al. Coaching patients on achieving cardiovascular health (COACH): a multicenter randomized trial in patients with coronary heart disease. Arch Intern Med. 2003;163:2775-2783.
32. Chisholm-Burns MA, Kim Lee J, Spivey CA, et al. US pharmacists’ effect as team members on patient care: systematic review and meta-analyses. Med Care. 2010;48:923-933.
• Prioritize patient teaching, and present no more than 3 to 5 key points per visit. C
• Confirm that patients understand what you’ve told them by asking them to explain it to you (the “teach back” method). B
• Whenever possible, use simple visual aids—eg, draw pictures, use illustrations, or show a video—to get your point across. B
Strength of recommendation (SOR)
A Good-quality patient-oriented evidence
B Inconsistent or limited-quality patient-oriented evidence
C Consensus, usual practice, opinion, disease-oriented evidence, case series
Half of all adults are unable to understand basic health information and services needed well enough to make appropriate health decisions, according to the Institute of Medicine.1 Findings from the 2003 National Assessment of Adult Literacy (NAAL), the National Center for Education Statistics’ only study of Americans’ ability to understand health-related information, painted a similarly grim picture. Although 53% of US adults had “intermediate” health literacy (HL), the NAAL found that up to 90% lacked the skills needed to manage their health and prevent disease.2
The National Patient Safety Foundation reports that low HL is associated with an additional $106 to $238 billion in health care costs per year.3 Among the reasons:
- Up to half of all prescription and over-the-counter medications are taken incorrectly,4 which helps explain why roughly 1.5 million preventable adverse drug reactions occur each year.1
- Chronically ill patients incur higher health care costs as a result of low HL. Consider, for instance, that patients with asthma have more frequent hospitalizations,5 and patients with diabetes have higher glycohemoglobin (HbA1c) and a higher incidence of nephropathy and retinopathy.6
- Elderly patients with low HL are more likely to use the emergency department, and have significantly worse mental health and greater all-cause mortality than their counterparts with higher HL.7
Clearly, this is a problem primary care physicians cannot afford to ignore. The strategies discussed in the text and tables that follow will increase your awareness of the effects of limited HL—and help you take positive steps to address them.
Put health literacy on your radar screen
Anyone can have trouble comprehending medical information at times, but patients who are elderly (≥65 years), cognitively impaired, or have limited education face the highest risk.8 Half of adults who never completed high school have “below basic” HL, compared with 15% of high school graduates.2
Education alone is not an accurate measure of HL, however. Reading comprehension is often 2 to 5 grade levels lower than an individual’s actual educational level. Socioeconomic status, race, and age affect the extent of the discrepancy, with the largest gap found among low-income minority patients.9
HL status is not shaped by reading comprehension alone, however. It also depends on the ability to decode symbols and charts and to formulate decisions and subsequent actions related to health. Thus, limited English proficiency (LEP) is a key risk factor for low HL, as well.10
Among Hispanic adults, those with LEP have higher rates of unemployment and are less likely to have health insurance or to have a usual source of health care.10 Compared with English-speaking patients with higher HL, those with lower HL and LEP are less likely to use health services or to adhere to clinicians’ recommendations—and more likely to have worse outcomes.11
While behavioral markers for low HL may be evident, clinicians often fail to recognize them.12,13 Patients with low HL may ask for help with forms they’re asked to fill out, submit incomplete forms, or fill out the forms with multiple misspellings. In the exam room, patients with limited HL are likely to identify a drug by its appearance—“the little yellow pill”—rather than by the name on the label. In one study, patients with limited HL were 10 to 18 times less likely than those with higher HL to correctly identify their medications.14 Rather than request clarification, however, such individuals are frequently ashamed of their lack of understanding and attempt to mask it by asking few questions.
Incorporate an HL assessment tool
According to the National Healthcare Disparities Report, poor HL contributes not only to differences in access to care, but also to provider bias and to poor patient-provider communication,15 which directly affects patients’ understanding of, and adherence to, medications and treatment plans. But in a busy practice setting, clinicians may have limited time to screen for HL or to devote to patient education. They may also be concerned about embarrassing patients who have low HL and unsure of how to appropriately address the issue.16
Routinely using an HL assessment tool is an important first step. There are several screening tests that reliably assess HL, but they vary in their approach and the time needed to administer them. (See TABLE 1 for details on the most widely used screening tools.17-21)
Assessing time and cost. The Newest Vital Sign (NVS), a screening tool in which patients are asked to use a sample product label to determine things like fat content, calories, and serving size, was included in a study assessing the time and cost of HL interventions. Distributing the NVS and explaining how to complete it added <30 seconds to the patient intake process. Scoring the test and recording the results in the patient’s electronic medical record, tasks completed by the front office staff, took <2 minutes. The office visit itself took 2 to 5 minutes more than it otherwise would have—the extra time needed for the clinician to adapt his or her communication style to the patient’s documented HL level and to assess patient recall and understanding.22
Implementation added up to $8,000 in start-up and training costs, plus costs for refresher training and system maintenance.22 Using free materials, such as the Agency for Healthcare Research and Quality (AHRQ)’s Health Literacy Universal Precautions Toolkit (detailed in a bit),23 limiting training fees, and relying on existing staff members to do the training could significantly cut the cost of an HL intervention.22
Table 1
Health literacy assessment: Validated screening tools17-21
| Assessment tool | Description | Administration time | Scoring | Advantages |
|---|---|---|---|---|
| Newest Vital Sign (NVS) http://www.annfammed.org/content/3/6/514.figures-only | 6-question test of ability to interpret an ice cream nutrition label | <3 minutes | 0-1 correct=high likelihood of limited HL; 2-3 correct=possibility of limited HL; ≥4 correct= adequate health literacy | Quick, widely accepted; available in English and Spanish |
| Rapid Estimate of Adult Literacy in Medicine, Short Form (REALM-SF) http://www.ahrq.gov/populations/sahlsatool.html | 7-item health word recognition test | 2-3 minutes | 0 correct=≤3rd grade;* 1-3 correct=4th-6th grade; 4-6 correct= 7th-8th grade; 7 correct=high school | Quick; large font available |
| Test of Functional Health Literacy in Adults (TOFHLA) http://www.peppercornbooks.com/catalog/information.php?info_id=5 | Timed reading comprehension test† | 18-22 minutes (7 minutes for S-TOFHLA) | 75-100=adequate HL; 60-74=marginal HL; 0-59= inadequate HL | Available in short version, very short version, and in Spanish |
| *≤3rd grade: unable to read most low-literacy materials; 4th-6th grades: needs low-literacy material and may be unable to read prescription labels; 7th-8th grades: will struggle with most patient education material; high school: able to read most patient education material. †Uses modified Cloze procedure (every 5th to 7th word is replaced with a blank space and the patient selects the word from 4 multiple choice options). HL, health literacy; S-TOFHLA, Short Test of Functional Health Literacy in Adults. | ||||
Tools to help boost your communication skills
A number of online resources are available to help health care professionals address HL. Take a look at the following examples to see which might be most helpful to you:
AHRQ Health Literacy Toolkit. Available at http://www.ahrq.gov/qual/literacy/index.html, the AHRQ’s HL toolkit starts with the assumption that most patients have difficulty understanding health information at times. It outlines a systematic approach to assessing clinical practices, evaluating patients’ HL, improving provider-patient communication, and teaching patients self-management skills. AHRQ provides 20 tools, specific implementation steps, worksheets, and sample forms, among other resources.
Communication course for providers. The Health Resources and Services Administration (HRSA) is another valuable resource. Noting that ensuring effective health communication is a shared responsibility, HRSA offers a free online course (http://www.hrsa.gov/publichealth/healthliteracy/) titled “Effective Communication Tools for Healthcare Professionals.” The curriculum incorporates HL, cultural competence, and LEP.
“Ask Me 3” campaign. Developed by the National Patient Safety Foundation, this program (available at http://www.npsf.org/for-healthcare-professionals/programs/ask-me-3/) is designed to promote provider-patient communication by encouraging patients to ask 3 questions at each visit:
- What is my main problem?
- What do I need to do?
- Why is it important for me to do this?
The role of providers is to ensure that patients understand the answers. Ask Me 3 brochures, posters, and patient handouts, which can be purchased on the foundation’s Web site, are designed to remind patients to speak up.
Assess comprehension and recall
Studies suggest that up to 80% of medical information received is forgotten by patients immediately, and nearly half of the content that’s retained is incorrect.24 Prioritizing information you wish to provide and limiting yourself to 3 to 5 key points per visit is one way to increase the likelihood that patients will remember what you said. Using open-ended questions (eg, “Tell me what you’ll do when you get home”) and the “teach back” method—that is, asking patients to repeat in their own words what you’ve taught them about their medications and treatment plan—helps to reinforce key take-home points.
The focus of “teach back” should be on how well the provider has explained things, AHRQ emphasizes. Thus, the toolkit suggests saying something along the lines of, “I want to be sure that I explained your medication correctly. Can you tell me how you’re going to take this medicine?”23 In a study of patients with diabetes, those whose providers assessed their recall or comprehension of new concepts were almost 9 times more likely to achieve HbA1c targets than patients whose doctors did not do so.25
Zero in on medication adherence
Another method highlighted in AHRQ’s toolkit is the “brown bag” medication review—asking patients to bring every prescription drug and over-the-counter product they take every time they come in and carefully reviewing each one (TABLE 2).23 The NAAL found that 36% of patients do not read at the level required to understand medication labeling.23 The percentage of adults who do not adhere to prescribed medication regimens is considerably higher.
In one study in which 9 practices implemented brown bag medication reviews, errors were found in 80% of the reviews. Among the most common errors: patients who stopped—or started—taking a drug without the knowledge of their provider, or continued to take a medication after it had been discontinued.23
Table 2
How to conduct a “brown bag” medication review
| Before the visit | Tell the patient what to bring to the next visit:
|
| During the visit | Display the medications
|
| After the visit | Document and code the medication review
|
| OTC, over-the-counter. *This code alone may not always be reimbursable, but may be used as a practice tracking tool in conjunction with the appropriate diagnosis. Adapted from: Agency for Healthcare Research and Quality. Health Literacy Universal Precautions Toolkit. Available at: http://www.ahrq.gov/qual/literacy/index.html. Accessed February 8, 2012. | |
Consider visual aids, group visits, and other interventions
In attempting to simplify patient handouts, consider using simple graphics (TABLE 3).23-30 In a randomized controlled trial (RCT) including 120 women—48% of whom had limited HL—a graphics-based educational tool significantly improved patient understanding of preeclampsia.26 Another RCT demonstrated that patients who had inadequate or marginal reading skills, had not completed high school, or were cognitively impaired were most likely to regularly refer to a medication schedule illustrated with pictures of their pills. More than 90% of the study group agreed that the illustrated schedule was easy to understand and helped them remember the name and purpose of their medications, as well as the time to take them.27
For patients who have low HL and are chronically ill, having the support of family or friends—any trusted confidante—is associated with better medication adherence. Group visits (in which a physician or other health care professional meets with a group of patients who have the same condition or diagnosis) is one way to provide such support. In one study, patients with diabetes who participated in group visits had higher rates of breast and cervical cancer screening and were more likely to get influenza and pneumococcal vaccinations and take ACE inhibitors, among other measures recommended by the American Diabetes Association.26
Table 3
Tips for helping patients with limited health literacy23-30
| Strategy | Key points |
|---|---|
| Warmly greet each patient | Maintain eye contact when you greet patients and during the interaction to encourage questions and disclosure |
| Use plain language (eg, high blood pressure rather than hypertension; liver instead of hepatic; heart attack, not myocardial infarction) and nonmedical terms, and speak clearly and at a moderate pace | Notice what words your patients use to describe a symptom or condition, and use those words throughout the interaction |
| Limit content | Prioritize what needs to be discussed, and present no more than 3 to 5 key points |
| Use visual aids | Draw simple pictures, use illustrations, demonstrate with 3-D models, or show videos that use nonmedical terms (adapted, as needed, for patients with LEP) |
| Provide encouragement | Encourage patients to ask questions about their health and treatment plans and to take an active role in managing their own health care |
| Assess recall and comprehension | Be specific and concrete, and repeat key points; confirm understanding by using “teach back”—asking patients to explain to you the information you provided to them |
| Take steps to provide additional patient support | Promote adherence and self-management skills by:
|
| LEP, limited English proficiency. | |
Take advantage of telemedicine … Health care delivered by telephone, Internet, video conference, or any other remote network may also be helpful. A Cochrane review found that patients with asthma who were the recipients of such interventions had a significant reduction in hospitalizations, particularly among those with more severe asthma.29 A systematic review found that for patients with diabetes, mobile phone interventions were associated with a statistically significant improvement in glycemic control and self-management.30
… and other providers. Interdisciplinary care has also been found to have a positive effect on management of chronic disease. One study found that patients with diabetes who received telephone coaching by nurses or nutritionists achieved a greater reduction in cholesterol and adherence to lipid-lowering medications than those who received the usual care.31 Direct patient care provided by pharmacists has also been associated with increased medication adherence and improvements in blood pressure, cholesterol levels, and HbA1c levels.32
CORRESPONDENCE Michelle A. Roett, MD, MPH, FAAFP, Fort Lincoln Family Medicine Center, 4151 Bladensburg Road, Colmar Manor, MD 20722; mar2@georgetown.edu
1. Institute of Medicine. Health Literacy: A Prescription to End Confusion. Washington, DC: National Academies Press; 2004.
2. Kutner M, Greenburg E, Jin Y. The Health Literacy of America’s Adults: Results from the 2003 National Assessment of Adult Literacy. Washington, DC: National Center for Education Statistics; 2006.
3. Vernon JA, Trujillo A, Rosenbaum S, et al. Low health literacy: implications for national health policy. National Patient Safety Foundation; 2007. Available at: http://www.npsf.org/askme3/pdfs/Case_Report_10_07.pdf. Accessed March 21, 2011.
4. Schillinger D, Machtinger EL, Wang F, et al. Language, literacy, and communication regarding medication in an anticoagulation clinic: a comparison of verbal vs. visual assessment. J Health Commun. 2006;11:651-664.
5. Adams RJ, Appleton SL, Hill CL, et al. Inadequate health literacy is associated with increased asthma morbidity in a population sample. J Allergy Clin Immunol. 2009;124:601-602.
6. Schillinger D, Piette J, Grumbach K, et al. Closing the loop: physician communication with diabetic patients who have low health literacy. Arch Intern Med. 2003;163:83-90.
7. Herndon JB, Chaney M, Carden D. Health literacy and emergency department outcomes: a systematic review. Ann Emerg Med. 2011;57:334-345.
8. Kirsch I, Jungeblut A, Jenkins L, et al. Adult Literacy in America: A First Look at the Findings of the National Adult Literacy Survey. 3rd ed. Washington, DC: National Center for Education, US Department of Education; 2002:201.
9. Davis T, Crouch M, Wills G, et al. The gap between patient reading and comprehension and the readability of patient education materials. J Fam Pract. 1990;31:533-538.
10. Brach CP, Cheyarley FM. Research findings #28: Demographics and health care access and utilization of limited-English-proficient and English-proficient Hispanics. 2008. Agency for Healthcare Research and Quality. Available at: http://www.meps.ahrq.gov/mepsweb/data_files/publications/rf28/rf28.pdf. Accessed May 20, 2011.
11. Ngo-Metzger Q, Telfair J, Sorkin DH, et al. Cultural Competency and Quality of Care: Obtaining the Patient’s Perspective. New York, NY: The Commonwealth Fund; 2006:963.
12. Bass PF, Wilson JF, Griffith CH, et al. Residents’ ability to identify patients with poor literacy skills. Acad Med. 2002;77:1039-1041.
13. Schwartzberg JG, Van Geest JB, Wang CC. eds. Understanding Health Literacy: Implications for Medicine and Public Health. Chicago, Ill: American Medical Association Press; 2005.
14. Kripalani S, Henderson LE, Chiu EY, et al. Predictors of medication self-management skill in a low-literacy population. J Gen Intern Med. 2006;21:852-856.
15. US Department of Health and Human Services. National Healthcare Disparities Report. 2010. Available at: http//www.ahrq.gov/qual/nhdr10/nhdr10.pdf. Accessed March 9, 2011.
16. Chew LD, Bradley KA, Boyko EJ. Brief questions to identify patients with inadequate health literacy. Fam Med. 2004;36:588-594.
17. Davis TC, Long SW, Jackson RH, et al. Rapid estimate of adult literacy in medicine: a shortened screening instrument. Fam Med. 1993;25:391-395.
18. Parker RM, Baker DW, Williams MV, et al. The test of functional health literacy in adults: a new instrument for measuring patients’ literacy skills. J Gen Intern Med. 1995;10:537-541.
19. Baker DW, Williams MV, Parker RM, et al. Development of a brief test to measure functional health literacy. Patient Educ Couns. 1999;38:33-42.
20. Shah LC, West P, Bremmeyr K, et al. Health literacy instrument in family medicine: the “Newest Vital Sign” ease of use and correlates. J Am Board Fam Med. 2010;23:195-203.
21. Weiss BD, Mays MZ, Martz W, et al. Quick assessment of literacy in primary care: the Newest Vital Sign. Ann Fam Med. 2005;3:514-522.
22. Welch VL, VanGeest JB, Caskey R. Time, costs, and clinical utilization of screening for health literacy: a case study using the Newest Vital Sign (NVS) instrument. J Am Board Fam Med. 2011;24:281-289.
23. DeWalt DA, Callahan LF, Hawk VH, et al. Health Literacy Universal Precautions Toolkit. Rockville, MD: Agency for Healthcare Research and Quality; April 2010. 10-0046-EF. Available at: http://www.ahrq.gov/qual/literacy/healthliteracytoolkit.pdf. Accessed March 21, 2011.
24. Kessels RP. Patients’ memory for medical information. J R Soc Med. 2003;96:219-222.
25. Shillinger D, Piette J, Grumbach K, et al. Closing the loop: physician communication with diabetic patients who have low health literacy. Arch Intern Med. 2003;163:83-90.
26. Wolf M, Bailey S, You W, et al. Improving patient understanding of preeclampsia, a randomized controlled trial. Am J Obstet Gynecol. 2011;206(suppl 1):S312.-
27. Kripalani S, Robertson R, Love-Ghaffari MH, et al. Development of an illustrated medication schedule as a low-literacy patient education tool. Patient Educ Couns. 2007;66:368-377.
28. Clancy DE, Huang P, Okonofua E, et al. Group visits: promoting adherence to diabetes guidelines. J Gen Intern Med. 2007;22:620-624.
29. McLean S, Chandler D, Nurmatov U, et al. Telehealthcare for asthma. Cochrane Database Syst Rev. 2011;(1):CD007717.-
30. Liang X, Wang Q, Yang X, et al. Effect of mobile phone intervention for diabetes on glycaemic control: a meta-analysis. Diabet Med. 2011;28:455-463.
31. Vale MJ, Jelinek MV, Best JD, et al. Coaching patients on achieving cardiovascular health (COACH): a multicenter randomized trial in patients with coronary heart disease. Arch Intern Med. 2003;163:2775-2783.
32. Chisholm-Burns MA, Kim Lee J, Spivey CA, et al. US pharmacists’ effect as team members on patient care: systematic review and meta-analyses. Med Care. 2010;48:923-933.
Menopause management: How you can do better
• Hormone replacement therapy should be considered only for women who are <60 years old and within 10 years of menopause. B
• Selective serotonin reuptake inhibitors and serotonin-norepinephrine reuptake inhibitors may reduce the frequency of hot flashes within 1 to 2 weeks of initiating treatment. B
• Local estrogen preparations should be first-line therapy for atrophic vaginitis. B
• Spironolactone may improve menopause-related hair loss. B
Strength of recommendation (SOR)
A Good-quality patient-oriented evidence
B Inconsistent or limited-quality patient-oriented evidence
C Consensus, usual practice, opinion, disease-oriented evidence, case series
CASE During a routine well-woman visit, 54-year-old Barbara P becomes tearful and confides that she’s afraid her marriage of 20 years is falling apart. She and her husband argue frequently, Barbara says, and she alternates between being tearful and angry for no apparent reason. Barbara’s last menstrual period was 2 years ago. When asked about menopausal symptoms, she reports having 6 or 7 hot flashes daily—which disrupt her sleep several nights a week. She also reports that intercourse is painful and that her interest in sex has diminished as a result. A pelvic exam reveals thin, pale vaginal epithelium; the rest of her physical exam is normal.
Many women with menopausal symptoms that significantly impair their quality of life never report them to their physicians—or do so only if they’re asked, as I have discovered in my practice. The mistaken belief that there are few effective treatments for menopausal symptoms, coupled with concern about adverse effects of hormone replacement therapy (HRT), prompts many women to suffer in silence. That’s a problem you can do much to change.
Broaching the subject with perimenopausal women, rather than waiting for them to initiate the discussion, is an important first step. Let them know that common menopausal symptoms, including hot flashes, atrophic vaginitis, insomnia, diminished libido, and hair loss, can be treated successfully with a variety of hormonal and nonhormonal agents. And when a patient reveals, as Barbara did, that she’s troubled by mood swings or uncharacteristic behavior, it may help to let her know that many women find it challenging to deal with both the physical and emotional ramifications of this new phase of life.
Hot flashes: How often? How severe?
Hot flashes are experienced by up to 75% of menopausal women, and tend to be most severe in the first 2 years of menopause.1 There is a broad spectrum of frequency and severity, however, so it’s important to question patients about both. Risk factors for greater severity and higher frequency include surgically or chemically induced menopause, an elevated body mass index, a history of tobacco use, and African American ethnicity.2,3 There are multiple treatments for hot flashes, including HRT, antidepressants, antiepileptics, antihypertensives, acupuncture, herbal remedies, and even physical activity (TABLE 1).4,5
Table 1
Treating hot flashes: A look at the options4,5
| HRT Estrogen-progesterone combination (estrogen only for women with hysterectomy) |
| Antidepressants* SNRIs SSRIs |
| Antiepileptics Gabapentin (900 mg/d) |
| Antihypertensives Clonidine (0.1 mg/d, then titrate upward)† Methyldopa (200-500 mg once or twice a day) |
| Herbal supplement's Black cohosh‡ Magnesium (400 mg/d) Omega-3 fatty acid‡ Red clover‡ St. John's wort‡ |
| Lifestyle/alternative interventions Acupuncture† Avoidance of triggers§ Paced respirations Physical activity Yoga |
| HRT, hormone replacement therapy; SNRIs, serotonin-norepinephrine reuptake inhibitors; SSRIs, selective serotonin reuptake inhibitors. *Specific antidepressants and dosage are detailed in Table 2. †Limited data on effect. ‡Optimal dose is unknown. §Eg, alcohol, hot drinks, spicy foods, and caffeine. |
A critical look at HRT
HRT (an estrogen-progesterone combination for women with an intact uterus, and estrogen alone for those who’ve had a hysterectomy) is highly effective, alleviating hot flashes and other menopausal symptoms 80% to 90% of the time.6 But widely publicized reports from the Women’s Health Initiative of an increased risk of breast cancer, coronary heart disease, stroke, and venous thromboembolism in women taking both estrogen and progesterone prompted many patients to taper off HRT, or decline to start it.7,8 That initial report was a decade ago, however, and further analyses and additional research have since found that for some women and under some circumstances, HRT may, in fact, be safe and effective.9
Age and time of menopause are key criteria. For women who are <60 years old and within 10 years of the onset of menopause, HRT appears to be a safe short-term treatment.9 While the risks may be most significant after 10 years of use, physicians should attempt to limit HRT whenever possible.
Women who are ≥60 years of age and those at high risk for cardiovascular disease or breast cancer, or both, should not take HRT. When prescribing HRT for patients without these contraindications, there are things you can do to minimize the risk:
- Limit the duration of HRT to the shortest treatment required.9
- Use a transdermal delivery system. Compared with oral administration, the patch appears to lower the risk of thromboembolism.10
- Prescribe a low-dose HRT regimen. The lower dose may reduce the risk of cardiovascular disease, but it will take longer to achieve symptom relief—typically, 8 to 12 weeks vs 4 weeks for women on a standard dose.11 A low-dose regimen is particularly important for women who are obese. Because of the higher serum estradiol levels found in this patient population, they need a smaller quantity of estrogen and progesterone to achieve symptom relief.12
- Taper slowly—over as long as 6 to 12 months—which may minimize hot flash severity and frequency.13
Compounded hormones. Some women prefer compounded hormones, which are often individualized based on the results of blood or saliva testing, in hopes of avoiding the risks associated with HRT. While compounds are typically marketed as a safer and more effective means of alleviating menopausal symptoms, however, there is limited evidence of their efficacy. What’s more, the lack of standardization, resulting in variations in formulations and dosages from one product to another, raises questions about the safety of compounded hormones.14-16
Antidepressants alleviate hot flashes
Both selective serotonin reuptake inhibitors (SSRIs) and serotonin-norepinephrine reuptake inhibitors (SNRIs), which target neurotransmitters involved in the hypothalamic thermoregulation center, have been found to reduce both the severity and frequency of hot flashes.4,17,18 Women who have hot flashes have a 2-fold increase in risk for depression, and antidepressant therapy may help alleviate mood disturbances in addition to providing vasomotor symptom relief,19,20 even in women who do not meet the criteria for clinical depression.21
Which antidepressants are most effective? Venlafaxine, desvenlafaxine, and paroxetine have been shown to provide the best vasomotor symptom relief, with symptom reduction of 67% vs 15% with placebo.15,22 It is important to note, however, that studies of individual agents have had different inclusion criteria and different means of randomization. TABLE 217,21-30 summarizes the evidence, recommended dosing, expected onset of symptom relief, and common adverse effects of antidepressants used to treat hot flashes.
Other agents have more adverse effects. Certain antihypertensives (clonidine and methyldopa) and the antiepileptic gabapentin may alleviate hot flashes, but none is an optimal treatment. Clonidine has been shown to be effective in both oral and transdermal forms, but the drug is associated with hypotension, among other adverse effects. Methyldopa has not been well studied and is not viewed as a first-line agent.5 And, although gabapentin at doses ≥900 mg/d reduces the frequency of hot flashes, many women cannot tolerate the nausea, headache, dizziness, and confusion that are common adverse effects.31-33
Table 2
Antidepressants for hot flashes? Here's what to consider
| Medication (usual dose) | Symptom relief | Adverse effects |
|---|---|---|
| SNRIs | ||
| Desvenlafaxine (100 mg/d)24 | Hot flash reduction in 1-2 wk; peak effect at 4 wk | Increased BP, decreased appetite, dry mouth, nausea |
| Duloxetine*23 | Limited data on onset of action or adverse effects | |
| Venlafaxine (75 mg/d)22 | Hot flash reduction in 1-2 wk | Constipation, decreased appetite, dry mouth, increased anxiety, nausea |
| SSRIs | ||
| Citalopram (10 mg/d)*21,25 | Hot flash reduction in 1-2 wk; peak effect at 4-8 wk | Dry mouth, nausea, palpitations, somnolence (may be useful for concomitant insomnia), sweating |
| Escitalopram (10-20 mg/d)26 | Limited data on dosing, onset of action, or adverse effects | |
| Fluoxetine (20 mg/d)21,27 | Hot flash reduction within 3 wk; peak effect at 6 mo | Appetite loss, constipation, dizziness, dry mouth, fatigue, mood changes, nausea, nervousness, sleep disturbances, sweating |
| Fluvoxamine (50 mg/d) | Limited data on onset of action or adverse effects | |
| Paroxetine (10-12.5 mg/d; may be increased to 25 mg/d after 2 wk if no relief)*28,29 | Hot flash reduction in 1-2 wk | Dry mouth, headache, insomnia, nausea, somnolence; reduces the plasma concentration of active metabolite of tamoxifen, and should not be used concurrently |
| Sertraline (50 mg/d)†17,30 | Hot flash reduction in 1-2 wk; peak effect at 3 wk | Anxiety, diarrhea, dry mouth, fatigue, nausea |
| BP, blood pressure; SNRIs, serotonin-norepinephrine reuptake inhibitors; SSRIs, selective serotonin reuptake inhibitors. *Can be given with HRT. †Mixed efficacy data; use as second-line treatment only. | ||
Exercise: Little help for hot flashes, but it may boost mood
Data on physical activity’s effect on hot flashes are rather limited. Overall, exercise has not been found to improve or worsen hot flashes,5 but it does improve mood swings associated with menopause.34 Any type of exercise may be beneficial.
Small studies have found that specific activities, such as paced respiration and yoga, improve hot flashes, but larger studies are needed to clarify effect size.5 Other lifestyle interventions, such as limiting alcohol consumption, decreasing spicy food intake, avoiding hot drinks, and eliminating caffeine, may alleviate hot flashes, as well.
What to expect from alternative treatments
Acupuncture. While acupuncture does appear to reduce the frequency of hot flashes in the short term, such benefits have not been sustained.35,36 What’s more, clinical studies have found sham acupuncture and true acupuncture to be beneficial, so the placebo effect may be an important factor in the success of this modality.35
Herbal remedies. A number of herbal preparations have been touted to improve hot flash frequency and severity: Black cohosh, red clover, St. John's wort , and omega-3 fatty acids have shown some benefit, although more research is needed to determine optimal dosing and ensure safety of use.5,21,37-39 Magnesium (400 mg/d), with its minimal adverse effects and low cost, has also recently emerged as an attractive option for hot flash control.40 No randomized double-blind clinical trials have been done, however, to test the effectiveness of these preparations.
Kava kava, vitamin E, evening primrose oil, and dong quai should be avoided. All have shown little or no benefit and have potentially serious adverse effects.5
Question patients about other menopausal symptoms
Treating hot flashes alone is not enough. It is important to address the full spectrum of menopausal symptoms, including insomnia, atrophic vaginitis, impaired sexual function, and hair loss.
Is she getting a good night’s sleep?
Insomnia—a common complaint of menopausal women—may be unrelated to, or a consequence of, hot flashes. Sedating hypnotics, and at least one herbal remedy, may help with both.
Eszopiclone (3 mg, taken at bedtime) has been shown to alleviate insomnia-related hot flashes. With sufficient sedation, night sweats and hot flashes go unnoticed, and both sleep and mood typically improve.41 Other sedating hypnotics have not been studied in this patient population, but would likely have similar effects.
Magnolia bark supplements may be a preferred sleep aid for women who hesitate to take a sedating hypnotic medication. This herbal remedy has been found to decrease anxiety, irritability, and insomnia related to menopause,42 although there is limited research regarding long-term benefits and adverse effects.
Is she experiencing vaginal dryness?
For about 50% of menopausal women, symptoms associated with atrophic vaginitis impair sexual function and quality of life.43 Clinical signs such as thinning of the vaginal epithelium and loss of rugae can be seen 2 to 3 years after the onset of menopause, but many women do not report symptoms until 4 to 5 years postmenopause.43 Sexually active women tend to have fewer menopausal symptoms in general, and less atrophic vaginitis in particular.44
Common symptoms include vaginal dryness (affecting 75% of menopausal women); dyspareunia (38%); and itching, unusual vaginal discharge, and pain (15%).43 Urinary tract infections secondary to atrophic vaginitis are common, as well. Yet only 25% of women with atrophic symptoms report them to their physicians—and nearly 70% say that their health care provider has never asked about them.43 Failure to diagnose and treat atrophic vaginitis leads to unnecessary suffering, as many effective treatments exist (TABLE 3).43,45-49
Topical estrogen is the most effective treatment for atrophic symptoms. Up to 25% of women on HRT continue to suffer from vaginal dryness and may benefit from topical estrogen. Research suggests that only regimens containing estriol alleviate vaginal symptoms.43
Conversely, while women using HRT for vasomotor symptoms may find that their vaginal dryness improves, HRT should not be considered for atrophic vaginitis alone in view of safety concerns and limited efficacy.43
Available as conjugated equine estrogens and estriol, estrone, or estradiol, topical estrogen may be delivered via cream, tablet, ring, or pessary. Adverse effects include itching, pain, vaginal discharge, and vaginal bleeding,43 but a switch to a different preparation may reduce or eliminate these problems. Endometrial proliferation has not been found to occur within 24 months of continuous use, so concomitant progesterone use is not recommended.45
Up to 90% of patients using local estrogen show improvement in atrophic symptoms within 3 weeks.43 Alternative diagnoses, such as vaginal candidiasis, contact irritation, or other vaginosis, should be considered if the condition fails to improve. Systemic absorption of estrogen—which is minimal to begin with—declines with use, as the thinness of the vaginal epithelial layer resolves. Doses can be reduced over time as less estrogen is needed to maintain healthy epithelium. The lowest effective dose should always be chosen for a patient.43
The only contraindication to topical estrogen use is allergy to an ingredient in the preparation. Because of its limited systemic absorption and low doses, it can be prescribed for virtually any woman with vaginal symptoms, including those who would not be candidates for systemic therapy. That said, few studies have addressed the use of local estrogens by women with a history of breast cancer. While it is likely a safe option for treatment of atrophic vaginitis, more research involving breast cancer survivors is needed.43
Dehydroepiandrosterone (DHEA) may provide the same benefits as local estrogens, but without any systemic effects.43
Water-soluble lubricants and moisturizers provide short-term relief.43 A variety of over-the-counter (OTC) lubricants are effective at alleviating dyspareunia. However, moisturizers often have limited long-term benefit and may have adverse effects. A hypersensitivity reaction to components of specific formulations is one potential adverse effect. Women need to be aware that some OTC lubricants may damage condoms, as well. (Pregnancy may still be possible for women who have occasional menstrual cycles; condoms also provide protection from sexually transmitted infection.)
Vitamin E, taken orally (100-600 IU/d) or used as a topical preparation, has also been shown to improve symptoms of vaginal dryness.46 Early studies of vitamin D in cell culture have shown benefit to atrophic tissues, although limited clinical studies have been performed.47
Soy, red clover, and black cohosh have been shown to provide some relief of atrophic symptoms.43 However, each of these agents uses estrogenic pathways, which may be a concern for some patients. Limited safety data and variation in preparations are potential problems, as well.43 Placebo-controlled trials of numerous other herbal products—including bryonia, belladonna, lycopodium, nettle, dong quai root, motherwort, chickweed, and wild yam—have found them to be neither safe nor effective.48
Other medications that may have limited use in treating atrophic vaginitis include tibolone, a weak estrogenic steroid, and oral pilocarpine,49 but limited data regarding their efficacy and adverse effects curtail their use. Topical lidocaine and oral gabapentin may work as analgesics, but little improvement in tissue integrity can be expected.43
Table 3
Treating atrophic vaginitis43,45-49
| HRT Estrogen-progesterone combination (estrogen only for women with hysterectomy) |
| Lubricants and moisturizers (water-based are most effective) |
Topical estrogen (5-10 mcg/d)
|
Herbal remedies/vitamins
|
Other agents
|
| DHEA, dehydroepiandrosterone; HRT, hormone replacement therapy. *Limited data on effect. †Optimal dose is unclear. |
Is intercourse painful? Has she lost interest in sex?
Many menopausal women notice a decline in libido, which is often related to frequent hot flashes or dyspareunia secondary to atrophic vaginitis. In these instances, treatment of the underlying condition, as detailed earlier, should be first-line therapy.
Sustained-release bupropion (300 mg/d) has been shown to increase both sexual arousal and satisfaction in women who are not depressed.44
Testosterone therapy is another treatment; in some cases, it can be added to an existing HRT regimen to improve libido. However, testosterone supplementation should be offered only after all other causes of low libido have been excluded. It is not recommended for women who are not on HRT, as its safety in this population is unknown. Long-term clinical trials are needed to assess the effectiveness of medications such as phosphodiesterase-5 inhibitors, although early research has shown encouraging results.43
Is her hair thinning?
Up to 26% of women develop thinning hair at the onset of menopause. This is thought to be the result of the relative increase in circulating androgens that occurs as estrogen production decreases.50 Spironolactone has been shown to be a safe and effective intervention. Acting as an antiandrogen, spironolactone is thought to restore the balance between estrogen and androgen, thereby halting hair loss—and, in some women, resulting in partial hair regrowth. A variety of doses have been used, but 100 to 200 mg/d is recommended.51
Topical minoxidil may also be helpful in women with hair loss, but up to one year of treatment may be necessary before effectiveness can be accurately assessed. The US Food and Drug Administration has approved only the 2% minoxidil solution for use in women, although a 5% solution is available and may be more effective.
Adverse effects of minoxidil include facial hypertrichosis over the cheeks and forehead. This is more likely to occur if the 5% solution is used, but may be reversible within 4 months of discontinuing therapy.52 Emerging evidence suggests that a combination of topical minoxidil and topical spironolactone may be helpful for women, without the adverse effects associated with systemic therapy.
Cyproterone acetate, which has also been shown to be effective, is usually administered as an oral contraceptive regimen: The patient takes 100 mg/d on Days 5 to 15 and 50 mcg ethinyl estradiol on Days 5 through 25. Up to 88% of women either have no progression of hair loss or actually experience hair regrowth with the use of cyproterone.53 However, the risks associated with exposure to ethinyl estradiol may limit use of this therapy.
CASE After an extensive discussion about treatment options, Barbara decided to start taking venlafaxine for her hot flashes and mood swings. She also began using an estrogen-containing vaginal ring (the device contains 2 mg estradiol and must be replaced every 90 days) to alleviate atrophic vaginitis symptoms. When she returned to the office 6 months later, the patient reported that the frequency of her hot flashes was down to only one or 2 per week, and they rarely disrupted her sleep. She also noted that her mood had improved, she was arguing with her husband far less often, and her pain during intercourse had resolved.
CORRESPONDENCE Gretchen M. Dickson, MD, MBA, Department of Family and Community Medicine, University of Kansas School of Medicine-Wichita, 1010 North Kansas, Wichita, KS 67214; gdickson@kumc.edu
1. Nakano K, Pinnow E, Flaws JA, et al. Reproductive history and hot flashes in perimenopausal women. J Womens Health. 2012;Jan 27 [Epub ahead of print].
2. Li S, Holm K. Physical activity alone and in combination with hormone replacement therapy on vasomotor symptoms in postmenopausal women. West J Nurs Res. 2003;25:274-288.
3. Gold EB, Colvin A, Avis N, et al. Longitudinal analysis of the association between vasomotor symptoms and race/ethnicity across the menopausal transition: study of women’s health across the nation. Am J Public Health. 2006;96:1226-1235.
4. Hall E, Frey B, Soares C. Non-hormonal treatment strategies for vasomotor symptoms. Drugs. 2011;7:287-304.
5. Pinkerton JV, Stovall DW, Kightlinger RS. Advances in the treatment of menopausal symptoms. Womens Health. 2009;5:361-384.
6. Maclennan AH, Broadbent JL, Lester S, et al. Oral oestrogen and combined oestrogen/progestogen therapy versus placebo for hot flushes. Cochrane Database Syst Rev. 2004;(4):CD002978.-
7. Hoffmann M, Hammar M, Kjeligren KI, et al. Changes in women’s attitudes towards and use of hormone therapy after HERS and WHI. Maturitas. 2005;52:11-17.
8. Rossouw JE, Anderson GL, Prentice RL, et al. Risks and benefits of estrogen plus progestin in healthy postmenopausal women: principal results from the Women’s Health Initiative randomized controlled trial. JAMA. 2002;288:321-333.
9. Rossouw JE, Prentice RL, Manson JE, et al. Postmenopausal hormone therapy and risk of cardiovascular disease by age and years since menopause. JAMA. 2007;297:1465-1477.
10. Schenck-Gustafsson K, Brincat M, Erel CT, et al. EMAS position statement: managing the menopause in the context of coronary heart disease. Maturitas. 2011;68:94-97.
11. Ettinger B. Vasomotor symptom relief versus unwanted effects: role of estrogen dosage. Am J Med. 2005;118(suppl 12B):74-78.
12. Taylor H, Manson J. Update in hormone therapy use in menopause. J Clin Endocrinol Metab. 2011;96:255-264.
13. Grady D, Ettinger B, Tosteson AN, et al. Predictors of difficulty when discontinuing postmenopausal hormone therapy. Obstet Gynecol. 2003;102:1233-1239.
14. Cooper A, Spencer C, Whitehead MI, et al. Systemic absorption of progesterone from Progest cream in postmenopausal women. Lancet. 1998;351:1255-1256.
15. Wren BG, Champion SM, Willets K, et al. Transdermal progesterone and its effect on vasomotor symptoms, blood lipid levels, bone metabolic markers, moods and quality of life for postmenopausal women. Menopause. 2003;10:13-18.
16. Sites C. Bioidentical hormones for the menopausal therapy. Womens Health. 2008;4:163-171.
17. Grady D, Cohen B, Tice J, et al. Ineffectiveness of sertraline for treatment of menopausal hot flushes: a randomized controlled trial. Obstet Gynecol. 2007;109:823-830.
18. Gordon PR, Kerwin JP, Boesen KG, et al. Sertraline to treat hot flashes: a randomized controlled, double-blind, crossover trial in a general populations. Menopause. 2006;13:568-575.
19. Woods NF, Smith-DeJulio K, Percival DB, et al. Depressed mood during the menopausal transition and early postmenopause: observations from the Seattle Midlife Women’s Health Study. Menopause. 2008;15:223-232.
20. Bromberger JT, Matthews KA, Schott LL, et al. Depressive symptoms during the menopausal transition: the Study of Women’s Health Across the Nation (SWAN). J Affect Disord. 2007;103:267-272.
21. Oktem M, Eroglu D, Karahan HB, et al. Black cohosh and fluoxetine in the treatment of postmenopausal symptoms: a prospective, randomized trial. Adv Ther. 2007;24:448-461.
22. Evans ML, Pritts E, Vittinghoff E, et al. Management of postmenopausal hot flushes with venlafaxine hydrochloride: a randomized controlled trial. Obstet Gynecol. 2005;105:161-166.
23. Joffee H, Soares CN, Petrillo LF, et al. Treatment of depression and menopause-related symptoms with the serotonin-norepinephrine reuptake inhibitor duloxetine. J Clin Psychiatry. 2007;68:943-950.
24. Archer DF, Seidman L, Constantine GD, et al. A double-blind, randomly assigned placebo controlled study of desvenlafaxine efficacy and safety for the treatment of vasomotor symptoms associated with menopause. Am J Obstet Gynecol. 2009;200:172e1-e10.
25. Soares CN, Poitras JR, Prouty J, et al. Efficacy of citalopram as a monotherapy or as an adjunctive treatment to estrogen therapy for perimenopausal and postmenopausal women with depression and vasomotor symptoms. J Clin Psychiatry. 2003;64:473-479.
26. Soares CN, Thase ME, Clayton A, et al. Desvenlafaxine and escitalopram for the treatment of postmenopausal women with major depressive disorder. Menopause. 2010;17:700-711.
27. Loprinzi CL, Sloan JA, Perez EA, et al. Phase III evaluation of fluoxetine for treatment of hot flashes. J Clin Oncol. 2002;20:1578-1583.
28. Stearns V, Slack E, Greep N, et al. Paroxetine is an effective treatment for hot flashes: results from a prospective randomized clinical trial. J Clin Oncol. 2005;23:6919-6930.
29. Soares CN, Joffee H, Viguera AC, et al. Paroxetine versus placebo for women in midlife after hormone therapy discontinuation. Am J Med. 2008;121:159-162.
30. Gordon PR, Kerwin JP, Boessen KG, et al. Sertraline to treat hot flashes: a randomized controlled double blind crossover trial in a general population. Menopause. 2006;13:568-575.
31. Guttuso T Jr, Kurlan R, McDermott MP, et al. Gabapentin’s effects on hot flashes in postmenopausal women: a randomized controlled trial. Obstet Gynecol. 2003;101:337-345.
32. Butt DA, Lock M, Lewis JE, et al. Gabapentin for the treatment of menopausal hot flashes: a randomized controlled trial. Menopause. 2008;15:310-318.
33. Reddy SY, Warner H, Guttuso T Jr, et al. Gabapentin, estrogen and placebo for treating hot flushes: a randomized controlled trial. Obstet Gynecol. 2006;108:41-48.
34. Thurston RC, Joffee H, Soares CN, et al. Physical activity and risk of vasomotor symptoms in women with and without a history of depression: results from the Harvard Study of Moods and Cycles. Menopause. 2006;13:553-560.
35. Borud EK, Alraek T, White A, et al. The Acupuncture on hot flushes among menopausal women (ACUFLASH) study, a randomized control trial. Menopause. 2009;16:484-493.
36. Borud EK, Alraek T, White A, et al. The Acupuncture on Hot Flashes Among Menopausal Women study: observational follow-up results at 6 and 12 months. Menopause. 2010;17:262-268.
37. Geller SE, Shulman LP, van Breeman RB, et al. Safety and efficacy of black cohosh and red clover for the management of vasomotor symptoms: a randomized controlled trial. Menopause. 2009;16:1156-1166.
38. Abdali K, Khajehei M, Tabatabaee HR. Effect of St John's Wort on severity, frequency, and duration of hot flashes in premenopausal, perimenopausal and postmenopausal women: a randomized, double-blind, placebo-controlled study. Menopause. 2010;17:326-331.
39. Freeman MP, Hibbeln JR, Silver M, et al. Omega-3 fatty acids for major depressive disorder associated with the menopausal transition: a preliminary open trial. Menopause. 2011;18:279-284.
40. Park H, Parker GL, Boardman JR, et al. A pilot phase II trial of magnesium supplements to reduce menopausal hot flashes in breast cancer patients. Support Care Cancer. 2011;19:859-862.
41. Joffee H, Petrillo L, Viguera A, et al. Eszopiclone improves insomnia and depressive and anxious symptoms in perimenopausal and postmenopausal women with hot flashes: a randomized double blinded placebo controlled crossover trial. Am J Obstet Gynecol. 2010;202:171.e1-171.e11.
42. Agosta C, Atlante M, Benvenuti C. Randomized controlled study on clinical efficacy of isoflavones plus Lactobacillus sporogenes, associated or not with a natural anxiolytic agent in menopause. Minerva Ginecol. 2011;63:11-17.
43. Sturdee D, Panay N. Recommendations for the management of postmenopausal vaginal atrophy. Climacteric. 2010;13:509-522.
44. Leiblum S, Bachmann G, Kemmann E, et al. Vaginal atrophy in the postmenopausal woman. The importance of sexual activity and hormones. JAMA. 1983;249:2195-2198.
45. Al-Baghdadi O, Ewies A. Topical estrogen therapy in the management of postmenopausal vaginal atrophy: an up-to-date review. Climacteric. 2009;12:91-105.
46. Weed SS. Menopausal Years: The Wise Woman Way. Alternative Approaches for Women. Woodstock, NY: Ash Tree; 1992.
47. Yildrim B, Kaleli B, Duzcan E, et al. The effects of postmenopausal vitamin D treatment on vaginal atrophy. Maturitas. 2004;49:334-347.
48. Catelo-Branco CC, Cancelo MJ, Villero J, et al. Management of post-menopausal vaginal atrophy and atrophic vaginitis. Maturitas. 2005;52(suppl 1):S46-S52.
49. LeVeque F, Hendrix S. Oral pilocarpine to treat vaginal xerosis associated with chemotherapy induced amenorrhea in premenopausal women. J Clin Oncol. 2004;22(suppl):8099.-
50. Ali I, Wojnarowska F. Physiological changes in scalp, facial and body hair after the menopause: a cross-sectional population-based study of subjective changes. Br J Dermatol. 2011;164:508-513.
51. Rathnayake D, Sinclair R. Innovative use of spironolactone as an antiandrogen in the treatment of female pattern hair loss. Dermatol Clin. 2010;28:611-618.
52. Olsen EA. Current and novel methods for assessing efficacy of hair growth promoters in pattern hair loss. J Am Acad Dermatol. 2003;48:253-262.
53. Dawber RP, Sonnex T, Ralfs I. Oral antiandrogen treatment of common baldness in women. Br J Dermatol. 1982;107 (suppl):20-21.
• Hormone replacement therapy should be considered only for women who are <60 years old and within 10 years of menopause. B
• Selective serotonin reuptake inhibitors and serotonin-norepinephrine reuptake inhibitors may reduce the frequency of hot flashes within 1 to 2 weeks of initiating treatment. B
• Local estrogen preparations should be first-line therapy for atrophic vaginitis. B
• Spironolactone may improve menopause-related hair loss. B
Strength of recommendation (SOR)
A Good-quality patient-oriented evidence
B Inconsistent or limited-quality patient-oriented evidence
C Consensus, usual practice, opinion, disease-oriented evidence, case series
CASE During a routine well-woman visit, 54-year-old Barbara P becomes tearful and confides that she’s afraid her marriage of 20 years is falling apart. She and her husband argue frequently, Barbara says, and she alternates between being tearful and angry for no apparent reason. Barbara’s last menstrual period was 2 years ago. When asked about menopausal symptoms, she reports having 6 or 7 hot flashes daily—which disrupt her sleep several nights a week. She also reports that intercourse is painful and that her interest in sex has diminished as a result. A pelvic exam reveals thin, pale vaginal epithelium; the rest of her physical exam is normal.
Many women with menopausal symptoms that significantly impair their quality of life never report them to their physicians—or do so only if they’re asked, as I have discovered in my practice. The mistaken belief that there are few effective treatments for menopausal symptoms, coupled with concern about adverse effects of hormone replacement therapy (HRT), prompts many women to suffer in silence. That’s a problem you can do much to change.
Broaching the subject with perimenopausal women, rather than waiting for them to initiate the discussion, is an important first step. Let them know that common menopausal symptoms, including hot flashes, atrophic vaginitis, insomnia, diminished libido, and hair loss, can be treated successfully with a variety of hormonal and nonhormonal agents. And when a patient reveals, as Barbara did, that she’s troubled by mood swings or uncharacteristic behavior, it may help to let her know that many women find it challenging to deal with both the physical and emotional ramifications of this new phase of life.
Hot flashes: How often? How severe?
Hot flashes are experienced by up to 75% of menopausal women, and tend to be most severe in the first 2 years of menopause.1 There is a broad spectrum of frequency and severity, however, so it’s important to question patients about both. Risk factors for greater severity and higher frequency include surgically or chemically induced menopause, an elevated body mass index, a history of tobacco use, and African American ethnicity.2,3 There are multiple treatments for hot flashes, including HRT, antidepressants, antiepileptics, antihypertensives, acupuncture, herbal remedies, and even physical activity (TABLE 1).4,5
Table 1
Treating hot flashes: A look at the options4,5
| HRT Estrogen-progesterone combination (estrogen only for women with hysterectomy) |
| Antidepressants* SNRIs SSRIs |
| Antiepileptics Gabapentin (900 mg/d) |
| Antihypertensives Clonidine (0.1 mg/d, then titrate upward)† Methyldopa (200-500 mg once or twice a day) |
| Herbal supplement's Black cohosh‡ Magnesium (400 mg/d) Omega-3 fatty acid‡ Red clover‡ St. John's wort‡ |
| Lifestyle/alternative interventions Acupuncture† Avoidance of triggers§ Paced respirations Physical activity Yoga |
| HRT, hormone replacement therapy; SNRIs, serotonin-norepinephrine reuptake inhibitors; SSRIs, selective serotonin reuptake inhibitors. *Specific antidepressants and dosage are detailed in Table 2. †Limited data on effect. ‡Optimal dose is unknown. §Eg, alcohol, hot drinks, spicy foods, and caffeine. |
A critical look at HRT
HRT (an estrogen-progesterone combination for women with an intact uterus, and estrogen alone for those who’ve had a hysterectomy) is highly effective, alleviating hot flashes and other menopausal symptoms 80% to 90% of the time.6 But widely publicized reports from the Women’s Health Initiative of an increased risk of breast cancer, coronary heart disease, stroke, and venous thromboembolism in women taking both estrogen and progesterone prompted many patients to taper off HRT, or decline to start it.7,8 That initial report was a decade ago, however, and further analyses and additional research have since found that for some women and under some circumstances, HRT may, in fact, be safe and effective.9
Age and time of menopause are key criteria. For women who are <60 years old and within 10 years of the onset of menopause, HRT appears to be a safe short-term treatment.9 While the risks may be most significant after 10 years of use, physicians should attempt to limit HRT whenever possible.
Women who are ≥60 years of age and those at high risk for cardiovascular disease or breast cancer, or both, should not take HRT. When prescribing HRT for patients without these contraindications, there are things you can do to minimize the risk:
- Limit the duration of HRT to the shortest treatment required.9
- Use a transdermal delivery system. Compared with oral administration, the patch appears to lower the risk of thromboembolism.10
- Prescribe a low-dose HRT regimen. The lower dose may reduce the risk of cardiovascular disease, but it will take longer to achieve symptom relief—typically, 8 to 12 weeks vs 4 weeks for women on a standard dose.11 A low-dose regimen is particularly important for women who are obese. Because of the higher serum estradiol levels found in this patient population, they need a smaller quantity of estrogen and progesterone to achieve symptom relief.12
- Taper slowly—over as long as 6 to 12 months—which may minimize hot flash severity and frequency.13
Compounded hormones. Some women prefer compounded hormones, which are often individualized based on the results of blood or saliva testing, in hopes of avoiding the risks associated with HRT. While compounds are typically marketed as a safer and more effective means of alleviating menopausal symptoms, however, there is limited evidence of their efficacy. What’s more, the lack of standardization, resulting in variations in formulations and dosages from one product to another, raises questions about the safety of compounded hormones.14-16
Antidepressants alleviate hot flashes
Both selective serotonin reuptake inhibitors (SSRIs) and serotonin-norepinephrine reuptake inhibitors (SNRIs), which target neurotransmitters involved in the hypothalamic thermoregulation center, have been found to reduce both the severity and frequency of hot flashes.4,17,18 Women who have hot flashes have a 2-fold increase in risk for depression, and antidepressant therapy may help alleviate mood disturbances in addition to providing vasomotor symptom relief,19,20 even in women who do not meet the criteria for clinical depression.21
Which antidepressants are most effective? Venlafaxine, desvenlafaxine, and paroxetine have been shown to provide the best vasomotor symptom relief, with symptom reduction of 67% vs 15% with placebo.15,22 It is important to note, however, that studies of individual agents have had different inclusion criteria and different means of randomization. TABLE 217,21-30 summarizes the evidence, recommended dosing, expected onset of symptom relief, and common adverse effects of antidepressants used to treat hot flashes.
Other agents have more adverse effects. Certain antihypertensives (clonidine and methyldopa) and the antiepileptic gabapentin may alleviate hot flashes, but none is an optimal treatment. Clonidine has been shown to be effective in both oral and transdermal forms, but the drug is associated with hypotension, among other adverse effects. Methyldopa has not been well studied and is not viewed as a first-line agent.5 And, although gabapentin at doses ≥900 mg/d reduces the frequency of hot flashes, many women cannot tolerate the nausea, headache, dizziness, and confusion that are common adverse effects.31-33
Table 2
Antidepressants for hot flashes? Here's what to consider
| Medication (usual dose) | Symptom relief | Adverse effects |
|---|---|---|
| SNRIs | ||
| Desvenlafaxine (100 mg/d)24 | Hot flash reduction in 1-2 wk; peak effect at 4 wk | Increased BP, decreased appetite, dry mouth, nausea |
| Duloxetine*23 | Limited data on onset of action or adverse effects | |
| Venlafaxine (75 mg/d)22 | Hot flash reduction in 1-2 wk | Constipation, decreased appetite, dry mouth, increased anxiety, nausea |
| SSRIs | ||
| Citalopram (10 mg/d)*21,25 | Hot flash reduction in 1-2 wk; peak effect at 4-8 wk | Dry mouth, nausea, palpitations, somnolence (may be useful for concomitant insomnia), sweating |
| Escitalopram (10-20 mg/d)26 | Limited data on dosing, onset of action, or adverse effects | |
| Fluoxetine (20 mg/d)21,27 | Hot flash reduction within 3 wk; peak effect at 6 mo | Appetite loss, constipation, dizziness, dry mouth, fatigue, mood changes, nausea, nervousness, sleep disturbances, sweating |
| Fluvoxamine (50 mg/d) | Limited data on onset of action or adverse effects | |
| Paroxetine (10-12.5 mg/d; may be increased to 25 mg/d after 2 wk if no relief)*28,29 | Hot flash reduction in 1-2 wk | Dry mouth, headache, insomnia, nausea, somnolence; reduces the plasma concentration of active metabolite of tamoxifen, and should not be used concurrently |
| Sertraline (50 mg/d)†17,30 | Hot flash reduction in 1-2 wk; peak effect at 3 wk | Anxiety, diarrhea, dry mouth, fatigue, nausea |
| BP, blood pressure; SNRIs, serotonin-norepinephrine reuptake inhibitors; SSRIs, selective serotonin reuptake inhibitors. *Can be given with HRT. †Mixed efficacy data; use as second-line treatment only. | ||
Exercise: Little help for hot flashes, but it may boost mood
Data on physical activity’s effect on hot flashes are rather limited. Overall, exercise has not been found to improve or worsen hot flashes,5 but it does improve mood swings associated with menopause.34 Any type of exercise may be beneficial.
Small studies have found that specific activities, such as paced respiration and yoga, improve hot flashes, but larger studies are needed to clarify effect size.5 Other lifestyle interventions, such as limiting alcohol consumption, decreasing spicy food intake, avoiding hot drinks, and eliminating caffeine, may alleviate hot flashes, as well.
What to expect from alternative treatments
Acupuncture. While acupuncture does appear to reduce the frequency of hot flashes in the short term, such benefits have not been sustained.35,36 What’s more, clinical studies have found sham acupuncture and true acupuncture to be beneficial, so the placebo effect may be an important factor in the success of this modality.35
Herbal remedies. A number of herbal preparations have been touted to improve hot flash frequency and severity: Black cohosh, red clover, St. John's wort , and omega-3 fatty acids have shown some benefit, although more research is needed to determine optimal dosing and ensure safety of use.5,21,37-39 Magnesium (400 mg/d), with its minimal adverse effects and low cost, has also recently emerged as an attractive option for hot flash control.40 No randomized double-blind clinical trials have been done, however, to test the effectiveness of these preparations.
Kava kava, vitamin E, evening primrose oil, and dong quai should be avoided. All have shown little or no benefit and have potentially serious adverse effects.5
Question patients about other menopausal symptoms
Treating hot flashes alone is not enough. It is important to address the full spectrum of menopausal symptoms, including insomnia, atrophic vaginitis, impaired sexual function, and hair loss.
Is she getting a good night’s sleep?
Insomnia—a common complaint of menopausal women—may be unrelated to, or a consequence of, hot flashes. Sedating hypnotics, and at least one herbal remedy, may help with both.
Eszopiclone (3 mg, taken at bedtime) has been shown to alleviate insomnia-related hot flashes. With sufficient sedation, night sweats and hot flashes go unnoticed, and both sleep and mood typically improve.41 Other sedating hypnotics have not been studied in this patient population, but would likely have similar effects.
Magnolia bark supplements may be a preferred sleep aid for women who hesitate to take a sedating hypnotic medication. This herbal remedy has been found to decrease anxiety, irritability, and insomnia related to menopause,42 although there is limited research regarding long-term benefits and adverse effects.
Is she experiencing vaginal dryness?
For about 50% of menopausal women, symptoms associated with atrophic vaginitis impair sexual function and quality of life.43 Clinical signs such as thinning of the vaginal epithelium and loss of rugae can be seen 2 to 3 years after the onset of menopause, but many women do not report symptoms until 4 to 5 years postmenopause.43 Sexually active women tend to have fewer menopausal symptoms in general, and less atrophic vaginitis in particular.44
Common symptoms include vaginal dryness (affecting 75% of menopausal women); dyspareunia (38%); and itching, unusual vaginal discharge, and pain (15%).43 Urinary tract infections secondary to atrophic vaginitis are common, as well. Yet only 25% of women with atrophic symptoms report them to their physicians—and nearly 70% say that their health care provider has never asked about them.43 Failure to diagnose and treat atrophic vaginitis leads to unnecessary suffering, as many effective treatments exist (TABLE 3).43,45-49
Topical estrogen is the most effective treatment for atrophic symptoms. Up to 25% of women on HRT continue to suffer from vaginal dryness and may benefit from topical estrogen. Research suggests that only regimens containing estriol alleviate vaginal symptoms.43
Conversely, while women using HRT for vasomotor symptoms may find that their vaginal dryness improves, HRT should not be considered for atrophic vaginitis alone in view of safety concerns and limited efficacy.43
Available as conjugated equine estrogens and estriol, estrone, or estradiol, topical estrogen may be delivered via cream, tablet, ring, or pessary. Adverse effects include itching, pain, vaginal discharge, and vaginal bleeding,43 but a switch to a different preparation may reduce or eliminate these problems. Endometrial proliferation has not been found to occur within 24 months of continuous use, so concomitant progesterone use is not recommended.45
Up to 90% of patients using local estrogen show improvement in atrophic symptoms within 3 weeks.43 Alternative diagnoses, such as vaginal candidiasis, contact irritation, or other vaginosis, should be considered if the condition fails to improve. Systemic absorption of estrogen—which is minimal to begin with—declines with use, as the thinness of the vaginal epithelial layer resolves. Doses can be reduced over time as less estrogen is needed to maintain healthy epithelium. The lowest effective dose should always be chosen for a patient.43
The only contraindication to topical estrogen use is allergy to an ingredient in the preparation. Because of its limited systemic absorption and low doses, it can be prescribed for virtually any woman with vaginal symptoms, including those who would not be candidates for systemic therapy. That said, few studies have addressed the use of local estrogens by women with a history of breast cancer. While it is likely a safe option for treatment of atrophic vaginitis, more research involving breast cancer survivors is needed.43
Dehydroepiandrosterone (DHEA) may provide the same benefits as local estrogens, but without any systemic effects.43
Water-soluble lubricants and moisturizers provide short-term relief.43 A variety of over-the-counter (OTC) lubricants are effective at alleviating dyspareunia. However, moisturizers often have limited long-term benefit and may have adverse effects. A hypersensitivity reaction to components of specific formulations is one potential adverse effect. Women need to be aware that some OTC lubricants may damage condoms, as well. (Pregnancy may still be possible for women who have occasional menstrual cycles; condoms also provide protection from sexually transmitted infection.)
Vitamin E, taken orally (100-600 IU/d) or used as a topical preparation, has also been shown to improve symptoms of vaginal dryness.46 Early studies of vitamin D in cell culture have shown benefit to atrophic tissues, although limited clinical studies have been performed.47
Soy, red clover, and black cohosh have been shown to provide some relief of atrophic symptoms.43 However, each of these agents uses estrogenic pathways, which may be a concern for some patients. Limited safety data and variation in preparations are potential problems, as well.43 Placebo-controlled trials of numerous other herbal products—including bryonia, belladonna, lycopodium, nettle, dong quai root, motherwort, chickweed, and wild yam—have found them to be neither safe nor effective.48
Other medications that may have limited use in treating atrophic vaginitis include tibolone, a weak estrogenic steroid, and oral pilocarpine,49 but limited data regarding their efficacy and adverse effects curtail their use. Topical lidocaine and oral gabapentin may work as analgesics, but little improvement in tissue integrity can be expected.43
Table 3
Treating atrophic vaginitis43,45-49
| HRT Estrogen-progesterone combination (estrogen only for women with hysterectomy) |
| Lubricants and moisturizers (water-based are most effective) |
Topical estrogen (5-10 mcg/d)
|
Herbal remedies/vitamins
|
Other agents
|
| DHEA, dehydroepiandrosterone; HRT, hormone replacement therapy. *Limited data on effect. †Optimal dose is unclear. |
Is intercourse painful? Has she lost interest in sex?
Many menopausal women notice a decline in libido, which is often related to frequent hot flashes or dyspareunia secondary to atrophic vaginitis. In these instances, treatment of the underlying condition, as detailed earlier, should be first-line therapy.
Sustained-release bupropion (300 mg/d) has been shown to increase both sexual arousal and satisfaction in women who are not depressed.44
Testosterone therapy is another treatment; in some cases, it can be added to an existing HRT regimen to improve libido. However, testosterone supplementation should be offered only after all other causes of low libido have been excluded. It is not recommended for women who are not on HRT, as its safety in this population is unknown. Long-term clinical trials are needed to assess the effectiveness of medications such as phosphodiesterase-5 inhibitors, although early research has shown encouraging results.43
Is her hair thinning?
Up to 26% of women develop thinning hair at the onset of menopause. This is thought to be the result of the relative increase in circulating androgens that occurs as estrogen production decreases.50 Spironolactone has been shown to be a safe and effective intervention. Acting as an antiandrogen, spironolactone is thought to restore the balance between estrogen and androgen, thereby halting hair loss—and, in some women, resulting in partial hair regrowth. A variety of doses have been used, but 100 to 200 mg/d is recommended.51
Topical minoxidil may also be helpful in women with hair loss, but up to one year of treatment may be necessary before effectiveness can be accurately assessed. The US Food and Drug Administration has approved only the 2% minoxidil solution for use in women, although a 5% solution is available and may be more effective.
Adverse effects of minoxidil include facial hypertrichosis over the cheeks and forehead. This is more likely to occur if the 5% solution is used, but may be reversible within 4 months of discontinuing therapy.52 Emerging evidence suggests that a combination of topical minoxidil and topical spironolactone may be helpful for women, without the adverse effects associated with systemic therapy.
Cyproterone acetate, which has also been shown to be effective, is usually administered as an oral contraceptive regimen: The patient takes 100 mg/d on Days 5 to 15 and 50 mcg ethinyl estradiol on Days 5 through 25. Up to 88% of women either have no progression of hair loss or actually experience hair regrowth with the use of cyproterone.53 However, the risks associated with exposure to ethinyl estradiol may limit use of this therapy.
CASE After an extensive discussion about treatment options, Barbara decided to start taking venlafaxine for her hot flashes and mood swings. She also began using an estrogen-containing vaginal ring (the device contains 2 mg estradiol and must be replaced every 90 days) to alleviate atrophic vaginitis symptoms. When she returned to the office 6 months later, the patient reported that the frequency of her hot flashes was down to only one or 2 per week, and they rarely disrupted her sleep. She also noted that her mood had improved, she was arguing with her husband far less often, and her pain during intercourse had resolved.
CORRESPONDENCE Gretchen M. Dickson, MD, MBA, Department of Family and Community Medicine, University of Kansas School of Medicine-Wichita, 1010 North Kansas, Wichita, KS 67214; gdickson@kumc.edu
1. Nakano K, Pinnow E, Flaws JA, et al. Reproductive history and hot flashes in perimenopausal women. J Womens Health. 2012;Jan 27 [Epub ahead of print].
2. Li S, Holm K. Physical activity alone and in combination with hormone replacement therapy on vasomotor symptoms in postmenopausal women. West J Nurs Res. 2003;25:274-288.
3. Gold EB, Colvin A, Avis N, et al. Longitudinal analysis of the association between vasomotor symptoms and race/ethnicity across the menopausal transition: study of women’s health across the nation. Am J Public Health. 2006;96:1226-1235.
4. Hall E, Frey B, Soares C. Non-hormonal treatment strategies for vasomotor symptoms. Drugs. 2011;7:287-304.
5. Pinkerton JV, Stovall DW, Kightlinger RS. Advances in the treatment of menopausal symptoms. Womens Health. 2009;5:361-384.
6. Maclennan AH, Broadbent JL, Lester S, et al. Oral oestrogen and combined oestrogen/progestogen therapy versus placebo for hot flushes. Cochrane Database Syst Rev. 2004;(4):CD002978.-
7. Hoffmann M, Hammar M, Kjeligren KI, et al. Changes in women’s attitudes towards and use of hormone therapy after HERS and WHI. Maturitas. 2005;52:11-17.
8. Rossouw JE, Anderson GL, Prentice RL, et al. Risks and benefits of estrogen plus progestin in healthy postmenopausal women: principal results from the Women’s Health Initiative randomized controlled trial. JAMA. 2002;288:321-333.
9. Rossouw JE, Prentice RL, Manson JE, et al. Postmenopausal hormone therapy and risk of cardiovascular disease by age and years since menopause. JAMA. 2007;297:1465-1477.
10. Schenck-Gustafsson K, Brincat M, Erel CT, et al. EMAS position statement: managing the menopause in the context of coronary heart disease. Maturitas. 2011;68:94-97.
11. Ettinger B. Vasomotor symptom relief versus unwanted effects: role of estrogen dosage. Am J Med. 2005;118(suppl 12B):74-78.
12. Taylor H, Manson J. Update in hormone therapy use in menopause. J Clin Endocrinol Metab. 2011;96:255-264.
13. Grady D, Ettinger B, Tosteson AN, et al. Predictors of difficulty when discontinuing postmenopausal hormone therapy. Obstet Gynecol. 2003;102:1233-1239.
14. Cooper A, Spencer C, Whitehead MI, et al. Systemic absorption of progesterone from Progest cream in postmenopausal women. Lancet. 1998;351:1255-1256.
15. Wren BG, Champion SM, Willets K, et al. Transdermal progesterone and its effect on vasomotor symptoms, blood lipid levels, bone metabolic markers, moods and quality of life for postmenopausal women. Menopause. 2003;10:13-18.
16. Sites C. Bioidentical hormones for the menopausal therapy. Womens Health. 2008;4:163-171.
17. Grady D, Cohen B, Tice J, et al. Ineffectiveness of sertraline for treatment of menopausal hot flushes: a randomized controlled trial. Obstet Gynecol. 2007;109:823-830.
18. Gordon PR, Kerwin JP, Boesen KG, et al. Sertraline to treat hot flashes: a randomized controlled, double-blind, crossover trial in a general populations. Menopause. 2006;13:568-575.
19. Woods NF, Smith-DeJulio K, Percival DB, et al. Depressed mood during the menopausal transition and early postmenopause: observations from the Seattle Midlife Women’s Health Study. Menopause. 2008;15:223-232.
20. Bromberger JT, Matthews KA, Schott LL, et al. Depressive symptoms during the menopausal transition: the Study of Women’s Health Across the Nation (SWAN). J Affect Disord. 2007;103:267-272.
21. Oktem M, Eroglu D, Karahan HB, et al. Black cohosh and fluoxetine in the treatment of postmenopausal symptoms: a prospective, randomized trial. Adv Ther. 2007;24:448-461.
22. Evans ML, Pritts E, Vittinghoff E, et al. Management of postmenopausal hot flushes with venlafaxine hydrochloride: a randomized controlled trial. Obstet Gynecol. 2005;105:161-166.
23. Joffee H, Soares CN, Petrillo LF, et al. Treatment of depression and menopause-related symptoms with the serotonin-norepinephrine reuptake inhibitor duloxetine. J Clin Psychiatry. 2007;68:943-950.
24. Archer DF, Seidman L, Constantine GD, et al. A double-blind, randomly assigned placebo controlled study of desvenlafaxine efficacy and safety for the treatment of vasomotor symptoms associated with menopause. Am J Obstet Gynecol. 2009;200:172e1-e10.
25. Soares CN, Poitras JR, Prouty J, et al. Efficacy of citalopram as a monotherapy or as an adjunctive treatment to estrogen therapy for perimenopausal and postmenopausal women with depression and vasomotor symptoms. J Clin Psychiatry. 2003;64:473-479.
26. Soares CN, Thase ME, Clayton A, et al. Desvenlafaxine and escitalopram for the treatment of postmenopausal women with major depressive disorder. Menopause. 2010;17:700-711.
27. Loprinzi CL, Sloan JA, Perez EA, et al. Phase III evaluation of fluoxetine for treatment of hot flashes. J Clin Oncol. 2002;20:1578-1583.
28. Stearns V, Slack E, Greep N, et al. Paroxetine is an effective treatment for hot flashes: results from a prospective randomized clinical trial. J Clin Oncol. 2005;23:6919-6930.
29. Soares CN, Joffee H, Viguera AC, et al. Paroxetine versus placebo for women in midlife after hormone therapy discontinuation. Am J Med. 2008;121:159-162.
30. Gordon PR, Kerwin JP, Boessen KG, et al. Sertraline to treat hot flashes: a randomized controlled double blind crossover trial in a general population. Menopause. 2006;13:568-575.
31. Guttuso T Jr, Kurlan R, McDermott MP, et al. Gabapentin’s effects on hot flashes in postmenopausal women: a randomized controlled trial. Obstet Gynecol. 2003;101:337-345.
32. Butt DA, Lock M, Lewis JE, et al. Gabapentin for the treatment of menopausal hot flashes: a randomized controlled trial. Menopause. 2008;15:310-318.
33. Reddy SY, Warner H, Guttuso T Jr, et al. Gabapentin, estrogen and placebo for treating hot flushes: a randomized controlled trial. Obstet Gynecol. 2006;108:41-48.
34. Thurston RC, Joffee H, Soares CN, et al. Physical activity and risk of vasomotor symptoms in women with and without a history of depression: results from the Harvard Study of Moods and Cycles. Menopause. 2006;13:553-560.
35. Borud EK, Alraek T, White A, et al. The Acupuncture on hot flushes among menopausal women (ACUFLASH) study, a randomized control trial. Menopause. 2009;16:484-493.
36. Borud EK, Alraek T, White A, et al. The Acupuncture on Hot Flashes Among Menopausal Women study: observational follow-up results at 6 and 12 months. Menopause. 2010;17:262-268.
37. Geller SE, Shulman LP, van Breeman RB, et al. Safety and efficacy of black cohosh and red clover for the management of vasomotor symptoms: a randomized controlled trial. Menopause. 2009;16:1156-1166.
38. Abdali K, Khajehei M, Tabatabaee HR. Effect of St John's Wort on severity, frequency, and duration of hot flashes in premenopausal, perimenopausal and postmenopausal women: a randomized, double-blind, placebo-controlled study. Menopause. 2010;17:326-331.
39. Freeman MP, Hibbeln JR, Silver M, et al. Omega-3 fatty acids for major depressive disorder associated with the menopausal transition: a preliminary open trial. Menopause. 2011;18:279-284.
40. Park H, Parker GL, Boardman JR, et al. A pilot phase II trial of magnesium supplements to reduce menopausal hot flashes in breast cancer patients. Support Care Cancer. 2011;19:859-862.
41. Joffee H, Petrillo L, Viguera A, et al. Eszopiclone improves insomnia and depressive and anxious symptoms in perimenopausal and postmenopausal women with hot flashes: a randomized double blinded placebo controlled crossover trial. Am J Obstet Gynecol. 2010;202:171.e1-171.e11.
42. Agosta C, Atlante M, Benvenuti C. Randomized controlled study on clinical efficacy of isoflavones plus Lactobacillus sporogenes, associated or not with a natural anxiolytic agent in menopause. Minerva Ginecol. 2011;63:11-17.
43. Sturdee D, Panay N. Recommendations for the management of postmenopausal vaginal atrophy. Climacteric. 2010;13:509-522.
44. Leiblum S, Bachmann G, Kemmann E, et al. Vaginal atrophy in the postmenopausal woman. The importance of sexual activity and hormones. JAMA. 1983;249:2195-2198.
45. Al-Baghdadi O, Ewies A. Topical estrogen therapy in the management of postmenopausal vaginal atrophy: an up-to-date review. Climacteric. 2009;12:91-105.
46. Weed SS. Menopausal Years: The Wise Woman Way. Alternative Approaches for Women. Woodstock, NY: Ash Tree; 1992.
47. Yildrim B, Kaleli B, Duzcan E, et al. The effects of postmenopausal vitamin D treatment on vaginal atrophy. Maturitas. 2004;49:334-347.
48. Catelo-Branco CC, Cancelo MJ, Villero J, et al. Management of post-menopausal vaginal atrophy and atrophic vaginitis. Maturitas. 2005;52(suppl 1):S46-S52.
49. LeVeque F, Hendrix S. Oral pilocarpine to treat vaginal xerosis associated with chemotherapy induced amenorrhea in premenopausal women. J Clin Oncol. 2004;22(suppl):8099.-
50. Ali I, Wojnarowska F. Physiological changes in scalp, facial and body hair after the menopause: a cross-sectional population-based study of subjective changes. Br J Dermatol. 2011;164:508-513.
51. Rathnayake D, Sinclair R. Innovative use of spironolactone as an antiandrogen in the treatment of female pattern hair loss. Dermatol Clin. 2010;28:611-618.
52. Olsen EA. Current and novel methods for assessing efficacy of hair growth promoters in pattern hair loss. J Am Acad Dermatol. 2003;48:253-262.
53. Dawber RP, Sonnex T, Ralfs I. Oral antiandrogen treatment of common baldness in women. Br J Dermatol. 1982;107 (suppl):20-21.