User login
Implementation of a Pharmacist-Managed Transitions of Care Tool
Effective transitions of care (TOC) are essential to ensure quality continuity of care after hospital discharge. About 20 to 30% of patients experience an adverse event (AE) in the peridischarge period when discharged to the community.1 Additionally, about two-thirds of AEs are preventable.1 The Joint Commission has identified various breakdowns in care that are associated with poor outcomes, including a lack of standardized discharge procedures, limited time dedicated to discharge planning and processes, and patients who lack the necessary resources or skills to implement discharge care plans.2
Background
The most impactful TOC programs are those that target patients who are at high risk for readmission or adverse outcomes.3 Factors such as advanced age, polypharmacy, cognitive impairment, and lack of social support are patient characteristics that have been associated with unfavorable outcomes after discharge.4 To identify this subset of high-risk individuals, various risk assessment scores have been developed, ranging from those that are used locally at the facility level to those that are nationally validated. The LACE score (Length of hospital stay; Acuity of the admission; Comorbidities measured with the Charlson comorbidity index score; and Emergency department visits within the past 6 months) is a validated index scoring tool that is used to identify medical and surgical patients at risk for readmission or death within 30 days of hospital discharge. On a 19-point scale, a score of ≥ 10 is considered high risk.5 Specific to the US Department of Veterans Affairs (VA), the Care Assessment Needs (CAN) score was developed to risk stratify the veteran population. The CAN score is generated using information including patient demographics, medical conditions, VA health care utilization, vital signs, laboratory values, medications, and socioeconomic status. This score is expressed as a percentile that compares the probability of death or admission among veterans at 90 days and 1 year postdischarge. Veterans in the 99th percentile have a 74% risk for these adverse outcomes at 1 year.6
The Joint Commission states that a fundamental component to assuring safe and effective TOC is medication management, which includes the involvement of pharmacists.2 TOC programs with pharmacist involvement have shown significant improvements related to reduced 30-day hospital readmissions and health care costs in addition to significant medication-related interventions.7-9 While this body of evidence continues to grow and demonstrates that pharmacists are an integral component of the TOC process, there is no gold standard program. Brantley and colleagues noted that a weakness of many TOC programs is that they are one dimensional, meaning that they focus on only 1 element of care transitions or 1 specific patient population or disease.10
There is well-supported evidence of high-impact interventions for pharmacists involved early in the admission process, but data are less robust on the discharge process. 11,12 Therefore, the primary focus of this project was to develop a pharmacist-based TOC program and implement a process for communicating high-risk patients who are discharging from our hospital across the continuum of care.
Setting
The Richard L. Roudebush VA Medical Center (RLRVAMC) is a tertiary care referral center for veterans in Indiana and eastern Illinois. Acute care clinical pharmacists are fully integrated into the acute care teams and practice under a comprehensive care model. Pharmacists attend daily patient care rounds and conduct discharge medication reconciliation for all patients with additional bedside counseling for patients who are being discharged home.
Primary care services are provided by patient aligned care teams (PACTs), multidisciplinary teams composed of physicians, advanced practice nurses, pharmacists, mental health care providers, registered nurses, dieticians, and care coordinators. Ambulatory Care or PACT clinical pharmacists are established within each RLRVAMC PACT clinic and provide comprehensive care management through an independent scope of practice for several chronic diseases, including hypertension, type 2 diabetes mellitus (T2DM), dyslipidemia, hypothyroidism, and tobacco cessation. Prior to this project implementation, there was no formalized or standardized method for facilitating routine communication of patients between acute care and PACT pharmacists in the TOC process.
Pilot Study
In 2017, RLRVAMC implemented a TOC pharmacy program pilot. A pharmacy resident and both acute care and PACT clinical pharmacy specialists (CPSs) developed the service. The pilot program was conducted from September 1, 2017 to March 1, 2018. The initial phase consisted of the development of an electronic TOC tool to standardize communication between acute care and PACT pharmacists. The TOC tool was created on a secure site accessible only to pharmacy personnel and not part of the formal medical record. (Figure 1).
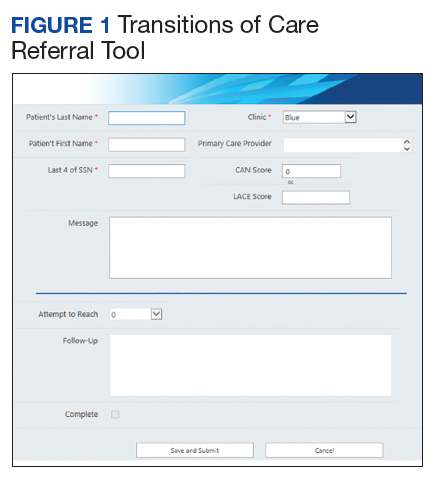
The acute care pharmacist identified high-risk patients through calculated CAN and LACE scores during the discharge process and offered PACT pharmacist follow-up to the patient during bedside discharge counseling. Information was then entered into the TOC tool, including patient identifiers and a message with specific information outlining the reason for referral. PACT pharmacists routinely reviewed the tool and attempted to phone each patient within 7 days of discharge. Follow-up included medication reconciliation and chronic disease management as warranted at the discretion of the PACT pharmacist. All postdischarge follow-up appointments were created and documented in the electronic health record. A retrospective chart review was completed on patients who were entered into the TOC tool.
Patients were eligible for referral if they were discharged during the study period with primary care established in one of the facility’s PACT clinics. Additionally, patients had to meet ≥ 1 of the following criteria, deeming them a high risk for readmission: LACE score ≥ 10, CAN score ≥ 90th percentile, or be considered high risk based on the discretion of the acute care pharmacist. Patients were included in the analysis if they met the CAN or LACE score requirement. Patients were excluded if they received primary care from a site other than a RLRVAMC PACT clinic. This included non-VA primary care, home-based primary care, or VA community-based outpatient clinics (CBOCs). Patients also were excluded if they required further institutional care postdischarge (ie, subacute rehabilitation, extended care facility, etc), discharged to hospice, or against medical advice.
The average referral rate per month during the pilot study was 19 patients, with 113 total referrals during the 6-month study period. Lower rates of index emergency department (ED) visits (5.3% vs 23.3%) and readmissions (1% vs 6.7%) were seen in the group of patients who received PACT pharmacist follow-up postdischarge compared with those who did not. Additionally, PACT pharmacists were able to make > 120 interventions, averaging 1.7 interventions per patient. Of note, these results were not statistically analyzed and were assessed as observational data to determine whether the program had the potential to be impactful. The results of the pilot study demonstrated positive outcomes associated with having a pharmacist-based TOC process and led to the desire for further development and implementation of the TOC program at the RLRVAMC. These positive results prompted a second phase project to address barriers, make improvements, and ensure sustainability.
Methods
Phase 2 was a quality improvement initiative; therefore, institutional review board approval was not needed. The aim of phase 2 was to improve, expand, and sustain the TOC program that was implemented in the pilot study. Barriers identified after discussion with acute care and PACT pharmacists included difficulty in making referrals due to required entry of cumbersome readmission risk factor calculations, limiting inclusion to patients who receive primary care at the main hospital facility, and the expansion of pharmacy staff with new pharmacists who were not knowledgeable of the referral process.
Design
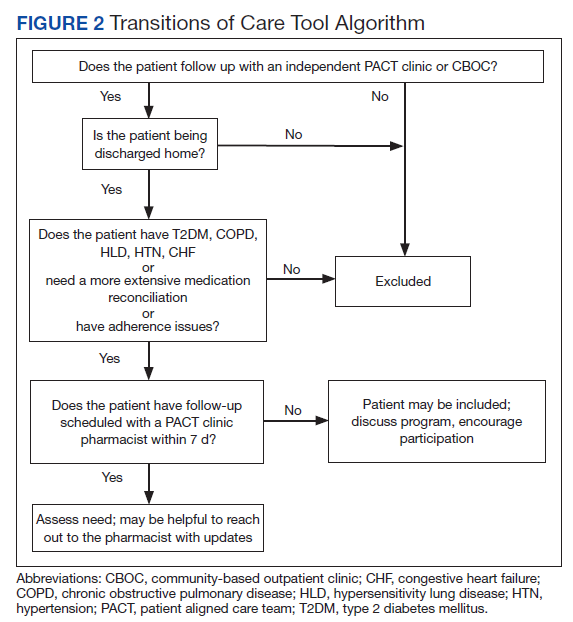
To overcome barriers, 4 main targeted interventions were needed: streamlining the referral process, enhancing pharmacy staff education, updating the discharge note template, and expanding the criteria to include patients who receive care at VA CBOCs. The referral process was streamlined by removing required calculated readmission risk scores, allowing pharmacist judgement to take precedence for referrals. Focused face-to-face education was provided to acute care and PACT pharmacists about the referral process and inclusion criteria to increase awareness and provide guidance of who may benefit from entry into the tool. Unlike the first phase of the study, education was provided for outpatient staff pharmacists responsible for discharging patients on the weekends. Additionally, the pharmacists received a printed quick reference guide of the information covered during the education sessions (Figure 2). Referral prompts were embedded into the standard pharmacy discharge note template to serve as a reminder to discharging pharmacists to assess patients for inclusion into the tool and provided a direct link to the tool. Expansion to include VA CBOCs occurred postpilot study, allowing increased patient access to this TOC service. All other aspects of the program were continued from the pilot phase.
Patients were eligible if they were discharged from RLRVAMC between October 1, 2018 and February 28, 2019. Additionally, the patient had to be established in a PACT clinic for primary care and have been referred to the tool based on the discretion of an acute care pharmacist. Patients were excluded if they were discharged against medical advice or to any facility where the patient and/or caregiver would not be responsible for medication administration (eg, subacute rehabilitation, extended care facility), or if the patient refused pharmacy follow-up.
Outcomes
The primary outcomes assessed were all-cause and index ED visits and readmissions within 30 days of discharge. All-cause ED visits and readmissions were defined as a second visit to RLRVAMC , regardless of readmission diagnosis. Index ED visits and readmissions were defined as those that were related to the initial admission diagnosis. Additional data collected and analyzed included the number of patients referred by pharmacists, number and type of medication discrepancies, medication changes, counseling interventions, time to follow-up postdischarge, and number of patients added to the PACT pharmacist’s clinic schedule for further management. A discrepancy identified by a PACT pharmacist was defined as a difference between the discharge medication list and the patient-reported medication list at the time of follow-up. Patients who were referred to the TOC tool but were unable to be reached by telephone served as the control group for this study.
Data Collection
A retrospective chart review was completed on patients entered into the tool. Data were collected and kept in a secured Microsoft Excel workbook. Baseline characteristics were analyzed using either a χ2 for nominal data or Student t test for continuous data. The primary outcomes were analyzed using a χ2 test. All statistical tests were analyzed using MiniTab 19 Statistical Software.
Results
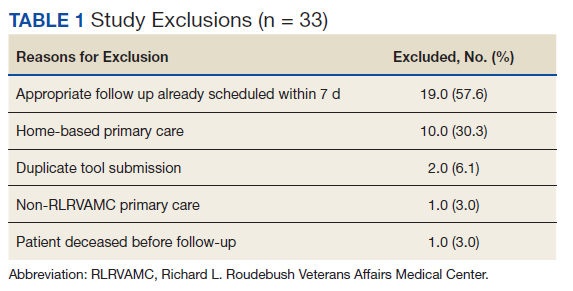
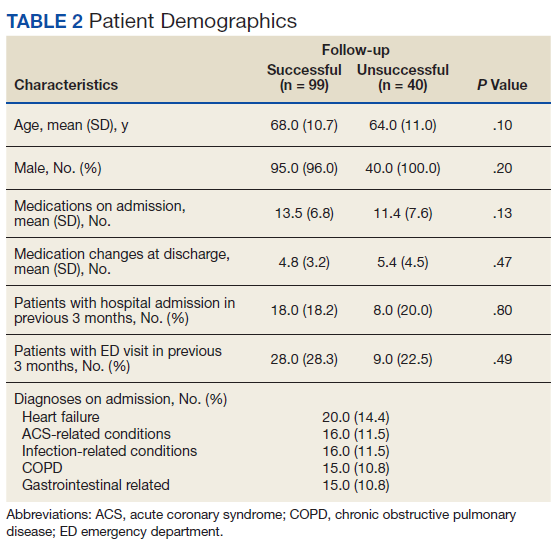
Pharmacists added 172 patients into the TOC tool; 139 patients met inclusion criteria. Of those excluded, most were because the PACT pharmacist did not attempt to contact the patient since they already had a primary care visit scheduled postdischarge (Table 1). Of the 139 patients who met the inclusion criteria, 99 were successfully contacted by a PACT pharmacist. Most patients were aged in their 60s, male, and white. Both groups had a similar quantity of outpatient medications on admission and medication changes made at discharge. Additionally, both groups had a similar number of patients with hospitalizations and/or ED visits in the 3 months before hospital admission that resulted in TOC tool referral (Table 2).
Hospital Readmission
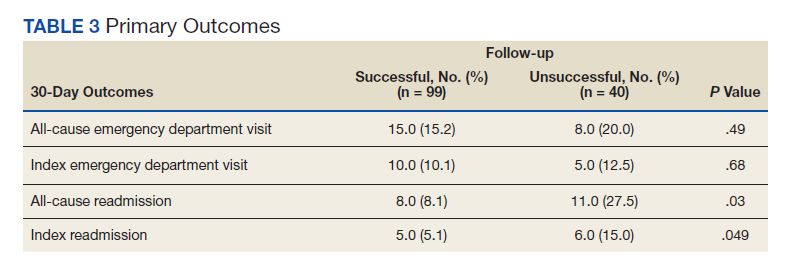
Hospital 30-day readmission rates for patients who were successfully followed by pharmacy compared with those who were not were 5.1% vs 15.0% (P = .049) for index readmissions and 8.1% vs 27.5% (P = .03) for all-cause readmissions. No statistically significant difference existed between those patients with follow-up compared with those without follow-up for either index (10.1% vs 12.5%, respectively; P = .68) or for all-cause ED visit rates (15.2% vs 20.0%, respectively; P = .49).
Patient Encounters
The average time to follow-up was 8.8 days, which was above the predetermined goal of contact within 7 days. Additionally, this was a decline from the initial pilot study, which had an average time to reach of 4.7 days. All patients reached by a pharmacist received medication reconciliation, with ≥ 28% of patients having ≥ 1 discrepancy. There were 43 discrepancies among all patients. Of the discrepancies, 25 were reported as errors performed by the patient, and 18 were from an error during the discharge process. The discrepancies that resulted from patient error were primarily patients who took the wrong dose of prescribed medications. Other patient discrepancies included taking medications not as scheduled, omitting medications (both intentionally and mistakenly), continuing to take medications that had been discontinued by a health care provider and improper administration technique. Examples of provider errors that occurred during the discharge process included not ordering medications for patient to pick up at discharge, not discontinuing a medication from the patient’s profile, and failure to renew expired prescriptions.
Additional counseling was provided to 75% of patients: The most common reason for counseling was T2DM, hypertension, and dyslipidemia management. PACT pharmacists changed medication regimens for 27.3% of patients for improved control of chronic diseases or relief of medication AEs.
At the end of each visit, patients were assessed to determine whether they could benefit from additional pharmacy follow-up. Thirty-seven patients were added to the pharmacist schedules for disease management appointments. The most common conditions for these appointments were T2DM, hypertension, tobacco cessation, and hyperlipidemia. Among the 37 patients who had pharmacy follow-up, there were 137 additional pharmacy appointments within the study period.
Program Referrals
After expansion to include the VA CBOCs, elimination of the elevated LACE or CAN score requirement, and additional staff education, the rate of referrals per month increased during phase 2 in comparison to the pilot study (Figure 3). There were a mean (SD) of 34 (10) referrals per month. Although not statistically analyzed, it is an objective increase in comparison to a mean 19 referrals per month in the pilot study.
Discussion
The continued development and use of a pharmacist-driven TOC tool at RLRVAMC increased communication and follow-up of high-risk patients, demonstrated the ability of pharmacists to identify and intervene in medication-related issues postdischarge, and successfully reduce 30-day readmissions. This program emphasized pharmacist involvement during the discharge process and created a standardized mechanism for TOC follow-up, addressing multiple areas that were identified by The Joint Commission as being associated with poor outcomes. The advanced pharmacy practice model at RLRVAMC allowed for a multidimensional program, including prospective patient identification and multiple pharmacy touchpoints. This is unique in comparison to many of the one-dimensional programs described in the literature.
Polypharmacy has been identified as a major predictor of medication discrepancies postdischarge, and patients with ≥ 10 active medications have been found to be at highest risk.13,14 Patients in this study had a mean 13 active medications on admission, with a mean 5 medication changes at discharge. PACT pharmacists documented 28 of 99 patients with ≥ 1 medication-related discrepancy at postdischarge reconciliation. This 28% discrepancy rate is consistent with discrepancy rates previously reported in the literature, which ranged from 14 to 45% in large meta-analyses.14,15 The majority of these discrepancies (58%) were related to patients who took the wrong dose of a prescribed medication.
Targeted interventions to overcome barriers in the pilot study increased the referral rates to the TOC tool; however, the increase in referral rate was associated with increased time to follow up by ambulatory care pharmacists. The extended follow-up times were seen most often in the 2 busiest primary care clinics, one of which is considered a teaching clinic for medical residents. Pharmacists were required to integrate these calls into their normal work schedule and were not provided additional time for calling, allowing for an increased follow-up time. The increased follow-up time likely contributed to the increased number of patients excluded due to already having PACT follow-up, giving more time for the primary care provider to have an appointment with the patient. The ambulatory care pharmacist could then determine whether further intervention was needed. In the summer of 2018, a decrease in referral rates occurred for a short time, but this is likely explained by incoming new residents and staff within the pharmacy department and decreased awareness among the new staff. The enhanced staff education took place during September 2018 and lead to increased referral rates compared with those seen in months prior.
PACT pharmacists were not only able to identify discrepancies, but also provide timely intervention on a multitude of medication-related issues by using their scope of practice (SOP). Most interventions were related to medication or disease counseling, including lifestyle, device, and disease education. The independent SOP of our PACT pharmacists is a unique aspect of this program and allowed pharmacists to independently adjust many aspects of a patient’s medication regimen during follow-up visits.
The outcomes of 30-day index and all-cause readmissions, as well as index and all-cause ED visit rates, were lower in the subset of patients who received PACT pharmacist follow-up after discharge (Table 3). The difference was most pronounced in the all-cause readmission rates: Only 8.1% of patients who received PACT follow-up experienced a readmission compared with 27.5% of those who did not. The difference between the groups regarding ED visit rates were not as pronounced, but this may be attributed to a limited sample size. These data indicate that the role of the pharmacist in identifying discrepancies and performing interventions at follow-up may play a clinically significant part in reducing both ED visit rates and hospital readmissions.
Limitations
There are some limitations identified within this study. Although the referral criteria were relaxed from the pilot study and enhanced education was created, continued education regarding appropriate referral of TOC patients continues to be necessary given intermittent staff changeover, incorporation of pharmacy trainees, and modifications to clinic workflow. Patients who were discharged to facilities were not included. This ensured that appropriate and consistent PACT pharmacist follow-up would be available, but likely reduced our sample size.
Although performing this study in a closed health care system with pharmacists who have independent SOPs is a strength of our study, also it can limit generalizability. Not all facilities house both acute care and ambulatory care in one location with wide SOPs to allow for comprehensive and continued care. Last, this study used convenience sampling, potentially introducing selection bias, as patients unable to be reached by PACT pharmacists may inherently be at increased risk for hospital readmission. However, in the 3 months preceding the hospital admission that resulted in TOC tool referral, both groups had a similar number of patients with hospital admissions and ED visits.
The TOC tool has become fully integrated into the daily workflow for both acute care and PACT pharmacists. After the conclusion of the study period, the referral rates into the tool have been maintained at a steady level, even surpassing the rates seen during the study period. In comparison with the pilot study, PACT pharmacists reported a subjective increase in referrals placed for procedures such as medication reconciliation or adherence checks. This is likely because acute care pharmacists were able to use their clinical judgement rather than to rely solely on calculated readmission risk scores for TOC tool referral.
The success of the TOC program led to the expansion to other specialty areas. ED pharmacists now refer patients from the ED who were not admitted to the hospital but would benefit from PACT follow-up. Additionally, the option to refer hematology and oncology patients was added to allow these patients to be followed up by our hematology/oncology CPSs by phone appointments. Unique reasons for follow-up for this patient population include concerns about delayed chemotherapy cycles or chemotherapy-associated AEs.
Conclusions
This study outlines the creation and continued improvement of a pharmacist-based TOC program. The program was designed as a method of communication between acute care and PACT pharmacists about high-risk patients. The creation of this program allowed PACT pharmacists not only to identify discrepancies and make interventions on high-risk patients, but also demonstrate that having pharmacists involved in these programs may have a positive impact on readmissions and ED visits. The success of the TOC tool at the RLRVAMC has led to its expansion and is now an integral part of the daily workflow for both acute care and PACT pharmacists.
1. Forster AJ, Murff HJ, Peterson JF, Gandhi TK, Bates DW. The incidence and severity of adverse effects affecting patients after discharge from the hospital. Ann Intern Med. 2003;138(3):161-167. doi:10.7326/0003-4819-138-3-200302040-00007
2. The Joint Commission. Transitions of care: the need for collaboration across entire care continuum. Published February 2013. Accessed February 25, 2021. http://www.jointcommission.org/assets/1/6/TOC_Hot_Topics.pdf
3. Leppin AL, Gionfriddo MR, Kessler M, et al. Preventing 30-day hospital readmissions: a systematic review and meta-analysis of randomized trials. JAMA Intern Med. 2014;174(7):1095-1107. doi:10.1001/jamainternmed.2014.1608
4. Medicare Hospital Compare. Readmissions and deaths. Accessed February 25, 2021. https://www.cms.gov/Medicare/Quality-Initiatives-Patient-Assessment-Instruments/HospitalQualityInits/VA-Data
5. van Walraven C, Dhalla IA, Bell C, et al. Derivation and validation of an index to predict early death or unplanned readmission after discharge from hospital to the community. CMAJ. 2010;182(6):551-557. doi:10.1503/cmaj.091117
6. US Department of Veteran Affairs. Care Assessment Needs (CAN) score report. Updated May 14, 2019. Accessed February 25, 2021. https://www.va.gov/HEALTHCAREEXCELLENCE/about/organization/examples/care-assessment-needs.asp
7. Schnipper JL, Kirwin JL, Cotugno MC, et al. Role of pharmacist counseling in preventing adverse drug events after hospitalization. Arch Intern Med. 2006;166(5):565-571. doi:10.1001/archinte.166.5.565
8. Phatak A, Prusi R, Ward B, et al. Impact of pharmacist involvement in the transitional care of high-risk patients through medication reconciliation, medication education, and post-discharge call-backs. J Hosp Med. 2016;11(1):40-44. doi:10.1002/jhm.2493
9. Coleman EA, Min SJ, Chomiak A, Kramer AM. Posthospital care transitions: patterns, complications, and risk identification. Health Serv Res. 2004;39(5):1449-1465. doi:10.1111/j.1475-6773.2004.00298.x
10. Brantley AF, Rossi DM, Barnes-Warren S, Francisco JC, Schatten I, Dave V. Bridging gaps in care: implementation of a pharmacist-led transitions of care program. Am J Health Syst Pharm. 2018;75(5)(suppl 1):S1-S5. doi:10.2146/ajhp160652
11. Scarsi KK, Fotis MA, Noskin GA. Pharmacist participation in medical rounds reduces medical errors. Am J Health Syst Pharm. 2002;59(21):2089-2092. doi:10.1093/ajhp/59.21.2089
12. Pevnick JM, Nguyen C, Jackevicius CA, et al. Improving admission medication reconciliation with pharmacists or pharmacy technicians in the emergency department: a randomised controlled trial. BMJ Qual Saf. 2018;27:512-520. doi:10.1136/bmjqs-2017-006761.
13. Kirwin J, Canales AE, Bentley ML, et al; American College of Clinical Pharmacy. Process indicators of quality clinical pharmacy services during transitions of care. Pharmacotherapy. 2012;32(11):e338-e347. doi:10.1002/phar.1214
14. Kwan JL, Lo L, Sampson M, et al. Medication reconciliation during transitions of care as a patient safety strategy: a systematic review. Ann Intern Med. 2013;158(5, part 2):397-403. doi:10.7326/0003-4819-158-5-201303051-00006
15. Stitt DM, Elliot DP, Thompson SN. Medication discrepancies identified at time of hospital discharge in a geriatric population. Am J Geriatr Pharmacother. 2011;9(4):234-240. doi:10.1016/j.amjopharm.2011.06.002
Effective transitions of care (TOC) are essential to ensure quality continuity of care after hospital discharge. About 20 to 30% of patients experience an adverse event (AE) in the peridischarge period when discharged to the community.1 Additionally, about two-thirds of AEs are preventable.1 The Joint Commission has identified various breakdowns in care that are associated with poor outcomes, including a lack of standardized discharge procedures, limited time dedicated to discharge planning and processes, and patients who lack the necessary resources or skills to implement discharge care plans.2
Background
The most impactful TOC programs are those that target patients who are at high risk for readmission or adverse outcomes.3 Factors such as advanced age, polypharmacy, cognitive impairment, and lack of social support are patient characteristics that have been associated with unfavorable outcomes after discharge.4 To identify this subset of high-risk individuals, various risk assessment scores have been developed, ranging from those that are used locally at the facility level to those that are nationally validated. The LACE score (Length of hospital stay; Acuity of the admission; Comorbidities measured with the Charlson comorbidity index score; and Emergency department visits within the past 6 months) is a validated index scoring tool that is used to identify medical and surgical patients at risk for readmission or death within 30 days of hospital discharge. On a 19-point scale, a score of ≥ 10 is considered high risk.5 Specific to the US Department of Veterans Affairs (VA), the Care Assessment Needs (CAN) score was developed to risk stratify the veteran population. The CAN score is generated using information including patient demographics, medical conditions, VA health care utilization, vital signs, laboratory values, medications, and socioeconomic status. This score is expressed as a percentile that compares the probability of death or admission among veterans at 90 days and 1 year postdischarge. Veterans in the 99th percentile have a 74% risk for these adverse outcomes at 1 year.6
The Joint Commission states that a fundamental component to assuring safe and effective TOC is medication management, which includes the involvement of pharmacists.2 TOC programs with pharmacist involvement have shown significant improvements related to reduced 30-day hospital readmissions and health care costs in addition to significant medication-related interventions.7-9 While this body of evidence continues to grow and demonstrates that pharmacists are an integral component of the TOC process, there is no gold standard program. Brantley and colleagues noted that a weakness of many TOC programs is that they are one dimensional, meaning that they focus on only 1 element of care transitions or 1 specific patient population or disease.10
There is well-supported evidence of high-impact interventions for pharmacists involved early in the admission process, but data are less robust on the discharge process. 11,12 Therefore, the primary focus of this project was to develop a pharmacist-based TOC program and implement a process for communicating high-risk patients who are discharging from our hospital across the continuum of care.
Setting
The Richard L. Roudebush VA Medical Center (RLRVAMC) is a tertiary care referral center for veterans in Indiana and eastern Illinois. Acute care clinical pharmacists are fully integrated into the acute care teams and practice under a comprehensive care model. Pharmacists attend daily patient care rounds and conduct discharge medication reconciliation for all patients with additional bedside counseling for patients who are being discharged home.
Primary care services are provided by patient aligned care teams (PACTs), multidisciplinary teams composed of physicians, advanced practice nurses, pharmacists, mental health care providers, registered nurses, dieticians, and care coordinators. Ambulatory Care or PACT clinical pharmacists are established within each RLRVAMC PACT clinic and provide comprehensive care management through an independent scope of practice for several chronic diseases, including hypertension, type 2 diabetes mellitus (T2DM), dyslipidemia, hypothyroidism, and tobacco cessation. Prior to this project implementation, there was no formalized or standardized method for facilitating routine communication of patients between acute care and PACT pharmacists in the TOC process.
Pilot Study
In 2017, RLRVAMC implemented a TOC pharmacy program pilot. A pharmacy resident and both acute care and PACT clinical pharmacy specialists (CPSs) developed the service. The pilot program was conducted from September 1, 2017 to March 1, 2018. The initial phase consisted of the development of an electronic TOC tool to standardize communication between acute care and PACT pharmacists. The TOC tool was created on a secure site accessible only to pharmacy personnel and not part of the formal medical record. (Figure 1).
The acute care pharmacist identified high-risk patients through calculated CAN and LACE scores during the discharge process and offered PACT pharmacist follow-up to the patient during bedside discharge counseling. Information was then entered into the TOC tool, including patient identifiers and a message with specific information outlining the reason for referral. PACT pharmacists routinely reviewed the tool and attempted to phone each patient within 7 days of discharge. Follow-up included medication reconciliation and chronic disease management as warranted at the discretion of the PACT pharmacist. All postdischarge follow-up appointments were created and documented in the electronic health record. A retrospective chart review was completed on patients who were entered into the TOC tool.
Patients were eligible for referral if they were discharged during the study period with primary care established in one of the facility’s PACT clinics. Additionally, patients had to meet ≥ 1 of the following criteria, deeming them a high risk for readmission: LACE score ≥ 10, CAN score ≥ 90th percentile, or be considered high risk based on the discretion of the acute care pharmacist. Patients were included in the analysis if they met the CAN or LACE score requirement. Patients were excluded if they received primary care from a site other than a RLRVAMC PACT clinic. This included non-VA primary care, home-based primary care, or VA community-based outpatient clinics (CBOCs). Patients also were excluded if they required further institutional care postdischarge (ie, subacute rehabilitation, extended care facility, etc), discharged to hospice, or against medical advice.
The average referral rate per month during the pilot study was 19 patients, with 113 total referrals during the 6-month study period. Lower rates of index emergency department (ED) visits (5.3% vs 23.3%) and readmissions (1% vs 6.7%) were seen in the group of patients who received PACT pharmacist follow-up postdischarge compared with those who did not. Additionally, PACT pharmacists were able to make > 120 interventions, averaging 1.7 interventions per patient. Of note, these results were not statistically analyzed and were assessed as observational data to determine whether the program had the potential to be impactful. The results of the pilot study demonstrated positive outcomes associated with having a pharmacist-based TOC process and led to the desire for further development and implementation of the TOC program at the RLRVAMC. These positive results prompted a second phase project to address barriers, make improvements, and ensure sustainability.
Methods
Phase 2 was a quality improvement initiative; therefore, institutional review board approval was not needed. The aim of phase 2 was to improve, expand, and sustain the TOC program that was implemented in the pilot study. Barriers identified after discussion with acute care and PACT pharmacists included difficulty in making referrals due to required entry of cumbersome readmission risk factor calculations, limiting inclusion to patients who receive primary care at the main hospital facility, and the expansion of pharmacy staff with new pharmacists who were not knowledgeable of the referral process.
Design
To overcome barriers, 4 main targeted interventions were needed: streamlining the referral process, enhancing pharmacy staff education, updating the discharge note template, and expanding the criteria to include patients who receive care at VA CBOCs. The referral process was streamlined by removing required calculated readmission risk scores, allowing pharmacist judgement to take precedence for referrals. Focused face-to-face education was provided to acute care and PACT pharmacists about the referral process and inclusion criteria to increase awareness and provide guidance of who may benefit from entry into the tool. Unlike the first phase of the study, education was provided for outpatient staff pharmacists responsible for discharging patients on the weekends. Additionally, the pharmacists received a printed quick reference guide of the information covered during the education sessions (Figure 2). Referral prompts were embedded into the standard pharmacy discharge note template to serve as a reminder to discharging pharmacists to assess patients for inclusion into the tool and provided a direct link to the tool. Expansion to include VA CBOCs occurred postpilot study, allowing increased patient access to this TOC service. All other aspects of the program were continued from the pilot phase.
Patients were eligible if they were discharged from RLRVAMC between October 1, 2018 and February 28, 2019. Additionally, the patient had to be established in a PACT clinic for primary care and have been referred to the tool based on the discretion of an acute care pharmacist. Patients were excluded if they were discharged against medical advice or to any facility where the patient and/or caregiver would not be responsible for medication administration (eg, subacute rehabilitation, extended care facility), or if the patient refused pharmacy follow-up.
Outcomes
The primary outcomes assessed were all-cause and index ED visits and readmissions within 30 days of discharge. All-cause ED visits and readmissions were defined as a second visit to RLRVAMC , regardless of readmission diagnosis. Index ED visits and readmissions were defined as those that were related to the initial admission diagnosis. Additional data collected and analyzed included the number of patients referred by pharmacists, number and type of medication discrepancies, medication changes, counseling interventions, time to follow-up postdischarge, and number of patients added to the PACT pharmacist’s clinic schedule for further management. A discrepancy identified by a PACT pharmacist was defined as a difference between the discharge medication list and the patient-reported medication list at the time of follow-up. Patients who were referred to the TOC tool but were unable to be reached by telephone served as the control group for this study.
Data Collection
A retrospective chart review was completed on patients entered into the tool. Data were collected and kept in a secured Microsoft Excel workbook. Baseline characteristics were analyzed using either a χ2 for nominal data or Student t test for continuous data. The primary outcomes were analyzed using a χ2 test. All statistical tests were analyzed using MiniTab 19 Statistical Software.
Results
Pharmacists added 172 patients into the TOC tool; 139 patients met inclusion criteria. Of those excluded, most were because the PACT pharmacist did not attempt to contact the patient since they already had a primary care visit scheduled postdischarge (Table 1). Of the 139 patients who met the inclusion criteria, 99 were successfully contacted by a PACT pharmacist. Most patients were aged in their 60s, male, and white. Both groups had a similar quantity of outpatient medications on admission and medication changes made at discharge. Additionally, both groups had a similar number of patients with hospitalizations and/or ED visits in the 3 months before hospital admission that resulted in TOC tool referral (Table 2).
Hospital Readmission
Hospital 30-day readmission rates for patients who were successfully followed by pharmacy compared with those who were not were 5.1% vs 15.0% (P = .049) for index readmissions and 8.1% vs 27.5% (P = .03) for all-cause readmissions. No statistically significant difference existed between those patients with follow-up compared with those without follow-up for either index (10.1% vs 12.5%, respectively; P = .68) or for all-cause ED visit rates (15.2% vs 20.0%, respectively; P = .49).
Patient Encounters
The average time to follow-up was 8.8 days, which was above the predetermined goal of contact within 7 days. Additionally, this was a decline from the initial pilot study, which had an average time to reach of 4.7 days. All patients reached by a pharmacist received medication reconciliation, with ≥ 28% of patients having ≥ 1 discrepancy. There were 43 discrepancies among all patients. Of the discrepancies, 25 were reported as errors performed by the patient, and 18 were from an error during the discharge process. The discrepancies that resulted from patient error were primarily patients who took the wrong dose of prescribed medications. Other patient discrepancies included taking medications not as scheduled, omitting medications (both intentionally and mistakenly), continuing to take medications that had been discontinued by a health care provider and improper administration technique. Examples of provider errors that occurred during the discharge process included not ordering medications for patient to pick up at discharge, not discontinuing a medication from the patient’s profile, and failure to renew expired prescriptions.
Additional counseling was provided to 75% of patients: The most common reason for counseling was T2DM, hypertension, and dyslipidemia management. PACT pharmacists changed medication regimens for 27.3% of patients for improved control of chronic diseases or relief of medication AEs.
At the end of each visit, patients were assessed to determine whether they could benefit from additional pharmacy follow-up. Thirty-seven patients were added to the pharmacist schedules for disease management appointments. The most common conditions for these appointments were T2DM, hypertension, tobacco cessation, and hyperlipidemia. Among the 37 patients who had pharmacy follow-up, there were 137 additional pharmacy appointments within the study period.
Program Referrals
After expansion to include the VA CBOCs, elimination of the elevated LACE or CAN score requirement, and additional staff education, the rate of referrals per month increased during phase 2 in comparison to the pilot study (Figure 3). There were a mean (SD) of 34 (10) referrals per month. Although not statistically analyzed, it is an objective increase in comparison to a mean 19 referrals per month in the pilot study.
Discussion
The continued development and use of a pharmacist-driven TOC tool at RLRVAMC increased communication and follow-up of high-risk patients, demonstrated the ability of pharmacists to identify and intervene in medication-related issues postdischarge, and successfully reduce 30-day readmissions. This program emphasized pharmacist involvement during the discharge process and created a standardized mechanism for TOC follow-up, addressing multiple areas that were identified by The Joint Commission as being associated with poor outcomes. The advanced pharmacy practice model at RLRVAMC allowed for a multidimensional program, including prospective patient identification and multiple pharmacy touchpoints. This is unique in comparison to many of the one-dimensional programs described in the literature.
Polypharmacy has been identified as a major predictor of medication discrepancies postdischarge, and patients with ≥ 10 active medications have been found to be at highest risk.13,14 Patients in this study had a mean 13 active medications on admission, with a mean 5 medication changes at discharge. PACT pharmacists documented 28 of 99 patients with ≥ 1 medication-related discrepancy at postdischarge reconciliation. This 28% discrepancy rate is consistent with discrepancy rates previously reported in the literature, which ranged from 14 to 45% in large meta-analyses.14,15 The majority of these discrepancies (58%) were related to patients who took the wrong dose of a prescribed medication.
Targeted interventions to overcome barriers in the pilot study increased the referral rates to the TOC tool; however, the increase in referral rate was associated with increased time to follow up by ambulatory care pharmacists. The extended follow-up times were seen most often in the 2 busiest primary care clinics, one of which is considered a teaching clinic for medical residents. Pharmacists were required to integrate these calls into their normal work schedule and were not provided additional time for calling, allowing for an increased follow-up time. The increased follow-up time likely contributed to the increased number of patients excluded due to already having PACT follow-up, giving more time for the primary care provider to have an appointment with the patient. The ambulatory care pharmacist could then determine whether further intervention was needed. In the summer of 2018, a decrease in referral rates occurred for a short time, but this is likely explained by incoming new residents and staff within the pharmacy department and decreased awareness among the new staff. The enhanced staff education took place during September 2018 and lead to increased referral rates compared with those seen in months prior.
PACT pharmacists were not only able to identify discrepancies, but also provide timely intervention on a multitude of medication-related issues by using their scope of practice (SOP). Most interventions were related to medication or disease counseling, including lifestyle, device, and disease education. The independent SOP of our PACT pharmacists is a unique aspect of this program and allowed pharmacists to independently adjust many aspects of a patient’s medication regimen during follow-up visits.
The outcomes of 30-day index and all-cause readmissions, as well as index and all-cause ED visit rates, were lower in the subset of patients who received PACT pharmacist follow-up after discharge (Table 3). The difference was most pronounced in the all-cause readmission rates: Only 8.1% of patients who received PACT follow-up experienced a readmission compared with 27.5% of those who did not. The difference between the groups regarding ED visit rates were not as pronounced, but this may be attributed to a limited sample size. These data indicate that the role of the pharmacist in identifying discrepancies and performing interventions at follow-up may play a clinically significant part in reducing both ED visit rates and hospital readmissions.
Limitations
There are some limitations identified within this study. Although the referral criteria were relaxed from the pilot study and enhanced education was created, continued education regarding appropriate referral of TOC patients continues to be necessary given intermittent staff changeover, incorporation of pharmacy trainees, and modifications to clinic workflow. Patients who were discharged to facilities were not included. This ensured that appropriate and consistent PACT pharmacist follow-up would be available, but likely reduced our sample size.
Although performing this study in a closed health care system with pharmacists who have independent SOPs is a strength of our study, also it can limit generalizability. Not all facilities house both acute care and ambulatory care in one location with wide SOPs to allow for comprehensive and continued care. Last, this study used convenience sampling, potentially introducing selection bias, as patients unable to be reached by PACT pharmacists may inherently be at increased risk for hospital readmission. However, in the 3 months preceding the hospital admission that resulted in TOC tool referral, both groups had a similar number of patients with hospital admissions and ED visits.
The TOC tool has become fully integrated into the daily workflow for both acute care and PACT pharmacists. After the conclusion of the study period, the referral rates into the tool have been maintained at a steady level, even surpassing the rates seen during the study period. In comparison with the pilot study, PACT pharmacists reported a subjective increase in referrals placed for procedures such as medication reconciliation or adherence checks. This is likely because acute care pharmacists were able to use their clinical judgement rather than to rely solely on calculated readmission risk scores for TOC tool referral.
The success of the TOC program led to the expansion to other specialty areas. ED pharmacists now refer patients from the ED who were not admitted to the hospital but would benefit from PACT follow-up. Additionally, the option to refer hematology and oncology patients was added to allow these patients to be followed up by our hematology/oncology CPSs by phone appointments. Unique reasons for follow-up for this patient population include concerns about delayed chemotherapy cycles or chemotherapy-associated AEs.
Conclusions
This study outlines the creation and continued improvement of a pharmacist-based TOC program. The program was designed as a method of communication between acute care and PACT pharmacists about high-risk patients. The creation of this program allowed PACT pharmacists not only to identify discrepancies and make interventions on high-risk patients, but also demonstrate that having pharmacists involved in these programs may have a positive impact on readmissions and ED visits. The success of the TOC tool at the RLRVAMC has led to its expansion and is now an integral part of the daily workflow for both acute care and PACT pharmacists.
1. Forster AJ, Murff HJ, Peterson JF, Gandhi TK, Bates DW. The incidence and severity of adverse effects affecting patients after discharge from the hospital. Ann Intern Med. 2003;138(3):161-167. doi:10.7326/0003-4819-138-3-200302040-00007
2. The Joint Commission. Transitions of care: the need for collaboration across entire care continuum. Published February 2013. Accessed February 25, 2021. http://www.jointcommission.org/assets/1/6/TOC_Hot_Topics.pdf
3. Leppin AL, Gionfriddo MR, Kessler M, et al. Preventing 30-day hospital readmissions: a systematic review and meta-analysis of randomized trials. JAMA Intern Med. 2014;174(7):1095-1107. doi:10.1001/jamainternmed.2014.1608
4. Medicare Hospital Compare. Readmissions and deaths. Accessed February 25, 2021. https://www.cms.gov/Medicare/Quality-Initiatives-Patient-Assessment-Instruments/HospitalQualityInits/VA-Data
5. van Walraven C, Dhalla IA, Bell C, et al. Derivation and validation of an index to predict early death or unplanned readmission after discharge from hospital to the community. CMAJ. 2010;182(6):551-557. doi:10.1503/cmaj.091117
6. US Department of Veteran Affairs. Care Assessment Needs (CAN) score report. Updated May 14, 2019. Accessed February 25, 2021. https://www.va.gov/HEALTHCAREEXCELLENCE/about/organization/examples/care-assessment-needs.asp
7. Schnipper JL, Kirwin JL, Cotugno MC, et al. Role of pharmacist counseling in preventing adverse drug events after hospitalization. Arch Intern Med. 2006;166(5):565-571. doi:10.1001/archinte.166.5.565
8. Phatak A, Prusi R, Ward B, et al. Impact of pharmacist involvement in the transitional care of high-risk patients through medication reconciliation, medication education, and post-discharge call-backs. J Hosp Med. 2016;11(1):40-44. doi:10.1002/jhm.2493
9. Coleman EA, Min SJ, Chomiak A, Kramer AM. Posthospital care transitions: patterns, complications, and risk identification. Health Serv Res. 2004;39(5):1449-1465. doi:10.1111/j.1475-6773.2004.00298.x
10. Brantley AF, Rossi DM, Barnes-Warren S, Francisco JC, Schatten I, Dave V. Bridging gaps in care: implementation of a pharmacist-led transitions of care program. Am J Health Syst Pharm. 2018;75(5)(suppl 1):S1-S5. doi:10.2146/ajhp160652
11. Scarsi KK, Fotis MA, Noskin GA. Pharmacist participation in medical rounds reduces medical errors. Am J Health Syst Pharm. 2002;59(21):2089-2092. doi:10.1093/ajhp/59.21.2089
12. Pevnick JM, Nguyen C, Jackevicius CA, et al. Improving admission medication reconciliation with pharmacists or pharmacy technicians in the emergency department: a randomised controlled trial. BMJ Qual Saf. 2018;27:512-520. doi:10.1136/bmjqs-2017-006761.
13. Kirwin J, Canales AE, Bentley ML, et al; American College of Clinical Pharmacy. Process indicators of quality clinical pharmacy services during transitions of care. Pharmacotherapy. 2012;32(11):e338-e347. doi:10.1002/phar.1214
14. Kwan JL, Lo L, Sampson M, et al. Medication reconciliation during transitions of care as a patient safety strategy: a systematic review. Ann Intern Med. 2013;158(5, part 2):397-403. doi:10.7326/0003-4819-158-5-201303051-00006
15. Stitt DM, Elliot DP, Thompson SN. Medication discrepancies identified at time of hospital discharge in a geriatric population. Am J Geriatr Pharmacother. 2011;9(4):234-240. doi:10.1016/j.amjopharm.2011.06.002
Opioid Management in Older Adults: Lessons Learned From a Geriatric Patient-Centered Medical Home
The United States continues to confront an opioid crisis that also affects older adults. According to the Substance Abuse and Mental Health Services Administration from 1999 to 2010, there has been a 4-fold increase in opioid overdose deaths.1 Between 2010 and 2015, the rate of opioid-related inpatient stays and emergency department (ED) visits for people aged ≥ 65 years increased by 34% and 74%, respectively, and opioid-related overdose deaths continue to increase among older patients.1,2
Background
Chronic pain is estimated to affect 50 million US adults.3 Individuals receiving long-term opioid therapy may not have experienced relief with other medications or cannot take them for medical safety reasons. Losing access to opioid prescriptions can contribute to misuse of illicit opioids. Implementing best practices for prescription opioid management in older adults is challenging. Older adults have a high prevalence of chronic pain, which is linked to disability and loss of function, reduced mobility, falls, depression, anxiety, sleep disorders, social isolation, and suicide or suicidal ideation.4 Until recently, chronic pain in older adults was often treated primarily with long-term opioid prescriptions, despite little evidence for the effectiveness of that treatment for chronic conditions. The prevalence of long-term opioid use in adults has increased from 1.8% (1999-2000) to 5.4% (2013-2014), and 25% of adult long-term opioid users are aged ≥ 65 years.5
Older adults are especially vulnerable to developing adverse events (AEs) from opioid use, including constipation, confusion, nausea, falls, and overdose. These factors make safe prescribing more challenging even when opioids are an appropriate therapeutic choice. Older adults often have multiple chronic conditions and take multiple medications that increase risk of AEs due to drug-disease and drug-drug interactions. Finding appropriate alternatives for pain management can be challenging in the presence of dementia if other pharmacologic options are contraindicated or mobility issues limit access to other therapeutic options.
Pain treatment plans should be based on realistic functional goals using a shared decision-making approach accounting for patient and provider expectations. All reasonable nondrug and nonopioid treatments should be considered before opioids are initiated. A comprehensive, person-centered, approach to pain management in older adults that includes opioids, other medications, and complementary and integrative care could improve both pain control and function,and reduce the harms of unnecessary opioid exposure.6 A validated risk review should be performed and documented on all patients starting opioids except patients enrolled in hospice care.
In 2018, the US Department of Veterans Affairs (VA) required all facilities to complete case reviews for veterans identified in the Stratification Tool for Opioid Risk Mitigation (STORM) dashboard as being at particularly high risk for AEs among patients prescribed opioids.7 We present our experience with a 1-year management of 48 high-risk older patients receiving chronic prescription opioid therapy. These patients obtained all their care at the VA with complete record documentation.
Methods
The Tennessee Valley Healthcare System (TVHS) is an integrated VA health care system with > 100,000 veteran patients in middle Tennessee with 2 medical centers 40 miles apart, and 12 community-based outpatient clinics. In 2011, TVHS developed a geriatric patient-centered medical home model for geriatric primary care—the geriatric patient aligned care team (GeriPACT).8 GeriPACT consists of a GeriPACT primary care provider (geriatrician or geriatric nurse practitioner with a panel of about 800 outpatients), social worker, clinical pharmacist, registered nurse care manager, licensed vocational nurse, and clerical staff. GeriPACT is a special population PACT within primary care for complex geriatric and other high-risk vulnerable veterans providing integrated, interdisciplinary assessment and longitudinal management, and coordination of both VA and non-VA-funded (eg, Medicare and Medicaid) services for patients and caregivers. GeriPACT at the Nashville TVHS campus has an enrollment of 745 patients of whom 48 receive chronic prescription opioid therapy. The practice is supported by the VA Computerized Patients Record System (CPRS), including the electronic patient portal, My healtheVet, with telemedicine capabilities. Data were collected by chart review with operations data extracted from the Veterans Health Information System and Technology Architecture.
Best practices for prescription opioids for chronic pain follow the US Department of Health and Human Services Interagency Task Force pain management recommendations.4 These include: (1) Effective pain evaluation and management, including diagnostic evaluation and indicated referrals; (2) appropriately prescribed opioids when indicated; and (3) active management of opioid users to prevent AEs and misuse. Strategies used in GeriPACT were adopted from the pain management task force and designed to address needs and challenges associated with responsible chronic opioid prescribing (Table 1).
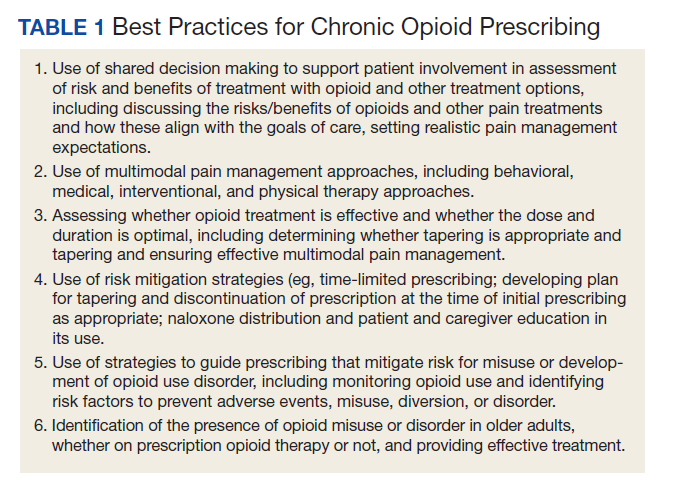
All 48 patients who were prescribed chronic opioid therapy received routine primary care at GeriPACT. A data tracking sheet was maintained from July 1, 2019 to June 30, 2020. Patients were presented for interdisciplinary collaboration and management at weekly GeriPACT where applicable continuous improvement processes were incorporated. Patients were seen every 3 to 6 months and offered dose reduction and alternative therapies at those times. All patients initiated monthly calls for medication refills and were monitored with an initial opioid contract and quarterly unannounced urine drug screens (UDSs) as well as a quarterly review of the prescription drug monitoring database (PDMD). Additionally, all patients received an Opioid Risk Tool assessment (scale 0-26; high risk ≥ 8) and a Risk Index for Overdose or Serious Opioid-Induced Respiratory Depression (RIOSORD) Score (scale 0-115).9,10 Patients with RIOSORD scores ≥ 25 (14% risk of opioid induced respiratory depression) were issued naloxone kits.
All VA patients additionally receive a risk stratification, the clinical assessment of need (CAN) score, which is a clinical predictor of hospitalization and death developed for VA populations.11 This methodology extracts predictors from 6 categories: social demographics, medical conditions, vital signs, prior year use of health services, medications, and laboratory tests and constructs logistic regression models to predict outcomes. CAN scores are on a 99-point scale, with higher scores corresponding to an increased probability of future health care events.
Our overall study was designed to meet standards for quality improvement reporting excellence (SQUIRE) criteria, and this report meets the quality improvement minimum quality criteria set (QI-MQCS) domains for reporting quality improvement work.12,13 The TVHS Institutional Review Board determined this study to be a quality improvement initiative.
Results
Chronic opioid patients comprised 6.4% of the GeriPACT population. These patients had many comorbidities, including diabetes mellitus (35%), pulmonary disease (25%), congestive heart failure (18.8%), and dementia (8%). There were 54% with estimated glomerular filtration rates (eGFR) < 60 mL/min, indicating at least stage 3 chronic kidney disease (Table 2). Patients had an average RIOSORD Score of 21 and a 14% risk of opioid induced respiratory depression, and 20% received mental health services.
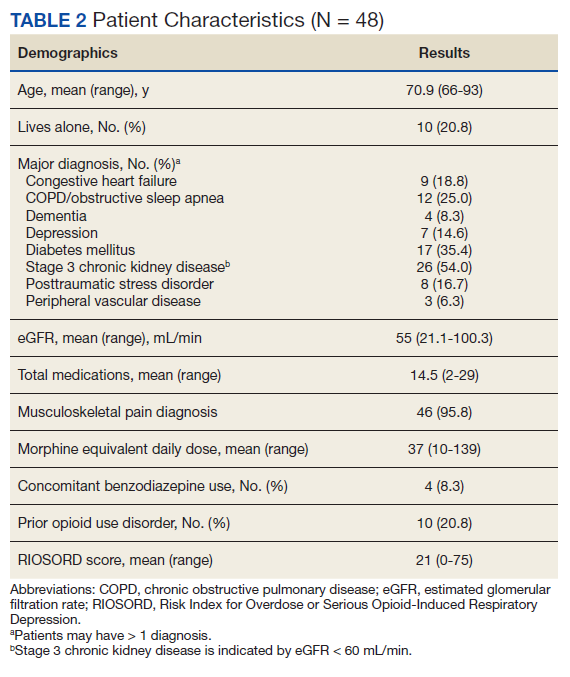
The mean CAN score was 83.1, suggesting a 1-year risk of 20% for a major AE and 5% mortality risk. Many patients with chronic opioid use were transferred to GeriPACT from primary care due to presence of complex medical issues in addition to need for chronic pain management. In this population, 8% were coprescribed benzodiazepines and opioids. Consults were obtained from interventional pain for 37.5% of patients and palliative care for 27% of patients, the majority for goals of care related to chronic illness and advance directive discussions, and in 1 patient for pain and symptom management. The majority of patients (81%) had advance care planning documents or discussions documented in the electronic health record, and 87.5% of patients received home and community-based support in addition to GeriPACT care.
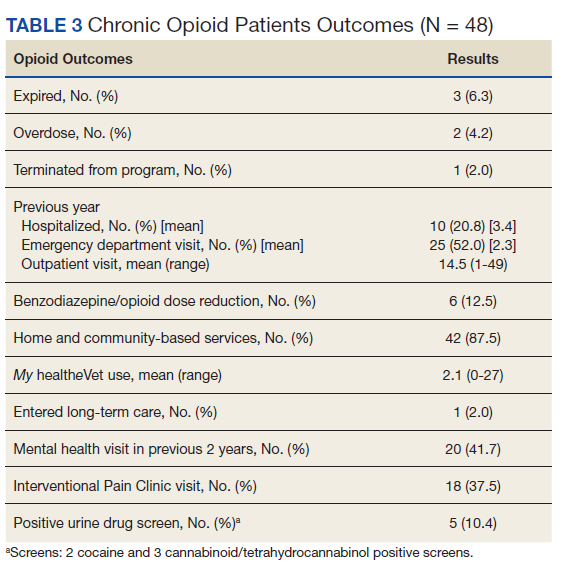
My healtheVet patient portal secure messaging was used a mean 2.1 times per patient (range 0-27) to maintain contact with GeriPACT providers and patients had a mean 14.5 outpatient visits yearly (range, 1-49) in addition to monthly clinic contact for opioid prescription refills (Table 3). One patient entered long-term care. Three patients expired due to congestive heart failure, sepsis, and complications following a hip fracture. Of the patients who expired, all had advance directives or hospice care involvement. The VA STORM risk tool identifies the highest risk patients: suicide risk, current opioid or substance use disorder, suicide attempt or overdose during the past year, and potential for opioid-related respiratory depression on the RIOSORD scale. None of the panel patients met high-risk criteria on the Opioid Risk Tool assessment or were identified on the facility’s highest risk category by the STORM risk tool.
Medication Reduction
Pharmacists routinely counseled patients regarding the appropriate timing of refills and made monthly calls to request refills of controlled drugs. Three patients agreed to opioid dose reduction due to improved clinical status. Two patients had 25% and 30% dose reductions, respectively, and 1 patient was able to be discontinue opioids. This was achieved through reduction of therapy and or substitution of alternative nonopioid pain medications. One patient was initiated on a slow benzodiazepine taper schedule after decades of benzodiazepine use in addition to engagement with a whole health coach and primary care mental health integration provider. Another patient was disenrolled from the clinic because of repeated nonadherence and positive UDSs for polysubstance use disorder.
Accidental Overdoses
There were 2 patients with accidental overdoses who survived, both on high morphine equivalent daily doses (MEDDs). One patient was admitted to the intensive care unit for increasing confusion after taking more than the prescribed opioids (120 mg MEDD) due to uncontrolled pain for 2 months following surgery. The second patient was taking 66 mg MEDD with multiple risk factors for respiratory depression (severe chronic obstructive pulmonary disease requiring oxygen, obstructive sleep apnea, and concomitant benzodiazepine use) who repeatedly refused tapering of opioids and benzodiazepines. He was found unresponsive in respiratory depression by home health staff. Both patients had naloxone kits in their home that were not administered.
Urine Drug Screening
There was an occasional negative opioid UDS attributed to patients on a low-dose opioid administered more than 24 hours before. Five patients (10.4%) had positive UDSs. Two patients were positive for cocaine, and because of chronic persistent pain and complex medical problems cared for in the clinic, counseled and continued on therapy with no repeat infractions. Two patients were positive for cannabinoids attributed to CBD oil products, which are legal in Tennessee. One patient had repeated positive UDSs for polysubstance abuse and was terminated from the clinic, preferring to use cannabinoids and other substances illegally. Meperidine, fentanyl, tramadol, and other synthetic opioids are not detected on a routine UDS.
Discussion
Primary care is critical in optimizing the prescribing and use of opioids in older adults. The patient-centered medical home can give health care providers the tools and support to provide evidence—based pain management for their older adult patients and to facilitate prescription and monitoring of appropriate opioid use to minimizing AEs and OUD risk. This includes a reliable health information technology monitoring system as part of a collaborative, person-centered care practice capable of managing frail older patients with multiple chronic conditions as well as social risk factors. GeriPACT was able to implement guideline—based evaluation and treatment of chronic pain patients through optimal management of opioids, risk reduction, and monitoring and management of AEs, misuse, and dose tapering using shared decision-making strategies when appropriate.
Complex older patients on chronic opioid treatment can do well and are best managed by an interdisciplinary team. Our panel had a high prevalence of chronic opioid patients and a high expected mortality based on the severity of comorbidities. Patients had frequent access to care with utilization of many support services. Patients received care for many chronic illnesses at the same time they received opioid therapy and generally were satisfied and adherent to their treatment plan. Published reports of the prevalence of coprescribing of benzodiazepines and opioids of 1.1 to 2.7% in the general population, may be lower than our veteran population.14 Despite the fact that nearly 20% of the population had a history of opioid misuse, only 1 patient was terminated from the clinic because of repeated episodes of polysubstance use disorder.
GeriPACT has the capability to be responsive to the changing needs of older chronic pain patients as a learning health system using continuous process improvement with frequent team meetings and interdisciplinary care.15 Our experience with chronic pain management demonstrates the feasibility and quality of guideline-based management and enhances our understanding of the intersection of care, chronic pain management, and opioid use disorder in older adults.
Limitations
Our experience with this population of older veterans may not be applicable to other geriatric populations. While all patients received their primary care at VA and patients were seen regularly, our data may not account for possible use of some community services, including hospitalization and long-term care.
Conclusions
Guideline-based patient-centered medical home management of patients with chronic pain treated with opioids can be an effective model to maintain and improve measures of health and well-being in older patients. Primary care management is critical in optimizing the prescribing and use of opioids in older adults. These complex older patients are best managed by an interdisciplinary team.
Acknowledgments
This work was supported in part by the Geriatric Workforce Enhancement Program, HRSA Grant: 1-U1Q-HP 033085-01-00.
1. Weiss AJ, Heslin KC, Barrett ML, Izar R, Bierman AS. Opioid-related inpatient stays and emergency department visits among patients aged 65 years and older, 2010 and 2015: Statistical Brief #244. In: Healthcare Cost and Utilization Project (HCUP) Statistical Briefs. Rockville (MD): Agency for Healthcare Research and Quality (US); September 18, 2018.
2. Centers for Disease Control and Prevention. New data show significant changes in drug overdose deaths. Published March 18, 2020. Accessed March 11, 2021. https://www.cdc.gov/media/releases/2020/p0318-data-show-changes-overdose-deaths.html
3. Dahlhamer J, Lucas J, Zelaya C, et al. Prevalence of chronic pain and high-impact chronic pain among adults - United States, 2016. MMWR Morb Mortal Wkly Rep. 2018;67(36):1001-1006. Published 2018 Sep 14. doi:10.15585/mmwr.mm6736a2
4. National Institutes of Health, Interagency Pain Research Coordinating Committee. National pain strategy overview. Updated March 11, 2021. Accessed March 11, 2021. https://www.iprcc.nih.gov/national-pain-strategy-overview
5. Mojtabai R. National trends in long-term use of prescription opioids. Pharmacoepidemiol Drug Saf. 2018;27(5):526-534. doi:10.1002/pds.4278
6. US Department of Health and Human Services. Pain management best practices inter-agency task force report: updates, gaps, inconsistencies, and recommendations. Published May 9, 2019. Accessed March 17, 2021.https://www.hhs.gov/sites/default/files/pmtf-final-report-2019-05-23.pdf
7. Oliva EM, Bowe T, Tavakoli S, et al. Development and applications of the Veterans Health Administration’s Stratification Tool for Opioid Risk Mitigation (STORM) to improve opioid safety and prevent overdose and suicide. Psychol Serv. 2017;14(1):34-49. doi:10.1037/ser0000099
8. US Department of Veterans Affairs, Veterans Health Administration. Geriatric patient aligned care team (Geri-PACT). Published June 15, 2015. Accessed March 11, 2021. https://www.va.gov/vhapublications/ViewPublication.asp?pub_ID=3115
9. Webster LR, Webster RM. Predicting aberrant behaviors in opioid-treated patients: preliminary validation of the Opioid Risk Tool. Pain Med. 2005;6(6):432-442. doi:10.1111/j.1526-4637.2005.00072.x
10. Zedler B, Xie L, Wang L, et al. Development of a risk index for serious prescription opioid-induced respiratory depression or overdose in Veterans’ Health Administration patients. Pain Med. 2015;16(8):1566-1579. doi:10.1111/pme.12777
11. Wang L, Porter B, Maynard C, et al. Predicting risk of hospitalization or death among patients receiving primary care in the Veterans Health Administration. Med Care. 2013;51(4):368-373. doi:10.1097/MLR.0b013e31827da95a
12. Ogrinc G, Mooney SE, Estrada C, et al. The SQUIRE (Standards for QUality Improvement Reporting Excellence) guidelines for quality improvement reporting: explanation and elaboration. Qual Saf Health Care. 2008;17(suppl 1):i13-i32. doi:10.1136/qshc.2008.029058
13. Hempel S, Shekelle PG, Liu JL, et al. Development of the Quality Improvement Minimum Quality Criteria Set (QI-MQCS): a tool for critical appraisal of quality improvement intervention publications. BMJ Qual Saf. 2015;24(12):796-804. doi:10.1136/bmjqs-2014-003151
14. Rhee TG. Coprescribing of Benzodiazepines and Opioids in Older Adults: Rates, Correlates, and National Trends. J Gerontol A Biol Sci Med Sci. 2019;74(12):1910-1915. doi:10.1093/gerona/gly283
15. National Academy of Medicine. The Learning Healthcare System: Workshop Summary. The National Academies Press; 2007. doi:10.17226/11903.
The United States continues to confront an opioid crisis that also affects older adults. According to the Substance Abuse and Mental Health Services Administration from 1999 to 2010, there has been a 4-fold increase in opioid overdose deaths.1 Between 2010 and 2015, the rate of opioid-related inpatient stays and emergency department (ED) visits for people aged ≥ 65 years increased by 34% and 74%, respectively, and opioid-related overdose deaths continue to increase among older patients.1,2
Background
Chronic pain is estimated to affect 50 million US adults.3 Individuals receiving long-term opioid therapy may not have experienced relief with other medications or cannot take them for medical safety reasons. Losing access to opioid prescriptions can contribute to misuse of illicit opioids. Implementing best practices for prescription opioid management in older adults is challenging. Older adults have a high prevalence of chronic pain, which is linked to disability and loss of function, reduced mobility, falls, depression, anxiety, sleep disorders, social isolation, and suicide or suicidal ideation.4 Until recently, chronic pain in older adults was often treated primarily with long-term opioid prescriptions, despite little evidence for the effectiveness of that treatment for chronic conditions. The prevalence of long-term opioid use in adults has increased from 1.8% (1999-2000) to 5.4% (2013-2014), and 25% of adult long-term opioid users are aged ≥ 65 years.5
Older adults are especially vulnerable to developing adverse events (AEs) from opioid use, including constipation, confusion, nausea, falls, and overdose. These factors make safe prescribing more challenging even when opioids are an appropriate therapeutic choice. Older adults often have multiple chronic conditions and take multiple medications that increase risk of AEs due to drug-disease and drug-drug interactions. Finding appropriate alternatives for pain management can be challenging in the presence of dementia if other pharmacologic options are contraindicated or mobility issues limit access to other therapeutic options.
Pain treatment plans should be based on realistic functional goals using a shared decision-making approach accounting for patient and provider expectations. All reasonable nondrug and nonopioid treatments should be considered before opioids are initiated. A comprehensive, person-centered, approach to pain management in older adults that includes opioids, other medications, and complementary and integrative care could improve both pain control and function,and reduce the harms of unnecessary opioid exposure.6 A validated risk review should be performed and documented on all patients starting opioids except patients enrolled in hospice care.
In 2018, the US Department of Veterans Affairs (VA) required all facilities to complete case reviews for veterans identified in the Stratification Tool for Opioid Risk Mitigation (STORM) dashboard as being at particularly high risk for AEs among patients prescribed opioids.7 We present our experience with a 1-year management of 48 high-risk older patients receiving chronic prescription opioid therapy. These patients obtained all their care at the VA with complete record documentation.
Methods
The Tennessee Valley Healthcare System (TVHS) is an integrated VA health care system with > 100,000 veteran patients in middle Tennessee with 2 medical centers 40 miles apart, and 12 community-based outpatient clinics. In 2011, TVHS developed a geriatric patient-centered medical home model for geriatric primary care—the geriatric patient aligned care team (GeriPACT).8 GeriPACT consists of a GeriPACT primary care provider (geriatrician or geriatric nurse practitioner with a panel of about 800 outpatients), social worker, clinical pharmacist, registered nurse care manager, licensed vocational nurse, and clerical staff. GeriPACT is a special population PACT within primary care for complex geriatric and other high-risk vulnerable veterans providing integrated, interdisciplinary assessment and longitudinal management, and coordination of both VA and non-VA-funded (eg, Medicare and Medicaid) services for patients and caregivers. GeriPACT at the Nashville TVHS campus has an enrollment of 745 patients of whom 48 receive chronic prescription opioid therapy. The practice is supported by the VA Computerized Patients Record System (CPRS), including the electronic patient portal, My healtheVet, with telemedicine capabilities. Data were collected by chart review with operations data extracted from the Veterans Health Information System and Technology Architecture.
Best practices for prescription opioids for chronic pain follow the US Department of Health and Human Services Interagency Task Force pain management recommendations.4 These include: (1) Effective pain evaluation and management, including diagnostic evaluation and indicated referrals; (2) appropriately prescribed opioids when indicated; and (3) active management of opioid users to prevent AEs and misuse. Strategies used in GeriPACT were adopted from the pain management task force and designed to address needs and challenges associated with responsible chronic opioid prescribing (Table 1).
All 48 patients who were prescribed chronic opioid therapy received routine primary care at GeriPACT. A data tracking sheet was maintained from July 1, 2019 to June 30, 2020. Patients were presented for interdisciplinary collaboration and management at weekly GeriPACT where applicable continuous improvement processes were incorporated. Patients were seen every 3 to 6 months and offered dose reduction and alternative therapies at those times. All patients initiated monthly calls for medication refills and were monitored with an initial opioid contract and quarterly unannounced urine drug screens (UDSs) as well as a quarterly review of the prescription drug monitoring database (PDMD). Additionally, all patients received an Opioid Risk Tool assessment (scale 0-26; high risk ≥ 8) and a Risk Index for Overdose or Serious Opioid-Induced Respiratory Depression (RIOSORD) Score (scale 0-115).9,10 Patients with RIOSORD scores ≥ 25 (14% risk of opioid induced respiratory depression) were issued naloxone kits.
All VA patients additionally receive a risk stratification, the clinical assessment of need (CAN) score, which is a clinical predictor of hospitalization and death developed for VA populations.11 This methodology extracts predictors from 6 categories: social demographics, medical conditions, vital signs, prior year use of health services, medications, and laboratory tests and constructs logistic regression models to predict outcomes. CAN scores are on a 99-point scale, with higher scores corresponding to an increased probability of future health care events.
Our overall study was designed to meet standards for quality improvement reporting excellence (SQUIRE) criteria, and this report meets the quality improvement minimum quality criteria set (QI-MQCS) domains for reporting quality improvement work.12,13 The TVHS Institutional Review Board determined this study to be a quality improvement initiative.
Results
Chronic opioid patients comprised 6.4% of the GeriPACT population. These patients had many comorbidities, including diabetes mellitus (35%), pulmonary disease (25%), congestive heart failure (18.8%), and dementia (8%). There were 54% with estimated glomerular filtration rates (eGFR) < 60 mL/min, indicating at least stage 3 chronic kidney disease (Table 2). Patients had an average RIOSORD Score of 21 and a 14% risk of opioid induced respiratory depression, and 20% received mental health services.
The mean CAN score was 83.1, suggesting a 1-year risk of 20% for a major AE and 5% mortality risk. Many patients with chronic opioid use were transferred to GeriPACT from primary care due to presence of complex medical issues in addition to need for chronic pain management. In this population, 8% were coprescribed benzodiazepines and opioids. Consults were obtained from interventional pain for 37.5% of patients and palliative care for 27% of patients, the majority for goals of care related to chronic illness and advance directive discussions, and in 1 patient for pain and symptom management. The majority of patients (81%) had advance care planning documents or discussions documented in the electronic health record, and 87.5% of patients received home and community-based support in addition to GeriPACT care.
My healtheVet patient portal secure messaging was used a mean 2.1 times per patient (range 0-27) to maintain contact with GeriPACT providers and patients had a mean 14.5 outpatient visits yearly (range, 1-49) in addition to monthly clinic contact for opioid prescription refills (Table 3). One patient entered long-term care. Three patients expired due to congestive heart failure, sepsis, and complications following a hip fracture. Of the patients who expired, all had advance directives or hospice care involvement. The VA STORM risk tool identifies the highest risk patients: suicide risk, current opioid or substance use disorder, suicide attempt or overdose during the past year, and potential for opioid-related respiratory depression on the RIOSORD scale. None of the panel patients met high-risk criteria on the Opioid Risk Tool assessment or were identified on the facility’s highest risk category by the STORM risk tool.
Medication Reduction
Pharmacists routinely counseled patients regarding the appropriate timing of refills and made monthly calls to request refills of controlled drugs. Three patients agreed to opioid dose reduction due to improved clinical status. Two patients had 25% and 30% dose reductions, respectively, and 1 patient was able to be discontinue opioids. This was achieved through reduction of therapy and or substitution of alternative nonopioid pain medications. One patient was initiated on a slow benzodiazepine taper schedule after decades of benzodiazepine use in addition to engagement with a whole health coach and primary care mental health integration provider. Another patient was disenrolled from the clinic because of repeated nonadherence and positive UDSs for polysubstance use disorder.
Accidental Overdoses
There were 2 patients with accidental overdoses who survived, both on high morphine equivalent daily doses (MEDDs). One patient was admitted to the intensive care unit for increasing confusion after taking more than the prescribed opioids (120 mg MEDD) due to uncontrolled pain for 2 months following surgery. The second patient was taking 66 mg MEDD with multiple risk factors for respiratory depression (severe chronic obstructive pulmonary disease requiring oxygen, obstructive sleep apnea, and concomitant benzodiazepine use) who repeatedly refused tapering of opioids and benzodiazepines. He was found unresponsive in respiratory depression by home health staff. Both patients had naloxone kits in their home that were not administered.
Urine Drug Screening
There was an occasional negative opioid UDS attributed to patients on a low-dose opioid administered more than 24 hours before. Five patients (10.4%) had positive UDSs. Two patients were positive for cocaine, and because of chronic persistent pain and complex medical problems cared for in the clinic, counseled and continued on therapy with no repeat infractions. Two patients were positive for cannabinoids attributed to CBD oil products, which are legal in Tennessee. One patient had repeated positive UDSs for polysubstance abuse and was terminated from the clinic, preferring to use cannabinoids and other substances illegally. Meperidine, fentanyl, tramadol, and other synthetic opioids are not detected on a routine UDS.
Discussion
Primary care is critical in optimizing the prescribing and use of opioids in older adults. The patient-centered medical home can give health care providers the tools and support to provide evidence—based pain management for their older adult patients and to facilitate prescription and monitoring of appropriate opioid use to minimizing AEs and OUD risk. This includes a reliable health information technology monitoring system as part of a collaborative, person-centered care practice capable of managing frail older patients with multiple chronic conditions as well as social risk factors. GeriPACT was able to implement guideline—based evaluation and treatment of chronic pain patients through optimal management of opioids, risk reduction, and monitoring and management of AEs, misuse, and dose tapering using shared decision-making strategies when appropriate.
Complex older patients on chronic opioid treatment can do well and are best managed by an interdisciplinary team. Our panel had a high prevalence of chronic opioid patients and a high expected mortality based on the severity of comorbidities. Patients had frequent access to care with utilization of many support services. Patients received care for many chronic illnesses at the same time they received opioid therapy and generally were satisfied and adherent to their treatment plan. Published reports of the prevalence of coprescribing of benzodiazepines and opioids of 1.1 to 2.7% in the general population, may be lower than our veteran population.14 Despite the fact that nearly 20% of the population had a history of opioid misuse, only 1 patient was terminated from the clinic because of repeated episodes of polysubstance use disorder.
GeriPACT has the capability to be responsive to the changing needs of older chronic pain patients as a learning health system using continuous process improvement with frequent team meetings and interdisciplinary care.15 Our experience with chronic pain management demonstrates the feasibility and quality of guideline-based management and enhances our understanding of the intersection of care, chronic pain management, and opioid use disorder in older adults.
Limitations
Our experience with this population of older veterans may not be applicable to other geriatric populations. While all patients received their primary care at VA and patients were seen regularly, our data may not account for possible use of some community services, including hospitalization and long-term care.
Conclusions
Guideline-based patient-centered medical home management of patients with chronic pain treated with opioids can be an effective model to maintain and improve measures of health and well-being in older patients. Primary care management is critical in optimizing the prescribing and use of opioids in older adults. These complex older patients are best managed by an interdisciplinary team.
Acknowledgments
This work was supported in part by the Geriatric Workforce Enhancement Program, HRSA Grant: 1-U1Q-HP 033085-01-00.
1. Weiss AJ, Heslin KC, Barrett ML, Izar R, Bierman AS. Opioid-related inpatient stays and emergency department visits among patients aged 65 years and older, 2010 and 2015: Statistical Brief #244. In: Healthcare Cost and Utilization Project (HCUP) Statistical Briefs. Rockville (MD): Agency for Healthcare Research and Quality (US); September 18, 2018.
2. Centers for Disease Control and Prevention. New data show significant changes in drug overdose deaths. Published March 18, 2020. Accessed March 11, 2021. https://www.cdc.gov/media/releases/2020/p0318-data-show-changes-overdose-deaths.html
3. Dahlhamer J, Lucas J, Zelaya C, et al. Prevalence of chronic pain and high-impact chronic pain among adults - United States, 2016. MMWR Morb Mortal Wkly Rep. 2018;67(36):1001-1006. Published 2018 Sep 14. doi:10.15585/mmwr.mm6736a2
4. National Institutes of Health, Interagency Pain Research Coordinating Committee. National pain strategy overview. Updated March 11, 2021. Accessed March 11, 2021. https://www.iprcc.nih.gov/national-pain-strategy-overview
5. Mojtabai R. National trends in long-term use of prescription opioids. Pharmacoepidemiol Drug Saf. 2018;27(5):526-534. doi:10.1002/pds.4278
6. US Department of Health and Human Services. Pain management best practices inter-agency task force report: updates, gaps, inconsistencies, and recommendations. Published May 9, 2019. Accessed March 17, 2021.https://www.hhs.gov/sites/default/files/pmtf-final-report-2019-05-23.pdf
7. Oliva EM, Bowe T, Tavakoli S, et al. Development and applications of the Veterans Health Administration’s Stratification Tool for Opioid Risk Mitigation (STORM) to improve opioid safety and prevent overdose and suicide. Psychol Serv. 2017;14(1):34-49. doi:10.1037/ser0000099
8. US Department of Veterans Affairs, Veterans Health Administration. Geriatric patient aligned care team (Geri-PACT). Published June 15, 2015. Accessed March 11, 2021. https://www.va.gov/vhapublications/ViewPublication.asp?pub_ID=3115
9. Webster LR, Webster RM. Predicting aberrant behaviors in opioid-treated patients: preliminary validation of the Opioid Risk Tool. Pain Med. 2005;6(6):432-442. doi:10.1111/j.1526-4637.2005.00072.x
10. Zedler B, Xie L, Wang L, et al. Development of a risk index for serious prescription opioid-induced respiratory depression or overdose in Veterans’ Health Administration patients. Pain Med. 2015;16(8):1566-1579. doi:10.1111/pme.12777
11. Wang L, Porter B, Maynard C, et al. Predicting risk of hospitalization or death among patients receiving primary care in the Veterans Health Administration. Med Care. 2013;51(4):368-373. doi:10.1097/MLR.0b013e31827da95a
12. Ogrinc G, Mooney SE, Estrada C, et al. The SQUIRE (Standards for QUality Improvement Reporting Excellence) guidelines for quality improvement reporting: explanation and elaboration. Qual Saf Health Care. 2008;17(suppl 1):i13-i32. doi:10.1136/qshc.2008.029058
13. Hempel S, Shekelle PG, Liu JL, et al. Development of the Quality Improvement Minimum Quality Criteria Set (QI-MQCS): a tool for critical appraisal of quality improvement intervention publications. BMJ Qual Saf. 2015;24(12):796-804. doi:10.1136/bmjqs-2014-003151
14. Rhee TG. Coprescribing of Benzodiazepines and Opioids in Older Adults: Rates, Correlates, and National Trends. J Gerontol A Biol Sci Med Sci. 2019;74(12):1910-1915. doi:10.1093/gerona/gly283
15. National Academy of Medicine. The Learning Healthcare System: Workshop Summary. The National Academies Press; 2007. doi:10.17226/11903.
Lumbar Fusion With Polyetheretherketone Rods Use for Patients With Degenerative Disease
Surgical treatment of degenerative lumbar spine disease has been rising steadily in the United States, and an increasing fraction of surgery involves lumbar fusion.1,2 Various techniques are used to accomplish a lumbar fusion, including noninstrumented fusion, anterior lumbar interbody fusion (ALIF), lateral lumbar interbody fusion (XLIF, OLIF), posterior pedicle screw fusion, posterior cortical screw fusion, posterior interbody fusion (TLIF, PLIF), and interspinous process fusion. Rigid, metallic fusion hardware provides high stability and fusion rates, but it likely leads to stress shielding and adjacent segment disease.3 There is interest in less rigid and dynamic stabilization techniques to reduce the risk of adjacent segment disease, such as polyetheretherketone (PEEK) rods, which have been available since 2007. However, literature regarding PEEK rod utility is sparse and of mixed outcomes.3,4 Additional patient reported outcome (PRO) information would be useful to both surgeons and patients. Using institutional data, this review was designed to examine our experience with PEEK rod lumbar fusion and to document PROs.
Methods
The study was approved by the institutional review board at the US Department of Veterans Affairs (VA) Portland Health Care System (VAPHCS) in Oregon with a waiver of authorization. In this retrospective, single center study, data were queried from the senior author’s (DAR) case logs from VA Computerized Patient Record System (CPRS). Electronic medical records, imaging, and PROs of all consecutive patients undergoing lumbar fusion at 1 or 2 levels with PEEK rods for degenerative disease were retrospectively reviewed. Cases of trauma, malignancy, or infection were excluded. From March 2011 through October 2019, 108 patients underwent lumbar fusion with PEEK rods.
Surgeries were conducted on a Mizuho OSI Jackson Table via bilateral 3 to 4 cm Wiltse incisions using the Medtronic Quadrant retractor system. Medtronic O-Arm images were acquired and delivered to a Medtronic Stealth Station for navigation of the screws. Monopolar coagulation was not used. PEEK pedicle screws were placed and verified with a second O-Arm spin before placing lordotic PEEK rods in the screw heads. No attempt was made to reduce any spondylolisthesis, but distraction was used to open the foramina and indirectly decompress the canal. An interbody device was placed only in treatment of multiply recurrent disc protrusion. After decortication of the transverse processes and facets, intertransverse fusion constructs consisting of calcium hydroxyapatite soaked in autologous bone marrow blood and wrapped in 6-mg bone morphogenetic protein-soaked sponges were placed on the bone. If canal decompression was indicated, a Medtronic Metrx retractor tube was then placed through one of the incisions and decompression carried out. Wounds were closed with absorbable suture. No bracing was used postoperatively. Figure 1 shows a typical single level PEEK rod fusion construct.

Patient pre- and postoperative Short Form-36 (SF-36) physical function (PF) scores and Oswestry Disability Index (ODI) scores had been obtained at routine clinic visits.
Static radiographs were used to assess the fusion. Dynamic films and/or computed tomography (CT) scans were obtained only when symptomatic pseudarthrosis was suspected. Some patients had abdominal or lumbar CT scans for other indications, and these were reviewed when available. Particular care was taken to assess facet fusion as an indicator of arthrodesis (Figure 2).5

Statistical Analysis
Pre- and postoperative pairwise t tests were completed for patients with a complete data, using SAS 9.2 statistical package. Data are presented as standard deviation (SD) of the mean.
Results
Following application of the inclusion/exclusion criteria, 108 patients had undergone lumbar fusion with PEEK rods. Mean (SD) patient age was 60.2 (10.3) years and 88 patients were male (Table 1). Most surgeries were at L5-S1 and L4-5. There were 97 single-level fusions and 11 bilevel fusions. Seventy-four procedures were for spondylolisthesis, 23 for foraminal stenosis, 5 for degenerative disc disease, 3 for coronal imbalance with foraminal stenosis, 2 for pseudarthrosis after surgery elsewhere, and 1 for multiple recurrent disc herniation (Table 2). Twenty-five patients (23.1%) were current tobacco users and 28 (25.9%) were former smokers, 26 (24.1%) had diabetes mellitus (DM), 16 (14.8%) had low bone density by dual energy X-ray absorptiometry (DEXA) imaging, 35 (32.4%) had depression, and 7 (6.5%) were taking an immunosuppressive agent (chronic steroids, biological response modifiers, or methotrexate). Mean body mass index was 30.1.


Surgical Procedure
Of the 108 patients, the first 18 underwent a procedure with fluoroscopic guidance and the Medtronic FluoroNav and Stealth Systems. The next 90 patients underwent a procedure with O-Arm intraoperative CT scanning and Stealth frameless stereotactic navigation. The mean (SD) length of stay was 1.7 (1.3) days. There were no wound infections and no new neurologic deficits. Mean (SD) follow up time was 30.3 (21.8) months.
Imaging
Final imaging was by radiograph in 73 patients, CT in 31, and magnetic resonance imaging (MRI) in 3 (1 patient had no imaging). Sixty-seven patients (62.0%) had a bilateral arthrodesis, and 15 (13.9%) had at least a unilateral arthrodesis. MRI was not used to assess arthrodesis. Eight patients (7.4%) had no definite arthrodesis. Seventeen patients had inadequate or early imaging from which a fusion determination could not be made. Of 81 patients with > 11 months of follow up, 58 (71.6%) had a bilateral arthrodesis, 12 (14.8%) had a unilateral arthrodesis, 8 (9.9%) had no arthrodesis, and 3 (3.7%) were indeterminate.

No patient had any revision fusion surgery at the index level during follow up. Two patients had adjacent level fusions at 27 and 60 months after the index procedure. One patient had a laminectomy at an adjacent segment at 18 months postfusion, and 1 had a foraminotomy at an adjacent segment 89 months post fusion (Figure 3). Overall, there were 4 (3.7%) adjacent segment surgeries at a mean of 48.5 months after surgery. One patient had a sacro-iliac joint fusion below an L5-S1 fusion 17 months prior for persisting pain after the fusion procedure.
Patient Reported Outcomes
Preoperative SF-36 PF and ODI scores were available for 81 patients (Table 3). Postoperative SF-36 PF scores were obtained at 3 months for 65 of these patients, and at 1 year for 63 patients. Postoperative ODI scores were obtained at 3 months for 65 patients, and at 1 year for 55 patients. Among the 65 patients with completed SF-36 scores at 3 months, a mean increase of 22.4 (95% CI, 17-27; P < .001) was noted, and for the 63 patients at 1 year a mean increase of 30.3 (95% CI, 25-35; P < .001) was noted. Among the 65 patients with completed ODI scores at 3 months, a mean decrease of 6.8 (95% CI, 4.9-8.6; P < .001) was noted, and for the 55 patients with completed ODI scores at 1 year a mean decrease of 10.3 (n = 55; 95% CI, 8.4-12.2; P < .001) was noted.

Cost
We compared the hardware cost of a single level construct consisting of 4 pedicle screws, 4 locking caps, and 2 rods using a PEEK system with that of 2 other titanium construct systems. At VAPHCS, the PEEK system cost was about 71% of the cost of 2 other titanium construct systems and 62% of the cost when compared with Medtronic titanium rods.
Discussion
PEEK is useful for spine and cranial implants. It is inert and fully biocompatible with a modulus of elasticity between that of cortical and cancellous bone, and much lower than that of titanium, and is therefore considered to be semirigid.3,4,6 PEEK rods are intermediate in stiffness between titanium rods (110 Gigapascals) and dynamic devices such as the Zimmer Biomet DYNESYS dynamic stabilization system or the Premia Spine TOPS system.3 Carbon fiber rods and carbon fiber reinforced PEEK implants are other semirigid rod alternatives.7,8 PEEK rods for posterior lumbar fusion surgery were introduced in 2007. Li and colleagues provide a thorough review of the biomechanical properties of PEEK rods.3
PEEK is thought to have several advantages when compared with titanium. These advantages include more physiologic load sharing and reduction in stress shielding, improved durability, reduced risk of failure in osteoporotic bone, less wear debris, no change in bone forming environment, and imaging radiolucency.4,9 Spinal PEEK cages have been reported to allow more uniform radiation dose distribution compared with metal constructs, an advantage that also may pertain to PEEK rods.10 Disadvantages of PEEK rods include an inability to detect rod breakage easily, lack of data on the use in more than minimally unstable clinical situations, and greater expense, although this was not the authors’ observation.3,4,11
Importantly, it has been reported that PEEK rods permit a greater range of motion in all planes when compared with titanium rods.9 Polyetheretherketone rods unload the bone screw interface and increased the anterior column load to a more physiologic 75% when compared with titanium rods.6,9 However, in another biomechanical study that compared titanium rods, PEEK rods, and a dynamic stabilization device, it was reported that anterior load sharing was 55%, 59%, and 75%, respectively.12 This indicated that PEEK rods are closer to metal rods than truly dynamic devices for anterior load sharing. The endurance limit of a PEEK rod construct was similar to that of clinically useful metal systems.9 PEEK rods resulted in no increase in postfatigue motion compared with titanium rods in a biomechanical model.13 Intradiscal pressures at PEEK instrumented segments were similar to uninstrumented segments and greater than those with titanium rod constructs.14 Intradiscal pressures at adjacent segments were highest with dynamic devices, intermediate with semirigid rods, and lowest with rigid constructs; however, stress values at adjacent segments were lower in PEEK than titanium constructs in any direction of motion.15,16
Fusion Rates
The use of PEEK rods in lumbar fusion has been reported previously.3,4,17,18 However, these studies featured small sample sizes, short follow up times, and contradictory results.4 Of 8 outcome reports found in a systematic review, 2 studies reported on procedures designed to create nonfusion outcomes (a third similar trial from 2013 was not included in the systematic review), and 1 study reported only on the condition of PEEK rods removed at subsequent surgery.3,19-21 Reported fusion rates varied from 86 to 100%.
In 42 patients with PEEK rod fusions who were followed for a mean of 31.4 months, 5 patients required adjacent segment surgery and 3 patients were treated for interbody cage migration and nonunion.17 Radiographic fusion rate was 86%. These authors concluded that PEEK rod fusion results were similar to those of other constructs, but not better, or perhaps worse than, metal rods.
Other studies have reported better results with PEEK.11,18,19,22-24 Highsmith and colleagues reported on 3 successful example cases of the use of PEEK rods.11 De Iure and colleagues reported on 30 cases up to 5 levels (mean, 2.9) using autograft bone, with a mean follow up of 18 months.23 Results were reported as satisfactory. Three patients had radiographic nonunions, 1 of which required revision for asymptomatic screw loosening at the cranial end of the construct. Qi and colleagues, reported on 20 patients with PEEK rods compared to 21 patients with titanium alloy rods.24 Both groups had similar clinical outcomes, structural parameters, and 100% fusion rates. Athanasakopoulos and colleagues reported on 52 patients with up to 3 level fusions followed for a mean of 3 years.22 There were significant improvements in PROs: at 1 year 96% had radiographic union. Two patients had screw breakage, 1 of whom required revision to a metal rod construct. Colangeli and colleagues reported on 12 patients treated with PEEK rods compared with 12 who were treated with a dynamic system.18 They reported significant improvements, no complications, and 100% fusion at 6 months. Huang and colleagues reported on 38 patients intended to undergo a nonfusion procedure with 2 years of follow up.19 They reported good outcomes and 1 case of screw loosening. As no fusion was intended, no fusion outcomes were reported. All these studies suggested that longer follow up and more patients would be needed to assess the role of PEEK rods in lumbar fusion.3
Our results show a radiographic fusion rate of 86.4% and a radiographic nonunion rate of 9.9% in patients followed for at least 12 months. There was no clinical need for revision fusion at the index level. In our retrospective review, patients had high levels of smoking, DM, depression, immunosuppression, and obesity, which may negatively influence radiographic fusion rates when compared with other studies with 100% reported fusion rates. There was no instance of construct breakage or screw breakout, indicating that PEEK rods may allow enough flexibility to avoid construct failure under stress as in a fall.
Patient Reported Outcomes
Recent large studies were reviewed to assess the pre- and postoperative patient PROs reported in comparison with our study population (Table 4). In the Swedish Spine Registry analysis of 765 patients with 3 different types of lumbar fusion, the mean preoperative ODI score was 37 and mean SF-36 physical component score (PCS) was 35 for the most similar approach (posterolateral fusion with instrumentation).25 At 1 year postoperation, the mean ODI was 26 and mean SF-36 PCS was 43. In the Spine Patient Outcomes Research Trial (SPORT) spondylolisthesis trial of 3 fusion types, the mean preoperative ODI was 41.2 and mean SF-36 PF score was 31.2 for the most similar approach (posterolateral instrumented fusion with pedicle screws).26 Postoperative ODI scores at 1 year decreased by a mean 20.9 points and mean SF-36 PF scores increased by 29.9.

We report a mean preoperative SF-36 PF score of 28.9, which is lower than the SPORT study score for posterolateral fusion with instrumentation and the Swedish Study score for posterolateral instrumented fusion with pedicle screws. Similarly, our mean ODI score of 24.8 was better than the scores reported in the Swedish and SPORT studies. Our mean SF-36 PF score at 1 year postoperation was 59.3, compared with 58.5 for the SPORT study group and 46.0 in the Swedish study group. Mean ODI score at 1 year postoperatively was 14.5, which is better than the scores reported in the Swedish and SPORT studies.
Minimally clinically important difference (MCID) is a parameter used to gauge the efficacy of spine surgery. The utility of the MCID based upon PROs has been questioned in lumbar fusion surgery, as it has been thought to measure if the patient is “feeling” rather than “doing” better, the latter of which can be better measured by functional performance measures and objective, external socioeconomic anchors such as return to work and health care costs.27 Nevertheless, validated PROs are reported widely in the spine surgery literature. The MCID in the SF-36 is not well established and can depend upon whether the scores are at the extremes or more in the central range and whether there is large variability in the scores.28 Rheumatoid arthritis was estimated to be 7.1 points on the PF scale and 7.2 on the physical component summary (PCS).29 For total knee replacement, it has been estimated to be 10 points on the SF-36 PCS.30 Lumbar surgery was estimated to be 4.9 points for the SF-36 PCS and 12.8 points for the ODI.31 And the SPORT trial it has been estimated that a 30% change in the possible gain (or loss) may be an appropriate criterion.28
With a preoperative mean SF-36 PF of 28.9, a 30% improvement in the available range (70.1) would be 21 points, making our data mean improvement of 30 points above the MCID. With a mean preoperative ODI of 24.6, a 30% improvement in the available range (25.4) would be 7.6 points, making our data mean improvement of 10.3 points better than the MCID. Therefore, our outcome results are comparable with other lumbar fusion outcome studies in terms of degree of disability prior to surgery and amount of improvement from surgery.
Adjacent Segment Disease
The precise factors resulting in adjacent segment disease are not fully defined.3,32 In reviews of lumbar adjacent segment disease, reported rates ranged from 2.5% at 1 year up to 80 to 100% at 10 years, with lower rates with noninstrumented fusions.4,32-34 Annual incidence of symptomatic adjacent segment disease following lumbar fusion ranges from 0.6 to 3.9% per year.32,35,36 Mismatch between lumbar lordosis and pelvic incidence after fusion is thought to lead to higher rates of adjacent segment disease, as can a laminectomy at an adjacent segment.32,36 Percutaneous fusion techniques or use of the Wiltse approach may lower the risk of adjacent segment disease due to avoidance of facet capsule disruption.37,38
Dynamic stabilization techniques do not appear be clearly protective against adjacent segment disease, although biomechanical models suggest that they may do so.33,39,40 A review by Wang and colleagues pooled studies to assess the risk of lumbar adjacent segment disease in spinal fusion to compare to disc arthroplasty and concluded that fusion carried a higher risk of adjacent segment disease.41 Definitive data on other types of motion preservation devices is lacking.3We show 3 adjacent segment fusions and 1 laminectomy have been needed in 108 patients and at a mean of 46 months after the index procedure and over 2.5 years of mean overall follow up. This is a low adjacent segment surgery rate compared to the historical data cited above, and may suggest some advantage for PEEK rods over more rigid constructs.
Strengths and Limitations
Strengths of this study include larger numbers than prior series of PEEK rod use and use in a population with high comorbidities linked to poor results without reduction in good outcomes. PEEK rods as used at the VAPHCS do not result in higher instrumentation costs than all metal constructs.
Study limitations include the retrospective nature with loss of follow up on some patients and incomplete radiographic and PROs in some patients. The use of 100% stereotactic guidance, the avoidance of interbody devices, and the off-label use of bone morphogenetic protein as part of the fusion construct introduce additional variables that may influence comparison to other studies. To avoid unnecessary radiation exposure, flexion extension films or CT scans were not routinely obtained if patients were doing well.42 Additionally, the degree of motion on dynamic views that would differentiate pseudarthrosis from arthrodesis has not been defined.5
Conclusions
The results presented show that lumbar fusion with PEEK rods can be undertaken with short hospitalization times and low complication rates, produce satisfactory clinical improvements, and result in radiographic fusion rates similar to metal constructs. Low rates of hardware failure or need for revision surgery were found. Preliminarily results of low rates of adjacent segment surgery are comparable with previously published metal construct rates. Longer follow up is needed to confirm these findings and to investigate whether semirigid constructs truly offer some protection from adjacent segment disease when compared to all metal constructs.
Acknowledgments
The authors thank Shirley McCartney, PhD, for editorial assistance.
1. Deyo RA, Mirza SK, Martin BI, Kreuter W, Goodman DC, Jarvik JG. Trends, major medical complications, and charges associated with surgery for lumbar spinal stenosis in older adults. JAMA. 2010;303(13):1259-1265. doi:10.1001/jama.2010.338
2. Machado GC, Maher CG, Ferreira PH, et al. Trends, complications, and costs for hospital admission and surgery for lumbar spinal stenosis. Spine (Phila Pa 1976). 2017;42(22):1737-1743. doi:10.1097/BRS.0000000000002207
3. Li C, Liu L, Shi JY, Yan KZ, Shen WZ, Yang ZR. Clinical and biomechanical researches of polyetheretherketone (PEEK) rods for semi-rigid lumbar fusion: a systematic review. Neurosurg Rev. 2018;41(2):375-389. doi:10.1007/s10143-016-0763-2
4. Mavrogenis AF, Vottis C, Triantafyllopoulos G, Papagelopoulos PJ, Pneumaticos SG. PEEK rod systems for the spine. Eur J Orthop Surg Traumatol. 2014;24 Suppl 1:S111-S116. doi:10.1007/s00590-014-1421-4
5. Choudhri TF, Mummaneni PV, Dhall SS, et al. Guideline update for the performance of fusion procedures for degenerative disease of the lumbar spine. Part 4: radiographic assessment of fusion status. J Neurosurg Spine. 2014;21(1):23-30. doi:10.3171/2014.4.SPINE14267
6. Ahn YH, Chen WM, Lee KY, Park KW, Lee SJ. Comparison of the load-sharing characteristics between pedicle-based dynamic and rigid rod devices. Biomed Mater. 2008;3(4):044101. doi:10.1088/1748-6041/3/4/044101
7. Ozer AF, Cevik OM, Erbulut DU, et al. A novel modular dynamic stabilization system for the treatment of degenerative spinal pathologies. Turk Neurosurg. 2019;29(1):115-120. doi:10.5137/1019-5149.JTN.23227-18.1
8. Hak DJ, Mauffrey C, Seligson D, Lindeque B. Use of carbon-fiber-reinforced composite implants in orthopedic surgery. Orthopedics. 2014;37(12):825-830. doi:10.3928/01477447-20141124-05
9. Gornet MF, Chan FW, Coleman JC, et al. Biomechanical assessment of a PEEK rod system for semi-rigid fixation of lumbar fusion constructs. J Biomech Eng. 2011;133(8):081009. doi:10.1115/1.4004862
10. Jackson JB 3rd, Crimaldi AJ, Peindl R, Norton HJ, Anderson WE, Patt JC. Effect of polyether ether ketone on therapeutic radiation to the spine: a pilot study. Spine (Phila Pa 1976). 2017;42(1):E1-E7. doi:10.1097/BRS.0000000000001695
11. Highsmith JM, Tumialán LM, Rodts GE Jr. Flexible rods and the case for dynamic stabilization. Neurosurg Focus. 2007;22(1):E11. Published 2007 Jan 15. doi:10.3171/foc.2007.22.1.11
12. Sengupta DK, Bucklen B, McAfee PC, Nichols J, Angara R, Khalil S. The comprehensive biomechanics and load-sharing of semirigid PEEK and semirigid posterior dynamic stabilization systems. Adv Orthop. 2013;2013:745610. doi:10.1155/2013/745610
13. Agarwal A, Ingels M, Kodigudla M, Momeni N, Goel V, Agarwal AK. Adjacent-level hypermobility and instrumented-level fatigue loosening with titanium and PEEK rods for a pedicle screw system: an in vitro study. J Biomech Eng. 2016;138(5):051004. doi:10.1115/1.4032965
14. Chou WK, Chien A, Wang JL. Biomechanical analysis between PEEK and titanium screw-rods spinal construct subjected to fatigue loading. J Spinal Disord Tech. 2015;28(3):E121-E125. doi:10.1097/BSD.0000000000000176
15. Shih KS Hsu CC, Zhou SY, Hou SM. Biomechanical investigation of pedicle screw-based posterior stabilization systems for the treatment of lumbar degenerative disc disease using finite element analyses. Biomed Eng: Appl Basis Commun. 2015;27(06):1550060. doi: 10.4015/S101623721550060X

16. Chang TK, Huang CH, Liu YC, et al. Biomechanical evaluation and comparison of polyetheretherketone rod system to traditional titanium rod fixation on adjacent levels. Formosan J Musculoskeletal Disord. 2013;4(2):42-47. doi: 10.1016/j.fjmd.2013.04.003
17. Ormond DR, Albert L Jr, Das K. Polyetheretherketone (PEEK) rods in lumbar spine degenerative disease: a case series. Clin Spine Surg. 2016;29(7):E371-E375. doi:10.1097/BSD.0b013e318277cb9b
18. Colangeli S, Barbanti Brodàno G, Gasbarrini A, et al. Polyetheretherketone (PEEK) rods: short-term results in lumbar spine degenerative disease. J Neurosurg Sci. 2015;59(2):91-96.
19. Huang W, Chang Z, Song R, Zhou K, Yu X. Non-fusion procedure using PEEK rod systems for lumbar degenerative diseases: clinical experience with a 2-year follow-up. BMC Musculoskelet Disord. 2016;17:53. Published 2016 Feb 1. doi:10.1186/s12891-016-0913-2
20. Wang C-J, Graf H, Wei H-W. Clinical outcomes of the dynamic lumbar pedicle screw-rod stabilization. Neurosurg Q. 2016;26(3):214-218. doi:10.1097/WNQ.0000000000000169
21. Kurtz SM, Lanman TH, Higgs G, et al. Retrieval analysis of PEEK rods for posterior fusion and motion preservation. Eur Spine J. 2013;22(12):2752-2759. doi:10.1007/s00586-013-2920-4
22. Athanasakopoulos M, Mavrogenis AF, Triantafyllopoulos G, Koufos S, Pneumaticos SG. Posterior spinal fusion using pedicle screws. Orthopedics. 2013;36(7):e951-e957. doi:10.3928/01477447-20130624-28
23. De Iure F, Bosco G, Cappuccio M, Paderni S, Amendola L. Posterior lumbar fusion by peek rods in degenerative spine: preliminary report on 30 cases. Eur Spine J. 2012;21 Suppl 1(Suppl 1):S50-S54. doi:10.1007/s00586-012-2219-x
24. Qi L, Li M, Zhang S, Xue J, Si H. Comparative effectiveness of PEEK rods versus titanium alloy rods in lumbar fusion: a preliminary report. Acta Neurochir (Wien). 2013;155(7):1187-1193. doi:10.1007/s00701-013-1772-3
25. Endler P, Ekman P, Möller H, Gerdhem P. Outcomes of posterolateral fusion with and without instrumentation and of interbody fusion for isthmic spondylolisthesis: a prospective study. J Bone Joint Surg Am. 2017;99(9):743-752. doi:10.2106/JBJS.16.00679
26. Abdu WA, Lurie JD, Spratt KF, et al. Degenerative spondylolisthesis: does fusion method influence outcome? Four-year results of the spine patient outcomes research trial. Spine (Phila Pa 1976). 2009;34(21):2351-2360. doi:10.1097/BRS.0b013e3181b8a829
27. Gatchel RJ, Mayer TG, Chou R. What does/should the minimum clinically important difference measure? A reconsideration of its clinical value in evaluating efficacy of lumbar fusion surgery. Clin J Pain. 2012;28(5):387-397. doi:10.1097/AJP.0b013e3182327f20
28. Spratt KF. Patient-level minimal clinically important difference based on clinical judgment and minimally detectable measurement difference: a rationale for the SF-36 physical function scale in the SPORT intervertebral disc herniation cohort. Spine (Phila Pa 1976). 2009;34(16):1722-1731. doi:10.1097/BRS.0b013e3181a8faf2
29. Ward MM, Guthrie LC, Alba MI. Clinically important changes in short form 36 health survey scales for use in rheumatoid arthritis clinical trials: the impact of low responsiveness. Arthritis Care Res (Hoboken). 2014;66(12):1783-1789. doi:10.1002/acr.22392
30. Escobar A, Quintana JM, Bilbao A, Aróstegui I, Lafuente I, Vidaurreta I. Responsiveness and clinically important differences for the WOMAC and SF-36 after total knee replacement. Osteoarthritis Cartilage. 2007;15(3):273-280. doi:10.1016/j.joca.2006.09.001
31. Copay AG, Glassman SD, Subach BR, Berven S, Schuler TC, Carreon LY. Minimum clinically important difference in lumbar spine surgery patients: a choice of methods using the Oswestry Disability Index, Medical Outcomes Study questionnaire Short Form 36, and pain scales. Spine J. 2008;8(6):968-974. doi:10.1016/j.spinee.2007.11.006
32. Radcliff KE, Kepler CK, Jakoi A, et al. Adjacent segment disease in the lumbar spine following different treatment interventions. Spine J. 2013;13(10):1339-1349. doi:10.1016/j.spinee.2013.03.020
33. Epstein NE. Adjacent level disease following lumbar spine surgery: a review. Surg Neurol Int. 2015;6(Suppl 24):S591-S599. Published 2015 Nov 25. doi:10.4103/2152-7806.170432
34. Epstein NE. A review: reduced reoperation rate for multilevel lumbar laminectomies with noninstrumented versus instrumented fusions. Surg Neurol Int. 2016;7(Suppl 13):S337-S346. Published 2016 May 17. doi:10.4103/2152-7806.182546
35. Scemama C, Magrino B, Gillet P, Guigui P. Risk of adjacent-segment disease requiring surgery after short lumbar fusion: results of the French Spine Surgery Society Series. J Neurosurg Spine. 2016;25(1):46-51. doi:10.3171/2015.11.SPINE15700
36. Tempel ZJ, Gandhoke GS, Bolinger BD, et al. The influence of pelvic incidence and lumbar lordosis mismatch on development of symptomatic adjacent level disease following single-level transforaminal lumbar interbody fusion. Neurosurgery. 2017;80(6):880-886. doi:10.1093/neuros/nyw073
37. Cheng YW, Chang PY, Wu JC, et al. Letter to the editor: Pedicle screw-based dynamic stabilization and adjacent-segment disease. J Neurosurg Spine. 2017;26(3):405-406. doi:10.3171/2016.7.SPINE16816
38. Street JT, Andrew Glennie R, Dea N, et al. A comparison of the Wiltse versus midline approaches in degenerative conditions of the lumbar spine. J Neurosurg Spine. 2016;25(3):332-338. doi:10.3171/2016.2.SPINE151018
39. Kuo CH, Huang WC, Wu JC, et al. Radiological adjacent-segment degeneration in L4-5 spondylolisthesis: comparison between dynamic stabilization and minimally invasive transforaminal lumbar interbody fusion. J Neurosurg Spine. 2018;29(3):250-258. doi:10.3171/2018.1.SPINE17993
40. Lee CH, Kim YE, Lee HJ, Kim DG, Kim CH. Biomechanical effects of hybrid stabilization on the risk of proximal adjacent-segment degeneration following lumbar spinal fusion using an interspinous device or a pedicle screw-based dynamic fixator. J Neurosurg Spine. 2017;27(6):643-649. doi:10.3171/2017.3.SPINE161169
41. Wang JC, Arnold PM, Hermsmeyer JT, Norvell DC. Do lumbar motion preserving devices reduce the risk of adjacent segment pathology compared with fusion surgery? A systematic review. Spine (Phila Pa 1976). 2012;37(22 Suppl):S133-S143. doi:10.1097/BRS.0b013e31826cadf2
42. Ross DA. Letter to the editor: steroid use in anterior cervical discectomy and fusion. J Neurosurg Spine. 2016;24(6):998-1000. doi:10.3171/2015.9.SPINE151052
Surgical treatment of degenerative lumbar spine disease has been rising steadily in the United States, and an increasing fraction of surgery involves lumbar fusion.1,2 Various techniques are used to accomplish a lumbar fusion, including noninstrumented fusion, anterior lumbar interbody fusion (ALIF), lateral lumbar interbody fusion (XLIF, OLIF), posterior pedicle screw fusion, posterior cortical screw fusion, posterior interbody fusion (TLIF, PLIF), and interspinous process fusion. Rigid, metallic fusion hardware provides high stability and fusion rates, but it likely leads to stress shielding and adjacent segment disease.3 There is interest in less rigid and dynamic stabilization techniques to reduce the risk of adjacent segment disease, such as polyetheretherketone (PEEK) rods, which have been available since 2007. However, literature regarding PEEK rod utility is sparse and of mixed outcomes.3,4 Additional patient reported outcome (PRO) information would be useful to both surgeons and patients. Using institutional data, this review was designed to examine our experience with PEEK rod lumbar fusion and to document PROs.
Methods
The study was approved by the institutional review board at the US Department of Veterans Affairs (VA) Portland Health Care System (VAPHCS) in Oregon with a waiver of authorization. In this retrospective, single center study, data were queried from the senior author’s (DAR) case logs from VA Computerized Patient Record System (CPRS). Electronic medical records, imaging, and PROs of all consecutive patients undergoing lumbar fusion at 1 or 2 levels with PEEK rods for degenerative disease were retrospectively reviewed. Cases of trauma, malignancy, or infection were excluded. From March 2011 through October 2019, 108 patients underwent lumbar fusion with PEEK rods.
Surgeries were conducted on a Mizuho OSI Jackson Table via bilateral 3 to 4 cm Wiltse incisions using the Medtronic Quadrant retractor system. Medtronic O-Arm images were acquired and delivered to a Medtronic Stealth Station for navigation of the screws. Monopolar coagulation was not used. PEEK pedicle screws were placed and verified with a second O-Arm spin before placing lordotic PEEK rods in the screw heads. No attempt was made to reduce any spondylolisthesis, but distraction was used to open the foramina and indirectly decompress the canal. An interbody device was placed only in treatment of multiply recurrent disc protrusion. After decortication of the transverse processes and facets, intertransverse fusion constructs consisting of calcium hydroxyapatite soaked in autologous bone marrow blood and wrapped in 6-mg bone morphogenetic protein-soaked sponges were placed on the bone. If canal decompression was indicated, a Medtronic Metrx retractor tube was then placed through one of the incisions and decompression carried out. Wounds were closed with absorbable suture. No bracing was used postoperatively. Figure 1 shows a typical single level PEEK rod fusion construct.
Patient pre- and postoperative Short Form-36 (SF-36) physical function (PF) scores and Oswestry Disability Index (ODI) scores had been obtained at routine clinic visits.
Static radiographs were used to assess the fusion. Dynamic films and/or computed tomography (CT) scans were obtained only when symptomatic pseudarthrosis was suspected. Some patients had abdominal or lumbar CT scans for other indications, and these were reviewed when available. Particular care was taken to assess facet fusion as an indicator of arthrodesis (Figure 2).5
Statistical Analysis
Pre- and postoperative pairwise t tests were completed for patients with a complete data, using SAS 9.2 statistical package. Data are presented as standard deviation (SD) of the mean.
Results
Following application of the inclusion/exclusion criteria, 108 patients had undergone lumbar fusion with PEEK rods. Mean (SD) patient age was 60.2 (10.3) years and 88 patients were male (Table 1). Most surgeries were at L5-S1 and L4-5. There were 97 single-level fusions and 11 bilevel fusions. Seventy-four procedures were for spondylolisthesis, 23 for foraminal stenosis, 5 for degenerative disc disease, 3 for coronal imbalance with foraminal stenosis, 2 for pseudarthrosis after surgery elsewhere, and 1 for multiple recurrent disc herniation (Table 2). Twenty-five patients (23.1%) were current tobacco users and 28 (25.9%) were former smokers, 26 (24.1%) had diabetes mellitus (DM), 16 (14.8%) had low bone density by dual energy X-ray absorptiometry (DEXA) imaging, 35 (32.4%) had depression, and 7 (6.5%) were taking an immunosuppressive agent (chronic steroids, biological response modifiers, or methotrexate). Mean body mass index was 30.1.
Surgical Procedure
Of the 108 patients, the first 18 underwent a procedure with fluoroscopic guidance and the Medtronic FluoroNav and Stealth Systems. The next 90 patients underwent a procedure with O-Arm intraoperative CT scanning and Stealth frameless stereotactic navigation. The mean (SD) length of stay was 1.7 (1.3) days. There were no wound infections and no new neurologic deficits. Mean (SD) follow up time was 30.3 (21.8) months.
Imaging
Final imaging was by radiograph in 73 patients, CT in 31, and magnetic resonance imaging (MRI) in 3 (1 patient had no imaging). Sixty-seven patients (62.0%) had a bilateral arthrodesis, and 15 (13.9%) had at least a unilateral arthrodesis. MRI was not used to assess arthrodesis. Eight patients (7.4%) had no definite arthrodesis. Seventeen patients had inadequate or early imaging from which a fusion determination could not be made. Of 81 patients with > 11 months of follow up, 58 (71.6%) had a bilateral arthrodesis, 12 (14.8%) had a unilateral arthrodesis, 8 (9.9%) had no arthrodesis, and 3 (3.7%) were indeterminate.
No patient had any revision fusion surgery at the index level during follow up. Two patients had adjacent level fusions at 27 and 60 months after the index procedure. One patient had a laminectomy at an adjacent segment at 18 months postfusion, and 1 had a foraminotomy at an adjacent segment 89 months post fusion (Figure 3). Overall, there were 4 (3.7%) adjacent segment surgeries at a mean of 48.5 months after surgery. One patient had a sacro-iliac joint fusion below an L5-S1 fusion 17 months prior for persisting pain after the fusion procedure.
Patient Reported Outcomes
Preoperative SF-36 PF and ODI scores were available for 81 patients (Table 3). Postoperative SF-36 PF scores were obtained at 3 months for 65 of these patients, and at 1 year for 63 patients. Postoperative ODI scores were obtained at 3 months for 65 patients, and at 1 year for 55 patients. Among the 65 patients with completed SF-36 scores at 3 months, a mean increase of 22.4 (95% CI, 17-27; P < .001) was noted, and for the 63 patients at 1 year a mean increase of 30.3 (95% CI, 25-35; P < .001) was noted. Among the 65 patients with completed ODI scores at 3 months, a mean decrease of 6.8 (95% CI, 4.9-8.6; P < .001) was noted, and for the 55 patients with completed ODI scores at 1 year a mean decrease of 10.3 (n = 55; 95% CI, 8.4-12.2; P < .001) was noted.
Cost
We compared the hardware cost of a single level construct consisting of 4 pedicle screws, 4 locking caps, and 2 rods using a PEEK system with that of 2 other titanium construct systems. At VAPHCS, the PEEK system cost was about 71% of the cost of 2 other titanium construct systems and 62% of the cost when compared with Medtronic titanium rods.
Discussion
PEEK is useful for spine and cranial implants. It is inert and fully biocompatible with a modulus of elasticity between that of cortical and cancellous bone, and much lower than that of titanium, and is therefore considered to be semirigid.3,4,6 PEEK rods are intermediate in stiffness between titanium rods (110 Gigapascals) and dynamic devices such as the Zimmer Biomet DYNESYS dynamic stabilization system or the Premia Spine TOPS system.3 Carbon fiber rods and carbon fiber reinforced PEEK implants are other semirigid rod alternatives.7,8 PEEK rods for posterior lumbar fusion surgery were introduced in 2007. Li and colleagues provide a thorough review of the biomechanical properties of PEEK rods.3
PEEK is thought to have several advantages when compared with titanium. These advantages include more physiologic load sharing and reduction in stress shielding, improved durability, reduced risk of failure in osteoporotic bone, less wear debris, no change in bone forming environment, and imaging radiolucency.4,9 Spinal PEEK cages have been reported to allow more uniform radiation dose distribution compared with metal constructs, an advantage that also may pertain to PEEK rods.10 Disadvantages of PEEK rods include an inability to detect rod breakage easily, lack of data on the use in more than minimally unstable clinical situations, and greater expense, although this was not the authors’ observation.3,4,11
Importantly, it has been reported that PEEK rods permit a greater range of motion in all planes when compared with titanium rods.9 Polyetheretherketone rods unload the bone screw interface and increased the anterior column load to a more physiologic 75% when compared with titanium rods.6,9 However, in another biomechanical study that compared titanium rods, PEEK rods, and a dynamic stabilization device, it was reported that anterior load sharing was 55%, 59%, and 75%, respectively.12 This indicated that PEEK rods are closer to metal rods than truly dynamic devices for anterior load sharing. The endurance limit of a PEEK rod construct was similar to that of clinically useful metal systems.9 PEEK rods resulted in no increase in postfatigue motion compared with titanium rods in a biomechanical model.13 Intradiscal pressures at PEEK instrumented segments were similar to uninstrumented segments and greater than those with titanium rod constructs.14 Intradiscal pressures at adjacent segments were highest with dynamic devices, intermediate with semirigid rods, and lowest with rigid constructs; however, stress values at adjacent segments were lower in PEEK than titanium constructs in any direction of motion.15,16
Fusion Rates
The use of PEEK rods in lumbar fusion has been reported previously.3,4,17,18 However, these studies featured small sample sizes, short follow up times, and contradictory results.4 Of 8 outcome reports found in a systematic review, 2 studies reported on procedures designed to create nonfusion outcomes (a third similar trial from 2013 was not included in the systematic review), and 1 study reported only on the condition of PEEK rods removed at subsequent surgery.3,19-21 Reported fusion rates varied from 86 to 100%.
In 42 patients with PEEK rod fusions who were followed for a mean of 31.4 months, 5 patients required adjacent segment surgery and 3 patients were treated for interbody cage migration and nonunion.17 Radiographic fusion rate was 86%. These authors concluded that PEEK rod fusion results were similar to those of other constructs, but not better, or perhaps worse than, metal rods.
Other studies have reported better results with PEEK.11,18,19,22-24 Highsmith and colleagues reported on 3 successful example cases of the use of PEEK rods.11 De Iure and colleagues reported on 30 cases up to 5 levels (mean, 2.9) using autograft bone, with a mean follow up of 18 months.23 Results were reported as satisfactory. Three patients had radiographic nonunions, 1 of which required revision for asymptomatic screw loosening at the cranial end of the construct. Qi and colleagues, reported on 20 patients with PEEK rods compared to 21 patients with titanium alloy rods.24 Both groups had similar clinical outcomes, structural parameters, and 100% fusion rates. Athanasakopoulos and colleagues reported on 52 patients with up to 3 level fusions followed for a mean of 3 years.22 There were significant improvements in PROs: at 1 year 96% had radiographic union. Two patients had screw breakage, 1 of whom required revision to a metal rod construct. Colangeli and colleagues reported on 12 patients treated with PEEK rods compared with 12 who were treated with a dynamic system.18 They reported significant improvements, no complications, and 100% fusion at 6 months. Huang and colleagues reported on 38 patients intended to undergo a nonfusion procedure with 2 years of follow up.19 They reported good outcomes and 1 case of screw loosening. As no fusion was intended, no fusion outcomes were reported. All these studies suggested that longer follow up and more patients would be needed to assess the role of PEEK rods in lumbar fusion.3
Our results show a radiographic fusion rate of 86.4% and a radiographic nonunion rate of 9.9% in patients followed for at least 12 months. There was no clinical need for revision fusion at the index level. In our retrospective review, patients had high levels of smoking, DM, depression, immunosuppression, and obesity, which may negatively influence radiographic fusion rates when compared with other studies with 100% reported fusion rates. There was no instance of construct breakage or screw breakout, indicating that PEEK rods may allow enough flexibility to avoid construct failure under stress as in a fall.
Patient Reported Outcomes
Recent large studies were reviewed to assess the pre- and postoperative patient PROs reported in comparison with our study population (Table 4). In the Swedish Spine Registry analysis of 765 patients with 3 different types of lumbar fusion, the mean preoperative ODI score was 37 and mean SF-36 physical component score (PCS) was 35 for the most similar approach (posterolateral fusion with instrumentation).25 At 1 year postoperation, the mean ODI was 26 and mean SF-36 PCS was 43. In the Spine Patient Outcomes Research Trial (SPORT) spondylolisthesis trial of 3 fusion types, the mean preoperative ODI was 41.2 and mean SF-36 PF score was 31.2 for the most similar approach (posterolateral instrumented fusion with pedicle screws).26 Postoperative ODI scores at 1 year decreased by a mean 20.9 points and mean SF-36 PF scores increased by 29.9.
We report a mean preoperative SF-36 PF score of 28.9, which is lower than the SPORT study score for posterolateral fusion with instrumentation and the Swedish Study score for posterolateral instrumented fusion with pedicle screws. Similarly, our mean ODI score of 24.8 was better than the scores reported in the Swedish and SPORT studies. Our mean SF-36 PF score at 1 year postoperation was 59.3, compared with 58.5 for the SPORT study group and 46.0 in the Swedish study group. Mean ODI score at 1 year postoperatively was 14.5, which is better than the scores reported in the Swedish and SPORT studies.
Minimally clinically important difference (MCID) is a parameter used to gauge the efficacy of spine surgery. The utility of the MCID based upon PROs has been questioned in lumbar fusion surgery, as it has been thought to measure if the patient is “feeling” rather than “doing” better, the latter of which can be better measured by functional performance measures and objective, external socioeconomic anchors such as return to work and health care costs.27 Nevertheless, validated PROs are reported widely in the spine surgery literature. The MCID in the SF-36 is not well established and can depend upon whether the scores are at the extremes or more in the central range and whether there is large variability in the scores.28 Rheumatoid arthritis was estimated to be 7.1 points on the PF scale and 7.2 on the physical component summary (PCS).29 For total knee replacement, it has been estimated to be 10 points on the SF-36 PCS.30 Lumbar surgery was estimated to be 4.9 points for the SF-36 PCS and 12.8 points for the ODI.31 And the SPORT trial it has been estimated that a 30% change in the possible gain (or loss) may be an appropriate criterion.28
With a preoperative mean SF-36 PF of 28.9, a 30% improvement in the available range (70.1) would be 21 points, making our data mean improvement of 30 points above the MCID. With a mean preoperative ODI of 24.6, a 30% improvement in the available range (25.4) would be 7.6 points, making our data mean improvement of 10.3 points better than the MCID. Therefore, our outcome results are comparable with other lumbar fusion outcome studies in terms of degree of disability prior to surgery and amount of improvement from surgery.
Adjacent Segment Disease
The precise factors resulting in adjacent segment disease are not fully defined.3,32 In reviews of lumbar adjacent segment disease, reported rates ranged from 2.5% at 1 year up to 80 to 100% at 10 years, with lower rates with noninstrumented fusions.4,32-34 Annual incidence of symptomatic adjacent segment disease following lumbar fusion ranges from 0.6 to 3.9% per year.32,35,36 Mismatch between lumbar lordosis and pelvic incidence after fusion is thought to lead to higher rates of adjacent segment disease, as can a laminectomy at an adjacent segment.32,36 Percutaneous fusion techniques or use of the Wiltse approach may lower the risk of adjacent segment disease due to avoidance of facet capsule disruption.37,38
Dynamic stabilization techniques do not appear be clearly protective against adjacent segment disease, although biomechanical models suggest that they may do so.33,39,40 A review by Wang and colleagues pooled studies to assess the risk of lumbar adjacent segment disease in spinal fusion to compare to disc arthroplasty and concluded that fusion carried a higher risk of adjacent segment disease.41 Definitive data on other types of motion preservation devices is lacking.3We show 3 adjacent segment fusions and 1 laminectomy have been needed in 108 patients and at a mean of 46 months after the index procedure and over 2.5 years of mean overall follow up. This is a low adjacent segment surgery rate compared to the historical data cited above, and may suggest some advantage for PEEK rods over more rigid constructs.
Strengths and Limitations
Strengths of this study include larger numbers than prior series of PEEK rod use and use in a population with high comorbidities linked to poor results without reduction in good outcomes. PEEK rods as used at the VAPHCS do not result in higher instrumentation costs than all metal constructs.
Study limitations include the retrospective nature with loss of follow up on some patients and incomplete radiographic and PROs in some patients. The use of 100% stereotactic guidance, the avoidance of interbody devices, and the off-label use of bone morphogenetic protein as part of the fusion construct introduce additional variables that may influence comparison to other studies. To avoid unnecessary radiation exposure, flexion extension films or CT scans were not routinely obtained if patients were doing well.42 Additionally, the degree of motion on dynamic views that would differentiate pseudarthrosis from arthrodesis has not been defined.5
Conclusions
The results presented show that lumbar fusion with PEEK rods can be undertaken with short hospitalization times and low complication rates, produce satisfactory clinical improvements, and result in radiographic fusion rates similar to metal constructs. Low rates of hardware failure or need for revision surgery were found. Preliminarily results of low rates of adjacent segment surgery are comparable with previously published metal construct rates. Longer follow up is needed to confirm these findings and to investigate whether semirigid constructs truly offer some protection from adjacent segment disease when compared to all metal constructs.
Acknowledgments
The authors thank Shirley McCartney, PhD, for editorial assistance.
1. Deyo RA, Mirza SK, Martin BI, Kreuter W, Goodman DC, Jarvik JG. Trends, major medical complications, and charges associated with surgery for lumbar spinal stenosis in older adults. JAMA. 2010;303(13):1259-1265. doi:10.1001/jama.2010.338
2. Machado GC, Maher CG, Ferreira PH, et al. Trends, complications, and costs for hospital admission and surgery for lumbar spinal stenosis. Spine (Phila Pa 1976). 2017;42(22):1737-1743. doi:10.1097/BRS.0000000000002207
3. Li C, Liu L, Shi JY, Yan KZ, Shen WZ, Yang ZR. Clinical and biomechanical researches of polyetheretherketone (PEEK) rods for semi-rigid lumbar fusion: a systematic review. Neurosurg Rev. 2018;41(2):375-389. doi:10.1007/s10143-016-0763-2
4. Mavrogenis AF, Vottis C, Triantafyllopoulos G, Papagelopoulos PJ, Pneumaticos SG. PEEK rod systems for the spine. Eur J Orthop Surg Traumatol. 2014;24 Suppl 1:S111-S116. doi:10.1007/s00590-014-1421-4
5. Choudhri TF, Mummaneni PV, Dhall SS, et al. Guideline update for the performance of fusion procedures for degenerative disease of the lumbar spine. Part 4: radiographic assessment of fusion status. J Neurosurg Spine. 2014;21(1):23-30. doi:10.3171/2014.4.SPINE14267
6. Ahn YH, Chen WM, Lee KY, Park KW, Lee SJ. Comparison of the load-sharing characteristics between pedicle-based dynamic and rigid rod devices. Biomed Mater. 2008;3(4):044101. doi:10.1088/1748-6041/3/4/044101
7. Ozer AF, Cevik OM, Erbulut DU, et al. A novel modular dynamic stabilization system for the treatment of degenerative spinal pathologies. Turk Neurosurg. 2019;29(1):115-120. doi:10.5137/1019-5149.JTN.23227-18.1
8. Hak DJ, Mauffrey C, Seligson D, Lindeque B. Use of carbon-fiber-reinforced composite implants in orthopedic surgery. Orthopedics. 2014;37(12):825-830. doi:10.3928/01477447-20141124-05
9. Gornet MF, Chan FW, Coleman JC, et al. Biomechanical assessment of a PEEK rod system for semi-rigid fixation of lumbar fusion constructs. J Biomech Eng. 2011;133(8):081009. doi:10.1115/1.4004862
10. Jackson JB 3rd, Crimaldi AJ, Peindl R, Norton HJ, Anderson WE, Patt JC. Effect of polyether ether ketone on therapeutic radiation to the spine: a pilot study. Spine (Phila Pa 1976). 2017;42(1):E1-E7. doi:10.1097/BRS.0000000000001695
11. Highsmith JM, Tumialán LM, Rodts GE Jr. Flexible rods and the case for dynamic stabilization. Neurosurg Focus. 2007;22(1):E11. Published 2007 Jan 15. doi:10.3171/foc.2007.22.1.11
12. Sengupta DK, Bucklen B, McAfee PC, Nichols J, Angara R, Khalil S. The comprehensive biomechanics and load-sharing of semirigid PEEK and semirigid posterior dynamic stabilization systems. Adv Orthop. 2013;2013:745610. doi:10.1155/2013/745610
13. Agarwal A, Ingels M, Kodigudla M, Momeni N, Goel V, Agarwal AK. Adjacent-level hypermobility and instrumented-level fatigue loosening with titanium and PEEK rods for a pedicle screw system: an in vitro study. J Biomech Eng. 2016;138(5):051004. doi:10.1115/1.4032965
14. Chou WK, Chien A, Wang JL. Biomechanical analysis between PEEK and titanium screw-rods spinal construct subjected to fatigue loading. J Spinal Disord Tech. 2015;28(3):E121-E125. doi:10.1097/BSD.0000000000000176
15. Shih KS Hsu CC, Zhou SY, Hou SM. Biomechanical investigation of pedicle screw-based posterior stabilization systems for the treatment of lumbar degenerative disc disease using finite element analyses. Biomed Eng: Appl Basis Commun. 2015;27(06):1550060. doi: 10.4015/S101623721550060X
16. Chang TK, Huang CH, Liu YC, et al. Biomechanical evaluation and comparison of polyetheretherketone rod system to traditional titanium rod fixation on adjacent levels. Formosan J Musculoskeletal Disord. 2013;4(2):42-47. doi: 10.1016/j.fjmd.2013.04.003
17. Ormond DR, Albert L Jr, Das K. Polyetheretherketone (PEEK) rods in lumbar spine degenerative disease: a case series. Clin Spine Surg. 2016;29(7):E371-E375. doi:10.1097/BSD.0b013e318277cb9b
18. Colangeli S, Barbanti Brodàno G, Gasbarrini A, et al. Polyetheretherketone (PEEK) rods: short-term results in lumbar spine degenerative disease. J Neurosurg Sci. 2015;59(2):91-96.
19. Huang W, Chang Z, Song R, Zhou K, Yu X. Non-fusion procedure using PEEK rod systems for lumbar degenerative diseases: clinical experience with a 2-year follow-up. BMC Musculoskelet Disord. 2016;17:53. Published 2016 Feb 1. doi:10.1186/s12891-016-0913-2
20. Wang C-J, Graf H, Wei H-W. Clinical outcomes of the dynamic lumbar pedicle screw-rod stabilization. Neurosurg Q. 2016;26(3):214-218. doi:10.1097/WNQ.0000000000000169
21. Kurtz SM, Lanman TH, Higgs G, et al. Retrieval analysis of PEEK rods for posterior fusion and motion preservation. Eur Spine J. 2013;22(12):2752-2759. doi:10.1007/s00586-013-2920-4
22. Athanasakopoulos M, Mavrogenis AF, Triantafyllopoulos G, Koufos S, Pneumaticos SG. Posterior spinal fusion using pedicle screws. Orthopedics. 2013;36(7):e951-e957. doi:10.3928/01477447-20130624-28
23. De Iure F, Bosco G, Cappuccio M, Paderni S, Amendola L. Posterior lumbar fusion by peek rods in degenerative spine: preliminary report on 30 cases. Eur Spine J. 2012;21 Suppl 1(Suppl 1):S50-S54. doi:10.1007/s00586-012-2219-x
24. Qi L, Li M, Zhang S, Xue J, Si H. Comparative effectiveness of PEEK rods versus titanium alloy rods in lumbar fusion: a preliminary report. Acta Neurochir (Wien). 2013;155(7):1187-1193. doi:10.1007/s00701-013-1772-3
25. Endler P, Ekman P, Möller H, Gerdhem P. Outcomes of posterolateral fusion with and without instrumentation and of interbody fusion for isthmic spondylolisthesis: a prospective study. J Bone Joint Surg Am. 2017;99(9):743-752. doi:10.2106/JBJS.16.00679
26. Abdu WA, Lurie JD, Spratt KF, et al. Degenerative spondylolisthesis: does fusion method influence outcome? Four-year results of the spine patient outcomes research trial. Spine (Phila Pa 1976). 2009;34(21):2351-2360. doi:10.1097/BRS.0b013e3181b8a829
27. Gatchel RJ, Mayer TG, Chou R. What does/should the minimum clinically important difference measure? A reconsideration of its clinical value in evaluating efficacy of lumbar fusion surgery. Clin J Pain. 2012;28(5):387-397. doi:10.1097/AJP.0b013e3182327f20
28. Spratt KF. Patient-level minimal clinically important difference based on clinical judgment and minimally detectable measurement difference: a rationale for the SF-36 physical function scale in the SPORT intervertebral disc herniation cohort. Spine (Phila Pa 1976). 2009;34(16):1722-1731. doi:10.1097/BRS.0b013e3181a8faf2
29. Ward MM, Guthrie LC, Alba MI. Clinically important changes in short form 36 health survey scales for use in rheumatoid arthritis clinical trials: the impact of low responsiveness. Arthritis Care Res (Hoboken). 2014;66(12):1783-1789. doi:10.1002/acr.22392
30. Escobar A, Quintana JM, Bilbao A, Aróstegui I, Lafuente I, Vidaurreta I. Responsiveness and clinically important differences for the WOMAC and SF-36 after total knee replacement. Osteoarthritis Cartilage. 2007;15(3):273-280. doi:10.1016/j.joca.2006.09.001
31. Copay AG, Glassman SD, Subach BR, Berven S, Schuler TC, Carreon LY. Minimum clinically important difference in lumbar spine surgery patients: a choice of methods using the Oswestry Disability Index, Medical Outcomes Study questionnaire Short Form 36, and pain scales. Spine J. 2008;8(6):968-974. doi:10.1016/j.spinee.2007.11.006
32. Radcliff KE, Kepler CK, Jakoi A, et al. Adjacent segment disease in the lumbar spine following different treatment interventions. Spine J. 2013;13(10):1339-1349. doi:10.1016/j.spinee.2013.03.020
33. Epstein NE. Adjacent level disease following lumbar spine surgery: a review. Surg Neurol Int. 2015;6(Suppl 24):S591-S599. Published 2015 Nov 25. doi:10.4103/2152-7806.170432
34. Epstein NE. A review: reduced reoperation rate for multilevel lumbar laminectomies with noninstrumented versus instrumented fusions. Surg Neurol Int. 2016;7(Suppl 13):S337-S346. Published 2016 May 17. doi:10.4103/2152-7806.182546
35. Scemama C, Magrino B, Gillet P, Guigui P. Risk of adjacent-segment disease requiring surgery after short lumbar fusion: results of the French Spine Surgery Society Series. J Neurosurg Spine. 2016;25(1):46-51. doi:10.3171/2015.11.SPINE15700
36. Tempel ZJ, Gandhoke GS, Bolinger BD, et al. The influence of pelvic incidence and lumbar lordosis mismatch on development of symptomatic adjacent level disease following single-level transforaminal lumbar interbody fusion. Neurosurgery. 2017;80(6):880-886. doi:10.1093/neuros/nyw073
37. Cheng YW, Chang PY, Wu JC, et al. Letter to the editor: Pedicle screw-based dynamic stabilization and adjacent-segment disease. J Neurosurg Spine. 2017;26(3):405-406. doi:10.3171/2016.7.SPINE16816
38. Street JT, Andrew Glennie R, Dea N, et al. A comparison of the Wiltse versus midline approaches in degenerative conditions of the lumbar spine. J Neurosurg Spine. 2016;25(3):332-338. doi:10.3171/2016.2.SPINE151018
39. Kuo CH, Huang WC, Wu JC, et al. Radiological adjacent-segment degeneration in L4-5 spondylolisthesis: comparison between dynamic stabilization and minimally invasive transforaminal lumbar interbody fusion. J Neurosurg Spine. 2018;29(3):250-258. doi:10.3171/2018.1.SPINE17993
40. Lee CH, Kim YE, Lee HJ, Kim DG, Kim CH. Biomechanical effects of hybrid stabilization on the risk of proximal adjacent-segment degeneration following lumbar spinal fusion using an interspinous device or a pedicle screw-based dynamic fixator. J Neurosurg Spine. 2017;27(6):643-649. doi:10.3171/2017.3.SPINE161169
41. Wang JC, Arnold PM, Hermsmeyer JT, Norvell DC. Do lumbar motion preserving devices reduce the risk of adjacent segment pathology compared with fusion surgery? A systematic review. Spine (Phila Pa 1976). 2012;37(22 Suppl):S133-S143. doi:10.1097/BRS.0b013e31826cadf2
42. Ross DA. Letter to the editor: steroid use in anterior cervical discectomy and fusion. J Neurosurg Spine. 2016;24(6):998-1000. doi:10.3171/2015.9.SPINE151052
VA Academic Affiliations Matter in the Era of Community Care: A Model From California
The Veterans Health Administration (VHA), 1 of 3 administrative branches in the US Department of Veterans Affairs (VA), is the largest integrated health care system in the United States.1 The VHA has 4 missions: providing health care to eligible veterans; supporting research to benefit veterans and the larger society; providing education for health care trainees; and supporting emergency response.1 In service of these goals, VA has academic affiliations with universities throughout the country, offering unique, extensive training and research opportunities. Both the VA and the affiliate benefit from these partnerships. For example, VA affiliations with University of California (UC) medical schools benefit veteran care while facilitating the UC academic mission. Through these affiliations, trainees who learn within the VHA’s highly effective integrated care model become health care professionals (HCPs) who are prepared to enter health care systems in California and meet the state’s demand for high-quality integrated care with an emphasis on primary care, mental health care, and care for aging populations.2,3
This report explores the history of the VHA, current veteran demographics and needs, VA academic affiliations, and the integrated care model of training in all VHA facilities. The VA and UC academic affiliation is described further with regard to shared research and educational functions. Finally, we identify potential risks to academic affiliations associated with increased VA reliance on community-based care following the implementation of recent legislation. We provide suggestions for VA academic affiliates to help assess and guide the potential impact of increased VA-managed community care.
VHA Resources
The VHA serves more than 9 million veterans through 170 medical centers and 1,074 outpatient care sites.1 In fiscal year 2017, the VA provided 109 million outpatient visits, and treated 615,000 inpatient medicine/surgical patients and 149,000 patients in inpatient mental health.4 The VHA focuses on the distinct concerns of veterans, which arise from military service as well as their broader health care needs. Veterans have higher rates of medical and mental health conditions than those of the general public; different cohorts in this population experience distinct medical and mental health concerns (Table 1).5
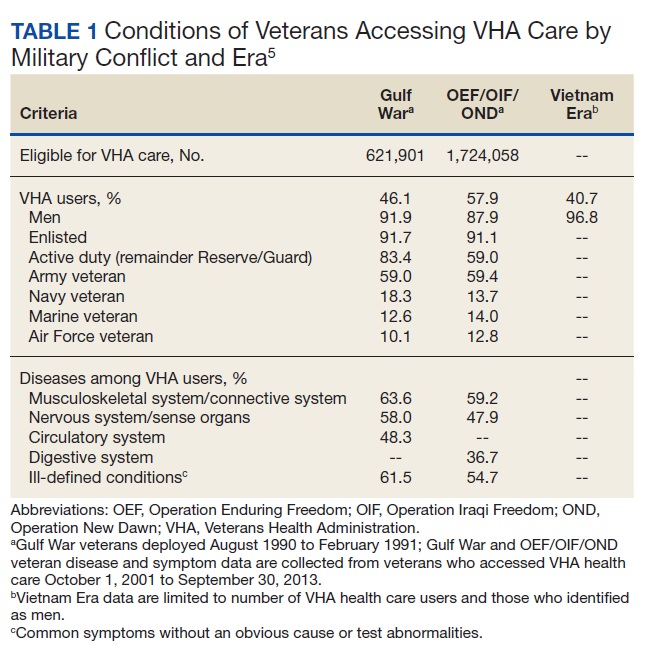
In addition, although veterans are disproportionately older men, the population is diversifying.6 For example, the number of female veterans is growing; furthermore, changes in the law now allow lesbian, gay, bisexual, and transgender (LGBT) individuals to serve openly, which has both reduced barriers for this population and allowed for LGBT veterans who were not eligible for VA care due to less than honorable discharges to have those discharges upgraded. As a result, care has been tailored to include the development of Women Veterans Program Managers and related services and LGBT and related identities resources such as LGBT Veteran Care Coordinators in every VA facility nationwide.7,8 The VA continues to adapt to serve all veterans; part of this adaptation is training HCPs to provide veteran-centered care for a growing and diversifying population.
VHA Resources in California
California has the largest population of veterans in the United States (Table 2).9,10 Of the 9,116,200 VA enrollees nationwide, 760,910 (8%) reside in California, and of those, 463,410 had at least 1 VA visit in the past year.3,10 The VHA is organized into 21 Veterans Integrated Service Networks (VISNs) that include multiple health care systems in the region associated with each VISN. California is part of VISN 21 (Northern California, Nevada, and Pacific Islands) and VISN 22 (Southern California, Nevada, and New Mexico). Among veterans who served in the recent Iraq and Afghanistan conflicts, 5.5% accessed care in VISN 21 and 9.3% accessed care in VISN 22.11 The VHA provides critical infrastructure for meeting complex veteran needs, as well as related specialized training, education, and research for HCPs. This specialization has been the basis for the broad system of affiliations between VA and academic systems.
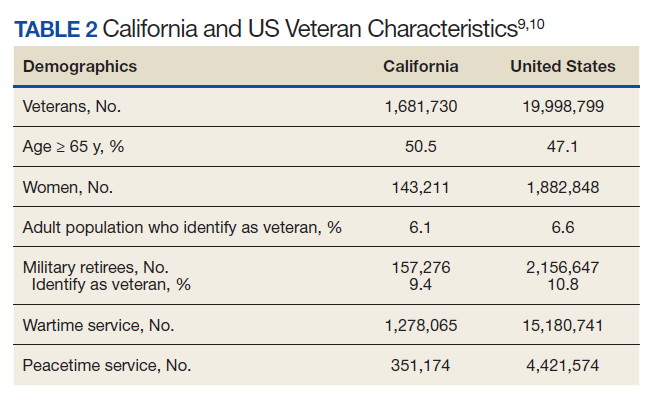
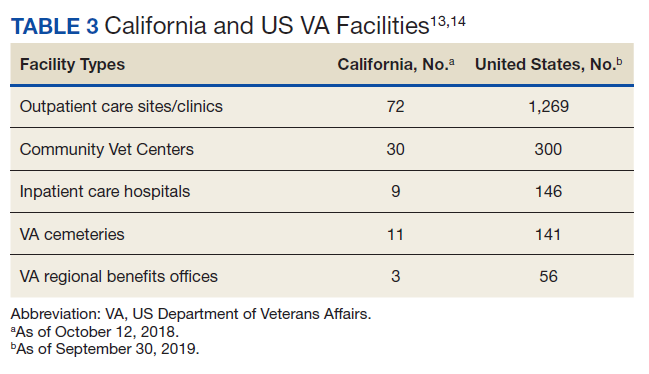
The VA continues to be a high priority in the federal budget process.12 In 2017, slightly more than 9% of the VA health care budget, $6.4 billion, was spent on medical care in California.10 Consequently, California has a noteworthy portion of VA infrastructure (Table 3).13,14 California has 8 VA medical centers (VAMCs) with hospital service (Fresno, Loma Linda, Long Beach, Palo Alto, Sacramento, San Diego, San Francisco, West Los Angeles), 3 VAMCs without hospital service (2 locations in the Palo Alto system and Sepulveda), 1 stand-alone extended-care facility (Martinez Community Living Center), and 1 stand-alone residential care facility (San Diego Domiciliary).9 The vast VA infrastructure in California and large population of veterans creates a strong demand for HCPs in the state.
VA Education and Collaboration
VA has been training clinicians and scholars since 1946, when VA academic affiliations were established by Memorandum Number 2.15,16 Today, the VA is the largest educator of HCPs in the United States.17 In 2015, an estimated $10.3 to $12.5 billion was spent on mandatory Medicare graduate medical education (GME).18 In 2017, the VA spent $1.78 billion of discretionary funding on GME to fund 11,000 full-time equivalent (FTE) slots, leading to > 43,000 physician residents (> 30% of all physician residents) spending part of their training in a VHA facility.18,19
This training mission has multiple benefits. It provides the VA with access to new HCPs who have the necessary training in veteran-specific needs, while supporting the national need for HCPs. In 2018, 120,890 clinical trainees received some or all of their training in the VA system.20 Of the 152 US medical schools that are accredited by the Liaison Committee on Medical Education, 95% collaborate with the VA for training while 100% of the 34 doctor of osteopathic medicine programs have VA training collaborations.20 The VA currently has an additional 18 partnerships with nursing schools.21 Further, 1,800 college and universities, including Hispanic-serving institutions and historically black colleges and universities, have VHA affiliations that provide training for more than 40 clinical health profession education programs.17
This training model has been successful in supporting VA staffing, as health care providers who trained in the VA are more likely to work in the VA.22 Among current VA employees, > 80% of optometrists, > 70% of podiatrists and psychologists, and > 60% of physicians received some part of their training in the VA system.23 In combination with recent increased funding for staffing, the ability of the VA to directly hire trainees in identified professions, and the expansion of loan forgiveness to high-demand specialties (eg, psychiatry), the training partnership between the VA and affiliates has been critical in maintaining the needed VA workforce.22,24,25
The VA Office of Academic Affiliations is responsible for all graduate medical and dental education administration in the VA system, which makes up 85% of its total budget. For each trainee, the VA provides approximately $60,000 toward their stipend in exchange for training and patient care time at a VHA hospital (Kenneth R. Jones, PhD, email communication, August 27, 2018).
California Health Care Education
The UC public university system, founded in 1869, currently has 10 campuses with a combined student body of > 280,000 students, along with 227,000 faculty and staff members.26 For every research dollar provided by California, the UC secures $7 in federal and private funding.26 The UC has 6 medical centers (Davis, Irvine, Los Angeles, Riverside, San Diego, and San Francisco); each is affiliated with at least 1 local VAMC.27,28
California trains a substantial share of health care trainees. In 2016, there were 10,429 physician residents in training in California.29 In 2017/2018, the San Francisco VAMC trained 1,178 medical students/residents, 57 pharmacy students, 25 nurse practitioner students, 19 optometry interns/students/residents, 11 dental students/residents, and 3 physical therapy students.20 In total, 6,223 UC health professions students were trained in VHA facilities during the 2017/2018 training year (Table 4).20 As of 2016, there were 105,907 physicians in California, and of those, 57% completed their GME in California.29 In California in 2015, 74 GME-sponsoring institutions graduated 3,568 residents and fellows, an increase of 10% since 1997.30 Of these sponsoring institutions, 6 of the top 8 programs were UC schools that graduated 48.4% (1,727) of all California residents and fellows in 2015.30
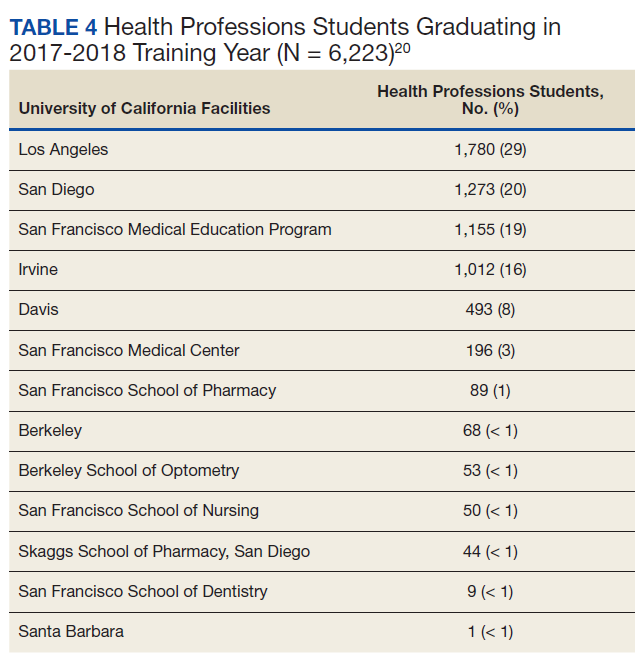
Despite these resources, California faces a major shortage of HCPs, particularly in primary, behavioral health, and older adult care.3 Today, 7 million Californians live in counties with a federally designated shortage of primary, dental, and mental health care providers.3 Most of these Californians are Latino, African American, or Native American, and they live in fast-growing rural and urban regions, including Los Angeles; the San Joaquin Valley; and the Inland Empire (San Bernardino and Riverside Counties).3 Current recommendations to meet increasing demands as California’s population increases, grows older, and faces increased health care demands include expanding residency programs to yield 1,872 additional primary care physicians and 2,202 additional psychiatrists by 2030.3 To meet this shortage and prepare for future health care demands, health care education is paramount; in California, VA and UC affiliations are central to addressing these needs.
The VA plays a particularly important role in supporting GME, which is essential to meeting both VA and California’s unmet HCP needs, as GME determines the number of medical practitioners available per specialty.30 The VA was the second largest GME fund provider in California at $90,662,608 (Medicare provided $552,235,626) and the California government provided a small portion of GME funding.30 VA education funding is a direct result of the VA provision of clinical care in one of the most innovative and modern health care systems in the world.
These VA training opportunities benefit the UC system and California by helping train integrated care practitioners to meet the increasing demand. Integrated care—the coordination of mental health care, substance use disorder treatment, and primary care services—is designed to improve health outcomes by helping people with multiple and complex health care needs access care.31,32
As the largest integrated health care system in the country, the VA brings important clinical, research, and educational opportunities to academic affiliates. A systematic review examining cost and quality outcomes in integrated care systems found improved quality of care compared with nonintegrated care systems; thus, many US government agencies and the World Health Organization are establishing integrated care systems as a standard and universal approach.31,33,34 While cost savings as a result of integrated care are unclear, most studies in this review reported a decrease in utilization of services.33 The presumption of more efficient and higher quality care is also predicated on features such as system-wide accessibility of comprehensive medical records that provide more information to HCPs, promote collaboration, and measure and reward performance, all of which are possible using the VA electronic health record (EHR) system.35,36 The VA offers an excellent opportunity for training in integrated care as this model is required of all VAMCs and community-based outpatient clinics (CBOCs).37
Providing integrated care to the citizens of California is among the 10 priorities of the California Future Health Workforce Commission (a group of California health care leaders cochaired by the UC system president) for immediate action and guides their recommendations on developing and expanding the health care workforce; therefore, training in an integrated health care system is especially important for California HCPs.3 Nearly three-quarters of California’s population aged ≥ 65 years has a chronic health condition that could benefit from integrated care; however, the current supply of HCPs is insufficient to meet the growing demand for geriatric care.38,39
The VA has a robust training program to produce scholars and practitioners who specialize in geriatric care. This includes the Geriatric Scholars Program, which has the goal of integrating geriatrics into primary care through professional development. The Geriatric Scholars Program is a component of the VA Geriatric Research Education and Clinical Centers at urban VAMCs to help provide education and clinical resource connections with rural CBOCs where geriatrics expertise is lacking.
The California Future Health Workforce Commission is highlighting the need to prioritize workforce development in primary care, mental health care, and care for the aging.3 These priorities are shared as foundational services within the VHA.40 The alignment of these priorities creates an excellent rationale for increasing training and education of the UC health care workforce in the California VA system through academic affiliations.
VA Research Collaborations
The VA Office of Research and Development has existed for more than 90 years with a mission to improve veteran health and well-being via research and attract, train, and retain high-caliber researchers. VA provides a rich environment to conduct observational and interventional research due to its large, diverse veteran population, institutional support, and integrated information system with extensive EHR data.41 The success of the VA in facilitating research is evidenced by the fact that 3 VA investigators have been awarded Nobel prizes, and 7 have received Lasker Foundation Awards.42 The size of the VA allows for innovative large-scale research, such as the Million Veteran Program (MVP). The MVP study developed a mega-biobank of VA health records, questionnaires, and blood samples from nearly 1 million veterans to study genetic influences on health and disease and integrate genetic testing into health care delivery.43 In addition to producing high-quality, innovative research, more than 60% of VA investigators also provide direct patient care.42
VA research areas of focus include homelessness, polytrauma, traumatic brain injury, hearing and vision loss, spinal cord injury, mental health, pain management, precision medicine, prosthetics and amputation care, women’s health, and chronic diseases, such as Parkinson and Alzheimer diseases.44 The VA estimates that, in 2021, total VA research spending will include a request of $787 million in addition to $370 million from the National Institutes of Health, the Department of Defense, and the Centers for Disease Control and Prevention, and $170 million from other nonfederal sources, for a projected total of $1.3 billion. This budget will support 2,200 projects with direct research and reimbursable employment of 3,275 FTEs,which are key to supporting VA academic affiliations.45 These funds translate into substantial benefits to the UC system, including shared research and training resources, grant-funding opportunities for UC faculty, and the ability to recruit top researchers, educators, and clinicians to its institutions.
VA Reliance on Community Care
The current VHA model is an integrated health care system that provides comprehensive, wraparound services to enrolled veterans, which are cost-effective, high quality, and consistently found to have equal or superior quality of care compared with that in the community.6,46-50 Despite public criticism about wait times and access to care in the VA system, one study showed that VA wait-time statistics were comparable with or faster than those for community HCPs.51,52 However, VA care coordination has undergone several changes to address these public criticisms, namely, the Veterans Access, Choice and Accountability Act of 2014 (38 USC § 1703 VACAA) and the VA MISSION Act of 2018 (42 USC § 274). VACAA was designed to increase access to care for veterans who live ≥ 40 miles from VA health care facilities or who are unable to been seen within 30 days of their preferred or clinically appropriate date.53 More than 2 million veterans (almost 25% of VHA-enrolled veterans) have received community care since the inception of VACAA in 2014.54
Recently, the MISSION Act mandated developing additional VA-coordinated community-based care through the establishment of a Veterans Community Care Program, which was established using existing VA 2019 fiscal year funds and did not include additional appropriations despite expanded criteria for community care referrals.55 Without additional future appropriations, VA funds would be shifted from VA care into community care. While increasing access to community care has in some cases led to care that is faster and closer and that was previously inaccessible in local VA specialty care, these efforts could reduce veteran engagement with the VA system.56
The changes implemented in VACAA and the VA MISSION Act were driven by important and valid concerns, including evidence of VA staff and officials covering up service deficiencies.51 Veterans in rural areas often have limited access to VA resources, and long travel to VAMCs or clinics can be an impediment. Veterans who have chosen community care tended to be those who have poorer health status, who live further away from VA facilities, women, and those who identified as White or Hispanic.56,57 While VA health care is on average equivalent to or better than community resources, there is significant variability in quality within the VA system. Advocates have argued that providing competition and choice for veterans places pressure on the VA to improve care where it is not meeting expectations. Therefore, access to community care is an important resource for veterans and needs to be implemented effectively and efficiently to help veterans receive the care they need. However, expansion of community care access, depending on how it is implemented, also can have effects on academic partnerships and the education and research missions that should be incorporated into planning.
Each VA health care system receives funding through the Veterans Equitable Reimbursement Allocation (VERA), which provides funds largely based on the number of enrolled veterans and the complexity of the care they receive.58 One potential implication of the shift among veterans to community care is a reduction in patients enrolled in VA programs, thus decreasing funding given to the VA to allocate for training and research. By definition, increased VA-managed community care means less opportunity for integrated training that brings together primary, mental health, and substance use care to meet patient needs. The Center for Medicare and Medicaid Services has developed a national initiative to help states develop programs in integrated care, particularly for individuals who are eligible for both Medicare and Medicaid.59 For states to develop integrated care, they need trainees who function well in this model. Integrated care training is particularly vulnerable to disruption because any portion of a veteran’s care being transferred to the community can impede integration. In effect, training in integrated care, likely the most efficient and cost-effective approach to health care for reasons discussed earlier, could be reduced as providers and trainees are required to manage and coordinate patient care between separate institutions.35
Educational Impact
The shift in usage from VA to community care has potential implications for academic affiliates, particularly in education and research.60 If more people are served in community settings, potentially some VAMCs could be reduced, realigned, or closed. If this restructuring happens, academic partnerships could be impacted negatively. The VA is instituting an Infrastructure Review Commission with the task of examining current VA utilization. If a VA site with an academic affiliate was considered for realignment or closure, the reduction would eliminate the ability of the academic affiliate to provide education and research collaborations at that site.
In a less drastic manner, increasing care in the community may change opportunities for academic affiliates to partner with the VA. As noted, the UC system and California veterans benefit immensely from the VHA as an integrated health care system with dedicated missions of education and research. This partnership is a model in which the VA is the primary source of care for eligible enrolled veterans and provides integrated comprehensive services. If the VA moves to serving primarily as a coordinator of community HCPs rather than a direct provider of health care, academic affiliates would need to make major adjustments to both the education and training models. This change could particularly affect specialty training programs that rely on having adequate volumes of patients to provide an extensive experience to meet training needs. If fewer veterans receive care directly from the VA and are instead dispersed in the community, that will reduce the ability of academic faculty to participate in the education of medical and affiliated trainees and to participate in research in VA settings. It is unclear what other model could replace such a system and be as beneficial to the VA and the academic partners with which it is currently affiliated.
Given the needs that led to the VA increasing access to care and the potential implications discussed for the VA and partnerships with academic affiliates, VA health care systems and academic affiliate partners should consider several steps. These steps involve assessment, coordination, and promotion.
Both the VA and academic affiliates would benefit if the VA shared assessment data on the use of community care, particularly identifying changes that relate to key training and/or research missions. Such data sharing can be critical to determine whether any risks (or potential opportunities) need to be addressed. In addition, increasing research on the outcomes related to both VA care and community-based care is of high value to determine whether the current changes are achieving intended goals. The VA recently funded such work through its research service, and such work is critical for guiding future policy for the VA and for the affiliates.
Coordination among the VA, academic affiliates, and community partners is vital for change. The issue of community care expansion should be a standing item on coordination meetings and shared governance councils between the institutions. It may make sense to establish specific workgroups or committees to coordinate tracking and assessment of the effect of community care expansion on the shared academic mission. One way to address the potential effect of increased community care on the research and education missions would be to include community partners into the partnerships. This strategy could potentially take a number of different forms, from providing education and training to community HCPs, having VA trainees rotate to community settings, or inviting community settings to be research sites for clinical trials. Such partnerships could potentially improve patient care and support the other academic missions. Coordination could be meaningfully improved by having community HCPs access the VA EHR, thus easing communications. Funding is available for EHR access in the VA MISSION Act and should be a high priority as community care expands. The more that community partners can access and connect with the VA EHR the better they will be able to coordinate care.
Third, the VA and its academic partners need to promote and educate veterans, their families, and their advocates on the benefits that are available through VA care and that are enhanced through academic partnerships. While the VA has been the target of justified criticism, many of its strengths addressed here are not broadly recognized. The VA could promote its sharing of staff and resources with the top academic health care institutions in an area and that veterans often have access to resources that otherwise would not be available without the academic affiliate. Making sure veterans are aware of the benefits available can potentially mitigate the need for community care.
Conclusions
Given changes from VACAA and the VA MISSION Act, VA and academic affiliates should be active partners in planning for future health care by providing input and feedback on VA structure to help shape federal and state systems moving forward. Institutions can take steps to steer their futures and meet growing clinical, training, and research needs. The VA and its academic partners in health care research are well positioned to develop projects to assess the effects of these changes. Evaluation of key variables including patient care, education, and research productivity are warranted to guide policymakers as they assess whether these changes in the VA are achieving the expressed goals of improving veteran care. Other opportunities to collaborate in the wake of the MISSION Act remain to be discovered within each academic affiliation. By strengthening working relationships between VA and academic teams, these deeply important partnerships can continue to produce clinical, research, and education outcomes that meet the needs of our veterans, our federal and state health care systems, and our country.
Acknowledgments
Dr. Sells was supported by the Department of Veterans Affairs, Veterans Health Administration, Office of Academic Affiliations VA Quality Scholars Advanced Fellowship Program.
1. US Department of Veterans Affairs, Veterans Health Administration. About VHA. Updated January 22, 2021. Accessed March 9, 2021. https://www.va.gov/health/aboutvha.asp
2. National Academies of Sciences, Engineering, and Medicine; Health and Medicine Division; Board on Health Care Services; Committee to Evaluate the Department of Veterans Affairs Mental Health Services. Evaluation of the Department of Veterans Affairs Mental Health Services. National Academies Press; 2018. Accessed March 9, 2021. https://www.ncbi.nlm.nih.gov/books/NBK499502/
3. California Future Health Workforce Commission. Meeting the demand for health: final report of the California Future Health Workforce Commission. Published February 2019. Accessed March 9, 2021. https://futurehealthworkforce.org/wp-content/uploads/2019/03/MeetingDemandForHealthFinalReportCFHWC.pdf
4. US Department of Veterans Affairs. Veterans Health Administration fiscal year 2017 annual report. Published 2017. Accessed March 9, 2021. https://www.va.gov/HEALTH/docs/VHA_AnnualReport_FY2017.pdf
5. US Department of Veterans Affairs. Public health: health care use by Gulf War & OEF/OIF/OND veterans. Updated March 28, 2017. Accessed March 9, 2021. https://www.publichealth.va.gov/epidemiology/reports/health-care-use-gulfwar-oefoifond/index.asp
6. Eibner C, Krull H, Brown KM, et al. Current and projected characteristics and unique health care needs of the patient population served by the Department of Veterans Affairs. Rand Health Q. 2016;5(4):13.
7. US Department of Veterans Affairs. Patient care services: veterans with lesbian, gay, bisexual and transgender (LGBT) and related identities. Updated August 31, 2020. Accessed March 9, 2021. https://www.patientcare.va.gov/LGBT/index.asp
8. US Department of Veterans Affairs. Women veterans health care: women veterans program managers. Updated March 28, 2017. Accessed March 9, 2021. https://www.womens health.va.gov/WOMENSHEALTH/programoverview/wvpm.asp
9. US Department of Veterans Affairs, National Center for Veterans Analysis and Statistics. VA facilities by state. Published May 15, 2017. Accessed March 9, 2021. https://www.va.gov/vetdata/docs/SpecialReports/VA_Facilities_By_State.PDF
10. US Department of Veterans Affairs, National Center for Veterans Analysis and Statistics. State summaries: California. Published September 2018. Accessed March 9, 2021. https://www.va.gov/vetdata/docs/SpecialReports/State_Summaries_California.pdf
11. US Department of Veterans Affairs, Veterans Health Administration, Office of Patient Care Services, Post-Deployment Health Group, Epidemiology Program. Analysis of VA health care utilization among Operation Enduring Freedom (OEF), Operation Iraqi Freedom (OIF), and Operation New Dawn (OND) veterans. Published January 2017. Accessed March 9, 2021. https://www.publichealth.va.gov/docs/epidemiology/healthcare-utilization-report-fy2015-qtr3.pdf
12. US Department of Veterans Affairs, Office of Budget. Annual budget submission, president’s budget request – fiscal year 2021. Updated February 10, 2020. Accessed March 9, 2021. https://www.va.gov/budget/products.asp
13. US Department of Veterans Affairs. Department of Veterans Affairs statistics at a glance. Updated February 2020. Accessed March 10, 2021. https://www.va.gov/vetdata/docs/Quickfacts/Stats_at_a_glance_4_6_20.PDF
14. US Department of Veterans Affairs VW. Locations, California. Updated October 12, 2018. Accessed March 10, 2021. https://www.va.gov/directory/guide/state.asp?dnum=ALL&STATE=CA
15. Baker, R. R., & Pickren, W. E. (2007). Psychology and the Department of Veterans Affairs: A historical analysis of training, research, practice, and advocacy. American Psychological Association. doi:10.1037/11544-000
16. Functions of Veterans Health Administration: health-care personnel education and training programs. 38 USC § 7302. Accessed March 16, 2021. https://www.govinfo.gov/app/details/USCODE-2011-title38/USCODE-2011-title38-partV-chap73-subchapI-sec7302
17. US Department of Veterans Affairs, Office of Academic Affiliations. Mission of the Office of Academic Affiliations. Published September 24, 2019. Accessed March 10, 2021. https://www.va.gov/oaa/oaa_mission.asp
18. Congressional Research Service. Federal support for graduate medical education: an overview. CRS report R44376. Updated December 27, 2018. Accessed March 10, 2021. https://fas.org/sgp/crs/misc/R44376.pdf
19. Association of American Medical Colleges. 2018 Report on residents. Table B3: number of active residents, by type of medical school, GME specialty, and sex. Accessed March 10, 2021. https://www.aamc.org/data-reports/students-residents/interactive-data/table-b3-number-active-residents-type-medical-school-gme-specialty-and-sex
20. US Department of Veterans Affairs, Office of Academic Affiliations. National summary trainees unique school list - academic year: 2017-2018.
21. US Department of Veterans Affairs, Office of Academic Affiliations. VA nursing academic partnerships. Updated December 12, 2018. Accessed March 10, 2021. https://www.va.gov/oaa/vanap/default.asp
22. Keitz SA, Aron DC, Brannen JL, et al. Impact of clinical training on recruiting graduating health professionals. Am J Manag Care. 2019;25(4):e111-e118. Published 2019 Apr 1.
23. US Department of Veterans Affairs, Office of Academic Affiliations. Health professions education: academic year 2019-2020. Published 2020. https://www.va.gov/OAA/docs/OAA_Statistics_2020.pdf
24. US Department of Veterans Affairs, Veterans Health Administration. Hiring programs and initiatives. Updated March 10, 2021. Accessed March 10, 2021. https://www.vacareers.va.gov/Benefits/HiringProgramsInitiatives/
25. US Department of Veterans Affairs, Veterans Health Administration. Students and trainees. Updated March 10, 2021. Accessed March 10, 2021. https://www.vacareers.va.gov/Careers/StudentsTrainees
26. The Regents of the University of California. The UC system. Accessed March 10, 2021. https://www.universityofcalifornia.edu/uc-system
27. The Regents of the University of California. The parts of UC. Accessed March 10, 2021. https://www.universityofcalifornia.edu/uc-system/parts-of-uc
28. US Department of Veterans Affairs. Locations: VISN 21: Sierra Pacific Network. Updated October 12, 2018. Accessed March 10, 2021. https://www.va.gov/directory/guide/region.asp?ID=1021
29. Association of American Medical Colleges. California physician workforce profile. Published 2017. Accessed March 10, 2021. https://www.aamc.org/system/files/2019-08/california2017.pdf
30. Rittenhouse D, Ament A, Grumbach K, Petterson S, Levin Z, Bazemore A. California Health Care Foundation: guide to graduate medical education funding in California. Published September 2018. Accessed March 10, 2021. https://www.chcf.org/wp-content/uploads/2018/08/GuideGraduateMedicalEducationFunding.pdf
31. US Department of Health and Human Services, Health Resources and Services Administration. Integrated behavioral health resource library. Accessed March 18, 2020. https://www.hrsa.gov/behavioral-health/library
32. US Department of Veterans Affairs. Patient care services: primary care - mental health integration (PC-MHI). Updated August 1, 2016. Accessed March 10, 2021. https://www.patientcare.va.gov/primarycare/PCMHI.asp
33. Hwang W, Chang J, Laclair M, Paz H. Effects of integrated delivery system on cost and quality. Am J Manag Care. 2013;19(5):e175-e184.
34. World Health Organization, World Organization of Family Doctors (Wonca). Integrating mental health into primary care: a global perspective. Published October 2008. Accessed March 10, 2021. https://www.who.int/mental_health/policy/Integratingmhintoprimarycare2008_lastversion.pdf
35. Congressional Budget Office. Comparing the costs of the veterans’ health care system with private-sector costs. Published December 10, 2014. Accessed March 10, 2021. https://www.cbo.gov/publication/49763
36. Souden M. Overview of VA data, information systems, national databases and research uses. Published October 2, 2017. Accessed March 10, 2021. https://www.hsrd.research.va.gov/for_researchers/cyber_seminars/archives/2376-notes.pdf
37. US Department of Veterans Affairs, Veterans Health Administration. Uniform mental health services in VA medical centers and clinics. VHA handbook 1160.01. Published September 11, 2008. Recertified September 30, 2013. Amended November 16, 2015. Published September 11, 2008. Accessed March 10, 2021. https://www.va.gov/vhapublications/ViewPublication.asp?pub_ID=1762
38. Coffman JM, Fix M, Ko M. California physician supply and distribution: headed for a drought? Published June 25, 2018. Accessed March 10, 2021. https://www.chcf.org/publication/californias-physicians-headed-drought
39. Meng YY, Ahman T, Pickett M. California Health Care Foundation: 2015 Edition—Californians with the top chronic conditions: 11 million and counting. Published April 23, 2015. Accessed March 10, 2021. https://www.chcf.org/publication/2015-edition-californians-top-chronic-conditions-11-million-counting
40. US Department of Veterans Affairs. Department of Veterans Affairs FY 2018-2024 strategic plan. Updated May 31, 2019. Accessed March 10, 2021. https://www.va.gov/oei/docs/va2018-2024strategicplan.pdf
41. Justice AC, Erdos J, Brandt C, Conigliaro J, Tierney W, Bryant K. The Veterans Affairs healthcare system: a unique laboratory for observational and interventional research. Med Care. 2006;44(8)(suppl 2):S7-S12. doi:10.1097/01.mlr.0000228027.80012.c5
42. US Department of Veterans Affairs, Office of Research and Development: About the Office of Research & Development. Published Updated March 4, 2021. Accessed March 10, 2021. https://www.research.va.gov/about/default.cfm
43. Gaziano JM, Concato J, Brophy M, et al. Million Veteran Program: a mega-biobank to study genetic influences on health and disease. J Clin Epidemiol. 2016;70:214-223. doi:10.1016/j.jclinepi.2015.09.016
44. US Department of Veterans Affairs. VA research program overview. Accessed March 12, 2021. https://www.research.va.gov/pubs/docs/va-research-overview-brochure.pdf
45. US Department of Veterans Affairs. FY 2021 budget submission: medical programs and information technology programs. Volume 2 of 4. Published February 2020. Accessed March 12, 2021. https://www.va.gov/budget/docs/summary/fy2021VAbudgetVolumeIImedicalProgramsAndInformationTechnology.pdf
46. Trivedi AN, Matula S, Miake-Lye I, Glassman PA, Shekelle P, Asch S. Systematic review: comparison of the quality of medical care in Veterans Affairs and non-Veterans Affairs settings. Med Care. 2011;49(1):76-88. doi:10.1097/MLR.0b013e3181f53575
47. Nugent GN, Hendricks A, Nugent L, Render ML. Value for taxpayers’ dollars: what VA care would cost at Medicare prices. Med Care Res Rev. 2004;61(4):495-508. doi:10.1177/1077558704269795
48. Anhang Price R, Sloss EM, Cefalu M, Farmer CM, Hussey PS. Comparing quality of care in Veterans Affairs and non-Veterans Affairs settings. J Gen Intern Med. 2018;33(10):1631-1638. doi:10.1007/s11606-018-4433-7
49. O’Hanlon C, Huang C, Sloss E, et al. Comparing VA and non-VA quality of care: a systematic review. J Gen Intern Med. 2017;32(1):105-121. doi:10.1007/s11606-016-3775-2
50. Vanneman ME, Wagner TH, Shwartz M, et al. Veterans’ experiences with outpatient care: comparing the Veterans Affairs system with community-based care. Health Aff (Millwood). 2020;39(8):1368-1376. doi:10.1377/hlthaff.2019.01375
51. US Department of Veterans Affairs, Office of Inspector General. Veterans Health Administration interim report: review of patient wait times, scheduling practices, and alleged patient deaths at the Phoenix health care system. Published May 28, 2014. Accessed March 12, 2021. https://www.va.gov/oig/pubs/VAOIG-14-02603-178.pdf
52. Penn M, Bhatnagar S, Kuy S, et al. Comparison of wait times for new patients between the private sector and United States Department of Veterans Affairs medical centers. JAMA Netw Open. 2019;2(1):e187096. doi:10.1001/jamanetworkopen.2018.7096
53. US Department of Veterans Affairs. Fact sheet: Veterans Access, Choice and Accountability Act of 2014 (“Choice Act”). Accessed March 12, 2021. https://www.va.gov/opa/choiceact/documents/choice-act-summary.pdf
54. Mattocks KM, Cunningham K, Elwy AR, et al. Recommendations for the evaluation of cross-system care coordination from the VA State-of-the-art Working Group on VA/Non-VA Care. J Gen Intern Med. 2019;34(Suppl 1):18-23. doi:10.1007/s11606-019-04972-1
55. US Department of Veterans Affairs. Fact sheet: VA MISSION Act and new veterans community care program. Published June 15, 2018. Accessed March 12, 2021. https://www.va.gov/COMMUNITYCARE/docs/pubfiles/factsheets/FactSheet_20-13.pdf
56. Stroupe KT, Martinez R, Hogan TP, et al. Experiences with the veterans’ choice program. J Gen Intern Med. 2019;34(10):2141-2149. doi:10.1007/s11606-019-05224-y
57. Yoon J, Leung LB, Rubenstein LV, et al. Use of the veterans’ choice program and attrition from Veterans Health Administration primary care. Med Care. 2020;58(12):1091-1097. doi:10.1097/MLR.0000000000001401
58. US Department of Veterans Affairs. Veterans Equitable Resource Allocation (VERA). Updated March 9, 2021. Accessed March 12, 2021. https://catalog.data.gov/dataset/veterans-equitable-resource-allocation-vera
59. Integrated Care Resource Center. About us. Accessed March 12, 2021. https://www.integratedcareresourcecenter.com/about-us
60. Duhaney T. How veteran utilization of the Veterans Health Administration could impact privatization. Public Policy Aging Rep. 2020;30(1):29-35. doi:10.1093/ppar/prz032
The Veterans Health Administration (VHA), 1 of 3 administrative branches in the US Department of Veterans Affairs (VA), is the largest integrated health care system in the United States.1 The VHA has 4 missions: providing health care to eligible veterans; supporting research to benefit veterans and the larger society; providing education for health care trainees; and supporting emergency response.1 In service of these goals, VA has academic affiliations with universities throughout the country, offering unique, extensive training and research opportunities. Both the VA and the affiliate benefit from these partnerships. For example, VA affiliations with University of California (UC) medical schools benefit veteran care while facilitating the UC academic mission. Through these affiliations, trainees who learn within the VHA’s highly effective integrated care model become health care professionals (HCPs) who are prepared to enter health care systems in California and meet the state’s demand for high-quality integrated care with an emphasis on primary care, mental health care, and care for aging populations.2,3
This report explores the history of the VHA, current veteran demographics and needs, VA academic affiliations, and the integrated care model of training in all VHA facilities. The VA and UC academic affiliation is described further with regard to shared research and educational functions. Finally, we identify potential risks to academic affiliations associated with increased VA reliance on community-based care following the implementation of recent legislation. We provide suggestions for VA academic affiliates to help assess and guide the potential impact of increased VA-managed community care.
VHA Resources
The VHA serves more than 9 million veterans through 170 medical centers and 1,074 outpatient care sites.1 In fiscal year 2017, the VA provided 109 million outpatient visits, and treated 615,000 inpatient medicine/surgical patients and 149,000 patients in inpatient mental health.4 The VHA focuses on the distinct concerns of veterans, which arise from military service as well as their broader health care needs. Veterans have higher rates of medical and mental health conditions than those of the general public; different cohorts in this population experience distinct medical and mental health concerns (Table 1).5
In addition, although veterans are disproportionately older men, the population is diversifying.6 For example, the number of female veterans is growing; furthermore, changes in the law now allow lesbian, gay, bisexual, and transgender (LGBT) individuals to serve openly, which has both reduced barriers for this population and allowed for LGBT veterans who were not eligible for VA care due to less than honorable discharges to have those discharges upgraded. As a result, care has been tailored to include the development of Women Veterans Program Managers and related services and LGBT and related identities resources such as LGBT Veteran Care Coordinators in every VA facility nationwide.7,8 The VA continues to adapt to serve all veterans; part of this adaptation is training HCPs to provide veteran-centered care for a growing and diversifying population.
VHA Resources in California
California has the largest population of veterans in the United States (Table 2).9,10 Of the 9,116,200 VA enrollees nationwide, 760,910 (8%) reside in California, and of those, 463,410 had at least 1 VA visit in the past year.3,10 The VHA is organized into 21 Veterans Integrated Service Networks (VISNs) that include multiple health care systems in the region associated with each VISN. California is part of VISN 21 (Northern California, Nevada, and Pacific Islands) and VISN 22 (Southern California, Nevada, and New Mexico). Among veterans who served in the recent Iraq and Afghanistan conflicts, 5.5% accessed care in VISN 21 and 9.3% accessed care in VISN 22.11 The VHA provides critical infrastructure for meeting complex veteran needs, as well as related specialized training, education, and research for HCPs. This specialization has been the basis for the broad system of affiliations between VA and academic systems.
The VA continues to be a high priority in the federal budget process.12 In 2017, slightly more than 9% of the VA health care budget, $6.4 billion, was spent on medical care in California.10 Consequently, California has a noteworthy portion of VA infrastructure (Table 3).13,14 California has 8 VA medical centers (VAMCs) with hospital service (Fresno, Loma Linda, Long Beach, Palo Alto, Sacramento, San Diego, San Francisco, West Los Angeles), 3 VAMCs without hospital service (2 locations in the Palo Alto system and Sepulveda), 1 stand-alone extended-care facility (Martinez Community Living Center), and 1 stand-alone residential care facility (San Diego Domiciliary).9 The vast VA infrastructure in California and large population of veterans creates a strong demand for HCPs in the state.
VA Education and Collaboration
VA has been training clinicians and scholars since 1946, when VA academic affiliations were established by Memorandum Number 2.15,16 Today, the VA is the largest educator of HCPs in the United States.17 In 2015, an estimated $10.3 to $12.5 billion was spent on mandatory Medicare graduate medical education (GME).18 In 2017, the VA spent $1.78 billion of discretionary funding on GME to fund 11,000 full-time equivalent (FTE) slots, leading to > 43,000 physician residents (> 30% of all physician residents) spending part of their training in a VHA facility.18,19
This training mission has multiple benefits. It provides the VA with access to new HCPs who have the necessary training in veteran-specific needs, while supporting the national need for HCPs. In 2018, 120,890 clinical trainees received some or all of their training in the VA system.20 Of the 152 US medical schools that are accredited by the Liaison Committee on Medical Education, 95% collaborate with the VA for training while 100% of the 34 doctor of osteopathic medicine programs have VA training collaborations.20 The VA currently has an additional 18 partnerships with nursing schools.21 Further, 1,800 college and universities, including Hispanic-serving institutions and historically black colleges and universities, have VHA affiliations that provide training for more than 40 clinical health profession education programs.17
This training model has been successful in supporting VA staffing, as health care providers who trained in the VA are more likely to work in the VA.22 Among current VA employees, > 80% of optometrists, > 70% of podiatrists and psychologists, and > 60% of physicians received some part of their training in the VA system.23 In combination with recent increased funding for staffing, the ability of the VA to directly hire trainees in identified professions, and the expansion of loan forgiveness to high-demand specialties (eg, psychiatry), the training partnership between the VA and affiliates has been critical in maintaining the needed VA workforce.22,24,25
The VA Office of Academic Affiliations is responsible for all graduate medical and dental education administration in the VA system, which makes up 85% of its total budget. For each trainee, the VA provides approximately $60,000 toward their stipend in exchange for training and patient care time at a VHA hospital (Kenneth R. Jones, PhD, email communication, August 27, 2018).
California Health Care Education
The UC public university system, founded in 1869, currently has 10 campuses with a combined student body of > 280,000 students, along with 227,000 faculty and staff members.26 For every research dollar provided by California, the UC secures $7 in federal and private funding.26 The UC has 6 medical centers (Davis, Irvine, Los Angeles, Riverside, San Diego, and San Francisco); each is affiliated with at least 1 local VAMC.27,28
California trains a substantial share of health care trainees. In 2016, there were 10,429 physician residents in training in California.29 In 2017/2018, the San Francisco VAMC trained 1,178 medical students/residents, 57 pharmacy students, 25 nurse practitioner students, 19 optometry interns/students/residents, 11 dental students/residents, and 3 physical therapy students.20 In total, 6,223 UC health professions students were trained in VHA facilities during the 2017/2018 training year (Table 4).20 As of 2016, there were 105,907 physicians in California, and of those, 57% completed their GME in California.29 In California in 2015, 74 GME-sponsoring institutions graduated 3,568 residents and fellows, an increase of 10% since 1997.30 Of these sponsoring institutions, 6 of the top 8 programs were UC schools that graduated 48.4% (1,727) of all California residents and fellows in 2015.30
Despite these resources, California faces a major shortage of HCPs, particularly in primary, behavioral health, and older adult care.3 Today, 7 million Californians live in counties with a federally designated shortage of primary, dental, and mental health care providers.3 Most of these Californians are Latino, African American, or Native American, and they live in fast-growing rural and urban regions, including Los Angeles; the San Joaquin Valley; and the Inland Empire (San Bernardino and Riverside Counties).3 Current recommendations to meet increasing demands as California’s population increases, grows older, and faces increased health care demands include expanding residency programs to yield 1,872 additional primary care physicians and 2,202 additional psychiatrists by 2030.3 To meet this shortage and prepare for future health care demands, health care education is paramount; in California, VA and UC affiliations are central to addressing these needs.
The VA plays a particularly important role in supporting GME, which is essential to meeting both VA and California’s unmet HCP needs, as GME determines the number of medical practitioners available per specialty.30 The VA was the second largest GME fund provider in California at $90,662,608 (Medicare provided $552,235,626) and the California government provided a small portion of GME funding.30 VA education funding is a direct result of the VA provision of clinical care in one of the most innovative and modern health care systems in the world.
These VA training opportunities benefit the UC system and California by helping train integrated care practitioners to meet the increasing demand. Integrated care—the coordination of mental health care, substance use disorder treatment, and primary care services—is designed to improve health outcomes by helping people with multiple and complex health care needs access care.31,32
As the largest integrated health care system in the country, the VA brings important clinical, research, and educational opportunities to academic affiliates. A systematic review examining cost and quality outcomes in integrated care systems found improved quality of care compared with nonintegrated care systems; thus, many US government agencies and the World Health Organization are establishing integrated care systems as a standard and universal approach.31,33,34 While cost savings as a result of integrated care are unclear, most studies in this review reported a decrease in utilization of services.33 The presumption of more efficient and higher quality care is also predicated on features such as system-wide accessibility of comprehensive medical records that provide more information to HCPs, promote collaboration, and measure and reward performance, all of which are possible using the VA electronic health record (EHR) system.35,36 The VA offers an excellent opportunity for training in integrated care as this model is required of all VAMCs and community-based outpatient clinics (CBOCs).37
Providing integrated care to the citizens of California is among the 10 priorities of the California Future Health Workforce Commission (a group of California health care leaders cochaired by the UC system president) for immediate action and guides their recommendations on developing and expanding the health care workforce; therefore, training in an integrated health care system is especially important for California HCPs.3 Nearly three-quarters of California’s population aged ≥ 65 years has a chronic health condition that could benefit from integrated care; however, the current supply of HCPs is insufficient to meet the growing demand for geriatric care.38,39
The VA has a robust training program to produce scholars and practitioners who specialize in geriatric care. This includes the Geriatric Scholars Program, which has the goal of integrating geriatrics into primary care through professional development. The Geriatric Scholars Program is a component of the VA Geriatric Research Education and Clinical Centers at urban VAMCs to help provide education and clinical resource connections with rural CBOCs where geriatrics expertise is lacking.
The California Future Health Workforce Commission is highlighting the need to prioritize workforce development in primary care, mental health care, and care for the aging.3 These priorities are shared as foundational services within the VHA.40 The alignment of these priorities creates an excellent rationale for increasing training and education of the UC health care workforce in the California VA system through academic affiliations.
VA Research Collaborations
The VA Office of Research and Development has existed for more than 90 years with a mission to improve veteran health and well-being via research and attract, train, and retain high-caliber researchers. VA provides a rich environment to conduct observational and interventional research due to its large, diverse veteran population, institutional support, and integrated information system with extensive EHR data.41 The success of the VA in facilitating research is evidenced by the fact that 3 VA investigators have been awarded Nobel prizes, and 7 have received Lasker Foundation Awards.42 The size of the VA allows for innovative large-scale research, such as the Million Veteran Program (MVP). The MVP study developed a mega-biobank of VA health records, questionnaires, and blood samples from nearly 1 million veterans to study genetic influences on health and disease and integrate genetic testing into health care delivery.43 In addition to producing high-quality, innovative research, more than 60% of VA investigators also provide direct patient care.42
VA research areas of focus include homelessness, polytrauma, traumatic brain injury, hearing and vision loss, spinal cord injury, mental health, pain management, precision medicine, prosthetics and amputation care, women’s health, and chronic diseases, such as Parkinson and Alzheimer diseases.44 The VA estimates that, in 2021, total VA research spending will include a request of $787 million in addition to $370 million from the National Institutes of Health, the Department of Defense, and the Centers for Disease Control and Prevention, and $170 million from other nonfederal sources, for a projected total of $1.3 billion. This budget will support 2,200 projects with direct research and reimbursable employment of 3,275 FTEs,which are key to supporting VA academic affiliations.45 These funds translate into substantial benefits to the UC system, including shared research and training resources, grant-funding opportunities for UC faculty, and the ability to recruit top researchers, educators, and clinicians to its institutions.
VA Reliance on Community Care
The current VHA model is an integrated health care system that provides comprehensive, wraparound services to enrolled veterans, which are cost-effective, high quality, and consistently found to have equal or superior quality of care compared with that in the community.6,46-50 Despite public criticism about wait times and access to care in the VA system, one study showed that VA wait-time statistics were comparable with or faster than those for community HCPs.51,52 However, VA care coordination has undergone several changes to address these public criticisms, namely, the Veterans Access, Choice and Accountability Act of 2014 (38 USC § 1703 VACAA) and the VA MISSION Act of 2018 (42 USC § 274). VACAA was designed to increase access to care for veterans who live ≥ 40 miles from VA health care facilities or who are unable to been seen within 30 days of their preferred or clinically appropriate date.53 More than 2 million veterans (almost 25% of VHA-enrolled veterans) have received community care since the inception of VACAA in 2014.54
Recently, the MISSION Act mandated developing additional VA-coordinated community-based care through the establishment of a Veterans Community Care Program, which was established using existing VA 2019 fiscal year funds and did not include additional appropriations despite expanded criteria for community care referrals.55 Without additional future appropriations, VA funds would be shifted from VA care into community care. While increasing access to community care has in some cases led to care that is faster and closer and that was previously inaccessible in local VA specialty care, these efforts could reduce veteran engagement with the VA system.56
The changes implemented in VACAA and the VA MISSION Act were driven by important and valid concerns, including evidence of VA staff and officials covering up service deficiencies.51 Veterans in rural areas often have limited access to VA resources, and long travel to VAMCs or clinics can be an impediment. Veterans who have chosen community care tended to be those who have poorer health status, who live further away from VA facilities, women, and those who identified as White or Hispanic.56,57 While VA health care is on average equivalent to or better than community resources, there is significant variability in quality within the VA system. Advocates have argued that providing competition and choice for veterans places pressure on the VA to improve care where it is not meeting expectations. Therefore, access to community care is an important resource for veterans and needs to be implemented effectively and efficiently to help veterans receive the care they need. However, expansion of community care access, depending on how it is implemented, also can have effects on academic partnerships and the education and research missions that should be incorporated into planning.
Each VA health care system receives funding through the Veterans Equitable Reimbursement Allocation (VERA), which provides funds largely based on the number of enrolled veterans and the complexity of the care they receive.58 One potential implication of the shift among veterans to community care is a reduction in patients enrolled in VA programs, thus decreasing funding given to the VA to allocate for training and research. By definition, increased VA-managed community care means less opportunity for integrated training that brings together primary, mental health, and substance use care to meet patient needs. The Center for Medicare and Medicaid Services has developed a national initiative to help states develop programs in integrated care, particularly for individuals who are eligible for both Medicare and Medicaid.59 For states to develop integrated care, they need trainees who function well in this model. Integrated care training is particularly vulnerable to disruption because any portion of a veteran’s care being transferred to the community can impede integration. In effect, training in integrated care, likely the most efficient and cost-effective approach to health care for reasons discussed earlier, could be reduced as providers and trainees are required to manage and coordinate patient care between separate institutions.35
Educational Impact
The shift in usage from VA to community care has potential implications for academic affiliates, particularly in education and research.60 If more people are served in community settings, potentially some VAMCs could be reduced, realigned, or closed. If this restructuring happens, academic partnerships could be impacted negatively. The VA is instituting an Infrastructure Review Commission with the task of examining current VA utilization. If a VA site with an academic affiliate was considered for realignment or closure, the reduction would eliminate the ability of the academic affiliate to provide education and research collaborations at that site.
In a less drastic manner, increasing care in the community may change opportunities for academic affiliates to partner with the VA. As noted, the UC system and California veterans benefit immensely from the VHA as an integrated health care system with dedicated missions of education and research. This partnership is a model in which the VA is the primary source of care for eligible enrolled veterans and provides integrated comprehensive services. If the VA moves to serving primarily as a coordinator of community HCPs rather than a direct provider of health care, academic affiliates would need to make major adjustments to both the education and training models. This change could particularly affect specialty training programs that rely on having adequate volumes of patients to provide an extensive experience to meet training needs. If fewer veterans receive care directly from the VA and are instead dispersed in the community, that will reduce the ability of academic faculty to participate in the education of medical and affiliated trainees and to participate in research in VA settings. It is unclear what other model could replace such a system and be as beneficial to the VA and the academic partners with which it is currently affiliated.
Given the needs that led to the VA increasing access to care and the potential implications discussed for the VA and partnerships with academic affiliates, VA health care systems and academic affiliate partners should consider several steps. These steps involve assessment, coordination, and promotion.
Both the VA and academic affiliates would benefit if the VA shared assessment data on the use of community care, particularly identifying changes that relate to key training and/or research missions. Such data sharing can be critical to determine whether any risks (or potential opportunities) need to be addressed. In addition, increasing research on the outcomes related to both VA care and community-based care is of high value to determine whether the current changes are achieving intended goals. The VA recently funded such work through its research service, and such work is critical for guiding future policy for the VA and for the affiliates.
Coordination among the VA, academic affiliates, and community partners is vital for change. The issue of community care expansion should be a standing item on coordination meetings and shared governance councils between the institutions. It may make sense to establish specific workgroups or committees to coordinate tracking and assessment of the effect of community care expansion on the shared academic mission. One way to address the potential effect of increased community care on the research and education missions would be to include community partners into the partnerships. This strategy could potentially take a number of different forms, from providing education and training to community HCPs, having VA trainees rotate to community settings, or inviting community settings to be research sites for clinical trials. Such partnerships could potentially improve patient care and support the other academic missions. Coordination could be meaningfully improved by having community HCPs access the VA EHR, thus easing communications. Funding is available for EHR access in the VA MISSION Act and should be a high priority as community care expands. The more that community partners can access and connect with the VA EHR the better they will be able to coordinate care.
Third, the VA and its academic partners need to promote and educate veterans, their families, and their advocates on the benefits that are available through VA care and that are enhanced through academic partnerships. While the VA has been the target of justified criticism, many of its strengths addressed here are not broadly recognized. The VA could promote its sharing of staff and resources with the top academic health care institutions in an area and that veterans often have access to resources that otherwise would not be available without the academic affiliate. Making sure veterans are aware of the benefits available can potentially mitigate the need for community care.
Conclusions
Given changes from VACAA and the VA MISSION Act, VA and academic affiliates should be active partners in planning for future health care by providing input and feedback on VA structure to help shape federal and state systems moving forward. Institutions can take steps to steer their futures and meet growing clinical, training, and research needs. The VA and its academic partners in health care research are well positioned to develop projects to assess the effects of these changes. Evaluation of key variables including patient care, education, and research productivity are warranted to guide policymakers as they assess whether these changes in the VA are achieving the expressed goals of improving veteran care. Other opportunities to collaborate in the wake of the MISSION Act remain to be discovered within each academic affiliation. By strengthening working relationships between VA and academic teams, these deeply important partnerships can continue to produce clinical, research, and education outcomes that meet the needs of our veterans, our federal and state health care systems, and our country.
Acknowledgments
Dr. Sells was supported by the Department of Veterans Affairs, Veterans Health Administration, Office of Academic Affiliations VA Quality Scholars Advanced Fellowship Program.
1. US Department of Veterans Affairs, Veterans Health Administration. About VHA. Updated January 22, 2021. Accessed March 9, 2021. https://www.va.gov/health/aboutvha.asp
2. National Academies of Sciences, Engineering, and Medicine; Health and Medicine Division; Board on Health Care Services; Committee to Evaluate the Department of Veterans Affairs Mental Health Services. Evaluation of the Department of Veterans Affairs Mental Health Services. National Academies Press; 2018. Accessed March 9, 2021. https://www.ncbi.nlm.nih.gov/books/NBK499502/
3. California Future Health Workforce Commission. Meeting the demand for health: final report of the California Future Health Workforce Commission. Published February 2019. Accessed March 9, 2021. https://futurehealthworkforce.org/wp-content/uploads/2019/03/MeetingDemandForHealthFinalReportCFHWC.pdf
4. US Department of Veterans Affairs. Veterans Health Administration fiscal year 2017 annual report. Published 2017. Accessed March 9, 2021. https://www.va.gov/HEALTH/docs/VHA_AnnualReport_FY2017.pdf
5. US Department of Veterans Affairs. Public health: health care use by Gulf War & OEF/OIF/OND veterans. Updated March 28, 2017. Accessed March 9, 2021. https://www.publichealth.va.gov/epidemiology/reports/health-care-use-gulfwar-oefoifond/index.asp
6. Eibner C, Krull H, Brown KM, et al. Current and projected characteristics and unique health care needs of the patient population served by the Department of Veterans Affairs. Rand Health Q. 2016;5(4):13.
7. US Department of Veterans Affairs. Patient care services: veterans with lesbian, gay, bisexual and transgender (LGBT) and related identities. Updated August 31, 2020. Accessed March 9, 2021. https://www.patientcare.va.gov/LGBT/index.asp
8. US Department of Veterans Affairs. Women veterans health care: women veterans program managers. Updated March 28, 2017. Accessed March 9, 2021. https://www.womens health.va.gov/WOMENSHEALTH/programoverview/wvpm.asp
9. US Department of Veterans Affairs, National Center for Veterans Analysis and Statistics. VA facilities by state. Published May 15, 2017. Accessed March 9, 2021. https://www.va.gov/vetdata/docs/SpecialReports/VA_Facilities_By_State.PDF
10. US Department of Veterans Affairs, National Center for Veterans Analysis and Statistics. State summaries: California. Published September 2018. Accessed March 9, 2021. https://www.va.gov/vetdata/docs/SpecialReports/State_Summaries_California.pdf
11. US Department of Veterans Affairs, Veterans Health Administration, Office of Patient Care Services, Post-Deployment Health Group, Epidemiology Program. Analysis of VA health care utilization among Operation Enduring Freedom (OEF), Operation Iraqi Freedom (OIF), and Operation New Dawn (OND) veterans. Published January 2017. Accessed March 9, 2021. https://www.publichealth.va.gov/docs/epidemiology/healthcare-utilization-report-fy2015-qtr3.pdf
12. US Department of Veterans Affairs, Office of Budget. Annual budget submission, president’s budget request – fiscal year 2021. Updated February 10, 2020. Accessed March 9, 2021. https://www.va.gov/budget/products.asp
13. US Department of Veterans Affairs. Department of Veterans Affairs statistics at a glance. Updated February 2020. Accessed March 10, 2021. https://www.va.gov/vetdata/docs/Quickfacts/Stats_at_a_glance_4_6_20.PDF
14. US Department of Veterans Affairs VW. Locations, California. Updated October 12, 2018. Accessed March 10, 2021. https://www.va.gov/directory/guide/state.asp?dnum=ALL&STATE=CA
15. Baker, R. R., & Pickren, W. E. (2007). Psychology and the Department of Veterans Affairs: A historical analysis of training, research, practice, and advocacy. American Psychological Association. doi:10.1037/11544-000
16. Functions of Veterans Health Administration: health-care personnel education and training programs. 38 USC § 7302. Accessed March 16, 2021. https://www.govinfo.gov/app/details/USCODE-2011-title38/USCODE-2011-title38-partV-chap73-subchapI-sec7302
17. US Department of Veterans Affairs, Office of Academic Affiliations. Mission of the Office of Academic Affiliations. Published September 24, 2019. Accessed March 10, 2021. https://www.va.gov/oaa/oaa_mission.asp
18. Congressional Research Service. Federal support for graduate medical education: an overview. CRS report R44376. Updated December 27, 2018. Accessed March 10, 2021. https://fas.org/sgp/crs/misc/R44376.pdf
19. Association of American Medical Colleges. 2018 Report on residents. Table B3: number of active residents, by type of medical school, GME specialty, and sex. Accessed March 10, 2021. https://www.aamc.org/data-reports/students-residents/interactive-data/table-b3-number-active-residents-type-medical-school-gme-specialty-and-sex
20. US Department of Veterans Affairs, Office of Academic Affiliations. National summary trainees unique school list - academic year: 2017-2018.
21. US Department of Veterans Affairs, Office of Academic Affiliations. VA nursing academic partnerships. Updated December 12, 2018. Accessed March 10, 2021. https://www.va.gov/oaa/vanap/default.asp
22. Keitz SA, Aron DC, Brannen JL, et al. Impact of clinical training on recruiting graduating health professionals. Am J Manag Care. 2019;25(4):e111-e118. Published 2019 Apr 1.
23. US Department of Veterans Affairs, Office of Academic Affiliations. Health professions education: academic year 2019-2020. Published 2020. https://www.va.gov/OAA/docs/OAA_Statistics_2020.pdf
24. US Department of Veterans Affairs, Veterans Health Administration. Hiring programs and initiatives. Updated March 10, 2021. Accessed March 10, 2021. https://www.vacareers.va.gov/Benefits/HiringProgramsInitiatives/
25. US Department of Veterans Affairs, Veterans Health Administration. Students and trainees. Updated March 10, 2021. Accessed March 10, 2021. https://www.vacareers.va.gov/Careers/StudentsTrainees
26. The Regents of the University of California. The UC system. Accessed March 10, 2021. https://www.universityofcalifornia.edu/uc-system
27. The Regents of the University of California. The parts of UC. Accessed March 10, 2021. https://www.universityofcalifornia.edu/uc-system/parts-of-uc
28. US Department of Veterans Affairs. Locations: VISN 21: Sierra Pacific Network. Updated October 12, 2018. Accessed March 10, 2021. https://www.va.gov/directory/guide/region.asp?ID=1021
29. Association of American Medical Colleges. California physician workforce profile. Published 2017. Accessed March 10, 2021. https://www.aamc.org/system/files/2019-08/california2017.pdf
30. Rittenhouse D, Ament A, Grumbach K, Petterson S, Levin Z, Bazemore A. California Health Care Foundation: guide to graduate medical education funding in California. Published September 2018. Accessed March 10, 2021. https://www.chcf.org/wp-content/uploads/2018/08/GuideGraduateMedicalEducationFunding.pdf
31. US Department of Health and Human Services, Health Resources and Services Administration. Integrated behavioral health resource library. Accessed March 18, 2020. https://www.hrsa.gov/behavioral-health/library
32. US Department of Veterans Affairs. Patient care services: primary care - mental health integration (PC-MHI). Updated August 1, 2016. Accessed March 10, 2021. https://www.patientcare.va.gov/primarycare/PCMHI.asp
33. Hwang W, Chang J, Laclair M, Paz H. Effects of integrated delivery system on cost and quality. Am J Manag Care. 2013;19(5):e175-e184.
34. World Health Organization, World Organization of Family Doctors (Wonca). Integrating mental health into primary care: a global perspective. Published October 2008. Accessed March 10, 2021. https://www.who.int/mental_health/policy/Integratingmhintoprimarycare2008_lastversion.pdf
35. Congressional Budget Office. Comparing the costs of the veterans’ health care system with private-sector costs. Published December 10, 2014. Accessed March 10, 2021. https://www.cbo.gov/publication/49763
36. Souden M. Overview of VA data, information systems, national databases and research uses. Published October 2, 2017. Accessed March 10, 2021. https://www.hsrd.research.va.gov/for_researchers/cyber_seminars/archives/2376-notes.pdf
37. US Department of Veterans Affairs, Veterans Health Administration. Uniform mental health services in VA medical centers and clinics. VHA handbook 1160.01. Published September 11, 2008. Recertified September 30, 2013. Amended November 16, 2015. Published September 11, 2008. Accessed March 10, 2021. https://www.va.gov/vhapublications/ViewPublication.asp?pub_ID=1762
38. Coffman JM, Fix M, Ko M. California physician supply and distribution: headed for a drought? Published June 25, 2018. Accessed March 10, 2021. https://www.chcf.org/publication/californias-physicians-headed-drought
39. Meng YY, Ahman T, Pickett M. California Health Care Foundation: 2015 Edition—Californians with the top chronic conditions: 11 million and counting. Published April 23, 2015. Accessed March 10, 2021. https://www.chcf.org/publication/2015-edition-californians-top-chronic-conditions-11-million-counting
40. US Department of Veterans Affairs. Department of Veterans Affairs FY 2018-2024 strategic plan. Updated May 31, 2019. Accessed March 10, 2021. https://www.va.gov/oei/docs/va2018-2024strategicplan.pdf
41. Justice AC, Erdos J, Brandt C, Conigliaro J, Tierney W, Bryant K. The Veterans Affairs healthcare system: a unique laboratory for observational and interventional research. Med Care. 2006;44(8)(suppl 2):S7-S12. doi:10.1097/01.mlr.0000228027.80012.c5
42. US Department of Veterans Affairs, Office of Research and Development: About the Office of Research & Development. Published Updated March 4, 2021. Accessed March 10, 2021. https://www.research.va.gov/about/default.cfm
43. Gaziano JM, Concato J, Brophy M, et al. Million Veteran Program: a mega-biobank to study genetic influences on health and disease. J Clin Epidemiol. 2016;70:214-223. doi:10.1016/j.jclinepi.2015.09.016
44. US Department of Veterans Affairs. VA research program overview. Accessed March 12, 2021. https://www.research.va.gov/pubs/docs/va-research-overview-brochure.pdf
45. US Department of Veterans Affairs. FY 2021 budget submission: medical programs and information technology programs. Volume 2 of 4. Published February 2020. Accessed March 12, 2021. https://www.va.gov/budget/docs/summary/fy2021VAbudgetVolumeIImedicalProgramsAndInformationTechnology.pdf
46. Trivedi AN, Matula S, Miake-Lye I, Glassman PA, Shekelle P, Asch S. Systematic review: comparison of the quality of medical care in Veterans Affairs and non-Veterans Affairs settings. Med Care. 2011;49(1):76-88. doi:10.1097/MLR.0b013e3181f53575
47. Nugent GN, Hendricks A, Nugent L, Render ML. Value for taxpayers’ dollars: what VA care would cost at Medicare prices. Med Care Res Rev. 2004;61(4):495-508. doi:10.1177/1077558704269795
48. Anhang Price R, Sloss EM, Cefalu M, Farmer CM, Hussey PS. Comparing quality of care in Veterans Affairs and non-Veterans Affairs settings. J Gen Intern Med. 2018;33(10):1631-1638. doi:10.1007/s11606-018-4433-7
49. O’Hanlon C, Huang C, Sloss E, et al. Comparing VA and non-VA quality of care: a systematic review. J Gen Intern Med. 2017;32(1):105-121. doi:10.1007/s11606-016-3775-2
50. Vanneman ME, Wagner TH, Shwartz M, et al. Veterans’ experiences with outpatient care: comparing the Veterans Affairs system with community-based care. Health Aff (Millwood). 2020;39(8):1368-1376. doi:10.1377/hlthaff.2019.01375
51. US Department of Veterans Affairs, Office of Inspector General. Veterans Health Administration interim report: review of patient wait times, scheduling practices, and alleged patient deaths at the Phoenix health care system. Published May 28, 2014. Accessed March 12, 2021. https://www.va.gov/oig/pubs/VAOIG-14-02603-178.pdf
52. Penn M, Bhatnagar S, Kuy S, et al. Comparison of wait times for new patients between the private sector and United States Department of Veterans Affairs medical centers. JAMA Netw Open. 2019;2(1):e187096. doi:10.1001/jamanetworkopen.2018.7096
53. US Department of Veterans Affairs. Fact sheet: Veterans Access, Choice and Accountability Act of 2014 (“Choice Act”). Accessed March 12, 2021. https://www.va.gov/opa/choiceact/documents/choice-act-summary.pdf
54. Mattocks KM, Cunningham K, Elwy AR, et al. Recommendations for the evaluation of cross-system care coordination from the VA State-of-the-art Working Group on VA/Non-VA Care. J Gen Intern Med. 2019;34(Suppl 1):18-23. doi:10.1007/s11606-019-04972-1
55. US Department of Veterans Affairs. Fact sheet: VA MISSION Act and new veterans community care program. Published June 15, 2018. Accessed March 12, 2021. https://www.va.gov/COMMUNITYCARE/docs/pubfiles/factsheets/FactSheet_20-13.pdf
56. Stroupe KT, Martinez R, Hogan TP, et al. Experiences with the veterans’ choice program. J Gen Intern Med. 2019;34(10):2141-2149. doi:10.1007/s11606-019-05224-y
57. Yoon J, Leung LB, Rubenstein LV, et al. Use of the veterans’ choice program and attrition from Veterans Health Administration primary care. Med Care. 2020;58(12):1091-1097. doi:10.1097/MLR.0000000000001401
58. US Department of Veterans Affairs. Veterans Equitable Resource Allocation (VERA). Updated March 9, 2021. Accessed March 12, 2021. https://catalog.data.gov/dataset/veterans-equitable-resource-allocation-vera
59. Integrated Care Resource Center. About us. Accessed March 12, 2021. https://www.integratedcareresourcecenter.com/about-us
60. Duhaney T. How veteran utilization of the Veterans Health Administration could impact privatization. Public Policy Aging Rep. 2020;30(1):29-35. doi:10.1093/ppar/prz032
Comparison of Dermatologist Ratings on Health Care–Specific and General Consumer Websites
Health care–specific (eg, Healthgrades, Zocdoc, Vitals, WebMD) and general consumer websites (eg, Google, Yelp) are popular platforms for patients to find physicians, schedule appointments, and review physician experiences. Patients find ratings on these websites more trustworthy than standardized surveys distributed by hospitals, but many physicians do not trust the reviews on these sites. For example, in a survey of both physicians (n=828) and patients (n=494), 36% of physicians trusted online reviews compared to 57% of patients.1 The objective of this study was to determine if health care–specific or general consumer websites more accurately reflect overall patient sentiment. This knowledge can help physicians who are seeking to improve the patient experience understand which websites have more accurate and trustworthy reviews.
Methods
A list of dermatologists from the top 10 most and least dermatologist–dense areas in the United States was compiled to examine different physician populations.2 Equal numbers of male and female dermatologists were randomly selected from the most dense areas. All physicians were included from the least dense areas because of limited sample size. Ratings were collected from websites most likely to appear on the first page of a Google search for a physician name, as these are most likely to be seen by patients. Descriptive statistics were generated to describe the study population; mean and median physician rating (using a scale of 1–5); SD; and minimum, maximum, and interquartile ranges. Spearman correlation coefficients were generated to examine the strength of association between ratings from website pairs. P<.05 was considered statistically significant, with analyses performed in R (3.6.2) for Windows (the R Foundation).
Results
A total of 167 representative physicians were included in this analysis; 141 from the most dense areas, and 26 from the least dense areas. The lowest average ratings for the entire sample and most dermatologist–dense areas were found on Yelp (3.61 and 3.60, respectively), and the lowest ratings in the least dermatologist–dense areas were found on Google (3.45)(Table 1). Correlation coefficient values were lowest for Zocdoc and Healthgrades (0.263) and highest for Vitals and WebMD (0.963)(Table 2). The health care–specific sites were closer to the overall average (4.06) than the general consumer sites (eFigure).
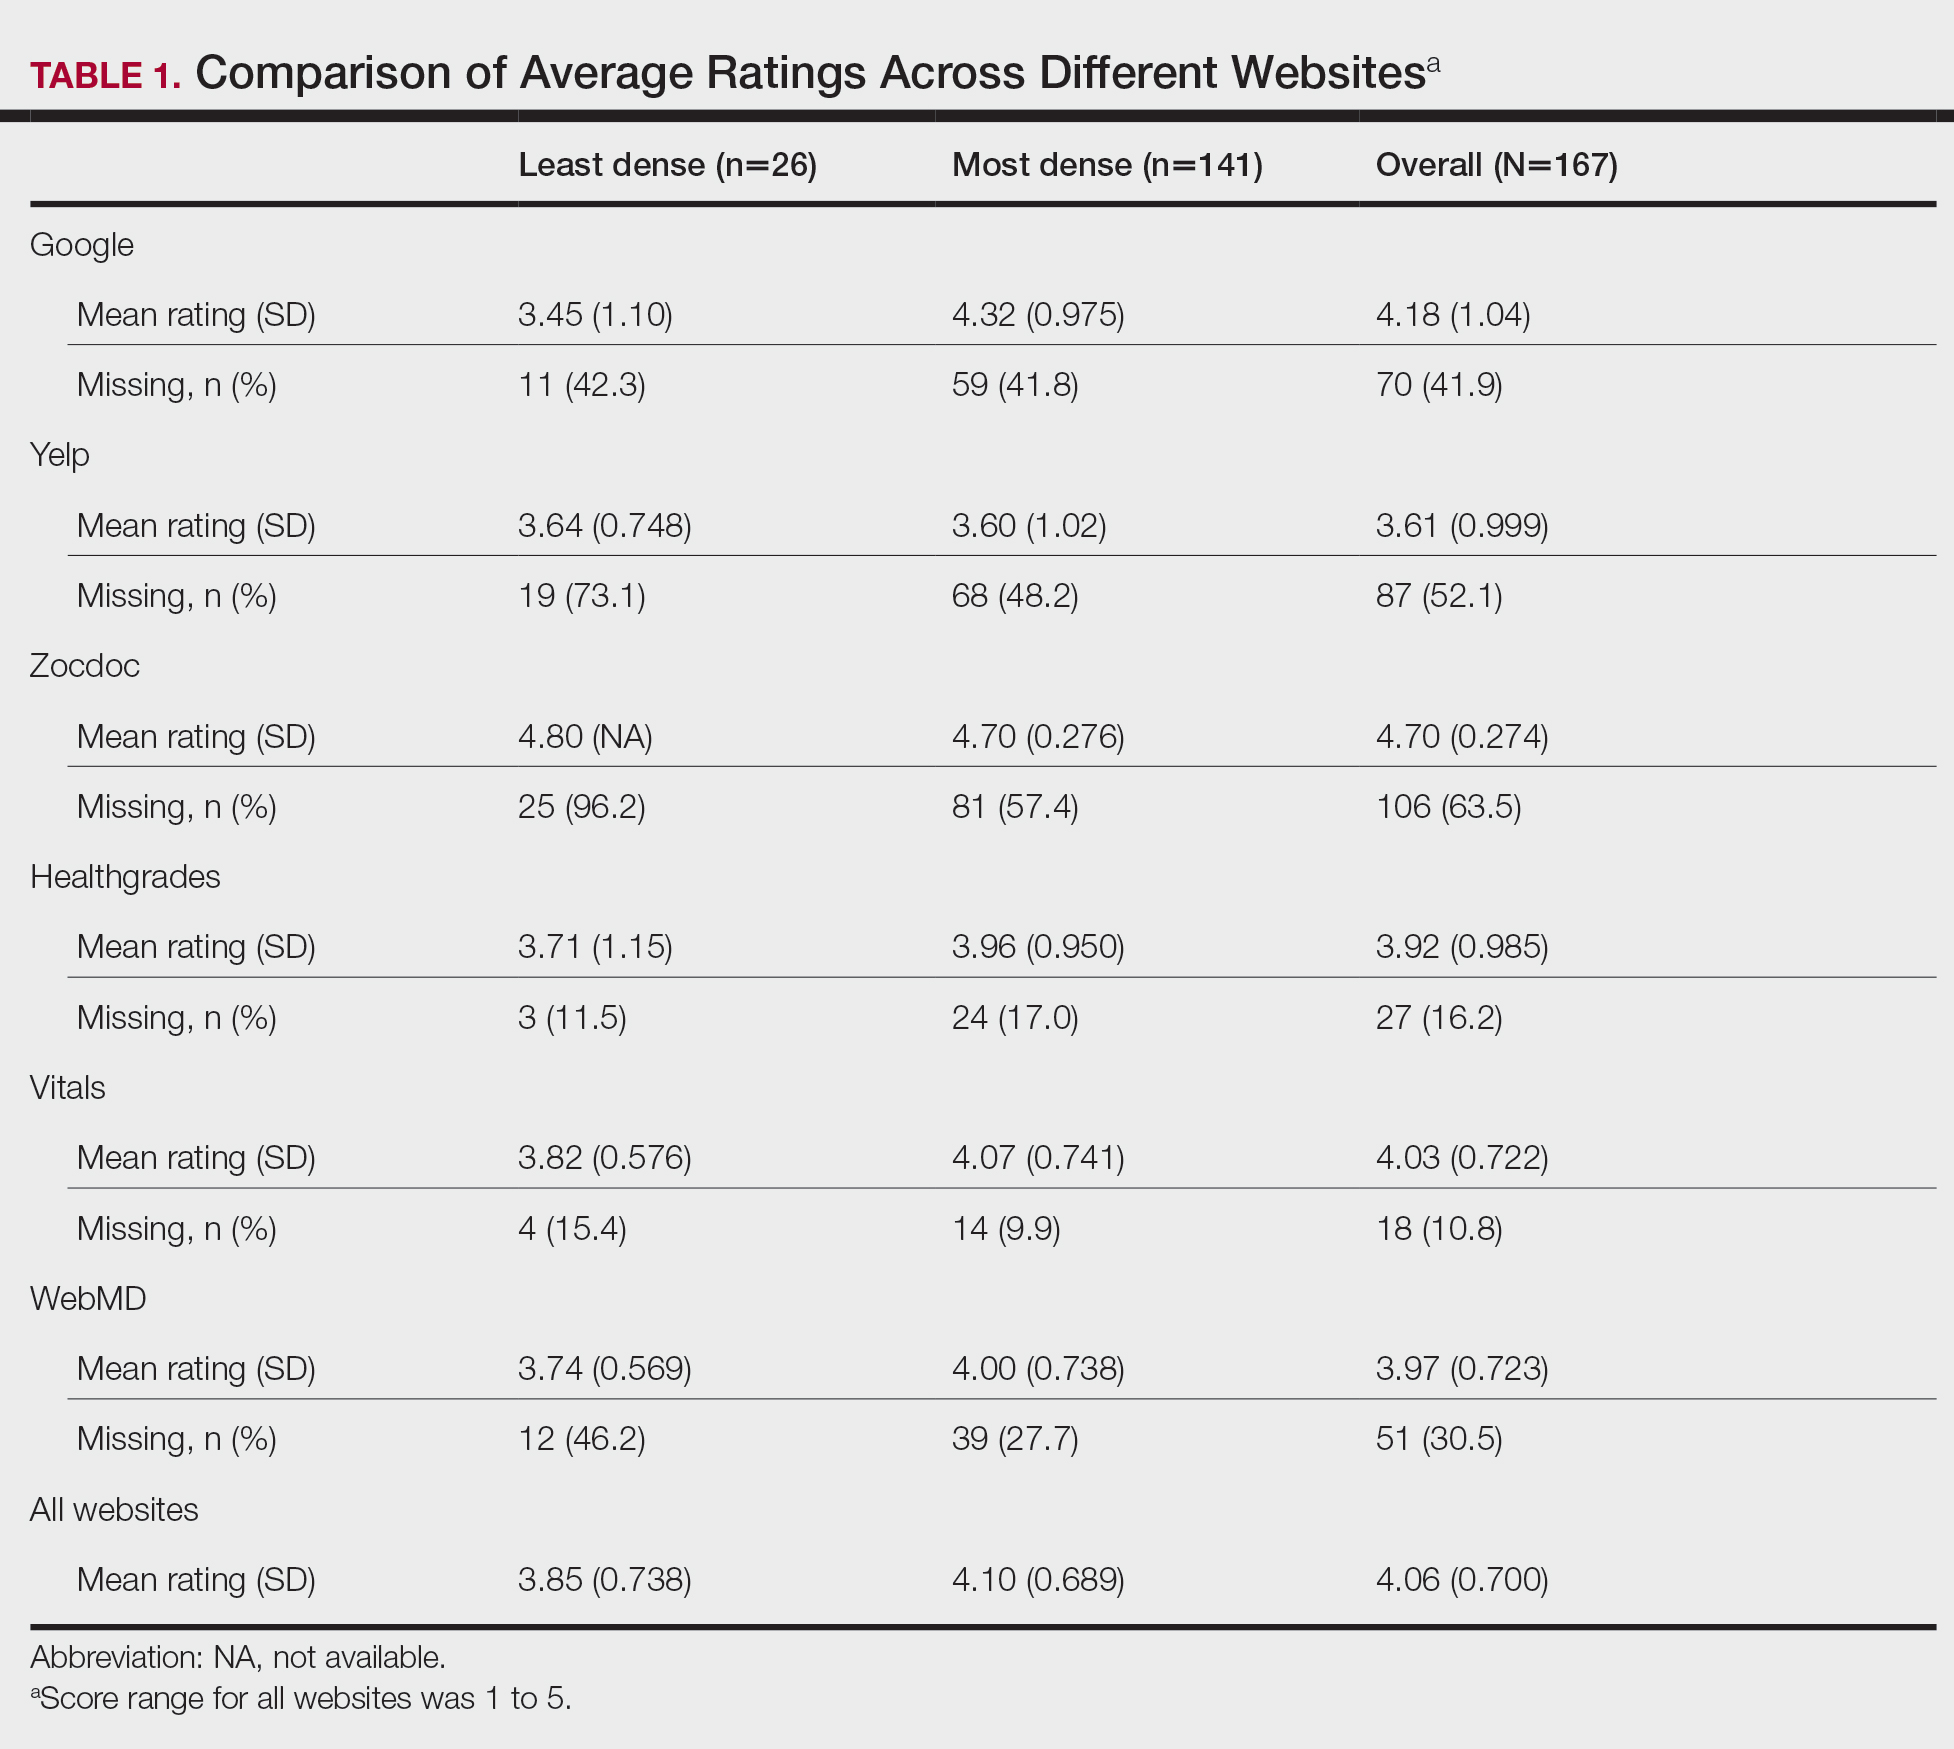
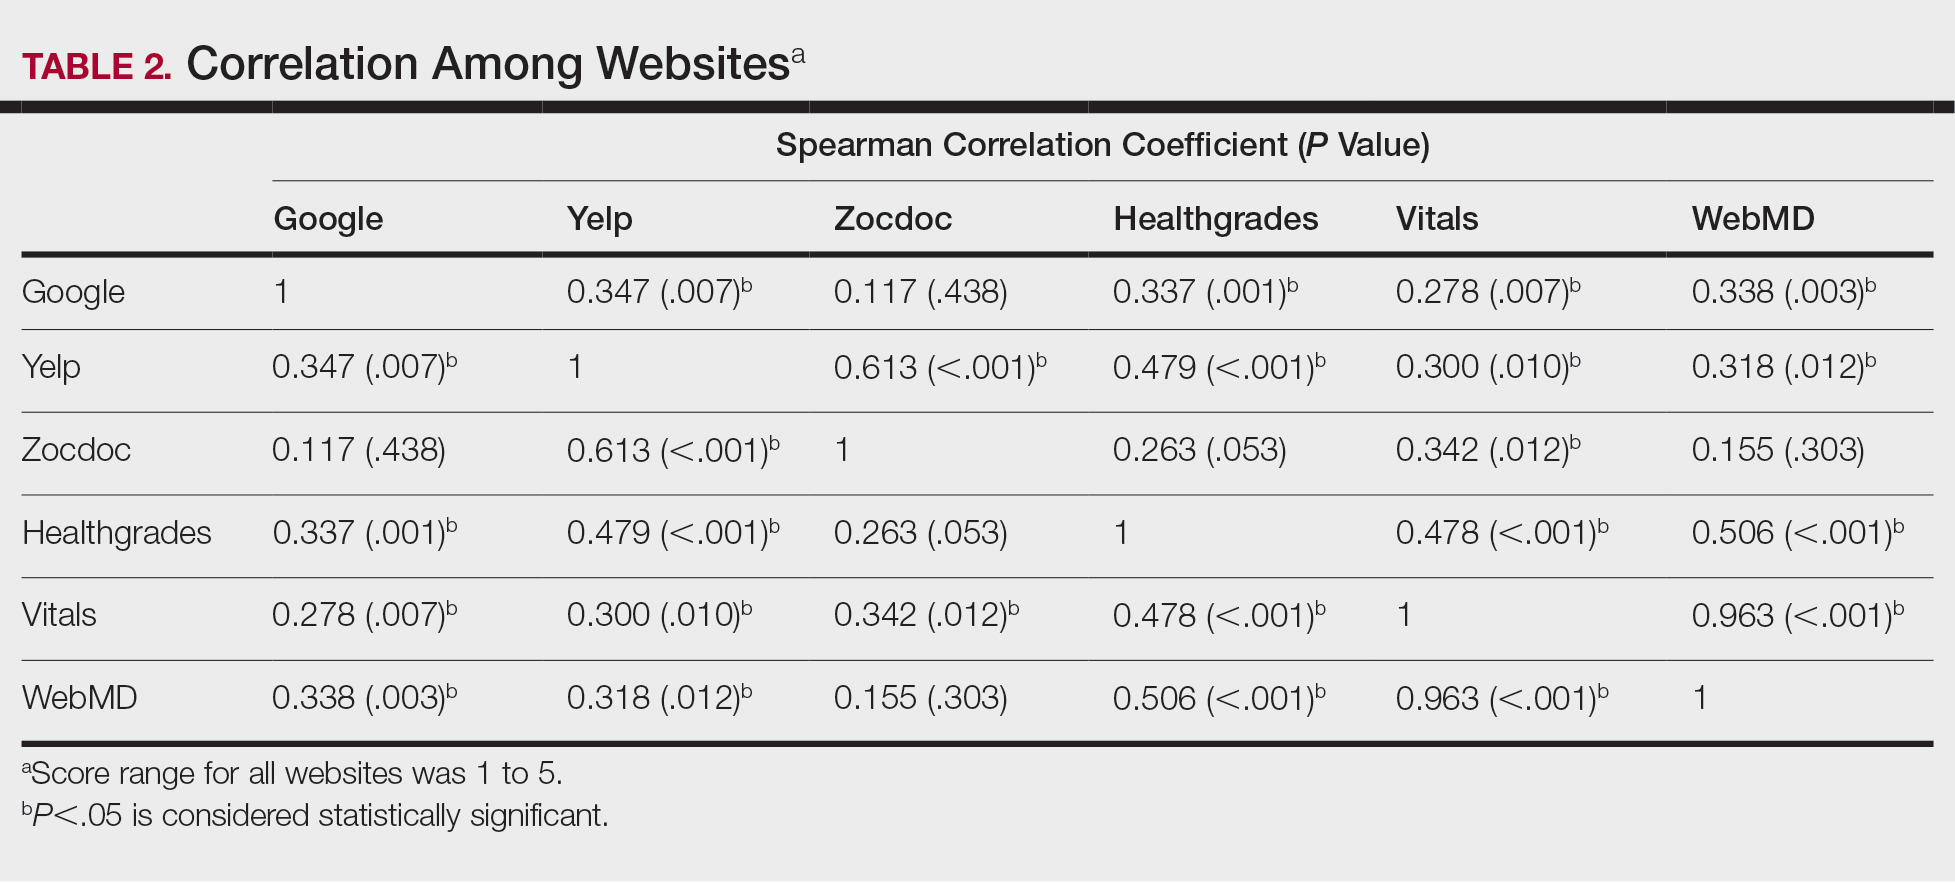
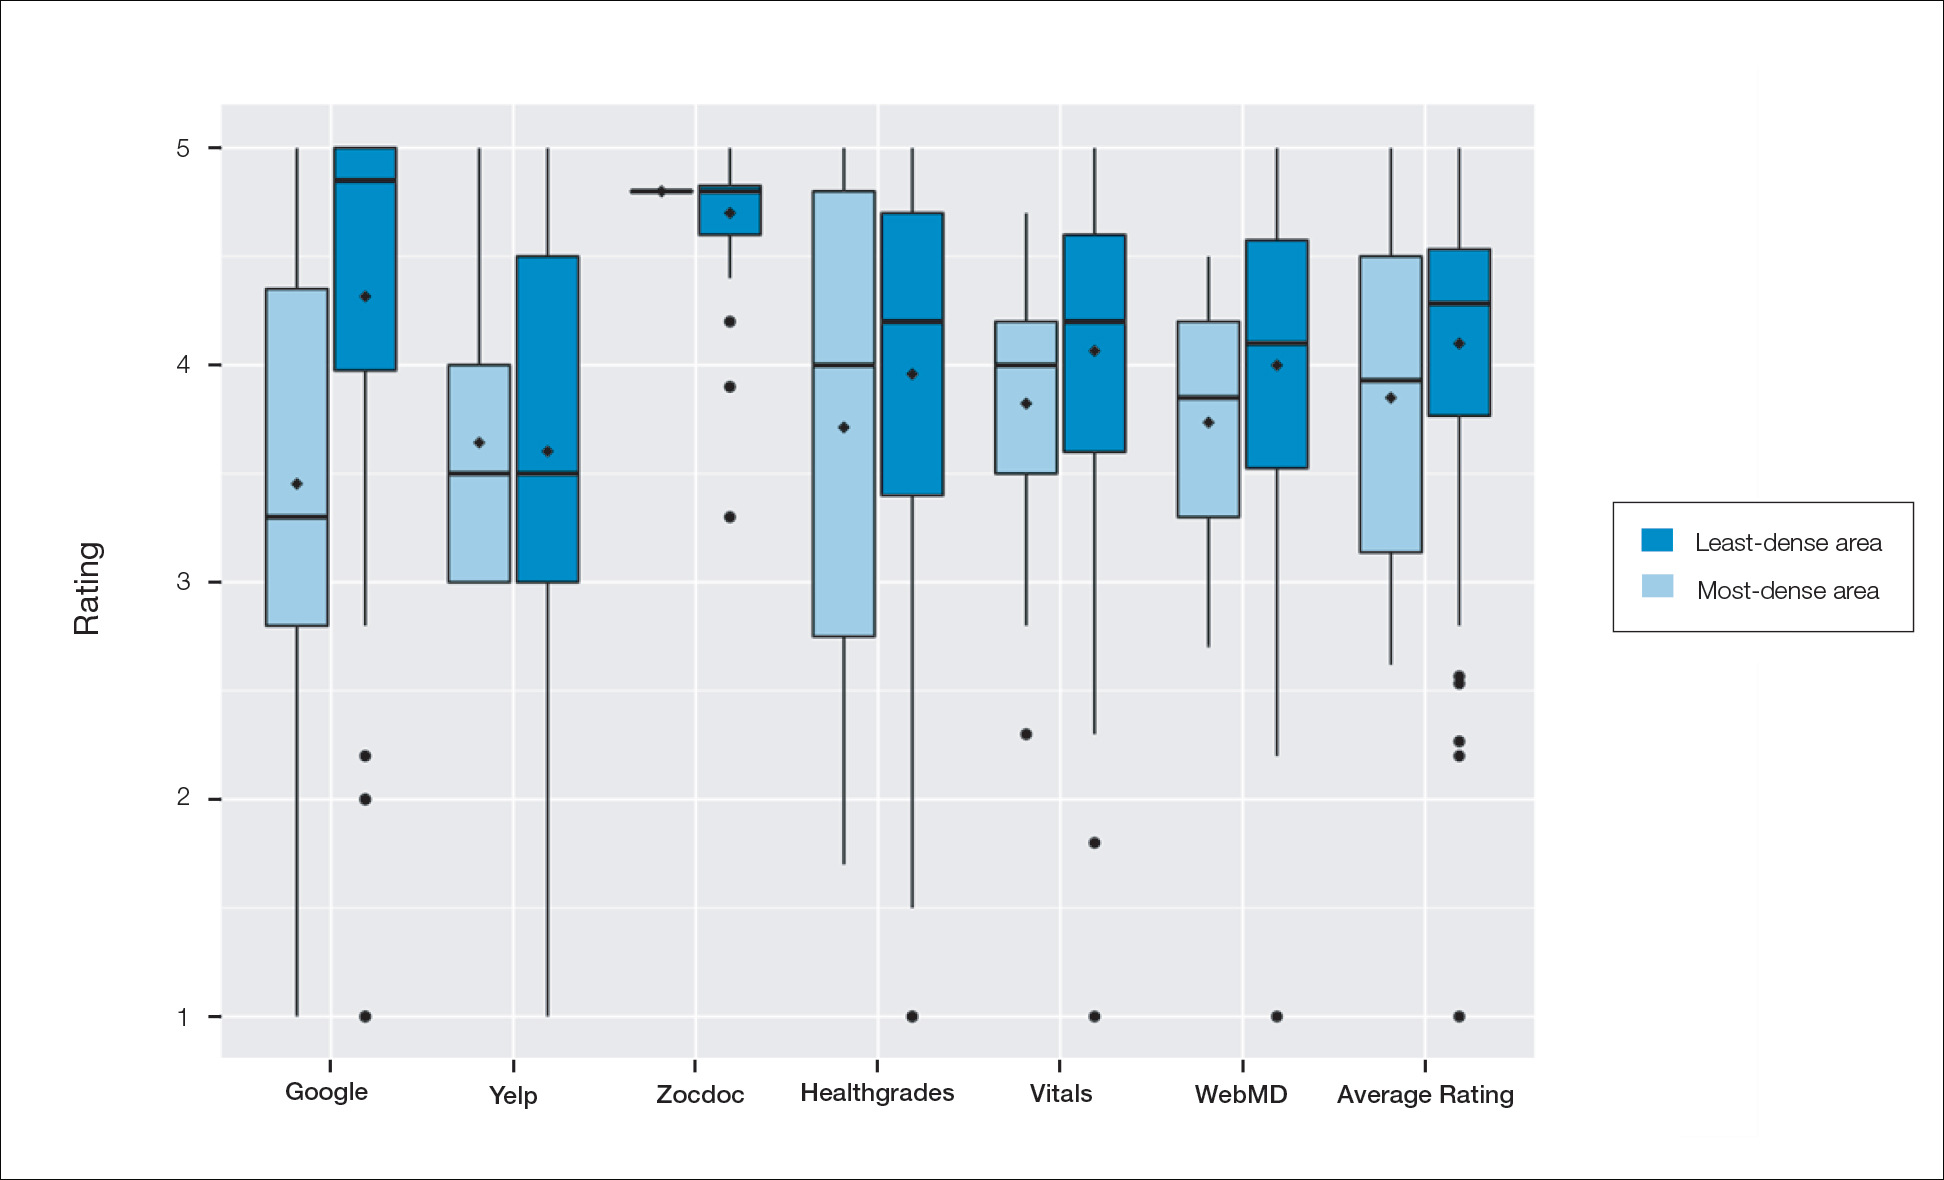
Comment
Although dermatologist ratings on each site had a broad range, we found that patients typically expressed negative interactions on general consumer websites rather than health care–specific websites. When comparing the ratings of the same group of dermatologists across different sites, ratings on health care–specific sites had a higher degree of correlation, with physician ratings more similar between 2 health care–specific sites and less similar between a health care–specific and a general consumer website. This pattern was consistent in both dermatologist-dense and dermatologist-poor areas, despite patients having varying levels of access to dermatologic care and medical resources and potentially different regional preferences of consumer websites. Taken together, these findings imply that health care–specific websites more consistently reflect overall patient sentiment.
Although one 2016 study comparing reviews of dermatology practices on Zocdoc and Yelp also demonstrated lower average ratings on Yelp,3 our study suggests that this trend is not isolated to these 2 sites but can be seen when comparing many health care–specific sites vs general consumer sites.
Our study compared ratings of dermatologists among popular websites to understand those that are most representative of patient attitudes toward physicians. These findings are important because online reviews reflect the entire patient experience, not just the patient-physician interaction, which may explain why physician scores on standardized questionnaires, such as Press Ganey surveys, do not correlate well with their online reviews.4 In a study comparing 98 physicians with negative online ratings to 82 physicians in similar departments with positive ratings, there was no significant difference in scores on patient-physician interaction questions on the Press Ganey survey.5 However, physicians who received negative online reviews scored lower on Press Ganey questions related to nonphysician interactions (eg, office cleanliness, interactions with staff).
The current study was subject to several limitations. Our analysis included all physicians in our random selection without accounting for those physicians with a greater online presence who might be more cognizant of these ratings and try to manipulate them through a reputation-management company or public relations consultant.
Conclusion
Our study suggests that consumer websites are not primarily used by disgruntled patients wishing to express grievances; instead, on average, most physicians received positive reviews. Furthermore, health care–specific websites show a higher degree of concordance than and may more accurately reflect overall patient attitudes toward their physicians than general consumer sites. Reviews from these health care–specific sites may be more helpful than general consumer websites in allowing physicians to understand patient sentiment and improve patient experiences.
- Frost C, Mesfin A. Online reviews of orthopedic surgeons: an emerging trend. Orthopedics. 2015;38:e257-e262. doi:10.3928/01477447-20150402-52
- Waqas B, Cooley V, Lipner SR. Association of sex, location, and experience with online patient ratings of dermatologists. J Am Acad Dermatol. 2020;83:954-955.
- Smith RJ, Lipoff JB. Evaluation of dermatology practice online reviews: lessons from qualitative analysis. JAMA Dermatol. 2016;152:153-157. doi:10.1001/jamadermatol.2015.3950
- Chen J, Presson A, Zhang C, et al. Online physician review websites poorly correlate to a validated metric of patient satisfaction. J Surg Res. 2018;227:1-6.
- Widmer RJ, Maurer MJ, Nayar VR, et al. Online physician reviews do not reflect patient satisfaction survey responses. Mayo Clinic Proc. 2018;93:453-457.
Health care–specific (eg, Healthgrades, Zocdoc, Vitals, WebMD) and general consumer websites (eg, Google, Yelp) are popular platforms for patients to find physicians, schedule appointments, and review physician experiences. Patients find ratings on these websites more trustworthy than standardized surveys distributed by hospitals, but many physicians do not trust the reviews on these sites. For example, in a survey of both physicians (n=828) and patients (n=494), 36% of physicians trusted online reviews compared to 57% of patients.1 The objective of this study was to determine if health care–specific or general consumer websites more accurately reflect overall patient sentiment. This knowledge can help physicians who are seeking to improve the patient experience understand which websites have more accurate and trustworthy reviews.
Methods
A list of dermatologists from the top 10 most and least dermatologist–dense areas in the United States was compiled to examine different physician populations.2 Equal numbers of male and female dermatologists were randomly selected from the most dense areas. All physicians were included from the least dense areas because of limited sample size. Ratings were collected from websites most likely to appear on the first page of a Google search for a physician name, as these are most likely to be seen by patients. Descriptive statistics were generated to describe the study population; mean and median physician rating (using a scale of 1–5); SD; and minimum, maximum, and interquartile ranges. Spearman correlation coefficients were generated to examine the strength of association between ratings from website pairs. P<.05 was considered statistically significant, with analyses performed in R (3.6.2) for Windows (the R Foundation).
Results
A total of 167 representative physicians were included in this analysis; 141 from the most dense areas, and 26 from the least dense areas. The lowest average ratings for the entire sample and most dermatologist–dense areas were found on Yelp (3.61 and 3.60, respectively), and the lowest ratings in the least dermatologist–dense areas were found on Google (3.45)(Table 1). Correlation coefficient values were lowest for Zocdoc and Healthgrades (0.263) and highest for Vitals and WebMD (0.963)(Table 2). The health care–specific sites were closer to the overall average (4.06) than the general consumer sites (eFigure).
Comment
Although dermatologist ratings on each site had a broad range, we found that patients typically expressed negative interactions on general consumer websites rather than health care–specific websites. When comparing the ratings of the same group of dermatologists across different sites, ratings on health care–specific sites had a higher degree of correlation, with physician ratings more similar between 2 health care–specific sites and less similar between a health care–specific and a general consumer website. This pattern was consistent in both dermatologist-dense and dermatologist-poor areas, despite patients having varying levels of access to dermatologic care and medical resources and potentially different regional preferences of consumer websites. Taken together, these findings imply that health care–specific websites more consistently reflect overall patient sentiment.
Although one 2016 study comparing reviews of dermatology practices on Zocdoc and Yelp also demonstrated lower average ratings on Yelp,3 our study suggests that this trend is not isolated to these 2 sites but can be seen when comparing many health care–specific sites vs general consumer sites.
Our study compared ratings of dermatologists among popular websites to understand those that are most representative of patient attitudes toward physicians. These findings are important because online reviews reflect the entire patient experience, not just the patient-physician interaction, which may explain why physician scores on standardized questionnaires, such as Press Ganey surveys, do not correlate well with their online reviews.4 In a study comparing 98 physicians with negative online ratings to 82 physicians in similar departments with positive ratings, there was no significant difference in scores on patient-physician interaction questions on the Press Ganey survey.5 However, physicians who received negative online reviews scored lower on Press Ganey questions related to nonphysician interactions (eg, office cleanliness, interactions with staff).
The current study was subject to several limitations. Our analysis included all physicians in our random selection without accounting for those physicians with a greater online presence who might be more cognizant of these ratings and try to manipulate them through a reputation-management company or public relations consultant.
Conclusion
Our study suggests that consumer websites are not primarily used by disgruntled patients wishing to express grievances; instead, on average, most physicians received positive reviews. Furthermore, health care–specific websites show a higher degree of concordance than and may more accurately reflect overall patient attitudes toward their physicians than general consumer sites. Reviews from these health care–specific sites may be more helpful than general consumer websites in allowing physicians to understand patient sentiment and improve patient experiences.
- Frost C, Mesfin A. Online reviews of orthopedic surgeons: an emerging trend. Orthopedics. 2015;38:e257-e262. doi:10.3928/01477447-20150402-52
- Waqas B, Cooley V, Lipner SR. Association of sex, location, and experience with online patient ratings of dermatologists. J Am Acad Dermatol. 2020;83:954-955.
- Smith RJ, Lipoff JB. Evaluation of dermatology practice online reviews: lessons from qualitative analysis. JAMA Dermatol. 2016;152:153-157. doi:10.1001/jamadermatol.2015.3950
- Chen J, Presson A, Zhang C, et al. Online physician review websites poorly correlate to a validated metric of patient satisfaction. J Surg Res. 2018;227:1-6.
- Widmer RJ, Maurer MJ, Nayar VR, et al. Online physician reviews do not reflect patient satisfaction survey responses. Mayo Clinic Proc. 2018;93:453-457.
Practice Points
- Online physician-rating websites are commonly used by patients to find physicians and review experiences.
- Health care–specific sites may more accurately reflect patient sentiment than general consumer sites.
- Dermatologists can use health care–specific sites to understand patient sentiment and learn how to improve patient experiences.
An Analysis of the Involvement and Attitudes of Resident Physicians in Reporting Errors in Patient Care
From Adelante Healthcare, Mesa, AZ (Dr. Chin), University Hospitals of Cleveland, Cleveland, OH (Drs. Delozier, Bascug, Levine, Bejanishvili, and Wynbrandt and Janet C. Peachey, Rachel M. Cerminara, and Sharon M. Darkovich), and Houston Methodist Hospitals, Houston, TX (Dr. Bhakta).
Abstract
Background: Resident physicians play an active role in the reporting of errors that occur in patient care. Previous studies indicate that residents significantly underreport errors in patient care.
Methods: Fifty-four of 80 eligible residents enrolled at University Hospitals–Regional Hospitals (UH-RH) during the 2018-2019 academic year completed a survey assessing their knowledge and experience in completing Patient Advocacy and Shared Stories (PASS) reports, which serve as incident reports in the UH health system in reporting errors in patient care. A series of interventions aimed at educating residents about the PASS report system were then conducted. The 54 residents who completed the first survey received it again 4 months later.
Results: Residents demonstrated greater understanding of when filing PASS reports was appropriate after the intervention, as significantly more residents reported having been involved in a situation where they should have filed a PASS report but did not (P = 0.036).
Conclusion: In this study, residents often did not report errors in patient care because they simply did not know the process for doing so. In addition, many residents often felt that the reporting of patient errors could be used as a form of retaliation.
Keywords: resident physicians; quality improvement; high-value care; medical errors; patient safety.
Resident physicians play a critical role in patient care. Residents undergo extensive supervised training in order to one day be able to practice medicine in an unsupervised setting, with the goal of providing the highest quality of care possible. One study reported that primary care provided by residents in a training program is of similar or higher quality than that provided by attending physicians.1
Besides providing high-quality care, it is important that residents play an active role in the reporting of errors that occur regarding patient care as well as in identifying events that may compromise patient safety and quality.2 In fact, increased reporting of patient errors has been shown to decrease liability-related costs for hospitals.3 Unfortunately, physicians, and residents in particular, have historically been poor reporters of errors in patient care.4 This is especially true when comparing physicians to other health professionals, such as nurses, in error reporting.5
Several studies have examined the involvement of residents in reporting errors in patient care. One recent study showed that a graduate medical education financial incentive program significantly increased the number of patient safety events reported by residents and fellows.6 This study, along with several others, supports the concept of using incentives to help improve the reporting of errors in patient care for physicians in training.7-10 Another study used Quality Improvement Knowledge Assessment Tool (QIKAT) scores to assess quality improvement (QI) knowledge. The study demonstrated that self-assessment scores of QI skills using QIKAT scores improved following a targeted intervention.11 Because further information on the involvement and attitudes of residents in reporting errors in patient care is needed, University Hospitals of Cleveland (UH) designed and implemented a QI study during the 2018-2019 academic year. This prospective study used anonymous surveys to objectively examine the involvement and attitudes of residents in reporting errors in patient care.
Methods
The UH health system uses Patient Advocacy and Shared Stories (PASS) reports as incident reports to not only disclose errors in patient care but also to identify any events that may compromise patient safety and quality. Based on preliminary review, nurses, ancillary staff, and administrators file the majority of PASS reports.
The study group consisted of residents at University Hospitals–Regional Hospitals (UH-RH), which is comprised of 2 hospitals: University Hospitals–Richmond Medical Center (UH-RMC) and University Hospitals –Bedford Medical Center (UH-BMC). UH-RMC and UH-BMC are 2 medium-sized university-affiliated community hospitals located in the Cleveland metropolitan area in Northeast Ohio. Both serve as clinical training sites for Case Western Reserve University School of Medicine and Lake Erie College of Osteopathic Medicine, the latter of which helped fund this study. The study was submitted to the Institutional Review Board (IRB) of University Hospitals of Cleveland and granted “not human subjects research” status as a QI study.
Surveys
UH-RH offers residency programs in dermatology, emergency medicine, family medicine, internal medicine, orthopedic surgery, and physical medicine and rehabilitation, along with a 1-year transitional/preliminary year. A total of 80 residents enrolled at UH-RH during the 2018-2019 academic year. All 80 residents at UH-RH received an email in December 2018 asking them to complete an anonymous survey regarding the PASS report system. The survey was administered using the REDCap software system and consisted of 15 multiple-choice questions. As an incentive for completing the survey, residents were offered a $10 Amazon gift card. The gift cards were funded through a research grant from Lake Erie College of Osteopathic Medicine. Residents were given 1 week to complete the survey. At the end of the week, 54 of 80 residents completed the first survey.
Following the first survey, efforts were undertaken by the study authors, in conjunction with the quality improvement department at UH-RH, to educate residents about the PASS report system. These interventions included giving a lecture on the PASS report system during resident didactic sessions, sending an email to all residents about the PASS report system, and providing residents an opportunity to complete an optional online training course regarding the PASS report system. As an incentive for completing the online training course, residents were offered a $10 Amazon gift card. As before, the gift cards were funded through a research grant from Lake Erie College of Osteopathic Medicine.
A second survey was administered in April 2019, 4 months after the first survey. To determine whether the intervention made an impact on the involvement and attitudes of residents in the reporting errors in patient care, only residents who completed the first survey were sent the second survey. The second survey consisted of the same questions as the first survey and was also administered using the REDCap software system. As an incentive for completing the survey, residents were offered another $10 Amazon gift card, again were funded through a research grant from Lake Erie College of Osteopathic Medicine. Residents were given 1 week to complete the survey.
Analysis
Chi-square analyses were utilized to examine differences between preintervention and postintervention responses across categories. All analyses were conducted using R statistical software, version 3.6.1 (R Foundation for Statistical Computing).
Results
A total of 54 of 80 eligible residents responded to the first survey (Table). Twenty-nine of 54 eligible residents responded to the second survey. Postintervention, significantly more residents indicated being involved in a situation where they should have filed a PASS report but did not (58.6% vs 53.7%; P = 0.036). Improvement was seen in PASS knowledge postintervention, where fewer residents reported not knowing how to file a PASS report (31.5% vs 55.2%; P = 0.059). No other improvements were significant, nor were there significant differences in responses between any other categories pre- and postintervention.

Discussion
Errors in patient care are a common occurrence in the hospital setting. Reporting errors when they happen is important for hospitals to gain data and better care for patients, but studies show that patient errors are usually underreported. This is concerning, as data on errors and other aspects of patient care are needed to inform quality improvement programs.
This study measured residents’ attitudes and knowledge regarding the filing of a PASS report. It also aimed to increase both the frequency of and knowledge about filing a PASS report with interventions. The results from each survey indicated a statistically significant increase in knowledge of when to file a PASS report. In the first survey, 53.7% of residents responded they they were involved in an instance where they should have filed a PASS report but did not. In the second survey, 58.5% of residents reported being involved in an instance where they should have filed a PASS report but did not. This difference was statistically significant (P = 0.036), sugesting that the intervention was successful at increasing residents’ knowledge regarding PASS reports and the appropriate times to file a PASS report.
The survey results also showed a trend toward increasing aggregate knowledge level of how to file PASS reports on the first survey and second surveys (from 31.5% vs 55.2%. This demonstrates an increase in knowledge of how to file a PASS report among residents at our hospital after the intervention. It should be noted that the intervention that was performed in this study was simple, easy to perform, and can be completed at any hospital system that uses a similar system for reporting patient errors.
Another important trend indicating the effectiveness of the intervention was a 15% increase in knowledge of what the PASS report acronym stands for, along with a 13.1% aggregate increase in the number of residents who filed a PASS report. This indicated that residents may have wanted to file a PASS report previously but simply did not know how to until the intervention. In addition, there was also a decrease in the aggregate percentages of residents who had never filed a PASS report and an increase in how many PASS reports were filed.
While PASS reports are a great way for hospitals to gain data and insight into problems at their sites, there was also a negative view of PASS reports. For example, a large percentage of residents indicated that filing a PASS report would not make any difference and that PASS reports are often used as a form of retaliation, either against themselves as the submitter or the person(s) mentioned in the PASS report. More specifically, more than 50% of residents felt that PASS reports were sometimes or often used as a form of retaliation against others. While many residents correctly identified in the survey that PASS reports are not equivalent to a “write-up,” it is concerning that they still feel there is a strong potential for retaliation when filing a PASS report. This finding is unfortunate but matches the results of a multicenter study that found that 44.6% of residents felt uncomfortable reporting patient errors, possibly secondary to fear of retaliation, along with issues with the reporting system.12
It is interesting to note that a minority of residents indicated that they feel that PASS reports are filed as often as they should be (25.9% on first survey and 24.1% on second survey). This is concerning, as the data gathered through PASS reports is used to improve patient care. However, the percentage reported in our study, although low, is higher than that reported in a similar study involving patients with Medicare insurance, which showed that only 14% of patient safety events were reported.13 These results demonstrate that further interventions are necessary in order to ensure that a PASS report is filed each time a patient safety event occurs.
Another finding of note is that the majority of residents also feel that the process of filing a PASS report is too time consuming. The majority of residents who have completed a PASS report stated that it took them between 10 and 20 minutes to complete a PASS report, but those same individuals also feel that it should take < 10 minutes to complete a PASS report. This is an important issue for hospital systems to address. Reducing the time it takes to file a PASS report may facilitate an increase in the amount of PASS reports filed.
We administered our surveys using email outreach to residents asking them to complete an anonymous online survey regarding the PASS report system using the REDCap software system. Researchers have various ways of administering surveys, ranging from paper surveys, emails, and even mobile apps. One study showed that online surveys tend to have higher response rates compared to non-online surveys, such as paper surveys and telephone surveys, which is likely due to the ease of use of online surveys.14 At the same time, unsolicited email surveys have been shown to have a negative influence on response rates. Mobile apps are a new way of administering surveys. However, research has not found any significant difference in the time required to complete the survey using mobile apps compared to other forms of administering surveys. In addition, surveys using mobile apps did not have increased response rates compared to other forms of administering surveys.15
To increase the response rate of our surveys, we offered gift cards to the study population for completing the survey. Studies have shown that surveys that offer incentives tend to have higher response rates than surveys that do not.16 Also, in addition to serving as a method for gathering data from our study population, we used our surveys as an intervention to increase awareness of PASS reporting, as reported in other studies. For example, another study used the HABITS questionnaire to not only gather information about children’s diet, but also to promote behavioral change towards healthy eating habits.17
This study had several limitations. First, the study was conducted using an anonymous online survey, which means we could not clarify questions that residents found confusing or needed further explanation. For example, 17 residents indicated in the first survey that they knew how to PASS report, but 19 residents indicated in the same survey that they have filed a PASS report in the past.
A second limitation of the study was that fewer residents completed the second survey (29 of 54 eligible residents) compared to the first survey (54 of 80 eligible residents). This may have impacted the results of the analysis, as certain findings were not statistically significant, despite trends in the data.
A third limitation of the study is that not all of the residents that completed the first and second surveys completed the entire intervention. For example, some residents did not attend the didactic lecture discussing PASS reports, and as such may not have received the appropriate training prior to completing the second survey.
The findings from this study can be used by the residency programs at UH-RH and by residency programs across the country to improve the involvement and attitudes of residents in reporting errors in patient care. Hospital staff need to be encouraged and educated on how to better report patient errors and the importance of reporting these errors. It would benefit hospital systems to provide continued and targeted training to familiarize physicians with the process of reporting patient errors, and take steps to reduce the time it takes to report patient errors. By increasing the reporting of errors, hospitals will be able to improve patient care through initiatives aimed at preventing errors.
Conclusion
Residents play an important role in providing high-quality care for patients. Part of providing high-quality care is the reporting of errors in patient care when they occur. Physicians, and in particular, residents, have historically underreported errors in patient care. Part of this underreporting results from residents not knowing or understanding the process of filing a report and feeling that the reports could be used as a form of retaliation. For hospital systems to continue to improve patient care, it is important for residents to not only know how to report errors in patient care but to feel comfortable doing so.
Corresponding author: Andrew J. Chin, DO, MS, MPH, Department of Internal Medicine, Adelante Healthcare, 1705 W Main St, Mesa, AZ 85201; anchin@adelantehealthcare.com.
Financial disclosures: None.
Funding: This study was funded by a research grant provided by Lake Eric College of Osteopathic Medicine to Andrew J. Chin and Anish Bhakta.
1. Zallman L, Ma J, Xiao L, Lasser KE. Quality of US primary care delivered by resident and staff physicians. J Gen Intern Med. 2010;25(11):1193-1197.
2. Bagain JP. The future of graduate medical education: a systems-based approach to ensure patient safety. Acad Med. 2015;90(9):1199-1202.
3. Kachalia A, Kaufman SR, Boothman R, et al. Liability claims and costs before and after implementation of a medical disclosure program. Ann Intern Med. 2010;153(4):213-221.
4. Kaldjian LC, Jones EW, Wu BJ, et al. Reporting medical errors to improve patient safety: a survey of physicians in teaching hospitals. Arch Intern Med. 2008;168(1):40-46.
5. Rowin EJ, Lucier D, Pauker SG, et al. Does error and adverse event reporting by physicians and nurses differ? Jt Comm J Qual Patient Saf. 2008;34(9):537-545.
6. Turner DA, Bae J, Cheely G, et al. Improving resident and fellow engagement in patient safety through a graduate medical education incentive program. J Grad Med Educ. 2018;10(6):671-675.
7. Macht R, Balen A, McAneny D, Hess D. A multifaceted intervention to increase surgery resident engagement in reporting adverse events. J Surg Educ. 2015;72(6):e117-e122.
8. Scott DR, Weimer M, English C, et al. A novel approach to increase residents’ involvement in reporting adverse events. Acad Med. 2011;86(6):742-746.
9. Stewart DA, Junn J, Adams MA, et al. House staff participation in patient safety reporting: identification of predominant barriers and implementation of a pilot program. South Med J. 2016;109(7):395-400.
10. Vidyarthi AR, Green AL, Rosenbluth G, Baron RB. Engaging residents and fellows to improve institution-wide quality: the first six years of a novel financial incentive program. Acad Med. 2014;89(3):460-468.
11. Fok MC, Wong RY. Impact of a competency based curriculum on quality improvement among internal medicine residents. BMC Med Educ. 2014;14:252.
12. Wijesekera TP, Sanders L, Windish DM. Education and reporting of diagnostic errors among physicians in internal medicine training programs. JAMA Intern Med. 2018;178(11):1548-1549.
13. Levinson DR. Hospital incident reporting systems do not capture most patient harm. Washington, D.C.: U.S. Department of Health and Human Services Office of the Inspector General. January 2012. Report No. OEI-06-09-00091.
14. Evans JR, Mathur A. The value of online surveys. Internet Research. 2005;15(2):192-219.
15. Marcano Belisario JS, Jamsek J, Huckvale K, et al. Comparison of self‐administered survey questionnaire responses collected using mobile apps versus other methods. Cochrane Database of Syst Rev. 2015;7:MR000042.
16. Manfreda KL, Batagelj Z, Vehovar V. Design of web survey questionnaires: three basic experiments. J Comput Mediat Commun. 2002;7(3):JCMC731.
17. Wright ND, Groisman‐Perelstein AE, Wylie‐Rosett J, et al. A lifestyle assessment and intervention tool for pediatric weight management: the HABITS questionnaire. J Hum Nutr Diet. 2011;24(1):96-100.
From Adelante Healthcare, Mesa, AZ (Dr. Chin), University Hospitals of Cleveland, Cleveland, OH (Drs. Delozier, Bascug, Levine, Bejanishvili, and Wynbrandt and Janet C. Peachey, Rachel M. Cerminara, and Sharon M. Darkovich), and Houston Methodist Hospitals, Houston, TX (Dr. Bhakta).
Abstract
Background: Resident physicians play an active role in the reporting of errors that occur in patient care. Previous studies indicate that residents significantly underreport errors in patient care.
Methods: Fifty-four of 80 eligible residents enrolled at University Hospitals–Regional Hospitals (UH-RH) during the 2018-2019 academic year completed a survey assessing their knowledge and experience in completing Patient Advocacy and Shared Stories (PASS) reports, which serve as incident reports in the UH health system in reporting errors in patient care. A series of interventions aimed at educating residents about the PASS report system were then conducted. The 54 residents who completed the first survey received it again 4 months later.
Results: Residents demonstrated greater understanding of when filing PASS reports was appropriate after the intervention, as significantly more residents reported having been involved in a situation where they should have filed a PASS report but did not (P = 0.036).
Conclusion: In this study, residents often did not report errors in patient care because they simply did not know the process for doing so. In addition, many residents often felt that the reporting of patient errors could be used as a form of retaliation.
Keywords: resident physicians; quality improvement; high-value care; medical errors; patient safety.
Resident physicians play a critical role in patient care. Residents undergo extensive supervised training in order to one day be able to practice medicine in an unsupervised setting, with the goal of providing the highest quality of care possible. One study reported that primary care provided by residents in a training program is of similar or higher quality than that provided by attending physicians.1
Besides providing high-quality care, it is important that residents play an active role in the reporting of errors that occur regarding patient care as well as in identifying events that may compromise patient safety and quality.2 In fact, increased reporting of patient errors has been shown to decrease liability-related costs for hospitals.3 Unfortunately, physicians, and residents in particular, have historically been poor reporters of errors in patient care.4 This is especially true when comparing physicians to other health professionals, such as nurses, in error reporting.5
Several studies have examined the involvement of residents in reporting errors in patient care. One recent study showed that a graduate medical education financial incentive program significantly increased the number of patient safety events reported by residents and fellows.6 This study, along with several others, supports the concept of using incentives to help improve the reporting of errors in patient care for physicians in training.7-10 Another study used Quality Improvement Knowledge Assessment Tool (QIKAT) scores to assess quality improvement (QI) knowledge. The study demonstrated that self-assessment scores of QI skills using QIKAT scores improved following a targeted intervention.11 Because further information on the involvement and attitudes of residents in reporting errors in patient care is needed, University Hospitals of Cleveland (UH) designed and implemented a QI study during the 2018-2019 academic year. This prospective study used anonymous surveys to objectively examine the involvement and attitudes of residents in reporting errors in patient care.
Methods
The UH health system uses Patient Advocacy and Shared Stories (PASS) reports as incident reports to not only disclose errors in patient care but also to identify any events that may compromise patient safety and quality. Based on preliminary review, nurses, ancillary staff, and administrators file the majority of PASS reports.
The study group consisted of residents at University Hospitals–Regional Hospitals (UH-RH), which is comprised of 2 hospitals: University Hospitals–Richmond Medical Center (UH-RMC) and University Hospitals –Bedford Medical Center (UH-BMC). UH-RMC and UH-BMC are 2 medium-sized university-affiliated community hospitals located in the Cleveland metropolitan area in Northeast Ohio. Both serve as clinical training sites for Case Western Reserve University School of Medicine and Lake Erie College of Osteopathic Medicine, the latter of which helped fund this study. The study was submitted to the Institutional Review Board (IRB) of University Hospitals of Cleveland and granted “not human subjects research” status as a QI study.
Surveys
UH-RH offers residency programs in dermatology, emergency medicine, family medicine, internal medicine, orthopedic surgery, and physical medicine and rehabilitation, along with a 1-year transitional/preliminary year. A total of 80 residents enrolled at UH-RH during the 2018-2019 academic year. All 80 residents at UH-RH received an email in December 2018 asking them to complete an anonymous survey regarding the PASS report system. The survey was administered using the REDCap software system and consisted of 15 multiple-choice questions. As an incentive for completing the survey, residents were offered a $10 Amazon gift card. The gift cards were funded through a research grant from Lake Erie College of Osteopathic Medicine. Residents were given 1 week to complete the survey. At the end of the week, 54 of 80 residents completed the first survey.
Following the first survey, efforts were undertaken by the study authors, in conjunction with the quality improvement department at UH-RH, to educate residents about the PASS report system. These interventions included giving a lecture on the PASS report system during resident didactic sessions, sending an email to all residents about the PASS report system, and providing residents an opportunity to complete an optional online training course regarding the PASS report system. As an incentive for completing the online training course, residents were offered a $10 Amazon gift card. As before, the gift cards were funded through a research grant from Lake Erie College of Osteopathic Medicine.
A second survey was administered in April 2019, 4 months after the first survey. To determine whether the intervention made an impact on the involvement and attitudes of residents in the reporting errors in patient care, only residents who completed the first survey were sent the second survey. The second survey consisted of the same questions as the first survey and was also administered using the REDCap software system. As an incentive for completing the survey, residents were offered another $10 Amazon gift card, again were funded through a research grant from Lake Erie College of Osteopathic Medicine. Residents were given 1 week to complete the survey.
Analysis
Chi-square analyses were utilized to examine differences between preintervention and postintervention responses across categories. All analyses were conducted using R statistical software, version 3.6.1 (R Foundation for Statistical Computing).
Results
A total of 54 of 80 eligible residents responded to the first survey (Table). Twenty-nine of 54 eligible residents responded to the second survey. Postintervention, significantly more residents indicated being involved in a situation where they should have filed a PASS report but did not (58.6% vs 53.7%; P = 0.036). Improvement was seen in PASS knowledge postintervention, where fewer residents reported not knowing how to file a PASS report (31.5% vs 55.2%; P = 0.059). No other improvements were significant, nor were there significant differences in responses between any other categories pre- and postintervention.
Discussion
Errors in patient care are a common occurrence in the hospital setting. Reporting errors when they happen is important for hospitals to gain data and better care for patients, but studies show that patient errors are usually underreported. This is concerning, as data on errors and other aspects of patient care are needed to inform quality improvement programs.
This study measured residents’ attitudes and knowledge regarding the filing of a PASS report. It also aimed to increase both the frequency of and knowledge about filing a PASS report with interventions. The results from each survey indicated a statistically significant increase in knowledge of when to file a PASS report. In the first survey, 53.7% of residents responded they they were involved in an instance where they should have filed a PASS report but did not. In the second survey, 58.5% of residents reported being involved in an instance where they should have filed a PASS report but did not. This difference was statistically significant (P = 0.036), sugesting that the intervention was successful at increasing residents’ knowledge regarding PASS reports and the appropriate times to file a PASS report.
The survey results also showed a trend toward increasing aggregate knowledge level of how to file PASS reports on the first survey and second surveys (from 31.5% vs 55.2%. This demonstrates an increase in knowledge of how to file a PASS report among residents at our hospital after the intervention. It should be noted that the intervention that was performed in this study was simple, easy to perform, and can be completed at any hospital system that uses a similar system for reporting patient errors.
Another important trend indicating the effectiveness of the intervention was a 15% increase in knowledge of what the PASS report acronym stands for, along with a 13.1% aggregate increase in the number of residents who filed a PASS report. This indicated that residents may have wanted to file a PASS report previously but simply did not know how to until the intervention. In addition, there was also a decrease in the aggregate percentages of residents who had never filed a PASS report and an increase in how many PASS reports were filed.
While PASS reports are a great way for hospitals to gain data and insight into problems at their sites, there was also a negative view of PASS reports. For example, a large percentage of residents indicated that filing a PASS report would not make any difference and that PASS reports are often used as a form of retaliation, either against themselves as the submitter or the person(s) mentioned in the PASS report. More specifically, more than 50% of residents felt that PASS reports were sometimes or often used as a form of retaliation against others. While many residents correctly identified in the survey that PASS reports are not equivalent to a “write-up,” it is concerning that they still feel there is a strong potential for retaliation when filing a PASS report. This finding is unfortunate but matches the results of a multicenter study that found that 44.6% of residents felt uncomfortable reporting patient errors, possibly secondary to fear of retaliation, along with issues with the reporting system.12
It is interesting to note that a minority of residents indicated that they feel that PASS reports are filed as often as they should be (25.9% on first survey and 24.1% on second survey). This is concerning, as the data gathered through PASS reports is used to improve patient care. However, the percentage reported in our study, although low, is higher than that reported in a similar study involving patients with Medicare insurance, which showed that only 14% of patient safety events were reported.13 These results demonstrate that further interventions are necessary in order to ensure that a PASS report is filed each time a patient safety event occurs.
Another finding of note is that the majority of residents also feel that the process of filing a PASS report is too time consuming. The majority of residents who have completed a PASS report stated that it took them between 10 and 20 minutes to complete a PASS report, but those same individuals also feel that it should take < 10 minutes to complete a PASS report. This is an important issue for hospital systems to address. Reducing the time it takes to file a PASS report may facilitate an increase in the amount of PASS reports filed.
We administered our surveys using email outreach to residents asking them to complete an anonymous online survey regarding the PASS report system using the REDCap software system. Researchers have various ways of administering surveys, ranging from paper surveys, emails, and even mobile apps. One study showed that online surveys tend to have higher response rates compared to non-online surveys, such as paper surveys and telephone surveys, which is likely due to the ease of use of online surveys.14 At the same time, unsolicited email surveys have been shown to have a negative influence on response rates. Mobile apps are a new way of administering surveys. However, research has not found any significant difference in the time required to complete the survey using mobile apps compared to other forms of administering surveys. In addition, surveys using mobile apps did not have increased response rates compared to other forms of administering surveys.15
To increase the response rate of our surveys, we offered gift cards to the study population for completing the survey. Studies have shown that surveys that offer incentives tend to have higher response rates than surveys that do not.16 Also, in addition to serving as a method for gathering data from our study population, we used our surveys as an intervention to increase awareness of PASS reporting, as reported in other studies. For example, another study used the HABITS questionnaire to not only gather information about children’s diet, but also to promote behavioral change towards healthy eating habits.17
This study had several limitations. First, the study was conducted using an anonymous online survey, which means we could not clarify questions that residents found confusing or needed further explanation. For example, 17 residents indicated in the first survey that they knew how to PASS report, but 19 residents indicated in the same survey that they have filed a PASS report in the past.
A second limitation of the study was that fewer residents completed the second survey (29 of 54 eligible residents) compared to the first survey (54 of 80 eligible residents). This may have impacted the results of the analysis, as certain findings were not statistically significant, despite trends in the data.
A third limitation of the study is that not all of the residents that completed the first and second surveys completed the entire intervention. For example, some residents did not attend the didactic lecture discussing PASS reports, and as such may not have received the appropriate training prior to completing the second survey.
The findings from this study can be used by the residency programs at UH-RH and by residency programs across the country to improve the involvement and attitudes of residents in reporting errors in patient care. Hospital staff need to be encouraged and educated on how to better report patient errors and the importance of reporting these errors. It would benefit hospital systems to provide continued and targeted training to familiarize physicians with the process of reporting patient errors, and take steps to reduce the time it takes to report patient errors. By increasing the reporting of errors, hospitals will be able to improve patient care through initiatives aimed at preventing errors.
Conclusion
Residents play an important role in providing high-quality care for patients. Part of providing high-quality care is the reporting of errors in patient care when they occur. Physicians, and in particular, residents, have historically underreported errors in patient care. Part of this underreporting results from residents not knowing or understanding the process of filing a report and feeling that the reports could be used as a form of retaliation. For hospital systems to continue to improve patient care, it is important for residents to not only know how to report errors in patient care but to feel comfortable doing so.
Corresponding author: Andrew J. Chin, DO, MS, MPH, Department of Internal Medicine, Adelante Healthcare, 1705 W Main St, Mesa, AZ 85201; anchin@adelantehealthcare.com.
Financial disclosures: None.
Funding: This study was funded by a research grant provided by Lake Eric College of Osteopathic Medicine to Andrew J. Chin and Anish Bhakta.
1. Zallman L, Ma J, Xiao L, Lasser KE. Quality of US primary care delivered by resident and staff physicians. J Gen Intern Med. 2010;25(11):1193-1197.
2. Bagain JP. The future of graduate medical education: a systems-based approach to ensure patient safety. Acad Med. 2015;90(9):1199-1202.
3. Kachalia A, Kaufman SR, Boothman R, et al. Liability claims and costs before and after implementation of a medical disclosure program. Ann Intern Med. 2010;153(4):213-221.
4. Kaldjian LC, Jones EW, Wu BJ, et al. Reporting medical errors to improve patient safety: a survey of physicians in teaching hospitals. Arch Intern Med. 2008;168(1):40-46.
5. Rowin EJ, Lucier D, Pauker SG, et al. Does error and adverse event reporting by physicians and nurses differ? Jt Comm J Qual Patient Saf. 2008;34(9):537-545.
6. Turner DA, Bae J, Cheely G, et al. Improving resident and fellow engagement in patient safety through a graduate medical education incentive program. J Grad Med Educ. 2018;10(6):671-675.
7. Macht R, Balen A, McAneny D, Hess D. A multifaceted intervention to increase surgery resident engagement in reporting adverse events. J Surg Educ. 2015;72(6):e117-e122.
8. Scott DR, Weimer M, English C, et al. A novel approach to increase residents’ involvement in reporting adverse events. Acad Med. 2011;86(6):742-746.
9. Stewart DA, Junn J, Adams MA, et al. House staff participation in patient safety reporting: identification of predominant barriers and implementation of a pilot program. South Med J. 2016;109(7):395-400.
10. Vidyarthi AR, Green AL, Rosenbluth G, Baron RB. Engaging residents and fellows to improve institution-wide quality: the first six years of a novel financial incentive program. Acad Med. 2014;89(3):460-468.
11. Fok MC, Wong RY. Impact of a competency based curriculum on quality improvement among internal medicine residents. BMC Med Educ. 2014;14:252.
12. Wijesekera TP, Sanders L, Windish DM. Education and reporting of diagnostic errors among physicians in internal medicine training programs. JAMA Intern Med. 2018;178(11):1548-1549.
13. Levinson DR. Hospital incident reporting systems do not capture most patient harm. Washington, D.C.: U.S. Department of Health and Human Services Office of the Inspector General. January 2012. Report No. OEI-06-09-00091.
14. Evans JR, Mathur A. The value of online surveys. Internet Research. 2005;15(2):192-219.
15. Marcano Belisario JS, Jamsek J, Huckvale K, et al. Comparison of self‐administered survey questionnaire responses collected using mobile apps versus other methods. Cochrane Database of Syst Rev. 2015;7:MR000042.
16. Manfreda KL, Batagelj Z, Vehovar V. Design of web survey questionnaires: three basic experiments. J Comput Mediat Commun. 2002;7(3):JCMC731.
17. Wright ND, Groisman‐Perelstein AE, Wylie‐Rosett J, et al. A lifestyle assessment and intervention tool for pediatric weight management: the HABITS questionnaire. J Hum Nutr Diet. 2011;24(1):96-100.
Amputation Care Quality and Satisfaction With Prosthetic Limb Services: A Longitudinal Study of Veterans With Upper Limb Amputation
Veterans with upper limb amputation (ULA) are a small, but important population, who have received more attention in the past decade due to the increased growth of the population of veterans with conflict-related amputation from recent military engagements. Among the 808 veterans with ULA receiving any care in the US Department of Veterans Affairs (VA) from 2010 to 2015 who participated in our national study, an estimated 28 to 35% had a conflict-related amputation.1 The care of these individuals with ULA is highly specialized, and there is a recognized shortage of experienced professionals in this area.2,3 The provision of high-quality prosthetic care is increasingly complex with advances in technology, such as externally powered devices with multiple functions.
The VA is a comprehensive, integrated health care system that serves more than 8.9 million veterans each year. Interdisciplinary amputation care is provided within the VA through a traditional clinic setting or by using one of several currently available virtual care modalities.4,5 In consultation with the veteran, VA health care providers (HCPs) prescribe prostheses and services based on the clinical needs and furnish authorized items and services to eligible veterans. Prescribed items and/or services are furnished either by internal VA resources or through a community-based prosthetist who is an authorized vendor or contractor. Although several studies have reported that the majority of veterans with ULA utilize VA services for at least some aspects of their health care, little is known about: (1) prosthetic limb care satisfaction or the quality of care that veterans receive; or (2) how care within the VA or Department of Defense (DoD) compares with care provided in the civilian sector.6-8
Earlier studies that examined the amputation rehabilitation services received by veterans with ULA pointed to quality gaps in care and differences in satisfaction in the VA and DoD when compared with the civilian sector but were limited in their scope and methodology.7,8 A 2008 study of veterans of the Vietnam War, Operation Iraqi Freedom (OIF), and Operation Enduring Freedom (OEF) compared satisfaction by location of care receipt (DoD only, VA only, private only, and multiple sources). That study dichotomized response categories for items related to satisfaction with care (satisfied/not), but did not estimate degree of satisfaction, calculate summary scores of the items, or utilize validated care satisfaction metrics. That study found that a greater proportion of Vietnam War veterans (compared with OIF/OEF veterans receiving care in the private sector) agreed that they “had a role in choosing prosthesis” and disagreed that they wanted to change their current prosthesis to another type.7 The assumption made by the authors is that much of this private sector care was actually VA-sponsored care prescribed and procured by the VA but delivered in the community. However, no data were collected to confirm or refute this assumption, and it is possible that some care was both VA sponsored and delivered, some was VA sponsored but commercially delivered, and in some cases, care was sponsored by other sources and delivered in still other facilities.
A 2012 VA Office of the Inspector General study of OIF, OEF, and Operation New Dawn (OND) veterans reported lower prosthetic satisfaction for veterans with upper limb when compared with lower limb amputation and described respondents concerns about lack of VA prosthetic expertise, difficulty with accessing VA services, and dissatisfaction with the sometimes lengthy approval process for obtaining fee-basis or VA contract care.8 Although this report suggested that there were quality gaps and areas for improvement, it did not employ validated metrics of prosthesis or care satisfaction and instead relied on qualitative data collected through telephone interviews.
Given the VA effort to enhance the quality and consistency of its amputation care services through the formal establishment of the Amputation System of Care, which began in 2008, further evaluation of care satisfaction and quality of care is warranted. In 2014 the VA and DoD released the first evidence-based clinical practice guidelines (CPGs) for the rehabilitation of persons with ULA.2 The CPG describes care paths to improve outcomes and basic tenets of amputation rehabilitation care and can be used to identify process activities that are essential aspects of quality care. However, the extent to which the CPG has impacted the quality and timeliness of care for veterans with ULA are presently unclear.
Thus, the purposes of this study were to: (1) measure veteran satisfaction with prosthetic limb care and identify factors associated with service satisfaction; (2) assess quality indicators that potentially reflect CPG) adoption; (3) compare care satisfaction and quality for those who received care in or outside of the VA or DoD; and (4) evaluate change in satisfaction over time.
Methods
The study was approved by the VA Central Institutional Review Board (IRB) (Study #16-20) and Human Research Protection Office, U.S. Army Medical Research and Development Command. The sampling frame consisted of veterans with major ULA who received care in the VA between 2010 and 2015 identified in VA Corporate Data Warehouse. We sent recruitment packages to nondeceased veterans who had current addresses and phone numbers. Those who did not opt out or inform us that they did not meet eligibility criteria were contacted by study interviewers. A waiver of documentation of written informed consent was obtained from the VA Central IRB. When reached by the study interviewer, Veterans provided oral informed consent. At baseline, 808 veterans were interviewed for a response rate of 47.7% as calculated by the American Association for Public Opinion Research (AAPOR) methodology.9 Follow-up interviews approximately 1 year later (mean [SD] 367 [16.8] days), were conducted with 585 respondents for a 72.4% response rate (Figure).
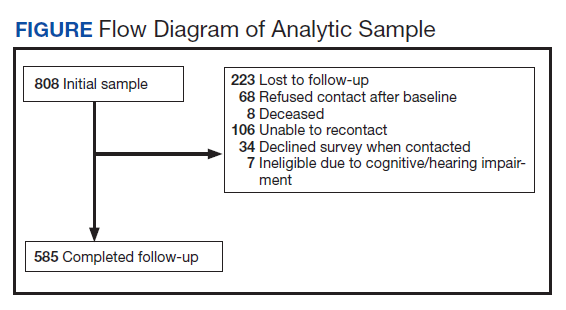
Survey Content
Development and pilot testing of the survey instrument previously was reported.1 The content of the survey drew from existing survey items and metrics, and included new items specifically designed to address patterns of amputation care, based on care goals within the CPG. All new and modified items were tested and refined through cognitive interviews with 10 participants, and tested with an additional 13 participants.
The survey collected data on demographics, amputation characteristics (year of amputation, level, laterality, and etiology), current prosthesis use, and type of prosthesis. This article focused on the sections of the survey pertaining to satisfaction with prosthetic care and indicators of quality of care. A description of the content of the full survey and a synopsis of overall findings are reported in a prior publication.1 The key independent, dependent, and other variables utilized in the analyses reported in this manuscript are described below.
Primary Independent Variables
In the follow-up survey, we asked respondents whether they had any amputation care in the prior 12 months, and if so to indicate where they had gone for care. We categorized respondents as having received VA/DoD care if they reported any care at the VA or DoD, and as having received non-VA/DoD care if they did not report care at the VA or DoD but indicated that they had received amputation care between baseline and follow-up.
Two primary outcomes were utilized; the Orthotics and Prosthetics User’s Survey (OPUS), client satisfaction with services scale (CSS), and a measure of care quality specifically developed for this study. The CSS is a measure developed specifically for orthotic and prosthesis users.10 This 11-item scale measures satisfaction with prosthetic limb services and contains items evaluating facets of care such as courtesy received from prosthetists and clinical staff, care coordination, appointment wait time, willingness of the prosthetist to listen to participant concerns, and satisfaction with prosthesis training. Items are rated on a 4-point scale (strongly agree [1] to strongly disagree [4]), thus higher CSS scores indicate worse satisfaction with services. The CSS was administered only to prosthesis users.
The Quality of Care assessment developed for this study contained items pertaining to amputation related care receipt and care quality. These items were generated by the study team in consultation with representatives from the VA/DoD Extremity Amputation Center of Excellence after review of the ULA rehabilitation CPG. Survey questions asked respondents about the clinicians visited for amputation related care in the past 12 months, whether they had an annual amputation-related checkup, whether any clinician had assessed their function, worked with them to identify goals, and/or to develop an amputation-related care plan. Respondents were also asked whether there had been family/caregiver involvement in their care and care coordination, whether a peer visitor was involved in their initial care, whether they had received information about amputation management in the prior year, and whether they had amputation-related pain. Those that indicated that they had amputation-related pain were subsequently asked whether their pain was well managed, whether they used medication for pain management, and whether they used any nonpharmaceutical strategies.
Quality of Care Index
We initially developed 15 indicator items of quality of care. We selected 7 of the items to create a summary index. We omitted 3 items about pain management, since these items were completed only by participants who indicated that they had experienced pain; however, we examined the 3 pain items individually given the importance of this topic. We omitted an additional 2 items from the summary index because they would not be sensitive to change because they pertained to the care in the year after initial amputation. One of these items asked whether caregivers were involved in initial amputation management and the other asked whether a peer visit occurred after amputation. Another 3 items were omitted because they only were completed by small subsamples due to intentional skip patterns in the survey. These items addressed whether clinical HCPs discussed amputation care goals in the prior year, worked to develop a care plan in the prior year, or helped to coordinate care after a move. Completion rates for all items considered for the index are shown in eAppendix 1 (Available at doi:10.12788/fp.0096). After item selection, we generated an index score, which was the number of reported “yes” responses to the seven relevant items.
Other Variables
We created a single variable called level/laterality which categorized ULA as unilateral or bilateral. We further categorized respondents with unilateral amputation by their amputation level. We categorized respondents as transradial for wrist joint or below the elbow amputations; transhumeral for at or above the elbow amputations; and shoulder for shoulder joint or forequarter amputations. Participants indicated the amputation etiology using 7 yes/no variables: combat injury, accident, burn, cancer, diabetes mellitus, and infection. Participants could select ≥ 1 etiology.
Primary prosthesis type was categorized as body powered, myoelectric/hybrid, cosmetic, other/unknown, or nonuser. The service era was classified based on amputation date as Before Vietnam, Vietnam War, After Vietnam to Gulf War, After Gulf War to September 10, 2001, and September 11, 2001 to present. For race, individuals with > 1 race were classified as other. We classified participants by region, using the station identification of the most recent VA medical center that they had visited between January 1, 2010 and December 30, 2015.
The survey also employed 2 measures of satisfaction with the prosthesis, the Trinity Amputation and Prosthetic Experience Scale (TAPES) satisfaction scale and the OPUS Client Satisfaction with Devices (CSD). TAPES consists of 10 items addressing color, shape, noise, appearance, weight, usefulness, reliability, fit, comfort and overall satisfaction.11 Items are rated on a 5-point Likert scale from very dissatisfied (1) to very satisfied (5). An 8-item version of the CSD scale was created for this study, after conducting a Rasch analysis (using Winsteps version 4.4.2) of the original 11-item CSD. The 8 items assess satisfaction with prosthesis fit, weight, comfort, donning ease, appearance, durability, skin contact, and pain. Items are rated on a 4-point scale from strongly agree (1) to strongly disagree (4); higher CSD scores indicate less satisfaction with devices. Psychometric analysis of the revised CSD score was reported in a prior publication.12 We also reported on the CSS using the original 10-item measure.
Data Analyses
We described characteristics of respondents at baseline and follow-up. We used baseline data to calculate CSS scores and described scores for all participants, for subgroups of unilateral and bilateral amputees, and for unilateral amputees stratified by amputation level. Wilcoxon rank sum tests were used to compare the CSS item and total scores of 461 prosthesis users with unilateral amputation and 29 with bilateral amputation. To identify factors that we hypothesized might be associated with CSS scores at baseline, we developed separate bivariate linear regression models. We added those factors that were associated with CSS scores at P ≤ .1 in bivariate analyses to a multivariable linear regression model of factors associated with CSS score. The P ≤ .1 threshold was used to ensure that relevant confounders were controlled for in regression models. We excluded 309 participants with no reported prosthesis use (who were not asked to complete the CSS), 20 participants with other/unknown prosthesis types, and 106 with missing data on amputation care in the prior year or on satisfaction metrics. We used baseline data for this analysis to maximize the sample size.
We compared CSS scores for those who reported receiving care within or outside of the VA or DoD in the prior year, using Wilcoxon Mann-Whitney rank tests. We also compared scores of individual quality of care items for these groups using Fisher exact tests. We chose to examine individual items rather than the full Index because several items specified care receipt within the VA and thus would be inappropriate to utilize in comparisons by site location; however, we described responses to all items. In these analyses, we excluded 2 respondents who had conflicting information regarding location of care. We used follow-up data for this analysis because it allowed us to identify location of care received in the prior year.
We also described the CSS scores, the 7-item Quality of Care Index and responses to other items related to quality of care at baseline and follow-up. To examine whether satisfaction with prosthetic care or aspects of care quality had changed over time, we compared baseline and follow-up CSS and quality of care scores for respondents who had measures at both times using Wilcoxon signed ranks tests. Individual items were compared using McNemar tests.
Results
Respondents were 97.4% male and included 776 unilateral amputees and 32 bilateral amputees with a mean (SD) age of 63.3 (14.1) years (Table 1). Respondents had lost their limbs a mean (SD) 31.4 (14.1) years prior, and half were transradial, 34.2% transhumeral, and 11.6% shoulder amputation. At baseline 185 (22.9%) participants received amputation-related care in the prior year and 118 (20.2%) participants received amputation-related care within 1 year of follow-up. Of respondents, 113 (19.3%) stated that their care was between baseline and follow-up and 89 (78.8%) of these received care at either the VA, the DoD or both; just 16 (14.2%) received care elsewhere.
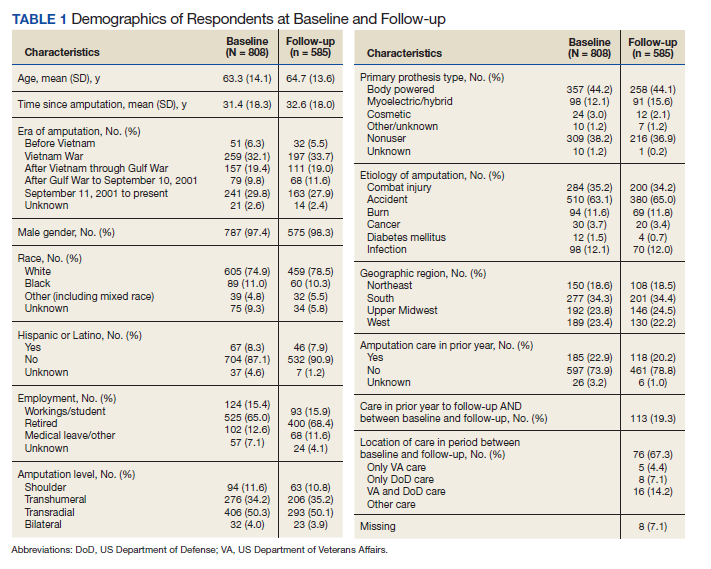
Mean (SD) CSS scores were highest (lower satisfaction) for those with amputation at the shoulder and lowest for those with transhumeral amputation: 42.2 (20.0) vs 33.4 (20.8). Persons with bilateral amputation were less satisfied in almost every category when compared with those with unilateral amputation, although the total CSS score was not substantially different. Wilcoxon rank sum analyses revealed statistically significant differences in wait time satisfaction: bilateral amputees were less satisfied than unilateral amputees. Factors associated with overall CSS score in bivariate analyses were CSD score, TAPES score, amputation care receipt, prosthesis type, race, and region of care (eAppendix 2, available at doi:10.12788/fp.0096).
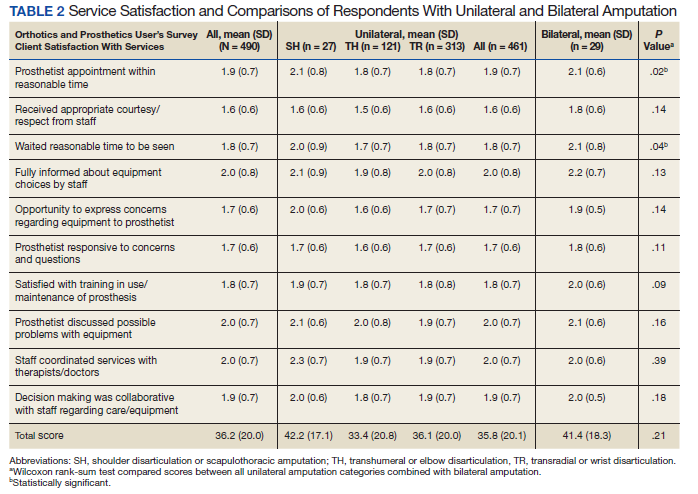
In the multivariate regression model of baseline CSS scores, only 2 variables were independently associated with CSS scores: CSD score and recent amputation care (Table 3). For each 1-point increase in CSD score there was a 0.7 point increase in CSS score. Those with amputation care in the prior year had higher satisfaction when compared with those who had not received care (P = .003).
For participants who indicated that they received amputation care between baseline and follow-up, CSS mean (SD) scores were better, but not statistically different, for those who reported care in the VA or DoD vs private care, 31.6 (22.6) vs 38.0 (17.7) (Table 4). When compared with community-based care, more participants who received care in the VA or DoD in the prior year had a functional assessment in that time period (33.7% vs 7.1%, P = .06), were contacted by HCPs outside of appointments (42.7% vs 18.8%, P = .07), and received information about amputation care in the prior year (41.6% vs 0%, P =.002). There was no difference in the proportion whose family/caregivers were involved in care in the prior year.
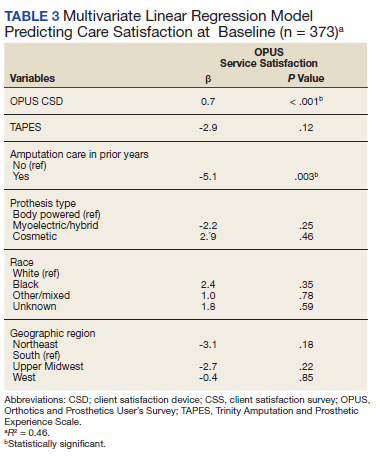
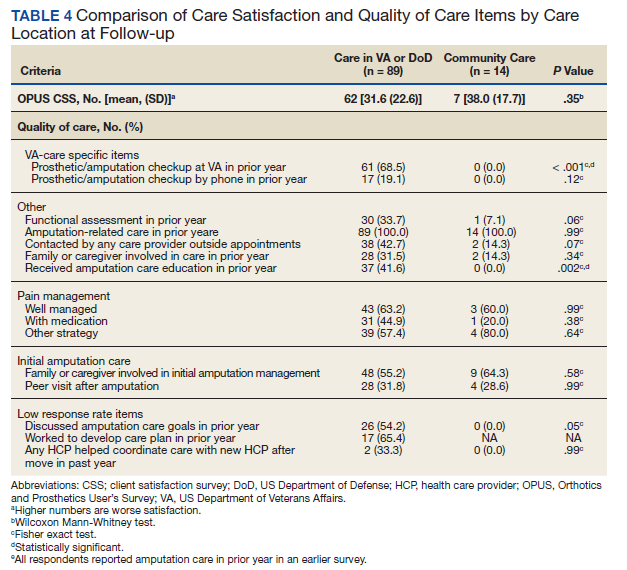
No statistically significant differences were observed in paired comparisons of the CSS and Quality of Care Index at baseline or follow-up for all participants with data at both time points (Table 5; eAppendix 3 available at doi:10.12788/fp.0096). Individual pain measures did not differ significantly between timepoints. Quality Index mean (SD) scores were 1.3 (1.5) and 1.2 (1.5) at baseline and follow-up, respectively (P = .07). For the 214 prosthesis users with longitudinal data, baseline CSS mean (SD) scores were generally worse at baseline than at follow-up: 34.4 (19.8) vs 32.5 (21.0) (P = .23). Family/caregiver involvement in amputation care was significantly higher in the year before baseline when compared with the year prior to follow-up (24.4% vs 17.7%, P = .001). There were no other statistically significant differences in Quality of Care items between baseline and follow-up.
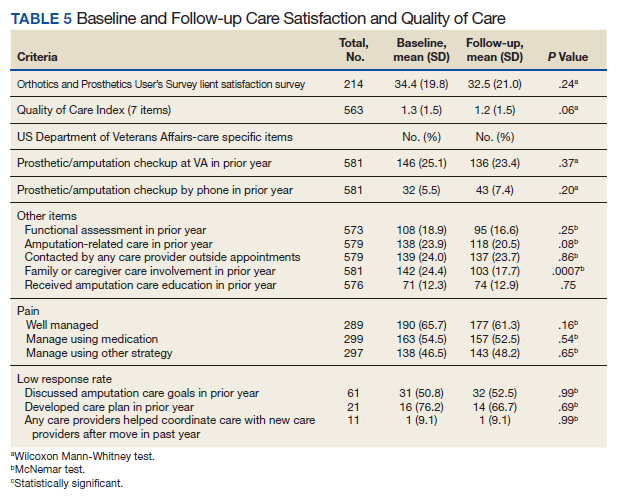
Discussion
Our longitudinal study provides insights into the experiences of veterans with major ULA related to satisfaction with prosthetic limb care services and receipt of amputation-related care. We reported on the development and use of a new summary measure of amputation care quality, which we designed to capture some of the key elements of care quality as provided in the VA/DoD CPG.2
We used baseline data to identify factors independently associated with prosthetic limb care satisfaction as measured by a previously validated measure, the OPUS CSS. The CSS addresses satisfaction with prosthetic limb services and does not reflect satisfaction with other amputation care services. We found that persons who received amputation care in the prior year had CSS scores that were a mean 5.1 points better than those who had not received recent care. Although causality cannot be determined with this investigation, this finding highlights an important relationship between frequency of care and satisfaction, which can be leveraged by the VA in future care initiatives. Care satisfaction was also better by 0.7 points for every 1-point decrease (indicating higher satisfaction) in the OPUS CSD prosthetic satisfaction scale. This finding isn’t surprising, given that a major purpose of prosthetic limb care services is to procure and fit a satisfactory device. To determine whether these same relationships were observed in the smaller, longitudinal cohort data at follow-up, we repeated these models and found similar relationships between recent care receipt and prosthesis satisfaction and satisfaction with services. We believe that these findings are meaningful and emphasize the importance of both service and device satisfaction to the veteran with an ULA. Lower service satisfaction scores among those with amputations at the shoulder and those with bilateral limb loss suggest that these individuals may benefit from different service delivery approaches.
We did observe a difference in satisfaction scores by geographic region in the follow-up (but not the baseline) data with satisfaction higher in the Western vs the Southern region (data not shown). This finding suggests a need for continued monitoring of care satisfaction over time to determine whether differences by region persist. We grouped respondents into geographic region based on the location where they had received their most recent VA care of any type. Many veterans receive care at multiple VA locations. Thus, it is possible that some veterans received their amputation care at a non-VA facility or a VA facility in a different region.
Our findings related to prosthetic limb care services satisfaction are generalizable to veteran prosthesis users. Findings may not be generalizable to nonusers, because in our study, the CSS only was administered to prosthesis users. Thus, we were unable to identify factors associated with care satisfaction for persons who were not current users of an upper limb prosthesis.
The study findings confirmed that most veterans with ULA receive amputation-related care in the VA or DoD. We compared CSS and Quality of Care item scores for those who reported receiving care at the VA or DoD vs elsewhere. Amputation care within the VA is complex. Some services are provided at VA facilities and some are ordered by VA clinicians but provided by community-based HCPs. However, we found that better (though not statistically significantly different) CSS scores and several Quality of Care items were endorsed by a significantly more of those reporting care in the VA or DoD as compared to elsewhere. Given the dissemination of a rehabilitation of upper limb amputees CPG, we hypothesized that VA and DoD HCPs would be more aware of care guidelines and would provide better care. Overall, our findings supported this hypothesis while also suggesting that areas such as caregiver involvement and peer visitation may benefit from additional attention and program improvement.
We used longitudinal data to describe and compare CSS and Quality of Care Index scores. Our analyses did not detect any statistically significant differences between baseline and follow-up. This finding may reflect that this was a relatively stable population with regard to amputation experiences given the mean time since amputation was 31.4 years. However, we also recognize that our measures may not have captured all aspects of care satisfaction or quality. It is possible that there were other changes that had occurred over the course of the year that were not captured by the CSS or by the Quality of Care Index. It is also possible that some implementation and adoption of the CPG had happened prior to our baseline survey. Finally, it is possible that some elements of the CPG have not yet been fully integrated into clinical care. We believe that the latter is likely, given that nearly 80% of respondents did not report receiving any amputation care within the past year at follow-up, though the CPGs recommend an annual visit.
Aside from recall bias, 2 explanations must be considered relative to the low rate of adherence to the CPG recommendation for an annual follow-up. The first is that the CPG simply may not be widely adopted. The second is that the majority of patients with ULA who use prostheses use a body-powered system. These tend to be low maintenance, long-lasting systems and may ultimately not need annual maintenance and repair. Further, if the veteran’s body-powered system is functioning properly and health status has not changed, they may simply be opting out of an annual visit despite the CPG recommendation. Nonetheless, this apparent low rate of annual follow-up emphasizes the need for additional process improvement measures for the VA.
Strengths and Limitations
The VA provides a unique setting for a nationally representative study of amputation rehabilitation because it has centralized data sources that can be used to identify veterans with ULA. Our study had a strong response rate, and its prosthetic limb care satisfaction findings are generalizable to all veterans with major ULA who received VA care from 2010 to 2015. However, there are limits to generalizability outside of this population to civilians or to veterans who do not receive VA care. To examine possible nonresponse bias, which could limit generalizability, we compared the baseline characteristics of respondents and nonrespondents to the follow-up study (eAppendix 4 available at doi:10.12788/fp.0096). There were no significant differences in satisfaction, quality of care, or receipt of amputation-related care between those lost to follow-up and those with follow-up data. Although, we did find small differences in gender, race, and service era (defined by amputation date). We do not believe that these differences threaten the interpretation of findings at follow-up, but there may be limits to generalizability of these findings to the full baseline sample. The data were from a telephone survey of veterans. It is possible that some veterans did not recall their care receipt or did not understand some of the questions and thus may not have accurately answered questions related to type of care received or the timing of that care.
Our interpretation of findings comparing care received within the VA and DoD or elsewhere is also limited because we cannot say with certainty whether those who indicated no care in the VA or DoD actually had care that was sponsored by the VA or DoD as contract or fee-basis care. Just 8 respondents indicated that they had received care only outside of the VA or DoD in the prior year. There were also some limitations in the collection of data about care location. We asked about receipt of amputation care in the prior year and about location of any amputation care received between baseline and follow-up, and there were differences in responses. Thus, we used a combination of these items to identify location of care received in the prior year.
Despite these limitations, we believe that our study provides novel, important findings about the satisfaction with prosthetic limb care services and quality of amputation rehabilitation care for veterans. Findings from this study can be used to address amputation and prosthetic limb care satisfaction and quality weaknesses highlighted and to benchmark care satisfaction and CPG compliance. Other studies evaluating care guideline compliance have used indicators obtained from clinical records or data repositories.13-15 Future work could combine self-reported satisfaction and care quality measures with indicators obtained from clinical or repository sources to provide a more complete snapshot of care delivery.
Conclusions
We reported on a national survey of veterans with major upper limb loss that assessed satisfaction with prosthetic limb care services and quality of amputation care. Satisfaction with prosthetic limb care was independently associated with satisfaction with the prosthesis, and receipt of care within the prior year. Most of the veterans surveyed received care within the VA or DoD and reported receiving higher quality of care, when compared with those who received care outside of the VA or DoD. Satisfaction with care and quality of care were stable over the year of this study. Data presented in this study can serve to direct VA amputation care process improvement initiatives as benchmarks for future work. Future studies are needed to track satisfaction with and quality of care for veterans with ULA.
1. Resnik L, Ekerholm S, Borgia M, Clark MA. A national study of veterans with major upper limb amputation: Survey methods, participants, and summary findings. PLoS One. 2019;14(3):e0213578. Published 2019 Mar 14. doi:10.1371/journal.pone.0213578
2. US Department of Defense, US Department of Veterans Affairs, Management of Upper Extremity Amputation Rehabilitation Working Group. VA/DoD clinical practice guideline for the management of upper extremity amputation rehabilitation.Published 2014. Accessed February 18, 2021. https://www.healthquality.va.gov/guidelines/Rehab/UEAR/VADoDCPGManagementofUEAR121614Corrected508.pdf
3. Jette AM. The Promise of Assistive Technology to Enhance Work Participation. Phys Ther. 2017;97(7):691-692. doi:10.1093/ptj/pzx054
4. Webster JB, Poorman CE, Cifu DX. Guest editorial: Department of Veterans Affairs amputations system of care: 5 years of accomplishments and outcomes. J Rehabil Res Dev. 2014;51(4):vii-xvi. doi:10.1682/JRRD.2014.01.0024
5. Scholten J, Poorman C, Culver L, Webster JB. Department of Veterans Affairs polytrauma telerehabilitation: twenty-first century care. Phys Med Rehabil Clin N Am. 2019;30(1):207-215. doi:10.1016/j.pmr.2018.08.003
6. Melcer T, Walker J, Bhatnagar V, Richard E. Clinic use at the Departments of Defense and Veterans Affairs following combat related amputations. Mil Med. 2020;185(1-2):e244-e253. doi:10.1093/milmed/usz149
7. Berke GM, Fergason J, Milani JR, et al. Comparison of satisfaction with current prosthetic care in veterans and servicemembers from Vietnam and OIF/OEF conflicts with major traumatic limb loss. J Rehabil Res Dev. 2010;47(4):361-371. doi:10.1682/jrrd.2009.12.0193
8. US Department of Veterans Affairs, Office of Inspector General. Healthcare inspection prosthetic limb care in VA facilities. Published March 8, 2012. Accessed February 18, 2021. https://www.va.gov/oig/pubs/VAOIG-11-02138-116.pdf 9. American Association for Public Opinion Research. Response rates - an overview. Accessed February 18, 2021. https://www.aapor.org/Education-Resources/For-Researchers/Poll-Survey-FAQ/Response-Rates-An-Overview.aspx
10. Heinemann AW, Bode RK, O’Reilly C. Development and measurement properties of the Orthotics and Prosthetics Users’ Survey (OPUS): a comprehensive set of clinical outcome instruments. Prosthet Orthot Int. 2003;27(3):191-206. doi:10.1080/03093640308726682
11. Desmond DM, MacLachlan M. Factor structure of the Trinity Amputation and Prosthesis Experience Scales (TAPES) with individuals with acquired upper limb amputations. Am J Phys Med Rehabil. 2005;84(7):506-513. doi:10.1097/01.phm.0000166885.16180.63
12. Resnik L, Borgia M, Heinemann AW, Clark MA. Prosthesis satisfaction in a national sample of veterans with upper limb amputation. Prosthet Orthot Int. 2020;44(2):81-91. doi:10.1177/0309364619895201
13. Ho TH, Caughey GE, Shakib S. Guideline compliance in chronic heart failure patients with multiple comorbid diseases: evaluation of an individualised multidisciplinary model of care. PLoS One. 2014;9(4):e93129. Published 2014 Apr 8. doi:10.1371/journal.pone.0093129
14. Mitchell KB, Lin H, Shen Y, et al. DCIS and axillary nodal evaluation: compliance with national guidelines. BMC Surg. 2017;17(1):12. Published 2017 Feb 7. doi:10.1186/s12893-017-0210-5
15. Moesker MJ, de Groot JF, Damen NL, et al. Guideline compliance for bridging anticoagulation use in vitamin-K antagonist patients; practice variation and factors associated with non-compliance. Thromb J. 2019;17:15. Published 2019 Aug 5. doi:10.1186/s12959-019-0204-x
Veterans with upper limb amputation (ULA) are a small, but important population, who have received more attention in the past decade due to the increased growth of the population of veterans with conflict-related amputation from recent military engagements. Among the 808 veterans with ULA receiving any care in the US Department of Veterans Affairs (VA) from 2010 to 2015 who participated in our national study, an estimated 28 to 35% had a conflict-related amputation.1 The care of these individuals with ULA is highly specialized, and there is a recognized shortage of experienced professionals in this area.2,3 The provision of high-quality prosthetic care is increasingly complex with advances in technology, such as externally powered devices with multiple functions.
The VA is a comprehensive, integrated health care system that serves more than 8.9 million veterans each year. Interdisciplinary amputation care is provided within the VA through a traditional clinic setting or by using one of several currently available virtual care modalities.4,5 In consultation with the veteran, VA health care providers (HCPs) prescribe prostheses and services based on the clinical needs and furnish authorized items and services to eligible veterans. Prescribed items and/or services are furnished either by internal VA resources or through a community-based prosthetist who is an authorized vendor or contractor. Although several studies have reported that the majority of veterans with ULA utilize VA services for at least some aspects of their health care, little is known about: (1) prosthetic limb care satisfaction or the quality of care that veterans receive; or (2) how care within the VA or Department of Defense (DoD) compares with care provided in the civilian sector.6-8
Earlier studies that examined the amputation rehabilitation services received by veterans with ULA pointed to quality gaps in care and differences in satisfaction in the VA and DoD when compared with the civilian sector but were limited in their scope and methodology.7,8 A 2008 study of veterans of the Vietnam War, Operation Iraqi Freedom (OIF), and Operation Enduring Freedom (OEF) compared satisfaction by location of care receipt (DoD only, VA only, private only, and multiple sources). That study dichotomized response categories for items related to satisfaction with care (satisfied/not), but did not estimate degree of satisfaction, calculate summary scores of the items, or utilize validated care satisfaction metrics. That study found that a greater proportion of Vietnam War veterans (compared with OIF/OEF veterans receiving care in the private sector) agreed that they “had a role in choosing prosthesis” and disagreed that they wanted to change their current prosthesis to another type.7 The assumption made by the authors is that much of this private sector care was actually VA-sponsored care prescribed and procured by the VA but delivered in the community. However, no data were collected to confirm or refute this assumption, and it is possible that some care was both VA sponsored and delivered, some was VA sponsored but commercially delivered, and in some cases, care was sponsored by other sources and delivered in still other facilities.
A 2012 VA Office of the Inspector General study of OIF, OEF, and Operation New Dawn (OND) veterans reported lower prosthetic satisfaction for veterans with upper limb when compared with lower limb amputation and described respondents concerns about lack of VA prosthetic expertise, difficulty with accessing VA services, and dissatisfaction with the sometimes lengthy approval process for obtaining fee-basis or VA contract care.8 Although this report suggested that there were quality gaps and areas for improvement, it did not employ validated metrics of prosthesis or care satisfaction and instead relied on qualitative data collected through telephone interviews.
Given the VA effort to enhance the quality and consistency of its amputation care services through the formal establishment of the Amputation System of Care, which began in 2008, further evaluation of care satisfaction and quality of care is warranted. In 2014 the VA and DoD released the first evidence-based clinical practice guidelines (CPGs) for the rehabilitation of persons with ULA.2 The CPG describes care paths to improve outcomes and basic tenets of amputation rehabilitation care and can be used to identify process activities that are essential aspects of quality care. However, the extent to which the CPG has impacted the quality and timeliness of care for veterans with ULA are presently unclear.
Thus, the purposes of this study were to: (1) measure veteran satisfaction with prosthetic limb care and identify factors associated with service satisfaction; (2) assess quality indicators that potentially reflect CPG) adoption; (3) compare care satisfaction and quality for those who received care in or outside of the VA or DoD; and (4) evaluate change in satisfaction over time.
Methods
The study was approved by the VA Central Institutional Review Board (IRB) (Study #16-20) and Human Research Protection Office, U.S. Army Medical Research and Development Command. The sampling frame consisted of veterans with major ULA who received care in the VA between 2010 and 2015 identified in VA Corporate Data Warehouse. We sent recruitment packages to nondeceased veterans who had current addresses and phone numbers. Those who did not opt out or inform us that they did not meet eligibility criteria were contacted by study interviewers. A waiver of documentation of written informed consent was obtained from the VA Central IRB. When reached by the study interviewer, Veterans provided oral informed consent. At baseline, 808 veterans were interviewed for a response rate of 47.7% as calculated by the American Association for Public Opinion Research (AAPOR) methodology.9 Follow-up interviews approximately 1 year later (mean [SD] 367 [16.8] days), were conducted with 585 respondents for a 72.4% response rate (Figure).
Survey Content
Development and pilot testing of the survey instrument previously was reported.1 The content of the survey drew from existing survey items and metrics, and included new items specifically designed to address patterns of amputation care, based on care goals within the CPG. All new and modified items were tested and refined through cognitive interviews with 10 participants, and tested with an additional 13 participants.
The survey collected data on demographics, amputation characteristics (year of amputation, level, laterality, and etiology), current prosthesis use, and type of prosthesis. This article focused on the sections of the survey pertaining to satisfaction with prosthetic care and indicators of quality of care. A description of the content of the full survey and a synopsis of overall findings are reported in a prior publication.1 The key independent, dependent, and other variables utilized in the analyses reported in this manuscript are described below.
Primary Independent Variables
In the follow-up survey, we asked respondents whether they had any amputation care in the prior 12 months, and if so to indicate where they had gone for care. We categorized respondents as having received VA/DoD care if they reported any care at the VA or DoD, and as having received non-VA/DoD care if they did not report care at the VA or DoD but indicated that they had received amputation care between baseline and follow-up.
Two primary outcomes were utilized; the Orthotics and Prosthetics User’s Survey (OPUS), client satisfaction with services scale (CSS), and a measure of care quality specifically developed for this study. The CSS is a measure developed specifically for orthotic and prosthesis users.10 This 11-item scale measures satisfaction with prosthetic limb services and contains items evaluating facets of care such as courtesy received from prosthetists and clinical staff, care coordination, appointment wait time, willingness of the prosthetist to listen to participant concerns, and satisfaction with prosthesis training. Items are rated on a 4-point scale (strongly agree [1] to strongly disagree [4]), thus higher CSS scores indicate worse satisfaction with services. The CSS was administered only to prosthesis users.
The Quality of Care assessment developed for this study contained items pertaining to amputation related care receipt and care quality. These items were generated by the study team in consultation with representatives from the VA/DoD Extremity Amputation Center of Excellence after review of the ULA rehabilitation CPG. Survey questions asked respondents about the clinicians visited for amputation related care in the past 12 months, whether they had an annual amputation-related checkup, whether any clinician had assessed their function, worked with them to identify goals, and/or to develop an amputation-related care plan. Respondents were also asked whether there had been family/caregiver involvement in their care and care coordination, whether a peer visitor was involved in their initial care, whether they had received information about amputation management in the prior year, and whether they had amputation-related pain. Those that indicated that they had amputation-related pain were subsequently asked whether their pain was well managed, whether they used medication for pain management, and whether they used any nonpharmaceutical strategies.
Quality of Care Index
We initially developed 15 indicator items of quality of care. We selected 7 of the items to create a summary index. We omitted 3 items about pain management, since these items were completed only by participants who indicated that they had experienced pain; however, we examined the 3 pain items individually given the importance of this topic. We omitted an additional 2 items from the summary index because they would not be sensitive to change because they pertained to the care in the year after initial amputation. One of these items asked whether caregivers were involved in initial amputation management and the other asked whether a peer visit occurred after amputation. Another 3 items were omitted because they only were completed by small subsamples due to intentional skip patterns in the survey. These items addressed whether clinical HCPs discussed amputation care goals in the prior year, worked to develop a care plan in the prior year, or helped to coordinate care after a move. Completion rates for all items considered for the index are shown in eAppendix 1 (Available at doi:10.12788/fp.0096). After item selection, we generated an index score, which was the number of reported “yes” responses to the seven relevant items.
Other Variables
We created a single variable called level/laterality which categorized ULA as unilateral or bilateral. We further categorized respondents with unilateral amputation by their amputation level. We categorized respondents as transradial for wrist joint or below the elbow amputations; transhumeral for at or above the elbow amputations; and shoulder for shoulder joint or forequarter amputations. Participants indicated the amputation etiology using 7 yes/no variables: combat injury, accident, burn, cancer, diabetes mellitus, and infection. Participants could select ≥ 1 etiology.
Primary prosthesis type was categorized as body powered, myoelectric/hybrid, cosmetic, other/unknown, or nonuser. The service era was classified based on amputation date as Before Vietnam, Vietnam War, After Vietnam to Gulf War, After Gulf War to September 10, 2001, and September 11, 2001 to present. For race, individuals with > 1 race were classified as other. We classified participants by region, using the station identification of the most recent VA medical center that they had visited between January 1, 2010 and December 30, 2015.
The survey also employed 2 measures of satisfaction with the prosthesis, the Trinity Amputation and Prosthetic Experience Scale (TAPES) satisfaction scale and the OPUS Client Satisfaction with Devices (CSD). TAPES consists of 10 items addressing color, shape, noise, appearance, weight, usefulness, reliability, fit, comfort and overall satisfaction.11 Items are rated on a 5-point Likert scale from very dissatisfied (1) to very satisfied (5). An 8-item version of the CSD scale was created for this study, after conducting a Rasch analysis (using Winsteps version 4.4.2) of the original 11-item CSD. The 8 items assess satisfaction with prosthesis fit, weight, comfort, donning ease, appearance, durability, skin contact, and pain. Items are rated on a 4-point scale from strongly agree (1) to strongly disagree (4); higher CSD scores indicate less satisfaction with devices. Psychometric analysis of the revised CSD score was reported in a prior publication.12 We also reported on the CSS using the original 10-item measure.
Data Analyses
We described characteristics of respondents at baseline and follow-up. We used baseline data to calculate CSS scores and described scores for all participants, for subgroups of unilateral and bilateral amputees, and for unilateral amputees stratified by amputation level. Wilcoxon rank sum tests were used to compare the CSS item and total scores of 461 prosthesis users with unilateral amputation and 29 with bilateral amputation. To identify factors that we hypothesized might be associated with CSS scores at baseline, we developed separate bivariate linear regression models. We added those factors that were associated with CSS scores at P ≤ .1 in bivariate analyses to a multivariable linear regression model of factors associated with CSS score. The P ≤ .1 threshold was used to ensure that relevant confounders were controlled for in regression models. We excluded 309 participants with no reported prosthesis use (who were not asked to complete the CSS), 20 participants with other/unknown prosthesis types, and 106 with missing data on amputation care in the prior year or on satisfaction metrics. We used baseline data for this analysis to maximize the sample size.
We compared CSS scores for those who reported receiving care within or outside of the VA or DoD in the prior year, using Wilcoxon Mann-Whitney rank tests. We also compared scores of individual quality of care items for these groups using Fisher exact tests. We chose to examine individual items rather than the full Index because several items specified care receipt within the VA and thus would be inappropriate to utilize in comparisons by site location; however, we described responses to all items. In these analyses, we excluded 2 respondents who had conflicting information regarding location of care. We used follow-up data for this analysis because it allowed us to identify location of care received in the prior year.
We also described the CSS scores, the 7-item Quality of Care Index and responses to other items related to quality of care at baseline and follow-up. To examine whether satisfaction with prosthetic care or aspects of care quality had changed over time, we compared baseline and follow-up CSS and quality of care scores for respondents who had measures at both times using Wilcoxon signed ranks tests. Individual items were compared using McNemar tests.
Results
Respondents were 97.4% male and included 776 unilateral amputees and 32 bilateral amputees with a mean (SD) age of 63.3 (14.1) years (Table 1). Respondents had lost their limbs a mean (SD) 31.4 (14.1) years prior, and half were transradial, 34.2% transhumeral, and 11.6% shoulder amputation. At baseline 185 (22.9%) participants received amputation-related care in the prior year and 118 (20.2%) participants received amputation-related care within 1 year of follow-up. Of respondents, 113 (19.3%) stated that their care was between baseline and follow-up and 89 (78.8%) of these received care at either the VA, the DoD or both; just 16 (14.2%) received care elsewhere.
Mean (SD) CSS scores were highest (lower satisfaction) for those with amputation at the shoulder and lowest for those with transhumeral amputation: 42.2 (20.0) vs 33.4 (20.8). Persons with bilateral amputation were less satisfied in almost every category when compared with those with unilateral amputation, although the total CSS score was not substantially different. Wilcoxon rank sum analyses revealed statistically significant differences in wait time satisfaction: bilateral amputees were less satisfied than unilateral amputees. Factors associated with overall CSS score in bivariate analyses were CSD score, TAPES score, amputation care receipt, prosthesis type, race, and region of care (eAppendix 2, available at doi:10.12788/fp.0096).
In the multivariate regression model of baseline CSS scores, only 2 variables were independently associated with CSS scores: CSD score and recent amputation care (Table 3). For each 1-point increase in CSD score there was a 0.7 point increase in CSS score. Those with amputation care in the prior year had higher satisfaction when compared with those who had not received care (P = .003).
For participants who indicated that they received amputation care between baseline and follow-up, CSS mean (SD) scores were better, but not statistically different, for those who reported care in the VA or DoD vs private care, 31.6 (22.6) vs 38.0 (17.7) (Table 4). When compared with community-based care, more participants who received care in the VA or DoD in the prior year had a functional assessment in that time period (33.7% vs 7.1%, P = .06), were contacted by HCPs outside of appointments (42.7% vs 18.8%, P = .07), and received information about amputation care in the prior year (41.6% vs 0%, P =.002). There was no difference in the proportion whose family/caregivers were involved in care in the prior year.
No statistically significant differences were observed in paired comparisons of the CSS and Quality of Care Index at baseline or follow-up for all participants with data at both time points (Table 5; eAppendix 3 available at doi:10.12788/fp.0096). Individual pain measures did not differ significantly between timepoints. Quality Index mean (SD) scores were 1.3 (1.5) and 1.2 (1.5) at baseline and follow-up, respectively (P = .07). For the 214 prosthesis users with longitudinal data, baseline CSS mean (SD) scores were generally worse at baseline than at follow-up: 34.4 (19.8) vs 32.5 (21.0) (P = .23). Family/caregiver involvement in amputation care was significantly higher in the year before baseline when compared with the year prior to follow-up (24.4% vs 17.7%, P = .001). There were no other statistically significant differences in Quality of Care items between baseline and follow-up.
Discussion
Our longitudinal study provides insights into the experiences of veterans with major ULA related to satisfaction with prosthetic limb care services and receipt of amputation-related care. We reported on the development and use of a new summary measure of amputation care quality, which we designed to capture some of the key elements of care quality as provided in the VA/DoD CPG.2
We used baseline data to identify factors independently associated with prosthetic limb care satisfaction as measured by a previously validated measure, the OPUS CSS. The CSS addresses satisfaction with prosthetic limb services and does not reflect satisfaction with other amputation care services. We found that persons who received amputation care in the prior year had CSS scores that were a mean 5.1 points better than those who had not received recent care. Although causality cannot be determined with this investigation, this finding highlights an important relationship between frequency of care and satisfaction, which can be leveraged by the VA in future care initiatives. Care satisfaction was also better by 0.7 points for every 1-point decrease (indicating higher satisfaction) in the OPUS CSD prosthetic satisfaction scale. This finding isn’t surprising, given that a major purpose of prosthetic limb care services is to procure and fit a satisfactory device. To determine whether these same relationships were observed in the smaller, longitudinal cohort data at follow-up, we repeated these models and found similar relationships between recent care receipt and prosthesis satisfaction and satisfaction with services. We believe that these findings are meaningful and emphasize the importance of both service and device satisfaction to the veteran with an ULA. Lower service satisfaction scores among those with amputations at the shoulder and those with bilateral limb loss suggest that these individuals may benefit from different service delivery approaches.
We did observe a difference in satisfaction scores by geographic region in the follow-up (but not the baseline) data with satisfaction higher in the Western vs the Southern region (data not shown). This finding suggests a need for continued monitoring of care satisfaction over time to determine whether differences by region persist. We grouped respondents into geographic region based on the location where they had received their most recent VA care of any type. Many veterans receive care at multiple VA locations. Thus, it is possible that some veterans received their amputation care at a non-VA facility or a VA facility in a different region.
Our findings related to prosthetic limb care services satisfaction are generalizable to veteran prosthesis users. Findings may not be generalizable to nonusers, because in our study, the CSS only was administered to prosthesis users. Thus, we were unable to identify factors associated with care satisfaction for persons who were not current users of an upper limb prosthesis.
The study findings confirmed that most veterans with ULA receive amputation-related care in the VA or DoD. We compared CSS and Quality of Care item scores for those who reported receiving care at the VA or DoD vs elsewhere. Amputation care within the VA is complex. Some services are provided at VA facilities and some are ordered by VA clinicians but provided by community-based HCPs. However, we found that better (though not statistically significantly different) CSS scores and several Quality of Care items were endorsed by a significantly more of those reporting care in the VA or DoD as compared to elsewhere. Given the dissemination of a rehabilitation of upper limb amputees CPG, we hypothesized that VA and DoD HCPs would be more aware of care guidelines and would provide better care. Overall, our findings supported this hypothesis while also suggesting that areas such as caregiver involvement and peer visitation may benefit from additional attention and program improvement.
We used longitudinal data to describe and compare CSS and Quality of Care Index scores. Our analyses did not detect any statistically significant differences between baseline and follow-up. This finding may reflect that this was a relatively stable population with regard to amputation experiences given the mean time since amputation was 31.4 years. However, we also recognize that our measures may not have captured all aspects of care satisfaction or quality. It is possible that there were other changes that had occurred over the course of the year that were not captured by the CSS or by the Quality of Care Index. It is also possible that some implementation and adoption of the CPG had happened prior to our baseline survey. Finally, it is possible that some elements of the CPG have not yet been fully integrated into clinical care. We believe that the latter is likely, given that nearly 80% of respondents did not report receiving any amputation care within the past year at follow-up, though the CPGs recommend an annual visit.
Aside from recall bias, 2 explanations must be considered relative to the low rate of adherence to the CPG recommendation for an annual follow-up. The first is that the CPG simply may not be widely adopted. The second is that the majority of patients with ULA who use prostheses use a body-powered system. These tend to be low maintenance, long-lasting systems and may ultimately not need annual maintenance and repair. Further, if the veteran’s body-powered system is functioning properly and health status has not changed, they may simply be opting out of an annual visit despite the CPG recommendation. Nonetheless, this apparent low rate of annual follow-up emphasizes the need for additional process improvement measures for the VA.
Strengths and Limitations
The VA provides a unique setting for a nationally representative study of amputation rehabilitation because it has centralized data sources that can be used to identify veterans with ULA. Our study had a strong response rate, and its prosthetic limb care satisfaction findings are generalizable to all veterans with major ULA who received VA care from 2010 to 2015. However, there are limits to generalizability outside of this population to civilians or to veterans who do not receive VA care. To examine possible nonresponse bias, which could limit generalizability, we compared the baseline characteristics of respondents and nonrespondents to the follow-up study (eAppendix 4 available at doi:10.12788/fp.0096). There were no significant differences in satisfaction, quality of care, or receipt of amputation-related care between those lost to follow-up and those with follow-up data. Although, we did find small differences in gender, race, and service era (defined by amputation date). We do not believe that these differences threaten the interpretation of findings at follow-up, but there may be limits to generalizability of these findings to the full baseline sample. The data were from a telephone survey of veterans. It is possible that some veterans did not recall their care receipt or did not understand some of the questions and thus may not have accurately answered questions related to type of care received or the timing of that care.
Our interpretation of findings comparing care received within the VA and DoD or elsewhere is also limited because we cannot say with certainty whether those who indicated no care in the VA or DoD actually had care that was sponsored by the VA or DoD as contract or fee-basis care. Just 8 respondents indicated that they had received care only outside of the VA or DoD in the prior year. There were also some limitations in the collection of data about care location. We asked about receipt of amputation care in the prior year and about location of any amputation care received between baseline and follow-up, and there were differences in responses. Thus, we used a combination of these items to identify location of care received in the prior year.
Despite these limitations, we believe that our study provides novel, important findings about the satisfaction with prosthetic limb care services and quality of amputation rehabilitation care for veterans. Findings from this study can be used to address amputation and prosthetic limb care satisfaction and quality weaknesses highlighted and to benchmark care satisfaction and CPG compliance. Other studies evaluating care guideline compliance have used indicators obtained from clinical records or data repositories.13-15 Future work could combine self-reported satisfaction and care quality measures with indicators obtained from clinical or repository sources to provide a more complete snapshot of care delivery.
Conclusions
We reported on a national survey of veterans with major upper limb loss that assessed satisfaction with prosthetic limb care services and quality of amputation care. Satisfaction with prosthetic limb care was independently associated with satisfaction with the prosthesis, and receipt of care within the prior year. Most of the veterans surveyed received care within the VA or DoD and reported receiving higher quality of care, when compared with those who received care outside of the VA or DoD. Satisfaction with care and quality of care were stable over the year of this study. Data presented in this study can serve to direct VA amputation care process improvement initiatives as benchmarks for future work. Future studies are needed to track satisfaction with and quality of care for veterans with ULA.
1. Resnik L, Ekerholm S, Borgia M, Clark MA. A national study of veterans with major upper limb amputation: Survey methods, participants, and summary findings. PLoS One. 2019;14(3):e0213578. Published 2019 Mar 14. doi:10.1371/journal.pone.0213578
2. US Department of Defense, US Department of Veterans Affairs, Management of Upper Extremity Amputation Rehabilitation Working Group. VA/DoD clinical practice guideline for the management of upper extremity amputation rehabilitation.Published 2014. Accessed February 18, 2021. https://www.healthquality.va.gov/guidelines/Rehab/UEAR/VADoDCPGManagementofUEAR121614Corrected508.pdf
3. Jette AM. The Promise of Assistive Technology to Enhance Work Participation. Phys Ther. 2017;97(7):691-692. doi:10.1093/ptj/pzx054
4. Webster JB, Poorman CE, Cifu DX. Guest editorial: Department of Veterans Affairs amputations system of care: 5 years of accomplishments and outcomes. J Rehabil Res Dev. 2014;51(4):vii-xvi. doi:10.1682/JRRD.2014.01.0024
5. Scholten J, Poorman C, Culver L, Webster JB. Department of Veterans Affairs polytrauma telerehabilitation: twenty-first century care. Phys Med Rehabil Clin N Am. 2019;30(1):207-215. doi:10.1016/j.pmr.2018.08.003
6. Melcer T, Walker J, Bhatnagar V, Richard E. Clinic use at the Departments of Defense and Veterans Affairs following combat related amputations. Mil Med. 2020;185(1-2):e244-e253. doi:10.1093/milmed/usz149
7. Berke GM, Fergason J, Milani JR, et al. Comparison of satisfaction with current prosthetic care in veterans and servicemembers from Vietnam and OIF/OEF conflicts with major traumatic limb loss. J Rehabil Res Dev. 2010;47(4):361-371. doi:10.1682/jrrd.2009.12.0193
8. US Department of Veterans Affairs, Office of Inspector General. Healthcare inspection prosthetic limb care in VA facilities. Published March 8, 2012. Accessed February 18, 2021. https://www.va.gov/oig/pubs/VAOIG-11-02138-116.pdf 9. American Association for Public Opinion Research. Response rates - an overview. Accessed February 18, 2021. https://www.aapor.org/Education-Resources/For-Researchers/Poll-Survey-FAQ/Response-Rates-An-Overview.aspx
10. Heinemann AW, Bode RK, O’Reilly C. Development and measurement properties of the Orthotics and Prosthetics Users’ Survey (OPUS): a comprehensive set of clinical outcome instruments. Prosthet Orthot Int. 2003;27(3):191-206. doi:10.1080/03093640308726682
11. Desmond DM, MacLachlan M. Factor structure of the Trinity Amputation and Prosthesis Experience Scales (TAPES) with individuals with acquired upper limb amputations. Am J Phys Med Rehabil. 2005;84(7):506-513. doi:10.1097/01.phm.0000166885.16180.63
12. Resnik L, Borgia M, Heinemann AW, Clark MA. Prosthesis satisfaction in a national sample of veterans with upper limb amputation. Prosthet Orthot Int. 2020;44(2):81-91. doi:10.1177/0309364619895201
13. Ho TH, Caughey GE, Shakib S. Guideline compliance in chronic heart failure patients with multiple comorbid diseases: evaluation of an individualised multidisciplinary model of care. PLoS One. 2014;9(4):e93129. Published 2014 Apr 8. doi:10.1371/journal.pone.0093129
14. Mitchell KB, Lin H, Shen Y, et al. DCIS and axillary nodal evaluation: compliance with national guidelines. BMC Surg. 2017;17(1):12. Published 2017 Feb 7. doi:10.1186/s12893-017-0210-5
15. Moesker MJ, de Groot JF, Damen NL, et al. Guideline compliance for bridging anticoagulation use in vitamin-K antagonist patients; practice variation and factors associated with non-compliance. Thromb J. 2019;17:15. Published 2019 Aug 5. doi:10.1186/s12959-019-0204-x
Impact of an Oral Antineoplastic Renewal Clinic on Medication Possession Ratio and Cost-Savings
Evaluation of oral antineoplastic agent (OAN) adherence patterns have identified correlations between nonadherence or over-adherence and poorer disease-related outcomes. Multiple studies have focused on imatinib use in chronic myeloid leukemia (CML) due to its continuous, long-term use. A study by Ganesan and colleagues found that nonadherence to imatinib showed a significant decrease in 5-year event-free survival between 76.7% of adherent participants compared with 59.8% of nonadherent participants.1 This study found that 44% of patients who were adherent to imatinib achieved complete cytogenetic response vs only 26% of patients who were nonadherent. In another study of imatinib for CML, major molecular response (MMR) was strongly correlated with adherence and no patients with adherence < 80% were able to achieve MMR.2 Similarly, in studies of tamoxifen for breast cancer, < 80% adherence resulted in a 10% decrease in survival when compared to those who were more adherent.3,4
In addition to the clinical implications of nonadherence, there can be a significant cost associated with suboptimal use of these medications. The price of a single dose of OAN medication may cost as much as $440.5
The benefits of multidisciplinary care teams have been identified in many studies.6,7 While studies are limited in oncology, pharmacists provide vital contributions to the oncology multidisciplinary team when managing OANs as these health care professionals have expert knowledge of the medications, potential adverse events (AEs), and necessary monitoring parameters.8 In one study, patients seen by the pharmacist-led oral chemotherapy management program experienced improved clinical outcomes and response to therapy when compared with preintervention patients (early molecular response, 88.9% vs 54.8%, P = .01; major molecular response, 83.3% vs 57.6%, P = .06).9 During the study, 318 AEs were reported, leading to 235 pharmacist interventions to ameliorate AEs and improve adherence.
The primary objective of this study was to measure the impact of a pharmacist-driven OAN renewal clinic on medication adherence. The secondary objective was to estimate cost-savings of this new service.
Methods
Prior to July 2014, several limitations were identified related to OAN prescribing and monitoring at the Richard L. Roudebush Veterans Affairs Medical Center in Indianapolis, Indiana (RLRVAMC). The prescription ordering process relied primarily on the patient to initiate refills, rather than the prescriber OAN prescriptions also lacked consistency for number of refills or quantities dispensed. Furthermore, ordering of antineoplastic products was not limited to hematology/oncology providers. Patients were identified with significant supply on hand at the time of medication discontinuation, creating concerns for medication waste, tolerability, and nonadherence.
As a result, opportunities were identified to improve the prescribing process, recommended monitoring, toxicity and tolerability evaluation, medication reconciliation, and medication adherence. In July of 2014, the RLRVAMC adopted a new chemotherapy order entry system capable of restricting prescriptions to hematology/oncology providers and limiting dispensed quantities and refill amounts. A comprehensive pharmacist driven OAN renewal clinic was implemented on September 1, 2014 with the goal of improving long-term adherence and tolerability, in addition to minimizing medication waste.
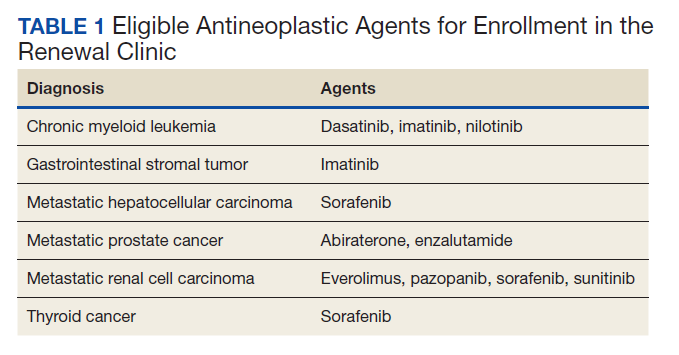
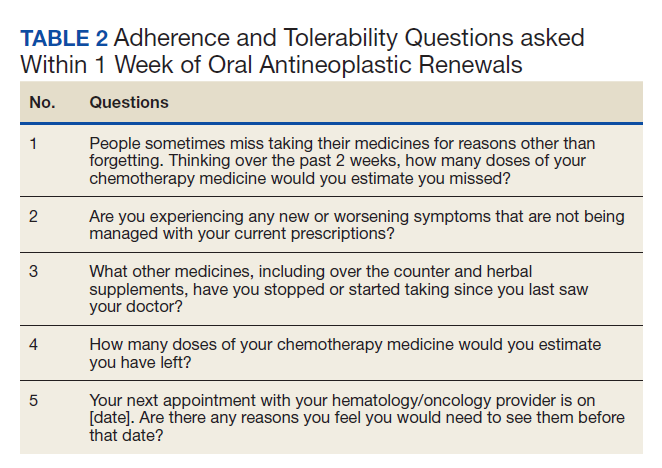
Patients were eligible for enrollment in the clinic if they had a cancer diagnosis and were concomitantly prescribed an OAN outlined in Table 1. All eligible patients were automatically enrolled in the clinic when they were deemed stable on their OAN by a hematology/oncology pharmacy specialist. Stability was defined as ≤ Grade 1 symptoms associated with the toxicities of OAN therapy managed with or without intervention as defined by the Common Terminology Criteria for Adverse Events (CTCAE) version 4.03. Once enrolled in the renewal clinic, patients were called by an oncology pharmacy resident (PGY2) 1 week prior to any OAN refill due date. Patients were asked a series of 5 adherence and tolerability questions (Table 2) to evaluate renewal criteria for approval or need for further evaluation. These questions were developed based on targeted information and published reports on monitoring adherence.10,11 Criteria for renewal included: < 10% self-reported missed doses of the OAN during the previous dispensing period, no hospitalizations or emergency department visits since most recent hematology/oncology provider appointment, no changes to concomitant medication therapies, and no new or worsening medication-related AEs. Patients meeting all criteria were given a 30-day supply of OAN. Prescribing, dispensing, and delivery of OAN were facilitated by the pharmacist. Patient cases that did not meet criteria for renewal were escalated to the hematology/oncology provider or oncology clinical pharmacy specialist for further evaluation.
Study Design and Setting
This was a pre/post retrospective cohort, quality improvement study of patients enrolled in the RLRVAMC OAN pharmacist renewal clinic. The study was deemed exempt from institutional review board (IRB) by the US Department of Veterans Affairs (VA) Research and Development Department.
Study Population
Patients were included in the preimplementation group if they had received at least 2 prescriptions of an eligible OAN. Therapy for the preimplementation group was required to be a monthly duration > 21 days and between the dates of September 1, 2013 and August 31, 2014. Patients were included in the postimplementation group if they had received at least 2 prescriptions of the studied OANs between September 1, 2014 and January 31, 2015. Patients were excluded if they had filled < 2 prescriptions of OAN; were managed by a non-VA oncologist or hematologist; or received an OAN other than those listed in Table 1.
Data Collection
For all patients in both the pre- and postimplementation cohorts, a standardized data collection tool was used to collect the following via electronic health record review by a PGY2 oncology resident: age, race, gender, oral antineoplastic agent, refill dates, days’ supply, estimated unit cost per dose cancer diagnosis, distance from the RLRVAMC, copay status, presence of hospitalizations/ED visits/dosage reductions, discontinuation rates, reasons for discontinuation, and total number of current prescriptions. The presence or absence of dosage reductions were collected to identify concerns for tolerability, but only the original dose for the preimplementation group and dosage at time of clinic enrollment for the postimplementation group was included in the analysis.
Outcomes and Statistical Analyses
The primary outcome was medication adherence defined as the median medication possession ratio (MPR) before and after implementation of the clinic. Secondary outcomes included the proportion of patients who were adherent from before implementation to after and estimated cost-savings of this clinic after implementation. MPR was used to estimate medication adherence by taking the cumulative day supply of medication on hand divided by the number of days on therapy.12 Number of days on therapy was determined by taking the difference on the start date of the new medication regimen and the discontinuation date of the same regimen. Patients were grouped by adherence into one of the following categories: < 0.8, 0.8 to 0.89, 0.9 to 1, and > 1.1. Patients were considered adherent if they reported taking ≥ 90% (MPR ≥ 0.9) of prescribed doses, adopted from the study by Anderson and colleagues.12 A patient with an MPR > 1, likely due to filling prior to the anticipated refill date, was considered 100% adherent (MPR = 1). If a patient switched OAN during the study, both agents were included as separate entities.
A conservative estimate of cost-savings was made by multiplying the RLRVAMC cost per unit of medication at time of initial prescription fill by the number of units taken each day multiplied by the total days’ supply on hand at time of therapy discontinuation. Patients with an MPR < 1 at time of therapy discontinuation were assumed to have zero remaining units on hand and zero cost savings was estimated. Waste, for purposes of cost-savings, was calculated for all MPR values > 1. Additional supply anticipated to be on hand from dose reductions was not included in the estimated cost of unused medication.
Descriptive statistics compared demographic characteristics between the pre- and postimplementation groups. MPR data were not normally distributed, which required the use of nonparametric Mann-Whitney U tests to compare pre- and postMPRs. Pearson χ2 compared the proportion of adherent patients between groups while descriptive statistics were used to estimate cost savings. Significance was determined based on a P value < .05. IBM SPSS Statistics software was used for all statistical analyses. As this was a complete sample of all eligible subjects, no sample size calculation was performed.
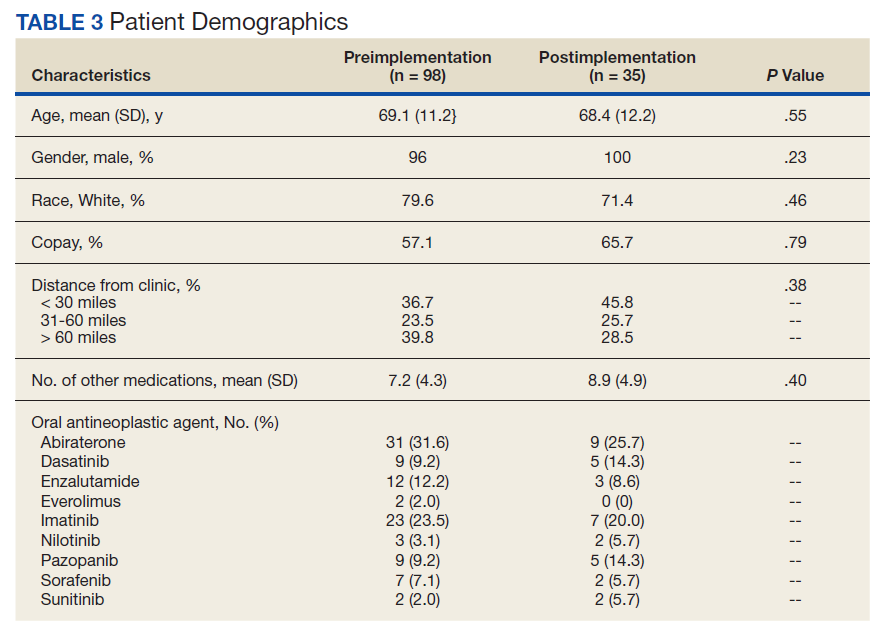
Results
In the preimplementation period, 246 patients received an OAN and 61 patients received an OAN in the postimplementation period (Figure 1). Of the 246 patients in the preimplementation period, 98 were eligible and included in the preimplementation group. Similarly, of the 61 patients in the postimplementation period, 35 patients met inclusion criteria for the postimplementation group. The study population was predominantly male with an average age of approximately 70 years in both groups (Table 3). More than 70% of the population in each group was White. No statistically significant differences between groups were identified. The most commonly prescribed OAN in the preimplementation group were abiraterone, imatinib, and enzalutamide (Table 3). In the postimplementation group, the most commonly prescribed agents were abiraterone, imatinib, pazopanib, and dasatinib. No significant differences were observed in prescribing of individual agents between the pre- and postimplementation groups or other characteristics that may affect adherence including patient copay status, number of concomitant medications, and driving distance from the RLRVAMC.
Thirty-six (36.7%) patients in the preimplementation group were considered nonadherent (MPR < 0.9) and 18 (18.4%) had an MPR < 0.8. Fifteen (15.3%) patients in the preimplementation clinic were considered overadherent (MPR > 1.1). Forty-seven (47.9%) patients in the preimplementation group were considered adherent (MPR 0.9 - 1.1) while all 35 (100%) patients in the postimplementation group were considered adherent (MPR 0.9 - 1.1). No non- or overadherent patients were identified in the postimplementation group (Figure 2). The median MPR for all patients in the preimplementation group was 0.94 compared with 1.06 (P < .001) in the postimplementation group.
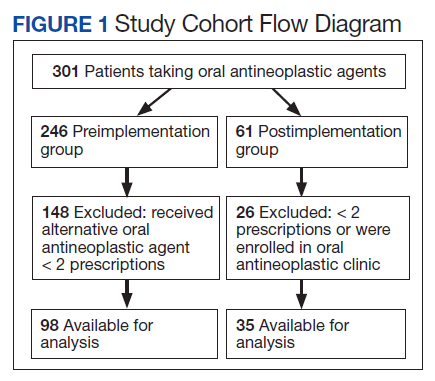
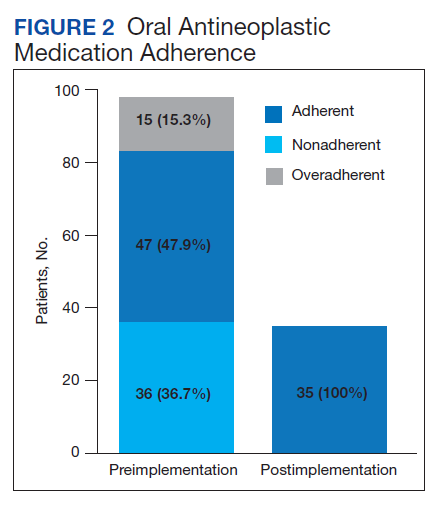
Thirty-five (35.7%) patients had therapy discontinued or held in the preimplementation group compared with 2 (5.7%) patients in the postimplementation group (P < .001). Reasons for discontinuation in the preimplementation group included disease progression (n = 27), death (n = 3), lost to follow up (n = 2), and intolerability of therapy (n = 3). Both patients that discontinued therapy in the postimplementation group did so due to disease progression. Of the 35 patients who had their OAN discontinued or held in the preimplementation group, 14 patients had excess supply on hand at time of discontinuation. The estimated value of the unused medication was $37,890. Nine (25%) of the 35 patients who discontinued therapy had a dosage reduction during the course of therapy and the additional supply was not included in the cost estimate. Similarly, 1 of the 2 patients in the postimplementation group had their OAN discontinued during study. The cost of oversupply of medication at the time of therapy discontinuation was estimated at $1,555. No patients in the postimplementation group had dose reductions. After implementation of the OAN renewal clinic, the total cost savings between pre ($37,890) and postimplementation ($1,555) groups was $36,355.
Discussion
OANs are widely used therapies, with more than 25 million doses administered per year in the United States alone.12 The use of these agents will continue to grow as more targeted agents become available and patients request more convenient treatment options. The role for hematology/oncology clinical pharmacy services must adapt to this increased usage of OANs, including increasing pharmacist involvement in medication education, adherence and tolerability assessments, and proactive drug interaction monitoring.However, additional research is needed to determine optimal management strategies.
Our study aimed to compare OAN adherence among patients at a tertiary care VA hospital before and after implementation of a renewal clinic. The preimplementation population had a median MPR of 0.94 compared with 1.06 in the postimplementation group (P < .001). Although an ideal MPR is 1.0, we aimed for a slightly higher MPR to allow a supply buffer in the event of prescription delivery delays, as more than 90% of prescriptions are mailed to patients from a regional mail-order pharmacy. Importantly, the median MPRs do not adequately convey the impact from this clinic. The proportion of patients who were considered adherent to OANs increased from 47.9% in the preimplementation to 100% in the postimplementation period. These finding suggest that the clinical pharmacist role to assess and encourage adherence through monitoring tolerability of these OANs improved the overall medication taking experience of these patients.
Upon initial evaluation of adherence pre- and postimplementation, median adherence rates in both groups appeared to be above goal at 0.94 and 1.06 respectively. Patients in the postimplementation group intentionally received a 5- to 7-day supply buffer to account for potential prescription delivery delays due to holidays and inclement weather. This would indicate that the patients in the postimplementation group would have 15% oversupply due to the 5-day supply buffer. After correcting for patients with confounding reasons for excess (dose reductions, breaks in treatment, etc.), the median MPR in the prerefill clinic group decreased to 0.9 and the MPR in the postrefill clinic group increased slightly to 1.08. Although the median adherence rate in both the pre- and postimplementation groups were above goal of 0.90, 36% of the patients in the preimplementation group were considered nonadherent (MPR < 0.9) compared with no patients in the postimplementation group. Therefore, our intervention to improve patient adherence appeared to be beneficial at our institution.
In addition to improving adherence, one of the goals of the renewal clinic was to minimize excess supply at the time of therapy discontinuation. This was accomplished by aligning medication fills with medical visits and objective monitoring, as well as limiting supply to no more than 30 days. Of the patients in the postimplementation group, only 1 patient had remaining medication at the time of therapy discontinuation compared with 14 patients in the preimplementation group. The estimated cost savings from excess supply was $36,335. Limiting the amount of unused supply not only saves money for the patient and the institution, but also decreases opportunity for improper hazardous waste disposal and unnecessary exposure of hazardous materials to others.
Our results show the pharmacist intervention in the coordination of renewals improved adherence, minimized medication waste, and saved money. The cost of pharmacist time participating in the refill clinic was not calculated. Each visit was completed in approximately 5 minutes, with subsequent documentation and coordination taking an additional 5 to 10 minutes. During the launch of this service, the oncology pharmacy resident provided all coverage of the clinic. Oversite of the resident was provided by hematology/oncology clinical pharmacy specialists. We have continued to utilize pharmacy resident coverage since that time to meet education needs and keep the estimated cost per visit low. Another option in the case that pharmacy residents are not available would be utilization of a pharmacy technician, intern, or professional student to conduct the adherence and tolerability phone assessments. Our escalation protocol allows intervention by clinical pharmacy specialist and/or other health care providers when necessary. Trainees have only required basic training on how to use the protocol.
Limitations
Due to this study’s retrospective design, an inherent limitation is dependence on prescriber and refill records for documentation of initiation and discontinuation dates. Therefore, only the association of impact of pharmacist intervention on medication adherence can be determined as opposed to causation. We did not take into account discrepancies in day supply secondary to ‘held’ therapies, dose reductions, or doses supplied during an inpatient admission, which may alter estimates of MPR and cost-savings data. Patients in the postimplementation group intentionally received a 5 to 7-day supply buffer to account for potential prescription delivery delays due to holidays and inclement weather. This would indicate that the patients in the postimplementation group would have 15% oversupply due to the 5-day supply buffer, thereby skewing MPR values. This study did not account for cost avoidance resulting from early identification and management of toxicity. Finally, the postimplementation data only spans 4 months and a longer duration of time is needed to more accurately determine sustainability of renewal clinic interventions and provide comprehensive evaluation of cost-avoidance.
Conclusion
Implementation of an OAN renewal clinic was associated with an increase in MPR, improved proportion of patients considered adherent, and an estimated $36,335 cost-savings. However, prospective evaluation and a longer study duration are needed to determine causality of improved adherence and cost-savings associated with a pharmacist-driven OAN renewal clinic.
1. Ganesan P, Sagar TG, Dubashi B, et al. Nonadherence to imatinib adversely affects event free survival in chronic phase chronic myeloid leukemia. Am J Hematol 2011; 86: 471-474. doi:10.1002/ajh.22019
2. Marin D, Bazeos A, Mahon FX, et al. Adherence is the critical factor for achieving molecular responses in patients with chronic myeloid leukemia who achieve complete cytogenetic responses on imatinib. J Clin Oncol 2010; 28: 2381-2388. doi:10.1200/JCO.2009.26.3087
3. McCowan C, Shearer J, Donnan PT, et al. Cohort study examining tamoxifen adherence and its relationship to mortality in women with breast cancer. Br J Cancer 2008; 99: 1763-1768. doi:10.1038/sj.bjc.6604758
4. Lexicomp Online. Sunitinib. Hudson, Ohio: Lexi-Comp, Inc; August 20, 2019.
5. Babiker A, El Husseini M, Al Nemri A, et al. Health care professional development: Working as a team to improve patient care. Sudan J Paediatr. 2014;14(2):9-16.
6. Spence MM, Makarem AF, Reyes SL, et al. Evaluation of an outpatient pharmacy clinical services program on adherence and clinical outcomes among patients with diabetes and/or coronary artery disease. J Manag Care Spec Pharm. 2014;20(10):1036-1045. doi:10.18553/jmcp.2014.20.10.1036
7. Holle LM, Puri S, Clement JM. Physician-pharmacist collaboration for oral chemotherapy monitoring: Insights from an academic genitourinary oncology practice. J Oncol Pharm Pract 2015; doi:10.1177/1078155215581524
8. Muluneh B, Schneider M, Faso A, et al. Improved Adherence Rates and Clinical Outcomes of an Integrated, Closed-Loop, Pharmacist-Led Oral Chemotherapy Management Program. Journal of Oncology Practice. 2018;14(6):371-333. doi:10.1200/JOP.17.00039.
9. Font R, Espinas JA, Gil-Gil M, et al. Prescription refill, patient self-report and physician report in assessing adherence to oral endocrine therapy in early breast cancer patients: a retrospective cohort study in Catalonia, Spain. British Journal of Cancer. 2012 ;107(8):1249-1256. doi:10.1038/bjc.2012.389.
10. Anderson KR, Chambers CR, Lam N, et al. Medication adherence among adults prescribed imatinib, dasatinib, or nilotinib for the treatment of chronic myeloid leukemia. J Oncol Pharm Practice. 2015;21(1):19–25. doi:10.1177/1078155213520261
11. Weingart SN, Brown E, Bach PB, et al. NCCN Task Force Report: oral chemotherapy. J Natl Compr Canc Netw. 2008;6(3): S1-S14.
Evaluation of oral antineoplastic agent (OAN) adherence patterns have identified correlations between nonadherence or over-adherence and poorer disease-related outcomes. Multiple studies have focused on imatinib use in chronic myeloid leukemia (CML) due to its continuous, long-term use. A study by Ganesan and colleagues found that nonadherence to imatinib showed a significant decrease in 5-year event-free survival between 76.7% of adherent participants compared with 59.8% of nonadherent participants.1 This study found that 44% of patients who were adherent to imatinib achieved complete cytogenetic response vs only 26% of patients who were nonadherent. In another study of imatinib for CML, major molecular response (MMR) was strongly correlated with adherence and no patients with adherence < 80% were able to achieve MMR.2 Similarly, in studies of tamoxifen for breast cancer, < 80% adherence resulted in a 10% decrease in survival when compared to those who were more adherent.3,4
In addition to the clinical implications of nonadherence, there can be a significant cost associated with suboptimal use of these medications. The price of a single dose of OAN medication may cost as much as $440.5
The benefits of multidisciplinary care teams have been identified in many studies.6,7 While studies are limited in oncology, pharmacists provide vital contributions to the oncology multidisciplinary team when managing OANs as these health care professionals have expert knowledge of the medications, potential adverse events (AEs), and necessary monitoring parameters.8 In one study, patients seen by the pharmacist-led oral chemotherapy management program experienced improved clinical outcomes and response to therapy when compared with preintervention patients (early molecular response, 88.9% vs 54.8%, P = .01; major molecular response, 83.3% vs 57.6%, P = .06).9 During the study, 318 AEs were reported, leading to 235 pharmacist interventions to ameliorate AEs and improve adherence.
The primary objective of this study was to measure the impact of a pharmacist-driven OAN renewal clinic on medication adherence. The secondary objective was to estimate cost-savings of this new service.
Methods
Prior to July 2014, several limitations were identified related to OAN prescribing and monitoring at the Richard L. Roudebush Veterans Affairs Medical Center in Indianapolis, Indiana (RLRVAMC). The prescription ordering process relied primarily on the patient to initiate refills, rather than the prescriber OAN prescriptions also lacked consistency for number of refills or quantities dispensed. Furthermore, ordering of antineoplastic products was not limited to hematology/oncology providers. Patients were identified with significant supply on hand at the time of medication discontinuation, creating concerns for medication waste, tolerability, and nonadherence.
As a result, opportunities were identified to improve the prescribing process, recommended monitoring, toxicity and tolerability evaluation, medication reconciliation, and medication adherence. In July of 2014, the RLRVAMC adopted a new chemotherapy order entry system capable of restricting prescriptions to hematology/oncology providers and limiting dispensed quantities and refill amounts. A comprehensive pharmacist driven OAN renewal clinic was implemented on September 1, 2014 with the goal of improving long-term adherence and tolerability, in addition to minimizing medication waste.
Patients were eligible for enrollment in the clinic if they had a cancer diagnosis and were concomitantly prescribed an OAN outlined in Table 1. All eligible patients were automatically enrolled in the clinic when they were deemed stable on their OAN by a hematology/oncology pharmacy specialist. Stability was defined as ≤ Grade 1 symptoms associated with the toxicities of OAN therapy managed with or without intervention as defined by the Common Terminology Criteria for Adverse Events (CTCAE) version 4.03. Once enrolled in the renewal clinic, patients were called by an oncology pharmacy resident (PGY2) 1 week prior to any OAN refill due date. Patients were asked a series of 5 adherence and tolerability questions (Table 2) to evaluate renewal criteria for approval or need for further evaluation. These questions were developed based on targeted information and published reports on monitoring adherence.10,11 Criteria for renewal included: < 10% self-reported missed doses of the OAN during the previous dispensing period, no hospitalizations or emergency department visits since most recent hematology/oncology provider appointment, no changes to concomitant medication therapies, and no new or worsening medication-related AEs. Patients meeting all criteria were given a 30-day supply of OAN. Prescribing, dispensing, and delivery of OAN were facilitated by the pharmacist. Patient cases that did not meet criteria for renewal were escalated to the hematology/oncology provider or oncology clinical pharmacy specialist for further evaluation.
Study Design and Setting
This was a pre/post retrospective cohort, quality improvement study of patients enrolled in the RLRVAMC OAN pharmacist renewal clinic. The study was deemed exempt from institutional review board (IRB) by the US Department of Veterans Affairs (VA) Research and Development Department.
Study Population
Patients were included in the preimplementation group if they had received at least 2 prescriptions of an eligible OAN. Therapy for the preimplementation group was required to be a monthly duration > 21 days and between the dates of September 1, 2013 and August 31, 2014. Patients were included in the postimplementation group if they had received at least 2 prescriptions of the studied OANs between September 1, 2014 and January 31, 2015. Patients were excluded if they had filled < 2 prescriptions of OAN; were managed by a non-VA oncologist or hematologist; or received an OAN other than those listed in Table 1.
Data Collection
For all patients in both the pre- and postimplementation cohorts, a standardized data collection tool was used to collect the following via electronic health record review by a PGY2 oncology resident: age, race, gender, oral antineoplastic agent, refill dates, days’ supply, estimated unit cost per dose cancer diagnosis, distance from the RLRVAMC, copay status, presence of hospitalizations/ED visits/dosage reductions, discontinuation rates, reasons for discontinuation, and total number of current prescriptions. The presence or absence of dosage reductions were collected to identify concerns for tolerability, but only the original dose for the preimplementation group and dosage at time of clinic enrollment for the postimplementation group was included in the analysis.
Outcomes and Statistical Analyses
The primary outcome was medication adherence defined as the median medication possession ratio (MPR) before and after implementation of the clinic. Secondary outcomes included the proportion of patients who were adherent from before implementation to after and estimated cost-savings of this clinic after implementation. MPR was used to estimate medication adherence by taking the cumulative day supply of medication on hand divided by the number of days on therapy.12 Number of days on therapy was determined by taking the difference on the start date of the new medication regimen and the discontinuation date of the same regimen. Patients were grouped by adherence into one of the following categories: < 0.8, 0.8 to 0.89, 0.9 to 1, and > 1.1. Patients were considered adherent if they reported taking ≥ 90% (MPR ≥ 0.9) of prescribed doses, adopted from the study by Anderson and colleagues.12 A patient with an MPR > 1, likely due to filling prior to the anticipated refill date, was considered 100% adherent (MPR = 1). If a patient switched OAN during the study, both agents were included as separate entities.
A conservative estimate of cost-savings was made by multiplying the RLRVAMC cost per unit of medication at time of initial prescription fill by the number of units taken each day multiplied by the total days’ supply on hand at time of therapy discontinuation. Patients with an MPR < 1 at time of therapy discontinuation were assumed to have zero remaining units on hand and zero cost savings was estimated. Waste, for purposes of cost-savings, was calculated for all MPR values > 1. Additional supply anticipated to be on hand from dose reductions was not included in the estimated cost of unused medication.
Descriptive statistics compared demographic characteristics between the pre- and postimplementation groups. MPR data were not normally distributed, which required the use of nonparametric Mann-Whitney U tests to compare pre- and postMPRs. Pearson χ2 compared the proportion of adherent patients between groups while descriptive statistics were used to estimate cost savings. Significance was determined based on a P value < .05. IBM SPSS Statistics software was used for all statistical analyses. As this was a complete sample of all eligible subjects, no sample size calculation was performed.
Results
In the preimplementation period, 246 patients received an OAN and 61 patients received an OAN in the postimplementation period (Figure 1). Of the 246 patients in the preimplementation period, 98 were eligible and included in the preimplementation group. Similarly, of the 61 patients in the postimplementation period, 35 patients met inclusion criteria for the postimplementation group. The study population was predominantly male with an average age of approximately 70 years in both groups (Table 3). More than 70% of the population in each group was White. No statistically significant differences between groups were identified. The most commonly prescribed OAN in the preimplementation group were abiraterone, imatinib, and enzalutamide (Table 3). In the postimplementation group, the most commonly prescribed agents were abiraterone, imatinib, pazopanib, and dasatinib. No significant differences were observed in prescribing of individual agents between the pre- and postimplementation groups or other characteristics that may affect adherence including patient copay status, number of concomitant medications, and driving distance from the RLRVAMC.
Thirty-six (36.7%) patients in the preimplementation group were considered nonadherent (MPR < 0.9) and 18 (18.4%) had an MPR < 0.8. Fifteen (15.3%) patients in the preimplementation clinic were considered overadherent (MPR > 1.1). Forty-seven (47.9%) patients in the preimplementation group were considered adherent (MPR 0.9 - 1.1) while all 35 (100%) patients in the postimplementation group were considered adherent (MPR 0.9 - 1.1). No non- or overadherent patients were identified in the postimplementation group (Figure 2). The median MPR for all patients in the preimplementation group was 0.94 compared with 1.06 (P < .001) in the postimplementation group.
Thirty-five (35.7%) patients had therapy discontinued or held in the preimplementation group compared with 2 (5.7%) patients in the postimplementation group (P < .001). Reasons for discontinuation in the preimplementation group included disease progression (n = 27), death (n = 3), lost to follow up (n = 2), and intolerability of therapy (n = 3). Both patients that discontinued therapy in the postimplementation group did so due to disease progression. Of the 35 patients who had their OAN discontinued or held in the preimplementation group, 14 patients had excess supply on hand at time of discontinuation. The estimated value of the unused medication was $37,890. Nine (25%) of the 35 patients who discontinued therapy had a dosage reduction during the course of therapy and the additional supply was not included in the cost estimate. Similarly, 1 of the 2 patients in the postimplementation group had their OAN discontinued during study. The cost of oversupply of medication at the time of therapy discontinuation was estimated at $1,555. No patients in the postimplementation group had dose reductions. After implementation of the OAN renewal clinic, the total cost savings between pre ($37,890) and postimplementation ($1,555) groups was $36,355.
Discussion
OANs are widely used therapies, with more than 25 million doses administered per year in the United States alone.12 The use of these agents will continue to grow as more targeted agents become available and patients request more convenient treatment options. The role for hematology/oncology clinical pharmacy services must adapt to this increased usage of OANs, including increasing pharmacist involvement in medication education, adherence and tolerability assessments, and proactive drug interaction monitoring.However, additional research is needed to determine optimal management strategies.
Our study aimed to compare OAN adherence among patients at a tertiary care VA hospital before and after implementation of a renewal clinic. The preimplementation population had a median MPR of 0.94 compared with 1.06 in the postimplementation group (P < .001). Although an ideal MPR is 1.0, we aimed for a slightly higher MPR to allow a supply buffer in the event of prescription delivery delays, as more than 90% of prescriptions are mailed to patients from a regional mail-order pharmacy. Importantly, the median MPRs do not adequately convey the impact from this clinic. The proportion of patients who were considered adherent to OANs increased from 47.9% in the preimplementation to 100% in the postimplementation period. These finding suggest that the clinical pharmacist role to assess and encourage adherence through monitoring tolerability of these OANs improved the overall medication taking experience of these patients.
Upon initial evaluation of adherence pre- and postimplementation, median adherence rates in both groups appeared to be above goal at 0.94 and 1.06 respectively. Patients in the postimplementation group intentionally received a 5- to 7-day supply buffer to account for potential prescription delivery delays due to holidays and inclement weather. This would indicate that the patients in the postimplementation group would have 15% oversupply due to the 5-day supply buffer. After correcting for patients with confounding reasons for excess (dose reductions, breaks in treatment, etc.), the median MPR in the prerefill clinic group decreased to 0.9 and the MPR in the postrefill clinic group increased slightly to 1.08. Although the median adherence rate in both the pre- and postimplementation groups were above goal of 0.90, 36% of the patients in the preimplementation group were considered nonadherent (MPR < 0.9) compared with no patients in the postimplementation group. Therefore, our intervention to improve patient adherence appeared to be beneficial at our institution.
In addition to improving adherence, one of the goals of the renewal clinic was to minimize excess supply at the time of therapy discontinuation. This was accomplished by aligning medication fills with medical visits and objective monitoring, as well as limiting supply to no more than 30 days. Of the patients in the postimplementation group, only 1 patient had remaining medication at the time of therapy discontinuation compared with 14 patients in the preimplementation group. The estimated cost savings from excess supply was $36,335. Limiting the amount of unused supply not only saves money for the patient and the institution, but also decreases opportunity for improper hazardous waste disposal and unnecessary exposure of hazardous materials to others.
Our results show the pharmacist intervention in the coordination of renewals improved adherence, minimized medication waste, and saved money. The cost of pharmacist time participating in the refill clinic was not calculated. Each visit was completed in approximately 5 minutes, with subsequent documentation and coordination taking an additional 5 to 10 minutes. During the launch of this service, the oncology pharmacy resident provided all coverage of the clinic. Oversite of the resident was provided by hematology/oncology clinical pharmacy specialists. We have continued to utilize pharmacy resident coverage since that time to meet education needs and keep the estimated cost per visit low. Another option in the case that pharmacy residents are not available would be utilization of a pharmacy technician, intern, or professional student to conduct the adherence and tolerability phone assessments. Our escalation protocol allows intervention by clinical pharmacy specialist and/or other health care providers when necessary. Trainees have only required basic training on how to use the protocol.
Limitations
Due to this study’s retrospective design, an inherent limitation is dependence on prescriber and refill records for documentation of initiation and discontinuation dates. Therefore, only the association of impact of pharmacist intervention on medication adherence can be determined as opposed to causation. We did not take into account discrepancies in day supply secondary to ‘held’ therapies, dose reductions, or doses supplied during an inpatient admission, which may alter estimates of MPR and cost-savings data. Patients in the postimplementation group intentionally received a 5 to 7-day supply buffer to account for potential prescription delivery delays due to holidays and inclement weather. This would indicate that the patients in the postimplementation group would have 15% oversupply due to the 5-day supply buffer, thereby skewing MPR values. This study did not account for cost avoidance resulting from early identification and management of toxicity. Finally, the postimplementation data only spans 4 months and a longer duration of time is needed to more accurately determine sustainability of renewal clinic interventions and provide comprehensive evaluation of cost-avoidance.
Conclusion
Implementation of an OAN renewal clinic was associated with an increase in MPR, improved proportion of patients considered adherent, and an estimated $36,335 cost-savings. However, prospective evaluation and a longer study duration are needed to determine causality of improved adherence and cost-savings associated with a pharmacist-driven OAN renewal clinic.
1. Ganesan P, Sagar TG, Dubashi B, et al. Nonadherence to imatinib adversely affects event free survival in chronic phase chronic myeloid leukemia. Am J Hematol 2011; 86: 471-474. doi:10.1002/ajh.22019
2. Marin D, Bazeos A, Mahon FX, et al. Adherence is the critical factor for achieving molecular responses in patients with chronic myeloid leukemia who achieve complete cytogenetic responses on imatinib. J Clin Oncol 2010; 28: 2381-2388. doi:10.1200/JCO.2009.26.3087
3. McCowan C, Shearer J, Donnan PT, et al. Cohort study examining tamoxifen adherence and its relationship to mortality in women with breast cancer. Br J Cancer 2008; 99: 1763-1768. doi:10.1038/sj.bjc.6604758
4. Lexicomp Online. Sunitinib. Hudson, Ohio: Lexi-Comp, Inc; August 20, 2019.
5. Babiker A, El Husseini M, Al Nemri A, et al. Health care professional development: Working as a team to improve patient care. Sudan J Paediatr. 2014;14(2):9-16.
6. Spence MM, Makarem AF, Reyes SL, et al. Evaluation of an outpatient pharmacy clinical services program on adherence and clinical outcomes among patients with diabetes and/or coronary artery disease. J Manag Care Spec Pharm. 2014;20(10):1036-1045. doi:10.18553/jmcp.2014.20.10.1036
7. Holle LM, Puri S, Clement JM. Physician-pharmacist collaboration for oral chemotherapy monitoring: Insights from an academic genitourinary oncology practice. J Oncol Pharm Pract 2015; doi:10.1177/1078155215581524
8. Muluneh B, Schneider M, Faso A, et al. Improved Adherence Rates and Clinical Outcomes of an Integrated, Closed-Loop, Pharmacist-Led Oral Chemotherapy Management Program. Journal of Oncology Practice. 2018;14(6):371-333. doi:10.1200/JOP.17.00039.
9. Font R, Espinas JA, Gil-Gil M, et al. Prescription refill, patient self-report and physician report in assessing adherence to oral endocrine therapy in early breast cancer patients: a retrospective cohort study in Catalonia, Spain. British Journal of Cancer. 2012 ;107(8):1249-1256. doi:10.1038/bjc.2012.389.
10. Anderson KR, Chambers CR, Lam N, et al. Medication adherence among adults prescribed imatinib, dasatinib, or nilotinib for the treatment of chronic myeloid leukemia. J Oncol Pharm Practice. 2015;21(1):19–25. doi:10.1177/1078155213520261
11. Weingart SN, Brown E, Bach PB, et al. NCCN Task Force Report: oral chemotherapy. J Natl Compr Canc Netw. 2008;6(3): S1-S14.
Preliminary Evaluation of an Order Template to Improve Diagnosis and Testosterone Therapy of Hypogonadism in Veterans
Testosterone treatment is clinically indicated when a patient presents with symptoms and signs and biochemical evidence of testosterone deficiency, ie, male hypogonadism. Laboratory confirmation of hypogonadism requires repeatedly low serum testosterone concentrations; between 8
Recent studies have reported an increase in testosterone prescriptions and raised concerns regarding health care provider (HCP) prescribing practices despite current clinical practice guidelines from major societies, such as the Endocrine Society. In the US from 2001 to 2011, testosterone use among men aged ≥ 40 years increased more than 3-fold in all age groups.3 Subsequently in the years from 2013 to 2016, prescription rates declined perhaps due to the cardiovascular and stroke concerns.4
In the US Department of Veterans Affairs (VA), new testosterone prescriptions across VA medical centers increased from 20,437 in fiscal year (FY) 2009 to 36,394 in FY 2012. Yet only 3.1% of men who received testosterone therapy had 2 or more low morning total or free testosterone concentrations measured; LH and/or FSH levels assessed; and presence of contraindications to therapy documented. Remarkably, 16.5% of these veterans did not have a testosterone level tested prior to being prescribed testosterone. Among veterans who were prescribed testosterone, 1.4% had a diagnosis of prostate cancer, 7.6% had a diagnosis of obstructive sleep apnea (OSA), and 3.5% had elevated hematocrit at baseline.5 These findings raised concerns of whether the diagnosis and etiology of hypogonadism were appropriately established and risks were considered before testosterone treatment was initiated.5,6
To further understand VA prescribing practices of testosterone therapy, a 2018 VA Office of the Inspector General (OIG) report evaluated the initiation and follow-up of testosterone replacement therapy. The OIG randomly sampled and reviewed 1,091 male patients who filled at least 1 outpatient testosterone prescription from VA in FY 2014 and who did not have a prior testosterone prescription in FY 2013. Patients were followed through September 30, 2015. Within 1 year prior to initiating testosterone, only 1.5% had clinical signs and symptoms of testosterone deficiency documented prior to testosterone testing (76% within 18 months of starting testosterone); only 9.1% of veterans had the recommended measurements of 2 low morning testosterone levels; and only 12% had LH and FSH levels measured. Within 3 to 6 months after starting testosterone therapy, only 24% of veterans were assessed for symptom improvement, and 29% to 33% were evaluated for adverse effects, hematocrit levels and adherence to the therapy. The OIG report concluded that VA HCPs were not adhering to guidelines (referencing the Endocrine Society guidelines) when evaluating and treating veterans with testosterone deficiency.7
Considering the OIG recommendations and need to improve current practices among providers, VA Puget Sound Health Care System (VAPSHCS) in Washington established a multidisciplinary workgroup consisting of an endocrinologist, geriatrician, primary care provider (PCP), pharmacists, VA information technology (IT) specialist, and health products support (HPS) clinical team in the spring of 2019 to assess and improve testosterone prescribing practices.
Methods
A testosterone order template was developed, approved by VAPSHCS Pharmacy and Therapeutics Committee, and implemented on July 1, 2019, at VAPSHCS, a 1a medical facility caring for more than 112,000 veterans. Given its potential risks and the propensity for varied prescribing practices, testosterone was designated as a restricted drug requiring a prior authorization drug request (PADR) and required completion of the testosterone order template in the Computerized Patient Record System (CPRS).
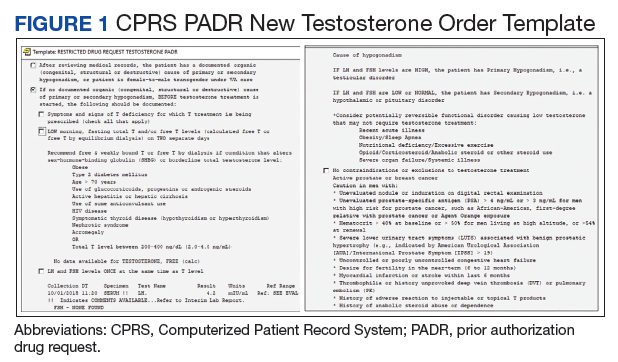
Testosterone Order Template
The testosterone order template had 2 components. Completion of the template for new testosterone orders was required to initiate treatment unless the patient had known organic hypogonadism or was a transgender male. The template ensured documentation of defined symptoms and signs of testosterone deficiency; low serum testosterone levels on at least 2 occasions and LH and FSH concentrations; no contraindications to testosterone treatment; discussion of risks and benefits of therapy; and baseline hematocrit (Figure 1). Relevant educational content (eg, risks and benefits of testosterone) was incorporated in the template. The second template was required for the first renewal of testosterone to document adherence to or reason for discontinuation of testosterone; improvement of symptoms and signs; and confirm monitoring hematocrit and testosterone levels during treatment.
Prior to implementation, the PADR template was introduced to HCPs at 2 chief-of-medicine rounds on the diagnosis and evaluation of hypogonadism by a pharmacist and endocrinologist. These educational sessions used case examples and discussions to teach the appropriate use of testosterone therapy in men with hypogonadism. The target audience was PCPs, residents, and other specialists who might prescribe testosterone.
Retrospective Chart Review
To assess the impact of the new testosterone order template on adherence to OIG recommendations, a retrospective chart review was completed comparing the appropriateness of initiating testosterone replacement therapy pretemplate period (July 1 to December 31, 2018) vs posttemplate period (July 1 to December 31, 2019). Inclusion and exclusion criteria were modeled after the 2018 OIG report to allow for comparison with the OIG study population. Eligible veterans in each time period included males who received a new testosterone prescription without having been prescribed testosterone in the previous 12 months. Exclusion criteria included community care network prescriptions (CCNRx); current testosterone prescription from a different VA site; clinic administration of testosterone in the previous 12 months; an organic hypogonadism (ie, Klinefelter syndrome) or gender dysphoria diagnosis; and whether the testosterone prescription was never dispensed (PADR was denied or veteran never had the prescription filled). Veterans who met the inclusion criteria in CPRS were identified by an algorithm developed by the VAPSHCS pharmacoeconomist.
Determining the appropriateness of testosterone prescribing, such as symptoms and laboratory measurements to confirm the diagnosis of hypogonadism, was based on the OIG report and Endocrine Society guidelines. A chart review of the 12 months before testosterone prescribing was completed for each veteran, assessing for documentation of symptoms of testosterone deficiency and laboratory measurements of serum testosterone, LH, and FSH. Also, documentation of a discussion of risks and benefits of testosterone therapy in the 3 months before prescribing was assessed, which matched the timeframe in the VA OIG report.
Interim Analysis
After initial template implementation, the multidisciplinary workgroup reconvened for a preplanned interim analysis in November 2019. The evaluation at this meeting revealed multiple order pathways in CPRS that were not linked to the PADR testosterone order template. Testosterone could be ordered in the generic order dialog, medications by drug class, and medications by alphabet, and endocrinology specialty menus without prompting to complete the testosterone order template or redirection to the restricted drug menu (Figure 2). These alternative testosterone ordering pathways were removed in early December 2019 and additional data collection was conducted for 3 months after discontinuation of alternative order pathways, the posttemplate/no alternative ordering pathways period, from December 7, 2019 to February 29, 2020.
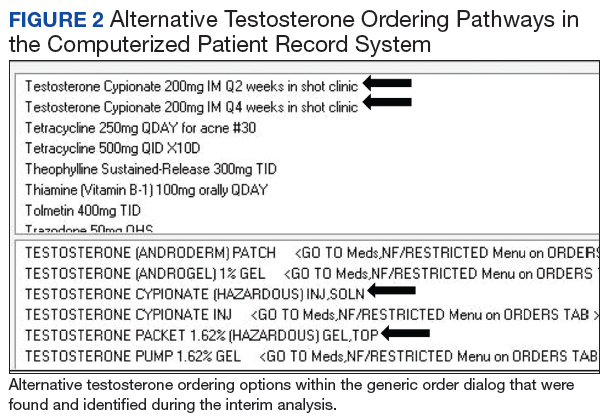
Exclusion of Previous Testosterone Prescriptions Predating Chart Review Period, Subgroup Analysis
In the OIG report and the initial retrospective chart review, only veterans without a testosterone prescription in the previous 12 months were evaluated. To assess whether a previous testosterone prescription influenced completion of the PADR and order template, a further subgroup analysis was conducted that excluded veterans who had a previous testosterone prescription at any time before the chart review periods. Therefore, “new testosterone prescription” refers to a veteran who never had a history of being on testosterone vs “former testosterone prescription,” meaning a patient could have had a previous testosterone prescription > 1 year prior to a new VA testosterone prescription.
Results
One hundred seventy-five veterans with a new testosterone prescription were identified in the pretemplate period; of these 80 (46%) met eligibility criteria; only 20 eligible veterans (25%) had a completed PADR (Figure 3). Ninety-one veterans with a new testosterone prescription were identified in the posttemplate period of which 41 (46%) veterans were eligible; 18 eligible veterans (44%) had a completed PADR, but only 7 (17%) had a completed testosterone order template.
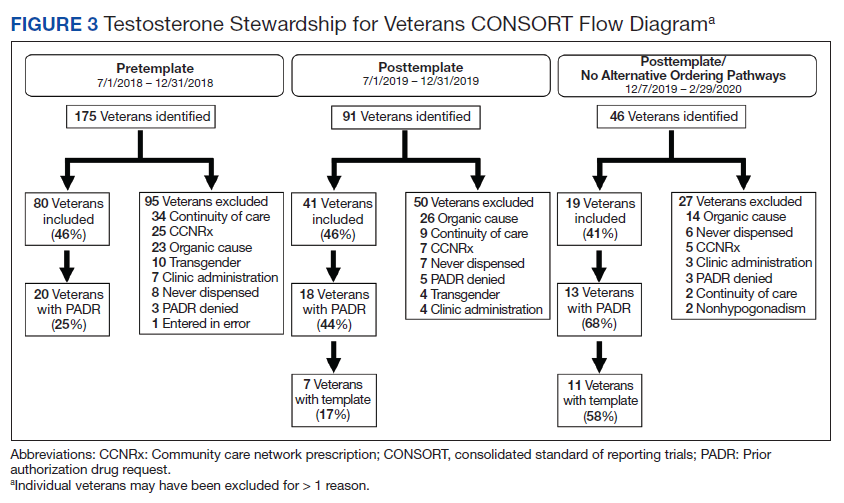
After excluding veterans who had alternative ordering pathways for testosterone, 46 veterans were identified in the posttemplate/no alternative ordering pathways period of which 19 (41%) veterans were eligible. Compared with the posttemplate period, a higher proportion of eligible veterans, 68% (13) had a completed PADR, and 58% (11) had a testosterone order template during the posttemplate/no alternative ordering pathways period.
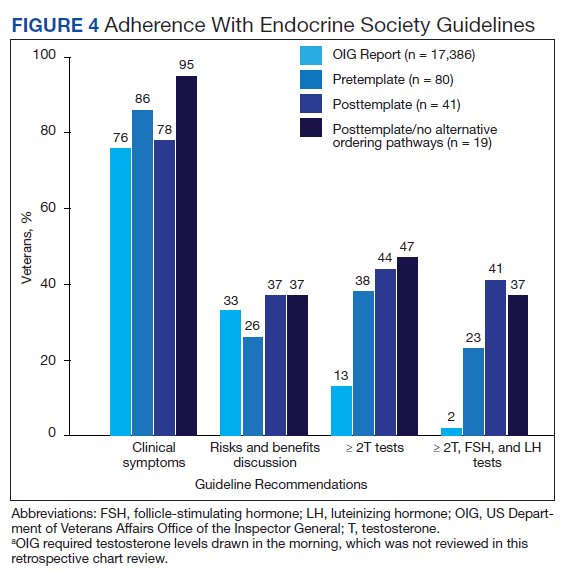
Compared with the OIG report findings, a similar percentage of veterans at VAPSHCS in the pretemplate period had documented clinical symptoms of testosterone deficiency and documented discussion of risks and benefits of testosterone therapy (Figure 4). However, a higher percentage of veterans had biochemical confirmation of testosterone deficiency with ≥ 2 low testosterone levels and evaluation of LH and FSH levels in the pretemplate period (23%) vs that in the OIG report (2%).
Compared with the pretemplate period, activation of the testosterone ordering template in the posttemplate period (Figure 4) had little effect on documented clinical symptoms and discussion of risks and benefits of testosterone treatment. However, the percentage of veterans who had ≥ 2 low testosterone levels and gonadotropins tested was higher in the posttemplate period (41%) vs both the pretemplate period and OIG report.
After removing alternative ordering pathways of testosterone, the percentages of veterans who had documented clinical symptoms, discussion of risks and benefits of testosterone, and ≥ 2 low testosterone levels and gonadotropin tests performed were similar in the posttemplate/no alternative ordering pathways vs posttemplate period.
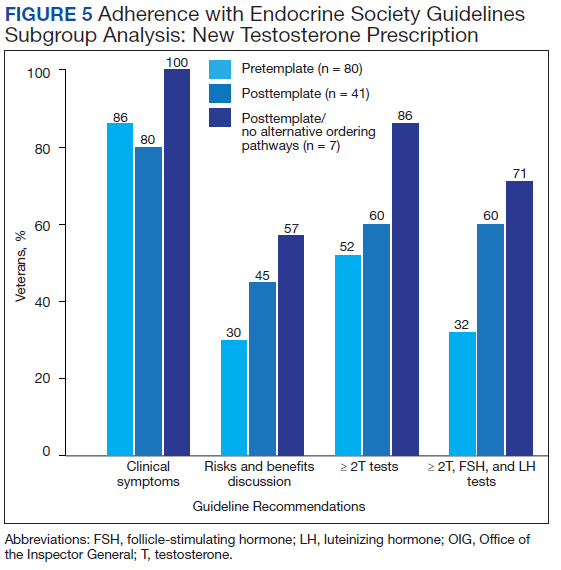
Excluding veterans who had previously received a former testosterone prescription at any time prior to chart review periods, this subgroup analysis resulted in greater adherence to Endocrine Society guidelines for testosterone treatment with introduction of the testosterone order template, particularly after removal of alternative ordering pathway (Figure 5). With the exclusion of veterans who formerly received testosterone prescriptions, the percentages of veterans who had documented clinical symptoms, discussion of risks and benefits, and ≥ 2 low testosterone levels with gonadotropin tests were higher (100%, 57%, and 71%, respectively) in the posttemplate/no alternative ordering pathways period, compared with the pretemplate period (86%, 30%, and 32%, respectively).
Discussion
The 2018 OIG report found that VA practitioners demonstrated poor adherence to evidence-based clinical practice guidelines for testosterone treatment in men with hypogonadism. Based on OIG recommendations, we developed a PADR testosterone ordering template to help HCPs improve practice by better adherence to guidelines for the diagnosis and treatment of hypogonadism in veterans. Before implementation of the PADR template, the percentage of veterans at VAPSHCS who had biochemical confirmation of hypogonadism was higher than that in the OIG report. Activation of the PADR testosterone ordering template (with or without removal of options for alternative ordering pathways of testosterone) resulted only in an improvement of laboratory confirmation and evaluation of etiology of hypogonadism. This is when we reasoned that clinicians may have access to prior records and laboratory testing beyond just the past year, and this information may have influenced their use of the PADR template. Subsequently, with exclusion of veterans who were previously prescribed testosterone, implementation of the PADR testosterone order template improved documentation of symptoms of testosterone deficiency, discussion of risks and benefits of testosterone therapy, and biochemical diagnosis and evaluation of hypogonadism relative to the period before implementation.
The lack of effects of implementing the testosterone order template on documentation of symptoms of testosterone deficiency and discussion of risks and benefits of testosterone therapy may be due to local expertise resulting in the relatively high adherence to these guideline recommendations at VAPSHCS before activation of the template vs that in the OIG report. The template improved documentation of the diagnosis and evaluation of hypogonadism for genuinely new testosterone prescriptions in veterans without a history of testosterone prescriptions; while those with a previous prescription had limited improvement. It is possible that in veterans who had testosterone prescribed previously, HCPs may have assumed or had bias that the diagnosis and evaluation of hypogonadism originally made was adequate. This finding underscores the need to develop strategies for reviewing PADR requests where there is historical testosterone use. Perhaps a clinical team member, such as a clinical pharmacist, with the background and training in guidelines for the evaluation of hypogonadism could review PADR requests in veterans with previous testosterone use.
Removal of alternative ordering pathways for testosterone increased the completion rate of PADR requests and the testosterone ordering template, although the latter was not completed in one-third of veterans. Possible reasons for HCPs’ suboptimal completion of the testosterone template despite the PADR initiation include clinicians’ lack of willingness to read the PADR completely and familiarize themselves with the clinical guidelines due to workload demands of PCPs. In addition there maybe pressure from patients to receive testosterone for age-related symptoms due to heavy marketing. In addition, there may have been pharmacists who reviewed the PADR and approved the incomplete testosterone template. At VAPSHCS there were up to 40 pharmacists during different periods reviewing the testosterone PADRs. Likely, not everyone was completely familiar with this implementation process, and a possible future consideration would be further education to staff pharmacists who are verifying these prescriptions. There were several advantages to using this new testosterone order template when HCPs attempted to order a prescription. First, they were prompted to complete the PADR. Subsequently, a pharmacist reviewed the template and approved or rejected the prescription if the template was incomplete. The completed template served as documentation in the electronic health record for the prescribing HCP. The template was constructed to populate the required laboratory tests for ease of use and documentation. In addition, educational information regarding the symptoms and signs of testosterone deficiency, laboratory tests needed to confirm and evaluate hypogonadism, contraindications to testosterone treatment, and risks and benefits of therapy were incorporated into the template to assist HCPs in understanding the requirements for a complete diagnosis and evaluation. Finally, on completion of the template, HCPs were able to order testosterone via link to various testosterone formulations.
Before its implementation, the PADR testosterone order template was introduced to PCPs and internal medicine residents at 2 case-based conferences aimed at the diagnosis and treatment of male hypogonadism. These conferences were well received and helped launch the testosterone PADR template at VAPSHCS. Similar outreach to HCPs who prescribe testosterone is highly recommended in other VA facilities before implementation of the testosterone ordering template. It is possible that more targeted education to other HCPs would have resulted in greater use of the testosterone ordering template and adherence to clinical practice guidelines.
The VAPSHCS multidisciplinary workgroup was essential for the development, implementation, evaluation, and revision of the PADR and testosterone ordering template. The workgroup met routinely to follow up on the ease of installation in CPRS and discuss technical corrections that were needed. This was an essential for quality improvement, as loopholes in CPRS were identified where the HCP could order testosterone without being prompted to use the new PADR testosterone order template (alternative ordering pathways). The workgroup swiftly informed the IT specialist and HPS team to remove alternative ordering pathways of testosterone. Continuous quality improvement evaluations are highly recommended during implementation of the template in other facilities to accommodate specific local modifications that might be needed.
After February 2020 due to the COVID-19 pandemic, the National VA Pharmacy and Medication Board halted PADR requirements. As a result, further evaluation of the New Testosterone Order template and planned initial assessment of First Renewal Testosterone Order template could not be performed. In addition, due to the COVID-19 pandemic, there was restricted in-person outpatient visits and reduced adjustments to prescribing practices. To address recommendations made in the OIG report, the VAPSHCS testosterone order template was modified into a clinical reminder dialog format by a VA National IT Specialist and HPS team, tested for usability at several VA test sites and approved by the National Clinical Template Workgroup for implementation nationally across all VAs. The National Endocrinology Ambulatory Council Workgroup will ensure that this template is adopted in a similar format when the new electronic health record system Cerner is introduced to the VA.
Conclusions
The creation and implementation of a PADR testosterone order template may be a beneficial approach to improve the diagnosis of hypogonadism and facilitate appropriate use of testosterone therapy in veterans in accordance with established clinical practice guidelines, particularly in veterans without any prior testosterone use. Key future strategies to improve testosterone prescribing should focus on identifying clinical team members, such as a local clinical pharmacist, to review and steward PADR requests to ensure that testosterone is indicated, and treatment is appropriately monitored.
1. Bhasin S, Cunningham GR, Hayes FJ, Matsumoto AM, Snyder PJ, Swerdloff RS, Montori VM; Task Force, Endocrine Society. Testosterone therapy in men with androgen deficiency syndromes: an Endocrine Society clinical practice guideline. J Clin Endocrinol Metab. 2010;95(6):2536-2559. doi:10.1210/jc.2009-2354
2. Grossmann M, Matsumoto AM. A perspective on middle-aged and older men with functional hypogonadism: focus on holistic management. J Clin Endocrinol Metab. 2017;102(3):1067-1075. doi:10.1210/jc.2016-3580
3. Baillargeon J, Urban RJ, Kuo YF, et al. Screening and monitoring in men prescribed testosterone therapy in the US, 2001-2010. Public Health Rep. 2015;130(2):143-152. doi:10.1177/003335491513000207
4. Baillargeon J, Kuo Y, Westra JR, Urban RJ, Goodwin JS. Testosterone prescribing in the United States, 2002-2016. JAMA. 2018;320(2):200-202. doi:10.1001/jama.2018.7999
5. Jasuja GK, Bhasin S, Reisman JI, Berlowitz DR, Rose AJ. Ascertainment of testosterone prescribing practices in the VA. Med Care. 2015;53(9):746-52. doi:10.1097/MLR.0000000000000398
6. Jasuja GK, Bhasin S, Rose AJ. Patterns of testosterone prescription overuse. Curr Opin Endocrinol Diabetes Obes. 2017;24(3):240-245. doi:10.1097/MED.0000000000000336
7. US Department of Veterans Affairs, Office of Inspector General. Office of Healthcare Inspections. Report No. 15-03215-154. Published April 11, 2018. Accessed February 24, 2021. https://www.va.gov/oig/pubs/VAOIG-15-03215-154.pdf
Testosterone treatment is clinically indicated when a patient presents with symptoms and signs and biochemical evidence of testosterone deficiency, ie, male hypogonadism. Laboratory confirmation of hypogonadism requires repeatedly low serum testosterone concentrations; between 8
Recent studies have reported an increase in testosterone prescriptions and raised concerns regarding health care provider (HCP) prescribing practices despite current clinical practice guidelines from major societies, such as the Endocrine Society. In the US from 2001 to 2011, testosterone use among men aged ≥ 40 years increased more than 3-fold in all age groups.3 Subsequently in the years from 2013 to 2016, prescription rates declined perhaps due to the cardiovascular and stroke concerns.4
In the US Department of Veterans Affairs (VA), new testosterone prescriptions across VA medical centers increased from 20,437 in fiscal year (FY) 2009 to 36,394 in FY 2012. Yet only 3.1% of men who received testosterone therapy had 2 or more low morning total or free testosterone concentrations measured; LH and/or FSH levels assessed; and presence of contraindications to therapy documented. Remarkably, 16.5% of these veterans did not have a testosterone level tested prior to being prescribed testosterone. Among veterans who were prescribed testosterone, 1.4% had a diagnosis of prostate cancer, 7.6% had a diagnosis of obstructive sleep apnea (OSA), and 3.5% had elevated hematocrit at baseline.5 These findings raised concerns of whether the diagnosis and etiology of hypogonadism were appropriately established and risks were considered before testosterone treatment was initiated.5,6
To further understand VA prescribing practices of testosterone therapy, a 2018 VA Office of the Inspector General (OIG) report evaluated the initiation and follow-up of testosterone replacement therapy. The OIG randomly sampled and reviewed 1,091 male patients who filled at least 1 outpatient testosterone prescription from VA in FY 2014 and who did not have a prior testosterone prescription in FY 2013. Patients were followed through September 30, 2015. Within 1 year prior to initiating testosterone, only 1.5% had clinical signs and symptoms of testosterone deficiency documented prior to testosterone testing (76% within 18 months of starting testosterone); only 9.1% of veterans had the recommended measurements of 2 low morning testosterone levels; and only 12% had LH and FSH levels measured. Within 3 to 6 months after starting testosterone therapy, only 24% of veterans were assessed for symptom improvement, and 29% to 33% were evaluated for adverse effects, hematocrit levels and adherence to the therapy. The OIG report concluded that VA HCPs were not adhering to guidelines (referencing the Endocrine Society guidelines) when evaluating and treating veterans with testosterone deficiency.7
Considering the OIG recommendations and need to improve current practices among providers, VA Puget Sound Health Care System (VAPSHCS) in Washington established a multidisciplinary workgroup consisting of an endocrinologist, geriatrician, primary care provider (PCP), pharmacists, VA information technology (IT) specialist, and health products support (HPS) clinical team in the spring of 2019 to assess and improve testosterone prescribing practices.
Methods
A testosterone order template was developed, approved by VAPSHCS Pharmacy and Therapeutics Committee, and implemented on July 1, 2019, at VAPSHCS, a 1a medical facility caring for more than 112,000 veterans. Given its potential risks and the propensity for varied prescribing practices, testosterone was designated as a restricted drug requiring a prior authorization drug request (PADR) and required completion of the testosterone order template in the Computerized Patient Record System (CPRS).
Testosterone Order Template
The testosterone order template had 2 components. Completion of the template for new testosterone orders was required to initiate treatment unless the patient had known organic hypogonadism or was a transgender male. The template ensured documentation of defined symptoms and signs of testosterone deficiency; low serum testosterone levels on at least 2 occasions and LH and FSH concentrations; no contraindications to testosterone treatment; discussion of risks and benefits of therapy; and baseline hematocrit (Figure 1). Relevant educational content (eg, risks and benefits of testosterone) was incorporated in the template. The second template was required for the first renewal of testosterone to document adherence to or reason for discontinuation of testosterone; improvement of symptoms and signs; and confirm monitoring hematocrit and testosterone levels during treatment.
Prior to implementation, the PADR template was introduced to HCPs at 2 chief-of-medicine rounds on the diagnosis and evaluation of hypogonadism by a pharmacist and endocrinologist. These educational sessions used case examples and discussions to teach the appropriate use of testosterone therapy in men with hypogonadism. The target audience was PCPs, residents, and other specialists who might prescribe testosterone.
Retrospective Chart Review
To assess the impact of the new testosterone order template on adherence to OIG recommendations, a retrospective chart review was completed comparing the appropriateness of initiating testosterone replacement therapy pretemplate period (July 1 to December 31, 2018) vs posttemplate period (July 1 to December 31, 2019). Inclusion and exclusion criteria were modeled after the 2018 OIG report to allow for comparison with the OIG study population. Eligible veterans in each time period included males who received a new testosterone prescription without having been prescribed testosterone in the previous 12 months. Exclusion criteria included community care network prescriptions (CCNRx); current testosterone prescription from a different VA site; clinic administration of testosterone in the previous 12 months; an organic hypogonadism (ie, Klinefelter syndrome) or gender dysphoria diagnosis; and whether the testosterone prescription was never dispensed (PADR was denied or veteran never had the prescription filled). Veterans who met the inclusion criteria in CPRS were identified by an algorithm developed by the VAPSHCS pharmacoeconomist.
Determining the appropriateness of testosterone prescribing, such as symptoms and laboratory measurements to confirm the diagnosis of hypogonadism, was based on the OIG report and Endocrine Society guidelines. A chart review of the 12 months before testosterone prescribing was completed for each veteran, assessing for documentation of symptoms of testosterone deficiency and laboratory measurements of serum testosterone, LH, and FSH. Also, documentation of a discussion of risks and benefits of testosterone therapy in the 3 months before prescribing was assessed, which matched the timeframe in the VA OIG report.
Interim Analysis
After initial template implementation, the multidisciplinary workgroup reconvened for a preplanned interim analysis in November 2019. The evaluation at this meeting revealed multiple order pathways in CPRS that were not linked to the PADR testosterone order template. Testosterone could be ordered in the generic order dialog, medications by drug class, and medications by alphabet, and endocrinology specialty menus without prompting to complete the testosterone order template or redirection to the restricted drug menu (Figure 2). These alternative testosterone ordering pathways were removed in early December 2019 and additional data collection was conducted for 3 months after discontinuation of alternative order pathways, the posttemplate/no alternative ordering pathways period, from December 7, 2019 to February 29, 2020.
Exclusion of Previous Testosterone Prescriptions Predating Chart Review Period, Subgroup Analysis
In the OIG report and the initial retrospective chart review, only veterans without a testosterone prescription in the previous 12 months were evaluated. To assess whether a previous testosterone prescription influenced completion of the PADR and order template, a further subgroup analysis was conducted that excluded veterans who had a previous testosterone prescription at any time before the chart review periods. Therefore, “new testosterone prescription” refers to a veteran who never had a history of being on testosterone vs “former testosterone prescription,” meaning a patient could have had a previous testosterone prescription > 1 year prior to a new VA testosterone prescription.
Results
One hundred seventy-five veterans with a new testosterone prescription were identified in the pretemplate period; of these 80 (46%) met eligibility criteria; only 20 eligible veterans (25%) had a completed PADR (Figure 3). Ninety-one veterans with a new testosterone prescription were identified in the posttemplate period of which 41 (46%) veterans were eligible; 18 eligible veterans (44%) had a completed PADR, but only 7 (17%) had a completed testosterone order template.
After excluding veterans who had alternative ordering pathways for testosterone, 46 veterans were identified in the posttemplate/no alternative ordering pathways period of which 19 (41%) veterans were eligible. Compared with the posttemplate period, a higher proportion of eligible veterans, 68% (13) had a completed PADR, and 58% (11) had a testosterone order template during the posttemplate/no alternative ordering pathways period.
Compared with the OIG report findings, a similar percentage of veterans at VAPSHCS in the pretemplate period had documented clinical symptoms of testosterone deficiency and documented discussion of risks and benefits of testosterone therapy (Figure 4). However, a higher percentage of veterans had biochemical confirmation of testosterone deficiency with ≥ 2 low testosterone levels and evaluation of LH and FSH levels in the pretemplate period (23%) vs that in the OIG report (2%).
Compared with the pretemplate period, activation of the testosterone ordering template in the posttemplate period (Figure 4) had little effect on documented clinical symptoms and discussion of risks and benefits of testosterone treatment. However, the percentage of veterans who had ≥ 2 low testosterone levels and gonadotropins tested was higher in the posttemplate period (41%) vs both the pretemplate period and OIG report.
After removing alternative ordering pathways of testosterone, the percentages of veterans who had documented clinical symptoms, discussion of risks and benefits of testosterone, and ≥ 2 low testosterone levels and gonadotropin tests performed were similar in the posttemplate/no alternative ordering pathways vs posttemplate period.
Excluding veterans who had previously received a former testosterone prescription at any time prior to chart review periods, this subgroup analysis resulted in greater adherence to Endocrine Society guidelines for testosterone treatment with introduction of the testosterone order template, particularly after removal of alternative ordering pathway (Figure 5). With the exclusion of veterans who formerly received testosterone prescriptions, the percentages of veterans who had documented clinical symptoms, discussion of risks and benefits, and ≥ 2 low testosterone levels with gonadotropin tests were higher (100%, 57%, and 71%, respectively) in the posttemplate/no alternative ordering pathways period, compared with the pretemplate period (86%, 30%, and 32%, respectively).
Discussion
The 2018 OIG report found that VA practitioners demonstrated poor adherence to evidence-based clinical practice guidelines for testosterone treatment in men with hypogonadism. Based on OIG recommendations, we developed a PADR testosterone ordering template to help HCPs improve practice by better adherence to guidelines for the diagnosis and treatment of hypogonadism in veterans. Before implementation of the PADR template, the percentage of veterans at VAPSHCS who had biochemical confirmation of hypogonadism was higher than that in the OIG report. Activation of the PADR testosterone ordering template (with or without removal of options for alternative ordering pathways of testosterone) resulted only in an improvement of laboratory confirmation and evaluation of etiology of hypogonadism. This is when we reasoned that clinicians may have access to prior records and laboratory testing beyond just the past year, and this information may have influenced their use of the PADR template. Subsequently, with exclusion of veterans who were previously prescribed testosterone, implementation of the PADR testosterone order template improved documentation of symptoms of testosterone deficiency, discussion of risks and benefits of testosterone therapy, and biochemical diagnosis and evaluation of hypogonadism relative to the period before implementation.
The lack of effects of implementing the testosterone order template on documentation of symptoms of testosterone deficiency and discussion of risks and benefits of testosterone therapy may be due to local expertise resulting in the relatively high adherence to these guideline recommendations at VAPSHCS before activation of the template vs that in the OIG report. The template improved documentation of the diagnosis and evaluation of hypogonadism for genuinely new testosterone prescriptions in veterans without a history of testosterone prescriptions; while those with a previous prescription had limited improvement. It is possible that in veterans who had testosterone prescribed previously, HCPs may have assumed or had bias that the diagnosis and evaluation of hypogonadism originally made was adequate. This finding underscores the need to develop strategies for reviewing PADR requests where there is historical testosterone use. Perhaps a clinical team member, such as a clinical pharmacist, with the background and training in guidelines for the evaluation of hypogonadism could review PADR requests in veterans with previous testosterone use.
Removal of alternative ordering pathways for testosterone increased the completion rate of PADR requests and the testosterone ordering template, although the latter was not completed in one-third of veterans. Possible reasons for HCPs’ suboptimal completion of the testosterone template despite the PADR initiation include clinicians’ lack of willingness to read the PADR completely and familiarize themselves with the clinical guidelines due to workload demands of PCPs. In addition there maybe pressure from patients to receive testosterone for age-related symptoms due to heavy marketing. In addition, there may have been pharmacists who reviewed the PADR and approved the incomplete testosterone template. At VAPSHCS there were up to 40 pharmacists during different periods reviewing the testosterone PADRs. Likely, not everyone was completely familiar with this implementation process, and a possible future consideration would be further education to staff pharmacists who are verifying these prescriptions. There were several advantages to using this new testosterone order template when HCPs attempted to order a prescription. First, they were prompted to complete the PADR. Subsequently, a pharmacist reviewed the template and approved or rejected the prescription if the template was incomplete. The completed template served as documentation in the electronic health record for the prescribing HCP. The template was constructed to populate the required laboratory tests for ease of use and documentation. In addition, educational information regarding the symptoms and signs of testosterone deficiency, laboratory tests needed to confirm and evaluate hypogonadism, contraindications to testosterone treatment, and risks and benefits of therapy were incorporated into the template to assist HCPs in understanding the requirements for a complete diagnosis and evaluation. Finally, on completion of the template, HCPs were able to order testosterone via link to various testosterone formulations.
Before its implementation, the PADR testosterone order template was introduced to PCPs and internal medicine residents at 2 case-based conferences aimed at the diagnosis and treatment of male hypogonadism. These conferences were well received and helped launch the testosterone PADR template at VAPSHCS. Similar outreach to HCPs who prescribe testosterone is highly recommended in other VA facilities before implementation of the testosterone ordering template. It is possible that more targeted education to other HCPs would have resulted in greater use of the testosterone ordering template and adherence to clinical practice guidelines.
The VAPSHCS multidisciplinary workgroup was essential for the development, implementation, evaluation, and revision of the PADR and testosterone ordering template. The workgroup met routinely to follow up on the ease of installation in CPRS and discuss technical corrections that were needed. This was an essential for quality improvement, as loopholes in CPRS were identified where the HCP could order testosterone without being prompted to use the new PADR testosterone order template (alternative ordering pathways). The workgroup swiftly informed the IT specialist and HPS team to remove alternative ordering pathways of testosterone. Continuous quality improvement evaluations are highly recommended during implementation of the template in other facilities to accommodate specific local modifications that might be needed.
After February 2020 due to the COVID-19 pandemic, the National VA Pharmacy and Medication Board halted PADR requirements. As a result, further evaluation of the New Testosterone Order template and planned initial assessment of First Renewal Testosterone Order template could not be performed. In addition, due to the COVID-19 pandemic, there was restricted in-person outpatient visits and reduced adjustments to prescribing practices. To address recommendations made in the OIG report, the VAPSHCS testosterone order template was modified into a clinical reminder dialog format by a VA National IT Specialist and HPS team, tested for usability at several VA test sites and approved by the National Clinical Template Workgroup for implementation nationally across all VAs. The National Endocrinology Ambulatory Council Workgroup will ensure that this template is adopted in a similar format when the new electronic health record system Cerner is introduced to the VA.
Conclusions
The creation and implementation of a PADR testosterone order template may be a beneficial approach to improve the diagnosis of hypogonadism and facilitate appropriate use of testosterone therapy in veterans in accordance with established clinical practice guidelines, particularly in veterans without any prior testosterone use. Key future strategies to improve testosterone prescribing should focus on identifying clinical team members, such as a local clinical pharmacist, to review and steward PADR requests to ensure that testosterone is indicated, and treatment is appropriately monitored.
1. Bhasin S, Cunningham GR, Hayes FJ, Matsumoto AM, Snyder PJ, Swerdloff RS, Montori VM; Task Force, Endocrine Society. Testosterone therapy in men with androgen deficiency syndromes: an Endocrine Society clinical practice guideline. J Clin Endocrinol Metab. 2010;95(6):2536-2559. doi:10.1210/jc.2009-2354
2. Grossmann M, Matsumoto AM. A perspective on middle-aged and older men with functional hypogonadism: focus on holistic management. J Clin Endocrinol Metab. 2017;102(3):1067-1075. doi:10.1210/jc.2016-3580
3. Baillargeon J, Urban RJ, Kuo YF, et al. Screening and monitoring in men prescribed testosterone therapy in the US, 2001-2010. Public Health Rep. 2015;130(2):143-152. doi:10.1177/003335491513000207
4. Baillargeon J, Kuo Y, Westra JR, Urban RJ, Goodwin JS. Testosterone prescribing in the United States, 2002-2016. JAMA. 2018;320(2):200-202. doi:10.1001/jama.2018.7999
5. Jasuja GK, Bhasin S, Reisman JI, Berlowitz DR, Rose AJ. Ascertainment of testosterone prescribing practices in the VA. Med Care. 2015;53(9):746-52. doi:10.1097/MLR.0000000000000398
6. Jasuja GK, Bhasin S, Rose AJ. Patterns of testosterone prescription overuse. Curr Opin Endocrinol Diabetes Obes. 2017;24(3):240-245. doi:10.1097/MED.0000000000000336
7. US Department of Veterans Affairs, Office of Inspector General. Office of Healthcare Inspections. Report No. 15-03215-154. Published April 11, 2018. Accessed February 24, 2021. https://www.va.gov/oig/pubs/VAOIG-15-03215-154.pdf