User login
Antibiotic Regimens and Associated Outcomes in Children Hospitalized With Staphylococcal Scalded Skin Syndrome
Staphylococcal scalded skin syndrome (SSSS) is an exfoliative toxin-mediated dermatitis that predominantly occurs in young children. Multiple recent reports indicate a rising incidence of this disease.1-4 Recommended treatment for SSSS includes antistaphylococcal antibiotics and supportive care measures.5,6 Elimination or reduction of the toxin-producing Staphylococcus aureus is thought to help limit disease progression and promote recovery. Experts advocate for the use of antibiotics even when there is no apparent focal source of infection, such as an abscess.6,7
Several factors may affect antibiotic selection, including the desire to inhibit toxin production and to target the causative pathogen in a bactericidal fashion. Because SSSS is toxin mediated, clindamycin is often recommended because of its inhibition of toxin synthesis.5,8 The clinical utility of adding other antibiotics to clindamycin for coverage of methicillin-sensitive S aureus (MSSA) or methicillin-resistant S aureus (MRSA) is uncertain. Several studies report MSSA to be the predominant pathogen identified by culture2,9; however, SSSS caused by MRSA has been reported.9-11 Additionally, bactericidal antibiotics (eg, nafcillin) have been considered to hold potential clinical advantage as compared with bacteriostatic antibiotics (eg, clindamycin), even though clinical studies have not clearly demonstrated this advantage in the general population.12,13 Some experts recommend additional MRSA or MSSA coverage (such as vancomycin or nafcillin) in patients with high illness severity or nonresponse to therapy, or in areas where there is high prevalence of staphylococcal resistance to clindamycin.5,7,9,14 Alternatively, for areas with low MRSA prevalence, monotherapy with an anti-MSSA antibiotic is another potential option. No recent studies have compared patient outcomes among antibiotic regimens in children with SSSS.
Knowledge of the outcomes associated with different antibiotic regimens for children hospitalized with SSSS is needed and could be used to improve patient outcomes and potentially promote antibiotic stewardship. In this study, our objectives were to (1) describe antibiotic regimens given to children hospitalized with SSSS, and (2) examine the association of three antibiotic regimens commonly used for SSSS (clindamycin monotherapy, clindamycin plus additional MSSA coverage, and clindamycin plus additional MRSA coverage) with patient outcomes of length of stay (LOS), treatment failure, and cost in a large cohort of children at US children’s hospitals.
METHODS
We conducted a multicenter, retrospective cohort study utilizing data within the Pediatric Health Information System (PHIS) database from July 1, 2011, to June 30, 2016. Thirty-five free-standing tertiary care US children’s hospitals within 24 states were included. The Children’s Hospital Association (Lenexa, Kansas) maintains the PHIS database, which contains de-identified patient information, including diagnoses (with International Classification of Diseases, Ninth and Tenth Revision, Clinical Modification [ICD-9-CM, ICD-10-CM]), demographics, procedures, and daily billing records. Data quality and reliability are confirmed by participating institutions and the Children’s Hospital Association.15 The local institutional review board (IRB) deemed the study exempt from formal IRB review, as patient information was de-identified.
Study Population
We included hospitalized children aged newborn to 18 years with a primary or secondary diagnosis of SSSS (ICD-9, 695.81; ICD-10, L00). Children whose primary presentation and admission were to a PHIS hospital were included; children transferred from another hospital were excluded. The following exclusion criteria were based on previously published methodology.16 Children with complex chronic medical conditions as classified by Feudtner et al17 were excluded, since these children may require a different treatment approach than the general pediatric population. In order to decrease diagnostic ambiguity, we excluded children if an alternative dermatologic diagnosis was recorded as a principal or secondary diagnosis (eg, Stevens-Johnson syndrome or scarlet fever).16 Finally, hospitals with fewer than 10 children with SSSS during the study period were excluded.
Antibiotic Regimen Groups
We used PHIS daily billing codes to determine the antibiotics received by the study population. Children were classified into antibiotic regimen groups based on whether they received specific antibiotic combinations. Antibiotics received on any day during the hospitalization, including in the emergency department (ED), were used to assign patients to regimen groups. Antibiotics were classified into regimen groups based on consensus among study investigators, which included two board-certified pediatric infectious diseases specialists (A.C., R.M.). Antibiotic group definitions are listed in Table 1. Oral and intravenous (IV) therapies were grouped together for clindamycin, cephalexin/cefazolin, and linezolid because of good oral bioavailability in most situations.18 The three most common antistaphylococcal groups were chosen for further analysis: clindamycin alone, clindamycin plus MSSA coverage, and clindamycin plus MRSA coverage. The clindamycin group was defined as children with receipt of oral or IV clindamycin. Children who received clindamycin with additional MSSA coverage, such as cefazolin or nafcillin, were categorized as the clindamycin plus MSSA group. Children who received clindamycin with additional MRSA coverage, such as vancomycin or linezolid, were categorized as the clindamycin plus MRSA group. We chose not to include children who received the above regimens plus other antibiotics with partial antistaphylococcal activity, such as ampicillin, gentamicin, or ceftriaxone, in the clindamycin plus MSSA and clindamycin plus MRSA groups. We excluded these antibiotics to decrease the heterogeneity in the definition of regimen groups and allow a more direct comparison for effectiveness.

Covariates
Covariates included age, sex, ethnicity and/or race, payer type, level of care, illness severity, and region. The variable definitions below are in keeping with a prior study of SSSS.16 Age was categorized as: birth to 59 days, 2 to 11 months, 1 to 4 years (preschool age), 5 to 10 years (school age), and 11 to 18 years (adolescent). We examined infants younger than 60 days separately from older infants because this population may warrant additional treatment considerations. Race and ethnicity were categorized as White (non-Hispanic), African American (non-Hispanic), Hispanic, or other. Payer types included government, private, or other. Level of care was assigned as either intensive care or acute care. Illness severity was assigned using the All Patient Refined Diagnosis Related Group (APR-DRG; 3M Corporation, St. Paul, Minnesota) severity levels.19 In line with a prior study,16 we defined “low illness severity” as the APR-DRG minor (1) classification. The moderate (2), major (3), and extreme (4) classifications were defined as “moderate to high illness severity,” since there were very few classifications of major or extreme (<5%) illness severity. We categorized hospitals into the following US regions: Northeast, Midwest, South, and West.
Outcome Measures
The primary outcome was hospital LOS in days, and secondary outcomes were treatment failure and hospital costs. Hospital LOS was chosen as the primary outcome to represent the time needed for the child to show clinical improvement. Treatment failure was defined as a same-cause 14-day ED revisit or hospital readmission, and these were determined to be same-cause if a diagnosis for SSSS (ICD-9, 695.81; ICD-10, L00) was documented for the return encounter. The 14-day interval for readmission and ED revisit was chosen to measure any relapse of symptoms after completion of antibiotic therapy, similar to a prior study of treatment failure in skin and soft tissue infections.20 Total costs of the hospitalization were estimated from charges using hospital- and year-specific cost-to-charge ratios. Subcategories of cost, including clinical, pharmacy, imaging, laboratory, supply, and other, were also compared among the three groups.
Statistical Analysis
Demographic and clinical characteristics of children were summarized using frequencies and percentages for categorical variables and medians with interquartile ranges (IQRs) for continuous variables. These were compared across antibiotic groups using chi-square and Kruskal–Wallis tests, respectively. In unadjusted analyses, outcomes were compared across antibiotic regimen groups using these same statistical tests. In order to account for patient clustering within hospitals, generalized linear mixed-effects models were used to model outcomes with a random intercept for each hospital. Models were adjusted for SSSS being listed as a principal or secondary diagnosis, race, illness severity, and level of care. We log-transformed LOS and cost data prior to modeling because of the nonnormal distributions for these data. Owing to the inability to measure the number of antibiotic doses, and to reduce the possibility of including children who received few regimen-defined combination antibiotics, a post hoc sensitivity analysis was performed. This analysis used an alternative definition for antibiotic regimen groups, for which children admitted for 2 or more calendar days must have received regimen-specified antibiotics on at least 2 days of the admission. Additionally, outcomes were stratified by low and moderate/high illness severity and compared across the three antibiotic regimen groups. All analyses were performed with SAS (SAS 9.4; SAS Institute, Cary, North Carolina), and P values of less than .05 were considered statistically significant.
RESULTS
Overall, 1,815 hospitalized children with SSSS were identified in the PHIS database, and after application of the exclusion criteria, 1,259 children remained, with 1,247 (99%) receiving antibiotics (Figure). The antibiotic regimens received by these children are described in Table 1. Of these, 828 children (66%) received one of the three most common antistaphylococcal regimens (clindamycin, clindamycin + MSSA, and clindamycin + MRSA) and were included for further analysis.

Characteristics of the 828 children are presented in Table 2. Most children (82%) were aged 4 years or younger, and distributions of age, sex, and insurance payer were similar among children receiving the three regimens. Thirty-two percent had moderate to high illness severity, and 3.5% required management in the intensive care setting. Of the three antibiotic regimens, clindamycin monotherapy was most common (47%), followed by clindamycin plus MSSA coverage (33%), and clindamycin plus MRSA coverage (20%). A higher proportion of children in the clindamycin plus MRSA group were African American and were hospitalized in the South. Children receiving clindamycin plus MRSA coverage had higher illness severity (44%) as compared with clindamycin monotherapy (28%) and clindamycin plus MSSA coverage (32%) (P = .001). Additionally, a larger proportion of children treated with clindamycin plus MRSA coverage were managed in the intensive care setting as compared with the clindamycin plus MSSA or clindamycin monotherapy groups.

Among the 828 children with SSSS, the median LOS was 2 days (IQR, 2-3), and treatment failure was 1.1% (95% CI, 0.4-1.8). After adjustment for illness severity, race, payer, and region (Table 3), the three antibiotic regimens were not associated with significant differences in LOS or treatment failure. Costs were significantly different among the three antibiotic regimens. Clindamycin plus MRSA coverage was associated with the greatest costs, whereas clindamycin monotherapy was associated with the lowest costs (mean, $5,348 vs $4,839, respectively; P < .001) (Table 3). In a sensitivity analysis using an alternative antibiotic regimen definition, we found results in line with the primary analysis, with no statistically significant differences in LOS (P = .44) or treatment failure (P = .54), but significant differences in cost (P < .001). Additionally, the same findings were present for LOS, treatment failure, and cost when outcomes were stratified by illness severity (Appendix Table). However, significant contributors to the higher cost in the clindamycin plus MRSA group did vary by illness severity stratification. Laboratory, supply, and pharmacy cost categories differed significantly among antibiotic groups for the low illness severity strata, whereas pharmacy was the only significant cost category difference in moderate/high illness severity.

DISCUSSION
Clindamycin monotherapy, clindamycin plus MSSA coverage, and clindamycin plus MRSA coverage are the most commonly administered antistaphylococcal antibiotic regimens for children hospitalized with SSSS at US children’s hospitals. Our multicenter study found that, across these antistaphylococcal antibiotic regimens, there were no associated differences in hospital LOS or treatment failure. However, the antibiotic regimens were associated with significant differences in overall hospital costs. These findings suggest that the use of clindamycin with additional MSSA or MRSA antibiotic coverage for children with SSSS may not be associated with additional clinical benefit, as compared with clindamycin monotherapy, and could potentially be more costly.
Prior literature describing LOS in relation to antibiotic use for children with SSSS is limited. Authors of a recent case series of 21 children in Philadelphia reported approximately 50% of children received clindamycin monotherapy or combination therapy, but patient outcomes such as LOS were not described.9 Clindamycin use and outcomes have been described in smaller studies and case reports of SSSS, which reported positive outcomes such as patient recovery and lack of disease recurrence.2,9,21 A small retrospective, comparative effectiveness study of 30 neonates with SSSS examined beta-lactamase–resistant penicillin use with and without cephalosporins. They found no effect on LOS, but findings were limited by a small sample size.22 Our study cohort included relatively few neonates, and thus our findings may not be applicable to this population subgroup. We chose not to include regimens with third-generation cephalosporins or ampicillin, which may have limited the number of included neonates, because these antibiotics are frequently administered during evaluation for invasive bacterial infections.23 We found a very low occurrence of treatment failure in our study cohort across all three groups, which is consistent with other studies of SSSS that report an overall good prognosis and low recurrence and/or readmission rates.6,16,24 The low prevalence of treatment failure, however, precluded our ability to detect small differences among antibiotic regimen groups that may exist.
We observed that cost differed significantly across antibiotic regimen groups, with lowest cost associated with clindamycin monotherapy in adjusted analysis despite similar LOS. Even with our illness-severity adjustment, there may have been other unmeasured factors resulting in the higher cost associated with the combination groups. Hence, we also examined cost breakdown with a stratified analysis by illness severity. We found that pharmacy costs were significantly different among antibiotic groups in both illness severity strata, whereas those with low illness severity also differed by laboratory and supply costs. Thus, pharmacy cost differences may be the largest driver in the cost differential among groups. Lower cost in the clindamycin monotherapy group is likely due to administration of a single antibiotic. The reason for supply and laboratory cost differences is uncertain, but higher cost in the clindamycin plus MRSA group could possibly be from laboratory testing related to drug monitoring (eg, renal function testing or drug levels). While other studies have reported costs for hospitalized children with SSSS associated with different patient characteristics or diagnostic testing,1,16 to our knowledge, no other studies have reported cost related to antibiotic regimens for SSSS. As healthcare reimbursements shift to value-based models, identifying treatment regimens with equal efficacy but lower cost will become increasingly important. Future studies should also examine other covariates and outcomes, such as oral vs parenteral antibiotic use, use of monitoring laboratories related to antibiotic choice, and adverse drug effects.
Several strengths and additional limitations apply to our study. Our study is one of the few to describe outcomes associated with antibiotic regimens for children with SSSS. With the PHIS database, we were able to include a large number of children with SSSS from children’s hospitals across the United States. Although the PHIS database affords these strengths, there are limitations inherent to administrative data. Children with SSSS were identified by documented ICD-9 and ICD-10 diagnostic codes, which might lead to misclassification. However, misclassification is less likely because only one ICD-9 and ICD-10 code exists for SSSS, and the characteristics of this condition are specific. Also, diagnostic codes for other dermatologic conditions (eg, scarlet fever) were excluded to further reduce the chance of misclassification. A limitation to our use of PHIS billing codes was the inability to confirm the dosage of antibiotics given, the number of doses, or whether antibiotics were prescribed upon discharge. Another limitation is that children whose antibiotic therapy was changed during hospitalization (eg, from clindamycin monotherapy to cefazolin monotherapy) were categorized into the combination groups. However, the sensitivity analysis performed based on a stricter antibiotic group definition (receipt of both antibiotics on at least 2 calendar days) did not alter the outcomes, which is reassuring. We were unable to assess the use of targeted antibiotic therapy because clinical data (eg, microbiology results) were not available. However, this may be less important because some literature suggests that cultures for S aureus are obtained infrequently2 and may be difficult to interpret when obtained,25 since culture growth can represent colonization rather than causative strains. An additional limitation is that administrative data do not include certain clinical outcomes, such as fever duration or degree of skin involvement, which could have differed among the groups. Last, the PHIS database only captures revisits or readmissions to PHIS hospitals, and so we are unable to exclude the possibility of a child being seen at or readmitted to another hospital.
Due to the observational design of this study and potential for incomplete measurement of illness severity, we recommend a future prospective trial with randomization to confirm these findings. One possible reason that LOS did not differ among groups is that the burden of clindamycin-resistant strains in our cohort could be low, and the addition of MSSA or MRSA coverage does not result in a clinically important increase in S aureus coverage. However, pooled pediatric hospital antibiogram data suggest the overall rate of clindamycin resistance is close to 20% in hospitals located in all US regions.26 Limited studies also suggest that MSSA may be the predominant pathogen associated with SSSS.2,9 To address this, future randomized trials could compare the effectiveness of clindamycin monotherapy to MSSA-specific agents like cefazolin or nafcillin. Unfortunately, anti-MSSA monotherapy was not evaluated in our study because very few children received this treatment. Using monotherapy as opposed to multiple antibiotics has the potential to promote antibiotic stewardship for antistaphylococcal antibiotics in the management of SSSS. Reducing unnecessary antibiotic use not only potentially affects antibiotic resistance, but could also benefit patients in reducing possible side effects, cost, and IV catheter complications.27 However, acknowledging our study limitations, our findings should be applied cautiously in clinical settings, in the context of local antibiogram data, individual culture results, and specific patient factors. The local clindamycin resistance rate for both MSSA and MRSA should be considered. Many antibiotics chosen to treat MRSA—such as vancomycin and trimethoprim/sulfamethoxazole—will also have anti-MSSA activity and may have lower local resistance rates than clindamycin. Practitioners may also consider how each antibiotic kills bacteria; for example, beta-lactams rely on bacterial replication, but clindamycin does not. Each factor should influence how empiric treatment, whether monotherapy or combination, is chosen for children with SSSS.
CONCLUSION
In this large, multicenter cohort of hospitalized children with SSSS, we found that the addition of MSSA or MRSA coverage to clindamycin monotherapy was not associated with differences in outcomes of hospital LOS and treatment failure. Furthermore, clindamycin monotherapy was associated with lower overall cost. Prospective randomized studies are needed to confirm these findings and assess whether clindamycin monotherapy, monotherapy with an anti-MSSA antibiotic, or alternative regimens are most effective for treatment of children with SSSS.
1. Staiman A, Hsu DY, Silverberg JI. Epidemiology of staphylococcal scalded skin syndrome in United States children. Br J Dermatol. 2018;178(3):704-708. https://doi.org/10.1111/bjd.16097
2. Hulten KG, Kok M, King KE, Lamberth LB, Kaplan SL. Increasing numbers of staphylococcal scalded skin syndrome cases caused by ST121 in Houston, TX. Pediatr Infect Dis J. 2020;39(1):30-34. https://doi.org/10.1097/INF.0000000000002499
3. Arnold JD, Hoek SN, Kirkorian AY. Epidemiology of staphylococcal scalded skin syndrome in the United States: A cross-sectional study, 2010-2014. J Am Acad Dermatol. 2018;78(2):404-406. https://doi.org/10.1016/j.jaad.2017.09.023
4. Hayward A, Knott F, Petersen I, et al. Increasing hospitalizations and general practice prescriptions for community-onset staphylococcal disease, England. Emerg Infect Dis. 2008;14(5):720-726. https://doi.org/10.3201/eid1405.070153
5. Berk DR, Bayliss SJ. MRSA, staphylococcal scalded skin syndrome, and other cutaneous bacterial emergencies. Pediatr Ann. 2010;39(10):627-633. https://doi.org/10.3928/00904481-20100922-02
6. Ladhani S, Joannou CL, Lochrie DP, Evans RW, Poston SM. Clinical, microbial, and biochemical aspects of the exfoliative toxins causing staphylococcal scalded-skin syndrome. Clin Microbiol Rev. 1999;12(2):224-242.
7. Handler MZ, Schwartz RA. Staphylococcal scalded skin syndrome: diagnosis and management in children and adults. J Eur Acad Dermatol Venereol. 2014;28(11):1418-1423. https://doi.org/10.1111/jdv.12541
8. Hodille E, Rose W, Diep BA, Goutelle S, Lina G, Dumitrescu O. The role of antibiotics in modulating virulence in Staphylococcus aureus. Clin Microbiol Rev. 2017;30(4):887-917. https://doi.org/10.1128/CMR.00120-16
9. Braunstein I, Wanat KA, Abuabara K, McGowan KL, Yan AC, Treat JR. Antibiotic sensitivity and resistance patterns in pediatric staphylococcal scalded skin syndrome. Pediatr Dermatol. 2014;31(3):305-308. https://doi.org/10.1111/pde.12195
10. Yamaguchi T, Yokota Y, Terajima J, et al. Clonal association of Staphylococcus aureus causing bullous impetigo and the emergence of new methicillin-resistant clonal groups in Kansai district in Japan. J Infect Dis. 2002;185(10):1511-1516. https://doi.org/10.1086/340212
11. Noguchi N, Nakaminami H, Nishijima S, Kurokawa I, So H, Sasatsu M. Antimicrobial agent of susceptibilities and antiseptic resistance gene distribution among methicillin-resistant Staphylococcus aureus isolates from patients with impetigo and staphylococcal scalded skin syndrome. J Clin Microbiol. 2006;44(6):2119-2125. https://doi.org/10.1128/JCM.02690-05
12. Pankey GA, Sabath LD. Clinical relevance of bacteriostatic versus bactericidal mechanisms of action in the treatment of Gram-positive bacterial infections. Clin Infect Dis. 2004;38(6):864-870. https://doi.org/10.1086/381972
13. Wald-Dickler N, Holtom P, Spellberg B. Busting the myth of “static vs cidal”: a systemic literature review. Clin Infect Dis. 2018;66(9):1470-1474. https://doi.org/10.1093/cid/cix1127
14. Ladhani S, Joannou CL. Difficulties in diagnosis and management of the staphylococcal scalded skin syndrome. Pediatr Infect Dis J. 2000;19(9):819-821. https://doi.org/10.1097/00006454-200009000-00002
15. Mongelluzzo J, Mohamad Z, Ten Have TR, Shah SS. Corticosteroids and mortality in children with bacterial meningitis. JAMA. 2008;299(17):2048-2055. https://doi.org/10.1001/jama.299.17.2048
16. Neubauer HC, Hall M, Wallace SS, et al. Variation in diagnostic test use and associated outcomes in staphylococcal scalded skin syndrome at children’s hospitals. Hosp Pediatr. 2018;8(9):530-537. https://doi.org/10.1542/hpeds.2018-0032
17. Feudtner C, Feinstein JA, Zhong W, Hall M, Dai D. Pediatric complex chronic conditions classification system version 2: updated for ICD-10 and complex medical technology dependence and transplantation. BMC Pediatr. 2014;14:199. https://doi.org/10.1186/1471-2431-14-199
18. Sauberan JS, Bradley JS. Antimicrobial agents. In: Long SS, ed. Principles and Practice of Pediatric Infectious Diseases. Elsevier; 2018:1499-1531.
19. Sedman AB, Bahl V, Bunting E, et al. Clinical redesign using all patient refined diagnosis related groups. Pediatrics. 2004;114(4):965-969. https://doi.org/10.1542/peds.2004-0650
20. Williams DJ, Cooper WO, Kaltenbach LA, et al. Comparative effectiveness of antibiotic treatment strategies for pediatric skin and soft-tissue infections. Pediatrics. 2011;128(3):e479-487. https://doi.org/10.1542/peds.2010-3681
21. Haasnoot PJ, De Vries A. Staphylococcal scalded skin syndrome in a 4-year-old child: a case report. J Med Case Rep. 2018;12(1):20. https://doi.org/ 10.1186/s13256-017-1533-7
22. Li MY, Hua Y, Wei GH, Qiu L. Staphylococcal scalded skin syndrome in neonates: an 8-year retrospective study in a single institution. Pediatr Dermatol. 2014;31(1):43-47. https://doi.org/10.1111/pde.12114
23. Markham JL, Hall M, Queen MA, et al. Variation in antibiotic selection and clinical outcomes in infants <60 days hospitalized with skin and soft tissue infections. Hosp Pediatr. 2019;9(1):30-38. https://doi.org/10.1542/hpeds.2017-0237
24. Davidson J, Polly S, Hayes PJ, Fisher KR, Talati AJ, Patel T. Recurrent staphylococcal scalded skin syndrome in an extremely low-birth-weight neonate. AJP Rep. 2017;7(2):e134-e137. https://doi.org/10.1055/s-0037-1603971
25. Ladhani S, Robbie S, Chapple DS, Joannou CL, Evans RW. Isolating Staphylococcus aureus from children with suspected Staphylococcal scalded skin syndrome is not clinically useful. Pediatr Infect Dis J. 2003;22(3):284-286.
26. Tamma PD, Robinson GL, Gerber JS, et al. Pediatric antimicrobial susceptibility trends across the United States. Infect Control Hosp Epidemiol. 2013;34(12):1244-1251. https://doi.org/10.1086/673974
27. Unbeck M, Forberg U, Ygge BM, Ehrenberg A, Petzold M, Johansson E. Peripheral venous catheter related complications are common among paediatric and neonatal patients. Acta Paediatr. 2015;104(6):566-574. https://doi.org/10.1111/apa.12963
Staphylococcal scalded skin syndrome (SSSS) is an exfoliative toxin-mediated dermatitis that predominantly occurs in young children. Multiple recent reports indicate a rising incidence of this disease.1-4 Recommended treatment for SSSS includes antistaphylococcal antibiotics and supportive care measures.5,6 Elimination or reduction of the toxin-producing Staphylococcus aureus is thought to help limit disease progression and promote recovery. Experts advocate for the use of antibiotics even when there is no apparent focal source of infection, such as an abscess.6,7
Several factors may affect antibiotic selection, including the desire to inhibit toxin production and to target the causative pathogen in a bactericidal fashion. Because SSSS is toxin mediated, clindamycin is often recommended because of its inhibition of toxin synthesis.5,8 The clinical utility of adding other antibiotics to clindamycin for coverage of methicillin-sensitive S aureus (MSSA) or methicillin-resistant S aureus (MRSA) is uncertain. Several studies report MSSA to be the predominant pathogen identified by culture2,9; however, SSSS caused by MRSA has been reported.9-11 Additionally, bactericidal antibiotics (eg, nafcillin) have been considered to hold potential clinical advantage as compared with bacteriostatic antibiotics (eg, clindamycin), even though clinical studies have not clearly demonstrated this advantage in the general population.12,13 Some experts recommend additional MRSA or MSSA coverage (such as vancomycin or nafcillin) in patients with high illness severity or nonresponse to therapy, or in areas where there is high prevalence of staphylococcal resistance to clindamycin.5,7,9,14 Alternatively, for areas with low MRSA prevalence, monotherapy with an anti-MSSA antibiotic is another potential option. No recent studies have compared patient outcomes among antibiotic regimens in children with SSSS.
Knowledge of the outcomes associated with different antibiotic regimens for children hospitalized with SSSS is needed and could be used to improve patient outcomes and potentially promote antibiotic stewardship. In this study, our objectives were to (1) describe antibiotic regimens given to children hospitalized with SSSS, and (2) examine the association of three antibiotic regimens commonly used for SSSS (clindamycin monotherapy, clindamycin plus additional MSSA coverage, and clindamycin plus additional MRSA coverage) with patient outcomes of length of stay (LOS), treatment failure, and cost in a large cohort of children at US children’s hospitals.
METHODS
We conducted a multicenter, retrospective cohort study utilizing data within the Pediatric Health Information System (PHIS) database from July 1, 2011, to June 30, 2016. Thirty-five free-standing tertiary care US children’s hospitals within 24 states were included. The Children’s Hospital Association (Lenexa, Kansas) maintains the PHIS database, which contains de-identified patient information, including diagnoses (with International Classification of Diseases, Ninth and Tenth Revision, Clinical Modification [ICD-9-CM, ICD-10-CM]), demographics, procedures, and daily billing records. Data quality and reliability are confirmed by participating institutions and the Children’s Hospital Association.15 The local institutional review board (IRB) deemed the study exempt from formal IRB review, as patient information was de-identified.
Study Population
We included hospitalized children aged newborn to 18 years with a primary or secondary diagnosis of SSSS (ICD-9, 695.81; ICD-10, L00). Children whose primary presentation and admission were to a PHIS hospital were included; children transferred from another hospital were excluded. The following exclusion criteria were based on previously published methodology.16 Children with complex chronic medical conditions as classified by Feudtner et al17 were excluded, since these children may require a different treatment approach than the general pediatric population. In order to decrease diagnostic ambiguity, we excluded children if an alternative dermatologic diagnosis was recorded as a principal or secondary diagnosis (eg, Stevens-Johnson syndrome or scarlet fever).16 Finally, hospitals with fewer than 10 children with SSSS during the study period were excluded.
Antibiotic Regimen Groups
We used PHIS daily billing codes to determine the antibiotics received by the study population. Children were classified into antibiotic regimen groups based on whether they received specific antibiotic combinations. Antibiotics received on any day during the hospitalization, including in the emergency department (ED), were used to assign patients to regimen groups. Antibiotics were classified into regimen groups based on consensus among study investigators, which included two board-certified pediatric infectious diseases specialists (A.C., R.M.). Antibiotic group definitions are listed in Table 1. Oral and intravenous (IV) therapies were grouped together for clindamycin, cephalexin/cefazolin, and linezolid because of good oral bioavailability in most situations.18 The three most common antistaphylococcal groups were chosen for further analysis: clindamycin alone, clindamycin plus MSSA coverage, and clindamycin plus MRSA coverage. The clindamycin group was defined as children with receipt of oral or IV clindamycin. Children who received clindamycin with additional MSSA coverage, such as cefazolin or nafcillin, were categorized as the clindamycin plus MSSA group. Children who received clindamycin with additional MRSA coverage, such as vancomycin or linezolid, were categorized as the clindamycin plus MRSA group. We chose not to include children who received the above regimens plus other antibiotics with partial antistaphylococcal activity, such as ampicillin, gentamicin, or ceftriaxone, in the clindamycin plus MSSA and clindamycin plus MRSA groups. We excluded these antibiotics to decrease the heterogeneity in the definition of regimen groups and allow a more direct comparison for effectiveness.
Covariates
Covariates included age, sex, ethnicity and/or race, payer type, level of care, illness severity, and region. The variable definitions below are in keeping with a prior study of SSSS.16 Age was categorized as: birth to 59 days, 2 to 11 months, 1 to 4 years (preschool age), 5 to 10 years (school age), and 11 to 18 years (adolescent). We examined infants younger than 60 days separately from older infants because this population may warrant additional treatment considerations. Race and ethnicity were categorized as White (non-Hispanic), African American (non-Hispanic), Hispanic, or other. Payer types included government, private, or other. Level of care was assigned as either intensive care or acute care. Illness severity was assigned using the All Patient Refined Diagnosis Related Group (APR-DRG; 3M Corporation, St. Paul, Minnesota) severity levels.19 In line with a prior study,16 we defined “low illness severity” as the APR-DRG minor (1) classification. The moderate (2), major (3), and extreme (4) classifications were defined as “moderate to high illness severity,” since there were very few classifications of major or extreme (<5%) illness severity. We categorized hospitals into the following US regions: Northeast, Midwest, South, and West.
Outcome Measures
The primary outcome was hospital LOS in days, and secondary outcomes were treatment failure and hospital costs. Hospital LOS was chosen as the primary outcome to represent the time needed for the child to show clinical improvement. Treatment failure was defined as a same-cause 14-day ED revisit or hospital readmission, and these were determined to be same-cause if a diagnosis for SSSS (ICD-9, 695.81; ICD-10, L00) was documented for the return encounter. The 14-day interval for readmission and ED revisit was chosen to measure any relapse of symptoms after completion of antibiotic therapy, similar to a prior study of treatment failure in skin and soft tissue infections.20 Total costs of the hospitalization were estimated from charges using hospital- and year-specific cost-to-charge ratios. Subcategories of cost, including clinical, pharmacy, imaging, laboratory, supply, and other, were also compared among the three groups.
Statistical Analysis
Demographic and clinical characteristics of children were summarized using frequencies and percentages for categorical variables and medians with interquartile ranges (IQRs) for continuous variables. These were compared across antibiotic groups using chi-square and Kruskal–Wallis tests, respectively. In unadjusted analyses, outcomes were compared across antibiotic regimen groups using these same statistical tests. In order to account for patient clustering within hospitals, generalized linear mixed-effects models were used to model outcomes with a random intercept for each hospital. Models were adjusted for SSSS being listed as a principal or secondary diagnosis, race, illness severity, and level of care. We log-transformed LOS and cost data prior to modeling because of the nonnormal distributions for these data. Owing to the inability to measure the number of antibiotic doses, and to reduce the possibility of including children who received few regimen-defined combination antibiotics, a post hoc sensitivity analysis was performed. This analysis used an alternative definition for antibiotic regimen groups, for which children admitted for 2 or more calendar days must have received regimen-specified antibiotics on at least 2 days of the admission. Additionally, outcomes were stratified by low and moderate/high illness severity and compared across the three antibiotic regimen groups. All analyses were performed with SAS (SAS 9.4; SAS Institute, Cary, North Carolina), and P values of less than .05 were considered statistically significant.
RESULTS
Overall, 1,815 hospitalized children with SSSS were identified in the PHIS database, and after application of the exclusion criteria, 1,259 children remained, with 1,247 (99%) receiving antibiotics (Figure). The antibiotic regimens received by these children are described in Table 1. Of these, 828 children (66%) received one of the three most common antistaphylococcal regimens (clindamycin, clindamycin + MSSA, and clindamycin + MRSA) and were included for further analysis.
Characteristics of the 828 children are presented in Table 2. Most children (82%) were aged 4 years or younger, and distributions of age, sex, and insurance payer were similar among children receiving the three regimens. Thirty-two percent had moderate to high illness severity, and 3.5% required management in the intensive care setting. Of the three antibiotic regimens, clindamycin monotherapy was most common (47%), followed by clindamycin plus MSSA coverage (33%), and clindamycin plus MRSA coverage (20%). A higher proportion of children in the clindamycin plus MRSA group were African American and were hospitalized in the South. Children receiving clindamycin plus MRSA coverage had higher illness severity (44%) as compared with clindamycin monotherapy (28%) and clindamycin plus MSSA coverage (32%) (P = .001). Additionally, a larger proportion of children treated with clindamycin plus MRSA coverage were managed in the intensive care setting as compared with the clindamycin plus MSSA or clindamycin monotherapy groups.
Among the 828 children with SSSS, the median LOS was 2 days (IQR, 2-3), and treatment failure was 1.1% (95% CI, 0.4-1.8). After adjustment for illness severity, race, payer, and region (Table 3), the three antibiotic regimens were not associated with significant differences in LOS or treatment failure. Costs were significantly different among the three antibiotic regimens. Clindamycin plus MRSA coverage was associated with the greatest costs, whereas clindamycin monotherapy was associated with the lowest costs (mean, $5,348 vs $4,839, respectively; P < .001) (Table 3). In a sensitivity analysis using an alternative antibiotic regimen definition, we found results in line with the primary analysis, with no statistically significant differences in LOS (P = .44) or treatment failure (P = .54), but significant differences in cost (P < .001). Additionally, the same findings were present for LOS, treatment failure, and cost when outcomes were stratified by illness severity (Appendix Table). However, significant contributors to the higher cost in the clindamycin plus MRSA group did vary by illness severity stratification. Laboratory, supply, and pharmacy cost categories differed significantly among antibiotic groups for the low illness severity strata, whereas pharmacy was the only significant cost category difference in moderate/high illness severity.
DISCUSSION
Clindamycin monotherapy, clindamycin plus MSSA coverage, and clindamycin plus MRSA coverage are the most commonly administered antistaphylococcal antibiotic regimens for children hospitalized with SSSS at US children’s hospitals. Our multicenter study found that, across these antistaphylococcal antibiotic regimens, there were no associated differences in hospital LOS or treatment failure. However, the antibiotic regimens were associated with significant differences in overall hospital costs. These findings suggest that the use of clindamycin with additional MSSA or MRSA antibiotic coverage for children with SSSS may not be associated with additional clinical benefit, as compared with clindamycin monotherapy, and could potentially be more costly.
Prior literature describing LOS in relation to antibiotic use for children with SSSS is limited. Authors of a recent case series of 21 children in Philadelphia reported approximately 50% of children received clindamycin monotherapy or combination therapy, but patient outcomes such as LOS were not described.9 Clindamycin use and outcomes have been described in smaller studies and case reports of SSSS, which reported positive outcomes such as patient recovery and lack of disease recurrence.2,9,21 A small retrospective, comparative effectiveness study of 30 neonates with SSSS examined beta-lactamase–resistant penicillin use with and without cephalosporins. They found no effect on LOS, but findings were limited by a small sample size.22 Our study cohort included relatively few neonates, and thus our findings may not be applicable to this population subgroup. We chose not to include regimens with third-generation cephalosporins or ampicillin, which may have limited the number of included neonates, because these antibiotics are frequently administered during evaluation for invasive bacterial infections.23 We found a very low occurrence of treatment failure in our study cohort across all three groups, which is consistent with other studies of SSSS that report an overall good prognosis and low recurrence and/or readmission rates.6,16,24 The low prevalence of treatment failure, however, precluded our ability to detect small differences among antibiotic regimen groups that may exist.
We observed that cost differed significantly across antibiotic regimen groups, with lowest cost associated with clindamycin monotherapy in adjusted analysis despite similar LOS. Even with our illness-severity adjustment, there may have been other unmeasured factors resulting in the higher cost associated with the combination groups. Hence, we also examined cost breakdown with a stratified analysis by illness severity. We found that pharmacy costs were significantly different among antibiotic groups in both illness severity strata, whereas those with low illness severity also differed by laboratory and supply costs. Thus, pharmacy cost differences may be the largest driver in the cost differential among groups. Lower cost in the clindamycin monotherapy group is likely due to administration of a single antibiotic. The reason for supply and laboratory cost differences is uncertain, but higher cost in the clindamycin plus MRSA group could possibly be from laboratory testing related to drug monitoring (eg, renal function testing or drug levels). While other studies have reported costs for hospitalized children with SSSS associated with different patient characteristics or diagnostic testing,1,16 to our knowledge, no other studies have reported cost related to antibiotic regimens for SSSS. As healthcare reimbursements shift to value-based models, identifying treatment regimens with equal efficacy but lower cost will become increasingly important. Future studies should also examine other covariates and outcomes, such as oral vs parenteral antibiotic use, use of monitoring laboratories related to antibiotic choice, and adverse drug effects.
Several strengths and additional limitations apply to our study. Our study is one of the few to describe outcomes associated with antibiotic regimens for children with SSSS. With the PHIS database, we were able to include a large number of children with SSSS from children’s hospitals across the United States. Although the PHIS database affords these strengths, there are limitations inherent to administrative data. Children with SSSS were identified by documented ICD-9 and ICD-10 diagnostic codes, which might lead to misclassification. However, misclassification is less likely because only one ICD-9 and ICD-10 code exists for SSSS, and the characteristics of this condition are specific. Also, diagnostic codes for other dermatologic conditions (eg, scarlet fever) were excluded to further reduce the chance of misclassification. A limitation to our use of PHIS billing codes was the inability to confirm the dosage of antibiotics given, the number of doses, or whether antibiotics were prescribed upon discharge. Another limitation is that children whose antibiotic therapy was changed during hospitalization (eg, from clindamycin monotherapy to cefazolin monotherapy) were categorized into the combination groups. However, the sensitivity analysis performed based on a stricter antibiotic group definition (receipt of both antibiotics on at least 2 calendar days) did not alter the outcomes, which is reassuring. We were unable to assess the use of targeted antibiotic therapy because clinical data (eg, microbiology results) were not available. However, this may be less important because some literature suggests that cultures for S aureus are obtained infrequently2 and may be difficult to interpret when obtained,25 since culture growth can represent colonization rather than causative strains. An additional limitation is that administrative data do not include certain clinical outcomes, such as fever duration or degree of skin involvement, which could have differed among the groups. Last, the PHIS database only captures revisits or readmissions to PHIS hospitals, and so we are unable to exclude the possibility of a child being seen at or readmitted to another hospital.
Due to the observational design of this study and potential for incomplete measurement of illness severity, we recommend a future prospective trial with randomization to confirm these findings. One possible reason that LOS did not differ among groups is that the burden of clindamycin-resistant strains in our cohort could be low, and the addition of MSSA or MRSA coverage does not result in a clinically important increase in S aureus coverage. However, pooled pediatric hospital antibiogram data suggest the overall rate of clindamycin resistance is close to 20% in hospitals located in all US regions.26 Limited studies also suggest that MSSA may be the predominant pathogen associated with SSSS.2,9 To address this, future randomized trials could compare the effectiveness of clindamycin monotherapy to MSSA-specific agents like cefazolin or nafcillin. Unfortunately, anti-MSSA monotherapy was not evaluated in our study because very few children received this treatment. Using monotherapy as opposed to multiple antibiotics has the potential to promote antibiotic stewardship for antistaphylococcal antibiotics in the management of SSSS. Reducing unnecessary antibiotic use not only potentially affects antibiotic resistance, but could also benefit patients in reducing possible side effects, cost, and IV catheter complications.27 However, acknowledging our study limitations, our findings should be applied cautiously in clinical settings, in the context of local antibiogram data, individual culture results, and specific patient factors. The local clindamycin resistance rate for both MSSA and MRSA should be considered. Many antibiotics chosen to treat MRSA—such as vancomycin and trimethoprim/sulfamethoxazole—will also have anti-MSSA activity and may have lower local resistance rates than clindamycin. Practitioners may also consider how each antibiotic kills bacteria; for example, beta-lactams rely on bacterial replication, but clindamycin does not. Each factor should influence how empiric treatment, whether monotherapy or combination, is chosen for children with SSSS.
CONCLUSION
In this large, multicenter cohort of hospitalized children with SSSS, we found that the addition of MSSA or MRSA coverage to clindamycin monotherapy was not associated with differences in outcomes of hospital LOS and treatment failure. Furthermore, clindamycin monotherapy was associated with lower overall cost. Prospective randomized studies are needed to confirm these findings and assess whether clindamycin monotherapy, monotherapy with an anti-MSSA antibiotic, or alternative regimens are most effective for treatment of children with SSSS.
1. Staiman A, Hsu DY, Silverberg JI. Epidemiology of staphylococcal scalded skin syndrome in United States children. Br J Dermatol. 2018;178(3):704-708. https://doi.org/10.1111/bjd.16097
2. Hulten KG, Kok M, King KE, Lamberth LB, Kaplan SL. Increasing numbers of staphylococcal scalded skin syndrome cases caused by ST121 in Houston, TX. Pediatr Infect Dis J. 2020;39(1):30-34. https://doi.org/10.1097/INF.0000000000002499
3. Arnold JD, Hoek SN, Kirkorian AY. Epidemiology of staphylococcal scalded skin syndrome in the United States: A cross-sectional study, 2010-2014. J Am Acad Dermatol. 2018;78(2):404-406. https://doi.org/10.1016/j.jaad.2017.09.023
4. Hayward A, Knott F, Petersen I, et al. Increasing hospitalizations and general practice prescriptions for community-onset staphylococcal disease, England. Emerg Infect Dis. 2008;14(5):720-726. https://doi.org/10.3201/eid1405.070153
5. Berk DR, Bayliss SJ. MRSA, staphylococcal scalded skin syndrome, and other cutaneous bacterial emergencies. Pediatr Ann. 2010;39(10):627-633. https://doi.org/10.3928/00904481-20100922-02
6. Ladhani S, Joannou CL, Lochrie DP, Evans RW, Poston SM. Clinical, microbial, and biochemical aspects of the exfoliative toxins causing staphylococcal scalded-skin syndrome. Clin Microbiol Rev. 1999;12(2):224-242.
7. Handler MZ, Schwartz RA. Staphylococcal scalded skin syndrome: diagnosis and management in children and adults. J Eur Acad Dermatol Venereol. 2014;28(11):1418-1423. https://doi.org/10.1111/jdv.12541
8. Hodille E, Rose W, Diep BA, Goutelle S, Lina G, Dumitrescu O. The role of antibiotics in modulating virulence in Staphylococcus aureus. Clin Microbiol Rev. 2017;30(4):887-917. https://doi.org/10.1128/CMR.00120-16
9. Braunstein I, Wanat KA, Abuabara K, McGowan KL, Yan AC, Treat JR. Antibiotic sensitivity and resistance patterns in pediatric staphylococcal scalded skin syndrome. Pediatr Dermatol. 2014;31(3):305-308. https://doi.org/10.1111/pde.12195
10. Yamaguchi T, Yokota Y, Terajima J, et al. Clonal association of Staphylococcus aureus causing bullous impetigo and the emergence of new methicillin-resistant clonal groups in Kansai district in Japan. J Infect Dis. 2002;185(10):1511-1516. https://doi.org/10.1086/340212
11. Noguchi N, Nakaminami H, Nishijima S, Kurokawa I, So H, Sasatsu M. Antimicrobial agent of susceptibilities and antiseptic resistance gene distribution among methicillin-resistant Staphylococcus aureus isolates from patients with impetigo and staphylococcal scalded skin syndrome. J Clin Microbiol. 2006;44(6):2119-2125. https://doi.org/10.1128/JCM.02690-05
12. Pankey GA, Sabath LD. Clinical relevance of bacteriostatic versus bactericidal mechanisms of action in the treatment of Gram-positive bacterial infections. Clin Infect Dis. 2004;38(6):864-870. https://doi.org/10.1086/381972
13. Wald-Dickler N, Holtom P, Spellberg B. Busting the myth of “static vs cidal”: a systemic literature review. Clin Infect Dis. 2018;66(9):1470-1474. https://doi.org/10.1093/cid/cix1127
14. Ladhani S, Joannou CL. Difficulties in diagnosis and management of the staphylococcal scalded skin syndrome. Pediatr Infect Dis J. 2000;19(9):819-821. https://doi.org/10.1097/00006454-200009000-00002
15. Mongelluzzo J, Mohamad Z, Ten Have TR, Shah SS. Corticosteroids and mortality in children with bacterial meningitis. JAMA. 2008;299(17):2048-2055. https://doi.org/10.1001/jama.299.17.2048
16. Neubauer HC, Hall M, Wallace SS, et al. Variation in diagnostic test use and associated outcomes in staphylococcal scalded skin syndrome at children’s hospitals. Hosp Pediatr. 2018;8(9):530-537. https://doi.org/10.1542/hpeds.2018-0032
17. Feudtner C, Feinstein JA, Zhong W, Hall M, Dai D. Pediatric complex chronic conditions classification system version 2: updated for ICD-10 and complex medical technology dependence and transplantation. BMC Pediatr. 2014;14:199. https://doi.org/10.1186/1471-2431-14-199
18. Sauberan JS, Bradley JS. Antimicrobial agents. In: Long SS, ed. Principles and Practice of Pediatric Infectious Diseases. Elsevier; 2018:1499-1531.
19. Sedman AB, Bahl V, Bunting E, et al. Clinical redesign using all patient refined diagnosis related groups. Pediatrics. 2004;114(4):965-969. https://doi.org/10.1542/peds.2004-0650
20. Williams DJ, Cooper WO, Kaltenbach LA, et al. Comparative effectiveness of antibiotic treatment strategies for pediatric skin and soft-tissue infections. Pediatrics. 2011;128(3):e479-487. https://doi.org/10.1542/peds.2010-3681
21. Haasnoot PJ, De Vries A. Staphylococcal scalded skin syndrome in a 4-year-old child: a case report. J Med Case Rep. 2018;12(1):20. https://doi.org/ 10.1186/s13256-017-1533-7
22. Li MY, Hua Y, Wei GH, Qiu L. Staphylococcal scalded skin syndrome in neonates: an 8-year retrospective study in a single institution. Pediatr Dermatol. 2014;31(1):43-47. https://doi.org/10.1111/pde.12114
23. Markham JL, Hall M, Queen MA, et al. Variation in antibiotic selection and clinical outcomes in infants <60 days hospitalized with skin and soft tissue infections. Hosp Pediatr. 2019;9(1):30-38. https://doi.org/10.1542/hpeds.2017-0237
24. Davidson J, Polly S, Hayes PJ, Fisher KR, Talati AJ, Patel T. Recurrent staphylococcal scalded skin syndrome in an extremely low-birth-weight neonate. AJP Rep. 2017;7(2):e134-e137. https://doi.org/10.1055/s-0037-1603971
25. Ladhani S, Robbie S, Chapple DS, Joannou CL, Evans RW. Isolating Staphylococcus aureus from children with suspected Staphylococcal scalded skin syndrome is not clinically useful. Pediatr Infect Dis J. 2003;22(3):284-286.
26. Tamma PD, Robinson GL, Gerber JS, et al. Pediatric antimicrobial susceptibility trends across the United States. Infect Control Hosp Epidemiol. 2013;34(12):1244-1251. https://doi.org/10.1086/673974
27. Unbeck M, Forberg U, Ygge BM, Ehrenberg A, Petzold M, Johansson E. Peripheral venous catheter related complications are common among paediatric and neonatal patients. Acta Paediatr. 2015;104(6):566-574. https://doi.org/10.1111/apa.12963
©2021 Society of Hospital Medicine
Implementing a Telehospitalist Program Between Veterans Health Administration Hospitals: Outcomes, Acceptance, and Barriers to Implementation
Healthcare in rural areas faces increasing challenges due to community hospital closures, physician shortages, and a more concentrated population of older adults with higher rates of comorbid conditions than their urban counterparts.1-3 Critical access hospitals (CAHs), which primarily serve rural areas, have fewer clinical capabilities, worse process-of-care measures, and higher mortality rates for some conditions when compared to non-CAHs.4 As such, CAHs are closing at record numbers across the United States,5 resulting in loss of available hospital beds and patient access to timely emergency services,6 which can worsen outcomes, further widening the rural-urban healthcare gap.7,8 Furthermore, this strain on an overwhelmed health system in the most vulnerable areas restricts the ability to respond to healthcare crises like the coronavirus disease 2019 pandemic.9
Providing adequate staff for currently available hospital beds is also a problem in rural areas. Studies demonstrating improved outcomes, decreased length of stay (LOS), and increased quality with hospitalist services have resulted in a high demand for hospitalists nationwide.10-12 Recruiting hospitalists to work in rural areas, however, has become increasingly challenging due to low-patient volumes, financial viability of hospitalist-model adoption, and provider shortages.13,14 Recently, the Veterans Health Administration (VHA) reported a 28% nationwide shortage of hospitalists,15 which disproportionally affects rural VHA hospitals. Staffing difficulties and reliance on intermittent providers were reported by more than 80% of rural and low-complexity VHA facilities.16
Telehospitalist services (THS) can help deliver high-quality care to rural residents locally, decrease travel expenses, support hospital volume, and increase healthcare capacity in response to a pandemic.14,17,18 Only a few studies have described THS (mostly with overnight or cross-coverage models directed to CAHs), and clinical outcomes have been inconsistently reported.17,19-21 Furthermore, no program has been conducted within an integrated health system akin to the VHA. The primary objective of this quality improvement (QI) initiative was to perform a mixed-methods evaluation of THS between VHA hospitals to compare clinical outcomes and patient and staff satisfaction. Secondary outcomes included description of the implementation process, unexpected challenges, and subsequent QI initiatives. These results will expand the knowledge on feasibility of THS and provide implementation guidance.
METHODS
A mixed-methods approach was used to evaluate outcomes of this QI project. Reporting follows the revised Standards for Quality Improvement Reporting Excellence (SQUIRE 2.0).22
Context
The VHA is the largest integrated healthcare system in the United States, with more than 8 million veterans enrolled, more than 30% of whom reside in a rural area. The VHA comprises more than 1,000 outpatient clinics and 170 acute care VA Medical Centers,23,24 including more than 35 rural and low-complexity hospitals.25 Low-complexity hospitals are those with the lowest volume and levels of patient complexity and minimal or no teaching programs, research, intensive care unit (ICU) beds, and subspecialists. Lack of reimbursement and interstate licensing, often cited as barriers to telemedicine, do not apply to the VHA. The hub site was a large tertiary care (high-complexity) VHA hospital located in Iowa City, Iowa. The spoke site was a low-complexity (10-bed acute inpatient unit with no ICU) rural VA hospital located in Tomah, Wisconsin.
Study Population
The preimplementation cohort for comparison included all patients admitted between January 1, 2018, and January 6, 2019. The postimplementation study cohort included all observation and acute care admissions during the pilot phase (January 7 to May 3, 2019) and sustainability phase (July 15 to December 31, 2019). The postimplementation analysis excluded the time period of May 4 to July 14, 2019, due to an interruption (gap) in THS. The gap period allowed for preliminary data analysis, optimization of the telecommunication system, and the recruitment and training of additional providers who could provide long-term staffing to the service.
Intervention
Preimplementation
Prior to THS implementation, Tomah’s inpatient ward was staffed by one physician per shift, who could be a hospitalist, medical officer of the day (MOD), or an intermittent provider (locum tenens). Hospitalists covering the acute inpatient ward prior to the THS transitioned to cover weekends, nights, and urgent care service shifts.
We visited the spoke site and held information-sharing sessions with key stakeholders (administrators, clinician leaders, nurses, and ancillary staff) prior to kick-off. Recurrent phone meetings addressed anticipated and emerging challenges. Telehospitalist and local providers underwent technology and service training.
Technology and Connectivity
A low-cost technology system using tablet computers provided Health Insurance Portability and Accountability Act–compliant videoconferencing with a telehospitalist at the hub site. An Eko-Core digital stethoscope® with a web-based audio stream was available. Telehospitalists conducted encounters from a private office space with telehealth capabilities. A total of $9,000 was spent on equipment at both sites. Due to connectivity problems and data limits, the tablets were switched to mobile computer-on-wheels workstations and hospital-based Wi-Fi for the sustainability phase.
THS Description
An experienced hub hospitalist, together with an advanced practice provider (APP; nurse practitioner [NP] or physician assistant [PA]), cared for all patients admitted to the 10-bed inpatient unit at the spoke site, Monday through Friday from 8:00 AM to 4:30 PM. The APP had limited or no prior experience in acute inpatient medicine. The telehospitalist worked as a team with the APP. The APP was the main point of contact for nurses, performed physical examinations, and directed patient care to their level of comfort (in a similar manner as a teaching team). The telehospitalist conducted bedside patient rounds, participated in multidisciplinary huddles, and shared clinical documentation and administrative duties with the APP. The telehospitalist was the primary staff for admitted patients and had full access to the electronic health record (EHR). The THS was staffed by 10 hospitalists during the study period. Overnight and weekend cross-coverage and admissions were performed by MODs, who also covered the urgent care and cross-covered other nonmedical units.
Quantitative Evaluation Methods
Workload and Clinical Outcomes
An EHR query identified all patients admitted during the pre- and postimplementation periods. Demographic data, clinical Nosos risk scores,26,27 and top admission diagnoses were reported. Workload was evaluated using the average number of encounters per day and self-reported telehospitalist worksheets, which were cross-referenced with EHR data. Clinical outcomes included LOS, 30-day hospital readmission rate, 30-day standardized mortality (SMR30), in-hospital mortality, and VHA-specific inpatient quality metrics. Independent sample t tests for continuous variables and chi-square tests or Fisher’s exact test (for patient class) for categorical variables were used to compare pre- and postimplementation groups. Statistical process control (SPC) charts evaluated changes over time. All analyses were conducted using Microsoft Excel and R.28
Anonymous surveys were distributed to spoke-site inpatient and administrative staff at 1 month and 12 months postimplementation, assessing satisfaction, technology/connectivity, communication, and challenges (Appendix Figure 1). Satisfaction of the telehospitalist physicians at the hub site was measured 12 months postimplementation by a 26-question survey assessing the same domains, plus quality of care (Appendix Figure 2).
Patient Satisfaction
The VHA Survey of Healthcare Experiences of Patients (SHEP), a version of the Hospital Consumer Assessment of Healthcare Providers and Systems Survey,29,30 was mailed to all patients after discharge. Survey responses concerning inpatient provider care (eg, care coordination, communication, hospital rating, willingness to recommend the hospital) during the pre- and postimplementation phases were compared using a two-sample test of independent proportions. Responses obtained during May and June 2019 were excluded.
Qualitative Evaluation Methods
The authors had full access to, and took full responsibility for, the integrity of the data. The project was evaluated by the University of Iowa Institutional Review Board and the Iowa City VA Research and Development Committee and was determined to be a non–human-subjects QI project.
RESULTS
Quantitative Workload and Clinical Outcomes
There were 822 admissions during the preimplementation period and 550 admissions during the postimplementation period (253 during the pilot and 297 during sustainability phase). Patient characteristics pre- and postimplementation were not significantly different (Table 1). The median patient age was 65 years; 96% of patients were male, and 83% were rural residents. The most common admission diagnosis was alcohol-related (36%); regarding patient disposition, 78% of admissions were discharged home.

Workload
There were 502 patient encounters staffed by the telehospitalist in the pilot phase, with an average of 6.25 encounters per day, and a telehospitalist-reported workload of 7 hours per day. There were 538 patient encounters, with an average of 4.67 encounters per day and a workload of 5.6 hours per day in the sustainability phase. The average daily census decreased from 5.0 (SD, 1.1) patients per day during preimplementation to 3.1 (SD, 0.5) patients per day during postimplementation (Table 2). In some of the months during the study period, admissions decreased below the lower SPC limit, suggesting a significant change (Figure). Adjusted LOS was significantly lower, with 3.0 (SD, 0.7) days vs 2.3 (SD, 0.3) days in the pre- and postimplementation periods, respectively. Bed occupancy rates were significantly lower in the sustainability phase compared with the pilot phase and the preimplementation period. Readmission rates varied, ranging from <10% to >30%, not significantly different but slightly higher in the postimplementation period. Readmission rates for heart failure, chronic obstructive pulmonary disease, and pneumonia remained unchanged; other medical readmissions (mostly alcohol-related) were slightly higher in the postimplementation period.

In-hospital mortality and SMR30 did not change significantly, but there was improvement in the 12-month rolling average of the observed/expected SMR30 from 1.40 to 1.08. Additional VHA-specific quality metrics were monitored and showed either small improvements or no change (data not shown).

Satisfaction at Hub and Spoke Sites
After sending two reminder communications via email, the telehospitalist satisfaction survey had a total response rate of 90% (9/10). Telehospitalists were satisfied or very satisfied (89%) with the program and the local providers (88.9%), rating their experience as good or excellent (100%) (Table 3). Communication with patients, families, and local staff was noted as being “positive” or “mostly positive.” Telehospitalists reported confidence in the accuracy of their diagnoses and rated the quality of care as being equal to that of a face-to-face encounter. Connectivity problems were prevalent, although most providers were able to resort to a back-up plan. Other challenges included differences in culture and concerns about liability. We received 27 responses from the spoke-site satisfaction survey; the response rate could not be determined because the survey was distributed by the spoke site for anonymity. Of the respondents, 37% identified as nurses, 25.9% as healthcare providers (APPs or physicians), and 33.3% as other staff (eg, social worker, nutritionist, physical therapist, utilization management, administrators); 3.7% did not respond. Among the participants, 88% had personally interacted with the THS. Most providers and other staff perceived THS as valuable (57.1% and 77.8%, respectively) and were satisfied or highly satisfied with THS (57.1% and 55.6%, respectively). On average, nurses provided lower ratings across all survey items than providers and other staff. Challenges noted by all staff included issues with communication, workflow, and technology/connectivity.

Qualitative Strengths
Our process evaluation identified high quality of care and teamwork as contributors to the success of the program. Overall, staff credited perceived improvements in quality of care to the quality of providers staffing the THS, including the local APPs. Noting the telehospitalists’ knowledge base and level of engagement as key attributes, one staff member commented: “I prefer a telehospitalist that really care[s] about patients than some provider that is physically here but does not engage.” Staff perceived improvements in the continuity of care, as well as care processes such as handoffs and transitions of care.
Improvements in teamwork were perceived compared with the previous model of care. Telehospitalists were lauded for their professionalism and communication skills. Overall, nurses felt providers in the THS listened more to their views. In addition, nurse respondents felt they could learn from several providers and said they enjoyed the telehospitalists’ disposition to teach and discuss patient care. The responsiveness of the THS staff was instrumental in building teamwork and acceptance. A bedside interdisciplinary protocol was established for appropriate patients. Local staff felt this was crucial for teamwork and patient satisfaction. Telehospitalists reported high-value in interdisciplinary rounds, facilitating interaction with nurses and ancillary staff. Handoff problems were identified, leading to QI initiatives to mitigate those issues.
Challenges
The survey identified administrative barriers, technical difficulties, workflow constraints, and clinical concerns. The credentialing process was complicated, delaying the onboarding of telehospitalists. Internet connectivity was inconsistent, leading to disruption in video communications; however, during the sustainability phase, updated technology improved communications. The communication workflow was resisted by some nurses, who wanted to phone the telehospitalist directly rather than having the local APP as the first contact. Secure messaging was enabled to allow nurses direct contact during the sustainability phase.
Workload was a concern among telehospitalists and local staff. Telehospitalists perceived the documentation requirements and administrative workload to be two to three times higher than at other hospitals—despite the lower number of encounters. Finally, clinical concerns from spoke-site clinicians included a perceived rise in the acuity of patients (which was not evident by the Nosos score) and delayed decisions to transfer-out patients. These concerns were addressed with educational sessions for telehospitalists during the sustainability phase.
Additional Quality Improvement Projects
The implementation of THS resulted in QI initiatives at the spoke site, including an EHR-integrated handoff tool; a documentation evaluation that led to the elimination of duplicative, inefficient, and error-prone templates; and a revision of the alcohol withdrawal treatment protocol during the sustainability phase to reduce the use of intravenous benzodiazepines. A more comprehensive benzodiazepine-sparing alcohol withdrawal treatment protocol was also developed but was not implemented until after the study period (January 2020).
DISCUSSION
Our pre-post study evaluation found implementation of a THS to be noninferior to face-to-face care, with no significant change in mortality, readmission rate, or patient satisfaction. The significant improvement observed in LOS is consistent with the adoption of hospitalist models in other medical care settings,11 but had not been reported by previous telehospitalist studies. For example, in their retrospective chart review comparing an NP-supported telehospitalist model to locum tenens hospitalists, Boltz et al found no difference in LOS.31 Moreover, as in our study, they found no differences in readmissions, mortality, and patient satisfaction.31 Similarly, Kuperman et al reported unchanged daily census, LOS, and transfer rates from a CAH with their virtual hospitalist program, but a decrease in the percentage of patients transferred-out from the emergency department, suggesting that more patients were treated locally.19
Reduction in LOS is one of the primary measures of efficiency in hospital care31; reducing LOS while maintaining the quality of care lowers hospital costs. The reduction in LOS in our study could be attributed to greater continuity of care, engagement/experience of the telehospitalists, or other factors. This decrease in LOS and slight reduction in admissions resulted in an overall lower daily census during the study period and impacted efficiency. Our study was unable to determine the cause for the reduction in admissions; however, several concurrent events, including the expansion of community-care options for veterans under the MISSION ACT (Maintaining Internal Systems and Strengthening Integrated Outside Networks Act) in June 2019, a nationwide smoking ban at VA facilities (October 2019), and a modification in the alcohol withdrawal treatment protocol might have influenced veterans’ choice of hospital.
Readmission rates were slightly higher, though nonsignificant, in the postimplementation period. Alcohol-related readmissions accounted for most readmissions; some of the protocol changes, such as admitting all patients with alcohol withdrawal to inpatient class instead of admitting some to the observation class, accounted for part of the increase in readmission rates. Readmission rates for other conditions such as chronic obstructive pulmonary disease, chronic heart failure, or pneumonia were not significantly different, suggesting that the reduction in LOS did not result in an unintended increased readmission rate for those conditions.
Rural hospitals are struggling with staffing and finances. Resorting to locum tenens staffing is costly and can result in variable quality of care.32,33 APPs are increasingly taking on hospitalist positions, with 65% of adult hospitalist programs, including half of all VHA hospitals, employing NPs and PAs.34,35 In response to this expanded scope of practice, hospitals employing APPs in hospitalist roles must comply with state and federal laws, which often require that APPs be supervised by or work in collaboration with an on-site or off-site physician. The THS is a great model to support APPs and address staffing and cost challenges in low-volume rural facilities, while maintaining quality of care. Some APP-telehospitalist programs similar to ours have reported cost reductions of up 58% compared to programs that employ locum tenens physicians.31 In our model, we assume that a single telehospitalist hub could provide coverage to two or three spoke sites with APP support, reducing staffing costs.
Hub telehospitalists reported satisfaction with the program, and they perceived the quality of care to be comparable to face-to-face encounters; their responses were consistent with those previously reported in an evaluation of telemedicine acute care by JaKa et al.
This study has several limitations. First, the VHA is an integrated health system, one that serves an older, predominantly male patient population. Also, the lack of reimbursement and interstate licensing restrictions limit generalizability of these results to other CAHs or healthcare systems. Furthermore, the intervention was limited to a single rural site; while this allowed for a detailed evaluation, unique barriers or facilitators might exist that limit its applicability. In addition, QI initiatives implemented by the VHA during the project period might have confounded some of our results. Last, patient satisfaction survey data are overall limited in their ability to fully assess patient’s experience and satisfaction with the program. Further qualitative studies are needed to gain deeper insight into patient perspectives with the THS and whether modality of care delivery influences patients’ care decisions. Future studies should consider a multisite design with one or more hubs and multiple spoke sites.
CONCLUSION
Telehospitalist services are a feasible and safe approach to provide inpatient services and address staffing needs of rural hospitals. To enhance program performance, it is essential to ensure adequate technological quality, clearly delineate and define roles and responsibilities of the care team, and address communication issues or staff concerns in a timely manner.
Acknowledgments
The authors thank the staff, administration, and leadership at the Tomah and Iowa City VA Medical Centers for working with us on this project. They offer special thanks to Kevin Glenn, MD, MS, Ethan Kuperman, MD, MS, FHM, and Jennifer Chapin, MSN, RN, for sharing their expertise, and the telehealth team, including Nathaniel Samuelson, Angela McDowell, and Katrin Metcalf.
Disclaimer
The views expressed in this article are those of the authors and do not necessarily represent the views of the Department of Veterans Affairs.
1. O’Connor A, Wellenius G. Rural-urban disparities in the prevalence of diabetes and coronary heart disease. Public Health. 2012;126(10):813-820. https://doi.org/10.1016/j.puhe.2012.05.029
2. Kaufman BG, Thomas SR, Randolph RK, et al. The rising rate of rural hospital closures. J Rural Health. 2016;32(1):35-43. https://doi.org/10.1111/jrh.12128
3. MacDowell M, Glasser M, Fitts M, Nielsen K, Hunsaker M. A national view of rural health workforce issues in the USA. Rural Remote Health. 2010;10(3):1531.
4. Joynt KE, Harris Y, Orav EJ, Jha AK. Quality of care and patient outcomes in critical access rural hospitals. JAMA. 2011;306(1):45-52. https://doi.org/10.1001/jama.2011.902
5. The Chartis Group. Chartis Center for Rural Health. The Rural Health Safety Net Under Pressure: Rural Hospital Vulnerability. Published February 2020. Accessed May 07, 2020. https://www.chartis.com/forum/wp-content/uploads/2020/02/CCRH_Vulnerability-Research_FiNAL-02.14.20.pdf
6. Miller KEM, James HJ, Holmes GM, Van Houtven CH. The effect of rural hospital closures on emergency medical service response and transport times. Health Serv Res. 2020;55(2):288-300. https://doi.org/10.1111/1475-6773.13254
7. Buchmueller TC, Jacobson M, Wold C. How far to the hospital? The effect of hospital closures on access to care. J Health Econ. 2006;25(4):740-761. https://doi.org/10.1016/j.jhealeco.2005.10.006
8. Mohr NM, Harland KK, Shane DM, et al. Rural patients with severe sepsis or septic shock who bypass rural hospitals have increased mortality: an instrumental variables approach. Crit Care Med. 2017;45(1):85-93. https://doi.org/10.1097/ccm.0000000000002026
9. Gutierrez J, Kuperman E, Kaboli PJ. Using telehealth as a tool for rural hospitals in the COVID-19 pandemic response. J Rural Health. 2020;10.1111/jrh.12443. https://doi.org/10.1111/jrh.12443
10. Kisuule F, Howell EE. Hospitalists and their impact on quality, patient safety, and satisfaction. Obstet Gynecol Clin North Am. 2015;42(3):433-446. https://doi.org/10.1016/j.ogc.2015.05.003
11. Peterson MC. A systematic review of outcomes and quality measures in adult patients cared for by hospitalists vs nonhospitalists. Mayo Clin Proc. 2009;84(3):248-254. https://doi.org/10.4065/84.3.248
12. Auerbach AD, Wachter RM, Katz P, Showstack J, Baron RB, Goldman L. Implementation of a voluntary hospitalist service at a community teaching hospital: improved clinical efficiency and patient outcomes. Ann Intern Med. 2002;137(11):859-865. https://doi.org/10.7326/0003-4819-137-11-200212030-00006
13. Casey MM, Hung P, Moscovice I, Prasad S. The use of hospitalists by small rural hospitals: results of a national survey. Med Care Res Rev. 2014;71(4):356-366. https://doi.org/10.1177/1077558714533822
14. Sanders RB, Simpson KN, Kazley AS, Giarrizzi DP. New hospital telemedicine services: potential market for a nighttime telehospitalist service. Telemed J E Health. 2014;20(10):902-908. https://doi.org/10.1089/tmj.2013.0344
15. Department of Veterans Affairs. Office of Inspector General. OIG Determination of Veterans Health Administration’s Occupational Staffing Shortages. Published September 30, 2019. Accessed June 15, 2020. https://www.va.gov/oig/pubs/VAOIG-19-00346-241.pdf
16. Gutierrez J, Moeckli J, McAdams N, Kaboli PJ. Perceptions of telehospitalist services to address staffing needs in rural and low complexity hospitals in the Veterans Health Administration. J Rural Health. 2019;36(3):355-359. https://doi.org/10.1111/jrh.12403
17. Eagle Telemedicine. EAGLE TELEMEDICINE NIGHT COVERAGE SOLUTIONS: Why They Work for Hospitals and Physicians. Accessed May 28, 2018. http://www.eagletelemedicine.com/wp-content/uploads/2016/11/EHP_WP_Telenocturnist_FINAL.pdf
18. Gujral J, Antoine C, Chandra S. The role of telehospitalist in COVID-19 response: Hospitalist caring remotely for New York patients explain their role. ACP Hospitalist. 2020; May 2020.
19. Kuperman EF, Linson EL, Klefstad K, Perry E, Glenn K. The virtual hospitalist: a single-site implementation bringing hospitalist coverage to critical access hospitals. J Hosp Med. 2018;13(11):759-763. https://doi.org/10.12788/jhm.3061
20. JaKa MM, Dinh JM, Ziegenfuss JY, et al. Patient and care team perspectives of telemedicine in critical access hospitals. J Hosp Med. 2020;15(6):345-348. https://doi.org/10.12788/jhm.3412
21. Khanal S, Burgon J, Leonard S, Griffiths M, Eddowes LA. Recommendations for the improved effectiveness and reporting of telemedicine programs in developing countries: results of a systematic literature review. Telemed J E Health. 2015;21(11):903-915. https://doi.org/10.1089/tmj.2014.0194
22. Ogrinc G, Davies L, Goodman D, Batalden P, Davidoff F, Stevens D. SQUIRE 2.0 (Standards for QUality Improvement Reporting Excellence): revised publication guidelines from a detailed consensus process. BMJ Qual Saf. 2016;25(12):986-992. https://doi.org/10.1136/bmjqs-2015-004411
23. VHA Office of Rural Health. ORH 2020-2024 STRATEGIC PLAN. In: U.S. Department of Veterans Affairs, ed 2020. Accessed January 18, 2021 https://www.ruralhealth.va.gov/aboutus/index.asp
24. Veterans Health Administration. About VHA. In: U.S. Department of Veterans Affairs, ed. 2019. Accessed January 18, 2021.https://www.va.gov/health/aboutvha.asp
25. GeoSpatial Outcomes Division. VHA Office of Rural Health. U.S. Department of Veterans Affairs. Rural Veterans Health Care Atlas. 2nd ed - FY-2015. Accessed July 30, 2020. https://www.ruralhealth.va.gov/docs/atlas/CHAPTER_02_RHRI_Pts_treated_at_VAMCs.pdf
26. Wagner TH, Upadhyay A, Cowgill E, et al. Risk adjustment tools for learning health systems: a comparison of DxCG and CMS-HCC V21. Health Serv Res. 2016;51(5):2002-2019. https://doi.org/10.1111/1475-6773.12454
27. Wagner T, Stefos T, Moran E, et al. Technical Report 30: Risk Adjustment: Guide to the V21 and Nosos Risk Score Programs. Updated February 8, 2016. Accessed July 30, 2020. https://www.herc.research.va.gov/include/page.asp?id=technical-report-risk-adjustment
28. The R Foundation. The R Project for Statistical Computing. Accessed August 10, 2020. https://www.R-project.org/
29. Cleary PD, Meterko M, Wright SM, Zaslavsky AM. Are comparisons of patient experiences across hospitals fair? A study in Veterans Health Administration hospitals. Med Care. 2014;52(7):619-625. https://doi.org/10.1097/mlr.0000000000000144
30. Giordano LA, Elliott MN, Goldstein E, Lehrman WG, Spencer PA. Development, implementation, and public reporting of the HCAHPS survey. Med Care Res Rev. 2010;67(1):27-37. doi:10.1177/1077558709341065
31. Boltz M, Cuellar NG, Cole C, Pistorese B. Comparing an on-site nurse practitioner with telemedicine physician support hospitalist programme with a traditional physician hospitalist programme. J Telemed and Telecare. 2019;25(4):213-220. https://doi.org/10.1177%2F1357633X18758744
32. Quinn R. The pros and cons of locum tenens for hospitalists. The Hospitalist. 2012(12). Accessed May 29, 2018. https://www.the-hospitalist.org/hospitalist/article/124988/pros-and-cons-locum-tenens-hospitalists
33. Blumenthal DM, Olenski AR, Tsugawa Y, Jena AB. Association between treatment by locum tenens internal medicine physicians and 30-day mortality among hospitalized Medicare beneficiaries. JAMA. 2017;318(21):2119-2129. https://doi.org/10.1001/jama.2017.17925
34. Butcher L. Nurses as hospitalists | AHA Trustee Services. American Hospital Association. Accessed July 14, 2020 https://trustees.aha.org/articles/1238-nurses-as-hospitalists
35. Kartha A, Restuccia JD, Burgess JF, Jr, et al. Nurse practitioner and physician assistant scope of practice in 118 acute care hospitals. J Hosp Med. 2014;9(10):615-620. https://doi.org/10.1002/jhm.2231
Healthcare in rural areas faces increasing challenges due to community hospital closures, physician shortages, and a more concentrated population of older adults with higher rates of comorbid conditions than their urban counterparts.1-3 Critical access hospitals (CAHs), which primarily serve rural areas, have fewer clinical capabilities, worse process-of-care measures, and higher mortality rates for some conditions when compared to non-CAHs.4 As such, CAHs are closing at record numbers across the United States,5 resulting in loss of available hospital beds and patient access to timely emergency services,6 which can worsen outcomes, further widening the rural-urban healthcare gap.7,8 Furthermore, this strain on an overwhelmed health system in the most vulnerable areas restricts the ability to respond to healthcare crises like the coronavirus disease 2019 pandemic.9
Providing adequate staff for currently available hospital beds is also a problem in rural areas. Studies demonstrating improved outcomes, decreased length of stay (LOS), and increased quality with hospitalist services have resulted in a high demand for hospitalists nationwide.10-12 Recruiting hospitalists to work in rural areas, however, has become increasingly challenging due to low-patient volumes, financial viability of hospitalist-model adoption, and provider shortages.13,14 Recently, the Veterans Health Administration (VHA) reported a 28% nationwide shortage of hospitalists,15 which disproportionally affects rural VHA hospitals. Staffing difficulties and reliance on intermittent providers were reported by more than 80% of rural and low-complexity VHA facilities.16
Telehospitalist services (THS) can help deliver high-quality care to rural residents locally, decrease travel expenses, support hospital volume, and increase healthcare capacity in response to a pandemic.14,17,18 Only a few studies have described THS (mostly with overnight or cross-coverage models directed to CAHs), and clinical outcomes have been inconsistently reported.17,19-21 Furthermore, no program has been conducted within an integrated health system akin to the VHA. The primary objective of this quality improvement (QI) initiative was to perform a mixed-methods evaluation of THS between VHA hospitals to compare clinical outcomes and patient and staff satisfaction. Secondary outcomes included description of the implementation process, unexpected challenges, and subsequent QI initiatives. These results will expand the knowledge on feasibility of THS and provide implementation guidance.
METHODS
A mixed-methods approach was used to evaluate outcomes of this QI project. Reporting follows the revised Standards for Quality Improvement Reporting Excellence (SQUIRE 2.0).22
Context
The VHA is the largest integrated healthcare system in the United States, with more than 8 million veterans enrolled, more than 30% of whom reside in a rural area. The VHA comprises more than 1,000 outpatient clinics and 170 acute care VA Medical Centers,23,24 including more than 35 rural and low-complexity hospitals.25 Low-complexity hospitals are those with the lowest volume and levels of patient complexity and minimal or no teaching programs, research, intensive care unit (ICU) beds, and subspecialists. Lack of reimbursement and interstate licensing, often cited as barriers to telemedicine, do not apply to the VHA. The hub site was a large tertiary care (high-complexity) VHA hospital located in Iowa City, Iowa. The spoke site was a low-complexity (10-bed acute inpatient unit with no ICU) rural VA hospital located in Tomah, Wisconsin.
Study Population
The preimplementation cohort for comparison included all patients admitted between January 1, 2018, and January 6, 2019. The postimplementation study cohort included all observation and acute care admissions during the pilot phase (January 7 to May 3, 2019) and sustainability phase (July 15 to December 31, 2019). The postimplementation analysis excluded the time period of May 4 to July 14, 2019, due to an interruption (gap) in THS. The gap period allowed for preliminary data analysis, optimization of the telecommunication system, and the recruitment and training of additional providers who could provide long-term staffing to the service.
Intervention
Preimplementation
Prior to THS implementation, Tomah’s inpatient ward was staffed by one physician per shift, who could be a hospitalist, medical officer of the day (MOD), or an intermittent provider (locum tenens). Hospitalists covering the acute inpatient ward prior to the THS transitioned to cover weekends, nights, and urgent care service shifts.
We visited the spoke site and held information-sharing sessions with key stakeholders (administrators, clinician leaders, nurses, and ancillary staff) prior to kick-off. Recurrent phone meetings addressed anticipated and emerging challenges. Telehospitalist and local providers underwent technology and service training.
Technology and Connectivity
A low-cost technology system using tablet computers provided Health Insurance Portability and Accountability Act–compliant videoconferencing with a telehospitalist at the hub site. An Eko-Core digital stethoscope® with a web-based audio stream was available. Telehospitalists conducted encounters from a private office space with telehealth capabilities. A total of $9,000 was spent on equipment at both sites. Due to connectivity problems and data limits, the tablets were switched to mobile computer-on-wheels workstations and hospital-based Wi-Fi for the sustainability phase.
THS Description
An experienced hub hospitalist, together with an advanced practice provider (APP; nurse practitioner [NP] or physician assistant [PA]), cared for all patients admitted to the 10-bed inpatient unit at the spoke site, Monday through Friday from 8:00 AM to 4:30 PM. The APP had limited or no prior experience in acute inpatient medicine. The telehospitalist worked as a team with the APP. The APP was the main point of contact for nurses, performed physical examinations, and directed patient care to their level of comfort (in a similar manner as a teaching team). The telehospitalist conducted bedside patient rounds, participated in multidisciplinary huddles, and shared clinical documentation and administrative duties with the APP. The telehospitalist was the primary staff for admitted patients and had full access to the electronic health record (EHR). The THS was staffed by 10 hospitalists during the study period. Overnight and weekend cross-coverage and admissions were performed by MODs, who also covered the urgent care and cross-covered other nonmedical units.
Quantitative Evaluation Methods
Workload and Clinical Outcomes
An EHR query identified all patients admitted during the pre- and postimplementation periods. Demographic data, clinical Nosos risk scores,26,27 and top admission diagnoses were reported. Workload was evaluated using the average number of encounters per day and self-reported telehospitalist worksheets, which were cross-referenced with EHR data. Clinical outcomes included LOS, 30-day hospital readmission rate, 30-day standardized mortality (SMR30), in-hospital mortality, and VHA-specific inpatient quality metrics. Independent sample t tests for continuous variables and chi-square tests or Fisher’s exact test (for patient class) for categorical variables were used to compare pre- and postimplementation groups. Statistical process control (SPC) charts evaluated changes over time. All analyses were conducted using Microsoft Excel and R.28
Anonymous surveys were distributed to spoke-site inpatient and administrative staff at 1 month and 12 months postimplementation, assessing satisfaction, technology/connectivity, communication, and challenges (Appendix Figure 1). Satisfaction of the telehospitalist physicians at the hub site was measured 12 months postimplementation by a 26-question survey assessing the same domains, plus quality of care (Appendix Figure 2).
Patient Satisfaction
The VHA Survey of Healthcare Experiences of Patients (SHEP), a version of the Hospital Consumer Assessment of Healthcare Providers and Systems Survey,29,30 was mailed to all patients after discharge. Survey responses concerning inpatient provider care (eg, care coordination, communication, hospital rating, willingness to recommend the hospital) during the pre- and postimplementation phases were compared using a two-sample test of independent proportions. Responses obtained during May and June 2019 were excluded.
Qualitative Evaluation Methods
The authors had full access to, and took full responsibility for, the integrity of the data. The project was evaluated by the University of Iowa Institutional Review Board and the Iowa City VA Research and Development Committee and was determined to be a non–human-subjects QI project.
RESULTS
Quantitative Workload and Clinical Outcomes
There were 822 admissions during the preimplementation period and 550 admissions during the postimplementation period (253 during the pilot and 297 during sustainability phase). Patient characteristics pre- and postimplementation were not significantly different (Table 1). The median patient age was 65 years; 96% of patients were male, and 83% were rural residents. The most common admission diagnosis was alcohol-related (36%); regarding patient disposition, 78% of admissions were discharged home.
Workload
There were 502 patient encounters staffed by the telehospitalist in the pilot phase, with an average of 6.25 encounters per day, and a telehospitalist-reported workload of 7 hours per day. There were 538 patient encounters, with an average of 4.67 encounters per day and a workload of 5.6 hours per day in the sustainability phase. The average daily census decreased from 5.0 (SD, 1.1) patients per day during preimplementation to 3.1 (SD, 0.5) patients per day during postimplementation (Table 2). In some of the months during the study period, admissions decreased below the lower SPC limit, suggesting a significant change (Figure). Adjusted LOS was significantly lower, with 3.0 (SD, 0.7) days vs 2.3 (SD, 0.3) days in the pre- and postimplementation periods, respectively. Bed occupancy rates were significantly lower in the sustainability phase compared with the pilot phase and the preimplementation period. Readmission rates varied, ranging from <10% to >30%, not significantly different but slightly higher in the postimplementation period. Readmission rates for heart failure, chronic obstructive pulmonary disease, and pneumonia remained unchanged; other medical readmissions (mostly alcohol-related) were slightly higher in the postimplementation period.
In-hospital mortality and SMR30 did not change significantly, but there was improvement in the 12-month rolling average of the observed/expected SMR30 from 1.40 to 1.08. Additional VHA-specific quality metrics were monitored and showed either small improvements or no change (data not shown).
Satisfaction at Hub and Spoke Sites
After sending two reminder communications via email, the telehospitalist satisfaction survey had a total response rate of 90% (9/10). Telehospitalists were satisfied or very satisfied (89%) with the program and the local providers (88.9%), rating their experience as good or excellent (100%) (Table 3). Communication with patients, families, and local staff was noted as being “positive” or “mostly positive.” Telehospitalists reported confidence in the accuracy of their diagnoses and rated the quality of care as being equal to that of a face-to-face encounter. Connectivity problems were prevalent, although most providers were able to resort to a back-up plan. Other challenges included differences in culture and concerns about liability. We received 27 responses from the spoke-site satisfaction survey; the response rate could not be determined because the survey was distributed by the spoke site for anonymity. Of the respondents, 37% identified as nurses, 25.9% as healthcare providers (APPs or physicians), and 33.3% as other staff (eg, social worker, nutritionist, physical therapist, utilization management, administrators); 3.7% did not respond. Among the participants, 88% had personally interacted with the THS. Most providers and other staff perceived THS as valuable (57.1% and 77.8%, respectively) and were satisfied or highly satisfied with THS (57.1% and 55.6%, respectively). On average, nurses provided lower ratings across all survey items than providers and other staff. Challenges noted by all staff included issues with communication, workflow, and technology/connectivity.
Qualitative Strengths
Our process evaluation identified high quality of care and teamwork as contributors to the success of the program. Overall, staff credited perceived improvements in quality of care to the quality of providers staffing the THS, including the local APPs. Noting the telehospitalists’ knowledge base and level of engagement as key attributes, one staff member commented: “I prefer a telehospitalist that really care[s] about patients than some provider that is physically here but does not engage.” Staff perceived improvements in the continuity of care, as well as care processes such as handoffs and transitions of care.
Improvements in teamwork were perceived compared with the previous model of care. Telehospitalists were lauded for their professionalism and communication skills. Overall, nurses felt providers in the THS listened more to their views. In addition, nurse respondents felt they could learn from several providers and said they enjoyed the telehospitalists’ disposition to teach and discuss patient care. The responsiveness of the THS staff was instrumental in building teamwork and acceptance. A bedside interdisciplinary protocol was established for appropriate patients. Local staff felt this was crucial for teamwork and patient satisfaction. Telehospitalists reported high-value in interdisciplinary rounds, facilitating interaction with nurses and ancillary staff. Handoff problems were identified, leading to QI initiatives to mitigate those issues.
Challenges
The survey identified administrative barriers, technical difficulties, workflow constraints, and clinical concerns. The credentialing process was complicated, delaying the onboarding of telehospitalists. Internet connectivity was inconsistent, leading to disruption in video communications; however, during the sustainability phase, updated technology improved communications. The communication workflow was resisted by some nurses, who wanted to phone the telehospitalist directly rather than having the local APP as the first contact. Secure messaging was enabled to allow nurses direct contact during the sustainability phase.
Workload was a concern among telehospitalists and local staff. Telehospitalists perceived the documentation requirements and administrative workload to be two to three times higher than at other hospitals—despite the lower number of encounters. Finally, clinical concerns from spoke-site clinicians included a perceived rise in the acuity of patients (which was not evident by the Nosos score) and delayed decisions to transfer-out patients. These concerns were addressed with educational sessions for telehospitalists during the sustainability phase.
Additional Quality Improvement Projects
The implementation of THS resulted in QI initiatives at the spoke site, including an EHR-integrated handoff tool; a documentation evaluation that led to the elimination of duplicative, inefficient, and error-prone templates; and a revision of the alcohol withdrawal treatment protocol during the sustainability phase to reduce the use of intravenous benzodiazepines. A more comprehensive benzodiazepine-sparing alcohol withdrawal treatment protocol was also developed but was not implemented until after the study period (January 2020).
DISCUSSION
Our pre-post study evaluation found implementation of a THS to be noninferior to face-to-face care, with no significant change in mortality, readmission rate, or patient satisfaction. The significant improvement observed in LOS is consistent with the adoption of hospitalist models in other medical care settings,11 but had not been reported by previous telehospitalist studies. For example, in their retrospective chart review comparing an NP-supported telehospitalist model to locum tenens hospitalists, Boltz et al found no difference in LOS.31 Moreover, as in our study, they found no differences in readmissions, mortality, and patient satisfaction.31 Similarly, Kuperman et al reported unchanged daily census, LOS, and transfer rates from a CAH with their virtual hospitalist program, but a decrease in the percentage of patients transferred-out from the emergency department, suggesting that more patients were treated locally.19
Reduction in LOS is one of the primary measures of efficiency in hospital care31; reducing LOS while maintaining the quality of care lowers hospital costs. The reduction in LOS in our study could be attributed to greater continuity of care, engagement/experience of the telehospitalists, or other factors. This decrease in LOS and slight reduction in admissions resulted in an overall lower daily census during the study period and impacted efficiency. Our study was unable to determine the cause for the reduction in admissions; however, several concurrent events, including the expansion of community-care options for veterans under the MISSION ACT (Maintaining Internal Systems and Strengthening Integrated Outside Networks Act) in June 2019, a nationwide smoking ban at VA facilities (October 2019), and a modification in the alcohol withdrawal treatment protocol might have influenced veterans’ choice of hospital.
Readmission rates were slightly higher, though nonsignificant, in the postimplementation period. Alcohol-related readmissions accounted for most readmissions; some of the protocol changes, such as admitting all patients with alcohol withdrawal to inpatient class instead of admitting some to the observation class, accounted for part of the increase in readmission rates. Readmission rates for other conditions such as chronic obstructive pulmonary disease, chronic heart failure, or pneumonia were not significantly different, suggesting that the reduction in LOS did not result in an unintended increased readmission rate for those conditions.
Rural hospitals are struggling with staffing and finances. Resorting to locum tenens staffing is costly and can result in variable quality of care.32,33 APPs are increasingly taking on hospitalist positions, with 65% of adult hospitalist programs, including half of all VHA hospitals, employing NPs and PAs.34,35 In response to this expanded scope of practice, hospitals employing APPs in hospitalist roles must comply with state and federal laws, which often require that APPs be supervised by or work in collaboration with an on-site or off-site physician. The THS is a great model to support APPs and address staffing and cost challenges in low-volume rural facilities, while maintaining quality of care. Some APP-telehospitalist programs similar to ours have reported cost reductions of up 58% compared to programs that employ locum tenens physicians.31 In our model, we assume that a single telehospitalist hub could provide coverage to two or three spoke sites with APP support, reducing staffing costs.
Hub telehospitalists reported satisfaction with the program, and they perceived the quality of care to be comparable to face-to-face encounters; their responses were consistent with those previously reported in an evaluation of telemedicine acute care by JaKa et al.
This study has several limitations. First, the VHA is an integrated health system, one that serves an older, predominantly male patient population. Also, the lack of reimbursement and interstate licensing restrictions limit generalizability of these results to other CAHs or healthcare systems. Furthermore, the intervention was limited to a single rural site; while this allowed for a detailed evaluation, unique barriers or facilitators might exist that limit its applicability. In addition, QI initiatives implemented by the VHA during the project period might have confounded some of our results. Last, patient satisfaction survey data are overall limited in their ability to fully assess patient’s experience and satisfaction with the program. Further qualitative studies are needed to gain deeper insight into patient perspectives with the THS and whether modality of care delivery influences patients’ care decisions. Future studies should consider a multisite design with one or more hubs and multiple spoke sites.
CONCLUSION
Telehospitalist services are a feasible and safe approach to provide inpatient services and address staffing needs of rural hospitals. To enhance program performance, it is essential to ensure adequate technological quality, clearly delineate and define roles and responsibilities of the care team, and address communication issues or staff concerns in a timely manner.
Acknowledgments
The authors thank the staff, administration, and leadership at the Tomah and Iowa City VA Medical Centers for working with us on this project. They offer special thanks to Kevin Glenn, MD, MS, Ethan Kuperman, MD, MS, FHM, and Jennifer Chapin, MSN, RN, for sharing their expertise, and the telehealth team, including Nathaniel Samuelson, Angela McDowell, and Katrin Metcalf.
Disclaimer
The views expressed in this article are those of the authors and do not necessarily represent the views of the Department of Veterans Affairs.
1. O’Connor A, Wellenius G. Rural-urban disparities in the prevalence of diabetes and coronary heart disease. Public Health. 2012;126(10):813-820. https://doi.org/10.1016/j.puhe.2012.05.029
2. Kaufman BG, Thomas SR, Randolph RK, et al. The rising rate of rural hospital closures. J Rural Health. 2016;32(1):35-43. https://doi.org/10.1111/jrh.12128
3. MacDowell M, Glasser M, Fitts M, Nielsen K, Hunsaker M. A national view of rural health workforce issues in the USA. Rural Remote Health. 2010;10(3):1531.
4. Joynt KE, Harris Y, Orav EJ, Jha AK. Quality of care and patient outcomes in critical access rural hospitals. JAMA. 2011;306(1):45-52. https://doi.org/10.1001/jama.2011.902
5. The Chartis Group. Chartis Center for Rural Health. The Rural Health Safety Net Under Pressure: Rural Hospital Vulnerability. Published February 2020. Accessed May 07, 2020. https://www.chartis.com/forum/wp-content/uploads/2020/02/CCRH_Vulnerability-Research_FiNAL-02.14.20.pdf
6. Miller KEM, James HJ, Holmes GM, Van Houtven CH. The effect of rural hospital closures on emergency medical service response and transport times. Health Serv Res. 2020;55(2):288-300. https://doi.org/10.1111/1475-6773.13254
7. Buchmueller TC, Jacobson M, Wold C. How far to the hospital? The effect of hospital closures on access to care. J Health Econ. 2006;25(4):740-761. https://doi.org/10.1016/j.jhealeco.2005.10.006
8. Mohr NM, Harland KK, Shane DM, et al. Rural patients with severe sepsis or septic shock who bypass rural hospitals have increased mortality: an instrumental variables approach. Crit Care Med. 2017;45(1):85-93. https://doi.org/10.1097/ccm.0000000000002026
9. Gutierrez J, Kuperman E, Kaboli PJ. Using telehealth as a tool for rural hospitals in the COVID-19 pandemic response. J Rural Health. 2020;10.1111/jrh.12443. https://doi.org/10.1111/jrh.12443
10. Kisuule F, Howell EE. Hospitalists and their impact on quality, patient safety, and satisfaction. Obstet Gynecol Clin North Am. 2015;42(3):433-446. https://doi.org/10.1016/j.ogc.2015.05.003
11. Peterson MC. A systematic review of outcomes and quality measures in adult patients cared for by hospitalists vs nonhospitalists. Mayo Clin Proc. 2009;84(3):248-254. https://doi.org/10.4065/84.3.248
12. Auerbach AD, Wachter RM, Katz P, Showstack J, Baron RB, Goldman L. Implementation of a voluntary hospitalist service at a community teaching hospital: improved clinical efficiency and patient outcomes. Ann Intern Med. 2002;137(11):859-865. https://doi.org/10.7326/0003-4819-137-11-200212030-00006
13. Casey MM, Hung P, Moscovice I, Prasad S. The use of hospitalists by small rural hospitals: results of a national survey. Med Care Res Rev. 2014;71(4):356-366. https://doi.org/10.1177/1077558714533822
14. Sanders RB, Simpson KN, Kazley AS, Giarrizzi DP. New hospital telemedicine services: potential market for a nighttime telehospitalist service. Telemed J E Health. 2014;20(10):902-908. https://doi.org/10.1089/tmj.2013.0344
15. Department of Veterans Affairs. Office of Inspector General. OIG Determination of Veterans Health Administration’s Occupational Staffing Shortages. Published September 30, 2019. Accessed June 15, 2020. https://www.va.gov/oig/pubs/VAOIG-19-00346-241.pdf
16. Gutierrez J, Moeckli J, McAdams N, Kaboli PJ. Perceptions of telehospitalist services to address staffing needs in rural and low complexity hospitals in the Veterans Health Administration. J Rural Health. 2019;36(3):355-359. https://doi.org/10.1111/jrh.12403
17. Eagle Telemedicine. EAGLE TELEMEDICINE NIGHT COVERAGE SOLUTIONS: Why They Work for Hospitals and Physicians. Accessed May 28, 2018. http://www.eagletelemedicine.com/wp-content/uploads/2016/11/EHP_WP_Telenocturnist_FINAL.pdf
18. Gujral J, Antoine C, Chandra S. The role of telehospitalist in COVID-19 response: Hospitalist caring remotely for New York patients explain their role. ACP Hospitalist. 2020; May 2020.
19. Kuperman EF, Linson EL, Klefstad K, Perry E, Glenn K. The virtual hospitalist: a single-site implementation bringing hospitalist coverage to critical access hospitals. J Hosp Med. 2018;13(11):759-763. https://doi.org/10.12788/jhm.3061
20. JaKa MM, Dinh JM, Ziegenfuss JY, et al. Patient and care team perspectives of telemedicine in critical access hospitals. J Hosp Med. 2020;15(6):345-348. https://doi.org/10.12788/jhm.3412
21. Khanal S, Burgon J, Leonard S, Griffiths M, Eddowes LA. Recommendations for the improved effectiveness and reporting of telemedicine programs in developing countries: results of a systematic literature review. Telemed J E Health. 2015;21(11):903-915. https://doi.org/10.1089/tmj.2014.0194
22. Ogrinc G, Davies L, Goodman D, Batalden P, Davidoff F, Stevens D. SQUIRE 2.0 (Standards for QUality Improvement Reporting Excellence): revised publication guidelines from a detailed consensus process. BMJ Qual Saf. 2016;25(12):986-992. https://doi.org/10.1136/bmjqs-2015-004411
23. VHA Office of Rural Health. ORH 2020-2024 STRATEGIC PLAN. In: U.S. Department of Veterans Affairs, ed 2020. Accessed January 18, 2021 https://www.ruralhealth.va.gov/aboutus/index.asp
24. Veterans Health Administration. About VHA. In: U.S. Department of Veterans Affairs, ed. 2019. Accessed January 18, 2021.https://www.va.gov/health/aboutvha.asp
25. GeoSpatial Outcomes Division. VHA Office of Rural Health. U.S. Department of Veterans Affairs. Rural Veterans Health Care Atlas. 2nd ed - FY-2015. Accessed July 30, 2020. https://www.ruralhealth.va.gov/docs/atlas/CHAPTER_02_RHRI_Pts_treated_at_VAMCs.pdf
26. Wagner TH, Upadhyay A, Cowgill E, et al. Risk adjustment tools for learning health systems: a comparison of DxCG and CMS-HCC V21. Health Serv Res. 2016;51(5):2002-2019. https://doi.org/10.1111/1475-6773.12454
27. Wagner T, Stefos T, Moran E, et al. Technical Report 30: Risk Adjustment: Guide to the V21 and Nosos Risk Score Programs. Updated February 8, 2016. Accessed July 30, 2020. https://www.herc.research.va.gov/include/page.asp?id=technical-report-risk-adjustment
28. The R Foundation. The R Project for Statistical Computing. Accessed August 10, 2020. https://www.R-project.org/
29. Cleary PD, Meterko M, Wright SM, Zaslavsky AM. Are comparisons of patient experiences across hospitals fair? A study in Veterans Health Administration hospitals. Med Care. 2014;52(7):619-625. https://doi.org/10.1097/mlr.0000000000000144
30. Giordano LA, Elliott MN, Goldstein E, Lehrman WG, Spencer PA. Development, implementation, and public reporting of the HCAHPS survey. Med Care Res Rev. 2010;67(1):27-37. doi:10.1177/1077558709341065
31. Boltz M, Cuellar NG, Cole C, Pistorese B. Comparing an on-site nurse practitioner with telemedicine physician support hospitalist programme with a traditional physician hospitalist programme. J Telemed and Telecare. 2019;25(4):213-220. https://doi.org/10.1177%2F1357633X18758744
32. Quinn R. The pros and cons of locum tenens for hospitalists. The Hospitalist. 2012(12). Accessed May 29, 2018. https://www.the-hospitalist.org/hospitalist/article/124988/pros-and-cons-locum-tenens-hospitalists
33. Blumenthal DM, Olenski AR, Tsugawa Y, Jena AB. Association between treatment by locum tenens internal medicine physicians and 30-day mortality among hospitalized Medicare beneficiaries. JAMA. 2017;318(21):2119-2129. https://doi.org/10.1001/jama.2017.17925
34. Butcher L. Nurses as hospitalists | AHA Trustee Services. American Hospital Association. Accessed July 14, 2020 https://trustees.aha.org/articles/1238-nurses-as-hospitalists
35. Kartha A, Restuccia JD, Burgess JF, Jr, et al. Nurse practitioner and physician assistant scope of practice in 118 acute care hospitals. J Hosp Med. 2014;9(10):615-620. https://doi.org/10.1002/jhm.2231
© 2021 Society of Hospital Medicine
Management of Do Not Resuscitate Orders Before Invasive Procedures
In January 2017, the US Department of Veterans Affairs (VA), led by the National Center of Ethics in Health Care, created the Life-Sustaining Treatment Decisions Initiative (LSTDI). The VA gradually implemented the LSTDI in its facilities nationwide. In a format similar to the standardized form of portable medical orders, provider orders for life-sustaining treatments (POLST), the initiative promotes discussions with veterans and encourages but does not require health care professionals (HCPs) to complete a template for documentation (life-sustaining treatment [LST] note) of a patient’s preferences.1 The HCP enters a code status into the electronic health record (EHR), creating a portable and durable note and order.
With a new durable code status, the HCPs performing these procedures (eg, colonoscopies, coronary catheterization, or percutaneous biopsies) need to acknowledge and can potentially rescind a do not resuscitate (DNR) order. Although the risk of cardiac arrest or intubation is low, all invasive procedures carry these risks to some degree.2,3 Some HCPs advocate the automatic discontinuation of DNR orders before any procedure, but multiple professional societies recommend that patients be included in these discussions to honor their wishes.4-7 Although no procedures at the VA require the suspension of a DNR status, it is important to establish which life-sustaining measures are acceptable to patients.
As part of the informed consent process, proceduralists (HCPs who perform a procedure) should discuss the option of temporary suspension of DNR in the periprocedural period and document the outcome of this discussion (eg, rescinded DNR, acknowledgment of continued DNR status). These discussions need to be documented clearly to ensure accurate communication with other HCPs, particularly those caring for the patient postprocedure. Without the documentation, the risk that the patient’s wishes will not be honored is high.8 Code status is usually addressed before intubation of general anesthesia; however, nonsurgical procedures have a lower likelihood of DNR acknowledgment.
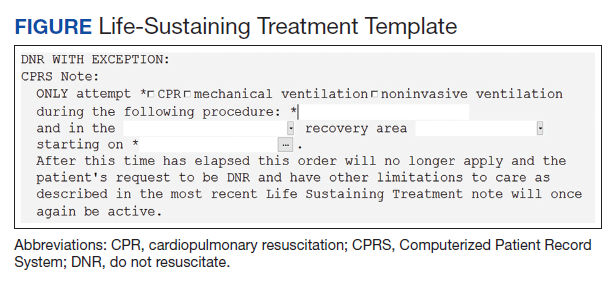
This study aimed to examine and improve the rate of acknowledgment of DNR status before nonsurgical procedures. We hypothesized that the rate of DNR acknowledgment before nonsurgical invasive procedures is low; and the rate can be raised with an intervention designed to educate proceduralists and improve and simplify this documentation.9
Methods
This was a single center, before/after quasi-experimental study. The study was considered clinical operations and institutional review board approval was unnecessary.
A retrospective chart review was performed of patients who underwent an inpatient or outpatient, nonsurgical invasive procedure at the Minneapolis VA Medical Center in Minnesota. The preintervention period was defined as the first 6 months after implementation of the LSTDI between May 8, 2018 and October 31, 2018. The intervention was presented in December 2018 and January 2019. The postintervention period was from February 1, 2019 to April 30, 2019.
Patients who underwent a nonsurgical invasive procedure were reviewed in 3 procedural areas. These areas were chosen based on high patient volumes and the need for rapid patient turnover, including gastroenterology, cardiology, and interventional radiology. An invasive procedure was defined as any procedure requiring patient consent. Those patients who had a completed LST note and who had a DNR order were recorded.
The intervention was composed of 2 elements: (1) an addendum to the LST note, which temporarily suspended resuscitation orders (Figure). We developed the addendum based on templates and orders in use before LSTDI implementation. Physicians from the procedural areas reviewed the addendum and provided feedback and the facility chief-of-staff provided approval. Part 2 was an educational presentation to proceduralists in each procedural area. The presentation included a brief introduction to the LSTDI, where to find a life-sustaining treatment note, code status, the importance of addressing code status, and a description of the addendum. The proceduralists were advised to use the addendum only after discussion with the patient and obtaining verbal consent for DNR suspension. If the patient elected to remain DNR, proceduralists were encouraged to document the conversation acknowledging the DNR.
Outcomes
The primary outcome of the study was proceduralist acknowledgment of DNR status before nonsurgical invasive procedures. DNR status was considered acknowledged if the proceduralist provided any type of documentation.
Statistical Analysis
Model predicted percentages of DNR acknowledgment are reported from a logistic regression model with both procedural area, time (before vs after) and the interaction between these 2 variables in the model. The simple main effects comparing before vs after within the procedural area based on post hoc contrasts of the interaction term also are shown.
Results
During the first 6 months following LSTDI implementation (the preintervention phase), 5,362 invasive procedures were performed in gastroenterology, interventional radiology, and cardiology. A total of 211 procedures were performed on patients who had a prior LST note indicating DNR. Of those, 68 (32.2%) had documentation acknowledging their DNR status. The educational presentation was given to each of the 3 departments with about 75% faculty attendance in each department. After the intervention, 1,932 invasive procedures were performed, identifying 143 LST notes with a DNR status. Sixty-five (45.5%) had documentation of a discussion regarding their DNR status.
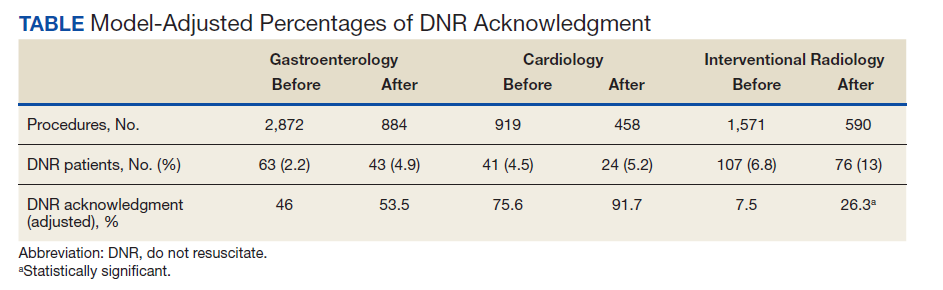
The interaction between procedural areas and time (before, after) was examined. Of the 3 procedural areas, only interventional radiology had significant differences before vs after, 7.5% vs 26.3%, respectively (P = .01). Model-adjusted percentages before vs after for cardiology were 75.6% vs 91.7% (P = .12) and for gastroenterology were 46% vs 53.5% (P = .40) (Table). When all 3 procedural areas were combined, there was a significant improvement in the overall percentage of DNR acknowledgment postintervention from 38.6% to 61.1.% (P = .01).
Discussion
With the LSTDI, DNR orders remain in place and are valid in the inpatient and outpatient setting until reversed by the patient. This creates new challenges for proceduralists. Before our intervention, only about one-third of proceduralists’ recognized DNR status before procedures. This low rate of preprocedural DNR acknowledgments is not unique to the VA. A pilot study assessing rate of documentation of code status discussions in patients undergoing venting gastrostomy tube for malignant bowel obstruction showed documentation in only 22% of cases before the procedure.10 Another simulation-based study of anesthesiologist showed only 57% of subjects addressed resuscitation before starting the procedure.11
Despite the low initial rates of DNR acknowledgment, our intervention successfully improved these rates, although with variation between procedural areas. Prior studies looking at improving adherence to guidelines have shown the benefit of physician education.12,13 Improving code status acknowledgment before an invasive procedure not only involves increasing awareness of a preexisting code status, but also developing a system to incorporate the documentation process efficiently into the procedural workflow and ensuring that providers are aware of the appropriate process. Although the largest improvement was in interventional radiology, many patients postintervention still did not have their DNR orders acknowledged. Confusion is created when the patient is cared for by a different HCP or when the resuscitation team is called during a cardiac arrest. Cardiopulmonary resuscitation may be started or withheld incorrectly if the patient’s most recent wishes for resuscitation are unclear.14
Outside of using education to raise awareness, other improvements could utilize informatics solutions, such as developing an alert on opening a patient chart if a DNR status exists (such as a pop-up screen) or adding code status as an item to a preprocedural checklist. Similar to our study, previous studies also have found that a systematic approach with guidelines and templates improved rates of documentation of code status and DNR decisions.15,16 A large proportion of the LST notes and procedures done on patients with a DNR in our study occurred in the inpatient setting without any involvement of the primary care provider in the discussion. Having an automated way to alert the primary care provider that a new LST note has been completed may be helpful in guiding future care. Future work could identify additional systematic methods to increase acknowledgment of DNR.
Limitations
Our single-center results may not be generalizable. Although the interaction between procedural area and time was tested, it is possible that improvement in DNR acknowledgment was attributable to secular trends and not the intervention. Other limitations included the decreased generalizability of a VA health care initiative and its unique electronic health record, incomplete attendance rates at our educational sessions, and a lack of patient-centered outcomes.
Conclusions
A templated addendum combined with targeted staff education improved the percentage of DNR acknowledgments before nonsurgical invasive procedures, an important step in establishing patient preferences for life-sustaining treatment in procedures with potential complications. Further research is needed to assess whether these improvements also lead to improved patient-centered outcomes.
Acknowledgments
The authors would like to acknowledge the invaluable help of Dr. Kathryn Rice and Dr. Anne Melzer for their guidance in the manuscript revision process
1. Physician Orders for Life-Sustaining Treatment Paradigm. Honoring the wishes of those with serious illness and frailty. Accessed January 11, 2021.
2. Arepally A, Oechsle D, Kirkwood S, Savader S. Safety of conscious sedation in interventional radiology. Cardiovasc Intervent Radiol. 2001;24(3):185-190. doi:10.1007/s002700002549
3. Arrowsmith J, Gertsman B, Fleischer D, Benjamin S. Results from the American Society for Gastrointestinal Endoscopy/U.S. Food and Drug Administration collaborative study on complication rates and drug use during gastrointestinal endoscopy. Gastrointest Endosc. 1991;37(4):421-427. doi:10.1016/s0016-5107(91)70773-6
4. Burkle C, Swetz K, Armstrong M, Keegan M. Patient and doctor attitudes and beliefs concerning perioperative do not resuscitate orders: anesthesiologists’ growing compliance with patient autonomy and self-determination guidelines. BMC Anesthesiol. 2013;13:2. doi:10.1186/1471-2253-13-2
5. American College of Surgeons. Statement on advance directives by patients: “do not resuscitate” in the operative room. Published January 3, 2014. Accessed January 11, 2021. https://bulletin.facs.org/2014/01/statement-on-advance-directives-by-patients-do-not-resuscitate-in-the-operating-room
6. Association of periOperative Registered Nurses. AORN position statement on perioperative care of patients with do-not-resuscitate or allow-natural death orders. Reaffirmed February 2020. Accessed June 16, 2020. https://www.aorn.org/guidelines/clinical-resources/position-statements
7. Bastron DR. Ethical guidelines for the anesthesia care of patients with do-not-resuscitate orders or other directives that limit treatment. Published 1996. Accessed January 11, 2021. https://pubs.asahq.org/anesthesiology/article/85/5/1190/35862/Ethical-Concerns-in-Anesthetic-Care-for-Patients
8. Baxter L, Hancox J, King B, Powell A, Tolley T. Stop! Patients receiving CPR despite valid DNACPR documentation. Eur J Pall Car. 2018;23(3):125-127.
9. Agency for Healthcare Research and Quality. Practice facilitation handbook, module 10: academic detailing as a quality improvement tool. Last reviewed May 2013. Accessed January 11, 2021. 2021. https://www.ahrq.gov/ncepcr/tools/pf-handbook/mod10.html
10. Urman R, Lilley E, Changala M, Lindvall C, Hepner D, Bader A. A pilot study to evaluate compliance with guidelines for preprocedural reconsideration of code status limitations. J Palliat Med. 2018;21(8):1152-1156. doi:10.1089/jpm.2017.0601
11. Waisel D, Simon R, Truog R, Baboolal H, Raemer D. Anesthesiologist management of perioperative do-not-resuscitate orders: a simulation-based experiment. Simul Healthc. 2009;4(2):70-76. doi:10.1097/SIH.0b013e31819e137b
12. Lozano P, Finkelstein J, Carey V, et al. A multisite randomized trial of the effects of physician education and organizational change in chronic-asthma care. Arch Pediatr Adolesc Med. 2004;158(9):875-883. doi:10.1001/archpedi.158.9.875
13. Brunström M, Ng N, Dahlström J, et al. Association of physician education and feedback on hypertension management with patient blood pressure and hypertension control. JAMA Netw Open. 2020;3(1):e1918625. doi:10.1001/jamanetworkopen.2019.18625
14. Wong J, Duane P, Ingraham N. A case series of patients who were do not resuscitate but underwent cardiopulmonary resuscitation. Resuscitation. 2020;146:145-146. doi:10.1016/j.resuscitation.2019.11.020
15. Mittelberger J, Lo B, Martin D, Uhlmann R. Impact of a procedure-specific do not resuscitate order form on documentation of do not resuscitate orders. Arch Intern Med. 1993;153(2):228-232.
16. Neubauer M, Taniguchi C, Hoverman J. Improving incidence of code status documentation through process and discipline. J Oncol Pract. 2015;11(2):e263-266. doi:10.1200/JOP.2014.001438
In January 2017, the US Department of Veterans Affairs (VA), led by the National Center of Ethics in Health Care, created the Life-Sustaining Treatment Decisions Initiative (LSTDI). The VA gradually implemented the LSTDI in its facilities nationwide. In a format similar to the standardized form of portable medical orders, provider orders for life-sustaining treatments (POLST), the initiative promotes discussions with veterans and encourages but does not require health care professionals (HCPs) to complete a template for documentation (life-sustaining treatment [LST] note) of a patient’s preferences.1 The HCP enters a code status into the electronic health record (EHR), creating a portable and durable note and order.
With a new durable code status, the HCPs performing these procedures (eg, colonoscopies, coronary catheterization, or percutaneous biopsies) need to acknowledge and can potentially rescind a do not resuscitate (DNR) order. Although the risk of cardiac arrest or intubation is low, all invasive procedures carry these risks to some degree.2,3 Some HCPs advocate the automatic discontinuation of DNR orders before any procedure, but multiple professional societies recommend that patients be included in these discussions to honor their wishes.4-7 Although no procedures at the VA require the suspension of a DNR status, it is important to establish which life-sustaining measures are acceptable to patients.
As part of the informed consent process, proceduralists (HCPs who perform a procedure) should discuss the option of temporary suspension of DNR in the periprocedural period and document the outcome of this discussion (eg, rescinded DNR, acknowledgment of continued DNR status). These discussions need to be documented clearly to ensure accurate communication with other HCPs, particularly those caring for the patient postprocedure. Without the documentation, the risk that the patient’s wishes will not be honored is high.8 Code status is usually addressed before intubation of general anesthesia; however, nonsurgical procedures have a lower likelihood of DNR acknowledgment.
This study aimed to examine and improve the rate of acknowledgment of DNR status before nonsurgical procedures. We hypothesized that the rate of DNR acknowledgment before nonsurgical invasive procedures is low; and the rate can be raised with an intervention designed to educate proceduralists and improve and simplify this documentation.9
Methods
This was a single center, before/after quasi-experimental study. The study was considered clinical operations and institutional review board approval was unnecessary.
A retrospective chart review was performed of patients who underwent an inpatient or outpatient, nonsurgical invasive procedure at the Minneapolis VA Medical Center in Minnesota. The preintervention period was defined as the first 6 months after implementation of the LSTDI between May 8, 2018 and October 31, 2018. The intervention was presented in December 2018 and January 2019. The postintervention period was from February 1, 2019 to April 30, 2019.
Patients who underwent a nonsurgical invasive procedure were reviewed in 3 procedural areas. These areas were chosen based on high patient volumes and the need for rapid patient turnover, including gastroenterology, cardiology, and interventional radiology. An invasive procedure was defined as any procedure requiring patient consent. Those patients who had a completed LST note and who had a DNR order were recorded.
The intervention was composed of 2 elements: (1) an addendum to the LST note, which temporarily suspended resuscitation orders (Figure). We developed the addendum based on templates and orders in use before LSTDI implementation. Physicians from the procedural areas reviewed the addendum and provided feedback and the facility chief-of-staff provided approval. Part 2 was an educational presentation to proceduralists in each procedural area. The presentation included a brief introduction to the LSTDI, where to find a life-sustaining treatment note, code status, the importance of addressing code status, and a description of the addendum. The proceduralists were advised to use the addendum only after discussion with the patient and obtaining verbal consent for DNR suspension. If the patient elected to remain DNR, proceduralists were encouraged to document the conversation acknowledging the DNR.
Outcomes
The primary outcome of the study was proceduralist acknowledgment of DNR status before nonsurgical invasive procedures. DNR status was considered acknowledged if the proceduralist provided any type of documentation.
Statistical Analysis
Model predicted percentages of DNR acknowledgment are reported from a logistic regression model with both procedural area, time (before vs after) and the interaction between these 2 variables in the model. The simple main effects comparing before vs after within the procedural area based on post hoc contrasts of the interaction term also are shown.
Results
During the first 6 months following LSTDI implementation (the preintervention phase), 5,362 invasive procedures were performed in gastroenterology, interventional radiology, and cardiology. A total of 211 procedures were performed on patients who had a prior LST note indicating DNR. Of those, 68 (32.2%) had documentation acknowledging their DNR status. The educational presentation was given to each of the 3 departments with about 75% faculty attendance in each department. After the intervention, 1,932 invasive procedures were performed, identifying 143 LST notes with a DNR status. Sixty-five (45.5%) had documentation of a discussion regarding their DNR status.
The interaction between procedural areas and time (before, after) was examined. Of the 3 procedural areas, only interventional radiology had significant differences before vs after, 7.5% vs 26.3%, respectively (P = .01). Model-adjusted percentages before vs after for cardiology were 75.6% vs 91.7% (P = .12) and for gastroenterology were 46% vs 53.5% (P = .40) (Table). When all 3 procedural areas were combined, there was a significant improvement in the overall percentage of DNR acknowledgment postintervention from 38.6% to 61.1.% (P = .01).
Discussion
With the LSTDI, DNR orders remain in place and are valid in the inpatient and outpatient setting until reversed by the patient. This creates new challenges for proceduralists. Before our intervention, only about one-third of proceduralists’ recognized DNR status before procedures. This low rate of preprocedural DNR acknowledgments is not unique to the VA. A pilot study assessing rate of documentation of code status discussions in patients undergoing venting gastrostomy tube for malignant bowel obstruction showed documentation in only 22% of cases before the procedure.10 Another simulation-based study of anesthesiologist showed only 57% of subjects addressed resuscitation before starting the procedure.11
Despite the low initial rates of DNR acknowledgment, our intervention successfully improved these rates, although with variation between procedural areas. Prior studies looking at improving adherence to guidelines have shown the benefit of physician education.12,13 Improving code status acknowledgment before an invasive procedure not only involves increasing awareness of a preexisting code status, but also developing a system to incorporate the documentation process efficiently into the procedural workflow and ensuring that providers are aware of the appropriate process. Although the largest improvement was in interventional radiology, many patients postintervention still did not have their DNR orders acknowledged. Confusion is created when the patient is cared for by a different HCP or when the resuscitation team is called during a cardiac arrest. Cardiopulmonary resuscitation may be started or withheld incorrectly if the patient’s most recent wishes for resuscitation are unclear.14
Outside of using education to raise awareness, other improvements could utilize informatics solutions, such as developing an alert on opening a patient chart if a DNR status exists (such as a pop-up screen) or adding code status as an item to a preprocedural checklist. Similar to our study, previous studies also have found that a systematic approach with guidelines and templates improved rates of documentation of code status and DNR decisions.15,16 A large proportion of the LST notes and procedures done on patients with a DNR in our study occurred in the inpatient setting without any involvement of the primary care provider in the discussion. Having an automated way to alert the primary care provider that a new LST note has been completed may be helpful in guiding future care. Future work could identify additional systematic methods to increase acknowledgment of DNR.
Limitations
Our single-center results may not be generalizable. Although the interaction between procedural area and time was tested, it is possible that improvement in DNR acknowledgment was attributable to secular trends and not the intervention. Other limitations included the decreased generalizability of a VA health care initiative and its unique electronic health record, incomplete attendance rates at our educational sessions, and a lack of patient-centered outcomes.
Conclusions
A templated addendum combined with targeted staff education improved the percentage of DNR acknowledgments before nonsurgical invasive procedures, an important step in establishing patient preferences for life-sustaining treatment in procedures with potential complications. Further research is needed to assess whether these improvements also lead to improved patient-centered outcomes.
Acknowledgments
The authors would like to acknowledge the invaluable help of Dr. Kathryn Rice and Dr. Anne Melzer for their guidance in the manuscript revision process
1. Physician Orders for Life-Sustaining Treatment Paradigm. Honoring the wishes of those with serious illness and frailty. Accessed January 11, 2021.
2. Arepally A, Oechsle D, Kirkwood S, Savader S. Safety of conscious sedation in interventional radiology. Cardiovasc Intervent Radiol. 2001;24(3):185-190. doi:10.1007/s002700002549
3. Arrowsmith J, Gertsman B, Fleischer D, Benjamin S. Results from the American Society for Gastrointestinal Endoscopy/U.S. Food and Drug Administration collaborative study on complication rates and drug use during gastrointestinal endoscopy. Gastrointest Endosc. 1991;37(4):421-427. doi:10.1016/s0016-5107(91)70773-6
4. Burkle C, Swetz K, Armstrong M, Keegan M. Patient and doctor attitudes and beliefs concerning perioperative do not resuscitate orders: anesthesiologists’ growing compliance with patient autonomy and self-determination guidelines. BMC Anesthesiol. 2013;13:2. doi:10.1186/1471-2253-13-2
5. American College of Surgeons. Statement on advance directives by patients: “do not resuscitate” in the operative room. Published January 3, 2014. Accessed January 11, 2021. https://bulletin.facs.org/2014/01/statement-on-advance-directives-by-patients-do-not-resuscitate-in-the-operating-room
6. Association of periOperative Registered Nurses. AORN position statement on perioperative care of patients with do-not-resuscitate or allow-natural death orders. Reaffirmed February 2020. Accessed June 16, 2020. https://www.aorn.org/guidelines/clinical-resources/position-statements
7. Bastron DR. Ethical guidelines for the anesthesia care of patients with do-not-resuscitate orders or other directives that limit treatment. Published 1996. Accessed January 11, 2021. https://pubs.asahq.org/anesthesiology/article/85/5/1190/35862/Ethical-Concerns-in-Anesthetic-Care-for-Patients
8. Baxter L, Hancox J, King B, Powell A, Tolley T. Stop! Patients receiving CPR despite valid DNACPR documentation. Eur J Pall Car. 2018;23(3):125-127.
9. Agency for Healthcare Research and Quality. Practice facilitation handbook, module 10: academic detailing as a quality improvement tool. Last reviewed May 2013. Accessed January 11, 2021. 2021. https://www.ahrq.gov/ncepcr/tools/pf-handbook/mod10.html
10. Urman R, Lilley E, Changala M, Lindvall C, Hepner D, Bader A. A pilot study to evaluate compliance with guidelines for preprocedural reconsideration of code status limitations. J Palliat Med. 2018;21(8):1152-1156. doi:10.1089/jpm.2017.0601
11. Waisel D, Simon R, Truog R, Baboolal H, Raemer D. Anesthesiologist management of perioperative do-not-resuscitate orders: a simulation-based experiment. Simul Healthc. 2009;4(2):70-76. doi:10.1097/SIH.0b013e31819e137b
12. Lozano P, Finkelstein J, Carey V, et al. A multisite randomized trial of the effects of physician education and organizational change in chronic-asthma care. Arch Pediatr Adolesc Med. 2004;158(9):875-883. doi:10.1001/archpedi.158.9.875
13. Brunström M, Ng N, Dahlström J, et al. Association of physician education and feedback on hypertension management with patient blood pressure and hypertension control. JAMA Netw Open. 2020;3(1):e1918625. doi:10.1001/jamanetworkopen.2019.18625
14. Wong J, Duane P, Ingraham N. A case series of patients who were do not resuscitate but underwent cardiopulmonary resuscitation. Resuscitation. 2020;146:145-146. doi:10.1016/j.resuscitation.2019.11.020
15. Mittelberger J, Lo B, Martin D, Uhlmann R. Impact of a procedure-specific do not resuscitate order form on documentation of do not resuscitate orders. Arch Intern Med. 1993;153(2):228-232.
16. Neubauer M, Taniguchi C, Hoverman J. Improving incidence of code status documentation through process and discipline. J Oncol Pract. 2015;11(2):e263-266. doi:10.1200/JOP.2014.001438
Can Using an Intensive Management Program Improve Primary Care Staff Experiences With Caring for High-Risk Patients?
Patients with complex medical and psychosocial needs are at the highest risk for fragmented care and adverse health outcomes.1,2 Although these high-risk patients make up only about 5% of the US patient population, they can account for as much as half of total health care costs.1 High-risk patients are complicated to treat because most have multiple chronic medical conditions, and many have a wide variety of psychological and social needs. Thus, physician, physician assistant, and nurse practitioner primary care providers (PCPs), and nurses (registered nurses, licensed vocational nurses, and licensed practical nurses) must address the complexity of the human condition in conjunction with health problems.2
Background
Caring for high-risk patients within a tight clinic schedule geared to the provision of comprehensive care to large panels of less complex patients can be a source of stress for PCPs and nurses.3-5 These conditions may lead to reduced well-being among primary care team members and to potential turnover.6 Furthermore, primary care staff may feel uncomfortable or lack the ability to address nonmedical concerns because of “person-specific factors that interfere with the delivery of usual care and decision making for whatever condition the patient has.”7,8 Having additional support for complex patients, such as intensive outpatient management teams, may be protective both by reducing health care provider (HCP) stress and improving patient outcomes.3,4
Caring for high-risk patients is challenging.9-11 High-risk patient care may require additional, often unpaid, work hoursand may be discouraging because these patients can be difficult to engage in care.7,12 Furthermore, high-risk patient care is challenging for primary care teams, since these complex patients may fall through the cracks and experience potentially preventable hospitalization or even death. Avoiding these negative consequences typically requires substantial time for the primary care team to engage and counsel the patient, family, and caregiver, through more frequent visits and additional communication. Furthermore, the primary care team typically must coordinate with other HCPs and resources—as many as 16 in a single year and as much as 12 for a single patient over an 80-day period.13,14 Not surprisingly, primary care teams identify help with care coordination as a critical need that may be addressed with intensive management support.
Primary care at the US Department of Veterans Affairs (VA) Veterans Health Administration (VHA) provides care for a large proportion of high-risk patients.15 Accordingly, VHA provides a variety of intensive management options for equipping primary care teams with expanded resources for caring for high-risk patients, including those offered in a few sites by a pilot intensive management program.16 As part of the pilot’s evaluation, we studied the work experiences of PCPs and nurses, some of whom had experienced the pilot program and some of whom only had access to typical VHA intensive management resources, such as telehealth and specialty medical homes (referred to in the VA as patient aligned care teams, or PACT), eg, for women patients, for patients who are homeless, or for older adults.17 Surveys assessed whether HCPs who indicated they were likely to seek help from PACT intensive management (PIM) teams to care for high-risk patients had higher job satisfaction and intention to stay at VHA compared with those who were not likely to seek help.
While substantial research on high-risk patients’ intensive management needs has focused on patient-level outcomes of interventions for meeting those needs,little research has examined links between primary care team access to intensive management resources and experiences, such as job satisfaction and job retention.18 In the work presented here, our objectives were to (1) assess the likelihood that a PCP or nurse intent to manage high-risk patients by seeking care coordination help from or transferring care to an intensive management team; and (2) evaluate the relationship between PCP or nurse intentions regarding using intensive management help for high-risk patients and their job satisfaction and likelihood of leaving VA primary care. We hypothesized that the accessibility of intensive management resources and PCP and nurse receptivity to accessing those resources may affect job-related experiences.
Methods
This study was conducted as part of the evaluation of a VA pilot project to provide general primary care teams with intensive management support from interdisciplinary teams for high-risk patients in 5 VHA systems in 5 states (Ohio, Georgia, North Carolina, Wisconsin, and California).6 We sampled primary care staff at 39 primary care clinics within those systems, all of whom had access to VA intensive management resources. These included telehealth, health coaches, integrated mental health providers, and specialty PACTs for specific populations (eg, those who are women, elderly, homeless, HIV-positive, or who have serious mental illness). Of the 39 primary care clinics that participated in the survey, 8 also participated in the pilot program offering an intensive management team to support general primary care in their care of high-risk patients.
Data are from PCPs and nurses who completed 2 cross-sectional surveys (online or hard copy). We invited 1,000 PCPs and nurses to complete the first survey (fielded December 2014 to May 2015) and 863 to complete the second survey (fielded October 2016 to January 2017). A total of 436 completed the first survey for a response rate of 44%, and 313 completed the second survey for a response rate of 36%. We constructed a longitudinal cohort of 144 PCPs and nurses who completed both surveys and had data at 2 timepoints. This longitudinal cohort represents 33% of the 442 unique respondents who completed either the first or second survey. Overlap across surveys was low because of high staff turnover between survey waves.
Measures
Outcomes. We examined 2 single-item outcome measures to assess job satisfaction and retention (ie, intent to stay in primary care at the VA) measured in both surveys. These items were worded “Overall, I am satisfied with my job.” and “I intend to continue working in primary care at the VA for the next two years.” Both items were rated on a 5-point Likert scale.
Independent Variable. We assessed proclivity to seek assistance in caring for high-risk patients based on PCPs or nurses indicating that they are likely to either “manage these patients with ongoing care coordination assistance from an intensive management team” and/or “transfer these patients from primary care to another intensive management team or program specializing in high-risk patients.” These 2 items were rated on a 5-point Likert scale; we dichotomized the scale with likely or very likely indicating high proclivity (likelihood) for ease of interpretation of the combined items.
Covariates. We also controlled for indicators of staff demographic and practice characteristics in multivariate analyses. These included gender, staff type (PCP vs nurse), years practicing at a VA clinic, team staffing level (full vs partial), proportion of the panel consisting of high-risk patients (using binary indicators: 11 to 20% or > 20% compared with 0 to 10% as the reference group), and whether or not the site participated in the pilot program offering an intensive management team to support primary care for high-risk patients to distinguish the 8 pilot sites from nonpilot sites.
Statistical Analysis
We used ordinary least squares regression analysis to examine associations between the independent variable measured at time 1 and outcomes measured at time 2, controlling for time 1 outcomes among staff who completed both surveys (eg, the longitudinal cohort). We adjusted for time 1 covariates and clustering of staff within clinics, assuming a random effect with robust standard errors, and conducted multiple imputations for item-level missing data. Poststratification weights were used to adjust for survey nonresponse by staff type, gender, facilities participating in the innovations, and type of specialty PACT. We calculated weights based on the sampling frame of all PCPs and nurses for each survey.
Results
Table 1 shows the proportion of primary care staff responding to the surveys. For the longitudinal cohort, the response by staff type was similar to the sample of staff that responded only to a single survey, but the sample that did not respond to either survey included more physicians. There was also some variation by medical center. For example, a smaller proportion of the cohort was from site D and more was from site E compared with the other samples. The proportion of primary care staff in facilities that participated in the intensive management pilot was higher than the proportion in other facilities. More women (81.9%) were in the longitudinal cohort compared with 77.4% in the single-survey sample and 69.2% in the sample that responded to neither survey.

Both surveys were completed by 144 respondents while 442 completed 1 survey and 645 did not respond to either survey. The cohort was predominantly nurses (64.6%); Of the PCPs, 25% were physicians. Most staff were women (81.9%) and aged > 45 years (72.2%). Staff had practiced at their current VA clinics for a mean of 7.4 years, and most reported being on a fully-staffed primary care team (70%).
Multivariate Analyses
In the multivariable regression analyses, we found that the primary care staff, which reported being more likely to use intensive management teams to help care for high-risk patients at time 1, reported significantly higher satisfaction (0.63 points higher on a 5-point scale) and intention to stay (0.41 points higher) at VA primary care (both P < .05) at time 2, 18 months later (Table 2). These effect sizes are equivalent to nearly two-thirds and half of a standard deviation, respectively. Among our control variables, years practicing in the VA was significantly associated with a lower likelihood of intent to stay at the VA. Models account for 28% of the variation in satisfaction and 22% of the variation in retention. The Figure shows the adjusted means based on parameters from the regression models for job satisfaction and intent to stay at the VA as well as likelihood of using an intensive management team for high-risk patients. Job satisfaction is nearly 1 point higher among those who report being likely to draw on support from an intensive management team to care for high-risk patients compared with those who reported that they were unlikely to use such a team. The pattern for intent to stay at the VA, while less pronounced, is similar to that for satisfaction.
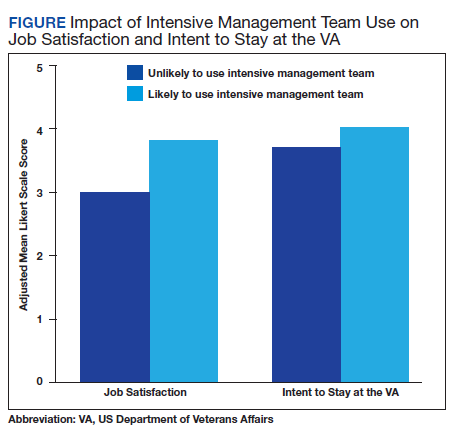
Discussion
Our findings are consistent with our hypothesis that augmenting primary care with high-risk patient intensive management assistance would improve primary care staff job satisfaction and retention. Findings also mirror recent qualitative studies, which have found that systemic approaches to augment primary care of high-risk patients are likely needed to maintain well-being.7,19 We found a positive relationship between the likelihood of using intensive management teams to help care for their high-risk patients and reported job satisfaction and intent to continue to work within VA primary care 18 months later. To our knowledge, this study is the first to examine the potential impact on PCPs and nurses of using intensive management teams to help care for high-risk patients.
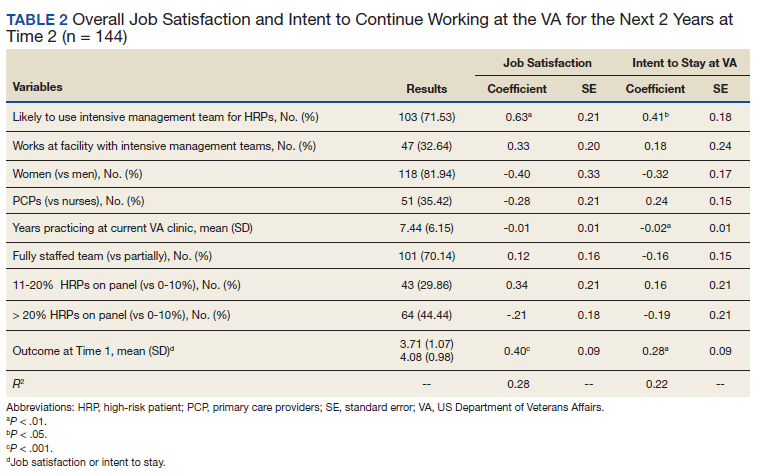
Our study suggests that this approach has the potential to alleviate PCP and nurse stress by incorporating intensive management teams as an extension of the medical home. Even high-functioning medical homes may find it challenging to meet the needs of their high-risk patients.3,7,8 Time constraints and a structured clinic schedule may limit the ability of medical homes to balance the needs of the general panel vs the individual needs of high-risk patients who might benefit from intensive services. Limited knowledge and lack of training to address the broad array of problems faced by high-risk patients also makes care challenging.2
Intensive management services often include interdisciplinary and comprehensive assessments, care coordination, health care system navigation, and linkages to social and home care services.20 Medical homes may benefit from these services, especially resources to support care coordination and communication with specialists and social services in large medical neighborhoods.21 For example, including a social worker on the intensive patient care team can help primary care staff by focusing specialized resources on nonmedical issues, such as chronic homelessness, substance use disorders, food insecurity, access to transportation, and poverty.18
Limitations
This study is subject to some limitations, including those typical of surveys, such as reliance on self-reported data. The longitudinal sample we studied had response rates that varied by site, participation in the pilot program, and gender relative to those who did not respond to both surveys; selection bias is possible. While we use a longitudinal cohort, we cannot attribute causality; it is possible that more satisfied staff are more likely to use intensive management teams rather than the use of intensive management teams contributing to higher satisfaction. Although each study site includes at least 1 type of intensive management resource, we cannot ascertain which intensive management resource primary care staff accessed, if any. While our sample size for the longitudinal cohort responders was limited, focusing on our longitudinal cohort provides more valid and reliable estimates than does using 2 cross-sectional samples with all responders. In addition, our models do not completely explain variation in the outcomes (R2= 0.28 and 0.22), although we included major explanatory factors, such as team staffing and professional type; other unmeasured factors may explain our outcomes. Finally, our provider sample may not generalize to HCPs in non-VA settings.
Conclusions
Our study expands on the limited data regarding the primary care staff experience of caring for high-risk patients and the potential impact of using interdisciplinary assistance to help care for this population. A strength of this study is the longitudinal cohort design that allowed us to understand staff receptivity to having access to intensive management resources to help care for high-risk patients over time among the same group of primary care staff. Given that an economic analysis has determined that the addition of the pilot intensive management program has been cost neutral to the VA, the possibility of its benefit, as suggested by our study findings, would support further implementation and evaluation of intensive management teams as a resource for PCPs caring for high-risk patients.22
Understanding the mechanisms by which primary care staff benefit most from high-risk patient assistance, and how to optimize communication and coordination between primary care staff and intensive management teams for high-risk patients might further increase primary care satisfaction and retention.
1. Hayes SL, Salzberg CA, McCarthy D, et al. High-need, high-cost patients: who are they and how do they use health care? A population-based comparison of demographics, health care use, and expenditures. Issue Brief (Commonw Fund). 2016;26:1-14.
2. Bowman MA. The complexity of family medicine care. J Am Board Fam Med. 2011;24(1):4-5. doi:10.3122/jabfm.2011.01.100268
3. Grant RW, Adams AS, Bayliss EA, Heisler M. Establishing visit priorities for complex patients: a summary of the literature and conceptual model to guide innovative interventions. Healthc (Amst). 2013;1(3-4):117-122. doi:10.1016/j.hjdsi.2013.07.008
4. Okunogbe A, Meredith LS, Chang ET, Simon A, Stockdale SE, Rubenstein LV. Care coordination and provider stress in primary care management of high-risk patients. J Gen Intern Med. 2018;33(1):65-71. doi:10.1007/s11606-017-4186-8
5. Weiner JZ, McCloskey JK, Uratsu CS, Grant RW. Primary care physician stress driven by social and financial needs of complex patients. J Gen Intern Med. 2019;34(6):818-819. doi:10.1007/s11606-018-4815-x
6. Shanafelt TD, Sloan JA, Habermann TM. The well-being of physicians. Am J Med. 2003;114(6):513-519. doi:10.1016/s0002-9343(03)00117-7
7. Loeb DF, Bayliss EA, Candrian C, deGruy FV, Binswanger IA. Primary care providers’ experiences caring for complex patients in primary care: a qualitative study. BMC Fam Pract. 2016;17:34. Published 2016 Mar 22. doi:10.1186/s12875-016-0433-z
8. Peek CJ, Baird MA, Coleman E. Primary care for patient complexity, not only disease. Fam Syst Health. 2009;27(4):287-302. doi:10.1037/a0018048
9. Powers BW, Chaguturu SK, Ferris TG. Optimizing high-risk care management. JAMA. 2015;313(8):795-796. doi:10.1001/jama.2014.18171
10. Skinner HG, Coffey R, Jones J, Heslin KC, Moy E. The effects of multiple chronic conditions on hospitalization costs and utilization for ambulatory care sensitive conditions in the United States: a nationally representative cross-sectional study. BMC Health Serv Res. 2016;16:77. Published 2016 Mar 1. doi:10.1186/s12913-016-1304-y
11. Zulman DM, Pal Chee C, Wagner TH, et al. Multimorbidity and healthcare utilisation among high-cost patients in the US Veterans Affairs Health Care System. BMJ Open. 2015;5(4):e007771. Published 2015 Apr 16. doi:10.1136/bmjopen-2015-007771
12. Breland JY, Asch SM, Slightam C, Wong A, Zulman DM. Key ingredients for implementing intensive outpatient programs within patient-centered medical homes: a literature review and qualitative analysis. Healthc (Amst). 2016;4(1):22-29. doi:10.1016/j.hjdsi.2015.12.005
13. Bodenheimer T. Coordinating care--a perilous journey through the health care system. N Engl J Med. 2008;358(10):1064-1071. doi:10.1056/NEJMhpr0706165
14. Press MJ. Instant replay--a quarterback’s view of care coordination. N Engl J Med. 2014;371(6):489-491. doi:10.1056/NEJMp1406033
15. Chang ET, Piegari RI, Zulman DM, et al. High-risk patients in VHA: where do they get their primary care? Abstract presented at the 2017 Society of General Internal Medicine Annual Meeting. J Gen Intern Med. 2017;32(suppl 2):83-808. doi:10.1007/s11606-017-4028-8
16. Chang ET, Zulman DM, Asch SM, et al. An operations-partnered evaluation of care redesign for high-risk patients in the Veterans Health Administration (VHA): Study protocol for the PACT Intensive Management (PIM) randomized quality improvement evaluation. Contemp Clin Trials. 2018;69:65-75. doi:10.1016/j.cct.2018.04.008
17. Olmos-Ochoa TT, Bharath P, Ganz DA, et al. Staff perspectives on primary care teams as de facto “hubs” for care coordination in VA: a qualitative study. J Gen Intern Med. 2019;34(suppl 1):82-89. doi:10.1007/s11606-019-04967-y
18. Iovan S, Lantz PM, Allan K, Abir M. Interventions to decrease use in prehospital and emergency care settings among super-utilizers in the United States: a systematic review. Med Care Res Rev. 2020;77(2):99-111. doi:10.1177/1077558719845722
19. Zulman DM, Ezeji-Okoye SC, Shaw JG, et al. Partnered research in healthcare delivery redesign for high-need, high-cost patients: development and feasibility of an Intensive Management Patient-Aligned Care Team (ImPACT). J Gen Intern Med. 2014;29 Suppl 4(Suppl 4):861-869. doi:10.1007/s11606-014-3022-7
20. Chang ET, Raja PV, Stockdale SE, et al. What are the key elements for implementing intensive primary care? A multisite Veterans Health Administration case study. Healthc (Amst). 2018;6(4):231-237. doi:10.1016/j.hjdsi.2017.10.001
21. Rich E, Lipson D, Libersky J, Parchman M; Mathematica Policy Research. Coordinating care for adults with complex care needs in the patient-centered medical home: challenges and solutions. Published January 2012. Accessed January 12, 2021. https://pcmh.ahrq.gov/page/coordinating-care-adults-complex-care-needs-patient-centered-medical-home-challenges-and-0
22. Yoon J, Chang E, Rubenstein LV, et al. Impact of primary care intensive management on high-risk veterans’ costs and utilization: a randomized quality improvement trial [published correction appears in Ann Intern Med. 2018 Oct 2;169(7):516]. Ann Intern Med. 2018;168(12):846-854. doi:10.7326/M17-3039
Patients with complex medical and psychosocial needs are at the highest risk for fragmented care and adverse health outcomes.1,2 Although these high-risk patients make up only about 5% of the US patient population, they can account for as much as half of total health care costs.1 High-risk patients are complicated to treat because most have multiple chronic medical conditions, and many have a wide variety of psychological and social needs. Thus, physician, physician assistant, and nurse practitioner primary care providers (PCPs), and nurses (registered nurses, licensed vocational nurses, and licensed practical nurses) must address the complexity of the human condition in conjunction with health problems.2
Background
Caring for high-risk patients within a tight clinic schedule geared to the provision of comprehensive care to large panels of less complex patients can be a source of stress for PCPs and nurses.3-5 These conditions may lead to reduced well-being among primary care team members and to potential turnover.6 Furthermore, primary care staff may feel uncomfortable or lack the ability to address nonmedical concerns because of “person-specific factors that interfere with the delivery of usual care and decision making for whatever condition the patient has.”7,8 Having additional support for complex patients, such as intensive outpatient management teams, may be protective both by reducing health care provider (HCP) stress and improving patient outcomes.3,4
Caring for high-risk patients is challenging.9-11 High-risk patient care may require additional, often unpaid, work hoursand may be discouraging because these patients can be difficult to engage in care.7,12 Furthermore, high-risk patient care is challenging for primary care teams, since these complex patients may fall through the cracks and experience potentially preventable hospitalization or even death. Avoiding these negative consequences typically requires substantial time for the primary care team to engage and counsel the patient, family, and caregiver, through more frequent visits and additional communication. Furthermore, the primary care team typically must coordinate with other HCPs and resources—as many as 16 in a single year and as much as 12 for a single patient over an 80-day period.13,14 Not surprisingly, primary care teams identify help with care coordination as a critical need that may be addressed with intensive management support.
Primary care at the US Department of Veterans Affairs (VA) Veterans Health Administration (VHA) provides care for a large proportion of high-risk patients.15 Accordingly, VHA provides a variety of intensive management options for equipping primary care teams with expanded resources for caring for high-risk patients, including those offered in a few sites by a pilot intensive management program.16 As part of the pilot’s evaluation, we studied the work experiences of PCPs and nurses, some of whom had experienced the pilot program and some of whom only had access to typical VHA intensive management resources, such as telehealth and specialty medical homes (referred to in the VA as patient aligned care teams, or PACT), eg, for women patients, for patients who are homeless, or for older adults.17 Surveys assessed whether HCPs who indicated they were likely to seek help from PACT intensive management (PIM) teams to care for high-risk patients had higher job satisfaction and intention to stay at VHA compared with those who were not likely to seek help.
While substantial research on high-risk patients’ intensive management needs has focused on patient-level outcomes of interventions for meeting those needs,little research has examined links between primary care team access to intensive management resources and experiences, such as job satisfaction and job retention.18 In the work presented here, our objectives were to (1) assess the likelihood that a PCP or nurse intent to manage high-risk patients by seeking care coordination help from or transferring care to an intensive management team; and (2) evaluate the relationship between PCP or nurse intentions regarding using intensive management help for high-risk patients and their job satisfaction and likelihood of leaving VA primary care. We hypothesized that the accessibility of intensive management resources and PCP and nurse receptivity to accessing those resources may affect job-related experiences.
Methods
This study was conducted as part of the evaluation of a VA pilot project to provide general primary care teams with intensive management support from interdisciplinary teams for high-risk patients in 5 VHA systems in 5 states (Ohio, Georgia, North Carolina, Wisconsin, and California).6 We sampled primary care staff at 39 primary care clinics within those systems, all of whom had access to VA intensive management resources. These included telehealth, health coaches, integrated mental health providers, and specialty PACTs for specific populations (eg, those who are women, elderly, homeless, HIV-positive, or who have serious mental illness). Of the 39 primary care clinics that participated in the survey, 8 also participated in the pilot program offering an intensive management team to support general primary care in their care of high-risk patients.
Data are from PCPs and nurses who completed 2 cross-sectional surveys (online or hard copy). We invited 1,000 PCPs and nurses to complete the first survey (fielded December 2014 to May 2015) and 863 to complete the second survey (fielded October 2016 to January 2017). A total of 436 completed the first survey for a response rate of 44%, and 313 completed the second survey for a response rate of 36%. We constructed a longitudinal cohort of 144 PCPs and nurses who completed both surveys and had data at 2 timepoints. This longitudinal cohort represents 33% of the 442 unique respondents who completed either the first or second survey. Overlap across surveys was low because of high staff turnover between survey waves.
Measures
Outcomes. We examined 2 single-item outcome measures to assess job satisfaction and retention (ie, intent to stay in primary care at the VA) measured in both surveys. These items were worded “Overall, I am satisfied with my job.” and “I intend to continue working in primary care at the VA for the next two years.” Both items were rated on a 5-point Likert scale.
Independent Variable. We assessed proclivity to seek assistance in caring for high-risk patients based on PCPs or nurses indicating that they are likely to either “manage these patients with ongoing care coordination assistance from an intensive management team” and/or “transfer these patients from primary care to another intensive management team or program specializing in high-risk patients.” These 2 items were rated on a 5-point Likert scale; we dichotomized the scale with likely or very likely indicating high proclivity (likelihood) for ease of interpretation of the combined items.
Covariates. We also controlled for indicators of staff demographic and practice characteristics in multivariate analyses. These included gender, staff type (PCP vs nurse), years practicing at a VA clinic, team staffing level (full vs partial), proportion of the panel consisting of high-risk patients (using binary indicators: 11 to 20% or > 20% compared with 0 to 10% as the reference group), and whether or not the site participated in the pilot program offering an intensive management team to support primary care for high-risk patients to distinguish the 8 pilot sites from nonpilot sites.
Statistical Analysis
We used ordinary least squares regression analysis to examine associations between the independent variable measured at time 1 and outcomes measured at time 2, controlling for time 1 outcomes among staff who completed both surveys (eg, the longitudinal cohort). We adjusted for time 1 covariates and clustering of staff within clinics, assuming a random effect with robust standard errors, and conducted multiple imputations for item-level missing data. Poststratification weights were used to adjust for survey nonresponse by staff type, gender, facilities participating in the innovations, and type of specialty PACT. We calculated weights based on the sampling frame of all PCPs and nurses for each survey.
Results
Table 1 shows the proportion of primary care staff responding to the surveys. For the longitudinal cohort, the response by staff type was similar to the sample of staff that responded only to a single survey, but the sample that did not respond to either survey included more physicians. There was also some variation by medical center. For example, a smaller proportion of the cohort was from site D and more was from site E compared with the other samples. The proportion of primary care staff in facilities that participated in the intensive management pilot was higher than the proportion in other facilities. More women (81.9%) were in the longitudinal cohort compared with 77.4% in the single-survey sample and 69.2% in the sample that responded to neither survey.
Both surveys were completed by 144 respondents while 442 completed 1 survey and 645 did not respond to either survey. The cohort was predominantly nurses (64.6%); Of the PCPs, 25% were physicians. Most staff were women (81.9%) and aged > 45 years (72.2%). Staff had practiced at their current VA clinics for a mean of 7.4 years, and most reported being on a fully-staffed primary care team (70%).
Multivariate Analyses
In the multivariable regression analyses, we found that the primary care staff, which reported being more likely to use intensive management teams to help care for high-risk patients at time 1, reported significantly higher satisfaction (0.63 points higher on a 5-point scale) and intention to stay (0.41 points higher) at VA primary care (both P < .05) at time 2, 18 months later (Table 2). These effect sizes are equivalent to nearly two-thirds and half of a standard deviation, respectively. Among our control variables, years practicing in the VA was significantly associated with a lower likelihood of intent to stay at the VA. Models account for 28% of the variation in satisfaction and 22% of the variation in retention. The Figure shows the adjusted means based on parameters from the regression models for job satisfaction and intent to stay at the VA as well as likelihood of using an intensive management team for high-risk patients. Job satisfaction is nearly 1 point higher among those who report being likely to draw on support from an intensive management team to care for high-risk patients compared with those who reported that they were unlikely to use such a team. The pattern for intent to stay at the VA, while less pronounced, is similar to that for satisfaction.
Discussion
Our findings are consistent with our hypothesis that augmenting primary care with high-risk patient intensive management assistance would improve primary care staff job satisfaction and retention. Findings also mirror recent qualitative studies, which have found that systemic approaches to augment primary care of high-risk patients are likely needed to maintain well-being.7,19 We found a positive relationship between the likelihood of using intensive management teams to help care for their high-risk patients and reported job satisfaction and intent to continue to work within VA primary care 18 months later. To our knowledge, this study is the first to examine the potential impact on PCPs and nurses of using intensive management teams to help care for high-risk patients.
Our study suggests that this approach has the potential to alleviate PCP and nurse stress by incorporating intensive management teams as an extension of the medical home. Even high-functioning medical homes may find it challenging to meet the needs of their high-risk patients.3,7,8 Time constraints and a structured clinic schedule may limit the ability of medical homes to balance the needs of the general panel vs the individual needs of high-risk patients who might benefit from intensive services. Limited knowledge and lack of training to address the broad array of problems faced by high-risk patients also makes care challenging.2
Intensive management services often include interdisciplinary and comprehensive assessments, care coordination, health care system navigation, and linkages to social and home care services.20 Medical homes may benefit from these services, especially resources to support care coordination and communication with specialists and social services in large medical neighborhoods.21 For example, including a social worker on the intensive patient care team can help primary care staff by focusing specialized resources on nonmedical issues, such as chronic homelessness, substance use disorders, food insecurity, access to transportation, and poverty.18
Limitations
This study is subject to some limitations, including those typical of surveys, such as reliance on self-reported data. The longitudinal sample we studied had response rates that varied by site, participation in the pilot program, and gender relative to those who did not respond to both surveys; selection bias is possible. While we use a longitudinal cohort, we cannot attribute causality; it is possible that more satisfied staff are more likely to use intensive management teams rather than the use of intensive management teams contributing to higher satisfaction. Although each study site includes at least 1 type of intensive management resource, we cannot ascertain which intensive management resource primary care staff accessed, if any. While our sample size for the longitudinal cohort responders was limited, focusing on our longitudinal cohort provides more valid and reliable estimates than does using 2 cross-sectional samples with all responders. In addition, our models do not completely explain variation in the outcomes (R2= 0.28 and 0.22), although we included major explanatory factors, such as team staffing and professional type; other unmeasured factors may explain our outcomes. Finally, our provider sample may not generalize to HCPs in non-VA settings.
Conclusions
Our study expands on the limited data regarding the primary care staff experience of caring for high-risk patients and the potential impact of using interdisciplinary assistance to help care for this population. A strength of this study is the longitudinal cohort design that allowed us to understand staff receptivity to having access to intensive management resources to help care for high-risk patients over time among the same group of primary care staff. Given that an economic analysis has determined that the addition of the pilot intensive management program has been cost neutral to the VA, the possibility of its benefit, as suggested by our study findings, would support further implementation and evaluation of intensive management teams as a resource for PCPs caring for high-risk patients.22
Understanding the mechanisms by which primary care staff benefit most from high-risk patient assistance, and how to optimize communication and coordination between primary care staff and intensive management teams for high-risk patients might further increase primary care satisfaction and retention.
1. Hayes SL, Salzberg CA, McCarthy D, et al. High-need, high-cost patients: who are they and how do they use health care? A population-based comparison of demographics, health care use, and expenditures. Issue Brief (Commonw Fund). 2016;26:1-14.
2. Bowman MA. The complexity of family medicine care. J Am Board Fam Med. 2011;24(1):4-5. doi:10.3122/jabfm.2011.01.100268
3. Grant RW, Adams AS, Bayliss EA, Heisler M. Establishing visit priorities for complex patients: a summary of the literature and conceptual model to guide innovative interventions. Healthc (Amst). 2013;1(3-4):117-122. doi:10.1016/j.hjdsi.2013.07.008
4. Okunogbe A, Meredith LS, Chang ET, Simon A, Stockdale SE, Rubenstein LV. Care coordination and provider stress in primary care management of high-risk patients. J Gen Intern Med. 2018;33(1):65-71. doi:10.1007/s11606-017-4186-8
5. Weiner JZ, McCloskey JK, Uratsu CS, Grant RW. Primary care physician stress driven by social and financial needs of complex patients. J Gen Intern Med. 2019;34(6):818-819. doi:10.1007/s11606-018-4815-x
6. Shanafelt TD, Sloan JA, Habermann TM. The well-being of physicians. Am J Med. 2003;114(6):513-519. doi:10.1016/s0002-9343(03)00117-7
7. Loeb DF, Bayliss EA, Candrian C, deGruy FV, Binswanger IA. Primary care providers’ experiences caring for complex patients in primary care: a qualitative study. BMC Fam Pract. 2016;17:34. Published 2016 Mar 22. doi:10.1186/s12875-016-0433-z
8. Peek CJ, Baird MA, Coleman E. Primary care for patient complexity, not only disease. Fam Syst Health. 2009;27(4):287-302. doi:10.1037/a0018048
9. Powers BW, Chaguturu SK, Ferris TG. Optimizing high-risk care management. JAMA. 2015;313(8):795-796. doi:10.1001/jama.2014.18171
10. Skinner HG, Coffey R, Jones J, Heslin KC, Moy E. The effects of multiple chronic conditions on hospitalization costs and utilization for ambulatory care sensitive conditions in the United States: a nationally representative cross-sectional study. BMC Health Serv Res. 2016;16:77. Published 2016 Mar 1. doi:10.1186/s12913-016-1304-y
11. Zulman DM, Pal Chee C, Wagner TH, et al. Multimorbidity and healthcare utilisation among high-cost patients in the US Veterans Affairs Health Care System. BMJ Open. 2015;5(4):e007771. Published 2015 Apr 16. doi:10.1136/bmjopen-2015-007771
12. Breland JY, Asch SM, Slightam C, Wong A, Zulman DM. Key ingredients for implementing intensive outpatient programs within patient-centered medical homes: a literature review and qualitative analysis. Healthc (Amst). 2016;4(1):22-29. doi:10.1016/j.hjdsi.2015.12.005
13. Bodenheimer T. Coordinating care--a perilous journey through the health care system. N Engl J Med. 2008;358(10):1064-1071. doi:10.1056/NEJMhpr0706165
14. Press MJ. Instant replay--a quarterback’s view of care coordination. N Engl J Med. 2014;371(6):489-491. doi:10.1056/NEJMp1406033
15. Chang ET, Piegari RI, Zulman DM, et al. High-risk patients in VHA: where do they get their primary care? Abstract presented at the 2017 Society of General Internal Medicine Annual Meeting. J Gen Intern Med. 2017;32(suppl 2):83-808. doi:10.1007/s11606-017-4028-8
16. Chang ET, Zulman DM, Asch SM, et al. An operations-partnered evaluation of care redesign for high-risk patients in the Veterans Health Administration (VHA): Study protocol for the PACT Intensive Management (PIM) randomized quality improvement evaluation. Contemp Clin Trials. 2018;69:65-75. doi:10.1016/j.cct.2018.04.008
17. Olmos-Ochoa TT, Bharath P, Ganz DA, et al. Staff perspectives on primary care teams as de facto “hubs” for care coordination in VA: a qualitative study. J Gen Intern Med. 2019;34(suppl 1):82-89. doi:10.1007/s11606-019-04967-y
18. Iovan S, Lantz PM, Allan K, Abir M. Interventions to decrease use in prehospital and emergency care settings among super-utilizers in the United States: a systematic review. Med Care Res Rev. 2020;77(2):99-111. doi:10.1177/1077558719845722
19. Zulman DM, Ezeji-Okoye SC, Shaw JG, et al. Partnered research in healthcare delivery redesign for high-need, high-cost patients: development and feasibility of an Intensive Management Patient-Aligned Care Team (ImPACT). J Gen Intern Med. 2014;29 Suppl 4(Suppl 4):861-869. doi:10.1007/s11606-014-3022-7
20. Chang ET, Raja PV, Stockdale SE, et al. What are the key elements for implementing intensive primary care? A multisite Veterans Health Administration case study. Healthc (Amst). 2018;6(4):231-237. doi:10.1016/j.hjdsi.2017.10.001
21. Rich E, Lipson D, Libersky J, Parchman M; Mathematica Policy Research. Coordinating care for adults with complex care needs in the patient-centered medical home: challenges and solutions. Published January 2012. Accessed January 12, 2021. https://pcmh.ahrq.gov/page/coordinating-care-adults-complex-care-needs-patient-centered-medical-home-challenges-and-0
22. Yoon J, Chang E, Rubenstein LV, et al. Impact of primary care intensive management on high-risk veterans’ costs and utilization: a randomized quality improvement trial [published correction appears in Ann Intern Med. 2018 Oct 2;169(7):516]. Ann Intern Med. 2018;168(12):846-854. doi:10.7326/M17-3039
Minimizing Opioids After Joint Operation: Protocol to Decrease Postoperative Opioid Use After Primary Total Knee Arthroplasty
For decades, opioids have been a mainstay in the management of pain after total joint arthroplasty. In the past 10 years, however, opioid prescribing has come under increased scrutiny due to a rise in rates of opioid abuse, pill diversion, and opioid-related deaths.1,2 Opioids are associated with adverse effects, including nausea, vomiting, constipation, apathy, and respiratory depression, all of which influence arthroplasty outcomes and affect the patient experience. Although primary care groups account for nearly half of prescriptions written, orthopedic surgeons have the third highest per capita rate of opioid prescribing of all medical specialties.3,4 This puts orthopedic surgeons, particularly those who perform routine procedures, in an opportune but challenging position to confront this problem through novel pain management strategies.
Approximately 1 million total knee arthroplasties (TKAs) are performed in the US every year, and the US Department of Veterans Affairs (VA) health system performs about 10,000 hip and knee joint replacements.5,6 There is no standardization of opioid prescribing in the postoperative period following these procedures, and studies have reported a wide variation in prescribing habits even within a single institution for a specific surgery.7 Patients who undergo TKA are at particularly high risk of long-term opioid use if they are on continuous opioids at the time of surgery; this is problematic in a VA patient population in which at least 16% of patients are prescribed opioids in a given year.8 Furthermore, veterans are twice as likely as nonveterans to die of an accidental overdose.9 Despite these risks, opioids remain a cornerstone of postoperative pain management both within and outside of the VA.10
In 2018, to limit unnecessary prescribing of opioid pain medication, the total joint service at the VA Portland Health Care System (VAPHCS) in Oregon implemented the Minimizing Opioids after Joint Operation (MOJO) postoperative pain protocol. The goal of the protocol was to reduce opioid use following TKA. The objectives were to provide safe, appropriate analgesia while allowing early mobilization and discharge without a concomitant increase in readmissions or emergency department (ED) visits. The purpose of this retrospective chart review was to compare the efficacy of the MOJO protocol with our historical experience and report our preliminary results.
Methods
Institutional review board approval was obtained to retrospectively review the medical records of patients who had undergone TKA surgery during 2018 at VAPHCS. The MOJO protocol was composed of several simultaneous changes. The centerpiece of the new protocol was a drastic decrease in routine prescription of postoperative opioids (Table 1). Other changes included instructing patients to reduce the use of preoperative opioid pain medication 6 weeks before surgery with a goal of no opioid consumption, perform daily sets of preoperative exercises, and attend a preoperative consultation/education session with a nurse coordinator to emphasize early recovery and discharge. In patients with chronic use of opioid pain medication (particularly those for whom the medication had been prescribed for other sources of pain, such as lumbar back pain), the goal was daily opioid use of ≤ 30 morphine equivalent doses (MEDs). During the inpatient stay, we stopped prescribing prophylactic pain medication prior to physical therapy (PT).
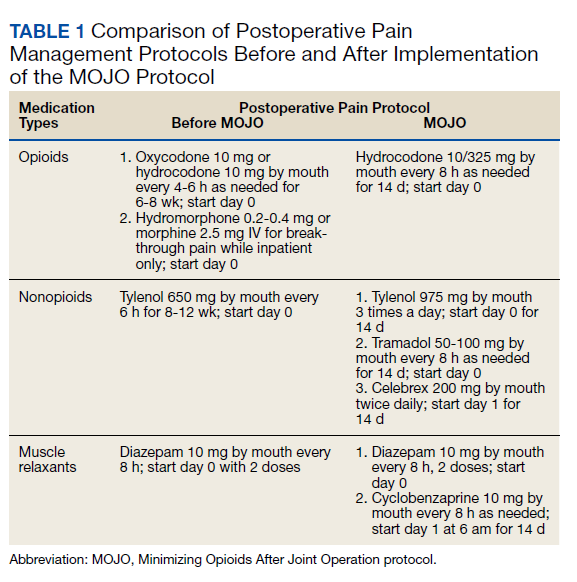
We encouraged preoperative optimization of muscle strength by giving instructions for 4 to 8 weeks of daily exercises (Appendix). We introduced perioperative adductor canal blocks (at the discretion of the anesthesia team) and transitioned to surgery without a tourniquet. Patients in both groups received intraoperative antibiotics and IV tranexamic acid (TXA); the MOJO group also received topical TXA.
Further patient care optimization included providing patients with a team-based approach, which consisted of nurse coordinators, physician assistants and nurse practitioners, residents, and the attending surgeon. Our team reviews the planned pain management protocol, perioperative expectations, criteria for discharge, and anticipated surgical outcomes with the patient during their preoperative visits. On postoperative day 1, these members round as a team to encourage patients in their immediate postoperative recovery and rehabilitation. During rounds, the team assesses whether the patient meets the criteria for discharge, adjusting the pain management protocol if necessary.
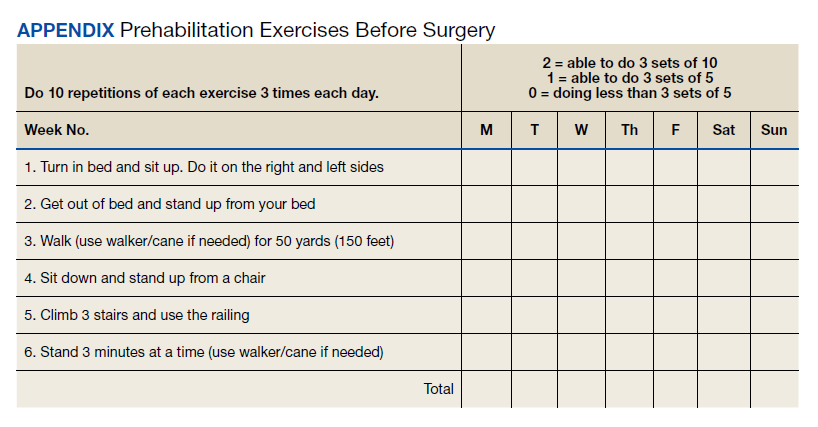
Changes in surgical technique included arthrotomy with electrocautery, minimizing traumatic dissection or resection of the synovial tissue, and intra-articular injection of a cocktail of ropivacaine 5 mg/mL 40 mL, epinephrine 1:1,000 0.5 mL, and methylprednisolone sodium 40 mg diluted with normal saline to a total volume of 120 mL.
The new routine was gradually implemented beginning January 2017 and fully implemented by July 2018. This study compared the first 20 consecutive patients undergoing primary TKA after July 2018 to the last 20 consecutive patients undergoing primary TKA prior to January 2017. Exclusion criteria included bilateral TKA, death before 90 days, and revision as the indication for surgery. The senior attending surgeon performed all surgeries using a standard midline approach. The majority of surgeries were performed using a cemented Vanguard total knee system (Zimmer Biomet); 4 patients in the historical group had a NexGen knee system, cementless monoblock tibial components (Zimmer Biomet); and 1 patient had a Logic knee system (Exactech). Surgical selection criteria for patients did not differ between groups.
Electronic health records were reviewed and data were abstracted. The data included demographic information (age, gender, body mass index [BMI], diagnosis, and procedure), surgical factors (American Society of Anesthesiologists score, Risk Assessment and Predictive Tool score, operative time, tourniquet time, estimated blood loss), hospital factors (length of stay [LOS], discharge location), postoperative pain scores (measured on postoperative day 1 and on day of discharge), and postdischarge events (90-day complications, telephone calls reporting pain, reoperations, returns to the ED, 90-day readmissions).
The primary outcome was the mean postoperative daily MED during the inpatient stay. Secondary outcomes included pain on postoperative day 1, pain at the time of discharge, LOS, hospital readmissions, and ED visits within 90 days of surgery. Because different opioid pain medications were used by patients postoperatively, all opioids were converted to MED prior to the final analysis. Collected patient data were de-identified prior to analysis.
Power analysis was conducted to determine whether the study had sufficient population size to reject the null hypothesis for the primary outcome measure. Because practitioners controlled postoperative opioid use, a Cohen’s d of 1.0 was used so that a very large effect size was needed to reach clinical significance. Statistical significance was set to 0.05, and patient groups were set at 20 patients each. This yielded an appropriate power of 0.87. Population characteristics were compared between groups using t tests and χ2 tests as appropriate. To analyze the primary outcome, comparisons were made between the 2 cohorts using 2-tailed t tests. Secondary outcomes were compared between groups using t tests or χ2 tests. All statistics were performed using R version 3.5.2. Power analysis was conducted using the package pwr.11 Statistical significance was set at
Results
Forty patients met the inclusion criteria, evenly divided between those undergoing TKA before and after instituting the MOJO protocol (Table 2). A single patient in the MOJO group died and was excluded. A patient who underwent bilateral TKA also was excluded. Both groups reflected the male predominance of the VA patient population. MOJO patients tended to have lower BMIs (34 vs 30, P < .01). All patients indicated for surgery with preoperative opioid use were able to titrate down to their preoperative goal as verified by prescriptions filled at VA pharmacies. Twelve of the patients in the MOJO group received adductor canal blocks.
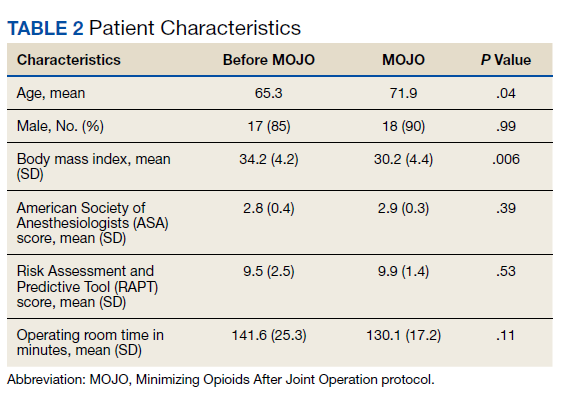
Results of t tests and χ2 tests comparing primary and secondary endpoints are listed in Table 3. Differences between the daily MEDs given in the historical and MOJO groups are shown. There were significant differences between the pre-MOJO and MOJO groups with regard to daily inpatient MEDs (82 mg vs 29 mg, P < .01) and total inpatient MEDs (306 mg vs 32 mg, P < .01). There was less self-reported pain on postoperative day 1 in the MOJO group (5.5 vs 3.9, P < .01), decreased LOS (4.4 days vs 1.2 days, P < .01), a trend toward fewer total ED visits (6 vs 2, P = .24), and fewer discharges to skilled nursing facilities (12 vs 0, P < .01). There were no blood transfusions in either group.
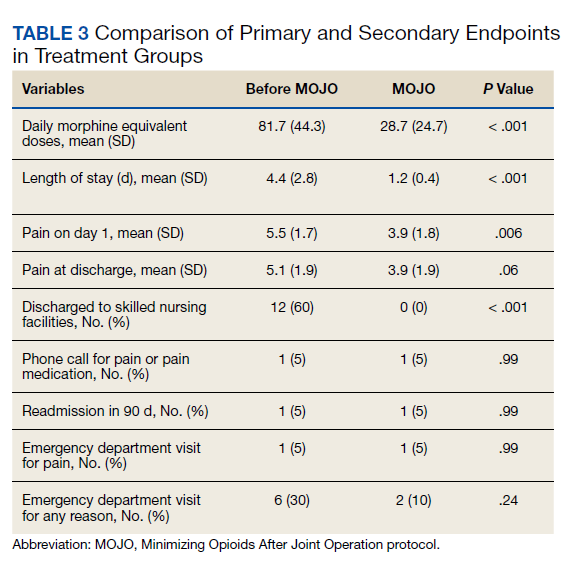
There were no readmissions due to uncontrolled pain. There was 1 readmission for shortness of breath in the MOJO group. The patient was discharged home the following day after ruling out thromboembolic and cardiovascular events. One patient from the control group was readmitted after missing a step on a staircase and falling. The patient sustained a quadriceps tendon rupture and underwent primary suture repair.
Discussion
Our results demonstrate that a multimodal approach to significantly reduce postoperative opioid use in patients with TKA is possible without increasing readmissions or ED visits for pain control. The patients in the MOJO group had a faster recovery, earlier discharge, and less use of postoperative opioid medication. Our approach to postoperative pain management was divided into 2 main categories: patient optimization and surgical optimization.
Patient Selection
Besides the standard evaluation and optimization of patients’ medical conditions, identifying and optimizing at-risk patients before surgery was a critical component of our protocol. Managing postoperative pain in patients with prior opioid use is an intractable challenge in orthopedic surgery. Patients with a history of chronic pain and preoperative use of opioid medications remain at higher risk of postoperative chronic pain and persistent use of opioid medication despite no obvious surgical complications.8 In a sample of > 6,000 veterans who underwent TKA at VA hospitals in 2014, 57% of the patients with daily use of opioids in the 90 days before surgery remained on opioids 1 year after surgery (vs 2 % in patients not on long-term opioids).8 This relationship between pre- and postoperative opioid use also was dose dependent.12
Furthermore, those with high preoperative use may experience worse outcomes relative to the opioid naive population as measured by arthritis-specific pain indices.13 In a well-powered retrospective study of patients who underwent elective orthopedic procedures, preoperative opioid abuse or dependence (determined by the International Classification of Diseases, Ninth Revision diagnosis) increased inpatient mortality, aggregate morbidity, surgical site infection, myocardial infarction, and LOS.14 Preoperative opioid use also has been associated with increased risk of ED visits, readmission, infection, stiffness, and aseptic revision.15 In patients with TKA in the VA specifically, preoperative opioid use (> 3 months in the prior year) was associated with increased revision rates that were even higher than those for patients with diabetes mellitus.16
Patient Education
Based on this evidence, we instruct patients to reduce their preoperative opioid dosing to zero (for patients with joint pain) or < 30 MED (for patients using opioids for other reasons). Although preoperative reduction of opioid use has been shown to improve outcomes after TKA, pain subspecialty recommendations for patients with chronic opioid use recommend considering adjunctive therapies, including transcutaneous electrical nerve stimulation, cognitive behavioral therapy, gabapentin, or ketamine.17,18 Through patient education our team has been successful in decreasing preoperative opioid use without adding other drugs or modalities.
Patient Optimization
Preoperative patient optimization included 4 to 8 weeks of daily sets of physical activity instructions (prehab) to improve the musculoskeletal function. These instructions are given to patients 4 to 8 weeks before surgery and aim to improve the patient’s balance, mobility, and functional ability (Appendix). Meta-analysis has shown that patients who undergo preoperative PT have a small but statistically significant decrease in postoperative pain at 4 weeks, though this does not persist beyond that period.19
We did note a lower BMI in patients in the MOJO group. Though this has the potential to be a confounder, a study of BMI in > 4,000 patients who underwent joint replacement surgery has shown that BMI is not associated with differences in postoperative pain.20
Surgeon and Surgical-Related Variables
Patients in the MOJO group had increased use of adductor canal blocks. A 2017 meta-analysis of 12,530 patients comparing analgesic modalities found that peripheral nerve blocks targeting multiple nerves (eg, femoral/sciatic) decreased pain at rest, decreased opioid consumption, and improved range of motion postoperatively.21 Also, these were found to be superior to single nerve blocks, periarticular infiltration, and epidural blocks.21 However, major nerve and epidural blocks affecting the lower extremity may increase the risk of falls and prolong LOS.22,23 The preferred peripheral block at VAPHCS is a single shot ultrasound-guided adductor canal block before the induction of general or spinal anesthesia. A randomized controlled trial has demonstrated superiority of this block to the femoral nerve block with regard to postoperative quadriceps strength, conferring the theoretical advantage of decreased fall risk and ability to participate in immediate PT.24 Although we are unable to confirm an association between anesthetic modalities and opioid burden, our clinical impression is that blocks were effective at reducing immediate postoperative pain. However, among MOJO patients there were no differences in patients with and without blocks for either pain (4.2 vs 3.8, P = .69) or opioid consumption (28.8 vs 33.0, P = .72) after surgery, though our study was not powered to detect a difference in this restricted subgroup.
Patients who frequently had reported postoperative thigh pain prompted us to make changes in our surgical technique, performing TKA without use of a tourniquet. Tourniquet use has been associated with an increased risk of thigh pain after TKA by multiple authors.25,26 Postoperative thigh pain also is pressure dependent.27 In addition, its use may be associated with a slightly increased risk of thromboembolic events and delayed functional recovery.28,29
Because postoperative hemarthrosis is associated with more pain and reduced joint recovery function, we used topical TXA to reduce postoperative surgical site and joint hematoma. TXA (either oral, IV, or topical) during TKA is used to control postoperative bleeding primarily and decrease the need for transfusion without concomitant increase in thromboembolic events.30,31 Topical TXA may be more effective than IV, particularly in the immediate postoperative period.32 Although pain typically is not an endpoint in studies of TXA, a prospective study of 48 patients showed evidence that its use may be associated with decreased postoperative pain in the first 24 hours after surgery (though not after).33 Finally, the use of intra-articular injection has evolved in our clinical practice, but literature is lacking with regard to its efficacy; more studies are needed to determine its effect relative to no injection. We have not seen any benefits to using
Limitations
This is a nonrandomized retrospective single-institution study. Our study population is composed of mostly males with military experience and is not necessarily a representative sample of the general population eligible for joint arthroplasty. Our primary endpoint (reduction of opioid use postoperatively) also was a cornerstone of our intervention. To account for this, we set a very large effect size in our power analysis and evaluated multiple secondary endpoints to determine whether postoperative pain remained well controlled and complications/readmission minimized with our interventions. Because our intervention was multimodal, our study cannot make conclusions about the effect of a particular component of our treatment strategy. We did not measure or compare functional outcomes between both groups, which offers an opportunity for further research.
These limitations are balanced by several strengths. Our cohort was well controlled with respect to the dose and type of drug used. There is staff dedicated to postoperative telephone follow-up after discharge, and veterans are apt to seek care within the VA health care system, which improves case finding for complications and ED visits. No patients were lost to follow-up. Moreover, our drastic reduction in opioid use is promising enough to warrant reporting, while the broader orthopedic literature explores the relative impact of each variable.
Conclusions
The MOJO protocol has been effective for reducing postoperative opioid use after TKA without compromising effective pain management. The drastic reduction in the postoperative use of opioid pain medications and LOS have contributed to a cultural shift within our department, comprehensive team approach, multimodal pain management, and preoperative patient optimization. Further investigations are required to assess the impact of each intervention on observed outcomes. However, the framework and routines are applicable to other institutions and surgical specialties.
Acknowledgments
The authors recognize Derek Bond, MD, for his help in creating the MOJO acronym.
1. Hedegaard H, Miniño AM, Warner M. Drug overdose deaths in the United States, 1999-2017. U.S. Department of Health and Human Services, Centers for Disease Control and Prevention, National Center for Health Statistics Data Brief No. 329. Published November 2018. Accessed January 12, 2021. https://www.cdc.gov/nchs/data/databriefs/db329-h.pdf
2. Hedegaard H, Warner M, Miniño AM. Drug overdose deaths in the United States, 1999-2016. U.S. Department of Health and Human Services, Centers for Disease Control and Prevention, National Center for Health Statistics NCHS data brief No. 294. Published December 2017. Accessed January 12, 2021. https://www.cdc.gov/nchs/data/databriefs/db294.pdf
3. Levy B, Paulozzi L, Mack KA, Jones CM. Trends in opioid analgesic–prescribing rates by specialty, U.S., 2007-2012. Am J Prev Med. 2015;49(3):409-413. doi:10.1016/j.amepre.2015.02.020
4. Guy GP, Zhang K. Opioid prescribing by specialty and volume in the U.S. Am J Prev Med. 2018;55(5):e153-155. doi:10.1016/j.amepre.2018.06.008
5. Kremers HM, Larson DR, Crowson CS, et al. Prevalence of total hip and knee replacement in the United States. J Bone Joint Surgery Am. 2015;17:1386-1397. doi:10.2106/JBJS.N.01141
6. Giori NJ, Amanatullah DF, Gupta S, Bowe T, Harris AHS. Risk reduction compared with access to care: quantifying the trade-off of enforcing a body mass index eligibility criterion for joint replacement. J Bone Joint Surg Am. 2018; 4(100):539-545. doi:10.2106/JBJS.17.00120
7. Sabatino MJ, Kunkel ST, Ramkumar DB, Keeney BJ, Jevsevar DS. Excess opioid medication and variation in prescribing patterns following common orthopaedic procedures. J Bone Joint Surg Am. 2018;100(3):180-188. doi:10.2106/JBJS.17.00672
8. Hadlandsmyth K, Vander Weg MW, McCoy KD, Mosher HJ, Vaughan-Sarrazin MS, Lund BC. Risk for prolonged opioid use following total knee arthroplasty in veterans. J Arthroplasty. 2018;33(1):119-123. doi:10.1016/j.arth.2017.08.022
9. Bohnert ASB, Valenstein M, Bair MJ, et al. Association between opioid prescribing patterns and opioid overdose-related deaths. JAMA. 2011;305(13):1315-1321. doi:10.1001/jama.2011.370
10. Hall MJ, Schwartzman A, Zhang J, Liu X. Ambulatory surgery data from hospitals and ambulatory surgery centers: United States, 2010. Natl Health Stat Report. 2017(102):1-15.
11. Champely S. pwr: basic functions for power analysis. R package version 1.2-2; 2018. Accessed January 13, 2021. https://rdrr.io/cran/pwr/
12. Goesling J, Moser SE, Zaidi B, et al. Trends and predictors of opioid use after total knee and total hip arthroplasty. Pain. 2016;157(6):1259-1265. doi:10.1097/j.pain.0000000000000516
13. Smith SR, Bido J, Collins JE, Yang H, Katz JN, Losina E. Impact of preoperative opioid use on total knee arthroplasty outcomes. J Bone Joint Surg Am. 2017;99(10):803-808. doi:10.2106/JBJS.16.01200
14. Menendez ME, Ring D, Bateman BT. Preoperative opioid misuse is associated with increased morbidity and mortality after elective orthopaedic surgery. Clin Orthop Relat Res. 2015;473(7):2402-412. doi:10.1007/s11999-015-4173-5
15. Cancienne JM, Patel KJ, Browne JA, Werner BC. Narcotic use and total knee arthroplasty. J Arthroplasty. 2018;33(1):113-118. doi:10.1016/j.arth.2017.08.006
16. Ben-Ari A, Chansky H, Rozet I. Preoperative opioid use is associated with early revision after total knee arthroplasty: a study of male patients treated in the Veterans Affairs System. J Bone Joint Surg Am. 2017;99(1):1-9. doi:10.2106/JBJS.16.00167
17. Nguyen L-CL, Sing DC, Bozic KJ. Preoperative reduction of opioid use before total joint arthroplasty. J Arthroplasty. 2016;31(suppl 9):282-287. doi:10.1016/j.arth.2016.01.068
18. Chou R, Gordon DB, de Leon-Casasola OA, et al. Management of postoperative pain: a clinical practice guideline from the American Pain Society, the American Society of Regional Anesthesia and Pain Medicine, and the American Society of Anesthesiologists’ Committee on Regional Anesthesia, Executive Committee, and Administrative Council. J Pain. 2016;17(2):131-157. doi:10.1016/j.jpain.2015.12.008
19. Wang L, Lee M, Zhang Z, Moodie J, Cheng D, Martin J. Does preoperative rehabilitation for patients planning to undergo joint replacement surgery improve outcomes? A systematic review and meta-analysis of randomised controlled trials. BMJ Open. 2016;6(2):e009857. doi:10.1136/bmjopen-2015-009857
20. Li W, Ayers DC, Lewis CG, Bowen TR, Allison JJ, Franklin PD. Functional gain and pain relief after total joint replacement according to obesity status. J Bone Joint Surg. 2017;99(14):1183-1189. doi:10.2106/JBJS.16.00960
21. Terkawi AS, Mavridis D, Sessler DI, et al. Pain management modalities after total knee arthroplasty: a network meta-analysis of 170 randomized controlled trials. Anesthesiology. 2017;126(5):923-937. doi:10.1097/ALN.0000000000001607
22. Ilfeld BM, Duke KB, Donohue MC. The association between lower extremity continuous peripheral nerve blocks and patient falls after knee and hip arthroplasty. Anesth Analg. 2010;111(6):1552-1554. doi:10.1213/ANE.0b013e3181fb9507
23. Elkassabany NM, Antosh S, Ahmed M, et al. The risk of falls after total knee arthroplasty with the use of a femoral nerve block versus an adductor canal block. Anest Analg. 2016;122(5):1696-1703. doi:10.1213/ane.0000000000001237
24. Wang D, Yang Y, Li Q, et al. Adductor canal block versus femoral nerve block for total knee arthroplasty: a meta-analysis of randomized controlled trials. Sci Rep. 2017;7:40721. doi:10.1038/srep40721
25. Liu D, Graham D, Gillies K, Gillies RM. Effects of tourniquet use on quadriceps function and pain in total knee arthroplasty. Knee Surg Relat Res. 2014;26(4):207-213. doi:10.5792/ksrr.2014.26.4.207
26. Abdel-Salam A, Eyres KS. Effects of tourniquet during total knee arthroplasty. A prospective randomised study. J Bone Joint Surg Br. 1995;77(2):250-253.
27. Worland RL, Arredondo J, Angles F, Lopez-Jimenez F, Jessup DE. Thigh pain following tourniquet application in simultaneous bilateral total knee replacement arthroplasty. J Arthroplasty. 1997;12(8):848-852. doi:10.1016/s0883-5403(97)90153-4
28. Tai T-W, Lin C-J, Jou I-M, Chang C-W, Lai K-A, Yang C-Y. Tourniquet use in total knee arthroplasty: a meta-analysis. Knee Surg Sports Traumatol, Arthrosc. 2011;19(7):1121-1130. doi:10.1007/s00167-010-1342-7
29. Jiang F-Z, Zhong H-M, Hong Y-C, Zhao G-F. Use of a tourniquet in total knee arthroplasty: a systematic review and meta-analysis of randomized controlled trials. J Orthop Sci. 2015;20(21):110-123. doi:10.1007/s00776-014-0664-6
30. Alshryda S, Sarda P, Sukeik M, Nargol A, Blenkinsopp J, Mason JM. Tranexamic acid in total knee replacement: a systematic review and meta-analysis. J Bone Joint Surg Br. 2011;93(12):1577-1585. doi:10.1302/0301-620X.93B12.26989
31. Panteli M, Papakostidis C, Dahabreh Z, Giannoudis PV. Topical tranexamic acid in total knee replacement: a systematic review and meta-analysis. Knee. 2013;20(5):300-309. doi:10.1016/j.knee.2013.05.014
32. Wang J, Wang Q, Zhang X, Wang Q. Intra-articular application is more effective than intravenous application of tranexamic acid in total knee arthroplasty: a prospective randomized controlled trial. J Arthroplasty. 2017;32(11):3385-3389. doi:10.1016/j.arth.2017.06.024
33. Guerreiro JPF, Badaro BS, Balbino JRM, Danieli MV, Queiroz AO, Cataneo DC. Application of tranexamic acid in total knee arthroplasty – prospective randomized trial. J Open Orthop J. 2017;11:1049-1057. doi:10.2174/1874325001711011049
For decades, opioids have been a mainstay in the management of pain after total joint arthroplasty. In the past 10 years, however, opioid prescribing has come under increased scrutiny due to a rise in rates of opioid abuse, pill diversion, and opioid-related deaths.1,2 Opioids are associated with adverse effects, including nausea, vomiting, constipation, apathy, and respiratory depression, all of which influence arthroplasty outcomes and affect the patient experience. Although primary care groups account for nearly half of prescriptions written, orthopedic surgeons have the third highest per capita rate of opioid prescribing of all medical specialties.3,4 This puts orthopedic surgeons, particularly those who perform routine procedures, in an opportune but challenging position to confront this problem through novel pain management strategies.
Approximately 1 million total knee arthroplasties (TKAs) are performed in the US every year, and the US Department of Veterans Affairs (VA) health system performs about 10,000 hip and knee joint replacements.5,6 There is no standardization of opioid prescribing in the postoperative period following these procedures, and studies have reported a wide variation in prescribing habits even within a single institution for a specific surgery.7 Patients who undergo TKA are at particularly high risk of long-term opioid use if they are on continuous opioids at the time of surgery; this is problematic in a VA patient population in which at least 16% of patients are prescribed opioids in a given year.8 Furthermore, veterans are twice as likely as nonveterans to die of an accidental overdose.9 Despite these risks, opioids remain a cornerstone of postoperative pain management both within and outside of the VA.10
In 2018, to limit unnecessary prescribing of opioid pain medication, the total joint service at the VA Portland Health Care System (VAPHCS) in Oregon implemented the Minimizing Opioids after Joint Operation (MOJO) postoperative pain protocol. The goal of the protocol was to reduce opioid use following TKA. The objectives were to provide safe, appropriate analgesia while allowing early mobilization and discharge without a concomitant increase in readmissions or emergency department (ED) visits. The purpose of this retrospective chart review was to compare the efficacy of the MOJO protocol with our historical experience and report our preliminary results.
Methods
Institutional review board approval was obtained to retrospectively review the medical records of patients who had undergone TKA surgery during 2018 at VAPHCS. The MOJO protocol was composed of several simultaneous changes. The centerpiece of the new protocol was a drastic decrease in routine prescription of postoperative opioids (Table 1). Other changes included instructing patients to reduce the use of preoperative opioid pain medication 6 weeks before surgery with a goal of no opioid consumption, perform daily sets of preoperative exercises, and attend a preoperative consultation/education session with a nurse coordinator to emphasize early recovery and discharge. In patients with chronic use of opioid pain medication (particularly those for whom the medication had been prescribed for other sources of pain, such as lumbar back pain), the goal was daily opioid use of ≤ 30 morphine equivalent doses (MEDs). During the inpatient stay, we stopped prescribing prophylactic pain medication prior to physical therapy (PT).
We encouraged preoperative optimization of muscle strength by giving instructions for 4 to 8 weeks of daily exercises (Appendix). We introduced perioperative adductor canal blocks (at the discretion of the anesthesia team) and transitioned to surgery without a tourniquet. Patients in both groups received intraoperative antibiotics and IV tranexamic acid (TXA); the MOJO group also received topical TXA.
Further patient care optimization included providing patients with a team-based approach, which consisted of nurse coordinators, physician assistants and nurse practitioners, residents, and the attending surgeon. Our team reviews the planned pain management protocol, perioperative expectations, criteria for discharge, and anticipated surgical outcomes with the patient during their preoperative visits. On postoperative day 1, these members round as a team to encourage patients in their immediate postoperative recovery and rehabilitation. During rounds, the team assesses whether the patient meets the criteria for discharge, adjusting the pain management protocol if necessary.
Changes in surgical technique included arthrotomy with electrocautery, minimizing traumatic dissection or resection of the synovial tissue, and intra-articular injection of a cocktail of ropivacaine 5 mg/mL 40 mL, epinephrine 1:1,000 0.5 mL, and methylprednisolone sodium 40 mg diluted with normal saline to a total volume of 120 mL.
The new routine was gradually implemented beginning January 2017 and fully implemented by July 2018. This study compared the first 20 consecutive patients undergoing primary TKA after July 2018 to the last 20 consecutive patients undergoing primary TKA prior to January 2017. Exclusion criteria included bilateral TKA, death before 90 days, and revision as the indication for surgery. The senior attending surgeon performed all surgeries using a standard midline approach. The majority of surgeries were performed using a cemented Vanguard total knee system (Zimmer Biomet); 4 patients in the historical group had a NexGen knee system, cementless monoblock tibial components (Zimmer Biomet); and 1 patient had a Logic knee system (Exactech). Surgical selection criteria for patients did not differ between groups.
Electronic health records were reviewed and data were abstracted. The data included demographic information (age, gender, body mass index [BMI], diagnosis, and procedure), surgical factors (American Society of Anesthesiologists score, Risk Assessment and Predictive Tool score, operative time, tourniquet time, estimated blood loss), hospital factors (length of stay [LOS], discharge location), postoperative pain scores (measured on postoperative day 1 and on day of discharge), and postdischarge events (90-day complications, telephone calls reporting pain, reoperations, returns to the ED, 90-day readmissions).
The primary outcome was the mean postoperative daily MED during the inpatient stay. Secondary outcomes included pain on postoperative day 1, pain at the time of discharge, LOS, hospital readmissions, and ED visits within 90 days of surgery. Because different opioid pain medications were used by patients postoperatively, all opioids were converted to MED prior to the final analysis. Collected patient data were de-identified prior to analysis.
Power analysis was conducted to determine whether the study had sufficient population size to reject the null hypothesis for the primary outcome measure. Because practitioners controlled postoperative opioid use, a Cohen’s d of 1.0 was used so that a very large effect size was needed to reach clinical significance. Statistical significance was set to 0.05, and patient groups were set at 20 patients each. This yielded an appropriate power of 0.87. Population characteristics were compared between groups using t tests and χ2 tests as appropriate. To analyze the primary outcome, comparisons were made between the 2 cohorts using 2-tailed t tests. Secondary outcomes were compared between groups using t tests or χ2 tests. All statistics were performed using R version 3.5.2. Power analysis was conducted using the package pwr.11 Statistical significance was set at
Results
Forty patients met the inclusion criteria, evenly divided between those undergoing TKA before and after instituting the MOJO protocol (Table 2). A single patient in the MOJO group died and was excluded. A patient who underwent bilateral TKA also was excluded. Both groups reflected the male predominance of the VA patient population. MOJO patients tended to have lower BMIs (34 vs 30, P < .01). All patients indicated for surgery with preoperative opioid use were able to titrate down to their preoperative goal as verified by prescriptions filled at VA pharmacies. Twelve of the patients in the MOJO group received adductor canal blocks.
Results of t tests and χ2 tests comparing primary and secondary endpoints are listed in Table 3. Differences between the daily MEDs given in the historical and MOJO groups are shown. There were significant differences between the pre-MOJO and MOJO groups with regard to daily inpatient MEDs (82 mg vs 29 mg, P < .01) and total inpatient MEDs (306 mg vs 32 mg, P < .01). There was less self-reported pain on postoperative day 1 in the MOJO group (5.5 vs 3.9, P < .01), decreased LOS (4.4 days vs 1.2 days, P < .01), a trend toward fewer total ED visits (6 vs 2, P = .24), and fewer discharges to skilled nursing facilities (12 vs 0, P < .01). There were no blood transfusions in either group.
There were no readmissions due to uncontrolled pain. There was 1 readmission for shortness of breath in the MOJO group. The patient was discharged home the following day after ruling out thromboembolic and cardiovascular events. One patient from the control group was readmitted after missing a step on a staircase and falling. The patient sustained a quadriceps tendon rupture and underwent primary suture repair.
Discussion
Our results demonstrate that a multimodal approach to significantly reduce postoperative opioid use in patients with TKA is possible without increasing readmissions or ED visits for pain control. The patients in the MOJO group had a faster recovery, earlier discharge, and less use of postoperative opioid medication. Our approach to postoperative pain management was divided into 2 main categories: patient optimization and surgical optimization.
Patient Selection
Besides the standard evaluation and optimization of patients’ medical conditions, identifying and optimizing at-risk patients before surgery was a critical component of our protocol. Managing postoperative pain in patients with prior opioid use is an intractable challenge in orthopedic surgery. Patients with a history of chronic pain and preoperative use of opioid medications remain at higher risk of postoperative chronic pain and persistent use of opioid medication despite no obvious surgical complications.8 In a sample of > 6,000 veterans who underwent TKA at VA hospitals in 2014, 57% of the patients with daily use of opioids in the 90 days before surgery remained on opioids 1 year after surgery (vs 2 % in patients not on long-term opioids).8 This relationship between pre- and postoperative opioid use also was dose dependent.12
Furthermore, those with high preoperative use may experience worse outcomes relative to the opioid naive population as measured by arthritis-specific pain indices.13 In a well-powered retrospective study of patients who underwent elective orthopedic procedures, preoperative opioid abuse or dependence (determined by the International Classification of Diseases, Ninth Revision diagnosis) increased inpatient mortality, aggregate morbidity, surgical site infection, myocardial infarction, and LOS.14 Preoperative opioid use also has been associated with increased risk of ED visits, readmission, infection, stiffness, and aseptic revision.15 In patients with TKA in the VA specifically, preoperative opioid use (> 3 months in the prior year) was associated with increased revision rates that were even higher than those for patients with diabetes mellitus.16
Patient Education
Based on this evidence, we instruct patients to reduce their preoperative opioid dosing to zero (for patients with joint pain) or < 30 MED (for patients using opioids for other reasons). Although preoperative reduction of opioid use has been shown to improve outcomes after TKA, pain subspecialty recommendations for patients with chronic opioid use recommend considering adjunctive therapies, including transcutaneous electrical nerve stimulation, cognitive behavioral therapy, gabapentin, or ketamine.17,18 Through patient education our team has been successful in decreasing preoperative opioid use without adding other drugs or modalities.
Patient Optimization
Preoperative patient optimization included 4 to 8 weeks of daily sets of physical activity instructions (prehab) to improve the musculoskeletal function. These instructions are given to patients 4 to 8 weeks before surgery and aim to improve the patient’s balance, mobility, and functional ability (Appendix). Meta-analysis has shown that patients who undergo preoperative PT have a small but statistically significant decrease in postoperative pain at 4 weeks, though this does not persist beyond that period.19
We did note a lower BMI in patients in the MOJO group. Though this has the potential to be a confounder, a study of BMI in > 4,000 patients who underwent joint replacement surgery has shown that BMI is not associated with differences in postoperative pain.20
Surgeon and Surgical-Related Variables
Patients in the MOJO group had increased use of adductor canal blocks. A 2017 meta-analysis of 12,530 patients comparing analgesic modalities found that peripheral nerve blocks targeting multiple nerves (eg, femoral/sciatic) decreased pain at rest, decreased opioid consumption, and improved range of motion postoperatively.21 Also, these were found to be superior to single nerve blocks, periarticular infiltration, and epidural blocks.21 However, major nerve and epidural blocks affecting the lower extremity may increase the risk of falls and prolong LOS.22,23 The preferred peripheral block at VAPHCS is a single shot ultrasound-guided adductor canal block before the induction of general or spinal anesthesia. A randomized controlled trial has demonstrated superiority of this block to the femoral nerve block with regard to postoperative quadriceps strength, conferring the theoretical advantage of decreased fall risk and ability to participate in immediate PT.24 Although we are unable to confirm an association between anesthetic modalities and opioid burden, our clinical impression is that blocks were effective at reducing immediate postoperative pain. However, among MOJO patients there were no differences in patients with and without blocks for either pain (4.2 vs 3.8, P = .69) or opioid consumption (28.8 vs 33.0, P = .72) after surgery, though our study was not powered to detect a difference in this restricted subgroup.
Patients who frequently had reported postoperative thigh pain prompted us to make changes in our surgical technique, performing TKA without use of a tourniquet. Tourniquet use has been associated with an increased risk of thigh pain after TKA by multiple authors.25,26 Postoperative thigh pain also is pressure dependent.27 In addition, its use may be associated with a slightly increased risk of thromboembolic events and delayed functional recovery.28,29
Because postoperative hemarthrosis is associated with more pain and reduced joint recovery function, we used topical TXA to reduce postoperative surgical site and joint hematoma. TXA (either oral, IV, or topical) during TKA is used to control postoperative bleeding primarily and decrease the need for transfusion without concomitant increase in thromboembolic events.30,31 Topical TXA may be more effective than IV, particularly in the immediate postoperative period.32 Although pain typically is not an endpoint in studies of TXA, a prospective study of 48 patients showed evidence that its use may be associated with decreased postoperative pain in the first 24 hours after surgery (though not after).33 Finally, the use of intra-articular injection has evolved in our clinical practice, but literature is lacking with regard to its efficacy; more studies are needed to determine its effect relative to no injection. We have not seen any benefits to using
Limitations
This is a nonrandomized retrospective single-institution study. Our study population is composed of mostly males with military experience and is not necessarily a representative sample of the general population eligible for joint arthroplasty. Our primary endpoint (reduction of opioid use postoperatively) also was a cornerstone of our intervention. To account for this, we set a very large effect size in our power analysis and evaluated multiple secondary endpoints to determine whether postoperative pain remained well controlled and complications/readmission minimized with our interventions. Because our intervention was multimodal, our study cannot make conclusions about the effect of a particular component of our treatment strategy. We did not measure or compare functional outcomes between both groups, which offers an opportunity for further research.
These limitations are balanced by several strengths. Our cohort was well controlled with respect to the dose and type of drug used. There is staff dedicated to postoperative telephone follow-up after discharge, and veterans are apt to seek care within the VA health care system, which improves case finding for complications and ED visits. No patients were lost to follow-up. Moreover, our drastic reduction in opioid use is promising enough to warrant reporting, while the broader orthopedic literature explores the relative impact of each variable.
Conclusions
The MOJO protocol has been effective for reducing postoperative opioid use after TKA without compromising effective pain management. The drastic reduction in the postoperative use of opioid pain medications and LOS have contributed to a cultural shift within our department, comprehensive team approach, multimodal pain management, and preoperative patient optimization. Further investigations are required to assess the impact of each intervention on observed outcomes. However, the framework and routines are applicable to other institutions and surgical specialties.
Acknowledgments
The authors recognize Derek Bond, MD, for his help in creating the MOJO acronym.
1. Hedegaard H, Miniño AM, Warner M. Drug overdose deaths in the United States, 1999-2017. U.S. Department of Health and Human Services, Centers for Disease Control and Prevention, National Center for Health Statistics Data Brief No. 329. Published November 2018. Accessed January 12, 2021. https://www.cdc.gov/nchs/data/databriefs/db329-h.pdf
2. Hedegaard H, Warner M, Miniño AM. Drug overdose deaths in the United States, 1999-2016. U.S. Department of Health and Human Services, Centers for Disease Control and Prevention, National Center for Health Statistics NCHS data brief No. 294. Published December 2017. Accessed January 12, 2021. https://www.cdc.gov/nchs/data/databriefs/db294.pdf
3. Levy B, Paulozzi L, Mack KA, Jones CM. Trends in opioid analgesic–prescribing rates by specialty, U.S., 2007-2012. Am J Prev Med. 2015;49(3):409-413. doi:10.1016/j.amepre.2015.02.020
4. Guy GP, Zhang K. Opioid prescribing by specialty and volume in the U.S. Am J Prev Med. 2018;55(5):e153-155. doi:10.1016/j.amepre.2018.06.008
5. Kremers HM, Larson DR, Crowson CS, et al. Prevalence of total hip and knee replacement in the United States. J Bone Joint Surgery Am. 2015;17:1386-1397. doi:10.2106/JBJS.N.01141
6. Giori NJ, Amanatullah DF, Gupta S, Bowe T, Harris AHS. Risk reduction compared with access to care: quantifying the trade-off of enforcing a body mass index eligibility criterion for joint replacement. J Bone Joint Surg Am. 2018; 4(100):539-545. doi:10.2106/JBJS.17.00120
7. Sabatino MJ, Kunkel ST, Ramkumar DB, Keeney BJ, Jevsevar DS. Excess opioid medication and variation in prescribing patterns following common orthopaedic procedures. J Bone Joint Surg Am. 2018;100(3):180-188. doi:10.2106/JBJS.17.00672
8. Hadlandsmyth K, Vander Weg MW, McCoy KD, Mosher HJ, Vaughan-Sarrazin MS, Lund BC. Risk for prolonged opioid use following total knee arthroplasty in veterans. J Arthroplasty. 2018;33(1):119-123. doi:10.1016/j.arth.2017.08.022
9. Bohnert ASB, Valenstein M, Bair MJ, et al. Association between opioid prescribing patterns and opioid overdose-related deaths. JAMA. 2011;305(13):1315-1321. doi:10.1001/jama.2011.370
10. Hall MJ, Schwartzman A, Zhang J, Liu X. Ambulatory surgery data from hospitals and ambulatory surgery centers: United States, 2010. Natl Health Stat Report. 2017(102):1-15.
11. Champely S. pwr: basic functions for power analysis. R package version 1.2-2; 2018. Accessed January 13, 2021. https://rdrr.io/cran/pwr/
12. Goesling J, Moser SE, Zaidi B, et al. Trends and predictors of opioid use after total knee and total hip arthroplasty. Pain. 2016;157(6):1259-1265. doi:10.1097/j.pain.0000000000000516
13. Smith SR, Bido J, Collins JE, Yang H, Katz JN, Losina E. Impact of preoperative opioid use on total knee arthroplasty outcomes. J Bone Joint Surg Am. 2017;99(10):803-808. doi:10.2106/JBJS.16.01200
14. Menendez ME, Ring D, Bateman BT. Preoperative opioid misuse is associated with increased morbidity and mortality after elective orthopaedic surgery. Clin Orthop Relat Res. 2015;473(7):2402-412. doi:10.1007/s11999-015-4173-5
15. Cancienne JM, Patel KJ, Browne JA, Werner BC. Narcotic use and total knee arthroplasty. J Arthroplasty. 2018;33(1):113-118. doi:10.1016/j.arth.2017.08.006
16. Ben-Ari A, Chansky H, Rozet I. Preoperative opioid use is associated with early revision after total knee arthroplasty: a study of male patients treated in the Veterans Affairs System. J Bone Joint Surg Am. 2017;99(1):1-9. doi:10.2106/JBJS.16.00167
17. Nguyen L-CL, Sing DC, Bozic KJ. Preoperative reduction of opioid use before total joint arthroplasty. J Arthroplasty. 2016;31(suppl 9):282-287. doi:10.1016/j.arth.2016.01.068
18. Chou R, Gordon DB, de Leon-Casasola OA, et al. Management of postoperative pain: a clinical practice guideline from the American Pain Society, the American Society of Regional Anesthesia and Pain Medicine, and the American Society of Anesthesiologists’ Committee on Regional Anesthesia, Executive Committee, and Administrative Council. J Pain. 2016;17(2):131-157. doi:10.1016/j.jpain.2015.12.008
19. Wang L, Lee M, Zhang Z, Moodie J, Cheng D, Martin J. Does preoperative rehabilitation for patients planning to undergo joint replacement surgery improve outcomes? A systematic review and meta-analysis of randomised controlled trials. BMJ Open. 2016;6(2):e009857. doi:10.1136/bmjopen-2015-009857
20. Li W, Ayers DC, Lewis CG, Bowen TR, Allison JJ, Franklin PD. Functional gain and pain relief after total joint replacement according to obesity status. J Bone Joint Surg. 2017;99(14):1183-1189. doi:10.2106/JBJS.16.00960
21. Terkawi AS, Mavridis D, Sessler DI, et al. Pain management modalities after total knee arthroplasty: a network meta-analysis of 170 randomized controlled trials. Anesthesiology. 2017;126(5):923-937. doi:10.1097/ALN.0000000000001607
22. Ilfeld BM, Duke KB, Donohue MC. The association between lower extremity continuous peripheral nerve blocks and patient falls after knee and hip arthroplasty. Anesth Analg. 2010;111(6):1552-1554. doi:10.1213/ANE.0b013e3181fb9507
23. Elkassabany NM, Antosh S, Ahmed M, et al. The risk of falls after total knee arthroplasty with the use of a femoral nerve block versus an adductor canal block. Anest Analg. 2016;122(5):1696-1703. doi:10.1213/ane.0000000000001237
24. Wang D, Yang Y, Li Q, et al. Adductor canal block versus femoral nerve block for total knee arthroplasty: a meta-analysis of randomized controlled trials. Sci Rep. 2017;7:40721. doi:10.1038/srep40721
25. Liu D, Graham D, Gillies K, Gillies RM. Effects of tourniquet use on quadriceps function and pain in total knee arthroplasty. Knee Surg Relat Res. 2014;26(4):207-213. doi:10.5792/ksrr.2014.26.4.207
26. Abdel-Salam A, Eyres KS. Effects of tourniquet during total knee arthroplasty. A prospective randomised study. J Bone Joint Surg Br. 1995;77(2):250-253.
27. Worland RL, Arredondo J, Angles F, Lopez-Jimenez F, Jessup DE. Thigh pain following tourniquet application in simultaneous bilateral total knee replacement arthroplasty. J Arthroplasty. 1997;12(8):848-852. doi:10.1016/s0883-5403(97)90153-4
28. Tai T-W, Lin C-J, Jou I-M, Chang C-W, Lai K-A, Yang C-Y. Tourniquet use in total knee arthroplasty: a meta-analysis. Knee Surg Sports Traumatol, Arthrosc. 2011;19(7):1121-1130. doi:10.1007/s00167-010-1342-7
29. Jiang F-Z, Zhong H-M, Hong Y-C, Zhao G-F. Use of a tourniquet in total knee arthroplasty: a systematic review and meta-analysis of randomized controlled trials. J Orthop Sci. 2015;20(21):110-123. doi:10.1007/s00776-014-0664-6
30. Alshryda S, Sarda P, Sukeik M, Nargol A, Blenkinsopp J, Mason JM. Tranexamic acid in total knee replacement: a systematic review and meta-analysis. J Bone Joint Surg Br. 2011;93(12):1577-1585. doi:10.1302/0301-620X.93B12.26989
31. Panteli M, Papakostidis C, Dahabreh Z, Giannoudis PV. Topical tranexamic acid in total knee replacement: a systematic review and meta-analysis. Knee. 2013;20(5):300-309. doi:10.1016/j.knee.2013.05.014
32. Wang J, Wang Q, Zhang X, Wang Q. Intra-articular application is more effective than intravenous application of tranexamic acid in total knee arthroplasty: a prospective randomized controlled trial. J Arthroplasty. 2017;32(11):3385-3389. doi:10.1016/j.arth.2017.06.024
33. Guerreiro JPF, Badaro BS, Balbino JRM, Danieli MV, Queiroz AO, Cataneo DC. Application of tranexamic acid in total knee arthroplasty – prospective randomized trial. J Open Orthop J. 2017;11:1049-1057. doi:10.2174/1874325001711011049
A Multi-Membership Approach for Attributing Patient-Level Outcomes to Providers in an Inpatient Setting
From Banner Health Corporation, Phoenix, AZ.
Background: Health care providers are routinely incentivized with pay-for-performance (P4P) metrics to increase the quality of care. In an inpatient setting, P4P models typically measure quality by attributing each patient’s outcome to a single provider even though many providers routinely care for the patient. This study investigates a new attribution approach aiming to distribute each outcome across all providers who provided care.
Methods: The methodology relies on a multi-membership model and is demonstrated in the Banner Health system using 3 clinical outcome measures (length of stay, 30-day readmissions, and mortality) and responses to 3 survey questions that measure a patient’s perception of their care. The new approach is compared to the “standard” method, which attributes each patient to only 1 provider.
Results: When ranking by clinical outcomes, both methods were concordant 72.1% to 82.1% of the time for top-half/bottom-half rankings, with a median percentile difference between 7 and 15. When ranking by survey scores, there was more agreement, with concordance between 84.1% and 86.6% and a median percentile difference between 11 and 13. Last, Pearson correlation coefficients of the paired percentiles ranged from 0.56 to 0.78.
Conclusion: The new approach provides a fairer solution when measuring provider performance.
Keywords: patient attribution; PAMM; PAPR; random effect model; pay for performance.
Providers practicing in hospitals are routinely evaluated based on their performance and, in many cases, are financially incentivized for a better-than-average performance within a pay-for-performance (P4P) model. The use of P4P models is based on the belief that they will “improve, motivate, and enhance providers to pursue aggressively and ultimately achieve the quality performance targets thus decreasing the number of medical errors with less malpractice events.”1 Although P4P models continue to be a movement in health care, they have been challenging to implement.
One concern involves the general quality of implementation, such as defining metrics and targets, setting payout amounts, managing technology and market conditions, and gauging the level of transparency to the provider.2 Another challenge, and the focus of this project, are concerns around measuring performance to avoid perceptions of unfairness. This concern can be minimized if the attribution is handled in a fairer way, by spreading it across all providers who affected the outcome, both in a positive or negative direction.3
To implement these models, the performance of providers needs to be measured and tracked periodically. This requires linking, or attributing, a patient’s outcome to a provider, which is almost always the attending or discharging provider (ie, a single provider).3 In this single-provider attribution approach, one provider will receive all the credit (good or bad) for their respective patients’ outcomes, even though the provider may have seen the patient only a fraction of the time during the hospitalization. Attributing outcomes—for example, length of stay (LOS), readmission rate, mortality rate, net promoter score (NPS)—using this approach reduces the validity of metrics designed to measure provider performance, especially in a rotating provider environment where many providers interact with and care for a patient. For example, the quality of providers’ interpersonal skills and competence were among the strongest determinants of patient satisfaction,4 but it is not credible that this is solely based on the last provider during a hospitalization.
Proportionally distributing the attribution of an outcome has been used successfully in other contexts. Typically, a statistical modeling approach using a multi-membership framework is used because it can handle the sometimes-complicated relationships within the hierarchy. It also allows for auxiliary variables to be introduced, which can help explain and control for exogenous effects.5-7 For example, in the education setting, standardized testing is administered to students at defined years of schooling: at grades 4, 8, and 10, for instance. The progress of students, measured as the academic gains between test years, are proportionally attributed to all the teachers who the student has had between the test years. These partial attributions are combined to evaluate an overall teacher performance.8,9
Although the multi-membership framework has been used in other industries, it has yet to be applied in measuring provider performance. The purpose of this project is to investigate the impact of using a multi-provider approach compared to the standard single-provider approach. The findings may lead to modifications in the way a provider’s performance is measured and, thus, how providers are compensated. A similar study investigated the impact of proportionally distributing patients’ outcomes across all rotating providers using a weighting method based on billing practices to measure the partial impact of each provider.3
This study is different in 2 fundamental ways. First, attribution is weighted based on the number of clinically documented interactions (via clinical notes) between a patient and all rotating providers during the hospitalization. Second, performance is measured via multi-membership models, which can estimate the effect (both positive and negative) that a provider has on an outcome, even when caring for a patient a fraction of the time during the hospitalization.
Methods
Setting
Banner Health is a non-profit, multi-hospital health care system across 6 states in the western United States that is uniquely positioned to study provider quality attribution models. It not only has a large number of providers and serves a broad patient population, but Banner Health also uses an instance of Cerner (Kansas City, MO), an enterprise-level electronic health record (EHR) system that connects all its facilities and allows for advanced analytics across its system.
For this study, we included only general medicine and surgery patients admitted and discharged from the inpatient setting between January 1, 2018, and December 31, 2018, who were between 18 and 89 years old at admission, and who had a LOS between 1 and 14 days. Visit- and patient-level data were collected from Cerner, while outcome data, and corresponding expected outcome data, were obtained from Premier, Inc. (Charlotte, NC) using their CareScience methodologies.10 To measure patient experience, response data were extracted from post-discharge surveys administered by InMoment (Salt Lake City, UT).
Provider Attribution Models
Provider Attribution by Physician of Record (PAPR). In the standard approach, denoted here as the PAPR model, 1 provider—typically the attending or discharging provider, which may be the same person—is attributed to the entire hospitalization. This provider is responsible for the patient’s care, and all patient outcomes are aggregated and attributed to the provider to gauge his or her performance. The PAPR model is the most popular form of attribution across many health care systems and is routinely used for P4P incentives.
In this study, the discharging provider was used when attributing hospitalizations using the PAPR model. Providers responsible for fewer than 12 discharges in the calendar year were excluded. Because of the directness of this type of attribution, the performance of 1 provider does not account for the performance of the other rotating providers during hospitalizations.
Provider Attribution by Multiple Membership (PAMM). In contrast, we introduce another attribution approach here that is designed to assign partial attribution to each provider who cares for the patient during the hospitalization. To aggregate the partial attributions, and possibly control for any exogenous or risk-based factors, a multiple-membership, or multi-member (MM), model is used. The MM model can measure the effect of a provider on an outcome even when the patient-to-provider relationship is complex, such as in a rotating provider environment.8
The purpose of this study is to compare attribution models and to determine whether there are meaningful differences between them. Therefore, for comparison purposes, the same discharging providers using the PAPR approach are eligible for the PAMM approach, so that both attribution models are using the same set of providers. All other providers are excluded because their performance would not be comparable to the PAPR approach.
While there are many ways to document provider-to-patient interactions, 2 methods are available in almost all health care systems. The first method is to link a provider’s billing charges to each patient-day combination. This approach limits the attribution to 1 provider per patient per day because multiple rotating providers cannot charge for the same patient-day combination.3 However, many providers interact with a patient on the same day, so using this approach excludes non-billed provider-to-patient interactions.
The second method, which was used in this study, relies on documented clinical notes within the EHR to determine how attribution is shared. In this approach, attribution is weighted based on the authorship of 3 types of eligible clinical notes: admitting history/physical notes (during admission), progress notes (during subsequent days), and discharge summary notes (during final discharge). This will (likely) result in many providers being linked to a patient on each day, which better reflects the clinical setting (Figure). Recently, clinical notes were used to attribute care of patients in an inpatient setting, and it was found that this approach provides a reliable way of tracking interactions and assigning ownership.11

The provider-level attribution weights are based on the share of authorships of eligible note types. Specifically, for each provider j, let aij be the total count of eligible note types for hospitalization i authored by provider j, and let ai be the overall total count of eligible note types for hospitalization i. Then the attribution weight is
(Eq. 1)

for hospitalization i and provider j. Note that ∑jwij = 1: in other words, the total attribution, summed across all providers, is constrained to be 1 for each hospitalization.
Patient Outcomes
Outcomes were chosen based on their routine use in health care systems as standards when evaluating provider performance. This study included 6 outcomes: inpatient LOS, inpatient mortality, 30-day inpatient readmission, and patient responses from 3 survey questions. These outcomes can be collected without any manual chart reviews, and therefore are viewed as objective outcomes of provider performance.
Each outcome was aggregated for each provider using both attribution methods independently. For the PAPR method, observed-to-expected (OE) indices for LOS, mortality, and readmissions were calculated along with average patient survey scores. For the PAMM method, provider-level random effects from the fitted models were used. In both cases, the calculated measures were used for ranking purposes when determining top (or bottom) providers for each outcome.
Individual Provider Metrics for the PAPR Method
Inpatient LOS Index. Hospital inpatient LOS was measured as the number of days between admission date and discharge date. For each hospital visit, an expected LOS was determined using Premier’s CareScience Analytics (CSA) risk-adjustment methodology.10 The CSA methodology for LOS incorporates a patient’s clinical history, demographics, and visit-related administrative information.
Let nj be the number of hospitalizations attributed to provider j. Let oij and eij be the observed and expected LOS, respectively, for hospitalization i = 1,…,nj attributed to provider j. Then the inpatient LOS index for provider j is Lj = ∑ioij⁄∑ieij.
Inpatient Mortality Index. Inpatient mortality was defined as the death of the patient during hospitalization. For each hospitalization, an expected mortality probability was determined using Premier’s CSA risk-adjustment methodology.10 The CSA methodology for mortality incorporates a patient’s demographics and comorbidities.
Just as before, let nj be the number of hospitalizations attributed to provider j. Let mij = 1 if the patient died during hospitalization i = 1, … , nj attributed to provider j; mij = 0 otherwise. Let pij(m) be the corresponding expected mortality probability. Then the inpatient mortality index for provider j is Mj = ∑imij⁄∑ipij(m).
30-Day Inpatient Readmission Index. A 30-day inpatient readmission was defined as the event when a patient is discharged and readmits back into the inpatient setting within 30 days. The inclusion criteria defined by the Centers for Medicare and Medicaid Services (CMS) all-cause hospital-wide readmission measure was used and, consequently, planned readmissions were excluded.12 Readmissions could occur at any Banner hospital, including the same hospital. For each hospital visit, an expected readmission probability was derived using Premier’s CSA risk-adjustment methodology.10 The CSA methodology for readmissions incorporates a patient’s clinical history, demographics, and visit-related administrative information.
Let nj be the number of hospitalizations attributed to provider j. Let rij = 1 if the patient had a readmission following hospitalization i = 1, … , nj attributed to provider j; rij = 0 otherwise. Let pij(r) be the corresponding expected readmission probability. Then the 30-day inpatient readmission index for provider j is Rj = ∑irij ⁄∑ipij(r).
Patient Survey Scores. The satisfaction of the patient’s experience during hospitalization was measured via post-discharge surveys administered by InMoment. Two survey questions were selected because they related directly to a provider’s interaction with the patient: “My interactions with doctors were excellent” (Doctor) and “I received the best possible care” (Care). A third question, “I would recommend this hospital to my family and friends,” was selected as a proxy measure of the overall experience and, in the aggregate, is referred to as the net promoter score (NPS).13,14 The responses were measured on an 11-point Likert scale, ranging from “Strongly Disagree” (0) to “Strongly Agree” (10); “N/A” or missing responses were excluded.
The Likert responses were coded to 3 discrete values as follows: if the value was between 0 and 6, then -1 (ie, detractor); between 7 and 8 (ie, neutral), then 0; otherwise 1 (ie, promoter). Averaging these coded responses results in a patient survey score for each question. Specifically, let nj be the number of hospitalizations attributed to provider j in which the patient responded to the survey question. Let sij ∈{−1, 0, 1} be the coded response linked to hospitalization i = 1, … , nj attributed to provider j. Then the patient experience score for provider j is Sj = ∑isij⁄nj.
Handling Ties in Provider Performance Measures. Because ties can occur in the PAPR approach for all measures, a tie-breaking strategy is needed. For LOS indices, ties are less likely because their numerator is strictly greater than 0, and expected LOS values are typically distinct enough. Indeed, no ties were found in this study for LOS indices. However, mortality and readmission indices can routinely result in ties when the best possible index is achieved, such as 0 deaths or readmissions among attributed hospitalizations. To help differentiate between those indices in the PAPR approach, the total estimated risk (denominator) was utilized as a secondary scoring criterion.
Mortality and readmission metrics were addressed by sorting first by the outcome (mortality index), and second by the denominator (total estimated risk). For example, if provider A has the same mortality rate as provider B, then provider A would be ranked higher if the denominator was larger, indicating a higher risk for mortality.
Similarly, it was very common for providers to have the same overall average rating for a survey question. Therefore, the denominator (number of respondents) was used to break ties. However, the denominator sorting was bidirectional. For example, if the tied score was positive (more promoters than detractors) for providers A and B, then provider A would be ranked higher if the denominator was larger. Conversely, if the tied score between providers A and B was neutral or negative (more detractors than promoters), then provider A would be ranked lower if the denominator was larger.
Individual Provider Metrics for the PAMM Method
For the PAMM method, model-based metrics were derived using a MM model.8 Specifically, let J be the number of rotating providers in a health care system. Let Yi be an outcome of interest from hospitalization i, X1i, …, Xpi be fixed effects or covariates, and ß1, …, ßp be the coefficients for the respective covariates. Then the generalized MM statistical model is
(Eq. 2)

where g(μi ) is a link function between the mean of the outcome, μi, and its linear predictor, ß0, is the marginal intercept, wij represents the attribution weight of provider j on hospitalization i (described in Equation 1), and γj represents the random effect of provider j on the outcome with γj~N(0,σγ2).
For the mortality and readmission binary outcomes, logistic regression was performed using a logit link function, with the corresponding expected probability as the only fixed covariate. The expected probabilities were first converted into odds and then log-transformed before entering the model. For LOS, Poisson regression was performed using a log link function with the log-transformed expected LOS as the only fixed covariate. For coded patient experience responses, an ordered logistic regression was performed using a cumulative logit link function (no fixed effects were added).
MM Model-based Metrics. Each fitted MM model produces a predicted random effect for each provider. The provider-specific random effects can be interpreted as the unobserved influence of each provider on the outcome after controlling for any fixed effect included in the model. Therefore, the provider-specific random effects were used to evaluate the relative provider performance, which is analogous to the individual provider-level metrics used in the PAPR method.
Measuring provider performance using a MM model is more flexible and robust to outliers compared to the standard approach using OE indices or simple averages. First, although not investigated here, the effect of patient-, visit-, provider-, and/or temporal-level covariates can be controlled when evaluating provider performance. For example, a patient’s socioeconomic status, a provider’s workload, and seasonal factors can be added to the MM model. These external factors are not accounted for in OE indices.
Another advantage of using predicted random effects is the concept of “shrinkage.” The process of estimating random effects inherently accounts for small sample sizes (when providers do not treat a large enough sample of patients) and/or when there is a large ratio of patient variance to provider variance (for instance, when patient outcome variability is much higher compared to provider performance variability). In both cases, the estimation of the random effect is pulled ever closer to 0, signaling that the provider performance is closer to the population average. See Henderson15 and Mood16 for further details.
In contrast, OE indices can result in unreliable estimates when a provider has not cared for many patients. This is especially prevalent when the outcome is binary with a low probability of occurring, such as mortality. Indeed, provider-level mortality OE indices are routinely 0 when the patient counts are low, which skews performance rankings unfairly. Finally, OE indices also ignore the magnitude of the variance of an outcome between providers and patients, which can be large.
Comparison Methodology
In this study, we seek to compare the 2 methods of attribution, PAPR and PAMM, to determine whether there are meaningful differences between them when measuring provider performance. Using retrospective data described in the next section, each attribution method was used independently to derive provider-level metrics. To assess relative performance, percentiles were assigned to each provider based on their metric values so that, in the end, there were 2 percentile ranks for each provider for each metric.
Using these paired percentiles, we derived the following measures of concordance, similar to Herzke, Michtalik3: (1) the percent concordance measure—defined as the number of providers who landed in the top half (greater than the median) or bottom half under both attribution models—divided by the total number of providers; (2) the median of the absolute difference in percentiles under both attribution models; and (3) the Pearson correlation coefficient of the paired provider ranks. The first measure is a global measure of concordance between the 2 approaches and would be expected to be 50% by chance. The second measure gauges how an individual provider’s rank is affected by the change in attribution methodologies. The third measure is a statistical measure of linear correlation of the paired percentiles and was not included in the Herzke, Michtalik3 study.
All statistical analyses were performed on SAS (version 9.4; Cary, NC) and the MM models were fitted using PROC GLIMMIX with the EFFECT statement. The Banner Health Institutional Review Board approved this study.
Results
Descriptive Statistics
A total of

Multi-Membership Model Results
Table 3 displays the results after independently fitting MM models to each of the 3 clinical outcomes. Along with a marginal intercept, the only covariate in each model was the corresponding expected value after a transformation. This was added to use the same information that is typically used in OE indices, therefore allowing for a proper comparison between the 2 attribution methods. The provider-level variance represents the between-provider variation and measures the amount of influence providers have on the corresponding outcome after controlling for any covariates in the model. A provider-level variance of 0 would indicate that providers do not have any influence on the outcome. While the mortality and readmission model results can be compared to each other, the LOS model cannot given its different scale and transformation altogether.

The results in Table 3 suggest that each expected value covariate is highly correlated with its corresponding outcome, which is the anticipated conclusion given that they are constructed in this fashion. The estimated provider-level variances indicate that, after including an expected value in the model, providers have less of an influence on a patient’s LOS and likelihood of being readmitted. On the other hand, the results suggest that providers have much more influence on the likelihood of a patient dying in the hospital, even after controlling for an expected mortality covariate.

Table 4 shows the results after independently fitting MM-ordered logistic models to each of the 3 survey questions. The similar provider-level variances suggest that providers have the same influence on the patient’s perception of the quality of their interactions with the doctor (Doctor), the quality of the care they received (Care), and their likelihood to recommend a friend or family member to the hospital (NPS).

Comparison Results Between Both Attribution Methods
Table 5 compares the 2 attribution methods when ranking providers based on their performance on each outcome measure. The comparison metrics gauge how well the 2 methods agree overall (percent concordance), agree at the provider level (absolute percentile difference and interquartile range [IQR]), and how the paired percentiles linearly correlate to each other (Pearson correlation coefficient).
 Approach vs a Multi-Membership (PAMM) Approach")
LOS, by a small margin, had the lowest concordance of clinical outcomes (72.1%), followed by mortality (75.9%) and readmissions (82.1%). Generally, the survey scores had higher percent concordance than the clinical outcome measures, with Doctor at 84.1%, Care at 85.9%, and NPS having the highest percent concordance at 86.6%. Given that by chance the percent concordance is expected to be 50%, there was notable discordance, especially with the clinical outcome measures. Using LOS performance as an example, one attribution methodology would rank a provider in the top half or bottom half, while the other attribution methodology would rank the same provider exactly the opposite way about 28% of the time.
The median absolute percentile difference between the 2 methods was more modest (between 7 and 15). Still, there were some providers whose performance ranking was heavily impacted by the attribution methodology that was used. This was especially true when evaluating performance for certain clinical measures, where the attribution method that was used could change the provider performance percentile by up to 90 levels.
The paired percentiles were positively correlated when ranking performance using any of the 6 measures. This suggests that both methodologies assess performance generally in the same direction, irrespective of the methodology and measure. We did not investigate more complex correlation measures and left this for future research.
It should be noted that ties occurred much more frequently with the PAPR method than when using PAMM and therefore required tie-breaking rules to be designed. Given the nature of OE indices, PAPR methodology is especially sensitive to ties whenever the measure includes counting the number of events (for example, mortality and readmissions) and whenever there are many providers with very few attributed patients. On the other hand, using the PAMM method is much more robust against ties given that the summation of all the weighted attributed outcomes will rarely result in ties, even with a nominal set of providers.
Discussion
In this study, the PAMM methodology was introduced and was used to assess relative provider performance on 3 clinical outcome measures and 3 patient survey scores. The new approach aims to distribute each outcome among all providers who provided care for a patient in an inpatient setting. Clinical notes were used to account for patient-to-provider interactions, and fitted MM statistical models were used to compute the effects that each provider had on each outcome. The provider effect was introduced as a random effect, and the set of predicted random effects was used to rank the performance of each provider.
The PAMM approach was compared to the more traditional methodology, PAPR, where each patient is attributed to only 1 provider: the discharging physician in this study. Using this approach, OE indices of clinical outcomes and averages of survey scores were used to rank the performance of each provider. This approach resulted in many ties, which were broken based on the number of hospitalizations, although other tie-breaking methods may be used in practice.
Both methodologies showed modest concordance with each other for the clinical outcomes, but higher concordance for the patient survey scores. This was also true when using the Pearson correlation coefficient to assess agreement. The 1 outcome measure that showed the least concordance and least linear correlation between methods was LOS, which would suggest that LOS performance is more sensitive to the attribution methodology that is used. However, it was the least concordant by a small margin.
Furthermore, although the medians of the absolute percentile differences were small, there were some providers who had large deviations, suggesting that some providers would move from being shown as high-performers to low-performers and vice versa based on the chosen attribution method. We investigated examples of this and determined that the root cause was the difference in effective sample sizes for a provider. For the PAPR method, the effective sample size is simply the number of hospitalizations attributed to the provider. For the PAMM method, the effective sample size is the sum of all non-zero weights across all hospitalizations where the provider cared for a patient. By and large, the PAMM methodology provides more information of the provider effect on an outcome than the PAPR approach because every provider-patient interaction is considered. For example, providers who do not routinely discharge patients, but often care for patients, will have rankings that differ dramatically between the 2 methods.
The PAMM methodology has many statistical advantages that were not fully utilized in this comparative study. For example, we did not include any covariates in the MM models except for the expected value of the outcome, when it was available. Still, it is known that other covariates can impact an outcome as well, such as the patient’s age, socioeconomic indicators, existing chronic conditions, and severity of hospitalization, which can be added to the MM models as fixed effects. In this way, the PAMM approach can control for these other covariates, which are typically outside of the control of providers but typically ignored using OE indices. Therefore, using the PAMM approach would provide a fairer comparison of provider performance.
Using the PAMM method, most providers had a large sample size to assess their performance once all the weighted interactions were included. Still, there were a few who did not care for many patients for a variety of reasons. In these scenarios, MM models “borrow” strength from other providers to produce a more robust predicted provider effect by using a weighted average between the overall population trend and the specific provider outcomes (see Rao and Molina17). As a result, PAMM is a more suitable approach when the sample sizes of patients attributed to providers can be small.
One of the most interesting findings of this study was the relative size of the provider-level variance to the size of the fixed effect in each model (Table 3). Except for mortality, these variances suggest that there is a small difference in performance from one provider to another. However, these should be interpreted as the variance when only 1 provider is involved in the care of a patient. When multiple providers are involved, using basic statistical theory, the overall provider-level variance will be σγ2 ∑wij2 (see Equation 2). For example, the estimated variance among providers for LOS was 0.03 (on a log scale), but, using the scenario in the Figure, the overall provider-level variance for this hospitalization will be 0.03 (0.3752 + 0.1252 + 0.52) = 0.012. Hence, the combined effect of providers on LOS is less than would be expected. Indeed, as more providers are involved with a patient’s care, the more their combined influence on an outcome is diluted.
In this study, the PAMM approach placed an equal weight on all provider-patient interactions via clinical note authorship, but that may not be optimal in some settings. For example, it may make more sense to set a higher weight on the provider who admitted or discharged the patient while placing less (or 0) weight on all other interactions. In the extreme, if the full weight were placed on 1 provider interaction (eg, during discharge, then the MM model would be reduced to a one-way random effects model. The flexibility of weighting interactions is a feature of the PAMM approach, but any weighting framework must be transparent to the providers before implementation.
Conclusion
This study demonstrates that the PAMM approach is a feasible option within a large health care organization. For P4P programs to be successful, providers must be able to trust that their performance will be fairly assessed and that all provider-patient interactions are captured to provide a full comparison amongst their peers. The PAMM methodology is one solution to spread the positive (and negative) outcomes across all providers who cared for a patient and therefore, if implemented, would add trust and fairness when measuring and assessing provider performance.
Acknowledgments: The authors thank Barrie Bradley for his support in the initial stages of this research and Dr. Syed Ismail Jafri for his help and support on the standard approaches of assessing and measuring provider performances.
Corresponding author: Rachel Ginn, MS, Banner Health Corporation, 2901 N. Central Ave., Phoenix, AZ 85012; rachel.ginn@gmail.com.
Financial disclosures: None.
1. Abduljawad A, Al-Assaf AF. Incentives for better performance in health care. Sultan Qaboos Univ Med J. 2011;11:201-206.
2. Milstein R, Schreyoegg J. Pay for performance in the inpatient sector: a review of 34 P4P programs in 14 OECD countries. Health Policy. 2016;120:1125-1140.
3. Herzke CA, Michtalik HJ, Durkin N, et al. A method for attributing patient-level metrics to rotating providers in an inpatient setting. J Hosp Med. 2018;13:470-475.
4. Batbaatar E, Dorjdagva J, Luvsannyam A, Savino MM, Amenta P. Determinants of patient satisfaction: a systematic review. Perspect Public Health. 2017;137:89-101.
5. Ballou D, Sanders W, Wright P. Controlling for student background in value-added assessment of teachers. J Educ Behav Stat. 2004;29:37-65.
6. Hill PW, Goldstein H. Multilevel modeling of educational data with cross-classification and missing identification for units. J Educ Behav Stat. 1998;23:117-128.
7. Rasbash J, Browne WJ. Handbook of Multilevel Analysis. Springer; 2007.
8. Brown WJ, Goldstein H, Rasbash J. Multiple membership multiple classification (MMMC) models. Statistical Modeling. 2001;1:103-124.
9. Sanders WL, Horn SP. The Tennessee Value-Added Assessment System (TVAAS)—mixed-model methodology in educational assessment. J Pers Eval Educ. 1994;8:299-311.
10. Kroch EA, Duan M. CareScience Risk Assessment Model: Hospital Performance Measurement. Premier, Inc., 2008. http://www.ahrq.gov/qual/mortality/KrochRisk.htm
11. Schumacher DJ, Wu DTY, Meganathan K, et al. A feasibility study to attribute patients to primary interns on inpatient ward teams using electronic health record data. Acad Med. 2019;94:1376-1383.
12. Simoes J, Krumholz HM, Lin Z. Hospital-level 30-day risk-standardized readmission measure. Centers for Medicare & Medicaid Services, 2018. https://www.cms.gov/Medicare/Quality-Initiatives-Patient-Assessment-Instruments/HospitalQualityInits/Downloads/Hospital-Wide-All-Cause-Readmission-Updates.zip
13. Krol MW, de Boer D, Delnoij DM, Rademakers JJDJM. The Net Promoter Score: an asset to patient experience surveys? Health Expect. 2015;18:3099-3109.
14. Doyle C, Lennox L, Bell D. A systematic review of evidence on the links between patient experience and clinical safety and effectiveness. BMJ Open. 2013;3:e001570.
15. Henderson CR. Sire evaluation and genetic trends. J Anim Sci. 1973;1973:10-41.
16. Mood AM. Introduction to the Theory of Statistics. McGraw-Hill; 1950:xiii, 433-xiii.
17. Rao JNK, Molina I. Small Area Estimation. Wiley; 2015.
From Banner Health Corporation, Phoenix, AZ.
Background: Health care providers are routinely incentivized with pay-for-performance (P4P) metrics to increase the quality of care. In an inpatient setting, P4P models typically measure quality by attributing each patient’s outcome to a single provider even though many providers routinely care for the patient. This study investigates a new attribution approach aiming to distribute each outcome across all providers who provided care.
Methods: The methodology relies on a multi-membership model and is demonstrated in the Banner Health system using 3 clinical outcome measures (length of stay, 30-day readmissions, and mortality) and responses to 3 survey questions that measure a patient’s perception of their care. The new approach is compared to the “standard” method, which attributes each patient to only 1 provider.
Results: When ranking by clinical outcomes, both methods were concordant 72.1% to 82.1% of the time for top-half/bottom-half rankings, with a median percentile difference between 7 and 15. When ranking by survey scores, there was more agreement, with concordance between 84.1% and 86.6% and a median percentile difference between 11 and 13. Last, Pearson correlation coefficients of the paired percentiles ranged from 0.56 to 0.78.
Conclusion: The new approach provides a fairer solution when measuring provider performance.
Keywords: patient attribution; PAMM; PAPR; random effect model; pay for performance.
Providers practicing in hospitals are routinely evaluated based on their performance and, in many cases, are financially incentivized for a better-than-average performance within a pay-for-performance (P4P) model. The use of P4P models is based on the belief that they will “improve, motivate, and enhance providers to pursue aggressively and ultimately achieve the quality performance targets thus decreasing the number of medical errors with less malpractice events.”1 Although P4P models continue to be a movement in health care, they have been challenging to implement.
One concern involves the general quality of implementation, such as defining metrics and targets, setting payout amounts, managing technology and market conditions, and gauging the level of transparency to the provider.2 Another challenge, and the focus of this project, are concerns around measuring performance to avoid perceptions of unfairness. This concern can be minimized if the attribution is handled in a fairer way, by spreading it across all providers who affected the outcome, both in a positive or negative direction.3
To implement these models, the performance of providers needs to be measured and tracked periodically. This requires linking, or attributing, a patient’s outcome to a provider, which is almost always the attending or discharging provider (ie, a single provider).3 In this single-provider attribution approach, one provider will receive all the credit (good or bad) for their respective patients’ outcomes, even though the provider may have seen the patient only a fraction of the time during the hospitalization. Attributing outcomes—for example, length of stay (LOS), readmission rate, mortality rate, net promoter score (NPS)—using this approach reduces the validity of metrics designed to measure provider performance, especially in a rotating provider environment where many providers interact with and care for a patient. For example, the quality of providers’ interpersonal skills and competence were among the strongest determinants of patient satisfaction,4 but it is not credible that this is solely based on the last provider during a hospitalization.
Proportionally distributing the attribution of an outcome has been used successfully in other contexts. Typically, a statistical modeling approach using a multi-membership framework is used because it can handle the sometimes-complicated relationships within the hierarchy. It also allows for auxiliary variables to be introduced, which can help explain and control for exogenous effects.5-7 For example, in the education setting, standardized testing is administered to students at defined years of schooling: at grades 4, 8, and 10, for instance. The progress of students, measured as the academic gains between test years, are proportionally attributed to all the teachers who the student has had between the test years. These partial attributions are combined to evaluate an overall teacher performance.8,9
Although the multi-membership framework has been used in other industries, it has yet to be applied in measuring provider performance. The purpose of this project is to investigate the impact of using a multi-provider approach compared to the standard single-provider approach. The findings may lead to modifications in the way a provider’s performance is measured and, thus, how providers are compensated. A similar study investigated the impact of proportionally distributing patients’ outcomes across all rotating providers using a weighting method based on billing practices to measure the partial impact of each provider.3
This study is different in 2 fundamental ways. First, attribution is weighted based on the number of clinically documented interactions (via clinical notes) between a patient and all rotating providers during the hospitalization. Second, performance is measured via multi-membership models, which can estimate the effect (both positive and negative) that a provider has on an outcome, even when caring for a patient a fraction of the time during the hospitalization.
Methods
Setting
Banner Health is a non-profit, multi-hospital health care system across 6 states in the western United States that is uniquely positioned to study provider quality attribution models. It not only has a large number of providers and serves a broad patient population, but Banner Health also uses an instance of Cerner (Kansas City, MO), an enterprise-level electronic health record (EHR) system that connects all its facilities and allows for advanced analytics across its system.
For this study, we included only general medicine and surgery patients admitted and discharged from the inpatient setting between January 1, 2018, and December 31, 2018, who were between 18 and 89 years old at admission, and who had a LOS between 1 and 14 days. Visit- and patient-level data were collected from Cerner, while outcome data, and corresponding expected outcome data, were obtained from Premier, Inc. (Charlotte, NC) using their CareScience methodologies.10 To measure patient experience, response data were extracted from post-discharge surveys administered by InMoment (Salt Lake City, UT).
Provider Attribution Models
Provider Attribution by Physician of Record (PAPR). In the standard approach, denoted here as the PAPR model, 1 provider—typically the attending or discharging provider, which may be the same person—is attributed to the entire hospitalization. This provider is responsible for the patient’s care, and all patient outcomes are aggregated and attributed to the provider to gauge his or her performance. The PAPR model is the most popular form of attribution across many health care systems and is routinely used for P4P incentives.
In this study, the discharging provider was used when attributing hospitalizations using the PAPR model. Providers responsible for fewer than 12 discharges in the calendar year were excluded. Because of the directness of this type of attribution, the performance of 1 provider does not account for the performance of the other rotating providers during hospitalizations.
Provider Attribution by Multiple Membership (PAMM). In contrast, we introduce another attribution approach here that is designed to assign partial attribution to each provider who cares for the patient during the hospitalization. To aggregate the partial attributions, and possibly control for any exogenous or risk-based factors, a multiple-membership, or multi-member (MM), model is used. The MM model can measure the effect of a provider on an outcome even when the patient-to-provider relationship is complex, such as in a rotating provider environment.8
The purpose of this study is to compare attribution models and to determine whether there are meaningful differences between them. Therefore, for comparison purposes, the same discharging providers using the PAPR approach are eligible for the PAMM approach, so that both attribution models are using the same set of providers. All other providers are excluded because their performance would not be comparable to the PAPR approach.
While there are many ways to document provider-to-patient interactions, 2 methods are available in almost all health care systems. The first method is to link a provider’s billing charges to each patient-day combination. This approach limits the attribution to 1 provider per patient per day because multiple rotating providers cannot charge for the same patient-day combination.3 However, many providers interact with a patient on the same day, so using this approach excludes non-billed provider-to-patient interactions.
The second method, which was used in this study, relies on documented clinical notes within the EHR to determine how attribution is shared. In this approach, attribution is weighted based on the authorship of 3 types of eligible clinical notes: admitting history/physical notes (during admission), progress notes (during subsequent days), and discharge summary notes (during final discharge). This will (likely) result in many providers being linked to a patient on each day, which better reflects the clinical setting (Figure). Recently, clinical notes were used to attribute care of patients in an inpatient setting, and it was found that this approach provides a reliable way of tracking interactions and assigning ownership.11
The provider-level attribution weights are based on the share of authorships of eligible note types. Specifically, for each provider j, let aij be the total count of eligible note types for hospitalization i authored by provider j, and let ai be the overall total count of eligible note types for hospitalization i. Then the attribution weight is
(Eq. 1)
for hospitalization i and provider j. Note that ∑jwij = 1: in other words, the total attribution, summed across all providers, is constrained to be 1 for each hospitalization.
Patient Outcomes
Outcomes were chosen based on their routine use in health care systems as standards when evaluating provider performance. This study included 6 outcomes: inpatient LOS, inpatient mortality, 30-day inpatient readmission, and patient responses from 3 survey questions. These outcomes can be collected without any manual chart reviews, and therefore are viewed as objective outcomes of provider performance.
Each outcome was aggregated for each provider using both attribution methods independently. For the PAPR method, observed-to-expected (OE) indices for LOS, mortality, and readmissions were calculated along with average patient survey scores. For the PAMM method, provider-level random effects from the fitted models were used. In both cases, the calculated measures were used for ranking purposes when determining top (or bottom) providers for each outcome.
Individual Provider Metrics for the PAPR Method
Inpatient LOS Index. Hospital inpatient LOS was measured as the number of days between admission date and discharge date. For each hospital visit, an expected LOS was determined using Premier’s CareScience Analytics (CSA) risk-adjustment methodology.10 The CSA methodology for LOS incorporates a patient’s clinical history, demographics, and visit-related administrative information.
Let nj be the number of hospitalizations attributed to provider j. Let oij and eij be the observed and expected LOS, respectively, for hospitalization i = 1,…,nj attributed to provider j. Then the inpatient LOS index for provider j is Lj = ∑ioij⁄∑ieij.
Inpatient Mortality Index. Inpatient mortality was defined as the death of the patient during hospitalization. For each hospitalization, an expected mortality probability was determined using Premier’s CSA risk-adjustment methodology.10 The CSA methodology for mortality incorporates a patient’s demographics and comorbidities.
Just as before, let nj be the number of hospitalizations attributed to provider j. Let mij = 1 if the patient died during hospitalization i = 1, … , nj attributed to provider j; mij = 0 otherwise. Let pij(m) be the corresponding expected mortality probability. Then the inpatient mortality index for provider j is Mj = ∑imij⁄∑ipij(m).
30-Day Inpatient Readmission Index. A 30-day inpatient readmission was defined as the event when a patient is discharged and readmits back into the inpatient setting within 30 days. The inclusion criteria defined by the Centers for Medicare and Medicaid Services (CMS) all-cause hospital-wide readmission measure was used and, consequently, planned readmissions were excluded.12 Readmissions could occur at any Banner hospital, including the same hospital. For each hospital visit, an expected readmission probability was derived using Premier’s CSA risk-adjustment methodology.10 The CSA methodology for readmissions incorporates a patient’s clinical history, demographics, and visit-related administrative information.
Let nj be the number of hospitalizations attributed to provider j. Let rij = 1 if the patient had a readmission following hospitalization i = 1, … , nj attributed to provider j; rij = 0 otherwise. Let pij(r) be the corresponding expected readmission probability. Then the 30-day inpatient readmission index for provider j is Rj = ∑irij ⁄∑ipij(r).
Patient Survey Scores. The satisfaction of the patient’s experience during hospitalization was measured via post-discharge surveys administered by InMoment. Two survey questions were selected because they related directly to a provider’s interaction with the patient: “My interactions with doctors were excellent” (Doctor) and “I received the best possible care” (Care). A third question, “I would recommend this hospital to my family and friends,” was selected as a proxy measure of the overall experience and, in the aggregate, is referred to as the net promoter score (NPS).13,14 The responses were measured on an 11-point Likert scale, ranging from “Strongly Disagree” (0) to “Strongly Agree” (10); “N/A” or missing responses were excluded.
The Likert responses were coded to 3 discrete values as follows: if the value was between 0 and 6, then -1 (ie, detractor); between 7 and 8 (ie, neutral), then 0; otherwise 1 (ie, promoter). Averaging these coded responses results in a patient survey score for each question. Specifically, let nj be the number of hospitalizations attributed to provider j in which the patient responded to the survey question. Let sij ∈{−1, 0, 1} be the coded response linked to hospitalization i = 1, … , nj attributed to provider j. Then the patient experience score for provider j is Sj = ∑isij⁄nj.
Handling Ties in Provider Performance Measures. Because ties can occur in the PAPR approach for all measures, a tie-breaking strategy is needed. For LOS indices, ties are less likely because their numerator is strictly greater than 0, and expected LOS values are typically distinct enough. Indeed, no ties were found in this study for LOS indices. However, mortality and readmission indices can routinely result in ties when the best possible index is achieved, such as 0 deaths or readmissions among attributed hospitalizations. To help differentiate between those indices in the PAPR approach, the total estimated risk (denominator) was utilized as a secondary scoring criterion.
Mortality and readmission metrics were addressed by sorting first by the outcome (mortality index), and second by the denominator (total estimated risk). For example, if provider A has the same mortality rate as provider B, then provider A would be ranked higher if the denominator was larger, indicating a higher risk for mortality.
Similarly, it was very common for providers to have the same overall average rating for a survey question. Therefore, the denominator (number of respondents) was used to break ties. However, the denominator sorting was bidirectional. For example, if the tied score was positive (more promoters than detractors) for providers A and B, then provider A would be ranked higher if the denominator was larger. Conversely, if the tied score between providers A and B was neutral or negative (more detractors than promoters), then provider A would be ranked lower if the denominator was larger.
Individual Provider Metrics for the PAMM Method
For the PAMM method, model-based metrics were derived using a MM model.8 Specifically, let J be the number of rotating providers in a health care system. Let Yi be an outcome of interest from hospitalization i, X1i, …, Xpi be fixed effects or covariates, and ß1, …, ßp be the coefficients for the respective covariates. Then the generalized MM statistical model is
(Eq. 2)
where g(μi ) is a link function between the mean of the outcome, μi, and its linear predictor, ß0, is the marginal intercept, wij represents the attribution weight of provider j on hospitalization i (described in Equation 1), and γj represents the random effect of provider j on the outcome with γj~N(0,σγ2).
For the mortality and readmission binary outcomes, logistic regression was performed using a logit link function, with the corresponding expected probability as the only fixed covariate. The expected probabilities were first converted into odds and then log-transformed before entering the model. For LOS, Poisson regression was performed using a log link function with the log-transformed expected LOS as the only fixed covariate. For coded patient experience responses, an ordered logistic regression was performed using a cumulative logit link function (no fixed effects were added).
MM Model-based Metrics. Each fitted MM model produces a predicted random effect for each provider. The provider-specific random effects can be interpreted as the unobserved influence of each provider on the outcome after controlling for any fixed effect included in the model. Therefore, the provider-specific random effects were used to evaluate the relative provider performance, which is analogous to the individual provider-level metrics used in the PAPR method.
Measuring provider performance using a MM model is more flexible and robust to outliers compared to the standard approach using OE indices or simple averages. First, although not investigated here, the effect of patient-, visit-, provider-, and/or temporal-level covariates can be controlled when evaluating provider performance. For example, a patient’s socioeconomic status, a provider’s workload, and seasonal factors can be added to the MM model. These external factors are not accounted for in OE indices.
Another advantage of using predicted random effects is the concept of “shrinkage.” The process of estimating random effects inherently accounts for small sample sizes (when providers do not treat a large enough sample of patients) and/or when there is a large ratio of patient variance to provider variance (for instance, when patient outcome variability is much higher compared to provider performance variability). In both cases, the estimation of the random effect is pulled ever closer to 0, signaling that the provider performance is closer to the population average. See Henderson15 and Mood16 for further details.
In contrast, OE indices can result in unreliable estimates when a provider has not cared for many patients. This is especially prevalent when the outcome is binary with a low probability of occurring, such as mortality. Indeed, provider-level mortality OE indices are routinely 0 when the patient counts are low, which skews performance rankings unfairly. Finally, OE indices also ignore the magnitude of the variance of an outcome between providers and patients, which can be large.
Comparison Methodology
In this study, we seek to compare the 2 methods of attribution, PAPR and PAMM, to determine whether there are meaningful differences between them when measuring provider performance. Using retrospective data described in the next section, each attribution method was used independently to derive provider-level metrics. To assess relative performance, percentiles were assigned to each provider based on their metric values so that, in the end, there were 2 percentile ranks for each provider for each metric.
Using these paired percentiles, we derived the following measures of concordance, similar to Herzke, Michtalik3: (1) the percent concordance measure—defined as the number of providers who landed in the top half (greater than the median) or bottom half under both attribution models—divided by the total number of providers; (2) the median of the absolute difference in percentiles under both attribution models; and (3) the Pearson correlation coefficient of the paired provider ranks. The first measure is a global measure of concordance between the 2 approaches and would be expected to be 50% by chance. The second measure gauges how an individual provider’s rank is affected by the change in attribution methodologies. The third measure is a statistical measure of linear correlation of the paired percentiles and was not included in the Herzke, Michtalik3 study.
All statistical analyses were performed on SAS (version 9.4; Cary, NC) and the MM models were fitted using PROC GLIMMIX with the EFFECT statement. The Banner Health Institutional Review Board approved this study.
Results
Descriptive Statistics
A total of
Multi-Membership Model Results
Table 3 displays the results after independently fitting MM models to each of the 3 clinical outcomes. Along with a marginal intercept, the only covariate in each model was the corresponding expected value after a transformation. This was added to use the same information that is typically used in OE indices, therefore allowing for a proper comparison between the 2 attribution methods. The provider-level variance represents the between-provider variation and measures the amount of influence providers have on the corresponding outcome after controlling for any covariates in the model. A provider-level variance of 0 would indicate that providers do not have any influence on the outcome. While the mortality and readmission model results can be compared to each other, the LOS model cannot given its different scale and transformation altogether.
The results in Table 3 suggest that each expected value covariate is highly correlated with its corresponding outcome, which is the anticipated conclusion given that they are constructed in this fashion. The estimated provider-level variances indicate that, after including an expected value in the model, providers have less of an influence on a patient’s LOS and likelihood of being readmitted. On the other hand, the results suggest that providers have much more influence on the likelihood of a patient dying in the hospital, even after controlling for an expected mortality covariate.
Table 4 shows the results after independently fitting MM-ordered logistic models to each of the 3 survey questions. The similar provider-level variances suggest that providers have the same influence on the patient’s perception of the quality of their interactions with the doctor (Doctor), the quality of the care they received (Care), and their likelihood to recommend a friend or family member to the hospital (NPS).
Comparison Results Between Both Attribution Methods
Table 5 compares the 2 attribution methods when ranking providers based on their performance on each outcome measure. The comparison metrics gauge how well the 2 methods agree overall (percent concordance), agree at the provider level (absolute percentile difference and interquartile range [IQR]), and how the paired percentiles linearly correlate to each other (Pearson correlation coefficient).
LOS, by a small margin, had the lowest concordance of clinical outcomes (72.1%), followed by mortality (75.9%) and readmissions (82.1%). Generally, the survey scores had higher percent concordance than the clinical outcome measures, with Doctor at 84.1%, Care at 85.9%, and NPS having the highest percent concordance at 86.6%. Given that by chance the percent concordance is expected to be 50%, there was notable discordance, especially with the clinical outcome measures. Using LOS performance as an example, one attribution methodology would rank a provider in the top half or bottom half, while the other attribution methodology would rank the same provider exactly the opposite way about 28% of the time.
The median absolute percentile difference between the 2 methods was more modest (between 7 and 15). Still, there were some providers whose performance ranking was heavily impacted by the attribution methodology that was used. This was especially true when evaluating performance for certain clinical measures, where the attribution method that was used could change the provider performance percentile by up to 90 levels.
The paired percentiles were positively correlated when ranking performance using any of the 6 measures. This suggests that both methodologies assess performance generally in the same direction, irrespective of the methodology and measure. We did not investigate more complex correlation measures and left this for future research.
It should be noted that ties occurred much more frequently with the PAPR method than when using PAMM and therefore required tie-breaking rules to be designed. Given the nature of OE indices, PAPR methodology is especially sensitive to ties whenever the measure includes counting the number of events (for example, mortality and readmissions) and whenever there are many providers with very few attributed patients. On the other hand, using the PAMM method is much more robust against ties given that the summation of all the weighted attributed outcomes will rarely result in ties, even with a nominal set of providers.
Discussion
In this study, the PAMM methodology was introduced and was used to assess relative provider performance on 3 clinical outcome measures and 3 patient survey scores. The new approach aims to distribute each outcome among all providers who provided care for a patient in an inpatient setting. Clinical notes were used to account for patient-to-provider interactions, and fitted MM statistical models were used to compute the effects that each provider had on each outcome. The provider effect was introduced as a random effect, and the set of predicted random effects was used to rank the performance of each provider.
The PAMM approach was compared to the more traditional methodology, PAPR, where each patient is attributed to only 1 provider: the discharging physician in this study. Using this approach, OE indices of clinical outcomes and averages of survey scores were used to rank the performance of each provider. This approach resulted in many ties, which were broken based on the number of hospitalizations, although other tie-breaking methods may be used in practice.
Both methodologies showed modest concordance with each other for the clinical outcomes, but higher concordance for the patient survey scores. This was also true when using the Pearson correlation coefficient to assess agreement. The 1 outcome measure that showed the least concordance and least linear correlation between methods was LOS, which would suggest that LOS performance is more sensitive to the attribution methodology that is used. However, it was the least concordant by a small margin.
Furthermore, although the medians of the absolute percentile differences were small, there were some providers who had large deviations, suggesting that some providers would move from being shown as high-performers to low-performers and vice versa based on the chosen attribution method. We investigated examples of this and determined that the root cause was the difference in effective sample sizes for a provider. For the PAPR method, the effective sample size is simply the number of hospitalizations attributed to the provider. For the PAMM method, the effective sample size is the sum of all non-zero weights across all hospitalizations where the provider cared for a patient. By and large, the PAMM methodology provides more information of the provider effect on an outcome than the PAPR approach because every provider-patient interaction is considered. For example, providers who do not routinely discharge patients, but often care for patients, will have rankings that differ dramatically between the 2 methods.
The PAMM methodology has many statistical advantages that were not fully utilized in this comparative study. For example, we did not include any covariates in the MM models except for the expected value of the outcome, when it was available. Still, it is known that other covariates can impact an outcome as well, such as the patient’s age, socioeconomic indicators, existing chronic conditions, and severity of hospitalization, which can be added to the MM models as fixed effects. In this way, the PAMM approach can control for these other covariates, which are typically outside of the control of providers but typically ignored using OE indices. Therefore, using the PAMM approach would provide a fairer comparison of provider performance.
Using the PAMM method, most providers had a large sample size to assess their performance once all the weighted interactions were included. Still, there were a few who did not care for many patients for a variety of reasons. In these scenarios, MM models “borrow” strength from other providers to produce a more robust predicted provider effect by using a weighted average between the overall population trend and the specific provider outcomes (see Rao and Molina17). As a result, PAMM is a more suitable approach when the sample sizes of patients attributed to providers can be small.
One of the most interesting findings of this study was the relative size of the provider-level variance to the size of the fixed effect in each model (Table 3). Except for mortality, these variances suggest that there is a small difference in performance from one provider to another. However, these should be interpreted as the variance when only 1 provider is involved in the care of a patient. When multiple providers are involved, using basic statistical theory, the overall provider-level variance will be σγ2 ∑wij2 (see Equation 2). For example, the estimated variance among providers for LOS was 0.03 (on a log scale), but, using the scenario in the Figure, the overall provider-level variance for this hospitalization will be 0.03 (0.3752 + 0.1252 + 0.52) = 0.012. Hence, the combined effect of providers on LOS is less than would be expected. Indeed, as more providers are involved with a patient’s care, the more their combined influence on an outcome is diluted.
In this study, the PAMM approach placed an equal weight on all provider-patient interactions via clinical note authorship, but that may not be optimal in some settings. For example, it may make more sense to set a higher weight on the provider who admitted or discharged the patient while placing less (or 0) weight on all other interactions. In the extreme, if the full weight were placed on 1 provider interaction (eg, during discharge, then the MM model would be reduced to a one-way random effects model. The flexibility of weighting interactions is a feature of the PAMM approach, but any weighting framework must be transparent to the providers before implementation.
Conclusion
This study demonstrates that the PAMM approach is a feasible option within a large health care organization. For P4P programs to be successful, providers must be able to trust that their performance will be fairly assessed and that all provider-patient interactions are captured to provide a full comparison amongst their peers. The PAMM methodology is one solution to spread the positive (and negative) outcomes across all providers who cared for a patient and therefore, if implemented, would add trust and fairness when measuring and assessing provider performance.
Acknowledgments: The authors thank Barrie Bradley for his support in the initial stages of this research and Dr. Syed Ismail Jafri for his help and support on the standard approaches of assessing and measuring provider performances.
Corresponding author: Rachel Ginn, MS, Banner Health Corporation, 2901 N. Central Ave., Phoenix, AZ 85012; rachel.ginn@gmail.com.
Financial disclosures: None.
1. Abduljawad A, Al-Assaf AF. Incentives for better performance in health care. Sultan Qaboos Univ Med J. 2011;11:201-206.
2. Milstein R, Schreyoegg J. Pay for performance in the inpatient sector: a review of 34 P4P programs in 14 OECD countries. Health Policy. 2016;120:1125-1140.
3. Herzke CA, Michtalik HJ, Durkin N, et al. A method for attributing patient-level metrics to rotating providers in an inpatient setting. J Hosp Med. 2018;13:470-475.
4. Batbaatar E, Dorjdagva J, Luvsannyam A, Savino MM, Amenta P. Determinants of patient satisfaction: a systematic review. Perspect Public Health. 2017;137:89-101.
5. Ballou D, Sanders W, Wright P. Controlling for student background in value-added assessment of teachers. J Educ Behav Stat. 2004;29:37-65.
6. Hill PW, Goldstein H. Multilevel modeling of educational data with cross-classification and missing identification for units. J Educ Behav Stat. 1998;23:117-128.
7. Rasbash J, Browne WJ. Handbook of Multilevel Analysis. Springer; 2007.
8. Brown WJ, Goldstein H, Rasbash J. Multiple membership multiple classification (MMMC) models. Statistical Modeling. 2001;1:103-124.
9. Sanders WL, Horn SP. The Tennessee Value-Added Assessment System (TVAAS)—mixed-model methodology in educational assessment. J Pers Eval Educ. 1994;8:299-311.
10. Kroch EA, Duan M. CareScience Risk Assessment Model: Hospital Performance Measurement. Premier, Inc., 2008. http://www.ahrq.gov/qual/mortality/KrochRisk.htm
11. Schumacher DJ, Wu DTY, Meganathan K, et al. A feasibility study to attribute patients to primary interns on inpatient ward teams using electronic health record data. Acad Med. 2019;94:1376-1383.
12. Simoes J, Krumholz HM, Lin Z. Hospital-level 30-day risk-standardized readmission measure. Centers for Medicare & Medicaid Services, 2018. https://www.cms.gov/Medicare/Quality-Initiatives-Patient-Assessment-Instruments/HospitalQualityInits/Downloads/Hospital-Wide-All-Cause-Readmission-Updates.zip
13. Krol MW, de Boer D, Delnoij DM, Rademakers JJDJM. The Net Promoter Score: an asset to patient experience surveys? Health Expect. 2015;18:3099-3109.
14. Doyle C, Lennox L, Bell D. A systematic review of evidence on the links between patient experience and clinical safety and effectiveness. BMJ Open. 2013;3:e001570.
15. Henderson CR. Sire evaluation and genetic trends. J Anim Sci. 1973;1973:10-41.
16. Mood AM. Introduction to the Theory of Statistics. McGraw-Hill; 1950:xiii, 433-xiii.
17. Rao JNK, Molina I. Small Area Estimation. Wiley; 2015.
Pharmacists’ Bleed Risk Tool and Treatment Preferences Prior to Initiating Anticoagulation in Patients With Nonvalvular Atrial Fibrillation: A Cross-Sectional Survey
From Nova Southeastern University College of Pharmacy, Fort Lauderdale, FL.
Abstract
- Objective: To determine pharmacists’ preferences in bleed risk tool (BRT) usage and gastroprotection when bleed risk was lower than or equal to stroke risk in patients with nonvalvular atrial fibrillation and who were candidates for oral anticoagulation therapy (warfarin or direct oral anticoagulants [DOACs]).
- Methods: A survey consisting of 4 domains (demographics, clinical experience, BRT usage, and treatment preferences based on cases where bleed risk was lower than or equal to stroke risk) was developed. The anonymous survey was disseminated via REDCap software to members of the American College of Clinical Pharmacy ambulatory care and cardiology Practice-based Research Networks. Descriptive statistics were calculated for all study variables and inferential statistics were employed as necessary.
- Results: Of 165 BRT users, 97% preferred HAS-BLED. When bleed risk was lower than stroke risk, 151 respondents chose either DOACs (65%) or warfarin (35%); 15% added gastroprotection. When bleed risk was equal to stroke risk, 141 respondents chose DOACs (50%), warfarin (45%), or aspirin (5%); 40% added gastroprotection.
- Conclusion: In addition to BRT usage, pharmacists were judicious in their recommendation to add gastroprotection and would consider doing so if there was a specific indication. As more than 80% of extracranial bleeds are gastrointestinal bleeds and most BRTs are nonspecific for predicting these bleeds, randomized, prospective studies stratified by HAS-BLED and stroke risk scores are needed to provide further guidance on the efficacy and safety of oral anticoagulation therapy with or without gastroprotection.
Keywords: NVAF; gastroprotection; proton pump inhibitors; warfarin; oral anticoagulants.
Management of patients with nonvalvular atrial fibrillation (NVAF) with oral anticoagulation therapy (OACT) requires constant attention to maintain a balance between preventing strokes and minimizing bleeds. Several validated bleed risk tools (BRTs) available for use in NVAF patients include HAS-BLED, HEMORR2HAGES, ATRIA, and mOBRI.1,2 A high bleed risk score is not a contraindication to OACT, but, prior to and throughout therapy, bleed risk should be assessed and modifiable risk factors addressed.3 While intraluminal gastrointestinal (GI) bleeds are not considered a critical bleed site, they are a common complication of chronic OACT and can result in hemodynamic compromise and permanent discontinuation of therapy.4,5 In 3233 patients with nonvariceal upper GI bleeds (2005-2016), the adjusted odds ratio of hospital admission, transfusion, and re-bleeding while on OACT (warfarin, heparin, or apixaban) was 3.48, 2.53, and 2.26, respectively.6 Addition of acid-suppressive therapy with a proton pump inhibitor (PPI) or histamine-2 receptor antagonist (H2RA) in NVAF patients at increased risk for upper GI bleeds and receiving OACT may result in fewer bleeds.7,8
Pharmacists play an integral part in managing patients on warfarin,9-11 and data on their role in managing patients receiving direct oral anticoagulants (DOACs) are increasing.12-16 Inpatient pharmacists actively participate in multidisciplinary collaborative teams and use clinical decision-support systems or enhanced monitoring to ensure safe prescribing of high-risk medications.12,15,16 Pharmacist-managed, outpatient-based anticoagulation services in patients on warfarin were associated with lower rates of bleeding and thromboembolic events and lower health care utilization versus routine care.17 However, it is unclear how pharmacists manage patients who are candidates for OACT but who may be at increased risk for upper GI bleeds. Using a US-based survey, the investigators sought to determine pharmacists’ preferences in BRT usage and gastroprotection when bleed risk was lower than or equal to stroke risk.
Methods
This cross-sectional study was conducted after receiving approval by Nova Southeastern University’s Institutional Review Board. The survey consisted of 16 items divided into 4 domains: demographics, clinical experience, use of BRTs, and treatment preferences based on cases where bleed risk was lower than or equal to stroke risk (Figure 1). Queries were multiple choice and allowed for free-text input when “Other” was selected. Licensed pharmacists ≥ 18 years of age who routinely provided care to patients with NVAF were eligible to participate in the study. Participants who reported using a BRT (users) completed all study domains, while participants who reported not using a BRT (nonusers) completed domains 1 through 3 only.

An invitation containing the survey link was sent to the American College of Clinical Pharmacy ambulatory care (n = 2237) and cardiology (n = 1318) pharmacists listed in the organization’s Practice-based Research Networks. The survey was administered in the United States between April and June 2016 via Research Electronic Data Capture (REDCap) software, a secure Web application for building and managing online surveys designed to support data collection for research studies.18
Survey responses were downloaded, and data were analyzed using NCSS 2019 Statistical Software, LLC (Kaysville, UT). Descriptive statistics were calculated for all study variables. Demographic and clinical experience data for the group that used a BRT versus the group that did not were compared using Pearson’s chi-square, ANOVA, or the Cochran-Armitage test for trends. Logistic regression with hierarchical forward selection with switching was used to identify predictors of drug selection and use of gastroprotection.
Results
Of 230 respondents who completed the survey (response rate 6.5%), 165 (72%) used a BRT and 65 (28%) did not. No significant differences were found for age, gender, duration in clinical practice, the percentage of time spent in patient care, or practice specialty between users and nonusers (Table). The median age of users was 32 years; 68% were females; the median duration in clinical practice was 6 years; 75% of their time was spent in clinical practice; and clinical settings included ambulatory care, cardiology, and internal medicine. A significant difference was found for practice region between users versus nonusers (P = 0.014). Respondents who managed more than 200 NVAF patients per year used a BRT more often than those who managed fewer than 100 NVAF patients per year (P = 0.001).

Of those who used a BRT, 97% utilized the HAS-BLED tool (n = 160). The remainder used HEMORR2HAGES (n = 3), ATRIA (n = 1), and mOBRI (n = 1). Reasons for choosing HAS-BLED included “familiarity/ease-of-use,” “preference by institution/clinical team,” and the fact that it was a “validated tool for NVAF.”
When bleed risk was lower than stroke risk, 151 of 165 users (92%) chose a treatment option (Figure 2). Of those, 65% chose a DOAC and 35% chose warfarin. Fourteen respondents chose “other” and explained that they “would initiate OACT after weighing patient factors and preferences.” When a DOAC was selected, 9% (n = 9) chose PPI co-therapy and 4% (n = 4) chose a H2RA. When warfarin was selected, 13% (n = 7) chose PPI co-therapy and 4% (n = 2) chose a H2RA. Respondents who chose gastroprotection did not provide reasons for doing so, but those who did not add it explained that they “would add gastroprotection only if patient is also on an NSAID or has a history of GI bleed” or cited “patient preference.” Specific to warfarin, some respondents would not add gastroprotection, as anticoagulation with warfarin is “easily reversed.”
")
When bleed risk was equal to stroke risk, 141 of 165 users (85%) chose a treatment option (Figure 3). Fifty percent chose DOACs, 45% chose warfarin, and 5% chose aspirin.
")
Of respondents who selected either a DOAC or warfarin, 38% (n = 50) also added gastroprotection (Figure 3). When a DOAC was selected, 34% (n = 24) favored PPI co-therapy and 7% (n = 5) chose a H2RA. When warfarin was selected, 19% (n = 12) favored PPI co-therapy, while 13% (n = 8) chose a H2RA. Rationale for choosing gastroprotection, regardless of OACT selection, included “stroke is more devastating, so if patient wants to continue treatment, but knew risks of bleeding were similar, would recommend gastroprotection to help minimize bleeding risk” and “patient-specific consideration.” Rationales for not choosing gastroprotection included “would add gastroprotection only if patient is on dual antiplatelet therapy or has another indication”; “in most patients, stroke risk outweighs bleed risk so no need for gastroprotection unless there is a stated reason”; “would use apixaban as has lowest bleeding rate of all DOACs in clinical trials”; and “gastroprotection has not been shown to be beneficial in large scale trials.”
Eight respondents chose aspirin because it was “easy and relatively low cost.” Twenty-four respondents chose “other” and explained that the choice of OACT depended on patient preference after they had discussed stroke and bleed risk with the patient and/or determined the etiology driving bleed risk.
Discussion
This is the first national survey exploring US pharmacists’ preferences in BRT usage and treatment based on bleed risk. Pharmacists preferred the HAS-BLED tool and considered patient-specific factors and evidence-based data when weighing the risk-benefit of OACT with or without gastroprotective therapy.
Similar to our findings, where three-quarters of pharmacists used a BRT, a recent Medscape/American College of Cardiology (ACC) survey reported that 74% of cardiologists used a BRT (eg, HAS-BLED) always/most of the time or sometimes to assess a patient’s overall risk of bleeding prior to initiating DOAC therapy; 27% never or rarely used a bleed risk score before prescribing DOACs.19 Although reasons for BRT preference were not provided, they may be similar to those reported by our respondents (ie, familiarity/ease-of-use). In both surveys, rationales for not using a BRT were not obtained, but possible reasons include lack of confidence with bleed risk calculators,20 inconsistent implementation of comprehensive assessments (stroke risk, bleed risk, and medication-related issues prior to decision-making),21 and nonspecific guideline recommendations.22
More recently, a network meta-analysis found that HAS-BLED and HEMORR2HAGES had modest but balanced sensitivity (
Although more than 80% of extracranial bleeds are GI bleeds,24 most BRTs are nonspecific for predicting GI bleeds. Indeed, one respondent used a spreadsheet with several BRTs to maximize treatment guidance for patients with multiple risk factors for strokes and bleeds. A comprehensive approach to determining factors that increase bleed risk should be adopted. These factors include age (HAS-BLED, HEMORR2HAGES, mOBRI, ATRIA); anemia (mOBRI, HEMORR2HAGES, ATRIA); hepatic/renal disease (HAS-BLED, HEMORR2HAGES, ATRIA, mOBRI); concomitant medications/alcohol use, including NSAIDs, corticosteroids, and antiplatelet therapy (HAS-BLED, HEMORR2HAGES); bleed history/rebleeding risk (HEMORR2HAGES, HAS-BLED, ATRIA); and GI bleeds (mOBRI).1,2 Additional risk factors for GI bleeds include being a tobacco smoker and/or being infected with Helicobacter pylori. A prospective cohort study that analyzed data from questionnaires completed by 99,359 individuals from the Copenhagen General Population Study reported that the multivariable adjusted hazard ratio for current smokers versus never smokers was 2.20 (95% CI, 1.84-2.62) for GI bleeds.25 Presence of H pylori should be investigated, with a subsequent eradication regimen implemented, as patients with warfarin-associated upper GI bleeds who were H pylori-positive had lower HAS-BLED scores versus those who were negative.26
When bleed risk was lower than stroke risk (eg, HAS-BLED < 3, CHA2DS2VASc ≥ 1), respondents appropriately initiated therapy with an OAC (predominantly apixaban); a small proportion also added gastroprotection. If the patient did not have any other GI bleed risk factors (eg, a previous GI bleed or on chronic antiplatelet or NSAID therapy), the choice of OACT depended on the attributes of each OAC and patient preference.27 Selection of warfarin was appropriate if cost, formulary restrictions, and availability of an inexpensive reversal agent were important concerns to patients and/or their health care providers. Rivaroxaban was selected because of its once-daily dosing and low risk for GI bleeding.
The recently published ARISTOPHANES study provides evidence that apixaban is an appropriate choice in patients with a HAS-BLED score < 3. In this retrospective observational study, more than 70% of patients received standard doses of DOACs (apixaban 5 mg, dabigatran 150 mg, or rivaroxaban 20 mg) and about 20% had a bleeding history, about 30% were on PPIs, less than 25% were on NSAIDs, and about 40% had a HAS-BLED score < 3. The study found that apixaban was more effective (reduced rates of ischemic or hemorrhagic strokes/systemic embolism) and safer (reduced rates of major GI bleed or intracranial bleed) than warfarin.28 Dabigatran and rivaroxaban were also more effective than warfarin for stroke prevention and had a lower risk for major intracranial bleed risk; while the risk of major GI bleed was similar between dabigatran and warfarin, major GI bleed risk was higher for rivaroxaban. When compared with each other, the 3 DOACs were effective at stroke prevention, with apixaban more effective than dabigatran and rivaroxaban; similar efficacy was noted for dabigatran versus rivaroxaban. Apixaban was associated with fewer GI bleeds versus dabigatran and rivaroxaban, but with similar intracranial bleed risks; dabigatran was associated with fewer GI bleeds but similar intracranial bleed risks versus rivaroxaban.28 Efficacy and safety findings from a subgroup analysis based on HAS-BLED scores < 3 and ≥ 3 were generally consistent with the main results.
When bleed risk was equal to stroke risk, the difficulty was determining how OACT in a patient at high stroke risk (CHA2DS2VASc score ≥ 2) and high bleed risk (HAS-BLED score ≥ 3) should be managed.
Another important finding was pharmacists’ uncertainty as to the effectiveness of PPIs in preventing GI bleeds in combination with DOACs. The data are conflicting. A meta-analysis of older studies (2007-2015) showed that PPIs (but not H2RAs) reduced the risk of upper GI bleeds in patients on warfarin but not for dabigatran
Limitations
Limitations of our survey included an overall low response rate,
Conclusion
In addition to applying BRTs in the management of NVAF patients, pharmacists considered patient-specific variables, prescriber preferences, and evidence-based guidance when recommending OACT with or without gastroprotection. To avoid suboptimal patient management, busy pharmacists should be granted time to attend continuing education programs describing optimal OACT selection and formulation of individualized, evidence-based plans to address modifiable risk factors for bleeding, including the appropriate use of gastroprotection. Randomized, prospective, long-term studies stratified by HAS-BLED and CHA2DS2VASc scores are needed to further clarify efficacy, safety, and cost-effectiveness of OACT, with and without PPIs, in patients who may be at risk for upper GI bleeds.
Acknowledgments:
Corresponding author: Devada Singh-Franco, PharmD, CDE, Nova Southeastern University College of Pharmacy, 3200 S University Drive, Fort Lauderdale, FL 33328; singh@nova.edu
Disclosures: None.
Funding: The study was supported by Nova Southeastern University’s Health Professions Division Internal Research Grant.
1. Apostolakis S, Lane DA, Guo Y, et al. Performance of the HEMORR2HAGES, ATRIA, and HAS-BLED bleeding risk–prediction scores in patients with atrial fibrillation undergoing anticoagulation. J Am Coll Cardiol. 2012;60:861-867.
2. Chang G, Xie Q, Ma L, et al. Accuracy of HAS-BLED and other bleeding risk assessment tools in predicting major bleeding events in atrial fibrillation: A network meta-analysis. J Thromb Haemost. 2020;18:791-801.
3. Ding WY, Harrison SL, Lane DA, Lip GYH. Considerations when choosing an appropriate bleeding risk assessment tool for patients with atrial fibrillation. J Thromb Haemost. 2020;18:788-790.
4. Lauffenburger JC, Rhoney DH, Farley JF, et al. Predictors of gastrointestinal bleeding among patients with atrial fibrillation after initiating dabigatran therapy. Pharmacotherapy. 2015;35:560-568.
5. Tomaselli GF, Mahaffey KW, Cuker A, et al. 2020 ACC Expert Consensus Decision Pathway on Management of Bleeding in Patients on Oral Anticoagulants: A Report of the American College of Cardiology Solution Set Oversight Committee. J Am Coll Cardiol. 2020;76:594-622.
6. Taha A, McCloskey C, Craigen T, Angerson W. Antiplatelet versus anticoagulant effects in non-variceal upper gastrointestinal bleeding. Gut. 2019;68(suppl 2):A152.
7. Chan EW, Lau WC, Leung WK, et al. Prevention of dabigatran-related gastrointestinal bleeding with gastroprotective agents: A population-based study. Gastroenterology. 2015;149:586-595.
8. Ray WA, Chung CP, Murray KT, et al. Association of oral anticoagulants and proton pump inhibitor cotherapy with hospitalization for upper gastrointestinal tract bleeding. JAMA. 2018;320:2221-2230.
9. Brunetti L, Lee S-M, Doherty N, et al. Impact of warfarin discharge education program on hospital readmission and treatment costs. Int J Clin Pharm. 2018;40:721-729.
10. Hasan SS, Kow CS, Curley LE, et al. Economic evaluation of prescribing conventional and newer oral anticoagulants in older adults. Expert Rev Pharmacoecon Outcomes Res. 2018;18:371-377.
11. Phelps E, Delate T, Witt DM, et al. Effect of increased time in the therapeutic range on atrial fibrillation outcomes within a centralized anticoagulation service. Thromb Res. 2018;163:54-59.
12. Ahuja T, Raco V, Papadopoulos J, Green D. Antithrombotic stewardship: Assessing use of computerized clinical decision support tools to enhance safe prescribing of direct oral anticoagulants in hospitalized patients. J Patient Saf. 2018 Sep 25. [Epub ahead of print]
13. Leef GC, Perino AC, Askari M, et al. Appropriateness of direct oral anticoagulant dosing in patients with atrial fibrillation: Insights from the Veterans Health Administration. J Pharm Pract. 2020;33:647-653.
14. Papastergiou J, Kheir N, Ladova K, et al. Pharmacists’ confidence when providing pharmaceutical care on anticoagulants, a multinational survey. Int J Clin Pharm. 2017;39:1282-1290.
15. Perlman A, Horwitz E, Hirsh-Raccah B, et al. Clinical pharmacist led hospital-wide direct oral anticoagulant stewardship program. Isr J Health Policy Res. 2019;8:19.
16. Uppuluri EM, McComb MN, Shapiro NL. Implementation of a direct oral anticoagulation screening service at a large academic medical center provided by a pharmacist-managed antithrombosis clinic as a method to expand antithrombotic stewardship efforts. J Pharm Pract. 2020;33:271-275.
17. Manzoor BS, Cheng W-H, Lee JC, et al. Quality of pharmacist-managed anticoagulation therapy in long-term ambulatory settings: A systematic review. Ann Pharmacother. 2017;51:1122-1137.
18. Harris PA, Taylor R, Thielke R, et al. Research Electronic Data Capture (REDCap)—A metadata-driven methodology and workflow process for providing translational research informatics support. J Biomed Inform. 2009;42:377-381.
19. Brooks M. AF management: Are clinicians in agreement? Medscape. May 30, 2019. Accessed December 29, 2020. https://www.medscape.com/viewarticle/913386
20. Amroze A, Mazor K, Crawford S, et al. Survey of confidence in use of stroke and bleeding risk calculators, knowledge of anticoagulants, and comfort with prescription of anticoagulation in challenging scenarios: SUPPORT-AF II study. J Thromb Thrombolysis. 2019;48:629-637.
21. Wang Y, Bajorek B. Decision-making around antithrombotics for stroke prevention in atrial fibrillation: the health professionals’ views. Int J Clin Pharm. 2016;38:985-995.
22. January CT, Wann LS, Alpert JS, et al. 2014 AHA/ACC/HRS guideline for the management of patients with atrial fibrillation: a report of the American College of Cardiology/American Heart Association Task Force on Practice Guidelines and the Heart Rhythm Society. Circulation. 2014;130:e199-e267.
23. January CT, Wann LS, Calkins H, et al. 2019 AHA/ACC/HRS Focused Update of the 2014 AHA/ACC/HRS Guideline for the Management of Patients With Atrial Fibrillation: A Report of the American College of Cardiology/American Heart Association Task Force on Clinical Practice Guidelines and the Heart Rhythm Society. J Am Coll Cardiol. 2019;74:104-132.
24. Anghel L, Sascu R, Trifan A, et al. Non-vitamin K antagonist oral anticoagulants and the gastrointestinal bleeding risk in real-world studies. J Clin Med. 2020;9:1398.
25. Langsted A, Nordestgaard BG. Smoking is associated with increased risk of major bleeding: a prospective cohort study. Thromb Haemost. 2019;119:39-47.
26. Faye AS, Hung KW, Cheng K, et al. HAS-BLED scores underestimate gastrointestinal bleeding risk among those with H. pylori. Am J Gastroenterol. 2019;114:S364.
27. Fawzy AM, Yang W-Y, Lip GY. Safety of direct oral anticoagulants in real-world clinical practice: translating the trials to everyday clinical management. Expert Opin Drug Saf. 2019;18:187-209.
28. Lip GYH, Keshishian A, Li X, et al. Effectiveness and safety of oral anticoagulants among nonvalvular atrial fibrillation patients. Stroke. 2018;49:2933-2944.
29. Abraham NS, Singh S, Alexander GC, et al. Comparative risk of gastrointestinal bleeding with dabigatran, rivaroxaban, and warfarin: population based cohort study. BMJ. 2015;350:h1857.
30. Holster IL, Valkhoff VE, Kuipers EJ, Tjwa E. New oral anticoagulants increase risk for gastrointestinal bleeding: a systematic review and meta-analysis. Gastroenterology. 2013;145:105-112.
31. Sherwood MW, Nessel CC, Hellkamp AS, et al. Gastrointestinal bleeding in patients with atrial fibrillation treated with rivaroxaban or warfarin: ROCKET AF Trial. J Am Coll Cardiol. 2015;66:2271-2281.
32. Di Minno A, Spadarella G, Spadarella E, et al. Gastrointestinal bleeding in patients receiving oral anticoagulation: Current treatment and pharmacological perspectives. Thromb Res. 2015;136:1074-1081.
33. Abraham NS, Hlatky MA, Antman EM, et al. ACCF/ACG/AHA 2010 Expert Consensus Document on the Concomitant Use of Proton Pump Inhibitors and Thienopyridines: A Focused Update of the ACCF/ACG/AHA 2008 Expert Consensus Document on Reducing the Gastrointestinal Risks of Antiplatelet Therapy and NSAID Use. Circulation. 2010;122:2619-2633.
34. Bhatt DL, Scheiman J, Abraham NS, et al. ACCF/ACG/AHA 2008 expert consensus document on reducing the gastrointestinal risks of antiplatelet therapy and NSAID use: a report of the American College of Cardiology Foundation Task Force on Clinical Expert Consensus Documents. J Am Coll Cardiol. 2008;52:1502-1517.
35. Lanza FL, Chan FK, Quigley EM. Guidelines for prevention of NSAID-related ulcer complications. Am J Gastroenterol. 2009;104:728-738.
36. Bang CS, Joo MK, Kim BW, et al. The role of acid suppressants in the prevention of anticoagulant-related gastrointestinal bleeding: a systematic review and meta-analysis. Gut Liver. 2020;14:57-66.
37. Farrell B, Pottie K, Thompson W, et al. Deprescribing proton pump inhibitors: Evidence-based clinical practice guideline. Can Fam Physician. 2017;63:354-364.
38. Fossmark R, Martinsen TC, Waldum HL. Adverse effects of proton pump inhibitors—evidence and plausibility. Int J Mol Sci. 2019;20:5203.
39. Haastrup PF, Thompson W, Sondergaard J, Jarbol DE. Side effects of long-term proton pump inhibitor use: A review. Basic Clin Pharmacol Toxicol. 2018;123:114-121.
40. Wong JM, Maddox TM, Kennedy K, Shaw RE. Comparing major bleeding risk in outpatients with atrial fibrillation or flutter by oral anticoagulant type (from the National Cardiovascular Disease Registry’s Practice Innovation and Clinical Excellence Registry). Am J Cardiol. 2020;125:1500-1507.
41. Nagata N, Niikura R, Aoki T, et al. Effect of proton-pump inhibitors on the risk of lower gastrointestinal bleeding associated with NSAIDs, aspirin, clopidogrel, and warfarin. J Gastroenterol. 2015;50:1079-1086.
From Nova Southeastern University College of Pharmacy, Fort Lauderdale, FL.
Abstract
- Objective: To determine pharmacists’ preferences in bleed risk tool (BRT) usage and gastroprotection when bleed risk was lower than or equal to stroke risk in patients with nonvalvular atrial fibrillation and who were candidates for oral anticoagulation therapy (warfarin or direct oral anticoagulants [DOACs]).
- Methods: A survey consisting of 4 domains (demographics, clinical experience, BRT usage, and treatment preferences based on cases where bleed risk was lower than or equal to stroke risk) was developed. The anonymous survey was disseminated via REDCap software to members of the American College of Clinical Pharmacy ambulatory care and cardiology Practice-based Research Networks. Descriptive statistics were calculated for all study variables and inferential statistics were employed as necessary.
- Results: Of 165 BRT users, 97% preferred HAS-BLED. When bleed risk was lower than stroke risk, 151 respondents chose either DOACs (65%) or warfarin (35%); 15% added gastroprotection. When bleed risk was equal to stroke risk, 141 respondents chose DOACs (50%), warfarin (45%), or aspirin (5%); 40% added gastroprotection.
- Conclusion: In addition to BRT usage, pharmacists were judicious in their recommendation to add gastroprotection and would consider doing so if there was a specific indication. As more than 80% of extracranial bleeds are gastrointestinal bleeds and most BRTs are nonspecific for predicting these bleeds, randomized, prospective studies stratified by HAS-BLED and stroke risk scores are needed to provide further guidance on the efficacy and safety of oral anticoagulation therapy with or without gastroprotection.
Keywords: NVAF; gastroprotection; proton pump inhibitors; warfarin; oral anticoagulants.
Management of patients with nonvalvular atrial fibrillation (NVAF) with oral anticoagulation therapy (OACT) requires constant attention to maintain a balance between preventing strokes and minimizing bleeds. Several validated bleed risk tools (BRTs) available for use in NVAF patients include HAS-BLED, HEMORR2HAGES, ATRIA, and mOBRI.1,2 A high bleed risk score is not a contraindication to OACT, but, prior to and throughout therapy, bleed risk should be assessed and modifiable risk factors addressed.3 While intraluminal gastrointestinal (GI) bleeds are not considered a critical bleed site, they are a common complication of chronic OACT and can result in hemodynamic compromise and permanent discontinuation of therapy.4,5 In 3233 patients with nonvariceal upper GI bleeds (2005-2016), the adjusted odds ratio of hospital admission, transfusion, and re-bleeding while on OACT (warfarin, heparin, or apixaban) was 3.48, 2.53, and 2.26, respectively.6 Addition of acid-suppressive therapy with a proton pump inhibitor (PPI) or histamine-2 receptor antagonist (H2RA) in NVAF patients at increased risk for upper GI bleeds and receiving OACT may result in fewer bleeds.7,8
Pharmacists play an integral part in managing patients on warfarin,9-11 and data on their role in managing patients receiving direct oral anticoagulants (DOACs) are increasing.12-16 Inpatient pharmacists actively participate in multidisciplinary collaborative teams and use clinical decision-support systems or enhanced monitoring to ensure safe prescribing of high-risk medications.12,15,16 Pharmacist-managed, outpatient-based anticoagulation services in patients on warfarin were associated with lower rates of bleeding and thromboembolic events and lower health care utilization versus routine care.17 However, it is unclear how pharmacists manage patients who are candidates for OACT but who may be at increased risk for upper GI bleeds. Using a US-based survey, the investigators sought to determine pharmacists’ preferences in BRT usage and gastroprotection when bleed risk was lower than or equal to stroke risk.
Methods
This cross-sectional study was conducted after receiving approval by Nova Southeastern University’s Institutional Review Board. The survey consisted of 16 items divided into 4 domains: demographics, clinical experience, use of BRTs, and treatment preferences based on cases where bleed risk was lower than or equal to stroke risk (Figure 1). Queries were multiple choice and allowed for free-text input when “Other” was selected. Licensed pharmacists ≥ 18 years of age who routinely provided care to patients with NVAF were eligible to participate in the study. Participants who reported using a BRT (users) completed all study domains, while participants who reported not using a BRT (nonusers) completed domains 1 through 3 only.
An invitation containing the survey link was sent to the American College of Clinical Pharmacy ambulatory care (n = 2237) and cardiology (n = 1318) pharmacists listed in the organization’s Practice-based Research Networks. The survey was administered in the United States between April and June 2016 via Research Electronic Data Capture (REDCap) software, a secure Web application for building and managing online surveys designed to support data collection for research studies.18
Survey responses were downloaded, and data were analyzed using NCSS 2019 Statistical Software, LLC (Kaysville, UT). Descriptive statistics were calculated for all study variables. Demographic and clinical experience data for the group that used a BRT versus the group that did not were compared using Pearson’s chi-square, ANOVA, or the Cochran-Armitage test for trends. Logistic regression with hierarchical forward selection with switching was used to identify predictors of drug selection and use of gastroprotection.
Results
Of 230 respondents who completed the survey (response rate 6.5%), 165 (72%) used a BRT and 65 (28%) did not. No significant differences were found for age, gender, duration in clinical practice, the percentage of time spent in patient care, or practice specialty between users and nonusers (Table). The median age of users was 32 years; 68% were females; the median duration in clinical practice was 6 years; 75% of their time was spent in clinical practice; and clinical settings included ambulatory care, cardiology, and internal medicine. A significant difference was found for practice region between users versus nonusers (P = 0.014). Respondents who managed more than 200 NVAF patients per year used a BRT more often than those who managed fewer than 100 NVAF patients per year (P = 0.001).
Of those who used a BRT, 97% utilized the HAS-BLED tool (n = 160). The remainder used HEMORR2HAGES (n = 3), ATRIA (n = 1), and mOBRI (n = 1). Reasons for choosing HAS-BLED included “familiarity/ease-of-use,” “preference by institution/clinical team,” and the fact that it was a “validated tool for NVAF.”
When bleed risk was lower than stroke risk, 151 of 165 users (92%) chose a treatment option (Figure 2). Of those, 65% chose a DOAC and 35% chose warfarin. Fourteen respondents chose “other” and explained that they “would initiate OACT after weighing patient factors and preferences.” When a DOAC was selected, 9% (n = 9) chose PPI co-therapy and 4% (n = 4) chose a H2RA. When warfarin was selected, 13% (n = 7) chose PPI co-therapy and 4% (n = 2) chose a H2RA. Respondents who chose gastroprotection did not provide reasons for doing so, but those who did not add it explained that they “would add gastroprotection only if patient is also on an NSAID or has a history of GI bleed” or cited “patient preference.” Specific to warfarin, some respondents would not add gastroprotection, as anticoagulation with warfarin is “easily reversed.”
When bleed risk was equal to stroke risk, 141 of 165 users (85%) chose a treatment option (Figure 3). Fifty percent chose DOACs, 45% chose warfarin, and 5% chose aspirin.
Of respondents who selected either a DOAC or warfarin, 38% (n = 50) also added gastroprotection (Figure 3). When a DOAC was selected, 34% (n = 24) favored PPI co-therapy and 7% (n = 5) chose a H2RA. When warfarin was selected, 19% (n = 12) favored PPI co-therapy, while 13% (n = 8) chose a H2RA. Rationale for choosing gastroprotection, regardless of OACT selection, included “stroke is more devastating, so if patient wants to continue treatment, but knew risks of bleeding were similar, would recommend gastroprotection to help minimize bleeding risk” and “patient-specific consideration.” Rationales for not choosing gastroprotection included “would add gastroprotection only if patient is on dual antiplatelet therapy or has another indication”; “in most patients, stroke risk outweighs bleed risk so no need for gastroprotection unless there is a stated reason”; “would use apixaban as has lowest bleeding rate of all DOACs in clinical trials”; and “gastroprotection has not been shown to be beneficial in large scale trials.”
Eight respondents chose aspirin because it was “easy and relatively low cost.” Twenty-four respondents chose “other” and explained that the choice of OACT depended on patient preference after they had discussed stroke and bleed risk with the patient and/or determined the etiology driving bleed risk.
Discussion
This is the first national survey exploring US pharmacists’ preferences in BRT usage and treatment based on bleed risk. Pharmacists preferred the HAS-BLED tool and considered patient-specific factors and evidence-based data when weighing the risk-benefit of OACT with or without gastroprotective therapy.
Similar to our findings, where three-quarters of pharmacists used a BRT, a recent Medscape/American College of Cardiology (ACC) survey reported that 74% of cardiologists used a BRT (eg, HAS-BLED) always/most of the time or sometimes to assess a patient’s overall risk of bleeding prior to initiating DOAC therapy; 27% never or rarely used a bleed risk score before prescribing DOACs.19 Although reasons for BRT preference were not provided, they may be similar to those reported by our respondents (ie, familiarity/ease-of-use). In both surveys, rationales for not using a BRT were not obtained, but possible reasons include lack of confidence with bleed risk calculators,20 inconsistent implementation of comprehensive assessments (stroke risk, bleed risk, and medication-related issues prior to decision-making),21 and nonspecific guideline recommendations.22
More recently, a network meta-analysis found that HAS-BLED and HEMORR2HAGES had modest but balanced sensitivity (
Although more than 80% of extracranial bleeds are GI bleeds,24 most BRTs are nonspecific for predicting GI bleeds. Indeed, one respondent used a spreadsheet with several BRTs to maximize treatment guidance for patients with multiple risk factors for strokes and bleeds. A comprehensive approach to determining factors that increase bleed risk should be adopted. These factors include age (HAS-BLED, HEMORR2HAGES, mOBRI, ATRIA); anemia (mOBRI, HEMORR2HAGES, ATRIA); hepatic/renal disease (HAS-BLED, HEMORR2HAGES, ATRIA, mOBRI); concomitant medications/alcohol use, including NSAIDs, corticosteroids, and antiplatelet therapy (HAS-BLED, HEMORR2HAGES); bleed history/rebleeding risk (HEMORR2HAGES, HAS-BLED, ATRIA); and GI bleeds (mOBRI).1,2 Additional risk factors for GI bleeds include being a tobacco smoker and/or being infected with Helicobacter pylori. A prospective cohort study that analyzed data from questionnaires completed by 99,359 individuals from the Copenhagen General Population Study reported that the multivariable adjusted hazard ratio for current smokers versus never smokers was 2.20 (95% CI, 1.84-2.62) for GI bleeds.25 Presence of H pylori should be investigated, with a subsequent eradication regimen implemented, as patients with warfarin-associated upper GI bleeds who were H pylori-positive had lower HAS-BLED scores versus those who were negative.26
When bleed risk was lower than stroke risk (eg, HAS-BLED < 3, CHA2DS2VASc ≥ 1), respondents appropriately initiated therapy with an OAC (predominantly apixaban); a small proportion also added gastroprotection. If the patient did not have any other GI bleed risk factors (eg, a previous GI bleed or on chronic antiplatelet or NSAID therapy), the choice of OACT depended on the attributes of each OAC and patient preference.27 Selection of warfarin was appropriate if cost, formulary restrictions, and availability of an inexpensive reversal agent were important concerns to patients and/or their health care providers. Rivaroxaban was selected because of its once-daily dosing and low risk for GI bleeding.
The recently published ARISTOPHANES study provides evidence that apixaban is an appropriate choice in patients with a HAS-BLED score < 3. In this retrospective observational study, more than 70% of patients received standard doses of DOACs (apixaban 5 mg, dabigatran 150 mg, or rivaroxaban 20 mg) and about 20% had a bleeding history, about 30% were on PPIs, less than 25% were on NSAIDs, and about 40% had a HAS-BLED score < 3. The study found that apixaban was more effective (reduced rates of ischemic or hemorrhagic strokes/systemic embolism) and safer (reduced rates of major GI bleed or intracranial bleed) than warfarin.28 Dabigatran and rivaroxaban were also more effective than warfarin for stroke prevention and had a lower risk for major intracranial bleed risk; while the risk of major GI bleed was similar between dabigatran and warfarin, major GI bleed risk was higher for rivaroxaban. When compared with each other, the 3 DOACs were effective at stroke prevention, with apixaban more effective than dabigatran and rivaroxaban; similar efficacy was noted for dabigatran versus rivaroxaban. Apixaban was associated with fewer GI bleeds versus dabigatran and rivaroxaban, but with similar intracranial bleed risks; dabigatran was associated with fewer GI bleeds but similar intracranial bleed risks versus rivaroxaban.28 Efficacy and safety findings from a subgroup analysis based on HAS-BLED scores < 3 and ≥ 3 were generally consistent with the main results.
When bleed risk was equal to stroke risk, the difficulty was determining how OACT in a patient at high stroke risk (CHA2DS2VASc score ≥ 2) and high bleed risk (HAS-BLED score ≥ 3) should be managed.
Another important finding was pharmacists’ uncertainty as to the effectiveness of PPIs in preventing GI bleeds in combination with DOACs. The data are conflicting. A meta-analysis of older studies (2007-2015) showed that PPIs (but not H2RAs) reduced the risk of upper GI bleeds in patients on warfarin but not for dabigatran
Limitations
Limitations of our survey included an overall low response rate,
Conclusion
In addition to applying BRTs in the management of NVAF patients, pharmacists considered patient-specific variables, prescriber preferences, and evidence-based guidance when recommending OACT with or without gastroprotection. To avoid suboptimal patient management, busy pharmacists should be granted time to attend continuing education programs describing optimal OACT selection and formulation of individualized, evidence-based plans to address modifiable risk factors for bleeding, including the appropriate use of gastroprotection. Randomized, prospective, long-term studies stratified by HAS-BLED and CHA2DS2VASc scores are needed to further clarify efficacy, safety, and cost-effectiveness of OACT, with and without PPIs, in patients who may be at risk for upper GI bleeds.
Acknowledgments:
Corresponding author: Devada Singh-Franco, PharmD, CDE, Nova Southeastern University College of Pharmacy, 3200 S University Drive, Fort Lauderdale, FL 33328; singh@nova.edu
Disclosures: None.
Funding: The study was supported by Nova Southeastern University’s Health Professions Division Internal Research Grant.
1. Apostolakis S, Lane DA, Guo Y, et al. Performance of the HEMORR2HAGES, ATRIA, and HAS-BLED bleeding risk–prediction scores in patients with atrial fibrillation undergoing anticoagulation. J Am Coll Cardiol. 2012;60:861-867.
2. Chang G, Xie Q, Ma L, et al. Accuracy of HAS-BLED and other bleeding risk assessment tools in predicting major bleeding events in atrial fibrillation: A network meta-analysis. J Thromb Haemost. 2020;18:791-801.
3. Ding WY, Harrison SL, Lane DA, Lip GYH. Considerations when choosing an appropriate bleeding risk assessment tool for patients with atrial fibrillation. J Thromb Haemost. 2020;18:788-790.
4. Lauffenburger JC, Rhoney DH, Farley JF, et al. Predictors of gastrointestinal bleeding among patients with atrial fibrillation after initiating dabigatran therapy. Pharmacotherapy. 2015;35:560-568.
5. Tomaselli GF, Mahaffey KW, Cuker A, et al. 2020 ACC Expert Consensus Decision Pathway on Management of Bleeding in Patients on Oral Anticoagulants: A Report of the American College of Cardiology Solution Set Oversight Committee. J Am Coll Cardiol. 2020;76:594-622.
6. Taha A, McCloskey C, Craigen T, Angerson W. Antiplatelet versus anticoagulant effects in non-variceal upper gastrointestinal bleeding. Gut. 2019;68(suppl 2):A152.
7. Chan EW, Lau WC, Leung WK, et al. Prevention of dabigatran-related gastrointestinal bleeding with gastroprotective agents: A population-based study. Gastroenterology. 2015;149:586-595.
8. Ray WA, Chung CP, Murray KT, et al. Association of oral anticoagulants and proton pump inhibitor cotherapy with hospitalization for upper gastrointestinal tract bleeding. JAMA. 2018;320:2221-2230.
9. Brunetti L, Lee S-M, Doherty N, et al. Impact of warfarin discharge education program on hospital readmission and treatment costs. Int J Clin Pharm. 2018;40:721-729.
10. Hasan SS, Kow CS, Curley LE, et al. Economic evaluation of prescribing conventional and newer oral anticoagulants in older adults. Expert Rev Pharmacoecon Outcomes Res. 2018;18:371-377.
11. Phelps E, Delate T, Witt DM, et al. Effect of increased time in the therapeutic range on atrial fibrillation outcomes within a centralized anticoagulation service. Thromb Res. 2018;163:54-59.
12. Ahuja T, Raco V, Papadopoulos J, Green D. Antithrombotic stewardship: Assessing use of computerized clinical decision support tools to enhance safe prescribing of direct oral anticoagulants in hospitalized patients. J Patient Saf. 2018 Sep 25. [Epub ahead of print]
13. Leef GC, Perino AC, Askari M, et al. Appropriateness of direct oral anticoagulant dosing in patients with atrial fibrillation: Insights from the Veterans Health Administration. J Pharm Pract. 2020;33:647-653.
14. Papastergiou J, Kheir N, Ladova K, et al. Pharmacists’ confidence when providing pharmaceutical care on anticoagulants, a multinational survey. Int J Clin Pharm. 2017;39:1282-1290.
15. Perlman A, Horwitz E, Hirsh-Raccah B, et al. Clinical pharmacist led hospital-wide direct oral anticoagulant stewardship program. Isr J Health Policy Res. 2019;8:19.
16. Uppuluri EM, McComb MN, Shapiro NL. Implementation of a direct oral anticoagulation screening service at a large academic medical center provided by a pharmacist-managed antithrombosis clinic as a method to expand antithrombotic stewardship efforts. J Pharm Pract. 2020;33:271-275.
17. Manzoor BS, Cheng W-H, Lee JC, et al. Quality of pharmacist-managed anticoagulation therapy in long-term ambulatory settings: A systematic review. Ann Pharmacother. 2017;51:1122-1137.
18. Harris PA, Taylor R, Thielke R, et al. Research Electronic Data Capture (REDCap)—A metadata-driven methodology and workflow process for providing translational research informatics support. J Biomed Inform. 2009;42:377-381.
19. Brooks M. AF management: Are clinicians in agreement? Medscape. May 30, 2019. Accessed December 29, 2020. https://www.medscape.com/viewarticle/913386
20. Amroze A, Mazor K, Crawford S, et al. Survey of confidence in use of stroke and bleeding risk calculators, knowledge of anticoagulants, and comfort with prescription of anticoagulation in challenging scenarios: SUPPORT-AF II study. J Thromb Thrombolysis. 2019;48:629-637.
21. Wang Y, Bajorek B. Decision-making around antithrombotics for stroke prevention in atrial fibrillation: the health professionals’ views. Int J Clin Pharm. 2016;38:985-995.
22. January CT, Wann LS, Alpert JS, et al. 2014 AHA/ACC/HRS guideline for the management of patients with atrial fibrillation: a report of the American College of Cardiology/American Heart Association Task Force on Practice Guidelines and the Heart Rhythm Society. Circulation. 2014;130:e199-e267.
23. January CT, Wann LS, Calkins H, et al. 2019 AHA/ACC/HRS Focused Update of the 2014 AHA/ACC/HRS Guideline for the Management of Patients With Atrial Fibrillation: A Report of the American College of Cardiology/American Heart Association Task Force on Clinical Practice Guidelines and the Heart Rhythm Society. J Am Coll Cardiol. 2019;74:104-132.
24. Anghel L, Sascu R, Trifan A, et al. Non-vitamin K antagonist oral anticoagulants and the gastrointestinal bleeding risk in real-world studies. J Clin Med. 2020;9:1398.
25. Langsted A, Nordestgaard BG. Smoking is associated with increased risk of major bleeding: a prospective cohort study. Thromb Haemost. 2019;119:39-47.
26. Faye AS, Hung KW, Cheng K, et al. HAS-BLED scores underestimate gastrointestinal bleeding risk among those with H. pylori. Am J Gastroenterol. 2019;114:S364.
27. Fawzy AM, Yang W-Y, Lip GY. Safety of direct oral anticoagulants in real-world clinical practice: translating the trials to everyday clinical management. Expert Opin Drug Saf. 2019;18:187-209.
28. Lip GYH, Keshishian A, Li X, et al. Effectiveness and safety of oral anticoagulants among nonvalvular atrial fibrillation patients. Stroke. 2018;49:2933-2944.
29. Abraham NS, Singh S, Alexander GC, et al. Comparative risk of gastrointestinal bleeding with dabigatran, rivaroxaban, and warfarin: population based cohort study. BMJ. 2015;350:h1857.
30. Holster IL, Valkhoff VE, Kuipers EJ, Tjwa E. New oral anticoagulants increase risk for gastrointestinal bleeding: a systematic review and meta-analysis. Gastroenterology. 2013;145:105-112.
31. Sherwood MW, Nessel CC, Hellkamp AS, et al. Gastrointestinal bleeding in patients with atrial fibrillation treated with rivaroxaban or warfarin: ROCKET AF Trial. J Am Coll Cardiol. 2015;66:2271-2281.
32. Di Minno A, Spadarella G, Spadarella E, et al. Gastrointestinal bleeding in patients receiving oral anticoagulation: Current treatment and pharmacological perspectives. Thromb Res. 2015;136:1074-1081.
33. Abraham NS, Hlatky MA, Antman EM, et al. ACCF/ACG/AHA 2010 Expert Consensus Document on the Concomitant Use of Proton Pump Inhibitors and Thienopyridines: A Focused Update of the ACCF/ACG/AHA 2008 Expert Consensus Document on Reducing the Gastrointestinal Risks of Antiplatelet Therapy and NSAID Use. Circulation. 2010;122:2619-2633.
34. Bhatt DL, Scheiman J, Abraham NS, et al. ACCF/ACG/AHA 2008 expert consensus document on reducing the gastrointestinal risks of antiplatelet therapy and NSAID use: a report of the American College of Cardiology Foundation Task Force on Clinical Expert Consensus Documents. J Am Coll Cardiol. 2008;52:1502-1517.
35. Lanza FL, Chan FK, Quigley EM. Guidelines for prevention of NSAID-related ulcer complications. Am J Gastroenterol. 2009;104:728-738.
36. Bang CS, Joo MK, Kim BW, et al. The role of acid suppressants in the prevention of anticoagulant-related gastrointestinal bleeding: a systematic review and meta-analysis. Gut Liver. 2020;14:57-66.
37. Farrell B, Pottie K, Thompson W, et al. Deprescribing proton pump inhibitors: Evidence-based clinical practice guideline. Can Fam Physician. 2017;63:354-364.
38. Fossmark R, Martinsen TC, Waldum HL. Adverse effects of proton pump inhibitors—evidence and plausibility. Int J Mol Sci. 2019;20:5203.
39. Haastrup PF, Thompson W, Sondergaard J, Jarbol DE. Side effects of long-term proton pump inhibitor use: A review. Basic Clin Pharmacol Toxicol. 2018;123:114-121.
40. Wong JM, Maddox TM, Kennedy K, Shaw RE. Comparing major bleeding risk in outpatients with atrial fibrillation or flutter by oral anticoagulant type (from the National Cardiovascular Disease Registry’s Practice Innovation and Clinical Excellence Registry). Am J Cardiol. 2020;125:1500-1507.
41. Nagata N, Niikura R, Aoki T, et al. Effect of proton-pump inhibitors on the risk of lower gastrointestinal bleeding associated with NSAIDs, aspirin, clopidogrel, and warfarin. J Gastroenterol. 2015;50:1079-1086.
