User login
Opportunities for Stewardship in the Transition From Intravenous to Enteral Antibiotics in Hospitalized Pediatric Patients
Bacterial infections are a common reason for pediatric hospital admissions in the United States.1 Antibiotics are the mainstay of treatment, and whether to administer them intravenously (IV) or enterally is an important and, at times, challenging decision. Not all hospitalized patients with infections require IV antibiotics, and safe, effective early transitions to enteral therapy have been described for numerous infections.2-7 However, guidelines describing the ideal initial route of antibiotic administration and when to transition to oral therapy are lacking.5,7,8 This lack of high-quality evidence-based guidance may contribute to overuse of IV antibiotics for many hospitalized pediatric patients, even when safe and effective enteral options exist.9
Significant costs and harms are associated with the use of IV antibiotics. In particular, studies have demonstrated longer length of stay (LOS), increased costs, and worsened pain or anxiety related to complications (eg, phlebitis, extravasation injury, thrombosis, catheter-associated bloodstream infections) associated with IV antibiotics.3,4,10-13 Earlier transition to enteral therapy, however, can mitigate these increased risks and costs.
The Centers for Disease Control and Prevention lists the transition from IV to oral antibiotics as a key stewardship intervention for improving antibiotic use.14 The Infectious Diseases Society of America (IDSA) antibiotic stewardship program guidelines strongly recommend the timely conversion from IV to oral antibiotics, stating that efforts focusing on this transition should be integrated into routine practice.15 There are a few metrics in the literature to measure this intervention, but none is universally used, and a modified delphi process could not reach consensus on IV-to-oral transition metrics.16
Few studies describe the opportunity to transition to enteral antibiotics in hospitalized patients with common bacterial infections or explore variation across hospitals. It is critical to understand current practice of antibiotic administration in order to identify opportunities to optimize patient outcomes and promote high-value care. Furthermore, few studies have evaluated the feasibility of IV-to-oral transition metrics using an administrative database. Thus, the aims of this study were to (1) determine opportunities to transition from IV to enteral antibiotics for pediatric patients hospitalized with common bacterial infections based on their ability to tolerate other enteral medications, (2) describe variation in transition practices among children’s hospitals, and (3) evaluate the feasibility of novel IV-to-oral transition metrics using an administrative database to inform stewardship efforts.
METHODS
Study Design and Setting
This multicenter, retrospective cohort study used data from the Pediatric Health Information System (PHIS), an administrative and billing database containing encounter-level data from 52 tertiary care pediatric hospitals across the United States affiliated with the Children’s Hospital Association (Lenexa, Kansas). Hospitals submit encounter-level data, including demographics, medications, and diagnoses based on International Classification of Disease, Tenth Revision, Clinical Modification (ICD-10-CM) codes. Data were de-identified at the time of submission, and data quality and reliability were assured by joint efforts between the Children’s Hospital Association and participating hospitals.
Study Population
This study included pediatric patients aged 60 days to 18 years who were hospitalized (inpatient or observation status) at one of the participating hospitals between January 1, 2017, and December 31, 2018, for one of the following seven common bacterial infections: community-acquired pneumonia (CAP), neck infection (superficial and deep), periorbital/orbital infection, urinary tract infection (UTI), osteomyelitis, septic arthritis, or skin and soft tissue infection (SSTI). The diagnosis cohorts were defined based on ICD-10-CM discharge diagnoses adapted from previous studies (Appendix Table 1).3,17-23 To define a cohort of generally healthy pediatric patients with an acute infection, we excluded patients hospitalized in the intensive care unit, patients with nonhome discharges, and patients with complex chronic conditions.24 We also excluded hospitals with incomplete data during the study period (n=1). The Institutional Review Board at Cincinnati Children’s Hospital Medical Center determined this study to be non–human-subjects research.
Outcomes
The primary outcomes were the number of opportunity days and the percent of days with opportunity to transition from IV to enteral therapy. Opportunity days, or days in which there was a potential opportunity to transition from IV to enteral antibiotics, were defined as days patients received only IV antibiotic doses and at least one enteral nonantibiotic medication, suggesting an ability to take enteral medications.13 We excluded days patients received IV antibiotics for which there was no enteral alternative (eg, vancomycin, Appendix Table 2). When measuring opportunity, to be conservative (ie, to underestimate rather than overestimate opportunity), we did not count as an opportunity day any day in which patients received both IV and enteral antibiotics. Percent opportunity, or the percent of days patients received antibiotics in which there was potential opportunity to transition from IV to enteral antibiotics, was defined as the number of opportunity days divided by number of inpatient days patients received enteral antibiotics or IV antibiotics with at least one enteral nonantibiotic medication (antibiotic days). Similar to opportunity days, antibiotic days excluded days patients were on IV antibiotics for which there was no enteral alternative. Based on our definition, a lower percent opportunity indicates that a hospital is using enteral antibiotics earlier during the hospitalization (earlier transition), while a higher percent opportunity represents later enteral antibiotic use (later transition).
Statistical Analysis
Demographic and clinical characteristics were summarized by diagnosis with descriptive statistics, including frequency with percentage, mean with standard deviation, and median with interquartile range (IQR). For each diagnosis, we evaluated aggregate opportunity days (sum of opportunity days among all hospitals), opportunity days per encounter, and aggregate percent opportunity using frequencies, mean with standard deviation, and percentages, respectively. We also calculated aggregate opportunity days for diagnosis-antibiotic combinations. To visually show variation in the percent opportunity across hospitals, we displayed the percent opportunity on a heat map, and evaluated percent opportunity across hospitals using chi-square tests. To compare the variability in the percent opportunity across and within hospitals, we used a generalized linear model with two fixed effects (hospital and diagnosis), and parsed the variability using the sum of squares. We performed a sensitivity analysis and excluded days that patients received antiemetic medications (eg, ondansetron, granisetron, prochlorperazine, promethazine), as these suggest potential intolerance of enteral medications. All statistical analyses were performed using SAS v.9.4 (SAS Institute Inc, Cary, North Carolina) and GraphPad Prism 8.0 (GraphPad Software Inc., San Diego, California), and P values < .05 were considered statistically significant.
RESULTS
During the 2-year study period, 100,103 hospitalizations met our inclusion criteria across 51 hospitals and seven diagnosis categories (Table 1). Diagnosis cohorts ranged in size from 1,462 encounters for septic arthritis to 35,665 encounters for neck infections. Overall, we identified 88,522 aggregate opportunity days on which there was an opportunity to switch from IV to enteral treatment in the majority of participants (percent opportunity, 57%).

Opportunity by Diagnosis
The number of opportunity days (aggregate and mean per encounter) and percent opportunity varied by diagnosis (Table 2). The aggregate number of opportunity days ranged from 3,693 in patients with septic arthritis to 25,359 in patients with SSTI, and mean opportunity days per encounter ranged from 0.9 in CAP to 2.8 in septic arthritis. Percent opportunity was highest for septic arthritis at 72.7% and lowest for CAP at 39.7%.

Variation in Opportunity Among Hospitals
The variation in the percent opportunity across hospitals was statistically significant for all diagnoses (Figure). Within hospitals, we observed similar practice patterns across diagnoses. For example, hospitals with a higher percent opportunity for one diagnosis tended to have higher percent opportunity for the other diagnoses (as noted in the top portion of the Figure), and those with lower percent opportunity for one diagnosis tended to also have lower percent opportunity for the other diagnoses studied (as noted in the bottom portion of the Figure). When evaluating variability in the percent opportunity, 45% of the variability was attributable to the hospital-effect and 35% to the diagnosis; the remainder was unexplained variability. Sensitivity analysis excluding days when patients received an antiemetic medication yielded no differences in our results.

Opportunity by Antibiotic
The aggregate number of opportunity days varied by antibiotic (Table 3). Intravenous antibiotics with the largest number of opportunity days included clindamycin (44,293), ceftriaxone (23,896), and ampicillin-sulbactam (15,484). Antibiotic-diagnosis combinations with the largest number of opportunity days for each diagnosis included ceftriaxone and ampicillin in CAP; clindamycin in cellulitis, SSTI, and neck infections; ceftriaxone in UTI; and cefazolin in osteomyelitis and septic arthritis.

DISCUSSION
In this multicenter study of pediatric patients hospitalized with common bacterial infections, there was the potential to transition from IV to enteral treatment in over half of the antibiotic days. The degree of opportunity varied by infection, antibiotic, and hospital. Antibiotics with a large aggregate number of opportunity days for enteral transition included clindamycin, which has excellent bioavailability; and ampicillin and ampicillin-sulbactam, which can achieve pharmacodynamic targets with oral equivalents.25-29 The across-hospital variation for a given diagnosis suggests that certain hospitals have strategies in place which permit an earlier transition to enteral antibiotics compared to other institutions in which there were likely missed opportunities to do so. This variability is likely due to limited evidence, emphasizing the need for robust studies to better understand the optimal initial antibiotic route and transition time. Our findings highlight the need for, and large potential impact of, stewardship efforts to promote earlier transition for specific drug targets. This study also demonstrates the feasibility of obtaining two metrics—percent opportunity and opportunity days—from administrative databases to inform stewardship efforts within and across hospitals.
Opportunity days and percent opportunity varied among diagnoses. The variation in aggregate opportunity days was largely a reflection of the number of encounters: Diagnoses such as SSTI, neck infections, and CAP had a large number of both aggregate opportunity days and encounters. The range of opportunity days per encounter (0.9-2.5) suggests potential missed opportunities to transition to enteral antibiotics across all diagnoses (Table 2). The higher opportunity days per encounter in osteomyelitis and septic arthritis may be related to longer LOS and higher percent opportunity. Percent opportunity likely varied among diagnoses due to differences in admission and discharge readiness criteria, diagnostic evaluation, frequency of antibiotic administration, and evidence on the optimal route of initial antibiotics and when to transition to oral formulations. For example, we hypothesize that certain diagnoses, such as osteomyelitis and septic arthritis, have admission and discharge readiness criteria directly tied to the perceived need for IV antibiotics, which may limit in-hospital days on enteral antibiotics and explain the high percent opportunity that we observed. The high percent opportunity seen in musculoskeletal infections also may be due to delays in initiating targeted treatment until culture results were available. Encounters for CAP had the lowest percent opportunity; we hypothesize that this is because admission and discharge readiness may be determined by factors other than the need for IV antibiotics (eg, need for supplemental oxygen), which may increase days on enteral antibiotics and lead to a lower percent opportunity.30
Urinary tract infection encounters had a high percent opportunity. As with musculoskeletal infection, this may be related to delays in initiating targeted treatment until culture results became available. Another reason for the high percent opportunity in UTI could be the common use of ceftriaxone, which, dosed every 24 hours, likely reduced the opportunity to transition to enteral antibiotics. There is strong evidence demonstrating no difference in outcomes based on antibiotic routes for UTI, and we would expect this to result in a low percent opportunity.2,31 While the observed high opportunity in UTI may relate to an initial unknown diagnosis or concern for systemic infection, this highlights potential opportunities for quality improvement initiatives to promote empiric oral antibiotics in clinically stable patients hospitalized with suspected UTI.
There was substantial variation in percent opportunity across hospitals for a given diagnosis, with less variation across diagnoses for a given hospital. Variation across hospitals but consistency within individual hospitals suggests that some hospitals may promote earlier transition from IV to enteral antibiotics as standard practice for all diagnoses, while other hospitals continue IV antibiotics for the entire hospitalization, highlighting potential missed opportunities at some institutions. While emerging data suggest that traditional long durations of IV antibiotics are not necessary for many infections, the limited evidence on the optimal time to switch to oral antibiotics may have influenced this variation.2-7 Many guidelines recommend initial IV antibiotics for hospitalized pediatric patients, but there are few studies comparing IV and enteral therapy.2,5,9 Limited evidence leaves significant room for hospital culture, antibiotic stewardship efforts, reimbursement considerations, and/or hospital workflow to influence transition timing and overall opportunity at individual hospitals.7,8,32-34 These findings emphasize the importance of research to identify optimal transition time and comparative effectiveness studies to evaluate whether initial IV antibiotics are truly needed for mild—and even severe—disease presentations. Since many patients are admitted for the perceived need for IV antibiotics, earlier use of enteral antibiotics could reduce rates of hospitalizations, LOS, healthcare costs, and resource utilization.
Antibiotics with a high number of opportunity days included clindamycin, ceftriaxone, ampicillin-sublactam, and ampicillin. Our findings are consistent with another study which found that most bioavailable drugs, including clindamycin, were administered via the IV route and accounted for a large number of antibiotic days.35 The Infectious Diseases Society of America recommends that hospitals promote earlier transition to oral formulations for highly bioavailable drugs.7 Given the high bioavailability of clindamycin, its common use in high-frequency encounters such as SSTI and neck infections, and the fact that it accounted for a large number of opportunity days, quality improvement initiatives promoting earlier transition to oral clindamycin could have a large impact across health systems.25,26 Additionally, although beta-lactam antibiotics such as amoxicillin and amoxicillin-sulbactam are not highly bioavailable, oral dosing can achieve sufficient serum concentrations to reach pharmacodynamic targets for common clinical indications; this could be an important quality improvement initiative.27-29 Several single-site studies have successfully implemented quality improvement initiatives to promote earlier IV-to-enteral transition, with resulting reductions in costs and no adverse events noted, highlighting the feasibility and impact of such efforts.13,36-38
This study also demonstrates the feasibility of collecting two metrics (percent opportunity and opportunity days) from administrative databases to inform IV-to-oral transition benchmarking and stewardship efforts. While there are several metrics in the literature for evaluating antibiotic transition (eg, days of IV or oral therapy, percentage of antibiotics given via the oral route, time to switch from IV to oral, and acceptance rate of suggested changes to antibiotic route), none are universally used or agreed upon.15,16,39 The opportunity metrics used in this study have several strengths, including the feasibility of obtaining them from existing databases and the ability to account for intake of other enteral medications; the latter is not evaluated in other metrics. These opportunity metrics can be used together to identify the percent of time in which there is opportunity to transition and total number of days to understand the full extent of potential opportunity for future interventions. As demonstrated in this study, these metrics can be measured by diagnosis, antibiotic, or diagnosis-antibiotic combination, and they can be used to evaluate stewardship efforts at a single institution over time or compare efforts across hospitals.
These findings should be interpreted in the context of important limitations. First, we attempted to characterize potential opportunity to transition to enteral medications based on a patient’s ability to tolerate nonenteral medications. However, there are other factors that could limit the opportunity to transition that we could not account for with an administrative dataset, including the use of antibiotics prior to admission, disease progression, severity of illness, and malabsorptive concerns. Thus, though we may have overestimated the true opportunity to transition to enteral antibiotics, it is unlikely that this would account for all of the variation in transition times that we observed across hospitals. Second, while our study required patients to have one of seven types of infection, we did not exclude any additional infectious diagnoses (eg, concurrent bacteremia, Clostridioides difficile, otitis media) that could have driven the choice of antibiotic type and modality. Although emerging evidence is supporting earlier transitions to oral therapy, bacteremia is typically treated with IV antibiotics; this may have led to an overestimation of true opportunity.40 “Clostridioides” difficile and otitis media are typically treated with enteral therapy; concurrent infections such as these may have led to an underestimation of opportunity given the fact that, based on our definition, the days on which patients received both IV and enteral antibiotics were not counted as opportunity days. Third, because PHIS uses billing days to capture medication use, we were unable to distinguish transitions that occurred early in the day vs those that took place later in the day. This could have led to an underestimation of percent opportunity, particularly for diagnoses with a short LOS; it also likely led to an underestimation of the variability observed across hospitals. Fourth, because we used an administrative dataset, we are unable to understand reasoning behind transitioning time from IV to oral antibiotics, as well as provider, patient, and institutional level factors that influenced these decisions.
CONCLUSION
Children hospitalized with bacterial infections often receive IV antibiotics, and the timing of transition from IV to enteral antibiotics varies significantly across hospitals. Further research is needed to compare the effectiveness of IV and enteral antibiotics and better define criteria for transition to enteral therapy. We identified ample opportunities for quality improvement initiatives to promote earlier transition, which have the potential to reduce healthcare utilization and promote optimal patient-directed high-value care.
1. Keren R, Luan X, Localio R, et al. Prioritization of comparative effectiveness research topics in hospital pediatrics. Arch Pediatr Adolesc Med. 2012;166(12):1155-1164. https://doi.org/10.1001/archpediatrics.2012.1266
2. McMullan BJ, Andresen D, Blyth CC, et al. Antibiotic duration and timing of the switch from intravenous to oral route for bacterial infections in children: systematic review and guidelines. Lancet Infect Dis. 2016;16(8):e139-e152. https://doi.org/10.1016/S1473-3099(16)30024-X
3. Keren R, Shah SS, Srivastava R, et al; for the Pediatric Research Inpatient Settings Network. Comparative effectiveness of intravenous vs oral antibiotics for postdischarge treatment of acute osteomyelitis in children. JAMA Pediatr. 2015;169(2):120-128. https://doi.org/10.1001/jamapediatrics.2014.2822
4. Shah SS, Srivastava R, Wu S, et al. Intravenous versus oral antibiotics for postdischarge treatment of complicated pneumonia. Pediatrics. 2016;138(6):e201692. https://doi.org/10.1542/peds.2016-1692
5. Li HK, Agweyu A, English M, Bejon P. An unsupported preference for intravenous antibiotics. PLoS Med. 2015;12(5):e1001825. https://dx.doi.org/10.1371%2Fjournal.pmed.1001825
6. Dellit TH, Owens RC, McGowan JE Jr, et al; Infectious Diseases Society of America; Society for Healthcare Epidemiology of America. Infectious Diseases Society of America and the Society for Healthcare Epidemiology of America guidelines for developing an institutional program to enhance antimicrobial stewardship. Clin Infect Dis. 2007;44(2):159-177. https://doi.org/10.1086/510393
7. Bradley JS, Byington CL, Shah SS, et al; Pediatric Infectious Diseases Society and the Infectious Diseases Society of America. Management of community-acquired pneumonia (CAP) in infants and children older than 3 months of age: clinical practice guidelines by the Pediatric Infectious Diseases Society and the Infectious Diseases Society of America. Clin Infect Dis. 2011;53(7):e25-e76. https://doi.org/10.1542/peds.2011-2385
8. Septimus EJ, Owens RC Jr. Need and potential of antimicrobial stewardship in community hospitals. Clin Infect Dis. 2011;53 Suppl 1:S8-S14. https://doi.org/10.1093/cid/cir363
9. Schroeder AR, Ralston SL. Intravenous antibiotic durations for common bacterial infections in children: when is enough? J Hosp Med. 2014;9(9):604-609. https://doi.org/10.1002/jhm.2239
10. Christensen EW, Spaulding AB, Pomputius WF, Grapentine SP. Effects of hospital practice patterns for antibiotic administration for pneumonia on hospital lengths of stay and costs. J Pediatric Infect Dis Soc. 2019;8(2):115-121. https://doi.org/10.1093/jpids/piy003
11. van Zanten AR, Engelfriet PM, van Dillen K, van Veen M, Nuijten MJ, Polderman KH. Importance of nondrug costs of intravenous antibiotic therapy. Crit Care. 2003;7(6):R184-R190. https://doi.org/10.1186/cc2388
12. Ruebner R, Keren R, Coffin S, Chu J, Horn D, Zaoutis TE. Complications of central venous catheters used for the treatment of acute hematogenous osteomyelitis. Pediatrics. 2006;117(4):1210-1215. https://doi.org/10.1542/peds.2005-1465
13. Girdwood SCT, Sellas MN, Courter JD, et al. Improving the transition of intravenous to enteral antibiotics in pediatric patients with pneumonia or skin and soft tissue infections. J Hosp Med. 2020;15(1):10-15. https://doi.org/10.12788/jhm.3253
14. Core Elements of Hospital Antibiotic Stewardship Programs. Centers for Disease Control and Prevention. Published 2019. Accessed May 30, 2020. https://www.cdc.gov/antibiotic-use/core-elements/hospital.html
15. Barlam TF, Cosgrove SE, Abbo LM, et al. Implementing an antibiotic stewardship program: guidelines by the Infectious Diseases Society of America and the Society for Healthcare Epidemiology of America. Clin Infect Dis. 2016;62(10):e51-e77. https://doi.org/10.1093/cid/ciw118
16. Science M, Timberlake K, Morris A, Read S, Le Saux N; Groupe Antibiothérapie en Pédiatrie Canada Alliance for Stewardship of Antimicrobials in Pediatrics (GAP Can ASAP). Quality metrics for antimicrobial stewardship programs. Pediatrics. 2019;143(4):e20182372. https://doi.org/10.1542/peds.2018-2372
17. Tchou MJ, Hall M, Shah SS, et al; Pediatric Research in Inpatient Settings (PRIS) Network. Patterns of electrolyte testing at children’s hospitals for common inpatient diagnoses. Pediatrics. 2019;144(1):e20181644. https://doi.org/10.1542/peds.2018-1644
18. Florin TA, French B, Zorc JJ, Alpern ER, Shah SS. Variation in emergency department diagnostic testing and disposition outcomes in pneumonia. Pediatrics. 2013;132(2):237-244. https://doi.org/10.1542/peds.2013-0179
19. Desai S, Shah SS, Hall M, Richardson TE, Thomson JE; Pediatric Research in Inpatient Settings (PRIS) Network. Imaging strategies and outcomes in children hospitalized with cervical lymphadenitis. J Hosp Med. 2020;15(4):197-203. https://doi.org/10.12788/jhm.3333
20. Markham JL, Hall M, Bettenhausen JL, Myers AL, Puls HT, McCulloh RJ. Variation in care and clinical outcomes in children hospitalized with orbital cellulitis. Hosp Pediatr. 2018;8(1):28-35. https://doi.org/10.1542/hpeds.2017-0040
21. Tieder JS, Hall M, Auger KA, et al. Accuracy of administrative billing codes to detect urinary tract infection hospitalizations. Pediatrics. 2011;128(2):323-330. https://doi.org/10.1542/peds.2010-2064
22. Singh JA, Yu S. The burden of septic arthritis on the U.S. inpatient care: a national study. PLoS One. 2017;12(8):e0182577. https://doi.org/10.1371/journal.pone.0182577
23. Foradori DM, Lopez MA, Hall M, et al. Invasive bacterial infections in infants younger than 60 days with skin and soft tissue infections. Pediatr Emerg Care. 2018. https://doi.org/10.1097/pec.0000000000001584
24. Feudtner C, Feinstein JA, Zhong W, Hall M, Dai D. Pediatric complex chronic conditions classification system version 2: updated for ICD-10 and complex medical technology dependence and transplantation. BMC Pediatr. 2014;14:199. https://doi.org/10.1186/1471-2431-14-199
25. Arancibia A, Icarte A, González C, Morasso I. Dose-dependent bioavailability of amoxycillin. Int J Clin Pharmacol Ther Toxicol. 1988;26(6):300-303.
26. Grayson ML, Cosgrove S, Crowe S, et al. Kucers’ the Use of Antibiotics: A Clinical Review of Antibacterial, Antifungal, Antiparasitic, and Antiviral Drugs. 7th ed. CRC Press; 2018.
27. Downes KJ, Hahn A, Wiles J, Courter JD, Inks AA. Dose optimisation of antibiotics in children: application of pharmacokinetics/pharmacodynamics in pediatrics’. Int J Antimicrob Agents. 2014;43(3):223-230. https://doi.org/10.1016/j.ijantimicag.2013.11.006
28. Gras-Le Guen C, Boscher C, Godon N, et al. Therapeutic amoxicillin levels achieved with oral administration in term neonates. Eur J Clin Pharmacol. 2007;63(7):657-662. https://doi.org/10.1007/s00228-007-0307-3
29. Sanchez Navarro A. New formulations of amoxicillin/clavulanic acid: a pharmacokinetic and pharmacodynamic review. Clin Pharmacokinet. 2005;44(11):1097-1115. https://doi.org/10.2165/00003088-200544110-00001
30. Fine MJ, Hough LJ, Medsger AR, et al. The hospital admission decision for patients with community-acquired pneumonia. Results from the pneumonia Patient Outcomes Research Team cohort study. Arch Intern Med. 1997;157(1):36-44. https://doi.org/10.1001/archinte.1997.00440220040006
31. Pohl A. Modes of administration of antibiotics for symptomatic severe urinary tract infections. Cochrane Database Syst Rev. 2007(4):CD003237. https://doi.org/10.1002/14651858.cd003237.pub2
32. Nageswaran S, Woods CR, Benjamin DK Jr, Givner LB, Shetty AK. Orbital cellulitis in children. Pediatr Infect Dis J. 2006;25(8):695-699. https://doi.org/10.1097/01.inf.0000227820.36036.f1
33. Al-Nammari S, Roberton B, Ferguson C. Towards evidence based emergency medicine: best BETs from the Manchester Royal Infirmary. Should a child with preseptal periorbital cellulitis be treated with intravenous or oral antibiotics? Emerg Med J. 2007;24(2):128-129. https://doi.org/10.1136/emj.2006.045245
34. Vieira F, Allen SM, Stocks RMS, Thompson JW. Deep neck infection. Otolaryngol Clin North Am. 2008;41(3):459-483, vii. https://doi.org/10.1016/j.otc.2008.01.002
35. Smith M, Shah S, Kronman M, Patel S, Thurm C, Hersh AL. Route of administration for highly orally bioavailable antibiotics. Open Forum Infect Dis. 2017;4(Suppl 1):S498-S499. https://doi.org/10.1093/ofid/ofx163.1291
36. Brady PW, Brinkman WB, Simmons JM, et al. Oral antibiotics at discharge for children with acute osteomyelitis: a rapid cycle improvement project. BMJ Qual Saf. 2014;23(6):499-507. https://doi.org/10.1136/bmjqs-2013-002179
37. Berrevoets MAH, Pot JHLW, Houterman AE, et al. An electronic trigger tool to optimise intravenous to oral antibiotic switch: a controlled, interrupted time series study. Antimicrob Resist Infect Control. 2017;6:81. https://doi.org/10.1186/s13756-017-0239-3
38. Fischer MA, Solomon DH, Teich JM, Avorn J. Conversion from intravenous to oral medications: assessment of a computerized intervention for hospitalized patients. Arch Intern Med. 2003;163(21):2585-2589. https://doi.org/10.1001/archinte.163.21.2585
39. Public Health Ontario. Antimicrobial stewardship programs metric examples. Published 2017. Accessed June 1, 2020. https://www.publichealthontario.ca/-/media/documents/A/2017/asp-metrics-examples.pdf?la=en
40. Desai S, Aronson PL, Shabanova V, et al; Febrile Young Infant Research Collaborative. Parenteral antibiotic therapy duration in young infants with bacteremic urinary tract infections. Pediatrics. 2019;144(3):e20183844. https://doi.org/10.1542/peds.2018-3844
Bacterial infections are a common reason for pediatric hospital admissions in the United States.1 Antibiotics are the mainstay of treatment, and whether to administer them intravenously (IV) or enterally is an important and, at times, challenging decision. Not all hospitalized patients with infections require IV antibiotics, and safe, effective early transitions to enteral therapy have been described for numerous infections.2-7 However, guidelines describing the ideal initial route of antibiotic administration and when to transition to oral therapy are lacking.5,7,8 This lack of high-quality evidence-based guidance may contribute to overuse of IV antibiotics for many hospitalized pediatric patients, even when safe and effective enteral options exist.9
Significant costs and harms are associated with the use of IV antibiotics. In particular, studies have demonstrated longer length of stay (LOS), increased costs, and worsened pain or anxiety related to complications (eg, phlebitis, extravasation injury, thrombosis, catheter-associated bloodstream infections) associated with IV antibiotics.3,4,10-13 Earlier transition to enteral therapy, however, can mitigate these increased risks and costs.
The Centers for Disease Control and Prevention lists the transition from IV to oral antibiotics as a key stewardship intervention for improving antibiotic use.14 The Infectious Diseases Society of America (IDSA) antibiotic stewardship program guidelines strongly recommend the timely conversion from IV to oral antibiotics, stating that efforts focusing on this transition should be integrated into routine practice.15 There are a few metrics in the literature to measure this intervention, but none is universally used, and a modified delphi process could not reach consensus on IV-to-oral transition metrics.16
Few studies describe the opportunity to transition to enteral antibiotics in hospitalized patients with common bacterial infections or explore variation across hospitals. It is critical to understand current practice of antibiotic administration in order to identify opportunities to optimize patient outcomes and promote high-value care. Furthermore, few studies have evaluated the feasibility of IV-to-oral transition metrics using an administrative database. Thus, the aims of this study were to (1) determine opportunities to transition from IV to enteral antibiotics for pediatric patients hospitalized with common bacterial infections based on their ability to tolerate other enteral medications, (2) describe variation in transition practices among children’s hospitals, and (3) evaluate the feasibility of novel IV-to-oral transition metrics using an administrative database to inform stewardship efforts.
METHODS
Study Design and Setting
This multicenter, retrospective cohort study used data from the Pediatric Health Information System (PHIS), an administrative and billing database containing encounter-level data from 52 tertiary care pediatric hospitals across the United States affiliated with the Children’s Hospital Association (Lenexa, Kansas). Hospitals submit encounter-level data, including demographics, medications, and diagnoses based on International Classification of Disease, Tenth Revision, Clinical Modification (ICD-10-CM) codes. Data were de-identified at the time of submission, and data quality and reliability were assured by joint efforts between the Children’s Hospital Association and participating hospitals.
Study Population
This study included pediatric patients aged 60 days to 18 years who were hospitalized (inpatient or observation status) at one of the participating hospitals between January 1, 2017, and December 31, 2018, for one of the following seven common bacterial infections: community-acquired pneumonia (CAP), neck infection (superficial and deep), periorbital/orbital infection, urinary tract infection (UTI), osteomyelitis, septic arthritis, or skin and soft tissue infection (SSTI). The diagnosis cohorts were defined based on ICD-10-CM discharge diagnoses adapted from previous studies (Appendix Table 1).3,17-23 To define a cohort of generally healthy pediatric patients with an acute infection, we excluded patients hospitalized in the intensive care unit, patients with nonhome discharges, and patients with complex chronic conditions.24 We also excluded hospitals with incomplete data during the study period (n=1). The Institutional Review Board at Cincinnati Children’s Hospital Medical Center determined this study to be non–human-subjects research.
Outcomes
The primary outcomes were the number of opportunity days and the percent of days with opportunity to transition from IV to enteral therapy. Opportunity days, or days in which there was a potential opportunity to transition from IV to enteral antibiotics, were defined as days patients received only IV antibiotic doses and at least one enteral nonantibiotic medication, suggesting an ability to take enteral medications.13 We excluded days patients received IV antibiotics for which there was no enteral alternative (eg, vancomycin, Appendix Table 2). When measuring opportunity, to be conservative (ie, to underestimate rather than overestimate opportunity), we did not count as an opportunity day any day in which patients received both IV and enteral antibiotics. Percent opportunity, or the percent of days patients received antibiotics in which there was potential opportunity to transition from IV to enteral antibiotics, was defined as the number of opportunity days divided by number of inpatient days patients received enteral antibiotics or IV antibiotics with at least one enteral nonantibiotic medication (antibiotic days). Similar to opportunity days, antibiotic days excluded days patients were on IV antibiotics for which there was no enteral alternative. Based on our definition, a lower percent opportunity indicates that a hospital is using enteral antibiotics earlier during the hospitalization (earlier transition), while a higher percent opportunity represents later enteral antibiotic use (later transition).
Statistical Analysis
Demographic and clinical characteristics were summarized by diagnosis with descriptive statistics, including frequency with percentage, mean with standard deviation, and median with interquartile range (IQR). For each diagnosis, we evaluated aggregate opportunity days (sum of opportunity days among all hospitals), opportunity days per encounter, and aggregate percent opportunity using frequencies, mean with standard deviation, and percentages, respectively. We also calculated aggregate opportunity days for diagnosis-antibiotic combinations. To visually show variation in the percent opportunity across hospitals, we displayed the percent opportunity on a heat map, and evaluated percent opportunity across hospitals using chi-square tests. To compare the variability in the percent opportunity across and within hospitals, we used a generalized linear model with two fixed effects (hospital and diagnosis), and parsed the variability using the sum of squares. We performed a sensitivity analysis and excluded days that patients received antiemetic medications (eg, ondansetron, granisetron, prochlorperazine, promethazine), as these suggest potential intolerance of enteral medications. All statistical analyses were performed using SAS v.9.4 (SAS Institute Inc, Cary, North Carolina) and GraphPad Prism 8.0 (GraphPad Software Inc., San Diego, California), and P values < .05 were considered statistically significant.
RESULTS
During the 2-year study period, 100,103 hospitalizations met our inclusion criteria across 51 hospitals and seven diagnosis categories (Table 1). Diagnosis cohorts ranged in size from 1,462 encounters for septic arthritis to 35,665 encounters for neck infections. Overall, we identified 88,522 aggregate opportunity days on which there was an opportunity to switch from IV to enteral treatment in the majority of participants (percent opportunity, 57%).
Opportunity by Diagnosis
The number of opportunity days (aggregate and mean per encounter) and percent opportunity varied by diagnosis (Table 2). The aggregate number of opportunity days ranged from 3,693 in patients with septic arthritis to 25,359 in patients with SSTI, and mean opportunity days per encounter ranged from 0.9 in CAP to 2.8 in septic arthritis. Percent opportunity was highest for septic arthritis at 72.7% and lowest for CAP at 39.7%.
Variation in Opportunity Among Hospitals
The variation in the percent opportunity across hospitals was statistically significant for all diagnoses (Figure). Within hospitals, we observed similar practice patterns across diagnoses. For example, hospitals with a higher percent opportunity for one diagnosis tended to have higher percent opportunity for the other diagnoses (as noted in the top portion of the Figure), and those with lower percent opportunity for one diagnosis tended to also have lower percent opportunity for the other diagnoses studied (as noted in the bottom portion of the Figure). When evaluating variability in the percent opportunity, 45% of the variability was attributable to the hospital-effect and 35% to the diagnosis; the remainder was unexplained variability. Sensitivity analysis excluding days when patients received an antiemetic medication yielded no differences in our results.
Opportunity by Antibiotic
The aggregate number of opportunity days varied by antibiotic (Table 3). Intravenous antibiotics with the largest number of opportunity days included clindamycin (44,293), ceftriaxone (23,896), and ampicillin-sulbactam (15,484). Antibiotic-diagnosis combinations with the largest number of opportunity days for each diagnosis included ceftriaxone and ampicillin in CAP; clindamycin in cellulitis, SSTI, and neck infections; ceftriaxone in UTI; and cefazolin in osteomyelitis and septic arthritis.
DISCUSSION
In this multicenter study of pediatric patients hospitalized with common bacterial infections, there was the potential to transition from IV to enteral treatment in over half of the antibiotic days. The degree of opportunity varied by infection, antibiotic, and hospital. Antibiotics with a large aggregate number of opportunity days for enteral transition included clindamycin, which has excellent bioavailability; and ampicillin and ampicillin-sulbactam, which can achieve pharmacodynamic targets with oral equivalents.25-29 The across-hospital variation for a given diagnosis suggests that certain hospitals have strategies in place which permit an earlier transition to enteral antibiotics compared to other institutions in which there were likely missed opportunities to do so. This variability is likely due to limited evidence, emphasizing the need for robust studies to better understand the optimal initial antibiotic route and transition time. Our findings highlight the need for, and large potential impact of, stewardship efforts to promote earlier transition for specific drug targets. This study also demonstrates the feasibility of obtaining two metrics—percent opportunity and opportunity days—from administrative databases to inform stewardship efforts within and across hospitals.
Opportunity days and percent opportunity varied among diagnoses. The variation in aggregate opportunity days was largely a reflection of the number of encounters: Diagnoses such as SSTI, neck infections, and CAP had a large number of both aggregate opportunity days and encounters. The range of opportunity days per encounter (0.9-2.5) suggests potential missed opportunities to transition to enteral antibiotics across all diagnoses (Table 2). The higher opportunity days per encounter in osteomyelitis and septic arthritis may be related to longer LOS and higher percent opportunity. Percent opportunity likely varied among diagnoses due to differences in admission and discharge readiness criteria, diagnostic evaluation, frequency of antibiotic administration, and evidence on the optimal route of initial antibiotics and when to transition to oral formulations. For example, we hypothesize that certain diagnoses, such as osteomyelitis and septic arthritis, have admission and discharge readiness criteria directly tied to the perceived need for IV antibiotics, which may limit in-hospital days on enteral antibiotics and explain the high percent opportunity that we observed. The high percent opportunity seen in musculoskeletal infections also may be due to delays in initiating targeted treatment until culture results were available. Encounters for CAP had the lowest percent opportunity; we hypothesize that this is because admission and discharge readiness may be determined by factors other than the need for IV antibiotics (eg, need for supplemental oxygen), which may increase days on enteral antibiotics and lead to a lower percent opportunity.30
Urinary tract infection encounters had a high percent opportunity. As with musculoskeletal infection, this may be related to delays in initiating targeted treatment until culture results became available. Another reason for the high percent opportunity in UTI could be the common use of ceftriaxone, which, dosed every 24 hours, likely reduced the opportunity to transition to enteral antibiotics. There is strong evidence demonstrating no difference in outcomes based on antibiotic routes for UTI, and we would expect this to result in a low percent opportunity.2,31 While the observed high opportunity in UTI may relate to an initial unknown diagnosis or concern for systemic infection, this highlights potential opportunities for quality improvement initiatives to promote empiric oral antibiotics in clinically stable patients hospitalized with suspected UTI.
There was substantial variation in percent opportunity across hospitals for a given diagnosis, with less variation across diagnoses for a given hospital. Variation across hospitals but consistency within individual hospitals suggests that some hospitals may promote earlier transition from IV to enteral antibiotics as standard practice for all diagnoses, while other hospitals continue IV antibiotics for the entire hospitalization, highlighting potential missed opportunities at some institutions. While emerging data suggest that traditional long durations of IV antibiotics are not necessary for many infections, the limited evidence on the optimal time to switch to oral antibiotics may have influenced this variation.2-7 Many guidelines recommend initial IV antibiotics for hospitalized pediatric patients, but there are few studies comparing IV and enteral therapy.2,5,9 Limited evidence leaves significant room for hospital culture, antibiotic stewardship efforts, reimbursement considerations, and/or hospital workflow to influence transition timing and overall opportunity at individual hospitals.7,8,32-34 These findings emphasize the importance of research to identify optimal transition time and comparative effectiveness studies to evaluate whether initial IV antibiotics are truly needed for mild—and even severe—disease presentations. Since many patients are admitted for the perceived need for IV antibiotics, earlier use of enteral antibiotics could reduce rates of hospitalizations, LOS, healthcare costs, and resource utilization.
Antibiotics with a high number of opportunity days included clindamycin, ceftriaxone, ampicillin-sublactam, and ampicillin. Our findings are consistent with another study which found that most bioavailable drugs, including clindamycin, were administered via the IV route and accounted for a large number of antibiotic days.35 The Infectious Diseases Society of America recommends that hospitals promote earlier transition to oral formulations for highly bioavailable drugs.7 Given the high bioavailability of clindamycin, its common use in high-frequency encounters such as SSTI and neck infections, and the fact that it accounted for a large number of opportunity days, quality improvement initiatives promoting earlier transition to oral clindamycin could have a large impact across health systems.25,26 Additionally, although beta-lactam antibiotics such as amoxicillin and amoxicillin-sulbactam are not highly bioavailable, oral dosing can achieve sufficient serum concentrations to reach pharmacodynamic targets for common clinical indications; this could be an important quality improvement initiative.27-29 Several single-site studies have successfully implemented quality improvement initiatives to promote earlier IV-to-enteral transition, with resulting reductions in costs and no adverse events noted, highlighting the feasibility and impact of such efforts.13,36-38
This study also demonstrates the feasibility of collecting two metrics (percent opportunity and opportunity days) from administrative databases to inform IV-to-oral transition benchmarking and stewardship efforts. While there are several metrics in the literature for evaluating antibiotic transition (eg, days of IV or oral therapy, percentage of antibiotics given via the oral route, time to switch from IV to oral, and acceptance rate of suggested changes to antibiotic route), none are universally used or agreed upon.15,16,39 The opportunity metrics used in this study have several strengths, including the feasibility of obtaining them from existing databases and the ability to account for intake of other enteral medications; the latter is not evaluated in other metrics. These opportunity metrics can be used together to identify the percent of time in which there is opportunity to transition and total number of days to understand the full extent of potential opportunity for future interventions. As demonstrated in this study, these metrics can be measured by diagnosis, antibiotic, or diagnosis-antibiotic combination, and they can be used to evaluate stewardship efforts at a single institution over time or compare efforts across hospitals.
These findings should be interpreted in the context of important limitations. First, we attempted to characterize potential opportunity to transition to enteral medications based on a patient’s ability to tolerate nonenteral medications. However, there are other factors that could limit the opportunity to transition that we could not account for with an administrative dataset, including the use of antibiotics prior to admission, disease progression, severity of illness, and malabsorptive concerns. Thus, though we may have overestimated the true opportunity to transition to enteral antibiotics, it is unlikely that this would account for all of the variation in transition times that we observed across hospitals. Second, while our study required patients to have one of seven types of infection, we did not exclude any additional infectious diagnoses (eg, concurrent bacteremia, Clostridioides difficile, otitis media) that could have driven the choice of antibiotic type and modality. Although emerging evidence is supporting earlier transitions to oral therapy, bacteremia is typically treated with IV antibiotics; this may have led to an overestimation of true opportunity.40 “Clostridioides” difficile and otitis media are typically treated with enteral therapy; concurrent infections such as these may have led to an underestimation of opportunity given the fact that, based on our definition, the days on which patients received both IV and enteral antibiotics were not counted as opportunity days. Third, because PHIS uses billing days to capture medication use, we were unable to distinguish transitions that occurred early in the day vs those that took place later in the day. This could have led to an underestimation of percent opportunity, particularly for diagnoses with a short LOS; it also likely led to an underestimation of the variability observed across hospitals. Fourth, because we used an administrative dataset, we are unable to understand reasoning behind transitioning time from IV to oral antibiotics, as well as provider, patient, and institutional level factors that influenced these decisions.
CONCLUSION
Children hospitalized with bacterial infections often receive IV antibiotics, and the timing of transition from IV to enteral antibiotics varies significantly across hospitals. Further research is needed to compare the effectiveness of IV and enteral antibiotics and better define criteria for transition to enteral therapy. We identified ample opportunities for quality improvement initiatives to promote earlier transition, which have the potential to reduce healthcare utilization and promote optimal patient-directed high-value care.
1. Keren R, Luan X, Localio R, et al. Prioritization of comparative effectiveness research topics in hospital pediatrics. Arch Pediatr Adolesc Med. 2012;166(12):1155-1164. https://doi.org/10.1001/archpediatrics.2012.1266
2. McMullan BJ, Andresen D, Blyth CC, et al. Antibiotic duration and timing of the switch from intravenous to oral route for bacterial infections in children: systematic review and guidelines. Lancet Infect Dis. 2016;16(8):e139-e152. https://doi.org/10.1016/S1473-3099(16)30024-X
3. Keren R, Shah SS, Srivastava R, et al; for the Pediatric Research Inpatient Settings Network. Comparative effectiveness of intravenous vs oral antibiotics for postdischarge treatment of acute osteomyelitis in children. JAMA Pediatr. 2015;169(2):120-128. https://doi.org/10.1001/jamapediatrics.2014.2822
4. Shah SS, Srivastava R, Wu S, et al. Intravenous versus oral antibiotics for postdischarge treatment of complicated pneumonia. Pediatrics. 2016;138(6):e201692. https://doi.org/10.1542/peds.2016-1692
5. Li HK, Agweyu A, English M, Bejon P. An unsupported preference for intravenous antibiotics. PLoS Med. 2015;12(5):e1001825. https://dx.doi.org/10.1371%2Fjournal.pmed.1001825
6. Dellit TH, Owens RC, McGowan JE Jr, et al; Infectious Diseases Society of America; Society for Healthcare Epidemiology of America. Infectious Diseases Society of America and the Society for Healthcare Epidemiology of America guidelines for developing an institutional program to enhance antimicrobial stewardship. Clin Infect Dis. 2007;44(2):159-177. https://doi.org/10.1086/510393
7. Bradley JS, Byington CL, Shah SS, et al; Pediatric Infectious Diseases Society and the Infectious Diseases Society of America. Management of community-acquired pneumonia (CAP) in infants and children older than 3 months of age: clinical practice guidelines by the Pediatric Infectious Diseases Society and the Infectious Diseases Society of America. Clin Infect Dis. 2011;53(7):e25-e76. https://doi.org/10.1542/peds.2011-2385
8. Septimus EJ, Owens RC Jr. Need and potential of antimicrobial stewardship in community hospitals. Clin Infect Dis. 2011;53 Suppl 1:S8-S14. https://doi.org/10.1093/cid/cir363
9. Schroeder AR, Ralston SL. Intravenous antibiotic durations for common bacterial infections in children: when is enough? J Hosp Med. 2014;9(9):604-609. https://doi.org/10.1002/jhm.2239
10. Christensen EW, Spaulding AB, Pomputius WF, Grapentine SP. Effects of hospital practice patterns for antibiotic administration for pneumonia on hospital lengths of stay and costs. J Pediatric Infect Dis Soc. 2019;8(2):115-121. https://doi.org/10.1093/jpids/piy003
11. van Zanten AR, Engelfriet PM, van Dillen K, van Veen M, Nuijten MJ, Polderman KH. Importance of nondrug costs of intravenous antibiotic therapy. Crit Care. 2003;7(6):R184-R190. https://doi.org/10.1186/cc2388
12. Ruebner R, Keren R, Coffin S, Chu J, Horn D, Zaoutis TE. Complications of central venous catheters used for the treatment of acute hematogenous osteomyelitis. Pediatrics. 2006;117(4):1210-1215. https://doi.org/10.1542/peds.2005-1465
13. Girdwood SCT, Sellas MN, Courter JD, et al. Improving the transition of intravenous to enteral antibiotics in pediatric patients with pneumonia or skin and soft tissue infections. J Hosp Med. 2020;15(1):10-15. https://doi.org/10.12788/jhm.3253
14. Core Elements of Hospital Antibiotic Stewardship Programs. Centers for Disease Control and Prevention. Published 2019. Accessed May 30, 2020. https://www.cdc.gov/antibiotic-use/core-elements/hospital.html
15. Barlam TF, Cosgrove SE, Abbo LM, et al. Implementing an antibiotic stewardship program: guidelines by the Infectious Diseases Society of America and the Society for Healthcare Epidemiology of America. Clin Infect Dis. 2016;62(10):e51-e77. https://doi.org/10.1093/cid/ciw118
16. Science M, Timberlake K, Morris A, Read S, Le Saux N; Groupe Antibiothérapie en Pédiatrie Canada Alliance for Stewardship of Antimicrobials in Pediatrics (GAP Can ASAP). Quality metrics for antimicrobial stewardship programs. Pediatrics. 2019;143(4):e20182372. https://doi.org/10.1542/peds.2018-2372
17. Tchou MJ, Hall M, Shah SS, et al; Pediatric Research in Inpatient Settings (PRIS) Network. Patterns of electrolyte testing at children’s hospitals for common inpatient diagnoses. Pediatrics. 2019;144(1):e20181644. https://doi.org/10.1542/peds.2018-1644
18. Florin TA, French B, Zorc JJ, Alpern ER, Shah SS. Variation in emergency department diagnostic testing and disposition outcomes in pneumonia. Pediatrics. 2013;132(2):237-244. https://doi.org/10.1542/peds.2013-0179
19. Desai S, Shah SS, Hall M, Richardson TE, Thomson JE; Pediatric Research in Inpatient Settings (PRIS) Network. Imaging strategies and outcomes in children hospitalized with cervical lymphadenitis. J Hosp Med. 2020;15(4):197-203. https://doi.org/10.12788/jhm.3333
20. Markham JL, Hall M, Bettenhausen JL, Myers AL, Puls HT, McCulloh RJ. Variation in care and clinical outcomes in children hospitalized with orbital cellulitis. Hosp Pediatr. 2018;8(1):28-35. https://doi.org/10.1542/hpeds.2017-0040
21. Tieder JS, Hall M, Auger KA, et al. Accuracy of administrative billing codes to detect urinary tract infection hospitalizations. Pediatrics. 2011;128(2):323-330. https://doi.org/10.1542/peds.2010-2064
22. Singh JA, Yu S. The burden of septic arthritis on the U.S. inpatient care: a national study. PLoS One. 2017;12(8):e0182577. https://doi.org/10.1371/journal.pone.0182577
23. Foradori DM, Lopez MA, Hall M, et al. Invasive bacterial infections in infants younger than 60 days with skin and soft tissue infections. Pediatr Emerg Care. 2018. https://doi.org/10.1097/pec.0000000000001584
24. Feudtner C, Feinstein JA, Zhong W, Hall M, Dai D. Pediatric complex chronic conditions classification system version 2: updated for ICD-10 and complex medical technology dependence and transplantation. BMC Pediatr. 2014;14:199. https://doi.org/10.1186/1471-2431-14-199
25. Arancibia A, Icarte A, González C, Morasso I. Dose-dependent bioavailability of amoxycillin. Int J Clin Pharmacol Ther Toxicol. 1988;26(6):300-303.
26. Grayson ML, Cosgrove S, Crowe S, et al. Kucers’ the Use of Antibiotics: A Clinical Review of Antibacterial, Antifungal, Antiparasitic, and Antiviral Drugs. 7th ed. CRC Press; 2018.
27. Downes KJ, Hahn A, Wiles J, Courter JD, Inks AA. Dose optimisation of antibiotics in children: application of pharmacokinetics/pharmacodynamics in pediatrics’. Int J Antimicrob Agents. 2014;43(3):223-230. https://doi.org/10.1016/j.ijantimicag.2013.11.006
28. Gras-Le Guen C, Boscher C, Godon N, et al. Therapeutic amoxicillin levels achieved with oral administration in term neonates. Eur J Clin Pharmacol. 2007;63(7):657-662. https://doi.org/10.1007/s00228-007-0307-3
29. Sanchez Navarro A. New formulations of amoxicillin/clavulanic acid: a pharmacokinetic and pharmacodynamic review. Clin Pharmacokinet. 2005;44(11):1097-1115. https://doi.org/10.2165/00003088-200544110-00001
30. Fine MJ, Hough LJ, Medsger AR, et al. The hospital admission decision for patients with community-acquired pneumonia. Results from the pneumonia Patient Outcomes Research Team cohort study. Arch Intern Med. 1997;157(1):36-44. https://doi.org/10.1001/archinte.1997.00440220040006
31. Pohl A. Modes of administration of antibiotics for symptomatic severe urinary tract infections. Cochrane Database Syst Rev. 2007(4):CD003237. https://doi.org/10.1002/14651858.cd003237.pub2
32. Nageswaran S, Woods CR, Benjamin DK Jr, Givner LB, Shetty AK. Orbital cellulitis in children. Pediatr Infect Dis J. 2006;25(8):695-699. https://doi.org/10.1097/01.inf.0000227820.36036.f1
33. Al-Nammari S, Roberton B, Ferguson C. Towards evidence based emergency medicine: best BETs from the Manchester Royal Infirmary. Should a child with preseptal periorbital cellulitis be treated with intravenous or oral antibiotics? Emerg Med J. 2007;24(2):128-129. https://doi.org/10.1136/emj.2006.045245
34. Vieira F, Allen SM, Stocks RMS, Thompson JW. Deep neck infection. Otolaryngol Clin North Am. 2008;41(3):459-483, vii. https://doi.org/10.1016/j.otc.2008.01.002
35. Smith M, Shah S, Kronman M, Patel S, Thurm C, Hersh AL. Route of administration for highly orally bioavailable antibiotics. Open Forum Infect Dis. 2017;4(Suppl 1):S498-S499. https://doi.org/10.1093/ofid/ofx163.1291
36. Brady PW, Brinkman WB, Simmons JM, et al. Oral antibiotics at discharge for children with acute osteomyelitis: a rapid cycle improvement project. BMJ Qual Saf. 2014;23(6):499-507. https://doi.org/10.1136/bmjqs-2013-002179
37. Berrevoets MAH, Pot JHLW, Houterman AE, et al. An electronic trigger tool to optimise intravenous to oral antibiotic switch: a controlled, interrupted time series study. Antimicrob Resist Infect Control. 2017;6:81. https://doi.org/10.1186/s13756-017-0239-3
38. Fischer MA, Solomon DH, Teich JM, Avorn J. Conversion from intravenous to oral medications: assessment of a computerized intervention for hospitalized patients. Arch Intern Med. 2003;163(21):2585-2589. https://doi.org/10.1001/archinte.163.21.2585
39. Public Health Ontario. Antimicrobial stewardship programs metric examples. Published 2017. Accessed June 1, 2020. https://www.publichealthontario.ca/-/media/documents/A/2017/asp-metrics-examples.pdf?la=en
40. Desai S, Aronson PL, Shabanova V, et al; Febrile Young Infant Research Collaborative. Parenteral antibiotic therapy duration in young infants with bacteremic urinary tract infections. Pediatrics. 2019;144(3):e20183844. https://doi.org/10.1542/peds.2018-3844
© 2021 Society of Hospital Medicine
Development of a Simple Index to Measure Overuse of Diagnostic Testing at the Hospital Level Using Administrative Data
There is substantial geographic variation in intensity of healthcare use in the United States,1 yet areas with higher healthcare utilization do not demonstrate superior clinical outcomes.2 Low-value care exposes patients to unnecessary anxiety, radiation, and risk for adverse events.
Previous research has focused on measuring low-value care at the level of hospital referral regions,3-6 metropolitan statistical areas,7 provider organizations,8 and individual physicians.9,10 Hospital referral regions designate regional healthcare markets for tertiary care and generally include at least one major referral center.11 Well-calibrated and validated hospital-level measures of diagnostic overuse are lacking.
We sought to construct a novel index to measure hospital level overuse of diagnostic testing. We focused on diagnostic intensity rather than other forms of overuse such as screening or treatment intensity. Moreover, we aimed to create a parsimonious index—one that is simple, relies on a small number of inputs, is derived from readily available administrative data without the need for chart review or complex logic, and does not require exclusion criteria.
METHODS
Conceptual Framework for Choosing Index Components
To create our overuse index, we took advantage of the requirements for International Classification of Diseases, 9th Revision-Clinical Modification (ICD-9-CM) billing codes 780-796; these codes are based on “symptoms, signs, and ill-defined conditions” and can only be listed as the primary discharge diagnosis if no more specific diagnosis is made.12 As such, when coupled with expensive tests, a high prevalence of these symptom-based diagnosis codes at discharge may serve as a proxy for low-value care. One of the candidate metrics we selected was based on Choosing Wisely® recommendations.13 The other candidate metrics were based on clinical experience and consensus of the study team.
Data Sources
We used hospital-level data on primary discharge diagnosis codes and utilization of testing data from the State Inpatient Databases (SID), which are part of the Agency for Healthcare Research and Quality Healthcare Cost and Utilization Project (HCUP). Our derivation cohort used data from acute care hospitals in Maryland, New Jersey, and Washington state. Our validation cohort used data from acute care hospitals in Kentucky, North Carolina, New York, and West Virginia. States were selected based on availability of data (certain states lacked complete testing utilization data) and cost of data acquisition. The SID contains hospital-level utilization of computed tomography (CT) scans (CT of the body and head) and diagnostic testing, including stress testing and esophagogastroduodenoscopy (EGD).
Data on three prespecified Dartmouth Atlas of Health Care metrics at the hospital service area (HSA) level were obtained from the Dartmouth Atlas website.14 These metrics were (1) rate of inpatient coronary angiograms per 1,000 Medicare enrollees, (2) price-adjusted physician reimbursement per fee-for-service Medicare enrollee per year (adjusted for patient sex, race, and age), and (3) mean inpatient spending per decedent in the last 6 months of life.15 Data on three prespecified Medicare metrics at the county level were obtained from the Centers for Medicare & Medicaid Services (CMS) website.16 These metrics were standardized per capita cost per (1) procedure, (2) imaging, and (3) test of Medicare fee-for-service patients. The CMS uses the Berenson-Eggers Type of Service Codes to classify fee-generating interventions into a number of categories, including procedure, imaging, and test.17
Components of the Overuse Index
We tested five candidate metrics for index inclusion (Table 1). We utilized Clinical Classifications Software (CCS) codes provided by HCUP, which combine several ICD-9-CM codes into a single primary CCS discharge code for ease of use. The components were (1) primary CCS diagnosis of “nausea and vomiting” coupled with body CT scan or EGD, (2) primary CCS diagnosis of abdominal pain and body CT scan or EGD, (3) primary CCS diagnosis of “nonspecific chest pain” and body CT scan or stress test, (4) primary CCS diagnosis of syncope and stress test, and (5) primary CCS diagnosis for syncope and CT of the brain. For a given metric, the denominator was all patients with the particular primary CCS discharge diagnosis code. The numerator was patients with the diagnostic code who also had the specific test or procedure. We characterized the denominators of each metric in terms of mean, SD, and range.

Index Inclusion Criteria and Construction
Specialty, pediatric, rehabilitation, and long-term care hospitals were excluded. Moreover, any hospital with an overall denominator (for the entire index, not an individual metric) of five or fewer observations was excluded. Admissions to acute care hospitals between January 2011 and September 2015 (time of transition from ICD-9-CM to ICD-10-CM) that had one of the specified diagnosis codes were included. For a given hospital, the value of each of the five candidate metrics was defined as the ratio of all admissions that had the given testing and all admissions during the observation period with inclusion CCS diagnosis codes.
Derivation and Validation of the Index
In our derivation cohort (hospitals in Maryland, New Jersey, and Washington state), we tested the temporal stability of each candidate metric by year using the intraclass correlation coefficient (ICC). Using exploratory factor analysis (EFA) and Cronbach’s alpha, we then tested internal consistency of the index candidate components to ensure that all measured a common underlying factor (ie, diagnostic overuse). To standardize data, test rates for both of these analyses were converted to z-scores. For the EFA, we expected that if the index was reflecting only a single underlying factor, the Eigenvalue for one factor should be much higher (typically above 1.0) than that for multiple factors. We calculated item-test correlation for each candidate metric and Cronbach’s alpha for the entire index. A high and stable value for item-test correlation for each index component, as well as a high Cronbach’s alpha, suggests that index components measure a single common factor. Given the small number of test items, we considered a Cronbach’s alpha above 0.6 to be satisfactory.
This analysis showed satisfactory temporal stability of each candidate metric and good internal consistency of the candidate metrics in the derivation cohort. Therefore, we decided to keep all metrics rather than discard any of them. This same process was repeated with the validation cohort (Kentucky, New York, North Carolina, and West Virginia) and then with the combined group of seven states. Tests on the validation and entire cohort further supported our decision to keep all five metrics.
To determine the overall index value for a hospital, all of its metric numerators and denominators were added to calculate one fraction. In this way for a given hospital, a metric for which there were no observations was effectively excluded from the index. This essentially weights each index component by frequency. We chose to count syncope admissions only once in the denominator to avoid the index being unduly influenced by this diagnosis. The hospital index values were combined into their HSAs by adding numerators and denominators from each hospital to calculate HSA index values, effectively giving higher weight to hospitals with more observations. Spearman’s correlation coefficients were measured for these Dartmouth Atlas metrics, also at the HSA level. For the county level analysis, we used a hospital-county crosswalk (available from the American Hospital Association [AHA] Annual Survey; https://www.ahadata.com/aha-annual-survey-database) to link a hospital overuse index value to a county level cost value rather than aggregating data at the county level. We felt this was appropriate, as HSAs were constructed to represent a local healthcare market, whereas counties are less likely to be homogenous from a healthcare perspective.
Analysis of Entire Hospital Sample
The mean index value and SD were calculated for the entire sample of hospitals and for each state. The mean index value for each year of data was calculated to measure the temporal change of the index (representing a change in diagnostic intensity over the study period) using linear regression. We divided the cohort of hospitals into tertiles based on their index value. This is consistent with the CMS categorization of hospital payments and value of care as being “at,” “significantly above,” or “significantly below” a mean value.18 The characteristics of hospitals by tertile were described by mean total hospital beds, mean annual admissions, teaching status (nonteaching hospital, minor teaching hospital, major teaching hospital), and critical access hospital (yes/no). We utilized the AHA Annual Survey for data on hospital characteristics. We calculated P values using analysis of variance for hospital bed size and a chi-square test for teaching status and critical access hospital.
The entire group of hospitals from seven states was then used to apply the index to the HSA level. Numerators and denominators for each hospital in an HSA were added to calculate an HSA-level proportion. Thus, the HSA level index value, though unweighted, is dominated by hospitals with larger numbers of observations. For each of the Dartmouth metrics, the adjusted odds ratio of being in a higher diagnostic overuse index tertile given being in a certain Dartmouth Atlas metric tertile was calculated using ordinal logistic regression. This model controlled for the mean number of beds of hospitals in the HSA (continuous variable), mean Elixhauser Comorbidity Index (ECI) score (continuous variable; unweighted average among hospitals in an HSA), whether the HSA had a major or minor teaching hospital (yes/no) or was a critical access hospital (yes/no), and state fixed effects. The ECI score is a validated score that uses the presence or absence of 29 comorbidities to predict in-hospital mortality.19 For discriminant validity, we also tested two variables not expected to be associated with overuse—hospital ownership and affiliation with the Catholic Church.
For the county-level analysis, ordinal logistic regression was used to predict the adjusted odds ratio of being in a higher diagnostic overuse index tertile given being in a certain tertile of a given county-level spending metric. This model controlled for hospital bed size (continuous variable), hospital ECI score (continuous variable), teaching status (major, minor, nonteaching), critical access hospital status (yes/no), and state fixed effects.
RESULTS
Descriptive Statistics for Metrics
A total of 620 acute care hospitals were included in the index. Thirteen hospitals were excluded because their denominator was five or fewer. The vast majority of HSAs (85.9%) had only one hospital, 8.2% had two hospitals, and 2.4% had three hospitals. Similarly, the majority of counties (68.7%) had only one hospital, 15.1% had two hospitals, and 6.6% had three hospitals (Appendix Tables 1.1 and 1.2). Nonspecific chest pain was the metric with largest denominator mean (650), SD (1,012), and range (0-10,725) (Appendix Table 2). Overall, the metric denominators were a small fraction of total hospital discharges, with means at the hospital level ranging from 0.69% for nausea and vomiting to 5.81% for nonspecific chest pain, suggesting that our index relies on a relatively small fraction of discharges.
Tests for Temporal Stability and Internal Consistency by Derivation and Validation Strategy
Overall, the ICCs for the derivation, validation, and entire cohort suggested strong temporal stability (Appendix Table 3). The EFA of the derivation, validation, and entire cohort showed high Eigenvalues for one principal component, with no other factors close to 1, indicating strong internal consistency (Appendix Table 4). The Cronbach’s alpha analysis also suggested strong internal consistency, with alpha values ranging from 0.73 for the validation cohort to 0.80 for the derivation cohort (Table 2).

Correlation With External Validation Measures
For the entire cohort, the Spearman’s rho for correlation between our overuse index and inpatient rate of coronary angiography at the HSA level was 0.186 (95% CI, 0.089-0.283), Medicare reimbursement at the HSA level was 0.355 (95% CI, 0.272-0.437), and Medicare spending during the last 6 months of life at the HSA level was 0.149 (95% CI, 0.061-0.236) (Appendix Figures 5.1-5.3). The Spearman’s rho for correlation between our overuse index and county level standardized procedure cost was 0.284 (95% CI, 0.210-0.358), imaging cost was 0.268 (95% CI, 0.195-0.342), and testing cost was 0.226 (95% CI, 0.152-0.300) (Appendix Figures 6.1-6.3).
Overall Index Values and Change Over Time
The mean hospital index value was 0.541 (SD, 0.178) (Appendix Table 7). There was a slight but statistically significant annual increase in the overall mean index value over the study period, suggesting a small rise in overuse of diagnostic testing (coefficient 0.011; P <.001) (Appendix Figure 8).
Diagnostic Overuse Index Tertiles
Hospitals in the lowest tertile of the index tended to be smaller (based on number of beds) (P < .0001) and were more likely to be critical access hospitals (P <.0001). There was a significant difference in the proportion of nonteaching, minor teaching, and major teaching hospitals, with more nonteaching hospitals in tertile 1 (P = .001) (Table 3). The median ECI score was not significantly different among tertiles. Neither of the variables tested for discriminant validity (hospital ownership and Catholic Church affiliation) was associated with our index.

Adjusted Multilevel Mixed-Effects Ordinal Logistic Regression
Our overuse index correlated most closely with physician reimbursement, with an odds ratio of 2.02 (95% CI, 1.11-3.66) of being in a higher tertile of the overuse index when comparing tertiles 3 and 1 of this Dartmouth metric. Of the Medicare county-level metrics, our index correlated most closely with cost of procedures, with an odds ratio of 2.03 (95% CI, 1.21-3.39) of being in a higher overuse index tertile when comparing tertiles 3 and 1 of the cost per procedure metric (Figure 1).

DISCUSSION
Previous research shows variation among hospitals for overall physician spending,20 noninvasive cardiac imaging,21 and the rate of finding obstructive lesions during elective coronary angiography.22 However, there is a lack of standardized methods to study a broad range of diagnostic overuse at the hospital level. To our knowledge, no studies have attempted to develop a diagnostic overuse index at the hospital level. We used a derivation-validation approach to achieve our goal. Although the five metrics represent a range of conditions, the EFA and Cronbach’s alpha tests suggest that they measure a common phenomenon. To avoid systematically excluding smaller hospitals, we limited the extent to which we eliminated hospitals with few observations. Our findings suggest that it may be reasonable to make generalizations on the diagnostic intensity of a hospital based on a relatively small number of discharges. Moreover, our index is a proof of concept that rates of negative diagnostic testing can serve as a proxy for estimating diagnostic overuse.
Our hospital-level index values extrapolated to the HSA level weakly correlated with prespecified Dartmouth Atlas metrics. In a multivariate ordinal regression, there was a significant though weak association between hospitals in higher tertiles of the Dartmouth Atlas metrics and categorization in higher tertiles of our diagnostic overuse index. Similarly, our hospital-level index correlated with two of the three county-level metrics in a multivariate ordinal regression.
We do not assume that all of the metrics in our index track together. However, our results, including the wide dispersion of index values among the tertiles (Table 3), suggest that at least some hospitals are outliers in multiple metrics. We did not assume ex ante that our index should correlate with Dartmouth overuse metrics or Medicare county-level spending; however, we did believe that an association with these measures would assist in validating our index. Given that our index utilizes four common diagnoses, while the Dartmouth and Medicare cost metrics are based on a much broader range of conditions, we would not expect more than a weak correlation even if our index is a valid way to measure overuse.
All of the metrics were based on the concept that hospitals with high rates of negative testing are likely providing large amounts of low-value care. Prior studies on diagnostic yield of CT scans in the emergency department for pulmonary embolus (PE) found an increase in testing and decrease in yield over time; these studies also showed that physicians with more experience ordered fewer CT scans and had a higher yield.23 A review of electronic health records and billing data also showed that hospitals with higher rates of D-dimer testing had higher yields on CT scans ordered to test for PE.24
We took advantage of the coding convention that certain diagnoses only be listed as the primary discharge diagnosis if no more specific diagnosis is made. This allowed us to identify hospitals that likely had high rates of negative tests without granular data. Of course, the metrics are not measuring rates of negative testing per se, but a proxy for this, based instead on the proportion of patients with a symptom-based primary discharge diagnosis who underwent diagnostic testing.
Measuring diagnostic overuse at the hospital level may help to understand factors that drive overuse, given that institutional incentives and culture likely play important roles in ordering tests. There is evidence that financial incentives drive physicians’ decisions,25-27 and there is also evidence that institutional culture impacts outcomes.28 Further, quality improvement projects are typically designed at the hospital level and may be an effective way to curb overuse.29,30
Previous studies have focused on measuring variation among providers and identifying outlier physicians.9,10,20 Providing feedback to underperforming physicians has been shown to change practice habits.31,32 Efforts to improve the practice habits of outlier hospitals may have a number of advantages, including economies of scale and scope and the added benefit of improving the habits of all providers—not just those who are underperforming.
Ordering expensive diagnostic tests on patients with a low pretest probability of having an organic etiology for their symptoms contributes to high healthcare costs. Of course, we do not believe that the ideal rate of negative testing is zero. However, hospitals with high rates of negative diagnostic testing are more likely to be those with clinicians who use expensive tests as a substitute for clinical judgment or less-expensive tests (eg, D-dimer testing to rule out PE).
One challenge we faced is that there is no gold standard of hospital-level overuse with which to validate our index. Our index is weakly correlated with a number of regional metrics that may be proxies for overuse. We are reassured that there is a statistically significant correlation with measures at both HSA and county levels. These correlations are weak, but these regional metrics are themselves imperfect surrogates for overuse. Furthermore, our index is preliminary and will need refinement in future studies.
Limitations
Our analysis has multiple limitations. First, since it relies heavily on primary ICD discharge diagnosis codes, biases could exist due to variations in coding practices. Second, the SID does not include observation stays or tests conducted in the ED, so differential use of observation stays among hospitals might impact results. Finally, based on utilization data, we were not able to distinguish between CT scans of the chest, abdomen, and pelvis because the SID labels each of these as body CT.
CONCLUSION
We developed a novel index to measure diagnostic intensity at the hospital level. This index relies on the concept that high rates of negative diagnostic testing likely indicate some degree of overuse. Our index is parsimonious, does not require granular claims data, and measures a range of potentially overused tests for common clinical scenarios. Our next steps include further refining the index, testing it with granular data, and validating it with other datasets. Thereafter, this index may be useful at identifying positive and negative outliers to understand what processes of care contribute to outlier high and low levels of diagnostic testing. We suspect our index is more useful at identifying extremes than comparing hospitals in the middle of the utilization curve. Additionally, exploring the relationship among individual metrics and the relationship between our index and quality measures like mortality and readmissions may be informative.
1. Fisher ES, Wennberg JE, Stukel TA, et al. Associations among hospital capacity, utilization, and mortality of US Medicare beneficiaries, controlling for sociodemographic factors. Health Serv Res. 2000;34(6):1351-1362.
2. Fisher ES, Wennberg DE, Stukel TA, Gottlieb DJ, Lucas FL, Pinder ÉL. The implications of regional variations in Medicare spending. Part 2: health outcomes and satisfaction with care. Ann Intern Med. 2003;138(4):288-298. https://doi.org/10.7326/0003-4819-138-4-200302180-00007
3. Segal JB, Nassery N, Chang H-Y, Chang E, Chan K, Bridges JFP. An index for measuring overuse of health care resources with Medicare claims. Med Care. 2015;53(3):230-236. https://doi.org/10.1097/mlr.0000000000000304
4. Colla CH, Morden NE, Sequist TD, Schpero WL, Rosenthal MB. Choosing wisely: prevalence and correlates of low-value health care services in the United States. J Gen Intern Med. 2014;30(2):221-228. https://doi.org/10.1007/s11606-014-3070-z
5. Colla CH, Morden NE, Sequist TD, Mainor AJ, Li Z, Rosenthal MB. Payer type and low-value care: comparing Choosing Wisely services across commercial and Medicare populations. Health Serv Res. 2018;53(2):730-746. https://doi.org/10.1111/1475-6773.12665
6. Schwartz AL, Landon BE, Elshaug AG, Chernew ME, McWilliams JM. Measuring low-value care in Medicare. JAMA Intern Med. 2014;174(7):1067-1076. https://doi.org/10.1001/jamainternmed.2014.1541
7. Oakes AH, Chang H-Y, Segal JB. Systemic overuse of health care in a commercially insured US population, 2010–2015. BMC Health Serv Res. 2019;19(1). https://doi.org/10.1186/s12913-019-4079-0
8. Schwartz AL, Zaslavsky AM, Landon BE, Chernew ME, McWilliams JM. Low-value service use in provider organizations. Health Serv Res. 2018;53(1):87-119. https://doi.org/10.1111/1475-6773.12597
9. Schwartz AL, Jena AB, Zaslavsky AM, McWilliams JM. Analysis of physician variation in provision of low-value services. JAMA Intern Med. 2019;179(1):16-25. https://doi.org/10.1001/jamainternmed.2018.5086
10. Bouck Z, Ferguson J, Ivers NM, et al. Physician characteristics associated with ordering 4 low-value screening tests in primary care. JAMA Netw Open. 2018;1(6):e183506. https://doi.org/10.1001/jamanetworkopen.2018.3506
11. Dartmouth Atlas Project. Data By Region - Dartmouth Atlas of Health Care. Accessed August 29, 2019. http://archive.dartmouthatlas.org/data/region/
12. ICD-9-CM Official Guidelines for Coding and Reporting (Effective October 11, 2011). Accessed March 1, 2018. https://www.cdc.gov/nchs/data/icd/icd9cm_guidelines_2011.pdf
13. Cassel CK, Guest JA. Choosing wisely - helping physicians and patients make smart decisions about their care. JAMA. 2012;307(17):1801-1802. https://doi.org/10.1001/jama.2012.476
14. The Dartmouth Atlas of Health Care. Accessed July 17, 2018. http://www.dartmouthatlas.org/
15. The Dartmouth Atlas of Healthcare. Research Methods. Accessed January 27, 2019. http://archive.dartmouthatlas.org/downloads/methods/research_methods.pdf
16. Centers for Medicare & Medicaid Services. Medicare geographic variation, public use file. Accessed January 5, 2020. https://www.cms.gov/Research-Statistics-Data-and-Systems/Statistics-Trends-and-Reports/Medicare-Geographic-Variation/GV_PUF
17. Centers for Medicare & Medicaid Services. Berenson-Eggers Type of Service (BETOS) codes. Accessed January 10, 2020. https://www.cms.gov/Research-Statistics-Data-and-Systems/Statistics-Trends-and-Reports/MedicareFeeforSvcPartsAB/downloads/betosdesccodes.pdf
18. Data.Medicare.gov. Payment and value of care – hospital: hospital compare. Accessed August 21, 2019. https://data.medicare.gov/Hospital-Compare/Payment-and-value-of-care-Hospital/c7us-v4mf
19. Moore BJ, White S, Washington R, Coenen N, Elixhauser A. Identifying increased risk of readmission and in-hospital mortality using hospital administrative data: the AHRQ Elixhauser comorbidity index. Med Care. 2017;55(7):698-705. https://doi.org/10.1097/mlr.0000000000000735
20. Tsugawa Y, Jha AK, Newhouse JP, Zaslavsky AM, Jena AB. Variation in physician spending and association with patient outcomes. JAMA Intern Med. 2017;177(5):675-682. https://doi.org/10.1001/jamainternmed.2017.0059
21. Safavi KC, Li S-X, Dharmarajan K, et al. Hospital variation in the use of noninvasive cardiac imaging and its association with downstream testing, interventions, and outcomes. JAMA Intern Med. 2014;174(4):546-553. https://doi.org/10.1001/jamainternmed.2013.14407
22. Douglas PS, Patel MR, Bailey SR, et al. Hospital variability in the rate of finding obstructive coronary artery disease at elective, diagnostic coronary angiography. J Am Coll Cardiol. 2011;58(8):801-809. https://doi.org/10.1016/j.jacc.2011.05.019
23. Venkatesh AK, Agha L, Abaluck J, Rothenberg C, Kabrhel C, Raja AS. Trends and variation in the utilization and diagnostic yield of chest imaging for Medicare patients with suspected pulmonary embolism in the emergency department. Am J Roentgenol. 2018;210(3):572-577. https://doi.org/10.2214/ajr.17.18586
24. Kline JA, Garrett JS, Sarmiento EJ, Strachan CC, Courtney DM. Over-testing for suspected pulmonary embolism in american emergency departments: the continuing epidemic. Circ Cardiovasc Qual Outcomes. 2020;13(1):e005753. https://doi.org/10.1161/circoutcomes.119.005753
25. Welch HG, Fisher ES. Income and cancer overdiagnosis – when too much care is harmful. N Engl J Med. 2017;376(23):2208-2209. https://doi.org/10.1056/nejmp1615069
26. Nicholson S. Physician specialty choice under uncertainty. J Labor Econ. 2002;20(4):816-847. https://doi.org/10.1086/342039
27. Chang R-KR, Halfon N. Geographic distribution of pediatricians in the United States: an analysis of the fifty states and Washington, DC. Pediatrics. 1997;100(2 pt 1):172-179. https://doi.org/10.1542/peds.100.2.172
28. Braithwaite J, Herkes J, Ludlow K, Lamprell G, Testa L. Association between organisational and workplace cultures, and patient outcomes: systematic review protocol. BMJ Open. 2016;6(12):e013758. https://doi.org/10.1136/bmjopen-2016-013758
29. Bhatia RS, Milford CE, Picard MH, Weiner RB. An educational intervention reduces the rate of inappropriate echocardiograms on an inpatient medical service. JACC Cardiovasc Imaging. 2013;6(5):545-555. https://doi.org/10.1016/j.jcmg.2013.01.010
30. Blackmore CC, Watt D, Sicuro PL. The success and failure of a radiology quality metric: the case of OP-10. J Am Coll Radiol. 2016;13(6):630-637. https://doi.org/10.1016/j.jacr.2016.01.006
31. Albertini JG, Wang P, Fahim C, et al. Evaluation of a peer-to-peer data transparency intervention for Mohs micrographic surgery overuse. JAMA Dermatol. 2019;155(8):906-913. https://dx.doi.org/10.1001%2Fjamadermatol.2019.1259
32. Sacarny A, Barnett ML, Le J, Tetkoski F, Yokum D, Agrawal S. Effect of peer comparison letters for high-volume primary care prescribers of quetiapine in older and disabled adults: a randomized clinical trial. JAMA Psychiatry. 2018;75(10):1003-1011. https://doi.org/10.1001/jamapsychiatry.2018.1867
There is substantial geographic variation in intensity of healthcare use in the United States,1 yet areas with higher healthcare utilization do not demonstrate superior clinical outcomes.2 Low-value care exposes patients to unnecessary anxiety, radiation, and risk for adverse events.
Previous research has focused on measuring low-value care at the level of hospital referral regions,3-6 metropolitan statistical areas,7 provider organizations,8 and individual physicians.9,10 Hospital referral regions designate regional healthcare markets for tertiary care and generally include at least one major referral center.11 Well-calibrated and validated hospital-level measures of diagnostic overuse are lacking.
We sought to construct a novel index to measure hospital level overuse of diagnostic testing. We focused on diagnostic intensity rather than other forms of overuse such as screening or treatment intensity. Moreover, we aimed to create a parsimonious index—one that is simple, relies on a small number of inputs, is derived from readily available administrative data without the need for chart review or complex logic, and does not require exclusion criteria.
METHODS
Conceptual Framework for Choosing Index Components
To create our overuse index, we took advantage of the requirements for International Classification of Diseases, 9th Revision-Clinical Modification (ICD-9-CM) billing codes 780-796; these codes are based on “symptoms, signs, and ill-defined conditions” and can only be listed as the primary discharge diagnosis if no more specific diagnosis is made.12 As such, when coupled with expensive tests, a high prevalence of these symptom-based diagnosis codes at discharge may serve as a proxy for low-value care. One of the candidate metrics we selected was based on Choosing Wisely® recommendations.13 The other candidate metrics were based on clinical experience and consensus of the study team.
Data Sources
We used hospital-level data on primary discharge diagnosis codes and utilization of testing data from the State Inpatient Databases (SID), which are part of the Agency for Healthcare Research and Quality Healthcare Cost and Utilization Project (HCUP). Our derivation cohort used data from acute care hospitals in Maryland, New Jersey, and Washington state. Our validation cohort used data from acute care hospitals in Kentucky, North Carolina, New York, and West Virginia. States were selected based on availability of data (certain states lacked complete testing utilization data) and cost of data acquisition. The SID contains hospital-level utilization of computed tomography (CT) scans (CT of the body and head) and diagnostic testing, including stress testing and esophagogastroduodenoscopy (EGD).
Data on three prespecified Dartmouth Atlas of Health Care metrics at the hospital service area (HSA) level were obtained from the Dartmouth Atlas website.14 These metrics were (1) rate of inpatient coronary angiograms per 1,000 Medicare enrollees, (2) price-adjusted physician reimbursement per fee-for-service Medicare enrollee per year (adjusted for patient sex, race, and age), and (3) mean inpatient spending per decedent in the last 6 months of life.15 Data on three prespecified Medicare metrics at the county level were obtained from the Centers for Medicare & Medicaid Services (CMS) website.16 These metrics were standardized per capita cost per (1) procedure, (2) imaging, and (3) test of Medicare fee-for-service patients. The CMS uses the Berenson-Eggers Type of Service Codes to classify fee-generating interventions into a number of categories, including procedure, imaging, and test.17
Components of the Overuse Index
We tested five candidate metrics for index inclusion (Table 1). We utilized Clinical Classifications Software (CCS) codes provided by HCUP, which combine several ICD-9-CM codes into a single primary CCS discharge code for ease of use. The components were (1) primary CCS diagnosis of “nausea and vomiting” coupled with body CT scan or EGD, (2) primary CCS diagnosis of abdominal pain and body CT scan or EGD, (3) primary CCS diagnosis of “nonspecific chest pain” and body CT scan or stress test, (4) primary CCS diagnosis of syncope and stress test, and (5) primary CCS diagnosis for syncope and CT of the brain. For a given metric, the denominator was all patients with the particular primary CCS discharge diagnosis code. The numerator was patients with the diagnostic code who also had the specific test or procedure. We characterized the denominators of each metric in terms of mean, SD, and range.
Index Inclusion Criteria and Construction
Specialty, pediatric, rehabilitation, and long-term care hospitals were excluded. Moreover, any hospital with an overall denominator (for the entire index, not an individual metric) of five or fewer observations was excluded. Admissions to acute care hospitals between January 2011 and September 2015 (time of transition from ICD-9-CM to ICD-10-CM) that had one of the specified diagnosis codes were included. For a given hospital, the value of each of the five candidate metrics was defined as the ratio of all admissions that had the given testing and all admissions during the observation period with inclusion CCS diagnosis codes.
Derivation and Validation of the Index
In our derivation cohort (hospitals in Maryland, New Jersey, and Washington state), we tested the temporal stability of each candidate metric by year using the intraclass correlation coefficient (ICC). Using exploratory factor analysis (EFA) and Cronbach’s alpha, we then tested internal consistency of the index candidate components to ensure that all measured a common underlying factor (ie, diagnostic overuse). To standardize data, test rates for both of these analyses were converted to z-scores. For the EFA, we expected that if the index was reflecting only a single underlying factor, the Eigenvalue for one factor should be much higher (typically above 1.0) than that for multiple factors. We calculated item-test correlation for each candidate metric and Cronbach’s alpha for the entire index. A high and stable value for item-test correlation for each index component, as well as a high Cronbach’s alpha, suggests that index components measure a single common factor. Given the small number of test items, we considered a Cronbach’s alpha above 0.6 to be satisfactory.
This analysis showed satisfactory temporal stability of each candidate metric and good internal consistency of the candidate metrics in the derivation cohort. Therefore, we decided to keep all metrics rather than discard any of them. This same process was repeated with the validation cohort (Kentucky, New York, North Carolina, and West Virginia) and then with the combined group of seven states. Tests on the validation and entire cohort further supported our decision to keep all five metrics.
To determine the overall index value for a hospital, all of its metric numerators and denominators were added to calculate one fraction. In this way for a given hospital, a metric for which there were no observations was effectively excluded from the index. This essentially weights each index component by frequency. We chose to count syncope admissions only once in the denominator to avoid the index being unduly influenced by this diagnosis. The hospital index values were combined into their HSAs by adding numerators and denominators from each hospital to calculate HSA index values, effectively giving higher weight to hospitals with more observations. Spearman’s correlation coefficients were measured for these Dartmouth Atlas metrics, also at the HSA level. For the county level analysis, we used a hospital-county crosswalk (available from the American Hospital Association [AHA] Annual Survey; https://www.ahadata.com/aha-annual-survey-database) to link a hospital overuse index value to a county level cost value rather than aggregating data at the county level. We felt this was appropriate, as HSAs were constructed to represent a local healthcare market, whereas counties are less likely to be homogenous from a healthcare perspective.
Analysis of Entire Hospital Sample
The mean index value and SD were calculated for the entire sample of hospitals and for each state. The mean index value for each year of data was calculated to measure the temporal change of the index (representing a change in diagnostic intensity over the study period) using linear regression. We divided the cohort of hospitals into tertiles based on their index value. This is consistent with the CMS categorization of hospital payments and value of care as being “at,” “significantly above,” or “significantly below” a mean value.18 The characteristics of hospitals by tertile were described by mean total hospital beds, mean annual admissions, teaching status (nonteaching hospital, minor teaching hospital, major teaching hospital), and critical access hospital (yes/no). We utilized the AHA Annual Survey for data on hospital characteristics. We calculated P values using analysis of variance for hospital bed size and a chi-square test for teaching status and critical access hospital.
The entire group of hospitals from seven states was then used to apply the index to the HSA level. Numerators and denominators for each hospital in an HSA were added to calculate an HSA-level proportion. Thus, the HSA level index value, though unweighted, is dominated by hospitals with larger numbers of observations. For each of the Dartmouth metrics, the adjusted odds ratio of being in a higher diagnostic overuse index tertile given being in a certain Dartmouth Atlas metric tertile was calculated using ordinal logistic regression. This model controlled for the mean number of beds of hospitals in the HSA (continuous variable), mean Elixhauser Comorbidity Index (ECI) score (continuous variable; unweighted average among hospitals in an HSA), whether the HSA had a major or minor teaching hospital (yes/no) or was a critical access hospital (yes/no), and state fixed effects. The ECI score is a validated score that uses the presence or absence of 29 comorbidities to predict in-hospital mortality.19 For discriminant validity, we also tested two variables not expected to be associated with overuse—hospital ownership and affiliation with the Catholic Church.
For the county-level analysis, ordinal logistic regression was used to predict the adjusted odds ratio of being in a higher diagnostic overuse index tertile given being in a certain tertile of a given county-level spending metric. This model controlled for hospital bed size (continuous variable), hospital ECI score (continuous variable), teaching status (major, minor, nonteaching), critical access hospital status (yes/no), and state fixed effects.
RESULTS
Descriptive Statistics for Metrics
A total of 620 acute care hospitals were included in the index. Thirteen hospitals were excluded because their denominator was five or fewer. The vast majority of HSAs (85.9%) had only one hospital, 8.2% had two hospitals, and 2.4% had three hospitals. Similarly, the majority of counties (68.7%) had only one hospital, 15.1% had two hospitals, and 6.6% had three hospitals (Appendix Tables 1.1 and 1.2). Nonspecific chest pain was the metric with largest denominator mean (650), SD (1,012), and range (0-10,725) (Appendix Table 2). Overall, the metric denominators were a small fraction of total hospital discharges, with means at the hospital level ranging from 0.69% for nausea and vomiting to 5.81% for nonspecific chest pain, suggesting that our index relies on a relatively small fraction of discharges.
Tests for Temporal Stability and Internal Consistency by Derivation and Validation Strategy
Overall, the ICCs for the derivation, validation, and entire cohort suggested strong temporal stability (Appendix Table 3). The EFA of the derivation, validation, and entire cohort showed high Eigenvalues for one principal component, with no other factors close to 1, indicating strong internal consistency (Appendix Table 4). The Cronbach’s alpha analysis also suggested strong internal consistency, with alpha values ranging from 0.73 for the validation cohort to 0.80 for the derivation cohort (Table 2).
Correlation With External Validation Measures
For the entire cohort, the Spearman’s rho for correlation between our overuse index and inpatient rate of coronary angiography at the HSA level was 0.186 (95% CI, 0.089-0.283), Medicare reimbursement at the HSA level was 0.355 (95% CI, 0.272-0.437), and Medicare spending during the last 6 months of life at the HSA level was 0.149 (95% CI, 0.061-0.236) (Appendix Figures 5.1-5.3). The Spearman’s rho for correlation between our overuse index and county level standardized procedure cost was 0.284 (95% CI, 0.210-0.358), imaging cost was 0.268 (95% CI, 0.195-0.342), and testing cost was 0.226 (95% CI, 0.152-0.300) (Appendix Figures 6.1-6.3).
Overall Index Values and Change Over Time
The mean hospital index value was 0.541 (SD, 0.178) (Appendix Table 7). There was a slight but statistically significant annual increase in the overall mean index value over the study period, suggesting a small rise in overuse of diagnostic testing (coefficient 0.011; P <.001) (Appendix Figure 8).
Diagnostic Overuse Index Tertiles
Hospitals in the lowest tertile of the index tended to be smaller (based on number of beds) (P < .0001) and were more likely to be critical access hospitals (P <.0001). There was a significant difference in the proportion of nonteaching, minor teaching, and major teaching hospitals, with more nonteaching hospitals in tertile 1 (P = .001) (Table 3). The median ECI score was not significantly different among tertiles. Neither of the variables tested for discriminant validity (hospital ownership and Catholic Church affiliation) was associated with our index.
Adjusted Multilevel Mixed-Effects Ordinal Logistic Regression
Our overuse index correlated most closely with physician reimbursement, with an odds ratio of 2.02 (95% CI, 1.11-3.66) of being in a higher tertile of the overuse index when comparing tertiles 3 and 1 of this Dartmouth metric. Of the Medicare county-level metrics, our index correlated most closely with cost of procedures, with an odds ratio of 2.03 (95% CI, 1.21-3.39) of being in a higher overuse index tertile when comparing tertiles 3 and 1 of the cost per procedure metric (Figure 1).
DISCUSSION
Previous research shows variation among hospitals for overall physician spending,20 noninvasive cardiac imaging,21 and the rate of finding obstructive lesions during elective coronary angiography.22 However, there is a lack of standardized methods to study a broad range of diagnostic overuse at the hospital level. To our knowledge, no studies have attempted to develop a diagnostic overuse index at the hospital level. We used a derivation-validation approach to achieve our goal. Although the five metrics represent a range of conditions, the EFA and Cronbach’s alpha tests suggest that they measure a common phenomenon. To avoid systematically excluding smaller hospitals, we limited the extent to which we eliminated hospitals with few observations. Our findings suggest that it may be reasonable to make generalizations on the diagnostic intensity of a hospital based on a relatively small number of discharges. Moreover, our index is a proof of concept that rates of negative diagnostic testing can serve as a proxy for estimating diagnostic overuse.
Our hospital-level index values extrapolated to the HSA level weakly correlated with prespecified Dartmouth Atlas metrics. In a multivariate ordinal regression, there was a significant though weak association between hospitals in higher tertiles of the Dartmouth Atlas metrics and categorization in higher tertiles of our diagnostic overuse index. Similarly, our hospital-level index correlated with two of the three county-level metrics in a multivariate ordinal regression.
We do not assume that all of the metrics in our index track together. However, our results, including the wide dispersion of index values among the tertiles (Table 3), suggest that at least some hospitals are outliers in multiple metrics. We did not assume ex ante that our index should correlate with Dartmouth overuse metrics or Medicare county-level spending; however, we did believe that an association with these measures would assist in validating our index. Given that our index utilizes four common diagnoses, while the Dartmouth and Medicare cost metrics are based on a much broader range of conditions, we would not expect more than a weak correlation even if our index is a valid way to measure overuse.
All of the metrics were based on the concept that hospitals with high rates of negative testing are likely providing large amounts of low-value care. Prior studies on diagnostic yield of CT scans in the emergency department for pulmonary embolus (PE) found an increase in testing and decrease in yield over time; these studies also showed that physicians with more experience ordered fewer CT scans and had a higher yield.23 A review of electronic health records and billing data also showed that hospitals with higher rates of D-dimer testing had higher yields on CT scans ordered to test for PE.24
We took advantage of the coding convention that certain diagnoses only be listed as the primary discharge diagnosis if no more specific diagnosis is made. This allowed us to identify hospitals that likely had high rates of negative tests without granular data. Of course, the metrics are not measuring rates of negative testing per se, but a proxy for this, based instead on the proportion of patients with a symptom-based primary discharge diagnosis who underwent diagnostic testing.
Measuring diagnostic overuse at the hospital level may help to understand factors that drive overuse, given that institutional incentives and culture likely play important roles in ordering tests. There is evidence that financial incentives drive physicians’ decisions,25-27 and there is also evidence that institutional culture impacts outcomes.28 Further, quality improvement projects are typically designed at the hospital level and may be an effective way to curb overuse.29,30
Previous studies have focused on measuring variation among providers and identifying outlier physicians.9,10,20 Providing feedback to underperforming physicians has been shown to change practice habits.31,32 Efforts to improve the practice habits of outlier hospitals may have a number of advantages, including economies of scale and scope and the added benefit of improving the habits of all providers—not just those who are underperforming.
Ordering expensive diagnostic tests on patients with a low pretest probability of having an organic etiology for their symptoms contributes to high healthcare costs. Of course, we do not believe that the ideal rate of negative testing is zero. However, hospitals with high rates of negative diagnostic testing are more likely to be those with clinicians who use expensive tests as a substitute for clinical judgment or less-expensive tests (eg, D-dimer testing to rule out PE).
One challenge we faced is that there is no gold standard of hospital-level overuse with which to validate our index. Our index is weakly correlated with a number of regional metrics that may be proxies for overuse. We are reassured that there is a statistically significant correlation with measures at both HSA and county levels. These correlations are weak, but these regional metrics are themselves imperfect surrogates for overuse. Furthermore, our index is preliminary and will need refinement in future studies.
Limitations
Our analysis has multiple limitations. First, since it relies heavily on primary ICD discharge diagnosis codes, biases could exist due to variations in coding practices. Second, the SID does not include observation stays or tests conducted in the ED, so differential use of observation stays among hospitals might impact results. Finally, based on utilization data, we were not able to distinguish between CT scans of the chest, abdomen, and pelvis because the SID labels each of these as body CT.
CONCLUSION
We developed a novel index to measure diagnostic intensity at the hospital level. This index relies on the concept that high rates of negative diagnostic testing likely indicate some degree of overuse. Our index is parsimonious, does not require granular claims data, and measures a range of potentially overused tests for common clinical scenarios. Our next steps include further refining the index, testing it with granular data, and validating it with other datasets. Thereafter, this index may be useful at identifying positive and negative outliers to understand what processes of care contribute to outlier high and low levels of diagnostic testing. We suspect our index is more useful at identifying extremes than comparing hospitals in the middle of the utilization curve. Additionally, exploring the relationship among individual metrics and the relationship between our index and quality measures like mortality and readmissions may be informative.
1. Fisher ES, Wennberg JE, Stukel TA, et al. Associations among hospital capacity, utilization, and mortality of US Medicare beneficiaries, controlling for sociodemographic factors. Health Serv Res. 2000;34(6):1351-1362.
2. Fisher ES, Wennberg DE, Stukel TA, Gottlieb DJ, Lucas FL, Pinder ÉL. The implications of regional variations in Medicare spending. Part 2: health outcomes and satisfaction with care. Ann Intern Med. 2003;138(4):288-298. https://doi.org/10.7326/0003-4819-138-4-200302180-00007
3. Segal JB, Nassery N, Chang H-Y, Chang E, Chan K, Bridges JFP. An index for measuring overuse of health care resources with Medicare claims. Med Care. 2015;53(3):230-236. https://doi.org/10.1097/mlr.0000000000000304
4. Colla CH, Morden NE, Sequist TD, Schpero WL, Rosenthal MB. Choosing wisely: prevalence and correlates of low-value health care services in the United States. J Gen Intern Med. 2014;30(2):221-228. https://doi.org/10.1007/s11606-014-3070-z
5. Colla CH, Morden NE, Sequist TD, Mainor AJ, Li Z, Rosenthal MB. Payer type and low-value care: comparing Choosing Wisely services across commercial and Medicare populations. Health Serv Res. 2018;53(2):730-746. https://doi.org/10.1111/1475-6773.12665
6. Schwartz AL, Landon BE, Elshaug AG, Chernew ME, McWilliams JM. Measuring low-value care in Medicare. JAMA Intern Med. 2014;174(7):1067-1076. https://doi.org/10.1001/jamainternmed.2014.1541
7. Oakes AH, Chang H-Y, Segal JB. Systemic overuse of health care in a commercially insured US population, 2010–2015. BMC Health Serv Res. 2019;19(1). https://doi.org/10.1186/s12913-019-4079-0
8. Schwartz AL, Zaslavsky AM, Landon BE, Chernew ME, McWilliams JM. Low-value service use in provider organizations. Health Serv Res. 2018;53(1):87-119. https://doi.org/10.1111/1475-6773.12597
9. Schwartz AL, Jena AB, Zaslavsky AM, McWilliams JM. Analysis of physician variation in provision of low-value services. JAMA Intern Med. 2019;179(1):16-25. https://doi.org/10.1001/jamainternmed.2018.5086
10. Bouck Z, Ferguson J, Ivers NM, et al. Physician characteristics associated with ordering 4 low-value screening tests in primary care. JAMA Netw Open. 2018;1(6):e183506. https://doi.org/10.1001/jamanetworkopen.2018.3506
11. Dartmouth Atlas Project. Data By Region - Dartmouth Atlas of Health Care. Accessed August 29, 2019. http://archive.dartmouthatlas.org/data/region/
12. ICD-9-CM Official Guidelines for Coding and Reporting (Effective October 11, 2011). Accessed March 1, 2018. https://www.cdc.gov/nchs/data/icd/icd9cm_guidelines_2011.pdf
13. Cassel CK, Guest JA. Choosing wisely - helping physicians and patients make smart decisions about their care. JAMA. 2012;307(17):1801-1802. https://doi.org/10.1001/jama.2012.476
14. The Dartmouth Atlas of Health Care. Accessed July 17, 2018. http://www.dartmouthatlas.org/
15. The Dartmouth Atlas of Healthcare. Research Methods. Accessed January 27, 2019. http://archive.dartmouthatlas.org/downloads/methods/research_methods.pdf
16. Centers for Medicare & Medicaid Services. Medicare geographic variation, public use file. Accessed January 5, 2020. https://www.cms.gov/Research-Statistics-Data-and-Systems/Statistics-Trends-and-Reports/Medicare-Geographic-Variation/GV_PUF
17. Centers for Medicare & Medicaid Services. Berenson-Eggers Type of Service (BETOS) codes. Accessed January 10, 2020. https://www.cms.gov/Research-Statistics-Data-and-Systems/Statistics-Trends-and-Reports/MedicareFeeforSvcPartsAB/downloads/betosdesccodes.pdf
18. Data.Medicare.gov. Payment and value of care – hospital: hospital compare. Accessed August 21, 2019. https://data.medicare.gov/Hospital-Compare/Payment-and-value-of-care-Hospital/c7us-v4mf
19. Moore BJ, White S, Washington R, Coenen N, Elixhauser A. Identifying increased risk of readmission and in-hospital mortality using hospital administrative data: the AHRQ Elixhauser comorbidity index. Med Care. 2017;55(7):698-705. https://doi.org/10.1097/mlr.0000000000000735
20. Tsugawa Y, Jha AK, Newhouse JP, Zaslavsky AM, Jena AB. Variation in physician spending and association with patient outcomes. JAMA Intern Med. 2017;177(5):675-682. https://doi.org/10.1001/jamainternmed.2017.0059
21. Safavi KC, Li S-X, Dharmarajan K, et al. Hospital variation in the use of noninvasive cardiac imaging and its association with downstream testing, interventions, and outcomes. JAMA Intern Med. 2014;174(4):546-553. https://doi.org/10.1001/jamainternmed.2013.14407
22. Douglas PS, Patel MR, Bailey SR, et al. Hospital variability in the rate of finding obstructive coronary artery disease at elective, diagnostic coronary angiography. J Am Coll Cardiol. 2011;58(8):801-809. https://doi.org/10.1016/j.jacc.2011.05.019
23. Venkatesh AK, Agha L, Abaluck J, Rothenberg C, Kabrhel C, Raja AS. Trends and variation in the utilization and diagnostic yield of chest imaging for Medicare patients with suspected pulmonary embolism in the emergency department. Am J Roentgenol. 2018;210(3):572-577. https://doi.org/10.2214/ajr.17.18586
24. Kline JA, Garrett JS, Sarmiento EJ, Strachan CC, Courtney DM. Over-testing for suspected pulmonary embolism in american emergency departments: the continuing epidemic. Circ Cardiovasc Qual Outcomes. 2020;13(1):e005753. https://doi.org/10.1161/circoutcomes.119.005753
25. Welch HG, Fisher ES. Income and cancer overdiagnosis – when too much care is harmful. N Engl J Med. 2017;376(23):2208-2209. https://doi.org/10.1056/nejmp1615069
26. Nicholson S. Physician specialty choice under uncertainty. J Labor Econ. 2002;20(4):816-847. https://doi.org/10.1086/342039
27. Chang R-KR, Halfon N. Geographic distribution of pediatricians in the United States: an analysis of the fifty states and Washington, DC. Pediatrics. 1997;100(2 pt 1):172-179. https://doi.org/10.1542/peds.100.2.172
28. Braithwaite J, Herkes J, Ludlow K, Lamprell G, Testa L. Association between organisational and workplace cultures, and patient outcomes: systematic review protocol. BMJ Open. 2016;6(12):e013758. https://doi.org/10.1136/bmjopen-2016-013758
29. Bhatia RS, Milford CE, Picard MH, Weiner RB. An educational intervention reduces the rate of inappropriate echocardiograms on an inpatient medical service. JACC Cardiovasc Imaging. 2013;6(5):545-555. https://doi.org/10.1016/j.jcmg.2013.01.010
30. Blackmore CC, Watt D, Sicuro PL. The success and failure of a radiology quality metric: the case of OP-10. J Am Coll Radiol. 2016;13(6):630-637. https://doi.org/10.1016/j.jacr.2016.01.006
31. Albertini JG, Wang P, Fahim C, et al. Evaluation of a peer-to-peer data transparency intervention for Mohs micrographic surgery overuse. JAMA Dermatol. 2019;155(8):906-913. https://dx.doi.org/10.1001%2Fjamadermatol.2019.1259
32. Sacarny A, Barnett ML, Le J, Tetkoski F, Yokum D, Agrawal S. Effect of peer comparison letters for high-volume primary care prescribers of quetiapine in older and disabled adults: a randomized clinical trial. JAMA Psychiatry. 2018;75(10):1003-1011. https://doi.org/10.1001/jamapsychiatry.2018.1867
© 2021 Society of Hospital Medicine
Gender-Based Discrimination and Sexual Harassment Among Academic Internal Medicine Hospitalists
Gender-based discrimination refers to “any distinction, exclusion or restriction made on the basis of socially constructed gender roles and norms which prevents a person from enjoying full human rights.”1 Similarly, sexual harassment encompasses a spectrum of sexual conduct that includes “unwelcome sexual advances, requests for sexual favors, and other verbal or physical harassment of a sexual nature,” as defined by the US Equal Employment Opportunity Commission.2 Gender-based discrimination and sexual harassment can be “overt,” which includes explicitly recognizable behaviors, or they can be “implicit,” which includes verbal and nonverbal behaviors that often go unrecognized but convey hostility, objectification, or exclusion of another person. Gender-based discrimination and sexual harassment are commonly described and likely more prevalent in academic settings.3-6 Female physicians are disproportionately affected by gender-based discrimination and sexual harassment, compared with their male peers.4,7
Female physicians face workplace harassment from both patients and coworkers. A study in Canada reported that more than 75% of female physicians experienced sexual harassment from their patients.8 A recent study showed almost half of the physicians who reported harassment, which was three times more often among female physicians, described other physician colleagues as perpetrators.9 In a study among clinician-researchers in the field of academic medicine, 30% of females reported having experienced sexual harassment, compared with 4% of males.7 Among females who reported harassment in this study, 47% stated that these experiences adversely affected their opportunities for career advancement. Career stage may also affect experiences or perceptions of gender-based discrimination and sexual harassment, with females in earlier career stages reporting a less favorable environment of gender equity.10
Hospital medicine is a young and evolving specialty, and the number of hospitalists has increased substantially from a few hundred at the time of inception to over 50,000 as of 2016.11 The proportion of female hospitalists increased from 31% in 2012 to 52% in 2014, reflecting equal gender representation in hospital medicine.12 Available evidence shows gender disparities exist in hospital medicine disproportionately affecting female hospitalists in their career advancement, including leadership and scholarship opportunities.13 However, there remains a knowledge gap regarding the prevalence of gender-based discrimination and sexual harassment experienced by hospitalists.
Our study examines the experiences of academic hospitalists regarding gender-based discrimination and sexual harassment and the impact of gender on career satisfaction and advancement.
METHODS
Study Design and Participants
An online survey was developed and approved by the institutional board review (IRB) at the Medical College of Wisconsin in Milwaukee. University-based academic centers with hospitalist programs, identified through personal connections, from across the continental United Stated were identified as potential study sites, and leaders at each institution were contacted to ascertain potential participation in the survey. The survey was distributed to Internal Medicine hospitalists at 18 participating academic institutions from January 2019 to June 2019. Participation was voluntary. The cover letter explained the purpose of the study and provided a link to the survey. To maintain anonymity, none of the questionnaires requested identifying information from participants. A web-based Qualtrics online-based survey platform was used.
Survey Elements
The survey aimed to assess several elements of gender-based discrimination and sexual harassment. All questions about these experiences distinguished encounters with patients from those with colleagues, and questions about occurrences either over a career or in the last 30 days were intended to capture both distant and recent timeframes. The theme for the questions for the survey was based on previous studies.4,7,8 The wording of questions was simplified to make them easily understandable, and the brevity of the survey was maintained to prevent possible nonresponses.14 Additional questions (mistaken for a healthcare provider other than a physician, feeling respected by patients and colleagues, referred to by terms such as “honey,” “dear,” “sweetheart,” “sugar,” or equivalent), which were deemed relevant in day-to-day clinical practice through consensus among study investigators and discussions among peer hospitalists, were incorporated into the final survey (Appendix). Survey questions were intended to capture several elements regarding interactions with patients and with colleagues or other healthcare providers (HCPs).
Questions on gender-based discrimination included:
- Has a patient [colleague or other healthcare provider] mistaken you for a healthcare provider other than a physician?
- Has a patient [colleague or other healthcare provider] asked you to do something not at your level of training?
- Do you feel respected? Do you perceive your gender has impacted opportunities for your career advancement?
Questions on sexual harassment included:
- Has a patient [colleague or other healthcare provider] touched you inappropriately, made sexual remarks or gestures, or made suggestive looks?
- Has a patient [colleague or other healthcare provider] referred to you by terms such as “honey,” “dear,” “sweetheart,” “sugar,” or equivalent?
In addition, the survey sought demographic information of the participants (age, gender, and race/ethnicity) and information about their individual institutions (names and locations) (Appendix). The geographical locations of the institutions were further categorized into four different regions according to the United States Census Bureau (Northwest, Midwest, South, and West). At the end of the survey, participants were given an opportunity to provide any additional comments.
Statistical Analysis
Standard descriptive summary statistics were used for demographic data. Associations between the variables were analyzed using chi-square test or Fischer’s exact test, as appropriate, for categorical variables and t test for continuous variables. The variations among institution-based responses were presented in the form of inter-quartile range (IQR). All tests were 2-sided, and P values less than .05 were considered statistically significant. All analyses were performed using IBM® SPSS® Statistics software version 24. Relevant responses representative of the overall respondents’ sentiments as provided under additional comment section were discussed and cited.
RESULTS
Eighteen different academic institutions across the United States participated in the study, with 336 individual responses. The majority of respondents were females (57%), in younger age categories (58% were 30-39 years old), Caucasian (59%), and early-career hospitalists (>50% working as hospitalists for ≤5 years) (Table 1). Regarding the overall geographic distribution, the largest number of responses were from the Midwest (n = 115; 35.6%) (Table 1 and Appendix).

Gender Discrimination
Interactions With Patients
Over their careers, 69% of hospitalists reported being mistaken for an HCP other than a physician by patients. This was more common among females than among males (99% vs 29%, respectively; P < .001) (Table 2). Almost half (48%) reported this had occurred in the last 30 days, more frequently by females (76% vs 10%; P < .001).

Of responding hospitalists, 96% stated that, over their careers, they have been asked by patients to do something they did not consider to be at their level of training (eg, help get food or water, help with a bed pan), with a higher prevalence of such experiences among females than males (99% vs 93%, respectively; P = .004) (Table 2). Most (71%) said they had experienced this in the last 30 days, which was again more frequently reported by females (78% vs 62%; P = .001).
The responses from female hospitalists regarding their career-long experiences of being mistaken for an HCP or asked to do something not at their level of training by their patients had both the highest number of positive responses across institutions (median of hospital proportions, 100%) and the least institutional variation since both had the narrowest IQR) (Table 2).
Interactions With Colleagues or Other HCPs
Among hospitalists responding to the survey, 46% felt that, over their careers, they had been mistaken for nonphysician HCPs by colleagues or other HCPs. This was more prevalent among females than among males (65% vs 20%; P < .001) (Table 2). Among respondents, 14% reported these events had occurred in the last 30 days, which was again more common among females (21% vs 5%; P < .001).
Over their careers, 26% of hospitalists reported they have been asked by a colleague or HCP to do something not at their level of training (eg, clean up the physician’s work room, make coffee, take notes in a meeting), with similar prevalence among females and males (29% vs 23%; P = .228). Ten percent reported these occurrences in the last 30 days, which was similar between females and males (12% vs 9%; P = .330).
Feelings of Respect and Opportunities for Career Advancement
When asked to rate the statement “I feel respected by patients” on a 5-point Likert scale, female hospitalists overall scored significantly lower as compared with their male counterparts (mean score, 3.73 vs 4.04; P < .001) (Table 3); this was also true when asked about feelings of respect by physicians (mean score, 3.84 vs 4.15; P < .001). Female hospitalists were more likely than males to report that their gender has more negatively impacted their opportunities for career advancement (mean score, 2.73 vs 3.34; P < .001).

Sexual Harassment
Interactions With Patients
Over half (57%) of hospitalists reported career-long experiences of patient(s) touching them inappropriately, making sexual remarks or gestures, or making suggestive looks. These experiences were more prevalent among females than among males (72% vs 36%, respectively; P < .001) (Table 2). Fifteen percent said they had such experience in rhe last 30 days, which was also more common among females (22% vs 6%; P < .001).
Most hospitalists (84%) reported that patients have referred to them by inappropriately familiar terms such as “honey,” “dear,” “sweetheart,” “sugar,” or equivalent over their careers, with females more frequently reporting these behaviors (95% vs 68%; P < .001). Experiencing this during the last 30 days was reported by 48%, which was again more common among females (68% vs 23%; P < .001).
Interactions With Colleagues or Other HCPs
Within their careers, 15% of hospitalists reported at least one experience of a colleague or HCP touching them inappropriately or making sexual remarks, gestures, or suggestive looks. This was more prevalent for females than males (18% vs 10%, respectively; P = .033). Only 2% of both females and males reported these experiences in the last 30 days (2% vs 2%; P = .981).
Almost one-third of participants (32%) affirmed that another HCP has referred to them by terms such as “honey,” “dear,” “sweetheart,” “sugar,” or equivalent in their career, with a higher proportion of females than males reporting these events (39% vs 23%; P = .002) (Table 2). Experiencing this during the last 30 days was reported by 10%, which was similar between females and males (12% vs 7%; P = .112).
Additional Comments From Respondents
- “Throughout my training and now into my professional career, there are nearly weekly incidents of elderly male patients referring to me as “honey/dear/sweetie” or even by my first name, even though I introduce myself as their physician and politely correct them. They will often refer to me as a nurse and ask me to do something not at my level of training. Sometimes even despite correcting the patient, they continue to refer to me as such. Throughout the years, other female MDs and I have discussed that this is ‘status quo’ for female physicians and observe that this is not an experience that male MDs share.”
- “I frequently round with a male nurse practitioner and the patients almost always, despite introducing ourselves and our roles, turn to him and ask him questions instead of addressing them to me.”
- “Our institution allows female faculty to be interviewed about childcare, household labor division, plans for pregnancy. One professor asks women private details about their private relationships such as what they do with spouse on date night or weekends away.”
- “It’s hard to answer questions related to my level of training. I don’t think it’s unreasonable for people to ask me to do things, no matter my level of training. . . . I don’t think being a doctor means that I am above this, or that it is inappropriate to be asked to do this.”
DISCUSSION
This survey demonstrated that gender-based discrimination and sexual harassment in the academic hospitalist healthcare environment are common, both in more distant and recent time frames. Notably, these experiences are shared by female and male physicians in interactions with both patients and colleagues, though male hospitalists report most of these experiences at significantly lower frequencies than females. These results support past work showing that female physicians are significantly more likely to be subjected to gender-based discrimination and sexual harassment, but also challenges the perception that gender-based discrimination and sexual harassment are uniquely experienced by females.
A startling number of females and males in the study reported sexual harassment (inappropriate touching, remarks, gestures, and looks) when interacting with patients throughout their careers and in last 30 days. Many males and females reported that patients had referred to them with inappropriately familiar, and potentially demeaning, terms of endearment. For both overt and implicit sexual harassment, females were significantly more likely than males to report experiencing these behaviors when interacting with patients. Although some of these experiences may seem less harmful than others, a meta-analysis demonstrated that frequent, less intense experiences of gender-based discrimination and sexual harassment have a similar impact on female’s well-being as do less frequent, more intense experiences.15 Although the person using the terms of endearment like “honey,” “sugar,” or “sweetheart” may feel the terms are harmless, such expressions can be inappropriate and constitute sexual harassment according to the U.S. Department of the Interior’s Office of Civil Rights.16 The Sexual Harassment/Assault Response and Prevention Program (SHARP) also classifies such terms into verbal categories of sexual harrassment.17
Of female physicians surveyed, 99% reported that they had been mistaken for HCPs other than physicians by their patients over their careers. Although this was also reported by male physicians, the experience was 3.4 times as likely for female physicians. Misidentification by patients may represent a disconnect between the growing female representation in the physician workforce and patients’ conceptions of the traditional image of a physician.
In parallel with this finding of misidentification, an interesting area of the study was the question regarding being asked to do “something not at your level of training.” A recurring theme in the comments was a rejection of the notion that certain tasks were “beneath a level of training,” suggesting a common view that acts of caregiving are not bounded by hierarchy. Analysis of qualitative responses showed that 40% of these responses had comments regarding this question. An example was “It’s hard to answer questions related to my level of training. . . . I don’t think being a doctor means that I am above this, or that it is inappropriate to be asked to do this.” Notably, however, a larger number of female than male physicians responded yes to this question in both study time frames. This points to a differential in how female physicians are viewed by patients, both in frequent misidentification and in behaviors more frequently asked of female physicians than their male counterparts. Given the comments, it may also suggest a difference in how female and male physicians perceive the fluidity of bounds on their care-taking roles set by their “level of training.”
A large number of study participants were early-career hospitalists, which may in part explain some of the study results. In a previous study of gender equity in an Internal Medicine department, physicians practicing medicine for more than 15 years perceived the departmental culture as more favorable than physicians with shorter careers.10 Additionally, the perception of cultures was most discordant between senior male physicians and junior female physicians.10 Because many hospitalists are early-career physicians, they may have trained in an environment that had heightened awareness surrounding gender-based discrimination and sexual harassment, which affects the overall study results.
Multiple qualitative comments, mentioned above, were submitted by participants describing their experiences in all categories. Such comments paint a picture of insidious bias and cultural norms affecting the quality of female physicians’ work lives.
Two questions focused on career satisfaction and the sense of respect from patients and colleagues. In both responses, there was a statistically different response between males and females, with females less likely to report that they felt respected and that their gender adversely impacted their opportunities for career advancement. This is disturbing information and warrants more investigation.
The reasons for the observed prevalence of gender-based discrimination and sexual harassment in this broad survey of academic hospitalists are uncertain. Multiple studies to date have demonstrated that gender-based discrimination and sexual harassment have historically existed in medicine and continue to even today. Unlike physicians with long-term relationships with patients, hospitalists may face more exposure due to a lack of long-term continuity with patients. The absence of an established trust in the relationship also may make them more vulnerable to inappropriate behaviors when interacting with patients. Hospital medicine, however, is a young specialty with equal gender representation and should be at the forefront of addressing and solving these issues of gender-based discrimination and sexual harassment.
The survey had a good distribution between female and male participants. Additionally, the survey reflected the general distribution of the national hospitalist workforce in gender, age, and ethnic/racial distribution, as well as number of years in practice.12 The study surveyed respondents regarding experiences in both long- and short-term time frames, as well as experiences with patients and colleagues.
Our study reflects a cross-sectional snapshot of hospitalists’ perceptions with no longitudinal follow-up. Since the survey was limited to academic medical centers, it may not reflect experiences in community/private practice settings. The small number of participants limited the ability to perform subgroup analyses by age, race, or years in practice, which may play a role in interactions with patients and colleagues. Since the number of respondents varied greatly by institution, a minority of institutions could have influenced some of the findings. Narrow IQRs of the hospital proportions as shown in Table 2 would suggest similar responses across institutions, whereas wide IQRs would suggest that a smaller number of institutions were possibly driving the findings. Because of the survey distribution method, it is unknown how many physicians received the survey and a response rate could not be calculated. Further, selection, recall, and detection biases cannot be ruled out.
CONCLUSION
This survey shows that gender-based discrimination and sexual harassment in the academic hospitalist healthcare environment are common and more frequently experienced by female physicians, both in interactions with patients and colleagues. Our study highlights the need to address this prevalent issue among academic hospitalists.
1. WHO Department of Reproductive Health and Research. Transforming health systems: gender and rights in reproductive health. A training manual for health managers. World Health Organization; 2001. https://www.who.int/reproductivehealth/publications/gender_rights/RHR_01_29/en/
2. Sexual Harassment. U.S. Equal Employment Opportunity Commission. Accessed Jan 5, 2020. https://www.eeoc.gov/laws/types/sexual_harassment.cfm
3. Frank E, Brogan D, Schiffman M. Prevalence and correlates of harassment among US women physicians. Arch Intern Med. 1998;158(4):352-358. https://doi.org/10.1001/archinte.158.4.352
4. Carr PL, Ash AS, Friedman RH, et al. Faculty perceptions of gender discrimination and sexual harassment in academic medicine. Ann Intern Med. 2000;132(11):889-96. https://doi.org/10.7326/0003-4819-132-11-200006060-00007
5. Bates CK, Jagsi R, Gordon LK, et al. It is time for zero tolerance for sexual harassment in academic medicine. Acad Med. 2018;93(2):163-165. https://doi.org/10.1097/acm.0000000000002050
6. Dzau VJ, Johnson PA. Ending sexual harassment in academic medicine. N Engl J Med. 2018;379(17):1589-1591. https://doi.org/10.1056/nejmp1809846
7. Jagsi R, Griffith KA, Jones R, Perumalswami CR, Ubel P, Stewart A. Sexual harassment and discrimination experiences of academic medical faculty. JAMA. 2016;315(19):2120-2121. https://doi.org/10.1001/jama.2016.2188
8. Phillips SP, Schneider MS. Sexual harassment of female doctors by patients. N Engl J Med. 1993;329(26):1936-1939. https://doi.org/10.1056/nejm199312233292607
9. Kane L. Sexual Harassment of Physicians: Report 2018. Medscape. June 13, 2018. Accessed Jan 24, 2020. https://www.medscape.com/slideshow/sexual-harassment-of-physicians-6010304
10. Ruzycki SM, Freeman G, Bharwani A, Brown A. Association of physician characteristics with perceptions and experiences of gender equity in an academic internal medicine department. JAMA Netw Open. 2019;2(11):e1915165. https://doi.org/10.1001/jamanetworkopen.2019.15165
11. Wachter RM, Goldman L. Zero to 50,000 - the 20th anniversary of the hospitalist. N Engl J Med. 2016;375(11):1009-1011. https://doi.org/10.1056/nejmp1607958
12. Miller CS, Fogerty RL, Gann J, Bruti CP, Klein R; The Society of General Internal Medicine Membership Committee. The growth of hospitalists and the future of the society of general internal medicine: results from the 2014 membership survey. J Gen Intern Med. 2017;32(11):1179-1185. https://doi.org/10.1007/s11606-017-4126-7
13. Burden M, Frank MG, Keniston A, et al. Gender disparities in leadership and scholarly productivity of academic hospitalists. J Hosp Med. 2015;10(8):481-485. https://doi.org/10.1002/jhm.2340
14. Sahlqvist S, Song Y, Bull F, Adams E, Preston J, Ogilvie D; iConnect consortium. Effect of questionnaire length, personalisation and reminder type on response rate to a complex postal survey: randomised controlled trial. BMC Med Res Methodol. 2011;11:62. https://doi.org/10.1186/1471-2288-11-62
15 Sojo VE, Wood RE, Genat AE. Harmful Workplace Experiences and Women’s Occupational Well-Being: A Meta-Analysis. Psychol Women Q. 2016;40(1):10-40. https://doi.org/10.1177/0361684315599346
16. Office of Civil Rights: Sexual Harassment. U.S. Department of the Interior. Accessed April 20, 2020. https://www.doi.gov/pmb/eeo/Sexual-Harassment
17. Sexual Harassment: Categories of Sexual Harassment. Sexual Harassment/Assault Response and Prevention Program (SHARP). Accessed April 20, 2020. https://www.sexualassault.army.mil/categories_of_harassment.aspx
Gender-based discrimination refers to “any distinction, exclusion or restriction made on the basis of socially constructed gender roles and norms which prevents a person from enjoying full human rights.”1 Similarly, sexual harassment encompasses a spectrum of sexual conduct that includes “unwelcome sexual advances, requests for sexual favors, and other verbal or physical harassment of a sexual nature,” as defined by the US Equal Employment Opportunity Commission.2 Gender-based discrimination and sexual harassment can be “overt,” which includes explicitly recognizable behaviors, or they can be “implicit,” which includes verbal and nonverbal behaviors that often go unrecognized but convey hostility, objectification, or exclusion of another person. Gender-based discrimination and sexual harassment are commonly described and likely more prevalent in academic settings.3-6 Female physicians are disproportionately affected by gender-based discrimination and sexual harassment, compared with their male peers.4,7
Female physicians face workplace harassment from both patients and coworkers. A study in Canada reported that more than 75% of female physicians experienced sexual harassment from their patients.8 A recent study showed almost half of the physicians who reported harassment, which was three times more often among female physicians, described other physician colleagues as perpetrators.9 In a study among clinician-researchers in the field of academic medicine, 30% of females reported having experienced sexual harassment, compared with 4% of males.7 Among females who reported harassment in this study, 47% stated that these experiences adversely affected their opportunities for career advancement. Career stage may also affect experiences or perceptions of gender-based discrimination and sexual harassment, with females in earlier career stages reporting a less favorable environment of gender equity.10
Hospital medicine is a young and evolving specialty, and the number of hospitalists has increased substantially from a few hundred at the time of inception to over 50,000 as of 2016.11 The proportion of female hospitalists increased from 31% in 2012 to 52% in 2014, reflecting equal gender representation in hospital medicine.12 Available evidence shows gender disparities exist in hospital medicine disproportionately affecting female hospitalists in their career advancement, including leadership and scholarship opportunities.13 However, there remains a knowledge gap regarding the prevalence of gender-based discrimination and sexual harassment experienced by hospitalists.
Our study examines the experiences of academic hospitalists regarding gender-based discrimination and sexual harassment and the impact of gender on career satisfaction and advancement.
METHODS
Study Design and Participants
An online survey was developed and approved by the institutional board review (IRB) at the Medical College of Wisconsin in Milwaukee. University-based academic centers with hospitalist programs, identified through personal connections, from across the continental United Stated were identified as potential study sites, and leaders at each institution were contacted to ascertain potential participation in the survey. The survey was distributed to Internal Medicine hospitalists at 18 participating academic institutions from January 2019 to June 2019. Participation was voluntary. The cover letter explained the purpose of the study and provided a link to the survey. To maintain anonymity, none of the questionnaires requested identifying information from participants. A web-based Qualtrics online-based survey platform was used.
Survey Elements
The survey aimed to assess several elements of gender-based discrimination and sexual harassment. All questions about these experiences distinguished encounters with patients from those with colleagues, and questions about occurrences either over a career or in the last 30 days were intended to capture both distant and recent timeframes. The theme for the questions for the survey was based on previous studies.4,7,8 The wording of questions was simplified to make them easily understandable, and the brevity of the survey was maintained to prevent possible nonresponses.14 Additional questions (mistaken for a healthcare provider other than a physician, feeling respected by patients and colleagues, referred to by terms such as “honey,” “dear,” “sweetheart,” “sugar,” or equivalent), which were deemed relevant in day-to-day clinical practice through consensus among study investigators and discussions among peer hospitalists, were incorporated into the final survey (Appendix). Survey questions were intended to capture several elements regarding interactions with patients and with colleagues or other healthcare providers (HCPs).
Questions on gender-based discrimination included:
- Has a patient [colleague or other healthcare provider] mistaken you for a healthcare provider other than a physician?
- Has a patient [colleague or other healthcare provider] asked you to do something not at your level of training?
- Do you feel respected? Do you perceive your gender has impacted opportunities for your career advancement?
Questions on sexual harassment included:
- Has a patient [colleague or other healthcare provider] touched you inappropriately, made sexual remarks or gestures, or made suggestive looks?
- Has a patient [colleague or other healthcare provider] referred to you by terms such as “honey,” “dear,” “sweetheart,” “sugar,” or equivalent?
In addition, the survey sought demographic information of the participants (age, gender, and race/ethnicity) and information about their individual institutions (names and locations) (Appendix). The geographical locations of the institutions were further categorized into four different regions according to the United States Census Bureau (Northwest, Midwest, South, and West). At the end of the survey, participants were given an opportunity to provide any additional comments.
Statistical Analysis
Standard descriptive summary statistics were used for demographic data. Associations between the variables were analyzed using chi-square test or Fischer’s exact test, as appropriate, for categorical variables and t test for continuous variables. The variations among institution-based responses were presented in the form of inter-quartile range (IQR). All tests were 2-sided, and P values less than .05 were considered statistically significant. All analyses were performed using IBM® SPSS® Statistics software version 24. Relevant responses representative of the overall respondents’ sentiments as provided under additional comment section were discussed and cited.
RESULTS
Eighteen different academic institutions across the United States participated in the study, with 336 individual responses. The majority of respondents were females (57%), in younger age categories (58% were 30-39 years old), Caucasian (59%), and early-career hospitalists (>50% working as hospitalists for ≤5 years) (Table 1). Regarding the overall geographic distribution, the largest number of responses were from the Midwest (n = 115; 35.6%) (Table 1 and Appendix).
Gender Discrimination
Interactions With Patients
Over their careers, 69% of hospitalists reported being mistaken for an HCP other than a physician by patients. This was more common among females than among males (99% vs 29%, respectively; P < .001) (Table 2). Almost half (48%) reported this had occurred in the last 30 days, more frequently by females (76% vs 10%; P < .001).
Of responding hospitalists, 96% stated that, over their careers, they have been asked by patients to do something they did not consider to be at their level of training (eg, help get food or water, help with a bed pan), with a higher prevalence of such experiences among females than males (99% vs 93%, respectively; P = .004) (Table 2). Most (71%) said they had experienced this in the last 30 days, which was again more frequently reported by females (78% vs 62%; P = .001).
The responses from female hospitalists regarding their career-long experiences of being mistaken for an HCP or asked to do something not at their level of training by their patients had both the highest number of positive responses across institutions (median of hospital proportions, 100%) and the least institutional variation since both had the narrowest IQR) (Table 2).
Interactions With Colleagues or Other HCPs
Among hospitalists responding to the survey, 46% felt that, over their careers, they had been mistaken for nonphysician HCPs by colleagues or other HCPs. This was more prevalent among females than among males (65% vs 20%; P < .001) (Table 2). Among respondents, 14% reported these events had occurred in the last 30 days, which was again more common among females (21% vs 5%; P < .001).
Over their careers, 26% of hospitalists reported they have been asked by a colleague or HCP to do something not at their level of training (eg, clean up the physician’s work room, make coffee, take notes in a meeting), with similar prevalence among females and males (29% vs 23%; P = .228). Ten percent reported these occurrences in the last 30 days, which was similar between females and males (12% vs 9%; P = .330).
Feelings of Respect and Opportunities for Career Advancement
When asked to rate the statement “I feel respected by patients” on a 5-point Likert scale, female hospitalists overall scored significantly lower as compared with their male counterparts (mean score, 3.73 vs 4.04; P < .001) (Table 3); this was also true when asked about feelings of respect by physicians (mean score, 3.84 vs 4.15; P < .001). Female hospitalists were more likely than males to report that their gender has more negatively impacted their opportunities for career advancement (mean score, 2.73 vs 3.34; P < .001).
Sexual Harassment
Interactions With Patients
Over half (57%) of hospitalists reported career-long experiences of patient(s) touching them inappropriately, making sexual remarks or gestures, or making suggestive looks. These experiences were more prevalent among females than among males (72% vs 36%, respectively; P < .001) (Table 2). Fifteen percent said they had such experience in rhe last 30 days, which was also more common among females (22% vs 6%; P < .001).
Most hospitalists (84%) reported that patients have referred to them by inappropriately familiar terms such as “honey,” “dear,” “sweetheart,” “sugar,” or equivalent over their careers, with females more frequently reporting these behaviors (95% vs 68%; P < .001). Experiencing this during the last 30 days was reported by 48%, which was again more common among females (68% vs 23%; P < .001).
Interactions With Colleagues or Other HCPs
Within their careers, 15% of hospitalists reported at least one experience of a colleague or HCP touching them inappropriately or making sexual remarks, gestures, or suggestive looks. This was more prevalent for females than males (18% vs 10%, respectively; P = .033). Only 2% of both females and males reported these experiences in the last 30 days (2% vs 2%; P = .981).
Almost one-third of participants (32%) affirmed that another HCP has referred to them by terms such as “honey,” “dear,” “sweetheart,” “sugar,” or equivalent in their career, with a higher proportion of females than males reporting these events (39% vs 23%; P = .002) (Table 2). Experiencing this during the last 30 days was reported by 10%, which was similar between females and males (12% vs 7%; P = .112).
Additional Comments From Respondents
- “Throughout my training and now into my professional career, there are nearly weekly incidents of elderly male patients referring to me as “honey/dear/sweetie” or even by my first name, even though I introduce myself as their physician and politely correct them. They will often refer to me as a nurse and ask me to do something not at my level of training. Sometimes even despite correcting the patient, they continue to refer to me as such. Throughout the years, other female MDs and I have discussed that this is ‘status quo’ for female physicians and observe that this is not an experience that male MDs share.”
- “I frequently round with a male nurse practitioner and the patients almost always, despite introducing ourselves and our roles, turn to him and ask him questions instead of addressing them to me.”
- “Our institution allows female faculty to be interviewed about childcare, household labor division, plans for pregnancy. One professor asks women private details about their private relationships such as what they do with spouse on date night or weekends away.”
- “It’s hard to answer questions related to my level of training. I don’t think it’s unreasonable for people to ask me to do things, no matter my level of training. . . . I don’t think being a doctor means that I am above this, or that it is inappropriate to be asked to do this.”
DISCUSSION
This survey demonstrated that gender-based discrimination and sexual harassment in the academic hospitalist healthcare environment are common, both in more distant and recent time frames. Notably, these experiences are shared by female and male physicians in interactions with both patients and colleagues, though male hospitalists report most of these experiences at significantly lower frequencies than females. These results support past work showing that female physicians are significantly more likely to be subjected to gender-based discrimination and sexual harassment, but also challenges the perception that gender-based discrimination and sexual harassment are uniquely experienced by females.
A startling number of females and males in the study reported sexual harassment (inappropriate touching, remarks, gestures, and looks) when interacting with patients throughout their careers and in last 30 days. Many males and females reported that patients had referred to them with inappropriately familiar, and potentially demeaning, terms of endearment. For both overt and implicit sexual harassment, females were significantly more likely than males to report experiencing these behaviors when interacting with patients. Although some of these experiences may seem less harmful than others, a meta-analysis demonstrated that frequent, less intense experiences of gender-based discrimination and sexual harassment have a similar impact on female’s well-being as do less frequent, more intense experiences.15 Although the person using the terms of endearment like “honey,” “sugar,” or “sweetheart” may feel the terms are harmless, such expressions can be inappropriate and constitute sexual harassment according to the U.S. Department of the Interior’s Office of Civil Rights.16 The Sexual Harassment/Assault Response and Prevention Program (SHARP) also classifies such terms into verbal categories of sexual harrassment.17
Of female physicians surveyed, 99% reported that they had been mistaken for HCPs other than physicians by their patients over their careers. Although this was also reported by male physicians, the experience was 3.4 times as likely for female physicians. Misidentification by patients may represent a disconnect between the growing female representation in the physician workforce and patients’ conceptions of the traditional image of a physician.
In parallel with this finding of misidentification, an interesting area of the study was the question regarding being asked to do “something not at your level of training.” A recurring theme in the comments was a rejection of the notion that certain tasks were “beneath a level of training,” suggesting a common view that acts of caregiving are not bounded by hierarchy. Analysis of qualitative responses showed that 40% of these responses had comments regarding this question. An example was “It’s hard to answer questions related to my level of training. . . . I don’t think being a doctor means that I am above this, or that it is inappropriate to be asked to do this.” Notably, however, a larger number of female than male physicians responded yes to this question in both study time frames. This points to a differential in how female physicians are viewed by patients, both in frequent misidentification and in behaviors more frequently asked of female physicians than their male counterparts. Given the comments, it may also suggest a difference in how female and male physicians perceive the fluidity of bounds on their care-taking roles set by their “level of training.”
A large number of study participants were early-career hospitalists, which may in part explain some of the study results. In a previous study of gender equity in an Internal Medicine department, physicians practicing medicine for more than 15 years perceived the departmental culture as more favorable than physicians with shorter careers.10 Additionally, the perception of cultures was most discordant between senior male physicians and junior female physicians.10 Because many hospitalists are early-career physicians, they may have trained in an environment that had heightened awareness surrounding gender-based discrimination and sexual harassment, which affects the overall study results.
Multiple qualitative comments, mentioned above, were submitted by participants describing their experiences in all categories. Such comments paint a picture of insidious bias and cultural norms affecting the quality of female physicians’ work lives.
Two questions focused on career satisfaction and the sense of respect from patients and colleagues. In both responses, there was a statistically different response between males and females, with females less likely to report that they felt respected and that their gender adversely impacted their opportunities for career advancement. This is disturbing information and warrants more investigation.
The reasons for the observed prevalence of gender-based discrimination and sexual harassment in this broad survey of academic hospitalists are uncertain. Multiple studies to date have demonstrated that gender-based discrimination and sexual harassment have historically existed in medicine and continue to even today. Unlike physicians with long-term relationships with patients, hospitalists may face more exposure due to a lack of long-term continuity with patients. The absence of an established trust in the relationship also may make them more vulnerable to inappropriate behaviors when interacting with patients. Hospital medicine, however, is a young specialty with equal gender representation and should be at the forefront of addressing and solving these issues of gender-based discrimination and sexual harassment.
The survey had a good distribution between female and male participants. Additionally, the survey reflected the general distribution of the national hospitalist workforce in gender, age, and ethnic/racial distribution, as well as number of years in practice.12 The study surveyed respondents regarding experiences in both long- and short-term time frames, as well as experiences with patients and colleagues.
Our study reflects a cross-sectional snapshot of hospitalists’ perceptions with no longitudinal follow-up. Since the survey was limited to academic medical centers, it may not reflect experiences in community/private practice settings. The small number of participants limited the ability to perform subgroup analyses by age, race, or years in practice, which may play a role in interactions with patients and colleagues. Since the number of respondents varied greatly by institution, a minority of institutions could have influenced some of the findings. Narrow IQRs of the hospital proportions as shown in Table 2 would suggest similar responses across institutions, whereas wide IQRs would suggest that a smaller number of institutions were possibly driving the findings. Because of the survey distribution method, it is unknown how many physicians received the survey and a response rate could not be calculated. Further, selection, recall, and detection biases cannot be ruled out.
CONCLUSION
This survey shows that gender-based discrimination and sexual harassment in the academic hospitalist healthcare environment are common and more frequently experienced by female physicians, both in interactions with patients and colleagues. Our study highlights the need to address this prevalent issue among academic hospitalists.
1. WHO Department of Reproductive Health and Research. Transforming health systems: gender and rights in reproductive health. A training manual for health managers. World Health Organization; 2001. https://www.who.int/reproductivehealth/publications/gender_rights/RHR_01_29/en/
2. Sexual Harassment. U.S. Equal Employment Opportunity Commission. Accessed Jan 5, 2020. https://www.eeoc.gov/laws/types/sexual_harassment.cfm
3. Frank E, Brogan D, Schiffman M. Prevalence and correlates of harassment among US women physicians. Arch Intern Med. 1998;158(4):352-358. https://doi.org/10.1001/archinte.158.4.352
4. Carr PL, Ash AS, Friedman RH, et al. Faculty perceptions of gender discrimination and sexual harassment in academic medicine. Ann Intern Med. 2000;132(11):889-96. https://doi.org/10.7326/0003-4819-132-11-200006060-00007
5. Bates CK, Jagsi R, Gordon LK, et al. It is time for zero tolerance for sexual harassment in academic medicine. Acad Med. 2018;93(2):163-165. https://doi.org/10.1097/acm.0000000000002050
6. Dzau VJ, Johnson PA. Ending sexual harassment in academic medicine. N Engl J Med. 2018;379(17):1589-1591. https://doi.org/10.1056/nejmp1809846
7. Jagsi R, Griffith KA, Jones R, Perumalswami CR, Ubel P, Stewart A. Sexual harassment and discrimination experiences of academic medical faculty. JAMA. 2016;315(19):2120-2121. https://doi.org/10.1001/jama.2016.2188
8. Phillips SP, Schneider MS. Sexual harassment of female doctors by patients. N Engl J Med. 1993;329(26):1936-1939. https://doi.org/10.1056/nejm199312233292607
9. Kane L. Sexual Harassment of Physicians: Report 2018. Medscape. June 13, 2018. Accessed Jan 24, 2020. https://www.medscape.com/slideshow/sexual-harassment-of-physicians-6010304
10. Ruzycki SM, Freeman G, Bharwani A, Brown A. Association of physician characteristics with perceptions and experiences of gender equity in an academic internal medicine department. JAMA Netw Open. 2019;2(11):e1915165. https://doi.org/10.1001/jamanetworkopen.2019.15165
11. Wachter RM, Goldman L. Zero to 50,000 - the 20th anniversary of the hospitalist. N Engl J Med. 2016;375(11):1009-1011. https://doi.org/10.1056/nejmp1607958
12. Miller CS, Fogerty RL, Gann J, Bruti CP, Klein R; The Society of General Internal Medicine Membership Committee. The growth of hospitalists and the future of the society of general internal medicine: results from the 2014 membership survey. J Gen Intern Med. 2017;32(11):1179-1185. https://doi.org/10.1007/s11606-017-4126-7
13. Burden M, Frank MG, Keniston A, et al. Gender disparities in leadership and scholarly productivity of academic hospitalists. J Hosp Med. 2015;10(8):481-485. https://doi.org/10.1002/jhm.2340
14. Sahlqvist S, Song Y, Bull F, Adams E, Preston J, Ogilvie D; iConnect consortium. Effect of questionnaire length, personalisation and reminder type on response rate to a complex postal survey: randomised controlled trial. BMC Med Res Methodol. 2011;11:62. https://doi.org/10.1186/1471-2288-11-62
15 Sojo VE, Wood RE, Genat AE. Harmful Workplace Experiences and Women’s Occupational Well-Being: A Meta-Analysis. Psychol Women Q. 2016;40(1):10-40. https://doi.org/10.1177/0361684315599346
16. Office of Civil Rights: Sexual Harassment. U.S. Department of the Interior. Accessed April 20, 2020. https://www.doi.gov/pmb/eeo/Sexual-Harassment
17. Sexual Harassment: Categories of Sexual Harassment. Sexual Harassment/Assault Response and Prevention Program (SHARP). Accessed April 20, 2020. https://www.sexualassault.army.mil/categories_of_harassment.aspx
© 2021 Society of Hospital Medicine
Liquid Biopsies in a Veteran Patient Population With Advanced Prostate and Lung Non-Small Cell Carcinomas: A New Paradigm and Unique Challenge in Personalized Medicine
The advent of liquid biopsies targeting genetic mutations in solid tumors is a major milestone in the field of precision oncology.1 Conventional methods of obtaining tissue for molecular studies are limited by sample size and often do not represent the entire bulk of the tumor.2 This newer minimally invasive, revolutionary technique analyzes circulating cell-free DNA carrying tumor-specific alterations (circulating tumor DNA [ctDNA]) in peripheral blood and detects signature genomic alterations.1 Tp53 mutations have been reported in 25 to 40% of prostatic cancers and > 50% of non-small cell lung cancers (NSCLC), being more common in late-stage and hormone refractory prostate cancers.3,4 Tp53 mutation has been found to be associated with poor prognosis and increased germline mutations.5
The veteran patient population has distinct demographic characteristics that make veterans more vulnerable to genetic mutations and malignancies, including risk of exposure to Agent Orange, smoking, substance abuse, and asbestos. This area is understudied and extremely sparse in the literature for frequency of genetic mutations, risk factors in solid malignancies occurring in the veteran patient population, and the clinical impact of these risk factors. We herein present a quality assurance study for the utility of liquid biopsies regarding the frequency of DNA damage repair (DDR) gene, Tp53, and androgen receptor (AR) mutations. The clinical impact in advanced lung and prostate cancers in the veteran patient population and frequency are the quality assurance observations that are the study endpoints.
Methods
We reviewed for quality assurance documentation from the Foundation Medicine (www.foundationmedicine.com) cancer biomarker tests on liquid biopsies performed at the Corporal Michael J. Crescenz Veteran Affairs Medical Center in Philadelphia, Pennsylvania from May 2019 to April 15, 2020. All biopsies were performed on cancers with biochemical, imaging or tissue evidence of advanced tumor progression. The testing was performed on advanced solid malignancies, including NSCLC, prostate adenocarcinoma, and metastatic colon cancer. Statistical data for adequacy; cases with notable mutations; frequency; and type of mutations of AR, DDR, and Tp53 were noted. General and specific risk factors associated with the veteran patient population were studied and matched with the type of mutations (Table 1).
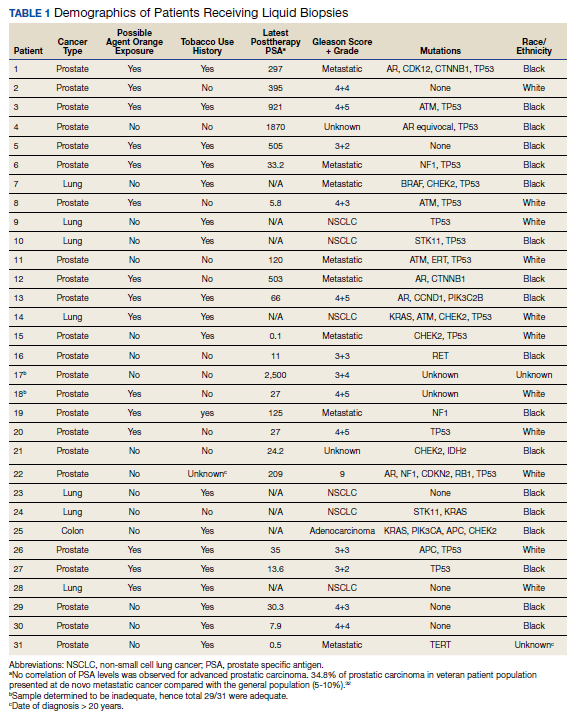
Results
Thirty-one liquid biopsies were performed over this period—23 for prostate cancer, 7 for patients with lung cancer patients, and 1 for a patient with colon cancer. Of 31 cases, sensitivity/adequacy of liquid biopsy for genetic mutation was detected in 29 (93.5%) cases (Figure 1). Two inadequate biopsies (both from patients with prostate cancer) were excluded from the study, leaving 29 liquid biopsies with adequate ctDNA for analysis that were considered for further statistical purpose—21 prostate, 7 lung, and 1 colon cancer.
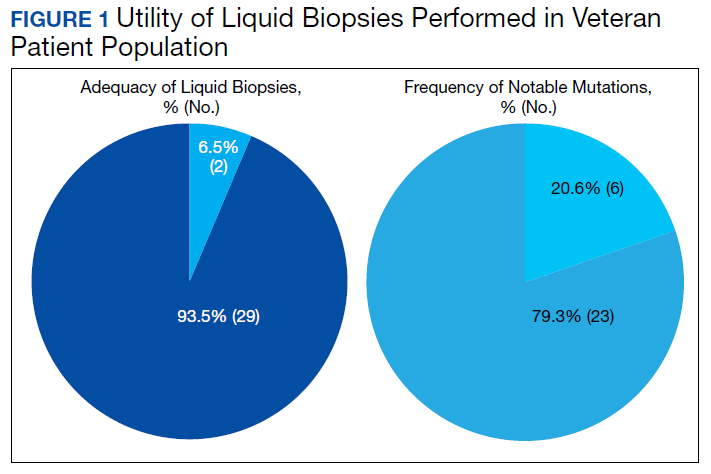
Multiple (common and different) genetic mutations were identified; however, our study subcategorized the mutations into the those that were related to prostate cancer, lung cancer, and some common mutations that occur in both cancers. Only the significant ones will be discussed in this review and equivocal result for AR is excluded from this study. Of the 21 prostate cancers, 4 (19.0%) had directed the targeted therapy to driver mutation (AR being most common in prostate cancer), while KRAS mutation, which was more common in lung cancer, was detected in 2/7 (28.6%) lung cancers. Mutations common to both cancer types were DDR gene mutations, which is a broad name for numerous genes including CDK12, ATM, and CHEK2.
Of all cases irrespective of the cancer type, 23/29 (79.3%) showed notable mutations. DDR gene mutations were found in 6 of 21 (28.5%) patients with prostate cancer and 8 of 23 (34.7%) patients with advanced prostate and lung cancers, indicating poor outcome and possible resistance to the current therapy. Of 23 patients showing mutations irrespective of the cancer type, 15 (65.2%) harbored Tp53 mutations, which is much more frequent in veteran patient population when compared with the literature. Fifteen of the 31 (48.4%) total patients were Vietnam War-era veterans who were potentially exposed to Agent Orange and 20 (64.5%) patients who were not Vietnam War-era veterans had a history that included smoking (Figure 2).
Discussion
The veteran patient population is a unique cohort due to its distinct demographic characteristics with a high volume of cancer cases diagnosed each year. According to data from VA Central Cancer Registry (VACCR), the most frequently diagnosed cancers are prostate (29%) and lung (18%).6
Liquid biopsy is a novel, promising technology that uses ctDNA and circulating tumor cells in peripheral blood for detecting genetic alterations through next generation sequencing.7-9 The advent of this minimally invasive, revolutionary technology has been a breakthrough in the field of precision oncology for prognosis, to monitor treatment response or resistance to therapy and further personalize cancer therapy.9,10
Comprehensive genomic profiling by liquid biopsy has many advantages over the molecular studies performed on tissue biopsy. Due to the tumor heterogeneity, tissue samples may not represent the full profile of the tumor genomics of cancer, while liquid biopsy has full presentation of the disease.11,12 Many times, tissue biopsy may be limited by a sample size that precludes full genetic profiling in addition to higher total cost, potential technical issues during processing, and possible side effects of the biopsy procedure.7,13 Additionally, as the tumor progresses, new driver mutations other than the ones previously detected on the primary tissue may emerge, which can confer resistance to the existing therapy.7,13
Advanced prostatic and lung carcinomas with biochemical, distant organ, or bony progression harbor unique signature genetic mutations indicating poor prognosis, lack of response or resistance to the existing therapy, and high risk of relapse.14,15 Some of the unique characteristics of the veteran patient population include a more aged patient population multiple comorbidities, higher frequency of > 1 type of cancer, advanced cancer stage at presentation, and specific risks factors such as exposure to Agent Orange in veterans who served during the Vietnam War era.16,17 We studied the utility of liquid biopsy in cancer care, including type and incidence of genomic alterations associated with advanced prostate and lung cancers, in this unique patient population.
The amount of cell-free DNA (cfDNA), also known as ctDNA varies widely in cancer patients. Some of the factors associated with low concentration of cfDNA are disease stage, intervening therapy, proliferation rates, and tumor vascularization.18,19 In the peripheral blood, of the total cfDNA, fractions of cfDNA varies from 0.01 to 90%.18,19 All samples containing ≥ 20 ng cfDNA (20 - 100 ng) were subjected to the hybrid capture-based NGS FoundationACT assay.20 In our study, 2 specimens did not meet the minimum criteria of adequacy (20 ng cfDNA); however, the overall adequacy rate for the detection of mutation, irrespective of the cancer type was 29 of 31 (93.5%) with only 2 inadequate samples. This rate is higher than the rate reported in the literature, which is about 70%.20
Significant differences were encountered in the incidence of DNA damage repair genes including Tp53 mutations when compared with those in the general patient population (Table 2). According to recent National Comprehensive Cancer Network (NCCN) guidelines, all prostate cancers should be screened for DDR gene mutations as these genes are common in aggressive prostate cancers and strongly associated with poor outcomes and shortened survival. Due to relatively high frequency of DDR gene mutations in advanced prostatic cancers, liquid biopsy in patients with these advanced stage prostate cancers may be a useful tool in clinical decision making and exploring targeted therapy.20
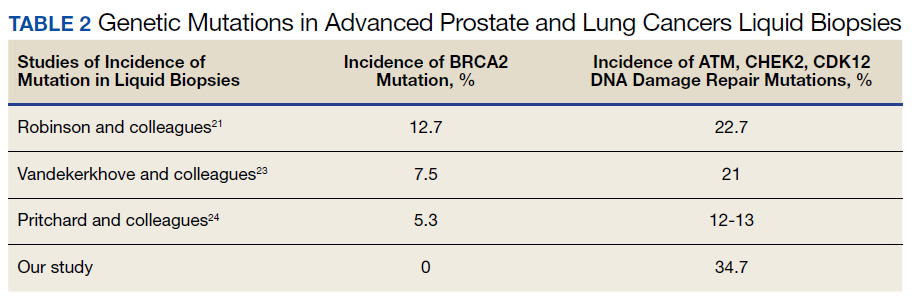
Mutations in BRCA2, ATM, CDK12, and CHEK2 (DDR gene family) are common. Incidence of ATM and CDK12 mutations in the literature is 3 to 6% of cases.21 Of 21 liquid biopsies of advanced prostate cancer patients, we found combined DDR gene mutation of ATM, CHEK2, and CDK12 genes in 6 (28.5%) cases, which is substantially higher than the 3 to 6% rate reported in the literature.21-24 Of the 23 patients who had notable mutations in our liquid biopsies, including both advanced prostate and lung cancer cases, 8 (34.7%) also showed mutation of the genes of DDR family. Our study did not show BRCA2 mutation, which is otherwise common in the literature.
We also evaluated the frequency of the most commonly occurring genetic mutations, Tp53 in advanced solid malignancies, especially advanced prostate and NSCLC. Previous studies have reported Tp53 mutation in association with risk factors (carcinogens) of cancer and have been a surrogate marker of poor survival or lack of response of therapy.25 Knowledge of Tp53 mutation is crucial for closer disease monitoring, preparing the patient for rapid progression, and encouraging the physician to prepare future lines of therapy.25-27 Although Tp53 mutation varies with histologic type and tissue of origin, Beltran and colleagues reported it in 30 to 40% of tumors, while Robles and colleagues reported about 40 to 42% incidence.25,27
Our study showed notable mutations in 23 of 29 adequate cases. Further, our study showed a high frequency of mutated Tp53 in 65.2% of combined advanced prostate and NSCLC cases. We then correlated cases of Vietnam War-era veterans with risk potential of Agent Orange exposure and Tp53 mutation. We found 7 of 15 Vietnam War-era veterans were positive for Tp53 mutations irrespective of the cancer type. The high incidence of Tp53 mutations in advanced prostate and lung carcinomas in the veteran patient population makes this tumor marker an aspiration not only as a surrogate of aggressive disease and tumor progression, but also as a key marker for targeted therapy in advanced prostate and lung cancers with loss of Tp53 function (Figure 3).
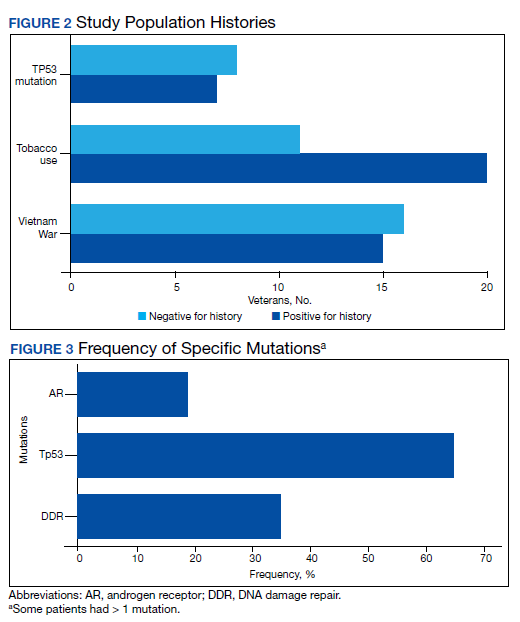
Mutations and amplifications in the AR gene are fundamental to progression of prostate cancer associated with advanced, hormone-refractory prostate cancer with the potential for targeted therapy with AR inhibitors. In our study, AR amplification was detected in 4 of 21 (19%) advanced prostate cancer cases, which is significantly lower than the 30 to 50% previously reported in the literature.28-32 Neither AR amplification or mutation was noted in advanced NSCLC in our study as previously reported in literature by Brennan and colleagues and Wang and colleagues.33-35 This is significant as it provides a pathway for future studies to focus on additional driver mutations for targeted therapies in advanced prostate carcinoma. To date, AR gene mutation does not play a role for personalized therapy in advanced NSCLC. Perhaps, a large cohort study with longitudinal analysis is needed for absolutely ruling out the possibility of personalized medicine in advanced lung cancer using this biomarker.
Conclusions
Liquid biopsy successfully provides precision-based oncology and information for decision making in this unique population of veterans. Difference in frequency of the genetic mutations in this cohort can provide future insight into disease progression, lack of response, and mechanism of resistance to the implemented therapy. Future studies focused on this veteran patient population are needed for developing targeted therapies and patient tailored oncologic therapy. ctDNA has a high potential for monitoring clinically relevant cancer-related genetic and epigenetic modifications for discovering more detailed information on the tumor characterization. Although larger cohort trial with longitudinal analyses are needed, high prevalence of DDR gene and Tp53 mutation in our study instills promising hope for therapeutic interventions in this unique cohort.
The minimally invasive liquid biopsy shows a great promise as both diagnostic and prognostic tool in the personalized clinical management of advanced prostate, and NSCLC in the veteran patient population with unique demographic characteristics. De novo metastatic prostate cancer is more common in veterans when compared with the general population, and therefore veterans may benefit by liquid biopsy. Differences in the frequency of genetic mutations (DDR, TP53, AR) in this cohort provides valuable information for disease progression, lack of response, mechanism of resistance to the implemented therapy and clinical decision making. Precision oncology can be further tailored for this cohort by focusing on DNA repair genes and Tp53 mutations for future targeted therapy.
1
9
16. Institute of Medicine (US) Committee to Review the Health Effects in Vietnam Veterans of Exposure to Herbicides (Fourth Biennial Update). Veterans and Agent Orange: Update 2002. National Academies Press (US); 2003.
17. Eibner C, Krull H, Brown KM, et al. Current and projected characteristics and unique health care needs of the patient population served by the Department of Veterans Affairs. Rand Health Q. 2016;5(4):13. Published 2016 May 9.
18. Saarenheimo J, Eigeliene N, Andersen H, Tiirola M, Jekunen A. The value of liquid biopsies for guiding therapy decisions in non-small cell lung cancer. Front Oncol. 2019;9:129. Published 2019 Mar 5.doi:10.3389/fonc.2019.00129
19
20
21
22
23
24
25
26
27
28
29
30
31. Antonarakis ES, Lu C, Luber B, et al. Clinical significance of androgen receptor splice variant-7 mRNA detection in circulating tumor cells of men with metastatic castration-resistant prostate cancer treated with first- and second-line abiraterone and enzalutamide. J Clin Oncol. 2017;35(19):2149-2156. doi:10.1200/JCO.2016.70.1961
32

33. Jung A, Kirchner T. Liquid biopsy in tumor genetic diagnosis. Dtsch Arztebl Int. 2018;115(10):169-174. doi:10.3238/arztebl.2018.0169
34. Brennan S, Wang AR, Beyer H, et al. Androgen receptor as a potential target in non-small cell lung cancer. Cancer Res. 2017;77(Suppl13): abstract nr 4121. doi:10.1158/1538-7445.AM2017-4121
35. Wang AR, Beyer H, Brennan S, et al. Androgen receptor drives differential gene expression in KRAS-mediated non-small cell lung cancer. Cancer Res. 2018;78(Suppl 13): abstract nr 3946. doi:10.1158/1538-7445.AM2018-3946
The advent of liquid biopsies targeting genetic mutations in solid tumors is a major milestone in the field of precision oncology.1 Conventional methods of obtaining tissue for molecular studies are limited by sample size and often do not represent the entire bulk of the tumor.2 This newer minimally invasive, revolutionary technique analyzes circulating cell-free DNA carrying tumor-specific alterations (circulating tumor DNA [ctDNA]) in peripheral blood and detects signature genomic alterations.1 Tp53 mutations have been reported in 25 to 40% of prostatic cancers and > 50% of non-small cell lung cancers (NSCLC), being more common in late-stage and hormone refractory prostate cancers.3,4 Tp53 mutation has been found to be associated with poor prognosis and increased germline mutations.5
The veteran patient population has distinct demographic characteristics that make veterans more vulnerable to genetic mutations and malignancies, including risk of exposure to Agent Orange, smoking, substance abuse, and asbestos. This area is understudied and extremely sparse in the literature for frequency of genetic mutations, risk factors in solid malignancies occurring in the veteran patient population, and the clinical impact of these risk factors. We herein present a quality assurance study for the utility of liquid biopsies regarding the frequency of DNA damage repair (DDR) gene, Tp53, and androgen receptor (AR) mutations. The clinical impact in advanced lung and prostate cancers in the veteran patient population and frequency are the quality assurance observations that are the study endpoints.
Methods
We reviewed for quality assurance documentation from the Foundation Medicine (www.foundationmedicine.com) cancer biomarker tests on liquid biopsies performed at the Corporal Michael J. Crescenz Veteran Affairs Medical Center in Philadelphia, Pennsylvania from May 2019 to April 15, 2020. All biopsies were performed on cancers with biochemical, imaging or tissue evidence of advanced tumor progression. The testing was performed on advanced solid malignancies, including NSCLC, prostate adenocarcinoma, and metastatic colon cancer. Statistical data for adequacy; cases with notable mutations; frequency; and type of mutations of AR, DDR, and Tp53 were noted. General and specific risk factors associated with the veteran patient population were studied and matched with the type of mutations (Table 1).
Results
Thirty-one liquid biopsies were performed over this period—23 for prostate cancer, 7 for patients with lung cancer patients, and 1 for a patient with colon cancer. Of 31 cases, sensitivity/adequacy of liquid biopsy for genetic mutation was detected in 29 (93.5%) cases (Figure 1). Two inadequate biopsies (both from patients with prostate cancer) were excluded from the study, leaving 29 liquid biopsies with adequate ctDNA for analysis that were considered for further statistical purpose—21 prostate, 7 lung, and 1 colon cancer.
Multiple (common and different) genetic mutations were identified; however, our study subcategorized the mutations into the those that were related to prostate cancer, lung cancer, and some common mutations that occur in both cancers. Only the significant ones will be discussed in this review and equivocal result for AR is excluded from this study. Of the 21 prostate cancers, 4 (19.0%) had directed the targeted therapy to driver mutation (AR being most common in prostate cancer), while KRAS mutation, which was more common in lung cancer, was detected in 2/7 (28.6%) lung cancers. Mutations common to both cancer types were DDR gene mutations, which is a broad name for numerous genes including CDK12, ATM, and CHEK2.
Of all cases irrespective of the cancer type, 23/29 (79.3%) showed notable mutations. DDR gene mutations were found in 6 of 21 (28.5%) patients with prostate cancer and 8 of 23 (34.7%) patients with advanced prostate and lung cancers, indicating poor outcome and possible resistance to the current therapy. Of 23 patients showing mutations irrespective of the cancer type, 15 (65.2%) harbored Tp53 mutations, which is much more frequent in veteran patient population when compared with the literature. Fifteen of the 31 (48.4%) total patients were Vietnam War-era veterans who were potentially exposed to Agent Orange and 20 (64.5%) patients who were not Vietnam War-era veterans had a history that included smoking (Figure 2).
Discussion
The veteran patient population is a unique cohort due to its distinct demographic characteristics with a high volume of cancer cases diagnosed each year. According to data from VA Central Cancer Registry (VACCR), the most frequently diagnosed cancers are prostate (29%) and lung (18%).6
Liquid biopsy is a novel, promising technology that uses ctDNA and circulating tumor cells in peripheral blood for detecting genetic alterations through next generation sequencing.7-9 The advent of this minimally invasive, revolutionary technology has been a breakthrough in the field of precision oncology for prognosis, to monitor treatment response or resistance to therapy and further personalize cancer therapy.9,10
Comprehensive genomic profiling by liquid biopsy has many advantages over the molecular studies performed on tissue biopsy. Due to the tumor heterogeneity, tissue samples may not represent the full profile of the tumor genomics of cancer, while liquid biopsy has full presentation of the disease.11,12 Many times, tissue biopsy may be limited by a sample size that precludes full genetic profiling in addition to higher total cost, potential technical issues during processing, and possible side effects of the biopsy procedure.7,13 Additionally, as the tumor progresses, new driver mutations other than the ones previously detected on the primary tissue may emerge, which can confer resistance to the existing therapy.7,13
Advanced prostatic and lung carcinomas with biochemical, distant organ, or bony progression harbor unique signature genetic mutations indicating poor prognosis, lack of response or resistance to the existing therapy, and high risk of relapse.14,15 Some of the unique characteristics of the veteran patient population include a more aged patient population multiple comorbidities, higher frequency of > 1 type of cancer, advanced cancer stage at presentation, and specific risks factors such as exposure to Agent Orange in veterans who served during the Vietnam War era.16,17 We studied the utility of liquid biopsy in cancer care, including type and incidence of genomic alterations associated with advanced prostate and lung cancers, in this unique patient population.
The amount of cell-free DNA (cfDNA), also known as ctDNA varies widely in cancer patients. Some of the factors associated with low concentration of cfDNA are disease stage, intervening therapy, proliferation rates, and tumor vascularization.18,19 In the peripheral blood, of the total cfDNA, fractions of cfDNA varies from 0.01 to 90%.18,19 All samples containing ≥ 20 ng cfDNA (20 - 100 ng) were subjected to the hybrid capture-based NGS FoundationACT assay.20 In our study, 2 specimens did not meet the minimum criteria of adequacy (20 ng cfDNA); however, the overall adequacy rate for the detection of mutation, irrespective of the cancer type was 29 of 31 (93.5%) with only 2 inadequate samples. This rate is higher than the rate reported in the literature, which is about 70%.20
Significant differences were encountered in the incidence of DNA damage repair genes including Tp53 mutations when compared with those in the general patient population (Table 2). According to recent National Comprehensive Cancer Network (NCCN) guidelines, all prostate cancers should be screened for DDR gene mutations as these genes are common in aggressive prostate cancers and strongly associated with poor outcomes and shortened survival. Due to relatively high frequency of DDR gene mutations in advanced prostatic cancers, liquid biopsy in patients with these advanced stage prostate cancers may be a useful tool in clinical decision making and exploring targeted therapy.20
Mutations in BRCA2, ATM, CDK12, and CHEK2 (DDR gene family) are common. Incidence of ATM and CDK12 mutations in the literature is 3 to 6% of cases.21 Of 21 liquid biopsies of advanced prostate cancer patients, we found combined DDR gene mutation of ATM, CHEK2, and CDK12 genes in 6 (28.5%) cases, which is substantially higher than the 3 to 6% rate reported in the literature.21-24 Of the 23 patients who had notable mutations in our liquid biopsies, including both advanced prostate and lung cancer cases, 8 (34.7%) also showed mutation of the genes of DDR family. Our study did not show BRCA2 mutation, which is otherwise common in the literature.
We also evaluated the frequency of the most commonly occurring genetic mutations, Tp53 in advanced solid malignancies, especially advanced prostate and NSCLC. Previous studies have reported Tp53 mutation in association with risk factors (carcinogens) of cancer and have been a surrogate marker of poor survival or lack of response of therapy.25 Knowledge of Tp53 mutation is crucial for closer disease monitoring, preparing the patient for rapid progression, and encouraging the physician to prepare future lines of therapy.25-27 Although Tp53 mutation varies with histologic type and tissue of origin, Beltran and colleagues reported it in 30 to 40% of tumors, while Robles and colleagues reported about 40 to 42% incidence.25,27
Our study showed notable mutations in 23 of 29 adequate cases. Further, our study showed a high frequency of mutated Tp53 in 65.2% of combined advanced prostate and NSCLC cases. We then correlated cases of Vietnam War-era veterans with risk potential of Agent Orange exposure and Tp53 mutation. We found 7 of 15 Vietnam War-era veterans were positive for Tp53 mutations irrespective of the cancer type. The high incidence of Tp53 mutations in advanced prostate and lung carcinomas in the veteran patient population makes this tumor marker an aspiration not only as a surrogate of aggressive disease and tumor progression, but also as a key marker for targeted therapy in advanced prostate and lung cancers with loss of Tp53 function (Figure 3).
Mutations and amplifications in the AR gene are fundamental to progression of prostate cancer associated with advanced, hormone-refractory prostate cancer with the potential for targeted therapy with AR inhibitors. In our study, AR amplification was detected in 4 of 21 (19%) advanced prostate cancer cases, which is significantly lower than the 30 to 50% previously reported in the literature.28-32 Neither AR amplification or mutation was noted in advanced NSCLC in our study as previously reported in literature by Brennan and colleagues and Wang and colleagues.33-35 This is significant as it provides a pathway for future studies to focus on additional driver mutations for targeted therapies in advanced prostate carcinoma. To date, AR gene mutation does not play a role for personalized therapy in advanced NSCLC. Perhaps, a large cohort study with longitudinal analysis is needed for absolutely ruling out the possibility of personalized medicine in advanced lung cancer using this biomarker.
Conclusions
Liquid biopsy successfully provides precision-based oncology and information for decision making in this unique population of veterans. Difference in frequency of the genetic mutations in this cohort can provide future insight into disease progression, lack of response, and mechanism of resistance to the implemented therapy. Future studies focused on this veteran patient population are needed for developing targeted therapies and patient tailored oncologic therapy. ctDNA has a high potential for monitoring clinically relevant cancer-related genetic and epigenetic modifications for discovering more detailed information on the tumor characterization. Although larger cohort trial with longitudinal analyses are needed, high prevalence of DDR gene and Tp53 mutation in our study instills promising hope for therapeutic interventions in this unique cohort.
The minimally invasive liquid biopsy shows a great promise as both diagnostic and prognostic tool in the personalized clinical management of advanced prostate, and NSCLC in the veteran patient population with unique demographic characteristics. De novo metastatic prostate cancer is more common in veterans when compared with the general population, and therefore veterans may benefit by liquid biopsy. Differences in the frequency of genetic mutations (DDR, TP53, AR) in this cohort provides valuable information for disease progression, lack of response, mechanism of resistance to the implemented therapy and clinical decision making. Precision oncology can be further tailored for this cohort by focusing on DNA repair genes and Tp53 mutations for future targeted therapy.
1
9
16. Institute of Medicine (US) Committee to Review the Health Effects in Vietnam Veterans of Exposure to Herbicides (Fourth Biennial Update). Veterans and Agent Orange: Update 2002. National Academies Press (US); 2003.
17. Eibner C, Krull H, Brown KM, et al. Current and projected characteristics and unique health care needs of the patient population served by the Department of Veterans Affairs. Rand Health Q. 2016;5(4):13. Published 2016 May 9.
18. Saarenheimo J, Eigeliene N, Andersen H, Tiirola M, Jekunen A. The value of liquid biopsies for guiding therapy decisions in non-small cell lung cancer. Front Oncol. 2019;9:129. Published 2019 Mar 5.doi:10.3389/fonc.2019.00129
19
20
21
22
23
24
25
26
27
28
29
30
31. Antonarakis ES, Lu C, Luber B, et al. Clinical significance of androgen receptor splice variant-7 mRNA detection in circulating tumor cells of men with metastatic castration-resistant prostate cancer treated with first- and second-line abiraterone and enzalutamide. J Clin Oncol. 2017;35(19):2149-2156. doi:10.1200/JCO.2016.70.1961
32
33. Jung A, Kirchner T. Liquid biopsy in tumor genetic diagnosis. Dtsch Arztebl Int. 2018;115(10):169-174. doi:10.3238/arztebl.2018.0169
34. Brennan S, Wang AR, Beyer H, et al. Androgen receptor as a potential target in non-small cell lung cancer. Cancer Res. 2017;77(Suppl13): abstract nr 4121. doi:10.1158/1538-7445.AM2017-4121
35. Wang AR, Beyer H, Brennan S, et al. Androgen receptor drives differential gene expression in KRAS-mediated non-small cell lung cancer. Cancer Res. 2018;78(Suppl 13): abstract nr 3946. doi:10.1158/1538-7445.AM2018-3946
Retrospective Chart Review of Advanced Practice Pharmacist Prescribing of Controlled Substances for Pain Management at the Harry S. Truman Memorial Veterans’ Hospital
In the midst of an opioid overdose public health crisis, the US Department of Health and Human Services developed a 5-point strategy to combat this problem. One aspect of this strategy is improved pain management.1 There is high demand for pain management services with a limited number of health care professionals appropriately trained to deliver care.2 Pharmacists are integral members of the interdisciplinary pain team and meet this demand.
Background
For almost 50 years, pharmacists at the US Department of Veterans Affairs (VA) have been functioning as advanced practice providers (APP).3 Clinical pharmacy specialists (CPS) provide comprehensive medication management (CMM) and have a scope of practice (SOP). The SOP serves as the collaborating agreement and outlines the clinical duties permitted in delivering patient care. In addition, the SOP may indicate specific practice areas and are standardized across VA (Table 1).4,5 Pharmacists apply for a SOP and must prove their competency in the practice area and provide documentation of their education, training, experience, knowledge, and skills.5,6 Residency and/or board certification are not required though helpful. A pharmacist’s SOP is reviewed and approved by the facility executive committee.5 Pharmacists with a SOP undergo professional practice evaluation twice a year. Prescribing controlled substances is permissible in the SOP if approved by the facility and allowed by the state of licensure. According to the US Drug Enforcement Agency (DEA) as of February 10, 2020, 8 states (California, Washington, Idaho, Massachusetts, Montana, New Mexico, North Carolina, and Ohio) allow pharmacists to prescribe controlled substances.7
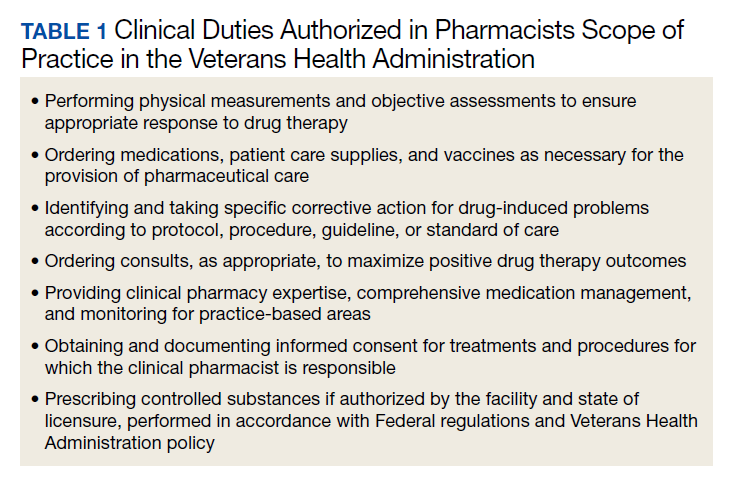
The VA developed the Pharmacists Achieve Results with Medications Documentation (PhARMD) tool that allows clinical pharmacists to document specific interventions made during clinical care and is included in their progress note. Data from fiscal year 2017 demonstrates that 136,041 pain management interventions were made by pharmacists across VA. The majority of these interventions were implemented by a CPS working autonomously as an APP.8
Several articles discuss the pharmacists role in the opioid crisis, although no outcomes data were provided. Chisholm-Burns and colleagues listed multiple potential ways that pharmacists can intervene, including managing pain in primary care clinic settings by using collaborative drug therapy agreements (CDTAs), using opioid exit plans and discharge planning in collaboration with other health care providers (HCPs), or making recommendations to the prescribers before writing prescriptions.9 Compton and colleagues similarly reviewed pharmacist roles in the opioid crisis. However, their focus was on dispensing pharmacists that provided education to patients about storage and disposal of opioids, identified opioid misuse, provided opioid overdose education and naloxone, and checked prescription drug monitoring programs (PDMPs).10 Missing from these articles was the role of the clinical pharmacist working as an APP delivering direct patient care and prescribing controlled substances.
Hammer and colleagues discussed the role of an oncology CPS with controlled substance prescriptive authority in pain management at an outpatient cancer center in Washington state.11 Under a CDTA, pharmacists could prescribe medications, including controlled substances if they obtain DEA registration. The pharmacist completed a comprehensive in-person assessment. The attending physician conducted a physical examination. Then the pharmacist presented the patient and proposed regimen to the interprofessional team to determine a final plan. Ultimately, the pharmacist wrote any controlled substance prescriptions. The patient followed up every 1 to 4 weeks by telephone with a nurse, and in-person assessments occurred at least every 6 months. No outcomes data were provided.11
Dole and colleagues reviewed the role of a pharmacist who had controlled substance prescriptive authority in a pain management clinic. The pharmacist provider saw up to 18 patients a day and then managed refill requests for 3 hours a day. The main outcome was change in visual analog scale (VAS) pain scores. Findings showed that reductions in VAS pain scores were statistically significant (P < .01). The pharmacist processed about 150 refills with an unclear number of controlled substances requests a day based on a medication-refill protocol. This was felt to improve access to physicians for acute needs, improve consistency in refills, and capture patients in need of follow-up. Additionally, the clinic saved $455,238 after 1 year.12
Study Aims
A review of the literature indicated sparse data on the impact of a pharmacist on opioid tapering, opioid dose, and opioid risk mitigation when the pharmacist is prescribing controlled substances. The purpose of this retrospective review was to characterize the controlled substance prescribing practices by the pharmacy pain clinic. The aim was to examine the pharmacist impact on morphine milligram equivalent (MME) and compliance with opioid risk mitigation strategies.
Methods
This project was a retrospective, single-center, chart review. The project was reviewed and approved by the University of Missouri-Columbia Institutional Review Board used by the Harry S. Truman Memorial Veterans’ Hospital (HSTMVH) as a quality improvement project. The author applied for controlled substance registration through the DEA and was issued registration April 30, 2018. The State of Ohio Board of Pharmacy was contacted as required by Ohio Administrative Code. The author's updated SOP to allow controlled substance prescribing was approved July 23, 2018. The CPS functions as an APP within an interdisciplinary pain management team that includes physicians, occupational and physical therapists, complementary and integrative health, and a psychologist. The reason for Pharmacy Pain Consult is required and it is primarily submitted through the electronic health record. The consult is reviewed for appropriateness and once approved is scheduled by support staff. Once the patient is stabilized, the patient is discharged back to their primary care provider (PCP) or referring provider for continued care. Patients were considered stabilized when their patient-specific goals were met, which varied from use of the lowest effective opioid dose to taper to discontinuation of opioids with no further medication changes needed. The taper strategy for each patient was individualized. Patients were generally tapered on their existing opioid medication unless they were new to the VA and on nonformulary medications or experiencing a significant adverse reaction. Numerous references are available through VA to assist with opioid tapering.13,14 The CPS is able to refer patients to other services, including behavioral health for substance use disorder treatment and medication-assisted treatment if concerns were identified.
Initial data were collected from the Veterans Integrated Service Network (VISN) 15 Corporate Data Warehouse by the VISN pharmacy analytics program manager. The original report included patients prescribed a Schedule II to V controlled substance by the author from July 1, 2018 to January 31, 2020. Chart review was conducted on each patient to obtain additional data. At the time of consult and discharge the following data were collected: opioid medication; MME; use of opioid risk mitigation strategies, such as urine drug screens (UDS), informed consent, opioid overdose education and naloxone distribution program (OEND), risk assessment via stratification tool for opioid risk mitigation (STORM), PDMP checks; and nonopioid medication number and classes.
Patients were included in the review if they were prescribed an opioid Schedule II or III controlled substance between July 1, 2018 and January 31, 2020. Patient were excluded if they were prescribed an opioid Schedule II or III controlled substance primarily as coverage for another prescriber. Patients prescribed only pregabalin, tramadol, or a benzodiazepine also were excluded.
The primary endpoint was change in MME from baseline to discharge from clinic. Secondary endpoints included change in opioid risk mitigation strategies and change in opioid medications prescribed from baseline to discharge.
Descriptive statistics were used to analyze parts of the data. A 2-sided t test was used to compare baseline and discharge MME. The Fisher exact test was used to compare nominal data of opioid risk mitigation strategies.
Calculation of MME was performed using the conversion factors provided by the Centers Disease Control and Prevention (CDC) for opioid guideline.15 For buprenorphine, tapentadol, and levorphanol conversion ratios were obtained from other sources. The conversion ratios used, included 75:1 for oral morphine to transdermal buprenorphine, 1:3.3 for oral morphine to oral tapentadol, and 1:7.5 for oral levorphanol to oral morphine.16,17 The Revised Standards for Quality Improvement Reporting Excellence (SQUIRE 2.0) was used to write the manuscript.18
Results
Seventy-five patients were included in this review. The average age of patients was 66 years; and 12% were female (n = 9) (Table 2). The largest number of consults came from PCPs (44%, n = 33) and the pain clinic (43%, n = 32). Nearly half (48%) of the consultations were for opioid tapering (n = 36), followed by 37% for opioid optimization or monitoring (n = 28), and 19% for nonopioid optimization (n = 14). The most common primary diagnoses at consultation were for chronic low back pain (56%), chronic neck pain (20%), and osteoarthritis (16%).
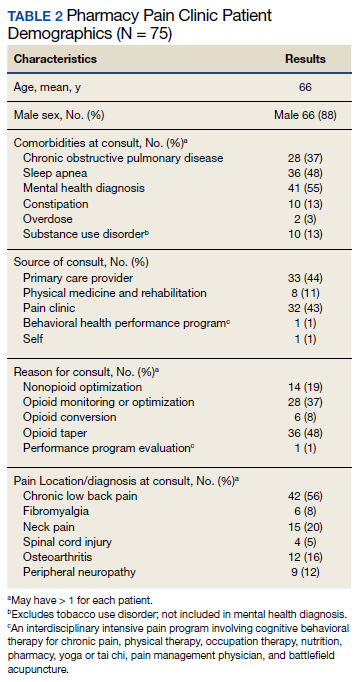
The average MME at time of consult was 93 MME compared with 31 MME at discharge which was statisticially significant (P < .01) (Figure 1). The mean percent change in MME was 46%, including methadone and 42% excluding methadone. There was a 26% change in UDS, 28% change in informed consent, 85% change in PDMP, 194% change in naloxone, and 357% change in STORM reviews from baseline to discharge with all demonstrating statistical significance (P < .01) (Figure 2). At discharge, the most common opioid prescribed was morphine SA (short acting) (n = 10, 13%, 44 average MME) and oxycodone/acetaminophen (n = 10, 13%, 28 average MME) (Table 3).
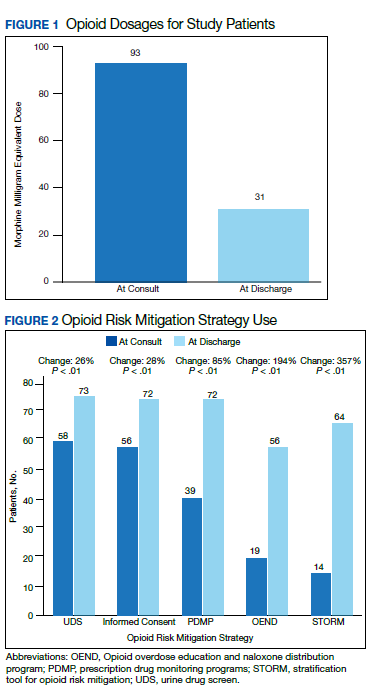
The average number of days from consult to initial visit was 23 days (Table 4). Face-to-face was the primary means of initial visit with 92% (n = 69) of visits, but phone was the primary mode of follow-up with 73% of visits (n = 55). The average number of follow-up visits was 7, representing 176 average days of time in the Pharmacy Pain Clinic. Consultation to the behavioral health performance program was the most common referral (n = 13, 17%).
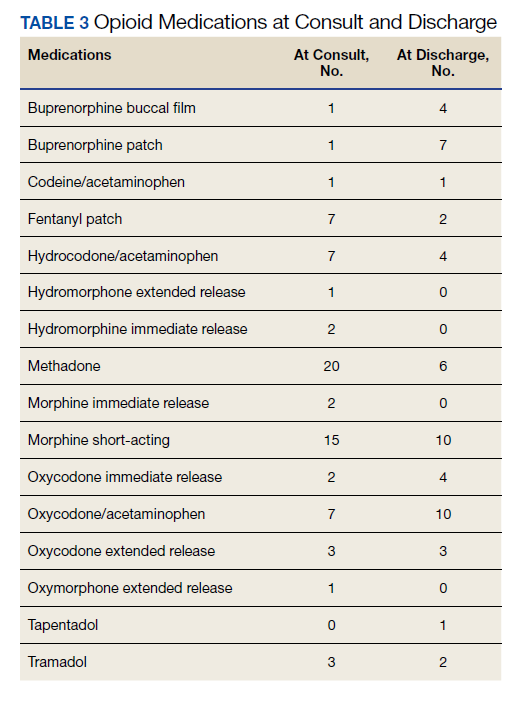
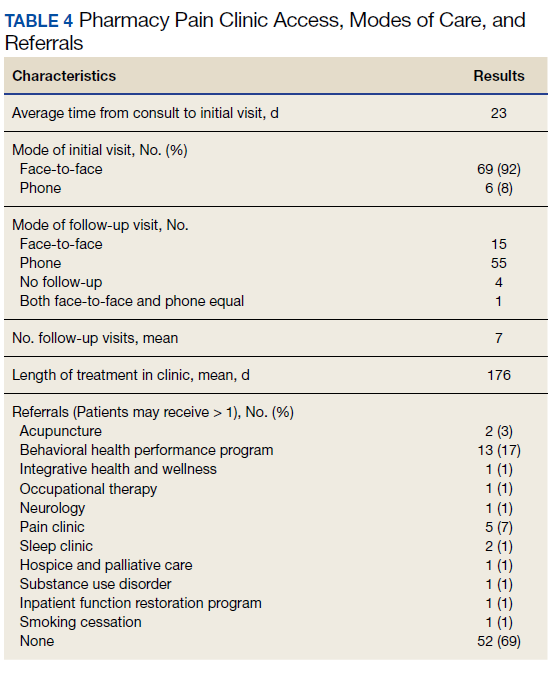
Five patients were new opioid starts in the Pharmacy Pain Clinic. Two patients were on tramadol at time of consult. Of the 5 new opioid starts, 3 patients received oxycodone/acetaminophen, 1 received buprenorphine patch, and 1 received hydrocodone/acetaminophen. The new opioid start average was 25 MME. All 5 patients had a UDS for opioid risk mitigation, 4 used consent and STORM reviews, and 2 patients had PDMP checks and naloxone.
Discussion
There was a statistically significant decrease of the mean MME between the time of consult and the time of discharge. There also were statistically significant changes in use of opioid risk mitigation strategies. Since methadone has a high MME, the mean reduction of MME was calculated with methadone (46%) and without methadone (42%). These data are consistent with other published studies examining opioid tapers in the VA population. Harden and colleagues calculated a 46% mean reduction in MME over 12 months for 72 veterans from opioid tapers implemented by PCPs, pain service, or pharmacist-run clinics.19
There is controversy about equianalgesic doses and no established universal equianalgesic conversion calculator or dose. Numerous equianalgesic opioid dose calculators are available, but for this analysis the CDC MME conversion factors were used (available at: https://www.cdc.gov/drugoverdose/pdf/calculating_total_daily_dose-a.pdf). Previous literature compared existing calculators and found significant variances in calculated doses for methadone and fentanyl conversions.20 Additionally, there have been concerns expressed with the safety of the CDC opioid calculator specifically surrounding the conversions for methadone and tapentadol.21 In the end, I chose the CDC calculator because it is established, readily available, and consistent.
Pharmacists in pain management can address access issues.2,3,11,12 The average length of time from consult to initial visit was 23 days. Often patients may have seen a HCP who implemented a change at the time of consult and wanted the patient to be seen 1 month later. Many patients at the HSTMVH live far from the facility, making in-person visits difficult. A majority of the follow-up visits were conducted by telephone. Patients were offered all modalities available for follow-up, including telephone, in-person, or telemedicine, but patients most often picked telephone. Patients averaged 7 follow-up visits before discharge. This number of visits would have taken time from other health care team members who could have been addressing other veterans. Patients were seen in clinic for 176 days on average, which supports and follows recommendations for a slow, incremental taper.
The opioid medications prescribed changed over time in the clinic. Methadone prescriptions dropped from 20 to 6 at consult to discharge, and fentanyl prescriptions fell from 7 to 2, respectively. The CDC guideline suggests use of long-acting products with more predictable pharmacokinetics (eg, morphine SA or oxycodone SA) rather than fentanyl or methadone.15 Notably, the use of buprenorphine products with FDA approval for pain indications increased from consult to discharge. Many of the patients in this study had pulmonary comorbidities, placing them at higher risk for adverse outcomes. Buprenorphine is a partial μ-opioid receptor agonist with a ceiling on respiratory depression so is potentially less risky in those with pulmonary comorbidities.
The biggest changes in opioid risk mitigation occurred in PDMP, OEND program, and STORM reviews. An 85% increase in PDMP reviews occurred with referral to the clinic. Missouri is the only state without a state-run PDMP. However, the St. Louis County PDMP was developed based on city or county participation and encompasses 85% of the population of Missouri and 94% of HCPs in Missouri as of August 29, 2019.22 Because there is no state-level PDMP, a review of the St. Louis County PDMP was not required during the review period. Nevertheless, the Pharmacy Pain Clinic uses the St. Louis County PDMP at the initial visit and regularly during care. VA policy requires a specific note title be used to document each check of the PDMP.23
There was a 194% increase in patients receiving naloxone with consultation to the Pharmacy Pain Clinic. Due to low coprescribing of naloxone for patients prescribed chronic opioid therapy, The author led an interdisciplinary team analysis of health care failure mode effects during the study period. This led to a process change with coprescribing of naloxone at refill in the primary care clinic.
The Comprehensive Addiction and Recovery Act of 2016 mandated that the VA review STORM on new start of opioids or patient identified as “very high-opioid prescription risk” category by an interdisciplinary opioid risk review team.24 Thus many of the patients referred to clinic didn’t require STORM reviews since they were not new opioid starts or identified as high risk. However, in the standard review of all new patients to the Pharmacy Pain Clinic, a STORM review is conducted and documented to assess the patient’s level of risk.
Only 5 patients were started on opioid medications during the study period. This is consistent with both CDC and the joint VA/US Department of Defense opioid prescribing guidelines that recommend against initiation of opioids for chronic nonmalignant pain.13,15 Two of the patients were prescribed tramadol for ineffective pain control at time of consult. Furthermore, 4 of the 5 patients were started on a short-acting opioid, which was supported by guidelines.13,15 One patient was initiated on buprenorphine patches due to comorbid chronic kidney disease. The VA does not limit the quantity of new opioid prescriptions, although some states and private insurance plans are implementing limitations. Guidelines also recommend against exceeding 90 MME due to risk. The average MME in this project at discharge was 25 MME. Use of opioid risk mitigation for the new opioid starts was reasonable. The reason for the missing PDMP report is unknown based on chart review and atypical according to clinic practice.
Recently, efforts to expand pharmacist training and positions in pain management at VA facilities have been undertaken. In 2016, there were just 11 American Society of Health-System Pharmacists-accredited pharmacy postgraduate year 2 pain and palliative care residency programs, which has expanded to 26 sites in 2020.2,3,25 In addition, the Clinical Pharmacy Practice Office and the VA Office of Rural Health have helped to hire 33 new pain management pharmacists.3
The role of pharmacists in prescribing controlled substances is limited mainly due to the small number of states that extend this authority.7 At the VA, a pharmacist can practice using any state of licensure. Therefore, a pharmacist working at a VA in a state that does not authorize controlled substance prescribing could obtain a license in a state that does permit it. However, the main barrier to obtaining other state licensures is the cost. At the time the author obtained controlled substance prescriptive authority, little direction was available on the process for advanced practice pharmacists at the VA. Since then, guidance has been developed to ease this process. Educational endeavors at VA have been implemented with the intent to increase the number of pharmacists with controlled substance prescriptive authority.
Barriers to pharmacists providing pain care extend beyond limited controlled substance prescriptive authority. Often pharmacists are still viewed in their traditional and operational role.9,10 Other health care team members and patients may not be aware or familiar with the training, knowledge, and skills of pharmacist's and their suitability as an APP.26,27 Most states permit pharmacists in establishing CDTA but not all. Additionally, some states recognize pharmacists as HCPs but many more do not. Furthermore, the Social Security Act does not include pharmacists as HCPs. This makes it challenging, though not impossible, for pharmacists to bill for their services.3
Strengths and Limitations
There were numerous strengths of the project. First, this addressed an unmet need in the literature with limited data discussing pharmacist prescribing controlled substances for pain management. There was 1 data reviewer who made the data collection process consistent. Since this retrospectively reviewed controlled substance prescribing in clinic, it captured real-world practice compared with that of experimental models. There were also several limitations in the project. The person collecting the data was also the person who conducted the clinic. The study was conducted retrospectively and based on documented information in the medical record. The population reviewed was primarily male and older, which fits the VA patient population but has less generalizability to other patient populations. This project was conducted at a single VA facility so may not be generalizable to other VA sites. It is unknown whether patients were again prescribed opioids if they left the VA for the community or another VA facility. The pain diagnoses or locations of pain were categorized to main groups and reliant on the referring provider. Another major weakness was the lack of comparison of pain scores or validated objective measure of function at baseline and at discharge. This consideration would be important for future work.
Conclusions
Pharmacists functioning as APP are key members of the pain management team. A review of a pharmacy-run pain clinic demonstrated statistically significant reduction in MME and improvement in opioid risk mitigation from consult to discharge. Patients enrolled in the pharmacy-managed clinic also had improvements in adherence to opioid risk mitigation strategies. Future attention should be focused on further expanding training and positions for pharmacists as APP in pain management.
Acknowledgments
The author thanks Chris Sedgwick for his assistance with data capture.
1. US Department of Health and Human Services. Help and resources: national opioid crisis. Updated August 30, 2020. Accessed December 10, 2020. https://www.hhs.gov/opioids/about-the-epidemic/hhs-response/index.html
2. Atkinson TJ, Gulum AH, Forkum WG. The future of pain pharmacy: driven by need. Integr Pharm Res Pract. 2016;5:33-42. doi:10.2147/IPRP.S63824
3. Seckel E, Jorgenson T, McFarland S. Meeting the national need for expertise in pain management with clinical pharmacist advanced practice providers. Jt Comm J Qual Patient Saf. 2019;45(5):387-392.doi:10.1016/j.jcjq.2019.01.002
4. McFarland MS, Groppi J, Ourth H, et al. Establishing a standardized clinical pharmacy practice model within the Veterans Health Administration: evolution of the credentialing and professional practice evaluation process. J Am Coll Clin Pharm. 2018;1(2):113-118. doi:10.1002/jac5.1022
5. US Department of Veterans Affairs, Veterans Health Administration. VHA Handbook. 1108.11. Clinical pharmacy services. Published July 1, 2015. Accessed December 10, 2020. https://www.va.gov/vhapublications/ViewPublication.asp?pub_ID=3120
6. US Department of Veterans Affairs, Veterans Health Administration. VHA Handbook 1100.19. Credentialing and priveleging. Published October 15, 2012. Accessed December 10, 2020. https://www.va.gov/vhapublications/ViewPublication.asp?pub_ID=2910
7. US Department of Justice, Drug Enforcement Agency. Mid-level practitioners authorization by state. Updated February 10, 2020. Accessed December 10, 2020. https://www.deadiversion.usdoj.gov/drugreg/practioners/mlp_by_state.pdf
8. Groppi JA, Ourth H, Morreale AP, Hirsh JM, Wright S. Advancement of clinical pharmacy practice through intervention capture. Am J Health Syst Pharm. 2018;75(12):886-892. doi:10.2146/ajhp170186
9. Chisholm-Burns MA, Spivey CA, Sherwin E, Wheeler J, Hohmeier K. The opioid crisis: origins, trends, policies, and the roles of pharmacists. Am J Health Syst Pharm. 2019;76(7):424-435. doi:10.1093/ajhp/zxy089
10. Compton WM, Jones CM, Stein JB, Wargo EM. Promising roles for pharmacists in addressing the U.S. opioid crisis. Res Social Adm Pharm. 2019;15(8):910-916. doi:10.1016/j.sapharm.2017.12.009
11. Hammer KJ, Segal EM, Alwan L, et al. Collaborative practice model for management of pain in patients with cancer. Am J Health Syst Pharm. 2016;73(18):1434-1441. doi:10.2146/ajhp150770
12. Dole EJ, Murawski MM, Adolphe AB, Aragon FD, Hochstadt B. Provision of pain management by a pharmacist with prescribing authority. Am J Health Syst Pharm. 2007;64(1):85-89. doi:10.2146/ajhp060056
13. US Department of Defense, US Department of Veterans Affairs. VA/DoD Clinical Practice Guideline for Opioid Therapy for Chronic Pain. Updated 2017. Accessed November 18, 2020. https://www.healthquality.va.gov/guidelines/Pain/cot/VADoDOTCPG022717.pdf
14. US Department of Veterans Affairs. VA, VHA, VA Academic Detailing Service. Veterans Health Administration. Opioid taper decision tool. Updated October 2016. Accessed November 18, 2020. https://www.pbm.va.gov/AcademicDetailingService/Documents/Pain_Opioid_Taper_Tool_IB_10_939_P96820.pdf
15. Dowell D, Haegerich TM, Chou R. CDC guideline for prescribing opioids for chronic pain - United States, 2016 [published correction appears in MMWR Recomm Rep. 2016;65(11):295]. MMWR Recomm Rep. 2016;65(1):1-49. doi:10.15585/mmwr.rr6501e1
16. McPherson M. Demystifying opioid conversion calculations. Published 2009. Accessed November 18, 2020. https://www.ashp.org/-/media/store-files/p1985-frontmatter.ashx
17. Gudin J, Fudin J, Nalamachu S. Levorphanol use: past, present and future. Postgrad Med. 2016;128(1):46-53. doi:10.1080/00325481.2016.1128308
18. Ogrinc G, Davies L, Goodman D, Batalden P, Davidoff F, Stevens D. SQUIRE 2.0 (Standards for QUality Improvement Reporting Excellence): revised publication guidelines from a detailed consensus process. BMJ Qual Saf. 2016;25(12):986-992. doi:10.1136/bmjqs-2015-004411
19. Harden P, Ahmed S, Ang K, Wiedemer N. Clinical implications of tapering chronic opioids in a veteran population. Pain Med. 2015;16(10):1975-1981. doi:10.1111/pme.12812
20. Shaw K, Fudin J. Evaluation and comparison of online equianalgesic opioid dose conversion calculators. Practical Pain Manag. 2013;13(7):61-66. Accessed November 18, 2020. https://www.practicalpainmanagement.com/treatments/pharmacological/opioids/evaluation-comparison-online-equianalgesic-opioid-dose-conversion
21. Fudin J, Raouf M, Wegrzyn EL, Schatman ME. Safety concerns with the Centers for Disease Control opioid calculator. J Pain Res. 2017;11:1-4. Published 2017 Dec 18. doi:10.2147/JPR.S155444
22. Saint Louis County Public Health. St. Louis County Prescription Drug Monitoring Program. Participating jurisdictions. Accessed December 10, 2020. https://pdmp-stlcogis.hub.arcgis.com
23. US Department of Veterans Affairs, Veterans Health Administration. VHA Directive 1306: querying state prescription drug monitoring programs. Updated October 21, 2019. Accessed November 18, 2020. https://www.va.gov/vhapublications/ViewPublication.asp?pub_ID=3283
24. Comprehensive Addiction and Recovery Act of 2016. 42 USC § 201 (2016).
25. American Society of Health-System Pharmacists. Residency directory. Accessed November 18, 2020. https://accreditation.ashp.org/directory/#/program/residency
26. Feehan M, Durante R, Ruble J, Munger MA. Qualitative interviews regarding pharmacist prescribing in the community setting. Am J Health Syst Pharm. 2016;73(18):1456-1461. doi:10.2146/ajhp150691
27. Giannitrapani KF, Glassman PA, Vang D, et al. Expanding the role of clinical pharmacists on interdisciplinary primary care teams for chronic pain and opioid management. BMC Fam Pract. 2018;19(1):107. doi:10.1186/s12875-018-0783-9
In the midst of an opioid overdose public health crisis, the US Department of Health and Human Services developed a 5-point strategy to combat this problem. One aspect of this strategy is improved pain management.1 There is high demand for pain management services with a limited number of health care professionals appropriately trained to deliver care.2 Pharmacists are integral members of the interdisciplinary pain team and meet this demand.
Background
For almost 50 years, pharmacists at the US Department of Veterans Affairs (VA) have been functioning as advanced practice providers (APP).3 Clinical pharmacy specialists (CPS) provide comprehensive medication management (CMM) and have a scope of practice (SOP). The SOP serves as the collaborating agreement and outlines the clinical duties permitted in delivering patient care. In addition, the SOP may indicate specific practice areas and are standardized across VA (Table 1).4,5 Pharmacists apply for a SOP and must prove their competency in the practice area and provide documentation of their education, training, experience, knowledge, and skills.5,6 Residency and/or board certification are not required though helpful. A pharmacist’s SOP is reviewed and approved by the facility executive committee.5 Pharmacists with a SOP undergo professional practice evaluation twice a year. Prescribing controlled substances is permissible in the SOP if approved by the facility and allowed by the state of licensure. According to the US Drug Enforcement Agency (DEA) as of February 10, 2020, 8 states (California, Washington, Idaho, Massachusetts, Montana, New Mexico, North Carolina, and Ohio) allow pharmacists to prescribe controlled substances.7
The VA developed the Pharmacists Achieve Results with Medications Documentation (PhARMD) tool that allows clinical pharmacists to document specific interventions made during clinical care and is included in their progress note. Data from fiscal year 2017 demonstrates that 136,041 pain management interventions were made by pharmacists across VA. The majority of these interventions were implemented by a CPS working autonomously as an APP.8
Several articles discuss the pharmacists role in the opioid crisis, although no outcomes data were provided. Chisholm-Burns and colleagues listed multiple potential ways that pharmacists can intervene, including managing pain in primary care clinic settings by using collaborative drug therapy agreements (CDTAs), using opioid exit plans and discharge planning in collaboration with other health care providers (HCPs), or making recommendations to the prescribers before writing prescriptions.9 Compton and colleagues similarly reviewed pharmacist roles in the opioid crisis. However, their focus was on dispensing pharmacists that provided education to patients about storage and disposal of opioids, identified opioid misuse, provided opioid overdose education and naloxone, and checked prescription drug monitoring programs (PDMPs).10 Missing from these articles was the role of the clinical pharmacist working as an APP delivering direct patient care and prescribing controlled substances.
Hammer and colleagues discussed the role of an oncology CPS with controlled substance prescriptive authority in pain management at an outpatient cancer center in Washington state.11 Under a CDTA, pharmacists could prescribe medications, including controlled substances if they obtain DEA registration. The pharmacist completed a comprehensive in-person assessment. The attending physician conducted a physical examination. Then the pharmacist presented the patient and proposed regimen to the interprofessional team to determine a final plan. Ultimately, the pharmacist wrote any controlled substance prescriptions. The patient followed up every 1 to 4 weeks by telephone with a nurse, and in-person assessments occurred at least every 6 months. No outcomes data were provided.11
Dole and colleagues reviewed the role of a pharmacist who had controlled substance prescriptive authority in a pain management clinic. The pharmacist provider saw up to 18 patients a day and then managed refill requests for 3 hours a day. The main outcome was change in visual analog scale (VAS) pain scores. Findings showed that reductions in VAS pain scores were statistically significant (P < .01). The pharmacist processed about 150 refills with an unclear number of controlled substances requests a day based on a medication-refill protocol. This was felt to improve access to physicians for acute needs, improve consistency in refills, and capture patients in need of follow-up. Additionally, the clinic saved $455,238 after 1 year.12
Study Aims
A review of the literature indicated sparse data on the impact of a pharmacist on opioid tapering, opioid dose, and opioid risk mitigation when the pharmacist is prescribing controlled substances. The purpose of this retrospective review was to characterize the controlled substance prescribing practices by the pharmacy pain clinic. The aim was to examine the pharmacist impact on morphine milligram equivalent (MME) and compliance with opioid risk mitigation strategies.
Methods
This project was a retrospective, single-center, chart review. The project was reviewed and approved by the University of Missouri-Columbia Institutional Review Board used by the Harry S. Truman Memorial Veterans’ Hospital (HSTMVH) as a quality improvement project. The author applied for controlled substance registration through the DEA and was issued registration April 30, 2018. The State of Ohio Board of Pharmacy was contacted as required by Ohio Administrative Code. The author's updated SOP to allow controlled substance prescribing was approved July 23, 2018. The CPS functions as an APP within an interdisciplinary pain management team that includes physicians, occupational and physical therapists, complementary and integrative health, and a psychologist. The reason for Pharmacy Pain Consult is required and it is primarily submitted through the electronic health record. The consult is reviewed for appropriateness and once approved is scheduled by support staff. Once the patient is stabilized, the patient is discharged back to their primary care provider (PCP) or referring provider for continued care. Patients were considered stabilized when their patient-specific goals were met, which varied from use of the lowest effective opioid dose to taper to discontinuation of opioids with no further medication changes needed. The taper strategy for each patient was individualized. Patients were generally tapered on their existing opioid medication unless they were new to the VA and on nonformulary medications or experiencing a significant adverse reaction. Numerous references are available through VA to assist with opioid tapering.13,14 The CPS is able to refer patients to other services, including behavioral health for substance use disorder treatment and medication-assisted treatment if concerns were identified.
Initial data were collected from the Veterans Integrated Service Network (VISN) 15 Corporate Data Warehouse by the VISN pharmacy analytics program manager. The original report included patients prescribed a Schedule II to V controlled substance by the author from July 1, 2018 to January 31, 2020. Chart review was conducted on each patient to obtain additional data. At the time of consult and discharge the following data were collected: opioid medication; MME; use of opioid risk mitigation strategies, such as urine drug screens (UDS), informed consent, opioid overdose education and naloxone distribution program (OEND), risk assessment via stratification tool for opioid risk mitigation (STORM), PDMP checks; and nonopioid medication number and classes.
Patients were included in the review if they were prescribed an opioid Schedule II or III controlled substance between July 1, 2018 and January 31, 2020. Patient were excluded if they were prescribed an opioid Schedule II or III controlled substance primarily as coverage for another prescriber. Patients prescribed only pregabalin, tramadol, or a benzodiazepine also were excluded.
The primary endpoint was change in MME from baseline to discharge from clinic. Secondary endpoints included change in opioid risk mitigation strategies and change in opioid medications prescribed from baseline to discharge.
Descriptive statistics were used to analyze parts of the data. A 2-sided t test was used to compare baseline and discharge MME. The Fisher exact test was used to compare nominal data of opioid risk mitigation strategies.
Calculation of MME was performed using the conversion factors provided by the Centers Disease Control and Prevention (CDC) for opioid guideline.15 For buprenorphine, tapentadol, and levorphanol conversion ratios were obtained from other sources. The conversion ratios used, included 75:1 for oral morphine to transdermal buprenorphine, 1:3.3 for oral morphine to oral tapentadol, and 1:7.5 for oral levorphanol to oral morphine.16,17 The Revised Standards for Quality Improvement Reporting Excellence (SQUIRE 2.0) was used to write the manuscript.18
Results
Seventy-five patients were included in this review. The average age of patients was 66 years; and 12% were female (n = 9) (Table 2). The largest number of consults came from PCPs (44%, n = 33) and the pain clinic (43%, n = 32). Nearly half (48%) of the consultations were for opioid tapering (n = 36), followed by 37% for opioid optimization or monitoring (n = 28), and 19% for nonopioid optimization (n = 14). The most common primary diagnoses at consultation were for chronic low back pain (56%), chronic neck pain (20%), and osteoarthritis (16%).
The average MME at time of consult was 93 MME compared with 31 MME at discharge which was statisticially significant (P < .01) (Figure 1). The mean percent change in MME was 46%, including methadone and 42% excluding methadone. There was a 26% change in UDS, 28% change in informed consent, 85% change in PDMP, 194% change in naloxone, and 357% change in STORM reviews from baseline to discharge with all demonstrating statistical significance (P < .01) (Figure 2). At discharge, the most common opioid prescribed was morphine SA (short acting) (n = 10, 13%, 44 average MME) and oxycodone/acetaminophen (n = 10, 13%, 28 average MME) (Table 3).
The average number of days from consult to initial visit was 23 days (Table 4). Face-to-face was the primary means of initial visit with 92% (n = 69) of visits, but phone was the primary mode of follow-up with 73% of visits (n = 55). The average number of follow-up visits was 7, representing 176 average days of time in the Pharmacy Pain Clinic. Consultation to the behavioral health performance program was the most common referral (n = 13, 17%).
Five patients were new opioid starts in the Pharmacy Pain Clinic. Two patients were on tramadol at time of consult. Of the 5 new opioid starts, 3 patients received oxycodone/acetaminophen, 1 received buprenorphine patch, and 1 received hydrocodone/acetaminophen. The new opioid start average was 25 MME. All 5 patients had a UDS for opioid risk mitigation, 4 used consent and STORM reviews, and 2 patients had PDMP checks and naloxone.
Discussion
There was a statistically significant decrease of the mean MME between the time of consult and the time of discharge. There also were statistically significant changes in use of opioid risk mitigation strategies. Since methadone has a high MME, the mean reduction of MME was calculated with methadone (46%) and without methadone (42%). These data are consistent with other published studies examining opioid tapers in the VA population. Harden and colleagues calculated a 46% mean reduction in MME over 12 months for 72 veterans from opioid tapers implemented by PCPs, pain service, or pharmacist-run clinics.19
There is controversy about equianalgesic doses and no established universal equianalgesic conversion calculator or dose. Numerous equianalgesic opioid dose calculators are available, but for this analysis the CDC MME conversion factors were used (available at: https://www.cdc.gov/drugoverdose/pdf/calculating_total_daily_dose-a.pdf). Previous literature compared existing calculators and found significant variances in calculated doses for methadone and fentanyl conversions.20 Additionally, there have been concerns expressed with the safety of the CDC opioid calculator specifically surrounding the conversions for methadone and tapentadol.21 In the end, I chose the CDC calculator because it is established, readily available, and consistent.
Pharmacists in pain management can address access issues.2,3,11,12 The average length of time from consult to initial visit was 23 days. Often patients may have seen a HCP who implemented a change at the time of consult and wanted the patient to be seen 1 month later. Many patients at the HSTMVH live far from the facility, making in-person visits difficult. A majority of the follow-up visits were conducted by telephone. Patients were offered all modalities available for follow-up, including telephone, in-person, or telemedicine, but patients most often picked telephone. Patients averaged 7 follow-up visits before discharge. This number of visits would have taken time from other health care team members who could have been addressing other veterans. Patients were seen in clinic for 176 days on average, which supports and follows recommendations for a slow, incremental taper.
The opioid medications prescribed changed over time in the clinic. Methadone prescriptions dropped from 20 to 6 at consult to discharge, and fentanyl prescriptions fell from 7 to 2, respectively. The CDC guideline suggests use of long-acting products with more predictable pharmacokinetics (eg, morphine SA or oxycodone SA) rather than fentanyl or methadone.15 Notably, the use of buprenorphine products with FDA approval for pain indications increased from consult to discharge. Many of the patients in this study had pulmonary comorbidities, placing them at higher risk for adverse outcomes. Buprenorphine is a partial μ-opioid receptor agonist with a ceiling on respiratory depression so is potentially less risky in those with pulmonary comorbidities.
The biggest changes in opioid risk mitigation occurred in PDMP, OEND program, and STORM reviews. An 85% increase in PDMP reviews occurred with referral to the clinic. Missouri is the only state without a state-run PDMP. However, the St. Louis County PDMP was developed based on city or county participation and encompasses 85% of the population of Missouri and 94% of HCPs in Missouri as of August 29, 2019.22 Because there is no state-level PDMP, a review of the St. Louis County PDMP was not required during the review period. Nevertheless, the Pharmacy Pain Clinic uses the St. Louis County PDMP at the initial visit and regularly during care. VA policy requires a specific note title be used to document each check of the PDMP.23
There was a 194% increase in patients receiving naloxone with consultation to the Pharmacy Pain Clinic. Due to low coprescribing of naloxone for patients prescribed chronic opioid therapy, The author led an interdisciplinary team analysis of health care failure mode effects during the study period. This led to a process change with coprescribing of naloxone at refill in the primary care clinic.
The Comprehensive Addiction and Recovery Act of 2016 mandated that the VA review STORM on new start of opioids or patient identified as “very high-opioid prescription risk” category by an interdisciplinary opioid risk review team.24 Thus many of the patients referred to clinic didn’t require STORM reviews since they were not new opioid starts or identified as high risk. However, in the standard review of all new patients to the Pharmacy Pain Clinic, a STORM review is conducted and documented to assess the patient’s level of risk.
Only 5 patients were started on opioid medications during the study period. This is consistent with both CDC and the joint VA/US Department of Defense opioid prescribing guidelines that recommend against initiation of opioids for chronic nonmalignant pain.13,15 Two of the patients were prescribed tramadol for ineffective pain control at time of consult. Furthermore, 4 of the 5 patients were started on a short-acting opioid, which was supported by guidelines.13,15 One patient was initiated on buprenorphine patches due to comorbid chronic kidney disease. The VA does not limit the quantity of new opioid prescriptions, although some states and private insurance plans are implementing limitations. Guidelines also recommend against exceeding 90 MME due to risk. The average MME in this project at discharge was 25 MME. Use of opioid risk mitigation for the new opioid starts was reasonable. The reason for the missing PDMP report is unknown based on chart review and atypical according to clinic practice.
Recently, efforts to expand pharmacist training and positions in pain management at VA facilities have been undertaken. In 2016, there were just 11 American Society of Health-System Pharmacists-accredited pharmacy postgraduate year 2 pain and palliative care residency programs, which has expanded to 26 sites in 2020.2,3,25 In addition, the Clinical Pharmacy Practice Office and the VA Office of Rural Health have helped to hire 33 new pain management pharmacists.3
The role of pharmacists in prescribing controlled substances is limited mainly due to the small number of states that extend this authority.7 At the VA, a pharmacist can practice using any state of licensure. Therefore, a pharmacist working at a VA in a state that does not authorize controlled substance prescribing could obtain a license in a state that does permit it. However, the main barrier to obtaining other state licensures is the cost. At the time the author obtained controlled substance prescriptive authority, little direction was available on the process for advanced practice pharmacists at the VA. Since then, guidance has been developed to ease this process. Educational endeavors at VA have been implemented with the intent to increase the number of pharmacists with controlled substance prescriptive authority.
Barriers to pharmacists providing pain care extend beyond limited controlled substance prescriptive authority. Often pharmacists are still viewed in their traditional and operational role.9,10 Other health care team members and patients may not be aware or familiar with the training, knowledge, and skills of pharmacist's and their suitability as an APP.26,27 Most states permit pharmacists in establishing CDTA but not all. Additionally, some states recognize pharmacists as HCPs but many more do not. Furthermore, the Social Security Act does not include pharmacists as HCPs. This makes it challenging, though not impossible, for pharmacists to bill for their services.3
Strengths and Limitations
There were numerous strengths of the project. First, this addressed an unmet need in the literature with limited data discussing pharmacist prescribing controlled substances for pain management. There was 1 data reviewer who made the data collection process consistent. Since this retrospectively reviewed controlled substance prescribing in clinic, it captured real-world practice compared with that of experimental models. There were also several limitations in the project. The person collecting the data was also the person who conducted the clinic. The study was conducted retrospectively and based on documented information in the medical record. The population reviewed was primarily male and older, which fits the VA patient population but has less generalizability to other patient populations. This project was conducted at a single VA facility so may not be generalizable to other VA sites. It is unknown whether patients were again prescribed opioids if they left the VA for the community or another VA facility. The pain diagnoses or locations of pain were categorized to main groups and reliant on the referring provider. Another major weakness was the lack of comparison of pain scores or validated objective measure of function at baseline and at discharge. This consideration would be important for future work.
Conclusions
Pharmacists functioning as APP are key members of the pain management team. A review of a pharmacy-run pain clinic demonstrated statistically significant reduction in MME and improvement in opioid risk mitigation from consult to discharge. Patients enrolled in the pharmacy-managed clinic also had improvements in adherence to opioid risk mitigation strategies. Future attention should be focused on further expanding training and positions for pharmacists as APP in pain management.
Acknowledgments
The author thanks Chris Sedgwick for his assistance with data capture.
1. US Department of Health and Human Services. Help and resources: national opioid crisis. Updated August 30, 2020. Accessed December 10, 2020. https://www.hhs.gov/opioids/about-the-epidemic/hhs-response/index.html
2. Atkinson TJ, Gulum AH, Forkum WG. The future of pain pharmacy: driven by need. Integr Pharm Res Pract. 2016;5:33-42. doi:10.2147/IPRP.S63824
3. Seckel E, Jorgenson T, McFarland S. Meeting the national need for expertise in pain management with clinical pharmacist advanced practice providers. Jt Comm J Qual Patient Saf. 2019;45(5):387-392.doi:10.1016/j.jcjq.2019.01.002
4. McFarland MS, Groppi J, Ourth H, et al. Establishing a standardized clinical pharmacy practice model within the Veterans Health Administration: evolution of the credentialing and professional practice evaluation process. J Am Coll Clin Pharm. 2018;1(2):113-118. doi:10.1002/jac5.1022
5. US Department of Veterans Affairs, Veterans Health Administration. VHA Handbook. 1108.11. Clinical pharmacy services. Published July 1, 2015. Accessed December 10, 2020. https://www.va.gov/vhapublications/ViewPublication.asp?pub_ID=3120
6. US Department of Veterans Affairs, Veterans Health Administration. VHA Handbook 1100.19. Credentialing and priveleging. Published October 15, 2012. Accessed December 10, 2020. https://www.va.gov/vhapublications/ViewPublication.asp?pub_ID=2910
7. US Department of Justice, Drug Enforcement Agency. Mid-level practitioners authorization by state. Updated February 10, 2020. Accessed December 10, 2020. https://www.deadiversion.usdoj.gov/drugreg/practioners/mlp_by_state.pdf
8. Groppi JA, Ourth H, Morreale AP, Hirsh JM, Wright S. Advancement of clinical pharmacy practice through intervention capture. Am J Health Syst Pharm. 2018;75(12):886-892. doi:10.2146/ajhp170186
9. Chisholm-Burns MA, Spivey CA, Sherwin E, Wheeler J, Hohmeier K. The opioid crisis: origins, trends, policies, and the roles of pharmacists. Am J Health Syst Pharm. 2019;76(7):424-435. doi:10.1093/ajhp/zxy089
10. Compton WM, Jones CM, Stein JB, Wargo EM. Promising roles for pharmacists in addressing the U.S. opioid crisis. Res Social Adm Pharm. 2019;15(8):910-916. doi:10.1016/j.sapharm.2017.12.009
11. Hammer KJ, Segal EM, Alwan L, et al. Collaborative practice model for management of pain in patients with cancer. Am J Health Syst Pharm. 2016;73(18):1434-1441. doi:10.2146/ajhp150770
12. Dole EJ, Murawski MM, Adolphe AB, Aragon FD, Hochstadt B. Provision of pain management by a pharmacist with prescribing authority. Am J Health Syst Pharm. 2007;64(1):85-89. doi:10.2146/ajhp060056
13. US Department of Defense, US Department of Veterans Affairs. VA/DoD Clinical Practice Guideline for Opioid Therapy for Chronic Pain. Updated 2017. Accessed November 18, 2020. https://www.healthquality.va.gov/guidelines/Pain/cot/VADoDOTCPG022717.pdf
14. US Department of Veterans Affairs. VA, VHA, VA Academic Detailing Service. Veterans Health Administration. Opioid taper decision tool. Updated October 2016. Accessed November 18, 2020. https://www.pbm.va.gov/AcademicDetailingService/Documents/Pain_Opioid_Taper_Tool_IB_10_939_P96820.pdf
15. Dowell D, Haegerich TM, Chou R. CDC guideline for prescribing opioids for chronic pain - United States, 2016 [published correction appears in MMWR Recomm Rep. 2016;65(11):295]. MMWR Recomm Rep. 2016;65(1):1-49. doi:10.15585/mmwr.rr6501e1
16. McPherson M. Demystifying opioid conversion calculations. Published 2009. Accessed November 18, 2020. https://www.ashp.org/-/media/store-files/p1985-frontmatter.ashx
17. Gudin J, Fudin J, Nalamachu S. Levorphanol use: past, present and future. Postgrad Med. 2016;128(1):46-53. doi:10.1080/00325481.2016.1128308
18. Ogrinc G, Davies L, Goodman D, Batalden P, Davidoff F, Stevens D. SQUIRE 2.0 (Standards for QUality Improvement Reporting Excellence): revised publication guidelines from a detailed consensus process. BMJ Qual Saf. 2016;25(12):986-992. doi:10.1136/bmjqs-2015-004411
19. Harden P, Ahmed S, Ang K, Wiedemer N. Clinical implications of tapering chronic opioids in a veteran population. Pain Med. 2015;16(10):1975-1981. doi:10.1111/pme.12812
20. Shaw K, Fudin J. Evaluation and comparison of online equianalgesic opioid dose conversion calculators. Practical Pain Manag. 2013;13(7):61-66. Accessed November 18, 2020. https://www.practicalpainmanagement.com/treatments/pharmacological/opioids/evaluation-comparison-online-equianalgesic-opioid-dose-conversion
21. Fudin J, Raouf M, Wegrzyn EL, Schatman ME. Safety concerns with the Centers for Disease Control opioid calculator. J Pain Res. 2017;11:1-4. Published 2017 Dec 18. doi:10.2147/JPR.S155444
22. Saint Louis County Public Health. St. Louis County Prescription Drug Monitoring Program. Participating jurisdictions. Accessed December 10, 2020. https://pdmp-stlcogis.hub.arcgis.com
23. US Department of Veterans Affairs, Veterans Health Administration. VHA Directive 1306: querying state prescription drug monitoring programs. Updated October 21, 2019. Accessed November 18, 2020. https://www.va.gov/vhapublications/ViewPublication.asp?pub_ID=3283
24. Comprehensive Addiction and Recovery Act of 2016. 42 USC § 201 (2016).
25. American Society of Health-System Pharmacists. Residency directory. Accessed November 18, 2020. https://accreditation.ashp.org/directory/#/program/residency
26. Feehan M, Durante R, Ruble J, Munger MA. Qualitative interviews regarding pharmacist prescribing in the community setting. Am J Health Syst Pharm. 2016;73(18):1456-1461. doi:10.2146/ajhp150691
27. Giannitrapani KF, Glassman PA, Vang D, et al. Expanding the role of clinical pharmacists on interdisciplinary primary care teams for chronic pain and opioid management. BMC Fam Pract. 2018;19(1):107. doi:10.1186/s12875-018-0783-9
Examining the Interfacility Variation of Social Determinants of Health in the Veterans Health Administration
Social determinants of health (SDoH) are social, economic, environmental, and occupational factors that are known to influence an individual’s health care utilization and clinical outcomes.1,2 Because the Veterans Health Administration (VHA) is charged to address both the medical and nonmedical needs of the veteran population, it is increasingly interested in the impact SDoH have on veteran care.3,4 To combat the adverse impact of such factors, the VHA has implemented several large-scale programs across the US that focus on prevalent SDoH, such as homelessness, substance abuse, and alcohol use disorders.5,6 While such risk factors are generally universal in their distribution, variation across regions, between urban and rural spaces, and even within cities has been shown to exist in private settings.7 Understanding such variability potentially could be helpful to US Department of Veterans Affairs (VA) policymakers and leaders to better allocate funding and resources to address such issues.
Although previous work has highlighted regional and neighborhood-level variability of SDoH, no study has examined the facility-level variability of commonly encountered social risk factors within the VHA.4,8 The aim of this study was to describe the interfacility variation of 5 common SDoH known to influence health and health outcomes among a national cohort of veterans hospitalized for common medical issues by using administrative data.
Methods
We used a national cohort of veterans aged ≥ 65 years who were hospitalized at a VHA acute care facility with a primary discharge diagnosis of acute myocardial infarction (AMI), heart failure (HF), or pneumonia in 2012. These conditions were chosen because they are publicly reported and frequently used for interfacility comparison.
Using the International Classification of Diseases–9th Revision (ICD-9) and VHA clinical stop codes, we calculated the median documented proportion of patients with any of the following 5 SDoH: lived alone, marginal housing, alcohol use disorder, substance use disorder, and use of substance use services for patients presenting with HF, MI, and pneumonia (Table). These SDoH were chosen because they are intervenable risk factors for which the VHA has several programs (eg, homeless outreach, substance abuse, and tobacco cessation). To examine the variability of these SDoH across VHA facilities, we determined the number of hospitals that had a sufficient number of admissions (≥ 50) to be included in the analyses. We then examined the administratively documented, facility-level variation in the proportion of individuals with any of the 5 SDoH administrative codes and examined the distribution of their use across all qualifying facilities.
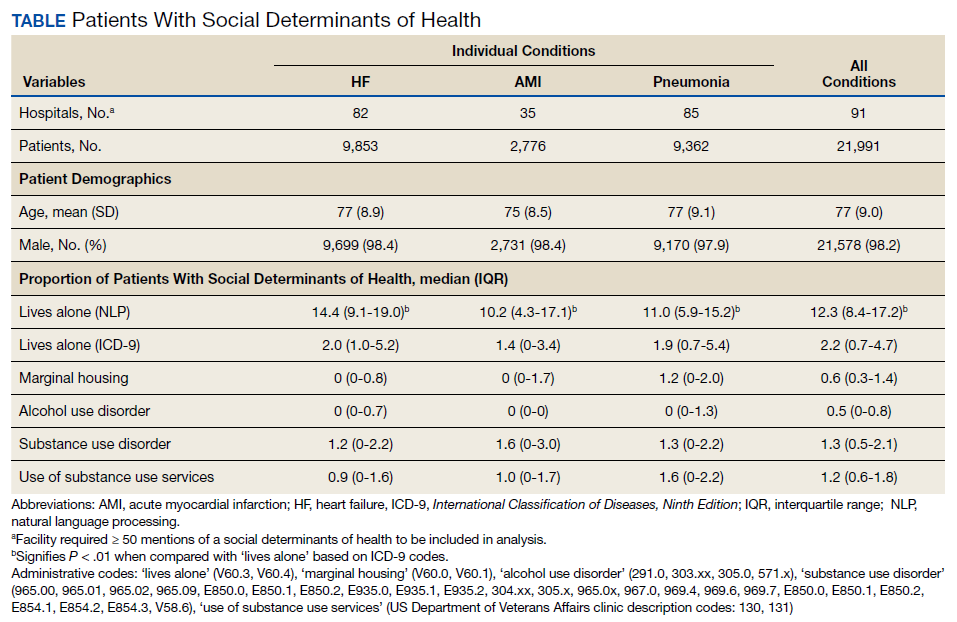
Because variability may be due to regional coding differences, we examined the difference in the estimated prevalence of the risk factor lives alone by using a previously developed natural language processing (NLP) program.9 The NLP program is a rule-based system designed to automatically extract information that requires inferencing from clinical notes (eg, discharge summaries and nursing, social work, emergency department physician, primary care, and hospital admission notes). For instance, the program identifies whether there was direct or indirect evidence that the patient did or did not live alone. In addition to extracting data on lives alone, the NLP program has the capacity to extract information on lack of social support and living alone—2 characteristics without VHA interventions, which were not examined here. The NLP program was developed and evaluated using at least 1 year of notes prior to index hospitalization. Because this program was developed and validated on a 2012 data set, we were limited to using a cohort from this year as well.
All analyses were conducted using SAS Version 9.4. The San Francisco VA Medical Center Institutional Review Board approved this study.
Results
In total, 21,991 patients with either HF (9,853), pneumonia (9,362), or AMI (2,776) were identified across 91 VHA facilities. The majority were male (98%) and had a median (SD) age of 77.0 (9.0) years. The median facility-level proportion of veterans who had any of the SDoH risk factors extracted through administrative codes was low across all conditions, ranging from 0.5 to 2.2%. The most prevalent factors among patients admitted for HF, AMI, and pneumonia were lives alone (2.0% [Interquartile range (IQR), 1.0-5.2], 1.4% [IQR, 0-3.4], and 1.9% [IQR, 0.7-5.4]), substance use disorder (1.2% [IQR, 0-2.2], 1.6% [IQR: 0-3.0], and 1.3% [IQR, 0-2.2] and use of substance use services (0.9% [IQR, 0-1.6%], 1.0% [IQR, 0-1.7%], and 1.6% [IQR, 0-2.2%], respectively [Table]).
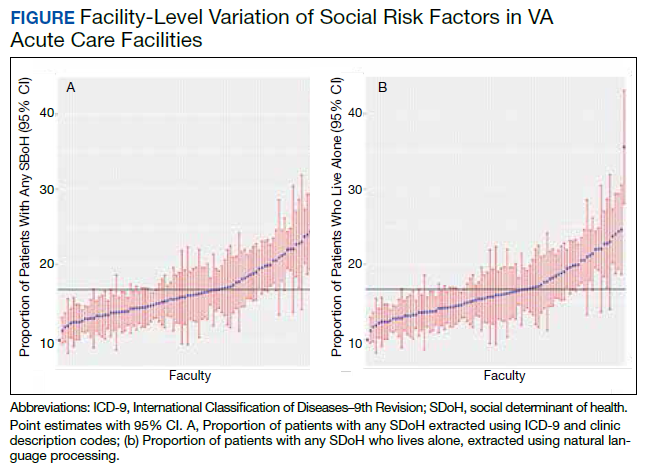
When utilizing the NLP algorithm, the documented prevalence of lives alone in the free text of the medical record was higher than administrative coding across all conditions (12.3% vs. 2.2%; P < .01). Among each of the 3 assessed conditions, HF (14.4% vs 2.0%, P < .01) had higher levels of lives alone compared with pneumonia (11% vs 1.9%, P < .01), and AMI (10.2% vs 1.4%, P < .01) when using the NLP algorithm. When we examined the documented facility-level variation in the proportion of individuals with any of the 5 SDoH administrative codes or NLP, we found large variability across all facilities—regardless of extraction method (Figure).
Discussion
While SDoH are known to impact health outcomes, the presence of these risk factors in administrative data among individuals hospitalized for common medical issues is low and variable across VHA facilities. Understanding the documented, facility-level variability of these measures may assist the VHA in determining how it invests time and resources—as different facilities may disproportionately serve a higher number of vulnerable individuals. Beyond the VHA, these findings have generalizable lessons for the US health care system, which has come to recognize how these risk factors impact patients’ health.10
Although the proportion of individuals with any of the assessed SDoH identified by administrative data was low, our findings are in line with recent studies that showed other risk factors such as social isolation (0.65%), housing issues (0.19%), and financial strain (0.07%) had similarly low prevalence.8,11 Although the exact prevalence of such factors remains unclear, these findings highlight that SDoH do not appear to be well documented in administrative data. Low coding rates are likely due to the fact that SDoH administrative codes are not tied to financial reimbursement—thus not incentivizing their use by clinicians or hospital systems.
In 2014, an Institute of Medicine report suggested that collection of SDoH in electronic health data as a means to better empower clinicians and health care systems to address social disparities and further support research in SDoH.12 Since then, data collection using SDoH screening tools has become more common across settings, but is not consistently translated to standardized data due to lack of industry consensus and technical barriers.13 To improve this process, the Centers for Medicare and Medicaid Services created “z-codes” for the ICD-10 classification system—a subset of codes that are meant to better capture patients’ underlying social risk.14 It remains to be seen if such administrative codes have improved the documentation of SDoH.
As health care systems have grown to understand the impact of SDoH on health outcomes,other means of collecting these data have evolved.1,10 For example, NLP-based extraction methods and electronic screening tools have been proposed and utilized as alternative for obtaining this information. Our findings suggest that some of these measures (eg, lives alone) often may be documented as part of routine care in the electronic health record, thus highlighting NLP as a tool to obtain such data. However, other studies using NLP technology to extract SDoH have shown this technology is often complicated by quality issues (ie, missing data), complex methods, and poor integration with current information technology infrastructures—thus limiting its use in health care delivery.15-18
While variance among SDoH across a national health care system is natural, it remains an important systems-level characteristic that health care leaders and policymakers should appreciate. As health care systems disperse financial resources and initiate quality improvement initiatives to address SDoH, knowing that not all facilities are equally affected by SDoH should impact allocation of such resources and energies. Although previous work has highlighted regional and neighborhood levels of variation within the VHA and other health care systems, to our knowledge, this is the first study to examine variability at the facility-level within the VHA.2,4,13,19
Limitations
There are several limitations to this study. First, though our findings are in line with previous data in other health care systems, generalizability beyond the VA, which primarily cares for older, male patients, may be limited.8 Though, as the nation’s largest health care system, lessons from the VHA can still be useful for other health care systems as they consider SDoH variation. Second, among the many SDoH previously identified to impact health, our analysis only focused on 5 such variables. Administrative and medical record documentation of other SDoH may be more common and less variable across institutions. Third, while our data suggests facility-level variation in these measures, this may be in part related to variation in coding across facilities. However, the single SDoH variable extracted using NLP also varied at the facility-level, suggesting that coding may not entirely drive the variation observed.
Conclusions
As US health care systems continue to address SDoH, our findings highlight the various challenges in obtaining accurate data on a patient’s social risk. Moreover, these findings highlight the large variability that exists among institutions in a national integrated health care system. Future work should explore the prevalence and variance of other SDoH as a means to help guide resource allocation and prioritize spending to better address SDoH where it is most needed.
Acknowledgments
This work was supported by NHLBI R01 RO1 HL116522-01A1. Support for VA/CMS data is provided by the US Department of Veterans Affairs, Veterans Health Administration, Office of Research and Development, Health Services Research and Development, VA Information Resource Center (Project Numbers SDR 02-237 and 98-004).
1. Social determinants of health (SDOH). https://catalyst.nejm.org/doi/full/10.1056/CAT.17.0312. Published December 1, 2017. Accessed December 8, 2020.
2. Hatef E, Searle KM, Predmore Z, et al. The Impact of Social Determinants of Health on hospitalization in the Veterans Health Administration. Am J Prev Med. 2019;56(6):811-818. doi:10.1016/j.amepre.2018.12.012
3. Lushniak BD, Alley DE, Ulin B, Graffunder C. The National Prevention Strategy: leveraging multiple sectors to improve population health. Am J Public Health. 2015;105(2):229-231. doi:10.2105/AJPH.2014.302257
4. Nelson K, Schwartz G, Hernandez S, Simonetti J, Curtis I, Fihn SD. The association between neighborhood environment and mortality: results from a national study of veterans. J Gen Intern Med. 2017;32(4):416-422. doi:10.1007/s11606-016-3905-x
5. Gundlapalli AV, Redd A, Bolton D, et al. Patient-aligned care team engagement to connect veterans experiencing homelessness with appropriate health care. Med Care. 2017;55 Suppl 9 Suppl 2:S104-S110. doi:10.1097/MLR.0000000000000770
6. Rash CJ, DePhilippis D. Considerations for implementing contingency management in substance abuse treatment clinics: the Veterans Affairs initiative as a model. Perspect Behav Sci. 2019;42(3):479-499. doi:10.1007/s40614-019-00204-3.
7. Ompad DC, Galea S, Caiaffa WT, Vlahov D. Social determinants of the health of urban populations: methodologic considerations. J Urban Health. 2007;84(3 Suppl):i42-i53. doi:10.1007/s11524-007-9168-4
8. Hatef E, Rouhizadeh M, Tia I, et al. Assessing the availability of data on social and behavioral determinants in structured and unstructured electronic health records: a retrospective analysis of a multilevel health care system. JMIR Med Inform. 2019;7(3):e13802. doi:10.2196/13802
9. Conway M, Keyhani S, Christensen L, et al. Moonstone: a novel natural language processing system for inferring social risk from clinical narratives. J Biomed Semantics. 2019;10(1):6. doi:10.1186/s13326-019-0198-0
10. Adler NE, Cutler DM, Fielding JE, et al. Addressing social determinants of health and health disparities: a vital direction for health and health care. Discussion Paper. NAM Perspectives. National Academy of Medicine, Washington, DC. doi:10.31478/201609t
11. Cottrell EK, Dambrun K, Cowburn S, et al. Variation in electronic health record documentation of social determinants of health across a national network of community health centers. Am J Prev Med. 2019;57(6):S65-S73. doi:10.1016/j.amepre.2019.07.014
12. Committee on the Recommended Social and Behavioral Domains and Measures for Electronic Health Records, Board on Population Health and Public Health Practice, Institute of Medicine. Capturing Social and Behavioral Domains and Measures in Electronic Health Records: Phase 2. National Academies Press (US); 2015.
13. Gottlieb L, Tobey R, Cantor J, Hessler D, Adler NE. Integrating Social And Medical Data To Improve Population Health: Opportunities And Barriers. Health Aff (Millwood). 2016;35(11):2116-2123. doi:10.1377/hlthaff.2016.0723
14. Centers for Medicare and Medicaid Service, Office of Minority Health. Z codes utilization among medicare fee-for-service (FFS) beneficiaries in 2017. Published January 2020. Accessed December 8, 2020. https://www.cms.gov/files/document/cms-omh-january2020-zcode-data-highlightpdf.pdf
15. Kharrazi H, Wang C, Scharfstein D. Prospective EHR-based clinical trials: the challenge of missing data. J Gen Intern Med. 2014;29(7):976-978. doi:10.1007/s11606-014-2883-0
16. Weiskopf NG, Weng C. Methods and dimensions of electronic health record data quality assessment: enabling reuse for clinical research. J Am Med Inform Assoc. 2013;20(1):144-151. doi:10.1136/amiajnl-2011-000681
17. Anzaldi LJ, Davison A, Boyd CM, Leff B, Kharrazi H. Comparing clinician descriptions of frailty and geriatric syndromes using electronic health records: a retrospective cohort study. BMC Geriatr. 2017;17(1):248. doi:10.1186/s12877-017-0645-7
18. Chen T, Dredze M, Weiner JP, Kharrazi H. Identifying vulnerable older adult populations by contextualizing geriatric syndrome information in clinical notes of electronic health records. J Am Med Inform Assoc. 2019;26(8-9):787-795. doi:10.1093/jamia/ocz093
19. Raphael E, Gaynes R, Hamad R. Cross-sectional analysis of place-based and racial disparities in hospitalisation rates by disease category in California in 2001 and 2011. BMJ Open. 2019;9(10):e031556. doi:10.1136/bmjopen-2019-031556
Social determinants of health (SDoH) are social, economic, environmental, and occupational factors that are known to influence an individual’s health care utilization and clinical outcomes.1,2 Because the Veterans Health Administration (VHA) is charged to address both the medical and nonmedical needs of the veteran population, it is increasingly interested in the impact SDoH have on veteran care.3,4 To combat the adverse impact of such factors, the VHA has implemented several large-scale programs across the US that focus on prevalent SDoH, such as homelessness, substance abuse, and alcohol use disorders.5,6 While such risk factors are generally universal in their distribution, variation across regions, between urban and rural spaces, and even within cities has been shown to exist in private settings.7 Understanding such variability potentially could be helpful to US Department of Veterans Affairs (VA) policymakers and leaders to better allocate funding and resources to address such issues.
Although previous work has highlighted regional and neighborhood-level variability of SDoH, no study has examined the facility-level variability of commonly encountered social risk factors within the VHA.4,8 The aim of this study was to describe the interfacility variation of 5 common SDoH known to influence health and health outcomes among a national cohort of veterans hospitalized for common medical issues by using administrative data.
Methods
We used a national cohort of veterans aged ≥ 65 years who were hospitalized at a VHA acute care facility with a primary discharge diagnosis of acute myocardial infarction (AMI), heart failure (HF), or pneumonia in 2012. These conditions were chosen because they are publicly reported and frequently used for interfacility comparison.
Using the International Classification of Diseases–9th Revision (ICD-9) and VHA clinical stop codes, we calculated the median documented proportion of patients with any of the following 5 SDoH: lived alone, marginal housing, alcohol use disorder, substance use disorder, and use of substance use services for patients presenting with HF, MI, and pneumonia (Table). These SDoH were chosen because they are intervenable risk factors for which the VHA has several programs (eg, homeless outreach, substance abuse, and tobacco cessation). To examine the variability of these SDoH across VHA facilities, we determined the number of hospitals that had a sufficient number of admissions (≥ 50) to be included in the analyses. We then examined the administratively documented, facility-level variation in the proportion of individuals with any of the 5 SDoH administrative codes and examined the distribution of their use across all qualifying facilities.
Because variability may be due to regional coding differences, we examined the difference in the estimated prevalence of the risk factor lives alone by using a previously developed natural language processing (NLP) program.9 The NLP program is a rule-based system designed to automatically extract information that requires inferencing from clinical notes (eg, discharge summaries and nursing, social work, emergency department physician, primary care, and hospital admission notes). For instance, the program identifies whether there was direct or indirect evidence that the patient did or did not live alone. In addition to extracting data on lives alone, the NLP program has the capacity to extract information on lack of social support and living alone—2 characteristics without VHA interventions, which were not examined here. The NLP program was developed and evaluated using at least 1 year of notes prior to index hospitalization. Because this program was developed and validated on a 2012 data set, we were limited to using a cohort from this year as well.
All analyses were conducted using SAS Version 9.4. The San Francisco VA Medical Center Institutional Review Board approved this study.
Results
In total, 21,991 patients with either HF (9,853), pneumonia (9,362), or AMI (2,776) were identified across 91 VHA facilities. The majority were male (98%) and had a median (SD) age of 77.0 (9.0) years. The median facility-level proportion of veterans who had any of the SDoH risk factors extracted through administrative codes was low across all conditions, ranging from 0.5 to 2.2%. The most prevalent factors among patients admitted for HF, AMI, and pneumonia were lives alone (2.0% [Interquartile range (IQR), 1.0-5.2], 1.4% [IQR, 0-3.4], and 1.9% [IQR, 0.7-5.4]), substance use disorder (1.2% [IQR, 0-2.2], 1.6% [IQR: 0-3.0], and 1.3% [IQR, 0-2.2] and use of substance use services (0.9% [IQR, 0-1.6%], 1.0% [IQR, 0-1.7%], and 1.6% [IQR, 0-2.2%], respectively [Table]).
When utilizing the NLP algorithm, the documented prevalence of lives alone in the free text of the medical record was higher than administrative coding across all conditions (12.3% vs. 2.2%; P < .01). Among each of the 3 assessed conditions, HF (14.4% vs 2.0%, P < .01) had higher levels of lives alone compared with pneumonia (11% vs 1.9%, P < .01), and AMI (10.2% vs 1.4%, P < .01) when using the NLP algorithm. When we examined the documented facility-level variation in the proportion of individuals with any of the 5 SDoH administrative codes or NLP, we found large variability across all facilities—regardless of extraction method (Figure).
Discussion
While SDoH are known to impact health outcomes, the presence of these risk factors in administrative data among individuals hospitalized for common medical issues is low and variable across VHA facilities. Understanding the documented, facility-level variability of these measures may assist the VHA in determining how it invests time and resources—as different facilities may disproportionately serve a higher number of vulnerable individuals. Beyond the VHA, these findings have generalizable lessons for the US health care system, which has come to recognize how these risk factors impact patients’ health.10
Although the proportion of individuals with any of the assessed SDoH identified by administrative data was low, our findings are in line with recent studies that showed other risk factors such as social isolation (0.65%), housing issues (0.19%), and financial strain (0.07%) had similarly low prevalence.8,11 Although the exact prevalence of such factors remains unclear, these findings highlight that SDoH do not appear to be well documented in administrative data. Low coding rates are likely due to the fact that SDoH administrative codes are not tied to financial reimbursement—thus not incentivizing their use by clinicians or hospital systems.
In 2014, an Institute of Medicine report suggested that collection of SDoH in electronic health data as a means to better empower clinicians and health care systems to address social disparities and further support research in SDoH.12 Since then, data collection using SDoH screening tools has become more common across settings, but is not consistently translated to standardized data due to lack of industry consensus and technical barriers.13 To improve this process, the Centers for Medicare and Medicaid Services created “z-codes” for the ICD-10 classification system—a subset of codes that are meant to better capture patients’ underlying social risk.14 It remains to be seen if such administrative codes have improved the documentation of SDoH.
As health care systems have grown to understand the impact of SDoH on health outcomes,other means of collecting these data have evolved.1,10 For example, NLP-based extraction methods and electronic screening tools have been proposed and utilized as alternative for obtaining this information. Our findings suggest that some of these measures (eg, lives alone) often may be documented as part of routine care in the electronic health record, thus highlighting NLP as a tool to obtain such data. However, other studies using NLP technology to extract SDoH have shown this technology is often complicated by quality issues (ie, missing data), complex methods, and poor integration with current information technology infrastructures—thus limiting its use in health care delivery.15-18
While variance among SDoH across a national health care system is natural, it remains an important systems-level characteristic that health care leaders and policymakers should appreciate. As health care systems disperse financial resources and initiate quality improvement initiatives to address SDoH, knowing that not all facilities are equally affected by SDoH should impact allocation of such resources and energies. Although previous work has highlighted regional and neighborhood levels of variation within the VHA and other health care systems, to our knowledge, this is the first study to examine variability at the facility-level within the VHA.2,4,13,19
Limitations
There are several limitations to this study. First, though our findings are in line with previous data in other health care systems, generalizability beyond the VA, which primarily cares for older, male patients, may be limited.8 Though, as the nation’s largest health care system, lessons from the VHA can still be useful for other health care systems as they consider SDoH variation. Second, among the many SDoH previously identified to impact health, our analysis only focused on 5 such variables. Administrative and medical record documentation of other SDoH may be more common and less variable across institutions. Third, while our data suggests facility-level variation in these measures, this may be in part related to variation in coding across facilities. However, the single SDoH variable extracted using NLP also varied at the facility-level, suggesting that coding may not entirely drive the variation observed.
Conclusions
As US health care systems continue to address SDoH, our findings highlight the various challenges in obtaining accurate data on a patient’s social risk. Moreover, these findings highlight the large variability that exists among institutions in a national integrated health care system. Future work should explore the prevalence and variance of other SDoH as a means to help guide resource allocation and prioritize spending to better address SDoH where it is most needed.
Acknowledgments
This work was supported by NHLBI R01 RO1 HL116522-01A1. Support for VA/CMS data is provided by the US Department of Veterans Affairs, Veterans Health Administration, Office of Research and Development, Health Services Research and Development, VA Information Resource Center (Project Numbers SDR 02-237 and 98-004).
1. Social determinants of health (SDOH). https://catalyst.nejm.org/doi/full/10.1056/CAT.17.0312. Published December 1, 2017. Accessed December 8, 2020.
2. Hatef E, Searle KM, Predmore Z, et al. The Impact of Social Determinants of Health on hospitalization in the Veterans Health Administration. Am J Prev Med. 2019;56(6):811-818. doi:10.1016/j.amepre.2018.12.012
3. Lushniak BD, Alley DE, Ulin B, Graffunder C. The National Prevention Strategy: leveraging multiple sectors to improve population health. Am J Public Health. 2015;105(2):229-231. doi:10.2105/AJPH.2014.302257
4. Nelson K, Schwartz G, Hernandez S, Simonetti J, Curtis I, Fihn SD. The association between neighborhood environment and mortality: results from a national study of veterans. J Gen Intern Med. 2017;32(4):416-422. doi:10.1007/s11606-016-3905-x
5. Gundlapalli AV, Redd A, Bolton D, et al. Patient-aligned care team engagement to connect veterans experiencing homelessness with appropriate health care. Med Care. 2017;55 Suppl 9 Suppl 2:S104-S110. doi:10.1097/MLR.0000000000000770
6. Rash CJ, DePhilippis D. Considerations for implementing contingency management in substance abuse treatment clinics: the Veterans Affairs initiative as a model. Perspect Behav Sci. 2019;42(3):479-499. doi:10.1007/s40614-019-00204-3.
7. Ompad DC, Galea S, Caiaffa WT, Vlahov D. Social determinants of the health of urban populations: methodologic considerations. J Urban Health. 2007;84(3 Suppl):i42-i53. doi:10.1007/s11524-007-9168-4
8. Hatef E, Rouhizadeh M, Tia I, et al. Assessing the availability of data on social and behavioral determinants in structured and unstructured electronic health records: a retrospective analysis of a multilevel health care system. JMIR Med Inform. 2019;7(3):e13802. doi:10.2196/13802
9. Conway M, Keyhani S, Christensen L, et al. Moonstone: a novel natural language processing system for inferring social risk from clinical narratives. J Biomed Semantics. 2019;10(1):6. doi:10.1186/s13326-019-0198-0
10. Adler NE, Cutler DM, Fielding JE, et al. Addressing social determinants of health and health disparities: a vital direction for health and health care. Discussion Paper. NAM Perspectives. National Academy of Medicine, Washington, DC. doi:10.31478/201609t
11. Cottrell EK, Dambrun K, Cowburn S, et al. Variation in electronic health record documentation of social determinants of health across a national network of community health centers. Am J Prev Med. 2019;57(6):S65-S73. doi:10.1016/j.amepre.2019.07.014
12. Committee on the Recommended Social and Behavioral Domains and Measures for Electronic Health Records, Board on Population Health and Public Health Practice, Institute of Medicine. Capturing Social and Behavioral Domains and Measures in Electronic Health Records: Phase 2. National Academies Press (US); 2015.
13. Gottlieb L, Tobey R, Cantor J, Hessler D, Adler NE. Integrating Social And Medical Data To Improve Population Health: Opportunities And Barriers. Health Aff (Millwood). 2016;35(11):2116-2123. doi:10.1377/hlthaff.2016.0723
14. Centers for Medicare and Medicaid Service, Office of Minority Health. Z codes utilization among medicare fee-for-service (FFS) beneficiaries in 2017. Published January 2020. Accessed December 8, 2020. https://www.cms.gov/files/document/cms-omh-january2020-zcode-data-highlightpdf.pdf
15. Kharrazi H, Wang C, Scharfstein D. Prospective EHR-based clinical trials: the challenge of missing data. J Gen Intern Med. 2014;29(7):976-978. doi:10.1007/s11606-014-2883-0
16. Weiskopf NG, Weng C. Methods and dimensions of electronic health record data quality assessment: enabling reuse for clinical research. J Am Med Inform Assoc. 2013;20(1):144-151. doi:10.1136/amiajnl-2011-000681
17. Anzaldi LJ, Davison A, Boyd CM, Leff B, Kharrazi H. Comparing clinician descriptions of frailty and geriatric syndromes using electronic health records: a retrospective cohort study. BMC Geriatr. 2017;17(1):248. doi:10.1186/s12877-017-0645-7
18. Chen T, Dredze M, Weiner JP, Kharrazi H. Identifying vulnerable older adult populations by contextualizing geriatric syndrome information in clinical notes of electronic health records. J Am Med Inform Assoc. 2019;26(8-9):787-795. doi:10.1093/jamia/ocz093
19. Raphael E, Gaynes R, Hamad R. Cross-sectional analysis of place-based and racial disparities in hospitalisation rates by disease category in California in 2001 and 2011. BMJ Open. 2019;9(10):e031556. doi:10.1136/bmjopen-2019-031556
Posttraumatic Stress Disorder-Associated Cognitive Deficits on the Repeatable Battery for the Assessment of Neuropsychological Status in a Veteran Population
Posttraumatic stress disorder (PTSD) affects about 10 to 25% of veterans in the US and is associated with reductions in quality of life and poor occupational functioning.1,2 PTSD is often associated with multiple cognitive deficits that play a role in a number of clinical symptoms and impair cognition beyond what can be solely attributed to the effects of physical or psychological trauma.3-5 Although the literature on the pattern and magnitude of cognitive deficits associated with PTSD is mixed, dysfunction in attention, verbal memory, speed of information processing, working memory, and executive functioning are the most consistent findings.6-11Verbal memory and attention seem to be particularly negatively impacted by PTSD and especially so in combat-exposed war veterans.7,12 Verbal memory difficulties in returning war veterans also may mediate quality of life and be particularly disruptive to everyday functioning.13 Further, evidence exists that a diagnosis of PTSD is associated with increased risk for dementia and deficits in episodic memory in older adults.14,15
The PTSD-associated cognitive deficits are routinely assessed through neuropsychological measures within the US Department of Veteran Affairs (VA). The Repeatable Battery for the Assessment of Neuropsychological Status (RBANS) is a commonly used cognitive screening measure in medical settings, and prior research has reinforced its clinical utility across a variety of populations, including Alzheimer disease, schizophrenia, Parkinson disease, Huntington disease, stroke, and traumatic brain injury (TBI).16-24
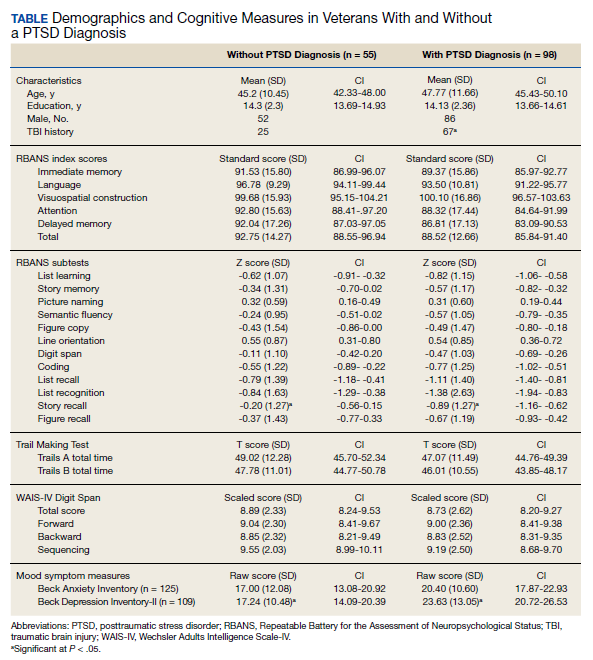
McKay and colleagues previously examined the use of the RBANS within a sample of individuals who had a history of moderate-to-severe TBIs, with findings suggesting the RBANS is a valid and reliable screening measure in this population.25However, McKay and colleagues used a carefully defined sample in a cognitive neurorehabilitation setting, many of whom experienced a TBI significant enough to require ongoing medical monitoring, attendant care, or substantial support services.
The influence of PTSD-associated cognitive deficits on the RBANS performance is unclear, and which subtests of the measure, if any, are differentially impacted in individuals with and those without a diagnosis of PTSD is uncertain. Further, less is known about the influence of PTSD in outpatient clinical settings when PTSD and TBI are not necessarily the primary presenting problem. The purpose of the current study was to determine the influence of a PTSD diagnosis on performance on the RBANS in an outpatient VA setting.
Methods
Participants included 153 veterans who were 90% male with a mean (SD) age of 46.8 (11.3) years and a mean (SD) education of 14.2 (2.3) years from a catchment area ranging from Montana south through western Texas, and all states west of that line, sequentially evaluated as part of a clinic workup at the California War Related Illness and Injury Study Center (WRIISC-CA). WRIISC-CA is a second-level evaluation clinic under patient primary care in the VA system dedicated to providing comprehensive medical evaluations on postdeployment veterans with complex medical concerns, including possible TBI and PTSD. Participants included 23 Vietnam-era, 72 Operation Desert Storm/Desert Shield-era, and 58 Operation Iraqi Freedom/Enduring Freedom-era veterans. We have previously published a more thorough analysis of medical characteristics for a WRIISC-CA sample.26
A Diagnostic and Statistical Manual of Mental Disorders, Fourth Edition (DSM IV) diagnosis of current PTSD was determined by the Clinician-Administered PTSD Scale (CAPS-IV), as administered or supervised by a licensed clinical psychologist during the course of the larger medical evaluation.27 Given the co-occurring nature of TBI and PTSD and their complicated relationship with regard to cognitive functioning, all veterans also underwent a comprehensive examination by a board-certified neurologist to assess for a possible history of TBI, based on the presence of at least 1 past event according to the guidelines recommended by the American Congress of Rehabilitation Medicine.28,29Veterans were categorized as having a history of no TBI, mild TBI, or moderate TBI. No veterans met criteria for history of severe TBI.Veterans were excluded from the analysis if unable to complete the mental health, neurological, or cognitive evaluations. Informed consent was obtained consistent with the Declaration of Helsinki and institutional guidelines established by the VA Palo Alto Human Subjects Review Committee. The study was approved by the VA Palo Alto and Stanford School of Medicine institutional review boards.
Cognitive Measures
All veterans completed a targeted cognitive battery that included the following: a reading recognition measure designed to estimate premorbid intellectual functioning (Wechsler Test of Adult Reading [WTAR]); a measure assessing auditory attention and working memory ability (Wechsler Adults Intelligence Scale-IV [WAIS-IV] Digit Span subtest); a measure assessing processing speed, attention, and cognitive flexibility (Trails A and B); and the RBANS.16,30-32The focus of the current study was on the RBANS, a brief cognitive screening measure that contains 12 subtests examining a variety of cognitive functions. Given that all participants were veterans receiving outpatient services, there was no nonpatient control group for comparison. To address this, all raw data were converted to standardized scores based on healthy normative data provided within the test manual. Specifically, the 12 RBANS subtest scores were converted to age-corrected standardized z scores, which in turn created a total summary score and 5 composite summary indexes: immediate memory, visuospatial/constructional, attention, language, and delayed memory. All veterans completed the Form A version of the measure.
Statistical Analyses
Group level differences on selective demographic and cognitive measures between veterans with a diagnosis of PTSD and those without were examined using t tests. Cognitive variables included standardized scores for the RBANS, including age-adjusted total summary score, index scores, and subtest scores.16 Estimated full-scale IQ and standardized summary scores from the WTAR, demographically adjusted standardized scores for the total time to complete Trails A and time to complete Trails B, and age-adjusted standardized scores for the WAIS-IV Digit Span subtest (forward, backward, and sequencing trials, as well as the summary total score) were examined for group differences.30,31,33 To further examine the association between PTSD and RBANS performance, multivariate multiple regressions were conducted using measures of episodic memory and processing speed from the RBANS (ie, story tasks, list learning tasks, and coding subtests). These specific measures were selected ad hoc based on extant literature.6,10The dependent variable for each analysis was the standardized score from the selected subtest; PTSD status, a diagnosis of TBI, a diagnosis of co-occurring TBI and PTSD, gender, and years of education were predictor variables.
Results
Of the 153 study participants, 98 (64%) met DSM-4 criteria for current PTSD, whereas 55 (36%) did not (Table). There was no group statistical difference between veterans with or without a diagnosis of PTSD for age, education, or gender (P < .05). A diagnosis of PTSD tended to be more frequent in participants with a history of head injury (χ2 = 7.72; P < .05). Veterans with a diagnosis of PTSD performed significantly worse on the RBANS Story Recall subtest compared with the results of those without PTSD (t[138] = 3.10; P < .01); performance on other cognitive measures was not significantly different between the PTSD groups. A diagnosis of PTSD was also significantly associated with self-reported depressive symptoms (Beck Depression Inventory-II; t[123] = -2.81; P < .01). Depressive symptoms were not associated with a history of TBI, and group differences were not significant.
Given the high co-occurrence of PTSD and TBI (68%) in our PTSD sample, secondary analyses examined the association of select diagnoses with performance on the RBANS, specifically veterans with a historical diagnosis of TBI (n = 92) from those without a diagnosis of TBI (n = 61), as well as those with co-occurring PTSD and TBI (n = 71) from those without (n = 82). The majority of the sample met criteria for a history of mild TBI (n = 79) when compared with moderate TBI (n = 13); none met criteria for a past history of severe TBI. PTSD status (β = .63, P = .04) and years of education (β = .16, P < .01) were associated with performance on the RBANS Story Recall subtest (R2= .23, F[5,139] = 8.11, P < .01). Education was the only significant predictor for the rest of the multivariate multiple regressions (all P < .05). A diagnosis of TBI or co-occurring PTSD and TBI was not significantly associated with performance on the Story Memory, Story Recall, List Learning, List Recall, or Coding subtests. multivariate analysis of variance tests for the hypothesis of an overall main effect of PTSD (F(5,130) = 1.08, P = .34), TBI (F[5,130] = .91, P = .48), or PTSD+TBI (F[5,130] =.47, P = .80) on the 4 selected tests were not significant.
Discussion
The findings of the present study suggest that veterans with PTSD perform worse on specific RBANS subtests compared with veterans without PTSD. Specifically, worse performance on the Story Recall subtest of the RBANS memory index was a significant predictor of a diagnosis of PTSD within the statistical model. This association with PTSD was not seen in other demographic (excluding education) or cognitive measures, including other memory tasks, such as List Recall and Figure Recall, and attentional measures, such as WAIS-IV Digit Span, and the Trail Making Test. Overall RBANS index scores were not significantly different between groups, though this is not surprising given that recent research suggests the RBANS composite scores have questionable validity and reliability.34
The finding that a measure of episodic memory is most influenced by PTSD status is consistent with prior research.35 However, there are several possible reasons why Story Recall in particular showed the greatest association, even more than other episodic memory measures. A review by Isaac and colleagues found a diagnosis of PTSD correlated with frontal lobe-associated memory deficits.6 As Story Recall provides only 2 rehearsal trials compared with the 4 trials provided in the RBANS List Learning subtest, it is possible that Story Recall relies more on attentional processes than on learning with repetition.
Research has indicated attention and verbal episodic memory dysfunction are associated with a diagnosis of PTSD in combat veterans, and individuals with a diagnosis of PTSD show deficits in executive functioning, including attention difficulties beyond what is seen in trauma-exposed controls.4,7,8,11,35Furthermore, a diagnosis of PTSD has been shown to be associated with impaired performance on the Logical Memory subtest of the Wechsler Memory Scale-Revised, a very similar measure to the RBANS Story Recall.36
The present finding that performance on a RBANS subtest was associated with a diagnosis of PTSD but not a history of TBI is not surprising. The majority of the present sample who reported a history of TBI met criteria for a remote head injury of mild severity (86%). Cognitive symptoms related to mild TBI are thought to generally resolve over time, and recent research suggests that PTSD symptoms may account for a substantial portion of reported postconcussive symptoms.37,38Similarly, recent research suggests a diagnosis of mild TBI does not necessarily result in additive cognitive impairment in combat veterans with a diagnosis of PTSD, and that a diagnosis of PTSD is more strongly associated with cognitive symptoms than is mild TBI.5,39,40
The lack of association with RBANS performance and co-occurring PTSD and TBI is less clear. Although both conditions are heterogenous, it may be that individuals with a diagnosis solely of PTSD are quantitively different from those with a concurrent diagnosis of PTSD and TBI (ie, PTSD presumed due to a mild TBI). Specifically, the impact of PTSD on cognition may be related to symptom severity and indexed trauma. A published systematic review on the PTSD-related cognitive impairment showed a medium-to-strong effect size for severity of PTSD symptoms on cognitive performance, with war trauma showing the strongest effect.4In particular, individuals who experience repeated or complex trauma are prone to experience PTSD symptoms with concurrent cognitive deficits, again suggesting the possibility of qualitative differences between outpatient veterans with PTSD and those with mild TBI associated PTSD.41While disentangling PTSD and mild TBI symptoms are notoriously difficult, future research aiming to examine these factors may be beneficial in the ability to draw larger conclusions on the relationship between cognition and PTSD.
Limitations
Several limitations may affect the generalizability of the findings. The present study used a veteran sample referred to a specialty clinic for complicated postdeployment health concerns. Although findings may not be representative of an inpatient population or clinics that focus solely on TBI, they may more adequately reflect veterans using clinical services at VA medical centers. We also did not include measures of PTSD symptom severity (eg, Posttraumatic Stress Disorder Checklist), instead using diagnosis based on the gold standard CAPS. In addition, the likelihood of the presence of a remote TBI was based on a clinical interview with a neurologist and not on acute neurologic findings. TBI is a heterogenous diagnosis, with multiple factors that likely influence cognitive performance, including location of the injury, type of injury, and time since injury, which may be lost during group analysis. Further, the RBANS is not intended to serve as a method for a differential diagnosis of PTSD or TBI. Concordant with this, the intention of the current study was to capture the quality of cognitive function on the RBANS within individuals with PTSD.
Conslusions
The ability for veterans to remember a short story following a delay (ie, RBANS Story Recall subtest) was negatively associated with a diagnosis of PTSD. Further, the RBANS best captured cognitive deficits associated with PTSD compared with those with a history of mild TBI, or co-occurring mild TBI and PTSD. These findings may provide insight into the interpretation and attribution of cognitive deficits in the veteran population and holds potential to guide future research examining focused cognitive phenotypes to provide precision targets in individual treatment.
1. Kessler RC, Sonnega A, Bromet E, Hughes M, Nelson CB. Posttraumatic stress disorder in the National Comorbidity Survey. Arch Gen Psychiatry. 1995;52(12):1048-1060. doi:10.1001/archpsyc.1995.03950240066012
2. Schnurr PP, Lunney CA, Bovin MJ, Marx BP. Posttraumatic stress disorder and quality of life: extension of findings to veterans of the wars in Iraq and Afghanistan. Clin Psychol Rev. 2009;29(8):727-735. doi:10.1016/j.cpr.2009.08.006
3. McNally RJ. Cognitive abnormalities in post-traumatic stress disorder. Trends Cogn Sci. 2006;10(6):271-277. doi:10.1016/j.tics.2006.04.007
4. Qureshi SU, Long ME, Bradshaw MR, et al. Does PTSD impair cognition beyond the effect of trauma? J Neuropsychiatry Clin Neurosci. 2011;23(1):16-28. doi:10.1176/jnp.23.1.jnp16
5. Gordon SN, Fitzpatrick PJ, Hilsabeck RC. No effect of PTSD and other psychiatric disorders on cognitive functioning in veterans with mild TBI. Clin Neuropsychol. 2011;25(3):337-347. doi:10.1080/13854046.2010.550634
6. Isaac CL, Cushway D, Jones GV. Is posttraumatic stress disorder associated with specific deficits in episodic memory? Clin Psychol Rev. 2006;26(8):939-955. doi:10.1016/j.cpr.2005.12.004
7. Johnsen GE, Asbjornsen AE. Consistent impaired verbal memory in PTSD: a meta-analysis. J Affect Disord. 2008;111(1):74-82. doi:10.1016/j.jad.2008.02.007
8. Polak AR, Witteveen AB, Reitsma JB, Olff M. The role of executive function in posttraumatic stress disorder: a systematic review. J Affect Disord. 2012;141(1):11-21. doi:10.1016/j.jad.2012.01.001
9. Scott JC, Matt GE, Wrocklage KM, et al. A quantitative meta-analysis of neurocognitive functioning in posttraumatic stress disorder. Psychol Bull. 2015;141(1):105-140.
10. Vasterling JJ, Duke LM, Brailey K, Constans JI, Allain AN Jr, Sutker PB. Attention, learning, and memory performances and intellectual resources in Vietnam veterans: PTSD and no disorder comparisons. Neuropsychology. 2002;16(1):5-14. doi:10.1037//0894-4105.16.1.5
11. Wrocklage KM, Schweinsburg BC, Krystal JH, et al. Neuropsychological functioning in veterans with posttraumatic stress disorder: associations with performance validity, comorbidities, and functional outcomes. J Int Neuropsychol Soc. 2016;19:1-13. doi:10.1017/S1355617716000059
12. Yehuda R, Keefe RS, Harvey PD, et al. Learning and memory in combat veterans with posttraumatic stress disorder. Am J Psychiatry. 1995;152(1):137-139. doi:10.1176/ajp.152.1.137
13. Martindale SL, Morissette SB, Kimbrel NA, et al. Neuropsychological functioning, coping, and quality of life among returning war veterans. Rehabil Psychol. 2016;61(3):231-239. doi:10.1037/rep0000076
14. Mackin SR, Lesselyong JA, Yaffe K. Pattern of cognitive impairment in older veterans with posttraumatic stress disorder evaluated at a memory disorders clinic. Int J Geriatr Psychiatry. 2012;27(6):637-642. doi:10.1002/gps.2763
15. Yaffe K, Vittinghoff E, Lindquist K, et al. Posttraumatic stress disorder and risk of dementia among US veterans. Arch Gen Psychiatry. 2010;67(6):608-613. doi:10.1001/archgenpsychiatry.2010.61
16. Randolph C. RBANS Manual: Repeatable Battery for the Assessment of Neuropsychological Status. Psychological Corporation; 1998.
17. Duff K, Humphreys Clark JD, O'Bryant SE, Mold JW, Schiffer RB, Sutker PB. Utility of the RBANS in detecting cognitive impairment associated with Alzheimer's disease: sensitivity, specificity, and positive and negative predictive powers. Arch Clin Neuropsychol. 2008;23(5):603-612. doi:10.1016/j.acn.2008.06.004
18. Gold JM, Queern C, Iannone VN, Buchanan RW. Repeatable battery for the assessment of neuropsychological status as a screening test in schizophrenia I: sensitivity, reliability, and validity. Am J Psychiatry. 1999;156(12):1944-1950. doi:10.1176/ajp.156.12.1944
19. Beatty WW, Ryder KA, Gontkovsky ST, Scott JG, McSwan KL, Bharucha KJ. Analyzing the subcortical dementia syndrome of Parkinson's disease using the RBANS. Arch Clin Neuropsychol. 2003;18(5):509-520.
20. Randolph C, Tierney MC, Mohr E, Chase TN. The Repeatable Battery for the Assessment of Neuropsychological Status (RBANS): preliminary clinical validity. J Clin Exp Neuropsychol. 1998;20(3):310-319. doi:10.1076/jcen.20.3.310.823
21. Larson E, Kirschner K, Bode R, Heinemann A, Goodman R. Construct and predictive validity of the repeatable battery for the assessment of neuropsychological status in the evaluation of stroke patients. J Clin Exp Neuropsychol. 2005;27(1):16-32. doi:10.1080/138033990513564
22. McKay C, Casey JE, Wertheimer J, Fichtenberg NL. Reliability and validity of the RBANS in a traumatic brain injured sample. Arch Clin Neuropsychol. 2007;22(1):91-98. doi:10.1016/j.acn.2006.11.003
23. Lippa SM, Hawes S, Jokic E, Caroselli JS. Sensitivity of the RBANS to acute traumatic brain injury and length of post-traumatic amnesia. Brain Inj. 2013;27(6):689-695. doi:10.3109/02699052.2013.771793
24. Pachet AK. Construct validity of the Repeatable Battery of Neuropsychological Status (RBANS) with acquired brain injury patients. Clin Neuropsychol. 2007;21(2):286-293. doi:10.1080/13854040500376823
25. McKay C, Wertheimer JC, Fichtenberg NL, Casey JE. The repeatable battery for the assessment of neuropsychological status (RBANS): clinical utility in a traumatic brain injury sample. Clin Neuropsychol. 2008;22(2):228-241. doi:10.1080/13854040701260370
26. Sheng T, Fairchild JK, Kong JY, et al. The influence of physical and mental health symptoms on Veterans’ functional health status. J Rehabil Res Dev. 2016;53(6):781-796. doi:10.1682/JRRD.2015.07.0146
27. Blake DD, Weathers FW, Nagy LM, et al. The development of a clinician-administered PTSD Scale. J Trauma Stress. 1995;8(1):75-90. doi:10.1007/BF02105408
28. Mattson EK, Nelson NW, Sponheim SR, Disner SG. The impact of PTSD and mTBI on the relationship between subjective and objective cognitive deficits in combat-exposed veterans. Neuropsychology. Oct 2019;33(7):913-921. doi:10.1037/neu0000560
29. Definition of mild traumatic brain injury. J Head Trauma Rehabil. 1993;8(3):86-87.
30. Wechsler D. Wechsler Test of Adult Reading (WTAR). The Psychological Corporation; 2001.
31. Wechsler D. Wechsler Adults Intelligence Scale – Fourth Edition: Administration and Scoring Manual. San Antonio, TX: Psychological Corporation; 2008.
32. Reitan R, Wolfson D. The Halstead-Reitan Neuropsychological Test Battery: Therapy and Clinical Interpretation. Tuscon, AZ: Neuropsychological Press; 1985.
33. Heaton R, Miller S, Taylor M, Grant I. Revised Comprehensive Norms for an Expanded Halstead-Reitan Battery: Demographically Ajdusted Neuropsychological Norms for African American and Caucasian Adults. Lutz, FL: Psychological Assesment Resources, Inc; 2004.
34. Vogt EM, Prichett GD, Hoelzle JB. Invariant two-component structure of the Repeatable Battery for the Assessment of Neuropsychological Status (RBANS). Appl Neuropsychol Adult. 2017;24(1)50-64. doi:10.1080/23279095.2015.1088852
35. Gilbertson MW, Gurvits TV, Lasko NB, Orr SP, Pitman RK. Multivariate assessment of explicit memory function in combat veterans with posttraumatic stress disorder. J Trauma Stress. 2001;14(2):413-432. doi:10.1023/A:1011181305501
36. Bremner JD, Randall P, Scott TM, et al. Deficits in short-term memory in adult survivors of childhood abuse. Psychiatry Res. 1995;59(1-2):97-107. doi:10.1016/0165-1781(95)02800-5
37. Belanger HG, Curtiss G, Demery JA, Lebowitz BK, Vanderploeg RD. Factors moderating neuropsychological outcomes following mild traumatic brain injury: a meta-analysis. J Int Neuropsychol Soc. 2005;11(3):215-227. doi:10.1017/S1355617705050277
38. Lippa SM, Pastorek NJ, Benge JF, Thornton GM. Postconcussive symptoms after blast and nonblast-related mild traumatic brain injuries in Afghanistan and Iraq war veterans. J Int Neuropsychol Soc. 2010;16(5):856-866. doi:10.1017/S1355617710000743
39. Soble JR, Spanierman LB, Fitzgerald Smith J. Neuropsychological functioning of combat veterans with posttraumatic stress disorder and mild traumatic brain injury. J Clin Exp Neuropsychol. 2013;35(5):551-561. doi:10.1080/13803395.2013.798398
40. Vanderploeg RD, Belanger HG, Curtiss G. Mild traumatic brain injury and posttraumatic stress disorder and their associations with health symptoms. Arch Phys Med Rehabil. 2009;90(7):1084-1093. doi:10.1016/j.apmr.2009.01.023
41. Ainamani HE, Elbert T, Olema DK, Hecker T. PTSD symptom severity relates to cognitive and psycho-social dysfunctioning - a study with Congolese refugees in Uganda. Eur J Psychotraumatol. 2017;8(1):1283086. doi:10.1080/20008198.2017.1283086
Posttraumatic stress disorder (PTSD) affects about 10 to 25% of veterans in the US and is associated with reductions in quality of life and poor occupational functioning.1,2 PTSD is often associated with multiple cognitive deficits that play a role in a number of clinical symptoms and impair cognition beyond what can be solely attributed to the effects of physical or psychological trauma.3-5 Although the literature on the pattern and magnitude of cognitive deficits associated with PTSD is mixed, dysfunction in attention, verbal memory, speed of information processing, working memory, and executive functioning are the most consistent findings.6-11Verbal memory and attention seem to be particularly negatively impacted by PTSD and especially so in combat-exposed war veterans.7,12 Verbal memory difficulties in returning war veterans also may mediate quality of life and be particularly disruptive to everyday functioning.13 Further, evidence exists that a diagnosis of PTSD is associated with increased risk for dementia and deficits in episodic memory in older adults.14,15
The PTSD-associated cognitive deficits are routinely assessed through neuropsychological measures within the US Department of Veteran Affairs (VA). The Repeatable Battery for the Assessment of Neuropsychological Status (RBANS) is a commonly used cognitive screening measure in medical settings, and prior research has reinforced its clinical utility across a variety of populations, including Alzheimer disease, schizophrenia, Parkinson disease, Huntington disease, stroke, and traumatic brain injury (TBI).16-24
McKay and colleagues previously examined the use of the RBANS within a sample of individuals who had a history of moderate-to-severe TBIs, with findings suggesting the RBANS is a valid and reliable screening measure in this population.25However, McKay and colleagues used a carefully defined sample in a cognitive neurorehabilitation setting, many of whom experienced a TBI significant enough to require ongoing medical monitoring, attendant care, or substantial support services.
The influence of PTSD-associated cognitive deficits on the RBANS performance is unclear, and which subtests of the measure, if any, are differentially impacted in individuals with and those without a diagnosis of PTSD is uncertain. Further, less is known about the influence of PTSD in outpatient clinical settings when PTSD and TBI are not necessarily the primary presenting problem. The purpose of the current study was to determine the influence of a PTSD diagnosis on performance on the RBANS in an outpatient VA setting.
Methods
Participants included 153 veterans who were 90% male with a mean (SD) age of 46.8 (11.3) years and a mean (SD) education of 14.2 (2.3) years from a catchment area ranging from Montana south through western Texas, and all states west of that line, sequentially evaluated as part of a clinic workup at the California War Related Illness and Injury Study Center (WRIISC-CA). WRIISC-CA is a second-level evaluation clinic under patient primary care in the VA system dedicated to providing comprehensive medical evaluations on postdeployment veterans with complex medical concerns, including possible TBI and PTSD. Participants included 23 Vietnam-era, 72 Operation Desert Storm/Desert Shield-era, and 58 Operation Iraqi Freedom/Enduring Freedom-era veterans. We have previously published a more thorough analysis of medical characteristics for a WRIISC-CA sample.26
A Diagnostic and Statistical Manual of Mental Disorders, Fourth Edition (DSM IV) diagnosis of current PTSD was determined by the Clinician-Administered PTSD Scale (CAPS-IV), as administered or supervised by a licensed clinical psychologist during the course of the larger medical evaluation.27 Given the co-occurring nature of TBI and PTSD and their complicated relationship with regard to cognitive functioning, all veterans also underwent a comprehensive examination by a board-certified neurologist to assess for a possible history of TBI, based on the presence of at least 1 past event according to the guidelines recommended by the American Congress of Rehabilitation Medicine.28,29Veterans were categorized as having a history of no TBI, mild TBI, or moderate TBI. No veterans met criteria for history of severe TBI.Veterans were excluded from the analysis if unable to complete the mental health, neurological, or cognitive evaluations. Informed consent was obtained consistent with the Declaration of Helsinki and institutional guidelines established by the VA Palo Alto Human Subjects Review Committee. The study was approved by the VA Palo Alto and Stanford School of Medicine institutional review boards.
Cognitive Measures
All veterans completed a targeted cognitive battery that included the following: a reading recognition measure designed to estimate premorbid intellectual functioning (Wechsler Test of Adult Reading [WTAR]); a measure assessing auditory attention and working memory ability (Wechsler Adults Intelligence Scale-IV [WAIS-IV] Digit Span subtest); a measure assessing processing speed, attention, and cognitive flexibility (Trails A and B); and the RBANS.16,30-32The focus of the current study was on the RBANS, a brief cognitive screening measure that contains 12 subtests examining a variety of cognitive functions. Given that all participants were veterans receiving outpatient services, there was no nonpatient control group for comparison. To address this, all raw data were converted to standardized scores based on healthy normative data provided within the test manual. Specifically, the 12 RBANS subtest scores were converted to age-corrected standardized z scores, which in turn created a total summary score and 5 composite summary indexes: immediate memory, visuospatial/constructional, attention, language, and delayed memory. All veterans completed the Form A version of the measure.
Statistical Analyses
Group level differences on selective demographic and cognitive measures between veterans with a diagnosis of PTSD and those without were examined using t tests. Cognitive variables included standardized scores for the RBANS, including age-adjusted total summary score, index scores, and subtest scores.16 Estimated full-scale IQ and standardized summary scores from the WTAR, demographically adjusted standardized scores for the total time to complete Trails A and time to complete Trails B, and age-adjusted standardized scores for the WAIS-IV Digit Span subtest (forward, backward, and sequencing trials, as well as the summary total score) were examined for group differences.30,31,33 To further examine the association between PTSD and RBANS performance, multivariate multiple regressions were conducted using measures of episodic memory and processing speed from the RBANS (ie, story tasks, list learning tasks, and coding subtests). These specific measures were selected ad hoc based on extant literature.6,10The dependent variable for each analysis was the standardized score from the selected subtest; PTSD status, a diagnosis of TBI, a diagnosis of co-occurring TBI and PTSD, gender, and years of education were predictor variables.
Results
Of the 153 study participants, 98 (64%) met DSM-4 criteria for current PTSD, whereas 55 (36%) did not (Table). There was no group statistical difference between veterans with or without a diagnosis of PTSD for age, education, or gender (P < .05). A diagnosis of PTSD tended to be more frequent in participants with a history of head injury (χ2 = 7.72; P < .05). Veterans with a diagnosis of PTSD performed significantly worse on the RBANS Story Recall subtest compared with the results of those without PTSD (t[138] = 3.10; P < .01); performance on other cognitive measures was not significantly different between the PTSD groups. A diagnosis of PTSD was also significantly associated with self-reported depressive symptoms (Beck Depression Inventory-II; t[123] = -2.81; P < .01). Depressive symptoms were not associated with a history of TBI, and group differences were not significant.
Given the high co-occurrence of PTSD and TBI (68%) in our PTSD sample, secondary analyses examined the association of select diagnoses with performance on the RBANS, specifically veterans with a historical diagnosis of TBI (n = 92) from those without a diagnosis of TBI (n = 61), as well as those with co-occurring PTSD and TBI (n = 71) from those without (n = 82). The majority of the sample met criteria for a history of mild TBI (n = 79) when compared with moderate TBI (n = 13); none met criteria for a past history of severe TBI. PTSD status (β = .63, P = .04) and years of education (β = .16, P < .01) were associated with performance on the RBANS Story Recall subtest (R2= .23, F[5,139] = 8.11, P < .01). Education was the only significant predictor for the rest of the multivariate multiple regressions (all P < .05). A diagnosis of TBI or co-occurring PTSD and TBI was not significantly associated with performance on the Story Memory, Story Recall, List Learning, List Recall, or Coding subtests. multivariate analysis of variance tests for the hypothesis of an overall main effect of PTSD (F(5,130) = 1.08, P = .34), TBI (F[5,130] = .91, P = .48), or PTSD+TBI (F[5,130] =.47, P = .80) on the 4 selected tests were not significant.
Discussion
The findings of the present study suggest that veterans with PTSD perform worse on specific RBANS subtests compared with veterans without PTSD. Specifically, worse performance on the Story Recall subtest of the RBANS memory index was a significant predictor of a diagnosis of PTSD within the statistical model. This association with PTSD was not seen in other demographic (excluding education) or cognitive measures, including other memory tasks, such as List Recall and Figure Recall, and attentional measures, such as WAIS-IV Digit Span, and the Trail Making Test. Overall RBANS index scores were not significantly different between groups, though this is not surprising given that recent research suggests the RBANS composite scores have questionable validity and reliability.34
The finding that a measure of episodic memory is most influenced by PTSD status is consistent with prior research.35 However, there are several possible reasons why Story Recall in particular showed the greatest association, even more than other episodic memory measures. A review by Isaac and colleagues found a diagnosis of PTSD correlated with frontal lobe-associated memory deficits.6 As Story Recall provides only 2 rehearsal trials compared with the 4 trials provided in the RBANS List Learning subtest, it is possible that Story Recall relies more on attentional processes than on learning with repetition.
Research has indicated attention and verbal episodic memory dysfunction are associated with a diagnosis of PTSD in combat veterans, and individuals with a diagnosis of PTSD show deficits in executive functioning, including attention difficulties beyond what is seen in trauma-exposed controls.4,7,8,11,35Furthermore, a diagnosis of PTSD has been shown to be associated with impaired performance on the Logical Memory subtest of the Wechsler Memory Scale-Revised, a very similar measure to the RBANS Story Recall.36
The present finding that performance on a RBANS subtest was associated with a diagnosis of PTSD but not a history of TBI is not surprising. The majority of the present sample who reported a history of TBI met criteria for a remote head injury of mild severity (86%). Cognitive symptoms related to mild TBI are thought to generally resolve over time, and recent research suggests that PTSD symptoms may account for a substantial portion of reported postconcussive symptoms.37,38Similarly, recent research suggests a diagnosis of mild TBI does not necessarily result in additive cognitive impairment in combat veterans with a diagnosis of PTSD, and that a diagnosis of PTSD is more strongly associated with cognitive symptoms than is mild TBI.5,39,40
The lack of association with RBANS performance and co-occurring PTSD and TBI is less clear. Although both conditions are heterogenous, it may be that individuals with a diagnosis solely of PTSD are quantitively different from those with a concurrent diagnosis of PTSD and TBI (ie, PTSD presumed due to a mild TBI). Specifically, the impact of PTSD on cognition may be related to symptom severity and indexed trauma. A published systematic review on the PTSD-related cognitive impairment showed a medium-to-strong effect size for severity of PTSD symptoms on cognitive performance, with war trauma showing the strongest effect.4In particular, individuals who experience repeated or complex trauma are prone to experience PTSD symptoms with concurrent cognitive deficits, again suggesting the possibility of qualitative differences between outpatient veterans with PTSD and those with mild TBI associated PTSD.41While disentangling PTSD and mild TBI symptoms are notoriously difficult, future research aiming to examine these factors may be beneficial in the ability to draw larger conclusions on the relationship between cognition and PTSD.
Limitations
Several limitations may affect the generalizability of the findings. The present study used a veteran sample referred to a specialty clinic for complicated postdeployment health concerns. Although findings may not be representative of an inpatient population or clinics that focus solely on TBI, they may more adequately reflect veterans using clinical services at VA medical centers. We also did not include measures of PTSD symptom severity (eg, Posttraumatic Stress Disorder Checklist), instead using diagnosis based on the gold standard CAPS. In addition, the likelihood of the presence of a remote TBI was based on a clinical interview with a neurologist and not on acute neurologic findings. TBI is a heterogenous diagnosis, with multiple factors that likely influence cognitive performance, including location of the injury, type of injury, and time since injury, which may be lost during group analysis. Further, the RBANS is not intended to serve as a method for a differential diagnosis of PTSD or TBI. Concordant with this, the intention of the current study was to capture the quality of cognitive function on the RBANS within individuals with PTSD.
Conslusions
The ability for veterans to remember a short story following a delay (ie, RBANS Story Recall subtest) was negatively associated with a diagnosis of PTSD. Further, the RBANS best captured cognitive deficits associated with PTSD compared with those with a history of mild TBI, or co-occurring mild TBI and PTSD. These findings may provide insight into the interpretation and attribution of cognitive deficits in the veteran population and holds potential to guide future research examining focused cognitive phenotypes to provide precision targets in individual treatment.
1. Kessler RC, Sonnega A, Bromet E, Hughes M, Nelson CB. Posttraumatic stress disorder in the National Comorbidity Survey. Arch Gen Psychiatry. 1995;52(12):1048-1060. doi:10.1001/archpsyc.1995.03950240066012
2. Schnurr PP, Lunney CA, Bovin MJ, Marx BP. Posttraumatic stress disorder and quality of life: extension of findings to veterans of the wars in Iraq and Afghanistan. Clin Psychol Rev. 2009;29(8):727-735. doi:10.1016/j.cpr.2009.08.006
3. McNally RJ. Cognitive abnormalities in post-traumatic stress disorder. Trends Cogn Sci. 2006;10(6):271-277. doi:10.1016/j.tics.2006.04.007
4. Qureshi SU, Long ME, Bradshaw MR, et al. Does PTSD impair cognition beyond the effect of trauma? J Neuropsychiatry Clin Neurosci. 2011;23(1):16-28. doi:10.1176/jnp.23.1.jnp16
5. Gordon SN, Fitzpatrick PJ, Hilsabeck RC. No effect of PTSD and other psychiatric disorders on cognitive functioning in veterans with mild TBI. Clin Neuropsychol. 2011;25(3):337-347. doi:10.1080/13854046.2010.550634
6. Isaac CL, Cushway D, Jones GV. Is posttraumatic stress disorder associated with specific deficits in episodic memory? Clin Psychol Rev. 2006;26(8):939-955. doi:10.1016/j.cpr.2005.12.004
7. Johnsen GE, Asbjornsen AE. Consistent impaired verbal memory in PTSD: a meta-analysis. J Affect Disord. 2008;111(1):74-82. doi:10.1016/j.jad.2008.02.007
8. Polak AR, Witteveen AB, Reitsma JB, Olff M. The role of executive function in posttraumatic stress disorder: a systematic review. J Affect Disord. 2012;141(1):11-21. doi:10.1016/j.jad.2012.01.001
9. Scott JC, Matt GE, Wrocklage KM, et al. A quantitative meta-analysis of neurocognitive functioning in posttraumatic stress disorder. Psychol Bull. 2015;141(1):105-140.
10. Vasterling JJ, Duke LM, Brailey K, Constans JI, Allain AN Jr, Sutker PB. Attention, learning, and memory performances and intellectual resources in Vietnam veterans: PTSD and no disorder comparisons. Neuropsychology. 2002;16(1):5-14. doi:10.1037//0894-4105.16.1.5
11. Wrocklage KM, Schweinsburg BC, Krystal JH, et al. Neuropsychological functioning in veterans with posttraumatic stress disorder: associations with performance validity, comorbidities, and functional outcomes. J Int Neuropsychol Soc. 2016;19:1-13. doi:10.1017/S1355617716000059
12. Yehuda R, Keefe RS, Harvey PD, et al. Learning and memory in combat veterans with posttraumatic stress disorder. Am J Psychiatry. 1995;152(1):137-139. doi:10.1176/ajp.152.1.137
13. Martindale SL, Morissette SB, Kimbrel NA, et al. Neuropsychological functioning, coping, and quality of life among returning war veterans. Rehabil Psychol. 2016;61(3):231-239. doi:10.1037/rep0000076
14. Mackin SR, Lesselyong JA, Yaffe K. Pattern of cognitive impairment in older veterans with posttraumatic stress disorder evaluated at a memory disorders clinic. Int J Geriatr Psychiatry. 2012;27(6):637-642. doi:10.1002/gps.2763
15. Yaffe K, Vittinghoff E, Lindquist K, et al. Posttraumatic stress disorder and risk of dementia among US veterans. Arch Gen Psychiatry. 2010;67(6):608-613. doi:10.1001/archgenpsychiatry.2010.61
16. Randolph C. RBANS Manual: Repeatable Battery for the Assessment of Neuropsychological Status. Psychological Corporation; 1998.
17. Duff K, Humphreys Clark JD, O'Bryant SE, Mold JW, Schiffer RB, Sutker PB. Utility of the RBANS in detecting cognitive impairment associated with Alzheimer's disease: sensitivity, specificity, and positive and negative predictive powers. Arch Clin Neuropsychol. 2008;23(5):603-612. doi:10.1016/j.acn.2008.06.004
18. Gold JM, Queern C, Iannone VN, Buchanan RW. Repeatable battery for the assessment of neuropsychological status as a screening test in schizophrenia I: sensitivity, reliability, and validity. Am J Psychiatry. 1999;156(12):1944-1950. doi:10.1176/ajp.156.12.1944
19. Beatty WW, Ryder KA, Gontkovsky ST, Scott JG, McSwan KL, Bharucha KJ. Analyzing the subcortical dementia syndrome of Parkinson's disease using the RBANS. Arch Clin Neuropsychol. 2003;18(5):509-520.
20. Randolph C, Tierney MC, Mohr E, Chase TN. The Repeatable Battery for the Assessment of Neuropsychological Status (RBANS): preliminary clinical validity. J Clin Exp Neuropsychol. 1998;20(3):310-319. doi:10.1076/jcen.20.3.310.823
21. Larson E, Kirschner K, Bode R, Heinemann A, Goodman R. Construct and predictive validity of the repeatable battery for the assessment of neuropsychological status in the evaluation of stroke patients. J Clin Exp Neuropsychol. 2005;27(1):16-32. doi:10.1080/138033990513564
22. McKay C, Casey JE, Wertheimer J, Fichtenberg NL. Reliability and validity of the RBANS in a traumatic brain injured sample. Arch Clin Neuropsychol. 2007;22(1):91-98. doi:10.1016/j.acn.2006.11.003
23. Lippa SM, Hawes S, Jokic E, Caroselli JS. Sensitivity of the RBANS to acute traumatic brain injury and length of post-traumatic amnesia. Brain Inj. 2013;27(6):689-695. doi:10.3109/02699052.2013.771793
24. Pachet AK. Construct validity of the Repeatable Battery of Neuropsychological Status (RBANS) with acquired brain injury patients. Clin Neuropsychol. 2007;21(2):286-293. doi:10.1080/13854040500376823
25. McKay C, Wertheimer JC, Fichtenberg NL, Casey JE. The repeatable battery for the assessment of neuropsychological status (RBANS): clinical utility in a traumatic brain injury sample. Clin Neuropsychol. 2008;22(2):228-241. doi:10.1080/13854040701260370
26. Sheng T, Fairchild JK, Kong JY, et al. The influence of physical and mental health symptoms on Veterans’ functional health status. J Rehabil Res Dev. 2016;53(6):781-796. doi:10.1682/JRRD.2015.07.0146
27. Blake DD, Weathers FW, Nagy LM, et al. The development of a clinician-administered PTSD Scale. J Trauma Stress. 1995;8(1):75-90. doi:10.1007/BF02105408
28. Mattson EK, Nelson NW, Sponheim SR, Disner SG. The impact of PTSD and mTBI on the relationship between subjective and objective cognitive deficits in combat-exposed veterans. Neuropsychology. Oct 2019;33(7):913-921. doi:10.1037/neu0000560
29. Definition of mild traumatic brain injury. J Head Trauma Rehabil. 1993;8(3):86-87.
30. Wechsler D. Wechsler Test of Adult Reading (WTAR). The Psychological Corporation; 2001.
31. Wechsler D. Wechsler Adults Intelligence Scale – Fourth Edition: Administration and Scoring Manual. San Antonio, TX: Psychological Corporation; 2008.
32. Reitan R, Wolfson D. The Halstead-Reitan Neuropsychological Test Battery: Therapy and Clinical Interpretation. Tuscon, AZ: Neuropsychological Press; 1985.
33. Heaton R, Miller S, Taylor M, Grant I. Revised Comprehensive Norms for an Expanded Halstead-Reitan Battery: Demographically Ajdusted Neuropsychological Norms for African American and Caucasian Adults. Lutz, FL: Psychological Assesment Resources, Inc; 2004.
34. Vogt EM, Prichett GD, Hoelzle JB. Invariant two-component structure of the Repeatable Battery for the Assessment of Neuropsychological Status (RBANS). Appl Neuropsychol Adult. 2017;24(1)50-64. doi:10.1080/23279095.2015.1088852
35. Gilbertson MW, Gurvits TV, Lasko NB, Orr SP, Pitman RK. Multivariate assessment of explicit memory function in combat veterans with posttraumatic stress disorder. J Trauma Stress. 2001;14(2):413-432. doi:10.1023/A:1011181305501
36. Bremner JD, Randall P, Scott TM, et al. Deficits in short-term memory in adult survivors of childhood abuse. Psychiatry Res. 1995;59(1-2):97-107. doi:10.1016/0165-1781(95)02800-5
37. Belanger HG, Curtiss G, Demery JA, Lebowitz BK, Vanderploeg RD. Factors moderating neuropsychological outcomes following mild traumatic brain injury: a meta-analysis. J Int Neuropsychol Soc. 2005;11(3):215-227. doi:10.1017/S1355617705050277
38. Lippa SM, Pastorek NJ, Benge JF, Thornton GM. Postconcussive symptoms after blast and nonblast-related mild traumatic brain injuries in Afghanistan and Iraq war veterans. J Int Neuropsychol Soc. 2010;16(5):856-866. doi:10.1017/S1355617710000743
39. Soble JR, Spanierman LB, Fitzgerald Smith J. Neuropsychological functioning of combat veterans with posttraumatic stress disorder and mild traumatic brain injury. J Clin Exp Neuropsychol. 2013;35(5):551-561. doi:10.1080/13803395.2013.798398
40. Vanderploeg RD, Belanger HG, Curtiss G. Mild traumatic brain injury and posttraumatic stress disorder and their associations with health symptoms. Arch Phys Med Rehabil. 2009;90(7):1084-1093. doi:10.1016/j.apmr.2009.01.023
41. Ainamani HE, Elbert T, Olema DK, Hecker T. PTSD symptom severity relates to cognitive and psycho-social dysfunctioning - a study with Congolese refugees in Uganda. Eur J Psychotraumatol. 2017;8(1):1283086. doi:10.1080/20008198.2017.1283086
“To Conserve Fighting Strength”: The Role of Military Culture in the Delivery of Care
Since 2001, nearly 2,000 US military service members have sustained traumatically acquired limb loss while serving in conflict zones primarily in Afghanistan and Iraq.1 Although most of these patients receive acute and long-term care in a military health facility, polytrauma programs within the Veterans Health Administration (VHA) treat other military patients with traumatic injuries while others receive specialized care in civilian medical programs. The Military Advanced Training Center (MATC) at Walter Reed National Military Medical Center (WRNMMC) provides a comprehensive rehabilitation program for patients with acquired traumatic limb loss.2
In this paper, we argue that receiving long-term care in military settings provides unique value for military patients because of the background therapeutic work such settings can provide. Currently, there are policy discussions that center on consolidating military health care under the oversight of the Defense Health Agency. This approach would develop a more centralized administration while also pursuing other measures to improve efficiency. When evaluating the current system, one key question remains: Would military service members and dependents seeking specific care or long-term rehabilitation programs be more effectively treated in nonmilitary settings?
Based on qualitative research, we argue that keeping a diverse range of military health programs has a positive and therapeutic impact. We also argue that the emergent literature about the importance of military culture to patients and the need for military cultural competence training for nonmilitary clinicians coupled with the results of a qualitative study of former patients at WRNMMC demonstrate that the social context at military treatment facilities offers a positive therapeutic impact.3
Program Description
This article is grounded in research conducted in the US Armed Forces Amputee Patient Care Program at WRNMMC. The study received WRNMMC Institutional Review Board approval in February 2012 and again for the continuation study in January 2015. The lead investigator for the research project was a medical anthropologist who worked with a research unit in the WRNMMC Department of Rehabilitation.
The main period of data collection occurred in 2 waves, the first between 2012 and 2014 and the second between 2015 and 2019. Patients arrived at WRNMMC within several days from the site of their injuries (nearly all were from Iraq and Afghanistan) via military medical facilities in Germany. After a period of recovery from the acute phase of their injuries, patients transitioned to outpatient housing and began their longer phase of care in the outpatient MATC.
On MATC admission, patients were assigned an occupational therapist, physical therapist, and prosthetist. In addition, rehabilitation physicians and orthopedic surgeons oversaw patient care. Social work and other programs provided additional services as needed.2 Patients were treated primarily for their orthopedic and extremity trauma and for neuropsychiatric injuries, such as mild traumatic brain injury. Other behavioral health services were available to support patients who reported symptoms of posttraumatic stress disorder, anxiety, depression, or other neuropsychological issues.
Patients had multiple daily appointments that shifted throughout the duration of their care. Initially a patient might have 2 physical therapy and 2 occupational therapy appointments daily, with each session lasting about an hour. Appointments with the orthotics and prosthetics service, which could be considerably longer were added as needed. These appointments required multiple castings, fittings, adjustments, and other activities. This also was the case with wound care, behavioral health, and other services and departments.
Cultural Competency
A recently published special issue of Academic Psychiatry described the important role that basic knowledge of military culture plays in effective care delivery to active-duty service members, guard and reserve, and veteran patients and families.4 Reger and colleagues also emphasized the importance of awareness of military culture to civilian clinicians particularly those providing care to service members.5
This concern with gaps in knowledge about recognizing the realities of military culture has given rise to an emergent literature on military cultural competence training for clinical providers.6 Cultural competence in health care settings is understood to be the practice of providing care within a social framework that acknowledges the social and cultural background of patients.7 In the military context, as in others, these discussions often are limited to behavioral health settings.8 This emergent literature provides researchers with important insights into understanding the scope and scale of military culture and the importance of delivering culturally competent care.
Beyond the concept of cultural competence, recognizing the importance of culture can be used to understand positive therapeutic impacts. In discussions of culture, service-members, veterans, and family members are shown to have adopted a set of ideas, values, roles, and behaviors. Mastering an awareness of those attributes is part of the process of delivering culturally competent care. At WRNMMC and other military treatment facilities, those attributes are “baked in” to the delivery of service—even when that service is provided by civilians. How that process operates is important to understanding the impact of the organization of clinical care.
Methods
Data were extracted from research conducted between 2012 and 2014 that investigated how former patients evaluated their posttreatment lives considering the care received in the MATC at WRNMMC. We used a lightly structured set of interview questions and categories in each interview that focused on 3 themes in the individual’s pathway to injury: education, joining their branch of service, injury experience. The focus was on developing an understanding of how events antecedent to the injury experience could influence the rehabilitation experience and postcare life. The second focus was on the experience of rehabilitation and to learn how the individual navigated community living after leaving care.
Results
Thirty-five participants with lower extremity amputations were recruited who had been discharged from the Amputee Patient Care Program ≥ 12 months prior to the study (Table 1). Participants were interviewed either over the telephone, or when possible, in person. Interviews were based on a lightly structured schedule designed to elicit accounts of community integration, which attended to reports of belongingness supported by accounts of social engagement in work, school, family, and social events. Interviews were analyzed using a modified content analysis approach. The study did not rely on a structured interview, but as is the case with many qualitative and ethnographic interviews, each session shared themes in common, such as questions about injury experience, rehabilitation experience, life after care (work, school, relationships), and so forth. Interviews were conducted by the lead author who was a medical anthropologist with training in health services research.
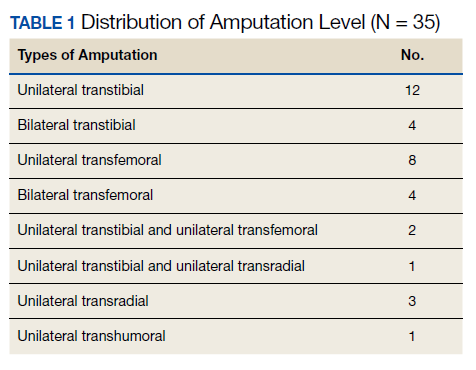
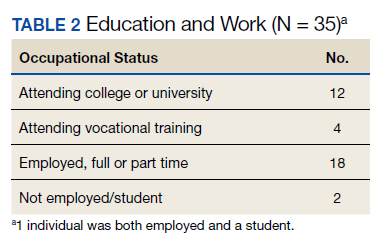
Participants generally described their post-care lives as “successful” that had been built on “good outcomes.” We left these concepts loosely defined to grant participants latitude in developing their own definitions for these ideas. That said, there is reason to view participants' lives as meeting specific criteria of success (Table 2). For example:
- 16 participants attended higher education postrehabilitation;
- 18 participants were working, or had worked, at the time of the interview;
- There was overlap between these groups and the total that had worked or attended school was 33 of 35; and
- 2 participants who had neither worked nor attended school were still recovering from injury complications at the time of the interview.
Family and relationships were other areas of success (Table 3). Twenty-three participants were currently in long-term relationships, including a mix of marriage and cohabitation households, while 3 were recently divorced and 2 were divorced for a longer term. Of the 5 participants who had been divorced, 3 were interested in pursuing new relationships. All 5 of these participants had children and were actively involved in their lives. Seven participants were not in relationships. Two participants did not have or seek relationships because of complications associated with their ongoing recovery.
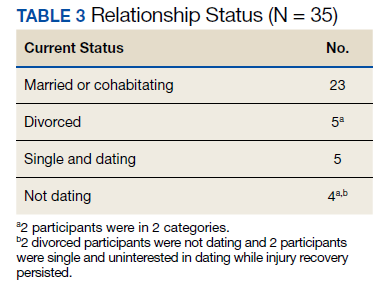
Whether considering the claims of participants, or how the literature conceptualizes successful community living, the evidence of success is supported by the accounts of work, school, and relationships. The attribution of these successes, in part, to the MATC rehabilitation program is important to understand because of the implications that this has on program value. Three features of the program continually emerged in interviews: recovering alongside peers, routine access to the entire treatment team, and ongoing relationships with key health care providers (HCPs).
Working Alongside Peers
Peers are an important element in how former patients remember their time in the rehabilitation program at WRNMMC. One benefit of recovering alongside peers is that it changes patients’ experiences of time. Being with other military patients creates a transitional time that participants said they valued as they shifted from the immediacy of their deployment experiences to the longer term demands of recovery and community reintegration.9 Additionally, sharing the clinical space with patients who had come before allowed participants to visualize a living timeline of their proposed recovery.
For most former patients, remembering the social intensity of their rehabilitation program is an important element in their narratives of recovery. The participants in our study do not necessarily maintain ties with their former peers, but nearly all of them point to support from other patients as being key in their own recovery from both the physical and psychological consequences of their injury.
Routine Access to the Treatment Team
The weekly amputee clinics that put surgeons, physicians, occupational and physical therapists, social workers, and prosthetists in a room with each patient worked to alleviate stress and anxiety in participants’ minds around the complexities of their injuries and care. One of the benefits of a group meeting is that it reduces the risk of miscommunication among HCPs and between HCPs and patients.7,10
These weekly sessions with HCPs and patients led to a second advantage; they promoted patient autonomy and participation in clinical decisions. Patients were able to negotiate clinical goals with their HCPs and then act on them almost immediately. In addition, patients with complex physical injuries, often with neurological or psychiatric comorbidities, were able to describe the full range of their challenges, and HCPs had an opportunity to check in with patients about the problems they faced and level of severity.
The ability to marshal clinical HCPs to attend weekly meetings of this nature with patients may be key for distinguishing military health care from VHA and civilian counterparts. More research on how clinical team/ patient meetings occur in other settings is needed. But one of the hallmark features of these clinic meetings at WRNMMC was their open-endedness. Patients typically were not bound by 15 minute or other temporally delimited meeting intervals. This research indicates that in military health care, the patient is the leader.
Continuity of Care
Continuity of care is a well-understood benefit to working with the same HCP. There were additional unanticipated benefits to assigning patients to HCPs with whom they had worked. The long-term period of care (5-24 months) gave patients the opportunity to develop multifaceted relationships with their HCPs and empowered them to advocate and negotiate for their outcome goals. In addition, the majority of frontline HCPs in physical and occupational therapy were civil ians (all prosthetic providers were civilians). These ongoing relationships had the impact of socializing clinicians into the expectations of military culture (around physical training, endurance and resilience, and disregard of pain).
Physical and occupational therapists occupied multiple roles for their patients, including being teachers, coaches, and sounding boards. Participants frequently described the way that their physical or occupational therapist could, on one hand, push them to achieve more in terms of physical functioning. But on the other hand, participants also talked about the emotional and psychological support they could receive based both on the long duration of their work with their care providers.
Conclusions
The ability to recover alongside peers, have access to the whole treatment team and develop long-term relationships with key care HCPs served as drivers for positive recovery. The impact of these 3 drivers of the social organization of the Amputee Patient Care Program represent an opportunity to highlight the role that the social context of military health care to use in achieving positive therapeutic outcomes. Former patients of the WRNMMC program could rely on a familiar and dependable social context for their care. This social context draws heavily on elements of military culture that structure the preinjury worlds of work and life that patients occupied. Based on these results we argue that the presence of rehabilitation and other clinical units in military medical settings offers an important value to patients and HCPs.
Acknowledgments
This work was supported by the Center for Rehabilitation Science Research, Department of Physical Medicine & Rehabilitation, Uniformed Services University, Bethesda, MD (awards HU0001-11-1-0004 and HU0001-15-2-0003).
1. Grimm PD, Mauntel TC, Potter BK. Combat and noncombat musculoskeletal injuries in the US military. Sports Med Arthrosc Rev. 2019;27(3):84-91. doi:10.1097/JSA.0000000000000246
2. Gajewski D, Granville R. The United States Armed Forces Amputee Patient Care Program. J Am Acad Orthop Surg. 2006;14(10 Spec No.):S183-S187. doi:10.5435/00124635-200600001-00040
3. Messinger S, Bozorghadad S, Pasquina P. Social relationships in rehabilitation and their impact on positive outcomes among amputees with lower limb loss at Walter Reed National Military Medical Center. J Rehabil Med. 2018;50(1):86-93. doi:10.2340/16501977-2274
4. Meyer EG. The importance of understanding military culture. Acad Psychiatry. 2015;39(4):416-418. doi:10.1007/s40596-015-0285-1
5. Reger MA, Etherage JR, Reger GM, Gahm GA. Civilian psychologists in an army culture: the ethical challenge of cultural competence. Mil Psychol. 2008;20(1):21-35. doi:10.1080/08995600701753144
6. Convoy S, Westphal RJ. The importance of developing military cultural competence. J Emerg Nurs. 2013;39(6):591-594. doi:10.1016/j.jen.2013.08.010
7. Campinha-Bacote J. The process of cultural competence in the delivery of healthcare services: a model of care. J Transcult Nurs. 2002;13(3):181-201. doi:10.1177/10459602013003003
8. Meyer EG, Hall-Clark BN, Hamaoka D, Peterson AL. Assessment of military cultural competence: a pilot study. Acad Psychiatry. 2015;39(4):382-388. doi:10.1007/s40596-015-0328-7
9. Messinger SD. Rehabilitating time: multiple temporalities among military clinicians and patients. Med Anthropol. 2010;29(2):150-169. doi:10.1080/01459741003715383
10. Williams MV, Davis T, Parker RM, Weiss BD. The role of health literacy in patient-physician communication. Fam Med. 2002;34(5):383-389.
Since 2001, nearly 2,000 US military service members have sustained traumatically acquired limb loss while serving in conflict zones primarily in Afghanistan and Iraq.1 Although most of these patients receive acute and long-term care in a military health facility, polytrauma programs within the Veterans Health Administration (VHA) treat other military patients with traumatic injuries while others receive specialized care in civilian medical programs. The Military Advanced Training Center (MATC) at Walter Reed National Military Medical Center (WRNMMC) provides a comprehensive rehabilitation program for patients with acquired traumatic limb loss.2
In this paper, we argue that receiving long-term care in military settings provides unique value for military patients because of the background therapeutic work such settings can provide. Currently, there are policy discussions that center on consolidating military health care under the oversight of the Defense Health Agency. This approach would develop a more centralized administration while also pursuing other measures to improve efficiency. When evaluating the current system, one key question remains: Would military service members and dependents seeking specific care or long-term rehabilitation programs be more effectively treated in nonmilitary settings?
Based on qualitative research, we argue that keeping a diverse range of military health programs has a positive and therapeutic impact. We also argue that the emergent literature about the importance of military culture to patients and the need for military cultural competence training for nonmilitary clinicians coupled with the results of a qualitative study of former patients at WRNMMC demonstrate that the social context at military treatment facilities offers a positive therapeutic impact.3
Program Description
This article is grounded in research conducted in the US Armed Forces Amputee Patient Care Program at WRNMMC. The study received WRNMMC Institutional Review Board approval in February 2012 and again for the continuation study in January 2015. The lead investigator for the research project was a medical anthropologist who worked with a research unit in the WRNMMC Department of Rehabilitation.
The main period of data collection occurred in 2 waves, the first between 2012 and 2014 and the second between 2015 and 2019. Patients arrived at WRNMMC within several days from the site of their injuries (nearly all were from Iraq and Afghanistan) via military medical facilities in Germany. After a period of recovery from the acute phase of their injuries, patients transitioned to outpatient housing and began their longer phase of care in the outpatient MATC.
On MATC admission, patients were assigned an occupational therapist, physical therapist, and prosthetist. In addition, rehabilitation physicians and orthopedic surgeons oversaw patient care. Social work and other programs provided additional services as needed.2 Patients were treated primarily for their orthopedic and extremity trauma and for neuropsychiatric injuries, such as mild traumatic brain injury. Other behavioral health services were available to support patients who reported symptoms of posttraumatic stress disorder, anxiety, depression, or other neuropsychological issues.
Patients had multiple daily appointments that shifted throughout the duration of their care. Initially a patient might have 2 physical therapy and 2 occupational therapy appointments daily, with each session lasting about an hour. Appointments with the orthotics and prosthetics service, which could be considerably longer were added as needed. These appointments required multiple castings, fittings, adjustments, and other activities. This also was the case with wound care, behavioral health, and other services and departments.
Cultural Competency
A recently published special issue of Academic Psychiatry described the important role that basic knowledge of military culture plays in effective care delivery to active-duty service members, guard and reserve, and veteran patients and families.4 Reger and colleagues also emphasized the importance of awareness of military culture to civilian clinicians particularly those providing care to service members.5
This concern with gaps in knowledge about recognizing the realities of military culture has given rise to an emergent literature on military cultural competence training for clinical providers.6 Cultural competence in health care settings is understood to be the practice of providing care within a social framework that acknowledges the social and cultural background of patients.7 In the military context, as in others, these discussions often are limited to behavioral health settings.8 This emergent literature provides researchers with important insights into understanding the scope and scale of military culture and the importance of delivering culturally competent care.
Beyond the concept of cultural competence, recognizing the importance of culture can be used to understand positive therapeutic impacts. In discussions of culture, service-members, veterans, and family members are shown to have adopted a set of ideas, values, roles, and behaviors. Mastering an awareness of those attributes is part of the process of delivering culturally competent care. At WRNMMC and other military treatment facilities, those attributes are “baked in” to the delivery of service—even when that service is provided by civilians. How that process operates is important to understanding the impact of the organization of clinical care.
Methods
Data were extracted from research conducted between 2012 and 2014 that investigated how former patients evaluated their posttreatment lives considering the care received in the MATC at WRNMMC. We used a lightly structured set of interview questions and categories in each interview that focused on 3 themes in the individual’s pathway to injury: education, joining their branch of service, injury experience. The focus was on developing an understanding of how events antecedent to the injury experience could influence the rehabilitation experience and postcare life. The second focus was on the experience of rehabilitation and to learn how the individual navigated community living after leaving care.
Results
Thirty-five participants with lower extremity amputations were recruited who had been discharged from the Amputee Patient Care Program ≥ 12 months prior to the study (Table 1). Participants were interviewed either over the telephone, or when possible, in person. Interviews were based on a lightly structured schedule designed to elicit accounts of community integration, which attended to reports of belongingness supported by accounts of social engagement in work, school, family, and social events. Interviews were analyzed using a modified content analysis approach. The study did not rely on a structured interview, but as is the case with many qualitative and ethnographic interviews, each session shared themes in common, such as questions about injury experience, rehabilitation experience, life after care (work, school, relationships), and so forth. Interviews were conducted by the lead author who was a medical anthropologist with training in health services research.
Participants generally described their post-care lives as “successful” that had been built on “good outcomes.” We left these concepts loosely defined to grant participants latitude in developing their own definitions for these ideas. That said, there is reason to view participants' lives as meeting specific criteria of success (Table 2). For example:
- 16 participants attended higher education postrehabilitation;
- 18 participants were working, or had worked, at the time of the interview;
- There was overlap between these groups and the total that had worked or attended school was 33 of 35; and
- 2 participants who had neither worked nor attended school were still recovering from injury complications at the time of the interview.
Family and relationships were other areas of success (Table 3). Twenty-three participants were currently in long-term relationships, including a mix of marriage and cohabitation households, while 3 were recently divorced and 2 were divorced for a longer term. Of the 5 participants who had been divorced, 3 were interested in pursuing new relationships. All 5 of these participants had children and were actively involved in their lives. Seven participants were not in relationships. Two participants did not have or seek relationships because of complications associated with their ongoing recovery.
Whether considering the claims of participants, or how the literature conceptualizes successful community living, the evidence of success is supported by the accounts of work, school, and relationships. The attribution of these successes, in part, to the MATC rehabilitation program is important to understand because of the implications that this has on program value. Three features of the program continually emerged in interviews: recovering alongside peers, routine access to the entire treatment team, and ongoing relationships with key health care providers (HCPs).
Working Alongside Peers
Peers are an important element in how former patients remember their time in the rehabilitation program at WRNMMC. One benefit of recovering alongside peers is that it changes patients’ experiences of time. Being with other military patients creates a transitional time that participants said they valued as they shifted from the immediacy of their deployment experiences to the longer term demands of recovery and community reintegration.9 Additionally, sharing the clinical space with patients who had come before allowed participants to visualize a living timeline of their proposed recovery.
For most former patients, remembering the social intensity of their rehabilitation program is an important element in their narratives of recovery. The participants in our study do not necessarily maintain ties with their former peers, but nearly all of them point to support from other patients as being key in their own recovery from both the physical and psychological consequences of their injury.
Routine Access to the Treatment Team
The weekly amputee clinics that put surgeons, physicians, occupational and physical therapists, social workers, and prosthetists in a room with each patient worked to alleviate stress and anxiety in participants’ minds around the complexities of their injuries and care. One of the benefits of a group meeting is that it reduces the risk of miscommunication among HCPs and between HCPs and patients.7,10
These weekly sessions with HCPs and patients led to a second advantage; they promoted patient autonomy and participation in clinical decisions. Patients were able to negotiate clinical goals with their HCPs and then act on them almost immediately. In addition, patients with complex physical injuries, often with neurological or psychiatric comorbidities, were able to describe the full range of their challenges, and HCPs had an opportunity to check in with patients about the problems they faced and level of severity.
The ability to marshal clinical HCPs to attend weekly meetings of this nature with patients may be key for distinguishing military health care from VHA and civilian counterparts. More research on how clinical team/ patient meetings occur in other settings is needed. But one of the hallmark features of these clinic meetings at WRNMMC was their open-endedness. Patients typically were not bound by 15 minute or other temporally delimited meeting intervals. This research indicates that in military health care, the patient is the leader.
Continuity of Care
Continuity of care is a well-understood benefit to working with the same HCP. There were additional unanticipated benefits to assigning patients to HCPs with whom they had worked. The long-term period of care (5-24 months) gave patients the opportunity to develop multifaceted relationships with their HCPs and empowered them to advocate and negotiate for their outcome goals. In addition, the majority of frontline HCPs in physical and occupational therapy were civil ians (all prosthetic providers were civilians). These ongoing relationships had the impact of socializing clinicians into the expectations of military culture (around physical training, endurance and resilience, and disregard of pain).
Physical and occupational therapists occupied multiple roles for their patients, including being teachers, coaches, and sounding boards. Participants frequently described the way that their physical or occupational therapist could, on one hand, push them to achieve more in terms of physical functioning. But on the other hand, participants also talked about the emotional and psychological support they could receive based both on the long duration of their work with their care providers.
Conclusions
The ability to recover alongside peers, have access to the whole treatment team and develop long-term relationships with key care HCPs served as drivers for positive recovery. The impact of these 3 drivers of the social organization of the Amputee Patient Care Program represent an opportunity to highlight the role that the social context of military health care to use in achieving positive therapeutic outcomes. Former patients of the WRNMMC program could rely on a familiar and dependable social context for their care. This social context draws heavily on elements of military culture that structure the preinjury worlds of work and life that patients occupied. Based on these results we argue that the presence of rehabilitation and other clinical units in military medical settings offers an important value to patients and HCPs.
Acknowledgments
This work was supported by the Center for Rehabilitation Science Research, Department of Physical Medicine & Rehabilitation, Uniformed Services University, Bethesda, MD (awards HU0001-11-1-0004 and HU0001-15-2-0003).
1. Grimm PD, Mauntel TC, Potter BK. Combat and noncombat musculoskeletal injuries in the US military. Sports Med Arthrosc Rev. 2019;27(3):84-91. doi:10.1097/JSA.0000000000000246
2. Gajewski D, Granville R. The United States Armed Forces Amputee Patient Care Program. J Am Acad Orthop Surg. 2006;14(10 Spec No.):S183-S187. doi:10.5435/00124635-200600001-00040
3. Messinger S, Bozorghadad S, Pasquina P. Social relationships in rehabilitation and their impact on positive outcomes among amputees with lower limb loss at Walter Reed National Military Medical Center. J Rehabil Med. 2018;50(1):86-93. doi:10.2340/16501977-2274
4. Meyer EG. The importance of understanding military culture. Acad Psychiatry. 2015;39(4):416-418. doi:10.1007/s40596-015-0285-1
5. Reger MA, Etherage JR, Reger GM, Gahm GA. Civilian psychologists in an army culture: the ethical challenge of cultural competence. Mil Psychol. 2008;20(1):21-35. doi:10.1080/08995600701753144
6. Convoy S, Westphal RJ. The importance of developing military cultural competence. J Emerg Nurs. 2013;39(6):591-594. doi:10.1016/j.jen.2013.08.010
7. Campinha-Bacote J. The process of cultural competence in the delivery of healthcare services: a model of care. J Transcult Nurs. 2002;13(3):181-201. doi:10.1177/10459602013003003
8. Meyer EG, Hall-Clark BN, Hamaoka D, Peterson AL. Assessment of military cultural competence: a pilot study. Acad Psychiatry. 2015;39(4):382-388. doi:10.1007/s40596-015-0328-7
9. Messinger SD. Rehabilitating time: multiple temporalities among military clinicians and patients. Med Anthropol. 2010;29(2):150-169. doi:10.1080/01459741003715383
10. Williams MV, Davis T, Parker RM, Weiss BD. The role of health literacy in patient-physician communication. Fam Med. 2002;34(5):383-389.
Perception of Executive Order on Medicare Pay for Advanced Practice Providers: A Study of Comments From Medical Professionals
The ability of advanced practice providers (APPs) to practice independently has been a recent topic of discussion among both the medical community and legislatures. Advanced practice provider is an umbrella term that includes physician assistants (PAs) and advanced practice registered nurses, including nurse practitioners (NPs), clinical nurse specialists, certified nurse-midwives, and certified registered nurse anesthetists. Since Congress passed the Balanced Budget Act of 1997, APPs can bill and be paid independently if they are not practicing incident to a physician or in a facility.1 Currently, NPs can practice independently in 27 states and Washington, DC. Physician assistants are required to practice under the supervision of a physician; however, the extent of supervision varies by state.2 Advocates for broadening the scope of practice for APPs argue that NPs and PAs will help to fill the physician deficit, particularly in primary care and rural regions. It has been projected that by 2025, the United States will require an additional 46,000 primary care providers to meet growing medical needs.3
On October 3, 2019, President Donald Trump issued the Executive Order on Protecting and Improving Medicare for Our Nation’s Seniors, in which he proposed an alternative to “Medicare for all.”4 This order instructed the Secretary of Health and Human Services to prepare a regulation that would “eliminate burdensome regulatory billing requirements, conditions of participation, supervision requirements, benefit definitions and all other licensure requirements . . . that are more stringent than applicable Federal or State laws require and that limit professionals from practicing at the top of their field.” Furthermore, President Trump proposed that “services provided by clinicians, including physicians, physician assistants, and nurse practitioners, are appropriately reimbursed in accordance with the work performed rather than the clinician’s occupation.”4
In response to the executive order, members of the medical community utilized Reddit, an online public forum, and Medscape, a medical news website, to vocalize opinions on the executive order.5,6 Our goal was to analyze the characteristics of those who participated in the discussion and their points of view on the plan to broaden the scope of practice and change the Medicare reimbursement plans for APPs.
Methods
All comments on the October 3, 2019, Medscape article, “Trump Executive Order Seeks Proposals on Medicare Pay for NPs, PAs,”5 and the corresponding Reddit discussion on this article6 were reviewed and characterized by the type of commenter—doctor of medicine (MD)/doctor of osteopathic medicine (DO), NP/RN/certified registered nurse anesthetist, PA, medical student, PA student, NP student, pharmacist, dietician, emergency medical technician, scribe, or unknown—as identified in their username, title, or in the text of the comment. Gender of the commenter was recorded when provided. Commenters were further grouped by their support or lack of support for the executive order based on their comments. Patients’ comments underwent further qualitative analysis to identify general themes.
All analyses were conducted with RStudio statistical software. Analyses were reported as proportions. Variables were compared by χ2 and Fisher exact tests. Odds ratios with 95% CIs were calculated. P<.05 was considered statistically significant.
Results
A total of 352 comments (130 on Medscape and 222 on Reddit) posted by 155 unique users (57 on Medscape and 98 on Reddit) were included in the analysis (Table 1). Of the 51 Medscape commenters who identified a gender, 60.7% were male and 39.2% were female. Reddit commenters did not identify a gender. Commenters included MD and DO physicians (43.2%), NPs/RNs/certified registered nurse anesthetists (13.5%), medical students (11.0%), PAs (9.7%), pharmacists (3.2%), NP students (1.9%), PA students (1.3%), emergency medical technicians (1.3%), dieticians (0.6%), and scribes (0.6%). Physicians (54.5% vs 36.73%; P=.032) and NPs (22.8% vs 8.2%; P=.009) made up a larger percentage of all comments on Medscape compared to Reddit, where medical students were more prevalent (16.3% vs 1.8%; P=.005). Nursing students and PA students more commonly posted on Reddit (4.08% of Reddit commenters vs 1.75% of Medscape commenters), though this difference did not achieve statistical significance.
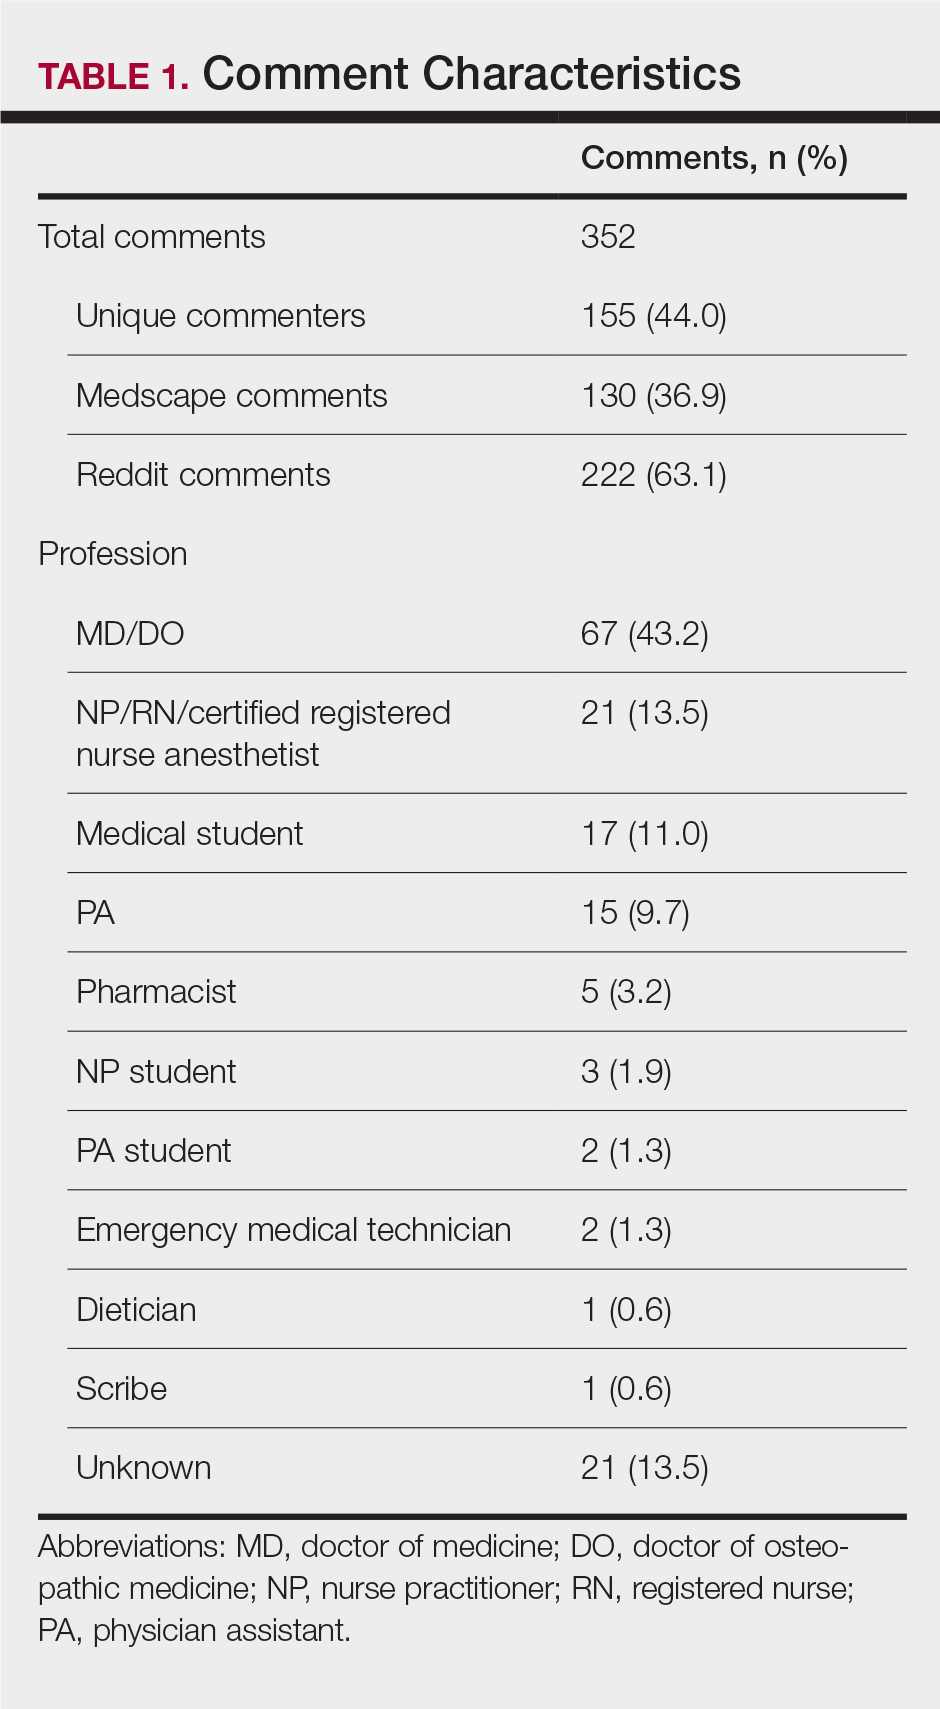
A majority of commenters did not support the executive order, with only 20.6% approving of the plan, 54.8% disapproving, and 24.5% remaining neutral (Figure). Advanced practice providers—NPs, PAs, NP/PA students, and APPs not otherwise specified—were more likely to support the executive order, with 52.3% voicing their support compared to only 4.8% of physicians and medical students expressing support (P<.0001). Similarly, physicians and medical students were more likely to disapprove of the order, with 75.0% voicing concerns compared to only 27.3% of APPs dissenting (P<.0001). A similar percentage of both physicians/medical students and APPs remained neutral (20.2% vs 18.2%). Commenters on Medscape were more likely to voice support for the executive order than those on Reddit (36.8% vs 11.2%; P=.0002), likely due to the higher percentage of NP and PA comments on the former.
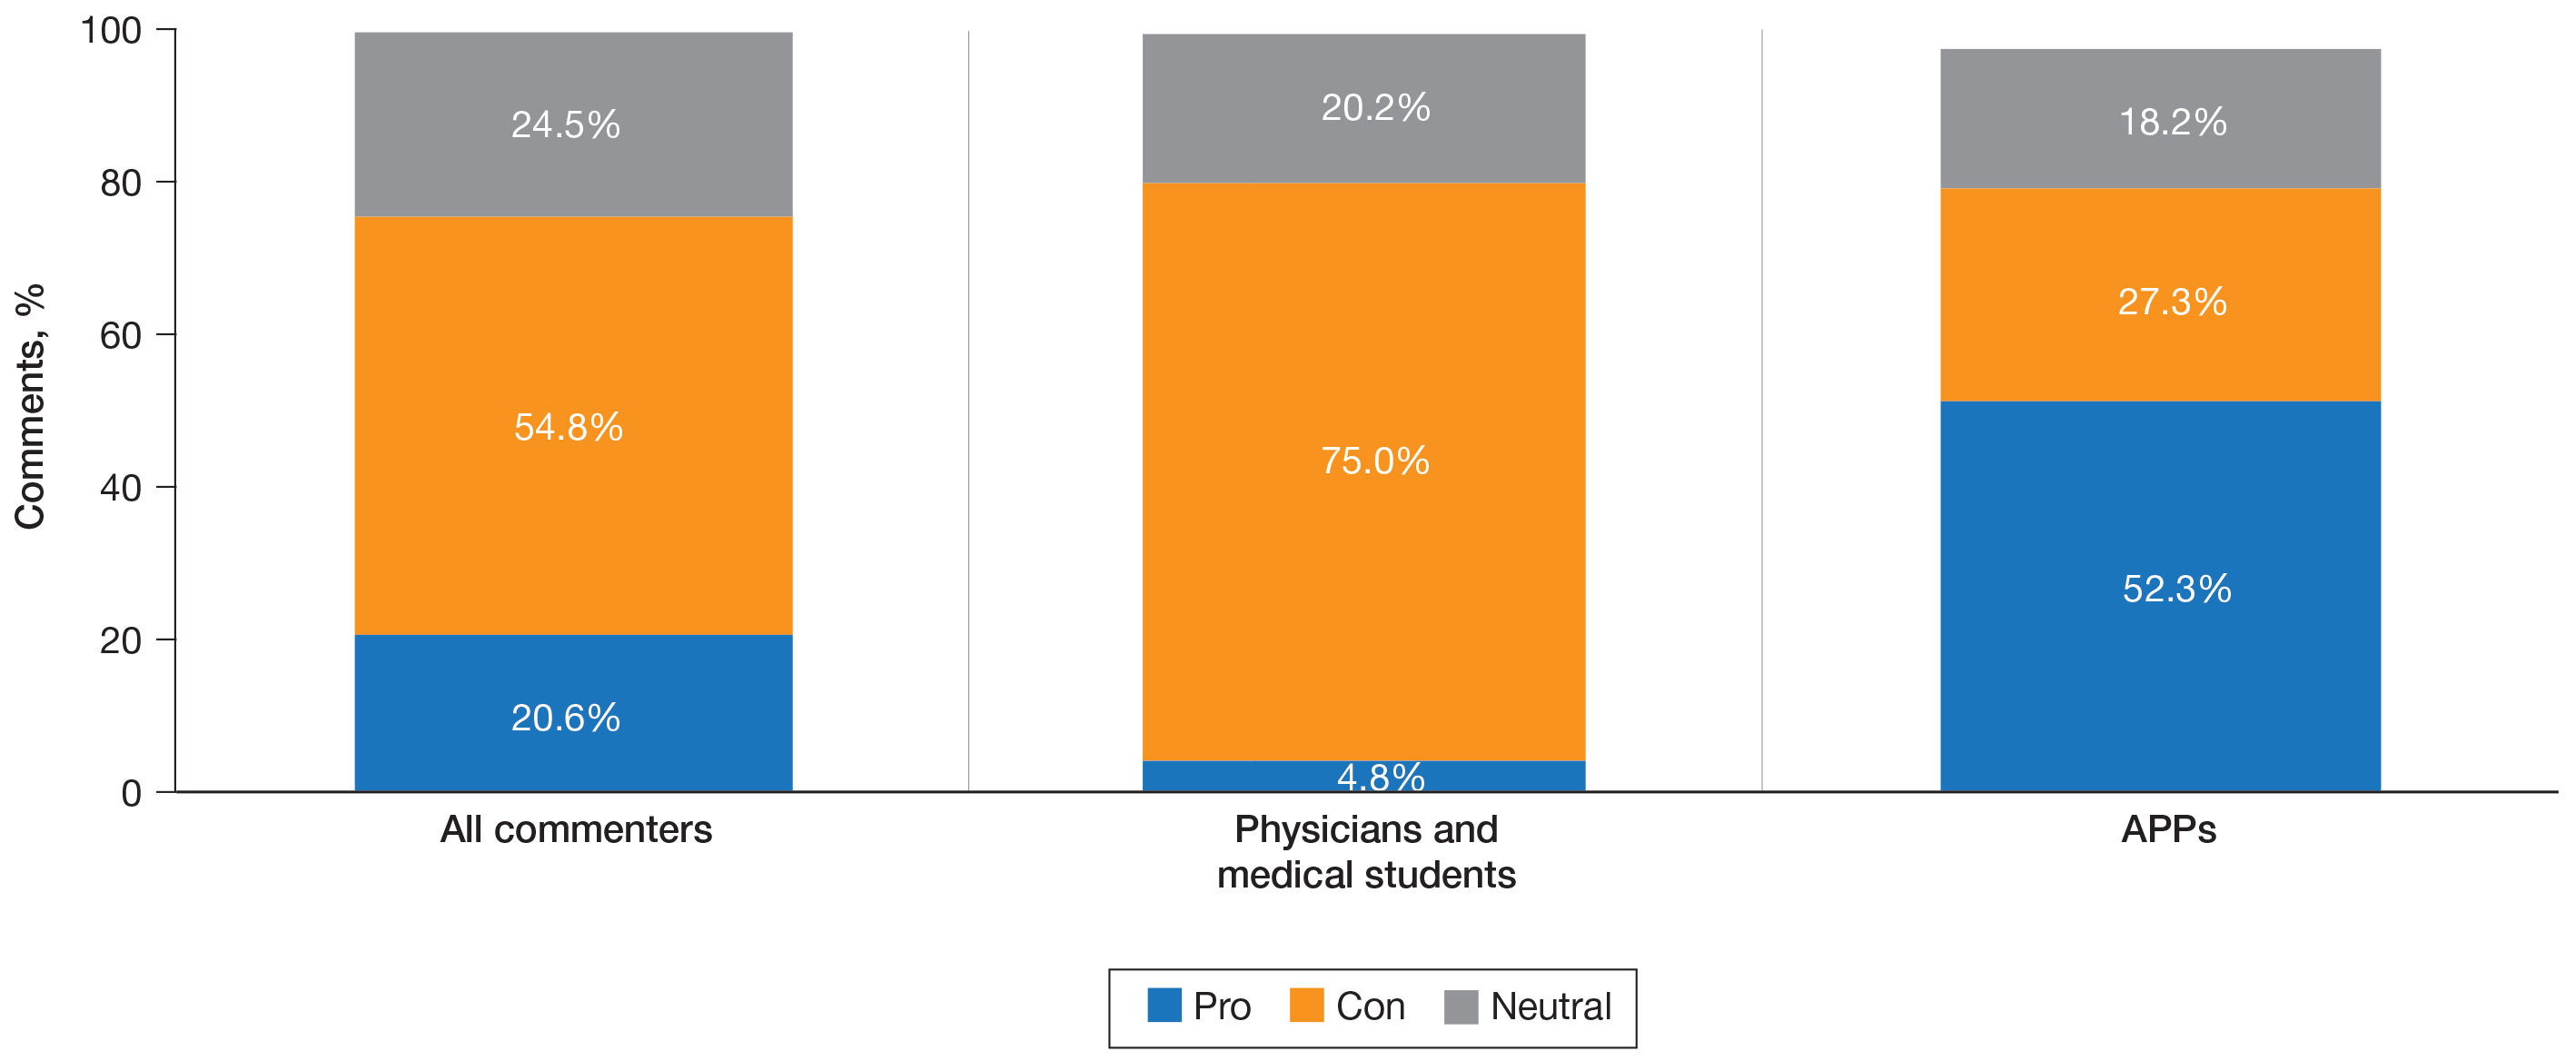
Overall, the most commonly discussed topic was provider reimbursement (22.6% of all comments)(Table 2). Physicians and medical students were more likely to discuss physician expertise compared to APPs (32.1% vs 4.5%; P<.001). They also were more likely to raise concerns that the executive order would discourage future generations of physicians from pursuing medicine (15.5% vs 0%; P=.01). Advanced practice providers were more likely than physicians/medical students to comment on the breadth of NP and/or PA training (38.6% vs 19.0%; P=.02). The eTable shows representative comments for each theme encountered.
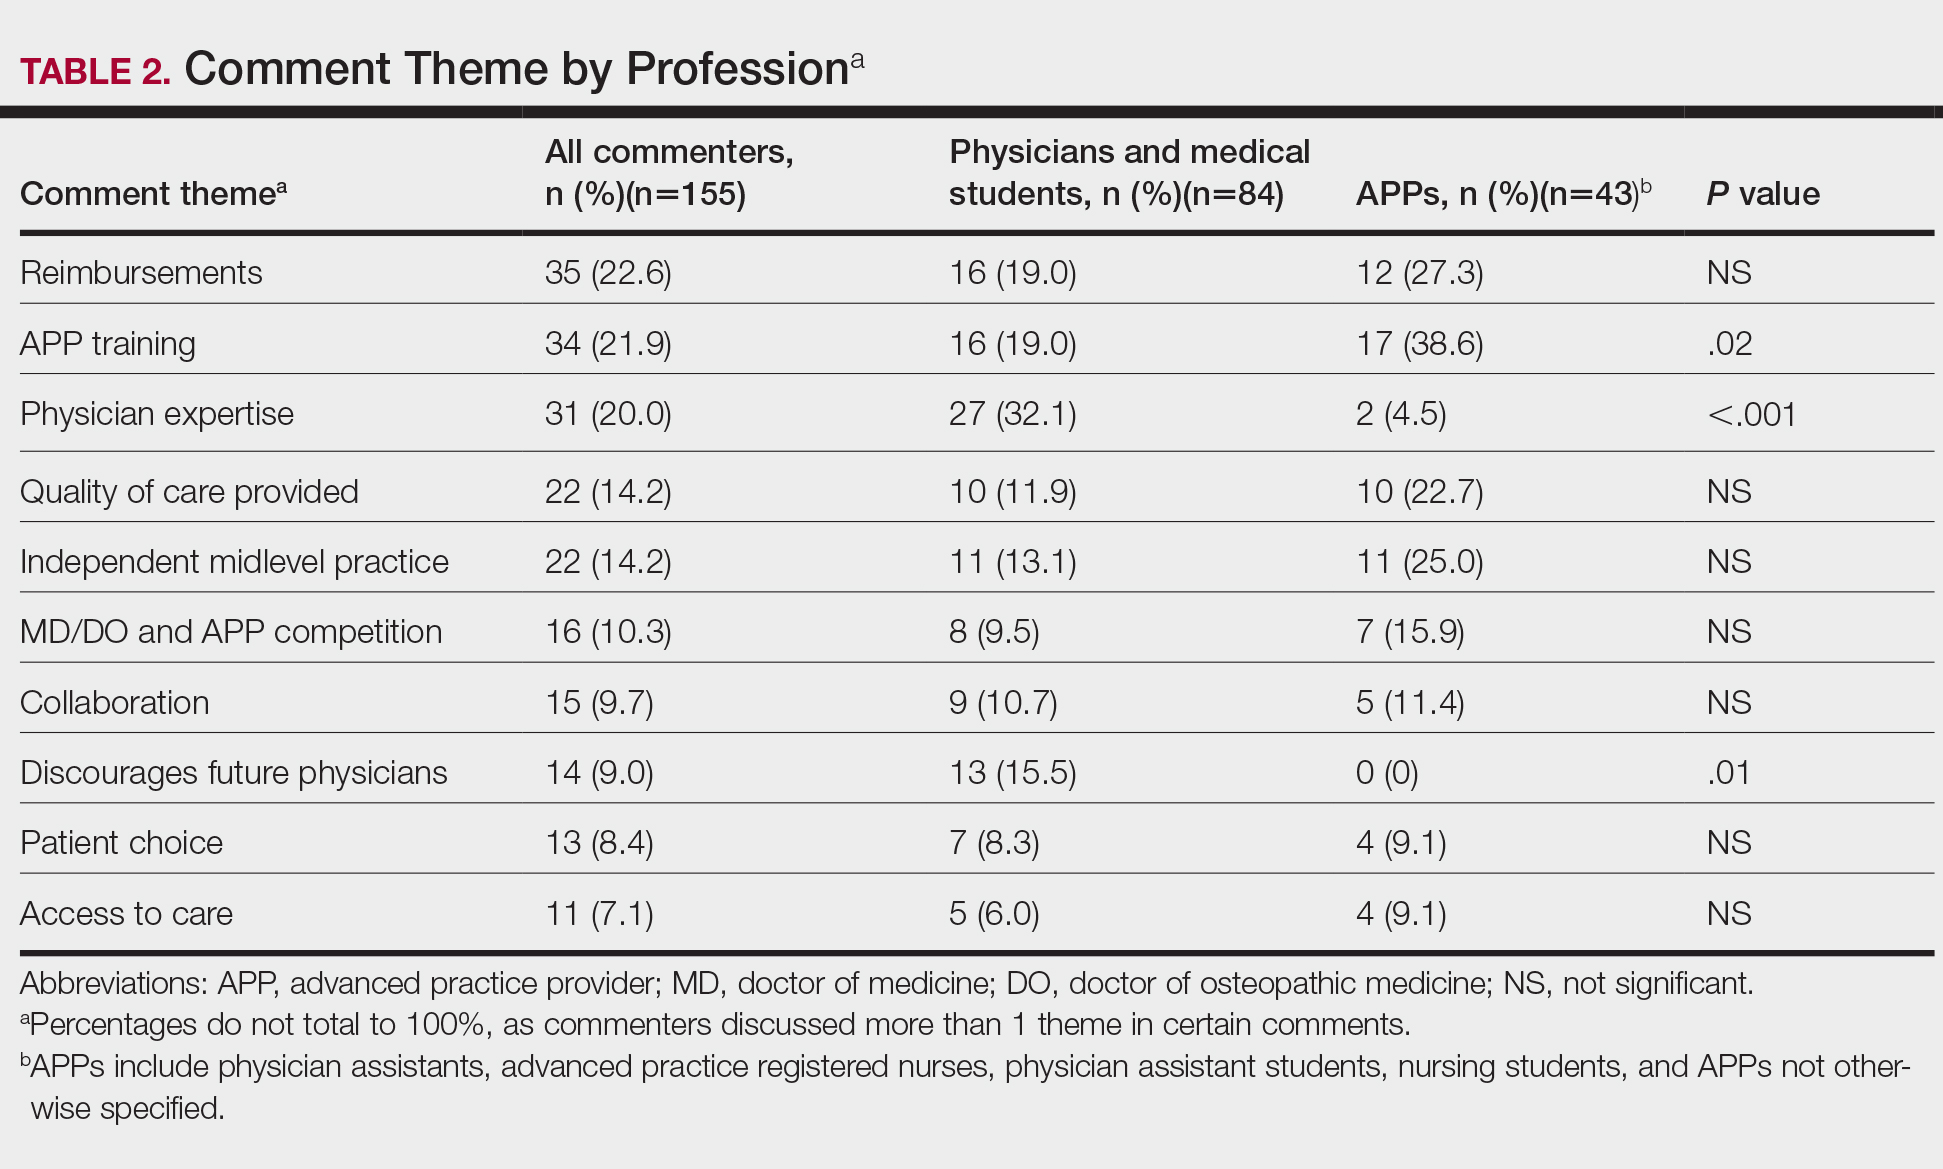
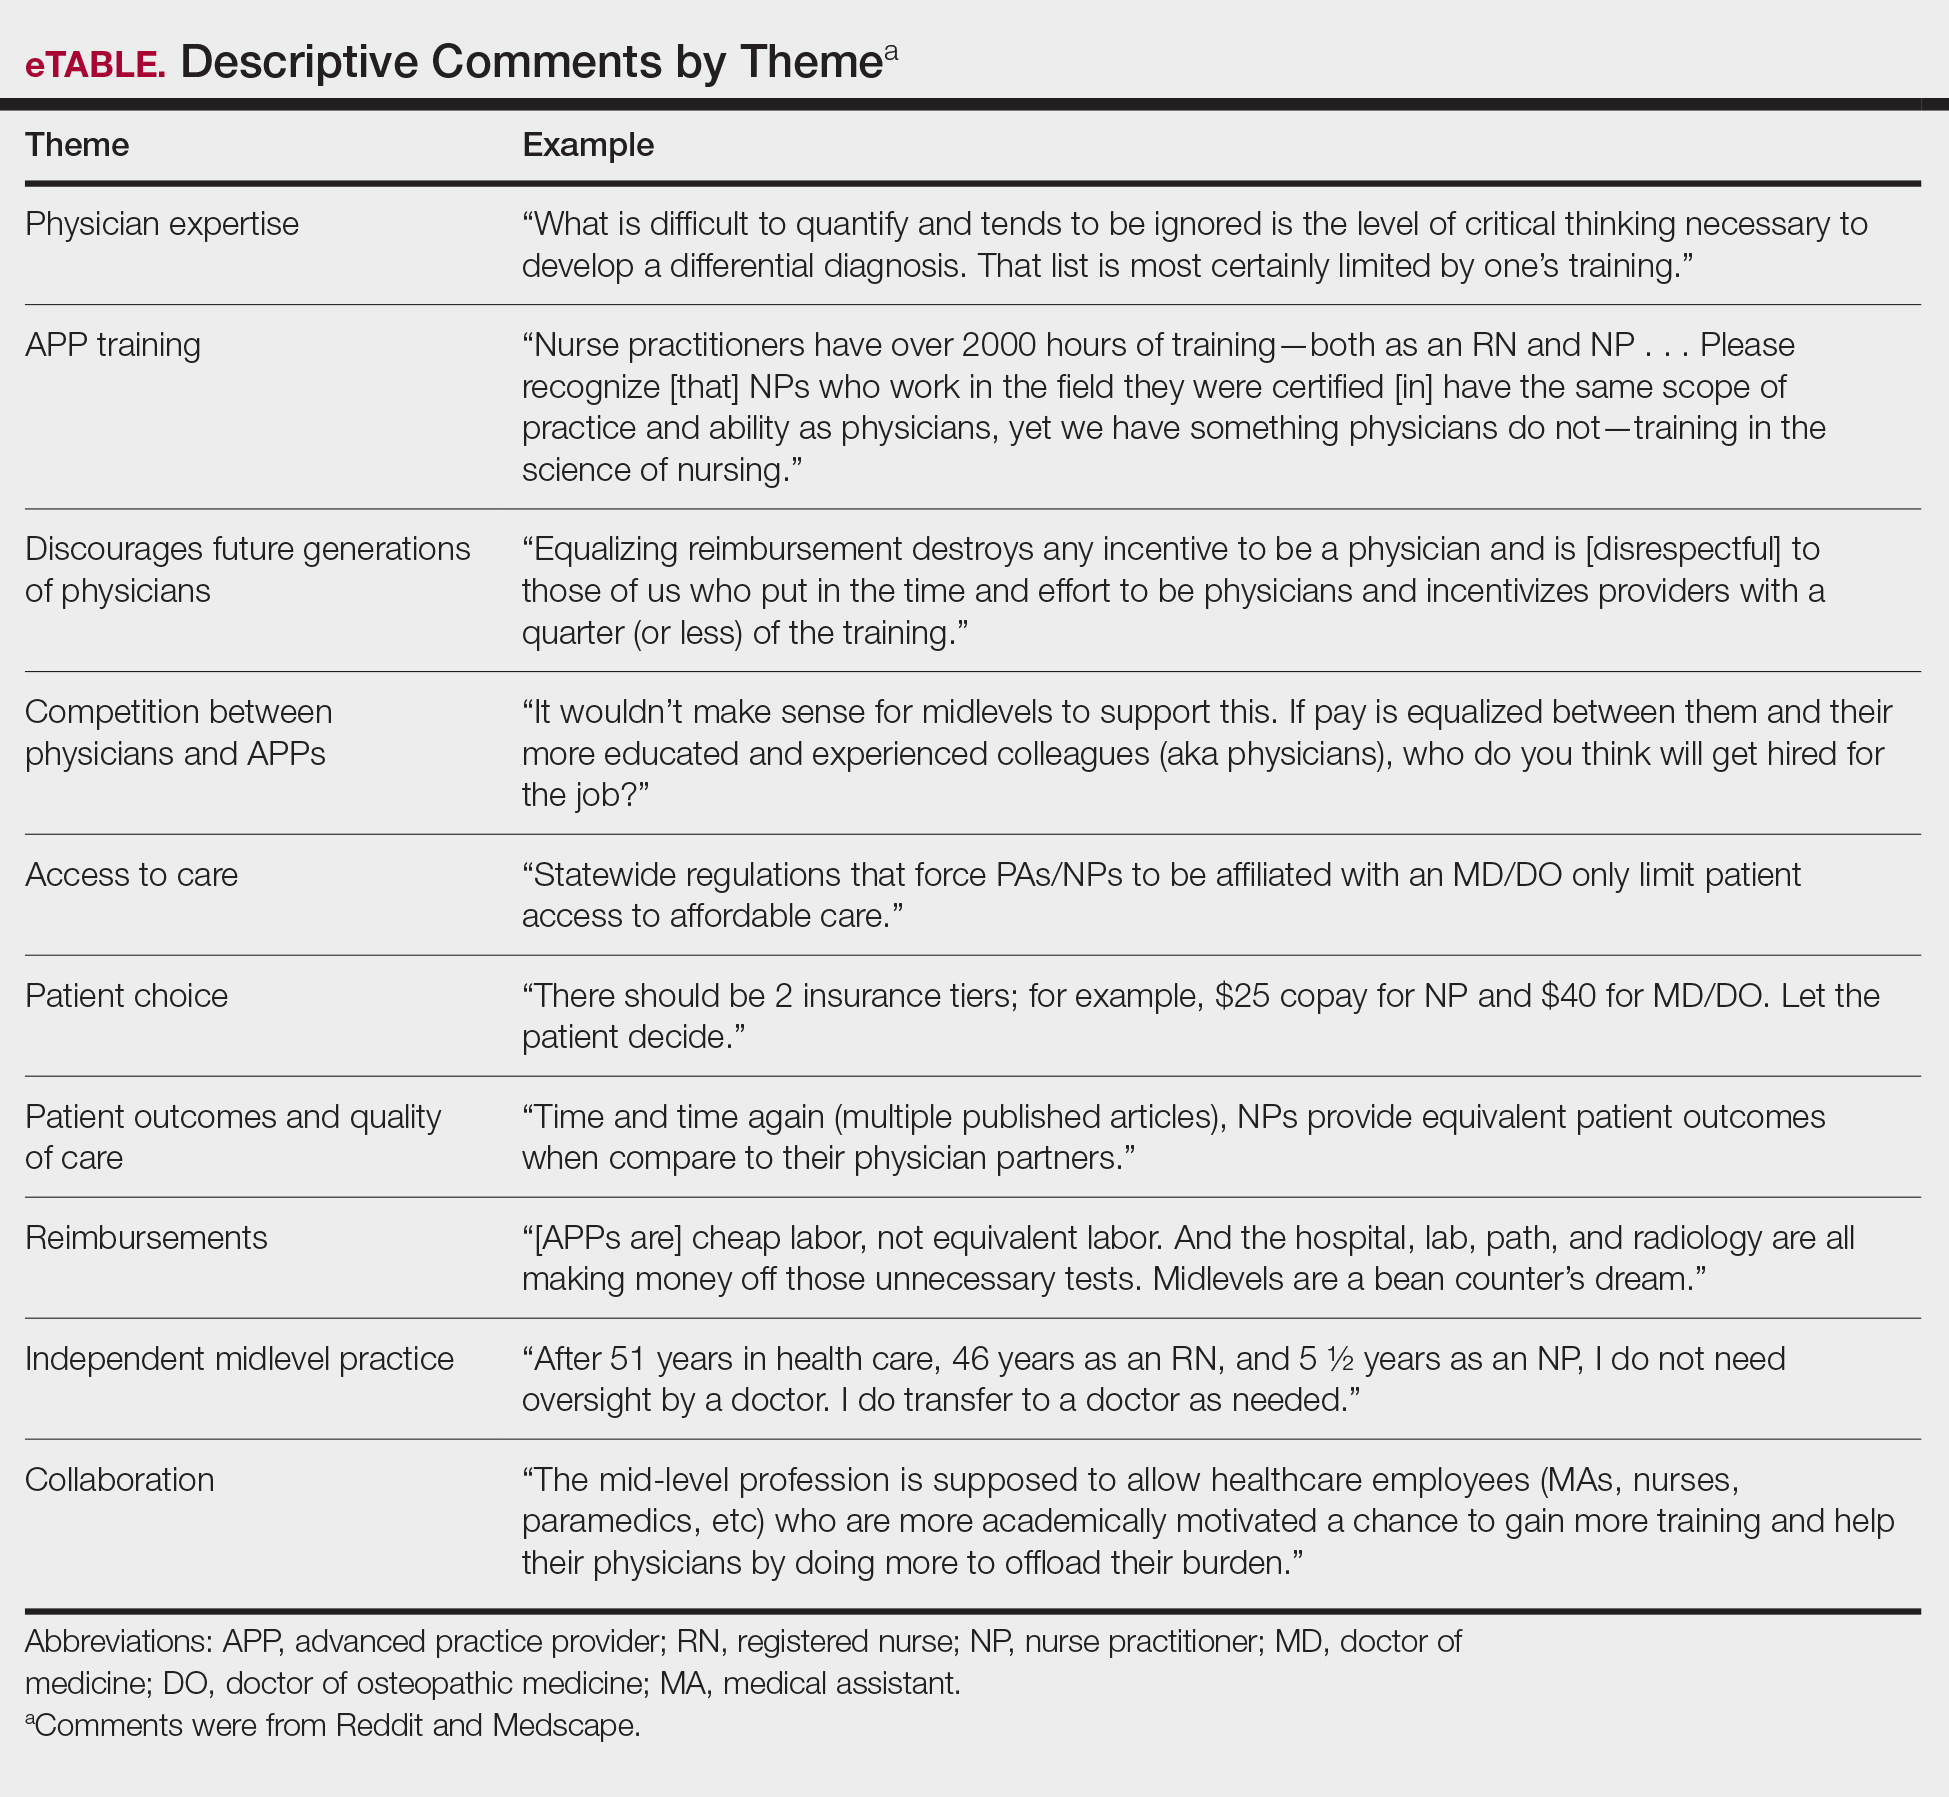
A subgroup analysis of the comments written by physicians supporting the executive order (n=4) and APPs disapproving of the order (n=12) was performed to identify the dissenting opinions. Physicians who supported the order discussed the need for improved pay for equal work (n=3), the competency of NP and PA training (n=2), the ability of a practice to generate more profit from APPs (n=1), and possible benefits of APPs providing primary care while MDs perform more specialized care (n=1). Of the APPs who did not support the order, there were 4 PAs, 2 registered nurses, 2 NPs, 2 NP students, and 2 PA students. The most common themes discussed were the differences in APP education and training (n=6), lack of desire for further responsibilities (n=4), and the adequacy of the current scope of practice (n=3).
Comment
President Trump’s executive order follows a trend of decreasing required oversight of APPs; however, this study indicates that these policies would face pushback from many physicians. These results are consistent with a prior study that analyzed 309 comments on an article in The New York Times made by physicians, APPs, patients, and laypeople, in which 24.7% had mistrust of APPs and 14.9% had concerns over APP supervision compared to 9% who supported APP independent practice.7 It is clear that there is a serious divide in opinion that threatens to harm the existing collaborations between physicians and APPs.
Primary Care Coverage With APPs
In the comments analyzed in our study, supporters of the executive order argued that an increase in APPs practicing independently would provide much-needed primary care coverage to patients in underserved regions. However, APPs are instead well represented across most specialties, with a majority in dermatology. Of the 4 million procedures billed independently by APPs in 2012, 54.8% were in the field of dermatology.8 The employment of APPs by dermatologists has grown from 28% of practices in 2005 to 46% in 2014, making this issue of particular importance to our field.9,10
Education and Training of APPs
In our analysis, many physicians cited concerns about the education and training of APPs. Dermatologists receive approximately 10,000 hours of training over the course of residency. Per the American Academy of Physician Assistants, PAs spend more than 2000 hours over a 26-month period on various clinical rotations, “with an emphasis on primary care.”11 There are multiple routes to become an advanced practice RN with varying classroom and clinical requirements, with one pathway requiring a bachelor of science in nursing, followed by a master’s degree requiring 500 to 700 hours of supervised clinical work. Although the Dermatology Nurses’ Association and Society of Dermatology Physician Assistants (http://www.dermpa.org) provide online modules, annual conventions with training workshops, and short fellowship programs, neither have formal guidelines on minimum requirements to diagnose and treat dermatologic conditions.2 Despite the lack of formalized dermatologic training, APPs billed for 13.4% of all dermatology procedures submitted to Medicare in 2015.12
Quality of Patient Care
In our study, physicians also voiced concern over reduced quality of patient care. In a review of 33,647 skin cancer screening examinations, PAs biopsied an average of 39.4 skin lesions, while dermatologists biopsied an average of 25.4 skin lesions to diagnose 1 case of melanoma.13 In addition, nonphysician providers accounted for 37.9% of defendants in 174 legal cases related to injury from cutaneous laser surgery.14 Before further laws are enacted regarding the independent practice and billing by NPs and PAs in the field of dermatology, further research is needed to address patient outcomes and safety.
Limitations
This study was subject to several limitations. Because of a lack of other sources offering discussions on the topic, our sample size was limited. Self-identification of users presents a challenge, as an individual can pose as a physician or APP without validation of credentials. Although great care was taken to minimize bias, grouping comments into broad categories may misinterpret a poster’s intentions. Furthermore, the data collected represent only a small proportion of the medical community—readers of Medscape and Reddit who have the motivation to create a user profile and post a comment rather than put their efforts into lobbying or contacting legislators. Those posting may have stronger political opinions or more poignant experiences than the general public. Although selection bias impacts the generalizability of our findings, this analysis allows for deeper insight into the beliefs of a vocal subset of the medical community who may not have the opportunity to present their opinions elsewhere.
Conclusion
Our analysis of the response to President Trump’s executive order reveals that a rollout of these regulations would be met with strong opposition. On October 29, 2019, more than 100 professional organizations, including the American Medical Association and the American Academy of Dermatology, wrote a letter to the Secretary of Health and Human Services that eloquently echoed the sentiments of the physician commenters in this study: “Scope of practice of health care professionals should be based on standardized, adequate training and demonstrated competence in patient care, not politics. While all health care professionals share an important role in providing care to patients, their skillset is not interchangeable with that of a fully trained physician.”15 The executive order would lead to a major shift in the current medical landscape, and as such, it is prudent that these concerns are addressed.
- Balanced Budget Act of 1997, 42 USC §1395x (1997). Accessed December 15, 2020. https://www.govinfo.gov/content/pkg/PLAW-105publ33/html/PLAW-105publ33.htm
- State practice environment. American Association of Nurse Practitioners. Updated October 20, 2020. Accessed December 8, 2020. https://www.aanp.org/advocacy/state/state-practice-environment
- Petterson SM, Liaw WR, Phillips RL Jr, et al. Projecting US primary care physician workforce needs: 2010-2015. Ann Fam Med. 2012;10:503-509.
- United States, Executive Office of the President [Donald Trump]. Executive Order 13890: Protecting and Improving Medicare for Our Nation’s Seniors. October 3, 2019. Fed Regist. 2019;84:53573-53576.
- Young KD. Trump executive order seeks proposals on Medicare pay for NPs, PAs. Medscape. Published October 3, 2019. Accessed December 8, 2020. https://www.medscape.com/viewarticle/919415
- Trump seeks proposals on Medicare pay for NPs, PAs. Reddit. Accessed December 8, 2020. https://www.reddit.com/r/medicine/comments/ddy03w/trump_seeks_proposals_on_medicare_pay_for_nps_pas/
- Martin E, Huang WW, Strowd LC, et al. Public perception of ethical issues in dermatology: evidenced by New York Times commenters. Dermatol Surg. 2018;44:1571-1577.
- Coldiron B, Ratnarathorn M. Scope of physician procedures independently billed by mid-level providers in the office setting. JAMA Dermatol. 2014;150:1153-1159.
- Resneck JS Jr. Dermatology practice consolidation fueled by private equity investment: potential consequences for the specialty and patients. JAMA Dermatol. 2018;154:13-14.
- Ehrlich A, Kostecki J, Olkaba H. Trends in dermatology practices and the implications for the workforce. J Am Acad Dermatol. 2017;77:746-752.
- Become a PA. American Academy of Physician Assistants. Accessed December 8, 2020. https://www.aapa.org/career-central/become-a-pa/.
- Zhang M, Zippin J, Kaffenberger B. Trends and scope of dermatology procedures billed by advanced practice professionals from 2012 through 2015. JAMA Dermatol. 2018;154:1040-1044.
- Anderson AM, Matsumoto M, Saul MI, et al. Accuracy of skin cancer diagnosis of physician assistants compared with dermatologists in a large health care system. JAMA Dermatol. 2018;154:569-573.
- Jalian HR, Jalian CA, Avram MM. Common causes of injury and legal action in laser surgery. JAMA Dermatol. 2013;149:188-193.
- American Medical Association. Open letter to the Honorable Alex M. Azar II. Published October 29, 2019. Accessed December 11, 2020. https://searchlf.ama-assn.org/undefined/documentDownload?uri=%2Funstructured%2Fbinary%2Fletter%2FLETTERS%2F2019-10-29-Final-Sign-on-re-10-3-Executive-Order.pdf
The ability of advanced practice providers (APPs) to practice independently has been a recent topic of discussion among both the medical community and legislatures. Advanced practice provider is an umbrella term that includes physician assistants (PAs) and advanced practice registered nurses, including nurse practitioners (NPs), clinical nurse specialists, certified nurse-midwives, and certified registered nurse anesthetists. Since Congress passed the Balanced Budget Act of 1997, APPs can bill and be paid independently if they are not practicing incident to a physician or in a facility.1 Currently, NPs can practice independently in 27 states and Washington, DC. Physician assistants are required to practice under the supervision of a physician; however, the extent of supervision varies by state.2 Advocates for broadening the scope of practice for APPs argue that NPs and PAs will help to fill the physician deficit, particularly in primary care and rural regions. It has been projected that by 2025, the United States will require an additional 46,000 primary care providers to meet growing medical needs.3
On October 3, 2019, President Donald Trump issued the Executive Order on Protecting and Improving Medicare for Our Nation’s Seniors, in which he proposed an alternative to “Medicare for all.”4 This order instructed the Secretary of Health and Human Services to prepare a regulation that would “eliminate burdensome regulatory billing requirements, conditions of participation, supervision requirements, benefit definitions and all other licensure requirements . . . that are more stringent than applicable Federal or State laws require and that limit professionals from practicing at the top of their field.” Furthermore, President Trump proposed that “services provided by clinicians, including physicians, physician assistants, and nurse practitioners, are appropriately reimbursed in accordance with the work performed rather than the clinician’s occupation.”4
In response to the executive order, members of the medical community utilized Reddit, an online public forum, and Medscape, a medical news website, to vocalize opinions on the executive order.5,6 Our goal was to analyze the characteristics of those who participated in the discussion and their points of view on the plan to broaden the scope of practice and change the Medicare reimbursement plans for APPs.
Methods
All comments on the October 3, 2019, Medscape article, “Trump Executive Order Seeks Proposals on Medicare Pay for NPs, PAs,”5 and the corresponding Reddit discussion on this article6 were reviewed and characterized by the type of commenter—doctor of medicine (MD)/doctor of osteopathic medicine (DO), NP/RN/certified registered nurse anesthetist, PA, medical student, PA student, NP student, pharmacist, dietician, emergency medical technician, scribe, or unknown—as identified in their username, title, or in the text of the comment. Gender of the commenter was recorded when provided. Commenters were further grouped by their support or lack of support for the executive order based on their comments. Patients’ comments underwent further qualitative analysis to identify general themes.
All analyses were conducted with RStudio statistical software. Analyses were reported as proportions. Variables were compared by χ2 and Fisher exact tests. Odds ratios with 95% CIs were calculated. P<.05 was considered statistically significant.
Results
A total of 352 comments (130 on Medscape and 222 on Reddit) posted by 155 unique users (57 on Medscape and 98 on Reddit) were included in the analysis (Table 1). Of the 51 Medscape commenters who identified a gender, 60.7% were male and 39.2% were female. Reddit commenters did not identify a gender. Commenters included MD and DO physicians (43.2%), NPs/RNs/certified registered nurse anesthetists (13.5%), medical students (11.0%), PAs (9.7%), pharmacists (3.2%), NP students (1.9%), PA students (1.3%), emergency medical technicians (1.3%), dieticians (0.6%), and scribes (0.6%). Physicians (54.5% vs 36.73%; P=.032) and NPs (22.8% vs 8.2%; P=.009) made up a larger percentage of all comments on Medscape compared to Reddit, where medical students were more prevalent (16.3% vs 1.8%; P=.005). Nursing students and PA students more commonly posted on Reddit (4.08% of Reddit commenters vs 1.75% of Medscape commenters), though this difference did not achieve statistical significance.
A majority of commenters did not support the executive order, with only 20.6% approving of the plan, 54.8% disapproving, and 24.5% remaining neutral (Figure). Advanced practice providers—NPs, PAs, NP/PA students, and APPs not otherwise specified—were more likely to support the executive order, with 52.3% voicing their support compared to only 4.8% of physicians and medical students expressing support (P<.0001). Similarly, physicians and medical students were more likely to disapprove of the order, with 75.0% voicing concerns compared to only 27.3% of APPs dissenting (P<.0001). A similar percentage of both physicians/medical students and APPs remained neutral (20.2% vs 18.2%). Commenters on Medscape were more likely to voice support for the executive order than those on Reddit (36.8% vs 11.2%; P=.0002), likely due to the higher percentage of NP and PA comments on the former.
Overall, the most commonly discussed topic was provider reimbursement (22.6% of all comments)(Table 2). Physicians and medical students were more likely to discuss physician expertise compared to APPs (32.1% vs 4.5%; P<.001). They also were more likely to raise concerns that the executive order would discourage future generations of physicians from pursuing medicine (15.5% vs 0%; P=.01). Advanced practice providers were more likely than physicians/medical students to comment on the breadth of NP and/or PA training (38.6% vs 19.0%; P=.02). The eTable shows representative comments for each theme encountered.
A subgroup analysis of the comments written by physicians supporting the executive order (n=4) and APPs disapproving of the order (n=12) was performed to identify the dissenting opinions. Physicians who supported the order discussed the need for improved pay for equal work (n=3), the competency of NP and PA training (n=2), the ability of a practice to generate more profit from APPs (n=1), and possible benefits of APPs providing primary care while MDs perform more specialized care (n=1). Of the APPs who did not support the order, there were 4 PAs, 2 registered nurses, 2 NPs, 2 NP students, and 2 PA students. The most common themes discussed were the differences in APP education and training (n=6), lack of desire for further responsibilities (n=4), and the adequacy of the current scope of practice (n=3).
Comment
President Trump’s executive order follows a trend of decreasing required oversight of APPs; however, this study indicates that these policies would face pushback from many physicians. These results are consistent with a prior study that analyzed 309 comments on an article in The New York Times made by physicians, APPs, patients, and laypeople, in which 24.7% had mistrust of APPs and 14.9% had concerns over APP supervision compared to 9% who supported APP independent practice.7 It is clear that there is a serious divide in opinion that threatens to harm the existing collaborations between physicians and APPs.
Primary Care Coverage With APPs
In the comments analyzed in our study, supporters of the executive order argued that an increase in APPs practicing independently would provide much-needed primary care coverage to patients in underserved regions. However, APPs are instead well represented across most specialties, with a majority in dermatology. Of the 4 million procedures billed independently by APPs in 2012, 54.8% were in the field of dermatology.8 The employment of APPs by dermatologists has grown from 28% of practices in 2005 to 46% in 2014, making this issue of particular importance to our field.9,10
Education and Training of APPs
In our analysis, many physicians cited concerns about the education and training of APPs. Dermatologists receive approximately 10,000 hours of training over the course of residency. Per the American Academy of Physician Assistants, PAs spend more than 2000 hours over a 26-month period on various clinical rotations, “with an emphasis on primary care.”11 There are multiple routes to become an advanced practice RN with varying classroom and clinical requirements, with one pathway requiring a bachelor of science in nursing, followed by a master’s degree requiring 500 to 700 hours of supervised clinical work. Although the Dermatology Nurses’ Association and Society of Dermatology Physician Assistants (http://www.dermpa.org) provide online modules, annual conventions with training workshops, and short fellowship programs, neither have formal guidelines on minimum requirements to diagnose and treat dermatologic conditions.2 Despite the lack of formalized dermatologic training, APPs billed for 13.4% of all dermatology procedures submitted to Medicare in 2015.12
Quality of Patient Care
In our study, physicians also voiced concern over reduced quality of patient care. In a review of 33,647 skin cancer screening examinations, PAs biopsied an average of 39.4 skin lesions, while dermatologists biopsied an average of 25.4 skin lesions to diagnose 1 case of melanoma.13 In addition, nonphysician providers accounted for 37.9% of defendants in 174 legal cases related to injury from cutaneous laser surgery.14 Before further laws are enacted regarding the independent practice and billing by NPs and PAs in the field of dermatology, further research is needed to address patient outcomes and safety.
Limitations
This study was subject to several limitations. Because of a lack of other sources offering discussions on the topic, our sample size was limited. Self-identification of users presents a challenge, as an individual can pose as a physician or APP without validation of credentials. Although great care was taken to minimize bias, grouping comments into broad categories may misinterpret a poster’s intentions. Furthermore, the data collected represent only a small proportion of the medical community—readers of Medscape and Reddit who have the motivation to create a user profile and post a comment rather than put their efforts into lobbying or contacting legislators. Those posting may have stronger political opinions or more poignant experiences than the general public. Although selection bias impacts the generalizability of our findings, this analysis allows for deeper insight into the beliefs of a vocal subset of the medical community who may not have the opportunity to present their opinions elsewhere.
Conclusion
Our analysis of the response to President Trump’s executive order reveals that a rollout of these regulations would be met with strong opposition. On October 29, 2019, more than 100 professional organizations, including the American Medical Association and the American Academy of Dermatology, wrote a letter to the Secretary of Health and Human Services that eloquently echoed the sentiments of the physician commenters in this study: “Scope of practice of health care professionals should be based on standardized, adequate training and demonstrated competence in patient care, not politics. While all health care professionals share an important role in providing care to patients, their skillset is not interchangeable with that of a fully trained physician.”15 The executive order would lead to a major shift in the current medical landscape, and as such, it is prudent that these concerns are addressed.
- Balanced Budget Act of 1997, 42 USC §1395x (1997). Accessed December 15, 2020. https://www.govinfo.gov/content/pkg/PLAW-105publ33/html/PLAW-105publ33.htm
- State practice environment. American Association of Nurse Practitioners. Updated October 20, 2020. Accessed December 8, 2020. https://www.aanp.org/advocacy/state/state-practice-environment
- Petterson SM, Liaw WR, Phillips RL Jr, et al. Projecting US primary care physician workforce needs: 2010-2015. Ann Fam Med. 2012;10:503-509.
- United States, Executive Office of the President [Donald Trump]. Executive Order 13890: Protecting and Improving Medicare for Our Nation’s Seniors. October 3, 2019. Fed Regist. 2019;84:53573-53576.
- Young KD. Trump executive order seeks proposals on Medicare pay for NPs, PAs. Medscape. Published October 3, 2019. Accessed December 8, 2020. https://www.medscape.com/viewarticle/919415
- Trump seeks proposals on Medicare pay for NPs, PAs. Reddit. Accessed December 8, 2020. https://www.reddit.com/r/medicine/comments/ddy03w/trump_seeks_proposals_on_medicare_pay_for_nps_pas/
- Martin E, Huang WW, Strowd LC, et al. Public perception of ethical issues in dermatology: evidenced by New York Times commenters. Dermatol Surg. 2018;44:1571-1577.
- Coldiron B, Ratnarathorn M. Scope of physician procedures independently billed by mid-level providers in the office setting. JAMA Dermatol. 2014;150:1153-1159.
- Resneck JS Jr. Dermatology practice consolidation fueled by private equity investment: potential consequences for the specialty and patients. JAMA Dermatol. 2018;154:13-14.
- Ehrlich A, Kostecki J, Olkaba H. Trends in dermatology practices and the implications for the workforce. J Am Acad Dermatol. 2017;77:746-752.
- Become a PA. American Academy of Physician Assistants. Accessed December 8, 2020. https://www.aapa.org/career-central/become-a-pa/.
- Zhang M, Zippin J, Kaffenberger B. Trends and scope of dermatology procedures billed by advanced practice professionals from 2012 through 2015. JAMA Dermatol. 2018;154:1040-1044.
- Anderson AM, Matsumoto M, Saul MI, et al. Accuracy of skin cancer diagnosis of physician assistants compared with dermatologists in a large health care system. JAMA Dermatol. 2018;154:569-573.
- Jalian HR, Jalian CA, Avram MM. Common causes of injury and legal action in laser surgery. JAMA Dermatol. 2013;149:188-193.
- American Medical Association. Open letter to the Honorable Alex M. Azar II. Published October 29, 2019. Accessed December 11, 2020. https://searchlf.ama-assn.org/undefined/documentDownload?uri=%2Funstructured%2Fbinary%2Fletter%2FLETTERS%2F2019-10-29-Final-Sign-on-re-10-3-Executive-Order.pdf
Practice Points
- On October 3, 2019, President Donald Trump issued the Executive Order on Protecting and Improving Medicare for Our Nation’s Seniors, in which he proposed eliminating supervision requirements for advanced practice providers (APPs) and equalizing Medicare reimbursements among APPs and physicians.
- In a review of comments posted on online forums for medical professionals, a majority of medical professionals disapproved of the executive order.
- Advanced practice providers were more likely to support the plan, citing the breadth of their experience, whereas physicians were more likely to disapprove based on their extensive training within their specialty.