User login
Harm Reduction Integration in an Interprofessional Primary Care Training Clinic
Background
Among people who use drugs (PWUD), harm reduction (HR) is an evidence-based low barrier approach to mitigating ongoing substance use risks and is considered a key pillar of the Department of Health and Human Service’s Overdose Prevention Strategy.1 Given the accessibility and continuity, primary care (PC) clinics are optimal sites for education about and provision of HR services.2,3
Aim
- Determining the impact of active and passive methods for HR supply.
- Recognizing the importance of clinician addiction education in the provision of HR services.
Methods
In January 2024, physician and nurse practitioner trainees in the West Haven Veterans Affairs (VA) Center of Education (CoE) in Interprofessional Primary Care received addiction care and HR strategy education. Initially, all patients presenting to the CoE completed a single-item substance use screening. Patients screening positive were offered HR supplies, including fentanyl and xylazine test strips (FTS, XTS), during the encounter (active distribution). Starting October 2024, HR kiosks were implemented in the clinic lobby, offering patients self-serve access to HR supplies (passive distribution). Test strip uptake was tracked through clinical encounter documentation and weekly kiosk inventory.
Results
Between January 2024 and June 2024, 92 FTS and 84 XTS were actively distributed. Upon implementation of the harm reduction kiosk, 253 FTS and 164 XTS were distributed between October 2024 and February 2025. In the CoE, FTS and XTS distribution increased by 275% and 195%, respectively, through passive kiosk distribution relative to active distribution during clinical encounters.
Conclusions
HR kiosk implementation resulted in significantly increased test strip uptake in the CoE, proving passive distribution to be an effective low barrier method of increasing access to HR and substance use disorder (SUD) resources. Although this model may reduce stigma and logistical barriers when presenting for a healthcare encounter, it limits the ability to track and engage patients for more intensive services. While each approach has unique advantages and disadvantages, test strip demand via both methods highlights the significant need for HR resources in PC settings. Continuing education for PC clinicians on low barrier SUD care and HR is critical to optimizing care for this population.
- Haffajee, RL, Sherry, TB, Dubenitz, JM, et al. Overdose prevention strategy. US Department of Health and Human Services (Issue Brief). Published October 27, 2021. Accessed December 11, 2025. https://aspe.hhs.gov/sites/default/files/documents/101936da95b69acb8446a4bad9179cc0/overdose-prevention-strategy.pdf
- Substance Abuse and Mental Health Services Administration. Advisory: low barrier models of care for substance use disorders. SAMHSA Publication No. PEP23-02-00-005. Published December 2023. Accessed December 11, 2025. https://library.samhsa.gov/sites/default/files/advisory-low-barrier-models-of-care-pep23-02-00-005.pdf
- Substance Abuse and Mental Health Services Administration: Harm Reduction Framework. Center for Substance Abuse Prevention, Substance Abuse and Mental Health Services Administration, 2023.
Background
Among people who use drugs (PWUD), harm reduction (HR) is an evidence-based low barrier approach to mitigating ongoing substance use risks and is considered a key pillar of the Department of Health and Human Service’s Overdose Prevention Strategy.1 Given the accessibility and continuity, primary care (PC) clinics are optimal sites for education about and provision of HR services.2,3
Aim
- Determining the impact of active and passive methods for HR supply.
- Recognizing the importance of clinician addiction education in the provision of HR services.
Methods
In January 2024, physician and nurse practitioner trainees in the West Haven Veterans Affairs (VA) Center of Education (CoE) in Interprofessional Primary Care received addiction care and HR strategy education. Initially, all patients presenting to the CoE completed a single-item substance use screening. Patients screening positive were offered HR supplies, including fentanyl and xylazine test strips (FTS, XTS), during the encounter (active distribution). Starting October 2024, HR kiosks were implemented in the clinic lobby, offering patients self-serve access to HR supplies (passive distribution). Test strip uptake was tracked through clinical encounter documentation and weekly kiosk inventory.
Results
Between January 2024 and June 2024, 92 FTS and 84 XTS were actively distributed. Upon implementation of the harm reduction kiosk, 253 FTS and 164 XTS were distributed between October 2024 and February 2025. In the CoE, FTS and XTS distribution increased by 275% and 195%, respectively, through passive kiosk distribution relative to active distribution during clinical encounters.
Conclusions
HR kiosk implementation resulted in significantly increased test strip uptake in the CoE, proving passive distribution to be an effective low barrier method of increasing access to HR and substance use disorder (SUD) resources. Although this model may reduce stigma and logistical barriers when presenting for a healthcare encounter, it limits the ability to track and engage patients for more intensive services. While each approach has unique advantages and disadvantages, test strip demand via both methods highlights the significant need for HR resources in PC settings. Continuing education for PC clinicians on low barrier SUD care and HR is critical to optimizing care for this population.
- Haffajee, RL, Sherry, TB, Dubenitz, JM, et al. Overdose prevention strategy. US Department of Health and Human Services (Issue Brief). Published October 27, 2021. Accessed December 11, 2025. https://aspe.hhs.gov/sites/default/files/documents/101936da95b69acb8446a4bad9179cc0/overdose-prevention-strategy.pdf
- Substance Abuse and Mental Health Services Administration. Advisory: low barrier models of care for substance use disorders. SAMHSA Publication No. PEP23-02-00-005. Published December 2023. Accessed December 11, 2025. https://library.samhsa.gov/sites/default/files/advisory-low-barrier-models-of-care-pep23-02-00-005.pdf
- Substance Abuse and Mental Health Services Administration: Harm Reduction Framework. Center for Substance Abuse Prevention, Substance Abuse and Mental Health Services Administration, 2023.
Building Trust: Enhancing Rural Women Veterans’ Healthcare Experiences Through Need-Supportive Patient-Centered Communication
Background
Rural women veterans often confront unique healthcare barriers—geographic isolation, gender-related stigma, and limited provider cultural sensitivity that undermine trust and engagement. In response, we co-designed an interprofessional communication curriculum to promote relational, patient-centered care grounded in psychological need support.
Innovation
Anchored in Self Determination Theory (SDT), this curriculum equips nurses and social workers with need-supportive communication strategies that nurture autonomy, competence, and relatedness, integrating two transformative learning methods for enhancing respectful and inclusive listening:
- Cultural humility reflections for veteran-centered care—personal narratives, storytelling, and power-awareness discussions to build lifelong reflective practices.
- Medical improv simulations—adaptive improvisational role plays for healthcare environments fostering presence, adaptability, empathy, trust-building, and real-time responsiveness.
Delivered via a multiday health professions learning lab, the training combines asynchronous workshops with in-person facilitated interactions. Core modules cover SDT foundations, need supportive dialogue, veteran-centered cultural humility, and shared decision-making practices that uplift rural women veterans’ voices. Using Kirkpatrick’s Four Level Model, we assess impact at multiple tiers:
- Reaction: Participant satisfaction and perceived training relevance.
- Learning: Pre/post assessments track SDT knowledge and communication skills gains.
- Behavior: Observe simulations and self-reported changes in communication practices.
- Results: Qualitative satisfaction metrics and care engagement trends among rural women veterans.
Results
A pilot cohort (N = 20) across two rural sites is pending implementation. pre/post surveys will assess any improved confidence in applying need supportive communication and the most effective component in building empathetic presence. Feedback measures will also indicate the significance of combined uses of medical improv and cultural humility on deepened relational capacity and trust.
Discussion
This program operationalizes SDT within healthcare communications, integrating cultural humility and improvisation learning modalities to enhance care quality for rural women veterans, ultimately strengthening provider-patient connections. Using health professions learning lab environments can foster sustained behavioral impacts. Future iterations will expand to additional rural VA sites, co-designing with the voices of women veterans through focus groups.
Tai Chi Modification and Supplemental Movements Quality Improvement Program
Background
The original program consisted of 12 movements that were to be split up between 3 weeks teaching 4 movements each week. Range of mobility was the main consideration for developing this HPE quality improvement project. Veterans who wanted to participate in Tai Chi were not able to engage in the activity due to the range of movement traditional Tai Chi required.
Innovation
The HPE Quality Improvement program developed a 15-movement warm-up, 12 co-ordinational movements consistent with the original program, 18 supplemental Tai Chi movements that were not included in the original program all of which focus on movements remaining below the shoulders and can be done standing or sitting. Four advanced exercises including “hip over heel” were included to target participants balance if able and to improve their hip strength, knee tendon/ligament strength. Tai Chi loses its potential to increase balance when performed in a sitting position.1 The movements drew upon Fu style Tai Chi and the program developer was given permission from Tommy Kirchoff to use his DVD Healing Exercises. The HPE program consisted of four 30–60-minute weekly sessions of learning the movements with another 4 weekly sessions of demonstrating the movements. Instructors were given written and visual documents to learn from and were evaluated by the developer during the last 4 weeks.
.
Results
Qualitative Data: Instructors notice a difference in how they feel, and appreciate having another option to offer veterans with mobility/standing issues. Patients expressed improvement in mobility relating to bending, arm extension, arm raising, muscle strengthening, hip strengthening and rotation.
Discussion
Future research will want to look at taking measurements before and after patient implementation to determine quantitative data related to balance, strength and range of movement including grip strength, stand up and go, and one-legged stands.
- Skelton DA, Mavroeidi A. How do muscle and bone strengthening and balance activities (MBSBA) vary across the life course, and are there particular ages where MBSBA are most important?. J Frailty Sarcopenia Falls. 2018;3(2):74-84. Published 2018 Jun 1. doi:10.22540/JFSF-03-074
Background
The original program consisted of 12 movements that were to be split up between 3 weeks teaching 4 movements each week. Range of mobility was the main consideration for developing this HPE quality improvement project. Veterans who wanted to participate in Tai Chi were not able to engage in the activity due to the range of movement traditional Tai Chi required.
Innovation
The HPE Quality Improvement program developed a 15-movement warm-up, 12 co-ordinational movements consistent with the original program, 18 supplemental Tai Chi movements that were not included in the original program all of which focus on movements remaining below the shoulders and can be done standing or sitting. Four advanced exercises including “hip over heel” were included to target participants balance if able and to improve their hip strength, knee tendon/ligament strength. Tai Chi loses its potential to increase balance when performed in a sitting position.1 The movements drew upon Fu style Tai Chi and the program developer was given permission from Tommy Kirchoff to use his DVD Healing Exercises. The HPE program consisted of four 30–60-minute weekly sessions of learning the movements with another 4 weekly sessions of demonstrating the movements. Instructors were given written and visual documents to learn from and were evaluated by the developer during the last 4 weeks.
.
Results
Qualitative Data: Instructors notice a difference in how they feel, and appreciate having another option to offer veterans with mobility/standing issues. Patients expressed improvement in mobility relating to bending, arm extension, arm raising, muscle strengthening, hip strengthening and rotation.
Discussion
Future research will want to look at taking measurements before and after patient implementation to determine quantitative data related to balance, strength and range of movement including grip strength, stand up and go, and one-legged stands.
- Skelton DA, Mavroeidi A. How do muscle and bone strengthening and balance activities (MBSBA) vary across the life course, and are there particular ages where MBSBA are most important?. J Frailty Sarcopenia Falls. 2018;3(2):74-84. Published 2018 Jun 1. doi:10.22540/JFSF-03-074
- Skelton DA, Mavroeidi A. How do muscle and bone strengthening and balance activities (MBSBA) vary across the life course, and are there particular ages where MBSBA are most important?. J Frailty Sarcopenia Falls. 2018;3(2):74-84. Published 2018 Jun 1. doi:10.22540/JFSF-03-074
Improving Life-Sustaining Treatment Discussions and Order Quality in a Primary Care Clinic
Background
Veterans Health Administration Directive 1004.03(1) (Advance Care Planning) aims to establish a “system-wide, patient-centered and evidence-based approach to Advance Care Planning.”1 Life-sustaining treatment (LST) orders are documents of patient preference regarding interventions such as mechanical ventilation, CPR, dialysis, artificial nutrition and hydration; and are considered part of an Advance Care Plan. From a bioethics perspective, these orders promote patient autonomy by formalizing patient preferences around LSTs in the medical record, particularly for when a patient lacks capacity and/or cannot make decisions on their own.2 Through consensus building, our team defined vague, inactionable, or incorrectly written LST orders as Potentially Problematic Orders (PPO). PPOs which cause confusion at the bedside or lack clarity around preferences can pose serious risks to patient safety and autonomy by exposing patients to inappropriate initiation or withholding of LSTs. Improving the quality of LST orders and reducing the number of PPOs is a crucial element for safe and effective implementation of Directive 1004.03(1).
Aim
The aim of this quality improvement project was to reduce the number of PPOs in a VA Community-Based Outpatient Clinic (CBOC) by 75% by the end of 2025.
Methods
The Model for Improvement was used for this quality improvement project.3 One year of LST orders were audited and thematic analysis identified 7 subtypes of PPO. Some PPO subtypes included clerical errors, potentially mismatched order sets (e.g., Comfort Care order with no associated DNR order) ill-defined or vague orders, and clinically impractical orders (eg, “consents to one shock during CPR”). We defined vague, ill-defined, and impractical orders as the most ethically and clinically challenging given the possibility of confusion or error at the bedside. Initial data were collected from October 2022 to October 2023, and post-intervention data were collected from February 2024 to September 2024. Interventions included process changes (clarifying role responsibility, documentation practices, patient education), regular auditing and feedback from a supervisor, and staff education.
Results
Post-intervention analysis demonstrated that the proportion of PPO remained the same, with 25% of patient charts containing at least one PPO. However, the distribution of PPO in the most ethically and clinically problematic categories (vague, ill-defined, and impractical orders) decreased from 14.7% to <1%.
Conclusions
We successfully reduced the most ethically and clinically challenging PPOs to <1% in our initial intervention. To reduce the overall proportion of PPO, we plan enhancements in process automations, additional physical educational resources, and minor changes in audit criteria. Future projects will aim to address the remaining PPO error types and prepare this project for implementation in other CBOCs.
- US Department of Veterans Affairs, Veterans Health Administration. VHA Directive 1004.03(1): Advance care planning. Published December 12, 2023. Accessed December 11, 2025. https://www.va.gov/vhapublications/ViewPublication.asp?pub_ID=11610
- White DB, Curtis JR, Lo B, Luce JM. Decisions to limit life-sustaining treatment for critically ill patients who lack both decision-making capacity and surrogate decision-makers. Crit Care Med. 2006;34(8):2053-2059. doi:10.1097/01.CCM.0000227654.38708.C1
- Ogrinc GS, Headrick LA, Barton AJ, Dolansky MA, Madigosky WS, Miltner RS, Hall AG. Fundamentals of Health Care Improvement: A Guide to Improving Your Patients’ Care (4th edition). Joint Commission Resources and Institute for Healthcare Improvement; 2022.
Background
Veterans Health Administration Directive 1004.03(1) (Advance Care Planning) aims to establish a “system-wide, patient-centered and evidence-based approach to Advance Care Planning.”1 Life-sustaining treatment (LST) orders are documents of patient preference regarding interventions such as mechanical ventilation, CPR, dialysis, artificial nutrition and hydration; and are considered part of an Advance Care Plan. From a bioethics perspective, these orders promote patient autonomy by formalizing patient preferences around LSTs in the medical record, particularly for when a patient lacks capacity and/or cannot make decisions on their own.2 Through consensus building, our team defined vague, inactionable, or incorrectly written LST orders as Potentially Problematic Orders (PPO). PPOs which cause confusion at the bedside or lack clarity around preferences can pose serious risks to patient safety and autonomy by exposing patients to inappropriate initiation or withholding of LSTs. Improving the quality of LST orders and reducing the number of PPOs is a crucial element for safe and effective implementation of Directive 1004.03(1).
Aim
The aim of this quality improvement project was to reduce the number of PPOs in a VA Community-Based Outpatient Clinic (CBOC) by 75% by the end of 2025.
Methods
The Model for Improvement was used for this quality improvement project.3 One year of LST orders were audited and thematic analysis identified 7 subtypes of PPO. Some PPO subtypes included clerical errors, potentially mismatched order sets (e.g., Comfort Care order with no associated DNR order) ill-defined or vague orders, and clinically impractical orders (eg, “consents to one shock during CPR”). We defined vague, ill-defined, and impractical orders as the most ethically and clinically challenging given the possibility of confusion or error at the bedside. Initial data were collected from October 2022 to October 2023, and post-intervention data were collected from February 2024 to September 2024. Interventions included process changes (clarifying role responsibility, documentation practices, patient education), regular auditing and feedback from a supervisor, and staff education.
Results
Post-intervention analysis demonstrated that the proportion of PPO remained the same, with 25% of patient charts containing at least one PPO. However, the distribution of PPO in the most ethically and clinically problematic categories (vague, ill-defined, and impractical orders) decreased from 14.7% to <1%.
Conclusions
We successfully reduced the most ethically and clinically challenging PPOs to <1% in our initial intervention. To reduce the overall proportion of PPO, we plan enhancements in process automations, additional physical educational resources, and minor changes in audit criteria. Future projects will aim to address the remaining PPO error types and prepare this project for implementation in other CBOCs.
- US Department of Veterans Affairs, Veterans Health Administration. VHA Directive 1004.03(1): Advance care planning. Published December 12, 2023. Accessed December 11, 2025. https://www.va.gov/vhapublications/ViewPublication.asp?pub_ID=11610
- White DB, Curtis JR, Lo B, Luce JM. Decisions to limit life-sustaining treatment for critically ill patients who lack both decision-making capacity and surrogate decision-makers. Crit Care Med. 2006;34(8):2053-2059. doi:10.1097/01.CCM.0000227654.38708.C1
- Ogrinc GS, Headrick LA, Barton AJ, Dolansky MA, Madigosky WS, Miltner RS, Hall AG. Fundamentals of Health Care Improvement: A Guide to Improving Your Patients’ Care (4th edition). Joint Commission Resources and Institute for Healthcare Improvement; 2022.
A Health Educator’s Primer to Cost-Effectiveness in Health Professions Education
Background
Cost-effectiveness (CE) evaluations, for existing and anticipated programs, are common in healthcare, but are rarely used in health professions education (HPE). A systematic review of HPE literature found not only few examples of CE evaluations, but also unclear and inconsistent methodology.1 One proposed reason HPE has been slow to adopt CE evaluations is uncertainty over terminology and how to adapt this methodology to HPE.2 CE evaluations present further challenges for HPE since educational outcomes are often not easily monetized. However, given the reality of constrained budgets and limited resources, CE evaluations can be a powerful tool for educators to strengthen arguments for proposed innovations, and for scholars seeking to conduct rigorous work that sustains critical review.
Innovation
This project aims to make CE evaluations more understandable to HPE educators, using a one-page infographic and glossary. This will provide a primer, operationalizing the steps involved in CE evaluations and addressing why and when CE evaluations might be considered in HPE. To improve comprehension, this is being developed collaboratively with health professions educators and an economist. This infographic will be submitted for publication, as a resource to facilitate educators’ scholarly work and conversations with fiscal administrators.
Results
The infographic includes 1) an overview of CE evaluations, 2) information about inputs required for CE evaluations, 3) guidance on interpreting results, 4) a glossary of key terminology, and 5) considerations for why educators might consider this type of analysis. A final draft will be pilot tested with a focus group to assess interdisciplinary accessibility.
Discussion
Discussions between health professions educators and an economist on this infographic uncovered concepts that were poorly understood or defined differently across disciplines, determining specific knowledge gaps and misunderstandings. For example, facilitating conversation between educators and economists highlighted key terms that were a source of misunderstanding. These were then added to the glossary, creating a shared vocabulary. This also helped clarify the steps and information necessary for conducting CE evaluations in HPE, particularly the issue of perspective choice for the analysis (educator, patient, learner, etc.). Overall, this collaboration aimed at making CE evaluations more approachable and understandable for HPE professionals through this infographic.
- Foo J, Cook DA, Walsh K, et al. Cost evaluations in health professions education: a systematic review of methods and reporting quality. Med Educ. 2019;53(12):1196-1208. doi:10.1111/medu.13936
- Maloney S, Reeves S, Rivers G, Ilic D, Foo J, Walsh K. The Prato Statement on cost and value in professional and interprofessional education. J Interprof Care. 2017;31(1):1-4. doi:10.1080/13561820.2016.1257255
Background
Cost-effectiveness (CE) evaluations, for existing and anticipated programs, are common in healthcare, but are rarely used in health professions education (HPE). A systematic review of HPE literature found not only few examples of CE evaluations, but also unclear and inconsistent methodology.1 One proposed reason HPE has been slow to adopt CE evaluations is uncertainty over terminology and how to adapt this methodology to HPE.2 CE evaluations present further challenges for HPE since educational outcomes are often not easily monetized. However, given the reality of constrained budgets and limited resources, CE evaluations can be a powerful tool for educators to strengthen arguments for proposed innovations, and for scholars seeking to conduct rigorous work that sustains critical review.
Innovation
This project aims to make CE evaluations more understandable to HPE educators, using a one-page infographic and glossary. This will provide a primer, operationalizing the steps involved in CE evaluations and addressing why and when CE evaluations might be considered in HPE. To improve comprehension, this is being developed collaboratively with health professions educators and an economist. This infographic will be submitted for publication, as a resource to facilitate educators’ scholarly work and conversations with fiscal administrators.
Results
The infographic includes 1) an overview of CE evaluations, 2) information about inputs required for CE evaluations, 3) guidance on interpreting results, 4) a glossary of key terminology, and 5) considerations for why educators might consider this type of analysis. A final draft will be pilot tested with a focus group to assess interdisciplinary accessibility.
Discussion
Discussions between health professions educators and an economist on this infographic uncovered concepts that were poorly understood or defined differently across disciplines, determining specific knowledge gaps and misunderstandings. For example, facilitating conversation between educators and economists highlighted key terms that were a source of misunderstanding. These were then added to the glossary, creating a shared vocabulary. This also helped clarify the steps and information necessary for conducting CE evaluations in HPE, particularly the issue of perspective choice for the analysis (educator, patient, learner, etc.). Overall, this collaboration aimed at making CE evaluations more approachable and understandable for HPE professionals through this infographic.
- Foo J, Cook DA, Walsh K, et al. Cost evaluations in health professions education: a systematic review of methods and reporting quality. Med Educ. 2019;53(12):1196-1208. doi:10.1111/medu.13936
- Maloney S, Reeves S, Rivers G, Ilic D, Foo J, Walsh K. The Prato Statement on cost and value in professional and interprofessional education. J Interprof Care. 2017;31(1):1-4. doi:10.1080/13561820.2016.1257255
Cost Analysis of Dermatology Residency Applications From 2021 to 2024 Using the Texas Seeking Transparency in Application to Residency Database
Cost Analysis of Dermatology Residency Applications From 2021 to 2024 Using the Texas Seeking Transparency in Application to Residency Database
To the Editor:
Residency applicants, especially in competitive specialties such as dermatology, face major financial barriers due to the high costs of applications, interviews, and away rotations.1 While several studies have examined application costs of other specialties, few have analyzed expenses associated with dermatology applications.1,2 There are no data examining costs following the start of the COVID-19 pandemic in 2020; thus, our study evaluated dermatology application cost trends from 2021 to 2024 and compared them to other specialties to identify strategies to reduce the financial burden on applicants.
Self-reported total application costs, application fees, interview expenses, and away rotation costs from 2021 to 2024 were collected from the Texas Seeking Transparency in Application to Residency (STAR) database powered by the UT Southwestern Medical Center (Dallas, Texas).3 The mean total application expenses per year were compared among specialties, and an analysis of variance was used to determine if the differences were statistically significant.
The number of applicants who recorded information in the Texas STAR database was 110 in 2021, 163 in 2022, 136 in 2023, and 129 in 2024.3 The total dermatology application expenses increased from $2805 in 2021 to $6231 in 2024; interview costs increased from $404 in 2021 to $911 in 2024; and away rotation costs increased from $850 in 2021 to $3812 in 2024 (all P<.05)(Table). There was no significant change in application fees during the study period ($2176 in 2021 to $2125 in 2024 [P=.58]). Dermatology had the fourth highest average total cost over the study period compared to all other specialties, increasing from $2250 in 2021 to $5250 in 2024, following orthopedic surgery ($2250 in 2021 to $6750 in 2024), plastic surgery ($2250 in 2021 to $9750 in 2024), and neurosurgery ($1750 in 2021 to $11,250 in 2024).

Our study found that dermatology residency application costs have increased significantly from 2021 to 2024, primarily driven by rising interview and away rotation expenses (both P<.05). This trend places dermatology among the most expensive fields to apply to for residency. A cross-sectional survey of dermatology residency program directors identified away rotations as one of the top 5 selection criteria, underscoring their importance in the matching process.4 In addition, a cross-sectional analysis of 345 dermatology residents found that 26.2% matched at institutions where they had mentors, including those they connected with through away rotations.5,6 Overall, the high cost of away rotations partially may reflect the competitive nature of the specialty, as building connections at programs may enhance the chances of matching. These costs also can vary based on geography, as rotating in high-cost urban centers can be more expensive than in rural areas; however, rural rotations may be less common due to limited program availability and applicant preferences. For example, nearly 50% of 2024 Electronic Residency Application Service applicants indicated a preference for urban settings, while fewer than 5% selected rural settings.7 Additionally, the high costs associated with applying to residency programs and completing away rotations can disproportionately impact students from rural backgrounds and underrepresented minorities, who may have fewer financial resources.
In our study, the lower application-related expenses in 2021 (during the pandemic) compared to those of 2024 (postpandemic) likely stem from the Association of American Medical Colleges’ recommendation to conduct virtual interviews during the pandemic.8 In 2024, some dermatology programs returned to in-person interviews, with some applicants consequently incurring higher costs related to travel, lodging, and other associated expenses.8 A cost-analysis study of 4153 dermatology applicants from 2016 to 2021 found that the average application costs were $1759 per applicant during the pandemic, when virtual interviews replaced in-person ones, whereas costs were $8476 per applicant during periods with in-person interviews and no COVID-19 restrictions.2 However, we did not observe a significant change in application fees over our study period, likely because the pandemic did not affect application numbers. A cross-sectional analysis of dermatology applicants during the pandemic similarly reported reductions in application-related expenses during the period when interviews were conducted virtually,9 supporting the trend observed in our study. Overall, our findings taken together with other studies highlight the pandemic’s role in reducing expenses and underscore the potential for exploring additional cost-saving measures.
Implementing strategies to reduce these financial burdens—including virtual interviews, increasing student funding for away rotations, and limiting the number of applications individual students can submit—could help alleviate socioeconomic disparities. The new signaling system for residency programs aims to reduce the number of applications submitted, as applicants typically receive interviews only from the limited number of programs they signal, reducing overall application costs. However, our data from the Texas STAR database suggest that application numbers remained relatively stable from 2021 to 2024, indicating that, despite signaling, many applicants still may apply broadly in hopes of improving their chances in an increasingly competitive field. Although a definitive solution to reducing the financial burden on dermatology applicants remains elusive, these strategies can raise awareness and encourage important dialogues.
Limitations of our study include the voluntary nature of the Texas STAR survey, leading to potential voluntary response bias, as well as the small sample size. Students who choose to submit cost data may differ systematically from those who do not; for example, students who match may be more likely to report their outcomes, while those who do not match may be less likely to participate, potentially introducing selection bias. In addition, general awareness of the Texas STAR survey may vary across institutions and among students, further limiting the number of students who participate. Additionally, 2021 was the only presignaling year included, making it difficult to assess longer-term trends. Despite these limitations, the Texas STAR database remains a valuable resource for analyzing general residency application expenses and trends, as it offers comprehensive data from more than 100 medical schools and includes many variables.3
In conclusion, our study found that total dermatology residency application costs have increased significantly from 2021 to 2024 (all P<.05), making dermatology among the most expensive specialties for applying. This study sets the foundation for future survey-based research for applicants and program directors on strategies to alleviate financial burdens.
- Mansouri B, Walker GD, Mitchell J, et al. The cost of applying to dermatology residency: 2014 data estimates. J Am Acad Dermatol. 2016;74:754-756. doi:10.1016/j.jaad.2015.10.049
- Gorgy M, Shah S, Arbuiso S, et al. Comparison of cost changes due to the COVID-19 pandemic for dermatology residency applications in the USA. Clin Exp Dermatol. 2022;47:600-602. doi:10.1111/ced.15001<.li>
- UT Southwestern. Texas STAR. 2024. Accessed November 5, 2025. https://www.utsouthwestern.edu/education/medical-school/about-the-school/student-affairs/texas-star.html
- Baldwin K, Weidner Z, Ahn J, et al. Are away rotations critical for a successful match in orthopaedic surgery? Clin Orthop Relat Res. 2009;467:3340-3345. doi:10.1007/s11999-009-0920-9
- Yeh C, Desai AD, Wilson BN, et al. Cross-sectional analysis of scholarly work and mentor relationships in matched dermatology residency applicants. J Am Acad Dermatol. 2022;86:1437-1439. doi:10.1016/j.jaad.2021.06.861
- Gorouhi F, Alikhan A, Rezaei A, et al. Dermatology residency selection criteria with an emphasis on program characteristics: a national program director survey. Dermatol Res Pract. 2014;2014:692760. doi:10.1155/2014/692760
- Association of American Medical Colleges. Decoding geographic and setting preferences in residency selection. January 18, 2024. Accessed October 27, 2025. https://www.aamc.org/services/eras-institutions/geographic-preferences
- Association of American Medical Colleges. Virtual interviews: tips for program directors. Updated May 14, 2020. https://med.stanford.edu/content/dam/sm/gme/program_portal/pd/pd_meet/2019-2020/8-6-20-Virtual_Interview_Tips_for_Program_Directors_05142020.pdf
- Williams GE, Zimmerman JM, Wiggins CJ, et al. The indelible marks on dermatology: impacts of COVID-19 on dermatology residency match using the Texas STAR database. Clin Dermatol. 2023;41:215-218. doi:10.1016/j.clindermatol.2022.12.001
To the Editor:
Residency applicants, especially in competitive specialties such as dermatology, face major financial barriers due to the high costs of applications, interviews, and away rotations.1 While several studies have examined application costs of other specialties, few have analyzed expenses associated with dermatology applications.1,2 There are no data examining costs following the start of the COVID-19 pandemic in 2020; thus, our study evaluated dermatology application cost trends from 2021 to 2024 and compared them to other specialties to identify strategies to reduce the financial burden on applicants.
Self-reported total application costs, application fees, interview expenses, and away rotation costs from 2021 to 2024 were collected from the Texas Seeking Transparency in Application to Residency (STAR) database powered by the UT Southwestern Medical Center (Dallas, Texas).3 The mean total application expenses per year were compared among specialties, and an analysis of variance was used to determine if the differences were statistically significant.
The number of applicants who recorded information in the Texas STAR database was 110 in 2021, 163 in 2022, 136 in 2023, and 129 in 2024.3 The total dermatology application expenses increased from $2805 in 2021 to $6231 in 2024; interview costs increased from $404 in 2021 to $911 in 2024; and away rotation costs increased from $850 in 2021 to $3812 in 2024 (all P<.05)(Table). There was no significant change in application fees during the study period ($2176 in 2021 to $2125 in 2024 [P=.58]). Dermatology had the fourth highest average total cost over the study period compared to all other specialties, increasing from $2250 in 2021 to $5250 in 2024, following orthopedic surgery ($2250 in 2021 to $6750 in 2024), plastic surgery ($2250 in 2021 to $9750 in 2024), and neurosurgery ($1750 in 2021 to $11,250 in 2024).
Our study found that dermatology residency application costs have increased significantly from 2021 to 2024, primarily driven by rising interview and away rotation expenses (both P<.05). This trend places dermatology among the most expensive fields to apply to for residency. A cross-sectional survey of dermatology residency program directors identified away rotations as one of the top 5 selection criteria, underscoring their importance in the matching process.4 In addition, a cross-sectional analysis of 345 dermatology residents found that 26.2% matched at institutions where they had mentors, including those they connected with through away rotations.5,6 Overall, the high cost of away rotations partially may reflect the competitive nature of the specialty, as building connections at programs may enhance the chances of matching. These costs also can vary based on geography, as rotating in high-cost urban centers can be more expensive than in rural areas; however, rural rotations may be less common due to limited program availability and applicant preferences. For example, nearly 50% of 2024 Electronic Residency Application Service applicants indicated a preference for urban settings, while fewer than 5% selected rural settings.7 Additionally, the high costs associated with applying to residency programs and completing away rotations can disproportionately impact students from rural backgrounds and underrepresented minorities, who may have fewer financial resources.
In our study, the lower application-related expenses in 2021 (during the pandemic) compared to those of 2024 (postpandemic) likely stem from the Association of American Medical Colleges’ recommendation to conduct virtual interviews during the pandemic.8 In 2024, some dermatology programs returned to in-person interviews, with some applicants consequently incurring higher costs related to travel, lodging, and other associated expenses.8 A cost-analysis study of 4153 dermatology applicants from 2016 to 2021 found that the average application costs were $1759 per applicant during the pandemic, when virtual interviews replaced in-person ones, whereas costs were $8476 per applicant during periods with in-person interviews and no COVID-19 restrictions.2 However, we did not observe a significant change in application fees over our study period, likely because the pandemic did not affect application numbers. A cross-sectional analysis of dermatology applicants during the pandemic similarly reported reductions in application-related expenses during the period when interviews were conducted virtually,9 supporting the trend observed in our study. Overall, our findings taken together with other studies highlight the pandemic’s role in reducing expenses and underscore the potential for exploring additional cost-saving measures.
Implementing strategies to reduce these financial burdens—including virtual interviews, increasing student funding for away rotations, and limiting the number of applications individual students can submit—could help alleviate socioeconomic disparities. The new signaling system for residency programs aims to reduce the number of applications submitted, as applicants typically receive interviews only from the limited number of programs they signal, reducing overall application costs. However, our data from the Texas STAR database suggest that application numbers remained relatively stable from 2021 to 2024, indicating that, despite signaling, many applicants still may apply broadly in hopes of improving their chances in an increasingly competitive field. Although a definitive solution to reducing the financial burden on dermatology applicants remains elusive, these strategies can raise awareness and encourage important dialogues.
Limitations of our study include the voluntary nature of the Texas STAR survey, leading to potential voluntary response bias, as well as the small sample size. Students who choose to submit cost data may differ systematically from those who do not; for example, students who match may be more likely to report their outcomes, while those who do not match may be less likely to participate, potentially introducing selection bias. In addition, general awareness of the Texas STAR survey may vary across institutions and among students, further limiting the number of students who participate. Additionally, 2021 was the only presignaling year included, making it difficult to assess longer-term trends. Despite these limitations, the Texas STAR database remains a valuable resource for analyzing general residency application expenses and trends, as it offers comprehensive data from more than 100 medical schools and includes many variables.3
In conclusion, our study found that total dermatology residency application costs have increased significantly from 2021 to 2024 (all P<.05), making dermatology among the most expensive specialties for applying. This study sets the foundation for future survey-based research for applicants and program directors on strategies to alleviate financial burdens.
- Mansouri B, Walker GD, Mitchell J, et al. The cost of applying to dermatology residency: 2014 data estimates. J Am Acad Dermatol. 2016;74:754-756. doi:10.1016/j.jaad.2015.10.049
- Gorgy M, Shah S, Arbuiso S, et al. Comparison of cost changes due to the COVID-19 pandemic for dermatology residency applications in the USA. Clin Exp Dermatol. 2022;47:600-602. doi:10.1111/ced.15001<.li>
- UT Southwestern. Texas STAR. 2024. Accessed November 5, 2025. https://www.utsouthwestern.edu/education/medical-school/about-the-school/student-affairs/texas-star.html
- Baldwin K, Weidner Z, Ahn J, et al. Are away rotations critical for a successful match in orthopaedic surgery? Clin Orthop Relat Res. 2009;467:3340-3345. doi:10.1007/s11999-009-0920-9
- Yeh C, Desai AD, Wilson BN, et al. Cross-sectional analysis of scholarly work and mentor relationships in matched dermatology residency applicants. J Am Acad Dermatol. 2022;86:1437-1439. doi:10.1016/j.jaad.2021.06.861
- Gorouhi F, Alikhan A, Rezaei A, et al. Dermatology residency selection criteria with an emphasis on program characteristics: a national program director survey. Dermatol Res Pract. 2014;2014:692760. doi:10.1155/2014/692760
- Association of American Medical Colleges. Decoding geographic and setting preferences in residency selection. January 18, 2024. Accessed October 27, 2025. https://www.aamc.org/services/eras-institutions/geographic-preferences
- Association of American Medical Colleges. Virtual interviews: tips for program directors. Updated May 14, 2020. https://med.stanford.edu/content/dam/sm/gme/program_portal/pd/pd_meet/2019-2020/8-6-20-Virtual_Interview_Tips_for_Program_Directors_05142020.pdf
- Williams GE, Zimmerman JM, Wiggins CJ, et al. The indelible marks on dermatology: impacts of COVID-19 on dermatology residency match using the Texas STAR database. Clin Dermatol. 2023;41:215-218. doi:10.1016/j.clindermatol.2022.12.001
Cost Analysis of Dermatology Residency Applications From 2021 to 2024 Using the Texas Seeking Transparency in Application to Residency Database
Cost Analysis of Dermatology Residency Applications From 2021 to 2024 Using the Texas Seeking Transparency in Application to Residency Database
PRACTICE POINTS
- Dermatology application costs increased from 2021 to 2024, largely due to expenses related to away rotations and, in some cases, a return to in-person interviews.
- Away rotations play a critical role in the dermatology match; however, they also contribute substantially to financial burden.
- The cost-saving impact of virtual interviews during the COVID-19 pandemic highlights a meaningful opportunity for future cost reduction.
- Further interventions are needed to meaningfully reduce financial burden and promote equity.

Staff Perspectives on the VISN 20 Tele-Neuropsychology Program
Staff Perspectives on the VISN 20 Tele-Neuropsychology Program
There are 2.7 million (48%) rural veterans enrolled in the Veterans Health Administration (VHA).1 Many VHA-enrolled rural veterans are aged ≥ 65 years (54%), a medically complex population that requires more extensive health care.1 These veterans may live far from US Department of Veterans Affairs (VA) medical centers (VAMCs) and often receive most of their care at rural community-based outpatient clinics (CBOCs). In addition to face-to-face (F2F) services provided at these clinics, many patient care needs may be met using telehealth technology, which can connect veterans at CBOCs with remote health care practitioners (HCPs).
This technology is used across medical specialties throughout the VA and has expanded into neuropsychology services to improve access amid the shortage of rural neuropsychologists. Prior research suggests that access to neuropsychology services improves the functional outcomes of people with diverse medical conditions, including dementia, brain injury, and epilepsy, and reduces emergency department visits, hospitalization duration, and health care costs.2-6 Given that veterans unable to access neuropsychology services may be at risk for poorer outcomes, identifying ways to improve access is a priority. Tele-neuropsychology (teleNP) has been used to expand access for rural veterans in need of these services.7,8
TeleNP is the application of audiovisual technologies to enable remote clinical encounters for neuropsychological assessments.9 TeleNP has been shown to be generally equivalent to F2F care, without significant differences compared with in-person visits.10-13 TeleNP was increasingly implemented following the COVID-19 pandemic and remains an enduring and expanding feature of neuropsychology care delivery.8,14-18 TeleNP services can increase access to care, especially for rural veterans and those with limited transportation.
Research in non-VA samples suggests a high level of clinician satisfaction with teleNP.16 In VA samples, research has found high levels of patient satisfaction with teleNP both within Veterans Integrated Services Network (VISN) 20 and in a VA health care system outside VISN 20.7,19 Investigating staff perceptions of these services and their utility compared with non-VA F2F visits is pertinent to the overall feasibility and effectiveness of teleNP.
TELE-NEUROPSYCHOLOGY PROGRAM
A clinical resource hub (CRH) is a VISN-governed program that provides veteran health care when local VHA facilities have service gaps.20,21 CRH 20 serves several Pacific Northwest VISN 20 health care systems and began providing teleNP in 2015. The CRH 20 teleNP service serves older adults in rural settings with > 570 teleNP evaluations completed over a recent 12-month period (May 2023 to May 2024). In the CRH 20 teleNP program, veterans are offered services by CRH 20 neuropsychologists via telehealth to a patient’s local VAMC, larger health care clinic, CBOC, or via Veterans Video Connect to the home.
Referral pathways to the CRH 20 teleNP program differ across sites. For VISN 20 sites that do not have any in-house neuropsychology services, referrals are initiated by HCPs from any discipline. At 2 sites with in-house neuropsychology programs, CRH 20 teleNP referrals typically are forwarded from the inhouse service whenever the veteran prefers to be seen at an outlying clinic. All sites, including the CBOCs, are equipped fully for testing, and the HCP encounters veterans in a private office via video-based telehealth technology after a telehealth technician orients them to the space. The private office minimizes environmental disruptions and uses standardized technology to ensure valid results. A limited number of evaluations are offered at home (< 5% of the evaluations) if the veteran is unable to come to a VHA facility, has access to reliable internet, and a minimally distracting home setting.
In VISN 20, teleNP is a routine practice for delivering services to rural sites, most of which lack neuropsychologists. However, there is limited information about the extent to which the referral sources find the service useful. This quality improvement (QI) project aimed to better understand how well-established teleNP services were received by referral sources/stakeholders and how services could be improved. Prior to the advent of the CRH 20 teleNP program, staff had the option of referring for F2F evaluations in the local community (outside the VA) at some sites, an option that remains. This QI project examined staff perspectives on the usefulness of CRH 20 teleNP services compared with non-VA F2F services. We administered an anonymous, confidential survey examining these factors to VISN 20 staff within 4 VA health care systems.
METHODS
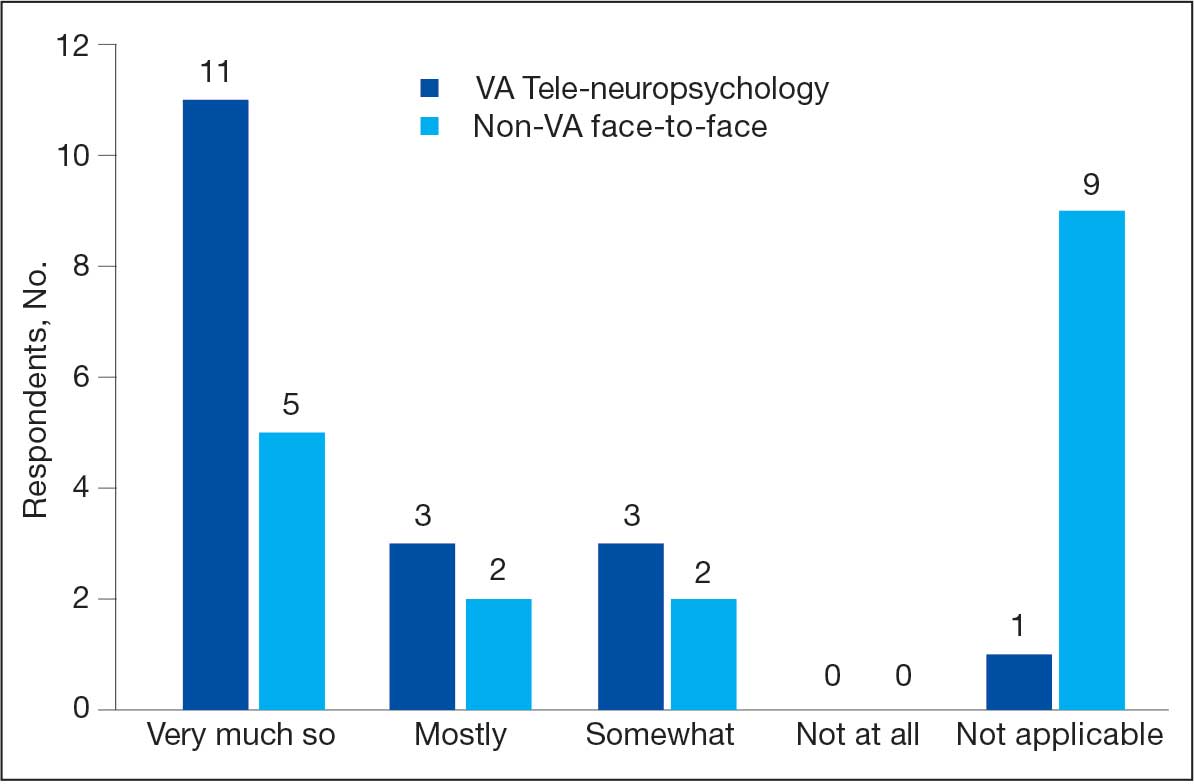
This QI project used a mixed quantitative and qualitative descriptive survey design to elicit feedback. The authors (3 neuropsychologists, 1 geropsychologist, and 1 research coordinator) developed the survey questions. The 13-question survey was voluntary, anonymous, and confidential, and respondents were given an opportunity to ask questions, with the first author serving as the point of contact.
The survey ascertained information about respondents and their work setting (ie, facility type, specific work setting and location, profession, and rurality of patients). First respondents were asked whether they have referred patients to neuropsychology services in the past year. Those who had not referred patients during the past year were asked about reasons for nonreferral with an option to provide an open-ended response. Respondents who did refer were asked how they refer for neuropsychology services and about the usefulness and timeliness of both teleNP and non-VA F2F services. Respondents were asked to respond with their preference for teleNP vs non-VA F2F with an open-ended prompt. Finally, respondents were invited to share any feedback for improvement regarding teleNP services.
A link to the survey, hosted on the VA Research Electronic Data Capture system, was emailed to facility and service line leaders at the 4 VISN 20 health care systems for distribution to the staff. All staff were included because in many of the facilities, particularly those that are highly rural with low staffing, it is not uncommon for technicians, nurses, and other support staff to assist with placing consults. In particular, VISN 20 nurses often have an optimal understanding of referral pathways to care for patients and are positioned to give and receive feedback about the utility of neuropsychological evaluations. The Research and Development Committee at the Boise VA Medical Center determined this project to be QI and exempt from institutional review board oversight. The VISN 20 employee labor relations HR supervisor approved this survey, with union awareness. Responses were anonymous.
Data were imported into Microsoft Excel and IBM SPSS Statistics for further analysis. Data were summarized using descriptive statistics, frequencies, and percentages. Nonparametric χ2 and Wilcoxon signed-rank tests were used to test for differences. An inductive approach to develop codes was used for the 3 open-ended questions. Two authors (CC, CEG) independently coded the responses and reviewed discrepancies. Final code applications were based on consensus.
RESULTS
The survey was deployed for 1 month between February 7, 2024, and June 15, 2024, at each of the 4 health care systems. Thirty-three staff members responded; of these, 1 person did not respond to an item on whether they referred for neuropsychology services. Eighteen of 33 respondents reported referring patients to teleNP or F2F neuropsychology services in the past year. Fourteen of the 33 respondents stated they did not refer; of these, 2 were unfamiliar with the teleNP service and 12 provided other reasons (eg, new to VA, not in their professional scope to order consults, did not have patients needing services).
The analysis focused on the 18 respondents who referred for neuropsychology services. Thirteen were within health care system A, and 5 were within health care system B (which had no nearby non-VA contracted neuropsychology services) and none were in the other 2 health care systems. Ten of 18 respondents (56%) stated they practiced primarily in a rural setting. Five respondents worked in a CBOC, 12 in a main VA facility, 9 in a primary care setting, 8 in a mental health setting, and 3 in other settings (eg, domiciliary). Participants could select > 1 setting. The 18 respondents who referred to neuropsychology services included 7 psychologists, 1 nurse, 2 social workers, 1 social services assistant, 4 nurse practitioners, 2 physicians, and 1 unknown HCP.
When asked to categorize the usefulness of services, more respondents characterized teleNP as very much so (1 on a 5-point scale) than F2F referrals (Figure). The mean (SD) of 1.5 (0.8) for teleNP usefulness fell between very much so and mostly and 1 respondent indicated not applicable. Similarly, the mean (SD) for non-VA F2F usefulness was 1.7 (0.9); 9 respondents rated this item as not applicable. A Wilcoxon signed-rank test of related samples indicated no significant differences between the pairs of ratings (Z = 1.50; P = .41).
Respondents with rural patients were more likely to refer them to teleNP services compared with respondents with nonrural patients (χ2 = 5.7; P = .02). However, ratings of teleNP usefulness did not significantly differ for those serving rural vs with nonrural patients (χ2 = 1.4; P = .49). Mean (SD) rating of teleNP usefulness was 1.3 (0.7) for the 9 rural subgroup respondents (between very much so and mostly) vs 1.8 (0.9) for the 8 nonrural subgroup respondents (between very much so and mostly). The mean (SD) rating for non-VA F2F usefulness was 1.8 (1.0) for the 4 rural subgroup respondents and 1.6 (0.8) for the 5 nonrural subgroup, between very much so and mostly for both groups.
Most respondents had no preference between teleNP or F2F. Notably, the responses underlying this group were multifaceted and corresponded to multiple codes (ie, access, preference for in-person services, technology, space and logistics, and service boundaries and requirements). According to 1 respondent, “the logistics of scheduling/room availability, technological challenges, and client behavioral issues that are likely to occur could possibly be more easily addressed via in-person sessions for some clients and providers.”
Six of 18 respondents preferred teleNP, citing timeliness, ease of access, and evaluation quality. One respondent noted that the “majority of my veterans live in extremely remote areas” and may need to take a plane for their visit. The 3 respondents who preferred in-person neuropsychology services cited veterans’ preference for in-person services.
Open-Ended Feedback
Thirteen respondents offered feedback on what is working well with teleNP services. Reasons mentioned were related to the service (ie, timeliness, access, quality) and the neuropsychologist (ie, communication and HCP skills). One respondent described the service and neuropsychologists positively, stating that they were “responsive, notes are readily available, clear assessments and recommendations, being available by [Microsoft] Teams/email.”
Ten respondents provided suggestions for improvement. Suggestions focused on expanding services, such as to “all veterans with cognitive/memory concerns that desire testing,” individuals with attention-deficit/hyperactivity disorder and co-occurring mental health concerns, and those in residential programs. Suggestions included hiring psychology technicians or more staff and providing education at local clinics.
DISCUSSION
This QI project examines VA staff perspectives on the usefulness of CRH 20 teleNP services and non-VA F2F services. While the small sample size limits generalizability, this preliminary study suggests that VA teleNP evaluations were similar to those conducted F2F in non-VA settings. While ratings of teleNP usefulness did not differ significantly for those serving rural vs nonrural veterans, respondents serving rural patients were more likely to refer patients to teleNP, suggesting that teleNP may increase access in rural settings, consistent with other studies.7,8,13 This article also presents qualitative suggestions for improving teleNP delivery within the VHA. This is the first known initiative to report on VHA staff satisfaction with a teleNP service and expands the limited literature to date on satisfaction with teleNP services. The findings provide initial support for continued use and, potentially, expansion of teleNP services within this CRH remote hub-and-spoke model.
Limitations
A significant limitation of the current work is the small sample size of survey respondents. In particular, while teleNP turnaround time was perceived as faster than non-VA F2F care, only 8 respondents reported on timeliness of F2F evaluation results, which renders it difficult to draw conclusions. Interestingly, not all respondents reported referring to neuropsychology services within the previous year; the most common reasons reflect the perception that referral to neuropsychology was outside of that staff member’s role or not clinically indicated.
One additional possible explanation for the absence of reporting on utility of teleNP specifically is that respondents did not track whether their patient was seen by teleNP or F2F services, based on how the referral process varies at each health care system. For example, in health care system C, a large number of referrals are forwarded to the service by local VA F2F neuropsychologists. This may speak to the seamlessness of the teleNP process, such that local staff and/or referring HCPs are unaware of the modality over which neuropsychology is being conducted. It is plausible that the reason behind this smaller response rate in health care systems B and C relates to how neuropsychology consults are processed at these local VAMCs. We suspect that in these settings, the HCPs referring for neuropsychological evaluations (eg, primary care, mental health) may be unaware that their referrals are being triaged to neuropsychologists in a different program (CRH 20 teleNP). Therefore, they would not necessarily know that they used teleNP and didn’t complete the survey.
The referral process for these 2 sites contrasts with the process for other VISN 20 sites where there is no local neuropsychology program triaging. In these settings, referrals from local HCPs come directly to teleNP; thus, it is more likely that these HCPs are aware of teleNP services. There were only 2 physicians who completed the survey, which may relate to their workload and a workflow where other staff have been increasingly requested to order the consults for the physician. This type of workflow results in an increase in the number of VHA staff involved in patient care. Ratings of usefulness were highest in health care system B, which does not have neuropsychology services at the facility or in the community; this may relate to elevated teleNP satisfaction ratings.
Further work may help identify which aspects of a teleNP service make it more useful than F2F care for this population or determine whether there were HCPor setting-specific factors that influenced the ratings (ie, preference for VA care or comparison of favorability ratings for the HCPs who conduct teleNP and F2F within the same system). The latter comparisons could not be drawn in the current systems due to the absence of HCPs who provide both teleNP and F2F modalities within VISN 20. Another consideration for future work would be to use a previously published/validated survey measure and piloting of questions with a naive sample before implementation.
CONCLUSIONS
This analysis provides initial support for feasibility and acceptability of teleNP as an alternative to traditional in-person neuropsychological evaluations. The small number of survey respondents may reflect the multiple pathways through which consults are forwarded to CRH 20, which includes both direct HCP referrals and forwarded consults from local neuropsychology services. CRH 20 has completed > 570 teleNP evaluations within 1 year, suggesting that lack of awareness may not be hindering veteran access to the service. Replication with a larger sample that is more broadly representative of key stakeholders in veteran care, identification of populations that would benefit most from teleNP services, and dissemination studies of the expansion of teleNP services are all important directions for future work. The robustness and longevity of the VISN 20 teleNP program, coupled with the preliminary positive findings from this project, demonstrate support for further assessment of the potential impact of telehealth on neuropsychological care within the VHA and show that barriers associated with access to health care services in remote settings may be mitigated through teleNP service delivery.
- US Department of Veterans Affairs, Office of Rural Health. Rural veterans. Updated March 10, 2025. Accessed July 7, 2025. https://www.ruralhealth.va.gov/aboutus/ruralvets.asp
- Braun M, Tupper D, Kaufmann P, et al. Neuropsychological assessment: a valuable tool in the diagnosis and management of neurological, neurodevelopmental, medical, and psychiatric disorders. Cogn Behav Neurol. 2011;24(3):107-114. doi:10.1097/wnn.0b013e3182351289
- Donders J. The incremental value of neuropsychological assessment: a critical review. Clin Neuropsychol. 2020;34(1):56-87. doi:10.1080/13854046.2019.1575471
- Williams MW, Rapport LJ, Hanks RA, et al. Incremental value of neuropsychological evaluations to computed tomography in predicting long-term outcomes after traumatic brain injury. Clin Neuropsychol. 2013;27(3):356-375. doi:10.1080/13854046.2013.765507
- Sieg E, Mai Q, Mosti C, Brook M. The utility of neuropsychological consultation in identifying medical inpatients with suspected cognitive impairment at risk for greater hospital utilization. Clin Neuropsychol. 2019;33(1):75-89. doi:10.1080/13854046.2018.1465124
- Vankirk KM, Horner MD, Turner TH, et al. CE hospital service utilization is reduced following neuropsychological evaluation in a sample of U.S. veterans. Clin Neuropsychol. 2013;27(5):750-761. doi:10.1080/13854046.2013.783122
- Appleman ER, O’Connor MK, Boucher SJ, et al. Teleneuropsychology clinic development and patient satisfaction. Clin Neuropsychol. 2021;35(4):819-837. doi:10.1080/13854046.2020.1871515
- Stelmokas J, Ratcliffe LN, Lengu K, et al. Evaluation of teleneuropsychology services in veterans during COVID-19. Psychol Serv. 2024;21(1):65-72. doi:10.1037/ser0000810
- Bilder R Postal KS, Barisa M, et al. Inter Organizational Practice Committee recommendations/guidance for teleneuropsychology in response to the COVID-19 pandemic. Arch Clin Neuropsychol. 2020;35(6):647-659. doi:10.1093/arclin/acaa046
- Brearly TW, Shura RD, Martindale SL, et al. Neuropsychological test administration by videoconference: a systematic review and meta-analysis. Neuropsychol Rev. 2017;27(2):174-186. doi:10.1007/s11065-017-9349-1
- Brown AD, Kelso W, Eratne D, et al. Investigating equivalence of in-person and telehealth-based neuropsychological assessment performance for individuals being investigated for younger onset dementia. Arch Clin Neuropsychol. 2024;39(5):594-607. doi:10.1093/arclin/acad108
- Chapman JE, Ponsford J, Bagot KL, et al. The use of videoconferencing in clinical neuropsychology practice: a mixed methods evaluation of neuropsychologists’ experiences and views. Aust Psychol. 2020;55(6):618-633. doi:10.1111/ap.12471
- Marra DE, Hamlet KM, Bauer RM, et al. Validity of teleneuropsychology for older adults in response to COVID-19: a systematic and critical review. Clin Neuropsychol. 2020;34:1411-1452. doi:10.1080/13854046.2020.1769192
- Hammers DB, Stolwyk R, Harder L, et al. A survey of international clinical teleneuropsychology service provision prior to COVID-19. Clin Neuropsychol. 2020;34(7-8):1267- 1283. doi:10.1080/13854046.2020.1810323
- Marra DE, Hoelzle JB, Davis JJ, et al. Initial changes in neuropsychologists’ clinical practice during the COVID-19 pandemic: a survey study. Clin Neuropsychol. 2020;34(7- 8):1251-1266. doi:10.1080/13854046.2020.1800098
- Parsons MW, Gardner MM, Sherman, JC et al. Feasibility and acceptance of direct-to-home teleneuropsychology services during the COVID-19 pandemic. J Int Neuropsychol Soc. 2022;28(2):210-215. doi:10.1017/s1355617721000436
- Rochette AD, Rahman-Filipiak A, Spencer RJ, et al. Teleneuropsychology practice survey during COVID-19 within the United States. Appl Neuropsychol Adult. 2022;29(6):1312- 1322. doi:10.1080/23279095.2021.1872576
- Messler AC, Hargrave DD, Trittschuh EH, et al. National survey of telehealth neuropsychology practices: current attitudes, practices, and relevance of tele-neuropsychology three years after the onset of COVID-19. Clin Neuropsychol. 2023;39:1017-1036. doi:10.1080/13854046.2023.2192422
- Rautman L, Sordahl JA. Veteran satisfaction with tele-neuropsychology services. Clin Neuropsychol. 2018;32:1453949. doi:10.1080/13854046.2018.1453949
- US Department of Veterans Affairs. Patient care services: clinical resource hubs. Updated March 20, 2024. Accessed August 4, 2025. https://www.patientcare .va.gov/primarycare/CRH.asp
- Burnett K, Stockdale SE, Yoon J, et al. The Clinical Resource Hub initiative: first-year implementation of the Veterans Health Administration regional telehealth contingency staffing program. Ambul Care Manage. 2023;46(3):228-239. doi:10.1097/JAC.0000000000000468
There are 2.7 million (48%) rural veterans enrolled in the Veterans Health Administration (VHA).1 Many VHA-enrolled rural veterans are aged ≥ 65 years (54%), a medically complex population that requires more extensive health care.1 These veterans may live far from US Department of Veterans Affairs (VA) medical centers (VAMCs) and often receive most of their care at rural community-based outpatient clinics (CBOCs). In addition to face-to-face (F2F) services provided at these clinics, many patient care needs may be met using telehealth technology, which can connect veterans at CBOCs with remote health care practitioners (HCPs).
This technology is used across medical specialties throughout the VA and has expanded into neuropsychology services to improve access amid the shortage of rural neuropsychologists. Prior research suggests that access to neuropsychology services improves the functional outcomes of people with diverse medical conditions, including dementia, brain injury, and epilepsy, and reduces emergency department visits, hospitalization duration, and health care costs.2-6 Given that veterans unable to access neuropsychology services may be at risk for poorer outcomes, identifying ways to improve access is a priority. Tele-neuropsychology (teleNP) has been used to expand access for rural veterans in need of these services.7,8
TeleNP is the application of audiovisual technologies to enable remote clinical encounters for neuropsychological assessments.9 TeleNP has been shown to be generally equivalent to F2F care, without significant differences compared with in-person visits.10-13 TeleNP was increasingly implemented following the COVID-19 pandemic and remains an enduring and expanding feature of neuropsychology care delivery.8,14-18 TeleNP services can increase access to care, especially for rural veterans and those with limited transportation.
Research in non-VA samples suggests a high level of clinician satisfaction with teleNP.16 In VA samples, research has found high levels of patient satisfaction with teleNP both within Veterans Integrated Services Network (VISN) 20 and in a VA health care system outside VISN 20.7,19 Investigating staff perceptions of these services and their utility compared with non-VA F2F visits is pertinent to the overall feasibility and effectiveness of teleNP.
TELE-NEUROPSYCHOLOGY PROGRAM
A clinical resource hub (CRH) is a VISN-governed program that provides veteran health care when local VHA facilities have service gaps.20,21 CRH 20 serves several Pacific Northwest VISN 20 health care systems and began providing teleNP in 2015. The CRH 20 teleNP service serves older adults in rural settings with > 570 teleNP evaluations completed over a recent 12-month period (May 2023 to May 2024). In the CRH 20 teleNP program, veterans are offered services by CRH 20 neuropsychologists via telehealth to a patient’s local VAMC, larger health care clinic, CBOC, or via Veterans Video Connect to the home.
Referral pathways to the CRH 20 teleNP program differ across sites. For VISN 20 sites that do not have any in-house neuropsychology services, referrals are initiated by HCPs from any discipline. At 2 sites with in-house neuropsychology programs, CRH 20 teleNP referrals typically are forwarded from the inhouse service whenever the veteran prefers to be seen at an outlying clinic. All sites, including the CBOCs, are equipped fully for testing, and the HCP encounters veterans in a private office via video-based telehealth technology after a telehealth technician orients them to the space. The private office minimizes environmental disruptions and uses standardized technology to ensure valid results. A limited number of evaluations are offered at home (< 5% of the evaluations) if the veteran is unable to come to a VHA facility, has access to reliable internet, and a minimally distracting home setting.
In VISN 20, teleNP is a routine practice for delivering services to rural sites, most of which lack neuropsychologists. However, there is limited information about the extent to which the referral sources find the service useful. This quality improvement (QI) project aimed to better understand how well-established teleNP services were received by referral sources/stakeholders and how services could be improved. Prior to the advent of the CRH 20 teleNP program, staff had the option of referring for F2F evaluations in the local community (outside the VA) at some sites, an option that remains. This QI project examined staff perspectives on the usefulness of CRH 20 teleNP services compared with non-VA F2F services. We administered an anonymous, confidential survey examining these factors to VISN 20 staff within 4 VA health care systems.
METHODS
This QI project used a mixed quantitative and qualitative descriptive survey design to elicit feedback. The authors (3 neuropsychologists, 1 geropsychologist, and 1 research coordinator) developed the survey questions. The 13-question survey was voluntary, anonymous, and confidential, and respondents were given an opportunity to ask questions, with the first author serving as the point of contact.
The survey ascertained information about respondents and their work setting (ie, facility type, specific work setting and location, profession, and rurality of patients). First respondents were asked whether they have referred patients to neuropsychology services in the past year. Those who had not referred patients during the past year were asked about reasons for nonreferral with an option to provide an open-ended response. Respondents who did refer were asked how they refer for neuropsychology services and about the usefulness and timeliness of both teleNP and non-VA F2F services. Respondents were asked to respond with their preference for teleNP vs non-VA F2F with an open-ended prompt. Finally, respondents were invited to share any feedback for improvement regarding teleNP services.
A link to the survey, hosted on the VA Research Electronic Data Capture system, was emailed to facility and service line leaders at the 4 VISN 20 health care systems for distribution to the staff. All staff were included because in many of the facilities, particularly those that are highly rural with low staffing, it is not uncommon for technicians, nurses, and other support staff to assist with placing consults. In particular, VISN 20 nurses often have an optimal understanding of referral pathways to care for patients and are positioned to give and receive feedback about the utility of neuropsychological evaluations. The Research and Development Committee at the Boise VA Medical Center determined this project to be QI and exempt from institutional review board oversight. The VISN 20 employee labor relations HR supervisor approved this survey, with union awareness. Responses were anonymous.
Data were imported into Microsoft Excel and IBM SPSS Statistics for further analysis. Data were summarized using descriptive statistics, frequencies, and percentages. Nonparametric χ2 and Wilcoxon signed-rank tests were used to test for differences. An inductive approach to develop codes was used for the 3 open-ended questions. Two authors (CC, CEG) independently coded the responses and reviewed discrepancies. Final code applications were based on consensus.
RESULTS
The survey was deployed for 1 month between February 7, 2024, and June 15, 2024, at each of the 4 health care systems. Thirty-three staff members responded; of these, 1 person did not respond to an item on whether they referred for neuropsychology services. Eighteen of 33 respondents reported referring patients to teleNP or F2F neuropsychology services in the past year. Fourteen of the 33 respondents stated they did not refer; of these, 2 were unfamiliar with the teleNP service and 12 provided other reasons (eg, new to VA, not in their professional scope to order consults, did not have patients needing services).
The analysis focused on the 18 respondents who referred for neuropsychology services. Thirteen were within health care system A, and 5 were within health care system B (which had no nearby non-VA contracted neuropsychology services) and none were in the other 2 health care systems. Ten of 18 respondents (56%) stated they practiced primarily in a rural setting. Five respondents worked in a CBOC, 12 in a main VA facility, 9 in a primary care setting, 8 in a mental health setting, and 3 in other settings (eg, domiciliary). Participants could select > 1 setting. The 18 respondents who referred to neuropsychology services included 7 psychologists, 1 nurse, 2 social workers, 1 social services assistant, 4 nurse practitioners, 2 physicians, and 1 unknown HCP.
When asked to categorize the usefulness of services, more respondents characterized teleNP as very much so (1 on a 5-point scale) than F2F referrals (Figure). The mean (SD) of 1.5 (0.8) for teleNP usefulness fell between very much so and mostly and 1 respondent indicated not applicable. Similarly, the mean (SD) for non-VA F2F usefulness was 1.7 (0.9); 9 respondents rated this item as not applicable. A Wilcoxon signed-rank test of related samples indicated no significant differences between the pairs of ratings (Z = 1.50; P = .41).
Respondents with rural patients were more likely to refer them to teleNP services compared with respondents with nonrural patients (χ2 = 5.7; P = .02). However, ratings of teleNP usefulness did not significantly differ for those serving rural vs with nonrural patients (χ2 = 1.4; P = .49). Mean (SD) rating of teleNP usefulness was 1.3 (0.7) for the 9 rural subgroup respondents (between very much so and mostly) vs 1.8 (0.9) for the 8 nonrural subgroup respondents (between very much so and mostly). The mean (SD) rating for non-VA F2F usefulness was 1.8 (1.0) for the 4 rural subgroup respondents and 1.6 (0.8) for the 5 nonrural subgroup, between very much so and mostly for both groups.
Most respondents had no preference between teleNP or F2F. Notably, the responses underlying this group were multifaceted and corresponded to multiple codes (ie, access, preference for in-person services, technology, space and logistics, and service boundaries and requirements). According to 1 respondent, “the logistics of scheduling/room availability, technological challenges, and client behavioral issues that are likely to occur could possibly be more easily addressed via in-person sessions for some clients and providers.”
Six of 18 respondents preferred teleNP, citing timeliness, ease of access, and evaluation quality. One respondent noted that the “majority of my veterans live in extremely remote areas” and may need to take a plane for their visit. The 3 respondents who preferred in-person neuropsychology services cited veterans’ preference for in-person services.
Open-Ended Feedback
Thirteen respondents offered feedback on what is working well with teleNP services. Reasons mentioned were related to the service (ie, timeliness, access, quality) and the neuropsychologist (ie, communication and HCP skills). One respondent described the service and neuropsychologists positively, stating that they were “responsive, notes are readily available, clear assessments and recommendations, being available by [Microsoft] Teams/email.”
Ten respondents provided suggestions for improvement. Suggestions focused on expanding services, such as to “all veterans with cognitive/memory concerns that desire testing,” individuals with attention-deficit/hyperactivity disorder and co-occurring mental health concerns, and those in residential programs. Suggestions included hiring psychology technicians or more staff and providing education at local clinics.
DISCUSSION
This QI project examines VA staff perspectives on the usefulness of CRH 20 teleNP services and non-VA F2F services. While the small sample size limits generalizability, this preliminary study suggests that VA teleNP evaluations were similar to those conducted F2F in non-VA settings. While ratings of teleNP usefulness did not differ significantly for those serving rural vs nonrural veterans, respondents serving rural patients were more likely to refer patients to teleNP, suggesting that teleNP may increase access in rural settings, consistent with other studies.7,8,13 This article also presents qualitative suggestions for improving teleNP delivery within the VHA. This is the first known initiative to report on VHA staff satisfaction with a teleNP service and expands the limited literature to date on satisfaction with teleNP services. The findings provide initial support for continued use and, potentially, expansion of teleNP services within this CRH remote hub-and-spoke model.
Limitations
A significant limitation of the current work is the small sample size of survey respondents. In particular, while teleNP turnaround time was perceived as faster than non-VA F2F care, only 8 respondents reported on timeliness of F2F evaluation results, which renders it difficult to draw conclusions. Interestingly, not all respondents reported referring to neuropsychology services within the previous year; the most common reasons reflect the perception that referral to neuropsychology was outside of that staff member’s role or not clinically indicated.
One additional possible explanation for the absence of reporting on utility of teleNP specifically is that respondents did not track whether their patient was seen by teleNP or F2F services, based on how the referral process varies at each health care system. For example, in health care system C, a large number of referrals are forwarded to the service by local VA F2F neuropsychologists. This may speak to the seamlessness of the teleNP process, such that local staff and/or referring HCPs are unaware of the modality over which neuropsychology is being conducted. It is plausible that the reason behind this smaller response rate in health care systems B and C relates to how neuropsychology consults are processed at these local VAMCs. We suspect that in these settings, the HCPs referring for neuropsychological evaluations (eg, primary care, mental health) may be unaware that their referrals are being triaged to neuropsychologists in a different program (CRH 20 teleNP). Therefore, they would not necessarily know that they used teleNP and didn’t complete the survey.
The referral process for these 2 sites contrasts with the process for other VISN 20 sites where there is no local neuropsychology program triaging. In these settings, referrals from local HCPs come directly to teleNP; thus, it is more likely that these HCPs are aware of teleNP services. There were only 2 physicians who completed the survey, which may relate to their workload and a workflow where other staff have been increasingly requested to order the consults for the physician. This type of workflow results in an increase in the number of VHA staff involved in patient care. Ratings of usefulness were highest in health care system B, which does not have neuropsychology services at the facility or in the community; this may relate to elevated teleNP satisfaction ratings.
Further work may help identify which aspects of a teleNP service make it more useful than F2F care for this population or determine whether there were HCPor setting-specific factors that influenced the ratings (ie, preference for VA care or comparison of favorability ratings for the HCPs who conduct teleNP and F2F within the same system). The latter comparisons could not be drawn in the current systems due to the absence of HCPs who provide both teleNP and F2F modalities within VISN 20. Another consideration for future work would be to use a previously published/validated survey measure and piloting of questions with a naive sample before implementation.
CONCLUSIONS
This analysis provides initial support for feasibility and acceptability of teleNP as an alternative to traditional in-person neuropsychological evaluations. The small number of survey respondents may reflect the multiple pathways through which consults are forwarded to CRH 20, which includes both direct HCP referrals and forwarded consults from local neuropsychology services. CRH 20 has completed > 570 teleNP evaluations within 1 year, suggesting that lack of awareness may not be hindering veteran access to the service. Replication with a larger sample that is more broadly representative of key stakeholders in veteran care, identification of populations that would benefit most from teleNP services, and dissemination studies of the expansion of teleNP services are all important directions for future work. The robustness and longevity of the VISN 20 teleNP program, coupled with the preliminary positive findings from this project, demonstrate support for further assessment of the potential impact of telehealth on neuropsychological care within the VHA and show that barriers associated with access to health care services in remote settings may be mitigated through teleNP service delivery.
- US Department of Veterans Affairs, Office of Rural Health. Rural veterans. Updated March 10, 2025. Accessed July 7, 2025. https://www.ruralhealth.va.gov/aboutus/ruralvets.asp
- Braun M, Tupper D, Kaufmann P, et al. Neuropsychological assessment: a valuable tool in the diagnosis and management of neurological, neurodevelopmental, medical, and psychiatric disorders. Cogn Behav Neurol. 2011;24(3):107-114. doi:10.1097/wnn.0b013e3182351289
- Donders J. The incremental value of neuropsychological assessment: a critical review. Clin Neuropsychol. 2020;34(1):56-87. doi:10.1080/13854046.2019.1575471
- Williams MW, Rapport LJ, Hanks RA, et al. Incremental value of neuropsychological evaluations to computed tomography in predicting long-term outcomes after traumatic brain injury. Clin Neuropsychol. 2013;27(3):356-375. doi:10.1080/13854046.2013.765507
- Sieg E, Mai Q, Mosti C, Brook M. The utility of neuropsychological consultation in identifying medical inpatients with suspected cognitive impairment at risk for greater hospital utilization. Clin Neuropsychol. 2019;33(1):75-89. doi:10.1080/13854046.2018.1465124
- Vankirk KM, Horner MD, Turner TH, et al. CE hospital service utilization is reduced following neuropsychological evaluation in a sample of U.S. veterans. Clin Neuropsychol. 2013;27(5):750-761. doi:10.1080/13854046.2013.783122
- Appleman ER, O’Connor MK, Boucher SJ, et al. Teleneuropsychology clinic development and patient satisfaction. Clin Neuropsychol. 2021;35(4):819-837. doi:10.1080/13854046.2020.1871515
- Stelmokas J, Ratcliffe LN, Lengu K, et al. Evaluation of teleneuropsychology services in veterans during COVID-19. Psychol Serv. 2024;21(1):65-72. doi:10.1037/ser0000810
- Bilder R Postal KS, Barisa M, et al. Inter Organizational Practice Committee recommendations/guidance for teleneuropsychology in response to the COVID-19 pandemic. Arch Clin Neuropsychol. 2020;35(6):647-659. doi:10.1093/arclin/acaa046
- Brearly TW, Shura RD, Martindale SL, et al. Neuropsychological test administration by videoconference: a systematic review and meta-analysis. Neuropsychol Rev. 2017;27(2):174-186. doi:10.1007/s11065-017-9349-1
- Brown AD, Kelso W, Eratne D, et al. Investigating equivalence of in-person and telehealth-based neuropsychological assessment performance for individuals being investigated for younger onset dementia. Arch Clin Neuropsychol. 2024;39(5):594-607. doi:10.1093/arclin/acad108
- Chapman JE, Ponsford J, Bagot KL, et al. The use of videoconferencing in clinical neuropsychology practice: a mixed methods evaluation of neuropsychologists’ experiences and views. Aust Psychol. 2020;55(6):618-633. doi:10.1111/ap.12471
- Marra DE, Hamlet KM, Bauer RM, et al. Validity of teleneuropsychology for older adults in response to COVID-19: a systematic and critical review. Clin Neuropsychol. 2020;34:1411-1452. doi:10.1080/13854046.2020.1769192
- Hammers DB, Stolwyk R, Harder L, et al. A survey of international clinical teleneuropsychology service provision prior to COVID-19. Clin Neuropsychol. 2020;34(7-8):1267- 1283. doi:10.1080/13854046.2020.1810323
- Marra DE, Hoelzle JB, Davis JJ, et al. Initial changes in neuropsychologists’ clinical practice during the COVID-19 pandemic: a survey study. Clin Neuropsychol. 2020;34(7- 8):1251-1266. doi:10.1080/13854046.2020.1800098
- Parsons MW, Gardner MM, Sherman, JC et al. Feasibility and acceptance of direct-to-home teleneuropsychology services during the COVID-19 pandemic. J Int Neuropsychol Soc. 2022;28(2):210-215. doi:10.1017/s1355617721000436
- Rochette AD, Rahman-Filipiak A, Spencer RJ, et al. Teleneuropsychology practice survey during COVID-19 within the United States. Appl Neuropsychol Adult. 2022;29(6):1312- 1322. doi:10.1080/23279095.2021.1872576
- Messler AC, Hargrave DD, Trittschuh EH, et al. National survey of telehealth neuropsychology practices: current attitudes, practices, and relevance of tele-neuropsychology three years after the onset of COVID-19. Clin Neuropsychol. 2023;39:1017-1036. doi:10.1080/13854046.2023.2192422
- Rautman L, Sordahl JA. Veteran satisfaction with tele-neuropsychology services. Clin Neuropsychol. 2018;32:1453949. doi:10.1080/13854046.2018.1453949
- US Department of Veterans Affairs. Patient care services: clinical resource hubs. Updated March 20, 2024. Accessed August 4, 2025. https://www.patientcare .va.gov/primarycare/CRH.asp
- Burnett K, Stockdale SE, Yoon J, et al. The Clinical Resource Hub initiative: first-year implementation of the Veterans Health Administration regional telehealth contingency staffing program. Ambul Care Manage. 2023;46(3):228-239. doi:10.1097/JAC.0000000000000468
Staff Perspectives on the VISN 20 Tele-Neuropsychology Program
Staff Perspectives on the VISN 20 Tele-Neuropsychology Program
The Role of Dermatologists in Developing AI Tools for Diagnosis and Classification of Skin Disease
The Role of Dermatologists in Developing AI Tools for Diagnosis and Classification of Skin Disease
Use of artificial intelligence (AI) in dermatology has increased over the past decade, likely driven by advances in deep learning algorithms, computing hardware, and machine learning.1 Studies comparing the performance of AI algorithms to dermatologists in classifying skin disorders have shown conflicting results.2,3 In this study, we aimed to analyze AI tools used for diagnosing and classifying skin disease and evaluate the role of dermatologists in the creation of AI technology. We also investigated the number of clinical images used in datasets to train AI programs and compared tools that were created with dermatologist input to those created without dermatologist/clinician involvement.
Methods
A search of PubMed articles indexed for MEDLINE using the terms machine learning, artificial intelligence, and dermatology was conducted on September 18, 2022. Articles were included if they described full-length trials; used machine learning for diagnosis of or screening for dermatologic conditions; and used dermoscopic or gross image datasets of the skin, hair, or nails. Articles were categorized into 4 groups based on the conditions covered: chronic wounds, inflammatory skin diseases, mixed conditions, and pigmented skin lesions. Algorithms were sorted into 4 categories: convolutional/convoluted neural network, deep learning model/deep neural network, AI/artificial neural network, and other. Details regarding Fitzpatrick skin type and skin of color (SoC) inclusion in the articles or AI algorithm datasets were recorded. Univariate and multivariate analyses were performed using Microsoft Excel and SAS Studio 3.8. Sensitivity and specificity were calculated for all included AI technology. Sensitivity, specificity, and the number of clinical images were compared among the included articles using analysis of variance and t tests (α=0.05; P<.05 indicated statistical significance).
Results
Our search yielded 1016 articles, 58 of which met the inclusion criteria. Overall, 25.9% (15/58) of the articles utilized AI to diagnose or classify mixed skin diseases; 22.4% (13/58) for pigmented skin lesions; 19.0% (11/58) for wounds; 17.2% (10/58) for inflammatory skin diseases; and 5.2% (3/58) each for acne, psoriasis, and onychomycosis. Overall, 24.0% (14/58) of articles provided information about Fitzpatrick skin type, and 58.7% (34/58) included clinical images depicting SoC. Furthermore, we found that only 20.7% (12/58) of articles on deep learning models included descriptions of patient ethnicity or race in at least 1 dataset, and only 10.3% (6/58) of studies included any information about skin tone in the dataset. Studies with a dermatologist as the last author (most likely to be supervising the project) were more likely to include clinical images depicting SoC than those without (82.6% [19/23] and 16.7% [3/18], respectively [P=.0411]).
The mean (SD) number of clinical images in the study articles was 28,422 (84,050). Thirty-seven (63.8%) of the study articles included gross images, 17 (29.3%) used dermoscopic images, and 4 (6.9%) used both. Twenty-seven (46.6%) articles used convolutional/convoluted neural networks, 15 (25.9%) used deep learning model/deep neural networks, 8 (13.8%) used other algorithms, 6 (10.3%) used AI/artificial neural network, and 2 (3.4%) used fuzzy algorithms. Most studies were conducted in China (29.3% [17/58]), Germany (12.1% [7/58]), India (10.3% [6/58]), multiple nations (10.3% [6/58]), and the United States (10.3% [6/58]). Overall, 82.8% (48/58) of articles included at least 1 dermatologist coauthor. Sensitivity of the AI models was 0.85, and specificity was 0.85. The average percentage of images in the dataset correctly identified by a physician was 76.87% vs 81.62% of images correctly identified by AI. Average agreement between AI and physician assessment was 77.98%, defined as AI and physician both having the same diagnosis.
Articles authored by dermatologists contained more clinical images than those without dermatologists in key authorship roles (P<.0001)(eTable). Psoriasis-related algorithms had the fewest (mean [SD]: 3173 [4203]), and pigmented skin lesions had the most clinical images (mean [SD]: 53,19l [155,579]).
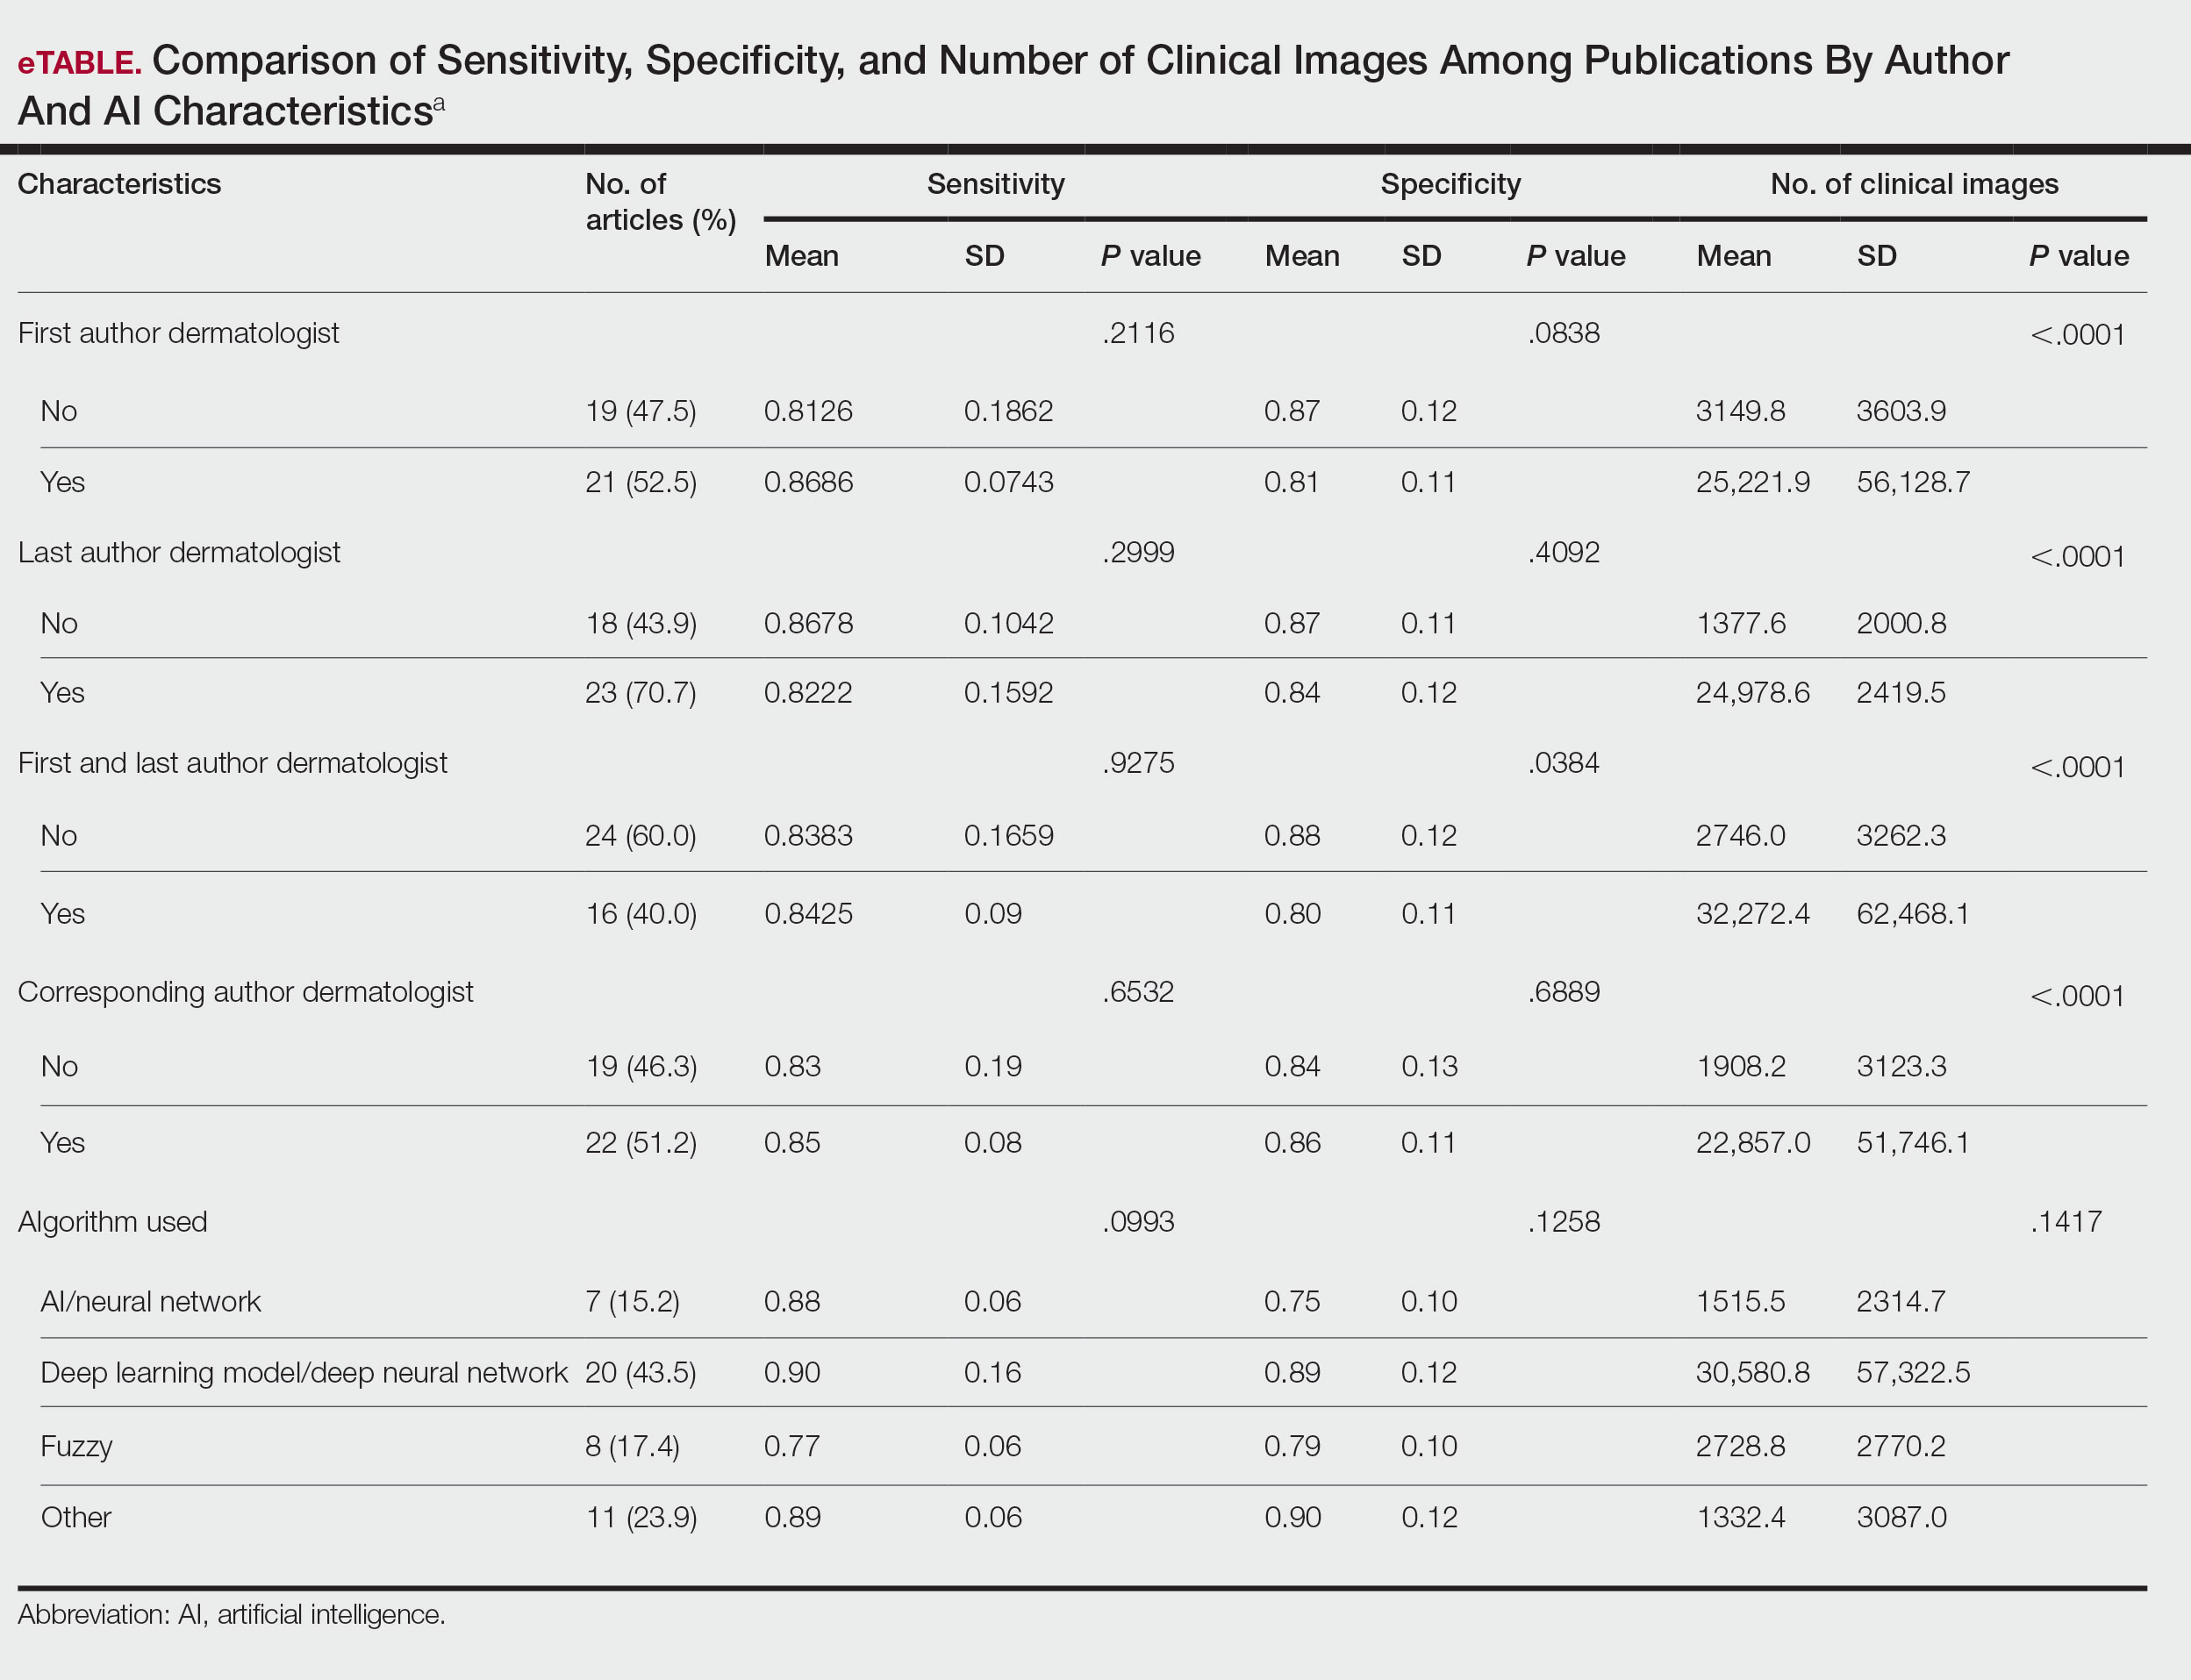
Comment
Our results indicated that AI studies with dermatologist authors had significantly more images in their datasets (ie, the set of clinical images of skin lesions used to train AI algorithms in diagnosing or classifying lesions) than those with nondermatologist authors (P<.0001)(eTable). Similarly, in a study of AI technology for skin cancer diagnosis, AI studies with dermatologist authors (ie, included in the development of the AI algorithm) had more images than studies without dermatologist authors.1 Deep learning textbooks have suggested that 5000 clinical images or training input per output category are needed to produce acceptable algorithm performance, and more than 10 million are needed to produce results superior to human performance.4-10 Despite advances in AI for dermatologic image analysis, the creation of these models often has been directed by nondermatologists1; therefore, dermatologist involvement in AI development is necessary to facilitate collection of larger image datasets and optimal performance for image diagnosis/classification tasks.
We found that 20.7% of articles on deep learning models included descriptions of patient ethnicity or race, and only 10.3% of studies included any information about skin tone in the dataset. Furthermore, American investigators primarily trained models using clinical images of patients with lighter skin tones, whereas Chinese investigators exclusively included images depicting darker skin tones. Similarly, in a study of 52 cutaneous imaging deep learning articles, only 17.3% (9/52) reported race and/or Fitzpatrick skin type, and only 7.7% (4/52) of articles included both.2,6,8 Therefore, dermatologists are needed to contribute images representing diverse populations and collaborate in AI research studies, as their involvement is necessary to ensure the accuracy of AI models in classifying lesions or diagnosing skin lesions across all skin types.
Our search was limited to PubMed, and real-world applications could not be evaluated.
Conclusion
In summary, we found that AI studies with dermatologist authors used larger numbers of clinical images in their datasets and more images representing diverse skin types than studies without. Therefore, we advocate for greater involvement of dermatologists in AI research, which might result in better patient outcomes by improving diagnostic accuracy.
- Zakhem GA, Fakhoury JW, Motosko CC, et al. Characterizing the role of dermatologists in developing artificial intelligence for assessment of skin cancer. J Am Acad Dermatol. 2021;85:1544-1556.
- Daneshjou R, Vodrahalli K, Novoa RA, et al. Disparities in dermatology AI performance on a diverse, curated clinical image set. Sci Adv. 2022;8:eabq6147.
- Wu E, Wu K, Daneshjou R, et al. How medical AI devices are evaluated: limitations and recommendations from an analysis of FDA approvals. Nat Med. 2021;27:582-584.
- Murphree DH, Puri P, Shamim H, et al. Deep learning for dermatologists: part I. Fundamental concepts. J Am Acad Dermatol. 2022;87:1343-1351.
- Goodfellow I, Bengio Y, Courville A. Deep Learning. The MIT Press; 2016.
- Kim YH, Kobic A, Vidal NY. Distribution of race and Fitzpatrick skin types in data sets for deep learning in dermatology: a systematic review. J Am Acad Dermatol. 2022;87:460-461.
- Liu Y, Jain A, Eng C, et al. A deep learning system for differential diagnosis of skin diseases. Nat Med. 2020;26:900-908.
- Zhu CY, Wang YK, Chen HP, et al. A deep learning based framework for diagnosing multiple skin diseases in a clinical environment. Front Med (Lausanne). 2021;8:626369.
- Capurro N, Pastore VP, Touijer L, et al. A deep learning approach to direct immunofluorescence pattern recognition in autoimmune bullous diseases. Br J Dermatol. 2024;191:261-266.
- Han SS, Park I, Eun Chang S, et al. Augmented intelligence dermatology: deep neural networks empower medical professionals in diagnosing skin cancer and predicting treatment options for 134 skin disorders. J Invest Dermatol. 2020;140:1753-1761.
Use of artificial intelligence (AI) in dermatology has increased over the past decade, likely driven by advances in deep learning algorithms, computing hardware, and machine learning.1 Studies comparing the performance of AI algorithms to dermatologists in classifying skin disorders have shown conflicting results.2,3 In this study, we aimed to analyze AI tools used for diagnosing and classifying skin disease and evaluate the role of dermatologists in the creation of AI technology. We also investigated the number of clinical images used in datasets to train AI programs and compared tools that were created with dermatologist input to those created without dermatologist/clinician involvement.
Methods
A search of PubMed articles indexed for MEDLINE using the terms machine learning, artificial intelligence, and dermatology was conducted on September 18, 2022. Articles were included if they described full-length trials; used machine learning for diagnosis of or screening for dermatologic conditions; and used dermoscopic or gross image datasets of the skin, hair, or nails. Articles were categorized into 4 groups based on the conditions covered: chronic wounds, inflammatory skin diseases, mixed conditions, and pigmented skin lesions. Algorithms were sorted into 4 categories: convolutional/convoluted neural network, deep learning model/deep neural network, AI/artificial neural network, and other. Details regarding Fitzpatrick skin type and skin of color (SoC) inclusion in the articles or AI algorithm datasets were recorded. Univariate and multivariate analyses were performed using Microsoft Excel and SAS Studio 3.8. Sensitivity and specificity were calculated for all included AI technology. Sensitivity, specificity, and the number of clinical images were compared among the included articles using analysis of variance and t tests (α=0.05; P<.05 indicated statistical significance).
Results
Our search yielded 1016 articles, 58 of which met the inclusion criteria. Overall, 25.9% (15/58) of the articles utilized AI to diagnose or classify mixed skin diseases; 22.4% (13/58) for pigmented skin lesions; 19.0% (11/58) for wounds; 17.2% (10/58) for inflammatory skin diseases; and 5.2% (3/58) each for acne, psoriasis, and onychomycosis. Overall, 24.0% (14/58) of articles provided information about Fitzpatrick skin type, and 58.7% (34/58) included clinical images depicting SoC. Furthermore, we found that only 20.7% (12/58) of articles on deep learning models included descriptions of patient ethnicity or race in at least 1 dataset, and only 10.3% (6/58) of studies included any information about skin tone in the dataset. Studies with a dermatologist as the last author (most likely to be supervising the project) were more likely to include clinical images depicting SoC than those without (82.6% [19/23] and 16.7% [3/18], respectively [P=.0411]).
The mean (SD) number of clinical images in the study articles was 28,422 (84,050). Thirty-seven (63.8%) of the study articles included gross images, 17 (29.3%) used dermoscopic images, and 4 (6.9%) used both. Twenty-seven (46.6%) articles used convolutional/convoluted neural networks, 15 (25.9%) used deep learning model/deep neural networks, 8 (13.8%) used other algorithms, 6 (10.3%) used AI/artificial neural network, and 2 (3.4%) used fuzzy algorithms. Most studies were conducted in China (29.3% [17/58]), Germany (12.1% [7/58]), India (10.3% [6/58]), multiple nations (10.3% [6/58]), and the United States (10.3% [6/58]). Overall, 82.8% (48/58) of articles included at least 1 dermatologist coauthor. Sensitivity of the AI models was 0.85, and specificity was 0.85. The average percentage of images in the dataset correctly identified by a physician was 76.87% vs 81.62% of images correctly identified by AI. Average agreement between AI and physician assessment was 77.98%, defined as AI and physician both having the same diagnosis.
Articles authored by dermatologists contained more clinical images than those without dermatologists in key authorship roles (P<.0001)(eTable). Psoriasis-related algorithms had the fewest (mean [SD]: 3173 [4203]), and pigmented skin lesions had the most clinical images (mean [SD]: 53,19l [155,579]).
Comment
Our results indicated that AI studies with dermatologist authors had significantly more images in their datasets (ie, the set of clinical images of skin lesions used to train AI algorithms in diagnosing or classifying lesions) than those with nondermatologist authors (P<.0001)(eTable). Similarly, in a study of AI technology for skin cancer diagnosis, AI studies with dermatologist authors (ie, included in the development of the AI algorithm) had more images than studies without dermatologist authors.1 Deep learning textbooks have suggested that 5000 clinical images or training input per output category are needed to produce acceptable algorithm performance, and more than 10 million are needed to produce results superior to human performance.4-10 Despite advances in AI for dermatologic image analysis, the creation of these models often has been directed by nondermatologists1; therefore, dermatologist involvement in AI development is necessary to facilitate collection of larger image datasets and optimal performance for image diagnosis/classification tasks.
We found that 20.7% of articles on deep learning models included descriptions of patient ethnicity or race, and only 10.3% of studies included any information about skin tone in the dataset. Furthermore, American investigators primarily trained models using clinical images of patients with lighter skin tones, whereas Chinese investigators exclusively included images depicting darker skin tones. Similarly, in a study of 52 cutaneous imaging deep learning articles, only 17.3% (9/52) reported race and/or Fitzpatrick skin type, and only 7.7% (4/52) of articles included both.2,6,8 Therefore, dermatologists are needed to contribute images representing diverse populations and collaborate in AI research studies, as their involvement is necessary to ensure the accuracy of AI models in classifying lesions or diagnosing skin lesions across all skin types.
Our search was limited to PubMed, and real-world applications could not be evaluated.
Conclusion
In summary, we found that AI studies with dermatologist authors used larger numbers of clinical images in their datasets and more images representing diverse skin types than studies without. Therefore, we advocate for greater involvement of dermatologists in AI research, which might result in better patient outcomes by improving diagnostic accuracy.
- Zakhem GA, Fakhoury JW, Motosko CC, et al. Characterizing the role of dermatologists in developing artificial intelligence for assessment of skin cancer. J Am Acad Dermatol. 2021;85:1544-1556.
- Daneshjou R, Vodrahalli K, Novoa RA, et al. Disparities in dermatology AI performance on a diverse, curated clinical image set. Sci Adv. 2022;8:eabq6147.
- Wu E, Wu K, Daneshjou R, et al. How medical AI devices are evaluated: limitations and recommendations from an analysis of FDA approvals. Nat Med. 2021;27:582-584.
- Murphree DH, Puri P, Shamim H, et al. Deep learning for dermatologists: part I. Fundamental concepts. J Am Acad Dermatol. 2022;87:1343-1351.
- Goodfellow I, Bengio Y, Courville A. Deep Learning. The MIT Press; 2016.
- Kim YH, Kobic A, Vidal NY. Distribution of race and Fitzpatrick skin types in data sets for deep learning in dermatology: a systematic review. J Am Acad Dermatol. 2022;87:460-461.
- Liu Y, Jain A, Eng C, et al. A deep learning system for differential diagnosis of skin diseases. Nat Med. 2020;26:900-908.
- Zhu CY, Wang YK, Chen HP, et al. A deep learning based framework for diagnosing multiple skin diseases in a clinical environment. Front Med (Lausanne). 2021;8:626369.
- Capurro N, Pastore VP, Touijer L, et al. A deep learning approach to direct immunofluorescence pattern recognition in autoimmune bullous diseases. Br J Dermatol. 2024;191:261-266.
- Han SS, Park I, Eun Chang S, et al. Augmented intelligence dermatology: deep neural networks empower medical professionals in diagnosing skin cancer and predicting treatment options for 134 skin disorders. J Invest Dermatol. 2020;140:1753-1761.
The Role of Dermatologists in Developing AI Tools for Diagnosis and Classification of Skin Disease
The Role of Dermatologists in Developing AI Tools for Diagnosis and Classification of Skin Disease
Practice Points
- Artificial intelligence (AI) technology is emerging as a valuable tool in diagnosing and classifying dermatologic conditions.
- Despite advances in AI for dermatologic image analysis, the creation of these models often has been directed by nondermatologists.

The Current State of Postgraduate Dermatology Training Programs for Advanced Practice Providers
The Current State of Postgraduate Dermatology Training Programs for Advanced Practice Providers
Nurse practitioners (NPs) and physician assistants (PAs) often help provide dermatologic care but lack the same mandatory specialized postgraduate training required of board-certified dermatologists (BCDs), which includes at least 3 years of dermatology-focused education in an accredited residency program in addition to an intern year of general medicine, pediatrics, or surgery. Dermatology residency is followed by a certification examination administered by the American Board of Dermatology (ABD) or the American Osteopathic Board of Dermatology, leading to board certification. Some physicians choose to do a fellowship, which typically involves an additional 1 to 2 years of postresidency subspeciality training.
Optional postgraduate dermatology training programs for advanced practice providers (APPs) have been offered by some academic institutions and private practice groups since at least 2003, including Lahey Hospital and Medical Center (Burlington, Massachusetts) as well as the University of Rochester Medical Center (Rochester, New York). Despite a lack of accreditation or standardization, the programs can be beneficial for NPs and PAs to expand their dermatologic knowledge and skills and help bridge the care gap within the specialty. Didactics often are conducted in parallel with the educational activities of the parent institution’s traditional dermatology residency program (eg, lectures, grand rounds). While these programs often are managed by practicing dermatology NPs and PAs, dermatologists also may be involved in their education with didactic instruction, curriculum development, and clinical preceptorship.
In this cross-sectional study, we identified and evaluated 10 postgraduate dermatology training programs for APPs across the United States. With the growing number of NPs and PAs in the dermatology workforce—both in academic and private practice—it is important for BCDs to be aware of the differences in the dermatology training received in order to ensure safe and effective care is provided through supervisory or collaborative roles (depending on state independent practice laws for APPs and to be aware of the implications these programs may have on the field of dermatology.
Methods
To identify postgraduate dermatology training programs for APPs in the United States, we conducted a cross-sectional study using data obtained via a Google search of various combinations of the following terms: nurse practitioner, NP, physician assistant, PA, advance practice provider, APP, dermatology, postgraduate training, residency, and fellowship. We excluded postgraduate dermatology training programs for APPs that required tuition and did not provide a stipend, as well as programs that lacked the formal structure and credibility needed to qualify as legitimate postgraduate training. Many of the excluded programs operate in a manner that raises ethical concerns, offering pay-to-play opportunities under the guise of education. Information collected on each program included the program name, location, parent institution, program length, class size, curriculum, and any associated salary and benefits.
Results
Ten academic and private practice organizations across the United States that offer postgraduate dermatologic training programs for APPs were identified (eTable). Four (40%) programs were advertised as fellowships. Six (60%) of the programs were offered at academic medical centers, and 4 (40%) were offered by private practices. Most programs were located east of the Mississippi River, and many institutions offered instruction at 1 or more locations within the same state (eFigure). The Advanced Dermatology and Cosmetic Surgery private practice group offered training opportunities in multiple states.
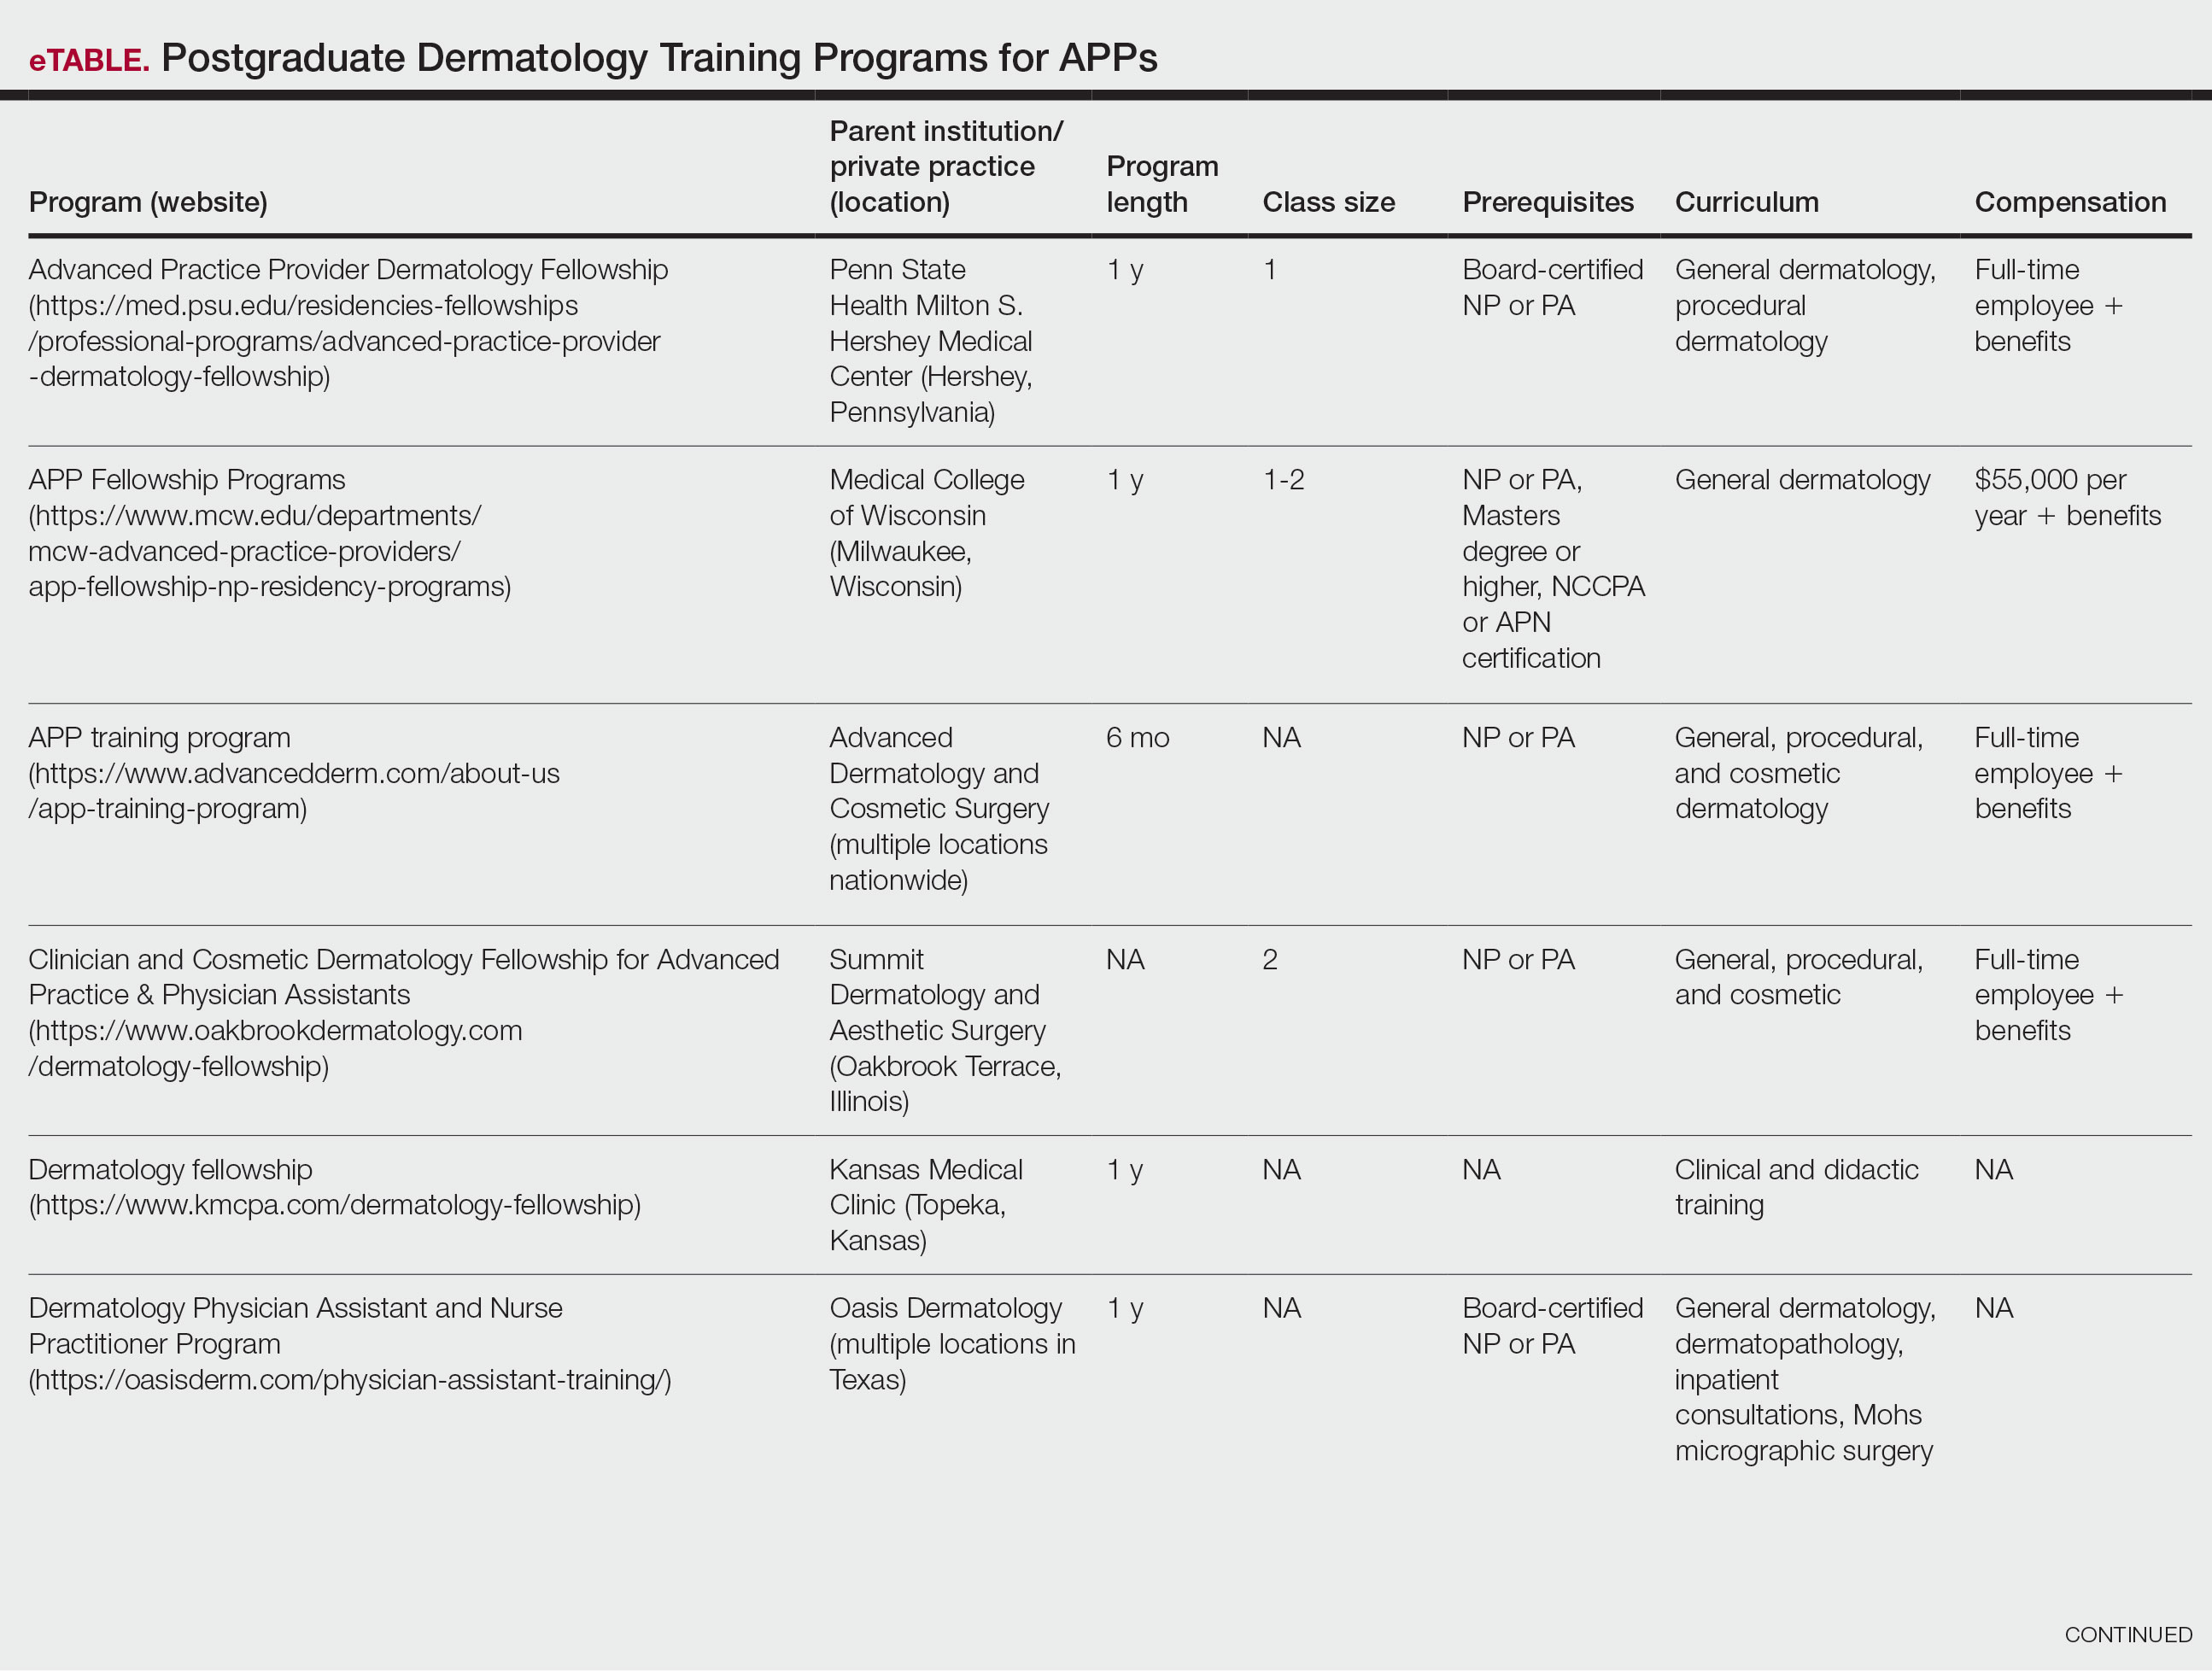
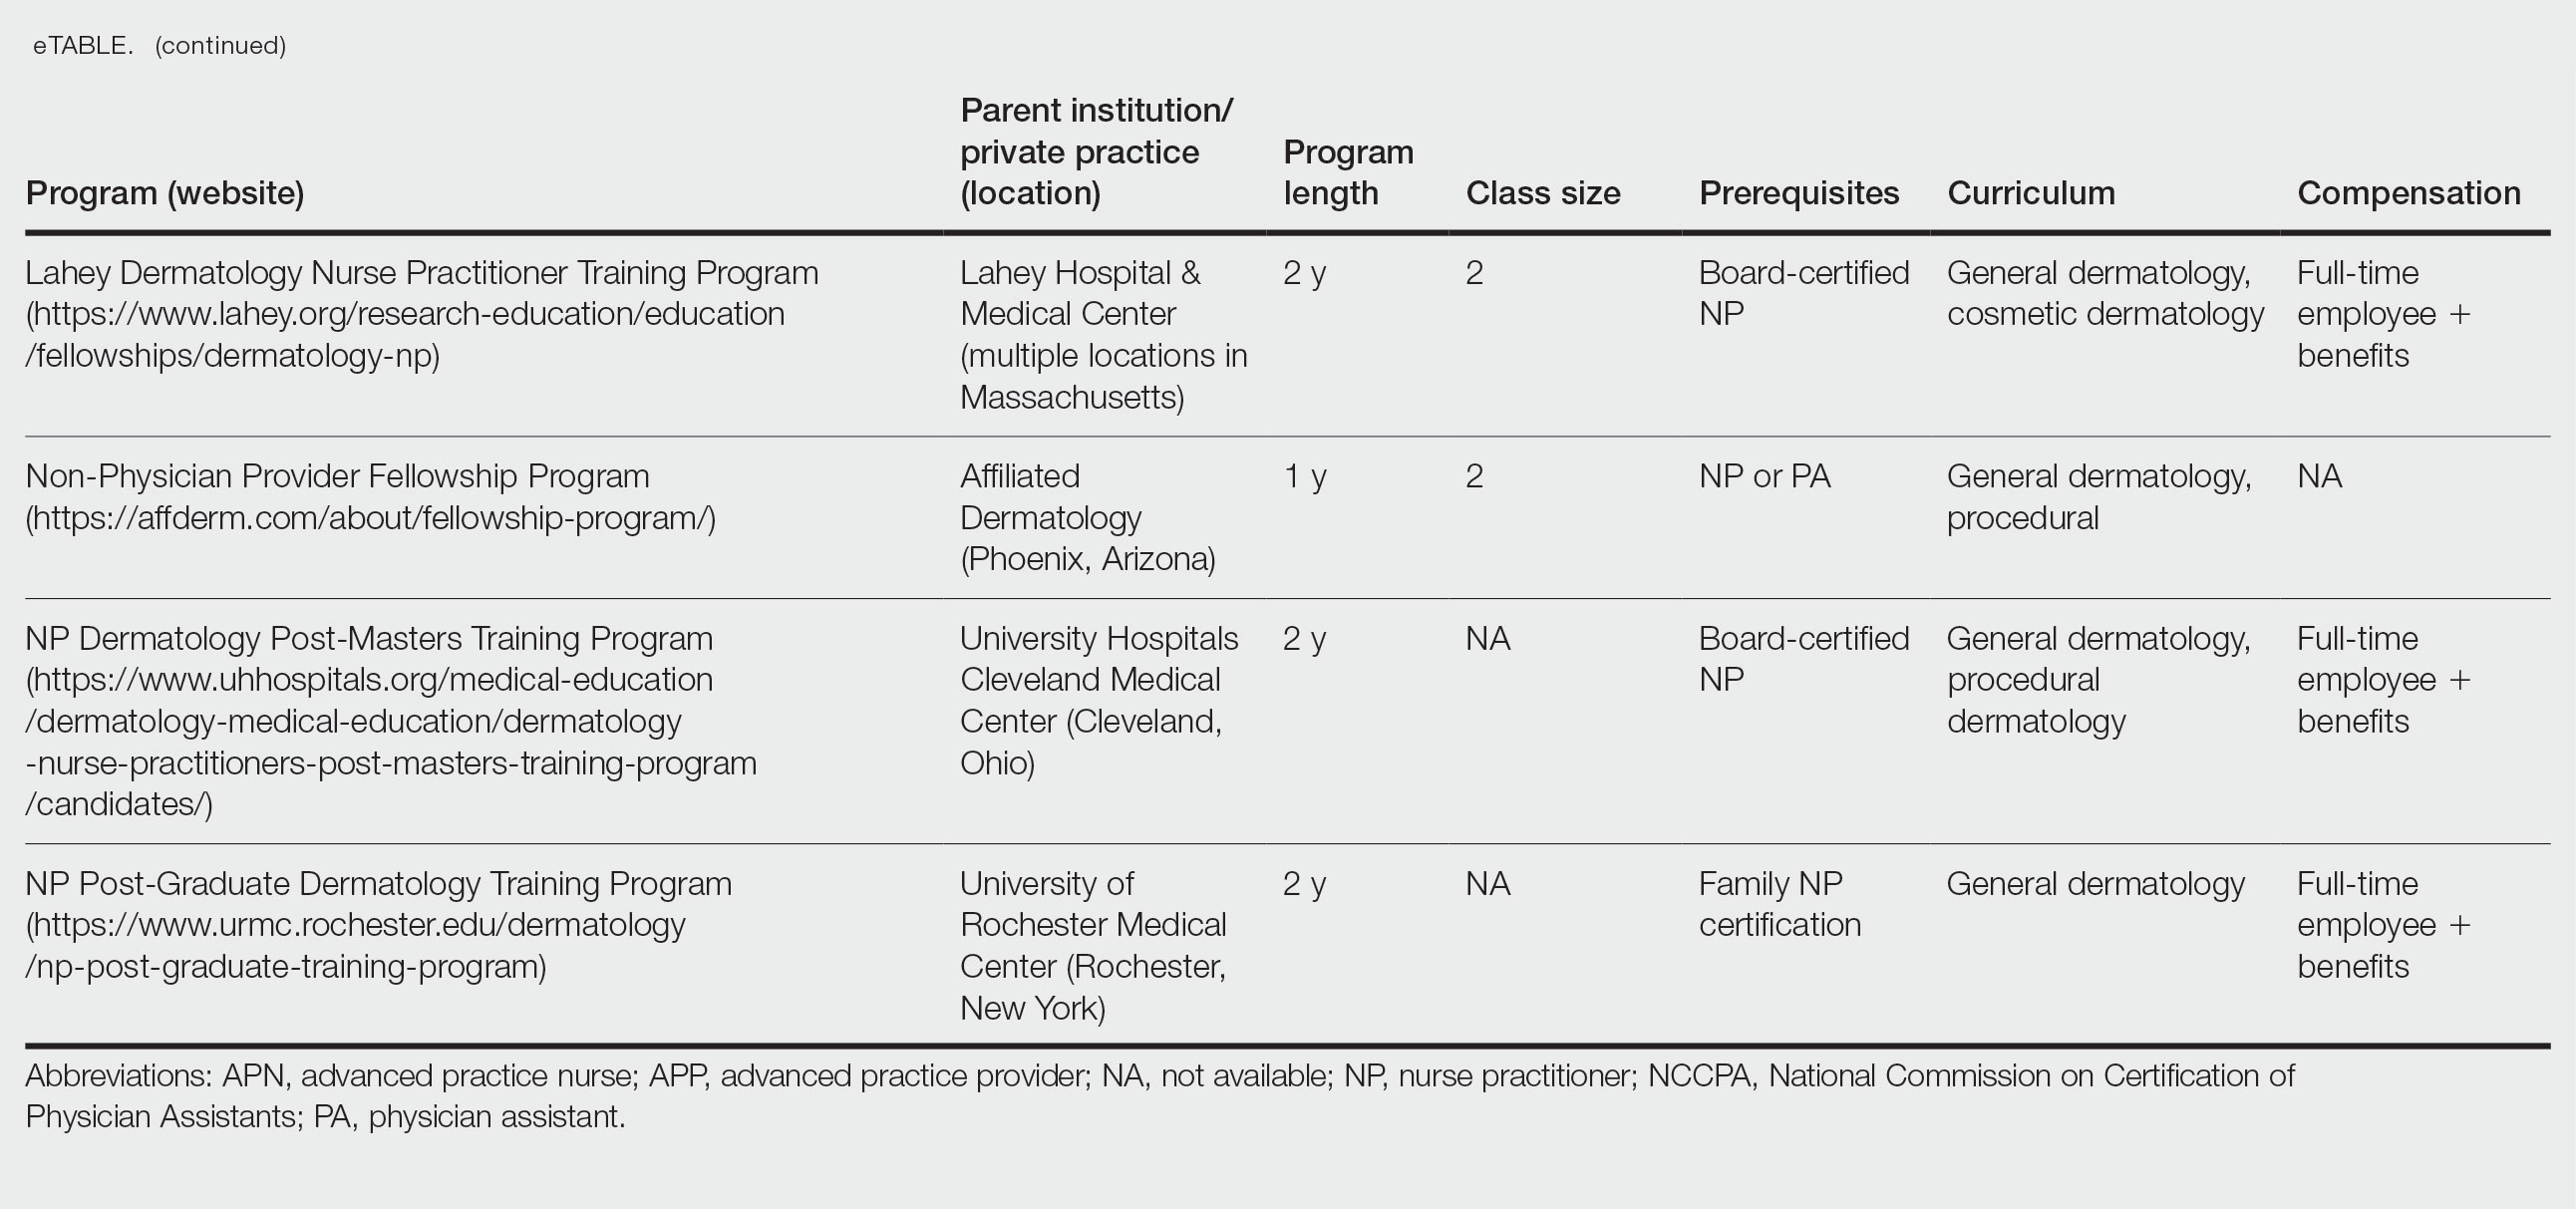
Six programs required APPs to become board-certified NPs or PAs prior to enrolling. Most programs enrolled both NPs and PAs, while some only enrolled NPs (eTable). Only 1 (10%) program required NPs to be board certified as a family NP, while another (10%) recommended that applicants have experience in urgent care, emergency medicine, or trauma medicine. Lahey Hospital & Medical Center required experience as an NP in a general setting for 1 to 2 years prior to applying. No program required prior experience in the field of dermatology.
Program length varied from 6 to 24 months, and cohort size typically was limited to 1 to 2 providers (eTable). Although the exact numbers could not be ascertained, most curricula focused on medical dermatology, including clinical and didactic components, but many offered electives such as cosmetic and procedural dermatology. Two institutions (20%) required independent research. Work typically was limited to 40 hours per week, and most paid a full-time employee salary and provided benefits such as health insurance, retirement, and paid leave (eTable). Kansas Medical Clinic (Topeka, Kansas) required at least 3 years of employment in an underserved community following program completion. The Oasis Dermatology private practice group in Texas required a 1-year teaching commitment after program completion. The Advanced Dermatology and Cosmetic Surgery group offered a full-time position upon program completion.
Comment
There is a large difference in the total number of training and credentialing hours when comparing graduate school training and postgraduate credentialing of medical and osteopathic physicians compared with APPs. A new graduate physician has at least twice as many clinical hours as a PA and 10 times as many clinical hours as an NP prior to starting residency. Physicians also typically complete at least 6 times the number of hours of certification examinations compared to NPs and PAs.1
Nurse practitioner students typically complete the 500 hours of prelicensure clinical training required for NP school in 2 to 4 years.2,3 The amount of time required for completion is dependent on the degree and experience of the student upon program entry (eg, bachelor of science in nursing vs master of science in nursing as a terminal degree). Physician assistant students are required to complete 2000 prelicensure clinical hours, and most PA programs are 3 years in duration.4 Many NP and PA programs require some degree of clinical experience prior to beginning graduate education.5
When comparing prelicensure examinations, questions assessing dermatologic knowledge comprise approximately 6% to 10% of the total questions on the United States Medical Licensing Examination Steps 1 and 2.6 The Comprehensive Osteopathic Medical Licensing Examination of the United States Level 1 and Level 2-Cognitive Evaluation both have at least 5% of questions dedicated to dermatology.7 Approximately 5% of the questions on the Physician Assistant National Certifying Examination are dedicated to dermatology.8 The dermatology content on either of the NP certification examinations is unclear.2,3 In the states of California, Indiana, and New York, national certification through the American Association of Nurse Practitioners or American Nurses Credentialing Center is not required for NPs to practice in their respective states.9
Regarding dermatologic board certification, a new graduate NP may obtain certification from the
Many of the programs we evaluated integrate APP trainees into resident education, allowing participation in equivalent didactic curricula, clinical rotations, and departmental academic activities. The salary and benefits associated with these programs are somewhat like those of resident physicians.15,16 While most tuition-based programs were excluded from our study due to their lack of credibility and alignment with our study criteria, we identified 2 specific programs that stood out as credible despite requiring students to pay tuition. These programs demonstrated a structured and rigorous curriculum with a clear focus on comprehensive dermatologic training, meeting our standards for inclusion. These programs offer dermatologic training for graduates of NP and PA programs at a cost to the student.15,16 The program at the Florida Atlantic University, Boca Raton, is largely online,15 and the program at the University of Miami, Florida, offers no direct clinical contact.16 These programs illustrate the variety of postgraduate dermatology curricula available nationally in comparison to resident salaries; however, they were not included in our formal analysis because they do not provide structured, in-person clinical training consistent with our inclusion criteria. Neither of these programs would enable participants to qualify for credentialing with the Dermatology Nurse Practitioner Certification Board after completion. While this study identified postgraduate training programs for APPs in dermatology advertised online, it is possible some were omitted or not advertised online.
While many of the postgraduate programs we evaluated provide unique educational opportunities for APPs, it is unknown if graduating providers are equipped to handle the care of patients with complex dermatologic needs. Regardless, the increased utilization of APPs by BCDs has been well documented over the past 2 decades.17-20 It has been suggested that a higher ratio of APPs to dermatologists can decrease the time it takes for a patient to be seen in a clinic.21-23 However, investigators have expressed concerns that APPs lack standardized surgical training and clinical hour requirements in the field of dermatology.24 Despite these concerns, Medicare claims data show that APPs are performing advanced surgical and cosmetic procedures at increasing rates.17,18 Other authors have questioned the cost-effectiveness of APPs, as multiple studies have shown that the number of biopsies needed to diagnose 1 case of skin cancer is higher for midlevel providers than for dermatologists.25-27
Conclusion
With the anticipated expansion of private equity in dermatology and the growth of our Medicare-eligible population, we are likely to see increased utilization of APPs to address the shortage of BCDs.28,29 Understanding the prelicensure and postlicensure clinical training requirements, examination hours, and extent of dermatology-focused education among APPs and BCDs can help dermatologists collaborate more effectively and ensure safe, high-quality patient care. Standardizing, improving, and providing high-quality education and promoting lifelong learning in the field of dermatology should be celebrated, and dermatologists are the skin experts best equipped to lead dermatologic education forward.
- Robeznieks A. Training gaps between physicians, nonphysicians are significant. American Medical Association. February 17, 2025. Accessed October 23, 2025. https://www.ama-assn.org/practice-management/scope-practice/training-gaps-between-physicians-nonphysicians-are-significant
- American Nurses Credentialing Center. Test content outline. Accessed October 6, 2025. https://www.nursingworld.org/globalassets/08282024-exam-24-npd-tco-website.pdf
- American Academy of Nurse Practitioners National Certification Board. AANPCB Family Nurse Practitioner Adult-Gerontology Primary Care Nurse Practitioner Psychiatric Mental Health Pratitioner: FNP, AGNP & PMHNP Certification Certification Handbook. American Academy of Nurse Practitioners Certification Board; 2023. Accessed October 6, 2025. https://www.aanpcert.org/resource/documents/AGNP%20FNP%20Candidate%20Handbook.pdf
- Society of Dermatology Physician Associates. SDPA Diplomate Fellowship. Accessed October 6, 2025. https://learning.dermpa.orgdiplomate-fellowship
- American Academy of Physician Associates. Become a PA. Accessed October 6, 2025. https://www.aapa.org/career-central/become-a-pa/
- United States Medical Licensing Examination. Prepare for your exam. Accessed October 6, 2025. https://www.usmle.org/prepare-your-exam
- National Board of Osteopathic Medical Examiners. Patient presentations related to the integumentary system. Accessed October 6, 2025. https://www.nbome.org/assessments/comlex-usa/comlex-usa-blueprint/d2-clinical-presentations/integumentary-system
- National Commission on Certification of Physician Assistants. PANCE content blueprint. Accessed October 6, 2025. https://prodcmsstoragesa.blob.core.windows.net/uploads/files/PANCEBlueprint.pdf
- American Association of Nurse Practitioners. Practice information by state. Accessed October 6, 2025. https://www.aanp.org/practice/practice-information-by-state
- Dermatology Nurse Practitioner Certification Board. Eligibility. Accessed October 6, 2025. https://www.dnpcb.org/eligibility.php
- National Board of Dermatology Physician Assistants. Certification. Accessed September 3, 2022.
- Society of Dermatology Physician Associates. SDPA statement regarding the ABDPA Board Certification Exam for derm PAs. October 8, 2019. Accessed October 6, 2025. https://www.dermpa.org/news/articles/2019-10/sdpa-statement-regarding-abdpa-board-certification-exam-derm-pas
- American Board of Dermatology. Residents and fellows. Accessed October 6, 2025. https://www.abderm.org/residents-and-fellows
- American Osteopathic Board of Dermatology. Primary certificaiton exam. Accessed October 6, 2025. https://certification.osteopathic.org/dermatology/certification-process/dermatology/written-exams/
- Florida Atlantic University. Christine E. Lynn College of Nursing. Dermatology nurse practitioner certificate program. Accessed October 6, 2025. https://www.fau.edu/nursing/academics/certificates/dermatology-program/
- Dr. Phillip Frost Department of Dermatology and Cutaneous Surgery. Advanced Practitioner Program.
- Coldiron B, Ratnarathorn M. Scope of physician procedures independently billed by mid-level providers in the office setting. JAMA Dermatol. 2014;150:1153-1159.
- Zhang M, Zippin J, Kaffenberger B. Trends and scope of dermatology procedures billed by advanced practice professionals from 2012 through 2015. JAMA Dermatol. 2018;154:1040-1044.
- Resneck J Jr, Kimball AB. The dermatology workforce shortage. J Am Acad Dermatol. 2004;50:50-54.
- Kimball AB, Resneck JS Jr. The US dermatology workforce: a specialty remains in shortage. J Am Acad Dermatol. 2008;59:741-745.
- Creadore A, Desai S, Li SJ, et al. Insurance acceptance, appointment wait time, and dermatologist access across practice types in the US. JAMA Dermatol. 2021;157:181-188.
- Braun RT, Bond AM, Qian Y, et al. Private equity in dermatology: effect on price, utilization, and spending. Health Aff (Millwood). 2021;40:727-735.
- Skaljic M, Lipoff JB. Association of private equity ownership with increased employment of advanced practice professionals in outpatient dermatology offices. J Am Acad Dermatol. 2021;84:1178-1180.
- Jalian HR, Avram MM. Mid-level practitioners in dermatology: a need for further study and oversight. JAMA Dermatol. 2014;150:1149-1151.
- Sarzynski E, Barry H. Current evidence and controversies: advanced practice providers in healthcare. Am J Manag Care. 2019;25:366-368.
- Nault A, Zhang C, Kim K, et al. Biopsy use in skin cancer diagnosis: comparing dermatology physicians and advanced practice professionals. JAMA Dermatol. 2015;151:899-902.
- Anderson AM, Matsumoto M, Saul MI, et al. Accuracy of skin cancer diagnosis by physician assistants compared with dermatologists in a large health care system. JAMA Dermatol. 2018;154:569-573.
- Sung C, Salem S, Oulee A, et al. A systematic review: landscape of private equity in dermatology from past to present. J Drugs Dermatol. 2023 Apr 1;22:404-409. doi: 10.36849/JDD.6892.
- CMS releases National Healthcare Expenditure and enrollment projections through 2031. Health Management Associates. July 13, 2023. Accessed October 23, 2025. https://www.healthmanagement.com/blog/cms-releases-national-healthcare-expenditure-and-enrollment-projections-through-2031/
Nurse practitioners (NPs) and physician assistants (PAs) often help provide dermatologic care but lack the same mandatory specialized postgraduate training required of board-certified dermatologists (BCDs), which includes at least 3 years of dermatology-focused education in an accredited residency program in addition to an intern year of general medicine, pediatrics, or surgery. Dermatology residency is followed by a certification examination administered by the American Board of Dermatology (ABD) or the American Osteopathic Board of Dermatology, leading to board certification. Some physicians choose to do a fellowship, which typically involves an additional 1 to 2 years of postresidency subspeciality training.
Optional postgraduate dermatology training programs for advanced practice providers (APPs) have been offered by some academic institutions and private practice groups since at least 2003, including Lahey Hospital and Medical Center (Burlington, Massachusetts) as well as the University of Rochester Medical Center (Rochester, New York). Despite a lack of accreditation or standardization, the programs can be beneficial for NPs and PAs to expand their dermatologic knowledge and skills and help bridge the care gap within the specialty. Didactics often are conducted in parallel with the educational activities of the parent institution’s traditional dermatology residency program (eg, lectures, grand rounds). While these programs often are managed by practicing dermatology NPs and PAs, dermatologists also may be involved in their education with didactic instruction, curriculum development, and clinical preceptorship.
In this cross-sectional study, we identified and evaluated 10 postgraduate dermatology training programs for APPs across the United States. With the growing number of NPs and PAs in the dermatology workforce—both in academic and private practice—it is important for BCDs to be aware of the differences in the dermatology training received in order to ensure safe and effective care is provided through supervisory or collaborative roles (depending on state independent practice laws for APPs and to be aware of the implications these programs may have on the field of dermatology.
Methods
To identify postgraduate dermatology training programs for APPs in the United States, we conducted a cross-sectional study using data obtained via a Google search of various combinations of the following terms: nurse practitioner, NP, physician assistant, PA, advance practice provider, APP, dermatology, postgraduate training, residency, and fellowship. We excluded postgraduate dermatology training programs for APPs that required tuition and did not provide a stipend, as well as programs that lacked the formal structure and credibility needed to qualify as legitimate postgraduate training. Many of the excluded programs operate in a manner that raises ethical concerns, offering pay-to-play opportunities under the guise of education. Information collected on each program included the program name, location, parent institution, program length, class size, curriculum, and any associated salary and benefits.
Results
Ten academic and private practice organizations across the United States that offer postgraduate dermatologic training programs for APPs were identified (eTable). Four (40%) programs were advertised as fellowships. Six (60%) of the programs were offered at academic medical centers, and 4 (40%) were offered by private practices. Most programs were located east of the Mississippi River, and many institutions offered instruction at 1 or more locations within the same state (eFigure). The Advanced Dermatology and Cosmetic Surgery private practice group offered training opportunities in multiple states.
Six programs required APPs to become board-certified NPs or PAs prior to enrolling. Most programs enrolled both NPs and PAs, while some only enrolled NPs (eTable). Only 1 (10%) program required NPs to be board certified as a family NP, while another (10%) recommended that applicants have experience in urgent care, emergency medicine, or trauma medicine. Lahey Hospital & Medical Center required experience as an NP in a general setting for 1 to 2 years prior to applying. No program required prior experience in the field of dermatology.
Program length varied from 6 to 24 months, and cohort size typically was limited to 1 to 2 providers (eTable). Although the exact numbers could not be ascertained, most curricula focused on medical dermatology, including clinical and didactic components, but many offered electives such as cosmetic and procedural dermatology. Two institutions (20%) required independent research. Work typically was limited to 40 hours per week, and most paid a full-time employee salary and provided benefits such as health insurance, retirement, and paid leave (eTable). Kansas Medical Clinic (Topeka, Kansas) required at least 3 years of employment in an underserved community following program completion. The Oasis Dermatology private practice group in Texas required a 1-year teaching commitment after program completion. The Advanced Dermatology and Cosmetic Surgery group offered a full-time position upon program completion.
Comment
There is a large difference in the total number of training and credentialing hours when comparing graduate school training and postgraduate credentialing of medical and osteopathic physicians compared with APPs. A new graduate physician has at least twice as many clinical hours as a PA and 10 times as many clinical hours as an NP prior to starting residency. Physicians also typically complete at least 6 times the number of hours of certification examinations compared to NPs and PAs.1
Nurse practitioner students typically complete the 500 hours of prelicensure clinical training required for NP school in 2 to 4 years.2,3 The amount of time required for completion is dependent on the degree and experience of the student upon program entry (eg, bachelor of science in nursing vs master of science in nursing as a terminal degree). Physician assistant students are required to complete 2000 prelicensure clinical hours, and most PA programs are 3 years in duration.4 Many NP and PA programs require some degree of clinical experience prior to beginning graduate education.5
When comparing prelicensure examinations, questions assessing dermatologic knowledge comprise approximately 6% to 10% of the total questions on the United States Medical Licensing Examination Steps 1 and 2.6 The Comprehensive Osteopathic Medical Licensing Examination of the United States Level 1 and Level 2-Cognitive Evaluation both have at least 5% of questions dedicated to dermatology.7 Approximately 5% of the questions on the Physician Assistant National Certifying Examination are dedicated to dermatology.8 The dermatology content on either of the NP certification examinations is unclear.2,3 In the states of California, Indiana, and New York, national certification through the American Association of Nurse Practitioners or American Nurses Credentialing Center is not required for NPs to practice in their respective states.9
Regarding dermatologic board certification, a new graduate NP may obtain certification from the
Many of the programs we evaluated integrate APP trainees into resident education, allowing participation in equivalent didactic curricula, clinical rotations, and departmental academic activities. The salary and benefits associated with these programs are somewhat like those of resident physicians.15,16 While most tuition-based programs were excluded from our study due to their lack of credibility and alignment with our study criteria, we identified 2 specific programs that stood out as credible despite requiring students to pay tuition. These programs demonstrated a structured and rigorous curriculum with a clear focus on comprehensive dermatologic training, meeting our standards for inclusion. These programs offer dermatologic training for graduates of NP and PA programs at a cost to the student.15,16 The program at the Florida Atlantic University, Boca Raton, is largely online,15 and the program at the University of Miami, Florida, offers no direct clinical contact.16 These programs illustrate the variety of postgraduate dermatology curricula available nationally in comparison to resident salaries; however, they were not included in our formal analysis because they do not provide structured, in-person clinical training consistent with our inclusion criteria. Neither of these programs would enable participants to qualify for credentialing with the Dermatology Nurse Practitioner Certification Board after completion. While this study identified postgraduate training programs for APPs in dermatology advertised online, it is possible some were omitted or not advertised online.
While many of the postgraduate programs we evaluated provide unique educational opportunities for APPs, it is unknown if graduating providers are equipped to handle the care of patients with complex dermatologic needs. Regardless, the increased utilization of APPs by BCDs has been well documented over the past 2 decades.17-20 It has been suggested that a higher ratio of APPs to dermatologists can decrease the time it takes for a patient to be seen in a clinic.21-23 However, investigators have expressed concerns that APPs lack standardized surgical training and clinical hour requirements in the field of dermatology.24 Despite these concerns, Medicare claims data show that APPs are performing advanced surgical and cosmetic procedures at increasing rates.17,18 Other authors have questioned the cost-effectiveness of APPs, as multiple studies have shown that the number of biopsies needed to diagnose 1 case of skin cancer is higher for midlevel providers than for dermatologists.25-27
Conclusion
With the anticipated expansion of private equity in dermatology and the growth of our Medicare-eligible population, we are likely to see increased utilization of APPs to address the shortage of BCDs.28,29 Understanding the prelicensure and postlicensure clinical training requirements, examination hours, and extent of dermatology-focused education among APPs and BCDs can help dermatologists collaborate more effectively and ensure safe, high-quality patient care. Standardizing, improving, and providing high-quality education and promoting lifelong learning in the field of dermatology should be celebrated, and dermatologists are the skin experts best equipped to lead dermatologic education forward.
- Robeznieks A. Training gaps between physicians, nonphysicians are significant. American Medical Association. February 17, 2025. Accessed October 23, 2025. https://www.ama-assn.org/practice-management/scope-practice/training-gaps-between-physicians-nonphysicians-are-significant
- American Nurses Credentialing Center. Test content outline. Accessed October 6, 2025. https://www.nursingworld.org/globalassets/08282024-exam-24-npd-tco-website.pdf
- American Academy of Nurse Practitioners National Certification Board. AANPCB Family Nurse Practitioner Adult-Gerontology Primary Care Nurse Practitioner Psychiatric Mental Health Pratitioner: FNP, AGNP & PMHNP Certification Certification Handbook. American Academy of Nurse Practitioners Certification Board; 2023. Accessed October 6, 2025. https://www.aanpcert.org/resource/documents/AGNP%20FNP%20Candidate%20Handbook.pdf
- Society of Dermatology Physician Associates. SDPA Diplomate Fellowship. Accessed October 6, 2025. https://learning.dermpa.orgdiplomate-fellowship
- American Academy of Physician Associates. Become a PA. Accessed October 6, 2025. https://www.aapa.org/career-central/become-a-pa/
- United States Medical Licensing Examination. Prepare for your exam. Accessed October 6, 2025. https://www.usmle.org/prepare-your-exam
- National Board of Osteopathic Medical Examiners. Patient presentations related to the integumentary system. Accessed October 6, 2025. https://www.nbome.org/assessments/comlex-usa/comlex-usa-blueprint/d2-clinical-presentations/integumentary-system
- National Commission on Certification of Physician Assistants. PANCE content blueprint. Accessed October 6, 2025. https://prodcmsstoragesa.blob.core.windows.net/uploads/files/PANCEBlueprint.pdf
- American Association of Nurse Practitioners. Practice information by state. Accessed October 6, 2025. https://www.aanp.org/practice/practice-information-by-state
- Dermatology Nurse Practitioner Certification Board. Eligibility. Accessed October 6, 2025. https://www.dnpcb.org/eligibility.php
- National Board of Dermatology Physician Assistants. Certification. Accessed September 3, 2022.
- Society of Dermatology Physician Associates. SDPA statement regarding the ABDPA Board Certification Exam for derm PAs. October 8, 2019. Accessed October 6, 2025. https://www.dermpa.org/news/articles/2019-10/sdpa-statement-regarding-abdpa-board-certification-exam-derm-pas
- American Board of Dermatology. Residents and fellows. Accessed October 6, 2025. https://www.abderm.org/residents-and-fellows
- American Osteopathic Board of Dermatology. Primary certificaiton exam. Accessed October 6, 2025. https://certification.osteopathic.org/dermatology/certification-process/dermatology/written-exams/
- Florida Atlantic University. Christine E. Lynn College of Nursing. Dermatology nurse practitioner certificate program. Accessed October 6, 2025. https://www.fau.edu/nursing/academics/certificates/dermatology-program/
- Dr. Phillip Frost Department of Dermatology and Cutaneous Surgery. Advanced Practitioner Program.
- Coldiron B, Ratnarathorn M. Scope of physician procedures independently billed by mid-level providers in the office setting. JAMA Dermatol. 2014;150:1153-1159.
- Zhang M, Zippin J, Kaffenberger B. Trends and scope of dermatology procedures billed by advanced practice professionals from 2012 through 2015. JAMA Dermatol. 2018;154:1040-1044.
- Resneck J Jr, Kimball AB. The dermatology workforce shortage. J Am Acad Dermatol. 2004;50:50-54.
- Kimball AB, Resneck JS Jr. The US dermatology workforce: a specialty remains in shortage. J Am Acad Dermatol. 2008;59:741-745.
- Creadore A, Desai S, Li SJ, et al. Insurance acceptance, appointment wait time, and dermatologist access across practice types in the US. JAMA Dermatol. 2021;157:181-188.
- Braun RT, Bond AM, Qian Y, et al. Private equity in dermatology: effect on price, utilization, and spending. Health Aff (Millwood). 2021;40:727-735.
- Skaljic M, Lipoff JB. Association of private equity ownership with increased employment of advanced practice professionals in outpatient dermatology offices. J Am Acad Dermatol. 2021;84:1178-1180.
- Jalian HR, Avram MM. Mid-level practitioners in dermatology: a need for further study and oversight. JAMA Dermatol. 2014;150:1149-1151.
- Sarzynski E, Barry H. Current evidence and controversies: advanced practice providers in healthcare. Am J Manag Care. 2019;25:366-368.
- Nault A, Zhang C, Kim K, et al. Biopsy use in skin cancer diagnosis: comparing dermatology physicians and advanced practice professionals. JAMA Dermatol. 2015;151:899-902.
- Anderson AM, Matsumoto M, Saul MI, et al. Accuracy of skin cancer diagnosis by physician assistants compared with dermatologists in a large health care system. JAMA Dermatol. 2018;154:569-573.
- Sung C, Salem S, Oulee A, et al. A systematic review: landscape of private equity in dermatology from past to present. J Drugs Dermatol. 2023 Apr 1;22:404-409. doi: 10.36849/JDD.6892.
- CMS releases National Healthcare Expenditure and enrollment projections through 2031. Health Management Associates. July 13, 2023. Accessed October 23, 2025. https://www.healthmanagement.com/blog/cms-releases-national-healthcare-expenditure-and-enrollment-projections-through-2031/
The Current State of Postgraduate Dermatology Training Programs for Advanced Practice Providers
The Current State of Postgraduate Dermatology Training Programs for Advanced Practice Providers
Practice Points
- Postgraduate dermatology training programs are available for advanced practice providers (APPs), but they are optional and lack a formal accreditation process.
- Awareness of these programs and the differences between APPs and physician training may help dermatologists provide safe and effective care in collaborative or supervisory roles.

Process Improvement for Engaging With Trauma-Focused Evidence-Based Psychotherapy for PTSD
Process Improvement for Engaging With Trauma-Focused Evidence-Based Psychotherapy for PTSD
Trauma-focused evidence-based psychotherapies (TF-EBPs), including cognitive processing therapy (CPT) and prolonged exposure therapy (PE), are recommended treatments for posttraumatic stress disorder (PTSD) in clinical practice guidelines.1-3 To increase initiation of these treatments, the US Department of Veterans Affairs (VA) used a large-scale dissemination and implementation effort to improve access to TF-EBP.4,5 These efforts achieved modest success, increasing prevalence of TF-EBP from a handful of veterans in 2004 to an annual prevalence of 14.6% for CPT and 4.3% for PE in 2014.6
Throughout these efforts, qualitative studies have been used to better understand veterans’ perspectives on receiving TF-EBP care.7-18 Barriers to initiation of and engagement in TF-EBP and PTSD care have been identified from these qualitative studies. One identified barrier was lack of knowledge—particularly lack of knowledge about what is meant by a PTSD diagnosis and available treatments.7-10 Stigma (ie, automatic negative associations) toward mental health problems or seeking mental health care also has been identified as a barrier to initiation.7,10-14 Perceptions of poor alignment between treatment and veteran goals, including lack of buy-in for the rationale, served as barriers to initiation and engagement.8,15-18
Using prior qualitative work, numerous initiatives have been developed to reduce stigma, facilitate conversations about how treatment aligns with goals, and fill knowledge gaps, particularly through online resources and shared decision-making.19,20 To better inform the state of veterans’ experiences with TF-EBP, a qualitative investigation was conducted involving veterans who recently initiated TF-EBP. Themes directly related to transitions to TF-EBP were identified; however, all veterans interviewed also described their experiences with TFEBP engagement and mental health care. Consistent with recommendations for qualitative methods, this study extends prior work on transitions to TF-EBP by describing themes with a distinct focus on the experience of engaging with TF-EBP and mental health care.21,22
Methods
The experiences of veterans who were transitioning into TF-EBPs were collected in semistructured interviews and analyzed. The semistructured interview guide was developed and refined in consultation with both qualitative methods experts and PTSD treatment experts to ensure that 6 content domains were appropriately queried: PTSD treatment options, cultural sensitivity of treatment, PTSD treatment selection, transition criteria, beliefs about stabilization treatment, and treatment needs/preferences.
Participants were identified using the VA Corporate Data Warehouse and included post-9/11 veterans who had recently initiated CPT or PE for the first time between September 1, 2021, and September 1, 2022. More details of participant selection are available in Holder et al.21 From a population of 10,814 patients, stratified random sampling generated a recruitment pool of 200 veterans for further outreach. The strata were defined such that this recruitment pool had similar proportions of demographic characteristics (ie, gender, race, ethnicity) to the population of eligible veterans, equivalent distributions of time to CPT or PE initiation (ie, 33.3% < 1 year, 33.3% 1-3 years, and 33.3% > 3 years), and adequate variability in TF-EBP type (ie, 66.7% CPT, 33.3% PE). A manual chart review in the recruitment pool excluded 12 veterans who did not initiate CPT or PE, 1 veteran with evidence of current active psychosis and/or cognitive impairment that would likely preclude comprehension of study materials, and 1 who was deceased.
Eligible veterans from the recruitment pool were contacted in groups of 25. First, a recruitment letter with study information and instructions to opt-out of further contact was mailed or emailed to veterans. After 2 weeks, veterans who had not responded were contacted by phone up to 3 times. Veterans interested in participating were scheduled for a 1-time visit that included verbal consent and the qualitative interview. Metrics were established a priori to ensure an adequately diverse and inclusive sample. Specifically, a minimum number of racial and/or ethnic minority veterans (33%) and women veterans (20%) were sought. Equal distribution across the 3 categories of time from first mental health visit to CPT/PE initiation also was targeted. Throughout enrollment, recruitment efforts were adapted to meet these metrics in the emerging sample. While the goal was to generate a diverse and inclusive sample using these methods, the sample was not intended to be representative of the population.
Of the 186 eligible participants, 21 declined participation and 26 could not be reached. The targeted sample was reached after exhausting contact for 47 veterans and contacting 80 veterans for a final response rate of 40% among fully contacted veterans and 27% among veterans with any contact. The final sample included 30 veterans who received CPT or PE in VA facilities (Table).
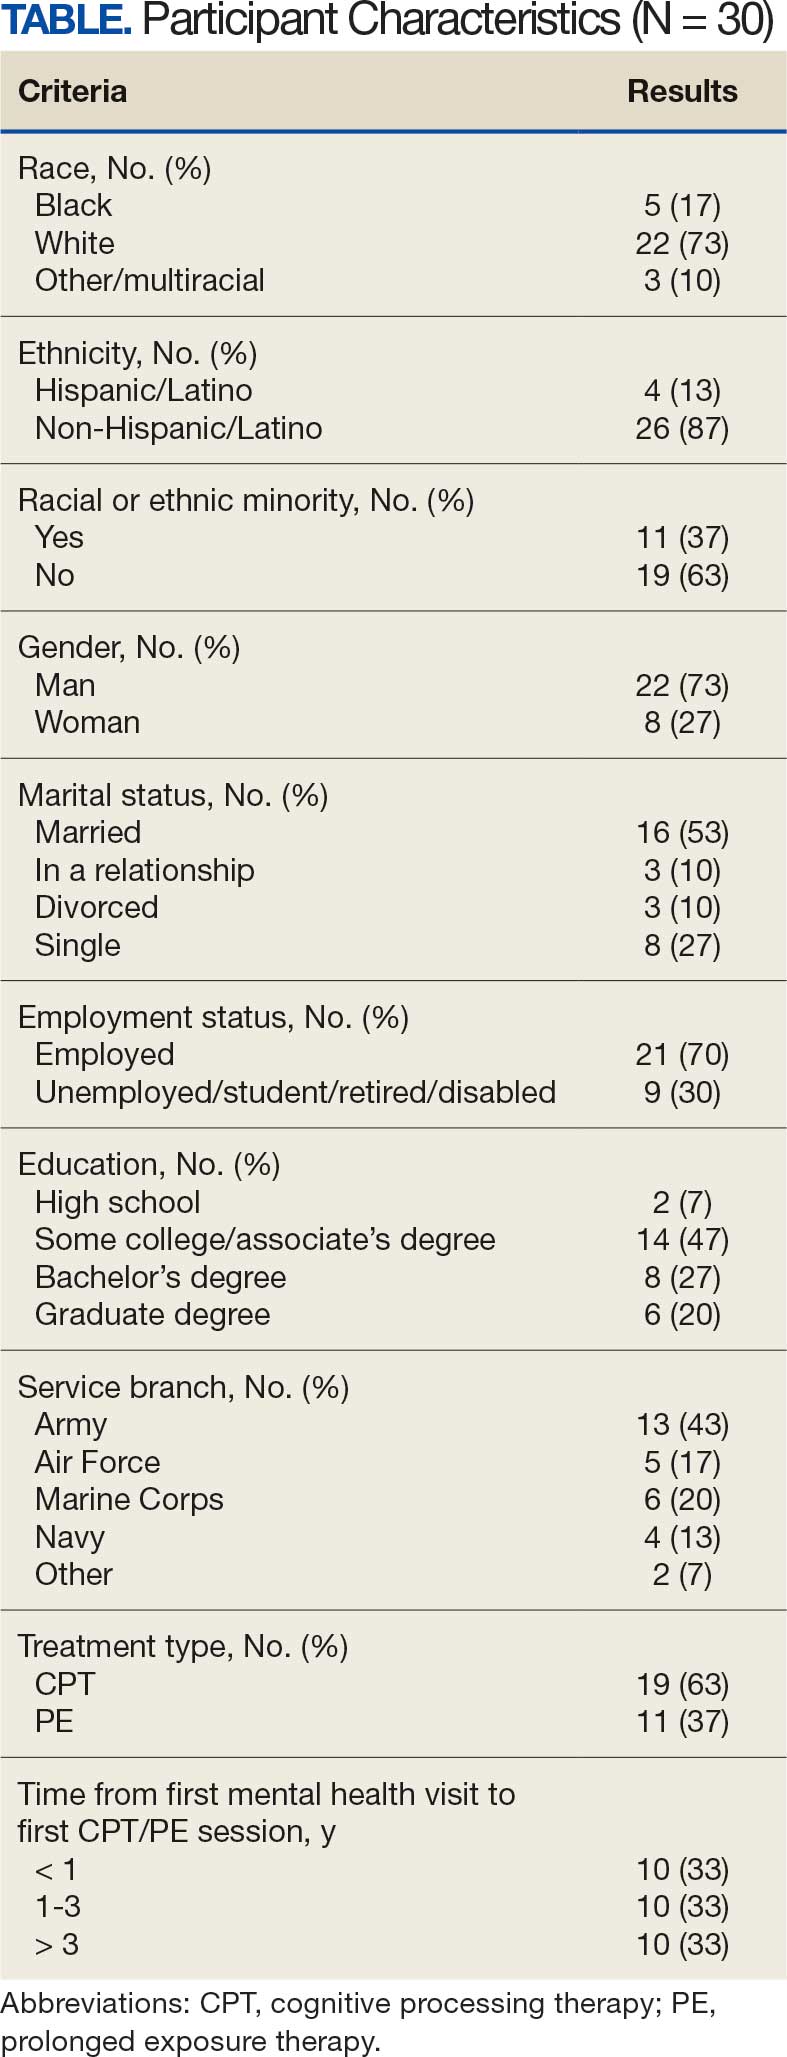
After veterans provided verbal consent for study participation, sociodemographic information was verbally reported, and a 30- to 60-minute semistructured qualitative phone interview was recorded and transcribed. Veterans received $40 for participation. All procedures were approved by the University of California San Francisco Institutional Review Board.
Qualitative Data Analysis
Rapid analysis procedures were used to analyze qualitative data. This approach is suitable for focused, moderately structured qualitative analyses in health services research and facilitates rapid dissemination to stakeholders.23 The qualitative analysts were 2 clinical psychologists with expertise in PTSD treatment (NH primary and RR secondary). Consistent with rapid analysis procedures, analysts prepared a templated summary (including relevant quotations) of each interview, organized by the prespecified content domains. Interviews were summarized independently, compared to ensure consistency, and discrepancies were resolved through review of the interview source materials. Individual summary templates were combined into a master analytic matrix to facilitate the identification of patterns and delineation of themes. Analysts routinely met to identify, discuss, and refine preliminary themes, revisiting source materials to reach consensus as needed.
Results
Fifteen themes were identified and organized into 2 distinct focus areas: themes directly related to the transition to TF-EBP (8 themes) and themes related to veterans’ experiences with TF-EBP and general mental health care with potential process-improvement implications (7 themes).21 Seven themes were identified related to experiences with TF-EBP engagement and VA mental health care. The 7 themes related to TF-EBP engagement and VA mental health care themes are summarized with exemplary quotations.
Veterans want a better understanding of psychotherapy and engaging with VA mental health. Veterans reported that they generally had a poor or “nebulous” understanding about the experience of psychotherapy. For example, veterans exhibited confusion about whether certain experiences were equivalent to participating in psychotherapy. They were sometimes unable to distinguish between interactions such as assessment, disability evaluations, peer support, and psychotherapy. One veteran described a conversation with a TFEBP therapist about prior treatment:
She [asked], have you ever been, or gone through a therapy to begin with? And I, I said, well I just chatted with somebody. And she said that’s not, that’s not therapy. So, I was like, oh, it’s not? That’s not what people do?
Veterans were surprised the VA offered a diverse range of psychotherapy interventions, rather than simply therapy. They did not realize there were different types of psychotherapy. As a result, veterans were not aware that some VA mental practitioners have specialty training and certification to provide treatment matched to specific diagnoses or needs. They thought that all clinicians could provide the same care. One veteran described their understanding:
I just figured all mental health people are mental health people. I didn’t have a better understanding of the system and all the different levels and how it plays out and specialties and things like that. Which, I guess, I should have because you have a primary care doctor, but then you have specialists in all these other different sectors that specialize in one particular area. I guess that should’ve been common sense, but it wasn’t.
Stigma was a barrier to seeking and engaging in mental health care. Veterans discovered they had to overcome stigma associated with seeking and engaging in mental health treatment. Military culture was often discussed as promoting stigma regarding mental health treatment. Specifically, veterans described that seeking treatment meant “either, I’m weak or I’m gonna be seen as weak.” In active-duty settings, the strategy for dealing with mental health symptoms was to “leave those feelings, you push ‘em aside,” an approach highly inconsistent with TF-EBP. In some cases, incorrect information about the VA and PTSD was presented as part of discharge from the military, leading to long-term skepticism of the VA and PTSD treatment. One veteran described his experience as part of a class on the VA compensation and pension assessment process for service-connected disabilities during his military discharge:
[A fellow discharging soldier asked] what about like PTSD, gettin’ rated for PTSD. I hear they take our weapons and stuff like we can’t own firearms and all that stuff. And [the instructor] was like, well, yes that’s a thing. He didn’t explain it like if you get compensated for PTSD you don’t lose your rights to carry a firearm or to have, to be able to go hunting.
Importantly, veterans often described how other identities (eg, race, ethnicity, gender, region of origin) interacted with military culture to enhance stigma. Hearing messaging from multiple sources reinforced beliefs that mental health treatment is inappropriate or is associated with weakness:
As a first-generation Italian, I was always taught keep your feelings to yourself. Never talk outside your family. Never bring up problems to other people and stuff like that. Same with the military. And then the old stigma working in [emergency medical services] and public safety, you’re weak if you get help.
The fundamentals of therapy, including rapport and flexibility, were important. Veterans valued nonspecific therapy factors, genuine empathy, building trust, being honest about treatment, personality, and rapport. These characteristics were almost universally described as particularly important:
I liked the fact that she made it personable and she cared. It wasn’t just like, here, we’re gonna start this. She explained it in the ways I could understand, not in medical terms, so to speak, but that’s what I liked about her. She really cared about what she did and helping me.
Flexibility was viewed as an asset, particularly when clinicians acknowledged veteran autonomy. A consistent example was when veterans were able to titrate trauma disclosure. One veteran described this flexible treatment experience: “She was right there in the room, she said, you know, at any time, you know, we could stop, we could debrief.”
Experiences of clinician flexibility and personalization of therapy were contrasted with experiences of overly rigid therapy. Overemphasis on protocols created barriers, often because treatment did not feel personalized. One veteran described how a clinician’s task-oriented approach interfered with their ability to engage in TF-EBP:
They listened, but it just didn’t seem like they were listening, because they really wanted to stay on task… So, I felt like if the person was more concerned, or more sympathetic to the things that was also going on in my life at that present time, I think I would’ve felt more comfortable talking about what was the PTSD part, too.
Veterans valued shared decision-making prior to TF-EBP initiation. Veterans typically described being involved in a shared decision-making process prior to initiating TF-EBP. During these sessions, clinicians discussed treatment options and provided veterans with a variety of materials describing treatments (eg, pamphlets, websites, videos, statistics). Most veterans appreciated being able to reflect on and discuss treatment options with their clinicians. Being given time in and out of session to review was viewed as valuable and increased confidence in treatment choice. One veteran described their experience:
I was given the information, you know, they gave me handouts, PDFs, whatever was available, and let me read over it. I didn’t have to choose anything right then and there, you know, they let me sleep on it. And I got back to them after some thought.
However, some veterans felt overwhelmed by being presented with too much information and did not believe they knew enough to make a final treatment decision. One veteran described being asked to contribute to the treatment decision:
I definitely asked [the clinician] to weigh in on maybe what he thought was best, because—I mean, I don’t know… I’m not necessarily sure I know what I think is best. I think we’re just lucky I’m here, so if you can give me a solid and help me out here by telling me just based on what I’ve said to you and the things that I’ve gone through, what do you think?
Veterans who perceived that their treatment preferences were respected had a positive outlook on TF-EBP. As part of the shared-decision making process, veterans typically described being given choices among PTSD treatments. One way that preferences were respected was through clinicians tailoring treatment descriptions to a veteran’s unique symptoms, experiences, and values. In these cases, clinicians observed specific concerns and clearly linked treatment principles to those concerns. For example, one veteran described their clinician’s recommendation for PE: “The hardest thing for me is to do the normal things like grocery store or getting on a train or anything like that. And so, he suggested that [PE] would be a good idea.”
In other cases, veterans wanted the highest quality of treatment rather than a match between treatment principles and the veteran’s presentation, goals, or strengths. These veterans wanted the best treatment available for PTSD and valued research support, recommendations from clinical practice guidelines, or clinician confidence in the effectiveness of the treatment. One veteran described this perspective:
I just wanted to be able to really tackle it in the best way possible and in the most like aggressive way possible. And it seemed like PE really was going to, they said that it’s a difficult type of therapy, but I really just wanted to kind of do the best that I could to eradicate some of the issues that I was having.
When veterans perceived a lack of respect for their preferences, they were hesitant about TF-EBP. For some veterans, a generic pitch for a TF-EBP was detrimental in the absence of the personal connection between the treatment and their own symptoms, goals, or strengths. These veterans did not question whether the treatment was effective in general but did question whether the treatment was best for them. One veteran described the contrast between their clinician’s perspective and their own.
I felt like they felt very comfortable, very confident in [CPT] being the program, because it was comfortable for them. Because they did it several times. And maybe they had a lot of success with other individuals... but they were very comfortable with that one, as a provider, more than: Is this the best fit for [me]?
Some veterans perceived little concern for their preferences and a lack of choice in available treatments, which tended to perpetuate negative perceptions of TFEBP. These veterans described their lack of choices with frustration. Alternatives to TFEBP were described by these veterans as so undesirable that they did not believe they had a real choice:
[CPT] was the only decision they had. There was nothing else for PTSD. They didn’t offer anything else. So, I mean it wasn’t a decision. It was either … take treatment or don’t take treatment at all… Actually, I need to correct myself. So, there were 2 options, group therapy or CPT. I forgot about that. I’m not a big group guy so I chose the CPT.
Another veteran was offered a choice between therapeutic approaches, but all were delivered via telehealth (consistent with the transition to virtual services during the COVID-19 pandemic). For this veteran, not only was the distinction between approaches unclear, but the choice between approaches was unimportant compared to the mode of delivery.
This happened during COVID-19 and VA stopped seeing anybody physically, face-to-face. So my only option for therapy was [telehealth]… There was like 3 of them, and I tried to figure out, you know, from the layperson’s perspective, like: I don’t know which one to go with.
Veterans wanted to be asked about their cultural identity. Veterans valued when clinicians asked questions about cultural identity as part of their mental health treatment and listened to their cultural context. Cultural identity factors extended beyond factors such as race, ethnicity, gender, and sexual orientation to religion, military culture, and regionality. Veterans often described situations where they wished clinicians would ask the question or initiate conversations about culture. A veteran highlighted the importance of their faith but noted that it was a taboo topic. Their clinician did not say “we don’t go there,” but they “never dove into it either.” Another veteran expressed a desire for their clinician to ask questions about experiences in the National Guard and as an African American veteran:
If a provider was to say like: Oh, you know, it’s a stressful situation being a part of the military, being in the National Guard. You know, just asking questions about that. I think that would really go a long way… Being African American was difficult as well. And more so because of my region, I think… I felt like it would probably be an uncomfortable subject to speak on… I mean, it wasn’t anything that my providers necessarily did, it was more so just because it wasn’t brought up.
One common area of concern for veterans was a match between veteran and therapist demographics. When asked about how their cultural identity influenced treatment, several veterans described the relevance of therapist match. Much like questions about their own cultural identity, veterans valued being asked about identity preferences in clinicians (eg, gender or race matching), rather than having to bring up the preference themselves. One veteran described relief at this question being asked directly: “I was relieved when she had asked [whether I wanted a male or female clinician] primarily because I was going to ask that or bring that up somehow. But her asking that before me was a weight off my shoulders.”
Discussing cultural identity through treatment strengthened veterans’ engagement in therapy. Many veterans appreciated when analogies used in therapy were relevant to their cultural experiences and when clinicians understood their culture (eg, military culture, race, ethnicity, religious beliefs, sexual orientation). One veteran described how their clinician understood military culture and made connections between military culture and the rationale for TF-EBP, which strengthened the veteran’s buy-in for the treatment and alliance with the clinician:
At the beginning when she was explaining PTSD, and I remember she said that your brain needed to think this way when you were in the military because it was a way of protecting and surviving, so your brain was doing that in order for you to survive in whatever areas you were because there was danger. So, your brain had you thinking that way. But now, you’re not in those situations anymore. You’re not in danger. You’re not in the military, but your brain is still thinking you are, and that’s what PTSD generally does to you.
Specific elements of TF-EBP also provided opportunities to discuss and integrate important aspects of identity. This is accomplished in PE by assigning relevant in vivo exercises. In CPT, “connecting the dots” on how prior experiences influenced trauma-related stuck points achieved this element. One veteran described their experience with a clinician who was comfortable discussing the veteran’s sexual orientation and recognized the impacts of prior trauma on intimacy:
They’re very different, and there’s a lot of things that can be accepted in gay relationships that are not in straight ones. With all that said, I think [the PE therapist] did a fantastic job being not—like never once did she laugh or make an uncomfortable comment or say she didn’t wanna talk about something when like part of the reason I wanted to get into therapy is that my partner and I weren’t having sex unless I used alcohol.
Discussion
As part of a larger national qualitative investigation of the experiences of veterans who recently initiated TF-EBP, veterans discussed their experiences with therapy and mental health care that have important implications for continued process improvement.21 Three key areas for continued process improvement were identified: (1) providing information about the diverse range of mental health care services at the VA and the implications of this continuum of care; (2) consideration of veteran preferences in treatment decision-making, including the importance of perceived choice; and (3) incorporating cultural assessment and cultural responsiveness into case conceptualization and treatment.
One area of process improvement identified was increasing knowledge about different types of psychotherapy and the continuum of care available at the VA. Veterans in this study confused or conflated participating in psychotherapy with talking about mental health symptoms with a clinician (eg, assessment, disability evaluation). They were sometimes surprised that psychotherapy is an umbrella term referring to a variety of different modalities. The downstream impact of these misunderstandings was a perception of VA mental health care as nebulous. Veterans were surprised that all mental health practitioners were unable to provide the same care. Confusion may have been compounded by highly variable referral processes across VA.24 To address this, clinicians have developed local educational resources and handouts for both veterans and referring clinicians from nonmental health and general mental health specialties.25 Given the variability in referral processes both between and within VA medical centers, national dissemination of these educational materials may be more difficult compared to materials for TF-EBPs.24 The VA started to use behavioral health interdisciplinary program (BHIP) teams, which are designed to be clinical homes for veterans connected with a central clinician who can explain and coordinate their mental health care as well as bring more consistency to the referral process.26 The ongoing transition toward the BHIP model of mental health care at VA may provide the opportunity to consolidate and integrate knowledge about the VA approach to mental health care, potentially filling knowledge gaps.
A second area of process improvement focused on the shared decision-making process. Consistent with mental health initiatives, veterans generally believed they had received sufficient information about TF-EBP and engaged in shared decision-making with clinicians.20,27 Veterans were given educational materials to review and had the opportunity to discuss these materials with clinicians. However, veterans described variability in the success of shared decision-making. Although veterans valued receiving accurate, comprehensible information to support treatment decisions, some preferred to defer to clinicians’ expertise regarding which treatment to pursue. While these veterans valued information, they also valued the expertise of clinicians in explaining why specific treatments would be beneficial. A key contributor to veterans satisfaction was assessing how veterans wanted to engage in the decision-making process and respecting those preferences.28 Veterans approached shared decision-making differently, from making decisions independently after receiving information to relying solely on clinician recommendation. The process was most successful when clinicians articulated how their recommended treatment aligned with a veteran’s preferences, including recommendations based on specific values (eg, personalized match vs being the best). Another important consideration is ensuring veterans know they can receive a variety of different types of mental health services available in different modalities (eg, virtual vs in-person; group vs individual). When veterans did not perceive choice in treatment aspects important to them (typically despite having choices), they were less satisfied with their TF-EBP experience.
A final area of process improvement identified involves how therapists address important aspects of culture. Veterans often described mental health stigma coming from intersecting cultural identities and expressed appreciation when therapists helped them recognize the impact of these beliefs on treatment. Some veterans did not discuss important aspects of their identity with clinicians, including race/ethnicity, religion, and military culture. Veterans did not report negative interactions with clinicians or experiences suggesting it was inappropriate to discuss identity; however, they were reluctant to independently raise these identity factors. Strategies such as the ADDRESSING framework, a mnemonic acronym that describes a series of potentially relevant characteristics, can help clinicians comprehensively consider different aspects that may be relevant to veterans, modeling that discussion of relevant these characteristics is welcome in TF-EBP.29 Veterans reported that making culturally relevant connections enhanced the TF-EBP experience, most commonly with military culture. These data support that TF-EBP delivery with attention to culture should be an integrated part of treatment, supporting engagement and therapeutic alliance.30 The VA National Center for PTSD consultation program is a resource to support clinicians in assessing and incorporating relevant aspects of cultural identity.31 For example, the National Center for PTSD provides a guide for using case conceptualization to address patient reactions to race-based violence during PTSD treatment.32 Both manualized design and therapist certification training can reinforce that assessing and attending to case conceptualization (including identity factors) is an integral component of TF-EBP.33,34
Limitations
While the current study has numerous strengths (eg, national veteran sampling, robust qualitative methods), results should be considered within the context of study limitations. First, veteran participants all received TF-EBP, and the perspectives of veterans who never initiate TF-EBP may differ. Despite the strong sampling approach, the study design is not intended to be generalizable to all veterans receiving TF-EBP for PTSD. Qualitative analysis yielded 15 themes, described in this study and prior research, consistent with recommendations.21,22 This approach allows rich description of distinct focus areas that would not be possible in a single manuscript. Nonetheless, all veterans interviewed described their experiences in TF-EBP and general mental health care, the focus of the semistructured interview guide was on the experience of transitioning from other treatment to TF-EBP.
Conclusion
This study describes themes related to general mental health and TF-EBP process improvement as part of a larger study on transitions in PTSD care.21,22 Veterans valued the fundamentals of therapy, including rapport and flexibility. Treatment-specific rapport (eg, pointing out treatment progress and effort in completing treatment components) and flexibility within the context of fidelity (ie, personalizing treatment while maintaining core treatment elements) may be most effective at engaging veterans in recommended PTSD treatments.18,34 In addition to successes, themes suggest multiple opportunities for process improvement. Ongoing VA initiatives and priorities (ie, BHIP, shared decision-making, consultation services) aim to improve processes consistent with veteran recommendations. Future research is needed to evaluate the success of these and other programs to optimize access to and engagement in recommended PTSD treatments.
- US Department of Veterans Affairs; US Department of Defense. VA/DoD clinical practice guideline for the management of posttraumatic stress disorder and acute stress disorder. 2023. Updated August 20, 2025. Accessed October 17, 2025. https://www.healthquality.va.gov/guidelines/MH/ptsd/
- International Society for Traumatic Stress Studies. ISTSS PTSD prevention and treatment guidelines: methodology and recommendations. Accessed August 13, 2025. http://www.istss.org/getattachment/Treating-Trauma/New-ISTSS-Prevention-and-TreatmentGuidelines/ISTSS_PreventionTreatmentGuidelines_FNL-March-19-2019.pdf.aspx
- American Psychological Association. Clinical practice guideline for the treatment of posttraumatic stress disorder in adults. Accessed August 13, 2025. https://www.apa.org/ptsd-guideline/ptsd.pdf
- Karlin BE, Cross G. From the laboratory to the therapy room: National dissemination and implementation of evidence- based psychotherapies in the U.S. Department of Veterans Affairs Health Care System. Am Psychol. 2014;69:19-33. doi:10.1037/a0033888
- Rosen CS, Matthieu MM, Wiltsey Stirman S, et al. A review of studies on the system-wide implementation of evidencebased psychotherapies for posttraumatic stress disorder in the Veterans Health Administration. Adm Policy Ment Health. 2016;43:957-977. doi:10.1007/s10488-016-0755-0
- Maguen S, Holder N, Madden E, et al. Evidence-based psychotherapy trends among posttraumatic stress disorder patients in a national healthcare system, 2001-2014. Depress Anxiety. 2020;37:356-364. doi:10.1002/da.22983
- Cheney AM, Koenig CJ, Miller CJ, et al. Veteran-centered barriers to VA mental healthcare services use. BMC Health Serv Res. 2018;18:591. doi:10.1186/s12913-018-3346-9
- Hundt NE, Mott JM, Miles SR, et al. Veterans’ perspectives on initiating evidence-based psychotherapy for posttraumatic stress disorder. Psychol Trauma. 2015;7:539-546. doi:10.1037/tra0000035
- Hundt NE, Helm A, Smith TL, et al. Failure to engage: a qualitative study of veterans who decline evidence-based psychotherapies for PTSD. Psychol Serv. 2018;15:536- 542. doi:10.1037/ser0000212
- Sayer NA, Friedemann-Sanchez G, Spoont M, et al. A qualitative study of determinants of PTSD treatment initiation in veterans. Psychiatry. 2009;72:238-255. doi:10.1521/psyc.2009.72.3.238
- Mittal D, Drummond KL, Blevins D, et al. Stigma associated with PTSD: perceptions of treatment seeking combat veterans. Psychiatr Rehabil J. 2013;36:86-92. doi:10.1037/h0094976
- Possemato K, Wray LO, Johnson E, et al. Facilitators and barriers to seeking mental health care among primary care veterans with posttraumatic stress disorder. J Trauma Stress. 2018;31:742-752. doi:10.1002/jts.22327
- Silvestrini M, Chen JA. “It’s a sign of weakness”: Masculinity and help-seeking behaviors among male veterans accessing posttraumatic stress disorder care. Psychol Trauma. 2023;15:665-671. doi:10.1037/tra0001382
- Stecker T, Shiner B, Watts BV, et al. Treatment-seeking barriers for veterans of the Iraq and Afghanistan conflicts who screen positive for PTSD. Psychiatr Serv. 2013;64:280-283. doi:10.1176/appi.ps.001372012
- Etingen B, Grubbs KM, Harik JM. Drivers of preference for evidence-based PTSD treatment: a qualitative assessment. Mil Med. 2020;185:303-310. doi:10.1093/milmed/usz220
- Hundt NE, Ecker AH, Thompson K, et al. “It didn’t fit for me:” A qualitative examination of dropout from prolonged exposure and cognitive processing therapy in veterans. Psychol Serv. 2020;17:414-421. doi:10.1037/ser0000316
- Kehle-Forbes SM, Gerould H, Polusny MA, et al. “It leaves me very skeptical” messaging in marketing prolonged exposure and cognitive processing therapy to veterans with PTSD. Psychol Trauma. 2022;14:849-852. doi:10.1037/tra0000550
- Kehle-Forbes SM, Ackland PE, Spoont MR, et al. Divergent experiences of U.S. veterans who did and did not complete trauma-focused therapies for PTSD: a national qualitative study of treatment dropout. Behav Res Ther. 2022;154:104123. doi:10.1016/j.brat.2022.104123
- Hessinger JD, London MJ, Baer SM. Evaluation of a shared decision-making intervention on the utilization of evidence-based psychotherapy in a VA outpatient PTSD clinic. Psychol Serv. 2018;15:437-441. doi:10.1037/ser0000141
- Hamblen JL, Grubbs KM, Cole B, et al. “Will it work for me?” Developing patient-friendly graphical displays of posttraumatic stress disorder treatment effectiveness. J Trauma Stress. 2022;35:999-1010. doi:10.1002/jts.22808
- Holder N, Ranney RM, Delgado AK, et al. Transitioning into trauma-focused evidence-based psychotherapy for posttraumatic stress disorder from other treatments: a qualitative investigation. Cogn Behav Ther. 2025;54:391-407. doi:10.1080/16506073.2024.2408386
- Levitt HM, Bamberg M, Creswell JW, et al. Journal article reporting standards for qualitative primary, qualitative meta-analytic, and mixed methods research in psychology: The APA Publications and Communications Board task force report. Am Psychol. 2018;73:26-46. doi:10.1037/amp0000151
- Palinkas LA, Mendon SJ, Hamilton AB. Innovations in mixed methods evaluations. Annu Rev Public Health. 2019;40:423- 442. doi:10.1146/annurev-publhealth-040218-044215
- Ranney RM, Cordova MJ, Maguen S. A review of the referral process for evidence-based psychotherapies for PTSD among veterans. Prof Psychol Res Pr. 2022;53:276-285. doi:10.1037/pro0000463
- Holder N, Ranney RM, Delgado AK, et al. Transitions to trauma-focused evidence-based psychotherapy for posttraumatic stress disorder from other treatment: a qualitative investigation of clinician’s perspectives. Cogn Behav Ther. 2025;1-19. doi:10.1080/16506073.2025.2481475
- Barry CN, Abraham KM, Weaver KR, et al. Innovating team-based outpatient mental health care in the Veterans Health Administration: staff-perceived benefits and challenges to pilot implementation of the Behavioral Health Interdisciplinary Program (BHIP). Psychol Serv. 2016;13:148-155. doi:10.1037/ser0000072
- Harik JM, Hundt NE, Bernardy NC, et al. Desired involvement in treatment decisions among adults with PTSD symptoms. J Trauma Stress. 2016;29:221-228. doi:10.1002/jts.22102
- Larsen SE, Hooyer K, Kehle-Forbes SM, et al. Patient experiences in making PTSD treatment decisions. Psychol Serv. 2024;21:529-537. doi:10.1037/ser0000817
- Hays PA. Four steps toward intersectionality in psychotherapy using the ADDRESSING framework. Prof Psychol Res Pr. 2024;55:454-462. doi:10.1037/pro0000577
- Galovski TE, Nixon RDV, Kaysen D. Flexible Applications of Cognitive Processing Therapy: Evidence-Based Treatment Methods. Academic Press; 2020.
- Larsen SE, McKee T, Fielstein E, et al. The development of a posttraumatic stress disorder (PTSD) consultation program to support system-wide implementation of high-quality PTSD care for veterans. Psychol Serv. 2025;22:342-348. doi:10.1037/ser0000867
- Galovski T, Kaysen D, McClendon J, et al. Provider guide to addressing patient reactions to race-based violence during PTSD treatment. PTSD.va.gov. Accessed August 3, 2025. www.ptsd.va.gov/professional/treat/specific/patient_reactions_race_violence.asp
- Galovski TE, Nixon RDV, Kehle-Forbes S. Walking the line between fidelity and flexibility: a conceptual review of personalized approaches to manualized treatments for posttraumatic stress disorder. J Trauma Stress. 2024;37:768-774. doi:10.1002/jts.23073
- Galovski TE, McSweeney LB, Nixon RDV, et al. Personalizing cognitive processing therapy with a case formulation approach to intentionally target impairment in psychosocial functioning associated with PTSD. Contemp Clin Trials Commun. 2024;42:101385. doi:10.1016/j.conctc.2024.101385
Trauma-focused evidence-based psychotherapies (TF-EBPs), including cognitive processing therapy (CPT) and prolonged exposure therapy (PE), are recommended treatments for posttraumatic stress disorder (PTSD) in clinical practice guidelines.1-3 To increase initiation of these treatments, the US Department of Veterans Affairs (VA) used a large-scale dissemination and implementation effort to improve access to TF-EBP.4,5 These efforts achieved modest success, increasing prevalence of TF-EBP from a handful of veterans in 2004 to an annual prevalence of 14.6% for CPT and 4.3% for PE in 2014.6
Throughout these efforts, qualitative studies have been used to better understand veterans’ perspectives on receiving TF-EBP care.7-18 Barriers to initiation of and engagement in TF-EBP and PTSD care have been identified from these qualitative studies. One identified barrier was lack of knowledge—particularly lack of knowledge about what is meant by a PTSD diagnosis and available treatments.7-10 Stigma (ie, automatic negative associations) toward mental health problems or seeking mental health care also has been identified as a barrier to initiation.7,10-14 Perceptions of poor alignment between treatment and veteran goals, including lack of buy-in for the rationale, served as barriers to initiation and engagement.8,15-18
Using prior qualitative work, numerous initiatives have been developed to reduce stigma, facilitate conversations about how treatment aligns with goals, and fill knowledge gaps, particularly through online resources and shared decision-making.19,20 To better inform the state of veterans’ experiences with TF-EBP, a qualitative investigation was conducted involving veterans who recently initiated TF-EBP. Themes directly related to transitions to TF-EBP were identified; however, all veterans interviewed also described their experiences with TFEBP engagement and mental health care. Consistent with recommendations for qualitative methods, this study extends prior work on transitions to TF-EBP by describing themes with a distinct focus on the experience of engaging with TF-EBP and mental health care.21,22
Methods
The experiences of veterans who were transitioning into TF-EBPs were collected in semistructured interviews and analyzed. The semistructured interview guide was developed and refined in consultation with both qualitative methods experts and PTSD treatment experts to ensure that 6 content domains were appropriately queried: PTSD treatment options, cultural sensitivity of treatment, PTSD treatment selection, transition criteria, beliefs about stabilization treatment, and treatment needs/preferences.
Participants were identified using the VA Corporate Data Warehouse and included post-9/11 veterans who had recently initiated CPT or PE for the first time between September 1, 2021, and September 1, 2022. More details of participant selection are available in Holder et al.21 From a population of 10,814 patients, stratified random sampling generated a recruitment pool of 200 veterans for further outreach. The strata were defined such that this recruitment pool had similar proportions of demographic characteristics (ie, gender, race, ethnicity) to the population of eligible veterans, equivalent distributions of time to CPT or PE initiation (ie, 33.3% < 1 year, 33.3% 1-3 years, and 33.3% > 3 years), and adequate variability in TF-EBP type (ie, 66.7% CPT, 33.3% PE). A manual chart review in the recruitment pool excluded 12 veterans who did not initiate CPT or PE, 1 veteran with evidence of current active psychosis and/or cognitive impairment that would likely preclude comprehension of study materials, and 1 who was deceased.
Eligible veterans from the recruitment pool were contacted in groups of 25. First, a recruitment letter with study information and instructions to opt-out of further contact was mailed or emailed to veterans. After 2 weeks, veterans who had not responded were contacted by phone up to 3 times. Veterans interested in participating were scheduled for a 1-time visit that included verbal consent and the qualitative interview. Metrics were established a priori to ensure an adequately diverse and inclusive sample. Specifically, a minimum number of racial and/or ethnic minority veterans (33%) and women veterans (20%) were sought. Equal distribution across the 3 categories of time from first mental health visit to CPT/PE initiation also was targeted. Throughout enrollment, recruitment efforts were adapted to meet these metrics in the emerging sample. While the goal was to generate a diverse and inclusive sample using these methods, the sample was not intended to be representative of the population.
Of the 186 eligible participants, 21 declined participation and 26 could not be reached. The targeted sample was reached after exhausting contact for 47 veterans and contacting 80 veterans for a final response rate of 40% among fully contacted veterans and 27% among veterans with any contact. The final sample included 30 veterans who received CPT or PE in VA facilities (Table).
After veterans provided verbal consent for study participation, sociodemographic information was verbally reported, and a 30- to 60-minute semistructured qualitative phone interview was recorded and transcribed. Veterans received $40 for participation. All procedures were approved by the University of California San Francisco Institutional Review Board.
Qualitative Data Analysis
Rapid analysis procedures were used to analyze qualitative data. This approach is suitable for focused, moderately structured qualitative analyses in health services research and facilitates rapid dissemination to stakeholders.23 The qualitative analysts were 2 clinical psychologists with expertise in PTSD treatment (NH primary and RR secondary). Consistent with rapid analysis procedures, analysts prepared a templated summary (including relevant quotations) of each interview, organized by the prespecified content domains. Interviews were summarized independently, compared to ensure consistency, and discrepancies were resolved through review of the interview source materials. Individual summary templates were combined into a master analytic matrix to facilitate the identification of patterns and delineation of themes. Analysts routinely met to identify, discuss, and refine preliminary themes, revisiting source materials to reach consensus as needed.
Results
Fifteen themes were identified and organized into 2 distinct focus areas: themes directly related to the transition to TF-EBP (8 themes) and themes related to veterans’ experiences with TF-EBP and general mental health care with potential process-improvement implications (7 themes).21 Seven themes were identified related to experiences with TF-EBP engagement and VA mental health care. The 7 themes related to TF-EBP engagement and VA mental health care themes are summarized with exemplary quotations.
Veterans want a better understanding of psychotherapy and engaging with VA mental health. Veterans reported that they generally had a poor or “nebulous” understanding about the experience of psychotherapy. For example, veterans exhibited confusion about whether certain experiences were equivalent to participating in psychotherapy. They were sometimes unable to distinguish between interactions such as assessment, disability evaluations, peer support, and psychotherapy. One veteran described a conversation with a TFEBP therapist about prior treatment:
She [asked], have you ever been, or gone through a therapy to begin with? And I, I said, well I just chatted with somebody. And she said that’s not, that’s not therapy. So, I was like, oh, it’s not? That’s not what people do?
Veterans were surprised the VA offered a diverse range of psychotherapy interventions, rather than simply therapy. They did not realize there were different types of psychotherapy. As a result, veterans were not aware that some VA mental practitioners have specialty training and certification to provide treatment matched to specific diagnoses or needs. They thought that all clinicians could provide the same care. One veteran described their understanding:
I just figured all mental health people are mental health people. I didn’t have a better understanding of the system and all the different levels and how it plays out and specialties and things like that. Which, I guess, I should have because you have a primary care doctor, but then you have specialists in all these other different sectors that specialize in one particular area. I guess that should’ve been common sense, but it wasn’t.
Stigma was a barrier to seeking and engaging in mental health care. Veterans discovered they had to overcome stigma associated with seeking and engaging in mental health treatment. Military culture was often discussed as promoting stigma regarding mental health treatment. Specifically, veterans described that seeking treatment meant “either, I’m weak or I’m gonna be seen as weak.” In active-duty settings, the strategy for dealing with mental health symptoms was to “leave those feelings, you push ‘em aside,” an approach highly inconsistent with TF-EBP. In some cases, incorrect information about the VA and PTSD was presented as part of discharge from the military, leading to long-term skepticism of the VA and PTSD treatment. One veteran described his experience as part of a class on the VA compensation and pension assessment process for service-connected disabilities during his military discharge:
[A fellow discharging soldier asked] what about like PTSD, gettin’ rated for PTSD. I hear they take our weapons and stuff like we can’t own firearms and all that stuff. And [the instructor] was like, well, yes that’s a thing. He didn’t explain it like if you get compensated for PTSD you don’t lose your rights to carry a firearm or to have, to be able to go hunting.
Importantly, veterans often described how other identities (eg, race, ethnicity, gender, region of origin) interacted with military culture to enhance stigma. Hearing messaging from multiple sources reinforced beliefs that mental health treatment is inappropriate or is associated with weakness:
As a first-generation Italian, I was always taught keep your feelings to yourself. Never talk outside your family. Never bring up problems to other people and stuff like that. Same with the military. And then the old stigma working in [emergency medical services] and public safety, you’re weak if you get help.
The fundamentals of therapy, including rapport and flexibility, were important. Veterans valued nonspecific therapy factors, genuine empathy, building trust, being honest about treatment, personality, and rapport. These characteristics were almost universally described as particularly important:
I liked the fact that she made it personable and she cared. It wasn’t just like, here, we’re gonna start this. She explained it in the ways I could understand, not in medical terms, so to speak, but that’s what I liked about her. She really cared about what she did and helping me.
Flexibility was viewed as an asset, particularly when clinicians acknowledged veteran autonomy. A consistent example was when veterans were able to titrate trauma disclosure. One veteran described this flexible treatment experience: “She was right there in the room, she said, you know, at any time, you know, we could stop, we could debrief.”
Experiences of clinician flexibility and personalization of therapy were contrasted with experiences of overly rigid therapy. Overemphasis on protocols created barriers, often because treatment did not feel personalized. One veteran described how a clinician’s task-oriented approach interfered with their ability to engage in TF-EBP:
They listened, but it just didn’t seem like they were listening, because they really wanted to stay on task… So, I felt like if the person was more concerned, or more sympathetic to the things that was also going on in my life at that present time, I think I would’ve felt more comfortable talking about what was the PTSD part, too.
Veterans valued shared decision-making prior to TF-EBP initiation. Veterans typically described being involved in a shared decision-making process prior to initiating TF-EBP. During these sessions, clinicians discussed treatment options and provided veterans with a variety of materials describing treatments (eg, pamphlets, websites, videos, statistics). Most veterans appreciated being able to reflect on and discuss treatment options with their clinicians. Being given time in and out of session to review was viewed as valuable and increased confidence in treatment choice. One veteran described their experience:
I was given the information, you know, they gave me handouts, PDFs, whatever was available, and let me read over it. I didn’t have to choose anything right then and there, you know, they let me sleep on it. And I got back to them after some thought.
However, some veterans felt overwhelmed by being presented with too much information and did not believe they knew enough to make a final treatment decision. One veteran described being asked to contribute to the treatment decision:
I definitely asked [the clinician] to weigh in on maybe what he thought was best, because—I mean, I don’t know… I’m not necessarily sure I know what I think is best. I think we’re just lucky I’m here, so if you can give me a solid and help me out here by telling me just based on what I’ve said to you and the things that I’ve gone through, what do you think?
Veterans who perceived that their treatment preferences were respected had a positive outlook on TF-EBP. As part of the shared-decision making process, veterans typically described being given choices among PTSD treatments. One way that preferences were respected was through clinicians tailoring treatment descriptions to a veteran’s unique symptoms, experiences, and values. In these cases, clinicians observed specific concerns and clearly linked treatment principles to those concerns. For example, one veteran described their clinician’s recommendation for PE: “The hardest thing for me is to do the normal things like grocery store or getting on a train or anything like that. And so, he suggested that [PE] would be a good idea.”
In other cases, veterans wanted the highest quality of treatment rather than a match between treatment principles and the veteran’s presentation, goals, or strengths. These veterans wanted the best treatment available for PTSD and valued research support, recommendations from clinical practice guidelines, or clinician confidence in the effectiveness of the treatment. One veteran described this perspective:
I just wanted to be able to really tackle it in the best way possible and in the most like aggressive way possible. And it seemed like PE really was going to, they said that it’s a difficult type of therapy, but I really just wanted to kind of do the best that I could to eradicate some of the issues that I was having.
When veterans perceived a lack of respect for their preferences, they were hesitant about TF-EBP. For some veterans, a generic pitch for a TF-EBP was detrimental in the absence of the personal connection between the treatment and their own symptoms, goals, or strengths. These veterans did not question whether the treatment was effective in general but did question whether the treatment was best for them. One veteran described the contrast between their clinician’s perspective and their own.
I felt like they felt very comfortable, very confident in [CPT] being the program, because it was comfortable for them. Because they did it several times. And maybe they had a lot of success with other individuals... but they were very comfortable with that one, as a provider, more than: Is this the best fit for [me]?
Some veterans perceived little concern for their preferences and a lack of choice in available treatments, which tended to perpetuate negative perceptions of TFEBP. These veterans described their lack of choices with frustration. Alternatives to TFEBP were described by these veterans as so undesirable that they did not believe they had a real choice:
[CPT] was the only decision they had. There was nothing else for PTSD. They didn’t offer anything else. So, I mean it wasn’t a decision. It was either … take treatment or don’t take treatment at all… Actually, I need to correct myself. So, there were 2 options, group therapy or CPT. I forgot about that. I’m not a big group guy so I chose the CPT.
Another veteran was offered a choice between therapeutic approaches, but all were delivered via telehealth (consistent with the transition to virtual services during the COVID-19 pandemic). For this veteran, not only was the distinction between approaches unclear, but the choice between approaches was unimportant compared to the mode of delivery.
This happened during COVID-19 and VA stopped seeing anybody physically, face-to-face. So my only option for therapy was [telehealth]… There was like 3 of them, and I tried to figure out, you know, from the layperson’s perspective, like: I don’t know which one to go with.
Veterans wanted to be asked about their cultural identity. Veterans valued when clinicians asked questions about cultural identity as part of their mental health treatment and listened to their cultural context. Cultural identity factors extended beyond factors such as race, ethnicity, gender, and sexual orientation to religion, military culture, and regionality. Veterans often described situations where they wished clinicians would ask the question or initiate conversations about culture. A veteran highlighted the importance of their faith but noted that it was a taboo topic. Their clinician did not say “we don’t go there,” but they “never dove into it either.” Another veteran expressed a desire for their clinician to ask questions about experiences in the National Guard and as an African American veteran:
If a provider was to say like: Oh, you know, it’s a stressful situation being a part of the military, being in the National Guard. You know, just asking questions about that. I think that would really go a long way… Being African American was difficult as well. And more so because of my region, I think… I felt like it would probably be an uncomfortable subject to speak on… I mean, it wasn’t anything that my providers necessarily did, it was more so just because it wasn’t brought up.
One common area of concern for veterans was a match between veteran and therapist demographics. When asked about how their cultural identity influenced treatment, several veterans described the relevance of therapist match. Much like questions about their own cultural identity, veterans valued being asked about identity preferences in clinicians (eg, gender or race matching), rather than having to bring up the preference themselves. One veteran described relief at this question being asked directly: “I was relieved when she had asked [whether I wanted a male or female clinician] primarily because I was going to ask that or bring that up somehow. But her asking that before me was a weight off my shoulders.”
Discussing cultural identity through treatment strengthened veterans’ engagement in therapy. Many veterans appreciated when analogies used in therapy were relevant to their cultural experiences and when clinicians understood their culture (eg, military culture, race, ethnicity, religious beliefs, sexual orientation). One veteran described how their clinician understood military culture and made connections between military culture and the rationale for TF-EBP, which strengthened the veteran’s buy-in for the treatment and alliance with the clinician:
At the beginning when she was explaining PTSD, and I remember she said that your brain needed to think this way when you were in the military because it was a way of protecting and surviving, so your brain was doing that in order for you to survive in whatever areas you were because there was danger. So, your brain had you thinking that way. But now, you’re not in those situations anymore. You’re not in danger. You’re not in the military, but your brain is still thinking you are, and that’s what PTSD generally does to you.
Specific elements of TF-EBP also provided opportunities to discuss and integrate important aspects of identity. This is accomplished in PE by assigning relevant in vivo exercises. In CPT, “connecting the dots” on how prior experiences influenced trauma-related stuck points achieved this element. One veteran described their experience with a clinician who was comfortable discussing the veteran’s sexual orientation and recognized the impacts of prior trauma on intimacy:
They’re very different, and there’s a lot of things that can be accepted in gay relationships that are not in straight ones. With all that said, I think [the PE therapist] did a fantastic job being not—like never once did she laugh or make an uncomfortable comment or say she didn’t wanna talk about something when like part of the reason I wanted to get into therapy is that my partner and I weren’t having sex unless I used alcohol.
Discussion
As part of a larger national qualitative investigation of the experiences of veterans who recently initiated TF-EBP, veterans discussed their experiences with therapy and mental health care that have important implications for continued process improvement.21 Three key areas for continued process improvement were identified: (1) providing information about the diverse range of mental health care services at the VA and the implications of this continuum of care; (2) consideration of veteran preferences in treatment decision-making, including the importance of perceived choice; and (3) incorporating cultural assessment and cultural responsiveness into case conceptualization and treatment.
One area of process improvement identified was increasing knowledge about different types of psychotherapy and the continuum of care available at the VA. Veterans in this study confused or conflated participating in psychotherapy with talking about mental health symptoms with a clinician (eg, assessment, disability evaluation). They were sometimes surprised that psychotherapy is an umbrella term referring to a variety of different modalities. The downstream impact of these misunderstandings was a perception of VA mental health care as nebulous. Veterans were surprised that all mental health practitioners were unable to provide the same care. Confusion may have been compounded by highly variable referral processes across VA.24 To address this, clinicians have developed local educational resources and handouts for both veterans and referring clinicians from nonmental health and general mental health specialties.25 Given the variability in referral processes both between and within VA medical centers, national dissemination of these educational materials may be more difficult compared to materials for TF-EBPs.24 The VA started to use behavioral health interdisciplinary program (BHIP) teams, which are designed to be clinical homes for veterans connected with a central clinician who can explain and coordinate their mental health care as well as bring more consistency to the referral process.26 The ongoing transition toward the BHIP model of mental health care at VA may provide the opportunity to consolidate and integrate knowledge about the VA approach to mental health care, potentially filling knowledge gaps.
A second area of process improvement focused on the shared decision-making process. Consistent with mental health initiatives, veterans generally believed they had received sufficient information about TF-EBP and engaged in shared decision-making with clinicians.20,27 Veterans were given educational materials to review and had the opportunity to discuss these materials with clinicians. However, veterans described variability in the success of shared decision-making. Although veterans valued receiving accurate, comprehensible information to support treatment decisions, some preferred to defer to clinicians’ expertise regarding which treatment to pursue. While these veterans valued information, they also valued the expertise of clinicians in explaining why specific treatments would be beneficial. A key contributor to veterans satisfaction was assessing how veterans wanted to engage in the decision-making process and respecting those preferences.28 Veterans approached shared decision-making differently, from making decisions independently after receiving information to relying solely on clinician recommendation. The process was most successful when clinicians articulated how their recommended treatment aligned with a veteran’s preferences, including recommendations based on specific values (eg, personalized match vs being the best). Another important consideration is ensuring veterans know they can receive a variety of different types of mental health services available in different modalities (eg, virtual vs in-person; group vs individual). When veterans did not perceive choice in treatment aspects important to them (typically despite having choices), they were less satisfied with their TF-EBP experience.
A final area of process improvement identified involves how therapists address important aspects of culture. Veterans often described mental health stigma coming from intersecting cultural identities and expressed appreciation when therapists helped them recognize the impact of these beliefs on treatment. Some veterans did not discuss important aspects of their identity with clinicians, including race/ethnicity, religion, and military culture. Veterans did not report negative interactions with clinicians or experiences suggesting it was inappropriate to discuss identity; however, they were reluctant to independently raise these identity factors. Strategies such as the ADDRESSING framework, a mnemonic acronym that describes a series of potentially relevant characteristics, can help clinicians comprehensively consider different aspects that may be relevant to veterans, modeling that discussion of relevant these characteristics is welcome in TF-EBP.29 Veterans reported that making culturally relevant connections enhanced the TF-EBP experience, most commonly with military culture. These data support that TF-EBP delivery with attention to culture should be an integrated part of treatment, supporting engagement and therapeutic alliance.30 The VA National Center for PTSD consultation program is a resource to support clinicians in assessing and incorporating relevant aspects of cultural identity.31 For example, the National Center for PTSD provides a guide for using case conceptualization to address patient reactions to race-based violence during PTSD treatment.32 Both manualized design and therapist certification training can reinforce that assessing and attending to case conceptualization (including identity factors) is an integral component of TF-EBP.33,34
Limitations
While the current study has numerous strengths (eg, national veteran sampling, robust qualitative methods), results should be considered within the context of study limitations. First, veteran participants all received TF-EBP, and the perspectives of veterans who never initiate TF-EBP may differ. Despite the strong sampling approach, the study design is not intended to be generalizable to all veterans receiving TF-EBP for PTSD. Qualitative analysis yielded 15 themes, described in this study and prior research, consistent with recommendations.21,22 This approach allows rich description of distinct focus areas that would not be possible in a single manuscript. Nonetheless, all veterans interviewed described their experiences in TF-EBP and general mental health care, the focus of the semistructured interview guide was on the experience of transitioning from other treatment to TF-EBP.
Conclusion
This study describes themes related to general mental health and TF-EBP process improvement as part of a larger study on transitions in PTSD care.21,22 Veterans valued the fundamentals of therapy, including rapport and flexibility. Treatment-specific rapport (eg, pointing out treatment progress and effort in completing treatment components) and flexibility within the context of fidelity (ie, personalizing treatment while maintaining core treatment elements) may be most effective at engaging veterans in recommended PTSD treatments.18,34 In addition to successes, themes suggest multiple opportunities for process improvement. Ongoing VA initiatives and priorities (ie, BHIP, shared decision-making, consultation services) aim to improve processes consistent with veteran recommendations. Future research is needed to evaluate the success of these and other programs to optimize access to and engagement in recommended PTSD treatments.
- US Department of Veterans Affairs; US Department of Defense. VA/DoD clinical practice guideline for the management of posttraumatic stress disorder and acute stress disorder. 2023. Updated August 20, 2025. Accessed October 17, 2025. https://www.healthquality.va.gov/guidelines/MH/ptsd/
- International Society for Traumatic Stress Studies. ISTSS PTSD prevention and treatment guidelines: methodology and recommendations. Accessed August 13, 2025. http://www.istss.org/getattachment/Treating-Trauma/New-ISTSS-Prevention-and-TreatmentGuidelines/ISTSS_PreventionTreatmentGuidelines_FNL-March-19-2019.pdf.aspx
- American Psychological Association. Clinical practice guideline for the treatment of posttraumatic stress disorder in adults. Accessed August 13, 2025. https://www.apa.org/ptsd-guideline/ptsd.pdf
- Karlin BE, Cross G. From the laboratory to the therapy room: National dissemination and implementation of evidence- based psychotherapies in the U.S. Department of Veterans Affairs Health Care System. Am Psychol. 2014;69:19-33. doi:10.1037/a0033888
- Rosen CS, Matthieu MM, Wiltsey Stirman S, et al. A review of studies on the system-wide implementation of evidencebased psychotherapies for posttraumatic stress disorder in the Veterans Health Administration. Adm Policy Ment Health. 2016;43:957-977. doi:10.1007/s10488-016-0755-0
- Maguen S, Holder N, Madden E, et al. Evidence-based psychotherapy trends among posttraumatic stress disorder patients in a national healthcare system, 2001-2014. Depress Anxiety. 2020;37:356-364. doi:10.1002/da.22983
- Cheney AM, Koenig CJ, Miller CJ, et al. Veteran-centered barriers to VA mental healthcare services use. BMC Health Serv Res. 2018;18:591. doi:10.1186/s12913-018-3346-9
- Hundt NE, Mott JM, Miles SR, et al. Veterans’ perspectives on initiating evidence-based psychotherapy for posttraumatic stress disorder. Psychol Trauma. 2015;7:539-546. doi:10.1037/tra0000035
- Hundt NE, Helm A, Smith TL, et al. Failure to engage: a qualitative study of veterans who decline evidence-based psychotherapies for PTSD. Psychol Serv. 2018;15:536- 542. doi:10.1037/ser0000212
- Sayer NA, Friedemann-Sanchez G, Spoont M, et al. A qualitative study of determinants of PTSD treatment initiation in veterans. Psychiatry. 2009;72:238-255. doi:10.1521/psyc.2009.72.3.238
- Mittal D, Drummond KL, Blevins D, et al. Stigma associated with PTSD: perceptions of treatment seeking combat veterans. Psychiatr Rehabil J. 2013;36:86-92. doi:10.1037/h0094976
- Possemato K, Wray LO, Johnson E, et al. Facilitators and barriers to seeking mental health care among primary care veterans with posttraumatic stress disorder. J Trauma Stress. 2018;31:742-752. doi:10.1002/jts.22327
- Silvestrini M, Chen JA. “It’s a sign of weakness”: Masculinity and help-seeking behaviors among male veterans accessing posttraumatic stress disorder care. Psychol Trauma. 2023;15:665-671. doi:10.1037/tra0001382
- Stecker T, Shiner B, Watts BV, et al. Treatment-seeking barriers for veterans of the Iraq and Afghanistan conflicts who screen positive for PTSD. Psychiatr Serv. 2013;64:280-283. doi:10.1176/appi.ps.001372012
- Etingen B, Grubbs KM, Harik JM. Drivers of preference for evidence-based PTSD treatment: a qualitative assessment. Mil Med. 2020;185:303-310. doi:10.1093/milmed/usz220
- Hundt NE, Ecker AH, Thompson K, et al. “It didn’t fit for me:” A qualitative examination of dropout from prolonged exposure and cognitive processing therapy in veterans. Psychol Serv. 2020;17:414-421. doi:10.1037/ser0000316
- Kehle-Forbes SM, Gerould H, Polusny MA, et al. “It leaves me very skeptical” messaging in marketing prolonged exposure and cognitive processing therapy to veterans with PTSD. Psychol Trauma. 2022;14:849-852. doi:10.1037/tra0000550
- Kehle-Forbes SM, Ackland PE, Spoont MR, et al. Divergent experiences of U.S. veterans who did and did not complete trauma-focused therapies for PTSD: a national qualitative study of treatment dropout. Behav Res Ther. 2022;154:104123. doi:10.1016/j.brat.2022.104123
- Hessinger JD, London MJ, Baer SM. Evaluation of a shared decision-making intervention on the utilization of evidence-based psychotherapy in a VA outpatient PTSD clinic. Psychol Serv. 2018;15:437-441. doi:10.1037/ser0000141
- Hamblen JL, Grubbs KM, Cole B, et al. “Will it work for me?” Developing patient-friendly graphical displays of posttraumatic stress disorder treatment effectiveness. J Trauma Stress. 2022;35:999-1010. doi:10.1002/jts.22808
- Holder N, Ranney RM, Delgado AK, et al. Transitioning into trauma-focused evidence-based psychotherapy for posttraumatic stress disorder from other treatments: a qualitative investigation. Cogn Behav Ther. 2025;54:391-407. doi:10.1080/16506073.2024.2408386
- Levitt HM, Bamberg M, Creswell JW, et al. Journal article reporting standards for qualitative primary, qualitative meta-analytic, and mixed methods research in psychology: The APA Publications and Communications Board task force report. Am Psychol. 2018;73:26-46. doi:10.1037/amp0000151
- Palinkas LA, Mendon SJ, Hamilton AB. Innovations in mixed methods evaluations. Annu Rev Public Health. 2019;40:423- 442. doi:10.1146/annurev-publhealth-040218-044215
- Ranney RM, Cordova MJ, Maguen S. A review of the referral process for evidence-based psychotherapies for PTSD among veterans. Prof Psychol Res Pr. 2022;53:276-285. doi:10.1037/pro0000463
- Holder N, Ranney RM, Delgado AK, et al. Transitions to trauma-focused evidence-based psychotherapy for posttraumatic stress disorder from other treatment: a qualitative investigation of clinician’s perspectives. Cogn Behav Ther. 2025;1-19. doi:10.1080/16506073.2025.2481475
- Barry CN, Abraham KM, Weaver KR, et al. Innovating team-based outpatient mental health care in the Veterans Health Administration: staff-perceived benefits and challenges to pilot implementation of the Behavioral Health Interdisciplinary Program (BHIP). Psychol Serv. 2016;13:148-155. doi:10.1037/ser0000072
- Harik JM, Hundt NE, Bernardy NC, et al. Desired involvement in treatment decisions among adults with PTSD symptoms. J Trauma Stress. 2016;29:221-228. doi:10.1002/jts.22102
- Larsen SE, Hooyer K, Kehle-Forbes SM, et al. Patient experiences in making PTSD treatment decisions. Psychol Serv. 2024;21:529-537. doi:10.1037/ser0000817
- Hays PA. Four steps toward intersectionality in psychotherapy using the ADDRESSING framework. Prof Psychol Res Pr. 2024;55:454-462. doi:10.1037/pro0000577
- Galovski TE, Nixon RDV, Kaysen D. Flexible Applications of Cognitive Processing Therapy: Evidence-Based Treatment Methods. Academic Press; 2020.
- Larsen SE, McKee T, Fielstein E, et al. The development of a posttraumatic stress disorder (PTSD) consultation program to support system-wide implementation of high-quality PTSD care for veterans. Psychol Serv. 2025;22:342-348. doi:10.1037/ser0000867
- Galovski T, Kaysen D, McClendon J, et al. Provider guide to addressing patient reactions to race-based violence during PTSD treatment. PTSD.va.gov. Accessed August 3, 2025. www.ptsd.va.gov/professional/treat/specific/patient_reactions_race_violence.asp
- Galovski TE, Nixon RDV, Kehle-Forbes S. Walking the line between fidelity and flexibility: a conceptual review of personalized approaches to manualized treatments for posttraumatic stress disorder. J Trauma Stress. 2024;37:768-774. doi:10.1002/jts.23073
- Galovski TE, McSweeney LB, Nixon RDV, et al. Personalizing cognitive processing therapy with a case formulation approach to intentionally target impairment in psychosocial functioning associated with PTSD. Contemp Clin Trials Commun. 2024;42:101385. doi:10.1016/j.conctc.2024.101385
Process Improvement for Engaging With Trauma-Focused Evidence-Based Psychotherapy for PTSD
Process Improvement for Engaging With Trauma-Focused Evidence-Based Psychotherapy for PTSD