User login
Give Her a Shoulder to Cry on

ANSWER
The radiograph demonstrates an acute horizontal fracture through the humeral neck. There is some slight lateral displacement of the fracture fragment.
The patient’s right arm was placed in a sling. Prompt orthopedic consultation was then obtained.
ANSWER
The radiograph demonstrates an acute horizontal fracture through the humeral neck. There is some slight lateral displacement of the fracture fragment.
The patient’s right arm was placed in a sling. Prompt orthopedic consultation was then obtained.
ANSWER
The radiograph demonstrates an acute horizontal fracture through the humeral neck. There is some slight lateral displacement of the fracture fragment.
The patient’s right arm was placed in a sling. Prompt orthopedic consultation was then obtained.

After a motor vehicle collision, a 70-year-old woman is brought to your emergency department by EMS personnel. She was a restrained driver in a vehicle crossing an intersection when she was broadsided by a tractor trailer traveling at high speed. Her airbags deployed, and she believes she briefly lost consciousness. Her biggest complaint is pain in her right shoulder.
Her medical history is significant for hypertension and hypothyroidism. On primary survey, you note an elderly woman who is in full cervical spine immobilization on a long backboard. Her Glasgow Coma Scale score is 15. She is in mild distress but has normal vital signs.
The patient has scattered abrasions and bruises on her body. Her right shoulder has mild to moderate tenderness to palpation and a decreased range of motion. Distally in that arm, she has good pulses and is neurovascularly intact.
You obtain a portable radiograph of the right shoulder (shown). What is your impression?

Infection or not infection, that is the question—Is procalcitonin the answer?

Diagnostic algorithms have been proposed to help recognize infection in chronic obstructive pulmonary disease, rhinosinusitis syndrome, acute arthritis, pharyngitis, and possible sepsis. The algorithms have included laboratory tests and potential biomarkers, but all are imperfect despite achieving various degrees of acceptance in practice.
In this issue of the Journal, Dr. Fakheri updates us on using the data on serum procalcitonin levels to guide starting and stopping antibiotics in different clinical scenarios. As I read the paper, I wondered what was different about procalcitonin that might allow it to succeed where seemingly similar biomarkers like C-reactive protein (CRP) and the erythrocyte sedimentation rate (ESR) have failed.
Procalcitonin is the approximately 15,000-kD product of the CALC1 gene and the precursor of calcitonin. Not surprisingly, then, it is increased in patients with thyroid medullary carcinoma, and it is also often elevated in nonthyroid neuroendocrine malignancies. Proteolytic cleavage of procalcitonin to active calcitonin takes place mainly or only in the thyroid, and under normal homeostatic conditions, procalcitonin is almost unmeasurable in the circulation. However, under major stress such as systemic inflammation, sepsis, or burns, the CALC1 gene is activated in parenchymal cells in many organs, and procalcitonin is synthesized and released. Notably, under these conditions, the procalcitonin does not seem to be of thyroid origin; hence, calcitonin levels do not rise markedly. The physiologic role of nonthyroidal procalcitonin is unknown.
Procalcitonin synthesis and secretion is turned on in nonthyroid tissue by multiple cytokines; the cytokines most likely relevant to its association with inflammation and infections are interleukin (IL) 1 beta, tumor necrosis factor (TNF) alpha, and IL-6. Since these same mediators drive the acute-phase response and elicit the increase in circulating CRP and fibrinogen (the major contributor to the ESR), the obvious question is why procalcitonin might be a more reliable biomarker to distinguish bacterial infection from inflammation or a viral infection than the CRP level or ESR. And although it does indeed seem to do so in several conditions, as Dr. Fakheri discusses, the explanation is not obvious. But it is intriguing to hypothesize.
Induction of procalcitonin by endotoxin-stimulated cytokines is rapid and seems to be slightly faster than that of CRP, although there may be issues of assay sensitivity. The half-life of procalcitonin is similar to that of CRP (about 24 hours). Its degradation does not seem to be altered in renal insufficiency, and its synthesis seems to rapidly shut off as the cytokine level drops. But interestingly, and perhaps relevant to its possible unique biomarker behavior, its synthesis seems to depend on factors other than the increase in inflammatory cytokines such as IL-6. Under certain circumstances, in the same patient, there is a discrepancy between the levels of procalcitonin and CRP.
In a small study of patients with pulmonary embolism and fever, IL-6 levels increased in many with an expected accompanying increase in CRP and ESR, but procalcitonin did not markedly rise,1 although all 3 markers rose as expected in patients with bacterial pneumonia.
Even more provocative is another study in 69 patients with systemic lupus erythematosus and bacterial infection (43 patients had sepsis, 11 of whom died). The CRP level rose dramatically in the infected patients, but procalcitonin did not.2
The intriguing aspect of this, assuming it holds true in other studies, is that interferon activity is high in lupus and many viral infections, and if interferon can suppress CALC1 gene activation3 but leave CRP activation unaffected, this may provide a clue as to why CRP but not procalcitonin is elevated in serious viral infections, thus allowing procalcitonin to more effectively distinguish bacterial from viral and other nonbacterial inflammatory responses.
The two studies I mention are small, some conflicting results have been published, and the results cannot yet be generalized. Plus, it has long been recognized there is sometimes discordance in a given patient between the elevation in ESR and CRP, not readily explained by the presence of a paraprotein, rheologic factors, or the different time course of decay in the ESR and CRP response. Whatever the explanation, procalcitonin’s biology is interesting, and clinical study results show promise. While tracking procalcitonin levels is not uniformly useful (eg, there is no convincing value in using procalcitonin in the diagnosis of prosthetic joint infections), there is accumulating evidence that it can guide us to using shorter but still effective courses of antibiotics in several clinical scenarios. Hopefully, more frequent use of the test will make a dent in our apparent excess use of antibiotics in patients with nonbacterial upper-respiratory infections.
- Köktürk N, Kanbay A, Bukan N, Ekim N. The value of serum procalcitonin in differential diagnosis of pulmonary embolism and community acquired pneumonia. Clin App Thromb Hemostasis 2011; 17(5):519–525. doi:10.1177/1076029610375425
- El-Serougy E, Zayed HS, Ibrahim NM, Maged LA. Procalcitonin and C-reactive protein as markers of infection in systemic lupus erythematosus: the controversy continues. Lupus 2018 Jan 1:961203318777101. doi:10.1177/0961203318777101 (e-pub ahead of print)
- Linscheid P, Seboek D, Nylen ES, et al. In vitro and in vivo calcitonin I gene expression in parenchymal cells: a novel product of human adipose tissue. Endocrinology 2003; 144(12): 5578–5584. doi:10.1210/en.2003-0854
Diagnostic algorithms have been proposed to help recognize infection in chronic obstructive pulmonary disease, rhinosinusitis syndrome, acute arthritis, pharyngitis, and possible sepsis. The algorithms have included laboratory tests and potential biomarkers, but all are imperfect despite achieving various degrees of acceptance in practice.
In this issue of the Journal, Dr. Fakheri updates us on using the data on serum procalcitonin levels to guide starting and stopping antibiotics in different clinical scenarios. As I read the paper, I wondered what was different about procalcitonin that might allow it to succeed where seemingly similar biomarkers like C-reactive protein (CRP) and the erythrocyte sedimentation rate (ESR) have failed.
Procalcitonin is the approximately 15,000-kD product of the CALC1 gene and the precursor of calcitonin. Not surprisingly, then, it is increased in patients with thyroid medullary carcinoma, and it is also often elevated in nonthyroid neuroendocrine malignancies. Proteolytic cleavage of procalcitonin to active calcitonin takes place mainly or only in the thyroid, and under normal homeostatic conditions, procalcitonin is almost unmeasurable in the circulation. However, under major stress such as systemic inflammation, sepsis, or burns, the CALC1 gene is activated in parenchymal cells in many organs, and procalcitonin is synthesized and released. Notably, under these conditions, the procalcitonin does not seem to be of thyroid origin; hence, calcitonin levels do not rise markedly. The physiologic role of nonthyroidal procalcitonin is unknown.
Procalcitonin synthesis and secretion is turned on in nonthyroid tissue by multiple cytokines; the cytokines most likely relevant to its association with inflammation and infections are interleukin (IL) 1 beta, tumor necrosis factor (TNF) alpha, and IL-6. Since these same mediators drive the acute-phase response and elicit the increase in circulating CRP and fibrinogen (the major contributor to the ESR), the obvious question is why procalcitonin might be a more reliable biomarker to distinguish bacterial infection from inflammation or a viral infection than the CRP level or ESR. And although it does indeed seem to do so in several conditions, as Dr. Fakheri discusses, the explanation is not obvious. But it is intriguing to hypothesize.
Induction of procalcitonin by endotoxin-stimulated cytokines is rapid and seems to be slightly faster than that of CRP, although there may be issues of assay sensitivity. The half-life of procalcitonin is similar to that of CRP (about 24 hours). Its degradation does not seem to be altered in renal insufficiency, and its synthesis seems to rapidly shut off as the cytokine level drops. But interestingly, and perhaps relevant to its possible unique biomarker behavior, its synthesis seems to depend on factors other than the increase in inflammatory cytokines such as IL-6. Under certain circumstances, in the same patient, there is a discrepancy between the levels of procalcitonin and CRP.
In a small study of patients with pulmonary embolism and fever, IL-6 levels increased in many with an expected accompanying increase in CRP and ESR, but procalcitonin did not markedly rise,1 although all 3 markers rose as expected in patients with bacterial pneumonia.
Even more provocative is another study in 69 patients with systemic lupus erythematosus and bacterial infection (43 patients had sepsis, 11 of whom died). The CRP level rose dramatically in the infected patients, but procalcitonin did not.2
The intriguing aspect of this, assuming it holds true in other studies, is that interferon activity is high in lupus and many viral infections, and if interferon can suppress CALC1 gene activation3 but leave CRP activation unaffected, this may provide a clue as to why CRP but not procalcitonin is elevated in serious viral infections, thus allowing procalcitonin to more effectively distinguish bacterial from viral and other nonbacterial inflammatory responses.
The two studies I mention are small, some conflicting results have been published, and the results cannot yet be generalized. Plus, it has long been recognized there is sometimes discordance in a given patient between the elevation in ESR and CRP, not readily explained by the presence of a paraprotein, rheologic factors, or the different time course of decay in the ESR and CRP response. Whatever the explanation, procalcitonin’s biology is interesting, and clinical study results show promise. While tracking procalcitonin levels is not uniformly useful (eg, there is no convincing value in using procalcitonin in the diagnosis of prosthetic joint infections), there is accumulating evidence that it can guide us to using shorter but still effective courses of antibiotics in several clinical scenarios. Hopefully, more frequent use of the test will make a dent in our apparent excess use of antibiotics in patients with nonbacterial upper-respiratory infections.
- Köktürk N, Kanbay A, Bukan N, Ekim N. The value of serum procalcitonin in differential diagnosis of pulmonary embolism and community acquired pneumonia. Clin App Thromb Hemostasis 2011; 17(5):519–525. doi:10.1177/1076029610375425
- El-Serougy E, Zayed HS, Ibrahim NM, Maged LA. Procalcitonin and C-reactive protein as markers of infection in systemic lupus erythematosus: the controversy continues. Lupus 2018 Jan 1:961203318777101. doi:10.1177/0961203318777101 (e-pub ahead of print)
- Linscheid P, Seboek D, Nylen ES, et al. In vitro and in vivo calcitonin I gene expression in parenchymal cells: a novel product of human adipose tissue. Endocrinology 2003; 144(12): 5578–5584. doi:10.1210/en.2003-0854

Pyoderma gangrenosum mistaken for diabetic ulcer

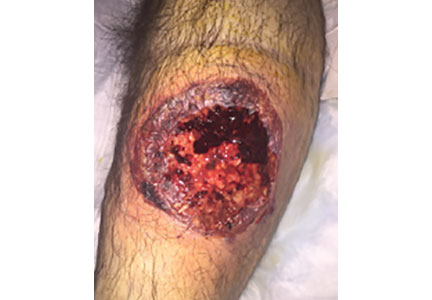
A 55-year-old man with type 2 diabetes mellitus, hypertension, anemia, and ulcerative colitis presented to the emergency department with an ulcer on his left leg (Figure 1). He said the lesion had started as a “large pimple” that ruptured one night while he was sleeping and then became drastically worse over the past week. He said the lesion was painful and was “oozing blood.”
On examination, the lesion was 7 cm by 6.5 cm, with fibrinous, necrotic tissue, purulence, and a violaceous tint at the borders. The patient’s body temperature was 100.5°F (38.1°C) and the white blood cell count was 8.1 x 10⁹/L (reference range 4.0–11.0).
Based on the patient’s medical history, the lesion was initially diagnosed as an infected diabetic ulcer. He was admitted to the hospital and intravenous (IV) vancomycin and clindamycin were started. During this time, the lesion expanded in size, and a second lesion appeared on the right anterior thigh, in similar fashion to how the original lesion had started. The original lesion expanded to 8 cm by 8.5 cm by hospital day 2. The patient continued to have episodes of low-grade fever without leukocytosis.
Cultures of blood and tissue from the lesions were negative, ruling out bacterial infection. Magnetic resonance imaging of the left tibia was negative for osteomyelitis. Punch biopsy of the ulcer border was done on day 3 to evaluate for pyoderma gangrenosum.
On hospital day 5, the patient developed acute kidney injury, with a creatinine increase to 2.17 mg/dL over 24 hours from a baseline value of 0.82 mg/dL. The IV antibiotics were discontinued, and IV fluid hydration was started. At this time, diabetic ulcer secondary to infection and osteomyelitis were ruled out. The lesions were diagnosed as pyoderma gangrenosum.

The patient was started on prednisone 30 mg twice daily. After 2 days, the low-grade fevers resolved, both lesions began to heal, and his creatinine level returned to baseline (Figure 2). He was discharged on hospital day 10. The prednisone was tapered over 1 month, with wet-to-dry dressing changes for wound care.
After discharge, he remained adherent to his steroid regimen. At a follow-up visit to his dermatologist, the ulcers had fully closed, and the skin had begun to heal. Results of the punch biopsy study came back 2 days after the patient was discharged and further confirmed the diagnosis, with a mixed lymphocytic composition composed primarily of neutrophils.
APPROACH TO DIAGNOSIS
Pyoderma gangrenosum is rare, with an incidence of 3 to 10 cases per million people per year.1 It is a rapidly progressive ulcerative condition typically associated with inflammatory bowel disease.2 Despite its name, the condition involves neither gangrene nor infection. The ulcer typically appears on the legs and is rapidly growing, painful, and purulent, with tissue necrosis and a violaceous border.3
Pyoderma gangrenosum is often misdiagnosed as infective ulcer and inappropriately treated with antibiotics.2 It can also be mistreated with surgical debridement, which can result in severe complications such as pathergy.1
The differential diagnosis includes diabetic ulcer, peripheral vascular disease, vasculitis, bacterial infection, osteomyelitis, and malignancy. Because it presents as an open, necrotic ulcer, ruling out infection is a top priority.3 However, an initial workup to rule out infection or other conditions can delay diagnosis and treatment,1 and treatment with broad-spectrum antibiotics poses the risk of nephrotoxicity and new complications during the hospital stay.
Diagnosis requires meeting 2 major criteria—ie, presence of the characteristic ulcerous lesion, and exclusion of other causes of skin ulceration—and at least 2 minor criteria including histologic confirmation of neutrophil infiltrate at the ulcer border, the presence of a systemic disease associated with pyoderma gangrenosum, and a rapid response to steroid treatment.4,5
Our patient was at high risk for an infected diabetic ulcer. After infection was ruled out, clinical suspicion for pyoderma gangrenosum was high, given the patient’s presentation and his history of ulcerative colitis.
TREATMENT
Treatment of pyoderma gangrenosum begins with systemic corticosteroids, as was done in this patient. Additional measures depend on whether the disease is localized or extensive and can include wound care, topical treatments, immunosuppressants, and immunomodulators.1
- Bhat RM. Pyoderma gangrenosum: an update. Indian Dermatol Online J 2012; 3(1):7–13. doi:10.4103/2229-5178.93482
- Marinopoulos S, Theofanakis C, Zacharouli T, Sotiropoulou M, Dimitrakakis C. Pyoderma gangrenosum of the breast: a case report study. Int J Surg Case Rep 2017; 31:203–205. doi:10.1016/j.ijscr.2017.01.036
- Gameiro A, Pereira N, Cardoso JC, Gonçalo M. Pyoderma gangrenosum: challenges and solutions. Clin Cosmet Investig Dermatol 2015; 8:285–293. doi:10.2147/CCID.S61202
- Su WP, David MD, Weenig RH, Powell FC, Perry HO. Pyoderma gangrenosum: clinicopathologic correlation and proposed diagnostic criteria. Int J Dermatol 2004; 43(11):790–800. doi:10.1111/j.1365-4632.2004.02128.x
- von den Driesch P. Pyoderma gangrenosum: a report of 44 cases with follow-up. Br J Dermatol 1997; 137(6):1000–1005. pmid:9470924
A 55-year-old man with type 2 diabetes mellitus, hypertension, anemia, and ulcerative colitis presented to the emergency department with an ulcer on his left leg (Figure 1). He said the lesion had started as a “large pimple” that ruptured one night while he was sleeping and then became drastically worse over the past week. He said the lesion was painful and was “oozing blood.”
On examination, the lesion was 7 cm by 6.5 cm, with fibrinous, necrotic tissue, purulence, and a violaceous tint at the borders. The patient’s body temperature was 100.5°F (38.1°C) and the white blood cell count was 8.1 x 10⁹/L (reference range 4.0–11.0).
Based on the patient’s medical history, the lesion was initially diagnosed as an infected diabetic ulcer. He was admitted to the hospital and intravenous (IV) vancomycin and clindamycin were started. During this time, the lesion expanded in size, and a second lesion appeared on the right anterior thigh, in similar fashion to how the original lesion had started. The original lesion expanded to 8 cm by 8.5 cm by hospital day 2. The patient continued to have episodes of low-grade fever without leukocytosis.
Cultures of blood and tissue from the lesions were negative, ruling out bacterial infection. Magnetic resonance imaging of the left tibia was negative for osteomyelitis. Punch biopsy of the ulcer border was done on day 3 to evaluate for pyoderma gangrenosum.
On hospital day 5, the patient developed acute kidney injury, with a creatinine increase to 2.17 mg/dL over 24 hours from a baseline value of 0.82 mg/dL. The IV antibiotics were discontinued, and IV fluid hydration was started. At this time, diabetic ulcer secondary to infection and osteomyelitis were ruled out. The lesions were diagnosed as pyoderma gangrenosum.
The patient was started on prednisone 30 mg twice daily. After 2 days, the low-grade fevers resolved, both lesions began to heal, and his creatinine level returned to baseline (Figure 2). He was discharged on hospital day 10. The prednisone was tapered over 1 month, with wet-to-dry dressing changes for wound care.
After discharge, he remained adherent to his steroid regimen. At a follow-up visit to his dermatologist, the ulcers had fully closed, and the skin had begun to heal. Results of the punch biopsy study came back 2 days after the patient was discharged and further confirmed the diagnosis, with a mixed lymphocytic composition composed primarily of neutrophils.
APPROACH TO DIAGNOSIS
Pyoderma gangrenosum is rare, with an incidence of 3 to 10 cases per million people per year.1 It is a rapidly progressive ulcerative condition typically associated with inflammatory bowel disease.2 Despite its name, the condition involves neither gangrene nor infection. The ulcer typically appears on the legs and is rapidly growing, painful, and purulent, with tissue necrosis and a violaceous border.3
Pyoderma gangrenosum is often misdiagnosed as infective ulcer and inappropriately treated with antibiotics.2 It can also be mistreated with surgical debridement, which can result in severe complications such as pathergy.1
The differential diagnosis includes diabetic ulcer, peripheral vascular disease, vasculitis, bacterial infection, osteomyelitis, and malignancy. Because it presents as an open, necrotic ulcer, ruling out infection is a top priority.3 However, an initial workup to rule out infection or other conditions can delay diagnosis and treatment,1 and treatment with broad-spectrum antibiotics poses the risk of nephrotoxicity and new complications during the hospital stay.
Diagnosis requires meeting 2 major criteria—ie, presence of the characteristic ulcerous lesion, and exclusion of other causes of skin ulceration—and at least 2 minor criteria including histologic confirmation of neutrophil infiltrate at the ulcer border, the presence of a systemic disease associated with pyoderma gangrenosum, and a rapid response to steroid treatment.4,5
Our patient was at high risk for an infected diabetic ulcer. After infection was ruled out, clinical suspicion for pyoderma gangrenosum was high, given the patient’s presentation and his history of ulcerative colitis.
TREATMENT
Treatment of pyoderma gangrenosum begins with systemic corticosteroids, as was done in this patient. Additional measures depend on whether the disease is localized or extensive and can include wound care, topical treatments, immunosuppressants, and immunomodulators.1
- Bhat RM. Pyoderma gangrenosum: an update. Indian Dermatol Online J 2012; 3(1):7–13. doi:10.4103/2229-5178.93482
- Marinopoulos S, Theofanakis C, Zacharouli T, Sotiropoulou M, Dimitrakakis C. Pyoderma gangrenosum of the breast: a case report study. Int J Surg Case Rep 2017; 31:203–205. doi:10.1016/j.ijscr.2017.01.036
- Gameiro A, Pereira N, Cardoso JC, Gonçalo M. Pyoderma gangrenosum: challenges and solutions. Clin Cosmet Investig Dermatol 2015; 8:285–293. doi:10.2147/CCID.S61202
- Su WP, David MD, Weenig RH, Powell FC, Perry HO. Pyoderma gangrenosum: clinicopathologic correlation and proposed diagnostic criteria. Int J Dermatol 2004; 43(11):790–800. doi:10.1111/j.1365-4632.2004.02128.x
- von den Driesch P. Pyoderma gangrenosum: a report of 44 cases with follow-up. Br J Dermatol 1997; 137(6):1000–1005. pmid:9470924
Part 4: Misguided Research or Missed Opportunities?
I have been ruminating about the Bai et al article on independent billing in the emergency department (ED) for weeks.1 I keep wondering why the data analysis seems so off base. Don’t get me wrong: The data gathered from Medicare is what it is—but a key piece of information is not present in the pure numbers input to the Medicare database.
So, I continued to probe this study with my colleagues. To a person, their comments supported that the intent of the study is unclear. The authors posit their objective to be an examination of the “involvement of NPs and PAs” in emergency services, using billing data. But to use billing data as a measure of “involvement” does not tell the whole story.
Independence in billing does not mean that the care NPs and PAs are providing is “beyond their scope of practice.” Moreover, the billing does not capture whether, or to what extent, physician consultation or assistance was involved. If the NP or PA dictated the chart, then they are by default the “only” (independent) provider. However, billing independently does not mean a physician (or other provider) was not consulted about the plan of care.
Case in point: Years ago, I had a young woman present to the ED with a sore throat. Her presenting complaint was a symptom of a peritonsillar abscess. So I phoned an ENT colleague (a physician) and asked him about the best treatment and follow-up in this case. Did he make a note in or sign the chart? No. Was I the only provider of record? Yes. Was that care “independent,” if you only look at the billing (done by a coder, for the record)? Yes.
Admittedly, Bai and colleagues do add in their conclusion that “independence in billing … does not necessarily indicate [NPs’/PAs’] independence in care delivery.”1 And they do note that the true challenge in the ED is determining how best to “blend” the expertise of the three professions (MD, NP, and PA) to provide efficient and cost-effective care.
However, throughout the article, there is an underpinning of inference that NPs and PAs are potentially practicing beyond their scope. Their comment that the increase in billing for NP and PA services results in a “reduction of the proportion of emergency physicians” speaks volumes.1 Perhaps there is more concern here about ED physician job security than about independent billing!
Regardless of the intention by Bai et al—and acknowledging that the analysis they presented is somewhat interesting—I see two missed opportunities to “actionalize” the data.2 One is to use the information to identify whether a problem with billing exists (ie, is there upcharging as a result of more details contained within the electronic health record?). The second is to use the data to investigate innovative ways to improve access to care across the continuum. Essentially, how do we use the results of any data analysis in a way that can be useful? That is the real challenge.
Continue to: The biggest conclusion I've drawn...
The biggest conclusion I’ve drawn from my exploration of these study findings? The opportunity to investigate the competencies of all ED providers, with the goal of improving access and controlling costs, is there. And as the NPs and PAs providing the care, we should undertake the next research study or data analysis and not leave the research on us to other professions!
I’d love to hear your thoughts on the Bai et al study or any aspect of this 4-part discussion! Drop me a line at NPEditor@mdege.com.
1. Bai G, Kelen GD, Frick KD, Anderson GF. Nurse practitioners and physician assistants in emergency medical services who billed independently, 2012-2016. Am J Emerg Med. https://doi.org/10.1016/j.ajem.2019.01.052. Accessed April 1, 2019.
2. The Wharton School at the University of Pennsylvania. Big data’s biggest challenge: how to avoid getting lost in the weeds. Knowledge@Wharton podcast. March 14, 2019. http://knowledge.wharton.upenn.edu/article/data-analytics-challenges. Accessed April 1, 2019.
I have been ruminating about the Bai et al article on independent billing in the emergency department (ED) for weeks.1 I keep wondering why the data analysis seems so off base. Don’t get me wrong: The data gathered from Medicare is what it is—but a key piece of information is not present in the pure numbers input to the Medicare database.
So, I continued to probe this study with my colleagues. To a person, their comments supported that the intent of the study is unclear. The authors posit their objective to be an examination of the “involvement of NPs and PAs” in emergency services, using billing data. But to use billing data as a measure of “involvement” does not tell the whole story.
Independence in billing does not mean that the care NPs and PAs are providing is “beyond their scope of practice.” Moreover, the billing does not capture whether, or to what extent, physician consultation or assistance was involved. If the NP or PA dictated the chart, then they are by default the “only” (independent) provider. However, billing independently does not mean a physician (or other provider) was not consulted about the plan of care.
Case in point: Years ago, I had a young woman present to the ED with a sore throat. Her presenting complaint was a symptom of a peritonsillar abscess. So I phoned an ENT colleague (a physician) and asked him about the best treatment and follow-up in this case. Did he make a note in or sign the chart? No. Was I the only provider of record? Yes. Was that care “independent,” if you only look at the billing (done by a coder, for the record)? Yes.
Admittedly, Bai and colleagues do add in their conclusion that “independence in billing … does not necessarily indicate [NPs’/PAs’] independence in care delivery.”1 And they do note that the true challenge in the ED is determining how best to “blend” the expertise of the three professions (MD, NP, and PA) to provide efficient and cost-effective care.
However, throughout the article, there is an underpinning of inference that NPs and PAs are potentially practicing beyond their scope. Their comment that the increase in billing for NP and PA services results in a “reduction of the proportion of emergency physicians” speaks volumes.1 Perhaps there is more concern here about ED physician job security than about independent billing!
Regardless of the intention by Bai et al—and acknowledging that the analysis they presented is somewhat interesting—I see two missed opportunities to “actionalize” the data.2 One is to use the information to identify whether a problem with billing exists (ie, is there upcharging as a result of more details contained within the electronic health record?). The second is to use the data to investigate innovative ways to improve access to care across the continuum. Essentially, how do we use the results of any data analysis in a way that can be useful? That is the real challenge.
Continue to: The biggest conclusion I've drawn...
The biggest conclusion I’ve drawn from my exploration of these study findings? The opportunity to investigate the competencies of all ED providers, with the goal of improving access and controlling costs, is there. And as the NPs and PAs providing the care, we should undertake the next research study or data analysis and not leave the research on us to other professions!
I’d love to hear your thoughts on the Bai et al study or any aspect of this 4-part discussion! Drop me a line at NPEditor@mdege.com.
1. Bai G, Kelen GD, Frick KD, Anderson GF. Nurse practitioners and physician assistants in emergency medical services who billed independently, 2012-2016. Am J Emerg Med. https://doi.org/10.1016/j.ajem.2019.01.052. Accessed April 1, 2019.
2. The Wharton School at the University of Pennsylvania. Big data’s biggest challenge: how to avoid getting lost in the weeds. Knowledge@Wharton podcast. March 14, 2019. http://knowledge.wharton.upenn.edu/article/data-analytics-challenges. Accessed April 1, 2019.

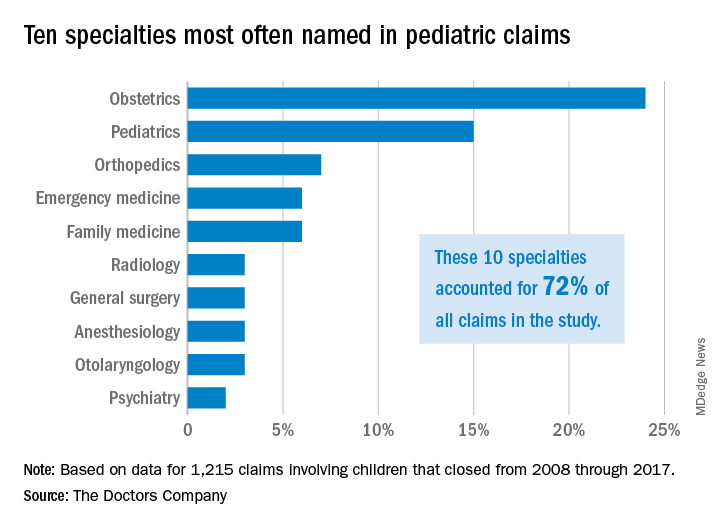
Malpractice: Diagnostic errors top allegation involving children
Diagnostic error is the most common allegation against pediatricians when sued by patients and their families, a study finds.
Investigators with The Doctors Company, a national medical liability insurer, examined 1,215 closed claims involving children from the company’s database between 2008 and 2017. Results showed that diagnostic mistakes, including delayed diagnosis, incorrect diagnosis, and failure to diagnose, were the most common accusations among claims that involved children ages 1 through 17. Poor medical treatment was the second most common allegation for claims that involved children aged 1-9, while surgical treatment-related error was the second most frequent accusation for children ages 10-17.
Pediatricians, orthopedic surgeons, and emergency medicine physicians were the most frequently named specialists in claims associated with children older than 1 month. Obstetricians were most frequently defendants in claims involving neonates. For these cases, errors during labor and delivery care were the most common complaints.
Of the 1,215 claims, obstetricians were named in 24% of the cases and pediatricians were named in 15% of the cases. The majority of claims were filed against physicians in the first 3 years following the medical incident alleged, according to the study, published by The Doctors Company.
The average patient payment in each case was $630,456, and the average expense to defend each claim was $157,502, according to the analysis. Claims that involved neonates had the highest average payment ($936,843) and the highest defense costs ($187,117), while claims involving children aged 10-17 years had the lowest average payment ($386,849) and cost the least to defend ($129,816).
For cases involving neonates, the type of therapy selected during labor and delivery and how it was managed were the most common factors contributing to the alleged injury, according to the analysis.
The most frequent factors contributing to patient harm for other age groups involved patient assessment issues and communication problems between the patient/family and the physician. Inadequate patient assessments were closely linked to incorrect diagnoses, while incomplete communication between patients/family members and providers impacted clinicians’ ability to make correct diagnoses, according to the study.
This analysis “shows that pediatric malpractice lawsuits impact nearly every area of medicine,” William F. Getman, MD, a pediatrician in Austin, Tex., said in an interview. “I was surprised to see that the most common age of a patient in a malpractice lawsuit was less than 1 month old. This age group also sustained the most severe injuries and had the highest indemnity paid.”
The study offers several key takeaways, including the importance of identifying system weaknesses in your medical practice and evaluating if improvements are needed, according to Darrell Ranum, vice president for patient safety and risk management for The Doctors Company.

Simple improvements, such as implementing tracking mechanisms for test results and referrals, can reduce the chance that important information falls through the cracks and delays diagnosis or treatment, Mr. Ranum said in an interview.
“When parents raise questions about their child’s complaints, this is the best opportunity to identify illnesses and conditions that represent a serious threat to children,” he said. “Prepare office staff members to know what complaints need to be evaluated by a clinician or require immediate care.”
In addition, the study findings point to the need to improve communication in all areas of the practice spectrum, Dr. Getman said.
“Many of the lawsuits could have been avoided by improvements in communication – doctor to patient, patient to doctor, doctor to nurse, doctor to doctor, nurse to patient, etc.,” he said. “Finding more effective and accurate ways to communicate will avoid mistakes, improve care, and improve outcomes. Examples of ways to improve communication include use of an interpreter when indicated, verbal and written explanations of instructions, and system improvements in tracking messages/labs/data. There are innumerable other ways to improve communication in health care.”
SOURCE: Ranum, D. The Doctor’s Advocate. First Quarter 2019.
Diagnostic error is the most common allegation against pediatricians when sued by patients and their families, a study finds.
Investigators with The Doctors Company, a national medical liability insurer, examined 1,215 closed claims involving children from the company’s database between 2008 and 2017. Results showed that diagnostic mistakes, including delayed diagnosis, incorrect diagnosis, and failure to diagnose, were the most common accusations among claims that involved children ages 1 through 17. Poor medical treatment was the second most common allegation for claims that involved children aged 1-9, while surgical treatment-related error was the second most frequent accusation for children ages 10-17.
Pediatricians, orthopedic surgeons, and emergency medicine physicians were the most frequently named specialists in claims associated with children older than 1 month. Obstetricians were most frequently defendants in claims involving neonates. For these cases, errors during labor and delivery care were the most common complaints.
Of the 1,215 claims, obstetricians were named in 24% of the cases and pediatricians were named in 15% of the cases. The majority of claims were filed against physicians in the first 3 years following the medical incident alleged, according to the study, published by The Doctors Company.
The average patient payment in each case was $630,456, and the average expense to defend each claim was $157,502, according to the analysis. Claims that involved neonates had the highest average payment ($936,843) and the highest defense costs ($187,117), while claims involving children aged 10-17 years had the lowest average payment ($386,849) and cost the least to defend ($129,816).
For cases involving neonates, the type of therapy selected during labor and delivery and how it was managed were the most common factors contributing to the alleged injury, according to the analysis.
The most frequent factors contributing to patient harm for other age groups involved patient assessment issues and communication problems between the patient/family and the physician. Inadequate patient assessments were closely linked to incorrect diagnoses, while incomplete communication between patients/family members and providers impacted clinicians’ ability to make correct diagnoses, according to the study.
This analysis “shows that pediatric malpractice lawsuits impact nearly every area of medicine,” William F. Getman, MD, a pediatrician in Austin, Tex., said in an interview. “I was surprised to see that the most common age of a patient in a malpractice lawsuit was less than 1 month old. This age group also sustained the most severe injuries and had the highest indemnity paid.”
The study offers several key takeaways, including the importance of identifying system weaknesses in your medical practice and evaluating if improvements are needed, according to Darrell Ranum, vice president for patient safety and risk management for The Doctors Company.
Simple improvements, such as implementing tracking mechanisms for test results and referrals, can reduce the chance that important information falls through the cracks and delays diagnosis or treatment, Mr. Ranum said in an interview.
“When parents raise questions about their child’s complaints, this is the best opportunity to identify illnesses and conditions that represent a serious threat to children,” he said. “Prepare office staff members to know what complaints need to be evaluated by a clinician or require immediate care.”
In addition, the study findings point to the need to improve communication in all areas of the practice spectrum, Dr. Getman said.
“Many of the lawsuits could have been avoided by improvements in communication – doctor to patient, patient to doctor, doctor to nurse, doctor to doctor, nurse to patient, etc.,” he said. “Finding more effective and accurate ways to communicate will avoid mistakes, improve care, and improve outcomes. Examples of ways to improve communication include use of an interpreter when indicated, verbal and written explanations of instructions, and system improvements in tracking messages/labs/data. There are innumerable other ways to improve communication in health care.”
SOURCE: Ranum, D. The Doctor’s Advocate. First Quarter 2019.
FDA approves generic naloxone spray for opioid overdose treatment
The Food and Drug Administration on April 19 approved the first generic naloxone hydrochloride nasal spray (Narcan) as treatment for stopping or reversing an opioid overdose.

“In the wake of the opioid crisis, a number of efforts are underway to make this emergency overdose reversal treatment more readily available and more accessible,” said Douglas Throckmorton, MD, deputy center director for regulatory programs in the FDA’s Center for Drug Evaluation and Research, in a press release. “In addition to this approval of the first generic naloxone nasal spray, moving forward, we will prioritize our review of generic drug applications for naloxone.”
The agency said the naloxone nasal spray does not need assembly and can be used by anyone, regardless of medical training. If the spray is administered quickly after the overdose begins, the effect of the opioid will be countered, often within minutes. However, patients should still seek immediate medical attention.
The FDA cautioned that, when used on a patient with an opioid dependence, naloxone can cause severe opioid withdrawal, characterized by symptoms such as body aches, diarrhea, tachycardia, fever, runny nose, sneezing, goose bumps, sweating, yawning, nausea or vomiting, nervousness, restlessness or irritability, shivering or trembling, abdominal cramps, weakness, and increased blood pressure.
Find the full press release on the FDA website.
lfranki@mdedge.com
The Food and Drug Administration on April 19 approved the first generic naloxone hydrochloride nasal spray (Narcan) as treatment for stopping or reversing an opioid overdose.
“In the wake of the opioid crisis, a number of efforts are underway to make this emergency overdose reversal treatment more readily available and more accessible,” said Douglas Throckmorton, MD, deputy center director for regulatory programs in the FDA’s Center for Drug Evaluation and Research, in a press release. “In addition to this approval of the first generic naloxone nasal spray, moving forward, we will prioritize our review of generic drug applications for naloxone.”
The agency said the naloxone nasal spray does not need assembly and can be used by anyone, regardless of medical training. If the spray is administered quickly after the overdose begins, the effect of the opioid will be countered, often within minutes. However, patients should still seek immediate medical attention.
The FDA cautioned that, when used on a patient with an opioid dependence, naloxone can cause severe opioid withdrawal, characterized by symptoms such as body aches, diarrhea, tachycardia, fever, runny nose, sneezing, goose bumps, sweating, yawning, nausea or vomiting, nervousness, restlessness or irritability, shivering or trembling, abdominal cramps, weakness, and increased blood pressure.
Find the full press release on the FDA website.
lfranki@mdedge.com
Part 3: Getting to the Scope of the Problem
Nurse practitioners (and PAs, I would submit) have been the most researched group of health care professionals since the inception of the role. Much of that research has focused on evaluating our contributions to primary care. Numerous studies of NP performance in various settings have concluded that we perform as well as physicians with respect to patient outcomes, proper diagnosis, management of specific medical conditions, and patient satisfaction.1
Over the past 10 years, however, the interest in our roles has shifted from the primary care arena to the emergency department (ED). Even before the introduction of the Affordable Care Act (ACA), two-thirds of all EDs utilized NPs and PAs.2 The ACA increased the number of Americans with insurance coverage, resulting in a greater demand for health care services—including ED utilization. Faced with an already strained system, hospital administrators looked for a solution and found one: hiring NPs and PAs to augment the clinician workforce.
This decision to (increasingly) employ NPs and PAs in ED settings was based on a desire to reduce wait times, increase throughput, improve access to care, and control costs. For the most part, these goals have been achieved. A systematic review of the impact of NPs in the ED on quality of care and patient satisfaction demonstrated a reduction in wait times.3 Moreover, in a national survey that included a review of the types of visits made to the ED, NPs and PAs were comparable to MDs in terms of reasons for care, diagnosis, and treatment.4
Given these results, I again ask: What was the intent of the research by Bai et al?5 Surely proper and prompt care is the goal of every ED provider. So the decision to examine only the billing is confounding.
Are the authors suggesting that hospital administrators prefer employing NPs and PAs over MDs? Are we replacing physicians in certain areas or filling voids where the physician workforce is inadequate to meet the community demands? Maybe yes to both. But, if the goal is to improve access, then we should focus on meeting the needs and on the quality of the care, not on who bills for it.
My cynical self says the goal of Bai et al was to establish that NPs and PAs are taking the jobs of ED physicians, and we must be stopped! Am I tilting at windmills with this train of thought? Next week, we’ll conclude our examination and draw our own conclusions! You can join the conversation by writing to NPEditor@mdedge.com.
1. Congressional Budget Office. Physician extenders: their current and future role in medical care delivery. Washington, DC: US Government Printing Office; 1979.
2. Wiler JL, Rooks, SP, Ginde AA. Update on midlevel provider utilization in US emergency departments, 2006 to 2009. Academic Emerg Med. 2012;19(8):986-989.
3. Carter A, Chochinov A. A systematic review of the impact of nurse practitioners on cost, quality of care, satisfaction, and wait times in the emergency department. Can J Emerg Med. 2007;9(4):286-295.
4. Hooker RS, McCaig L. Emergency department uses of physician assistants and nurse practitioners: a national survey. Am J Emerg Med. 1996;14:245-249.
5. Bai G, Kelen GD, Frick KD, Anderson GF. Nurse practitioners and physician assistants in emergency medical services who billed independently, 2012-2016. Am J Emerg Med. https://doi.org/10.1016/j.ajem.2019.01.052. Accessed April 1, 2019.
Nurse practitioners (and PAs, I would submit) have been the most researched group of health care professionals since the inception of the role. Much of that research has focused on evaluating our contributions to primary care. Numerous studies of NP performance in various settings have concluded that we perform as well as physicians with respect to patient outcomes, proper diagnosis, management of specific medical conditions, and patient satisfaction.1
Over the past 10 years, however, the interest in our roles has shifted from the primary care arena to the emergency department (ED). Even before the introduction of the Affordable Care Act (ACA), two-thirds of all EDs utilized NPs and PAs.2 The ACA increased the number of Americans with insurance coverage, resulting in a greater demand for health care services—including ED utilization. Faced with an already strained system, hospital administrators looked for a solution and found one: hiring NPs and PAs to augment the clinician workforce.
This decision to (increasingly) employ NPs and PAs in ED settings was based on a desire to reduce wait times, increase throughput, improve access to care, and control costs. For the most part, these goals have been achieved. A systematic review of the impact of NPs in the ED on quality of care and patient satisfaction demonstrated a reduction in wait times.3 Moreover, in a national survey that included a review of the types of visits made to the ED, NPs and PAs were comparable to MDs in terms of reasons for care, diagnosis, and treatment.4
Given these results, I again ask: What was the intent of the research by Bai et al?5 Surely proper and prompt care is the goal of every ED provider. So the decision to examine only the billing is confounding.
Are the authors suggesting that hospital administrators prefer employing NPs and PAs over MDs? Are we replacing physicians in certain areas or filling voids where the physician workforce is inadequate to meet the community demands? Maybe yes to both. But, if the goal is to improve access, then we should focus on meeting the needs and on the quality of the care, not on who bills for it.
My cynical self says the goal of Bai et al was to establish that NPs and PAs are taking the jobs of ED physicians, and we must be stopped! Am I tilting at windmills with this train of thought? Next week, we’ll conclude our examination and draw our own conclusions! You can join the conversation by writing to NPEditor@mdedge.com.
1. Congressional Budget Office. Physician extenders: their current and future role in medical care delivery. Washington, DC: US Government Printing Office; 1979.
2. Wiler JL, Rooks, SP, Ginde AA. Update on midlevel provider utilization in US emergency departments, 2006 to 2009. Academic Emerg Med. 2012;19(8):986-989.
3. Carter A, Chochinov A. A systematic review of the impact of nurse practitioners on cost, quality of care, satisfaction, and wait times in the emergency department. Can J Emerg Med. 2007;9(4):286-295.
4. Hooker RS, McCaig L. Emergency department uses of physician assistants and nurse practitioners: a national survey. Am J Emerg Med. 1996;14:245-249.
5. Bai G, Kelen GD, Frick KD, Anderson GF. Nurse practitioners and physician assistants in emergency medical services who billed independently, 2012-2016. Am J Emerg Med. https://doi.org/10.1016/j.ajem.2019.01.052. Accessed April 1, 2019.
Part 2: Whose Bill Is It, Anyway?
In an attempt to understand the data presented by Bai et al regarding independent billing by NPs and PAs in the emergency department (ED), I reached out to several colleagues to get their take on the study.1 Four of them are ED providers (2 MDs, 1 NP, 1 PA), and another is an experienced data analyst. In short, the analysis was analyzed!
Each member of my “expert panel” had similar comments and concerns, particularly regarding billing versus providing care. These are two different animals, or—as I often say—Bai and colleagues were comparing “oranges and shoes.” Several colleagues questioned the purpose of the article: What were the authors really trying to say?
Both MDs noted the absence of comments related to any consultation between the NP/PA and the ED physician during the patient encounter. They also pointed out the sheer volume of patients in EDs, resulting in the increasing popularity and utilization of NP/PAs to provide timely care to patients in need.
More than one of us initially wondered whether there could be potential “overbilling.” With the implementation of electronic health records (EHRs), the average charge per patient has increased. Maybe the EHR, now so common in EDs, more accurately captures the amount of time the provider spends caring for the patient and allows for more detailed documentation of the visit. This might result in a prima facie higher level of billing without necessarily representing the acuity of the presenting complaint.
One fact not presented in the Bai article is that, in many instances, providers (whether MDs, NPs, or PAs) do not complete the bills submitted to the insurance companies. In many EDs, medical coders extract the patient encounter data from the medical record. The reality is, the acuity of the patient is being decided by the person who is coding the visit—not the provider. And thus, it is potentially flawed thinking to rely on billing data alone to assess an increase in the acuity of patients seen by NPs and PAs in the ED.
Since we know (through data!) that there are more NPs and PAs providing care in EDs across the country, it follows logically that there will be more bills submitted in our names. This leads me to wonder: What was the motivation for Bai and colleagues to perform this study? What point are they actually trying to make?
Stay tuned ... There’s more to say next week! (In the meantime, you can share your thoughts by writing to me at NPEditor@mdedge.com.)
1. Bai G, Kelen GD, Frick KD, Anderson GF. Nurse practitioners and physician assistants in emergency medical services who billed independently, 2012-2016. Am J Emerg Med. https://doi.org/10.1016/j.ajem.2019.01.052. Accessed April 1, 2019.
In an attempt to understand the data presented by Bai et al regarding independent billing by NPs and PAs in the emergency department (ED), I reached out to several colleagues to get their take on the study.1 Four of them are ED providers (2 MDs, 1 NP, 1 PA), and another is an experienced data analyst. In short, the analysis was analyzed!
Each member of my “expert panel” had similar comments and concerns, particularly regarding billing versus providing care. These are two different animals, or—as I often say—Bai and colleagues were comparing “oranges and shoes.” Several colleagues questioned the purpose of the article: What were the authors really trying to say?
Both MDs noted the absence of comments related to any consultation between the NP/PA and the ED physician during the patient encounter. They also pointed out the sheer volume of patients in EDs, resulting in the increasing popularity and utilization of NP/PAs to provide timely care to patients in need.
More than one of us initially wondered whether there could be potential “overbilling.” With the implementation of electronic health records (EHRs), the average charge per patient has increased. Maybe the EHR, now so common in EDs, more accurately captures the amount of time the provider spends caring for the patient and allows for more detailed documentation of the visit. This might result in a prima facie higher level of billing without necessarily representing the acuity of the presenting complaint.
One fact not presented in the Bai article is that, in many instances, providers (whether MDs, NPs, or PAs) do not complete the bills submitted to the insurance companies. In many EDs, medical coders extract the patient encounter data from the medical record. The reality is, the acuity of the patient is being decided by the person who is coding the visit—not the provider. And thus, it is potentially flawed thinking to rely on billing data alone to assess an increase in the acuity of patients seen by NPs and PAs in the ED.
Since we know (through data!) that there are more NPs and PAs providing care in EDs across the country, it follows logically that there will be more bills submitted in our names. This leads me to wonder: What was the motivation for Bai and colleagues to perform this study? What point are they actually trying to make?
Stay tuned ... There’s more to say next week! (In the meantime, you can share your thoughts by writing to me at NPEditor@mdedge.com.)
1. Bai G, Kelen GD, Frick KD, Anderson GF. Nurse practitioners and physician assistants in emergency medical services who billed independently, 2012-2016. Am J Emerg Med. https://doi.org/10.1016/j.ajem.2019.01.052. Accessed April 1, 2019.
1. Bai G, Kelen GD, Frick KD, Anderson GF. Nurse practitioners and physician assistants in emergency medical services who billed independently, 2012-2016. Am J Emerg Med. https://doi.org/10.1016/j.ajem.2019.01.052. Accessed April 1, 2019.
Part 1: The Study in Question
Recently, my colleague Randy D. Danielsen, PhD, DFAAPA, PA-C Emeritus, shared a study from the American Journal of Emergency Medicine that focused on “the involvement of NPs and PAs who billed independently” in emergency departments (EDs).1 In casual conversation, several of us agreed the findings didn’t “pass the sniff test,” so I decided to do some investigating.
The context: Data from 2006-2009 indicate that in two-thirds of all EDs, NPs and PAs are involved in the care of 13.7% of all patients.2 Further analysis of Medicare Public Use Files from 2014 reveal that of 58,641 unique emergency medicine clinicians, 14,360 (24.5%) are advanced practice providers.3 All interesting statistics.
The American Journal of Emergency Medicine article, however, gave me (and several colleagues) pause. In it, the authors presented their analysis of Medicare provider utilization and payment data from 2012-2016.1 The researchers documented billing increases of 65% for NPs and 35% for PAs.
But what stopped me in my tracks was that the researchers emphasized an increase—from 18% to 24%—in NP/PA treatment of patients with the highest severity illness or injury (CPT code 99285).1 I discussed this finding with ED-based colleagues, and they too questioned its accuracy.
In fact, the more we parsed this study, the more questions we had … and the higher our eyebrows raised. What were the researchers examining and drawing conclusions on— independent billing by NPs and PAs, or independent practice? These are two very different measures. Were the authors in fact grousing about the increase in NP/PA providers in EDs?
There is a paucity of research on billing by NPs and PAs, and the discussion surrounding this particular study will undoubtedly prompt additional questions. Over the next 3 weeks, we invite you to join us on Thursdays as we continue our examination of this data—and encourage you to share your thoughts with us along the way!
1. Bai G, Kelen GD, Frick KD, Anderson GF. Nurse practitioners and physician assistants in emergency medical services who billed independently, 2012-2016. Am J Emerg Med. https://doi.org/10.1016/j.ajem.2019.01.052. Accessed April 1, 2019.
2. Wilder JL, Rooks, SP, Ginde AA. Update on midlevel provider utilization in US emergency departments, 2006 to 2009. Academic Emerg Med. 2012;19(8):986-989.
3. Hall MK, Burns K, Carius M, et al. State of the national emergency department workforce: who provides care where? Ann Emerg Med. 2018;72(3):302-307.
Recently, my colleague Randy D. Danielsen, PhD, DFAAPA, PA-C Emeritus, shared a study from the American Journal of Emergency Medicine that focused on “the involvement of NPs and PAs who billed independently” in emergency departments (EDs).1 In casual conversation, several of us agreed the findings didn’t “pass the sniff test,” so I decided to do some investigating.
The context: Data from 2006-2009 indicate that in two-thirds of all EDs, NPs and PAs are involved in the care of 13.7% of all patients.2 Further analysis of Medicare Public Use Files from 2014 reveal that of 58,641 unique emergency medicine clinicians, 14,360 (24.5%) are advanced practice providers.3 All interesting statistics.
The American Journal of Emergency Medicine article, however, gave me (and several colleagues) pause. In it, the authors presented their analysis of Medicare provider utilization and payment data from 2012-2016.1 The researchers documented billing increases of 65% for NPs and 35% for PAs.
But what stopped me in my tracks was that the researchers emphasized an increase—from 18% to 24%—in NP/PA treatment of patients with the highest severity illness or injury (CPT code 99285).1 I discussed this finding with ED-based colleagues, and they too questioned its accuracy.
In fact, the more we parsed this study, the more questions we had … and the higher our eyebrows raised. What were the researchers examining and drawing conclusions on— independent billing by NPs and PAs, or independent practice? These are two very different measures. Were the authors in fact grousing about the increase in NP/PA providers in EDs?
There is a paucity of research on billing by NPs and PAs, and the discussion surrounding this particular study will undoubtedly prompt additional questions. Over the next 3 weeks, we invite you to join us on Thursdays as we continue our examination of this data—and encourage you to share your thoughts with us along the way!
1. Bai G, Kelen GD, Frick KD, Anderson GF. Nurse practitioners and physician assistants in emergency medical services who billed independently, 2012-2016. Am J Emerg Med. https://doi.org/10.1016/j.ajem.2019.01.052. Accessed April 1, 2019.
2. Wilder JL, Rooks, SP, Ginde AA. Update on midlevel provider utilization in US emergency departments, 2006 to 2009. Academic Emerg Med. 2012;19(8):986-989.
3. Hall MK, Burns K, Carius M, et al. State of the national emergency department workforce: who provides care where? Ann Emerg Med. 2018;72(3):302-307.
30-day readmissions after STEMI with cardiogenic shock 13%
WASHINGTON – and remain in hospital for an average of 6 days, according to an analysis from the National Readmission Database presented at CRT 2019 sponsored by MedStar Heart & Vascular Institute.

“About one in four of the readmissions was for heart failure,” reported Karan Sud, MD, a cardiology resident at the Mount Sinai St. Luke’s West Hospital, New York.
Despite gains in acute survival among STEMI patients in cardiogenic shock, little attention has been paid to the risk of readmissions, according to Dr. Sud. According to data collected from the National Readmissions Database for 2010-2014, these rates are high enough to deserve attention, he said.
“Our goal is now to develop a scoring system based on our predictive model to identify patients at the index admission who are at risk for readmission,” Dr. Sud reported. On the basis of these predictors, it might be possible to implement strategies to optimize management and improve access to care.
In the years studied, there were 94,991 patients with STEMI and cardiogenic shock captured in the National Readmissions Database, of whom 43,205 survived and were followed for readmission. Of the 5,503 readmissions within 30 days, 12% were considered unplanned.
Half of the readmissions were for noncardiovascular causes, including sepsis, respiratory failure, and major bleeding. Of those related to cardiovascular disease, about half, or nearly 25% of the total, were for heart failure.
The predictors of readmission included female sex, age older than 75 years, average length of stay longer than 10 days, and more than three comorbidities, such as diabetes or chronic kidney disease, according to Dr. Sud.
“Those sent home from the index admission were more likely than those discharged to an extended care facility to be readmitted,” he added. He also noted that lower socioeconomic status was a risk factor for readmission, a phenomenon that he attributed to access issues regarding follow-up care.
“We are now conducting a prospective study to look at readmissions at 6 months,” reported Dr. Sud, who believes that efforts to understand the risk of readmission following STEMI complicated by cardiogenic shock might uncover opportunities for better management.
WASHINGTON – and remain in hospital for an average of 6 days, according to an analysis from the National Readmission Database presented at CRT 2019 sponsored by MedStar Heart & Vascular Institute.
“About one in four of the readmissions was for heart failure,” reported Karan Sud, MD, a cardiology resident at the Mount Sinai St. Luke’s West Hospital, New York.
Despite gains in acute survival among STEMI patients in cardiogenic shock, little attention has been paid to the risk of readmissions, according to Dr. Sud. According to data collected from the National Readmissions Database for 2010-2014, these rates are high enough to deserve attention, he said.
“Our goal is now to develop a scoring system based on our predictive model to identify patients at the index admission who are at risk for readmission,” Dr. Sud reported. On the basis of these predictors, it might be possible to implement strategies to optimize management and improve access to care.
In the years studied, there were 94,991 patients with STEMI and cardiogenic shock captured in the National Readmissions Database, of whom 43,205 survived and were followed for readmission. Of the 5,503 readmissions within 30 days, 12% were considered unplanned.
Half of the readmissions were for noncardiovascular causes, including sepsis, respiratory failure, and major bleeding. Of those related to cardiovascular disease, about half, or nearly 25% of the total, were for heart failure.
The predictors of readmission included female sex, age older than 75 years, average length of stay longer than 10 days, and more than three comorbidities, such as diabetes or chronic kidney disease, according to Dr. Sud.
“Those sent home from the index admission were more likely than those discharged to an extended care facility to be readmitted,” he added. He also noted that lower socioeconomic status was a risk factor for readmission, a phenomenon that he attributed to access issues regarding follow-up care.
“We are now conducting a prospective study to look at readmissions at 6 months,” reported Dr. Sud, who believes that efforts to understand the risk of readmission following STEMI complicated by cardiogenic shock might uncover opportunities for better management.
REPORTING FROM CRT 2019