User login
Malnutrition leads to worse outcomes in frail elderly patients treated for PAD
Frailty increasingly has been seen as a factor in procedural outcomes, including vascular surgery. Nutrition factors among older adults have also become an issue of concern, and older adults undergoing interventions for peripheral arterial disease (PAD) may be at risk for malnutrition. At the Vascular Annual Meeting, Laura Drudi, MD, of McGill University, Montreal, reported on a study that she and her colleagues performed to determine the association between preprocedural nutritional status and all-cause mortality in patients being treated for PAD.
Dr. Drudi detailed their post hoc analysis of the FRAILED (Frailty Assessment in Lower Extremity arterial Disease) prospective cohort, which comprised two centers recruiting patients during July 1, 2015–Oct.1, 2016. Individuals who underwent vascular interventions for Rutherford class 3 or higher PAD were enrolled. Trained observers used the Mini Nutritional Assessment (MNA)–Short Form to assess the patients before their procedures. Scores less than or equal to 7 on a 14-point scale were considered malnourished, with scores of 8-11 indicated that patients were at risk for malnutrition.
The modified Essential Frailty Toolset (mEFT) was simultaneously used to measure frailty, with scores of 3 or less on a 5-point scale considered frail. The primary endpoint of the study was all-cause mortality at 12 months after the procedure. Results were available for a cohort of 148 patients (39.2% women) with a mean age of 70 years, and a mean body mass index of 26.7 kg/m2. Among these patients, 59 (40%) had claudication and 89 (60%) had chronic limb-threatening ischemia. A total of 98 (66%) patients underwent endovascular revascularization and 50 (34%) underwent open or hybrid revascularization.
Overall, 3% of subjects were classified as malnourished and 33% were at risk for malnutrition. There were 9 (6%) deaths at 12 months. Mini Nutritional Assessment–Short Form scores were modestly but significantly correlated with the mEFT scores (Pearson’s R = –0.48; P less than .001).
”We found that patients with malnourishment or at risk of malnourishment had a 2.5-fold higher crude 1-year mortality, compared with those with normal nutritional status,” said Dr. Drudi.
In the 41% of patients deemed frail, malnutrition was associated with all-cause mortality (adjusted odds ratio, 2.08 per point decrease in MNA scores); whereas in the nonfrail patients, MNA scores had little or no effect on mortality (adjusted OR, 1.05).
“Preprocedural nutritional status is associated with mortality in frail older adults undergoing interventions for PAD. Clinical trials are needed to determine whether pre- and postprocedural nutritional interventions can improve clinical outcomes in these vulnerable individuals,” Dr. Drudi concluded.

Modest cognitive changes deemed inherent in ‘normal’ aging
Interventions leading to improved gray matter volume tied to reducing dementia risk
CRYSTAL CITY, VA. – As technology advances and the population becomes older, clinicians should understand how modest age-related declines in cognition affect older adults’ ability to learn new technological skills, Philip D. Harvey, PhD, said at Focus on Neuropsychiatry presented by Current Psychiatry and the American Academy of Clinical Psychiatrists.
According to the U.S. Census Bureau, the number of adults in the United States above age 65 is slated to increase over the next several decades, and by 2030, one in five adults in the United States will be at retirement age. By 2050, “a significant number of people” in the United States are expected to be age 90, Dr. Harvey said at the meeting, presented by Global Academy for Medical Education.
“What we need to do is to understand what are the normal things that happen to people as they become 90 years of age,” said Dr. Harvey, of the department of psychiatry and behavioral sciences at the University of Miami.
Within the technology industry, significant advancements were made over the last 40 years with the advent of the personal computer in the 1980s, mobile phones in the 1990s, and wireless Internet, smartphones, and wireless devices in the 2000s. Many interactions that used to be person-to-person are now performed online, and it is feasible for a 90-year-old living today to never have encountered this technology during their careers. “Utilizing technology is a central requirement for independent living today,” Dr. Harvey said.
Most people passively adapt to these new changes in technology. However, Dr. Harvey noted that adults in their 80s and 90s who are retired can have difficulty using or learning about new technology as they age. “Human-technology interaction involves information processing, and places demands on memory and other cognitive abilities,” he said. “Age is associated with declines specifically in the kind of abilities that are required to master new technology.”
Learning about and using technology requires different elements of cognition that include different types of memory, such as working, episodic, declarative, procedural, semantic, long-term factual, and emotional. A decline in any of those kinds of memory could result in failures in forgetting, learning or recalling material, and learning new motor skills, among other problems. Crystallized intelligence is more likely to be retained over time, but fluid cognition in the form of processing speed, working and episodic memory, and the ability to solve abstract problems tend to decline over time as people age, Dr. Harvey said.
Base cognitive abilities do play a role in how crystallized and fluid cognition decline over time. For example, while vocabulary might increase as one ages, a person’s working memory, processing speed, and episodic memory decline over time. Evidence also suggests that speed training and exercise appear to improve cognition. (J Am Geriatr Soc. 13 Jan 2014. doi: 10.1111/jgs.12607).
Cyrus Raji, MD, PhD, and colleagues also explored the relationship between caloric expenditure and gray matter volume in the Cardiovascular Health Study, and found that exercise of various types improved gray matter volume and reduced the risk of dementia in people aged 65 or older. Furthermore, Dr. Raji and colleagues found, caloric expenditures, rather than intensity of exercise, may alone predict increases in gray matter volume (J Alzheimers Dis. 2016. doi: 10.3233/JAD-160057).
“If you want to improve your memory, grow your hippocampus,” Dr. Harvey said at the meeting.
Dr. Harvey reported serving as a consultant for Alkermes, Boehringer-Ingelheim, Lundbeck, Otsuka Digital Health, Sanofi, Sunovion Pharmaceuticals, Takeda, and Teva. He also reported receiving a grant from Takeda, and is the founder and CSO of i-Function.
Global Academy and this news organization are owned by the same parent company.
Interventions leading to improved gray matter volume tied to reducing dementia risk
Interventions leading to improved gray matter volume tied to reducing dementia risk
CRYSTAL CITY, VA. – As technology advances and the population becomes older, clinicians should understand how modest age-related declines in cognition affect older adults’ ability to learn new technological skills, Philip D. Harvey, PhD, said at Focus on Neuropsychiatry presented by Current Psychiatry and the American Academy of Clinical Psychiatrists.
According to the U.S. Census Bureau, the number of adults in the United States above age 65 is slated to increase over the next several decades, and by 2030, one in five adults in the United States will be at retirement age. By 2050, “a significant number of people” in the United States are expected to be age 90, Dr. Harvey said at the meeting, presented by Global Academy for Medical Education.
“What we need to do is to understand what are the normal things that happen to people as they become 90 years of age,” said Dr. Harvey, of the department of psychiatry and behavioral sciences at the University of Miami.
Within the technology industry, significant advancements were made over the last 40 years with the advent of the personal computer in the 1980s, mobile phones in the 1990s, and wireless Internet, smartphones, and wireless devices in the 2000s. Many interactions that used to be person-to-person are now performed online, and it is feasible for a 90-year-old living today to never have encountered this technology during their careers. “Utilizing technology is a central requirement for independent living today,” Dr. Harvey said.
Most people passively adapt to these new changes in technology. However, Dr. Harvey noted that adults in their 80s and 90s who are retired can have difficulty using or learning about new technology as they age. “Human-technology interaction involves information processing, and places demands on memory and other cognitive abilities,” he said. “Age is associated with declines specifically in the kind of abilities that are required to master new technology.”
Learning about and using technology requires different elements of cognition that include different types of memory, such as working, episodic, declarative, procedural, semantic, long-term factual, and emotional. A decline in any of those kinds of memory could result in failures in forgetting, learning or recalling material, and learning new motor skills, among other problems. Crystallized intelligence is more likely to be retained over time, but fluid cognition in the form of processing speed, working and episodic memory, and the ability to solve abstract problems tend to decline over time as people age, Dr. Harvey said.
Base cognitive abilities do play a role in how crystallized and fluid cognition decline over time. For example, while vocabulary might increase as one ages, a person’s working memory, processing speed, and episodic memory decline over time. Evidence also suggests that speed training and exercise appear to improve cognition. (J Am Geriatr Soc. 13 Jan 2014. doi: 10.1111/jgs.12607).
Cyrus Raji, MD, PhD, and colleagues also explored the relationship between caloric expenditure and gray matter volume in the Cardiovascular Health Study, and found that exercise of various types improved gray matter volume and reduced the risk of dementia in people aged 65 or older. Furthermore, Dr. Raji and colleagues found, caloric expenditures, rather than intensity of exercise, may alone predict increases in gray matter volume (J Alzheimers Dis. 2016. doi: 10.3233/JAD-160057).
“If you want to improve your memory, grow your hippocampus,” Dr. Harvey said at the meeting.
Dr. Harvey reported serving as a consultant for Alkermes, Boehringer-Ingelheim, Lundbeck, Otsuka Digital Health, Sanofi, Sunovion Pharmaceuticals, Takeda, and Teva. He also reported receiving a grant from Takeda, and is the founder and CSO of i-Function.
Global Academy and this news organization are owned by the same parent company.
REPORTING FROM FOCUS ON NEUROPSYCHIATRY 2019
Cognitive decline sped up after CHD
according to the results of a large prospective study with a median of 12 years of follow-up.
“We found that incident CHD was significantly associated with faster post–CHD-diagnosis cognitive decline, but not pre–CHD-diagnosis or short-term cognitive decline after the event,” Wuxiang Xie, PhD, of Peking University Health Science Center, Beijing, and associates wrote in the Journal of the American College of Cardiology. Linear mixed models showed that cognitive decline sped up during the year after incident CHD.
Past research had suggested a link between accelerated cognitive decline and CHD, but the temporal pattern of the relationship was unclear. For the study, Dr. Xie and associates followed 7,888 adults from the English Longitudinal Study of Aging who were an average of 62 years old and had no history of stroke, MI, angina, or dementia (Alzheimer’s disease or otherwise). All participants underwent a baseline cognitive assessment for verbal memory, semantic fluency, and temporal orientation, plus a median of six follow-up assessments.
In all, 480 (6%) participants developed CHD during follow-up. Their rate of cognitive decline remained constant before and immediately after their CHD diagnosis, but in subsequent years, they experienced significant accelerations in loss of global cognitive function, verbal memory, and temporal orientation even after accounting for time and many demographic and clinical variables. For example, the slope representing temporal change in global cognitive score decreased by a mean of 0.039 per year, compared with the pre-CHD slope (slope difference, –0.039; 95% confidence interval, –0.063 to –0.015; P =. 002). Semantic fluency also declined faster after CHD, but the difference, compared with before CHD, did not reach statistical significance (P = .11).
Individuals without CHD showed no such accelerations in cognitive decline throughout follow-up in adjusted models, the researchers wrote. “Based on repeated cognitive measurements over a long follow-up period, this study revealed a reliable and robust trajectory of cognitive decline [after CHD]. Future studies are warranted to determine the precise mechanisms linking incident CHD to cognitive decline.”
Funders included the National Natural Science Foundation of China, the Beijing Natural Science Foundation, and the Newton International Fellowship from the Academy of Medical Sciences. The researchers reported having no relevant financial disclosures.
SOURCE: Xie W et al. J Amer Coll Cardiol. 2019 Jun 17. doi: 10.1016/j.jacc.2019.04.019.
The findings “highlight the role of cardiovascular risk factors and cardiovascular health as crucial determinants of cognitive trajectories in later life,” wrote Suvi P. Rovio, PhD; Katja Pahkala, PhD; and Olli T. Raitakari, MD, PhD. For example, accelerated declines in verbal memory might indicate a specific vulnerability to vascular changes within the medial temporal lobe and hippocampus.
The fact that cognitive decline did not accelerate immediately after coronary heart disease suggests that CHD itself does not acutely alter the brain, such as by causing microinfarcts, they commented. Instead, CHD might induce longer-term shifts in cerebral vascular function by affecting the blood-brain barrier or perfusion and oxidation in the brain. While these complex relationships need further untangling, the study suggests interventions that cut CHD risk also might help prevent cognitive decline itself and slow the rate of cognitive decline if it occurs.
Dr. Rovio, Dr. Pahkala, and Dr. Raitakari are at the University of Turku (Finland) and Turku University Hospital. These comments are adapted from an editorial accompanying the article by Xie et al. (J Amer Coll Cardiol. 2019 Jun 17. doi: 10.1016/j.jacc.2019.04.020). They reported having no relevant financial disclosures.
according to the results of a large prospective study with a median of 12 years of follow-up.
“We found that incident CHD was significantly associated with faster post–CHD-diagnosis cognitive decline, but not pre–CHD-diagnosis or short-term cognitive decline after the event,” Wuxiang Xie, PhD, of Peking University Health Science Center, Beijing, and associates wrote in the Journal of the American College of Cardiology. Linear mixed models showed that cognitive decline sped up during the year after incident CHD.
Past research had suggested a link between accelerated cognitive decline and CHD, but the temporal pattern of the relationship was unclear. For the study, Dr. Xie and associates followed 7,888 adults from the English Longitudinal Study of Aging who were an average of 62 years old and had no history of stroke, MI, angina, or dementia (Alzheimer’s disease or otherwise). All participants underwent a baseline cognitive assessment for verbal memory, semantic fluency, and temporal orientation, plus a median of six follow-up assessments.
In all, 480 (6%) participants developed CHD during follow-up. Their rate of cognitive decline remained constant before and immediately after their CHD diagnosis, but in subsequent years, they experienced significant accelerations in loss of global cognitive function, verbal memory, and temporal orientation even after accounting for time and many demographic and clinical variables. For example, the slope representing temporal change in global cognitive score decreased by a mean of 0.039 per year, compared with the pre-CHD slope (slope difference, –0.039; 95% confidence interval, –0.063 to –0.015; P =. 002). Semantic fluency also declined faster after CHD, but the difference, compared with before CHD, did not reach statistical significance (P = .11).
Individuals without CHD showed no such accelerations in cognitive decline throughout follow-up in adjusted models, the researchers wrote. “Based on repeated cognitive measurements over a long follow-up period, this study revealed a reliable and robust trajectory of cognitive decline [after CHD]. Future studies are warranted to determine the precise mechanisms linking incident CHD to cognitive decline.”
Funders included the National Natural Science Foundation of China, the Beijing Natural Science Foundation, and the Newton International Fellowship from the Academy of Medical Sciences. The researchers reported having no relevant financial disclosures.
SOURCE: Xie W et al. J Amer Coll Cardiol. 2019 Jun 17. doi: 10.1016/j.jacc.2019.04.019.
FROM THE JOURNAL OF THE AMERICAN COLLEGE OF CARDIOLOGY
Consider drug treatment in late-life women with osteoporosis
and therefore have more to gain from osteoporosis treatment, regardless of the presence of any comorbidities, according to a new study.
To determine how and when to treat older women for osteoporosis, Kristine E. Ensrud, MD, of the University of Minnesota, Minneapolis, and coauthors studied active surviving participants in the Study of Osteoporotic Fractures. The cohort comprised 1,528 women who met criteria for either osteoporosis (n = 761) or without osteoporosis but at high fracture risk (n = 767). Mean age at the time of examination was 84 years and mean femoral neck bone mineral density (BMD) T-score was −2.24.
During an average follow-up period of 4.4 years after initial examination, 125 women (9%) experienced a hip fracture and 287 (19%) died without experiencing that outcome. The 5-year absolute probability of mortality was 25% (95% confidence interval, 21.8%-28.1%) in women with osteoporosis and 19% (95% CI, 16.6%-22.3%) in women without osteoporosis but at high fracture risk. Although both groups saw mortality probability increase with more comorbidities and poorer prognosis, 5-year hip fracture probability was 13% (95% CI, 10.7%-15.5%) among women with osteoporosis and 4% (95% CI, 2.8%-5.6%) among women without osteoporosis but at high fracture risk.
This probability of the women with osteoporosis experiencing a hip fracture, “even after considering their competing mortality risk” suggests that “initiation of drug treatment in late-life women with osteoporosis may still be effective in the prevention of subsequent hip fracture,” the researchers wrote in JAMA Internal Medicine.
Dr. Ensrud and associates acknowledged their study’s limitations, including the cohort being made up of community-dwelling white women and thus the results not being generalizable to men or women of other racial or ethnic groups. But the researchers noted that the mean femoral neck BMD of women in the study “was essentially identical to that of a nationally representative sample of community-dwelling women 80 years and older enrolled in the 2005 to 2008 NHANES [National Health and Nutrition Examination Survey].”
Dr. Cynthia M. Boyd reported receiving royalties from UpToDate and a grant from the National Institutes of Aging Dr. Katie L. Stone reported receiving grant support from Merck, and Dr. Lisa Langsetmo reported receiving grants from the National Institutes of Health and Merck. No other authors reported any relevant financial disclosures. The Study of Osteoporotic Fractures was supported by NIH and grants from NIA.
SOURCE: Ensrud KE et al. JAMA Intern Med. 2019 Jun 17. doi: 10.1001/jamainternmed.2019.0682.
Older patients with osteoporosis with multimorbidities are the most at risk for hip fractures, which should place an emphasis on research into their treatment, Sarah D. Berry, MD, MPH; Sandra Shi, MD; and Douglas P. Kiel, MD, MPH, of Harvard Medical School, Boston, wrote in an invited commentary.
The coauthors noted that the study by Ensrud et al. is of “great clinical importance, given the ongoing recognition that clinical guidelines should consider multimorbidity.” Currently, the guidelines for treating osteoporosis do not consider age, comorbidities, or frailty, but this study indicates that older women can see benefits from treatment.
They also acknowledged the value of patient preference, referencing a study where 80% of older women “would prefer death as opposed to a hip fracture leading to institutionalization.” All in all, the work of Ensrud et al. is a reminder of “the dangers in ignoring the problem” and the need for future guidelines in osteoporosis treatment to address osteoporosis treatment for older patients with multimorbidity.
These comments are adapted from an invited commentary accompanying the article by Ensrud et al. (JAMA Intern Med. 2019 Jun 17. doi: 10.1001/jamainternmed.2019.0688 ). Dr. Berry reported receiving royalties from UpToDate outside the submitted work. Dr. Kiel reported receiving royalties from UpToDate, along with grants from the Dairy Council and Radius Health, and personal fees from Springer outside the submitted work. Dr. Shi reported no relevant financial disclosures. No funding for this editorial was reported.
and therefore have more to gain from osteoporosis treatment, regardless of the presence of any comorbidities, according to a new study.
To determine how and when to treat older women for osteoporosis, Kristine E. Ensrud, MD, of the University of Minnesota, Minneapolis, and coauthors studied active surviving participants in the Study of Osteoporotic Fractures. The cohort comprised 1,528 women who met criteria for either osteoporosis (n = 761) or without osteoporosis but at high fracture risk (n = 767). Mean age at the time of examination was 84 years and mean femoral neck bone mineral density (BMD) T-score was −2.24.
During an average follow-up period of 4.4 years after initial examination, 125 women (9%) experienced a hip fracture and 287 (19%) died without experiencing that outcome. The 5-year absolute probability of mortality was 25% (95% confidence interval, 21.8%-28.1%) in women with osteoporosis and 19% (95% CI, 16.6%-22.3%) in women without osteoporosis but at high fracture risk. Although both groups saw mortality probability increase with more comorbidities and poorer prognosis, 5-year hip fracture probability was 13% (95% CI, 10.7%-15.5%) among women with osteoporosis and 4% (95% CI, 2.8%-5.6%) among women without osteoporosis but at high fracture risk.
This probability of the women with osteoporosis experiencing a hip fracture, “even after considering their competing mortality risk” suggests that “initiation of drug treatment in late-life women with osteoporosis may still be effective in the prevention of subsequent hip fracture,” the researchers wrote in JAMA Internal Medicine.
Dr. Ensrud and associates acknowledged their study’s limitations, including the cohort being made up of community-dwelling white women and thus the results not being generalizable to men or women of other racial or ethnic groups. But the researchers noted that the mean femoral neck BMD of women in the study “was essentially identical to that of a nationally representative sample of community-dwelling women 80 years and older enrolled in the 2005 to 2008 NHANES [National Health and Nutrition Examination Survey].”
Dr. Cynthia M. Boyd reported receiving royalties from UpToDate and a grant from the National Institutes of Aging Dr. Katie L. Stone reported receiving grant support from Merck, and Dr. Lisa Langsetmo reported receiving grants from the National Institutes of Health and Merck. No other authors reported any relevant financial disclosures. The Study of Osteoporotic Fractures was supported by NIH and grants from NIA.
SOURCE: Ensrud KE et al. JAMA Intern Med. 2019 Jun 17. doi: 10.1001/jamainternmed.2019.0682.
FROM JAMA INTERNAL MEDICINE
Key clinical point: Medical treatment to prevent osteoporotic hip fracture in women over age 80 likely is worthwhile.
Major finding: Five-year hip fracture probability was 13% among women with osteoporosis and 4% among women without osteoporosis but at high fracture risk.
Study details: A prospective cohort study of 1,528 women 80 years and older who were potential candidates for osteoporosis drug treatment.
Disclosures: Dr. Cynthia M. Boyd reported receiving royalties from UpToDate and a grant from the National Institutes of Aging Dr. Katie L. Stone reported receiving grant support from Merck, and Dr. Lisa Langsetmo reported receiving grants from the National Institutes of Health and Merck. No other authors reported any relevant financial disclosures. The Study of Osteoporotic Fractures was supported by NIH and grants from NIA.
Source: Ensrud KE et al. JAMA Intern Med. 2019 Jun 17. doi: 10.1001/jamainternmed.2019.0682.
LTC-associated suicide among older adults more common than previously thought
The rate of suicide associated with residential long-term care (LTC) in adults aged 55 years and older may be significantly higher than the injury location coding of the National Violent Death Reporting System (NVDRS) suggests, according to new research.

The Centers for Disease Control and Prevention reports that there are about 16,000 nursing homes and 31,000 assisted living facilities in the United States and they currently house about 25% of all Medicare beneficiaries. “As such, residential LTC may be a potential location for identifying individuals at high risk of self-harm and for implementing interventions to reduce suicide risk, wrote Briana Mezuk, PhD, and associates from the University of Michigan, Ann Arbor. The study was published in JAMA Network Open.
Dr. Mezuk and colleagues conducted a cross-sectional, epidemiologic study using a natural language–processing algorithm to analyze restricted-access data from the NVDRS between 2003 and 2015. A total of 47,759 suicides and undetermined deaths in adults aged 55 years and older from 27 states were included in the analysis (median age, 64 years; 77.6% male; 90.0% non-Hispanic white).
The algorithm identified 1,037 (2.2% of the total) suicide deaths associated with LTC, with 428 occurring in adults living in LTC, 449 occurring during the transition into or out of LTC, and 160 otherwise associated with LTC. Decedents in this group had a median age of 79 years, were 73.8% male, and were 94.3% non-Hispanic white. The number of suicide deaths varied widely from year to year, but no trend was found in the change over the study period.
Deaths while living in LTC were more likely among women, which the investigators noted is to be expected because LTC residents are disproportionately women. Death while transitioning into or out of LTC was more likely among adults who previously had expressed suicide ideation and had a physical health problem cited as a contributing circumstance. Death otherwise associated with LTC was more likely in adults who were married or in a relationship, had a depressed mood, and had a recent crisis cited as a contributing factor.
“Living in LTC or transitioning to LTC is also correlated with a host of characteristics that are established risk factors for suicide,” the investigators noted.
In further analysis, the investigators compared the number of suicide deaths the algorithm identified as occurring within an LTC facility (n = 428) with the injury location code SRF (supervised residential facility; n = 263) and the death location code LTC/nursing home (n = 567) within the NVDRS. Of the 263 SRF injuries, 106 were identified as occurring within a LTC facility by the algorithm. The agreement between the algorithm and the SRF coding was poor (kappa statistic, 0.30; 95% confidence interval, 0.26-0.35).
“Leaders in the field have continued to call for a shift away from a medicalized paradigm of residential LTC toward institutional practices that instead focus on fostering meaningful interactions between residents, promote engagement in care, and enhance quality of life. In addition, existing, scalable programs that support older adults living in the community offer the potential to promote quality of life for older adults who may be considering transitioning into or out of residential LTC,” the investigators concluded. “These findings emphasize the importance of such efforts for the mental health of older adults.”
The study was supported by a grant from the National Institute of Mental Health. The investigators reported no conflicts of interest.
SOURCE: Mezuk B et al. JAMA Netw Open. 2019 Jun 14. doi: 10.1001/jamanetworkopen.2019.5627.
Filling the gap in knowledge about the consequences of transitioning into long-term care is sorely needed, wrote Yoram Barak, MD, MHA, and Chris Gale, MB,ChB, MPH, given that fewer than 20 studies on the subject have been published in the past 30 years. A 2015 systematic review of nursing home suicides included only eight studies and 101 suicide deaths.
Despite the limits of an epidemiologic study on long-term care in elderly adults, such as the significant differences between elderly populations in America and other countries, this study by Mezuk et al. provides useful information on a longer period of time than would be possible with case-control studies and at a more granular level than data that would be available from national case registers, Dr. Barak and Dr. Gale wrote.
Dr. Barak and Dr. Gale are with the department of psychological medicine at the University of Otago in Dunedin, New Zealand. They made these comments in an editorial published in JAMA Network Open (2019 Jun 14. doi: 10.1001/jamanetworkopen.2019.5634). They did not report any conflicts of interest.
The rate of suicide associated with residential long-term care (LTC) in adults aged 55 years and older may be significantly higher than the injury location coding of the National Violent Death Reporting System (NVDRS) suggests, according to new research.
The Centers for Disease Control and Prevention reports that there are about 16,000 nursing homes and 31,000 assisted living facilities in the United States and they currently house about 25% of all Medicare beneficiaries. “As such, residential LTC may be a potential location for identifying individuals at high risk of self-harm and for implementing interventions to reduce suicide risk, wrote Briana Mezuk, PhD, and associates from the University of Michigan, Ann Arbor. The study was published in JAMA Network Open.
Dr. Mezuk and colleagues conducted a cross-sectional, epidemiologic study using a natural language–processing algorithm to analyze restricted-access data from the NVDRS between 2003 and 2015. A total of 47,759 suicides and undetermined deaths in adults aged 55 years and older from 27 states were included in the analysis (median age, 64 years; 77.6% male; 90.0% non-Hispanic white).
The algorithm identified 1,037 (2.2% of the total) suicide deaths associated with LTC, with 428 occurring in adults living in LTC, 449 occurring during the transition into or out of LTC, and 160 otherwise associated with LTC. Decedents in this group had a median age of 79 years, were 73.8% male, and were 94.3% non-Hispanic white. The number of suicide deaths varied widely from year to year, but no trend was found in the change over the study period.
Deaths while living in LTC were more likely among women, which the investigators noted is to be expected because LTC residents are disproportionately women. Death while transitioning into or out of LTC was more likely among adults who previously had expressed suicide ideation and had a physical health problem cited as a contributing circumstance. Death otherwise associated with LTC was more likely in adults who were married or in a relationship, had a depressed mood, and had a recent crisis cited as a contributing factor.
“Living in LTC or transitioning to LTC is also correlated with a host of characteristics that are established risk factors for suicide,” the investigators noted.
In further analysis, the investigators compared the number of suicide deaths the algorithm identified as occurring within an LTC facility (n = 428) with the injury location code SRF (supervised residential facility; n = 263) and the death location code LTC/nursing home (n = 567) within the NVDRS. Of the 263 SRF injuries, 106 were identified as occurring within a LTC facility by the algorithm. The agreement between the algorithm and the SRF coding was poor (kappa statistic, 0.30; 95% confidence interval, 0.26-0.35).
“Leaders in the field have continued to call for a shift away from a medicalized paradigm of residential LTC toward institutional practices that instead focus on fostering meaningful interactions between residents, promote engagement in care, and enhance quality of life. In addition, existing, scalable programs that support older adults living in the community offer the potential to promote quality of life for older adults who may be considering transitioning into or out of residential LTC,” the investigators concluded. “These findings emphasize the importance of such efforts for the mental health of older adults.”
The study was supported by a grant from the National Institute of Mental Health. The investigators reported no conflicts of interest.
SOURCE: Mezuk B et al. JAMA Netw Open. 2019 Jun 14. doi: 10.1001/jamanetworkopen.2019.5627.
FROM JAMA NETWORK OPEN
Key clinical point: Suicide associated with long-term care may be more common than previous data have indicated.
Major finding: About 2.2% of the suicide deaths reported to the National Violent Death Reporting System occurred or were associated with long-term care.
Study details: An analysis of 47,759 suicides and undetermined deaths in adults aged at least 55 years with data included in the National Violent Death Reporting System.Disclosures: The study was supported by a grant from the National Institute of Mental Health. The investigators reported no conflicts of interest.
Source: Mezuk B et al. JAMA Netw Open. 2019 Jun 14. doi: 10.1001/jamanetworkopen.2019.5627.
Opposing cost trends seen for prescribed medications
according to the Agency for Healthcare Research and Quality.
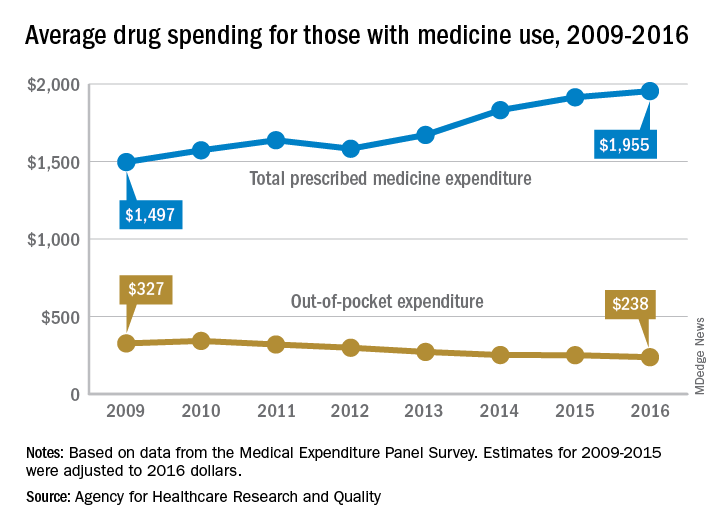
The average expenditure among persons who used at least one prescription drug went from $1,497 per individual in 2009 to $1,955 in 2016, for an increase of almost 31%. These cost figures cover medications obtained in outpatient settings only and “include the amount paid out of pocket plus any third-party payments from health insurance or other sources,” the AHRQ said.
When out-of-pocket spending for drugs obtained in outpatient settings was considered separately, the average per-person cost dropped by 27%, going from $327 per person with use in 2009 to $238 in 2016, the AHRQ researchers reported.
Over that time period, both total and out-of-pocket costs were considerably and consistently higher for those aged 65 years and older than for those under 65. In 2016, total spending was $3,288 each for elderly persons with at least one prescribed drug purchase and $1,539 for those under age 65, with respective out-of-pocket costs of $401 and $188, they said.
The AHRQ analysis was based on data from the Medical Expenditure Panel Survey, and expenditures for 2009-2015 were adjusted to 2016 dollars.
according to the Agency for Healthcare Research and Quality.
The average expenditure among persons who used at least one prescription drug went from $1,497 per individual in 2009 to $1,955 in 2016, for an increase of almost 31%. These cost figures cover medications obtained in outpatient settings only and “include the amount paid out of pocket plus any third-party payments from health insurance or other sources,” the AHRQ said.
When out-of-pocket spending for drugs obtained in outpatient settings was considered separately, the average per-person cost dropped by 27%, going from $327 per person with use in 2009 to $238 in 2016, the AHRQ researchers reported.
Over that time period, both total and out-of-pocket costs were considerably and consistently higher for those aged 65 years and older than for those under 65. In 2016, total spending was $3,288 each for elderly persons with at least one prescribed drug purchase and $1,539 for those under age 65, with respective out-of-pocket costs of $401 and $188, they said.
The AHRQ analysis was based on data from the Medical Expenditure Panel Survey, and expenditures for 2009-2015 were adjusted to 2016 dollars.
Does Vitamin D Supplementation Improve Lower Extremity Power and Function in Community-Dwelling Older Adults?
Study Overview
Objective. To test the effect of 12 months of vitamin D supplementation on lower-extremity power and function in older community-dwelling adults screened for low serum 25-hydroxyvitamin D (25(OH)D).
Design. A single-center, double-blind, randomized placebo-controlled study in which participants were assigned to 800 IU of vitamin D3 supplementation or placebo daily and were followed over a total period of 12 months.
Setting and participants. A total of 100 community-dwelling men and women aged ≥ 60 years with serum 25(OH)D ≤ 20 ng/mL at screening participated. Participants were prescreened by phone, and were excluded if they met any of the following exclusion criteria: vitamin D supplement use > 600 IU/day (for age 60-70 years) or > 800 IU/day (for age ≥ 71 years); vitamin D injection within the previous 3 months; > 2 falls or 1 fall with injury in past year; use of cane, walker, or other indoor walking aid; history of kidney stones within past 3 years; hypercalcemia (serum calcium > 10.8 mg/dL); renal dysfunction (glomerular filtration rate, < 30 mL/min); history of liver disease, sarcoidosis, lymphoma, dysphagia, or other gastrointestinal disorder; neuromuscular disorder affecting lower-extremity function; hip replacement within the past year; cancer treatment in the past 3 years; treatment with thiazide diuretics > 37.5 mg, teriparatide, denosumab, or bisphosphonates within the past 2 years; oral steroids (for > 3 weeks in the past 6 months); and use of fat malabsorption products or anticonvulsive therapy.
Main outcome measures. The primary outcome was leg extensor power assessed using a computer-interfaced bilateral Keiser pneumatic leg press. Secondary outcomes to measure physical function included: (1) backward tandem walk test (which is an indicator of balance and postural control during movement1); (2) Short Physical Performance Battery (SPPB) testing, which includes a balance assessment (ability to stand with feet positioned normally, semi-tandem, and tandem for 10s), a timed 4-m walk, and a chair stand test (time to complete 5 repeated chair stands); (3) stair climbing (ie, time to climb 10 steps, as a measure of knee extensor strength and functional capacity); and (4) handgrip strength (using a dynamometer). Lean tissue mass was assessed by dual X-ray absorptiometry (DEXA scan). Finally, other measures included serum total 25(OH)D levels measured at baseline, 4, 8, and 12 months, as well as 24-hour urine collection for urea-nitrogen and creatinine measurements.
Main results. Of the 2289 individuals screened for the study, 100 met eligibility criteria and underwent randomization to receive either 800 IU vitamin D supplementation daily (n = 49) or placebo (n = 51). Three patients (2 in vitamin D group and 1 in placebo group) were lost to follow up. The mean age of all participants was 69.6 ± 6.9 years. In the vitamin D group versus the control group, respectively, the percent male: female ratio was 66:34 versus 63:37, and percent Caucasian was 75% versus 82%. Mean body mass index was 28.2 ± 7.0 and mean serum 25(OH)D was 20.2 ± 6.7 ng/mL. At the end of the study (12 months), 70% of participants given vitamin D supplementation had 25(OH)D levels ≥ 30 ng/mL and all participants had levels ≥ 20 ng/mL. In the placebo group, the serum 25(OH)D level was ≥ 20 ng/mL in 54% and ≥ 30 ng/mL in 6%. The mean serum 25(OH)D level increased to 32.5 ± 5.1 ng/mL in the vitamin D–supplemented group, but no significant change was found in the placebo group (treatment × time, P < 0.001). Overall, the serum 1,25 (OH)2D3 levels did not differ between the 2 groups over the intervention period (time, P = 0.49; treatment × time, P = 0.27). Dietary intake of vitamin D, calcium, nitrogen, and protein did not differ or change over time between the 2 groups. The change in leg press power, function, and strength did not differ between the groups over 12 months (all treatment × time, P values ≥ 0.60). A total of 27 falls were reported (14 in vitamin D versus 9 in control group), of which 9 were associated with injuries. There was no significant change in lean body mass at the end of the study period in either group (treatment × time, P = 0.98).
Conclusion. In community-dwelling older adults with vitamin D deficiency (≤ 20 ng/mL), 12-month daily supplementation with 800 IU of vitamin D3 resulted in sufficient increases in serum 25(OH)D levels, but did not improve lower-extremity power, strength, or lean mass.
Commentary
Vitamin D deficiency is common in older adults (prevalence of about 41% in US adults ≥ 65 years old, according to Forrest et al2) and is likely due to dietary deficiency, reduced sun exposure (lifestyle), and decreased intestinal calcium absorption. As such, vitamin D deficiency has historically been a topic of debate and of interest in geriatric medicine, as it relates to muscle weakness, which in turn leads to increased susceptibility to falls.3 Interestingly, vitamin D receptors are expressed in human skeletal muscle,4 and in one study, 3-month supplementation of vitamin D led to an increase in type II skeletal muscle fibers in older women.5 Similarly, results from a meta-analysis of 5 randomized controlled trials (RCTs)6 showed that vitamin D supplementation may reduce fall risk in older adults by 22% (corrected odds ratio, 0.78; 95% confidence interval, 0.64-0.92). Thus, in keeping with this general theme of vitamin D supplementation yielding beneficial effects in clinical outcomes, clinicians have long accepted and practiced routine vitamin D supplementation in caring for older adults.
In more recent years, the role of vitamin D supplementation in primary care has become controversial,7 as observed in a recent paradigm shift of moving away from routine supplementation for fall and fracture prevention in clinical practice.8 In a recent meta-analysis of 33 RCTs in older community-dwelling adults, supplementation with vitamin D with or without calcium did not result in a reduction of hip fracture or total number of fractures.9 Moreover, the United States Preventive Services Task Force (USPSTF) recently published updated recommendations on the use of vitamin D supplementation for primary prevention of fractures10 and prevention of falls11 in community-dwelling adults. In these updated recommendations, the USPSTF indicated that insufficient evidence exists to re
Vitamin D supplementation is no longer routinely recommended for fall and fracture prevention. However, if we believe that poor lower extremity muscle strength is a risk factor for falls,12 then the question of whether vitamin D has a beneficial role in improving lower extremity strength in older adults needs to be addressed. Results regarding the effect of vitamin D supplementation on muscle function have so far been mixed. For example, in a randomized, double-blinded, placebo-controlled trial of 160 postmenopausal women with low vitamin D level (< 20 ng/mL), vitamin D3 supplementation at 1000 IU/day for 9 months showed a significant increase in lower extremity muscle strength.13 However, in another randomized double-blinded, placebo-controlled trial of 130 men aged 65 to 90 years with low vitamin D level (< 30 ng/mL) and an SPPB score of ≤ 9 (mild-moderate limitation in mobility), daily supplementation with 4000 IU of vitamin D3 for 9 months did not result in improved SPPB score or gait speed.14 In the study reported by Shea et al, the authors showed that 800 IU of daily vitamin D supplementation (consistent with the Institute of Medicine [IOM] recommendations for older adults15) in community-dwelling older adults with vitamin D deficiency (< 20 ng/mL) did not improve lower extremity muscle strength. This finding is significant in that it adds further evidence to support the rationale against using vitamin D supplementation for the sole purpose of improving lower extremity muscle function in older adults with vitamin D deficiency.
Valuable strengths of this study include its randomized, double-blinded, placebo-controlled trial design testing the IOM recommended dose of daily vitamin D supplementation for older adults. In addition, compared to some of the prior studies mentioned above, the study population included both males and females, although the final study population resulted in some gender bias (with male predominance). Moreover, participants were followed for a sufficient amount of time (1 year), with an excellent adherence rate (only 3 were lost to follow-up) and with corresponding improvement in vitamin D levels. Finally, the use of SPPB as a readout for primary outcome should also be commended, as this assessment is a well-validated method for measuring lower extremity function with scaled scores that predict poor outcomes.16 However, some limitations include the aforementioned predominance of male participants and Caucasian race in both intervention and control groups, as well as discrepancies between the measurement methods for serum vitamin D levels (ie, finger-stick cards versus clinical lab measurement) that may have underestimated the actual serum 25(OH)D levels.
Applications for Clinical Practice
While the null findings from the Shea and colleagues study are applicable to healthier community-dwelling older adults, they may not be generalizable to the care of more frail older patients due to their increased risks for falls and high vulnerability to adverse outcomes. Thus, further studies that account for baseline sarcopenia, frailty, and other fall-risk factors (eg, polypharmacy) are needed to better evaluate the value of vitamin D supplementation in this most vulnerable population.
— Caroline Park, MD, PhD, and Fred Ko, MD
Icahn School of Medicine at Mount Sinai, New York, NY
1. Husu P, Suni J, Pasanen M, Miilunpalo S. Health-related fitness tests as predictors of difficulties in long-distance walking among high-functioning older adults. Aging Clin Exp Res. 2007;19:444-450.
2. Forrest KYZ, Stuhldreher WL. Prevalence and correlates of vitamin D deficiency in US adults. Nutr Res. 2011;31:48-54.
3. Bischoff-Ferrari HA, Giovannucci E, Willett WC, et al. Estimation of optimal serum concentrations of 25-hydroxyvitamin D for multiple health outcomes. Am J Clin Nutr. 2006;84:1253.
4. Simpson RU, Thomas GA, Arnold AJ. Identification of 1,25-dihydroxyvitamin-D3 receptors and activities in muscle. J Biol Chem. 1985;260:8882-8891.
5. Sorensen OH, Lund BI, Saltin B, et al. Myopathy in bone loss ofaging - improvement by treatment with 1alpha-hydroxycholecalciferol and calcium. Clinical Science. 1979;56:157-161.
6. Bischoff-Ferrari HA, Dawson-Hughes B, Willett WC, et al. Effect of vitamin D on falls - A meta-analysis. JAMA. 2004;291:1999-2006.
7. Lewis JR SM, Daly RM. The vitamin D and calcium controversy: an update. Curr Opin Rheumatol. 2019;31:91-97.
8. Schwenk T. No value for routine vitamin D supplementation. NEJM Journal Watch. December 26, 2018.
9. Zhao JG, Zeng XT, Wang J, Liu L. Association between calcium or vitamin D supplementation and fracture incidence in community-dwelling older adults: a systematic review and meta-analysis. JAMA. 2017;318:2466-2482.
10. Grossman DC, Curry SJ, Owens DK, et al. Vitamin D, calcium, or combined supplementation for the primary prevention of fractures in community-dwelling adults US Preventive Services Task Force Recommendation Statement. JAMA. 2018;319:1592-1599.
11. Grossman DC, Curry SJ, Owens DK, et al. Interventions to prevent falls in community-dwelling older adults US Preventive Services Task Force Recommendation Statement. JAMA. 2018;319:1696-1704.
12. Tinetti ME, Speechley M, Ginter SF. Risk-factors for falls among elderly persons living in the community. N Engl J Med. 1988;319:1701-1707.
13. Cangussu LM, Nahas-Neto J, Orsatti CL, et al. Effect of vitamin D supplementation alone on muscle function in postmenopausal women: a randomized, double-blind, placebo-controlled clinical trial. Osteoporos Int. 2015;26:2413-2421.
14. Levis S, Gomez-Marin O. Vitamin D and physical function in sedentary older men. J Am Geriatr Soc. 2017;65:323-331.
15. Ross CA TC, Yaktine AL, Del Valle HB. Institute of Medicine (US) Committee to Review Dietary Reference Intakes for Vitamin D and Calcium. National Academies Press. 2011.
16. Guralnik JM, Ferrucci L, Simonsick EM, et al. Lower-extremity function in persons over the age of 70 years as a predictor of subsequent disability. N Engl J Med. 1995;332:556-561
Study Overview
Objective. To test the effect of 12 months of vitamin D supplementation on lower-extremity power and function in older community-dwelling adults screened for low serum 25-hydroxyvitamin D (25(OH)D).
Design. A single-center, double-blind, randomized placebo-controlled study in which participants were assigned to 800 IU of vitamin D3 supplementation or placebo daily and were followed over a total period of 12 months.
Setting and participants. A total of 100 community-dwelling men and women aged ≥ 60 years with serum 25(OH)D ≤ 20 ng/mL at screening participated. Participants were prescreened by phone, and were excluded if they met any of the following exclusion criteria: vitamin D supplement use > 600 IU/day (for age 60-70 years) or > 800 IU/day (for age ≥ 71 years); vitamin D injection within the previous 3 months; > 2 falls or 1 fall with injury in past year; use of cane, walker, or other indoor walking aid; history of kidney stones within past 3 years; hypercalcemia (serum calcium > 10.8 mg/dL); renal dysfunction (glomerular filtration rate, < 30 mL/min); history of liver disease, sarcoidosis, lymphoma, dysphagia, or other gastrointestinal disorder; neuromuscular disorder affecting lower-extremity function; hip replacement within the past year; cancer treatment in the past 3 years; treatment with thiazide diuretics > 37.5 mg, teriparatide, denosumab, or bisphosphonates within the past 2 years; oral steroids (for > 3 weeks in the past 6 months); and use of fat malabsorption products or anticonvulsive therapy.
Main outcome measures. The primary outcome was leg extensor power assessed using a computer-interfaced bilateral Keiser pneumatic leg press. Secondary outcomes to measure physical function included: (1) backward tandem walk test (which is an indicator of balance and postural control during movement1); (2) Short Physical Performance Battery (SPPB) testing, which includes a balance assessment (ability to stand with feet positioned normally, semi-tandem, and tandem for 10s), a timed 4-m walk, and a chair stand test (time to complete 5 repeated chair stands); (3) stair climbing (ie, time to climb 10 steps, as a measure of knee extensor strength and functional capacity); and (4) handgrip strength (using a dynamometer). Lean tissue mass was assessed by dual X-ray absorptiometry (DEXA scan). Finally, other measures included serum total 25(OH)D levels measured at baseline, 4, 8, and 12 months, as well as 24-hour urine collection for urea-nitrogen and creatinine measurements.
Main results. Of the 2289 individuals screened for the study, 100 met eligibility criteria and underwent randomization to receive either 800 IU vitamin D supplementation daily (n = 49) or placebo (n = 51). Three patients (2 in vitamin D group and 1 in placebo group) were lost to follow up. The mean age of all participants was 69.6 ± 6.9 years. In the vitamin D group versus the control group, respectively, the percent male: female ratio was 66:34 versus 63:37, and percent Caucasian was 75% versus 82%. Mean body mass index was 28.2 ± 7.0 and mean serum 25(OH)D was 20.2 ± 6.7 ng/mL. At the end of the study (12 months), 70% of participants given vitamin D supplementation had 25(OH)D levels ≥ 30 ng/mL and all participants had levels ≥ 20 ng/mL. In the placebo group, the serum 25(OH)D level was ≥ 20 ng/mL in 54% and ≥ 30 ng/mL in 6%. The mean serum 25(OH)D level increased to 32.5 ± 5.1 ng/mL in the vitamin D–supplemented group, but no significant change was found in the placebo group (treatment × time, P < 0.001). Overall, the serum 1,25 (OH)2D3 levels did not differ between the 2 groups over the intervention period (time, P = 0.49; treatment × time, P = 0.27). Dietary intake of vitamin D, calcium, nitrogen, and protein did not differ or change over time between the 2 groups. The change in leg press power, function, and strength did not differ between the groups over 12 months (all treatment × time, P values ≥ 0.60). A total of 27 falls were reported (14 in vitamin D versus 9 in control group), of which 9 were associated with injuries. There was no significant change in lean body mass at the end of the study period in either group (treatment × time, P = 0.98).
Conclusion. In community-dwelling older adults with vitamin D deficiency (≤ 20 ng/mL), 12-month daily supplementation with 800 IU of vitamin D3 resulted in sufficient increases in serum 25(OH)D levels, but did not improve lower-extremity power, strength, or lean mass.
Commentary
Vitamin D deficiency is common in older adults (prevalence of about 41% in US adults ≥ 65 years old, according to Forrest et al2) and is likely due to dietary deficiency, reduced sun exposure (lifestyle), and decreased intestinal calcium absorption. As such, vitamin D deficiency has historically been a topic of debate and of interest in geriatric medicine, as it relates to muscle weakness, which in turn leads to increased susceptibility to falls.3 Interestingly, vitamin D receptors are expressed in human skeletal muscle,4 and in one study, 3-month supplementation of vitamin D led to an increase in type II skeletal muscle fibers in older women.5 Similarly, results from a meta-analysis of 5 randomized controlled trials (RCTs)6 showed that vitamin D supplementation may reduce fall risk in older adults by 22% (corrected odds ratio, 0.78; 95% confidence interval, 0.64-0.92). Thus, in keeping with this general theme of vitamin D supplementation yielding beneficial effects in clinical outcomes, clinicians have long accepted and practiced routine vitamin D supplementation in caring for older adults.
In more recent years, the role of vitamin D supplementation in primary care has become controversial,7 as observed in a recent paradigm shift of moving away from routine supplementation for fall and fracture prevention in clinical practice.8 In a recent meta-analysis of 33 RCTs in older community-dwelling adults, supplementation with vitamin D with or without calcium did not result in a reduction of hip fracture or total number of fractures.9 Moreover, the United States Preventive Services Task Force (USPSTF) recently published updated recommendations on the use of vitamin D supplementation for primary prevention of fractures10 and prevention of falls11 in community-dwelling adults. In these updated recommendations, the USPSTF indicated that insufficient evidence exists to re
Vitamin D supplementation is no longer routinely recommended for fall and fracture prevention. However, if we believe that poor lower extremity muscle strength is a risk factor for falls,12 then the question of whether vitamin D has a beneficial role in improving lower extremity strength in older adults needs to be addressed. Results regarding the effect of vitamin D supplementation on muscle function have so far been mixed. For example, in a randomized, double-blinded, placebo-controlled trial of 160 postmenopausal women with low vitamin D level (< 20 ng/mL), vitamin D3 supplementation at 1000 IU/day for 9 months showed a significant increase in lower extremity muscle strength.13 However, in another randomized double-blinded, placebo-controlled trial of 130 men aged 65 to 90 years with low vitamin D level (< 30 ng/mL) and an SPPB score of ≤ 9 (mild-moderate limitation in mobility), daily supplementation with 4000 IU of vitamin D3 for 9 months did not result in improved SPPB score or gait speed.14 In the study reported by Shea et al, the authors showed that 800 IU of daily vitamin D supplementation (consistent with the Institute of Medicine [IOM] recommendations for older adults15) in community-dwelling older adults with vitamin D deficiency (< 20 ng/mL) did not improve lower extremity muscle strength. This finding is significant in that it adds further evidence to support the rationale against using vitamin D supplementation for the sole purpose of improving lower extremity muscle function in older adults with vitamin D deficiency.
Valuable strengths of this study include its randomized, double-blinded, placebo-controlled trial design testing the IOM recommended dose of daily vitamin D supplementation for older adults. In addition, compared to some of the prior studies mentioned above, the study population included both males and females, although the final study population resulted in some gender bias (with male predominance). Moreover, participants were followed for a sufficient amount of time (1 year), with an excellent adherence rate (only 3 were lost to follow-up) and with corresponding improvement in vitamin D levels. Finally, the use of SPPB as a readout for primary outcome should also be commended, as this assessment is a well-validated method for measuring lower extremity function with scaled scores that predict poor outcomes.16 However, some limitations include the aforementioned predominance of male participants and Caucasian race in both intervention and control groups, as well as discrepancies between the measurement methods for serum vitamin D levels (ie, finger-stick cards versus clinical lab measurement) that may have underestimated the actual serum 25(OH)D levels.
Applications for Clinical Practice
While the null findings from the Shea and colleagues study are applicable to healthier community-dwelling older adults, they may not be generalizable to the care of more frail older patients due to their increased risks for falls and high vulnerability to adverse outcomes. Thus, further studies that account for baseline sarcopenia, frailty, and other fall-risk factors (eg, polypharmacy) are needed to better evaluate the value of vitamin D supplementation in this most vulnerable population.
— Caroline Park, MD, PhD, and Fred Ko, MD
Icahn School of Medicine at Mount Sinai, New York, NY
1. Husu P, Suni J, Pasanen M, Miilunpalo S. Health-related fitness tests as predictors of difficulties in long-distance walking among high-functioning older adults. Aging Clin Exp Res. 2007;19:444-450.
2. Forrest KYZ, Stuhldreher WL. Prevalence and correlates of vitamin D deficiency in US adults. Nutr Res. 2011;31:48-54.
3. Bischoff-Ferrari HA, Giovannucci E, Willett WC, et al. Estimation of optimal serum concentrations of 25-hydroxyvitamin D for multiple health outcomes. Am J Clin Nutr. 2006;84:1253.
4. Simpson RU, Thomas GA, Arnold AJ. Identification of 1,25-dihydroxyvitamin-D3 receptors and activities in muscle. J Biol Chem. 1985;260:8882-8891.
5. Sorensen OH, Lund BI, Saltin B, et al. Myopathy in bone loss ofaging - improvement by treatment with 1alpha-hydroxycholecalciferol and calcium. Clinical Science. 1979;56:157-161.
6. Bischoff-Ferrari HA, Dawson-Hughes B, Willett WC, et al. Effect of vitamin D on falls - A meta-analysis. JAMA. 2004;291:1999-2006.
7. Lewis JR SM, Daly RM. The vitamin D and calcium controversy: an update. Curr Opin Rheumatol. 2019;31:91-97.
8. Schwenk T. No value for routine vitamin D supplementation. NEJM Journal Watch. December 26, 2018.
9. Zhao JG, Zeng XT, Wang J, Liu L. Association between calcium or vitamin D supplementation and fracture incidence in community-dwelling older adults: a systematic review and meta-analysis. JAMA. 2017;318:2466-2482.
10. Grossman DC, Curry SJ, Owens DK, et al. Vitamin D, calcium, or combined supplementation for the primary prevention of fractures in community-dwelling adults US Preventive Services Task Force Recommendation Statement. JAMA. 2018;319:1592-1599.
11. Grossman DC, Curry SJ, Owens DK, et al. Interventions to prevent falls in community-dwelling older adults US Preventive Services Task Force Recommendation Statement. JAMA. 2018;319:1696-1704.
12. Tinetti ME, Speechley M, Ginter SF. Risk-factors for falls among elderly persons living in the community. N Engl J Med. 1988;319:1701-1707.
13. Cangussu LM, Nahas-Neto J, Orsatti CL, et al. Effect of vitamin D supplementation alone on muscle function in postmenopausal women: a randomized, double-blind, placebo-controlled clinical trial. Osteoporos Int. 2015;26:2413-2421.
14. Levis S, Gomez-Marin O. Vitamin D and physical function in sedentary older men. J Am Geriatr Soc. 2017;65:323-331.
15. Ross CA TC, Yaktine AL, Del Valle HB. Institute of Medicine (US) Committee to Review Dietary Reference Intakes for Vitamin D and Calcium. National Academies Press. 2011.
16. Guralnik JM, Ferrucci L, Simonsick EM, et al. Lower-extremity function in persons over the age of 70 years as a predictor of subsequent disability. N Engl J Med. 1995;332:556-561
Meta-analysis finds no link between PPI use and risk of dementia

The finding runs counter to recent studies, including a large pharmacoepidemiological claims data analysis from Germany, that propose an association between proton pump inhibitor (PPI) use and the development of dementia (JAMA Neurol. 2016;73[4]:410-6). “The issue with these studies is that they’re based on retrospective claims data and pharmacoepidemiological studies and insurance databases that don’t really give you a good causality basis,” lead study author Saad Alrajhi, MD, said in an interview at the annual Digestive Disease Week.
In an effort to better characterize the association between PPI exposure and dementia, Dr. Alrajhi, a gastroenterology fellow at McGill University, Montreal, and colleagues conducted a meta-analysis of all fully published randomized clinical trials or observational studies comparing use of PPIs and occurrence of dementia. The researchers queried Embase, MEDLINE, and ISI Web of Knowledge for relevant studies that were published from 1995 through September 2018. Next, they assessed the quality of the studies by using the Cochrane risk assessment tool for RCTs or the Newcastle-Ottawa Scale for observational studies.
As the primary outcome, the researchers compared dementia incidence after PPI exposure (experimental group) versus no PPI exposure (control group). Development of Alzheimer’s dementia was a secondary outcome. Sensitivity analyses consisted of excluding one study at a time, and assessing results among studies of highest qualities. Subgroup analyses included stratifying patients by age. To report odds ratios, Dr. Alrajhi and colleagues used fixed or random effects models based on the absence or presence of heterogeneity.
Of 549 studies assessed, 5 met the criteria for inclusion in the final analysis: 3 case-control studies and 2 cohort studies, with a total of 472,933 patients. All of the studies scored 8 or 9 on the Newcastle-Ottawa scale, indicating high quality. Significant heterogeneity was noted for all analyses. The researchers found that the incidence of dementia was not significantly increased among patients in the PPI-exposed group (odd ratio, 1.08 (95% confidence interval, 0.97-1.20; P = .18). Sensitivity analyses confirmed the robustness of the results. Subgroup analysis showed no between-group differences among studies that included a minimum age above 65 years (three studies) or less than age 65 (two studies). PPI exposure was not associated with the development of Alzheimer’s dementia (two studies) (OR, 1.32 (95% CI, 0.80-2.17; P = .27).
“In the absence of randomized trial evidence, a PPI prescribing approach based on appropriate utilization of guideline-based prescription should be done without the extra fear of the association of dementia,” Dr. Alrajhi said.
The researchers reported having no financial disclosures.
REPORTING FROM DDW 2019
A sleeping beast: Obstructive sleep apnea and stroke
Obstructive sleep apnea (OSA) is an independent risk factor for ischemic stroke and may also, infrequently, be a consequence of stroke. It is significantly underdiagnosed in the general population and is highly prevalent in patients who have had a stroke. Many patients likely had their stroke because of this chronic untreated condition.
This review focuses on OSA and its prevalence, consequences, and treatment in patients after a stroke.
DEFINING AND QUANTIFYING OSA
OSA is the most common type of sleep-disordered breathing.1,2 It involves repeated narrowing or complete collapse of the upper airway despite ongoing respiratory effort.3,4 Apneic episodes are terminated by arousals from hypoxemia or efforts to breathe.5 In contrast, central sleep apnea is characterized by a patent airway but lack of airflow due to absent respiratory effort.5
In OSA, the number of episodes of apnea (absent airflow) and hypopnea (reduced airflow) are added together and divided by hours of sleep to calculate the apnea-hypopnea index (AHI). OSA is diagnosed by either of the following3,4:
- AHI of 5 or higher, with clinical symptoms related to OSA (described below)
- AHI of 15 or higher, regardless of symptoms.
The AHI also defines OSA severity, as follows3:
- Mild: AHI 5 to 15
- Moderate: AHI 15 to 30
- Severe: AHI greater than 30.
Diagnostic criteria (eg, definition of hypopnea, testing methods, and AHI thresholds) have varied over time, an important consideration when reviewing the literature.
OSA IS MORE COMMON THAN EXPECTED AFTER STROKE
In the most methodologically sound and generalizable study of this topic to date, the Wisconsin Sleep Cohort Study6 reported in 2013 that about 14% of men and 5% of women ages 30 to 70 have an AHI greater than 5 (using 4% desaturation to score hypopneic episodes) with daytime sleepiness. Other studies suggest that 80% to 90% of people with OSA are undiagnosed and untreated.1,7
The prevalence of OSA in patients who have had a stroke is much higher, ranging from 30% to 96% depending on the study methods and population.1,8–12 A 2010 meta-analysis11 of 29 studies reported that 72% of patients who had a stroke had an AHI greater than 5, and 29% had severe OSA. In this analysis, 7% of those with sleep-disordered breathing had central sleep apnea; still, these data indicate that the prevalence of OSA in these patients is about 5 times higher than in the general population.
RISK FACTORS MAY DIFFER IN STROKE POPULATION
Several risk factors for OSA have been identified.
Obesity is one of the strongest risk factors, with increasing body mass index (BMI) associated with increased OSA prevalence.4,6,13 However, obesity appears to be a less significant risk factor in patients who have had a stroke than in the general population. In the 2010 meta-analysis11 of OSA after stroke, the average BMI was only 26.4 kg/m2 (with obesity defined as a BMI > 30.0 kg/m2), and increasing BMI was not associated with increasing AHI.
Male sex and advanced age are also OSA risk factors.4,5 They remain significant in patients after a stroke; about 65% of poststroke patients who have OSA are men, and the older the patient, the more likely the AHI is greater than 10.11
Ethnicity and genetics may also play important roles in OSA risk, with roughly 25% of OSA prevalence estimated to have a genetic basis.14,15 Some risk factors for OSA such as craniofacial shape, upper airway anatomy, upper airway muscle dysfunction, increased respiratory chemosensitivity, and poor arousal threshold during sleep are likely determined by genetics and ethnicity.14,15 Compared with people of European origin, Asians have a similar prevalence of OSA, but at a much lower average BMI, suggesting that other factors are significant.14 Possible genetically determined anatomic risk factors have not been specifically studied in the poststroke population, but it can be assumed they remain relevant.
Several studies have tried to find an association between OSA and type, location, etiology, or pattern of stroke.10,11,16–19 Although some suggest links between cardioembolic stroke and OSA,16,20 or thrombolysis and OSA,10 most have found no association between OSA and stroke features.11,12,21,22
HOW DOES OSA INCREASE STROKE RISK?
Untreated severe OSA is associated with increased cardiovascular mortality,21,22 and OSA is an independent risk factor for incident stroke.23 A number of mechanisms may explain these relationships.
Intermittent hypoxemia and recurrent sympathetic arousals resulting from OSA are thought to lead to many of the comorbid conditions with which it is associated: hypertension, coronary artery disease, heart failure, arrhythmias, pulmonary hypertension, and stroke. Repetitive decreases in ventilation lead to oxygen desaturations that result in cycles of increased sympathetic outflow and eventual sustained nocturnal hypertension and daytime chronic hypertension.1,5,9,13 Also implicated are various changes in vasodilator and vasoconstrictor substances due to endothelial dysfunction and inflammation, which are thought to play a role in the atherogenic and prothrombotic states induced by OSA.1,5,13
Cerebral circulation is altered primarily by the changes in partial pressure of carbon dioxide (Pco2). During apnea, the Pco2 rises, causing vasodilation and increased blood flow. After the apnea resolves, there is hyperpnea with resultant decreased Pco2, and vasoconstriction. In a patient who already has vascular disease, the enhanced vasoconstriction could lead to ischemia.1,5
Changes in intrathoracic pressure result in distortion of cardiac architecture. When the patient tries to breathe against an occluded airway, the intrathoracic pressure becomes more and more negative, increasing preload and afterload. When this happens repeatedly every night for years, it leads to remodeling of the heart such as left and right ventricular hypertrophy, with reduced stroke volume, myocardial ischemia, and increased risk of arrhythmia.1,5,13
Untreated OSA is believed to predispose patients to develop atrial fibrillation through sympathetic overactivity, vascular inflammation, heart rate variability, and cardiac remodeling.24 As atrial fibrillation is a major risk factor for stroke, particularly cardioembolic stroke, it may be another pathway of increased stroke risk in OSA.16,20,25
CLINICAL MANIFESTATIONS OF OSA NOT OBVIOUS AFTER STROKE
OSA typically causes both daytime symptoms (excessive sleepiness, poor concentration, morning headache, depressive symptoms) and nighttime signs and symptoms (snoring, choking, gasping, night sweats, insomnia, nocturia, witnessed episodes of apnea).3,4,26 Unfortunately, because these are nonspecific, OSA is often underdiagnosed.4,26
Identifying OSA after a stroke may be a particular challenge, as patients often do not report classic symptoms, and the typical picture of OSA may have less predictive validity in these patients.1,27,28 Within the first 24 hours after a stroke, hypersomnia, snoring history, and age are not predictive of OSA.1 Patients found to have OSA after a stroke frequently do not have the traditional symptoms (sleepiness, snoring) seen in usual OSA patients. And they have higher rates of OSA at a younger age than the usual OSA patients, so age is not a predictive risk factor. In addition, daytime sleepiness and obesity are often absent or less prominent.1,9,27,28 Finally, typical OSA signs and symptoms may be attributed to the stroke itself or to comorbidities affecting the patient, lowering suspicion for OSA.
OSA MAY HINDER STROKE RECOVERY, WORSEN OUTCOMES
OSA, particularly when moderate to severe, is linked to pathophysiologic changes that can hinder recovery from a stroke.
Intermittent hypoxemia during sleep can worsen vascular damage of at-risk tissue: nocturnal hypoxemia correlates with white matter hyperintensities on magnetic resonance imaging, a marker of ischemic demyelination.29 Oxidative stress and release of inflammatory mediators associated with intermittent hypoxemia may impair vascular blood flow to brain tissue attempting to repair itself.30 In addition, sympathetic overactivity and Pco2 fluctuations associated with OSA may impede cerebral circulation.
Taken together, such ongoing nocturnal insults can lead to clinical consequences during this vulnerable period.
A 1996 study31 of patients recovering from a stroke found that an oxygen desaturation index (number of times that the blood oxygen level drops below a certain threshold, as measured by overnight oximetry) of more than 10 per hour was associated with worse functional recovery at discharge and at 3 and 12 months after discharge. This study also noted an association between time spent with oxygen saturations below 90% and the rate of death at 1 year.
A 2003 study32 reported that patients with an AHI greater than 10 by polysomnography spent an average of 13 days longer on the rehabilitation service and had worse functional and cognitive status on discharge, even after controlling for multiple confounders. Several subsequent studies have confirmed these and similar findings.8,33,34
OSA has also been linked to depression,35 which is common after stroke and may worsen outcomes.36 The interaction between OSA, depression, and poststroke outcomes warrants further study.
In the general population, OSA has been independently associated with increased risk of stroke or death from any cause.21,22,37 These associations have also been reported in the poststroke population: a 2014 meta-analysis found that OSA increased the risk of a repeat stroke (relative risk [RR] 1.8, 95% confidence interval [CI] 1.2–2.6) and all-cause mortality (RR 1.69, 95% CI 1.4–2.1).38
TESTING FOR OSA AFTER STROKE
Because of the high prevalence of OSA in patients who have had a stroke and the potential for worse outcomes associated with untreated OSA, there should be a low threshold for evaluating for OSA soon after stroke. Objective testing is required to qualify for therapy, and the gold standard for diagnosis of OSA is formal polysomnography conducted in a sleep laboratory.2–4 Unfortunately, polysomnography may be unacceptable to some patients, is costly, and is resource-intensive, particularly in an inpatient or rehabilitation setting.28 Ideally, to optimize testing efficiency, patients should be screened for the likelihood of OSA before polysomnography is ordered.
Questionnaires can help determine the need for further testing
Questionnaires developed to assess OSA risk39 include the following:
The Berlin questionnaire, developed in 1999, has 10 questions assessing daytime and nighttime signs and symptoms and presence of hypertension.
The STOP questionnaire, developed in 2008, assesses snoring, tiredness, observed apneic episodes, and elevated blood pressure.
The STOP-BANG questionnaire, published in 2010, includes the STOP questions plus BMI over 35 kg/m2, age over 50, neck circumference over 41 cm, and male gender.
A 2017 meta-analysis39 of 108 studies with nearly 50,000 people found that the STOP-BANG questionnaire performed best with regard to sensitivity and diagnostic odds ratio, but with poor specificity.
These screening tools and modified versions of them have also been evaluated in patients who have had a stroke.
In 2015, Boulos et al28 found that the STOP-BAG (a version of STOP-BANG that excludes neck circumference) and the 4-variable (4V) questionnaire (sex, BMI, blood pressure, snoring) had moderate predictive value for OSA within 6 months after sroke.
In 2016, Katzan et al40 found that the STOP-BAG2 (STOP-BAG criteria plus continuous variables for BMI and age) had a high sensitivity for polysomnographically diagnosed OSA within the first year after a stroke. The specificity was significantly better than the STOP-BANG or the STOP-BAG questionnaire, although it remained suboptimal at 60.5%.
In 2017, Sico et al41 developed and assessed the SLEEP Inventory (sex, left heart failure, Epworth Sleepiness Scale, enlarged neck, weight in pounds, insulin resistance or diabetes, and National Institutes of Health Stroke Scale) and found that it outperformed the Berlin and STOP-BANG questionnaires in the poststroke setting. The SLEEP Inventory had the best specificity and negative predictive value, and a slightly better ability to correctly classify patients as having OSA or not, classifying 80% of patients correctly.
These newer screening tools (eg, STOP-BAG, STOP-BAG2, SLEEP) can be used to identify with reasonable accuracy which patients need definitive testing after stroke.
Pulse oximetry is another possible screening tool
Overnight pulse oximetry may also help screen for sleep apnea and stratify risk after a stroke. A 2012 study42 of overnight oximetry to screen patients before surgery found that the oxygen desaturation index was significantly associated with the AHI measured by polysomnography. However, oximetry testing cannot distinguish between OSA and central sleep apnea, so it is insufficient to diagnose OSA or qualify patients for therapy. Further study is needed to examine the ability of overnight pulse oximetry to screen or to stratify risk for OSA after stroke.
Polysomnography vs home testing
Polysomnography is the gold standard for diagnosing OSA. Benefits include technical support and trouble-shooting, determining relationships between OSA, body position, and sleep stage, and the ability to intervene with treatment.2 However, polysomnography can be cumbersome, costly, and resource-intensive.
A home sleep apnea test, ie, an unattended, limited-channel sleep study, may be an acceptable alternative.2–4,43,44 Home testing does not require a sleep technologist to be present during testing, uses fewer sensors, and is less expensive than overnight polysomnography, but its utility can be limited: it fails to accurately discriminate between episodes of OSA and central sleep apnea, there is potential for false-negative results, and it can underestimate sleep apnea burden because it does not measure sleep.2
Institutional resources and logistics may influence the choice of diagnostic modality. No data exist on outcomes from different diagnostic testing methods in poststroke patients. Further research is needed.
POSITIVE AIRWAY PRESSURE THERAPY: BENEFITS, CHALLENGES, ALTERNATIVES
The first-line treatment for OSA is positive airway pressure (PAP).3 For most patients, this is continuous PAP (CPAP) or autoadjusting PAP (APAP). In some instances, particularly for those who cannot tolerate CPAP or who have comorbid hypoventilation, bilevel PAP (BPAP) may be indicated. More advanced PAP therapies are unlikely to be used after stroke.
PAP therapy is associated with reduced daytime sleepiness, improved mood, normalization of sleep architecture, improved systemic and pulmonary artery blood pressure, reduced rates of atrial fibrillation after ablation, and improved insulin sensitivity.45–49 Whether it reduces the risk of cardiovascular events, including stroke, remains controversial; most data suggest that it does not.50,51 However, when adherence to PAP therapy is considered rather than intention to treat, treatment has been found to lead to improved cardiovascular outcomes.52
Mixed evidence of benefits after stroke
Observational studies provide evidence that CPAP may help patients with OSA after stroke, although results are mixed.53–58 The studies ranged in size from 14 to 105 patients, enrolled patients with mostly moderate to severe OSA, and followed patients from 10 days to 7 years. Adherence to therapy was generally good in the short term (50%–70%), but only 15% to 30% of patients remained adherent at 5 to 7 years. Variable outcomes were reported, with some studies finding improved symptoms in the near term and mixed evidence of cardiovascular benefit in the longer ones. However, as these studies lacked randomization, drawing definitive conclusions on CPAP efficacy is difficult.

Patients were enrolled in the index admission or when starting a rehabilitation service—generally 2 to 3 weeks after their stroke. No clear association was found between the timing of initiating PAP therapy and outcomes. All patients had ischemic strokes, but few details were provided regarding stroke location, size, and severity. Exclusion criteria included severe underlying cardiopulmonary disease, confusion, severe stroke with marked impairment, and inability to cooperate. Almost all patients had moderate to severe OSA, and patients with central sleep apnea were excluded.
The major outcomes examined were drop-out rates, PAP adherence, and neurologic improvement based on neurologic functional scales (National Institutes of Health Stroke Scale and Canadian Neurologic Scale). As expected, dropout rates were higher in patients randomized to CPAP (OR 1.83, 95% CI 1.05–3.21, P = .03), although overall adherence was better than anticipated, with mean CPAP use across trials of 4.5 hours per night (95% CI 3.97–5.08) and with about 50% to 60% of patients adhering to therapy for at least 4 hours nightly.
Improvement in neurologic outcomes favored CPAP (standard mean difference 0.54, 95% CI 0.026–1.05), although considerable heterogeneity was seen. Improved sleepiness outcomes were inconsistent. Major cardiovascular outcomes were reported in only 2 studies (using the same data set) and showed delayed time to the next cardiovascular event for those treated with CPAP but no difference in cardiovascular event-free survival.
PAP poses more challenges after stroke
The primary limitation to PAP therapy is poor acceptance and adherence to therapy.59 High rates of refusal of therapy and difficulty complying with treatment have been noted in the poststroke population, although recent studies have reported better adherence rates. How rates of adherence play out in real-world settings, outside of the controlled environment of a research study, has yet to be determined.
In general, CPAP adherence is affected by claustrophobia, difficulty tolerating a mask, problems with pressure intolerance, irritating air leaks, nasal congestion, and naso-oral dryness. Many such barriers can be overcome with use of a properly fitted mask, an appropriate pressure setting, heated humidification, nasal sprays (eg, saline, inhaled steroids), and education, encouragement, and reassurance.
After a stroke, additional obstacles may impede the ability to use PAP therapy.68 Facial paresis (hemi- or bifacial) may make fitting of the mask problematic. Paralysis or weakness of the extremities may limit the ability to adjust or remove a mask. Aphasia can impair communication and understanding of the need to use PAP therapy, and upper-airway problems related to stroke, including dysphagia, may lead to pressure intolerance or risk of aspiration. Finally, a lack of perceived benefit, particularly if the patient does not have daytime sleepiness, may limit motivation.
Consider alternatives
For patients unlikely to succeed with PAP therapy, there are alternatives. Surgery and oral appliances are not usually realistic options in the setting of recent stroke, but positional therapy, including the use of body positioners to prevent supine sleep, as well as elevating the head of the bed, may be of some benefit.69,70 A nasopharyngeal airway stenting device (nasal trumpet) may also be tolerated by some patients.

A proposed algorithm for screening, diagnosing, and treating OSA in patients after stroke is presented in Figure 1.
- Selim B, Roux FJ. Stroke and sleep disorders. Sleep Med Clin 2012; 7(4):597–607. doi:10.1016/j.jsmc.2012.08.007
- Kapur VK, Auckley DH, Chowdhuri S, et al. Clinical practice guideline for diagnostic testing for adult obstructive sleep apnea: an American Academy of Sleep Medicine Clinical Practice Guideline. J Clin Sleep Med 2017; 13(3):479–504. doi:10.5664/jcsm.6506
- Epstein LJ, Kristo D, Strollo PJ Jr, et al; Adult Obstructive Sleep Apnea Task Force of the American Academy of Sleep Medicine. Clinical guideline for the evaluation, management, and long-term care of obstructive sleep apnea in adults. J Clin Sleep Med 2009; 5(3):263–276. pmid:19960649
- Patil SP, Schneider H, Schwartz AR, Smith PL. Adult obstructive sleep apnea: pathophysiology and diagnosis. Chest 2007; 132(1):325–337. doi:10.1378/chest.07-0040
- Dempsey JA, Veasey SC, Morgan BJ, O’Donnell CP. Pathophysiology of sleep apnea. Physiol Rev 2010; 90(1):47–112. doi:10.1152/physrev.00043.2008
- Peppard PE, Young T, Barnet JH, Palta M, Hagen EW, Hla KM. Increased prevalence of sleep-disordered breathing in adults. Am J Epidemiol 2013; 177(9):1006–1014. doi:10.1093/aje/kws342
- Redline S, Sotres-Alvarez D, Loredo J, et al. Sleep-disordered breathing in Hispanic/Latino individuals of diverse backgrounds. The Hispanic Community Health Study/Study of Latinos. Am J Resp Crit Care Med 2014; 189(3):335–344. doi:10.1164/rccm.201309-1735OC
- Aaronson JA, van Bennekom CA, Hofman WF, et al. Obstructive sleep apnea is related to impaired cognitive and functional status after stroke. Sleep 2015; 38(9):1431–1437. doi:10.5665/sleep.4984
- Sharma S, Culebras A. Sleep apnoea and stroke. Stroke Vasc Neurol 2016; 1(4):185–191. doi:10.1136/svn-2016-000038
- Huhtakangas JK, Huhtakangas J, Bloigu R, Saaresranta T. Prevalence of sleep apnea at the acute phase of ischemic stroke with or without thrombolysis. Sleep Med 2017; 40:40–46. doi:10.1016/j.sleep.2017.08.018
- Johnson KG, Johnson DC. Frequency of sleep apnea in stroke and TIA patients: a meta-analysis. J Clin Sleep Med 2010; 6(2):131–137. pmid:20411688
- Iranzo A, Santamaria J, Berenguer J, Sanchez M, Chamorro A. Prevalence and clinical importance of sleep apnea in the first night after cerebral infarction. Neurology 2002; 58:911–916. pmid:11914407
- Javaheri S, Barbe F, Campos-Rodriguez F, et al. Sleep apnea: types, mechanisms, and clinical cardiovascular consequences. J Am Coll Cardiol 2017; 69(7):841–858. doi:10.1016/j.jacc.2016.11.069
- Dudley KA, Patel SR. Disparities and genetic risk factors in obstructive sleep apnea. Sleep Med 2016; 18:96–102. doi:10.1016/j.sleep.2015.01.015
- Redline S, Tishler PV. The genetics of sleep apnea. Sleep Med Rev 2000; 4(6):583–602. doi:10.1053/smrv.2000.0120
- Lipford MC, Flemming KD, Calvin AD, et al. Associations between cardioembolic stroke and obstructive sleep apnea. Sleep 2015; 38(11):1699–1705. doi:10.5665/sleep.5146
- Wang Y, Wang Y, Chen J, Yi X, Dong S, Cao L. Stroke patterns, topography, and etiology in patients with obstructive sleep apnea hypopnea syndrome. Int J Clin Exp Med 2017; 10(4):7137–7143.
- Fisse AL, Kemmling A, Teuber A, et al. The association of lesion location and sleep related breathing disorder in patients with acute ischemic stroke. PLoS One 2017; 12(1):e0171243. doi:10.1371/journal.pone.0171243
- Brown DL, Mowla A, McDermott M, et al. Ischemic stroke subtype and presence of sleep-disordered breathing: the BASIC sleep apnea study. J Stroke Cerebrovasc Dis 2015; 24(2):388–393. doi:10.1016/j.jstrokecerebrovasdis.2014.09.007
- Poli M, Philip P, Taillard J, et al. Atrial fibrillation as a major cause of stroke in apneic patients: a prospective study. Sleep Med 2017; 30:251–254. doi:10.1016/j.sleep.2015.07.031
- Young T, Finn L, Peppard PE, et al. Sleep disordered breathing and mortality: eighteen-year follow-up of the Wisconsin Sleep Cohort. Sleep 2008; 31(8):1071–1078. pmid:18714778
- Molnar MZ, Mucsi I, Novak M, et al. Association of incident obstructive sleep apnoea with outcomes in a large cohort of US veterans. Thorax 2015; 70(9):888–895. doi:10.1136/thoraxjnl-2015-206970
- Redline S, Yenokyan G, Gottlieb DJ, et al. Obstructive sleep apnea-hypopnea and incident stroke: the sleep heart health study. Am J Respir Crit Care Med 2010; 182(2):269–277. doi:10.1164/rccm.200911-1746OC
- Marulanda-Londono E, Chaturvedi S. The interplay between obstructive sleep apnea and atrial fibrillation. Fron Neurol 2017; 8:668. doi:10.3389/fneur.2017.00668
- Szymanski FM, Filipiak KJ, Platek AE, Hrynkiewicz-Szymanska A, Karpinski G, Opolski G. Assessment of CHADS2 and CHA 2DS 2-VASc scores in obstructive sleep apnea patients with atrial fibrillation. Sleep Breath 2015; 19(2):531–537. doi:10.1007/s11325-014-1042-5
- Stansbury RC, Strollo PJ. Clinical manifestations of sleep apnea. J Thoracic Dis 2015; 7(9):E298–E310. doi:10.3978/j.issn.2072-1439.2015.09.13
- Chan W, Coutts SB, Hanly P. Sleep apnea in patients with transient ischemic attack and minor stroke: opportunity for risk reduction of recurrent stroke? Stroke 2010; 41(12):2973–2975. doi:10.1161/STROKEAHA.110.596759
- Boulos MI, Wan A, Im J, et al. Identifying obstructive sleep apnea after stroke/TIA: evaluating four simple screening tools. Sleep Med 2016; 21:133–139. doi:10.1016/j.sleep.2015.12.013
- Patel SK, Hanly PJ, Smith EE, Chan W, Coutts SB. Nocturnal hypoxemia is associated with white matter hyperintensities in patients with a minor stroke or transient ischemic attack. J Clin Sleep Med 2015; 11(12):1417–1424. doi:10.5664/jcsm.5278
- McCarty MF, DiNicolantonio JJ, O’Keefe JH. NADPH oxidase, uncoupled endothelial nitric oxide synthase, and NF-KappaB are key mediators of the pathogenic impact of obstructive sleep apnea—therapeutic implications. J Integr Cardiol 2016; 2(5):367–374. doi:10.15761/JIC.1000177
- Good DC, Henkle JQ, Gelber D, Welsh J, Verhulst S. Sleep-disordered breathing and poor functional outcome after stroke. Stroke 1996; 27(2):252–259. pmid:8571419
- Kaneko Y, Hajek VE, Zivanovic V, Raboud J, Bradley TD. Relationship of sleep apnea to functional capacity and length of hospitalization following stroke. Sleep 2003; 26(3):293–297. pmid:12749548
- Yan-fang S, Yu-ping W. Sleep-disordered breathing: impact on functional outcome of ischemic stroke patients. Sleep Med 2009; 10(7):717–719. doi:10.1016/j.sleep.2008.08.006
- Kumar R, Suri JC, Manocha R. Study of association of severity of sleep disordered breathing and functional outcome in stroke patients. Sleep Med 2017; 34:50–56. doi:10.1016/j.sleep.2017.02.025
- Kerner NA, Roose SP. Obstructive sleep apnea is linked to depression and cognitive impairment: evidence and potential mechanisms. Am J Geriatr Psychiatry 2016; 24(6):496–508. doi:10.1016/j.jagp.2016.01.134
- Bartoli F, Lillia N, Lax A, et al. Depression after stroke and risk of mortality: a systematic review and meta-analysis. Stroke Res Treat 2013; 2013:862978. doi:10.1155/2013/862978
- Yaggi HK, Concato J, Kernan WN, Lichtman JH, Brass LM, Mohsenin V. Obstructive sleep apnea as a risk factor for stroke and death. N Engl J Med 2005; 353(19):2034–2041. doi:10.1056/NEJMoa043104
- Xie W, Zheng F, Song X. Obstructive sleep apnea and serious adverse outcomes in patients with cardiovascular or cerebrovascular disease: a PRISMA-compliant systematic review and meta-analysis. Medicine (Baltimore) 2014; 93(29):e336. doi:10.1097/MD.0000000000000336
- Chiu HY, Chen PY, Chuang LP, et al. Diagnostic accuracy of the Berlin questionnaire, STOP-BANG, STOP, and Epworth sleepiness scale in detecting obstructive sleep apnea: a bivariate meta-analysis. Sleep Med Rev 2017; 36:57–70. doi:10.1016/j.smrv.2016.10.004
- Katzan IL, Thompson NR, Uchino K, Foldvary-Schaefer N. A screening tool for obstructive sleep apnea in cerebrovascular patients. Sleep Med 2016; 21:70–76. doi:10.1016/j.sleep.2016.02.001
- Sico JJ, Yaggi HK, Ofner S, et al. Development, validation, and assessment of an ischemic stroke or transient ischemic attack-specific prediction tool for obstructive sleep apnea. J Stroke Cerebrovasc Dis 2017; 26(8):1745–1754. doi:10.1016/j.jstrokecerebrovasdis.2017.03.042
- Chung F, Liao P, Elsaid H, Islam S, Shapiro CM, Sun Y. Oxygen desaturation index from nocturnal oximetry: a sensitive and specific tool to detect sleep-disordered breathing in surgical patients. Anesth Analg 2012; 114(5):993–1000. doi:10.1213/ANE.0b013e318248f4f5
- Boulos MI, Elias S, Wan A, et al. Unattended hospital and home sleep apnea testing following cerebrovascular events. J Stroke Cerebrovasc Dis 2017; 26(1):143–149. doi:10.1016/j.jstrokecerebrovasdis.2016.09.001
- Saletu MT, Kotzian ST, Schwarzinger A, Haider S, Spatt J, Saletu B. Home sleep apnea testing is a feasible and accurate method to diagnose obstructive sleep apnea in stroke patients during in-hospital rehabilitation. J Clin Sleep Med 2018; 14(9):1495–1501. doi:10.5664/jcsm.7322
- Giles TL, Lasserson TJ, Smith BH, White J, Wright J, Cates CJ. Continuous positive airways pressure for obstructive sleep apnoea in adults. Cochrane Database Syst Rev 2006; (3):CD001106. doi:10.1002/14651858.CD001106.pub3
- Fatureto-Borges F, Lorenzi-Filho G, Drager LF. Effectiveness of continuous positive airway pressure in lowering blood pressure in patients with obstructive sleep apnea: a critical review of the literature. Integr Blood Press Control 2016; 9:43–47. doi:10.2147/IBPC.S70402
- Imran TF, Gharzipura M, Liu S, et al. Effect of continuous positive airway pressure treatment on pulmonary artery pressure in patients with isolated obstructive sleep apnea: a meta-analysis. Heart Fail Rev 2016; 21(5):591–598. doi:10.1007/s10741-016-9548-5
- Deng F, Raza A, Guo J. Treating obstructive sleep apnea with continuous positive airway pressure reduces risk of recurrent atrial fibrillation after catheter ablation: a meta-analysis. Sleep Med 2018; 46:5–11. doi:10.1016/j.sleep.2018.02.013
- Seetho IW, Wilding JPH. Sleep-disordered breathing, type 2 diabetes, and the metabolic syndrome. Chronic Resp Dis 2014; 11(4):257–275. doi:10.1177/1479972314552806
- Kim Y, Koo YS, Lee HY, Lee SY. Can continuous positive airway pressure reduce the risk of stroke in obstructive sleep apnea patients? A systematic review and meta-analysis. PloS ONE 2016; 11(1):e0146317. doi:10.1371/journal.pone.0146317
- Yu J, Zhou Z, McEvoy RD, et al. Association of positive airway pressure with cardiovascular events and death in adults with sleep apnea: a systematic review and meta-analysis. JAMA 2017; 318(2):156–166. doi:10.1001/jama.2017.7967
- Peker Y, Glantz H, Eulenburg C, Wegscheider K, Herlitz J, Thunström E. Effect of positive airway pressure on cardiovascular outcomes in coronary artery disease patients with nonsleepy obstructive sleep apnea. The RICCADSA randomized controlled trial. Am J Respir Crit Care Med 2016; 194(5):613–620. doi:10.1164/rccm.201601-0088OC
- Martinez-Garcia MA, Soler-Cataluna JJ, Ejarque-Martinez L, et al. Continuous positive airway pressure treatment reduces mortality in patients with ischemic stroke and obstructive sleep apnea: a 5-year follow-up study. Am J Respir Crit Care Med 2009; 180(1):36–41. doi:10.1164/rccm.200808-1341OC
- Broadley SA, Jorgensen L, Cheek A, et al. Early investigation and treatment of obstructive sleep apnoea after acute stroke. J Clin Neurosci 2007; 14(4):328–333. doi:10.1016/j.jocn.2006.01.017
- Wessendorf TE, Wang YM, Thilmann AF, Sorgenfrei U, Konietzko N, Teschler H. Treatment of obstructive sleep apnoea with nasal continuous positive airway pressure in stroke. Eur Respir J 2001; 18(4):623–629. pmid:11716165
- Bassetti CL, Milanova M, Gugger M. Sleep-disordered breathing and acute ischemic stroke: diagnosis, risk factors, treatment, evolution, and long-term clinical outcome. Stroke 2006; 37(4):967–972. doi:10.1161/01.STR.0000208215.49243.c3
- Palombini L, Guilleminault C. Stroke and treatment with nasal CPAP. Eur J Neurol 2006; 13(2):198–200. doi:10.1111/j.1468-1331.2006.01169.x
- Martínez-García MA, Campos-Rodríguez F, Soler-Cataluña JJ, Catalán-Serra P, Román-Sánchez P, Montserrat JM. Increased incidence of nonfatal cardiovascular events in stroke patients with sleep apnoea: effect of CPAP treatment. Eur Respir J 2012; 39(4):906–912. doi:10.1183/09031936.00011311
- Brill AK, Horvath T, Seiler A, et al. CPAP as treatment of sleep apnea after stroke: a meta-analysis of randomized trials. Neurology 2018; 90(14):e1222–e1230. doi:10.1212/WNL.0000000000005262
- Hsu C, Vennelle M, Li H, Engleman HM, Dennis MS, Douglas NJ. Sleep-disordered breathing after stroke: a randomised controlled trial of continuous positive airway pressure. J Neurol Neurosurg Psychiatry 2006; 77(10):1143–1149. doi:10.1136/jnnp.2005.086686
- Parra O, Sanchez-Armengol A, Bonnin M, et al. Early treatment of obstructive apnoea and stroke outcome: a randomised controlled trial. Eur Resp J 2011; 37(5):1128–1136. doi:10.1183/09031936.00034410
- Ryan CM, Bayley M, Green R, Murray BJ, Bradley TD. Influence of continuous positive airway pressure on outcomes of rehabilitation in stroke patients with obstructive sleep apnea. Stroke 2011; 42(4):1062–1067. doi:10.1161/STROKEAHA.110.597468
- Bravata DM, Concato J, Fried T, et al. Continuous positive airway pressure: evaluation of a novel therapy for patients with acute ischemic stroke. Sleep 2011; 34(9):1271–1277. doi:10.5665/SLEEP.1254
- Parra O, Sanchez-Armengol A, Capote F, et al. Efficacy of continuous positive airway pressure treatment on 5-year survival in patients with ischaemic stroke and obstructive sleep apnea: a randomized controlled trial. J Sleep Res 2015; 24(1):47–53. doi:10.1111/jsr.12181
- Khot SP, Davis AP, Crane DA, et al. Effect of continuous positive airway pressure on stroke rehabilitation: a pilot randomized sham-controlled trial. J Clin Sleep Med 2016; 12(7):1019–1026. doi:10.5664/jcsm.5940
- Aaronson JA, Hofman WF, van Bennekom CA, et al. Effects of continuous positive airway pressure on cognitive and functional outcome of stroke patients with obstructive sleep apnea: a randomized controlled trial. J Clin Sleep Med 2016; 12(4):533–541. doi:10.5664/jcsm.5684
- Gupta A, Shukla G, Afsar M, et al. Role of positive airway pressure therapy for obstructive sleep apnea in patients with stroke: a randomized controlled trial. J Clin Sleep Med 2018; 14(4):511–521. doi:10.5664/jcsm.7034
- Mello-Fujita L, Kim LJ, Palombini Lde O, et al. Treatment of obstructive sleep apnea syndrome associated with stroke. Sleep Med 2015; 16(6):691–696. doi:10.1016/j.sleep.2014.12.017
- Svatikova A, Chervin RD, Wing JJ, Sanchez BN, Migda EM, Brown DL. Positional therapy in ischemic stroke patients with obstructive sleep apnea. Sleep Med 2011; 12(3):262–266. doi:10.1016/j.sleep.2010.12.008
- Souza FJ, Genta PR, de Souza Filho AJ, Wellman A, Lorenzi-Filho G. The influence of head-of-bed elevation in patients with obstructive sleep apnea. Sleep Breath 2017; 21(4):815–820. doi:10.1007/s11325-017-1524-3
Obstructive sleep apnea (OSA) is an independent risk factor for ischemic stroke and may also, infrequently, be a consequence of stroke. It is significantly underdiagnosed in the general population and is highly prevalent in patients who have had a stroke. Many patients likely had their stroke because of this chronic untreated condition.
This review focuses on OSA and its prevalence, consequences, and treatment in patients after a stroke.
DEFINING AND QUANTIFYING OSA
OSA is the most common type of sleep-disordered breathing.1,2 It involves repeated narrowing or complete collapse of the upper airway despite ongoing respiratory effort.3,4 Apneic episodes are terminated by arousals from hypoxemia or efforts to breathe.5 In contrast, central sleep apnea is characterized by a patent airway but lack of airflow due to absent respiratory effort.5
In OSA, the number of episodes of apnea (absent airflow) and hypopnea (reduced airflow) are added together and divided by hours of sleep to calculate the apnea-hypopnea index (AHI). OSA is diagnosed by either of the following3,4:
- AHI of 5 or higher, with clinical symptoms related to OSA (described below)
- AHI of 15 or higher, regardless of symptoms.
The AHI also defines OSA severity, as follows3:
- Mild: AHI 5 to 15
- Moderate: AHI 15 to 30
- Severe: AHI greater than 30.
Diagnostic criteria (eg, definition of hypopnea, testing methods, and AHI thresholds) have varied over time, an important consideration when reviewing the literature.
OSA IS MORE COMMON THAN EXPECTED AFTER STROKE
In the most methodologically sound and generalizable study of this topic to date, the Wisconsin Sleep Cohort Study6 reported in 2013 that about 14% of men and 5% of women ages 30 to 70 have an AHI greater than 5 (using 4% desaturation to score hypopneic episodes) with daytime sleepiness. Other studies suggest that 80% to 90% of people with OSA are undiagnosed and untreated.1,7
The prevalence of OSA in patients who have had a stroke is much higher, ranging from 30% to 96% depending on the study methods and population.1,8–12 A 2010 meta-analysis11 of 29 studies reported that 72% of patients who had a stroke had an AHI greater than 5, and 29% had severe OSA. In this analysis, 7% of those with sleep-disordered breathing had central sleep apnea; still, these data indicate that the prevalence of OSA in these patients is about 5 times higher than in the general population.
RISK FACTORS MAY DIFFER IN STROKE POPULATION
Several risk factors for OSA have been identified.
Obesity is one of the strongest risk factors, with increasing body mass index (BMI) associated with increased OSA prevalence.4,6,13 However, obesity appears to be a less significant risk factor in patients who have had a stroke than in the general population. In the 2010 meta-analysis11 of OSA after stroke, the average BMI was only 26.4 kg/m2 (with obesity defined as a BMI > 30.0 kg/m2), and increasing BMI was not associated with increasing AHI.
Male sex and advanced age are also OSA risk factors.4,5 They remain significant in patients after a stroke; about 65% of poststroke patients who have OSA are men, and the older the patient, the more likely the AHI is greater than 10.11
Ethnicity and genetics may also play important roles in OSA risk, with roughly 25% of OSA prevalence estimated to have a genetic basis.14,15 Some risk factors for OSA such as craniofacial shape, upper airway anatomy, upper airway muscle dysfunction, increased respiratory chemosensitivity, and poor arousal threshold during sleep are likely determined by genetics and ethnicity.14,15 Compared with people of European origin, Asians have a similar prevalence of OSA, but at a much lower average BMI, suggesting that other factors are significant.14 Possible genetically determined anatomic risk factors have not been specifically studied in the poststroke population, but it can be assumed they remain relevant.
Several studies have tried to find an association between OSA and type, location, etiology, or pattern of stroke.10,11,16–19 Although some suggest links between cardioembolic stroke and OSA,16,20 or thrombolysis and OSA,10 most have found no association between OSA and stroke features.11,12,21,22
HOW DOES OSA INCREASE STROKE RISK?
Untreated severe OSA is associated with increased cardiovascular mortality,21,22 and OSA is an independent risk factor for incident stroke.23 A number of mechanisms may explain these relationships.
Intermittent hypoxemia and recurrent sympathetic arousals resulting from OSA are thought to lead to many of the comorbid conditions with which it is associated: hypertension, coronary artery disease, heart failure, arrhythmias, pulmonary hypertension, and stroke. Repetitive decreases in ventilation lead to oxygen desaturations that result in cycles of increased sympathetic outflow and eventual sustained nocturnal hypertension and daytime chronic hypertension.1,5,9,13 Also implicated are various changes in vasodilator and vasoconstrictor substances due to endothelial dysfunction and inflammation, which are thought to play a role in the atherogenic and prothrombotic states induced by OSA.1,5,13
Cerebral circulation is altered primarily by the changes in partial pressure of carbon dioxide (Pco2). During apnea, the Pco2 rises, causing vasodilation and increased blood flow. After the apnea resolves, there is hyperpnea with resultant decreased Pco2, and vasoconstriction. In a patient who already has vascular disease, the enhanced vasoconstriction could lead to ischemia.1,5
Changes in intrathoracic pressure result in distortion of cardiac architecture. When the patient tries to breathe against an occluded airway, the intrathoracic pressure becomes more and more negative, increasing preload and afterload. When this happens repeatedly every night for years, it leads to remodeling of the heart such as left and right ventricular hypertrophy, with reduced stroke volume, myocardial ischemia, and increased risk of arrhythmia.1,5,13
Untreated OSA is believed to predispose patients to develop atrial fibrillation through sympathetic overactivity, vascular inflammation, heart rate variability, and cardiac remodeling.24 As atrial fibrillation is a major risk factor for stroke, particularly cardioembolic stroke, it may be another pathway of increased stroke risk in OSA.16,20,25
CLINICAL MANIFESTATIONS OF OSA NOT OBVIOUS AFTER STROKE
OSA typically causes both daytime symptoms (excessive sleepiness, poor concentration, morning headache, depressive symptoms) and nighttime signs and symptoms (snoring, choking, gasping, night sweats, insomnia, nocturia, witnessed episodes of apnea).3,4,26 Unfortunately, because these are nonspecific, OSA is often underdiagnosed.4,26
Identifying OSA after a stroke may be a particular challenge, as patients often do not report classic symptoms, and the typical picture of OSA may have less predictive validity in these patients.1,27,28 Within the first 24 hours after a stroke, hypersomnia, snoring history, and age are not predictive of OSA.1 Patients found to have OSA after a stroke frequently do not have the traditional symptoms (sleepiness, snoring) seen in usual OSA patients. And they have higher rates of OSA at a younger age than the usual OSA patients, so age is not a predictive risk factor. In addition, daytime sleepiness and obesity are often absent or less prominent.1,9,27,28 Finally, typical OSA signs and symptoms may be attributed to the stroke itself or to comorbidities affecting the patient, lowering suspicion for OSA.
OSA MAY HINDER STROKE RECOVERY, WORSEN OUTCOMES
OSA, particularly when moderate to severe, is linked to pathophysiologic changes that can hinder recovery from a stroke.
Intermittent hypoxemia during sleep can worsen vascular damage of at-risk tissue: nocturnal hypoxemia correlates with white matter hyperintensities on magnetic resonance imaging, a marker of ischemic demyelination.29 Oxidative stress and release of inflammatory mediators associated with intermittent hypoxemia may impair vascular blood flow to brain tissue attempting to repair itself.30 In addition, sympathetic overactivity and Pco2 fluctuations associated with OSA may impede cerebral circulation.
Taken together, such ongoing nocturnal insults can lead to clinical consequences during this vulnerable period.
A 1996 study31 of patients recovering from a stroke found that an oxygen desaturation index (number of times that the blood oxygen level drops below a certain threshold, as measured by overnight oximetry) of more than 10 per hour was associated with worse functional recovery at discharge and at 3 and 12 months after discharge. This study also noted an association between time spent with oxygen saturations below 90% and the rate of death at 1 year.
A 2003 study32 reported that patients with an AHI greater than 10 by polysomnography spent an average of 13 days longer on the rehabilitation service and had worse functional and cognitive status on discharge, even after controlling for multiple confounders. Several subsequent studies have confirmed these and similar findings.8,33,34
OSA has also been linked to depression,35 which is common after stroke and may worsen outcomes.36 The interaction between OSA, depression, and poststroke outcomes warrants further study.
In the general population, OSA has been independently associated with increased risk of stroke or death from any cause.21,22,37 These associations have also been reported in the poststroke population: a 2014 meta-analysis found that OSA increased the risk of a repeat stroke (relative risk [RR] 1.8, 95% confidence interval [CI] 1.2–2.6) and all-cause mortality (RR 1.69, 95% CI 1.4–2.1).38
TESTING FOR OSA AFTER STROKE
Because of the high prevalence of OSA in patients who have had a stroke and the potential for worse outcomes associated with untreated OSA, there should be a low threshold for evaluating for OSA soon after stroke. Objective testing is required to qualify for therapy, and the gold standard for diagnosis of OSA is formal polysomnography conducted in a sleep laboratory.2–4 Unfortunately, polysomnography may be unacceptable to some patients, is costly, and is resource-intensive, particularly in an inpatient or rehabilitation setting.28 Ideally, to optimize testing efficiency, patients should be screened for the likelihood of OSA before polysomnography is ordered.
Questionnaires can help determine the need for further testing
Questionnaires developed to assess OSA risk39 include the following:
The Berlin questionnaire, developed in 1999, has 10 questions assessing daytime and nighttime signs and symptoms and presence of hypertension.
The STOP questionnaire, developed in 2008, assesses snoring, tiredness, observed apneic episodes, and elevated blood pressure.
The STOP-BANG questionnaire, published in 2010, includes the STOP questions plus BMI over 35 kg/m2, age over 50, neck circumference over 41 cm, and male gender.
A 2017 meta-analysis39 of 108 studies with nearly 50,000 people found that the STOP-BANG questionnaire performed best with regard to sensitivity and diagnostic odds ratio, but with poor specificity.
These screening tools and modified versions of them have also been evaluated in patients who have had a stroke.
In 2015, Boulos et al28 found that the STOP-BAG (a version of STOP-BANG that excludes neck circumference) and the 4-variable (4V) questionnaire (sex, BMI, blood pressure, snoring) had moderate predictive value for OSA within 6 months after sroke.
In 2016, Katzan et al40 found that the STOP-BAG2 (STOP-BAG criteria plus continuous variables for BMI and age) had a high sensitivity for polysomnographically diagnosed OSA within the first year after a stroke. The specificity was significantly better than the STOP-BANG or the STOP-BAG questionnaire, although it remained suboptimal at 60.5%.
In 2017, Sico et al41 developed and assessed the SLEEP Inventory (sex, left heart failure, Epworth Sleepiness Scale, enlarged neck, weight in pounds, insulin resistance or diabetes, and National Institutes of Health Stroke Scale) and found that it outperformed the Berlin and STOP-BANG questionnaires in the poststroke setting. The SLEEP Inventory had the best specificity and negative predictive value, and a slightly better ability to correctly classify patients as having OSA or not, classifying 80% of patients correctly.
These newer screening tools (eg, STOP-BAG, STOP-BAG2, SLEEP) can be used to identify with reasonable accuracy which patients need definitive testing after stroke.
Pulse oximetry is another possible screening tool
Overnight pulse oximetry may also help screen for sleep apnea and stratify risk after a stroke. A 2012 study42 of overnight oximetry to screen patients before surgery found that the oxygen desaturation index was significantly associated with the AHI measured by polysomnography. However, oximetry testing cannot distinguish between OSA and central sleep apnea, so it is insufficient to diagnose OSA or qualify patients for therapy. Further study is needed to examine the ability of overnight pulse oximetry to screen or to stratify risk for OSA after stroke.
Polysomnography vs home testing
Polysomnography is the gold standard for diagnosing OSA. Benefits include technical support and trouble-shooting, determining relationships between OSA, body position, and sleep stage, and the ability to intervene with treatment.2 However, polysomnography can be cumbersome, costly, and resource-intensive.
A home sleep apnea test, ie, an unattended, limited-channel sleep study, may be an acceptable alternative.2–4,43,44 Home testing does not require a sleep technologist to be present during testing, uses fewer sensors, and is less expensive than overnight polysomnography, but its utility can be limited: it fails to accurately discriminate between episodes of OSA and central sleep apnea, there is potential for false-negative results, and it can underestimate sleep apnea burden because it does not measure sleep.2
Institutional resources and logistics may influence the choice of diagnostic modality. No data exist on outcomes from different diagnostic testing methods in poststroke patients. Further research is needed.
POSITIVE AIRWAY PRESSURE THERAPY: BENEFITS, CHALLENGES, ALTERNATIVES
The first-line treatment for OSA is positive airway pressure (PAP).3 For most patients, this is continuous PAP (CPAP) or autoadjusting PAP (APAP). In some instances, particularly for those who cannot tolerate CPAP or who have comorbid hypoventilation, bilevel PAP (BPAP) may be indicated. More advanced PAP therapies are unlikely to be used after stroke.
PAP therapy is associated with reduced daytime sleepiness, improved mood, normalization of sleep architecture, improved systemic and pulmonary artery blood pressure, reduced rates of atrial fibrillation after ablation, and improved insulin sensitivity.45–49 Whether it reduces the risk of cardiovascular events, including stroke, remains controversial; most data suggest that it does not.50,51 However, when adherence to PAP therapy is considered rather than intention to treat, treatment has been found to lead to improved cardiovascular outcomes.52
Mixed evidence of benefits after stroke
Observational studies provide evidence that CPAP may help patients with OSA after stroke, although results are mixed.53–58 The studies ranged in size from 14 to 105 patients, enrolled patients with mostly moderate to severe OSA, and followed patients from 10 days to 7 years. Adherence to therapy was generally good in the short term (50%–70%), but only 15% to 30% of patients remained adherent at 5 to 7 years. Variable outcomes were reported, with some studies finding improved symptoms in the near term and mixed evidence of cardiovascular benefit in the longer ones. However, as these studies lacked randomization, drawing definitive conclusions on CPAP efficacy is difficult.
Patients were enrolled in the index admission or when starting a rehabilitation service—generally 2 to 3 weeks after their stroke. No clear association was found between the timing of initiating PAP therapy and outcomes. All patients had ischemic strokes, but few details were provided regarding stroke location, size, and severity. Exclusion criteria included severe underlying cardiopulmonary disease, confusion, severe stroke with marked impairment, and inability to cooperate. Almost all patients had moderate to severe OSA, and patients with central sleep apnea were excluded.
The major outcomes examined were drop-out rates, PAP adherence, and neurologic improvement based on neurologic functional scales (National Institutes of Health Stroke Scale and Canadian Neurologic Scale). As expected, dropout rates were higher in patients randomized to CPAP (OR 1.83, 95% CI 1.05–3.21, P = .03), although overall adherence was better than anticipated, with mean CPAP use across trials of 4.5 hours per night (95% CI 3.97–5.08) and with about 50% to 60% of patients adhering to therapy for at least 4 hours nightly.
Improvement in neurologic outcomes favored CPAP (standard mean difference 0.54, 95% CI 0.026–1.05), although considerable heterogeneity was seen. Improved sleepiness outcomes were inconsistent. Major cardiovascular outcomes were reported in only 2 studies (using the same data set) and showed delayed time to the next cardiovascular event for those treated with CPAP but no difference in cardiovascular event-free survival.
PAP poses more challenges after stroke
The primary limitation to PAP therapy is poor acceptance and adherence to therapy.59 High rates of refusal of therapy and difficulty complying with treatment have been noted in the poststroke population, although recent studies have reported better adherence rates. How rates of adherence play out in real-world settings, outside of the controlled environment of a research study, has yet to be determined.
In general, CPAP adherence is affected by claustrophobia, difficulty tolerating a mask, problems with pressure intolerance, irritating air leaks, nasal congestion, and naso-oral dryness. Many such barriers can be overcome with use of a properly fitted mask, an appropriate pressure setting, heated humidification, nasal sprays (eg, saline, inhaled steroids), and education, encouragement, and reassurance.
After a stroke, additional obstacles may impede the ability to use PAP therapy.68 Facial paresis (hemi- or bifacial) may make fitting of the mask problematic. Paralysis or weakness of the extremities may limit the ability to adjust or remove a mask. Aphasia can impair communication and understanding of the need to use PAP therapy, and upper-airway problems related to stroke, including dysphagia, may lead to pressure intolerance or risk of aspiration. Finally, a lack of perceived benefit, particularly if the patient does not have daytime sleepiness, may limit motivation.
Consider alternatives
For patients unlikely to succeed with PAP therapy, there are alternatives. Surgery and oral appliances are not usually realistic options in the setting of recent stroke, but positional therapy, including the use of body positioners to prevent supine sleep, as well as elevating the head of the bed, may be of some benefit.69,70 A nasopharyngeal airway stenting device (nasal trumpet) may also be tolerated by some patients.
A proposed algorithm for screening, diagnosing, and treating OSA in patients after stroke is presented in Figure 1.
- Selim B, Roux FJ. Stroke and sleep disorders. Sleep Med Clin 2012; 7(4):597–607. doi:10.1016/j.jsmc.2012.08.007
- Kapur VK, Auckley DH, Chowdhuri S, et al. Clinical practice guideline for diagnostic testing for adult obstructive sleep apnea: an American Academy of Sleep Medicine Clinical Practice Guideline. J Clin Sleep Med 2017; 13(3):479–504. doi:10.5664/jcsm.6506
- Epstein LJ, Kristo D, Strollo PJ Jr, et al; Adult Obstructive Sleep Apnea Task Force of the American Academy of Sleep Medicine. Clinical guideline for the evaluation, management, and long-term care of obstructive sleep apnea in adults. J Clin Sleep Med 2009; 5(3):263–276. pmid:19960649
- Patil SP, Schneider H, Schwartz AR, Smith PL. Adult obstructive sleep apnea: pathophysiology and diagnosis. Chest 2007; 132(1):325–337. doi:10.1378/chest.07-0040
- Dempsey JA, Veasey SC, Morgan BJ, O’Donnell CP. Pathophysiology of sleep apnea. Physiol Rev 2010; 90(1):47–112. doi:10.1152/physrev.00043.2008
- Peppard PE, Young T, Barnet JH, Palta M, Hagen EW, Hla KM. Increased prevalence of sleep-disordered breathing in adults. Am J Epidemiol 2013; 177(9):1006–1014. doi:10.1093/aje/kws342
- Redline S, Sotres-Alvarez D, Loredo J, et al. Sleep-disordered breathing in Hispanic/Latino individuals of diverse backgrounds. The Hispanic Community Health Study/Study of Latinos. Am J Resp Crit Care Med 2014; 189(3):335–344. doi:10.1164/rccm.201309-1735OC
- Aaronson JA, van Bennekom CA, Hofman WF, et al. Obstructive sleep apnea is related to impaired cognitive and functional status after stroke. Sleep 2015; 38(9):1431–1437. doi:10.5665/sleep.4984
- Sharma S, Culebras A. Sleep apnoea and stroke. Stroke Vasc Neurol 2016; 1(4):185–191. doi:10.1136/svn-2016-000038
- Huhtakangas JK, Huhtakangas J, Bloigu R, Saaresranta T. Prevalence of sleep apnea at the acute phase of ischemic stroke with or without thrombolysis. Sleep Med 2017; 40:40–46. doi:10.1016/j.sleep.2017.08.018
- Johnson KG, Johnson DC. Frequency of sleep apnea in stroke and TIA patients: a meta-analysis. J Clin Sleep Med 2010; 6(2):131–137. pmid:20411688
- Iranzo A, Santamaria J, Berenguer J, Sanchez M, Chamorro A. Prevalence and clinical importance of sleep apnea in the first night after cerebral infarction. Neurology 2002; 58:911–916. pmid:11914407
- Javaheri S, Barbe F, Campos-Rodriguez F, et al. Sleep apnea: types, mechanisms, and clinical cardiovascular consequences. J Am Coll Cardiol 2017; 69(7):841–858. doi:10.1016/j.jacc.2016.11.069
- Dudley KA, Patel SR. Disparities and genetic risk factors in obstructive sleep apnea. Sleep Med 2016; 18:96–102. doi:10.1016/j.sleep.2015.01.015
- Redline S, Tishler PV. The genetics of sleep apnea. Sleep Med Rev 2000; 4(6):583–602. doi:10.1053/smrv.2000.0120
- Lipford MC, Flemming KD, Calvin AD, et al. Associations between cardioembolic stroke and obstructive sleep apnea. Sleep 2015; 38(11):1699–1705. doi:10.5665/sleep.5146
- Wang Y, Wang Y, Chen J, Yi X, Dong S, Cao L. Stroke patterns, topography, and etiology in patients with obstructive sleep apnea hypopnea syndrome. Int J Clin Exp Med 2017; 10(4):7137–7143.
- Fisse AL, Kemmling A, Teuber A, et al. The association of lesion location and sleep related breathing disorder in patients with acute ischemic stroke. PLoS One 2017; 12(1):e0171243. doi:10.1371/journal.pone.0171243
- Brown DL, Mowla A, McDermott M, et al. Ischemic stroke subtype and presence of sleep-disordered breathing: the BASIC sleep apnea study. J Stroke Cerebrovasc Dis 2015; 24(2):388–393. doi:10.1016/j.jstrokecerebrovasdis.2014.09.007
- Poli M, Philip P, Taillard J, et al. Atrial fibrillation as a major cause of stroke in apneic patients: a prospective study. Sleep Med 2017; 30:251–254. doi:10.1016/j.sleep.2015.07.031
- Young T, Finn L, Peppard PE, et al. Sleep disordered breathing and mortality: eighteen-year follow-up of the Wisconsin Sleep Cohort. Sleep 2008; 31(8):1071–1078. pmid:18714778
- Molnar MZ, Mucsi I, Novak M, et al. Association of incident obstructive sleep apnoea with outcomes in a large cohort of US veterans. Thorax 2015; 70(9):888–895. doi:10.1136/thoraxjnl-2015-206970
- Redline S, Yenokyan G, Gottlieb DJ, et al. Obstructive sleep apnea-hypopnea and incident stroke: the sleep heart health study. Am J Respir Crit Care Med 2010; 182(2):269–277. doi:10.1164/rccm.200911-1746OC
- Marulanda-Londono E, Chaturvedi S. The interplay between obstructive sleep apnea and atrial fibrillation. Fron Neurol 2017; 8:668. doi:10.3389/fneur.2017.00668
- Szymanski FM, Filipiak KJ, Platek AE, Hrynkiewicz-Szymanska A, Karpinski G, Opolski G. Assessment of CHADS2 and CHA 2DS 2-VASc scores in obstructive sleep apnea patients with atrial fibrillation. Sleep Breath 2015; 19(2):531–537. doi:10.1007/s11325-014-1042-5
- Stansbury RC, Strollo PJ. Clinical manifestations of sleep apnea. J Thoracic Dis 2015; 7(9):E298–E310. doi:10.3978/j.issn.2072-1439.2015.09.13
- Chan W, Coutts SB, Hanly P. Sleep apnea in patients with transient ischemic attack and minor stroke: opportunity for risk reduction of recurrent stroke? Stroke 2010; 41(12):2973–2975. doi:10.1161/STROKEAHA.110.596759
- Boulos MI, Wan A, Im J, et al. Identifying obstructive sleep apnea after stroke/TIA: evaluating four simple screening tools. Sleep Med 2016; 21:133–139. doi:10.1016/j.sleep.2015.12.013
- Patel SK, Hanly PJ, Smith EE, Chan W, Coutts SB. Nocturnal hypoxemia is associated with white matter hyperintensities in patients with a minor stroke or transient ischemic attack. J Clin Sleep Med 2015; 11(12):1417–1424. doi:10.5664/jcsm.5278
- McCarty MF, DiNicolantonio JJ, O’Keefe JH. NADPH oxidase, uncoupled endothelial nitric oxide synthase, and NF-KappaB are key mediators of the pathogenic impact of obstructive sleep apnea—therapeutic implications. J Integr Cardiol 2016; 2(5):367–374. doi:10.15761/JIC.1000177
- Good DC, Henkle JQ, Gelber D, Welsh J, Verhulst S. Sleep-disordered breathing and poor functional outcome after stroke. Stroke 1996; 27(2):252–259. pmid:8571419
- Kaneko Y, Hajek VE, Zivanovic V, Raboud J, Bradley TD. Relationship of sleep apnea to functional capacity and length of hospitalization following stroke. Sleep 2003; 26(3):293–297. pmid:12749548
- Yan-fang S, Yu-ping W. Sleep-disordered breathing: impact on functional outcome of ischemic stroke patients. Sleep Med 2009; 10(7):717–719. doi:10.1016/j.sleep.2008.08.006
- Kumar R, Suri JC, Manocha R. Study of association of severity of sleep disordered breathing and functional outcome in stroke patients. Sleep Med 2017; 34:50–56. doi:10.1016/j.sleep.2017.02.025
- Kerner NA, Roose SP. Obstructive sleep apnea is linked to depression and cognitive impairment: evidence and potential mechanisms. Am J Geriatr Psychiatry 2016; 24(6):496–508. doi:10.1016/j.jagp.2016.01.134
- Bartoli F, Lillia N, Lax A, et al. Depression after stroke and risk of mortality: a systematic review and meta-analysis. Stroke Res Treat 2013; 2013:862978. doi:10.1155/2013/862978
- Yaggi HK, Concato J, Kernan WN, Lichtman JH, Brass LM, Mohsenin V. Obstructive sleep apnea as a risk factor for stroke and death. N Engl J Med 2005; 353(19):2034–2041. doi:10.1056/NEJMoa043104
- Xie W, Zheng F, Song X. Obstructive sleep apnea and serious adverse outcomes in patients with cardiovascular or cerebrovascular disease: a PRISMA-compliant systematic review and meta-analysis. Medicine (Baltimore) 2014; 93(29):e336. doi:10.1097/MD.0000000000000336
- Chiu HY, Chen PY, Chuang LP, et al. Diagnostic accuracy of the Berlin questionnaire, STOP-BANG, STOP, and Epworth sleepiness scale in detecting obstructive sleep apnea: a bivariate meta-analysis. Sleep Med Rev 2017; 36:57–70. doi:10.1016/j.smrv.2016.10.004
- Katzan IL, Thompson NR, Uchino K, Foldvary-Schaefer N. A screening tool for obstructive sleep apnea in cerebrovascular patients. Sleep Med 2016; 21:70–76. doi:10.1016/j.sleep.2016.02.001
- Sico JJ, Yaggi HK, Ofner S, et al. Development, validation, and assessment of an ischemic stroke or transient ischemic attack-specific prediction tool for obstructive sleep apnea. J Stroke Cerebrovasc Dis 2017; 26(8):1745–1754. doi:10.1016/j.jstrokecerebrovasdis.2017.03.042
- Chung F, Liao P, Elsaid H, Islam S, Shapiro CM, Sun Y. Oxygen desaturation index from nocturnal oximetry: a sensitive and specific tool to detect sleep-disordered breathing in surgical patients. Anesth Analg 2012; 114(5):993–1000. doi:10.1213/ANE.0b013e318248f4f5
- Boulos MI, Elias S, Wan A, et al. Unattended hospital and home sleep apnea testing following cerebrovascular events. J Stroke Cerebrovasc Dis 2017; 26(1):143–149. doi:10.1016/j.jstrokecerebrovasdis.2016.09.001
- Saletu MT, Kotzian ST, Schwarzinger A, Haider S, Spatt J, Saletu B. Home sleep apnea testing is a feasible and accurate method to diagnose obstructive sleep apnea in stroke patients during in-hospital rehabilitation. J Clin Sleep Med 2018; 14(9):1495–1501. doi:10.5664/jcsm.7322
- Giles TL, Lasserson TJ, Smith BH, White J, Wright J, Cates CJ. Continuous positive airways pressure for obstructive sleep apnoea in adults. Cochrane Database Syst Rev 2006; (3):CD001106. doi:10.1002/14651858.CD001106.pub3
- Fatureto-Borges F, Lorenzi-Filho G, Drager LF. Effectiveness of continuous positive airway pressure in lowering blood pressure in patients with obstructive sleep apnea: a critical review of the literature. Integr Blood Press Control 2016; 9:43–47. doi:10.2147/IBPC.S70402
- Imran TF, Gharzipura M, Liu S, et al. Effect of continuous positive airway pressure treatment on pulmonary artery pressure in patients with isolated obstructive sleep apnea: a meta-analysis. Heart Fail Rev 2016; 21(5):591–598. doi:10.1007/s10741-016-9548-5
- Deng F, Raza A, Guo J. Treating obstructive sleep apnea with continuous positive airway pressure reduces risk of recurrent atrial fibrillation after catheter ablation: a meta-analysis. Sleep Med 2018; 46:5–11. doi:10.1016/j.sleep.2018.02.013
- Seetho IW, Wilding JPH. Sleep-disordered breathing, type 2 diabetes, and the metabolic syndrome. Chronic Resp Dis 2014; 11(4):257–275. doi:10.1177/1479972314552806
- Kim Y, Koo YS, Lee HY, Lee SY. Can continuous positive airway pressure reduce the risk of stroke in obstructive sleep apnea patients? A systematic review and meta-analysis. PloS ONE 2016; 11(1):e0146317. doi:10.1371/journal.pone.0146317
- Yu J, Zhou Z, McEvoy RD, et al. Association of positive airway pressure with cardiovascular events and death in adults with sleep apnea: a systematic review and meta-analysis. JAMA 2017; 318(2):156–166. doi:10.1001/jama.2017.7967
- Peker Y, Glantz H, Eulenburg C, Wegscheider K, Herlitz J, Thunström E. Effect of positive airway pressure on cardiovascular outcomes in coronary artery disease patients with nonsleepy obstructive sleep apnea. The RICCADSA randomized controlled trial. Am J Respir Crit Care Med 2016; 194(5):613–620. doi:10.1164/rccm.201601-0088OC
- Martinez-Garcia MA, Soler-Cataluna JJ, Ejarque-Martinez L, et al. Continuous positive airway pressure treatment reduces mortality in patients with ischemic stroke and obstructive sleep apnea: a 5-year follow-up study. Am J Respir Crit Care Med 2009; 180(1):36–41. doi:10.1164/rccm.200808-1341OC
- Broadley SA, Jorgensen L, Cheek A, et al. Early investigation and treatment of obstructive sleep apnoea after acute stroke. J Clin Neurosci 2007; 14(4):328–333. doi:10.1016/j.jocn.2006.01.017
- Wessendorf TE, Wang YM, Thilmann AF, Sorgenfrei U, Konietzko N, Teschler H. Treatment of obstructive sleep apnoea with nasal continuous positive airway pressure in stroke. Eur Respir J 2001; 18(4):623–629. pmid:11716165
- Bassetti CL, Milanova M, Gugger M. Sleep-disordered breathing and acute ischemic stroke: diagnosis, risk factors, treatment, evolution, and long-term clinical outcome. Stroke 2006; 37(4):967–972. doi:10.1161/01.STR.0000208215.49243.c3
- Palombini L, Guilleminault C. Stroke and treatment with nasal CPAP. Eur J Neurol 2006; 13(2):198–200. doi:10.1111/j.1468-1331.2006.01169.x
- Martínez-García MA, Campos-Rodríguez F, Soler-Cataluña JJ, Catalán-Serra P, Román-Sánchez P, Montserrat JM. Increased incidence of nonfatal cardiovascular events in stroke patients with sleep apnoea: effect of CPAP treatment. Eur Respir J 2012; 39(4):906–912. doi:10.1183/09031936.00011311
- Brill AK, Horvath T, Seiler A, et al. CPAP as treatment of sleep apnea after stroke: a meta-analysis of randomized trials. Neurology 2018; 90(14):e1222–e1230. doi:10.1212/WNL.0000000000005262
- Hsu C, Vennelle M, Li H, Engleman HM, Dennis MS, Douglas NJ. Sleep-disordered breathing after stroke: a randomised controlled trial of continuous positive airway pressure. J Neurol Neurosurg Psychiatry 2006; 77(10):1143–1149. doi:10.1136/jnnp.2005.086686
- Parra O, Sanchez-Armengol A, Bonnin M, et al. Early treatment of obstructive apnoea and stroke outcome: a randomised controlled trial. Eur Resp J 2011; 37(5):1128–1136. doi:10.1183/09031936.00034410
- Ryan CM, Bayley M, Green R, Murray BJ, Bradley TD. Influence of continuous positive airway pressure on outcomes of rehabilitation in stroke patients with obstructive sleep apnea. Stroke 2011; 42(4):1062–1067. doi:10.1161/STROKEAHA.110.597468
- Bravata DM, Concato J, Fried T, et al. Continuous positive airway pressure: evaluation of a novel therapy for patients with acute ischemic stroke. Sleep 2011; 34(9):1271–1277. doi:10.5665/SLEEP.1254
- Parra O, Sanchez-Armengol A, Capote F, et al. Efficacy of continuous positive airway pressure treatment on 5-year survival in patients with ischaemic stroke and obstructive sleep apnea: a randomized controlled trial. J Sleep Res 2015; 24(1):47–53. doi:10.1111/jsr.12181
- Khot SP, Davis AP, Crane DA, et al. Effect of continuous positive airway pressure on stroke rehabilitation: a pilot randomized sham-controlled trial. J Clin Sleep Med 2016; 12(7):1019–1026. doi:10.5664/jcsm.5940
- Aaronson JA, Hofman WF, van Bennekom CA, et al. Effects of continuous positive airway pressure on cognitive and functional outcome of stroke patients with obstructive sleep apnea: a randomized controlled trial. J Clin Sleep Med 2016; 12(4):533–541. doi:10.5664/jcsm.5684
- Gupta A, Shukla G, Afsar M, et al. Role of positive airway pressure therapy for obstructive sleep apnea in patients with stroke: a randomized controlled trial. J Clin Sleep Med 2018; 14(4):511–521. doi:10.5664/jcsm.7034
- Mello-Fujita L, Kim LJ, Palombini Lde O, et al. Treatment of obstructive sleep apnea syndrome associated with stroke. Sleep Med 2015; 16(6):691–696. doi:10.1016/j.sleep.2014.12.017
- Svatikova A, Chervin RD, Wing JJ, Sanchez BN, Migda EM, Brown DL. Positional therapy in ischemic stroke patients with obstructive sleep apnea. Sleep Med 2011; 12(3):262–266. doi:10.1016/j.sleep.2010.12.008
- Souza FJ, Genta PR, de Souza Filho AJ, Wellman A, Lorenzi-Filho G. The influence of head-of-bed elevation in patients with obstructive sleep apnea. Sleep Breath 2017; 21(4):815–820. doi:10.1007/s11325-017-1524-3
KEY POINTS
- A low threshold for evaluating for OSA after a stroke is warranted: the prevalence is high in this population, and risk factors for OSA and its typical clinical picture may not be present.
- Questionnaires can help screen for the likelihood of OSA and the need for more definitive assessment with polysomnography or home sleep apnea testing, tests that pose additional challenges after stroke.
- Positive airway pressure (PAP) therapy remains the first-line treatment for OSA after stroke; it may improve recovery and reduce long-term sequelae of untreated OSA.
- Acceptance of and adherence to PAP therapy can be especially problematic in this population, and alternatives should be considered if needed.
Correction: Subclinical hypothyroidism
In Azim S, Nasr C, “Subclinical hypothyroidism: When to treat,” Cleve Clin J Med 2019; 86(2):101–110, on page 103, in the section “Subclinical hypothyroidism can resolve or progress,” the sentence “The rate of progression to overt hypothyroidism is estimated to be 33% to 35% over 10 to 20 years of follow-up” contained an error. The correct rate of progression is 33% to 55%. This error has been corrected online.
In Azim S, Nasr C, “Subclinical hypothyroidism: When to treat,” Cleve Clin J Med 2019; 86(2):101–110, on page 103, in the section “Subclinical hypothyroidism can resolve or progress,” the sentence “The rate of progression to overt hypothyroidism is estimated to be 33% to 35% over 10 to 20 years of follow-up” contained an error. The correct rate of progression is 33% to 55%. This error has been corrected online.
In Azim S, Nasr C, “Subclinical hypothyroidism: When to treat,” Cleve Clin J Med 2019; 86(2):101–110, on page 103, in the section “Subclinical hypothyroidism can resolve or progress,” the sentence “The rate of progression to overt hypothyroidism is estimated to be 33% to 35% over 10 to 20 years of follow-up” contained an error. The correct rate of progression is 33% to 55%. This error has been corrected online.