User login
PCVs reduced CAP hospitalizations in young children but not other age groups
, but there was no clear impact apparent in other age groups, reported Annemarie van Deursen, MD, of the University Medical Centre (the Netherlands) Utrecht, and her associates.
In the Netherlands, the 7-valent pneumococcal conjugate vaccine (PCV7) was added to the national infant immunization program in 2006; in 2011, PCV7 was replaced by the 10-valent vaccine (PCV10). The investigators undertook a population-based retrospective study during 1999-2014 on all-cause CAP hospitalizations in all ages, identifying 155,994 CAP hospitalizations.
In children aged 0-6 months, the CAP hospitalization rate ratio (RR) was significant from 2012 onward, with an overall post-PCV RR of 0.62 and a RR of 0.19 at the end of the study period in December 2014. In children aged 6 months-1 year, the RR was statistically significant directly after the introduction of PCV, with an overall post-PCV RR of 0.67 and a RR of 0.47 in December 2014, the investigators wrote.
In none of the other age groups did the overall post-PCV hospitalization RR reach statistical significance.
The association of reductions in CAP hospitalizations in children up to 2 years with the introduction of PCV7 “supports the interpretation for a direct causal effect of PCV7, in line with IPD [invasive pneumococcal disease] results that showed a sustained overall IPD reduction in children,” the investigators said. “Furthermore, [during] each subsequent year of the post-PCV period, the reduction in CAP hospitalization rates increased in line with progressive vaccine-type–IPD reduction in the population and limited replacement by nonvaccine type in childhood IPD.”
Read more in Vaccine (2017 Nov 13. doi: 10.1016/j.vaccine.2017.10.090).
FROM VACCINE
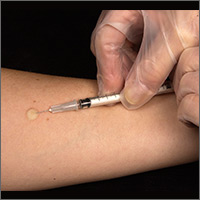
Flu vaccine did not protect children with acute leukemia
said April Sykes of St. Jude Children’s Research Hospital in Carmel, Ind., and her associates.
Patients aged 1-21 years being treated for acute leukemia during three successive influenza seasons (2011-2012, 2012-2013, and 2013-2014) were identified by a retrospective review of EHRs; of those patients, 354 (71%) patients received TIV, and 98 (20%) received a booster dose of flu vaccine.
Also, whether the children and youth received one or two doses of flu vaccine made no difference in the rates of influenza (0.60 vs. 1.02; P = .107), the investigators reported.
These data suggest “that influenza vaccine may be ineffective in children receiving therapy for acute leukemia and that routine administration of TIV may not reflect high-value care,” the researchers said. “Until more immunogenic and protective vaccines are developed, efforts to prevent influenza in high-risk populations should focus on more general strategies, such as avoiding ill persons and practicing good respiratory hygiene in households and health care facilities.”
Read more in the Journal of Pediatrics (2017 Nov 21. doi: 10.1016/j.jpeds.2017.08.071).
FROM THE JOURNAL OF PEDIATRICS
Vaccine exemptions more common in western states
For the 2016-2017 school year, 2% of American kindergarten students had an exemption from one or more vaccines, said Ranee Seither and associates at the National Center of Immunization and Respiratory Disease, Centers for Disease Control and Prevention, Atlanta.
Among the 46 states – including the District of Columbia – that reported data, nine times as many exemptions were granted on religious or philosophical grounds (1.8%) as were granted for medical reasons (0.2%), they said.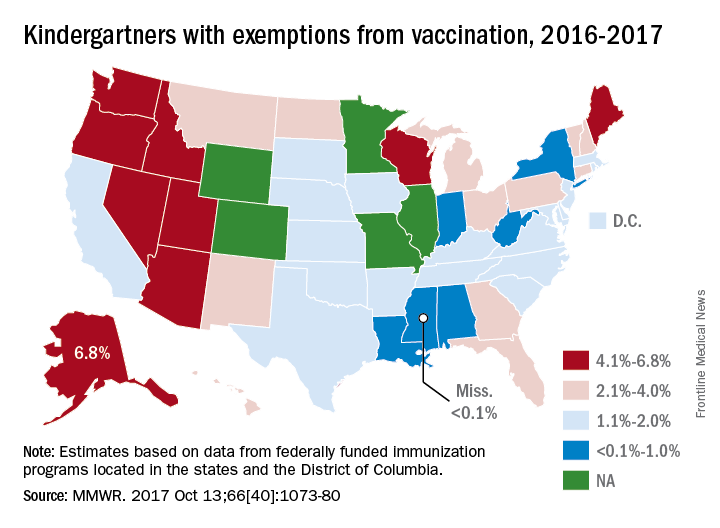
Alaska had the highest rate of medical exemptions at 1.5% and Oregon had the highest rate of religious/philosophical exemptions at 6.5%. Thirty states do not allow philosophical exemptions, Arizona and Mississippi do not allow religious exemptions, and West Virginia does not allow either, they noted.
Exemption data were reported for 3,666,870 kindergartners for the 2016-2017 school year and collected by federally funded immunization programs in the 50 states and D.C.
FROM MMWR
Hawaii experiencing a statewide outbreak of mumps
As of Nov. 30, 2017, 636 cases of mumps had been confirmed in Hawaii, according to the state’s Department of Health (DOH).
The Hawaii DOH originally reported 14 confirmed mumps cases statewide in April 2017, but the number of confirmed cases has increased by more than 4,000% since that time.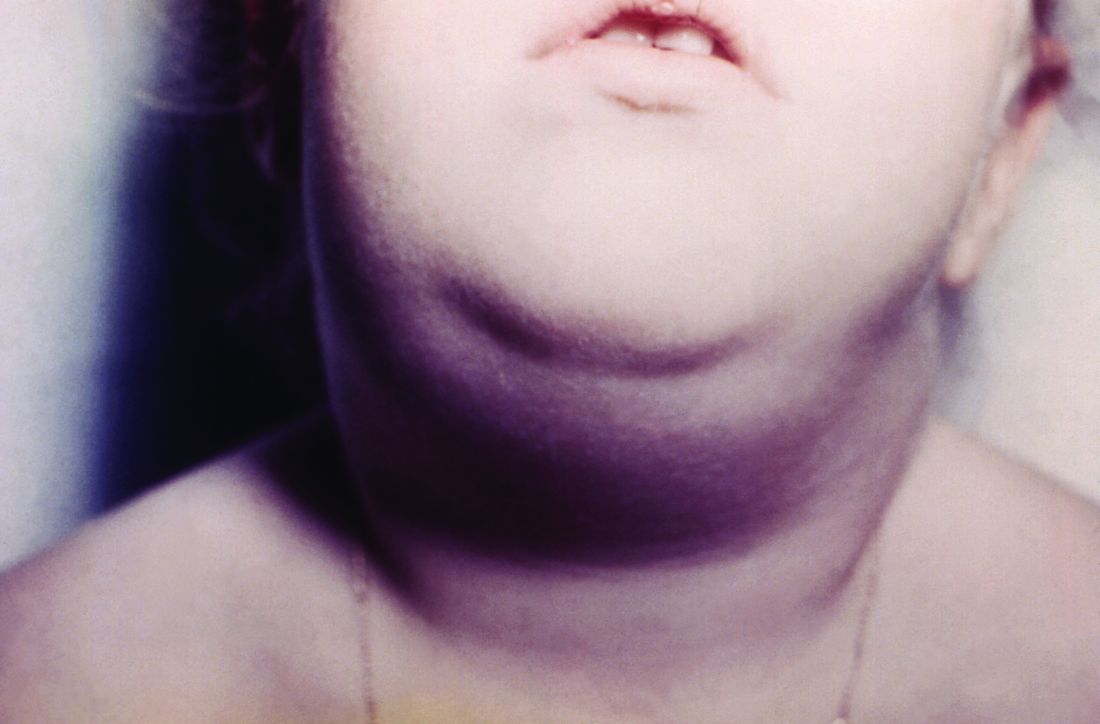
In the midst of the outbreak, the Hawaii DOH recommends that all adolescents between the aged 10-19 years old, and adults born in or after 1957, should receive an additional MMR vaccine dose as soon as possible. The outbreak dose is recommended regardless of previous vaccination or documented immunity to mumps. Administering additional doses of vaccine is not an ideal situation, the DOH noted, but said it should not cause any medical complications.
The Hawaii DOH will investigate mumps cases statewide as the outbreak continues.
More states allowing pharmacists to administer vaccines to younger patients
.
Since the 1990s, states have made laws to increase access to immunization services by giving pharmacists authority to give vaccines, said Cason D. Schmit, JD, of Texas A&M University at College Station, and Matthew S. Penn, JD, director of the Public Health Law Program at the Centers for Disease Control and Prevention, Atlanta. This has the advantage of pharmacies being open longer hours than most physicians’ offices, in addition to the opportunities for immunizing people in rural locations as well as those people without a regular physician.
Yet barriers to pharmacists’ providing immunization services remain because of some state laws. Laws in nine states that prevent pharmacists from vaccinating patients younger than age 18 years keep pharmacists from administering any of the vaccines listed in the 2016 Advisory Committee of Immunization Practices child immunization schedule. The two states in which pharmacists can vaccinate patients as young as 14 years allow the pharmacists to administer only the recommended booster for meningococcal vaccine and annual influenza vaccines for children. And the 15 states with minimum patient age restrictions for 7- to 12-year-oldss allow pharmacists to administer only the four vaccines ACIP recommends on the 2016 schedule for children (meningococcal, Tdap, human papillomavirus, and annual influenza vaccines).
Read more in the Journal of the American Pharmacists Association (2017 Nov-Dec;57[6]:661-9).
FROM THE JOURNAL OF THE AMERICAN PHARMACISTS ASSOCIATION
Adolescents with chronic health conditions often undervaccinated
said Annika M. Hofstetter, MD, PhD, of Columbia University, New York, and her associates.
The National Health Interview Survey on Disability in 1994-1995 estimated that chronic conditions of any type affected 15%-18% of U.S. children and adolescents. The Advisory Committee on Immunization Practices recommends that all adolescents, whether or not they have chronic medical condition, be vaccinated with human papillomavirus (HPV), Tdap, meningococcal, and flu vaccines.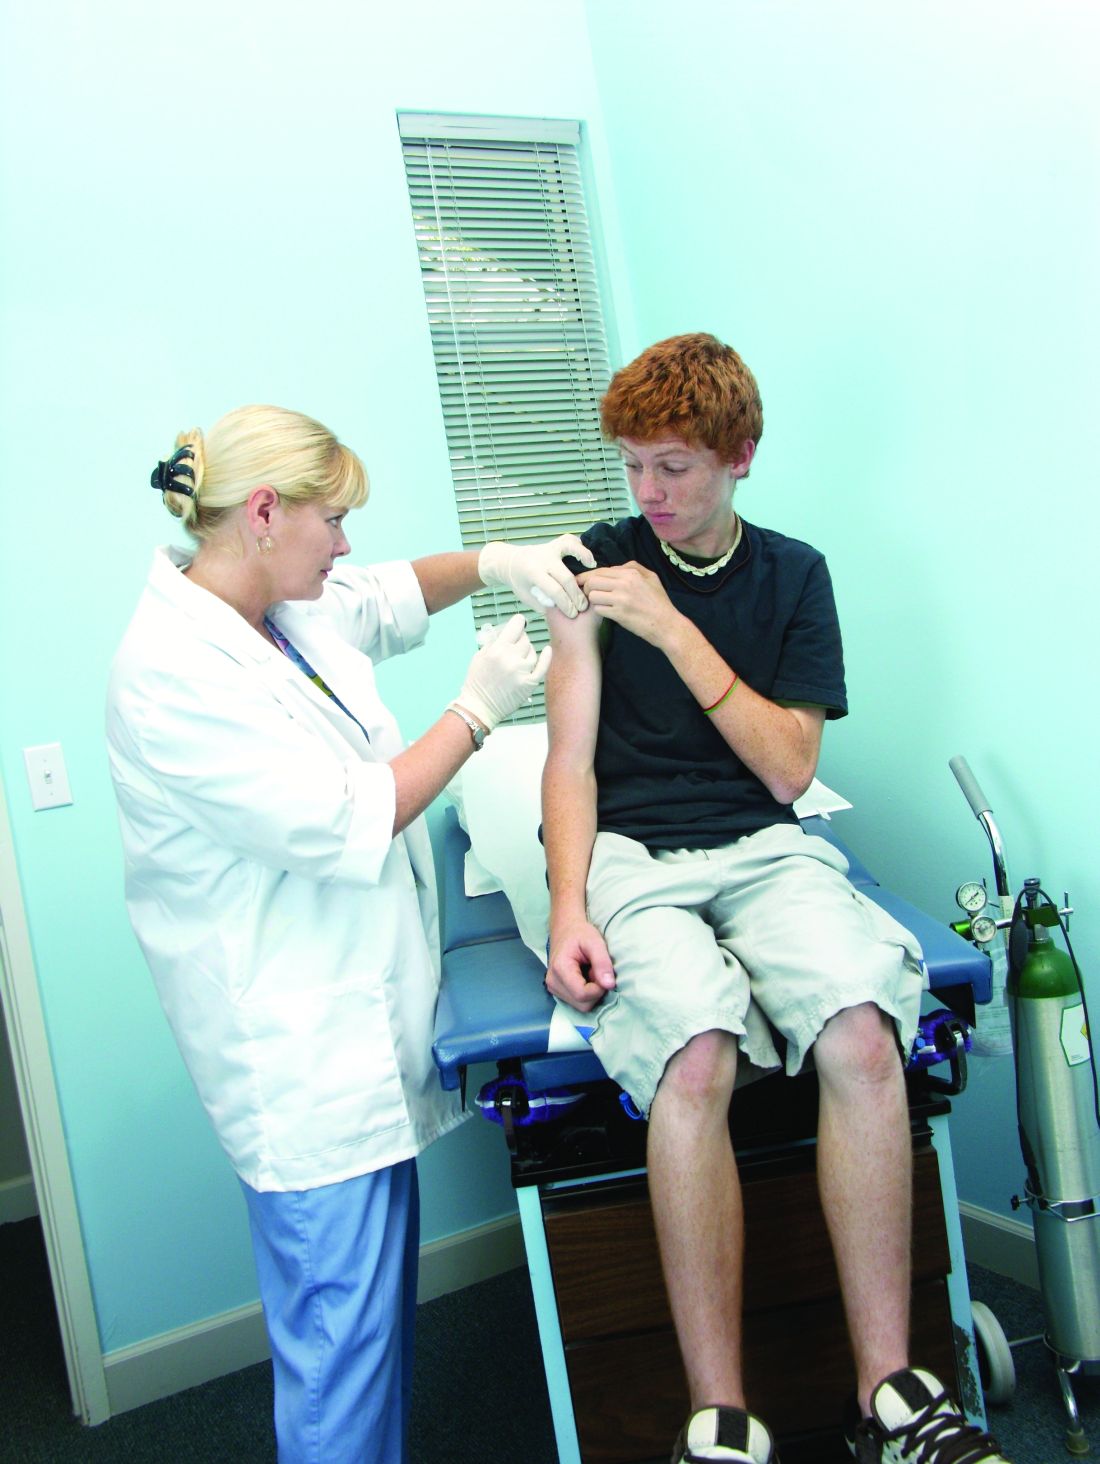
Fewer adolescents with CMCs had received one more doses of HPV (81%), than did those without CMCs (85%; P less than .01). Fewer adolescents with epilepsy (63%), mental retardation (58%), cerebral palsy (54%), and autism spectrum disorder (46%) had started HPV vaccination, compared with those without each of these conditions (84%; all comparisons, P less than .001). No differences were seen for asthma or congenital heart disease, the investigators said.
More adolescents with CMCs had gotten their flu shot than did those without CMCs during the 2011-2012 season (67% vs. 50%; P less than .001) or during the 2012-2013 season (74% vs. 65%; P less than .001). More adolescents with asthma got their flu shot than did those without asthma during the 2011-2012 season (69% vs. 51%; P less than .001) or during the 2012-2013 season (74% vs. 65%; P less than .001). No differences were seen for the other common CMCs.
Nonetheless, the mean number of missed opportunities was significantly higher among unvaccinated adolescents with CMCs, compared with those without CMCs, for the first HPV vaccination, meningococcal vaccination, and influenza vaccination in both seasons measured (P less than .001 for all).
“Missed opportunities for the third HPV vaccine dose or Tdap did not differ by CMC status,” Dr. Hofstetter and her associates said.
Read more in the American Journal of Preventive Medicine (2017 Nov;53[5]:680-8).
FROM THE AMERICAN JOURNAL OF PREVENTIVE MEDICINE
Mississippi has highest varicella vaccination rate
Coverage for two doses of varicella vaccine among kindergarten students was highest in Mississippi and lowest in the District of Columbia, said Ranee Seither and associates at the National Center of Immunization and Respiratory Disease at the Centers for Disease Control and Prevention, Atlanta.
For the 2016-2017 school year, 99.4% of Mississippi children enrolled in kindergarten received the state-required two doses of varicella vaccine, compared with 84.6% in D.C. The median was 93.8% for the 42 states that require two doses and 96.5% for those 42 plus the 7 states that reported and only require one dose. Oklahoma and Wyoming “did not report data because of widespread problems with the quality of data reported by schools,” the CDC investigators wrote (MMWR 2017;66[40]:1073-80).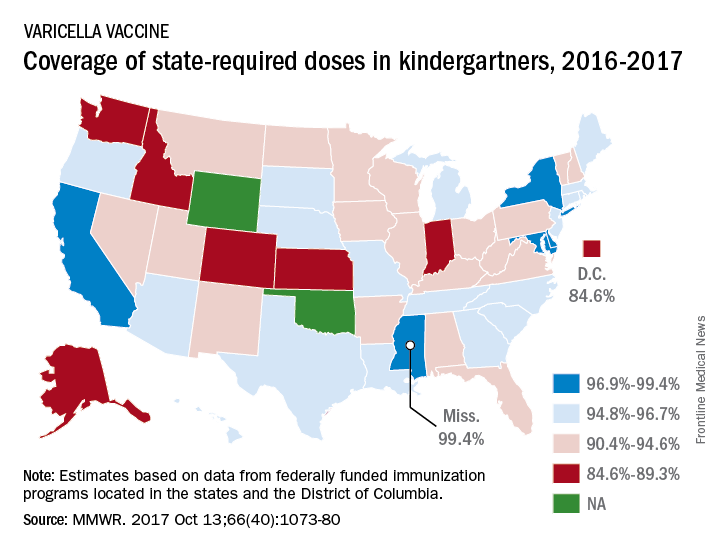
The data for the CDC analysis, which included 3,973,172 kindergartners for the 2016-2017 school year, were collected by federally funded immunization programs in the 50 states and D.C.
FROM MMWR
The new shingles vaccine: What PCPs need to know
Resources
- US Food and Drug Administration. Shingrix. Available at: https://www.fda.gov/BiologicsBloodVaccines/Vaccines/ApprovedProducts/ucm581491.htm. Accessed November 17, 2017.
- Hales CM, Harpaz R, Ortego-Sanchez I, et al. Update on recommendations for the use of herpes zoster vaccine. MMWR Morb Mortal Wkly Rep. 2014;63:729-731.
- Centers for Disease Control and Prevention. Herpes Zoster Work Group Activity Update. June 21, 2017. Available at: https://www.cdc.gov/vaccines/acip/meetings/downloads/slides-2017-06/zoster-01-belongia.pdf. Accessed October 27, 2017.
- Centers for Disease Control and Prevention. Vaccination. Available at: https://www.cdc.gov/shingles/vaccination.html. Accessed November 17, 2017.
- Meeting of the Advisory Committee on Immunization Practices (ACIP). Atlanta, Ga; October 25-26, 2017. Available at: https://www.cdc.gov/vaccines/acip/meetings/downloads/agenda-archive/agenda-2017-10.pdf. Accessed November 20, 2017.

Which interventions are effective in managing parental vaccine refusal?
EVIDENCE SUMMARY
A systematic review analyzed 30 predominantly US studies with more than 8000 patients published between 1990 and 2012 (4 RCTs, 7 nonrandomized clinical trials, 13 before/after intervention trials, and 6 evaluation studies) to evaluate interventions that decreased parental vaccine refusal and hesitancy.1 Interventions included: change in state law, changes in state and school policies, and family-centered education initiatives.
Four studies that evaluated the impact of state laws concerning personal exemption (in addition to religious exemption) consistently found that total nonmedical exemption rates were higher in states that allowed personal exemptions. One nationwide survey found that total nonmedical exemption rates were 2.54 times higher (95% confidence interval [CI], 1.68-3.83) in states that allowed personal exemption than in states where only religious nonmedical exemption was allowed.
Fifteen studies evaluated the impact of educational initiatives on parental attitude towards vaccination; 8 of them reported statistically significant changes. None of the studies demonstrated a change in vaccination rates, however. Citing the generally low quality of the studies, the review authors concluded that they didn’t have convincing evidence that educational interventions reduced vaccine hesitancy.
Herd immunity is an iffy motivator
A systematic review analyzed 29 studies from western nations (17 qualitative and 12 quantitative, 4650 patients) regarding willingness to immunize children for the benefit of the community.2 Of the 17 qualitative studies, only 2 (164 patients) identified benefit to others as a motivating factor in parents’ decisions to immunize their children. In the 12 quantitative studies, a wide range of parents (1% to 60%) rated the concept of benefit to others as a reason for immunization. Overall, approximately one-third of parents listed herd immunity as a motivating reason. The authors concluded that the high heterogeneity of the studies made it unclear whether herd immunity was a motivating factor in childhood immunizations.
Multifaceted interventions, education, and tailored approaches may all work
A systematic review of international studies published between 2007 and 2013 investigated interventions to increase uptake of routinely recommended immunizations in groups with vaccine hesitancy and reduced use.3 Authors identified 189 articles (trial types and number of patients not given) that provided outcome measures.
Interventions that resulted in at least a 25% increase in vaccine uptake were primarily multifaceted, including elements of: targeting undervaccinated populations, improving access or convenience, educational initiatives, and mandates. Interventions that produced a greater than 20% increase in knowledge were generally educational interventions embedded in routine processes such as clinic visits.
The authors noted wide variation between studies in effect size, settings, and target populations. They concluded that interventions tailored to specific populations and concerns were likely to work best.
Corrective information doesn’t help with the most worried parents
A subsequent RCT tested whether correcting the myth that the flu vaccine can give people the flu would reduce belief in the misconception, increase perceptions that the flu vaccine is safe, and increase vaccination intent.4 Respondents to a national online poll of 1000 people received one of 3 interventions: correctional education (information debunking the myth), risk education (information about the risks of influenza infection), or no additional education.
Corrective information about the flu vaccine reduced the false belief that the vaccine can cause the flu by 15% to 20% and that the flu vaccine is unsafe by 5% to 10% (data from graphs; P<.05 for both effects). However, corrective information actually decreased parental intention to vaccinate among the group most concerned about the adverse effects of the vaccine (data from graph and text: +5% in the low-concern group vs −18% in the high-concern group; P<.05).
A presumptive approach works—but at a cost
A subsequent observational study videotaped 111 patient-provider vaccine discussions.5 Researchers categorized the initiation of the vaccine discussion as presumptive (eg, “We have to do some shots.”) or participatory (eg, “What do you want to do about shots?”). Using a presumptive style was more likely to result in acceptance of all recommended vaccines by the end of the visit (90% vs 17%; P<.05), but it decreased the chance of a highly rated visit experience (63% vs 95%; P<.05).
RECOMMENDATIONS
The 2015 Centers for Disease Control and Prevention (CDC) Pink Book recommends a combination of strategies, aimed at both providers and the public, for increasing and maintaining high immunization rates. The Pink Book advises providers to be ready to address vaccine safety concerns raised by parents.6
In a 2012 guideline, the CDC encouraged providers to listen attentively, be ready with scientific information and reliable resources, and use appropriate anecdotes in communicating with vaccine-hesitant parents.7 The guideline recommended against excluding families who refuse vaccination from the practice.
1. Sadaf A, Richards JL, Glanz J, et al. A systematic review of interventions for reducing parental vaccine refusal and vaccine hesitancy. Vaccine. 2013;31:4293-42304.
2. Quadri-Sheriff M, Hendrix K, Downs S, et al. The role of herd immunity in parents’ decision to vaccinate children: a systematic review. Pediatrics. 2012;130:522-530.
3. Jarrett C, Wilson R, O’Leary M, et al. Strategies for addressing vaccine hesitancy: a systematic review. Vaccine. 2015;33:4180-4190.
4. Nyhan B, Reifler J. Does correcting myths about the flu vaccine work? An experimental evaluation of the effects of corrective information. Vaccine. 2015;33:459-464.
5. Opel DJ, Mangione-Smith R, Robinson JD, et al. The influence of provider communication behaviors on parental vaccine acceptance and visit experience. Am J Public Health. 2015;105:1998-2004.
6. Centers for Disease Control and Prevention. Immunization Strategies for Healthcare Practices and Providers. Available at: http://www.cdc.gov/vaccines/pubs/pinkbook/strat.html. Accessed May 11, 2016.
7. Centers for Disease Control and Prevention. Provider Resources for Vaccine Conversations with Parents. Available at: http://www.cdc.gov/vaccines/hcp/conversations/about-vacc-conversations.html. Accessed May 11, 2016.
EVIDENCE SUMMARY
A systematic review analyzed 30 predominantly US studies with more than 8000 patients published between 1990 and 2012 (4 RCTs, 7 nonrandomized clinical trials, 13 before/after intervention trials, and 6 evaluation studies) to evaluate interventions that decreased parental vaccine refusal and hesitancy.1 Interventions included: change in state law, changes in state and school policies, and family-centered education initiatives.
Four studies that evaluated the impact of state laws concerning personal exemption (in addition to religious exemption) consistently found that total nonmedical exemption rates were higher in states that allowed personal exemptions. One nationwide survey found that total nonmedical exemption rates were 2.54 times higher (95% confidence interval [CI], 1.68-3.83) in states that allowed personal exemption than in states where only religious nonmedical exemption was allowed.
Fifteen studies evaluated the impact of educational initiatives on parental attitude towards vaccination; 8 of them reported statistically significant changes. None of the studies demonstrated a change in vaccination rates, however. Citing the generally low quality of the studies, the review authors concluded that they didn’t have convincing evidence that educational interventions reduced vaccine hesitancy.
Herd immunity is an iffy motivator
A systematic review analyzed 29 studies from western nations (17 qualitative and 12 quantitative, 4650 patients) regarding willingness to immunize children for the benefit of the community.2 Of the 17 qualitative studies, only 2 (164 patients) identified benefit to others as a motivating factor in parents’ decisions to immunize their children. In the 12 quantitative studies, a wide range of parents (1% to 60%) rated the concept of benefit to others as a reason for immunization. Overall, approximately one-third of parents listed herd immunity as a motivating reason. The authors concluded that the high heterogeneity of the studies made it unclear whether herd immunity was a motivating factor in childhood immunizations.
Multifaceted interventions, education, and tailored approaches may all work
A systematic review of international studies published between 2007 and 2013 investigated interventions to increase uptake of routinely recommended immunizations in groups with vaccine hesitancy and reduced use.3 Authors identified 189 articles (trial types and number of patients not given) that provided outcome measures.
Interventions that resulted in at least a 25% increase in vaccine uptake were primarily multifaceted, including elements of: targeting undervaccinated populations, improving access or convenience, educational initiatives, and mandates. Interventions that produced a greater than 20% increase in knowledge were generally educational interventions embedded in routine processes such as clinic visits.
The authors noted wide variation between studies in effect size, settings, and target populations. They concluded that interventions tailored to specific populations and concerns were likely to work best.
Corrective information doesn’t help with the most worried parents
A subsequent RCT tested whether correcting the myth that the flu vaccine can give people the flu would reduce belief in the misconception, increase perceptions that the flu vaccine is safe, and increase vaccination intent.4 Respondents to a national online poll of 1000 people received one of 3 interventions: correctional education (information debunking the myth), risk education (information about the risks of influenza infection), or no additional education.
Corrective information about the flu vaccine reduced the false belief that the vaccine can cause the flu by 15% to 20% and that the flu vaccine is unsafe by 5% to 10% (data from graphs; P<.05 for both effects). However, corrective information actually decreased parental intention to vaccinate among the group most concerned about the adverse effects of the vaccine (data from graph and text: +5% in the low-concern group vs −18% in the high-concern group; P<.05).
A presumptive approach works—but at a cost
A subsequent observational study videotaped 111 patient-provider vaccine discussions.5 Researchers categorized the initiation of the vaccine discussion as presumptive (eg, “We have to do some shots.”) or participatory (eg, “What do you want to do about shots?”). Using a presumptive style was more likely to result in acceptance of all recommended vaccines by the end of the visit (90% vs 17%; P<.05), but it decreased the chance of a highly rated visit experience (63% vs 95%; P<.05).
RECOMMENDATIONS
The 2015 Centers for Disease Control and Prevention (CDC) Pink Book recommends a combination of strategies, aimed at both providers and the public, for increasing and maintaining high immunization rates. The Pink Book advises providers to be ready to address vaccine safety concerns raised by parents.6
In a 2012 guideline, the CDC encouraged providers to listen attentively, be ready with scientific information and reliable resources, and use appropriate anecdotes in communicating with vaccine-hesitant parents.7 The guideline recommended against excluding families who refuse vaccination from the practice.
1. Sadaf A, Richards JL, Glanz J, et al. A systematic review of interventions for reducing parental vaccine refusal and vaccine hesitancy. Vaccine. 2013;31:4293-42304.
2. Quadri-Sheriff M, Hendrix K, Downs S, et al. The role of herd immunity in parents’ decision to vaccinate children: a systematic review. Pediatrics. 2012;130:522-530.
3. Jarrett C, Wilson R, O’Leary M, et al. Strategies for addressing vaccine hesitancy: a systematic review. Vaccine. 2015;33:4180-4190.
4. Nyhan B, Reifler J. Does correcting myths about the flu vaccine work? An experimental evaluation of the effects of corrective information. Vaccine. 2015;33:459-464.
5. Opel DJ, Mangione-Smith R, Robinson JD, et al. The influence of provider communication behaviors on parental vaccine acceptance and visit experience. Am J Public Health. 2015;105:1998-2004.
6. Centers for Disease Control and Prevention. Immunization Strategies for Healthcare Practices and Providers. Available at: http://www.cdc.gov/vaccines/pubs/pinkbook/strat.html. Accessed May 11, 2016.
7. Centers for Disease Control and Prevention. Provider Resources for Vaccine Conversations with Parents. Available at: http://www.cdc.gov/vaccines/hcp/conversations/about-vacc-conversations.html. Accessed May 11, 2016.
Evidence-based answers from the Family Physicians Inquiries Network
EVIDENCE-BASED ANSWER:
It’s unclear whether educational initiatives alone alter vaccine refusal. Although about a third of parents cite herd immunity as motivation for vaccination, its efficacy in addressing vaccine hesitancy isn’t clear (strength of recommendation [SOR]: B, systematic reviews not limited to randomized controlled trials [RCTs]).
Multifaceted interventions (encompassing improved access to vaccines, immunization mandates, and patient education) may produce a ≥25% increase in vaccine uptake in groups with vaccine hesitancy and low utilization (SOR: B, extrapolated from a meta-analysis across diverse cultures).
Correcting false information about influenza vaccination improves perceptions about the vaccine, but may decrease intention to vaccinate in parents who already have strong concerns about safety (SOR: C, low-quality RCT).
Discussions about vaccines that are more paternalistic (presumptive rather than participatory) are associated with higher vaccination rates, but lower visit satisfaction (SOR: C, observational study).
Providers should thoroughly address patient concerns about safety and encourage vaccine use (SOR: C, expert opinion).

Screening for tuberculosis: Updated recommendations
Tuberculosis (TB) remains a significant public health problem worldwide with an estimated 10.4 million new cases and 1.7 million deaths having occurred in 2016.1 In that same year, there were 9287 new cases in the United States—the lowest number of TB cases on record.2
TB appears in one of 2 forms: active disease, which causes symptoms, morbidity, and mortality and is a source of transmission to others; and latent TB infection (LTBI), which is asymptomatic and noninfectious but can progress to active disease. The estimated prevalence of LTBI worldwide is 23%,3 although in the United States it is only about 5%.4 The proportion of those with LTBI who will develop active disease is estimated at 5% to 10% and is highly variable depending on risks.4
In the United States, about two-thirds of active TB cases occur among those who are foreign born, whose rate of active disease is 14.6/100,000.2 Five countries account for more than half of foreign-born cases: Mexico, the Philippines, India, Vietnam, and China.2
Who should be tested?
A major public health strategy for controlling TB in the United States is targeted screening for LTBI and treatment to prevent progression to active disease. The US Preventive Services Task Force (USPSTF) recommends screening for LTBI in adults age 18 and older who are at high risk of TB infection.4 This is consistent with recommendations from the Centers for Disease Control and Prevention (CDC), although the CDC also recommends testing infants and children
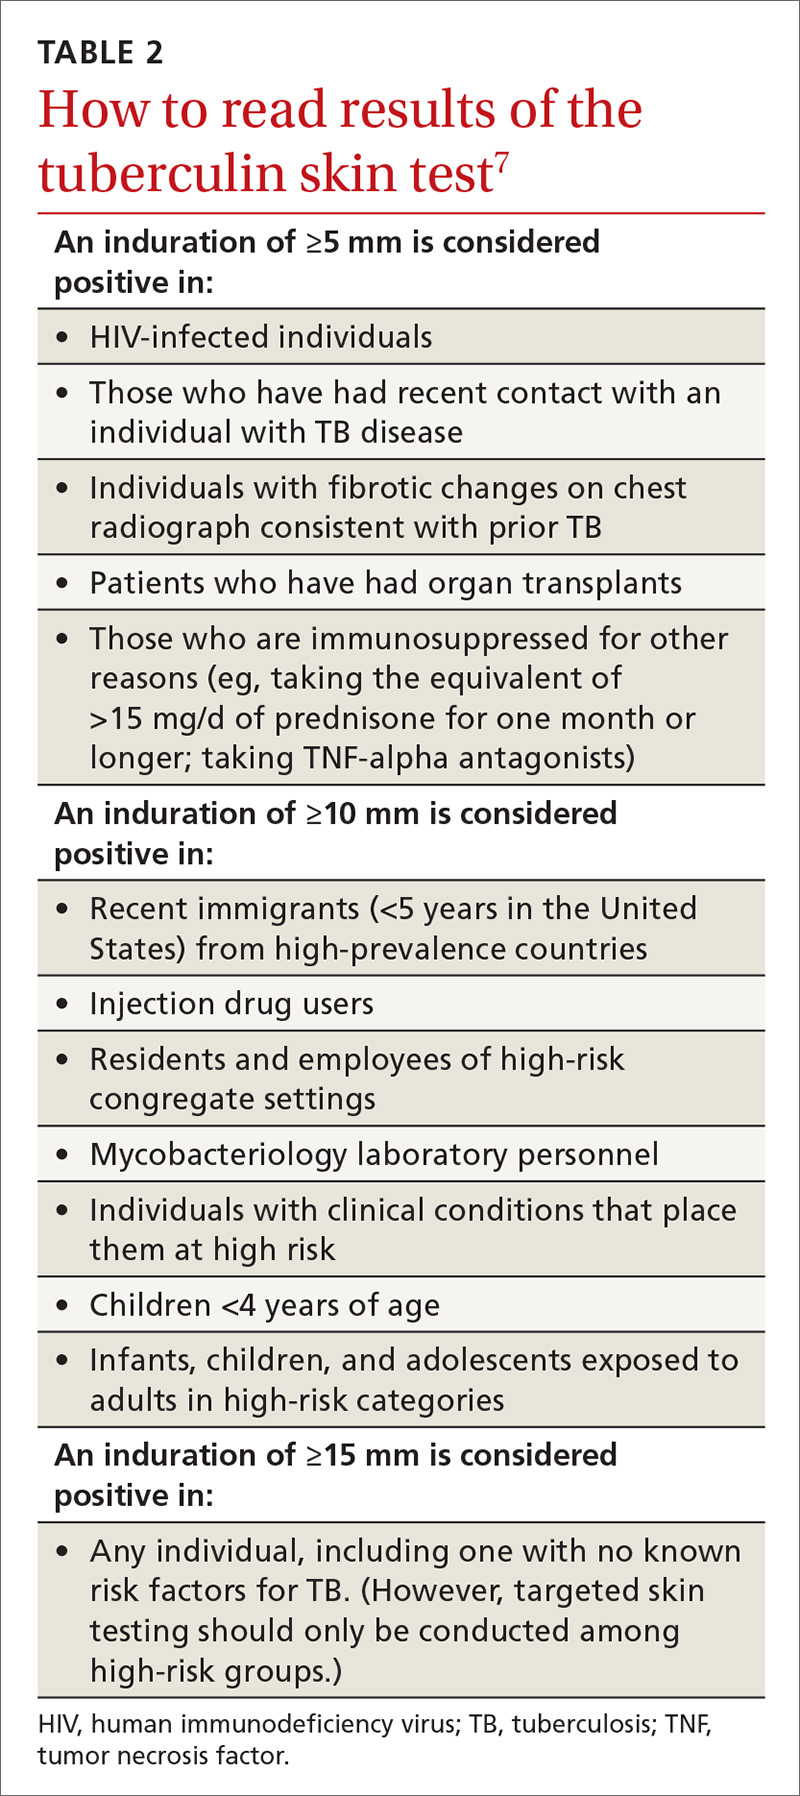
Two types of testing are available for TB screening: the TB skin test (TST) and the interferon-gamma release assay (IGRA). There are 2 IGRA test options: T-SPOT. TB (Oxford Immunotec) and QuantiFERON-TB Gold (Qiagen). The TST and IGRA each has advantages and disadvantages. The TST must be placed intradermally and read correctly, and the patient must return for the interpretation 48 to 72 hours after placement. Test interpretation depends on the patient’s risk category, with either a 5-mm, 10-mm, or 15-mm induration being classified as a positive result (TABLE 27).
IGRA is a blood test that needs to be processed within a limited time frame and is more expensive than the TST. The USPSTF lists the sensitivity and specificity of each option as follows: TST, using a 10-mm cutoff, 79%, 97%; T-SPOT, 90%, 95%; QuantiFERON-TB Gold In-Tube, 80%, 97%.4
Which test to use?
Recently the CDC, the American Thoracic Society, and the Infectious Diseases Society of America jointly published revised recommendations on TB testing:8
- For children younger than 5 years, TST is the preferred option, although IGRA is acceptable in children older than 3 years of age.
- For individuals at high risk of infection but not at high risk of disease progression, IGRA is recommended if they have received a bacille Calmette-Guerin vaccine or are unlikely to return for TST interpretation.
- For others at high risk of infection but not at high risk of disease progression, IGRA is preferred but TST is acceptable.
- For those who have both a high risk of infection and a high risk of disease progression, evidence is insufficient to recommend one test over another; either type is acceptable.
- For those with neither high risk of infection nor high risk of disease progression, testing is not recommended. However, it may be required by law or for credentialing of some kind (eg, for some health professionals or those who work in schools or nursing homes). If this is the case, IGRA is suggested as the preferred test. If the test result is positive, performing a second test is advised (either TST or an alternative type of IGRA). Consider the individual to be infected only if the second test result is also positive.
If a TB screening result is positive, confirm or rule out active TB by asking about symptoms (cough, fever, weight loss) and performing a chest x-ray. If the radiograph shows signs of active TB, collect 3 sputum samples by induction for analysis by smear microscopy, culture, and, possibly, nucleic acid amplification and rifampin susceptibility testing. Consider consulting your local public health department for advice on, or assistance with, sample collection. Report LTBI to the local health department and seek advice on the appropriate tests and treatments.
Expanded treatment selections
With LTBI there are now 4 treatment options for patients and physicians to consider:9 isoniazid given daily or twice weekly for either 6 or 9 months; isoniazid and rifapentine given once weekly for 3 months; or rifampin given daily for 4 months. Factors influencing treatment selection include a patient’s age, concomitant conditions, and the likelihood of bacterial resistance. Free treatment for LTBI may be available; again, check with your local health department.
1. WHO. Global tuberculosis report 2017. Geneva, Switzerland: World Health Organization. Available at: http://www.who.int/tb/publications/global_report/en/. Accessed November 8, 2017.
2. Schmit KM, Wansaula Z, Pratt R, et al. Tuberculosis—United States, 2016. MMWR Morb Mortal Wkly Rep. 2017;66:289-294.
3. Houben RMGJ, Dodd PJ. The global burden of latent tuberculosis infection: a re-estimation using mathematical modelling. PLoS Med. 2016;13(10):e1002152. Available at: http://journals.plos.org/plosmedicine/article?id=10.1371/journal.pmed.1002152. Accessed November 10, 2017.
4. USPSTF. Screening for latent tuberculosis infection in adults: US Preventive Services Task Force recommendation statement. JAMA. 2016;316:962-969.
5. CDC. Tuberculosis. Who should be tested. Available at: https://www.cdc.gov/tb/topic/testing/whobetested.htm. Accessed November 8, 2017.
6. CDC. Latent tuberculosis infection: a guide for primary health care providers. Targeted testing for tuberculosis. Available at: https://www.cdc.gov/tb/publications/ltbi/targetedtesting.htm#identifyingTBDisease. Accessed November 8, 2017.
7. CDC. TB elimination. Tuberculin skin testing. Available at: https://www.cdc.gov/tb/publications/factsheets/testing/skintesting.pdf. Accessed November 8, 2017.
8. Lewinsohn DM, Leonard MK, LoBue PA, el al. Official American Thoracic Society/Infectious Diseases Society of America/Centers for Disease Control and Prevention Clinical Practice Guidelines: Diagnosis of tuberculosis in adults and children. Clin Infect Dis. 2017;64:111-115.
9. CDC. Treatment regimens for latent TB infection (LTBI). Available at: https://www.cdc.gov/tb/topic/treatment/ltbi.htm. Accessed November 8, 2017.
Tuberculosis (TB) remains a significant public health problem worldwide with an estimated 10.4 million new cases and 1.7 million deaths having occurred in 2016.1 In that same year, there were 9287 new cases in the United States—the lowest number of TB cases on record.2
TB appears in one of 2 forms: active disease, which causes symptoms, morbidity, and mortality and is a source of transmission to others; and latent TB infection (LTBI), which is asymptomatic and noninfectious but can progress to active disease. The estimated prevalence of LTBI worldwide is 23%,3 although in the United States it is only about 5%.4 The proportion of those with LTBI who will develop active disease is estimated at 5% to 10% and is highly variable depending on risks.4
In the United States, about two-thirds of active TB cases occur among those who are foreign born, whose rate of active disease is 14.6/100,000.2 Five countries account for more than half of foreign-born cases: Mexico, the Philippines, India, Vietnam, and China.2
Who should be tested?
A major public health strategy for controlling TB in the United States is targeted screening for LTBI and treatment to prevent progression to active disease. The US Preventive Services Task Force (USPSTF) recommends screening for LTBI in adults age 18 and older who are at high risk of TB infection.4 This is consistent with recommendations from the Centers for Disease Control and Prevention (CDC), although the CDC also recommends testing infants and children
Two types of testing are available for TB screening: the TB skin test (TST) and the interferon-gamma release assay (IGRA). There are 2 IGRA test options: T-SPOT. TB (Oxford Immunotec) and QuantiFERON-TB Gold (Qiagen). The TST and IGRA each has advantages and disadvantages. The TST must be placed intradermally and read correctly, and the patient must return for the interpretation 48 to 72 hours after placement. Test interpretation depends on the patient’s risk category, with either a 5-mm, 10-mm, or 15-mm induration being classified as a positive result (TABLE 27).
IGRA is a blood test that needs to be processed within a limited time frame and is more expensive than the TST. The USPSTF lists the sensitivity and specificity of each option as follows: TST, using a 10-mm cutoff, 79%, 97%; T-SPOT, 90%, 95%; QuantiFERON-TB Gold In-Tube, 80%, 97%.4
Which test to use?
Recently the CDC, the American Thoracic Society, and the Infectious Diseases Society of America jointly published revised recommendations on TB testing:8
- For children younger than 5 years, TST is the preferred option, although IGRA is acceptable in children older than 3 years of age.
- For individuals at high risk of infection but not at high risk of disease progression, IGRA is recommended if they have received a bacille Calmette-Guerin vaccine or are unlikely to return for TST interpretation.
- For others at high risk of infection but not at high risk of disease progression, IGRA is preferred but TST is acceptable.
- For those who have both a high risk of infection and a high risk of disease progression, evidence is insufficient to recommend one test over another; either type is acceptable.
- For those with neither high risk of infection nor high risk of disease progression, testing is not recommended. However, it may be required by law or for credentialing of some kind (eg, for some health professionals or those who work in schools or nursing homes). If this is the case, IGRA is suggested as the preferred test. If the test result is positive, performing a second test is advised (either TST or an alternative type of IGRA). Consider the individual to be infected only if the second test result is also positive.
If a TB screening result is positive, confirm or rule out active TB by asking about symptoms (cough, fever, weight loss) and performing a chest x-ray. If the radiograph shows signs of active TB, collect 3 sputum samples by induction for analysis by smear microscopy, culture, and, possibly, nucleic acid amplification and rifampin susceptibility testing. Consider consulting your local public health department for advice on, or assistance with, sample collection. Report LTBI to the local health department and seek advice on the appropriate tests and treatments.
Expanded treatment selections
With LTBI there are now 4 treatment options for patients and physicians to consider:9 isoniazid given daily or twice weekly for either 6 or 9 months; isoniazid and rifapentine given once weekly for 3 months; or rifampin given daily for 4 months. Factors influencing treatment selection include a patient’s age, concomitant conditions, and the likelihood of bacterial resistance. Free treatment for LTBI may be available; again, check with your local health department.
1. WHO. Global tuberculosis report 2017. Geneva, Switzerland: World Health Organization. Available at: http://www.who.int/tb/publications/global_report/en/. Accessed November 8, 2017.
2. Schmit KM, Wansaula Z, Pratt R, et al. Tuberculosis—United States, 2016. MMWR Morb Mortal Wkly Rep. 2017;66:289-294.
3. Houben RMGJ, Dodd PJ. The global burden of latent tuberculosis infection: a re-estimation using mathematical modelling. PLoS Med. 2016;13(10):e1002152. Available at: http://journals.plos.org/plosmedicine/article?id=10.1371/journal.pmed.1002152. Accessed November 10, 2017.
4. USPSTF. Screening for latent tuberculosis infection in adults: US Preventive Services Task Force recommendation statement. JAMA. 2016;316:962-969.
5. CDC. Tuberculosis. Who should be tested. Available at: https://www.cdc.gov/tb/topic/testing/whobetested.htm. Accessed November 8, 2017.
6. CDC. Latent tuberculosis infection: a guide for primary health care providers. Targeted testing for tuberculosis. Available at: https://www.cdc.gov/tb/publications/ltbi/targetedtesting.htm#identifyingTBDisease. Accessed November 8, 2017.
7. CDC. TB elimination. Tuberculin skin testing. Available at: https://www.cdc.gov/tb/publications/factsheets/testing/skintesting.pdf. Accessed November 8, 2017.
8. Lewinsohn DM, Leonard MK, LoBue PA, el al. Official American Thoracic Society/Infectious Diseases Society of America/Centers for Disease Control and Prevention Clinical Practice Guidelines: Diagnosis of tuberculosis in adults and children. Clin Infect Dis. 2017;64:111-115.
9. CDC. Treatment regimens for latent TB infection (LTBI). Available at: https://www.cdc.gov/tb/topic/treatment/ltbi.htm. Accessed November 8, 2017.
From The Journal of Family Practice | 2017;66(12):755-757.