User login
Should ‘advanced maternal age’ be redefined? Study suggests benefits.
Pregnant women who were at or above the advanced maternal age (AMA) cutoff of 35 years on their due date received significantly more prenatal care, resulting in a slight decline in perinatal mortality, compared with women who were just a few months younger, according to a new study published in JAMA Health Forum. The findings “suggest that clinicians use the cutoff as a heuristic in their clinical recommendations and service provision,” noted lead author Caroline K. Geiger, PhD, who was a PhD student at Harvard University in Cambridge, Mass., during the course of the study, and now works as an associate health economist at Genentech in San Francisco. She and her coauthors suggest a slightly younger AMA cutoff might be beneficial. “Our results suggest that 3.9 perinatal deaths per 1,000 deliveries in this age range could be averted if patients just a few months younger than the AMA cutoff received similar care to those older than the cutoff,” they wrote. “Although the risk of adverse outcomes increases with maternal age, individuals 4 months older or younger than 35 years should not have different underlying risks.”
The cross-sectional study used a national sample of 51,290 commercially insured individuals who were pregnant between 2008 and 2019 and had delivery dates within 120 days of their 35th birthday. Just over half (50.9%) of the individuals were aged 34.7-34.9 years on their expected delivery date – just below the AMA cutoff – while 49.1% were just over the cutoff at age 35.0-35.3 years. A total of 4.7% had multiple gestation, 4.8% had pregestational diabetes, 4.4% had chronic hypertension, and 9.7% had obesity. There was also a subgroup analysis among individuals with low-risk pregnancy (defined as singleton, with no pregestational diabetes, chronic hypertension, or obesity) because they were less likely to have indications for additional prenatal care.
Although there was a slight, nonstatistically significant increase in the overall number of ob.gyn. visits at the AMA cutoff, compared with below it, the percentage of individuals with any maternal-fetal medicine visit increased by 4.27 percentage points (P < .001) at the cutoff. Additionally, while there was a “modest” increase in total ultrasounds (P = .006), there was a significant increase in detailed ultrasounds (P < .001) at the cutoff, and a “substantial” increase in antepartum surveillance (P < .001), the authors reported.
The AMA designation was associated with a 0.39 percentage-point decline in perinatal mortality (P = .04), “however, there were no significant changes in the proportion of individuals with severe maternal morbidity or with preterm birth or low birth weight at age 35 years,” they wrote.
In the subgroup analysis of low-risk pregnancies, “prenatal care services increased substantially at the 35-year cutoff, and in all cases, the increases at age 35 years for this group were larger than for the full sample,” they noted, adding that there was also a “substantially larger” decline in perinatal mortality at the AMA cutoff (P = .002), compared with the full sample.
The authors noted the need for more rigorous evidence on the value and effect of prenatal care guidelines on pregnancy outcomes. “Although pregnancy-related risks increase with maternal age, there is no known abrupt biological increase in underlying risk precisely at age 35 years,” they wrote, adding that “much of the content of prenatal care guidelines has persisted for decades without strong causal evidence to demonstrate its value.”
Their words echo those of Alex F. Peahl, MD, an ob.gyn. and assistant professor at the Institute for Healthcare Policy and Innovation, at the University of Michigan, in Ann Arbor, MI. In a recent review, Dr. Peahl and her colleague Joel D. Howell, MD, PhD, from the same university (Am J Obstet Gynecol. 2021 Apr;224[4]:339-47), note that the COVID-19 pandemic forced a much-needed rethink of prenatal care and its delivery. A look through the history of prenatal care shows “we have treated visit frequency and modality as fixed boxes, into which we must fit an ever-changing set of care recommendations,” they wrote. “We do not have data to support a specific prenatal visit schedule, recommended number of telemedicine visits, or specifications of additional services, and we never have. However, one thing is clear: we are long overdue for new prenatal care delivery guidelines in the United States.”
But when reached for comment on the new study Dr. Peahl cautioned that its conclusions are “limited and warrant future investigation. … While increased prenatal services may explain the improvement in outcomes, several other explanations should be considered,” she told this publication. “Perhaps, maternity care professional behavior differs for patients who are over the age of 35, resulting in increased caution in interpreting test results and symptoms; perhaps patients are more routinely induced at 39 weeks, limiting stillbirth rate; or perhaps patients are more hypervigilant when given the diagnosis of AMA.”
Priya Rajan, MD, agreed that while the paper showed an association between intensified antenatal interventions and decreased perinatal mortality, it did not show a causal relationship. “The study did not include information on other important factors that are also associated with perinatal risk,” noted Dr. Rajan, who is an associate professor in the department of ob.gyn. at Northwestern University in Chicago. Yet, she acknowledged that the findings “support what many clinicians know, which is that age 35 isn’t some tipping point; rather, obstetric risk is influenced by a range of factors, of which age may be one. This study, particularly when considered in the context of other studies and articles we have seen recently, confirms the need for us to rethink how we care for people during pregnancy and post partum. This includes delving further into understanding what aspects of the prenatal care that we provide have the biggest impact for both maternal and perinatal adverse outcomes.”
The study was supported by grant DGE1745303 from the National Science Foundation Graduate Research Fellowship Program. Dr. Geiger reported being a PhD student during the conduction of the study, but had no other disclosures. Dr. Peahl will soon be a consultant for Maven Clinic. Dr. Rajan had no relevant disclosures.
JAMA HEALTH FORUM
White ankle scars
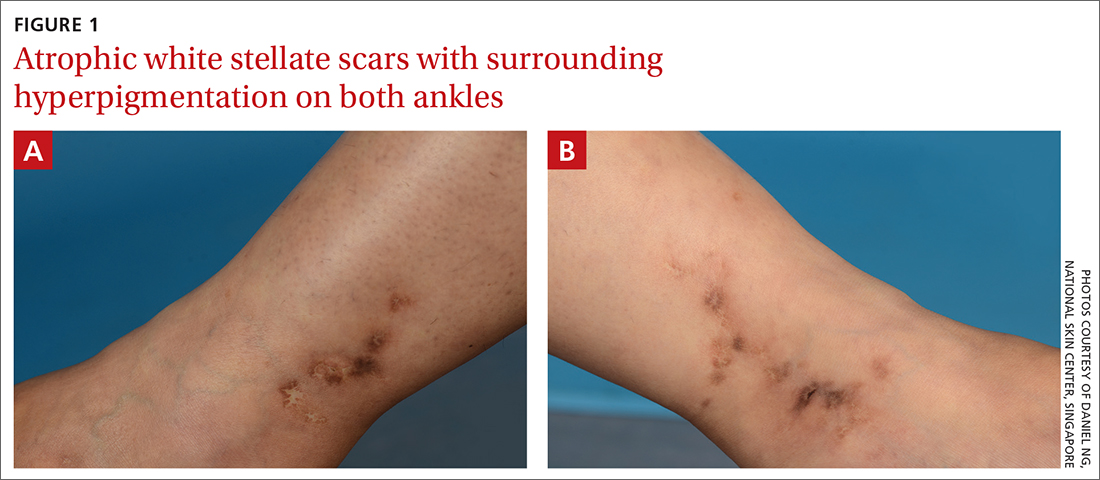
A 42-year-old woman presented to our dermatology center with white scars on both of her ankles. She first noticed the lesions 2 years prior; they were initially erythematous and painful, even when she was at rest. Her past medical history included 3 spontaneous term miscarriages. She denied any prolonged standing or trauma.
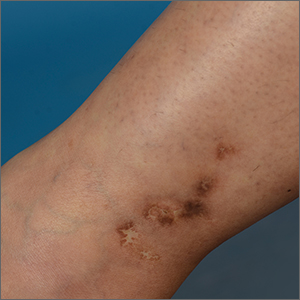
On examination, atrophic porcelain-white stellate scars were visible with surrounding hyperpigmentation on the medial aspect of both ankles (FIGURE 1A & 1B). There were no tender erythematous nodules,
WHAT IS YOUR DIAGNOSIS?
HOW WOULD YOU TREAT THIS PATIENT?
Diagnosis: Atrophie blanche
Atrophie blanche is a morphologic feature described as porcelain-white stellate scars with surrounding telangiectasia and hyperpigmentation. The lesions are typically found over the peri-malleolar region and are sequelae of healed erythematous and painful ulcers. The lesions arise from upper dermal, small vessel, thrombotic vasculopathy leading to ischemic rest pain; if left untreated, atrophic white scars eventually develop.
A sign of venous insufficiency or thrombotic vasculopathy
Atrophie blanche may develop following healing of an ulcer due to venous insufficiency or small vessel thrombotic vasculopathy.1 The incidence of thrombotic vasculopathy is 1:100,000 with a female predominance, and up to 50% of cases are associated with procoagulant conditions.2 Thrombotic vasculopathy can be due to an inherited or acquired thrombophilia.1
Causes of hereditary thrombophilia include Factor V Leiden/prothrombin mutations, anti-thrombin III/protein C/protein S deficiencies, dysfibrinogenemia, and hyperhomocysteinemia.
Acquired thrombophilia arises from underlying prothrombotic states associated with the Virchow triad: hypercoagulability, blood flow stasis, and endothelial injury. The use of oral contraceptives or hormone replacement therapy, presence of malignancy, and antiphospholipid syndrome (APS) are causes of acquired thrombophilia.2
Obtaining a careful history is crucial
Thorough history-taking and physical examination are required to determine the underlying cause of atrophie blanche.
Continue to: Chronic venous insufficiency
Chronic venous insufficiency is more likely in patients with a history of prolonged standing, obesity, or previous injury/surgery to leg veins. Physical examination would reveal hyperpigmentation, telangiectasia, varicose veins, pedal edema, and venous ulcers.3
Inherited thrombophilia may be at work in patients with a family history of arterial and venous thrombosis (eg, stroke, acute coronary syndrome, or deep vein thromboses).
Acquired thrombophilia should be suspected if there is a history of recurrent miscarriages or malignancy.4 Given our patient’s history of miscarriages, we ordered further lab work and found that she had elevated anticardiolipin levels (> 40 U/mL) fulfilling the revised Sapporo criteria5 for APS.
Thrombophilia or chronic venous insufficiency? In a patient with a history suggestive of thrombophilia, further work-up should be done before attributing atrophie blanche to healed venous ulcers from chronic venous insufficiency. A skin lesion biopsy could reveal classic changes of thrombotic vasculopathy subjacent to the ulcer, including intraluminal thrombosis, endothelial proliferation, and subintimal hyaline degeneration, as opposed to dermal changes consistent with venous stasis, such as increased siderophages, hemosiderin deposition, erythrocyte extravasation, dermal fibrosis, and adipocytic damage.
Differential diagnosis includes atrophic scarring
The differential diagnosis for hypopigmented atrophic macules and plaques over the lower limbs include atrophic scarring from previous trauma, guttate morphea, extra-genital lichen sclerosus, and tuberculoid leprosy.
Continue to: Atrophic scarring
Atrophic scarring occurs only after trauma.
Guttate morphea lesions are sclerotic and may be depressed.
Extra-genital lichen sclerosus is characterized by polygonal, shiny, ivory-white sclerotic lesions with or without follicular plugging.
Tuberculoid leprosy involves loss of nociception, hypotrichosis, and palpable thickened regional nerves (eg, great auricular, sural, or ulnar nerve).
Treatment requires long-term anticoagulation
Our patient had APS and the mainstay of treatment is long-term systemic anticoagulation along with attentive wound care.6 Warfarin is preferred over a direct oral anticoagulant as it is more effective in the prevention of recurrent thrombosis in patients with APS.7
Our patient was started on warfarin. Since APS may occur as a primary condition or in the setting of a systemic disease, such as systemic lupus erythematosus, she was referred to a rheumatologist.
1. Alavi A, Hafner J, Dutz JP, et al. Atrophie blanche: is it associated with venous disease or livedoid vasculopathy? Adv Skin Wound Care. 2014;27:518-24. doi: 10.1097/01.ASW.0000455098.98684.95
2. Di Giacomo TB, Hussein TP, Souza DG, et al. Frequency of thrombophilia determinant factors in patients with livedoid vasculopathy and treatment with anticoagulant drugs—a prospective study. J Eur Acad Dermatol Venereol. 2010;24:1340-1346. doi: 10.1111/j.1468-3083.2010.03646.x
3. Millan SB, Gan R, Townsend PE. Venous ulcers: diagnosis and treatment. Am Fam Physician. 2019;100:298-305.
4. Armstrong EM, Bellone JM, Hornsby LB, et al. Acquired thrombophilia. J Pharm Pract. 2014;27:234-242. doi: 10.1177/0897190014530424
5. Miyakis S, Lockshin MD, Atsumi T, et al. International consensus statement on an update of the classification criteria for definite antiphospholipid syndrome (APS). J Thromb Haemost. 2006;4:295-306. doi: 10.1111/j.1538-7836.2006.01753.x
6. Stevens SM, Woller SC, Bauer KA, et al. Guidance for the evaluation and treatment of hereditary and acquired thrombophilia. J Thromb Thrombolysis. 2016;41:154-164. doi: 10.1007/s11239-015-1316-1
7. Cohen H, Hunt BJ, Efthymiou M, et al. Rivaroxaban versus warfarin to treat patients with thrombotic antiphospholipid syndrome, with or without systemic lupus erythematosus (RAPS): a randomised, controlled, open-label, phase 2/3, non-inferiority trial. Lancet Haematol. 2016;3:e426-e436. doi: 10.1016/S2352-3026(16)30079-5
A 42-year-old woman presented to our dermatology center with white scars on both of her ankles. She first noticed the lesions 2 years prior; they were initially erythematous and painful, even when she was at rest. Her past medical history included 3 spontaneous term miscarriages. She denied any prolonged standing or trauma.
On examination, atrophic porcelain-white stellate scars were visible with surrounding hyperpigmentation on the medial aspect of both ankles (FIGURE 1A & 1B). There were no tender erythematous nodules,
WHAT IS YOUR DIAGNOSIS?
HOW WOULD YOU TREAT THIS PATIENT?
Diagnosis: Atrophie blanche
Atrophie blanche is a morphologic feature described as porcelain-white stellate scars with surrounding telangiectasia and hyperpigmentation. The lesions are typically found over the peri-malleolar region and are sequelae of healed erythematous and painful ulcers. The lesions arise from upper dermal, small vessel, thrombotic vasculopathy leading to ischemic rest pain; if left untreated, atrophic white scars eventually develop.
A sign of venous insufficiency or thrombotic vasculopathy
Atrophie blanche may develop following healing of an ulcer due to venous insufficiency or small vessel thrombotic vasculopathy.1 The incidence of thrombotic vasculopathy is 1:100,000 with a female predominance, and up to 50% of cases are associated with procoagulant conditions.2 Thrombotic vasculopathy can be due to an inherited or acquired thrombophilia.1
Causes of hereditary thrombophilia include Factor V Leiden/prothrombin mutations, anti-thrombin III/protein C/protein S deficiencies, dysfibrinogenemia, and hyperhomocysteinemia.
Acquired thrombophilia arises from underlying prothrombotic states associated with the Virchow triad: hypercoagulability, blood flow stasis, and endothelial injury. The use of oral contraceptives or hormone replacement therapy, presence of malignancy, and antiphospholipid syndrome (APS) are causes of acquired thrombophilia.2
Obtaining a careful history is crucial
Thorough history-taking and physical examination are required to determine the underlying cause of atrophie blanche.
Continue to: Chronic venous insufficiency
Chronic venous insufficiency is more likely in patients with a history of prolonged standing, obesity, or previous injury/surgery to leg veins. Physical examination would reveal hyperpigmentation, telangiectasia, varicose veins, pedal edema, and venous ulcers.3
Inherited thrombophilia may be at work in patients with a family history of arterial and venous thrombosis (eg, stroke, acute coronary syndrome, or deep vein thromboses).
Acquired thrombophilia should be suspected if there is a history of recurrent miscarriages or malignancy.4 Given our patient’s history of miscarriages, we ordered further lab work and found that she had elevated anticardiolipin levels (> 40 U/mL) fulfilling the revised Sapporo criteria5 for APS.
Thrombophilia or chronic venous insufficiency? In a patient with a history suggestive of thrombophilia, further work-up should be done before attributing atrophie blanche to healed venous ulcers from chronic venous insufficiency. A skin lesion biopsy could reveal classic changes of thrombotic vasculopathy subjacent to the ulcer, including intraluminal thrombosis, endothelial proliferation, and subintimal hyaline degeneration, as opposed to dermal changes consistent with venous stasis, such as increased siderophages, hemosiderin deposition, erythrocyte extravasation, dermal fibrosis, and adipocytic damage.
Differential diagnosis includes atrophic scarring
The differential diagnosis for hypopigmented atrophic macules and plaques over the lower limbs include atrophic scarring from previous trauma, guttate morphea, extra-genital lichen sclerosus, and tuberculoid leprosy.
Continue to: Atrophic scarring
Atrophic scarring occurs only after trauma.
Guttate morphea lesions are sclerotic and may be depressed.
Extra-genital lichen sclerosus is characterized by polygonal, shiny, ivory-white sclerotic lesions with or without follicular plugging.
Tuberculoid leprosy involves loss of nociception, hypotrichosis, and palpable thickened regional nerves (eg, great auricular, sural, or ulnar nerve).
Treatment requires long-term anticoagulation
Our patient had APS and the mainstay of treatment is long-term systemic anticoagulation along with attentive wound care.6 Warfarin is preferred over a direct oral anticoagulant as it is more effective in the prevention of recurrent thrombosis in patients with APS.7
Our patient was started on warfarin. Since APS may occur as a primary condition or in the setting of a systemic disease, such as systemic lupus erythematosus, she was referred to a rheumatologist.
1. Alavi A, Hafner J, Dutz JP, et al. Atrophie blanche: is it associated with venous disease or livedoid vasculopathy? Adv Skin Wound Care. 2014;27:518-24. doi: 10.1097/01.ASW.0000455098.98684.95
2. Di Giacomo TB, Hussein TP, Souza DG, et al. Frequency of thrombophilia determinant factors in patients with livedoid vasculopathy and treatment with anticoagulant drugs—a prospective study. J Eur Acad Dermatol Venereol. 2010;24:1340-1346. doi: 10.1111/j.1468-3083.2010.03646.x
3. Millan SB, Gan R, Townsend PE. Venous ulcers: diagnosis and treatment. Am Fam Physician. 2019;100:298-305.
4. Armstrong EM, Bellone JM, Hornsby LB, et al. Acquired thrombophilia. J Pharm Pract. 2014;27:234-242. doi: 10.1177/0897190014530424
5. Miyakis S, Lockshin MD, Atsumi T, et al. International consensus statement on an update of the classification criteria for definite antiphospholipid syndrome (APS). J Thromb Haemost. 2006;4:295-306. doi: 10.1111/j.1538-7836.2006.01753.x
6. Stevens SM, Woller SC, Bauer KA, et al. Guidance for the evaluation and treatment of hereditary and acquired thrombophilia. J Thromb Thrombolysis. 2016;41:154-164. doi: 10.1007/s11239-015-1316-1
7. Cohen H, Hunt BJ, Efthymiou M, et al. Rivaroxaban versus warfarin to treat patients with thrombotic antiphospholipid syndrome, with or without systemic lupus erythematosus (RAPS): a randomised, controlled, open-label, phase 2/3, non-inferiority trial. Lancet Haematol. 2016;3:e426-e436. doi: 10.1016/S2352-3026(16)30079-5
Cervical cancer update: The latest on screening & management
The World Health Organization estimates that, in 2020, worldwide, there were 604,000 new cases of uterine cervical cancer and approximately 342,000 deaths, 84% of which occurred in developing countries.1 In the United States, as of 2018, the lifetime risk of death from cervical cancer was 2.2 for every 100,000
In this article, we summarize recent updates in the epidemiology, prevention, and treatment of cervical cancer. We emphasize recent information of value to family physicians, including updates in clinical guidelines and other pertinent national recommendations.
Spotlight continues to shine on HPV
It has been known for several decades that cervical cancer is caused by human papillomavirus (HPV). Of more than 100 known HPV types, 14 or 15 are classified as carcinogenic. HPV 16 is the most common oncogenic type, causing more than 60% of cases of cervical cancer3,4
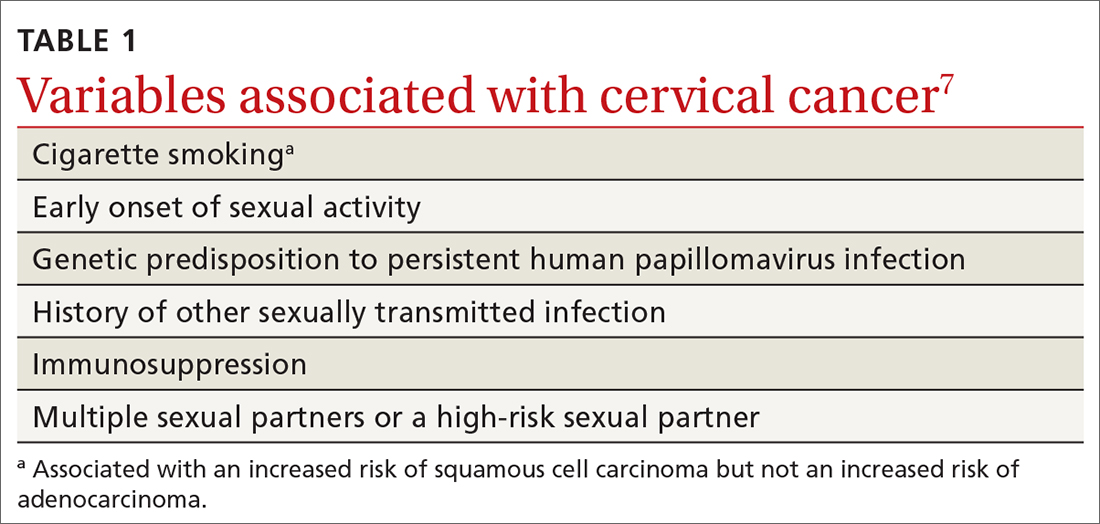
HPV is the most common sexually transmitted infection, with as many as 80% of sexually active people becoming infected during their lifetime, generally before 50 years of age.5 HPV also causes other anogenital and oropharyngeal cancers; however, worldwide, more than 80% of HPV-associated cancers are cervical.6 Risk factors for cervical cancer are listed in TABLE 1.7 Cervical cancer is less common when partners are circumcised.7
Most cases of HPV infection clear in 1 or 2 years
At least 70% of cervical cancers are squamous cell carcinoma (SCC); 20% to 25% are adenocarcinoma (ADC); and < 3% to 5% are adenosquamous carcinoma.10 Almost 100% of cervical SCCs are HPV+, as are 86% of cervical ADCs. The most common reason for HPV-negative status in patients with cervical cancer is false-negative testing because of inadequate methods.
Primary prevention through vaccination
HPV vaccination was introduced in 2006 in the United States for girls,a and for boysa in 2011. The primary reason for vaccinating boys is to reduce the rates of HPV-related anal and oropharyngeal cancer. The only available HPV vaccine in the United States is Gardasil 9 (9-valent vaccine, recombinant; Merck), which provides coverage for 7 high-risk HPV types that account for approximately 90% of cervical cancers and 2 types (6 and 11) that are the principal causes of condylomata acuminata (genital warts). Future generations of prophylactic vaccines are expected to cover additional strains.
Continue to: Vaccine studies...
Vaccine studies have been summarized in a Cochrane review,11 showing that vaccination is highly effective for prevention of cervical dysplasia, especially when given to young girls and womena previously unexposed to the virus. It has not been fully established how long protection lasts, but vaccination appears to be 70% to 90% effective for ≥ 10 years.
Dosing schedule. The Advisory Committee on Immunization Practices (ACIP) of the Centers for Disease Control and Prevention (CDC) recommends a 2-dose schedule 6 to 15 months apart, for both girls and boys between 9 and 14 years of age.12 A third dose is indicated if the first and second doses were given less than 5 months apart, or the person is older than 15 years or is immunocompromised. No recommendation has been made for revaccination after the primary series.
In 2018, the US Food and Drug Administration approved Gardasil 9 for adults 27 to 45 years of age. In June 2019, ACIP recommended vaccination for mena as old as 26 years, and adopted a recommendation that unvaccinated men and women between 27 and 45 years discuss HPV vaccination with their physician.13
The adolescent HPV vaccination rate varies by state; however, all states lag behind the CDC’s Healthy People 2020 goal of 80%.14 Barriers to vaccination include cost, infrastructure limitations, and social stigma.
Secondary prevention: Screening and Tx of precancerous lesions
Cervical cancer screening identifies patients at increased risk of cervical cancer and reassures the great majority of them that their risk of cervical cancer is very low. There are 3 general approaches to cervical cancer screening:
- cytology-based screening, which has been implemented for decades in many countries
- primary testing for DNA or RNA markers of high-risk HPV types
- co-testing with cytology-based screening plus HPV testing.
Continue to: USPSTF guidance
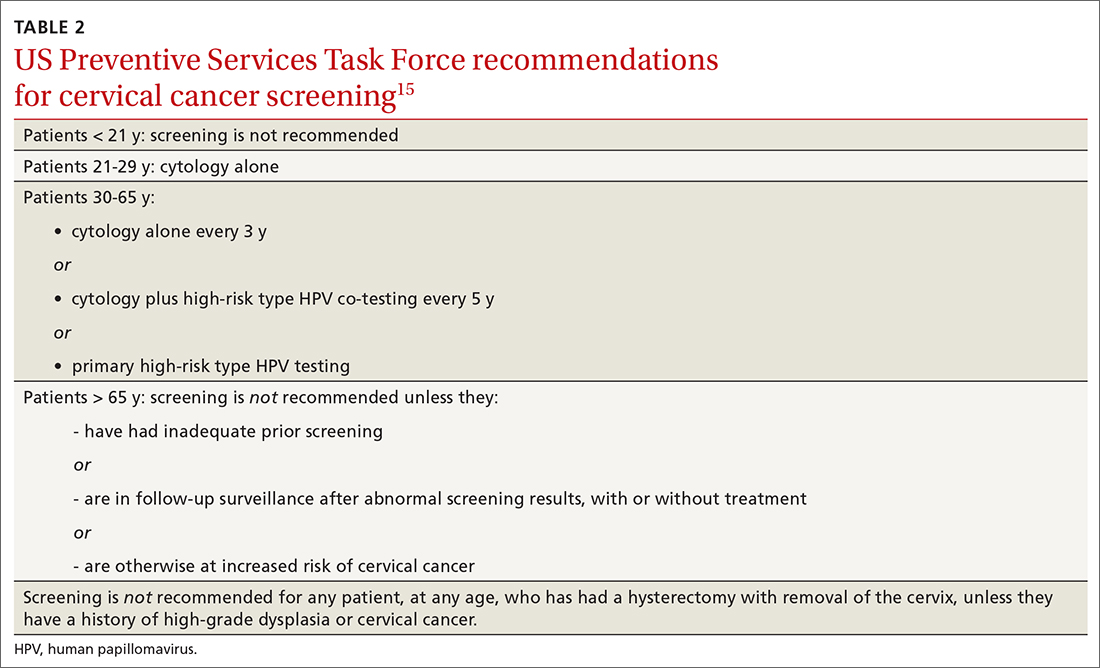
USPSTF guidance. Recommendations of the US Preventive Services Task Force (USPSTF) for cervical cancer screening were updated in 2018 (TABLE 215). The recommendations state that high-risk HPV screening alone is a strategy that is amenable to patient self-sampling and self-mailing for processing—a protocol that has the potential to improve access
ASCCP guidance. The American Society of Colposcopy and Cervical Pathology (ASCCP) makes nearly the same recommendations for cervical cancer screening. An exception is that ASCCP guidelines allow for the possibility of screening using primary high-risk HPV testing for patients starting at 25 years of age.16
Screening programs that can be initiated at a later age and longer intervals should be possible once the adolescent vaccination rate is optimized and vaccination registries are widely implemented.
Cervical cytology protocol
Cervical cytologic abnormalities are reported using the Bethesda system. Specimen adequacy is the most important component of quality assurance,17 and is determined primarily by sufficient cellularity. However, any specimen containing abnormal squamous cells of undetermined significance (ASCUS) or atypical glandular cells (AGCs) is considered satisfactory, regardless of the number of cells. Obscuring factors that impair quality include excessive blood; inflammation; air-drying artifact; and an interfering substance, such as lubricant. The presence of reactive changes resulting from inflammation does not require further evaluation unless the patient is immunosuppressed.
Abnormalities are most often of squamous cells, of 2 categories: low-grade squamous intraepithelial lesions (LSILs) and high-grade squamous intraepithelial lesions (HSILs). HSILs are more likely to be associated with persistent HPV infection and higher risk of progression to cervical cancer.
Continue to: Cytologic findings...
Cytologic findings can be associated with histologic findings that are sometimes more, sometimes less, severe. LSIL cytology specimens that contain a few cells that are suspicious for HSIL, but that do not contain enough cells to be diagnostic, are reported as atypical squamous cells, and do not exclude a high-grade intraepithelial lesion.
Glandular-cell abnormalities usually originate from the glandular epithelium of the endocervix or the endometrium—most often, AGCs. Less frequent are AGCs, favor neoplasia; endocervical adenocarcinoma in situ; and ADC. Rarely, AGCs are associated with adenosquamous carcinoma. Endometrial polyps are a typical benign pathology that can be associated with AGCs.
In about 30% of cases, AGCs are associated with premalignant or malignant disease.18 The risk of malignancy in patients with AGCs increases with age, from < 2% among patients younger than 40 years to approximately 15% among those > 50 years.19 Endometrial malignancy is more common than cervical malignancy among patients > 40 years.
AGC cytology requires endocervical curettage, plus endometrial sampling for patients ≥ 35 years
Cytology-based screening has limitations. Sensitivity is relatively low and dependent on the expertise of the cytologist, although regular repeat testing has been used to overcome this limitation. A substantial subset of results are reported as equivocal—ie, ASCUS.
Continue to: Primary HPV screening
Primary HPV screening
Primary HPV testing was approved by the US Food and Drug Administration in 2015 and recommended as an appropriate screening option by professional societies
In contrast to cytology-based screening, HPV testing has high sensitivity (≥ 90%); the population-based negative likelihood ratio is near zero.20 This degree of sensitivity allows for extended screening intervals. However, primary HPV testing lacks specificity for persistent infection and high-grade or invasive lesions, which approximately doubles the number of patients who screen positive. The potential for excess patients to be referred for colposcopy led to the need for secondary triage.
Instituting secondary triage. Cytology is, currently, the primary method of secondary triage, reducing the number of referrals for colposcopy by nearly one-half, compared to referrals for all high-risk HPV results, and with better overall accuracy over cytology with high-risk HPV triage.21 When cytology shows ASCUS, or worse, refer the patient for colposcopy; alternatively, if so-called reflex testing for HPV types 16 and 18 is available and positive, direct referral to colposcopy without cytology is also appropriate.
In the future, secondary triage for cytology is likely to be replaced with improved technologies, such as immunostaining of the specimen for biomarkers associated with cervical precancer or cancer, or for viral genome methylation testing.22
Management of abnormal cervical cancer screening results
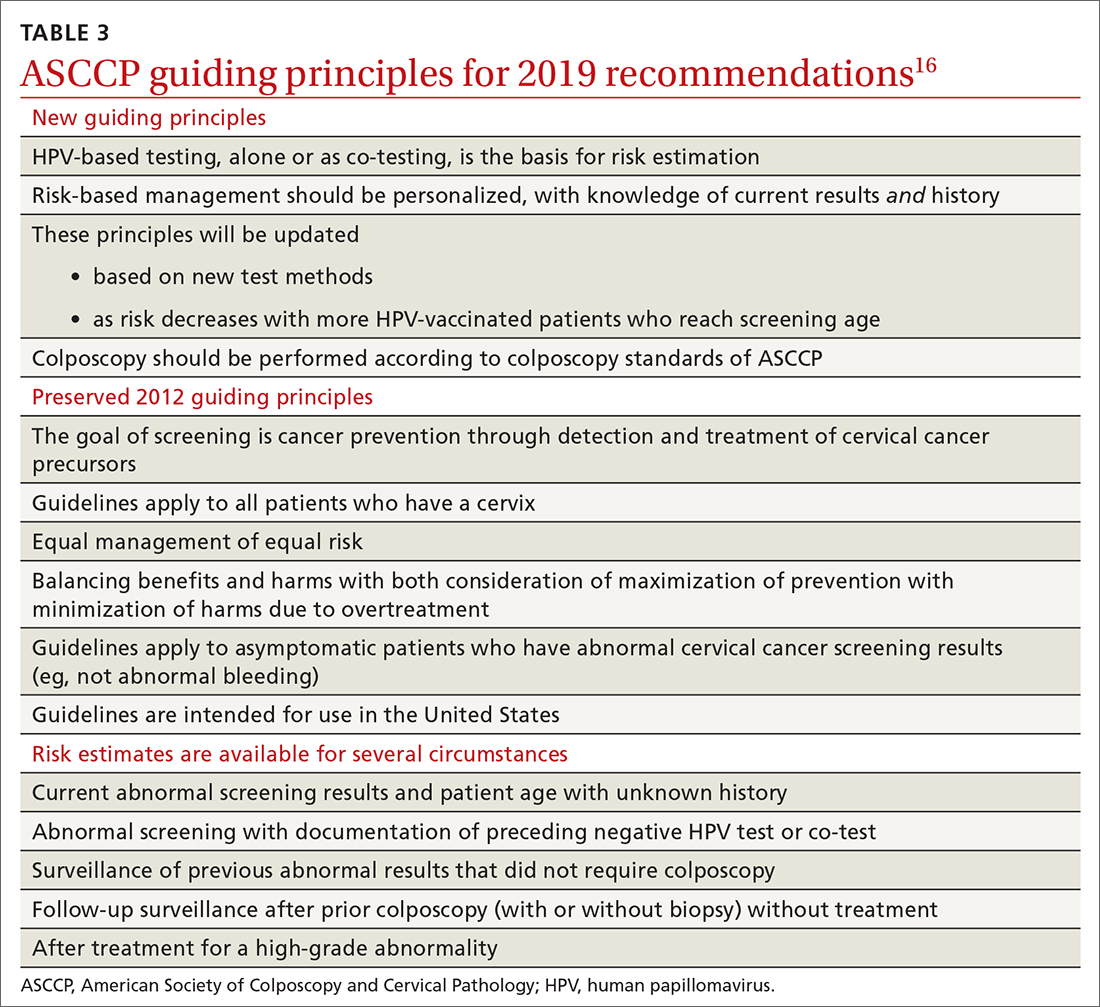
Routine screening applies to asymptomatic patients who do not require surveillance because they have not had prior abnormal screening results. In 2020, ASCCP published risk-based management consensus guidelines that were developed for abnormal cervical cancer screening tests and for cancer precursors.16 Guiding principles, and screening situations in which the guidelines can be applied, are summarized in TABLE 3
Continue to: ASCCP guidelines...
ASCCP guidelines provide a framework to incorporate new data and technologies without major revision
Some noteworthy scenarios in ASCCP risk-based management are:
- For unsatisfactory cytology with a negative HPV test or no HPV test, repeat age-based screening in 2 to 4 months. (Note: A negative HPV test might reflect an inadequate specimen; do not interpret this result as a true negative.)
- An absent transformation zone (ie, between glandular and squamous cervical cells) with an otherwise adequate specimen should be interpreted as satisfactory for screening in patients 21 to 29 years of age. For those ≥ 30 years and with no HPV testing in this circumstance, HPV testing is preferred; repeating cytology, in 3 years, is also acceptable.
- After a finding of LSIL/CIN1 without evidence of a high-grade abnormality, and after 2 negative annual screenings (including HPV testing), a return to 3-year (not 5-year) screening is recommended.
- A cytology result of an HSIL carries a risk of 26% for CIN3+, in which case colposcopy is recommended, regardless of HPV test results.
- For long-term management after treatment for CIN2+, continue surveillance testing every 3 years after 3 consecutive negative HPV tests or cytology findings, for at least 25 years. If the 25-year threshold is reached before 65 years of age, continuing surveillance every 3 years is optional, as long as the patient is in good health (ie, life expectancy ≥ 10 years).
- After hysterectomy for a high-grade abnormality, annual vaginal HPV testing is recommended until 3 negative tests are returned; after that, surveillance shifts to a 3-year interval until the 25-year threshold.
Treatment of cancer precursors
Treatment for cervical dysplasia is excisional or ablative.
Excisional therapy. In most cases, excisional therapy (either a loop electrosurgical excision procedure [LEEP; also known as large loop excision of the transformation zone, cold knife conization, and laser conization] or cone biopsy) is required, or preferred. Excisional treatment has the advantage of providing a diagnostic specimen.
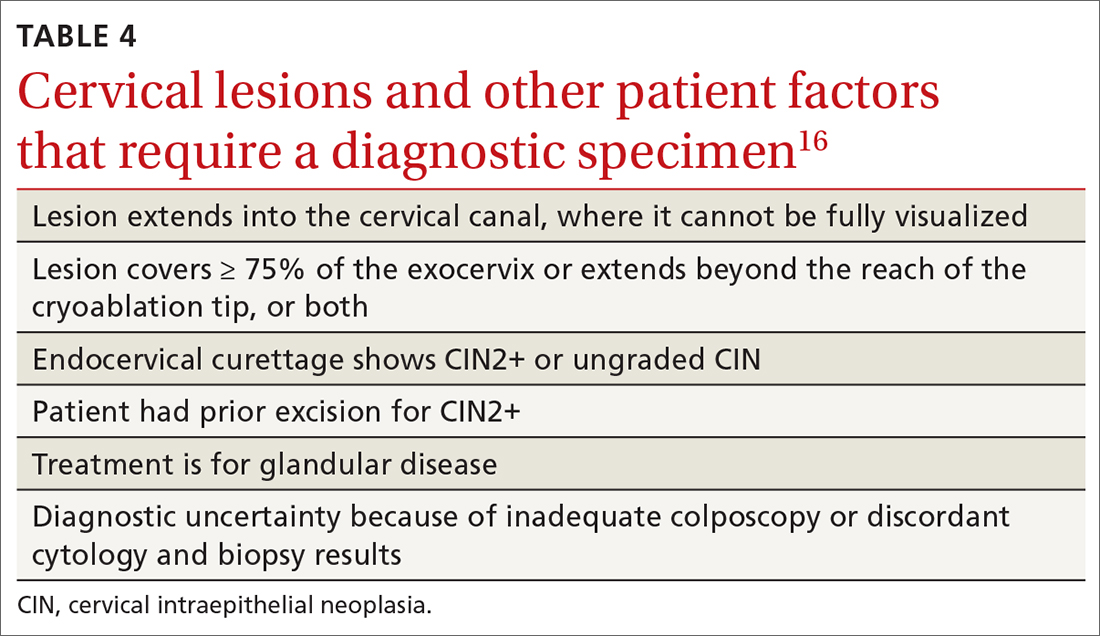
The World Health Organization recommends LEEP over ablation in settings in which LEEP is available.23 ASCCP states that, in the relatively few cases in which treatment is needed and it is for CIN1, either excision or ablation is acceptable. TABLE 416 lists situations in which excisional treatment is required because a diagnostic specimen is needed.
Continue to: Ablative treatments
Ablative treatments are cryotherapy, CO2 laser ablation, and thermal ablation. Ablative therapy has the advantage of presenting less risk of adverse obstetric outcomes (eg, preterm birth); it can be used if the indication for therapy is:
- CIN1 or CIN2 and HPV type 16 or 18 positivity
- concordant cytology and histology
- satisfactory colposcopy
- negative endocervical curettage.
The most common ablative treatment is liquid nitrogen applied to a metal tip under local anesthesia.
Hysterectomy can be considered for patients with recurrent CIN2+ who have completed childbearing or for whom repeat excision is infeasible (eg, scarring or a short cervix), or both.
Cost, availability, and convenience might play a role in decision-making with regard to the treatment choice for cancer precursors.
Is care after treatment called for? Patients who continue to be at increased risk of (and thus mortality from) cervical and vaginal cancer require enhanced surveillance. The risk of cancer is more than triple for patients who were given their diagnosis, and treated, when they were > 60 years, compared to patients treated in their 30s.1 The excess period of risk covers at least 25 years after treatment, even among patients who have had 3 posttreatment screenings.
Continue to: Persistent HPV positivity...
Persistent HPV positivity is more challenging. Patients infected with HPV type 16 have an increased risk of residual disease.
Cancer management
Invasive cancer. Most cervical cancers (60%) occur among patients who have not been screened during the 5 years before their diagnosis.24 For patients who have a diagnosis of cancer, those detected through screening have a much better prognosis than those identified by symptoms (mean cure rate, 92% and 66%, respectively).25 The median 5-year survival for patients who were not screened during the 5 years before their diagnosis of cervical cancer is 66%.2
In unscreened patients, cervical cancer usually manifests as abnormal vaginal bleeding, especially postcoitally. In approximately 45% of cases, the patient has localized disease at diagnosis; in 36%, regional disease; and in 15%, distant metastases.26
For cancers marked by stromal invasion < 3 mm, appropriate treatment is cone biopsy or simple hysterectomy.27
Most patients with early-stage cervical cancer undergo modified radical hysterectomy. The ovaries are usually conserved, unless the cancer is adenocarcinoma. Sentinel-node dissection has become standard practice. Primary radiation therapy is most often used for patients who are a poor surgical candidate because of medical comorbidity or poor functional status. Antiangiogenic agents (eg, bevacizumab) can be used as adjuvant palliative therapy for advanced and recurrent disease
Continue to: After treatment for...
After treatment for invasive cervical cancer, the goal is early detection of recurrence, although there is no consensus on a protocol. Most recurrences are detected within the first 2 years.
Long-term sequelae after treatment for advanced cancer are considerable. Patients report significantly lower quality of life,
Hormone replacement therapy is generally considered acceptable after treatment of cervical cancer because it does not increase replication of HPV.
Recurrent or metastatic cancer. Recurrence or metastases will develop in 15% to 60% of patients,30 usually within the first 2 years after treatment.
Management depends on location and extent of disease, using mainly radiation therapy or surgical resection. Recurrence or metastasis is usually incurable.
Continue to: Last, there are promising...
Last, there are promising areas of research for more effective treatment for cervical cancer precursors and cancers, including gene editing tools31 and therapeutic
Prospects for better cervical cancer care
Prevention. HPV vaccination is likely to have a large impact on population-based risk of both cancer and cancer precursors in the next generation.
Screening in the foreseeable future will gravitate toward reliance on primary HPV screening, with a self-sampling option.
Surveillance after dysplastic disease. The 2019 ASCCP guidelines for surveillance and intervention decisions after abnormal cancer screening results will evolve to incorporate introduction of new technology into computerized algorithms.
Treatment. New biologic therapies, including monoclonal antibodies and therapeutic vaccines against HPV, will likely be introduced for treating cancer precursors and invasive cancer.
A NOTE FROM THE EDITORS The Editors of The Journal of Family Practice recognize the importance of addressing the reproductive health of gender-diverse individuals. In this article, we use the words “women,” “men,” “girls,” and “boys” in limited circumstances (1) for ease of reading and (2) to reflect the official language of the US Food and Drug Administration and the Advisory Committee on Immunization Practices. The reader should consider the information and guidance offered in this discussion of cervical cancer and other human papillomavirus-related cancers to speak to the care of people with a uterine cervix and people with a penis.
CORRESPONDENCE
Linda Speer, MD, 3000 Arlington Avenue, MS 1179, Toledo, OH 43614; Linda.speer@utoledo.edu
1. Sung H, Ferlay J, Siegel RL, et al. Global cancer statistics 2020: GLOBOCAN estimates of incidence and mortality worldwide for 36 cancers in 185 countries. CA Cancer J Clin. 2021;71:209-249. doi: 10.3322/caac.21660
2. Cancer stat facts: cervical cancer. National Cancer Institute Surveillance, Epidemiology, and End Results [SEER] Program. Accessed November 14, 2021. https://seer.cancer.gov/statfacts/html/cervix.html
3. Guan P, Howell-Jones R, Li N, et al. Human papillomavirus types in 115,789 HPV-positive women: a meta-analysis from cervical infection to cancer. Int J Cancer 2012;131:2349-2359. doi: 10.1002/ijc.27485
4. Winer RL, Hughes JP, Feng Q, et al. Early history of incident, type-specific human papillomavirus infections in newly sexually active young women. Cancer Epidemiol Biomarkers Prev. 2011;20:699-707. doi: 10.1158/1055-9965.EPI-10-1108
5. Chesson HW, Dunne EF, Hariri F, et al. The estimated lifetime probability of acquiring human papillomavirus in the United States. Sex Transm Dis. 2014;41:660-664. doi: 10.1097/OLQ.0000000000000193
6. Human papillomavirus (HPV) and cervical cancer. Fact sheet. Geneva, Switzerland: World Health Organization; November 11, 2020. Accessed November 14, 2021. www.who.int/news-room/fact-sheets/detail/human-papillomavirus-(hpv)-and-cervical-cancer
7. International Collaboration of Epidemiological Studies of Cervical Cancer. Comparison of risk factors for invasive squamous cell carcinoma and adenocarcinoma of the cervix: collaborative reanalysis of individual data on 8,097 women with squamous cell carcinoma and 1,374 women with adenocarcinoma from 12 epidemiological studies. Int J Cancer. 2007;120:885-891. doi: 10.1002/ijc.22357
8. McCredie MRE, Sharples KJ, Paul C, et al. Natural history of cervical cancer neoplasia and risk of invasive cancer in women with cervical intraepithelial neoplasia 3: a retrospective cohort study. Lancet Oncol. 2008:9:425-434. doi: 10.1016/S1470-2045(08)70103-7
9. de Sanjose S, Quint WG, Alemany I, et al; . Human papillomavirus genotype attribution in invasive cervical cancer: a retrospective, cross-sectional worldwide study. Lancet Oncol. 2010;11:1048-1056. doi: 10.1016/S1470-2045(10)70230-8
10. Ries LAG, Melbert D, Krapcho M, et al. SEER Cancer Statistics Review 1975-2004. Bethesda, MD: National Cancer Institute; 2007. Accessed November 14, 2021. https://seer.cancer.gov/archive/csr/1975_2004/#citation
11. Arbyn M, Xu L, Simoens C, et al. Prophylactic vaccination against human papillomaviruses to prevent cervical cancer and its precursors. Cochrane Database Syst Rev. 2018;5:CD009069. doi: 10.1002/14651858.CD009069.pub3
12. Meites E, Kempe A, Markowitz LE. Use of a 2-dose schedule for human papillomavirus vaccination—updated recommendations of the Advisory Committee on Immunization Practices. MMWR Morb Mortal Wkly Rep. 2016:65;1405-1408. doi: 10.15585/mmwr.mm6549a5
13. Meites E, Szilagyi PG, Chesson HW, et al. Human papillomavirus vaccination for adults: updated recommendations of the Advisory Committee on Immunization Practices. MMWR Morb Mortal Wkly Rep. 2019;68:698-702. doi: 10.15585/mmwr.mm6832a3
14. State-level data: Female adolescents receiving 2 or 3 doses of HPV vaccine by age 13-15 years (percent). HealthyPeople.gov. Accessed November 14, 2021. www.healthypeople.gov/2020/data/map/4657?year=2018
15. United States Preventive Services Task Force; Curry SJ, Krist AH, Owens DK, et al. Screening for cervical cancer: US Preventive Services Task Force recommendation statement. JAMA 2018;320:674-686. doi: 10.1001/jama.2018.10897
16. Perkins RB, Guido RS, Castle PE, et al; 2019 ASCCP Risk-Based Management Consensus Guidelines Committee. 2019 ASCCP risk-based management consensus guidelines for abnormal cervical cancer screening tests and cancer precursors. J Low Genit Tract Dis. 2020;24:102-131. doi: 10.1097/LGT.0000000000000525
17. Nayar R, Wilbur DC. The Pap test and Bethesda 2014. Cancer Cytopathol. 2015;123;271-281. doi: 10.1002/cncy.21521
18. Schnatz PF, Guile M, O’Sullivan DM, et al. Clinical significance of atypical glandular cells on cervical cytology. Obstet Gynecol 2006;107:701-708. doi: 10.1097/01.AOG.0000202401.29145.68
19. Zhao C, Florea A, Onisko A, et al. Histologic follow-up results in 662 patients with Pap test findings of atypical glandular cells: results from a large academic womens hospital laboratory employing sensitive screening methods. Gynecol Oncol 2009;114:383-389. doi: 10.1016/j.ygyno.2009.05.019
20. Zazove P, Reed BD, Gregoire L, et al. Low false-negative rate of PCR analysis for detecting human papillomavirus-related cervical lesions. J Clin Microbiol. 1998;36:2708-2713. doi: 10.1128/JCM.36.9.2708-2713.1998
21. Richardson LA, El-Zein M, Ramankumar AV, et al; . HPV DNA testing with cytology triage in cervical cancer screening: influence of revealing HPV infection status. Cancer Cytopathol. 2015:123:745-754. doi: 10.1002/cncy.21596
22. Wentzensen N, Schiffman M, Palmer T, et al. Triage of HPV positive women in cervical cancer screening. J Clin Virol 2016;76:S49-S55. doi: 10.1016/j.jcv.2015.11.015
23. WHO Guidelines: Use of Cryotherapy for Cervical Intraepithelial Neoplasia. Geneva, Switzerland: World Health Organization; 2011. Accessed November 14, 2021. www.ncbi.nlm.nih.gov/books/NBK138476/pdf/Bookshelf_NBK138476.pdf
24. Spence AR, Goggin P, Franco EL. Process of care failures in invasive cervical cancer: systematic review and meta-analysis. Prev Med. 2007:45:93-106. doi: 10.1016/j.ypmed.2007.06.007
25. Rositch AF, Nowak RG, Gravitt PE. Increased age and race-specific incidence of cervical cancer after correction for hysterectomy prevalence in the United States from 2000-2009. Cancer. 2014:120:2032-2038. doi: 10.1002/cncr.28548
26. Siegel RL, Miller KD, Fuchs HE, et al. Cancer statistics, 2021. CA: Cancer J Clin. 2021;71:7-33. doi: 10.3322/caac.21654
27. National Comprehensive Cancer Network. Clinical practice guidelines in oncology: cervical cancer. Accessed June 15, 2021. www.nccn.org/professionals/physician_gls/pdf/cervical.pdf
28. Tewari KS, Sill MW, Penson RT, et al. Bevacizumab for advanced cervical cancer: final overall survival and adverse event analysis of a randomised, controlled, open-label, phase 3 trial (Gynecologic Oncology Group 240). Lancet. 2017;390:1654-1663. doi: 10.1016/S0140-6736(17)31607-0
29. Osann K, Hsieh S, Nelson EL, et al. Factors associated with poor quality of life among cervical cancer survivors: implications for clinical care and clinical trials. Gynecol Oncol. 2014;135:266-272. doi: 10.1016/j.ygyno.2014.08.036
30. Ries LAG, Harkins D, Krapcho M, et al. SEER Cancer Statistics Review, 1975 to 2003. Bethesda, MD: National Cancer Institute; 2007. Accessed November 14, 2021. https://seer.cancer.gov/archive/csr/1975_2003/#citation
31. Hu Z, Ding M. The precision prevention and therapy of HPV-related cervical cancer: new concepts and clinical implications. Cancer Med. 2018;7:5217-5236. doi: 10.1002/cam4.1501
32. Wang R, Pan W, Jin L, et al. Human papillomavirus vaccine against cervical cancer: opportunity and challenge. Cancer Lett. 2020;471:88-102. doi: 10.1016/j.canlet.2019.11.039
The World Health Organization estimates that, in 2020, worldwide, there were 604,000 new cases of uterine cervical cancer and approximately 342,000 deaths, 84% of which occurred in developing countries.1 In the United States, as of 2018, the lifetime risk of death from cervical cancer was 2.2 for every 100,000
In this article, we summarize recent updates in the epidemiology, prevention, and treatment of cervical cancer. We emphasize recent information of value to family physicians, including updates in clinical guidelines and other pertinent national recommendations.
Spotlight continues to shine on HPV
It has been known for several decades that cervical cancer is caused by human papillomavirus (HPV). Of more than 100 known HPV types, 14 or 15 are classified as carcinogenic. HPV 16 is the most common oncogenic type, causing more than 60% of cases of cervical cancer3,4
HPV is the most common sexually transmitted infection, with as many as 80% of sexually active people becoming infected during their lifetime, generally before 50 years of age.5 HPV also causes other anogenital and oropharyngeal cancers; however, worldwide, more than 80% of HPV-associated cancers are cervical.6 Risk factors for cervical cancer are listed in TABLE 1.7 Cervical cancer is less common when partners are circumcised.7
Most cases of HPV infection clear in 1 or 2 years
At least 70% of cervical cancers are squamous cell carcinoma (SCC); 20% to 25% are adenocarcinoma (ADC); and < 3% to 5% are adenosquamous carcinoma.10 Almost 100% of cervical SCCs are HPV+, as are 86% of cervical ADCs. The most common reason for HPV-negative status in patients with cervical cancer is false-negative testing because of inadequate methods.
Primary prevention through vaccination
HPV vaccination was introduced in 2006 in the United States for girls,a and for boysa in 2011. The primary reason for vaccinating boys is to reduce the rates of HPV-related anal and oropharyngeal cancer. The only available HPV vaccine in the United States is Gardasil 9 (9-valent vaccine, recombinant; Merck), which provides coverage for 7 high-risk HPV types that account for approximately 90% of cervical cancers and 2 types (6 and 11) that are the principal causes of condylomata acuminata (genital warts). Future generations of prophylactic vaccines are expected to cover additional strains.
Continue to: Vaccine studies...
Vaccine studies have been summarized in a Cochrane review,11 showing that vaccination is highly effective for prevention of cervical dysplasia, especially when given to young girls and womena previously unexposed to the virus. It has not been fully established how long protection lasts, but vaccination appears to be 70% to 90% effective for ≥ 10 years.
Dosing schedule. The Advisory Committee on Immunization Practices (ACIP) of the Centers for Disease Control and Prevention (CDC) recommends a 2-dose schedule 6 to 15 months apart, for both girls and boys between 9 and 14 years of age.12 A third dose is indicated if the first and second doses were given less than 5 months apart, or the person is older than 15 years or is immunocompromised. No recommendation has been made for revaccination after the primary series.
In 2018, the US Food and Drug Administration approved Gardasil 9 for adults 27 to 45 years of age. In June 2019, ACIP recommended vaccination for mena as old as 26 years, and adopted a recommendation that unvaccinated men and women between 27 and 45 years discuss HPV vaccination with their physician.13
The adolescent HPV vaccination rate varies by state; however, all states lag behind the CDC’s Healthy People 2020 goal of 80%.14 Barriers to vaccination include cost, infrastructure limitations, and social stigma.
Secondary prevention: Screening and Tx of precancerous lesions
Cervical cancer screening identifies patients at increased risk of cervical cancer and reassures the great majority of them that their risk of cervical cancer is very low. There are 3 general approaches to cervical cancer screening:
- cytology-based screening, which has been implemented for decades in many countries
- primary testing for DNA or RNA markers of high-risk HPV types
- co-testing with cytology-based screening plus HPV testing.
Continue to: USPSTF guidance
USPSTF guidance. Recommendations of the US Preventive Services Task Force (USPSTF) for cervical cancer screening were updated in 2018 (TABLE 215). The recommendations state that high-risk HPV screening alone is a strategy that is amenable to patient self-sampling and self-mailing for processing—a protocol that has the potential to improve access
ASCCP guidance. The American Society of Colposcopy and Cervical Pathology (ASCCP) makes nearly the same recommendations for cervical cancer screening. An exception is that ASCCP guidelines allow for the possibility of screening using primary high-risk HPV testing for patients starting at 25 years of age.16
Screening programs that can be initiated at a later age and longer intervals should be possible once the adolescent vaccination rate is optimized and vaccination registries are widely implemented.
Cervical cytology protocol
Cervical cytologic abnormalities are reported using the Bethesda system. Specimen adequacy is the most important component of quality assurance,17 and is determined primarily by sufficient cellularity. However, any specimen containing abnormal squamous cells of undetermined significance (ASCUS) or atypical glandular cells (AGCs) is considered satisfactory, regardless of the number of cells. Obscuring factors that impair quality include excessive blood; inflammation; air-drying artifact; and an interfering substance, such as lubricant. The presence of reactive changes resulting from inflammation does not require further evaluation unless the patient is immunosuppressed.
Abnormalities are most often of squamous cells, of 2 categories: low-grade squamous intraepithelial lesions (LSILs) and high-grade squamous intraepithelial lesions (HSILs). HSILs are more likely to be associated with persistent HPV infection and higher risk of progression to cervical cancer.
Continue to: Cytologic findings...
Cytologic findings can be associated with histologic findings that are sometimes more, sometimes less, severe. LSIL cytology specimens that contain a few cells that are suspicious for HSIL, but that do not contain enough cells to be diagnostic, are reported as atypical squamous cells, and do not exclude a high-grade intraepithelial lesion.
Glandular-cell abnormalities usually originate from the glandular epithelium of the endocervix or the endometrium—most often, AGCs. Less frequent are AGCs, favor neoplasia; endocervical adenocarcinoma in situ; and ADC. Rarely, AGCs are associated with adenosquamous carcinoma. Endometrial polyps are a typical benign pathology that can be associated with AGCs.
In about 30% of cases, AGCs are associated with premalignant or malignant disease.18 The risk of malignancy in patients with AGCs increases with age, from < 2% among patients younger than 40 years to approximately 15% among those > 50 years.19 Endometrial malignancy is more common than cervical malignancy among patients > 40 years.
AGC cytology requires endocervical curettage, plus endometrial sampling for patients ≥ 35 years
Cytology-based screening has limitations. Sensitivity is relatively low and dependent on the expertise of the cytologist, although regular repeat testing has been used to overcome this limitation. A substantial subset of results are reported as equivocal—ie, ASCUS.
Continue to: Primary HPV screening
Primary HPV screening
Primary HPV testing was approved by the US Food and Drug Administration in 2015 and recommended as an appropriate screening option by professional societies
In contrast to cytology-based screening, HPV testing has high sensitivity (≥ 90%); the population-based negative likelihood ratio is near zero.20 This degree of sensitivity allows for extended screening intervals. However, primary HPV testing lacks specificity for persistent infection and high-grade or invasive lesions, which approximately doubles the number of patients who screen positive. The potential for excess patients to be referred for colposcopy led to the need for secondary triage.
Instituting secondary triage. Cytology is, currently, the primary method of secondary triage, reducing the number of referrals for colposcopy by nearly one-half, compared to referrals for all high-risk HPV results, and with better overall accuracy over cytology with high-risk HPV triage.21 When cytology shows ASCUS, or worse, refer the patient for colposcopy; alternatively, if so-called reflex testing for HPV types 16 and 18 is available and positive, direct referral to colposcopy without cytology is also appropriate.
In the future, secondary triage for cytology is likely to be replaced with improved technologies, such as immunostaining of the specimen for biomarkers associated with cervical precancer or cancer, or for viral genome methylation testing.22
Management of abnormal cervical cancer screening results
Routine screening applies to asymptomatic patients who do not require surveillance because they have not had prior abnormal screening results. In 2020, ASCCP published risk-based management consensus guidelines that were developed for abnormal cervical cancer screening tests and for cancer precursors.16 Guiding principles, and screening situations in which the guidelines can be applied, are summarized in TABLE 3
Continue to: ASCCP guidelines...
ASCCP guidelines provide a framework to incorporate new data and technologies without major revision
Some noteworthy scenarios in ASCCP risk-based management are:
- For unsatisfactory cytology with a negative HPV test or no HPV test, repeat age-based screening in 2 to 4 months. (Note: A negative HPV test might reflect an inadequate specimen; do not interpret this result as a true negative.)
- An absent transformation zone (ie, between glandular and squamous cervical cells) with an otherwise adequate specimen should be interpreted as satisfactory for screening in patients 21 to 29 years of age. For those ≥ 30 years and with no HPV testing in this circumstance, HPV testing is preferred; repeating cytology, in 3 years, is also acceptable.
- After a finding of LSIL/CIN1 without evidence of a high-grade abnormality, and after 2 negative annual screenings (including HPV testing), a return to 3-year (not 5-year) screening is recommended.
- A cytology result of an HSIL carries a risk of 26% for CIN3+, in which case colposcopy is recommended, regardless of HPV test results.
- For long-term management after treatment for CIN2+, continue surveillance testing every 3 years after 3 consecutive negative HPV tests or cytology findings, for at least 25 years. If the 25-year threshold is reached before 65 years of age, continuing surveillance every 3 years is optional, as long as the patient is in good health (ie, life expectancy ≥ 10 years).
- After hysterectomy for a high-grade abnormality, annual vaginal HPV testing is recommended until 3 negative tests are returned; after that, surveillance shifts to a 3-year interval until the 25-year threshold.
Treatment of cancer precursors
Treatment for cervical dysplasia is excisional or ablative.
Excisional therapy. In most cases, excisional therapy (either a loop electrosurgical excision procedure [LEEP; also known as large loop excision of the transformation zone, cold knife conization, and laser conization] or cone biopsy) is required, or preferred. Excisional treatment has the advantage of providing a diagnostic specimen.
The World Health Organization recommends LEEP over ablation in settings in which LEEP is available.23 ASCCP states that, in the relatively few cases in which treatment is needed and it is for CIN1, either excision or ablation is acceptable. TABLE 416 lists situations in which excisional treatment is required because a diagnostic specimen is needed.
Continue to: Ablative treatments
Ablative treatments are cryotherapy, CO2 laser ablation, and thermal ablation. Ablative therapy has the advantage of presenting less risk of adverse obstetric outcomes (eg, preterm birth); it can be used if the indication for therapy is:
- CIN1 or CIN2 and HPV type 16 or 18 positivity
- concordant cytology and histology
- satisfactory colposcopy
- negative endocervical curettage.
The most common ablative treatment is liquid nitrogen applied to a metal tip under local anesthesia.
Hysterectomy can be considered for patients with recurrent CIN2+ who have completed childbearing or for whom repeat excision is infeasible (eg, scarring or a short cervix), or both.
Cost, availability, and convenience might play a role in decision-making with regard to the treatment choice for cancer precursors.
Is care after treatment called for? Patients who continue to be at increased risk of (and thus mortality from) cervical and vaginal cancer require enhanced surveillance. The risk of cancer is more than triple for patients who were given their diagnosis, and treated, when they were > 60 years, compared to patients treated in their 30s.1 The excess period of risk covers at least 25 years after treatment, even among patients who have had 3 posttreatment screenings.
Continue to: Persistent HPV positivity...
Persistent HPV positivity is more challenging. Patients infected with HPV type 16 have an increased risk of residual disease.
Cancer management
Invasive cancer. Most cervical cancers (60%) occur among patients who have not been screened during the 5 years before their diagnosis.24 For patients who have a diagnosis of cancer, those detected through screening have a much better prognosis than those identified by symptoms (mean cure rate, 92% and 66%, respectively).25 The median 5-year survival for patients who were not screened during the 5 years before their diagnosis of cervical cancer is 66%.2
In unscreened patients, cervical cancer usually manifests as abnormal vaginal bleeding, especially postcoitally. In approximately 45% of cases, the patient has localized disease at diagnosis; in 36%, regional disease; and in 15%, distant metastases.26
For cancers marked by stromal invasion < 3 mm, appropriate treatment is cone biopsy or simple hysterectomy.27
Most patients with early-stage cervical cancer undergo modified radical hysterectomy. The ovaries are usually conserved, unless the cancer is adenocarcinoma. Sentinel-node dissection has become standard practice. Primary radiation therapy is most often used for patients who are a poor surgical candidate because of medical comorbidity or poor functional status. Antiangiogenic agents (eg, bevacizumab) can be used as adjuvant palliative therapy for advanced and recurrent disease
Continue to: After treatment for...
After treatment for invasive cervical cancer, the goal is early detection of recurrence, although there is no consensus on a protocol. Most recurrences are detected within the first 2 years.
Long-term sequelae after treatment for advanced cancer are considerable. Patients report significantly lower quality of life,
Hormone replacement therapy is generally considered acceptable after treatment of cervical cancer because it does not increase replication of HPV.
Recurrent or metastatic cancer. Recurrence or metastases will develop in 15% to 60% of patients,30 usually within the first 2 years after treatment.
Management depends on location and extent of disease, using mainly radiation therapy or surgical resection. Recurrence or metastasis is usually incurable.
Continue to: Last, there are promising...
Last, there are promising areas of research for more effective treatment for cervical cancer precursors and cancers, including gene editing tools31 and therapeutic
Prospects for better cervical cancer care
Prevention. HPV vaccination is likely to have a large impact on population-based risk of both cancer and cancer precursors in the next generation.
Screening in the foreseeable future will gravitate toward reliance on primary HPV screening, with a self-sampling option.
Surveillance after dysplastic disease. The 2019 ASCCP guidelines for surveillance and intervention decisions after abnormal cancer screening results will evolve to incorporate introduction of new technology into computerized algorithms.
Treatment. New biologic therapies, including monoclonal antibodies and therapeutic vaccines against HPV, will likely be introduced for treating cancer precursors and invasive cancer.
A NOTE FROM THE EDITORS The Editors of The Journal of Family Practice recognize the importance of addressing the reproductive health of gender-diverse individuals. In this article, we use the words “women,” “men,” “girls,” and “boys” in limited circumstances (1) for ease of reading and (2) to reflect the official language of the US Food and Drug Administration and the Advisory Committee on Immunization Practices. The reader should consider the information and guidance offered in this discussion of cervical cancer and other human papillomavirus-related cancers to speak to the care of people with a uterine cervix and people with a penis.
CORRESPONDENCE
Linda Speer, MD, 3000 Arlington Avenue, MS 1179, Toledo, OH 43614; Linda.speer@utoledo.edu
1. Sung H, Ferlay J, Siegel RL, et al. Global cancer statistics 2020: GLOBOCAN estimates of incidence and mortality worldwide for 36 cancers in 185 countries. CA Cancer J Clin. 2021;71:209-249. doi: 10.3322/caac.21660
2. Cancer stat facts: cervical cancer. National Cancer Institute Surveillance, Epidemiology, and End Results [SEER] Program. Accessed November 14, 2021. https://seer.cancer.gov/statfacts/html/cervix.html
3. Guan P, Howell-Jones R, Li N, et al. Human papillomavirus types in 115,789 HPV-positive women: a meta-analysis from cervical infection to cancer. Int J Cancer 2012;131:2349-2359. doi: 10.1002/ijc.27485
4. Winer RL, Hughes JP, Feng Q, et al. Early history of incident, type-specific human papillomavirus infections in newly sexually active young women. Cancer Epidemiol Biomarkers Prev. 2011;20:699-707. doi: 10.1158/1055-9965.EPI-10-1108
5. Chesson HW, Dunne EF, Hariri F, et al. The estimated lifetime probability of acquiring human papillomavirus in the United States. Sex Transm Dis. 2014;41:660-664. doi: 10.1097/OLQ.0000000000000193
6. Human papillomavirus (HPV) and cervical cancer. Fact sheet. Geneva, Switzerland: World Health Organization; November 11, 2020. Accessed November 14, 2021. www.who.int/news-room/fact-sheets/detail/human-papillomavirus-(hpv)-and-cervical-cancer
7. International Collaboration of Epidemiological Studies of Cervical Cancer. Comparison of risk factors for invasive squamous cell carcinoma and adenocarcinoma of the cervix: collaborative reanalysis of individual data on 8,097 women with squamous cell carcinoma and 1,374 women with adenocarcinoma from 12 epidemiological studies. Int J Cancer. 2007;120:885-891. doi: 10.1002/ijc.22357
8. McCredie MRE, Sharples KJ, Paul C, et al. Natural history of cervical cancer neoplasia and risk of invasive cancer in women with cervical intraepithelial neoplasia 3: a retrospective cohort study. Lancet Oncol. 2008:9:425-434. doi: 10.1016/S1470-2045(08)70103-7
9. de Sanjose S, Quint WG, Alemany I, et al; . Human papillomavirus genotype attribution in invasive cervical cancer: a retrospective, cross-sectional worldwide study. Lancet Oncol. 2010;11:1048-1056. doi: 10.1016/S1470-2045(10)70230-8
10. Ries LAG, Melbert D, Krapcho M, et al. SEER Cancer Statistics Review 1975-2004. Bethesda, MD: National Cancer Institute; 2007. Accessed November 14, 2021. https://seer.cancer.gov/archive/csr/1975_2004/#citation
11. Arbyn M, Xu L, Simoens C, et al. Prophylactic vaccination against human papillomaviruses to prevent cervical cancer and its precursors. Cochrane Database Syst Rev. 2018;5:CD009069. doi: 10.1002/14651858.CD009069.pub3
12. Meites E, Kempe A, Markowitz LE. Use of a 2-dose schedule for human papillomavirus vaccination—updated recommendations of the Advisory Committee on Immunization Practices. MMWR Morb Mortal Wkly Rep. 2016:65;1405-1408. doi: 10.15585/mmwr.mm6549a5
13. Meites E, Szilagyi PG, Chesson HW, et al. Human papillomavirus vaccination for adults: updated recommendations of the Advisory Committee on Immunization Practices. MMWR Morb Mortal Wkly Rep. 2019;68:698-702. doi: 10.15585/mmwr.mm6832a3
14. State-level data: Female adolescents receiving 2 or 3 doses of HPV vaccine by age 13-15 years (percent). HealthyPeople.gov. Accessed November 14, 2021. www.healthypeople.gov/2020/data/map/4657?year=2018
15. United States Preventive Services Task Force; Curry SJ, Krist AH, Owens DK, et al. Screening for cervical cancer: US Preventive Services Task Force recommendation statement. JAMA 2018;320:674-686. doi: 10.1001/jama.2018.10897
16. Perkins RB, Guido RS, Castle PE, et al; 2019 ASCCP Risk-Based Management Consensus Guidelines Committee. 2019 ASCCP risk-based management consensus guidelines for abnormal cervical cancer screening tests and cancer precursors. J Low Genit Tract Dis. 2020;24:102-131. doi: 10.1097/LGT.0000000000000525
17. Nayar R, Wilbur DC. The Pap test and Bethesda 2014. Cancer Cytopathol. 2015;123;271-281. doi: 10.1002/cncy.21521
18. Schnatz PF, Guile M, O’Sullivan DM, et al. Clinical significance of atypical glandular cells on cervical cytology. Obstet Gynecol 2006;107:701-708. doi: 10.1097/01.AOG.0000202401.29145.68
19. Zhao C, Florea A, Onisko A, et al. Histologic follow-up results in 662 patients with Pap test findings of atypical glandular cells: results from a large academic womens hospital laboratory employing sensitive screening methods. Gynecol Oncol 2009;114:383-389. doi: 10.1016/j.ygyno.2009.05.019
20. Zazove P, Reed BD, Gregoire L, et al. Low false-negative rate of PCR analysis for detecting human papillomavirus-related cervical lesions. J Clin Microbiol. 1998;36:2708-2713. doi: 10.1128/JCM.36.9.2708-2713.1998
21. Richardson LA, El-Zein M, Ramankumar AV, et al; . HPV DNA testing with cytology triage in cervical cancer screening: influence of revealing HPV infection status. Cancer Cytopathol. 2015:123:745-754. doi: 10.1002/cncy.21596
22. Wentzensen N, Schiffman M, Palmer T, et al. Triage of HPV positive women in cervical cancer screening. J Clin Virol 2016;76:S49-S55. doi: 10.1016/j.jcv.2015.11.015
23. WHO Guidelines: Use of Cryotherapy for Cervical Intraepithelial Neoplasia. Geneva, Switzerland: World Health Organization; 2011. Accessed November 14, 2021. www.ncbi.nlm.nih.gov/books/NBK138476/pdf/Bookshelf_NBK138476.pdf
24. Spence AR, Goggin P, Franco EL. Process of care failures in invasive cervical cancer: systematic review and meta-analysis. Prev Med. 2007:45:93-106. doi: 10.1016/j.ypmed.2007.06.007
25. Rositch AF, Nowak RG, Gravitt PE. Increased age and race-specific incidence of cervical cancer after correction for hysterectomy prevalence in the United States from 2000-2009. Cancer. 2014:120:2032-2038. doi: 10.1002/cncr.28548
26. Siegel RL, Miller KD, Fuchs HE, et al. Cancer statistics, 2021. CA: Cancer J Clin. 2021;71:7-33. doi: 10.3322/caac.21654
27. National Comprehensive Cancer Network. Clinical practice guidelines in oncology: cervical cancer. Accessed June 15, 2021. www.nccn.org/professionals/physician_gls/pdf/cervical.pdf
28. Tewari KS, Sill MW, Penson RT, et al. Bevacizumab for advanced cervical cancer: final overall survival and adverse event analysis of a randomised, controlled, open-label, phase 3 trial (Gynecologic Oncology Group 240). Lancet. 2017;390:1654-1663. doi: 10.1016/S0140-6736(17)31607-0
29. Osann K, Hsieh S, Nelson EL, et al. Factors associated with poor quality of life among cervical cancer survivors: implications for clinical care and clinical trials. Gynecol Oncol. 2014;135:266-272. doi: 10.1016/j.ygyno.2014.08.036
30. Ries LAG, Harkins D, Krapcho M, et al. SEER Cancer Statistics Review, 1975 to 2003. Bethesda, MD: National Cancer Institute; 2007. Accessed November 14, 2021. https://seer.cancer.gov/archive/csr/1975_2003/#citation
31. Hu Z, Ding M. The precision prevention and therapy of HPV-related cervical cancer: new concepts and clinical implications. Cancer Med. 2018;7:5217-5236. doi: 10.1002/cam4.1501
32. Wang R, Pan W, Jin L, et al. Human papillomavirus vaccine against cervical cancer: opportunity and challenge. Cancer Lett. 2020;471:88-102. doi: 10.1016/j.canlet.2019.11.039
PRACTICE RECOMMENDATIONS
› Encourage eligible patients to be vaccinated against human papillomavirus (HPV) because the vaccine is highly effective for preventing cervical dysplasia, especially when given to patients previously unexposed to the virus. A
› Screen for cervical disease with either cytology plus HPV testing or primary HPV testing with secondary triage for cytology; both protocols are more accurate than screening with cervical cytology alone, and allow you to widen the screening interval. A
Strength of recommendation (SOR)
A Good-quality patient-oriented evidence
B Inconsistent or limited-quality patient-oriented evidence
C Consensus, usual practice, opinion, disease-oriented evidence, case series

Write an exercise Rx to improve patients' cardiorespiratory fitness
It is well-known that per capita health care spending in the United States is more than twice the average in other developed countries1; nevertheless, the overall health care ranking of the US is near the bottom compared to other countries in this group.2 Much of the reason for this poor relative showing lies in the fact that the US has employed a somewhat traditional fee-for-service health care model that does not incentivize efforts to promote health and wellness or prevent chronic disease. The paradigm of promoting physical activity for its disease-preventing and treatment benefits has not been well-integrated in the US health care system.
In this article, we endeavor to provide better understanding of the barriers that keep family physicians from routinely promoting physical activity in clinical practice; define tools and resources that can be used in the clinical setting to promote physical activity; and delineate areas for future work.
Glaring hole in US physical activity education
Many primary care physicians feel underprepared to prescribe or motivate patients to exercise. The reason for that lack of preparedness likely relates to a medical education system that does not spend time preparing physicians to perform this critical task. A study showed that, on average, medical schools require only 8 hours of physical activity education in their curriculum during the 4 years of schooling.3 Likewise, the average primary care residency program offers only 3 hours of didactic training on physical activity, nutrition, and obesity.4 The problem extends to sports medicine fellowship training, in which a 2019 survey showed that 63% of fellows were never taught how to write an exercise prescription in their training program.5
Without education on physical activity, medical students, residents, and fellows are woefully underprepared to realize the therapeutic value of physical activity in patient care, comprehend current physical activity guidelines, appropriately motivate patients to engage in exercise, and competently discuss exercise prescriptions in different disease states. Throughout their training, it is imperative for medical professionals to be educated on the social determinants of health, which include the conditions in which people live, work, and play. These environmental variables can contribute to health inequities that create additional barriers to improvement in physical fitness.6
National guidelines on physical activity
The 2018 National Physical Activity Guidelines detail recommendations for children, adolescents, adults, and special populations.7 The guidelines define physical activity as bodily movement produced by skeletal muscles that result in energy expenditure above resting baseline levels, and includes all types, intensities, and domains of activity. Exercise is a subset of physical activity characterized as planned, structured, repetitive, and designed to improve or maintain physical fitness, physical performance, or health.
Highlights from the 2018 guidelines include7:
- Preschool-aged children (3 to 5 years of age) should be physically active throughout the day, with as much as 3 hours per day of physical activity of all intensities—light, moderate, and vigorous.
- Older children and adolescents (6 to 17 years) should accumulate 60 minutes per day of moderate-to-vigorous physical activity, including aerobic, muscle-strengthening, and bone-strengthening activities.
- Adults of all ages should achieve approximately 150 to 300 minutes of moderate or 75 to 150 minutes of vigorous physical activity (or an equivalent combination) per week, along with at least 2 days per week of muscle-strengthening activities. Other types of physical activity include flexibility, balance, bone-strengthening, and mind–body exercises.
3-step framework for enhancing physical activity counseling
Merely knowing that physical activity is healthy is not enough, during a patient encounter, to increase the level of physical activity. Therefore, it is imperative to learn and adopt a framework that has proved to yield successful outcomes. The Screening, Brief Intervention, and Referral to Treatment (SBIRT) framework, which has predominantly been used to change patient behavior related to alcohol and substance use, is now being utilized by some providers to promote physical activity.8 We apply the SBIRT approach in this article, although research is lacking on its clinical utility and outcome measures.
Continue to: SBIRT
SBIRT: Screening
An office visit provides an opportunity to understand a patient’s level of physical activity. Often, understanding a patient’s baseline level of activity is only asked during a thorough social history, which might not be performed during patient encounters. As physical activity is the primary determinant of cardiorespiratory fitness (CRF), some health care systems have begun delineating physical activity levels as a vital sign to ensure that the assessment of physical activity is a standard part of every clinical encounter. At a minimum, this serves as a prompt and provides an opportunity to start a conversation around improving physical activity levels when guidelines are not being met.
The exercise vital sign. Assessment and documentation of physical activity in the electronic health record are not yet standardized; however, Kaiser Permanente health plans have implemented the exercise vital sign, or EVS, in its HealthConnect (Epic Systems) electronic health record. The EVS incorporates information about a patient’s:
- days per week of moderate-to-strenuous exercise (eg, a brisk walk)
- minutes per day, on average, of exercise at this level.
The physical activity vital sign. Intermountain Healthcare implemented the physical activity vital sign, or PAVS, in its iCentra (Cerner Corp.) electronic health record. The 3-question PAVS assessment asks:
- On average, how many days of the week do you perform physical activity or exercise?
- On average, how many total minutes of physical activity or exercise do you perform on those days?
- How would you describe the intensity of your physical activity or exercise: Light (ie, a casual walk)? Moderate (a brisk walk)? Or vigorous (jogging)?
PAVS includes a fourth data point: The physician–user documents whether the patient was counseled to start, increase, maintain, or modify physical activity or exercise.
EVS and the PAVS have demonstrated validity.9-11
Continue to: Cardiorespiratory fitness as a vital sign
Cardiorespiratory fitness as a vital sign. In 2016, the American Heart Association (AHA) asserted the importance of assessing CRF as a clinical vital sign.12 CRF is commonly expressed as maximal oxygen consumption (VO2max = O2 mL/kg/min) and measured through cardiopulmonary exercise testing (CPET), considered the gold standard by combining conventional graded exercise testing with ventilatory expired gas analysis. CPET is more objective and precise than equations estimating CRF that are derived from peak work rate. AHA recommended that efforts to improve CRF should become standard in clinical encounters, explaining that even a small increase in CRF (eg, 1 or 2 metabolic equivalentsa [METs]) is associated with a considerably (10% to 30%) lower rate of adverse cardiovascular events.12
De Souza de Silva and colleagues revealed an association between each 1-MET increase in CRF and per-person annual health care cost savings (adjusted for age and presence of cardiovascular disease) of $3272 (normal-weight patients), $4252 (overweight), and $6103 (obese).13 In its 2016 scientific statement on CRF as a vital sign, AHA listed several methods of estimating CRF and concluded that, although CPET involves a higher level of training, proficiency, equipment, and, therefore, cost, the independent and additive information obtained justifies its use in many patients.12
CASE
Mary Q, 68 years of age, presents for an annual well-woman examination. Body mass index is 32; resting heart rate (HR), 73 bpm; and blood pressure, 126/74 mm Hg. She reports being inactive, except for light walking every day with her dog around the neighborhood, which takes them approximately 15 minutes. She denies any history or signs and symptoms of cardiovascular, metabolic, or renal disease.
You consider 3 questions before taking next steps regarding increasing Ms. Q’s activity level:
- What is her PAVS?
- Does she need medical clearance before starting an exercise program?
- What would an evidence-based cardiovascular exercise prescription for Ms. Q look like?
SBIRT: Brief intervention
When a patient does not meet the recommended level of physical activity, you have an opportunity to deliver a brief intervention. To do this effectively, you must have adequate understanding of the patient’s receptivity for change. The transtheoretical, or Stages of Change, model proposes that a person typically goes through 5 stages of growth—pre-contemplation, contemplation, preparation, action, and maintenance—in the process of lifestyle modification. This model highlights the different approaches to exercise adoption and maintenance that need to be taken, based on a given patient’s stage at the moment.
Continue to: Using this framework...
Using this framework, you can help patients realize intrinsic motivation that can facilitate progression through each stage, utilizing techniques such as motivational interviewing—so-called change talk—to increase self-efficacy.14TABLE 115 provides examples of motivational interviewing techniques that can be used during a patient encounter to improve health behaviors, such as physical activity.
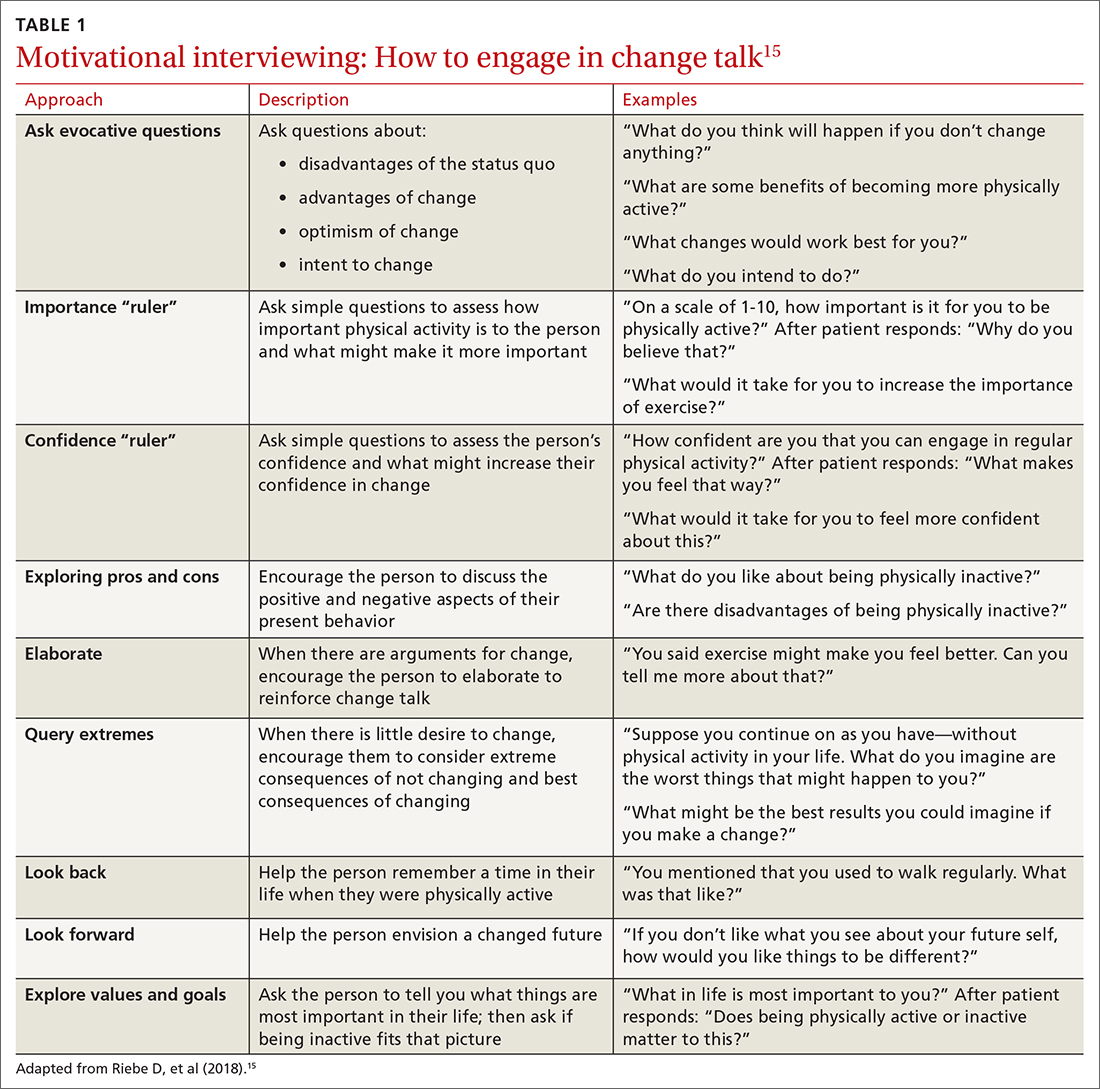
Writing the exercise prescription
A patient who wants to increase their level of physical activity should be offered a formal exercise prescription, which has been shown to increase the level of physical activity, particularly in older patients. In fact, a study conducted in Spain in the practices of family physicians found that older patients who received a physical activity prescription increased their activity by 131 minutes per week; and compared to control patients, they doubled the minutes per week devoted to moderate or vigorous physical activity.16
FITT-VP. The basics of a cardiovascular exercise prescription can be found in the FITT-VP (Frequency, Intensity, Time, Type, Volume, and [monitoring of] Progression) framework (TABLE 217-19). For most patients, this model includes 3 to 5 days per week of moderate-to-vigorous physical activity for 30 to 60 minutes per session. For patients with established chronic disease, physical activity provides health benefits but might require modification. Disease-specific patient handouts for exercise can be downloaded, at no cost, through the American College of Sports Medicine (ACSM) “Exercise Is Medicine” program, which can be found at: www.exerciseismedicine.org/support_page.php/rx-for-health-series.
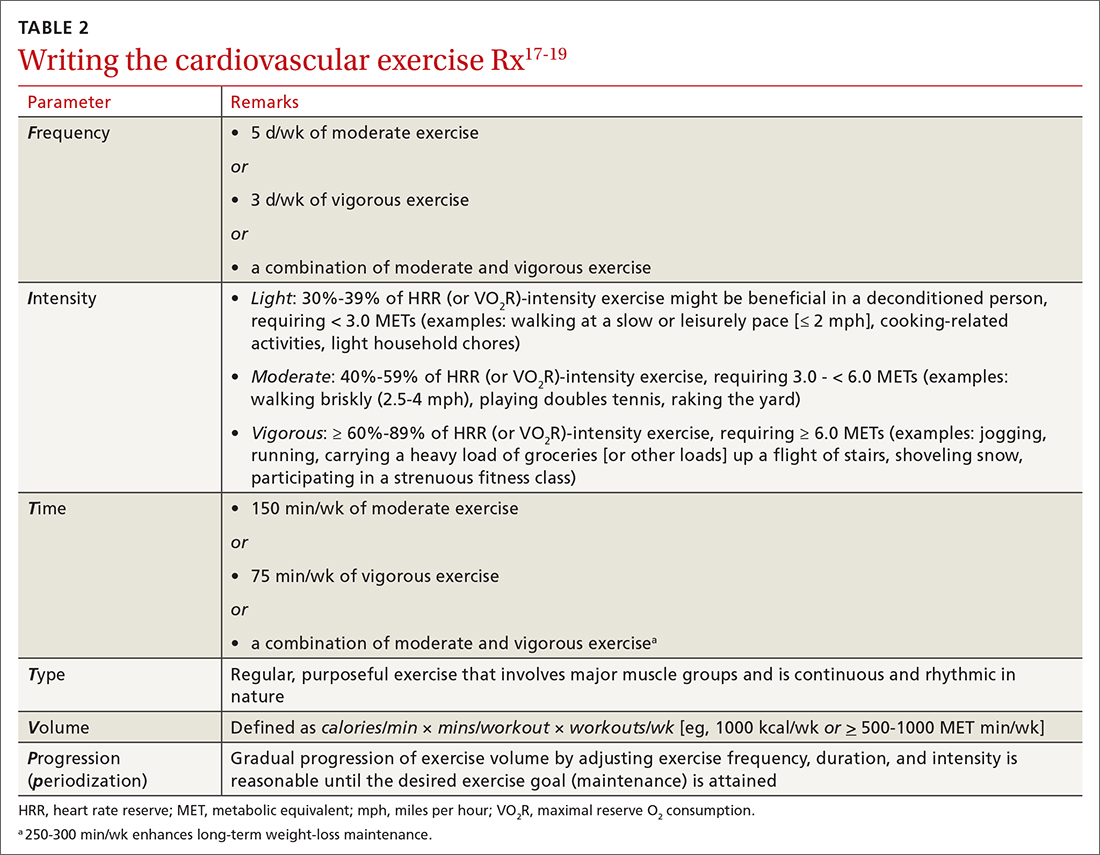
Determining intensity level. Although CPET is the gold standard for determining a patient’s target intensity level, such a test might be impracticable for a given patient. Surrogate markers of target intensity level can be obtained by measuring maximum HR (HRmax), using a well-known equation20:
HRmax = 220 – age
which is then multiplied by intensity range:
- light: 30%-39%
- moderate: 40%-59%
- vigorous: 60%-89%
or, more preferably, by calculating the HR training zone while accounting for HR at rest (HRrest). This is accomplished by calculating the HR reserve (HRR) (ie, HRR = HRmax – HRrest) and then calculating the target heart rate (THR)21:
THR = [HRR × %intensity] + HRrest
Continue to: The THR calculation...
The THR calculation is performed twice, once with a lower %intensity and again with a higher %intensity to develop a training zone based on HRR.
The HRR equation is more accurate than calculating HRmax from 220 – age, because HRR accounts for resting HR, which is often lower in people who are better conditioned.
Another method of calculating intensity for patients who are beginning a physical activity program is the rating of perceived exertion (RPE), which is graded on a scale of 6 to 20: Moderate exercise correlates with an RPE of 12 to 13 (“somewhat hard”); vigorous exercise correlates with an RPE of 14 to 16 (“hard”). By adding a zero to the rating on the RPE scale, the corresponding HR in a healthy adult can be estimated when they are performing an activity at that perceived intensity.22 Moderate exercise therefore correlates with a HR of 120 and 130 bpm.
The so-called talk test can also guide exercise intensity: Light-intensity activity correlates with an ability to sing; moderate-intensity physical activity likely allows the patient to still hold a conversation; and vigorous-intensity activity correlates with an inability to carry on a conversation while exercising.
An exercise prescription should be accompanied by a patient-derived goal, which can be reassessed during a follow-up visit. So-called SMART goals (Specific, Measurable, Achievable, Relevant, and Time-bound) are tools to help patients set personalized and realistic expectations for physical activity. Meeting the goal of approximately 150 to 300 minutes of moderate or 75 to 150 minutes of vigorous physical activity (or an equivalent combination) per week is ideal, but a patient needs to start where they are, at the moment, and gradually increase activity by setting what for them are realistic and sustainable goals.
Continue to: CASE
CASE
With a PAVS of 105 minutes (ie, 15 minutes per day × 7 days) of weekly light-to-moderate exercise walking her dog, Ms. Q does not satisfy current physical activity guidelines. She needs an exercise prescription to incorporate into her lifestyle (see “Cardiovascular exercise prescription,” at left).
First, based on ACSM pre-participation guidelines, Ms. Q does not need medical clearance before initiating light-to-moderate exercise and gradually progressing to vigorous-intensity exercise.
Second, in addition to walking the dog for 105 minutes a week, you:
- advise her to start walking for 10 minutes, 3 times per week, at a pace that keeps her HR at 97-104 bpm.
- encourage her to gradually increase the frequency or duration of her walks by no more than 10% per week.
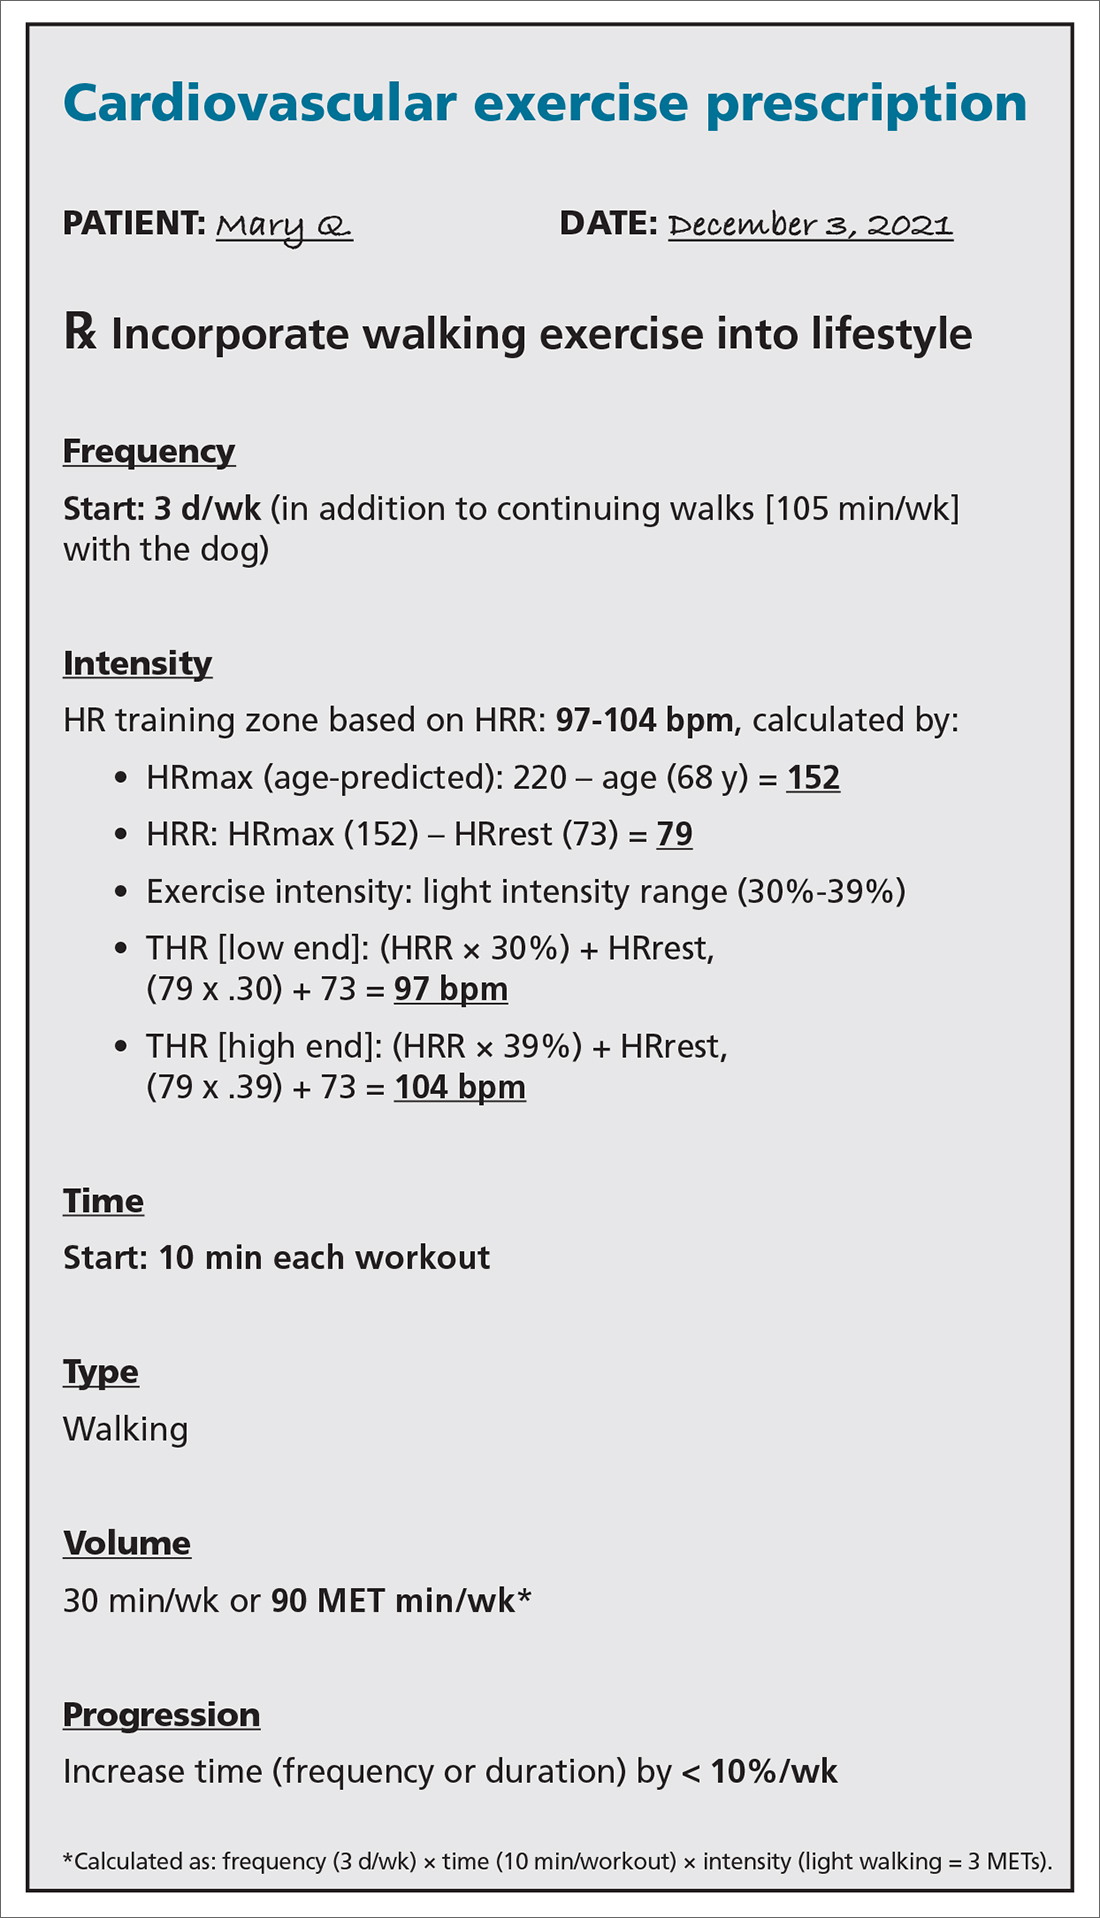
SBIRT: Referral for treatment
When referring a patient to a fitness program or professional, it is essential to consider their preferences, resources, and environment.23 Community fitness partners are often an excellent referral option for a patient seeking guidance or structure for their exercise program. Using the ACSM ProFinder service, (www.acsm.org/get-stay-certified/find-a-pro) you can search for exercise professionals who have achieved the College’s Gold Standard credential.
Gym memberships or fitness programs might be part of the extra coverage offered by Medicare Advantage Plans, other Medicare health plans, or Medicare Supplement Insurance (Medigap) plans.24
Continue to: CASE
CASE
After providing Ms. Q with her exercise prescription, you refer her to a local gym that participates in the Silver Sneakers fitness and wellness program (for adults ≥ 65 years of age in eligible Medicare plans) to determine whether she qualifies to begin resistance and flexibility training, for which you will write a second exercise prescription (TABLE 317-19).
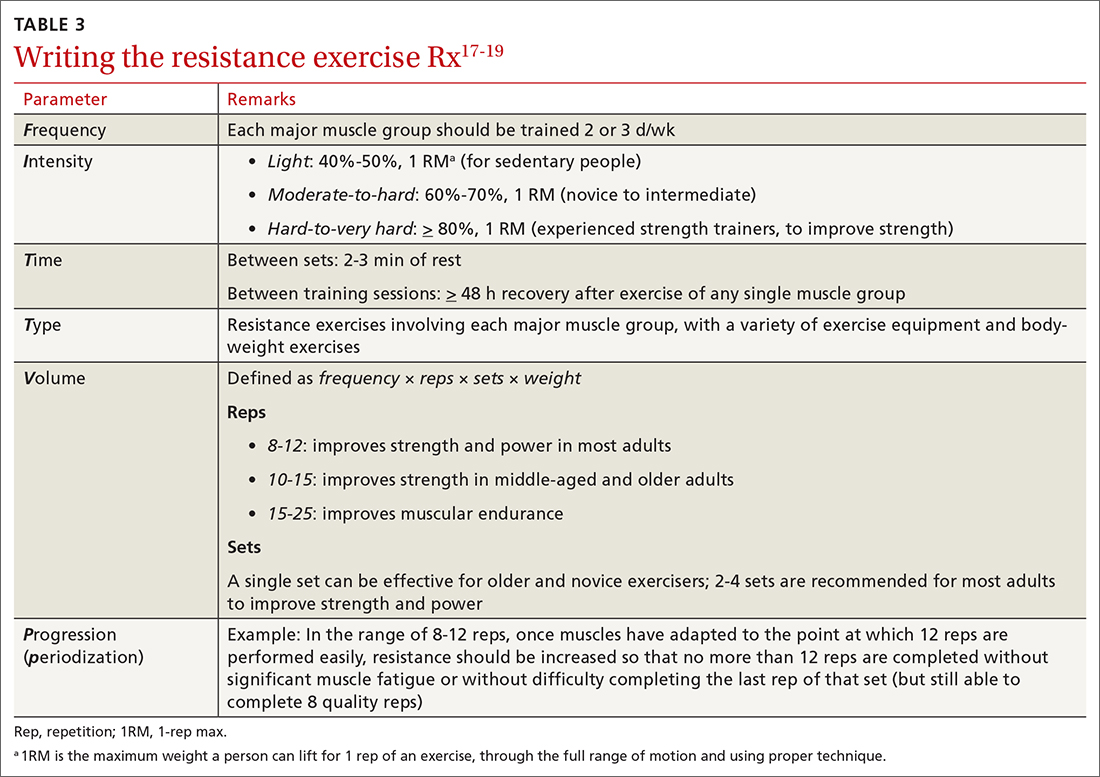
Pre-participation screening
Updated 2015 ACSM exercise pre-participation health screening recommendations attempt to decrease possible barriers to people who are becoming more physically active, by minimizing unnecessary referral to health care providers before they change their level of physical activity. ACSM recommendations on exercise clearance include this guidance25:
- For a patient who is asymptomatic and already physically active—regardless of whether they have known cardiovascular, metabolic, or renal disease—medical clearance is unnecessary for moderate-intensity exercise.
- Any patient who has been physically active and asymptomatic but who becomes symptomatic during exercise should immediately discontinue such activity and undergo medical evaluation.
- For a patient who is inactive, asymptomatic, and who does not have known cardiovascular, metabolic, or renal disease, medical clearance for light- or moderate-intensity exercise is unnecessary.
- For inactive, asymptomatic patients who have known cardiovascular, metabolic, or renal disease, medical clearance is recommended.
Digital health
Smartwatches and health apps (eg, CardioCoach, Fitbit, Garmin Connect, Nike Training Club, Strava, and Training Peaks) can provide workouts and offer patients the ability to collect information and even connect with other users through social media platforms. This information can be synced to Apple Health platforms for iPhones (www.apple.com/ios/health/) or through Google Fit (www.google.com/fit/) on Android devices. Primary care physicians who become familiar with health apps might find them useful for select patients who want to use technology to improve their physical activity level.
However, data on the value of using digital apps for increasing physical activity, in relation to their cost, are limited. Additional research is needed to assess their validity.
Billing and coding
For most patients, the physical activity assessment, prescription, and referral are performed in the context of treating another condition (eg, hypertension, type 2 diabetes, obesity, depression) or during a preventive health examination, and are typically covered without additional charge to the patient. An evaluation and management visit for an established patient could be used to bill if > 50% of the office visit was spent face-to-face with a physician, with patient counseling and coordination of care.
Continue to: Physicians and physical therapists...
Physicians and physical therapists can use the therapeutic exercise code (Current Procedural Terminology code 97110) when teaching patients exercises to develop muscle strength and endurance, joint range of motion, and flexibility26 (TABLE 426).
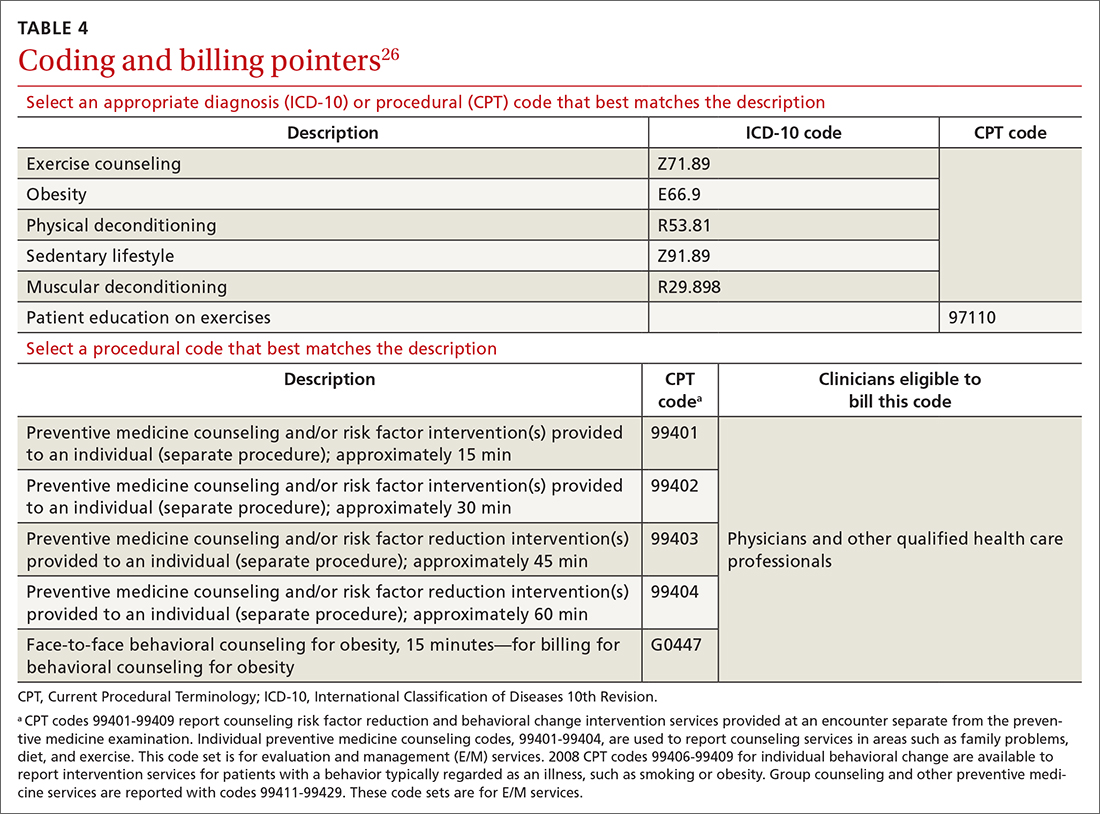
Conclusion
Physical activity and CRF are strong predictors of premature mortality, even compared to other risk factors, such as cigarette smoking, hypertension, hypercholesterolemia, and type 2 diabetes.27 Brief physical activity assessment and counseling is an efficient, effective, and cost-effective means to increase physical activity, and presents a unique opportunity for you to encourage lifestyle-based strategies for reducing cardiovascular risk.28
However, it is essential to meet patients where they are before trying to have them progress; it is therefore imperative to assess the individual patient’s level of activity using PAVS. With that information in hand, you can personalize physical activity advice; determine readiness for change and potential barriers for change; assist the patient in setting SMART goals; and arrange follow-up to assess adherence to the exercise prescription. Encourage the patient to call their health insurance plan to determine whether a gym membership or fitness program is covered.
Research is needed to evaluate the value of using digital apps, in light of their cost, to increase physical activity and improve CRF in a clinical setting. Prospective trials should be initiated to determine how routine implementation of CRF assessment in primary care alters the trajectory of clinical care. It is hoped that future research will answer the question: Would such an approach improve clinical outcomes and reduce health care expenditures?12
a Defined as O2 consumed while sitting at rest; equivalent to 3.5 mL of O2 × kg of body weight × min.
CORRESPONDENCE
Matthew Kampert, DO, MS, Sports Medicine, 5555 Transportation Boulevard, Cleveland, OH 44125; kamperm@ccf.org
1. Papanicolas I, Woskie LR, Jha AK. Health care spending in the United States and other high-income countries. JAMA. 2018;319:1024-1039. doi: 10.1001/jama.2018.1150
2. Tikkanen R, Abrams MK. U.S. health care from a global perspective, 2019: higher spending, worse outcomes? The Commonwealth Fund Website. January 30, 2020. Accessed November 16, 2021. www.commonwealthfund.org/publications/issue-briefs/2020/jan/us-health-care-global-perspective-2019
3. Stoutenberg M, Stasi S, Stamatakis E, et al. Physical activity training in US medical schools: preparing future physicians to engage in primary prevention. Phys Sportsmed. 2015;43:388-394. doi: 10.1080/00913847.2015.1084868
4. Antognoli EL, Seeholzer EL, Gullett H, et al. Primary care resident training for obesity, nutrition, and physical activity counseling: a mixed-methods study. Health Promot Pract. 2017;18:672-680. doi: 10.1177/1524839916658025
5. Asif IM, Drezner JA. Sports and exercise medicine education in the USA: call to action. Br J Sports Med. 2020;54:195-196. doi: 10.1136/bjsports-2019-101104
6. Douglas JA, Briones MD, Bauer EZ, et al. Social and environmental determinants of physical activity in urban parks: testing a neighborhood disorder model. Prev Med. 2018;109:119-124. doi: 10.1016/j.ypmed.2018.01.013
7. 2018 Physical Activity Guidelines Advisory Committee. 2018 Physical Activity Guidelines Advisory Committee Scientific Report. Washington, DC: US Department of Health & Human Services; 2018. Accessed November 15, 2021. https://health.gov/sites/default/files/2019-09/PAG_Advisory_Committee_Report.pdf
8. Avis JL, Cave AL, Donaldson S, et al. Working with parents to prevent childhood obesity: protocol for a primary care-based ehealth study. JMIR Res Protoc. 2015;4:e35. doi:10.2196/resprot.4147
9. Ball TJ, Joy EA, Gren LH, et al. Concurrent validity of a self-reported physical activity ‘vital sign’ questionnaire with adult primary care patients. Prev Chronic Dis. 2016;13:e16. doi: 10.5888/pcd13.150228
10. Ball TJ, Joy EA, Gren LH, et al. Predictive validity of an adult physical activity “vital sign” recorded in electronic health records. J Phys Act Health. 2016;13:403-408. doi: 10.1123/jpah.2015-0210
11. Coleman KJ, Ngor E, Reynolds K, et al. Initial validation of an exercise “vital sign” in electronic medical records. Med Sci Sports Exerc. 2012;44:2071-2076. doi: 10.1249/MSS.0b013e3182630ec1
12. Ross R, Blair SN, Arena R, et al; ; ; ; ; ; . Importance of assessing cardiorespiratory fitness in clinical practice: a case for fitness as a clinical vital sign: a scientific statement from the American Heart Association. Circulation. 2016;134:e653-e699. doi: 10.1161/CIR.0000000000000461
13. de Souza de Silva CG, Kokkinos PP, Doom R, et al. Association between cardiorespiratory fitness, obesity, and health care costs: The Veterans Exercise Testing Study. Int J Obes (Lond). 2019;43:2225-2232. doi: 10.1038/s41366-018-0257-0
14. Prochaska JO, Velicer WF. The transtheoretical model of health behavior change. Am J Health Promot. 1997;12:38-48. doi: 10.4278/0890-1171-12.1.38
15. Riebe D, Ehrman JK, Liguori G, et al. Methods for evoking change talk. In: ACSM’s Guidelines for Exercise Testing and Prescription. 10th ed. Wolters Kluwer; 2018.
16. Grandes G, Sanchez A, Sanchez-Pinilla RO, et al. Effectiveness of physical activity advice and prescription by physicians in routine primary care: a cluster randomized trial. Arch Intern Med. 2009;169:694-701. doi: 10.1001/archinternmed.2009.23
17. McNeill LH, Kreuter MW, Subramanian SV. Social environment and physical activity: a review of concepts and evidence. Soc Sci Med. 2006;63:1011-1022. doi: 10.1016/j.socscimed.2006.03.012
18. Garber CE, Blissmer BE, Deschenes MR, et al; American College of Sports Medicine. Quantity and quality of exercise for developing and maintaining cardiorespiratory, musculoskeletal, and neuromotor fitness in apparently healthy adults: Guidance for prescribing exercise. Position stand. Med Sci Sport Exerc. 2011;43:1334-1359. doi: 10.1249/MSS.0b013e318213fefb
19. Donnelly JE, Blair SN, Jakicic JM, et al; American College of Sports Medicine. Appropriate physical activity intervention strategies for weight loss and prevention of weight regain for adults. Position stand. Med Sci Sport Exerc. 2009;41:459-471. doi: 10.1249/MSS.0b013e3181949333
20. Fox SM 3rd, Naughton JP, Haskell WL. Physical activity and the prevention of coronary heart disease. Ann Clin Res. 1971;3:404-432.
21. Karvonen MJ, Kentala E, Mustala O. The effects of training on heart rate; a longitudinal study. Ann Med Exp Biol Fenn. 1957;35:307-315.
22. The Borg RPE scale. In: Borg G. Borg’s Perceived Exertion and Pain Scales. Human Kinetics; 1998:29-38.
23. Ratamess NA, Alvar BA, Evetoch TK, et al; American College of Sports Medicine. Progression models in resistance training for healthy adults. Position stand. Med Sci Sport Exerc. 2009;41:687-708. doi: 10.1249/MSS.0b013e3181915670
24. Gym memberships & fitness programs. Medicare.gov. Baltimore, MD: US Centers for Medicare and Medicaid Services. Accessed November 16, 2021. www.medicare.gov/coverage/gym-memberships-fitness-programs
25. Riebe D, Franklin BA, Thompson PD, et al. Updating ACSM’s recommendations for exercise preparticipation health screening. Med Sci Sports Exerc. 2015;47:2473-2479. doi: 10.1249/MSS.0000000000000664
26. Physical Activity Related Current Procedural Terminology (CPT®) Codes. Physical Activity Alliance website. Accessed November 16, 2021. https://paamovewithus.org/wp-content/uploads/2020/11/PAA-Physical-Activity-CPT-Codes-Nov-2020-AMA-Approved-Final-1.pdf
27. Blair SN. Physical inactivity: the biggest public health problem of the 21st century Br J Sports Med. 2009;43:1-2.
28. Vuori IM, Lavie CJ, Blair SN. Physical activity promotion in the health care system. Mayo Clin Proc. 2013;88:1446-1461. doi: 10.1016/j.mayocp.2013.08.020
It is well-known that per capita health care spending in the United States is more than twice the average in other developed countries1; nevertheless, the overall health care ranking of the US is near the bottom compared to other countries in this group.2 Much of the reason for this poor relative showing lies in the fact that the US has employed a somewhat traditional fee-for-service health care model that does not incentivize efforts to promote health and wellness or prevent chronic disease. The paradigm of promoting physical activity for its disease-preventing and treatment benefits has not been well-integrated in the US health care system.
In this article, we endeavor to provide better understanding of the barriers that keep family physicians from routinely promoting physical activity in clinical practice; define tools and resources that can be used in the clinical setting to promote physical activity; and delineate areas for future work.
Glaring hole in US physical activity education
Many primary care physicians feel underprepared to prescribe or motivate patients to exercise. The reason for that lack of preparedness likely relates to a medical education system that does not spend time preparing physicians to perform this critical task. A study showed that, on average, medical schools require only 8 hours of physical activity education in their curriculum during the 4 years of schooling.3 Likewise, the average primary care residency program offers only 3 hours of didactic training on physical activity, nutrition, and obesity.4 The problem extends to sports medicine fellowship training, in which a 2019 survey showed that 63% of fellows were never taught how to write an exercise prescription in their training program.5
Without education on physical activity, medical students, residents, and fellows are woefully underprepared to realize the therapeutic value of physical activity in patient care, comprehend current physical activity guidelines, appropriately motivate patients to engage in exercise, and competently discuss exercise prescriptions in different disease states. Throughout their training, it is imperative for medical professionals to be educated on the social determinants of health, which include the conditions in which people live, work, and play. These environmental variables can contribute to health inequities that create additional barriers to improvement in physical fitness.6
National guidelines on physical activity
The 2018 National Physical Activity Guidelines detail recommendations for children, adolescents, adults, and special populations.7 The guidelines define physical activity as bodily movement produced by skeletal muscles that result in energy expenditure above resting baseline levels, and includes all types, intensities, and domains of activity. Exercise is a subset of physical activity characterized as planned, structured, repetitive, and designed to improve or maintain physical fitness, physical performance, or health.
Highlights from the 2018 guidelines include7:
- Preschool-aged children (3 to 5 years of age) should be physically active throughout the day, with as much as 3 hours per day of physical activity of all intensities—light, moderate, and vigorous.
- Older children and adolescents (6 to 17 years) should accumulate 60 minutes per day of moderate-to-vigorous physical activity, including aerobic, muscle-strengthening, and bone-strengthening activities.
- Adults of all ages should achieve approximately 150 to 300 minutes of moderate or 75 to 150 minutes of vigorous physical activity (or an equivalent combination) per week, along with at least 2 days per week of muscle-strengthening activities. Other types of physical activity include flexibility, balance, bone-strengthening, and mind–body exercises.
3-step framework for enhancing physical activity counseling
Merely knowing that physical activity is healthy is not enough, during a patient encounter, to increase the level of physical activity. Therefore, it is imperative to learn and adopt a framework that has proved to yield successful outcomes. The Screening, Brief Intervention, and Referral to Treatment (SBIRT) framework, which has predominantly been used to change patient behavior related to alcohol and substance use, is now being utilized by some providers to promote physical activity.8 We apply the SBIRT approach in this article, although research is lacking on its clinical utility and outcome measures.
Continue to: SBIRT
SBIRT: Screening
An office visit provides an opportunity to understand a patient’s level of physical activity. Often, understanding a patient’s baseline level of activity is only asked during a thorough social history, which might not be performed during patient encounters. As physical activity is the primary determinant of cardiorespiratory fitness (CRF), some health care systems have begun delineating physical activity levels as a vital sign to ensure that the assessment of physical activity is a standard part of every clinical encounter. At a minimum, this serves as a prompt and provides an opportunity to start a conversation around improving physical activity levels when guidelines are not being met.
The exercise vital sign. Assessment and documentation of physical activity in the electronic health record are not yet standardized; however, Kaiser Permanente health plans have implemented the exercise vital sign, or EVS, in its HealthConnect (Epic Systems) electronic health record. The EVS incorporates information about a patient’s:
- days per week of moderate-to-strenuous exercise (eg, a brisk walk)
- minutes per day, on average, of exercise at this level.
The physical activity vital sign. Intermountain Healthcare implemented the physical activity vital sign, or PAVS, in its iCentra (Cerner Corp.) electronic health record. The 3-question PAVS assessment asks:
- On average, how many days of the week do you perform physical activity or exercise?
- On average, how many total minutes of physical activity or exercise do you perform on those days?
- How would you describe the intensity of your physical activity or exercise: Light (ie, a casual walk)? Moderate (a brisk walk)? Or vigorous (jogging)?
PAVS includes a fourth data point: The physician–user documents whether the patient was counseled to start, increase, maintain, or modify physical activity or exercise.
EVS and the PAVS have demonstrated validity.9-11
Continue to: Cardiorespiratory fitness as a vital sign
Cardiorespiratory fitness as a vital sign. In 2016, the American Heart Association (AHA) asserted the importance of assessing CRF as a clinical vital sign.12 CRF is commonly expressed as maximal oxygen consumption (VO2max = O2 mL/kg/min) and measured through cardiopulmonary exercise testing (CPET), considered the gold standard by combining conventional graded exercise testing with ventilatory expired gas analysis. CPET is more objective and precise than equations estimating CRF that are derived from peak work rate. AHA recommended that efforts to improve CRF should become standard in clinical encounters, explaining that even a small increase in CRF (eg, 1 or 2 metabolic equivalentsa [METs]) is associated with a considerably (10% to 30%) lower rate of adverse cardiovascular events.12
De Souza de Silva and colleagues revealed an association between each 1-MET increase in CRF and per-person annual health care cost savings (adjusted for age and presence of cardiovascular disease) of $3272 (normal-weight patients), $4252 (overweight), and $6103 (obese).13 In its 2016 scientific statement on CRF as a vital sign, AHA listed several methods of estimating CRF and concluded that, although CPET involves a higher level of training, proficiency, equipment, and, therefore, cost, the independent and additive information obtained justifies its use in many patients.12
CASE
Mary Q, 68 years of age, presents for an annual well-woman examination. Body mass index is 32; resting heart rate (HR), 73 bpm; and blood pressure, 126/74 mm Hg. She reports being inactive, except for light walking every day with her dog around the neighborhood, which takes them approximately 15 minutes. She denies any history or signs and symptoms of cardiovascular, metabolic, or renal disease.
You consider 3 questions before taking next steps regarding increasing Ms. Q’s activity level:
- What is her PAVS?
- Does she need medical clearance before starting an exercise program?
- What would an evidence-based cardiovascular exercise prescription for Ms. Q look like?
SBIRT: Brief intervention
When a patient does not meet the recommended level of physical activity, you have an opportunity to deliver a brief intervention. To do this effectively, you must have adequate understanding of the patient’s receptivity for change. The transtheoretical, or Stages of Change, model proposes that a person typically goes through 5 stages of growth—pre-contemplation, contemplation, preparation, action, and maintenance—in the process of lifestyle modification. This model highlights the different approaches to exercise adoption and maintenance that need to be taken, based on a given patient’s stage at the moment.
Continue to: Using this framework...
Using this framework, you can help patients realize intrinsic motivation that can facilitate progression through each stage, utilizing techniques such as motivational interviewing—so-called change talk—to increase self-efficacy.14TABLE 115 provides examples of motivational interviewing techniques that can be used during a patient encounter to improve health behaviors, such as physical activity.
Writing the exercise prescription
A patient who wants to increase their level of physical activity should be offered a formal exercise prescription, which has been shown to increase the level of physical activity, particularly in older patients. In fact, a study conducted in Spain in the practices of family physicians found that older patients who received a physical activity prescription increased their activity by 131 minutes per week; and compared to control patients, they doubled the minutes per week devoted to moderate or vigorous physical activity.16
FITT-VP. The basics of a cardiovascular exercise prescription can be found in the FITT-VP (Frequency, Intensity, Time, Type, Volume, and [monitoring of] Progression) framework (TABLE 217-19). For most patients, this model includes 3 to 5 days per week of moderate-to-vigorous physical activity for 30 to 60 minutes per session. For patients with established chronic disease, physical activity provides health benefits but might require modification. Disease-specific patient handouts for exercise can be downloaded, at no cost, through the American College of Sports Medicine (ACSM) “Exercise Is Medicine” program, which can be found at: www.exerciseismedicine.org/support_page.php/rx-for-health-series.
Determining intensity level. Although CPET is the gold standard for determining a patient’s target intensity level, such a test might be impracticable for a given patient. Surrogate markers of target intensity level can be obtained by measuring maximum HR (HRmax), using a well-known equation20:
HRmax = 220 – age
which is then multiplied by intensity range:
- light: 30%-39%
- moderate: 40%-59%
- vigorous: 60%-89%
or, more preferably, by calculating the HR training zone while accounting for HR at rest (HRrest). This is accomplished by calculating the HR reserve (HRR) (ie, HRR = HRmax – HRrest) and then calculating the target heart rate (THR)21:
THR = [HRR × %intensity] + HRrest
Continue to: The THR calculation...
The THR calculation is performed twice, once with a lower %intensity and again with a higher %intensity to develop a training zone based on HRR.
The HRR equation is more accurate than calculating HRmax from 220 – age, because HRR accounts for resting HR, which is often lower in people who are better conditioned.
Another method of calculating intensity for patients who are beginning a physical activity program is the rating of perceived exertion (RPE), which is graded on a scale of 6 to 20: Moderate exercise correlates with an RPE of 12 to 13 (“somewhat hard”); vigorous exercise correlates with an RPE of 14 to 16 (“hard”). By adding a zero to the rating on the RPE scale, the corresponding HR in a healthy adult can be estimated when they are performing an activity at that perceived intensity.22 Moderate exercise therefore correlates with a HR of 120 and 130 bpm.
The so-called talk test can also guide exercise intensity: Light-intensity activity correlates with an ability to sing; moderate-intensity physical activity likely allows the patient to still hold a conversation; and vigorous-intensity activity correlates with an inability to carry on a conversation while exercising.
An exercise prescription should be accompanied by a patient-derived goal, which can be reassessed during a follow-up visit. So-called SMART goals (Specific, Measurable, Achievable, Relevant, and Time-bound) are tools to help patients set personalized and realistic expectations for physical activity. Meeting the goal of approximately 150 to 300 minutes of moderate or 75 to 150 minutes of vigorous physical activity (or an equivalent combination) per week is ideal, but a patient needs to start where they are, at the moment, and gradually increase activity by setting what for them are realistic and sustainable goals.
Continue to: CASE
CASE
With a PAVS of 105 minutes (ie, 15 minutes per day × 7 days) of weekly light-to-moderate exercise walking her dog, Ms. Q does not satisfy current physical activity guidelines. She needs an exercise prescription to incorporate into her lifestyle (see “Cardiovascular exercise prescription,” at left).
First, based on ACSM pre-participation guidelines, Ms. Q does not need medical clearance before initiating light-to-moderate exercise and gradually progressing to vigorous-intensity exercise.
Second, in addition to walking the dog for 105 minutes a week, you:
- advise her to start walking for 10 minutes, 3 times per week, at a pace that keeps her HR at 97-104 bpm.
- encourage her to gradually increase the frequency or duration of her walks by no more than 10% per week.
SBIRT: Referral for treatment
When referring a patient to a fitness program or professional, it is essential to consider their preferences, resources, and environment.23 Community fitness partners are often an excellent referral option for a patient seeking guidance or structure for their exercise program. Using the ACSM ProFinder service, (www.acsm.org/get-stay-certified/find-a-pro) you can search for exercise professionals who have achieved the College’s Gold Standard credential.
Gym memberships or fitness programs might be part of the extra coverage offered by Medicare Advantage Plans, other Medicare health plans, or Medicare Supplement Insurance (Medigap) plans.24
Continue to: CASE
CASE
After providing Ms. Q with her exercise prescription, you refer her to a local gym that participates in the Silver Sneakers fitness and wellness program (for adults ≥ 65 years of age in eligible Medicare plans) to determine whether she qualifies to begin resistance and flexibility training, for which you will write a second exercise prescription (TABLE 317-19).
Pre-participation screening
Updated 2015 ACSM exercise pre-participation health screening recommendations attempt to decrease possible barriers to people who are becoming more physically active, by minimizing unnecessary referral to health care providers before they change their level of physical activity. ACSM recommendations on exercise clearance include this guidance25:
- For a patient who is asymptomatic and already physically active—regardless of whether they have known cardiovascular, metabolic, or renal disease—medical clearance is unnecessary for moderate-intensity exercise.
- Any patient who has been physically active and asymptomatic but who becomes symptomatic during exercise should immediately discontinue such activity and undergo medical evaluation.
- For a patient who is inactive, asymptomatic, and who does not have known cardiovascular, metabolic, or renal disease, medical clearance for light- or moderate-intensity exercise is unnecessary.
- For inactive, asymptomatic patients who have known cardiovascular, metabolic, or renal disease, medical clearance is recommended.
Digital health
Smartwatches and health apps (eg, CardioCoach, Fitbit, Garmin Connect, Nike Training Club, Strava, and Training Peaks) can provide workouts and offer patients the ability to collect information and even connect with other users through social media platforms. This information can be synced to Apple Health platforms for iPhones (www.apple.com/ios/health/) or through Google Fit (www.google.com/fit/) on Android devices. Primary care physicians who become familiar with health apps might find them useful for select patients who want to use technology to improve their physical activity level.
However, data on the value of using digital apps for increasing physical activity, in relation to their cost, are limited. Additional research is needed to assess their validity.
Billing and coding
For most patients, the physical activity assessment, prescription, and referral are performed in the context of treating another condition (eg, hypertension, type 2 diabetes, obesity, depression) or during a preventive health examination, and are typically covered without additional charge to the patient. An evaluation and management visit for an established patient could be used to bill if > 50% of the office visit was spent face-to-face with a physician, with patient counseling and coordination of care.
Continue to: Physicians and physical therapists...
Physicians and physical therapists can use the therapeutic exercise code (Current Procedural Terminology code 97110) when teaching patients exercises to develop muscle strength and endurance, joint range of motion, and flexibility26 (TABLE 426).
Conclusion
Physical activity and CRF are strong predictors of premature mortality, even compared to other risk factors, such as cigarette smoking, hypertension, hypercholesterolemia, and type 2 diabetes.27 Brief physical activity assessment and counseling is an efficient, effective, and cost-effective means to increase physical activity, and presents a unique opportunity for you to encourage lifestyle-based strategies for reducing cardiovascular risk.28
However, it is essential to meet patients where they are before trying to have them progress; it is therefore imperative to assess the individual patient’s level of activity using PAVS. With that information in hand, you can personalize physical activity advice; determine readiness for change and potential barriers for change; assist the patient in setting SMART goals; and arrange follow-up to assess adherence to the exercise prescription. Encourage the patient to call their health insurance plan to determine whether a gym membership or fitness program is covered.
Research is needed to evaluate the value of using digital apps, in light of their cost, to increase physical activity and improve CRF in a clinical setting. Prospective trials should be initiated to determine how routine implementation of CRF assessment in primary care alters the trajectory of clinical care. It is hoped that future research will answer the question: Would such an approach improve clinical outcomes and reduce health care expenditures?12
a Defined as O2 consumed while sitting at rest; equivalent to 3.5 mL of O2 × kg of body weight × min.
CORRESPONDENCE
Matthew Kampert, DO, MS, Sports Medicine, 5555 Transportation Boulevard, Cleveland, OH 44125; kamperm@ccf.org
1. Papanicolas I, Woskie LR, Jha AK. Health care spending in the United States and other high-income countries. JAMA. 2018;319:1024-1039. doi: 10.1001/jama.2018.1150
2. Tikkanen R, Abrams MK. U.S. health care from a global perspective, 2019: higher spending, worse outcomes? The Commonwealth Fund Website. January 30, 2020. Accessed November 16, 2021. www.commonwealthfund.org/publications/issue-briefs/2020/jan/us-health-care-global-perspective-2019
3. Stoutenberg M, Stasi S, Stamatakis E, et al. Physical activity training in US medical schools: preparing future physicians to engage in primary prevention. Phys Sportsmed. 2015;43:388-394. doi: 10.1080/00913847.2015.1084868
4. Antognoli EL, Seeholzer EL, Gullett H, et al. Primary care resident training for obesity, nutrition, and physical activity counseling: a mixed-methods study. Health Promot Pract. 2017;18:672-680. doi: 10.1177/1524839916658025
5. Asif IM, Drezner JA. Sports and exercise medicine education in the USA: call to action. Br J Sports Med. 2020;54:195-196. doi: 10.1136/bjsports-2019-101104
6. Douglas JA, Briones MD, Bauer EZ, et al. Social and environmental determinants of physical activity in urban parks: testing a neighborhood disorder model. Prev Med. 2018;109:119-124. doi: 10.1016/j.ypmed.2018.01.013
7. 2018 Physical Activity Guidelines Advisory Committee. 2018 Physical Activity Guidelines Advisory Committee Scientific Report. Washington, DC: US Department of Health & Human Services; 2018. Accessed November 15, 2021. https://health.gov/sites/default/files/2019-09/PAG_Advisory_Committee_Report.pdf
8. Avis JL, Cave AL, Donaldson S, et al. Working with parents to prevent childhood obesity: protocol for a primary care-based ehealth study. JMIR Res Protoc. 2015;4:e35. doi:10.2196/resprot.4147
9. Ball TJ, Joy EA, Gren LH, et al. Concurrent validity of a self-reported physical activity ‘vital sign’ questionnaire with adult primary care patients. Prev Chronic Dis. 2016;13:e16. doi: 10.5888/pcd13.150228
10. Ball TJ, Joy EA, Gren LH, et al. Predictive validity of an adult physical activity “vital sign” recorded in electronic health records. J Phys Act Health. 2016;13:403-408. doi: 10.1123/jpah.2015-0210
11. Coleman KJ, Ngor E, Reynolds K, et al. Initial validation of an exercise “vital sign” in electronic medical records. Med Sci Sports Exerc. 2012;44:2071-2076. doi: 10.1249/MSS.0b013e3182630ec1
12. Ross R, Blair SN, Arena R, et al; ; ; ; ; ; . Importance of assessing cardiorespiratory fitness in clinical practice: a case for fitness as a clinical vital sign: a scientific statement from the American Heart Association. Circulation. 2016;134:e653-e699. doi: 10.1161/CIR.0000000000000461
13. de Souza de Silva CG, Kokkinos PP, Doom R, et al. Association between cardiorespiratory fitness, obesity, and health care costs: The Veterans Exercise Testing Study. Int J Obes (Lond). 2019;43:2225-2232. doi: 10.1038/s41366-018-0257-0
14. Prochaska JO, Velicer WF. The transtheoretical model of health behavior change. Am J Health Promot. 1997;12:38-48. doi: 10.4278/0890-1171-12.1.38
15. Riebe D, Ehrman JK, Liguori G, et al. Methods for evoking change talk. In: ACSM’s Guidelines for Exercise Testing and Prescription. 10th ed. Wolters Kluwer; 2018.
16. Grandes G, Sanchez A, Sanchez-Pinilla RO, et al. Effectiveness of physical activity advice and prescription by physicians in routine primary care: a cluster randomized trial. Arch Intern Med. 2009;169:694-701. doi: 10.1001/archinternmed.2009.23
17. McNeill LH, Kreuter MW, Subramanian SV. Social environment and physical activity: a review of concepts and evidence. Soc Sci Med. 2006;63:1011-1022. doi: 10.1016/j.socscimed.2006.03.012
18. Garber CE, Blissmer BE, Deschenes MR, et al; American College of Sports Medicine. Quantity and quality of exercise for developing and maintaining cardiorespiratory, musculoskeletal, and neuromotor fitness in apparently healthy adults: Guidance for prescribing exercise. Position stand. Med Sci Sport Exerc. 2011;43:1334-1359. doi: 10.1249/MSS.0b013e318213fefb
19. Donnelly JE, Blair SN, Jakicic JM, et al; American College of Sports Medicine. Appropriate physical activity intervention strategies for weight loss and prevention of weight regain for adults. Position stand. Med Sci Sport Exerc. 2009;41:459-471. doi: 10.1249/MSS.0b013e3181949333
20. Fox SM 3rd, Naughton JP, Haskell WL. Physical activity and the prevention of coronary heart disease. Ann Clin Res. 1971;3:404-432.
21. Karvonen MJ, Kentala E, Mustala O. The effects of training on heart rate; a longitudinal study. Ann Med Exp Biol Fenn. 1957;35:307-315.
22. The Borg RPE scale. In: Borg G. Borg’s Perceived Exertion and Pain Scales. Human Kinetics; 1998:29-38.
23. Ratamess NA, Alvar BA, Evetoch TK, et al; American College of Sports Medicine. Progression models in resistance training for healthy adults. Position stand. Med Sci Sport Exerc. 2009;41:687-708. doi: 10.1249/MSS.0b013e3181915670
24. Gym memberships & fitness programs. Medicare.gov. Baltimore, MD: US Centers for Medicare and Medicaid Services. Accessed November 16, 2021. www.medicare.gov/coverage/gym-memberships-fitness-programs
25. Riebe D, Franklin BA, Thompson PD, et al. Updating ACSM’s recommendations for exercise preparticipation health screening. Med Sci Sports Exerc. 2015;47:2473-2479. doi: 10.1249/MSS.0000000000000664
26. Physical Activity Related Current Procedural Terminology (CPT®) Codes. Physical Activity Alliance website. Accessed November 16, 2021. https://paamovewithus.org/wp-content/uploads/2020/11/PAA-Physical-Activity-CPT-Codes-Nov-2020-AMA-Approved-Final-1.pdf
27. Blair SN. Physical inactivity: the biggest public health problem of the 21st century Br J Sports Med. 2009;43:1-2.
28. Vuori IM, Lavie CJ, Blair SN. Physical activity promotion in the health care system. Mayo Clin Proc. 2013;88:1446-1461. doi: 10.1016/j.mayocp.2013.08.020
PRACTICE RECOMMENDATIONS
› Encourage children and adolescents (6 to 17 years of age) to engage in 60 min of moderate-to-vigorous physical activity, including aerobic, muscle-strengthening, and bone-strengthening endeavors on most, if not all, days of the week. A
› Encourage adults to perform approximately 150 to 300 min of moderate or 75 to 150 min of vigorous physical activity (or an equivalent combination) per week, along with moderate-intensity muscle-strengthening activities on ≥ 2 days per week. A
› Counsel patients that even a small (eg, 1-2 metabolic equivalents) increase in cardiorespiratory fitness is associated with a 10% to 30% lower rate of adverse events. A
Strength of recommendation (SOR)
A Good-quality patient-oriented evidence
B Inconsistent or limited-quality patient-oriented evidence
C Consensus, usual practice, opinion, disease-oriented evidence, case series

Skip that repeat DXA scan in these postmenopausal women
ILLUSTRATIVE CASE
A 70-year-old White woman with a history of type 2 diabetes and a normal
As many as 1 in 2 postmenopausal women are at risk for an osteoporosis-related fracture.2 Each year, about 2 million fragility fractures occur in the United States.2,3 The
Two prospective cohort studies determined that repeat BMD testing 4 to 8 years after baseline screening did not improve fracture risk prediction.5,6 Limitations of these studies included no analysis of high-risk subgroups, as well as failure to include many younger postmenopausal women in the studies.5,6 An additional longitudinal study that followed postmenopausal women for up to 15 years estimated that the interval for at least 10% of women to develop osteoporosis after initial screening was more than 15 years for women with normal BMD and about 5 years for those with moderate osteopenia.7
STUDY SUMMARY
The current study examined data from the
Study participants averaged 66 years of age, with a mean BMI of 29, and 23% were non-White. In addition, 97% had either normal BMD or osteopenia (T score ≥ −2.4). Participants were excluded from the study if they had been treated with bone-active medications other than vitamin D and calcium, reported a history of MOF (fracture of the hip, spine, radius, ulna, wrist, upper arm, or shoulder) at baseline or between BMD tests, missed follow-up visits after the Year 3 BMD scan, or had missing covariate data. Participants self-reported fractures on annual patient questionnaires, and hip fractures were confirmed through medical records.
During the mean follow-up period of 9 years after the second BMD test, 139 women (1.9%) had 1 or more hip fractures, and 732 women (9.9%) had 1 or more MOFs.
Area under the receiver operating characteristic curve (AU-ROC) values for baseline BMD screening and baseline plus 3-year BMD measurement were similar in their ability to discriminate between women who had a hip fracture or MOF and women who did not. AU-ROC values communicate the usefulness of a diagnostic or screening test. An AU-ROC value of 1 would be considered perfect (100% sensitive and 100% specific), whereas an AU-ROC of 0.5 suggests a test with no ability to discriminate at all. Values between 0.7 and 0.8 would be considered acceptable, and those between 0.8 and 0.9, excellent.
Continue to: The AU-ROCs in this study...
The AU-ROCs in this study were 0.71 (95% CI, 0.67-0.75) for baseline total hip BMD, 0.61 (95% CI, 0.56-0.65) for change in total hip BMD between baseline and 3-year BMD scan, and 0.73 (95% CI, 0.69-0.77) for the combined baseline total hip BMD and change in total hip BMD. For femoral neck and lumbar spine BMD, AU-ROC values demonstrated comparable discrimination of hip fracture and MOF as those for total hip BMD. The AU-ROC values among age subgroups (< 65 years, 65-74 years, and ≥ 75 years) were also similar. Associations between change in bone density and fracture risk did not change when adjusted for factors such as BMI, race/ethnicity, diabetes, or baseline BMD.
WHAT’S NEW
Results can be applied to a wider range of patients
This study found that for postmenopausal women, a repeat BMD measurement obtained 3 years after the initial assessment did not improve risk discrimination for hip fracture or MOF beyond the baseline BMD value and should not be routinely performed. Additionally, evidence from this study allows this recommendation to apply to younger postmenopausal women and a variety of high-risk subgroups.
CAVEATS
Possible bias due to self-reporting of fractures
This study suggests that for women without a diagnosis of osteoporosis at initial screening, repeat testing is unlikely to affect future risk stratification. Repeat BMD testing should still be considered when the results are likely to influence clinical management.
However, an important consideration is that fractures were self-reported in this study, introducing a possible source of bias. Additionally, although this study supports foregoing repeat screening at a 3-year interval, there is still no agreed-upon determination of when (or if) to repeat BMD screening in women without osteoporosis.
A large subset of the study population was younger than 65 (44%), the age when family physicians typically recommend screening for osteoporosis. However, the age-adjusted AU-ROC values for fracture risk prediction were the same, and this should not invalidate the conclusions for the study population at large.
CHALLENGES TO IMPLEMENTATION
No challenges seen
We see no challenges in implementing this recommendation.
ACKNOWLEDGEMENT
The PURLs Surveillance System was supported in part by Grant Number UL1RR024999 from the National Center for Research Resources, a Clinical Translational Science Award to the University of Chicago. The content is solely the responsibility of the authors and does not necessarily represent the official views of the National Center for Research Resources or the National Institutes of Health.
1. Crandall CJ, Larson J, Wright NC, et al. Serial bone density measurement and incident fracture risk discrimination in postmenopausal women. JAMA Intern Med. 2020;180:1232-1240. doi: 10.1001/jamainternmed.2020.2986
2. US Preventive Services Task Force. Screening for osteoporosis: US Preventive Services Task Force recommendation statement. Ann Intern Med. 2011;154:356-364. doi: 10.7326/0003-4819-154-5-201103010-00307
3. Burge R, Dawson-Hughes B, Solomon DH, et al. Incidence and economic burden of osteoporosis-related fractures in the United States, 2005-2025. J Bone Miner Res. 2007;22:465-475. doi: 10.1359/jbmr.061113
4. US Preventive Services Task Force; Curry SJ, Krist AH, Owens DK, et al. Screening for osteoporosis to prevent fractures: US Preventive Services Task Force recommendation statement. JAMA. 2018;319:2521-2531. doi: 10.1001/jama.2018.7498
5. Hillier TA, Stone KL, Bauer DC, et al. Evaluating the value of repeat bone mineral density measurement and prediction of fractures in older women: the study of osteoporotic fractures. Arch Intern Med. 2007;167:155-160. doi: 10.1001/archinte.167.2.155
6. Berry SD, Samelson EJ, Pencina MJ, et al. Repeat bone mineral density screening and prediction of hip and major osteoporotic fracture. JAMA. 2013;310:1256-1262. doi: 10.1001/jama.2013.277817
7. Gourlay ML, Fine JP, Preisser JS, et al; Study of Osteoporotic Fractures Research Group. Bone-density testing interval and transition to osteoporosis in older women. N Engl J Med. 2012;366:225-233. doi: 10.1056/NEJMoa1107142
ILLUSTRATIVE CASE
A 70-year-old White woman with a history of type 2 diabetes and a normal
As many as 1 in 2 postmenopausal women are at risk for an osteoporosis-related fracture.2 Each year, about 2 million fragility fractures occur in the United States.2,3 The
Two prospective cohort studies determined that repeat BMD testing 4 to 8 years after baseline screening did not improve fracture risk prediction.5,6 Limitations of these studies included no analysis of high-risk subgroups, as well as failure to include many younger postmenopausal women in the studies.5,6 An additional longitudinal study that followed postmenopausal women for up to 15 years estimated that the interval for at least 10% of women to develop osteoporosis after initial screening was more than 15 years for women with normal BMD and about 5 years for those with moderate osteopenia.7
STUDY SUMMARY
The current study examined data from the
Study participants averaged 66 years of age, with a mean BMI of 29, and 23% were non-White. In addition, 97% had either normal BMD or osteopenia (T score ≥ −2.4). Participants were excluded from the study if they had been treated with bone-active medications other than vitamin D and calcium, reported a history of MOF (fracture of the hip, spine, radius, ulna, wrist, upper arm, or shoulder) at baseline or between BMD tests, missed follow-up visits after the Year 3 BMD scan, or had missing covariate data. Participants self-reported fractures on annual patient questionnaires, and hip fractures were confirmed through medical records.
During the mean follow-up period of 9 years after the second BMD test, 139 women (1.9%) had 1 or more hip fractures, and 732 women (9.9%) had 1 or more MOFs.
Area under the receiver operating characteristic curve (AU-ROC) values for baseline BMD screening and baseline plus 3-year BMD measurement were similar in their ability to discriminate between women who had a hip fracture or MOF and women who did not. AU-ROC values communicate the usefulness of a diagnostic or screening test. An AU-ROC value of 1 would be considered perfect (100% sensitive and 100% specific), whereas an AU-ROC of 0.5 suggests a test with no ability to discriminate at all. Values between 0.7 and 0.8 would be considered acceptable, and those between 0.8 and 0.9, excellent.
Continue to: The AU-ROCs in this study...
The AU-ROCs in this study were 0.71 (95% CI, 0.67-0.75) for baseline total hip BMD, 0.61 (95% CI, 0.56-0.65) for change in total hip BMD between baseline and 3-year BMD scan, and 0.73 (95% CI, 0.69-0.77) for the combined baseline total hip BMD and change in total hip BMD. For femoral neck and lumbar spine BMD, AU-ROC values demonstrated comparable discrimination of hip fracture and MOF as those for total hip BMD. The AU-ROC values among age subgroups (< 65 years, 65-74 years, and ≥ 75 years) were also similar. Associations between change in bone density and fracture risk did not change when adjusted for factors such as BMI, race/ethnicity, diabetes, or baseline BMD.
WHAT’S NEW
Results can be applied to a wider range of patients
This study found that for postmenopausal women, a repeat BMD measurement obtained 3 years after the initial assessment did not improve risk discrimination for hip fracture or MOF beyond the baseline BMD value and should not be routinely performed. Additionally, evidence from this study allows this recommendation to apply to younger postmenopausal women and a variety of high-risk subgroups.
CAVEATS
Possible bias due to self-reporting of fractures
This study suggests that for women without a diagnosis of osteoporosis at initial screening, repeat testing is unlikely to affect future risk stratification. Repeat BMD testing should still be considered when the results are likely to influence clinical management.
However, an important consideration is that fractures were self-reported in this study, introducing a possible source of bias. Additionally, although this study supports foregoing repeat screening at a 3-year interval, there is still no agreed-upon determination of when (or if) to repeat BMD screening in women without osteoporosis.
A large subset of the study population was younger than 65 (44%), the age when family physicians typically recommend screening for osteoporosis. However, the age-adjusted AU-ROC values for fracture risk prediction were the same, and this should not invalidate the conclusions for the study population at large.
CHALLENGES TO IMPLEMENTATION
No challenges seen
We see no challenges in implementing this recommendation.
ACKNOWLEDGEMENT
The PURLs Surveillance System was supported in part by Grant Number UL1RR024999 from the National Center for Research Resources, a Clinical Translational Science Award to the University of Chicago. The content is solely the responsibility of the authors and does not necessarily represent the official views of the National Center for Research Resources or the National Institutes of Health.
1. Crandall CJ, Larson J, Wright NC, et al. Serial bone density measurement and incident fracture risk discrimination in postmenopausal women. JAMA Intern Med. 2020;180:1232-1240. doi: 10.1001/jamainternmed.2020.2986
2. US Preventive Services Task Force. Screening for osteoporosis: US Preventive Services Task Force recommendation statement. Ann Intern Med. 2011;154:356-364. doi: 10.7326/0003-4819-154-5-201103010-00307
3. Burge R, Dawson-Hughes B, Solomon DH, et al. Incidence and economic burden of osteoporosis-related fractures in the United States, 2005-2025. J Bone Miner Res. 2007;22:465-475. doi: 10.1359/jbmr.061113
4. US Preventive Services Task Force; Curry SJ, Krist AH, Owens DK, et al. Screening for osteoporosis to prevent fractures: US Preventive Services Task Force recommendation statement. JAMA. 2018;319:2521-2531. doi: 10.1001/jama.2018.7498
5. Hillier TA, Stone KL, Bauer DC, et al. Evaluating the value of repeat bone mineral density measurement and prediction of fractures in older women: the study of osteoporotic fractures. Arch Intern Med. 2007;167:155-160. doi: 10.1001/archinte.167.2.155
6. Berry SD, Samelson EJ, Pencina MJ, et al. Repeat bone mineral density screening and prediction of hip and major osteoporotic fracture. JAMA. 2013;310:1256-1262. doi: 10.1001/jama.2013.277817
7. Gourlay ML, Fine JP, Preisser JS, et al; Study of Osteoporotic Fractures Research Group. Bone-density testing interval and transition to osteoporosis in older women. N Engl J Med. 2012;366:225-233. doi: 10.1056/NEJMoa1107142
PRACTICE CHANGER
Do not routinely repeat bone density testing 3 years after initial screening in postmenopausal patients who do not have osteoporosis.
STRENGTH OF RECOMMENDATION
A: Based on several large, good-quality prospective cohort studies1
Crandall CJ, Larson J, Wright NC, et al. Serial bone density measurement and incident fracture risk discrimination in postmenopausal women. JAMA Intern Med. 2020;180:1232-1240. doi: 10.1001/jamainternmed.2020.2986
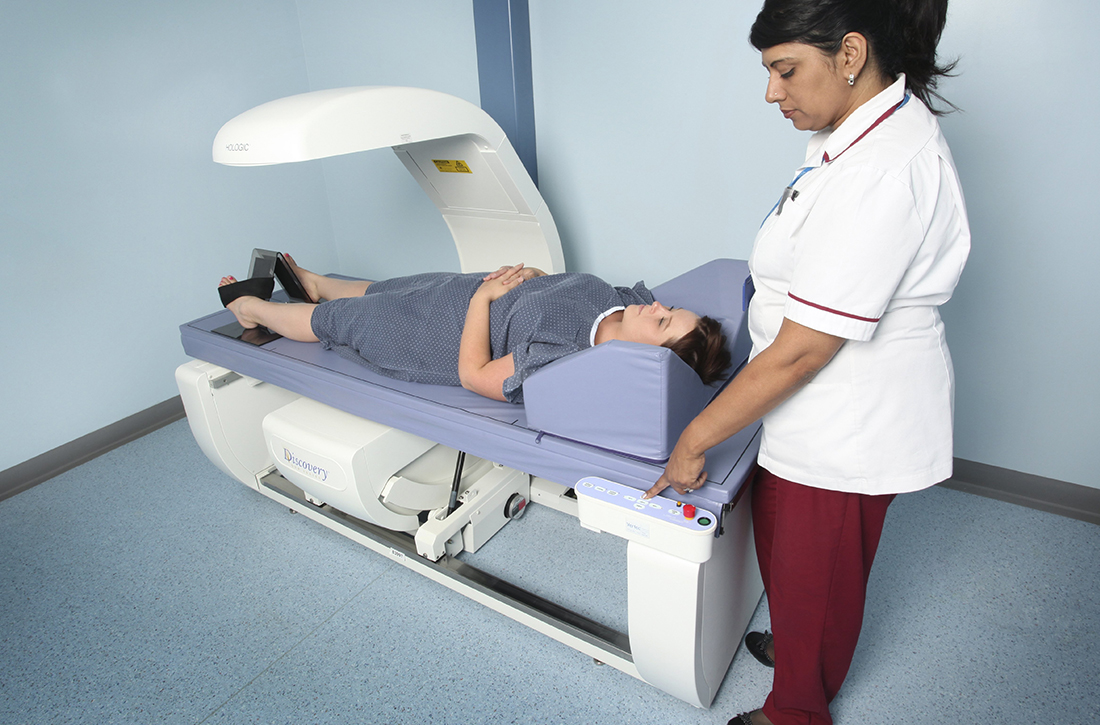
Letter counters study that focuses on low-risk home births
A research letter published recently in the American Journal of Obstetrics and Gynecology argues that the methodology of a recent paper on the safety of planned home births presented a biased analysis.

The paper that Amos Grünebaum, MD, and colleagues with the department of obstetrics and gynecology at Lenox Hill Hospital in Hempstead, N.J., referred to is a study in Obstetrics & Gynecology which concluded that planned home births in Washington state are low risk.
In that paper, Elizabeth Nethery, RM, MS, MSM, a midwife and PhD candidate at the University of British Columbia, Vancouver, calculated the outcomes from 2015 to 2020 for “all births attended by members of a statewide midwifery professional association that were within professional association guidelines and met eligibility criteria for planned birth center birth.”
Ms. Nethery’s team concluded: “Rates of adverse outcomes for this cohort in a U.S. state with well-established and integrated community midwifery were low overall. Birth outcomes were similar for births planned at home or at a state-licensed, freestanding birth center.”
This news organization was among the publications that reported the results of that study.
But it’s the exclusion criteria in that study, primarily, that Dr. Grünebaum and colleagues take issue with.
Births excluded from the main analysis of the study by Ms. Nethery and coauthors involved “multifetal pregnancy, prior cesarean delivery, onset of labor at more than 42 0/7 weeks of gestation or preterm (less than 37 weeks), preexisting hypertension or diabetes, known amniotic fluid abnormality, gestational hypertension or preeclampsia, or malpresentation.”
Those are conditions that fall outside guidelines for planned home births. But both Ms. Nethery and Dr. Grünebaum said that sometimes these high-risk conditions are present in home births.
Different conclusion for home birth safety
Dr. Grünebaum and colleagues’ analysis of the risk profiles and outcomes for U.S. planned home births for the years 2016-2020 came to a different conclusion about the safety of home births.
They used a retrospective population-based cohort study that used the Centers for Disease Control and Prevention WONDER natality online database. They included planned home births and compared the outcomes with and without certain risk factors, including some high-risk factors such as twin deliveries, breech births, and previous cesarean.
Dr. Grünebaum’s analysis concluded that “it is an immutable truth that planned home births in the United States result in avoidable risks of increased adverse neonatal outcomes.”
Ms. Nethery said though the high-risk conditions were excluded from their main analysis, they are mentioned in the paper and detailed in the supplement.
She acknowledged in the paper that some midwives practice outside the guidelines and that was the case in 7% of births or for 800 people in the Washington state study. But she told this publication it’s a small number and high-risk births should be handled in a hospital so the team focused its research on low-risk births.
“People plan home births who are outside the guidelines everywhere in the world. There are a lot of reasons why people do it,” she said. Among them are not feeling safe in the hospital, being rejected by an obstetrician for a desired procedure, or, in some cases, because they are misinformed.
She said midwives are sometimes faced with a difficult choice, when a patient wants, for instance, a vaginal birth after cesarean (VBAC), one of the conditions not recommended for home births.
The midwife is left with the choice of saying she will not do a VBAC in the home, or she can explain to the patient why it is not recommended and explain all the reasons it is not recommended, such as an elevated risk of rupture, but honor the patient’s choice.
“Do you tell the person: ‘Sorry, go have the cesarean anyway or do you do your best to support this person?’ Birthing people have the right to autonomy of choice,” Ms. Nethery said.
Dr. Grünebaum and colleagues said: “The recent study by Nethery et al. concluded that planned home births in the state of Washington have good neonatal outcomes by focusing on results of low-risk patients.”
Dr. Grünebaum said in an interview: “It’s like reporting on smoking and lung cancer and saying I’m only going to report on patients who have smoked for less than 5 years. You need to take the whole picture into consideration.”
Ms. Nethery gave this explanation for excluding the high-risk patients: “If you are studying a drug, you exclude people from your study who got the drug even though they had risk factors that were ‘contraindications’ to that drug. Likely there was a reason they got the drug – in consultation with their doctor, the patient and the doctor decided that the potential benefit outweighed the risk – but they are not relevant to understanding how that drug impacts people who were ‘eligible’ for the drug in the first place.”
“That is part of the reason we excluded ‘high-risk’ people from our study,” she said. “The other reason is that that is what is commonly done in most research on this topic – we focus on ‘low-risk’ people who are within standards and eligibility criteria.”
She gave examples such as a 2019 meta-analysis and a 2011 Birthplace in England national prospective cohort study, both of which excluded high-risk home births.
“Third, we wanted to compare apples to apples (for our analysis of home vs. hospital) – and licensed birth centers in Washington state have restrictions based on risk,” Ms. Nethery said.
Dr. Grünebaum said his team supports the right of all women to give birth where they wish. “But you cannot choose unless you are given the right information.”
Dr. Grünebaum also said planned home births in the United States cannot be compared with home births delivered by midwives in other countries. Different from the United States, he said, in countries such as Canada, Germany, and England, midwives are well integrated in the medical system and they are typically affiliated with hospitals and they belong to organizations which support very strong guidelines.
He added that, while Washington state has its own set of guidelines, there are no national guidelines for home births and practice varies greatly by state.
The authors concluded: “It is the professional responsibility of all health care providers, obstetricians, and midwives to present unbiased information. Focusing the reporting of outcomes on low-risk deliveries underreports true adverse outcomes in U.S. home births and provides biased information to patients considering planned home births. It is an immutable truth that planned home births in the United States result in avoidable risks of increased adverse neonatal outcomes.”
Angela Martin, MD, assistant professor of maternal-fetal medicine and medical director of the labor and delivery department at University of Kansas Medical Center, Kansas City, who was not part of either study, said she did not believe it was a problem that Ms. Nethery’s study excluded the high-risk conditions in the main analysis because it was disclosed.
“The authors were clear that they excluded high-risk conditions,” she said. “Therefore, the study should not be extrapolated to women with these conditions.”
“I believe her results do make that case for low-risk women in Washington state,” Dr. Martin said. “Again, it is important that findings are not extrapolated to women outside of those included in the study.”
She said there are several things that make Washington unusual in midwifery care. Consequently, the results should not be seen as representative of the United States.
“It is one of the most integrated states for midwife care in the country,” Dr. Martin said. “Washington has licensure available for midwives, which is not true of all states. It also has a robust state professional association that publishes guidelines for midwives to follow. And midwives in Washington have a wide formulary. For example, they can administer antibiotics, carry and administer hemorrhage medications, they can carry oxygen, and they are allowed to suture.”
Iris Krishna, MD, MPH, director of perinatal quality, Emory Perinatal Center and assistant professor in the division of maternal-fetal medicine at Emory University, Atlanta, said in an interview that the arguments by Ms. Nethery and Dr. Grünebaum illustrate the controversy over home births.
Dr. Krishna, who was not part of either study, said physicians and midwives should counsel patients contemplating a planned community birth that available data is not generalizable to all birth settings or all patients.
“Women should be counseled that delivery in a hospital setting or accredited birth center is safer than home birth,” she said. “Ultimately, each woman has the right to make a medically informed decision about delivery after adequate counseling on the risks and benefits of community birth.”
Dr. Grünebaum and colleagues reported no relevant financial relationships. Ms. Nethery, Dr. Martin, and Dr. Krishna also reported no relevant financial relationships.
A research letter published recently in the American Journal of Obstetrics and Gynecology argues that the methodology of a recent paper on the safety of planned home births presented a biased analysis.
The paper that Amos Grünebaum, MD, and colleagues with the department of obstetrics and gynecology at Lenox Hill Hospital in Hempstead, N.J., referred to is a study in Obstetrics & Gynecology which concluded that planned home births in Washington state are low risk.
In that paper, Elizabeth Nethery, RM, MS, MSM, a midwife and PhD candidate at the University of British Columbia, Vancouver, calculated the outcomes from 2015 to 2020 for “all births attended by members of a statewide midwifery professional association that were within professional association guidelines and met eligibility criteria for planned birth center birth.”
Ms. Nethery’s team concluded: “Rates of adverse outcomes for this cohort in a U.S. state with well-established and integrated community midwifery were low overall. Birth outcomes were similar for births planned at home or at a state-licensed, freestanding birth center.”
This news organization was among the publications that reported the results of that study.
But it’s the exclusion criteria in that study, primarily, that Dr. Grünebaum and colleagues take issue with.
Births excluded from the main analysis of the study by Ms. Nethery and coauthors involved “multifetal pregnancy, prior cesarean delivery, onset of labor at more than 42 0/7 weeks of gestation or preterm (less than 37 weeks), preexisting hypertension or diabetes, known amniotic fluid abnormality, gestational hypertension or preeclampsia, or malpresentation.”
Those are conditions that fall outside guidelines for planned home births. But both Ms. Nethery and Dr. Grünebaum said that sometimes these high-risk conditions are present in home births.
Different conclusion for home birth safety
Dr. Grünebaum and colleagues’ analysis of the risk profiles and outcomes for U.S. planned home births for the years 2016-2020 came to a different conclusion about the safety of home births.
They used a retrospective population-based cohort study that used the Centers for Disease Control and Prevention WONDER natality online database. They included planned home births and compared the outcomes with and without certain risk factors, including some high-risk factors such as twin deliveries, breech births, and previous cesarean.
Dr. Grünebaum’s analysis concluded that “it is an immutable truth that planned home births in the United States result in avoidable risks of increased adverse neonatal outcomes.”
Ms. Nethery said though the high-risk conditions were excluded from their main analysis, they are mentioned in the paper and detailed in the supplement.
She acknowledged in the paper that some midwives practice outside the guidelines and that was the case in 7% of births or for 800 people in the Washington state study. But she told this publication it’s a small number and high-risk births should be handled in a hospital so the team focused its research on low-risk births.
“People plan home births who are outside the guidelines everywhere in the world. There are a lot of reasons why people do it,” she said. Among them are not feeling safe in the hospital, being rejected by an obstetrician for a desired procedure, or, in some cases, because they are misinformed.
She said midwives are sometimes faced with a difficult choice, when a patient wants, for instance, a vaginal birth after cesarean (VBAC), one of the conditions not recommended for home births.
The midwife is left with the choice of saying she will not do a VBAC in the home, or she can explain to the patient why it is not recommended and explain all the reasons it is not recommended, such as an elevated risk of rupture, but honor the patient’s choice.
“Do you tell the person: ‘Sorry, go have the cesarean anyway or do you do your best to support this person?’ Birthing people have the right to autonomy of choice,” Ms. Nethery said.
Dr. Grünebaum and colleagues said: “The recent study by Nethery et al. concluded that planned home births in the state of Washington have good neonatal outcomes by focusing on results of low-risk patients.”
Dr. Grünebaum said in an interview: “It’s like reporting on smoking and lung cancer and saying I’m only going to report on patients who have smoked for less than 5 years. You need to take the whole picture into consideration.”
Ms. Nethery gave this explanation for excluding the high-risk patients: “If you are studying a drug, you exclude people from your study who got the drug even though they had risk factors that were ‘contraindications’ to that drug. Likely there was a reason they got the drug – in consultation with their doctor, the patient and the doctor decided that the potential benefit outweighed the risk – but they are not relevant to understanding how that drug impacts people who were ‘eligible’ for the drug in the first place.”
“That is part of the reason we excluded ‘high-risk’ people from our study,” she said. “The other reason is that that is what is commonly done in most research on this topic – we focus on ‘low-risk’ people who are within standards and eligibility criteria.”
She gave examples such as a 2019 meta-analysis and a 2011 Birthplace in England national prospective cohort study, both of which excluded high-risk home births.
“Third, we wanted to compare apples to apples (for our analysis of home vs. hospital) – and licensed birth centers in Washington state have restrictions based on risk,” Ms. Nethery said.
Dr. Grünebaum said his team supports the right of all women to give birth where they wish. “But you cannot choose unless you are given the right information.”
Dr. Grünebaum also said planned home births in the United States cannot be compared with home births delivered by midwives in other countries. Different from the United States, he said, in countries such as Canada, Germany, and England, midwives are well integrated in the medical system and they are typically affiliated with hospitals and they belong to organizations which support very strong guidelines.
He added that, while Washington state has its own set of guidelines, there are no national guidelines for home births and practice varies greatly by state.
The authors concluded: “It is the professional responsibility of all health care providers, obstetricians, and midwives to present unbiased information. Focusing the reporting of outcomes on low-risk deliveries underreports true adverse outcomes in U.S. home births and provides biased information to patients considering planned home births. It is an immutable truth that planned home births in the United States result in avoidable risks of increased adverse neonatal outcomes.”
Angela Martin, MD, assistant professor of maternal-fetal medicine and medical director of the labor and delivery department at University of Kansas Medical Center, Kansas City, who was not part of either study, said she did not believe it was a problem that Ms. Nethery’s study excluded the high-risk conditions in the main analysis because it was disclosed.
“The authors were clear that they excluded high-risk conditions,” she said. “Therefore, the study should not be extrapolated to women with these conditions.”
“I believe her results do make that case for low-risk women in Washington state,” Dr. Martin said. “Again, it is important that findings are not extrapolated to women outside of those included in the study.”
She said there are several things that make Washington unusual in midwifery care. Consequently, the results should not be seen as representative of the United States.
“It is one of the most integrated states for midwife care in the country,” Dr. Martin said. “Washington has licensure available for midwives, which is not true of all states. It also has a robust state professional association that publishes guidelines for midwives to follow. And midwives in Washington have a wide formulary. For example, they can administer antibiotics, carry and administer hemorrhage medications, they can carry oxygen, and they are allowed to suture.”
Iris Krishna, MD, MPH, director of perinatal quality, Emory Perinatal Center and assistant professor in the division of maternal-fetal medicine at Emory University, Atlanta, said in an interview that the arguments by Ms. Nethery and Dr. Grünebaum illustrate the controversy over home births.
Dr. Krishna, who was not part of either study, said physicians and midwives should counsel patients contemplating a planned community birth that available data is not generalizable to all birth settings or all patients.
“Women should be counseled that delivery in a hospital setting or accredited birth center is safer than home birth,” she said. “Ultimately, each woman has the right to make a medically informed decision about delivery after adequate counseling on the risks and benefits of community birth.”
Dr. Grünebaum and colleagues reported no relevant financial relationships. Ms. Nethery, Dr. Martin, and Dr. Krishna also reported no relevant financial relationships.
FROM THE AMERICAN JOURNAL OF OBSTETRICS AND GYNECOLOGY
‘Best Hospitals for Maternity’ offers national perspective
“The Best Hospitals for Maternity” looked at data for 2019 and covered uncomplicated but not high-risk pregnancies. “All families deserve to be informed on how hospitals perform on key indicators of quality, which is why U.S. News has compiled and published a trove of maternal health data from hospitals across the country,” Ben Harder, managing editor and chief of health analysis at U.S. News, said in a written statement.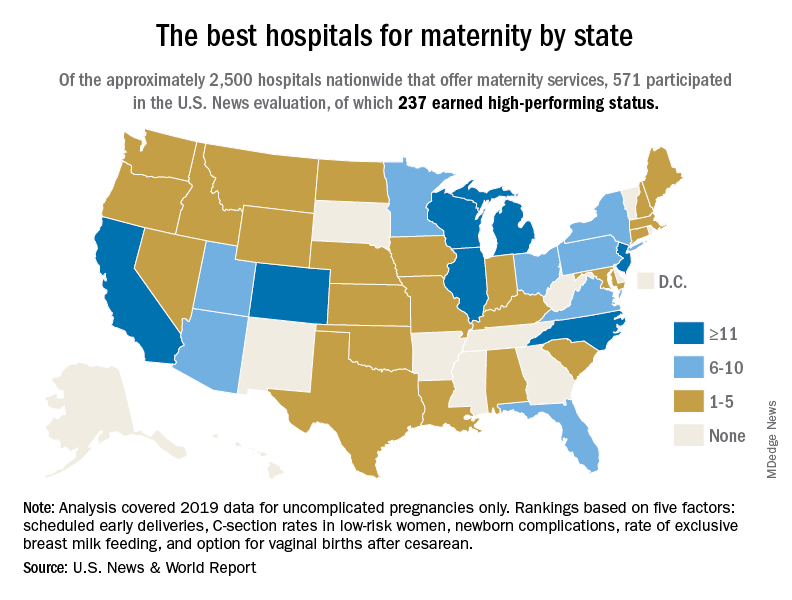
The 237 best performers were selected from an overall pool of 571 hospitals that participated in the analysis, representing every state except Alaska, Arkansas, and Vermont, U.S. News said, noting that about 2,700 hospitals in the United States offer maternity services.
California has the highest number of best performers, 33, followed by Illinois and New Jersey, both with 15. Colorado is home to 14 best-performing hospitals, Michigan has 12, and North Carolina and Wisconsin each have 12. “Hospitals that performed well had fewer newborn complications, fewer early deliveries and fewer C-sections, compared to other hospitals across the nation,” Mr. Harder said.
The composite score constructed by U.S. News involved five quality measures: nulliparous, term, singleton, and vertex cesarean delivery rates; early elective delivery rates; unexpected newborn complications rates; routine vaginal birth after cesarean (VBAC) delivery availability; and exclusive breast milk–feeding rates. The composite score averaged 80.0 for high performers and 54.9 for the other participating hospitals, U.S. News reported.
Averages for the high performers on each of the five measures looked like this:
- C-section rate, 21.1%.
- Early elective delivery rate, 1.3%.
- Overall unexpected newborn complication rates, 2.38%
- Exclusive breast milk–feeding rate, 58.6%.
- VBAC availability, 92.4%.
Data for four measures were collected from the hospitals via online survey over a 4-month window that began on April 29, 2021. Rates of early elective delivery came from the Centers for Medicare & Medicaid Services Care Compare.
Large analysis confirms safety of nipple-sparing mastectomy
A new analysis of over 22,000 mastectomy patients confirms what smaller studies have indicated: Patients who undergo nipple-sparing mastectomy have overall and disease-free survival similar to that of those who receive a total mastectomy.
When nipple-sparing mastectomy was introduced, many experts felt uneasy about opting for the less invasive procedure, recalled Rosa Hwang, MD, associate medical director for breast surgery at MD Anderson Cancer Center in Houston. “The concern was leaving all this skin,” said Dr. Hwang. “Are you going to leave cancer behind” and increase the risk of local recurrence?
Over the past 2 decades, the number of patients undergoing nipple-sparing mastectomy increased and, in turn, studies began to demonstrate the safety of the procedure.
However, large analyses evaluating long-term outcomes – namely, overall survival and breast cancer-specific survival – of nipple-sparing mastectomy were still lacking.
The latest study, published online Nov. 20 in Annals of Surgical Oncology, compared the long-term prognosis and survival benefits of nipple-sparing to total mastectomy in thousands of women. The analysis, which pulled data from the SEER cancer database, included 5,765 patients who underwent the nipple-sparing procedure and 17,289 patients who had a total mastectomy.
The authors found that overall survival and breast cancer–specific survival were similar for women undergoing nipple-sparing mastectomy and those receiving a total mastectomy. In fact, over the long-term, the nipple-sparing group slightly edged out the total mastectomy group in overall survival (94.61% vs. 93% at 5 years and 86.34% vs. 83.48% at 10 years, respectively) and in breast cancer-specific survival rates (96.16% vs. 95.74% at 5 years, and 92.2% vs. 91.37% at 10 years). The differences, however, were not significant.
The study also found that certain subgroups – including White women, women over age 46, those with a median household income of $70,000 or more, hormone receptor-positive, and HER2 negative – had significantly better overall survival rate with the nipple-sparing procedure (P < .05). However, the authors noted, the survival advantage in the nipple-sparing group did not extend to breast cancer–specific survival.
Dr. Hwang, who was not involved in the current analysis, said the significant overall survival result in the subgroup analysis was surprising because “there’s no biological reason why one would expect that to be true.”
Given that the subgroups did not demonstrate better breast cancer–specific survival, Dr. Hwang believes the overall survival finding may have more to do with comorbidities, which the study did not account for, than type of mastectomy.
When choosing who is eligible for a nipple-sparing mastectomy, “We’re more selective,” Dr. Hwang said. For instance, patients with uncontrolled diabetes or who smoke are unlikely to be candidates. “So, I think it’s possible that medical comorbidities and medical conditions between these groups [were] different.”
According to the authors, coding inconsistencies represent another possible weakness of the study. From 1998 to 2010, “the term ‘nipple-sparing mastectomy’ was coded as a [total mastectomy] with the ‘subcutaneous mastectomy’ code.” It’s possible that some patients receiving the nipple-sparing procedure before 2011 were not appropriately coded in the current study.
Moving forward, a large prospective study that includes comorbidities would be helpful, but overall the study helps validate that “nipple-sparing mastectomy is a safe operation for selected patients,” Dr. Hwang said.
A version of this article first appeared on Medscape.com.
The gender pay gap, care economy, and mental health
According to an analysis by the Pew Research Center and a report by the National Women’s Law Center, women were earning approximately $0.83-$0.84 for every $1.00 earned by their male counterparts in 2020. Accordingly, women would need to work an additional 42 days to receive compensation for earnings by men during that year. Moreover, these gaps exist with respect to race inequalities. For example, Black and Latinx women who are working full-time were reported to earn approximately $0.64 and $0.57, respectively, for every $1.00 compared with their white, non-Hispanic male counterparts. Striking, isn’t it?

The gender pay gap also affects physicians. A 2021 Medscape survey found that male physicians earn 35% more than female physicians. The biggest gap seems to be between male and female specialists, with men earning $376,000 and women $283,000.
Gender inequality and COVID-19
In addition to workplace responsibilities, women are more likely to take on unpaid positions in the informal care economy – examples of these tasks include cleaning, grocery shopping, and child care. In fact, the COVID-19 pandemic has increased the burden of unpaid care work among women, which often incurs a significant impact on their participation in the paid economy.
A study in the United States evaluating the impact of gender inequality during COVID-19 suggested that the rise in unemployment among women during this time may be related to decreased occupational flexibility. Accordingly, the closure of schools and caregiving facilities has translated into increased responsibilities as the informal caregiver, and a decreased ability to fulfill work obligations. Consequently, women may be overwhelmed and unable to maintain their employment status, are limited in their work opportunities, and/or are furloughed or passed over for promotions.
Gendered pay gaps affect mental health
A study by Platt and colleagues investigated the relationship between gendered wage gaps and gendered disparities in depression and anxiety disorders. Researchers found that females with a lower income compared with their matched male counterparts were more likely to experience depression and generalized anxiety disorders (i.e., they were 2.4 times more likely to experience depression and 4 times more likely to experience anxiety), while women who earned more than men did not report a significant difference in depression there were reduced gaps in the prevalence of anxiety disorders. As such, it has been suggested that wage gap inequalities are a contributing factor to gendered mental health disparities.
Reduced pay is not only a signifier of reduced returns on human capital. It may also have implications for one’s role in the care economy (e.g., greater time allocation as a result of reduced return), and may result in a higher likelihood for relocation as it relates to a partner’s work, overqualification for a position, inflexible work schedules, and reduced work autonomy.
Wage inequalities may act as a proxy for workplace inequalities such as promotions, prestigious projects, limited upward mobility, and internalized negative workplace experiences, all of which may contribute to increased sleep loss, stress, and related mental health stressors.
One might say, “A few cents, so what?” We should encourage conversations around the gender pay gap and develop strategies to combat this economic and social disparity.
Ms. Lui completed an HBSc global health specialist degree at the University of Toronto, where she is now an MSc candidate. She has received income from Braxia Scientific Corp. A version of this article first appeared on Medscape.com.
According to an analysis by the Pew Research Center and a report by the National Women’s Law Center, women were earning approximately $0.83-$0.84 for every $1.00 earned by their male counterparts in 2020. Accordingly, women would need to work an additional 42 days to receive compensation for earnings by men during that year. Moreover, these gaps exist with respect to race inequalities. For example, Black and Latinx women who are working full-time were reported to earn approximately $0.64 and $0.57, respectively, for every $1.00 compared with their white, non-Hispanic male counterparts. Striking, isn’t it?
The gender pay gap also affects physicians. A 2021 Medscape survey found that male physicians earn 35% more than female physicians. The biggest gap seems to be between male and female specialists, with men earning $376,000 and women $283,000.
Gender inequality and COVID-19
In addition to workplace responsibilities, women are more likely to take on unpaid positions in the informal care economy – examples of these tasks include cleaning, grocery shopping, and child care. In fact, the COVID-19 pandemic has increased the burden of unpaid care work among women, which often incurs a significant impact on their participation in the paid economy.
A study in the United States evaluating the impact of gender inequality during COVID-19 suggested that the rise in unemployment among women during this time may be related to decreased occupational flexibility. Accordingly, the closure of schools and caregiving facilities has translated into increased responsibilities as the informal caregiver, and a decreased ability to fulfill work obligations. Consequently, women may be overwhelmed and unable to maintain their employment status, are limited in their work opportunities, and/or are furloughed or passed over for promotions.
Gendered pay gaps affect mental health
A study by Platt and colleagues investigated the relationship between gendered wage gaps and gendered disparities in depression and anxiety disorders. Researchers found that females with a lower income compared with their matched male counterparts were more likely to experience depression and generalized anxiety disorders (i.e., they were 2.4 times more likely to experience depression and 4 times more likely to experience anxiety), while women who earned more than men did not report a significant difference in depression there were reduced gaps in the prevalence of anxiety disorders. As such, it has been suggested that wage gap inequalities are a contributing factor to gendered mental health disparities.
Reduced pay is not only a signifier of reduced returns on human capital. It may also have implications for one’s role in the care economy (e.g., greater time allocation as a result of reduced return), and may result in a higher likelihood for relocation as it relates to a partner’s work, overqualification for a position, inflexible work schedules, and reduced work autonomy.
Wage inequalities may act as a proxy for workplace inequalities such as promotions, prestigious projects, limited upward mobility, and internalized negative workplace experiences, all of which may contribute to increased sleep loss, stress, and related mental health stressors.
One might say, “A few cents, so what?” We should encourage conversations around the gender pay gap and develop strategies to combat this economic and social disparity.
Ms. Lui completed an HBSc global health specialist degree at the University of Toronto, where she is now an MSc candidate. She has received income from Braxia Scientific Corp. A version of this article first appeared on Medscape.com.
HPV vaccines reduce cervical cancer rates in young females
Two different studies have found that, provided young females are immunized with the human papilloma virus (HPV) vaccine at a young enough age, both the incidence of and mortality from cervical cancer can be dramatically curtailed, data from the United Kingdom and to a lesser extent, the United States indicate.
In the U.K. study, published online in The Lancet, researchers showed that the national vaccination program against HPV, initiated in England in 2008, has all but eradicated cervical cancer and cervical intraepithelial neoplasia (CIN3) in young girls who received the vaccine at the age of 12 and 13 years (school year 8) prior to their sexual debut.
In this age group, cervical cancer rates were 87% lower than rates among previously nonvaccinated generations, while CIN3 rates were reduced by 97%, as researchers report. “It’s been incredible to see the impact of HPV vaccination, and now we can prove it prevented hundreds of women from developing cancer in England,” senior author Peter Sasieni, MD, King’s College London, said in a statement. “To see the real-life impact of the vaccine has been truly rewarding,” he added.
“This study provides the first direct evidence of the impact of the UK HPV vaccination campaign on cervical cancer incidence, showing a large reduction in cervical cancer rates in vaccinated cohorts,” Kate Soldan, MD, UK Health Security Agency, London, said in the same statement.
“This represents an important step forward in cervical cancer prevention, and we hope that these new results encourage uptake as the success of the vaccination programme relies not only on the efficacy of the vaccine but also the proportion of the population vaccinated,” she added.
Vanessa Saliba, MD, a consultant epidemiologist for the UK Health Security Agency, agreed, adding that “these remarkable findings confirm that the HPV vaccine saves lives by dramatically reducing cervical cancer rates among women.”
“This reminds us that vaccines are one of the most important tools we have to help us live longer, healthier lives,” she reemphasized.
British HPV program
When initiated in 2008, the national HPV vaccination program used the bivalent, Cervarix vaccine against HPV 16 and 18. As researchers noted, these two HPV types are responsible for 70%-80% of all cervical cancers in England.
However, in 2012, the program switched to the quadrivalent HPV vaccine (Gardasil) which is also effective against two additional HPV types, 6 and 11, both of which cause genital warts. The program also originally recommended the three-dose regimen for both HPV vaccines.
Now, only two doses of the vaccine are given to girls under the age of 15 even though it has been shown that a single dose of the HPV vaccine provides good protection against persistent infection, with efficacy rates that are similar to that of three doses, as the authors point out.
Among the cohort eligible for vaccination at 12 or 13 years of age, 89% received at least one dose of the HPV vaccine while 85% of the same age group received all three shots.
Cancer registry
Data from a population-based cancer registry was used to estimate the early effect of the bivalent HPV program on the incidence of cervical cancer and CIN3 in England between January 2006 and June 2019. During the study interval, there were 27,946 diagnoses of cervical cancer and 318,058 diagnoses of CIN3, lead author Milena Falcaro, MD, King’s College London, and colleagues report. Participants were then analyzed separately according to their age at the time of vaccination and the incidence rates calculated for both cervical cancer and CIN3 in the three separate groups.
For slightly older girls who received the vaccine between 14 and 16 years of age (school year 10-11), cervical cancer was reduced by 62% while CIN3 rates were reduced by 75%. For those who received the vaccine between 16 and 18 years of age (school year 12-13), cervical cancer rates were reduced by 34% while CIN3 rates were reduced by 39%, study authors add.
Indeed, the authors estimate that by June 2019 there were approximately 450 fewer cases of cervical cancer and 17,200 fewer cases of CIN3 than would otherwise have been expected in the vaccinated population in England.
The authors acknowledge that cervical cancer is rare in young women and vaccinated populations are still young. For example, the youngest recipients would have been immunized at the age of 12 in 2008 and would still be only 23 years old in 2019 when the study ended.
Thus, the authors emphasize that, because the vaccinated populations are still young, it’s too early to assess the full effect of HPV vaccination on cervical cancer rates.
Asked to comment on the study, Maurice Markman, MD, president, Medicine and Science Cancer Treatment Centers of America, pointed out that results from the British study are very similar to those from a Swedish study assessing the effect of the quadrivalent vaccine alone.
“You can put any superlatives you want in here, but these are stunningly positive results,” Dr. Markman said in an interview. As an oncologist who has been treating cervical cancer for 40 years – particularly advanced cervical cancer – “I can tell you this is one of the most devastating diseases to women, and the ability to eliminate this cancer with something as simple as a vaccine is the goal of cancer therapy, and it’s been remarkably successful,” he stressed.
Editorial commentary
Commenting on the findings, editorialists Maggie Cruickshank, MD, University of Aberdeen (Scotland), and Mihaela Grigore, MD, University of Medicine and Pharmacy, Lasi, Romania, point out that published reports evaluating the effect of HPV vaccination on cervical cancer rates have been scarce until now.
“The most important issue, besides the availability of the vaccine ... is the education of the population to accept vaccination because a high rate of immunization is a key element of success,” they emphasize. “Even in a wealthy country such as England with free access to HPV immunization, uptake has not reached the 90% vaccination target of girls aged 15 years set by the WHO [World Health Organization],” the editorialists add.
Dr. Cruickshank and Dr. Grigore also suggest that the effect HPV vaccination is having on cervical cancer rates as shown in this study should also stimulate vaccination programs in low- and middle-income countries where cervical cancer is a far greater public health issue than it is in countries with established systems of vaccination and screening.
HPV vaccination in the United States
The HPV vaccination program is similarly reducing the incidence of and mortality from cervical cancer among younger women in the United States who are most likely to have received the vaccine. As reported by lead author, Justin Barnes, MD, Washington University, St. Louis, the incidence of cervical cancer dropped by 37.7% from 2001 through 2005 to 2010 through 2017 in girls and young women between 15 and 24 years of age.
The U.S. study was published online in JAMA Pediatrics.
“HPV vaccine coverage in the U.S. has improved over the last few years although it was quite poor for many years,” senior author of the U.K. study, Peter Sasieni, MD, King’s College London, said in an interview. “Thus, one would anticipate a lower impact on the population in the U.S., because vaccine uptake, particularly in those aged 11-14 years was so much lower than it was in the U.K.,” he noted.
SEER databases
National age-adjusted cervical cancer incidence and mortality data from January 2001 through December 2017 for women and girls between 15 and 39 years of age were obtained from the combined Surveillance, Epidemiology, and End Results as well as the National Program of Cancer Registries databases. Mortality data was obtained from the National Center for Health Statistics.
Investigators then compared percentage changes in the incidence of and mortality from cervical cancer from January 2001 through December 2005 during the prevaccination years to that observed between January 2010 through December 2017 during the postvaccination years. They also compared incidence and mortality rates in three different cohorts: females between 15 and 24 years of age, those between 25 and 29 years of age, and those between 30 and 39 years of age.
“The older two groups were included as comparison, given their low vaccination rates,” the authors explained. Results showed that, during the same study interval from 2001 through 2005 to 2010 through 2017, the incidence of cervical cancer dropped by only 16.1% in women between 25 and 29 years of age and by only 8% for women between 30 and 39 years of age, the investigators report.
Reductions in mortality from cervical cancer were only strikingly so in the youngest age group of females between 15 and 24 years of age, among whom there was a 43.3% reduction in mortality from 2001-2005 to 2010-2017, as Dr. Barnes and colleagues note.
This pattern changed substantially in women between the ages of 25 and 29, among whom there was a 4.3% increase in mortality from cervical cancer during the same study interval and a small, 4.7% reduction among women between 30 and 39 years of age, investigators add. In actual numbers, mortality rates from cervical cancer were very low at only 0.6 per 100,000 in females between 15 and 24 years of age.
This compared to a mortality rate of 0.57 per 100,000 in women between 25 and 29 years of age and 1.89 per 100,000 in the oldest age group. “These nationwide data showed decreased cervical cancer incidence and mortality among women and girls aged 15-24 years after HPV vaccine introduction,” Dr. Barnes notes.
“Thus, the current study adds to knowledge by quantitatively comparing changes in cervical cancer incidence by age-based vaccine eligibility and providing suggestive evidence for vaccine-associated decreases in cervical cancer mortality,” investigators add.
However, as the authors also point out, while the reduction in mortality from cervical cancer associated with HPV vaccination may translate to older age groups as HPV-vaccinated cohorts age, “the number of deaths and hence the number of potentially averted deaths in young women and girls was small,” they caution, “and efforts to further improve vaccination uptake remain important.”
None of the authors or the editorialists had any conflicts of interest to declare.