User login
Cardiometabolic risk increased with obesity and abnormal blood glucose
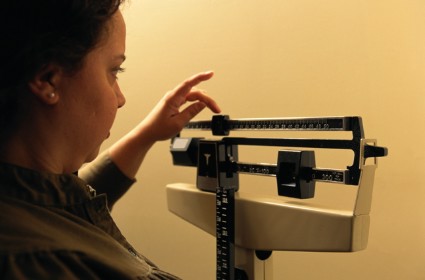
High blood sugar, obesity, and increasing body mass index over time contributed to the likelihood that women would be at risk for metabolic syndrome, but physical activity reduced that risk, according to a recent study. Neither smoking nor alcohol consumption contributed to becoming at-risk for metabolic syndrome.
"Women who remained metabolically benign were more physically active than their peers, and the protective effect of physical activity ... persisted, even after adjusting for known cardiometabolic risk factors," reported Unab I. Khan of Albert Einstein College of Medicine, New York (J. Clin. Endocrinol. Metab. 2014 May 20 [doi:10.1210/jc.2013-3259]).
Dr. Khan and his associates tracked 482 overweight (BMI 25-29.9) and 384 obese (BMI higher than 30) women regarded as metabolically benign overweight/obese because they had fewer than two of the following metabolic syndrome abnormalities:
• Systolic/diastolic blood pressure of 130/85 mm Hg or greater, or antihypertensive medication use.
• Fasting triglycerides of 150 mg/dL or greater.
• Fasting HDL cholesterol levels of 50 mg/dL or less, or lipid-lowering medication use.
• Fasting glucose of 100 mg/dL or greater, or self-reported use of antidiabetic medications.
"At risk" was defined as having two or more metabolic syndrome abnormalities.
During the 7-year follow-up, 43% of the women progressed from metabolically benign to being at risk. These women had a higher baseline BMI and greater abnormalities in blood glucose, triglycerides, blood pressure and low HDL cholesterol measurements.
After the researchers accounted for age, race/ethnicity, education status, menopausal status, geographical site, smoking, alcohol use, and a family history of cardiovascular disease, the strongest contributor to progression to being at risk was abnormal fasting glucose (hazard ratio, 3.24, P less than .001), followed by high blood pressure (HR 3.00), triglycerides (HR 2.91) and HDL (HR 2.85). Baseline physical activity significantly reduced that risk (HR 0.86). All differences were statistically significant.
"Controlling these [cardiometabolic] factors could potentially allay the elevated risk of cardiovascular morbidity and mortality unanimously associated with the at-risk phenotype," the authors wrote.
The study was supported by the National Institutes of Health, the National Institute on Aging, the National Institute of Nursing Research, and the Office of Research on Women’s Health. The authors reported no disclosures.
FROM THE JOURNAL OF CLINICAL ENDOCRINOLOGY AND METABOLISM
Key clinical point: Physical activity was shown to significantly reduce the risk of metabolic syndrome in women.
Major finding: Among 866 metabolically benign overweight/obese women at baseline, those with higher fasting glucose levels had the greatest risk (hazard ratio 3.24, P less than .001) of progressing to being at risk for metabolic syndrome, but physical activity decreased the risk (HR 0.86, P less than .001).
Data source: A cohort study of 866 metabolically benign overweight/obese women tracked over 7 years at seven sites throughout the United States
Disclosures: The study was supported by the National Institutes of Health, the National Institute on Aging, the National Institute of Nursing Research and the Office of Research on Women’s Health. The authors reported no disclosures.
Only atypical major depressive disorder linked to obesity
The atypical subtype of major depressive disorder is linked to greater risk of obesity, and this link is not found in other subtypes of the illness, a recent study shows.
"For the clinician, the atypical subtype deserves particular attention, because this subtype is a strong predictor of adiposity," Dr. Aurélie M. Lasserre of Lausanne University Hospital in Prilly, Switzerland, and her associates reported online. "Accordingly, the screening of atypical features and, in particular, increased appetite in individuals with depression is crucial," they wrote (JAMA Psychiatry 2014 June 4 [doi:10.1001/jamapsychiatry.2014.411]).

After tracking 3,054 participants in Lausanne, Switzerland, for a mean 5.5 years starting in 2003, Dr. Lasserre’s team found that those with melancholic, combined, or unspecified major depressive disorder (MDD) showed no greater risk for fat-mass gain or obesity than did those without MDD.
However, individuals with atypical MDD had nearly four times greater odds of obesity (odds ratio, 3.75), with increased body mass index (BMI) and waist circumference in both sexes, and increased fat mass in men, compared with those without MDD. The researchers found no evidence for medication or physical activity affecting the link between adiposity and atypical MDD.
Of the total sample, 7.6% of the participants met criteria for MDD at baseline, and 36.7% had a previous major depressive episode. The subtypes among those with current MDD included 10% atypical and melancholic combined, 14% atypical, 29% melancholic, and 48% unspecified.
The researchers took into account participants’ sociodemographic characteristics as well as their alcohol and tobacco use, amount of physical activity, and medication use. Baseline mean BMI was 25.3 kg/m2, and those with current or previous atypical MDD or atypical and melancholic combined MDD tended to have a higher baseline BMI than did those who were never depressed.
Among the limitations cited is that the sociodemographic characteristics of participants and nonparticipants differed at the physical follow-up, "suggesting that individuals with a less-healthy lifestyle were less likely to participate," Dr. Lasserre and her colleagues wrote.
This study was supported by the Swiss National Science Foundation. Dr. Lasserre had no disclosures; three coauthors used research grants from GlaxoSmithKline for the study.
The atypical subtype of major depressive disorder is linked to greater risk of obesity, and this link is not found in other subtypes of the illness, a recent study shows.
"For the clinician, the atypical subtype deserves particular attention, because this subtype is a strong predictor of adiposity," Dr. Aurélie M. Lasserre of Lausanne University Hospital in Prilly, Switzerland, and her associates reported online. "Accordingly, the screening of atypical features and, in particular, increased appetite in individuals with depression is crucial," they wrote (JAMA Psychiatry 2014 June 4 [doi:10.1001/jamapsychiatry.2014.411]).
After tracking 3,054 participants in Lausanne, Switzerland, for a mean 5.5 years starting in 2003, Dr. Lasserre’s team found that those with melancholic, combined, or unspecified major depressive disorder (MDD) showed no greater risk for fat-mass gain or obesity than did those without MDD.
However, individuals with atypical MDD had nearly four times greater odds of obesity (odds ratio, 3.75), with increased body mass index (BMI) and waist circumference in both sexes, and increased fat mass in men, compared with those without MDD. The researchers found no evidence for medication or physical activity affecting the link between adiposity and atypical MDD.
Of the total sample, 7.6% of the participants met criteria for MDD at baseline, and 36.7% had a previous major depressive episode. The subtypes among those with current MDD included 10% atypical and melancholic combined, 14% atypical, 29% melancholic, and 48% unspecified.
The researchers took into account participants’ sociodemographic characteristics as well as their alcohol and tobacco use, amount of physical activity, and medication use. Baseline mean BMI was 25.3 kg/m2, and those with current or previous atypical MDD or atypical and melancholic combined MDD tended to have a higher baseline BMI than did those who were never depressed.
Among the limitations cited is that the sociodemographic characteristics of participants and nonparticipants differed at the physical follow-up, "suggesting that individuals with a less-healthy lifestyle were less likely to participate," Dr. Lasserre and her colleagues wrote.
This study was supported by the Swiss National Science Foundation. Dr. Lasserre had no disclosures; three coauthors used research grants from GlaxoSmithKline for the study.
FROM JAMA PSYCHIATRY
Key clinical point: "Screening of atypical features and, in particular, increased appetite in individuals with depression is crucial."
Major finding: Those with atypical major depressive disorder – but no other MDD subtypes – have 3.75 greater odds of obesity than do those without depression.
Data source: The data are based on a prospective population-based cohort study involving 3,054 participants in Lausanne, Switzerland, starting in 2003 with a mean 5.5 years follow-up.
Disclosures: This study was supported by the Swiss National Science Foundation. Dr. Lasserre had no disclosures; three coauthors used research grants from GlaxoSmithKline for the study.

Less weight gain seen in other antidepressants than in citalopram
The amount of potential weight gain from antidepressants depends on the particular drug, though the differences among the medications are modest, according to a recent study.
Antidepressants nortriptyline, amitriptyline, and bupropion were all associated with less weight gain than citalopram, Sarah S. Blumenthal of Massachusetts General Hospital in Boston and her associates reported online (JAMA Psychiatry 2014 June 4 [doi:10.1001/jamapsychiatry.2014.414]).

The researchers pulled prescribing data and all recorded weights for 19,244 adults aged 18-65 during the 12 months after they were prescribed an antidepressant. The medications of interest included the following: amitriptyline, bupropion, citalopram, duloxetine, escitalopram, fluoxetine, mirtazapine, nortriptyline, paroxetine, venlafaxine, and sertraline.
Prescribing data for 3,366 other adults not receiving psychotropics but receiving the asthma medication albuterol sulfate or obesity medications orlistat, phentermine, and sibutramine also were pulled to confirm study validity (assay sensitivity). The data came from the Partners HealthCare electronic health record, used by Massachusetts General Hospital, Brigham and Women’s Hospital, and community and specialty outpatient clinics in Boston.
The participants’ weight change in 3-month increments over 12 months was compared to that seen with citalopram. The researchers adjusted for sociodemographic characteristics and clinical variables, including depressive or anxiety disorder, recent tobacco use, pain disorder, and a comorbidity index to consider overall illness burden.
Nortriptyline (P less than .001), amitriptyline (P = .001), and bupropion (P = .02), in order from greatest to least difference, were the only medications associated with less weight gain than citalopram. The asthma and obesity medications also showed less weight gain than citalopram. Weaker differences were seen in those who took antidepressants for less than the full 12 months of the study period.
Ms. Blumenthal and her colleagues cited several limitations. For example, the subset of patients with depressive symptoms who have diminished appetites and resulting weight loss may experience weight gain after treatment. In contrast, other patients who might gain because of depressive symptoms might experience weight loss after taking antidepressants. "It is difficult to predict the net effect on observed weight change without a means of distinguishing these phenomena," they wrote.
The study was supported by the National Institute of Mental Health. Ms. Blumenthal had no disclosures, and her colleagues disclosed relationships with several pharmaceutical and research companies.
The amount of potential weight gain from antidepressants depends on the particular drug, though the differences among the medications are modest, according to a recent study.
Antidepressants nortriptyline, amitriptyline, and bupropion were all associated with less weight gain than citalopram, Sarah S. Blumenthal of Massachusetts General Hospital in Boston and her associates reported online (JAMA Psychiatry 2014 June 4 [doi:10.1001/jamapsychiatry.2014.414]).
The researchers pulled prescribing data and all recorded weights for 19,244 adults aged 18-65 during the 12 months after they were prescribed an antidepressant. The medications of interest included the following: amitriptyline, bupropion, citalopram, duloxetine, escitalopram, fluoxetine, mirtazapine, nortriptyline, paroxetine, venlafaxine, and sertraline.
Prescribing data for 3,366 other adults not receiving psychotropics but receiving the asthma medication albuterol sulfate or obesity medications orlistat, phentermine, and sibutramine also were pulled to confirm study validity (assay sensitivity). The data came from the Partners HealthCare electronic health record, used by Massachusetts General Hospital, Brigham and Women’s Hospital, and community and specialty outpatient clinics in Boston.
The participants’ weight change in 3-month increments over 12 months was compared to that seen with citalopram. The researchers adjusted for sociodemographic characteristics and clinical variables, including depressive or anxiety disorder, recent tobacco use, pain disorder, and a comorbidity index to consider overall illness burden.
Nortriptyline (P less than .001), amitriptyline (P = .001), and bupropion (P = .02), in order from greatest to least difference, were the only medications associated with less weight gain than citalopram. The asthma and obesity medications also showed less weight gain than citalopram. Weaker differences were seen in those who took antidepressants for less than the full 12 months of the study period.
Ms. Blumenthal and her colleagues cited several limitations. For example, the subset of patients with depressive symptoms who have diminished appetites and resulting weight loss may experience weight gain after treatment. In contrast, other patients who might gain because of depressive symptoms might experience weight loss after taking antidepressants. "It is difficult to predict the net effect on observed weight change without a means of distinguishing these phenomena," they wrote.
The study was supported by the National Institute of Mental Health. Ms. Blumenthal had no disclosures, and her colleagues disclosed relationships with several pharmaceutical and research companies.
FROM JAMA PSYCHIATRY
Key clinical point: Differences among antidepressants in contributing to weight gain warrant a careful assessment of each patient’s metabolic situation before prescribing.
Major finding: Nortriptyline (P less than .001), amitriptyline (P = .001), and bupropion (P = .02), in order from greatest to least difference, were the only medications associated with less weight gain than citalopram. .
Data source: The findings are based on a retrospective study using 12 months of data from a large New England health care system on 22,610 adults taking antidepressants or another medication of interest.
Disclosures: The study was supported by the National Institute of Mental Health. Ms. Blumenthal had no disclosures, and her colleagues disclosed relationships with several pharmaceutical and research companies.
Doctors' political giving starts to shift from Republicans
A gradual shift in physicians’ contributions from Republican candidates and organizations – and to their Democratic counterparts – has accompanied the increasing numbers of female physicians and physician employees in the workforce, Adam Bonica, Ph.D., and his colleagues reported June 2 in JAMA Internal Medicine.
The researchers used publicly available data from the Federal Elections Commission and the Database on Ideology, Money in Politics, and Elections for the 1992 and 2012 election cycles. Doctors were identified using the National Provider Identified public use file from the National Plan and Provider Enumeration System and the Unique Physician Identifier Number database (JAMA Intern. Med. [doi:10.1001/jamainternmed.2014.2105]).

A total of 140,423 physicians contributed at least $200 to a candidate or organization (including super political action committees) during at least one election cycle in that time, Dr. Bonica of Stanford (Calif.) University and his colleagues reported.
In the 1992 election cycle (spanning 1991 and 1992), 2.6% of physicians made $20 million in political contributions; by the 2012 cycle, 9.4% of physicians donated $189 million. The authors calculated the percentage of total contributions that went to Republican candidates or organizations during those 2 decades.
During the entire study period, an average 57% of male physicians and 31% of female physicians contributed to Republicans; however, the overall percentage of physician contributions to Republicans began decreasing in 1996. In both the 2008 and 2012 election cycles, less than half of political contributions from physicians went to Republicans.
The gender gap in contributions also increased over time. In the 2012 election cycles, twice as many men (52%) as women (24%) donated to Republicans. The gap was similar between doctors practicing at for-profit (53%) versus nonprofit (26%) organizations.
The biggest contrast in contributions was by specialty and also showed increased polarization during the study period. Although 66% of surgeons and 33% of pediatricians contributed to Republicans in the 1992 election cycle, that gulf widened to include 70% of surgeons and 22% of pediatricians in 2012.
Much of this gap appeared to be explained by average earnings by specialty: As average earnings by each specialty increased, the percentage of physicians in that specialty contributing to Republicans also increased.
The authors reported no conflicts of interest.
Dr. Bonica and colleagues are careful not to extrapolate much beyond their findings. Their data show a recent shift toward the Democrats in the traditional physician support of Republicans, and they believe that this shift is likely to continue. However, these data may not be representative of the rank and file of physicians.
Predictions of how physicians will behave in the future are at best uncertain. We simply do not know how most physicians will react to the problems that will probably emerge as the Affordable Care Act plays out.
Physicians have the unique power to reshape the medical care system. But if they never unite to press for major reform, the future of health care in the United States will indeed be bleak. We will end up with either a system controlled by blind market forces or a system entangled in complicated and intrusive government regulations. In either case it would be impossible to practice good patient-centered medicine, and the quality and effectiveness of our health care system would sink even lower among the ranks of developed countries. It is up to the medical profession to see that this does not happen.
Dr. Arnold S. Relman is retired from the department of medicine at Brigham and Women’s Hospital in Boston. His comments were adapted from an editorial (doi:10.1001/jamainternmed.2014.509) accompanying Dr. Bonica’s study. He reported no conflicts of interest.
A gradual shift in physicians’ contributions from Republican candidates and organizations – and to their Democratic counterparts – has accompanied the increasing numbers of female physicians and physician employees in the workforce, Adam Bonica, Ph.D., and his colleagues reported June 2 in JAMA Internal Medicine.
The researchers used publicly available data from the Federal Elections Commission and the Database on Ideology, Money in Politics, and Elections for the 1992 and 2012 election cycles. Doctors were identified using the National Provider Identified public use file from the National Plan and Provider Enumeration System and the Unique Physician Identifier Number database (JAMA Intern. Med. [doi:10.1001/jamainternmed.2014.2105]).
A total of 140,423 physicians contributed at least $200 to a candidate or organization (including super political action committees) during at least one election cycle in that time, Dr. Bonica of Stanford (Calif.) University and his colleagues reported.
In the 1992 election cycle (spanning 1991 and 1992), 2.6% of physicians made $20 million in political contributions; by the 2012 cycle, 9.4% of physicians donated $189 million. The authors calculated the percentage of total contributions that went to Republican candidates or organizations during those 2 decades.
During the entire study period, an average 57% of male physicians and 31% of female physicians contributed to Republicans; however, the overall percentage of physician contributions to Republicans began decreasing in 1996. In both the 2008 and 2012 election cycles, less than half of political contributions from physicians went to Republicans.
The gender gap in contributions also increased over time. In the 2012 election cycles, twice as many men (52%) as women (24%) donated to Republicans. The gap was similar between doctors practicing at for-profit (53%) versus nonprofit (26%) organizations.
The biggest contrast in contributions was by specialty and also showed increased polarization during the study period. Although 66% of surgeons and 33% of pediatricians contributed to Republicans in the 1992 election cycle, that gulf widened to include 70% of surgeons and 22% of pediatricians in 2012.
Much of this gap appeared to be explained by average earnings by specialty: As average earnings by each specialty increased, the percentage of physicians in that specialty contributing to Republicans also increased.
The authors reported no conflicts of interest.
FROM JAMA INTERNAL MEDICINE
Key clinical point: Physicians’ political preferences have changed as the profession’s demographics have changed.
Major finding: In both the 2008 and 2012 election cycles, less than half of political contributions from physicians went to Republicans.
Data source: The Federal Elections Commission and the Database on Ideology, Money in Politics, and Elections.
Disclosures: The authors reported no conflicts of interest.

One in 8 kids abused, neglected by age 18
One in every eight children will be abused or neglected by the time they turn 18 years old, and children in several minority groups have an even higher risk, according to a recent study.
Child maltreatment rates remained fairly consistent from 2004 through 2011, but the annual rates of approximately 1% greatly underestimate the cumulative prevalence of maltreatment, Christopher Wildeman, Ph.D., of Yale University, New Haven, and his associates reported online (JAMA Pediatr. 2 June 2014 [doi:10.1001/jamapediatrics.2014.410]).
"The results from this analysis – which provides cumulative rather than annual estimates – indicate that confirmed child maltreatment is common, on the scale of other major public health concerns that affect child health and well-being," they wrote.
Dr. Wildeman’s team used data from the 5,689,900 confirmed cases of child maltreatment in the National Child Abuse and Neglect Data System (NCANDS) Child File between 2004 and 2011, nearly 80% of which are cases of neglect. A confirmed case was one in which Child Protective Services obtained sufficient proof to substantiate that abuse or neglect occurred. U.S. child population estimates used in the study came from the Centers for Disease Control and Prevention.
Among 670,000 reports of confirmed child maltreatment cases in 2011 (0.9% of U.S. children), 492,400 cases (73.5%) involved children without a previous report. However, the youngest children are at the greatest risk, with about a quarter of children’s first confirmed reports occurring before age 2 years.
The researchers found that 12.5% of all U.S. children, including 12% of boys and 13% of girls, will experience confirmed maltreatment by age 18. Overall, 2.1% of all children have a confirmed report by age 1 year and 5.8% by age 5 years.
Black children have the greater risk for maltreatment, with 20.9% experiencing abuse or neglect by age 18, followed by Native American (14.5%) and Hispanic (13%) children. The children least likely to experience a confirmed case of maltreatment are Asian/Pacific Islanders, who comprised 3.8% of reports. Just over one in ten white children (10.7%) will be victims in a confirmed maltreatment case.
The authors had no financial conflicts.
FROM JAMA PEDIATRICS
Key clinical point: Keep an eye out for child abuse or neglect, as it is more common than previously estimated.
Major finding: Approximately 12.5% of U.S. children will experience maltreatment by the time they are 18 years old.
Data source: The findings are based on an analysis of the 5,689,900 children with a confirmed report of maltreatment in the National Child Abuse and Neglect Data System Child File between 2004 and 2011, as well as data on U.S. child population estimates by the Centers for Disease Control and Prevention.
Disclosures: The authors had no financial conflicts.
Hypertonic saline indications for bronchiolitis lack evidence for clear guidance
The therapeutic value of hypertonic saline in treating bronchiolitis in young children remains unclear, based on the findings of two randomized controlled trials with conflicting results.
While one found no significant improvements in outcomes between hypertonic and normal saline, the other found a lower risk of hospitalization in children receiving hypertonic saline.
"Based on the results of this and other studies, the administration of a single dose of 3% hypertonic saline in the acute care setting does not appear to be more effective than normal saline in improving short-term respiratory distress in bronchiolitis," reported Dr. Todd Florin of Cincinnati Children’s Hospital Medical Center and his associates in the first study (JAMA Pediatr. 2014 May 26 [doi: 10.1001/jamapediatrics.2013.5306]).
Dr. Florin’s team equally randomized 62 children under age 24 months to receive 4 mL of either 3% hypertonic saline or normal saline within 90 minutes after receiving standard therapy for bronchiolitis, which included nasal suctioning and a single dose of nebulized albuterol. The children had all presented to the emergency department of Children’s Hospital of Philadelphia during one of two consecutive bronchiolitis seasons, from November to April in 2010 and 2011.
All children were assessed using the Respiratory Distress Assessment Instrument (RDAI) 1 hour after treatment and then 2 hours after treatment for those being discharged or still in the ED at that time. Based on the Respiratory Assessment Change Score (RACS) – which uses the RDAI score and a standardized change in respiratory rate to assess respiratory status changes – the normal saline group showed clinically significant improvement (a RACS of –3) after an hour, whereas the hypertonic saline group did not.
There was no significant difference in the median RDAI scores, heart rate, oxygen saturation, hospitalization rate, or child’s breathing or feeding status (based on parental perception) between the two groups.
Yet the hospitalization rate was lower in the hypertonic saline group of the other study, which used similar protocols in a larger population, reported Dr. Susan Wu of Children’s Hospital Los Angeles and her associates, also in JAMA Pediatrics (JAMA Pediatr. 2014 May 26 [doi: 10.1001/jamapediatrics.2014.301].
Their participants included 408 children under age 24 months presenting with bronchiolitis at two different children’s hospital EDs between March 2008 and April 2011. All patients received 2.5 mg of nebulized albuterol, after which 197 children received 4 mL of normal saline and 211 children received 4 mL of 3% hypertonic saline, each inhaled up to three times. Children admitted received their assigned saline (always premedicated with albuterol sulfate) every 8 hours until discharge.
While 42.6% of the normal saline patients were admitted to the hospital, only 28.9% of the hypertonic saline patients were admitted (P = .01), for an adjusted odds ratio of 0.49 and a number needed to treat of 8 to prevent one hospitalization. "Other statistically significant predictors of admission included site, male sex, patient weight, baseline respiratory rate, and baseline oxygen saturation," the authors reported.
Among those admitted, the length of stay was 3.16 days for the hypertonic saline participants and 3.92 days for the normal saline participants, but the difference was not significant (P = .24). No significant difference was found in the RDAI score, which decreased in both groups. The RACS was calculated using the same methods as in the Florin study for 366 cases, but no significant differences in the mean RACS scores existed between the two groups after adjustment for RDAI baseline scores.
Dr. Wu and her team recommended that future research "investigate the optimal dosing and administration regimen and the patient-level factors that may affect response to hypertonic saline."
The Florin et al. study was funded by an Academic Pediatric Association Young Investigator Award. The Wu et al. study was funded by the Thrasher Research Fund and the department of pediatrics, University of Southern California Keck School of Medicine, Los Angeles. The authors of both studies declared that they had no relevant financial disclosures.
For pediatricians looking for answers on how best to provide treatment for their patients, nothing can be more frustrating than two randomized clinical trials (RCTs) with contradictory results. When we consider study design and risk of bias, these two RCTs appear to be well designed and well implemented. Differences in populations, interventions, controls, and outcome measures may also result in study results being different; however, examination of these two studies shows no obvious reasons for their results to differ because of these factors. It remains to be seen whether the way in which albuterol was used in reference to hypertonic saline has an effect on the outcome.
Evaluating the efficacy of hypertonic saline in the treatment of bronchiolitis is not an easy task. Evidently, it is difficult to base treatment decisions on the result of a single study. The summary of a systematic review from 2013 in the Cochrane Database is that there is probably not a role for hypertonic saline for patients with bronchiolitis treated in the emergency department, but it may be helpful for inpatients by decreasing their length of hospital stay by 1.15 days.
These two trials point us to the importance of using scientifically developed systematic reviews and meta-analyses to get the best sense of optimal treatment for children. From our read of the current systematic review (which now will need to be updated) and our read of these two individual trials, we would not start using hypertonic saline in the emergency department on a routine basis. However, nebulized hypertonic saline may have a role to play for children hospitalized with bronchiolitis.
Dr. Sim Grewal is in the division of pediatric emergency medicine at the University of Alberta in Edmonton. Dr. Terry P. Klassen is part of Translating Emergency Knowledge for Kids at the Manitoba Institute of Child Health, and is in the department of pediatrics at the University of Manitoba, both in Winnipeg. Neither physician reported any relevant financial disclosures. These comments have been adapted from an editorial accompanying the studies in JAMA Pediatrics (JAMA Pediatr. 2014 26 May [doi: 10.1001/jamapediatrics.2014.423]).
The therapeutic value of hypertonic saline in treating bronchiolitis in young children remains unclear, based on the findings of two randomized controlled trials with conflicting results.
While one found no significant improvements in outcomes between hypertonic and normal saline, the other found a lower risk of hospitalization in children receiving hypertonic saline.
"Based on the results of this and other studies, the administration of a single dose of 3% hypertonic saline in the acute care setting does not appear to be more effective than normal saline in improving short-term respiratory distress in bronchiolitis," reported Dr. Todd Florin of Cincinnati Children’s Hospital Medical Center and his associates in the first study (JAMA Pediatr. 2014 May 26 [doi: 10.1001/jamapediatrics.2013.5306]).
Dr. Florin’s team equally randomized 62 children under age 24 months to receive 4 mL of either 3% hypertonic saline or normal saline within 90 minutes after receiving standard therapy for bronchiolitis, which included nasal suctioning and a single dose of nebulized albuterol. The children had all presented to the emergency department of Children’s Hospital of Philadelphia during one of two consecutive bronchiolitis seasons, from November to April in 2010 and 2011.
All children were assessed using the Respiratory Distress Assessment Instrument (RDAI) 1 hour after treatment and then 2 hours after treatment for those being discharged or still in the ED at that time. Based on the Respiratory Assessment Change Score (RACS) – which uses the RDAI score and a standardized change in respiratory rate to assess respiratory status changes – the normal saline group showed clinically significant improvement (a RACS of –3) after an hour, whereas the hypertonic saline group did not.
There was no significant difference in the median RDAI scores, heart rate, oxygen saturation, hospitalization rate, or child’s breathing or feeding status (based on parental perception) between the two groups.
Yet the hospitalization rate was lower in the hypertonic saline group of the other study, which used similar protocols in a larger population, reported Dr. Susan Wu of Children’s Hospital Los Angeles and her associates, also in JAMA Pediatrics (JAMA Pediatr. 2014 May 26 [doi: 10.1001/jamapediatrics.2014.301].
Their participants included 408 children under age 24 months presenting with bronchiolitis at two different children’s hospital EDs between March 2008 and April 2011. All patients received 2.5 mg of nebulized albuterol, after which 197 children received 4 mL of normal saline and 211 children received 4 mL of 3% hypertonic saline, each inhaled up to three times. Children admitted received their assigned saline (always premedicated with albuterol sulfate) every 8 hours until discharge.
While 42.6% of the normal saline patients were admitted to the hospital, only 28.9% of the hypertonic saline patients were admitted (P = .01), for an adjusted odds ratio of 0.49 and a number needed to treat of 8 to prevent one hospitalization. "Other statistically significant predictors of admission included site, male sex, patient weight, baseline respiratory rate, and baseline oxygen saturation," the authors reported.
Among those admitted, the length of stay was 3.16 days for the hypertonic saline participants and 3.92 days for the normal saline participants, but the difference was not significant (P = .24). No significant difference was found in the RDAI score, which decreased in both groups. The RACS was calculated using the same methods as in the Florin study for 366 cases, but no significant differences in the mean RACS scores existed between the two groups after adjustment for RDAI baseline scores.
Dr. Wu and her team recommended that future research "investigate the optimal dosing and administration regimen and the patient-level factors that may affect response to hypertonic saline."
The Florin et al. study was funded by an Academic Pediatric Association Young Investigator Award. The Wu et al. study was funded by the Thrasher Research Fund and the department of pediatrics, University of Southern California Keck School of Medicine, Los Angeles. The authors of both studies declared that they had no relevant financial disclosures.
FROM JAMA PEDIATRICS
Key clinical point: Hypertonic saline indications for bronchiolitis lack evidence for clear guidance.
Major finding: Compared with normal saline, administration of 3% hypertonic saline for bronchiolitis resulted in less improvement in the median RDAI score and no significant differences in heart rate, oxygen saturation, hospitalization rate, or other outcomes an hour after intervention in one study (Florin et al.). Another study showed a lower hospital admission rate for those receiving 3% hypertonic saline (28.9%, vs. 42.6% for normal saline; P = .01; adjusted odds ratio, 0.49) and no significant differences in RDAI score (Wu et al.).
Data source: The findings are based on two randomized controlled studies, one (Florin et al.) involving 62 children under age 24 months during November to April of 2010 and 2011, and another (Wu et al.) involving 408 children under age 24 months presenting at two emergency departments between March 2008 and April 2011.
Disclosures: The Florin et al. study was funded by an Academic Pediatric Association Young Investigator Award. The Wu et al. study was funded by the Thrasher Research Fund and the department of pediatrics, University of Southern California Keck School of Medicine, Los Angeles. The authors of both studies declared that they had no relevant financial disclosures.
Abnormal cortisol levels reveal clues in children at risk for psychosis
Abnormalities in the functioning of the hypothalamic-pituitary-adrenal axis might offer insight into understanding psychosis in schizophrenia, a recent study shows.
As "the primary system involved in coordinating the physiological response to stress," the HPA axis might interact with psychosocial stress "to trigger psychosis onset among individuals with an underlying vulnerability for the disorder," based on findings of abnormal cortisol levels in at-risk children, Alexis E. Cullen and her associates at King’s College London reported.
Their findings rely on abnormal daytime cortisol levels and correlations between cortisol levels and psychosocial stress and/or neurocognitive performance in children with a family history of schizophrenia and/or antecedents of schizophrenia (Psychoneuroendocrinology 2014;46:1-13 [dx.doi.org/10.1016/j.psyneuen.2014.03.010]).
The authors screened more than 1,300 children to identify 33 willing participants exhibiting all three antecedents of schizophrenia: a speech and/or motor delay or abnormality; a social, emotional, and/or behavioral problem; and a psychoticlike experience. Then they recruited 22 children with a first- or second-degree relative with schizophrenia, including 4 in the antecedents group. The comparison group included 40 typically developing children with no first-, second-, or third-degree relatives with a schizophrenia spectrum disorder and no antecedents.
About 33 months after identifying the participants, the children, aged 11-14, collected six saliva samples each day over 2 consecutive days, four in the hour after waking up, one at noon and one at 8 p.m. They also completed two psychosocial assessments – one on negative life events and one on school-related daily hassles – and memory and executive function assessments.
The researchers used Area Under the Curve calculations to compare cortisol levels in the hour after waking up (AUCi-CAR) and throughout the day (AUCg-DAY). The family history participants had significantly lower AUCi-CAR values (mean -33.8 nmol min/L) than the typically developing participants (mean 121.6 nmol min/L; standardized mean difference (d) = -.73; P = .01), but the antecedents of schizophrenia participants (mean 81.2 nmol min/L) were not significantly different from typically developing participants (d = -.19; P = .42). AUCg-DAY values were not significantly different between typically developing participants and either family history participants or antecedents of schizophrenia participants.
Both family history and antecedents of schizophrenia participants experienced more negative life events than the control participants, and the children with antecedents of schizophrenia experienced more daily hassles and subsequent distress than the controls. AUCi-CAR values for family history children were positively correlated with current and past distress relating to negative life events; those values were negatively correlated with distress at the time of past negative life events among typically developing children.
Both family history and antecedents of schizophrenia participants performed more poorly on neurocognitive tests than the typically developing participants. AUCi-CAR values had some positive correlations with subtests among family history and among antecedents participants, and AUCg-DAY values had negative correlations with subtests among family history participants.
Ms. Cullen and her associates said their study was limited by the small number of participant groups. "However, the non–help-seeking nature of this group may be considered a potential strength of the study, as it reduces the possibility that any HPA axis abnormalities are merely due to distress associated with emerging illness," they wrote.
The study was supported by the National Institute for Health Research, the Bial Foundation, a NARSAD Young Investigator Award, the British Medical Association, the Waterloo Foundation, and the Medical Research Council. No disclosures were reported.
FROM PSYCHONEURO- ENDOCRINOLOGY
Key clinical point: A strategy for reducing the risk of psychosis early is to target patients’ hypothalamic-pituitary-adrenal axis function.
Major finding: Children with a family history of schizophrenia had significantly lower cortisol levels in the hour after waking up (mean -33.8 nmol min/L) than typically developing participants (mean 121.6 nmol min/L; d = -.73; P = .01). .
Data source: Findings are based on an analysis of morning and daytime cortisol levels, and psychosocial and neurocognitive assessments of 40 typically developing children, 22 children with a family history of schizophrenia and 33 children presenting with multiple antecedents of schizophrenia, all aged 11 to 14.
Disclosures: The study was supported by the National Institute for Health Research, the Bial Foundation, a NARSAD Young Investigator Award, the British Medical Association, the Waterloo Foundation and the Medical Research Council. No disclosures were reported.
Infant Hepatitis B Vaccine Administration Provides Long-lasting Protection
Earn 0.25 hours AMA PRA Category 1 credit: Read this article, and click the link at the end to take the posttest.
Protection conferred by the hepatitis B vaccine administered in infancy continues through late adolescence, a study showed.
The low prevalence of hepatitis B in the United States and the participants’ seroprotective response to a challenge dose of hepatitis B vaccine suggest "the addition of a booster dose of hepatitis B vaccine to the routine immunization schedule for adolescents appears unnecessary," Dr. Amy Middleman of the University of Oklahoma Health Sciences Center, Oklahoma City, and her associates reported online (Pediatrics 2014;133:e1500-7).

Antibody levels of hepatitis B surface antigen (anti-HBs) of at least 10 IU/mL are considered sufficient seroprotection. Baseline anti-HBs and anti-HB core antigen (anti-HBc) were obtained from 420 adolescents aged 16-19 years, recruited in Houston between April 2010 and December 2011. All participants had received exactly 3 doses of the hepatitis B vaccine before 1 year. Those receiving it within 7 days of birth were group 1, and those receiving it at or after 4 weeks were group 2.
Participants were randomized to receive a 10-mcg or 20-mcg challenge dose of Engerix-B hepatitis B vaccine. Blood draws to determine postchallenge dose quantitative anti-HBs titer were performed 13-15 days after enrollment. Most participants (76%) had less than 10 IU/mL anti-HBs at baseline, and 92% had seroprotective levels after the challenge dose, regardless of whether they were group 1 or 2 or received the 10-mcg or 20-mcg doses.
"Importantly, immune memory remained intact for most subjects, despite evidence elsewhere that the infant immune system has a diminished capacity to mount a robust response to the primary vaccination series," the authors reported.
Geometric mean titers following the challenge dose were higher in group 2 (1,745.77) than in group 1 (487.84) and among those receiving 20 mcg (1,314.67) than among those receiving the 10-mcg (537.65) dosage. Higher baseline anti-HBs titer and being nonwhite were associated with higher geometric mean titers. Marijuana smokers receiving the higher challenge dose had a blunted response. No participants were anti-HBc positive, and no adverse events were reported following the challenge dose. The hepatitis B vaccine between 1991 and 1998 was 2.5 mcg per dose, but is now 5 mcg or 10 mcg.
The study was supported by the Centers for Disease Control and Prevention. Dr. Middleman’s institution receives Novartis grant funds. Dr. Baker has served on an advisory board for Pfizer and has consulted for and served on an advisory board for Novartis Vaccines.
To earn 0.25 hours AMA PRA Category 1 credit after reading this article, take the post-test here.
Earn 0.25 hours AMA PRA Category 1 credit: Read this article, and click the link at the end to take the posttest.
Protection conferred by the hepatitis B vaccine administered in infancy continues through late adolescence, a study showed.
The low prevalence of hepatitis B in the United States and the participants’ seroprotective response to a challenge dose of hepatitis B vaccine suggest "the addition of a booster dose of hepatitis B vaccine to the routine immunization schedule for adolescents appears unnecessary," Dr. Amy Middleman of the University of Oklahoma Health Sciences Center, Oklahoma City, and her associates reported online (Pediatrics 2014;133:e1500-7).
Antibody levels of hepatitis B surface antigen (anti-HBs) of at least 10 IU/mL are considered sufficient seroprotection. Baseline anti-HBs and anti-HB core antigen (anti-HBc) were obtained from 420 adolescents aged 16-19 years, recruited in Houston between April 2010 and December 2011. All participants had received exactly 3 doses of the hepatitis B vaccine before 1 year. Those receiving it within 7 days of birth were group 1, and those receiving it at or after 4 weeks were group 2.
Participants were randomized to receive a 10-mcg or 20-mcg challenge dose of Engerix-B hepatitis B vaccine. Blood draws to determine postchallenge dose quantitative anti-HBs titer were performed 13-15 days after enrollment. Most participants (76%) had less than 10 IU/mL anti-HBs at baseline, and 92% had seroprotective levels after the challenge dose, regardless of whether they were group 1 or 2 or received the 10-mcg or 20-mcg doses.
"Importantly, immune memory remained intact for most subjects, despite evidence elsewhere that the infant immune system has a diminished capacity to mount a robust response to the primary vaccination series," the authors reported.
Geometric mean titers following the challenge dose were higher in group 2 (1,745.77) than in group 1 (487.84) and among those receiving 20 mcg (1,314.67) than among those receiving the 10-mcg (537.65) dosage. Higher baseline anti-HBs titer and being nonwhite were associated with higher geometric mean titers. Marijuana smokers receiving the higher challenge dose had a blunted response. No participants were anti-HBc positive, and no adverse events were reported following the challenge dose. The hepatitis B vaccine between 1991 and 1998 was 2.5 mcg per dose, but is now 5 mcg or 10 mcg.
The study was supported by the Centers for Disease Control and Prevention. Dr. Middleman’s institution receives Novartis grant funds. Dr. Baker has served on an advisory board for Pfizer and has consulted for and served on an advisory board for Novartis Vaccines.
To earn 0.25 hours AMA PRA Category 1 credit after reading this article, take the post-test here.
FROM PEDIATRICS
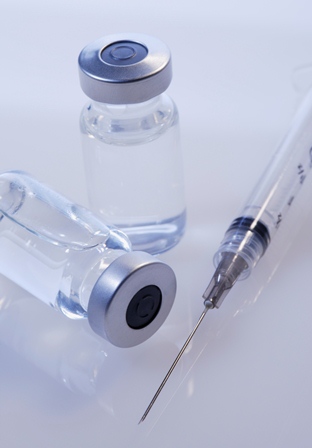
Infant hepatitis B vaccine administration provides long-lasting protection
Protection conferred by the hepatitis B vaccine administered in infancy continues through late adolescence, a study showed.
The low prevalence of hepatitis B in the United States and the participants’ seroprotective response to a challenge dose of hepatitis B vaccine suggest "the addition of a booster dose of hepatitis B vaccine to the routine immunization schedule for adolescents appears unnecessary," Dr. Amy Middleman of the University of Oklahoma Health Sciences Center, Oklahoma City, and her associates reported online (Pediatrics 2014;133:e1500-7).
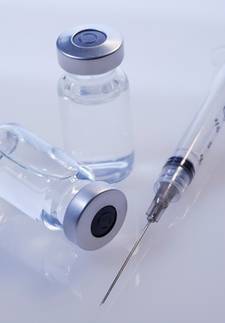
Antibody levels of hepatitis B surface antigen (anti-HBs) of at least 10 IU/mL are considered sufficient seroprotection. Baseline anti-HBs and anti-HB core antigen (anti-HBc) were obtained from 420 adolescents aged 16-19 years, recruited in Houston between April 2010 and December 2011. All participants had received exactly 3 doses of the hepatitis B vaccine before 1 year. Those receiving it within 7 days of birth were group 1, and those receiving it at or after 4 weeks were group 2.
Participants were randomized to receive a 10-mcg or 20-mcg challenge dose of Engerix-B hepatitis B vaccine. Blood draws to determine postchallenge dose quantitative anti-HBs titer were performed 13-15 days after enrollment. Most participants (76%) had less than 10 IU/mL anti-HBs at baseline, and 92% had seroprotective levels after the challenge dose, regardless of whether they were group 1 or 2 or received the 10-mcg or 20-mcg doses.
"Importantly, immune memory remained intact for most subjects, despite evidence elsewhere that the infant immune system has a diminished capacity to mount a robust response to the primary vaccination series," the authors reported.
Geometric mean titers following the challenge dose were higher in group 2 (1,745.77) than in group 1 (487.84) and among those receiving 20 mcg (1,314.67) than among those receiving the 10-mcg (537.65) dosage. Higher baseline anti-HBs titer and being nonwhite were associated with higher geometric mean titers. Marijuana smokers receiving the higher challenge dose had a blunted response. No participants were anti-HBc positive, and no adverse events were reported following the challenge dose. The hepatitis B vaccine between 1991 and 1998 was 2.5 mcg per dose, but is now 5 mcg or 10 mcg.
The study was supported by the Centers for Disease Control and Prevention. Dr. Middleman’s institution receives Novartis grant funds. Dr. Baker has served on an advisory board for Pfizer and has consulted for and served on an advisory board for Novartis Vaccines.
Protection conferred by the hepatitis B vaccine administered in infancy continues through late adolescence, a study showed.
The low prevalence of hepatitis B in the United States and the participants’ seroprotective response to a challenge dose of hepatitis B vaccine suggest "the addition of a booster dose of hepatitis B vaccine to the routine immunization schedule for adolescents appears unnecessary," Dr. Amy Middleman of the University of Oklahoma Health Sciences Center, Oklahoma City, and her associates reported online (Pediatrics 2014;133:e1500-7).
Antibody levels of hepatitis B surface antigen (anti-HBs) of at least 10 IU/mL are considered sufficient seroprotection. Baseline anti-HBs and anti-HB core antigen (anti-HBc) were obtained from 420 adolescents aged 16-19 years, recruited in Houston between April 2010 and December 2011. All participants had received exactly 3 doses of the hepatitis B vaccine before 1 year. Those receiving it within 7 days of birth were group 1, and those receiving it at or after 4 weeks were group 2.
Participants were randomized to receive a 10-mcg or 20-mcg challenge dose of Engerix-B hepatitis B vaccine. Blood draws to determine postchallenge dose quantitative anti-HBs titer were performed 13-15 days after enrollment. Most participants (76%) had less than 10 IU/mL anti-HBs at baseline, and 92% had seroprotective levels after the challenge dose, regardless of whether they were group 1 or 2 or received the 10-mcg or 20-mcg doses.
"Importantly, immune memory remained intact for most subjects, despite evidence elsewhere that the infant immune system has a diminished capacity to mount a robust response to the primary vaccination series," the authors reported.
Geometric mean titers following the challenge dose were higher in group 2 (1,745.77) than in group 1 (487.84) and among those receiving 20 mcg (1,314.67) than among those receiving the 10-mcg (537.65) dosage. Higher baseline anti-HBs titer and being nonwhite were associated with higher geometric mean titers. Marijuana smokers receiving the higher challenge dose had a blunted response. No participants were anti-HBc positive, and no adverse events were reported following the challenge dose. The hepatitis B vaccine between 1991 and 1998 was 2.5 mcg per dose, but is now 5 mcg or 10 mcg.
The study was supported by the Centers for Disease Control and Prevention. Dr. Middleman’s institution receives Novartis grant funds. Dr. Baker has served on an advisory board for Pfizer and has consulted for and served on an advisory board for Novartis Vaccines.
FROM PEDIATRICS
Key clinical point: The addition of a booster dose of hepatitis B vaccine to the routine immunization schedule for adolescents appears unnecessary.
Major finding: Among teens who had received the complete hepatitis B vaccine series in infancy, 92% achieved seroprotection – antibody levels of hepatitis B surface antigen of at least 10 IU/mL – in response to a hepatitis B vaccine challenge dose.
Data source: The findings are based on a randomized trial in which 420 adolescents, aged 16-19 years, who received the complete 3-dose hepatitis B vaccine series before 1 year old, were challenged with a hepatitis B vaccine dose of 10 mcg or 20 mcg to test seroprotective antibody levels.
Disclosures: The study was supported by the U.S. Centers for Disease Control and Prevention. Dr. Middleman’s institution receives Novartis grant funds. Dr. Baker has served on an advisory board for Pfizer and has consulted for and served on an advisory board for Novartis Vaccines.

Rotavirus vaccination in NICU may pose little risk
Rotavirus vaccine can be safely administered to infants in neonatal intensive care units before discharge without putting nearby unvaccinated infants at risk, a study showed.
Vaccinated infants did not experience any symptoms attributable to the vaccine, and no unvaccinated infants in the same NICU pods as the vaccinated infants contracted rotavirus in the 2 weeks after vaccination, reported Heather Monk and her associates at Children’s Hospital of Philadelphia (CHOP) (Pediatrics 2014 May 19 [doi:10.1542/peds.2013-3504]).
Many infants hospitalized in the NICU are preterm patients who remain there past 104 days, the age by which the first rotavirus vaccine dose should be administered, and are at higher risk for rotavirus after discharge. Yet hospitals may not administer rotavirus vaccines in the NICU because of concerns about shedding from the live virus vaccine causing infection in nearby unvaccinated infants.
CHOP vaccinates age-eligible NICU patients with rotavirus and identified 96 infants who received the vaccine between Sept. 1, 2008, and Sept. 30, 2010. Their records were investigated for fever higher than 38 C, diarrhea or increased stool frequency, vomiting, abdominal distention, hematochezia, feeding intolerance, or intussusception in the week after vaccination. Overall, 25% of the infants had no symptoms after vaccination, 51% had symptoms consistent with those at baseline, and 24% had new symptoms determined to be unrelated to the vaccine.
Meanwhile, 801 unvaccinated infants were in the same NICU "pods" as the vaccinated infants, with beds anywhere from 9 to 32 feet away from the vaccinated infants’ beds. In the 15 days after vaccination – the time during which shedding was documented in rotavirus clinical trials – 6.3% of unvaccinated infants had abdominal imaging, were ordered for bowel rest, or received intravenous antibiotics. However, most (78%) of these were due to preexisting conditions, and the 1.2% who had new symptoms did not have rotavirus; the symptoms in the latter cases were likely due to concomitant medical conditions that developed.
The study did not use external funding. RotaTeq was developed at CHOP, but the vaccine patent has been sold. The authors had no relevant financial conflicts of interest.
FROM PEDIATRICS
Key clinical point: RotaTeq rotavirus vaccine appears safe to administer to neonates in the NICU, without a risk to unvaccinated neonates nearby.
Major finding: Of 96 infants receiving the RotaTeq rotavirus vaccine in the NICU, 76% had no new symptoms afterward and 24% had symptoms unrelated to vaccination; no unvaccinated infants in the NICU caught rotavirus.
Data source: A retrospective study of 96 infants who received the rotavirus vaccine in the Children’s Hospital of Philadelphia NICU between 2008 and 2010 and 801 unvaccinated infants in the same NICU pods.
Disclosures: RotaTeq was developed at Children’s Hospital of Philadelphia, but the vaccine patent has been sold. The authors had no relevant financial conflicts of interest.