An 87-year-old woman was brought to the intensive care unit with worsening shortness of breath on exertion, fatigue, orthopnea, paroxysmal nocturnal dyspnea, lower extremity swelling, subjective fever, productive cough, and rhinorrhea over the last week. She reported no chest pain, lightheadedness, or palpitations. Her medical history included the following:
Cardiac arrest with recurrent ventricular tachycardia requiring an implanted cardioverter-defibrillator and amiodarone therapy
Hypothyroidism requiring levothyroxine
Asthma with a moderate obstructive pattern: forced expiratory volume in 1 second (FEV1) 60% of predicted, forced vital capacity (FVC) 2.06 L, FEV1/FVC 54%, diffusing capacity for carbon monoxide (DLCO) 72% of predicted with positive bronchodilator response
Long-standing essential thrombocythemia treated with hydroxyurea.
Before admission, she had been reliably taking guideline-directed heart failure therapy as well as amiodarone for her recurrent ventricular tachycardia. Her levothyroxine had recently been increased as well.
Physical examination. On admission, her blood pressure was 95/53 mm Hg, heart rate 73 beats per minute, temperature 36.7ºC (98.1ºF), and oxygen saturation 81% requiring supplemental oxygen 15 L/min by nonrebreather face mask. Physical examination revealed elevated jugular venous pressure, bibasilar crackles, lower extremity edema, and a grade 3 of 6 holosystolic murmur both at the left sternal border and at the apex radiating to the axilla. There was no evidence of wheezing or pulsus paradoxus.
Electrocardiography showed sinus rhythm and an old left bundle branch block.
Chest radiography showed cardiomegaly, bilateral pleural effusions, and pulmonary edema.
WHAT IS THE CAUSE OF HER SYMPTOMS?
1. Based on the available information, which of the following is the most likely cause of this patient’s clinical presentation?
Acute decompensated heart failure
Pulmonary embolism
Exacerbation of asthma
Exacerbation of chronic obstructive pulmonary disease (COPD)
Heart failure is a clinical diagnosis based on careful history-taking and physical examination. Major criteria include paroxysmal nocturnal dyspnea, orthopnea, elevated jugular venous pressure, pulmonary crackles, a third heart sound, cardiomegaly, pulmonary edema, and weight loss of more than 4.5 kg with diuretic therapy.1 N-terminal pro-B-type natriuretic peptide (NT-proBNP) is also an effective marker of acute decompensated heart failure in the proper clinical setting.2
Our patient’s elevated jugular venous pressure, bibasilar crackles, lower extremity edema, chest radiography findings consistent with pulmonary edema, markedly elevated NT-proBNP, history of orthopnea, paroxysmal nocturnal dyspnea, and dyspnea on exertion were most consistent with acute decompensated heart failure. Her cough and subjective fevers were thought to be due to an upper respiratory tract viral infection.
Pulmonary embolism causes pleuritic chest pain, dyspnea, and, occasionally, elevated troponin. The most common feature on electrocardiography is sinus tachycardia; nonspecific ST-segment and T-wave changes may also be seen.3
Although pulmonary embolism remained in the differential diagnosis, our patient’s lack of typical features of pulmonary embolism made this less likely.
Asthma is characterized by recurrent airflow obstruction and bronchial hyperresponsiveness.4 Asthma exacerbations present with wheezing, tachypnea, tachycardia, and pulsus paradoxus.5
Despite her previous asthma diagnosis, our patient’s lack of typical features of asthma exacerbation made this diagnosis unlikely.
COPD exacerbations present with increased dyspnea, cough, sputum production, wheezing, lung resonance to percussion, and distant heart sounds, and are characterized by airflow obstruction.6,7
Although our patient presented with cough and dyspnea, she had no history of COPD and her other signs and symptoms (elevated jugular venous pressure, elevated NT-proBNP, and peripheral edema) could not be explained by COPD exacerbation.
OUR PATIENT UNDERWENT FURTHER TESTING
Echocardiography revealed severe left ventricular enlargement, an ejection fraction of 20% (which was near her baseline value), diffuse regional wall-motion abnormalities, severe mitral regurgitation, and moderate tricuspid regurgitation consistent with an exacerbation of heart failure.
We considered the possibility that her heart failure symptoms might be due to precipitous up-titration of her levothyroxine dose, given her borderline-elevated free thyroxine (T4) and increase in cardiac index (currently 4.45 L/min/m2, previously 2.20 L/min/m2 by the left ventricular outflow tract velocity time integral method). However, given her reduced ejection fraction, this clinical presentation most likely represented an acute exacerbation of her chronic heart failure. Her subjective fevers were thought to be due to a viral infection of the upper respiratory tract. The macrocytic anemia and thrombocytopenia were thought to be a side effect of her long-standing treatment with hydroxyurea for essential thrombocythemia, although amiodarone has also been associated with cytopenia.8
Treatment was started with intravenous diuretics and positive pressure ventilation with oxygen supplementation. Her levothyroxine dose was reduced, and her hydroxyurea was stopped.
Figure 1. Chest computed tomography axial views demonstrated increased attenuation in the liver (A, arrow) and left pleural base (B, arrow). Evaluation of the right lung base revealed ground-glass opacities (C, arrow) and honeycombing (D, arrow). These findings were consistent with amiodarone pulmonary toxicity.After aggressive diuresis, our patient returned to euvolemia. However, she had persistent fine crackles and hypoxia. She had no further fever, and her vital signs were otherwise stable. Her cytopenia improved with cessation of hydroxyurea. Chest computed tomography (CT) showed bibasilar ground-glass infiltrates with areas of interstitial fibrosis, high-attenuation pleural lesions, and increased liver attenuation (Figure 1).
Further testing for connective tissue disease and hypersensitivity pneumonitis was also done, and the results were negative. To exclude an atypical infection, bronchoalveolar lavage was performed; preliminary microbial testing was negative, and the white blood cell count in the lavage fluid was 90% macrophages (pigment-laden), 7% neutrophils, and 3% lymphocytes.
WHAT IS THE CAUSE OF HER PERSISTENT PULMONARY FINDINGS?
2. Given the CT findings and laboratory results, what is the most likely cause of our patient’s persistent crackles and hypoxia?
Heart failure with reduced ejection fraction
Bacterial pneumonia
Idiopathic pulmonary fibrosis
Amiodarone pulmonary toxicity
Heart failure with reduced ejection fraction can cause ground-glass opacities on CT due to increased pulmonary edema. Although our patient initially presented with acute decompensation of heart failure with reduced ejection fraction decompensation, she had returned to euvolemia after aggressive diuresis. Moreover, increased pleural and liver attenuation are not typically seen as a result of heart failure with reduced ejection fraction, making this diagnosis less likely.
Bacterial pneumonia typically presents with cough, fever, and purulent sputum production.9 Further evaluation usually reveals decreased breath sounds, dullness to percussion, and leukocytosis.10 Chest CT in bacterial pneumonia commonly shows a focal area of consolidation, which was not seen in our patient.11
Idiopathic pulmonary fibrosis usually presents with slowly progressive dyspnea and nonproductive cough.12 Physical examination usually reveals fine crackles and occasionally end-inspiratory “squeaks” if traction bronchiectasis is present.12 The diagnosis of idiopathic pulmonary fibrosis requires chest CT findings compatible with it (ie, basal fibrosis, reticular abnormalities, and honeycombing). However, it remains a diagnosis of exclusion and requires ruling out conditions known to cause pulmonary fibrosis such as hypersensitivity pneumonitis, connective tissue disease, and certain medications.12
Although idiopathic pulmonary fibrosis remained in the differential diagnosis, our patient remained on amiodarone, a known cause of pulmonary fibrosis.13 Similarly, the high-attenuation pleural lesions likely represented organizing pneumonia, which is more common in amiodarone pulmonary toxicity. And the ground-glass opacities made idiopathic pulmonary fibrosis unlikely, although they may be seen in an acute exacerbation of this disease.14 Thus, a diagnosis of idiopathic pulmonary fibrosis could not be made definitively.
Amiodarone pulmonary toxicity most commonly presents with acute to subacute cough and progressive dyspnea.13 Physical findings are similar to those in idiopathic pulmonary fibrosis and commonly include bibasilar crackles. Chest CT shows diffuse ground-glass opacities, reticular abnormalities, fibrosis, and increased attenuation of multiple organs, including the lungs, liver, and spleen.14 Bronchoalveolar lavage findings of lipid-laden macrophages suggest but do not definitively diagnose amiodarone pulmonary toxicity.15 And patients with acute amiodarone pulmonary toxicity may present with pigment-laden macrophages on bronchoalveolar lavage, as in our patient.16
Exclusion of hypersensitivity pneumonitis, connective tissue disease, and infection made our patient’s progressive dyspnea and chest CT findings of ground-glass opacities, fibrosis, and increased pulmonary and liver attenuation most consistent with amiodarone pulmonary toxicity.
Amiodarone was therefore discontinued. However, the test result of her lavage fluid for influenza A by polymerase chain reaction came back positive a few hours later.
WHAT IS THE NEXT STEP?
3. Given the positive influenza A polymerase chain reaction test, which of the following is the best next step in this patient’s management?
Surgical lung biopsy
Stop amiodarone and start supportive influenza management
Stop amiodarone and start dronedarone
Start an intravenous corticosteroid
Surgical lung biopsy is typically not required for diagnosis in patients with suspected amiodarone pulmonary toxicity. In addition, acute respiratory distress syndrome has been documented in patients who have undergone surgical biopsy for suspected amiodarone pulmonary toxicity.17
Thus, surgical biopsy is typically only done in cases of persistent symptoms despite withdrawal of amiodarone and initiation of steroid therapy.
Stopping amiodarone and starting supportive influenza management are the best next steps, as our patient’s fevers, cough, dyspnea, and laboratory test results were consistent with influenza.18 Moreover, CT findings of ground-glass opacities and reticular abnormalities can be seen in influenza.19
However, concomitant amiodarone pulmonary toxicity could not be ruled out, as CT showed increased lung and liver attenuation and fibrosis that could not be explained by influenza. And the elevation in aminotransferase levels more than 2 times the upper limit of normal and CT findings of increased liver attenuation suggested amiodarone hepatotoxicity. However, definitive diagnosis would require exclusion of other causes such as congestive hepatopathy, in some cases with liver biopsy.13
Our patient’s persistent hypoxia was thought to be due in part to influenza, and thus the best next step in management was to stop amiodarone and provide supportive care for influenza.
Dronedarone is an antiarrhythmic drug structurally and functionally similar to amiodarone. There are far fewer reports of pulmonary toxicity with dronedarone than with amiodarone.20 However, lack of data on dronedarone in amiodarone pulmonary toxicity, increased rates of hospitalization and death associated with dronedarone in patients like ours with advanced heart failure, and our patient’s previously implanted cardioverter-defibrillator for recurrent ventricular tachycardia all made dronedarone an undesirable alternative to amiodarone.21
Corticosteroids are useful in the treatment of amiodarone pulmonary toxicity when hypoxia and dyspnea are present at diagnosis.13 Our patient’s hypoxia and dyspnea were thought to be due in part to her acute influenza infection, and therefore corticosteroids were not used at the outset.
However, concomitant amiodarone pulmonary toxicity could not be excluded, and the elevation in aminotransferases of more than 2 times the upper limit of normal and CT findings of increased liver attenuation suggested amiodarone hepatotoxicity—though congestive hepatopathy remained in the differential diagnosis. Therefore, supportive therapy for influenza was instituted, and amiodarone was withheld. Her condition subsequently improved, and she was discharged.
FOLLOW-UP 1 MONTH LATER
At a follow-up visit 1 month later, our patient continued to have dyspnea and hypoxia. She did not have signs or symptoms consistent with decompensated heart failure.
Pulmonary function testing revealed the following values:
FEV1 0.69 L (56% of predicted)
FVC 1.08 L (64% of predicted)
Figure 2. In A, repeat chest computed tomography demonstrated increased liver attenuation (arrow); in B, it showed persistent ground-glass opacities (white arrow), increased pulmonary attenuation (black arrowhead), and worsening pleural effusions (black arrows). These findings supported the diagnosis of amiodarone pulmonary toxicity.FEV1/FVC ratio 64%
DLCO 2.20 mL/min/mm Hg (12% of predicted).
Aminotransferase levels had also normalized. Repeat chest CT showed persistent bibasilar interstitial fibrotic changes, enlarging bilateral pleural effusions, and persistent peripheral ground-glass opacities (Figure 2).
WHAT FURTHER TREATMENT IS APPROPRIATE?
4. Given the chest CT findings, which of the following is the most appropriate treatment strategy for this patient?
No further management, continue to hold amiodarone
Corticosteroids
Repeat bronchoalveolar lavage
Intravenous antibiotics
No further management of amiodarone pulmonary toxicity would be appropriate if our patient did not have a high burden of symptoms. However, when patients with amiodarone pulmonary toxicity present with hypoxia and dyspnea, corticosteroids should be started.13 Our patient remained symptomatic after discontinuation of amiodarone and resolution of her influenza infection, and CT showed persistent signs of amiodarone pulmonary toxicity, which required further management.
Corticosteroids are useful in treating amiodarone pulmonary toxicity when hypoxia and dyspnea are present at diagnosis. Our patient’s persistent ground-glass opacities, fibrotic changes, and increased attenuation in multiple organs on CT, coupled with a confirmed reduction in FVC of greater than 15% and reduction in DLCO of greater than 20% after recovery from influenza, were most consistent with persistent amiodarone pulmonary toxicity.13
Although our patient’s amiodarone had been discontinued, the long half-life of the drug (45 days) allowed pulmonary toxicity to progress even after the drug was discontinued.22 Because our patient continued to have hypoxia and dyspnea on exertion, the most appropriate next step in management (in addition to managing her pleural effusions) was to start corticosteroids.
For amiodarone pulmonary toxicity, prednisone is typically started at 40 to 60 mg daily and can result in rapid improvement in symptoms.13 Tapering should be slow and may take several months.
Bronchoalveolar lavage is typically used in suspected cases of amiodarone pulmonary toxicity only to rule out an alternative diagnosis such as infection. Lipid-laden macrophages may be seen in the fluid. However, lipid-laden macrophages are not diagnostic of amiodarone pulmonary toxicity, as this finding may also be seen in patients taking amiodarone who do not develop pulmonary toxicity.15 Other findings on bronchoalveolar lavage in amiodarone pulmonary toxicity are nonspecific and are not diagnostically useful.13
Intravenous antibiotics are appropriate if bacterial pneumonia is suspected. However, bacterial pneumonia typically presents with cough, fever, purulent sputum production, and focal consolidation on chest imaging.9 Our patient’s CT findings of persistent peripheral ground-glass opacities and lack of cough, fever, or purulent sputum production were not consistent with bacterial pneumonia, and therefore intravenous antibiotics were not indicated.
CASE CONCLUSION
Given our patient’s persistent dyspnea, hypoxia, and chest CT findings consistent with amiodarone pulmonary toxicity, it was recommended that she start corticosteroids. However, before starting therapy, she suffered a femoral fracture that required surgical intervention. Around the time of the procedure, she had an ST-segment elevation myocardial infarction requiring vasopressor support and mechanical ventilation. At that time, the patient and family decided to pursue comfort measures, and she died peacefully.
MORE ABOUT AMIODARONE PULMONARY TOXICITY
Pulmonary toxicity is a well-described consequence of amiodarone therapy.23 Amiodarone carries a 2% risk of pulmonary toxicity.24 Although higher doses are more likely to cause pulmonary toxicity, lower doses also have been implicated.22,24 Preexisting pulmonary disease may predispose patients taking amiodarone to pulmonary toxicity; however, this is not uniformly seen.25
Mortality rates as high as 10% from amiodarone pulmonary toxicity have been reported. Thus, diligent surveillance for pulmonary toxicity with pulmonary function tests in patients taking amiodarone is mandatory. In particular, a reduction in FVC of greater than 15% or in DLCO of greater than 20% from baseline may be seen in amiodarone pulmonary toxicity.26
Amiodarone pulmonary toxicity can present at any time after the start of therapy, but it occurs most often after 6 to 12 months.13 Patients typically experience insidious dyspnea; however, presentation with acute to subacute cough and progressive dyspnea can occur, especially with high concentrations of supplemental oxygen with or without mechanical ventilation.12,27 Findings on physical examination include bibasilar crackles. CT chest findings include diffuse ground-glass opacities, reticular abnormalities, fibrosis, and increased attenuation in multiple organs, including the lung, liver, and spleen.14
The diagnosis of amiodarone pulmonary toxicity requires ruling out hypersensitivity pneumonitis, connective tissue disease, heart failure, and infection. Surgical biopsy and bronchoalveolar lavage are not commonly used to establish the diagnosis of amiodarone pulmonary toxicity, as surgical biopsy increases the risk of acute respiratory distress syndrome, and the results of bronchoalveolar lavage are usually nonspecific.13,15
Initial treatment involves discontinuing the amiodarone once the diagnosis is suspected. If patients have worsening hypoxia or dyspnea at the time of diagnosis, corticosteroids can be used. Prednisone is typically started at 40 to 60 mg daily and can result in rapid improvement in symptoms.13 Tapering of corticosteroids should occur slowly and may take several months.
References
McKee PA, Castelli WP, McNamara PM, Kannel WB. The natural history of congestive heart failure: the Framingham study. N Engl J Med 1971; 285(26):1441–1446. doi:10.1056/NEJM197112232852601
Stein PD, Terrin ML, Hales CA, et al. Clinical, laboratory, roentgenographic, and electrocardiographic findings in patients with acute pulmonary embolism and no pre-existing cardiac or pulmonary disease. Chest 1991; 100(3):598–603. pmid:1909617
Baggish AL, Siebert U, Lainchbury JG, et al. A validated clinical and biochemical score for the diagnosis of acute heart failure: the ProBNP investigation of dyspnea in the emergency department (PRIDE) acute heart failure score. Am Heart J 2006; 151(1):48–54. doi:10.1016/j.ahj.2005.02.031
National Heart, Lung, and Blood Institute. National Asthma Education and Prevention Program. Expert panel report 3: Guidelines for the diagnosis and management of asthma. www.nhlbi.nih.gov/sites/default/files/media/docs/asthgdln_1.pdf. Accessed August 3, 2018.
Brenner BE, Abraham E, Simon RR. Position and diaphoresis in acute asthma. Am J Med 1983; 74(6):1005–1009. pmid:6407304
Badgett RG, Tanaka DJ, Hunt DK, et al. Can moderate chronic obstructive pulmonary disease be diagnosed by historical and physical findings alone? Am J Med 1993; 94(2):188–196. pmid:8430714
Erie AJ, McClure RF, Wolanskyj AP. Amiodarone-induced bone marrow granulomas: an unusual cause of reversible pancytopenia. Hematol Rep 2010; 2(1):e6. doi:10.4081/hr.2010.e6
Marrie TJ. Community-acquired pneumonia. Clin Infect Dis 1994; 18(4):501–513. pmid:8038304
Metlay JP, Kapoor WN, Fine MJ. Does this patient have community-acquired pneumonia? Diagnosing pneumonia by history and physical examination. JAMA 1997; 278(17):1440–1445. pmid:9356004
Walker CM, Abbott GF, Greene RE, Shepard JA, Vummidi D, Digumarthy SR. Imaging pulmonary infection: classic signs and patterns. AJR Am J Roentgenol 2014; 202(3):479–492. doi:10.2214/AJR.13.11463
Raghu G, Collard HR, Egan JJ, et al; ATS/ERS/JRS/ALAT Committee on Idiopathic Pulmonary Fibrosis. An official ATS/ERS/JRS/ALAT statement: idiopathic pulmonary fibrosis: evidence-based guidelines for diagnosis and management. Am J Respir Crit Care Med 2011; 183(6):788–824. doi:10.1164/rccm.2009-040GL
Goldschlager N, Epstein AE, Naccarelli GV, et al; Practice Guidelines Sub-committee, North American Society of Pacing and Electrophysiology (HRS). A practical guide for clinicians who treat patients with amiodarone: 2007. Heart Rhythm 2007; 4(9):1250–1259. doi:10.1016/j.hrthm.2007.07.020
Martin WJ 2nd, Rosenow EC 3rd. Amiodarone pulmonary toxicity: recognition and pathogenesis (Part I). Chest 1988; 93(5):1067–1075. pmid:3282816
Iskandar SB, Abi-Saleh B, Keith RL, Byrd RP Jr, Roy TM. Amiodarone-induced alveolar hemorrhage. South Med J 2006; 99(4):383–387.
Van Mieghem W, Coolen L, Malysse I, Lacquet LM, Deneffe GJ, Demedts MG. Amiodarone and the development of ARDS after lung surgery. Chest 1994; 105(6):1642–1645. pmid:8205854
Nicholson KG. Clinical features of influenza. Semin Respir Infect 1992; 7(1):26–37. pmid:1609165
Muller NL, Franquet T, Lee KS, Silva CIS. Viruses, mycoplasma, and chlamydia. In: Imaging of Pulmonary Infections. Philadelphia, PA: Lippincott Williams & Wilkins; 2007:94–114.
Stack S, Nguyen DV, Casto A, Ahuja N. Diffuse alveolar damage in a patient receiving dronedarone. Chest 2015; 147(4):e131–e133. doi:10.1378/chest.14-1849
De Ferrari GM, Dusi V. Drug safety evaluation of dronedarone in atrial fibrillation. Expert Opin Drug Saf 2012; 11(6):1023–1045. doi:10.1517/14740338.2012.722994
Okayasu K, Takeda Y, Kojima J, et al. Amiodarone pulmonary toxicity: a patient with three recurrences of pulmonary toxicity and consideration of the probable risk for relapse. Intern Med 2006; 45(22):1303–1307. pmid:17170505
Vorperian VR, Havighurst TC, Miller S, January CT. Adverse effects of low dose amiodarone: a meta-analysis. J Am Coll Cardiol 1997; 30(3):791–798. pmid:9283542
Amiodarone Trials Meta-Analysis Investigators. Effect of prophylactic amiodarone on mortality after acute myocardial infarction and in congestive heart failure: meta-analysis of individual data from 6500 patients in randomised trials. Lancet 1997; 350(9089):1417–1424. pmid:9371164
Olshansky B, Sami M, Rubin A, et al; NHLBI AFFIRM Investigators. Use of amiodarone for atrial fibrillation in patients with preexisting pulmonary disease in the AFFIRM study. Am J Cardiol 2005; 95(3):404–405. doi:10.1016/j.amjcard.2004.09.044
Camus P. Interstitial lung disease from drugs, biologics, and radiation. In: Schwartz MI, King TE Jr, eds. Interstitial Lung Disease. 5th ed. Shelton, CT: People’s Medical Publishing House; 2011:637–644.
Wolkove N, Baltzan M. Amiodarone pulmonary toxicity. Can Respir J 2009; 16(2):43–48. doi:10.1155/2009/282540
An 87-year-old woman was brought to the intensive care unit with worsening shortness of breath on exertion, fatigue, orthopnea, paroxysmal nocturnal dyspnea, lower extremity swelling, subjective fever, productive cough, and rhinorrhea over the last week. She reported no chest pain, lightheadedness, or palpitations. Her medical history included the following:
Cardiac arrest with recurrent ventricular tachycardia requiring an implanted cardioverter-defibrillator and amiodarone therapy
Hypothyroidism requiring levothyroxine
Asthma with a moderate obstructive pattern: forced expiratory volume in 1 second (FEV1) 60% of predicted, forced vital capacity (FVC) 2.06 L, FEV1/FVC 54%, diffusing capacity for carbon monoxide (DLCO) 72% of predicted with positive bronchodilator response
Long-standing essential thrombocythemia treated with hydroxyurea.
Before admission, she had been reliably taking guideline-directed heart failure therapy as well as amiodarone for her recurrent ventricular tachycardia. Her levothyroxine had recently been increased as well.
Physical examination. On admission, her blood pressure was 95/53 mm Hg, heart rate 73 beats per minute, temperature 36.7ºC (98.1ºF), and oxygen saturation 81% requiring supplemental oxygen 15 L/min by nonrebreather face mask. Physical examination revealed elevated jugular venous pressure, bibasilar crackles, lower extremity edema, and a grade 3 of 6 holosystolic murmur both at the left sternal border and at the apex radiating to the axilla. There was no evidence of wheezing or pulsus paradoxus.
Electrocardiography showed sinus rhythm and an old left bundle branch block.
Chest radiography showed cardiomegaly, bilateral pleural effusions, and pulmonary edema.
WHAT IS THE CAUSE OF HER SYMPTOMS?
1. Based on the available information, which of the following is the most likely cause of this patient’s clinical presentation?
Acute decompensated heart failure
Pulmonary embolism
Exacerbation of asthma
Exacerbation of chronic obstructive pulmonary disease (COPD)
Heart failure is a clinical diagnosis based on careful history-taking and physical examination. Major criteria include paroxysmal nocturnal dyspnea, orthopnea, elevated jugular venous pressure, pulmonary crackles, a third heart sound, cardiomegaly, pulmonary edema, and weight loss of more than 4.5 kg with diuretic therapy.1 N-terminal pro-B-type natriuretic peptide (NT-proBNP) is also an effective marker of acute decompensated heart failure in the proper clinical setting.2
Our patient’s elevated jugular venous pressure, bibasilar crackles, lower extremity edema, chest radiography findings consistent with pulmonary edema, markedly elevated NT-proBNP, history of orthopnea, paroxysmal nocturnal dyspnea, and dyspnea on exertion were most consistent with acute decompensated heart failure. Her cough and subjective fevers were thought to be due to an upper respiratory tract viral infection.
Pulmonary embolism causes pleuritic chest pain, dyspnea, and, occasionally, elevated troponin. The most common feature on electrocardiography is sinus tachycardia; nonspecific ST-segment and T-wave changes may also be seen.3
Although pulmonary embolism remained in the differential diagnosis, our patient’s lack of typical features of pulmonary embolism made this less likely.
Asthma is characterized by recurrent airflow obstruction and bronchial hyperresponsiveness.4 Asthma exacerbations present with wheezing, tachypnea, tachycardia, and pulsus paradoxus.5
Despite her previous asthma diagnosis, our patient’s lack of typical features of asthma exacerbation made this diagnosis unlikely.
COPD exacerbations present with increased dyspnea, cough, sputum production, wheezing, lung resonance to percussion, and distant heart sounds, and are characterized by airflow obstruction.6,7
Although our patient presented with cough and dyspnea, she had no history of COPD and her other signs and symptoms (elevated jugular venous pressure, elevated NT-proBNP, and peripheral edema) could not be explained by COPD exacerbation.
OUR PATIENT UNDERWENT FURTHER TESTING
Echocardiography revealed severe left ventricular enlargement, an ejection fraction of 20% (which was near her baseline value), diffuse regional wall-motion abnormalities, severe mitral regurgitation, and moderate tricuspid regurgitation consistent with an exacerbation of heart failure.
We considered the possibility that her heart failure symptoms might be due to precipitous up-titration of her levothyroxine dose, given her borderline-elevated free thyroxine (T4) and increase in cardiac index (currently 4.45 L/min/m2, previously 2.20 L/min/m2 by the left ventricular outflow tract velocity time integral method). However, given her reduced ejection fraction, this clinical presentation most likely represented an acute exacerbation of her chronic heart failure. Her subjective fevers were thought to be due to a viral infection of the upper respiratory tract. The macrocytic anemia and thrombocytopenia were thought to be a side effect of her long-standing treatment with hydroxyurea for essential thrombocythemia, although amiodarone has also been associated with cytopenia.8
Treatment was started with intravenous diuretics and positive pressure ventilation with oxygen supplementation. Her levothyroxine dose was reduced, and her hydroxyurea was stopped.
Figure 1. Chest computed tomography axial views demonstrated increased attenuation in the liver (A, arrow) and left pleural base (B, arrow). Evaluation of the right lung base revealed ground-glass opacities (C, arrow) and honeycombing (D, arrow). These findings were consistent with amiodarone pulmonary toxicity.After aggressive diuresis, our patient returned to euvolemia. However, she had persistent fine crackles and hypoxia. She had no further fever, and her vital signs were otherwise stable. Her cytopenia improved with cessation of hydroxyurea. Chest computed tomography (CT) showed bibasilar ground-glass infiltrates with areas of interstitial fibrosis, high-attenuation pleural lesions, and increased liver attenuation (Figure 1).
Further testing for connective tissue disease and hypersensitivity pneumonitis was also done, and the results were negative. To exclude an atypical infection, bronchoalveolar lavage was performed; preliminary microbial testing was negative, and the white blood cell count in the lavage fluid was 90% macrophages (pigment-laden), 7% neutrophils, and 3% lymphocytes.
WHAT IS THE CAUSE OF HER PERSISTENT PULMONARY FINDINGS?
2. Given the CT findings and laboratory results, what is the most likely cause of our patient’s persistent crackles and hypoxia?
Heart failure with reduced ejection fraction
Bacterial pneumonia
Idiopathic pulmonary fibrosis
Amiodarone pulmonary toxicity
Heart failure with reduced ejection fraction can cause ground-glass opacities on CT due to increased pulmonary edema. Although our patient initially presented with acute decompensation of heart failure with reduced ejection fraction decompensation, she had returned to euvolemia after aggressive diuresis. Moreover, increased pleural and liver attenuation are not typically seen as a result of heart failure with reduced ejection fraction, making this diagnosis less likely.
Bacterial pneumonia typically presents with cough, fever, and purulent sputum production.9 Further evaluation usually reveals decreased breath sounds, dullness to percussion, and leukocytosis.10 Chest CT in bacterial pneumonia commonly shows a focal area of consolidation, which was not seen in our patient.11
Idiopathic pulmonary fibrosis usually presents with slowly progressive dyspnea and nonproductive cough.12 Physical examination usually reveals fine crackles and occasionally end-inspiratory “squeaks” if traction bronchiectasis is present.12 The diagnosis of idiopathic pulmonary fibrosis requires chest CT findings compatible with it (ie, basal fibrosis, reticular abnormalities, and honeycombing). However, it remains a diagnosis of exclusion and requires ruling out conditions known to cause pulmonary fibrosis such as hypersensitivity pneumonitis, connective tissue disease, and certain medications.12
Although idiopathic pulmonary fibrosis remained in the differential diagnosis, our patient remained on amiodarone, a known cause of pulmonary fibrosis.13 Similarly, the high-attenuation pleural lesions likely represented organizing pneumonia, which is more common in amiodarone pulmonary toxicity. And the ground-glass opacities made idiopathic pulmonary fibrosis unlikely, although they may be seen in an acute exacerbation of this disease.14 Thus, a diagnosis of idiopathic pulmonary fibrosis could not be made definitively.
Amiodarone pulmonary toxicity most commonly presents with acute to subacute cough and progressive dyspnea.13 Physical findings are similar to those in idiopathic pulmonary fibrosis and commonly include bibasilar crackles. Chest CT shows diffuse ground-glass opacities, reticular abnormalities, fibrosis, and increased attenuation of multiple organs, including the lungs, liver, and spleen.14 Bronchoalveolar lavage findings of lipid-laden macrophages suggest but do not definitively diagnose amiodarone pulmonary toxicity.15 And patients with acute amiodarone pulmonary toxicity may present with pigment-laden macrophages on bronchoalveolar lavage, as in our patient.16
Exclusion of hypersensitivity pneumonitis, connective tissue disease, and infection made our patient’s progressive dyspnea and chest CT findings of ground-glass opacities, fibrosis, and increased pulmonary and liver attenuation most consistent with amiodarone pulmonary toxicity.
Amiodarone was therefore discontinued. However, the test result of her lavage fluid for influenza A by polymerase chain reaction came back positive a few hours later.
WHAT IS THE NEXT STEP?
3. Given the positive influenza A polymerase chain reaction test, which of the following is the best next step in this patient’s management?
Surgical lung biopsy
Stop amiodarone and start supportive influenza management
Stop amiodarone and start dronedarone
Start an intravenous corticosteroid
Surgical lung biopsy is typically not required for diagnosis in patients with suspected amiodarone pulmonary toxicity. In addition, acute respiratory distress syndrome has been documented in patients who have undergone surgical biopsy for suspected amiodarone pulmonary toxicity.17
Thus, surgical biopsy is typically only done in cases of persistent symptoms despite withdrawal of amiodarone and initiation of steroid therapy.
Stopping amiodarone and starting supportive influenza management are the best next steps, as our patient’s fevers, cough, dyspnea, and laboratory test results were consistent with influenza.18 Moreover, CT findings of ground-glass opacities and reticular abnormalities can be seen in influenza.19
However, concomitant amiodarone pulmonary toxicity could not be ruled out, as CT showed increased lung and liver attenuation and fibrosis that could not be explained by influenza. And the elevation in aminotransferase levels more than 2 times the upper limit of normal and CT findings of increased liver attenuation suggested amiodarone hepatotoxicity. However, definitive diagnosis would require exclusion of other causes such as congestive hepatopathy, in some cases with liver biopsy.13
Our patient’s persistent hypoxia was thought to be due in part to influenza, and thus the best next step in management was to stop amiodarone and provide supportive care for influenza.
Dronedarone is an antiarrhythmic drug structurally and functionally similar to amiodarone. There are far fewer reports of pulmonary toxicity with dronedarone than with amiodarone.20 However, lack of data on dronedarone in amiodarone pulmonary toxicity, increased rates of hospitalization and death associated with dronedarone in patients like ours with advanced heart failure, and our patient’s previously implanted cardioverter-defibrillator for recurrent ventricular tachycardia all made dronedarone an undesirable alternative to amiodarone.21
Corticosteroids are useful in the treatment of amiodarone pulmonary toxicity when hypoxia and dyspnea are present at diagnosis.13 Our patient’s hypoxia and dyspnea were thought to be due in part to her acute influenza infection, and therefore corticosteroids were not used at the outset.
However, concomitant amiodarone pulmonary toxicity could not be excluded, and the elevation in aminotransferases of more than 2 times the upper limit of normal and CT findings of increased liver attenuation suggested amiodarone hepatotoxicity—though congestive hepatopathy remained in the differential diagnosis. Therefore, supportive therapy for influenza was instituted, and amiodarone was withheld. Her condition subsequently improved, and she was discharged.
FOLLOW-UP 1 MONTH LATER
At a follow-up visit 1 month later, our patient continued to have dyspnea and hypoxia. She did not have signs or symptoms consistent with decompensated heart failure.
Pulmonary function testing revealed the following values:
FEV1 0.69 L (56% of predicted)
FVC 1.08 L (64% of predicted)
Figure 2. In A, repeat chest computed tomography demonstrated increased liver attenuation (arrow); in B, it showed persistent ground-glass opacities (white arrow), increased pulmonary attenuation (black arrowhead), and worsening pleural effusions (black arrows). These findings supported the diagnosis of amiodarone pulmonary toxicity.FEV1/FVC ratio 64%
DLCO 2.20 mL/min/mm Hg (12% of predicted).
Aminotransferase levels had also normalized. Repeat chest CT showed persistent bibasilar interstitial fibrotic changes, enlarging bilateral pleural effusions, and persistent peripheral ground-glass opacities (Figure 2).
WHAT FURTHER TREATMENT IS APPROPRIATE?
4. Given the chest CT findings, which of the following is the most appropriate treatment strategy for this patient?
No further management, continue to hold amiodarone
Corticosteroids
Repeat bronchoalveolar lavage
Intravenous antibiotics
No further management of amiodarone pulmonary toxicity would be appropriate if our patient did not have a high burden of symptoms. However, when patients with amiodarone pulmonary toxicity present with hypoxia and dyspnea, corticosteroids should be started.13 Our patient remained symptomatic after discontinuation of amiodarone and resolution of her influenza infection, and CT showed persistent signs of amiodarone pulmonary toxicity, which required further management.
Corticosteroids are useful in treating amiodarone pulmonary toxicity when hypoxia and dyspnea are present at diagnosis. Our patient’s persistent ground-glass opacities, fibrotic changes, and increased attenuation in multiple organs on CT, coupled with a confirmed reduction in FVC of greater than 15% and reduction in DLCO of greater than 20% after recovery from influenza, were most consistent with persistent amiodarone pulmonary toxicity.13
Although our patient’s amiodarone had been discontinued, the long half-life of the drug (45 days) allowed pulmonary toxicity to progress even after the drug was discontinued.22 Because our patient continued to have hypoxia and dyspnea on exertion, the most appropriate next step in management (in addition to managing her pleural effusions) was to start corticosteroids.
For amiodarone pulmonary toxicity, prednisone is typically started at 40 to 60 mg daily and can result in rapid improvement in symptoms.13 Tapering should be slow and may take several months.
Bronchoalveolar lavage is typically used in suspected cases of amiodarone pulmonary toxicity only to rule out an alternative diagnosis such as infection. Lipid-laden macrophages may be seen in the fluid. However, lipid-laden macrophages are not diagnostic of amiodarone pulmonary toxicity, as this finding may also be seen in patients taking amiodarone who do not develop pulmonary toxicity.15 Other findings on bronchoalveolar lavage in amiodarone pulmonary toxicity are nonspecific and are not diagnostically useful.13
Intravenous antibiotics are appropriate if bacterial pneumonia is suspected. However, bacterial pneumonia typically presents with cough, fever, purulent sputum production, and focal consolidation on chest imaging.9 Our patient’s CT findings of persistent peripheral ground-glass opacities and lack of cough, fever, or purulent sputum production were not consistent with bacterial pneumonia, and therefore intravenous antibiotics were not indicated.
CASE CONCLUSION
Given our patient’s persistent dyspnea, hypoxia, and chest CT findings consistent with amiodarone pulmonary toxicity, it was recommended that she start corticosteroids. However, before starting therapy, she suffered a femoral fracture that required surgical intervention. Around the time of the procedure, she had an ST-segment elevation myocardial infarction requiring vasopressor support and mechanical ventilation. At that time, the patient and family decided to pursue comfort measures, and she died peacefully.
MORE ABOUT AMIODARONE PULMONARY TOXICITY
Pulmonary toxicity is a well-described consequence of amiodarone therapy.23 Amiodarone carries a 2% risk of pulmonary toxicity.24 Although higher doses are more likely to cause pulmonary toxicity, lower doses also have been implicated.22,24 Preexisting pulmonary disease may predispose patients taking amiodarone to pulmonary toxicity; however, this is not uniformly seen.25
Mortality rates as high as 10% from amiodarone pulmonary toxicity have been reported. Thus, diligent surveillance for pulmonary toxicity with pulmonary function tests in patients taking amiodarone is mandatory. In particular, a reduction in FVC of greater than 15% or in DLCO of greater than 20% from baseline may be seen in amiodarone pulmonary toxicity.26
Amiodarone pulmonary toxicity can present at any time after the start of therapy, but it occurs most often after 6 to 12 months.13 Patients typically experience insidious dyspnea; however, presentation with acute to subacute cough and progressive dyspnea can occur, especially with high concentrations of supplemental oxygen with or without mechanical ventilation.12,27 Findings on physical examination include bibasilar crackles. CT chest findings include diffuse ground-glass opacities, reticular abnormalities, fibrosis, and increased attenuation in multiple organs, including the lung, liver, and spleen.14
The diagnosis of amiodarone pulmonary toxicity requires ruling out hypersensitivity pneumonitis, connective tissue disease, heart failure, and infection. Surgical biopsy and bronchoalveolar lavage are not commonly used to establish the diagnosis of amiodarone pulmonary toxicity, as surgical biopsy increases the risk of acute respiratory distress syndrome, and the results of bronchoalveolar lavage are usually nonspecific.13,15
Initial treatment involves discontinuing the amiodarone once the diagnosis is suspected. If patients have worsening hypoxia or dyspnea at the time of diagnosis, corticosteroids can be used. Prednisone is typically started at 40 to 60 mg daily and can result in rapid improvement in symptoms.13 Tapering of corticosteroids should occur slowly and may take several months.
References
McKee PA, Castelli WP, McNamara PM, Kannel WB. The natural history of congestive heart failure: the Framingham study. N Engl J Med 1971; 285(26):1441–1446. doi:10.1056/NEJM197112232852601
Stein PD, Terrin ML, Hales CA, et al. Clinical, laboratory, roentgenographic, and electrocardiographic findings in patients with acute pulmonary embolism and no pre-existing cardiac or pulmonary disease. Chest 1991; 100(3):598–603. pmid:1909617
Baggish AL, Siebert U, Lainchbury JG, et al. A validated clinical and biochemical score for the diagnosis of acute heart failure: the ProBNP investigation of dyspnea in the emergency department (PRIDE) acute heart failure score. Am Heart J 2006; 151(1):48–54. doi:10.1016/j.ahj.2005.02.031
National Heart, Lung, and Blood Institute. National Asthma Education and Prevention Program. Expert panel report 3: Guidelines for the diagnosis and management of asthma. www.nhlbi.nih.gov/sites/default/files/media/docs/asthgdln_1.pdf. Accessed August 3, 2018.
Brenner BE, Abraham E, Simon RR. Position and diaphoresis in acute asthma. Am J Med 1983; 74(6):1005–1009. pmid:6407304
Badgett RG, Tanaka DJ, Hunt DK, et al. Can moderate chronic obstructive pulmonary disease be diagnosed by historical and physical findings alone? Am J Med 1993; 94(2):188–196. pmid:8430714
Erie AJ, McClure RF, Wolanskyj AP. Amiodarone-induced bone marrow granulomas: an unusual cause of reversible pancytopenia. Hematol Rep 2010; 2(1):e6. doi:10.4081/hr.2010.e6
Marrie TJ. Community-acquired pneumonia. Clin Infect Dis 1994; 18(4):501–513. pmid:8038304
Metlay JP, Kapoor WN, Fine MJ. Does this patient have community-acquired pneumonia? Diagnosing pneumonia by history and physical examination. JAMA 1997; 278(17):1440–1445. pmid:9356004
Walker CM, Abbott GF, Greene RE, Shepard JA, Vummidi D, Digumarthy SR. Imaging pulmonary infection: classic signs and patterns. AJR Am J Roentgenol 2014; 202(3):479–492. doi:10.2214/AJR.13.11463
Raghu G, Collard HR, Egan JJ, et al; ATS/ERS/JRS/ALAT Committee on Idiopathic Pulmonary Fibrosis. An official ATS/ERS/JRS/ALAT statement: idiopathic pulmonary fibrosis: evidence-based guidelines for diagnosis and management. Am J Respir Crit Care Med 2011; 183(6):788–824. doi:10.1164/rccm.2009-040GL
Goldschlager N, Epstein AE, Naccarelli GV, et al; Practice Guidelines Sub-committee, North American Society of Pacing and Electrophysiology (HRS). A practical guide for clinicians who treat patients with amiodarone: 2007. Heart Rhythm 2007; 4(9):1250–1259. doi:10.1016/j.hrthm.2007.07.020
Martin WJ 2nd, Rosenow EC 3rd. Amiodarone pulmonary toxicity: recognition and pathogenesis (Part I). Chest 1988; 93(5):1067–1075. pmid:3282816
Iskandar SB, Abi-Saleh B, Keith RL, Byrd RP Jr, Roy TM. Amiodarone-induced alveolar hemorrhage. South Med J 2006; 99(4):383–387.
Van Mieghem W, Coolen L, Malysse I, Lacquet LM, Deneffe GJ, Demedts MG. Amiodarone and the development of ARDS after lung surgery. Chest 1994; 105(6):1642–1645. pmid:8205854
Nicholson KG. Clinical features of influenza. Semin Respir Infect 1992; 7(1):26–37. pmid:1609165
Muller NL, Franquet T, Lee KS, Silva CIS. Viruses, mycoplasma, and chlamydia. In: Imaging of Pulmonary Infections. Philadelphia, PA: Lippincott Williams & Wilkins; 2007:94–114.
Stack S, Nguyen DV, Casto A, Ahuja N. Diffuse alveolar damage in a patient receiving dronedarone. Chest 2015; 147(4):e131–e133. doi:10.1378/chest.14-1849
De Ferrari GM, Dusi V. Drug safety evaluation of dronedarone in atrial fibrillation. Expert Opin Drug Saf 2012; 11(6):1023–1045. doi:10.1517/14740338.2012.722994
Okayasu K, Takeda Y, Kojima J, et al. Amiodarone pulmonary toxicity: a patient with three recurrences of pulmonary toxicity and consideration of the probable risk for relapse. Intern Med 2006; 45(22):1303–1307. pmid:17170505
Vorperian VR, Havighurst TC, Miller S, January CT. Adverse effects of low dose amiodarone: a meta-analysis. J Am Coll Cardiol 1997; 30(3):791–798. pmid:9283542
Amiodarone Trials Meta-Analysis Investigators. Effect of prophylactic amiodarone on mortality after acute myocardial infarction and in congestive heart failure: meta-analysis of individual data from 6500 patients in randomised trials. Lancet 1997; 350(9089):1417–1424. pmid:9371164
Olshansky B, Sami M, Rubin A, et al; NHLBI AFFIRM Investigators. Use of amiodarone for atrial fibrillation in patients with preexisting pulmonary disease in the AFFIRM study. Am J Cardiol 2005; 95(3):404–405. doi:10.1016/j.amjcard.2004.09.044
Camus P. Interstitial lung disease from drugs, biologics, and radiation. In: Schwartz MI, King TE Jr, eds. Interstitial Lung Disease. 5th ed. Shelton, CT: People’s Medical Publishing House; 2011:637–644.
Wolkove N, Baltzan M. Amiodarone pulmonary toxicity. Can Respir J 2009; 16(2):43–48. doi:10.1155/2009/282540
We live in the era of evidence-based medicine, so new interventions must meet criteria for both safety and efficacy before they are adopted. However, we have inherited many practices adopted before the current standards were in place, and we have not always been rigorous in reevaluating traditional remedies. A conservative belief in established practice or the influence of vested interests may account for this lack of rigor in reappraisal.1 Calcium and vitamin D supplements are possible examples of this phenomenon.
BONE METABOLISM IS TIGHTLY REGULATED
Bone is a connective tissue, its matrix composed principally of type 1 collagen, which provides tensile strength. Hydroxyapatite crystals, composed predominantly of calcium and phosphate, lie between the collagen fibers and provide compressive strength. In a tightly regulated process, osteoblasts lay down the collagenous matrix, and osteoclasts remove it. Mineralization of newly formed bone proceeds if normal levels of extracellular calcium and phosphate are present, in the absence of inhibitors of mineralization.
High calcium intake does not drive bone formation
The endocrine system is critical in maintaining normocalcemia. A decrease in calcium intake results in increased parathyroid hormone secretion, resulting in increased renal tubular calcium reabsorption, increased bone turnover (both formation and resorption), and increased activation of vitamin D leading to increased intestinal absorption of calcium. High calcium intake reverses these changes.
Reid IR, Bristow SM, Bolland MJ. Calcium supplements: benefits and risks. J Intern Med 2015; 278(4):354–368. Copyright 2015, The Association for the Publication of the Journal of Internal Medicine.
Figure 1. Absolute change in total body bone mineral content (BMC) over 5 years in normal postmenopausal women, as a function of each woman’s average calcium intake assessed at baseline and at year 5. The lines show the regression (with 95% confidence intervals) for this relationship (P = .53)Thus, a normal serum calcium concentration can be maintained with calcium intake ranging from 200 to more than 2,000 mg/day, and rates of bone loss in postmenopausal women are unaffected by calcium intake (Figure 1).2
If calcium intake is very low, hypocalcemia and secondary hyperparathyroidism develop,3 and bone mineralization may be impaired. However, levels of calcium intake in Africa and in East and Southeast Asia are typically less than 400 mg/day,4 yet there is no evidence that these levels adversely affect skeletal health. In fact, fracture risk is lower in these regions than in North America, where calcium intake is several times greater.
Thus, some calcium intake is required to maintain circulating concentrations, but there is no mechanism by which high calcium intake can drive bone formation. Quite the opposite, in fact.
Vitamin D deficiency has little relationship with diet
Vitamin D is a biologically inactive secosteroid activated by hydroxylation in the liver and kidney to function as the key regulator of intestinal calcium absorption. As with calcium, its deficiency results in hypocalcemia and impaired bone mineralization.
Paradoxically, high levels of vitamin D stimulate bone resorption and inhibit bone mineralization in mice,5 and large doses increase bone resorption markers acutely in clinical studies.6 Thus, it is important to ensure an adequate vitamin D supply, but not an oversupply.
In the absence of supplements, most vitamin D is produced in the skin as a result of the action of ultraviolet light (from sunlight) on 7-dehydrocholesterol. Thus, vitamin D deficiency occurs in those deprived of skin exposure to sunlight (eg, due to veiling, living at high latitude, staying permanently indoors), but it has little relationship with diet.
ARE CALCIUM SUPPLEMENTS EFFECTIVE?
Calcium supplements are certainly biologically active. They transiently increase serum calcium concentrations, suppress parathyroid hormone, and reduce bone resorption.2 In the first year of use, they increase bone density by about 1% compared with placebo.7 However, longer use does not result in further bone density advantage over placebo,7 suggesting that the response simply reflects a decreased number of osteoclastic resorption sites and does not indicate a sustained change in bone balance.
A 1% difference in bone density would not be expected to reduce fracture risk, and a number of large, carefully conducted randomized controlled trials published over the last 15 years have failed to demonstrate antifracture efficacy for calcium.8–12 As a result, the US Preventive Services Task Force recommends against the routine use of calcium supplements in community-dwelling adults.13
In contrast, in a placebo-controlled trial published in 1992, Chapuy et al14 found that elderly women residing in nursing homes who received calcium and vitamin D supplements had fewer fractures. At 18 months, by intention-to-treat analysis, nonvertebral fractures had occurred in 160 (12%) of 1,387 women in the supplement group compared with 215 (15%) of 1,403 women in the placebo group (P < .001). However, these women were severely vitamin D-deficient (the mean serum 25-hydroxyvitamin D level at baseline in the placebo group was 13 ng/mL, normal range 15–50), to the extent that many must have had osteomalacia.
Thus, this study shows that calcium and vitamin D are effective in managing osteomalacia, but the subsequent trials8–12 did not observe any benefit in community-dwelling cohorts. Meta-analyses that pool the Chapuy study with community-based studies generally find that calcium with vitamin D is beneficial, but the heterogeneity of these populations means that such pooling is inappropriate.15
It is sometimes stated that calcium and vitamin D should always be given with osteoporosis medications because the efficacy of these drugs has only been demonstrated when coadministered with these supplements. This is incorrect. The addition of calcium to alendronate does not alter its effects on bone density,16 and the antifracture efficacy of both bisphosphonates17 and estrogen18,19 has been demonstrated in the absence of supplementation with calcium or vitamin D. The evidence that bisphosphonates prevent fractures in the absence of calcium supplements has recently been strengthened by the results of a randomized controlled trial comparing zoledronate with placebo in women over age 65 with osteopenia.20
ARE CALCIUM SUPPLEMENTS SAFE?
Calcium supplements often cause gastrointestinal symptoms, particularly constipation. They have been shown to double the risk of hospital admission due to abdominal symptoms.21 In the absence of clear evidence of benefit, these facts alone should militate against their routine use. Calcium supplements also cause hypercalcemia and hypercalciuria22 and increase the risk of renal calculi (by 17% in the Women’s Health Initiative8).
Over the last decade, evidence has emerged that calcium supplements may also increase the risk of myocardial infarction, and possibly stroke. This finding was not statistically significant in any single study, but is consistently present in meta-analyses.23
Evidence from the Women’s Health Initiative
When studies of calcium with vitamin D are added to these meta-analyses, the results are less consistent. This is because such meta-analyses are dominated by the Women's Health Initiative (because of its large size, with 36,282 participants). There have been 2 different analyses of this trial with respect to cardiovascular events.
When the Women’s Health Initiative as a whole was analyzed, there was no significant effect of calcium plus vitamin D on vascular end points. However, there is a significant interaction between body mass index and the effect of supplements, such that nonobese women demonstrated a 17% increase in myocardial infarction.24 This study was unusual in that it included women already taking calcium and vitamin D supplements.
Bolland MJ, Grey A, Avenell A, Gamble GD, Reid IR. Calcium supplements with or without vitamin D and risk of cardiovascular events: reanalysis of the Women’s Health Initiative limited access dataset and meta-analysis. BMJ 2011; 342:d2040.
Figure 2. Effect of calcium supplements on cardiovascular events, with or without vitamin D. Data for 28,072 participants in 8 trials of calcium supplements with trial-level data, plus data for Women’s Health Initiative CaD study participants not taking calcium supplements at baseline.
There was a significant interaction between baseline use of supplements and the effects of the trial intervention on vascular events, justifying analyzing the supplement-naive individuals separately. In this group of 16,000 women, an increase in clinical myocardial infarction of 22% was found, similar to the findings with calcium supplements alone.25
Thus, there is consistent evidence that introducing a calcium supplement de novo increases the risk of myocardial infarction (Figure 2).16,25–31 We calculate that treating 1,000 patients with calcium or calcium plus vitamin D for 5 years would cause an additional 6 myocardial infarctions or strokes (number needed to harm 178) and prevent only 3 fractures (number needed to treat 302).25
ARE VITAMIN D SUPPLEMENTS EFFECTIVE?
Vitamin D is highly effective in treating osteomalacia, improving symptoms within days and increasing bone density by as much as 50% over 1 year.32,33 In contrast, randomized controlled trials of vitamin D supplements alone in people without osteomalacia have not shown increases in bone density or changes in fracture risk.34–37
Reid IR, Horne AM, Mihov B, et al. Effect of monthly high-dose vitamin D on bone density in community-dwelling older adults substudy of a randomized controlled trial. J Intern Med 2017; 282(5):452–460. Copyright 2017, Assoc for Publication of J Int Med
Figure 3. Changes in bone mineral density (BMD) from baseline to 2 years in the vitamin D and placebo groups of the Vitamin D Assessment study, according to baseline serum 25(OH)D (25-hydroxyvitamin D) concentrations. Data are mean ± 95% confidence intervals. P values are shown for between-group comparisons.
In 2017, my colleagues and I published a trial showing that vitamin D supplementation increases bone density by 2% to 3% in the spine and femoral neck in participants with baseline 25-hydroxyvitamin D levels below 30- nmol/L (12 ng/mL), but those starting above this level showed no effect (Figure 3).38 And a reanalysis of an earlier study confirmed this 30 nmol/L threshold for an effect of vitamin D on bone density.39 The finding of a clear-cut threshold for vitamin D effects is predicted by the physiologic considerations set out above.
Belief that higher levels of 25-hydroxyvitamin D are better is based on observational data. However, correlation does not prove causation, and it is likely that causation is reversed here. Those with better health are likely to spend more time exercising outdoors, are less likely to be obese, and are less likely to have inflammatory conditions; and as a result, they are more likely to have better vitamin D status. We should now be using trial-based definitions of vitamin D deficiency as opposed to thresholds derived from disease associations in observational studies.
Vitamin D supplements have also been suggested to benefit cardiovascular health and to reduce cancer risk, though current clinical trial data provide no support for these hypotheses.36,40 Other trials addressing these questions are ongoing.
ARE VITAMIN D SUPPLEMENTS SAFE?
The safety of vitamin D supplements has generally been assessed with respect to the incidence of hypercalcemia. On this basis, very high doses have been promoted. However, there is now evidence that doses of 4,000 IU/day, 60,000 IU/month, and 500,000 IU/year increase the risk of falls and fractures.41,42
The threshold for bone benefits discussed above (12 ng/mL) is easily exceeded with doses of vitamin D of 400 to 1,000 IU/day. At these levels, vitamin D supplements have no known adverse effects and can be widely endorsed for individuals at risk of deficiency. Supplement doses greater than 2,000 IU/day should be used only in exceptional circumstances, and with appropriate monitoring.
LITTLE USE FOR CALCIUM AND VITAMIN D SUPPLEMENTS
Extensive clinical trials have failed to demonstrate meaningful benefit from calcium supplements in the management of osteoporosis. Calcium supplements are often prescribed in patients who are receiving other treatments for osteoporosis, which may be justified with interventions that have the potential to cause hypocalcemia, but their coadministration with bisphosphonates has been shown to be unnecessary.
Calcium supplements commonly cause gastrointestinal symptoms that are sometimes severe and are likely to contribute to high levels of noncompliance with osteoporosis medications. They increase the risk of kidney stones,8 and there is reasonable evidence to suggest an adverse effect on vascular risk as well.23
Vitamin D deficiency is common in frail elderly people, particularly those with dark skin or living at high latitudes. Low doses of vitamin D are safe and highly effective in preventing osteomalacia. But vitamin D supplements are unnecessary in those who regularly have sun exposure. And high doses of vitamin D have no demonstrated advantage and have been shown to increase the risk of falls and fractures.
Our decision to prescribe calcium and vitamin D supplements should be based on evidence that is of the same quality as for any other intervention we prescribe. Current evidence suggests that there is little reason to prescribe calcium, and that vitamin D should be targeted at those at risk of 25-hydroxyvitamin D levels less than 12 ng/mL.
References
Grey A, Bolland M. Web of industry, advocacy, and academia in the management of osteoporosis. BMJ 2015; 351:h3170. doi:10.1136/bmj.h3170
Reid IR, Bristow SM, Bolland MJ. Calcium supplements: benefits and risks. J Intern Med 2015; 278(4):354–368. doi:10.1111/joim.12394
Bolland MJ, Grey AB, Ames RW, Horne AM, Gamble GD, Reid IR. Fat mass is an important predictor of parathyroid hormone levels in postmenopausal women. Bone 2006; 38(3):317–321. doi:10.1016/j.bone.2005.08.018
Lieben L, Masuyama R, Torrekens S, et al. Normocalcemia is maintained in mice under conditions of calcium malabsorption by vitamin D-induced inhibition of bone mineralization. J Clin Invest 2012; 122(5):1803–1815. doi:10.1172/JCI45890
Rossini M, Gatti D, Viapiana O, et al. Short-term effects on bone turnover markers of a single high dose of oral vitamin D3. J Clin Endocrinol Metab 2012; 97(4):E622–E626. doi:10.1210/jc.2011-2448
Tai V, Leung W, Grey A, Reid IR, Bolland MJ. Calcium intake and bone mineral density: systematic review and meta-analysis. BMJ 2015; 351:h4183. doi:10.1136/bmj.h4183
Jackson RD, LaCroix AZ, Gass M, et al; Women’s Health Initiative Investigators. Calcium plus vitamin D supplementation and the risk of fractures. N Engl J Med 2006; 354(7):669–683. doi:10.1056/NEJMoa055218
Grant AM, Avenell A, Campbell MK, et al; RECORD Trial Group. Oral vitamin D3 and calcium for secondary prevention of low-trauma fractures in elderly people (Randomised Evaluation of Calcium or vitamin D, RECORD): a randomised placebo-controlled trial. Lancet 2005; 365(9471):1621–1628. doi:10.1016/S0140-6736(05)63013-9
Prince RL, Devine A, Dhaliwal SS, Dick IM. Effects of calcium supplementation on clinical fracture and bone structure: results of a 5-year, double-blind, placebo-controlled trial in elderly women. Arch Intern Med 2006; 166(8):869–875. doi:10.1001/archinte.166.8.869
Reid IR, Mason B, Horne A, et al. Randomized controlled trial of calcium in healthy older women. Am J Med 2006; 119(9):777–785. doi:10.1016/j.amjmed.2006.02.038
Salovaara K, Tuppurainen M, Karkkainen M, et al. Effect of vitamin D-3 and calcium on fracture risk in 65-to 71-year-old women: a population-based 3-year randomized, controlled trial—the OSTPRE-FPS. J Bone Miner Res 2010; 25(7):1487–1495. doi:10.1002/jbmr.48
Moyer VA, US Preventive Services Task Force. Vitamin D and calcium supplementation to prevent fractures in adults: U.S. Preventive Services Task Force recommendation statement. Ann Intern Med 2013; 158(9):691–696. doi:10.7326/0003-4819-158-9-201305070-00603
Chapuy MC, Arlot ME, Duboeuf F, et al. Vitamin D3 and calcium to prevent hip fractures in elderly women. N Engl J Med 1992; 327(23):1637–1642. doi:10.1056/NEJM199212033272305
Tang BMP, Eslick GD, Nowson C, Smith C, Bensoussan A. Use of calcium or calcium in combination with vitamin D supplementation to prevent fractures and bone loss in people aged 50 years and older: a meta-analysis. Lancet 2007; 370(9588):657–666. doi:10.1016/S0140-6736(07)61342-7
Bonnick S, Broy S, Kaiser F, et al. Treatment with alendronate plus calcium, alendronate alone, or calcium alone for postmenopausal low bone mineral density. Curr Med Res Opin 2007; 23(6):1341–1349. doi:10.1185/030079907X188035
McCloskey EV, Beneton M, Charlesworth D, et al. Clodronate reduces the incidence of fractures in community-dwelling elderly women unselected for osteoporosis: results of a double-blind, placebo-controlled randomized study. J Bone Miner Res 2007; 22(1):135–141. doi:10.1359/jbmr.061008
Lindsay R, Hart DM, Forrest C, Baird C. Prevention of spinal osteoporosis in oophorectomised women. Lancet 1980; 2(8205):1151–1154. pmid:6107766
Cauley JA, Robbins J, Chen Z, et al; Women’s Health Initiative Investigators. Effects of estrogen plus progestin on risk of fracture and bone mineral density: the Women’s Health Initiative randomized trial. JAMA 2003; 290(13):1729–1738. doi:10.1001/jama.290.13.1729
Reid I, Horne A, Mihov B, et al. Abstracts of the ECTS Congress 2018: Zoledronate every 18 months for 6 years in osteopenic postmenopausal women reduces non-vertebral fractures and height loss. Calcif Tissue Int 2018; 102:S1-S159. doi:10.1007/s00223-018-0418-0
Lewis JR, Zhu K, Prince RL. Adverse events from calcium supplementation: relationship to errors in myocardial infarction self-reporting in randomized controlled trials of calcium supplementation. J Bone Miner Res 2012; 27(3):719–722. doi:10.1002/jbmr.1484
Gallagher JC, Smith LM, Yalamanchili V. Incidence of hypercalciuria and hypercalcemia during vitamin D and calcium supplementation in older women. Menopause 2014; 21(11):1173–1180. doi:10.1097/GME.0000000000000270
Reid IR, Bristow SM, Bolland MJ. Calcium and cardiovascular disease. Endocrinol Metab (Seoul) 2017; 32(3):339–349. doi:10.3803/EnM.2017.32.3.339
Hsia J, Heiss G, Ren H, et al; Women’s Health Initiative Investigators. Calcium/vitamin D supplementation and cardiovascular events. Circulation 2007; 115(7):846–854. doi:10.1161/CIRCULATIONAHA.106.673491
Bolland MJ, Grey A, Avenell A, Gamble GD, Reid IR. Calcium supplements with or without vitamin D and risk of cardiovascular events: reanalysis of the Women’s Health Initiative limited access dataset and meta-analysis. BMJ 2011; 342:d2040. doi:10.1136/bmj.d2040
Baron JA, Beach M, Mandel JS, et al. Calcium supplements for the prevention of colorectal adenomas. Calcium Polyp Prevention Study Group. N Engl J Med 1999; 340(3):101–107. doi:10.1056/NEJM199901143400204
Bolland MJ, Barber PA, Doughty RN, et al. Vascular events in healthy older women receiving calcium supplementation: randomised controlled trial. BMJ 2008; 336(7638):262–266. doi:10.1136/bmj.39440.525752.BE
Lappe JM, Travers-Gustafson D, Davies KM, Recker RR, Heaney RP. Vitamin D and calcium supplementation reduces cancer risk: results of a randomized trial. Am J Clin Nutr 2007; 85(6):1586–1591. doi:10.1093/ajcn/85.6.1586
Reid IR, Ames R, Mason B, et al. Randomized controlled trial of calcium supplementation in healthy, non-osteoporotic, older men. Arch Intern Med 2008; 168(20):2276–2282. doi:10.1001/archinte.168.20.2276
Reid IR, Ames RW, Evans MC,Gamble GD, Sharpe SJ. Effect of calcium supplementation on bone loss in postmenopausal women. N Engl J Med 1993; 328(7):460–464. doi:10.1056/NEJM199302183280702
Reid IR, Ames RW, Evans MC, Gamble GD, Sharpe SJ. Long-term effects of calcium supplementation on bone loss and fractures in postmenopausal women: a randomized controlled trial. Am J Med 1995; 98(4):331–335. doi:10.1016/S0002-9343(99)80310-6
Al-Ali H, Fuleihan GE. Nutritional osteomalacia: substantial clinical improvement and gain in bone density posttherapy. J Clin Densitom 2000; 3(1):97–101. pmid:10745306
El-Desouki MI, Othman SM, Fouda MA. Bone mineral density and bone scintigraphy in adult Saudi female patients with osteomalacia. Saudi Med J 2004; 25(3):355–358.
Reid IR, Bolland MJ, Grey A. Effects of vitamin D supplements on bone mineral density: a systematic review and meta-analysis. Lancet 2014; 383(9912):146–155. doi:10.1016/S0140-6736(13)61647-5
Avenell A, Mak JC, O’Connell D. Vitamin D and vitamin D analogues for preventing fractures in post-menopausal women and older men. Cochrane Database Syst Rev 2014; (4):CD000227. doi:10.1002/14651858.CD000227.pub4
Bolland MJ, Grey A, Gamble GD, Reid IR. The effect of vitamin D supplementation on skeletal, vascular, or cancer outcomes: a trial sequential meta-analysis. Lancet Diabetes Endocrinol 2014; 2(4):307–320. doi:10.1016/S2213-8587(13)70212-2
DIPART (Vitamin D Individual Patient Analysis of Randomized Trials) Group. Patient level pooled analysis of 68 500 patients from seven major vitamin D fracture trials in US and Europe. BMJ 2010; 340:b5463. doi:10.1136/bmj.b5463
Reid IR, Horne AM, Mihov B, et al. Effect of monthly high-dose vitamin D on bone density in community-dwelling older adults substudy of a randomized controlled trial. J Intern Med 2017; 282(5):452–460. doi:10.1111/joim.12651
MacDonald HM, Reid IR, Gamble GD, Fraser WD, Tang JC, Wood AD. 25-Hydroxyvitamin D threshold for the effects of vitamin D supplements on bone density secondary analysis of a randomized controlled trial. J Bone Miner Res 2018. Epub ahead of print. doi:10.1002/jbmr.3442
Scragg R, Stewart AW, Waayer D, et al. Effect of monthly high-dose vitamin D supplementation on cardiovascular disease in the vitamin D assessment study: a randomized clinical trial. JAMA Cardiol 2017; 2(6):608–616. doi:10.1001/jamacardio.2017.0175
Sanders KM, Stuart AL, Williamson EJ, et al. Annual high-dose oral vitamin D and falls and fractures in older women: a randomized controlled trial. JAMA 2010; 303(18):1815–1822. doi:10.1001/jama.2010.594
Smith LM, Gallagher JC, Suiter C. Medium doses of daily vitamin D decrease falls and higher doses of daily vitamin D3 increase falls: a randomized clinical trial. J Steroid Biochem Mol Biol 2017; 173:317–322. doi:10.1016/j.jsbmb.2017.03.015
Ian R. Reid, MD University of Auckland, Auckland, New Zealand; Department of Endocrinology, Auckland District Health Board, Auckland, New Zealand
Address: Ian R. Reid, MD, Faculty of Medical and Health Sciences, University of Auckland, Private Bag 92019, Auckland, New Zealand; i.reid@auckland.ac.nz
Dr. Reid has disclosed consulting for Amgen and Merck and teaching and speaking for Amgen and Eli Lilly. He is supported by the Health Research Council of New Zealand.
Author and Disclosure Information
Ian R. Reid, MD University of Auckland, Auckland, New Zealand; Department of Endocrinology, Auckland District Health Board, Auckland, New Zealand
Address: Ian R. Reid, MD, Faculty of Medical and Health Sciences, University of Auckland, Private Bag 92019, Auckland, New Zealand; i.reid@auckland.ac.nz
Dr. Reid has disclosed consulting for Amgen and Merck and teaching and speaking for Amgen and Eli Lilly. He is supported by the Health Research Council of New Zealand.
We live in the era of evidence-based medicine, so new interventions must meet criteria for both safety and efficacy before they are adopted. However, we have inherited many practices adopted before the current standards were in place, and we have not always been rigorous in reevaluating traditional remedies. A conservative belief in established practice or the influence of vested interests may account for this lack of rigor in reappraisal.1 Calcium and vitamin D supplements are possible examples of this phenomenon.
BONE METABOLISM IS TIGHTLY REGULATED
Bone is a connective tissue, its matrix composed principally of type 1 collagen, which provides tensile strength. Hydroxyapatite crystals, composed predominantly of calcium and phosphate, lie between the collagen fibers and provide compressive strength. In a tightly regulated process, osteoblasts lay down the collagenous matrix, and osteoclasts remove it. Mineralization of newly formed bone proceeds if normal levels of extracellular calcium and phosphate are present, in the absence of inhibitors of mineralization.
High calcium intake does not drive bone formation
The endocrine system is critical in maintaining normocalcemia. A decrease in calcium intake results in increased parathyroid hormone secretion, resulting in increased renal tubular calcium reabsorption, increased bone turnover (both formation and resorption), and increased activation of vitamin D leading to increased intestinal absorption of calcium. High calcium intake reverses these changes.
Reid IR, Bristow SM, Bolland MJ. Calcium supplements: benefits and risks. J Intern Med 2015; 278(4):354–368. Copyright 2015, The Association for the Publication of the Journal of Internal Medicine.
Figure 1. Absolute change in total body bone mineral content (BMC) over 5 years in normal postmenopausal women, as a function of each woman’s average calcium intake assessed at baseline and at year 5. The lines show the regression (with 95% confidence intervals) for this relationship (P = .53)Thus, a normal serum calcium concentration can be maintained with calcium intake ranging from 200 to more than 2,000 mg/day, and rates of bone loss in postmenopausal women are unaffected by calcium intake (Figure 1).2
If calcium intake is very low, hypocalcemia and secondary hyperparathyroidism develop,3 and bone mineralization may be impaired. However, levels of calcium intake in Africa and in East and Southeast Asia are typically less than 400 mg/day,4 yet there is no evidence that these levels adversely affect skeletal health. In fact, fracture risk is lower in these regions than in North America, where calcium intake is several times greater.
Thus, some calcium intake is required to maintain circulating concentrations, but there is no mechanism by which high calcium intake can drive bone formation. Quite the opposite, in fact.
Vitamin D deficiency has little relationship with diet
Vitamin D is a biologically inactive secosteroid activated by hydroxylation in the liver and kidney to function as the key regulator of intestinal calcium absorption. As with calcium, its deficiency results in hypocalcemia and impaired bone mineralization.
Paradoxically, high levels of vitamin D stimulate bone resorption and inhibit bone mineralization in mice,5 and large doses increase bone resorption markers acutely in clinical studies.6 Thus, it is important to ensure an adequate vitamin D supply, but not an oversupply.
In the absence of supplements, most vitamin D is produced in the skin as a result of the action of ultraviolet light (from sunlight) on 7-dehydrocholesterol. Thus, vitamin D deficiency occurs in those deprived of skin exposure to sunlight (eg, due to veiling, living at high latitude, staying permanently indoors), but it has little relationship with diet.
ARE CALCIUM SUPPLEMENTS EFFECTIVE?
Calcium supplements are certainly biologically active. They transiently increase serum calcium concentrations, suppress parathyroid hormone, and reduce bone resorption.2 In the first year of use, they increase bone density by about 1% compared with placebo.7 However, longer use does not result in further bone density advantage over placebo,7 suggesting that the response simply reflects a decreased number of osteoclastic resorption sites and does not indicate a sustained change in bone balance.
A 1% difference in bone density would not be expected to reduce fracture risk, and a number of large, carefully conducted randomized controlled trials published over the last 15 years have failed to demonstrate antifracture efficacy for calcium.8–12 As a result, the US Preventive Services Task Force recommends against the routine use of calcium supplements in community-dwelling adults.13
In contrast, in a placebo-controlled trial published in 1992, Chapuy et al14 found that elderly women residing in nursing homes who received calcium and vitamin D supplements had fewer fractures. At 18 months, by intention-to-treat analysis, nonvertebral fractures had occurred in 160 (12%) of 1,387 women in the supplement group compared with 215 (15%) of 1,403 women in the placebo group (P < .001). However, these women were severely vitamin D-deficient (the mean serum 25-hydroxyvitamin D level at baseline in the placebo group was 13 ng/mL, normal range 15–50), to the extent that many must have had osteomalacia.
Thus, this study shows that calcium and vitamin D are effective in managing osteomalacia, but the subsequent trials8–12 did not observe any benefit in community-dwelling cohorts. Meta-analyses that pool the Chapuy study with community-based studies generally find that calcium with vitamin D is beneficial, but the heterogeneity of these populations means that such pooling is inappropriate.15
It is sometimes stated that calcium and vitamin D should always be given with osteoporosis medications because the efficacy of these drugs has only been demonstrated when coadministered with these supplements. This is incorrect. The addition of calcium to alendronate does not alter its effects on bone density,16 and the antifracture efficacy of both bisphosphonates17 and estrogen18,19 has been demonstrated in the absence of supplementation with calcium or vitamin D. The evidence that bisphosphonates prevent fractures in the absence of calcium supplements has recently been strengthened by the results of a randomized controlled trial comparing zoledronate with placebo in women over age 65 with osteopenia.20
ARE CALCIUM SUPPLEMENTS SAFE?
Calcium supplements often cause gastrointestinal symptoms, particularly constipation. They have been shown to double the risk of hospital admission due to abdominal symptoms.21 In the absence of clear evidence of benefit, these facts alone should militate against their routine use. Calcium supplements also cause hypercalcemia and hypercalciuria22 and increase the risk of renal calculi (by 17% in the Women’s Health Initiative8).
Over the last decade, evidence has emerged that calcium supplements may also increase the risk of myocardial infarction, and possibly stroke. This finding was not statistically significant in any single study, but is consistently present in meta-analyses.23
Evidence from the Women’s Health Initiative
When studies of calcium with vitamin D are added to these meta-analyses, the results are less consistent. This is because such meta-analyses are dominated by the Women's Health Initiative (because of its large size, with 36,282 participants). There have been 2 different analyses of this trial with respect to cardiovascular events.
When the Women’s Health Initiative as a whole was analyzed, there was no significant effect of calcium plus vitamin D on vascular end points. However, there is a significant interaction between body mass index and the effect of supplements, such that nonobese women demonstrated a 17% increase in myocardial infarction.24 This study was unusual in that it included women already taking calcium and vitamin D supplements.
Bolland MJ, Grey A, Avenell A, Gamble GD, Reid IR. Calcium supplements with or without vitamin D and risk of cardiovascular events: reanalysis of the Women’s Health Initiative limited access dataset and meta-analysis. BMJ 2011; 342:d2040.
Figure 2. Effect of calcium supplements on cardiovascular events, with or without vitamin D. Data for 28,072 participants in 8 trials of calcium supplements with trial-level data, plus data for Women’s Health Initiative CaD study participants not taking calcium supplements at baseline.
There was a significant interaction between baseline use of supplements and the effects of the trial intervention on vascular events, justifying analyzing the supplement-naive individuals separately. In this group of 16,000 women, an increase in clinical myocardial infarction of 22% was found, similar to the findings with calcium supplements alone.25
Thus, there is consistent evidence that introducing a calcium supplement de novo increases the risk of myocardial infarction (Figure 2).16,25–31 We calculate that treating 1,000 patients with calcium or calcium plus vitamin D for 5 years would cause an additional 6 myocardial infarctions or strokes (number needed to harm 178) and prevent only 3 fractures (number needed to treat 302).25
ARE VITAMIN D SUPPLEMENTS EFFECTIVE?
Vitamin D is highly effective in treating osteomalacia, improving symptoms within days and increasing bone density by as much as 50% over 1 year.32,33 In contrast, randomized controlled trials of vitamin D supplements alone in people without osteomalacia have not shown increases in bone density or changes in fracture risk.34–37
Reid IR, Horne AM, Mihov B, et al. Effect of monthly high-dose vitamin D on bone density in community-dwelling older adults substudy of a randomized controlled trial. J Intern Med 2017; 282(5):452–460. Copyright 2017, Assoc for Publication of J Int Med
Figure 3. Changes in bone mineral density (BMD) from baseline to 2 years in the vitamin D and placebo groups of the Vitamin D Assessment study, according to baseline serum 25(OH)D (25-hydroxyvitamin D) concentrations. Data are mean ± 95% confidence intervals. P values are shown for between-group comparisons.
In 2017, my colleagues and I published a trial showing that vitamin D supplementation increases bone density by 2% to 3% in the spine and femoral neck in participants with baseline 25-hydroxyvitamin D levels below 30- nmol/L (12 ng/mL), but those starting above this level showed no effect (Figure 3).38 And a reanalysis of an earlier study confirmed this 30 nmol/L threshold for an effect of vitamin D on bone density.39 The finding of a clear-cut threshold for vitamin D effects is predicted by the physiologic considerations set out above.
Belief that higher levels of 25-hydroxyvitamin D are better is based on observational data. However, correlation does not prove causation, and it is likely that causation is reversed here. Those with better health are likely to spend more time exercising outdoors, are less likely to be obese, and are less likely to have inflammatory conditions; and as a result, they are more likely to have better vitamin D status. We should now be using trial-based definitions of vitamin D deficiency as opposed to thresholds derived from disease associations in observational studies.
Vitamin D supplements have also been suggested to benefit cardiovascular health and to reduce cancer risk, though current clinical trial data provide no support for these hypotheses.36,40 Other trials addressing these questions are ongoing.
ARE VITAMIN D SUPPLEMENTS SAFE?
The safety of vitamin D supplements has generally been assessed with respect to the incidence of hypercalcemia. On this basis, very high doses have been promoted. However, there is now evidence that doses of 4,000 IU/day, 60,000 IU/month, and 500,000 IU/year increase the risk of falls and fractures.41,42
The threshold for bone benefits discussed above (12 ng/mL) is easily exceeded with doses of vitamin D of 400 to 1,000 IU/day. At these levels, vitamin D supplements have no known adverse effects and can be widely endorsed for individuals at risk of deficiency. Supplement doses greater than 2,000 IU/day should be used only in exceptional circumstances, and with appropriate monitoring.
LITTLE USE FOR CALCIUM AND VITAMIN D SUPPLEMENTS
Extensive clinical trials have failed to demonstrate meaningful benefit from calcium supplements in the management of osteoporosis. Calcium supplements are often prescribed in patients who are receiving other treatments for osteoporosis, which may be justified with interventions that have the potential to cause hypocalcemia, but their coadministration with bisphosphonates has been shown to be unnecessary.
Calcium supplements commonly cause gastrointestinal symptoms that are sometimes severe and are likely to contribute to high levels of noncompliance with osteoporosis medications. They increase the risk of kidney stones,8 and there is reasonable evidence to suggest an adverse effect on vascular risk as well.23
Vitamin D deficiency is common in frail elderly people, particularly those with dark skin or living at high latitudes. Low doses of vitamin D are safe and highly effective in preventing osteomalacia. But vitamin D supplements are unnecessary in those who regularly have sun exposure. And high doses of vitamin D have no demonstrated advantage and have been shown to increase the risk of falls and fractures.
Our decision to prescribe calcium and vitamin D supplements should be based on evidence that is of the same quality as for any other intervention we prescribe. Current evidence suggests that there is little reason to prescribe calcium, and that vitamin D should be targeted at those at risk of 25-hydroxyvitamin D levels less than 12 ng/mL.
References
Grey A, Bolland M. Web of industry, advocacy, and academia in the management of osteoporosis. BMJ 2015; 351:h3170. doi:10.1136/bmj.h3170
Reid IR, Bristow SM, Bolland MJ. Calcium supplements: benefits and risks. J Intern Med 2015; 278(4):354–368. doi:10.1111/joim.12394
Bolland MJ, Grey AB, Ames RW, Horne AM, Gamble GD, Reid IR. Fat mass is an important predictor of parathyroid hormone levels in postmenopausal women. Bone 2006; 38(3):317–321. doi:10.1016/j.bone.2005.08.018
Lieben L, Masuyama R, Torrekens S, et al. Normocalcemia is maintained in mice under conditions of calcium malabsorption by vitamin D-induced inhibition of bone mineralization. J Clin Invest 2012; 122(5):1803–1815. doi:10.1172/JCI45890
Rossini M, Gatti D, Viapiana O, et al. Short-term effects on bone turnover markers of a single high dose of oral vitamin D3. J Clin Endocrinol Metab 2012; 97(4):E622–E626. doi:10.1210/jc.2011-2448
Tai V, Leung W, Grey A, Reid IR, Bolland MJ. Calcium intake and bone mineral density: systematic review and meta-analysis. BMJ 2015; 351:h4183. doi:10.1136/bmj.h4183
Jackson RD, LaCroix AZ, Gass M, et al; Women’s Health Initiative Investigators. Calcium plus vitamin D supplementation and the risk of fractures. N Engl J Med 2006; 354(7):669–683. doi:10.1056/NEJMoa055218
Grant AM, Avenell A, Campbell MK, et al; RECORD Trial Group. Oral vitamin D3 and calcium for secondary prevention of low-trauma fractures in elderly people (Randomised Evaluation of Calcium or vitamin D, RECORD): a randomised placebo-controlled trial. Lancet 2005; 365(9471):1621–1628. doi:10.1016/S0140-6736(05)63013-9
Prince RL, Devine A, Dhaliwal SS, Dick IM. Effects of calcium supplementation on clinical fracture and bone structure: results of a 5-year, double-blind, placebo-controlled trial in elderly women. Arch Intern Med 2006; 166(8):869–875. doi:10.1001/archinte.166.8.869
Reid IR, Mason B, Horne A, et al. Randomized controlled trial of calcium in healthy older women. Am J Med 2006; 119(9):777–785. doi:10.1016/j.amjmed.2006.02.038
Salovaara K, Tuppurainen M, Karkkainen M, et al. Effect of vitamin D-3 and calcium on fracture risk in 65-to 71-year-old women: a population-based 3-year randomized, controlled trial—the OSTPRE-FPS. J Bone Miner Res 2010; 25(7):1487–1495. doi:10.1002/jbmr.48
Moyer VA, US Preventive Services Task Force. Vitamin D and calcium supplementation to prevent fractures in adults: U.S. Preventive Services Task Force recommendation statement. Ann Intern Med 2013; 158(9):691–696. doi:10.7326/0003-4819-158-9-201305070-00603
Chapuy MC, Arlot ME, Duboeuf F, et al. Vitamin D3 and calcium to prevent hip fractures in elderly women. N Engl J Med 1992; 327(23):1637–1642. doi:10.1056/NEJM199212033272305
Tang BMP, Eslick GD, Nowson C, Smith C, Bensoussan A. Use of calcium or calcium in combination with vitamin D supplementation to prevent fractures and bone loss in people aged 50 years and older: a meta-analysis. Lancet 2007; 370(9588):657–666. doi:10.1016/S0140-6736(07)61342-7
Bonnick S, Broy S, Kaiser F, et al. Treatment with alendronate plus calcium, alendronate alone, or calcium alone for postmenopausal low bone mineral density. Curr Med Res Opin 2007; 23(6):1341–1349. doi:10.1185/030079907X188035
McCloskey EV, Beneton M, Charlesworth D, et al. Clodronate reduces the incidence of fractures in community-dwelling elderly women unselected for osteoporosis: results of a double-blind, placebo-controlled randomized study. J Bone Miner Res 2007; 22(1):135–141. doi:10.1359/jbmr.061008
Lindsay R, Hart DM, Forrest C, Baird C. Prevention of spinal osteoporosis in oophorectomised women. Lancet 1980; 2(8205):1151–1154. pmid:6107766
Cauley JA, Robbins J, Chen Z, et al; Women’s Health Initiative Investigators. Effects of estrogen plus progestin on risk of fracture and bone mineral density: the Women’s Health Initiative randomized trial. JAMA 2003; 290(13):1729–1738. doi:10.1001/jama.290.13.1729
Reid I, Horne A, Mihov B, et al. Abstracts of the ECTS Congress 2018: Zoledronate every 18 months for 6 years in osteopenic postmenopausal women reduces non-vertebral fractures and height loss. Calcif Tissue Int 2018; 102:S1-S159. doi:10.1007/s00223-018-0418-0
Lewis JR, Zhu K, Prince RL. Adverse events from calcium supplementation: relationship to errors in myocardial infarction self-reporting in randomized controlled trials of calcium supplementation. J Bone Miner Res 2012; 27(3):719–722. doi:10.1002/jbmr.1484
Gallagher JC, Smith LM, Yalamanchili V. Incidence of hypercalciuria and hypercalcemia during vitamin D and calcium supplementation in older women. Menopause 2014; 21(11):1173–1180. doi:10.1097/GME.0000000000000270
Reid IR, Bristow SM, Bolland MJ. Calcium and cardiovascular disease. Endocrinol Metab (Seoul) 2017; 32(3):339–349. doi:10.3803/EnM.2017.32.3.339
Hsia J, Heiss G, Ren H, et al; Women’s Health Initiative Investigators. Calcium/vitamin D supplementation and cardiovascular events. Circulation 2007; 115(7):846–854. doi:10.1161/CIRCULATIONAHA.106.673491
Bolland MJ, Grey A, Avenell A, Gamble GD, Reid IR. Calcium supplements with or without vitamin D and risk of cardiovascular events: reanalysis of the Women’s Health Initiative limited access dataset and meta-analysis. BMJ 2011; 342:d2040. doi:10.1136/bmj.d2040
Baron JA, Beach M, Mandel JS, et al. Calcium supplements for the prevention of colorectal adenomas. Calcium Polyp Prevention Study Group. N Engl J Med 1999; 340(3):101–107. doi:10.1056/NEJM199901143400204
Bolland MJ, Barber PA, Doughty RN, et al. Vascular events in healthy older women receiving calcium supplementation: randomised controlled trial. BMJ 2008; 336(7638):262–266. doi:10.1136/bmj.39440.525752.BE
Lappe JM, Travers-Gustafson D, Davies KM, Recker RR, Heaney RP. Vitamin D and calcium supplementation reduces cancer risk: results of a randomized trial. Am J Clin Nutr 2007; 85(6):1586–1591. doi:10.1093/ajcn/85.6.1586
Reid IR, Ames R, Mason B, et al. Randomized controlled trial of calcium supplementation in healthy, non-osteoporotic, older men. Arch Intern Med 2008; 168(20):2276–2282. doi:10.1001/archinte.168.20.2276
Reid IR, Ames RW, Evans MC,Gamble GD, Sharpe SJ. Effect of calcium supplementation on bone loss in postmenopausal women. N Engl J Med 1993; 328(7):460–464. doi:10.1056/NEJM199302183280702
Reid IR, Ames RW, Evans MC, Gamble GD, Sharpe SJ. Long-term effects of calcium supplementation on bone loss and fractures in postmenopausal women: a randomized controlled trial. Am J Med 1995; 98(4):331–335. doi:10.1016/S0002-9343(99)80310-6
Al-Ali H, Fuleihan GE. Nutritional osteomalacia: substantial clinical improvement and gain in bone density posttherapy. J Clin Densitom 2000; 3(1):97–101. pmid:10745306
El-Desouki MI, Othman SM, Fouda MA. Bone mineral density and bone scintigraphy in adult Saudi female patients with osteomalacia. Saudi Med J 2004; 25(3):355–358.
Reid IR, Bolland MJ, Grey A. Effects of vitamin D supplements on bone mineral density: a systematic review and meta-analysis. Lancet 2014; 383(9912):146–155. doi:10.1016/S0140-6736(13)61647-5
Avenell A, Mak JC, O’Connell D. Vitamin D and vitamin D analogues for preventing fractures in post-menopausal women and older men. Cochrane Database Syst Rev 2014; (4):CD000227. doi:10.1002/14651858.CD000227.pub4
Bolland MJ, Grey A, Gamble GD, Reid IR. The effect of vitamin D supplementation on skeletal, vascular, or cancer outcomes: a trial sequential meta-analysis. Lancet Diabetes Endocrinol 2014; 2(4):307–320. doi:10.1016/S2213-8587(13)70212-2
DIPART (Vitamin D Individual Patient Analysis of Randomized Trials) Group. Patient level pooled analysis of 68 500 patients from seven major vitamin D fracture trials in US and Europe. BMJ 2010; 340:b5463. doi:10.1136/bmj.b5463
Reid IR, Horne AM, Mihov B, et al. Effect of monthly high-dose vitamin D on bone density in community-dwelling older adults substudy of a randomized controlled trial. J Intern Med 2017; 282(5):452–460. doi:10.1111/joim.12651
MacDonald HM, Reid IR, Gamble GD, Fraser WD, Tang JC, Wood AD. 25-Hydroxyvitamin D threshold for the effects of vitamin D supplements on bone density secondary analysis of a randomized controlled trial. J Bone Miner Res 2018. Epub ahead of print. doi:10.1002/jbmr.3442
Scragg R, Stewart AW, Waayer D, et al. Effect of monthly high-dose vitamin D supplementation on cardiovascular disease in the vitamin D assessment study: a randomized clinical trial. JAMA Cardiol 2017; 2(6):608–616. doi:10.1001/jamacardio.2017.0175
Sanders KM, Stuart AL, Williamson EJ, et al. Annual high-dose oral vitamin D and falls and fractures in older women: a randomized controlled trial. JAMA 2010; 303(18):1815–1822. doi:10.1001/jama.2010.594
Smith LM, Gallagher JC, Suiter C. Medium doses of daily vitamin D decrease falls and higher doses of daily vitamin D3 increase falls: a randomized clinical trial. J Steroid Biochem Mol Biol 2017; 173:317–322. doi:10.1016/j.jsbmb.2017.03.015
In 1984, Jim Fixx, who wrote The Complete Book of Running,1 went out for his daily run and died of a massive heart attack. He was 48. Unbeknownst to him, he had 3-vessel coronary artery disease.
His case illustrates the difficulty of diagnosing coronary artery disease in patients who have no symptoms of it. For many, the initial presentation is myocardial infarction or death. Until recently, there was no reliable way to diagnose subclinical coronary artery disease other than angiography, and there is still no way to rule it out. As a result, physicians have concentrated less on diagnosing subclinical disease and more on assessing the risk of myocardial infarction.
ASSESSING RISK
The risk factors for coronary artery disease (age, male sex, smoking, hypertension, and cholesterol) have been well known for half a century. By combining risk factors with the appropriate weighting, it is possible to predict an individual’s risk of a myocardial infarction.
In 2013, the American College of Cardiology/American Heart Association (ACC/AHA) guidelines applied this risk-based approach to prescribing statins for primary prevention.2 Instead of focusing on low-density lipoprotein cholesterol concentration, which by itself is a poor predictor of myocardial infarction, they recommended using the Pooled Cohort Equation3 to determine the risk of a cardiovascular event within 10 years. For patients at high risk (> 7.5%), the benefits of a statin generally outweigh the harms. For those at low risk (< 5%), the opposite is true. For patients in between, there is room for shared decision-making.
Debate has focused on the predictive accuracy of the equation, the threshold for treatment, and the fact that almost all men over 60 qualify for treatment.4 These objections stem from the focus on risk rather than on diagnosis of the underlying disease.
Because one-third of “high-risk” patients never develop cardiovascular disease,5 the risk-based approach necessitates overtreatment. Those without disease cannot benefit from treatment but nonetheless suffer its side effects, cost, and inconvenience. Raising treatment thresholds (eg, treating only patients whose 10-year risk exceeds 10%) improves the ratio of patients with disease to those without but also misses diseased patients who have few risk factors. “Low risk” is not “no risk.”
TESTING FOR DISEASE IN THOSE AT INTERMEDIATE RISK
Diagnostic testing is preferred if such testing is safe and inexpensive.
In this issue of Cleveland Clinic Journal of Medicine, Parikh and colleagues6 review coronary artery calcium scoring, a diagnostic test for coronary artery disease. They conclude that calcium scoring is strongly predictive but should be reserved for patients at intermediate risk to help them decide about treatment. This is clearly the right approach, but the authors leave the term “intermediate” undefined, and their clinical examples offer little guidance as to where the borders lie.
The ACC/AHA guidelines specify a narrow intermediate range (5.0%–7.4%). For these patients, calcium scoring could reclassify most as being at high or low risk, helping to clarify whether statins are indicated.
However, only 12% of patients fall into this category.7 What about patients at higher risk? Could they be reclassified as being at low risk if their calcium score was 0?8 Conversely, could some low-risk patients discover that they are at high risk and perhaps take action?
The ACC/AHA guidelines recommend against calcium scoring in these circumstances. One concern was that calcium scoring had not been tested with the Pooled Cohort Equation. Another concern related to cost and radiation exposure, but as Parikh et al point out, the cost has now fallen to less than $100, and radiation exposure is similar to that with mammography.
SHOULD WE TEST PATIENTS AT HIGH OR LOW RISK?
Who, then, should we test? For patients at high or low risk according to the Pooled Cohort Equation, 2 questions determine whether calcium scoring is warranted: how much would an extremely high or low score (ie, 0 or > 400) change the risk of an event, and how likely is an extreme score?
The first question relates to the usefulness of the test, the second to its cost-effectiveness. If even an extreme score cannot move a patient’s risk into or out of the treatment range, then testing is unwarranted. At the same time, if few patients have an extreme score, then cost per test that changes practice will be high.
Because calcium scoring is a direct test for disease, it is extremely predictive. When added to risk-factor models, it substantially improves discrimination9 and exhibits excellent calibration.10 This is true whether the outcome is a major cardiovascular event or death from any cause.
But the calcium score is not strong enough to override all other risk factors. A patient with a predicted 10-year risk of 18% according to the Pooled Cohort Equation and a calcium score of 0 could be reclassified as being at low risk, but a patient with a 10-year predicted risk of 35% could not. The same is true for patients at low risk. A patient with a 4% risk and a calcium score higher than 400 would be reclassified as being at high risk, but not a patient with a 1% risk.
Extreme calcium scores are common, especially in patients at high risk. In the Multi-Ethnic Study of Atherosclerosis (MESA) cohort, 45% of patients with a 10-year predicted risk of 7.5% to 20% had a calcium score of 0, reclassifying them into the low-risk category.11 Even if the predicted risk was greater than 20%, 1 in 4 patients had a score of 0. In contrast, if the 10-year predicted risk was below 5%, one-fifth of patients had a calcium score greater than 0, but only 4% had a score greater than 100.
Nevertheless, patients in the low-risk category whose baseline risk is close to 5% may wish to undergo calcium scoring, because a positive test opens the door to a potentially lifesaving treatment. In general, the closer patients are to the treatment threshold, the more likely they are to be reclassified by calcium scoring.
The Society for Cardiovascular Computed Tomography currently recommends coronary artery calcium scoring for patients whose 10-year risk is between 5% and 20%.12 These numbers are easy to remember and a reasonable approximation of the number of patients likely to benefit from testing.
COMBINING CALCIUM SCORING WITH TRADITIONAL RISK FACTORS
Primary care physicians interested in more exact personalized medicine can use a risk calculator derived from the MESA cohort.13 Based on 10-year outcomes for 6,814 participants, Blaha et al8 derived and validated this risk-prediction tool incorporating all the elements of the Pooled Cohort Equation in addition to family history, race, and calcium score.
The tool offered good discrimination and calibration when validated against 2 external cohorts (the Heinz Nixdorf Recall Study and the Dallas Heart Study).10 The C statistics were 0.78 and 0.82, with 10-year risk predicted by the tool within half a percent of the observed event rate in each cohort.
The online calculator displays the 10-year risk based on risk factors alone or including a calcium score, allowing the clinician to gauge the value of testing. For example, a 70-year-old nonsmoking white man with a total cholesterol level of 240 mg/dL, high-density lipoprotein cholesterol 40 mg/dL, and systolic blood pressure 130 mm Hg on amlodipine has a 15.2% 10-year risk (well above the 7.5% threshold for statin therapy). However, if his calcium score is 0, his risk falls to 4.3% (well below the threshold). Sharing such information with patients could help them to decide whether to undergo coronary artery calcium scoring.
Ultimately, the decision to take a statin for primary prevention of coronary artery disease is a personal one. It involves weighing risks, benefits, and preferences. Physicians can facilitate the process by providing information and guidance. Patients are best served by having the most accurate information. In many cases, that information should include calcium scoring.
References
Fixx JF. The Complete Book of Running. New York: Random House, 1977.
Goff DC, Jr, Lloyd-Jones DM, Bennett G, et al. 2013 ACC/AHA guideline on the assessment of cardiovascular risk: a report of the American College of Cardiology/American Heart Association Task Force on Practice Guidelines. Circulation 2014; 129(25 suppl 2):S49–S73. doi:10.1161/01.cir.0000437741.48606.98
Pencina MJ, Navar-Boggan AM, D’Agostino RB, Sr, et al. Application of new cholesterol guidelines to a population-based sample. N Engl J Med 2014; 370(15):1422–1431. doi:10.1056/NEJMoa1315665
Wilkins JT, Ning H, Berry J, Zhao L, Dyer AR, Lloyd-Jones DM. Lifetime risk and years lived free of total cardiovascular disease. JAMA 2012; 308(17):1795–1801. doi:10.1001/jama.2012.14312
Parikh P, Shah N, Ahmed H, Schoenhagen P, Fares M. Coronary artery calcium scoring: its practicality and clinical utility in primary care. Cleve Clin J Med 2018; 85(9):707–716. doi:10.3949/ccjm.85a.17097
Blaha MJ, Dardari ZA, Blumenthal RS, Martin SS, Nasir K, Al-Mallah MH. The new “intermediate risk” group: a comparative analysis of the new 2013 ACC/AHA risk assessment guidelines versus prior guidelines in men. Atherosclerosis 2014; 237(1):1–4. doi:10.1016/j.atherosclerosis.2014.08.024
Blaha MJ, Cainzos-Achirica M, Greenland P, et al. Role of coronary artery calcium score of zero and other negative risk markers for cardiovascular disease: the Multi-Ethnic Study of Atherosclerosis (MESA). Circulation 2016; 133(9):849–858. doi:10.1161/CIRCULATIONAHA.115.018524
Peters SAE, den Ruijter HM, Bots ML, Moons KGM. Improvements in risk stratification for the occurrence of cardiovascular disease by imaging subclinical atherosclerosis: a systematic review. Heart 2012; 98(3):177–184. doi:10.1136/heartjnl-2011-300747
McClelland RL, Jorgensen NW, Budoff M, et al. Ten-year coronary heart disease risk prediction using coronary artery calcium and traditional risk factors: derivation in the Multi-Ethnic Study of Atherosclerosis with validation in the Heinz Nixdorf Recall Study and the Dallas Heart Study. J Am Coll Cardiol 2015; 66(15):1643–1653. doi:10.1016/j.jacc.2015.08.035
Nasir K, Bittencourt MS, Blaha MJ, et al. Implications of coronary artery calcium testing among statin candidates according to American College of Cardiology/American Heart Association cholesterol management guidelines: MESA (Multi-Ethnic Study of Atherosclerosis). J Am Coll Cardiol 2015; 66(15):1657–1668. doi:10.1016/j.jacc.2015.07.066
Hecht H, Blaha MJ, Berman DS, et al. Clinical indications for coronary artery calcium scoring in asymptomatic patients: expert consensus statement from the Society of Cardiovascular Computed Tomography. J Cardiovasc Comput Tomogr 2017; 11(2):157–168. doi:10.1016/j.jcct.2017.02.010
Michael B. Rothberg, MD, MPH Vice-Chair for Research, Medicine Institute; Director, Center for Value-Based Care Research, Medicine Institute, Cleveland Clinic; Professor, Cleveland Clinic Lerner College of Medicine of Case Western Reserve University, Cleveland, OH
Address: Michael B. Rothberg, MD, MPH, Center for Value-Based Care Research, Medicine Institute, G10, Cleveland Clinic, 9500 Euclid Avenue, Cleveland, OH 44195; rothbem@ccf.org
Author and Disclosure Information
Michael B. Rothberg, MD, MPH Vice-Chair for Research, Medicine Institute; Director, Center for Value-Based Care Research, Medicine Institute, Cleveland Clinic; Professor, Cleveland Clinic Lerner College of Medicine of Case Western Reserve University, Cleveland, OH
Address: Michael B. Rothberg, MD, MPH, Center for Value-Based Care Research, Medicine Institute, G10, Cleveland Clinic, 9500 Euclid Avenue, Cleveland, OH 44195; rothbem@ccf.org
In 1984, Jim Fixx, who wrote The Complete Book of Running,1 went out for his daily run and died of a massive heart attack. He was 48. Unbeknownst to him, he had 3-vessel coronary artery disease.
His case illustrates the difficulty of diagnosing coronary artery disease in patients who have no symptoms of it. For many, the initial presentation is myocardial infarction or death. Until recently, there was no reliable way to diagnose subclinical coronary artery disease other than angiography, and there is still no way to rule it out. As a result, physicians have concentrated less on diagnosing subclinical disease and more on assessing the risk of myocardial infarction.
ASSESSING RISK
The risk factors for coronary artery disease (age, male sex, smoking, hypertension, and cholesterol) have been well known for half a century. By combining risk factors with the appropriate weighting, it is possible to predict an individual’s risk of a myocardial infarction.
In 2013, the American College of Cardiology/American Heart Association (ACC/AHA) guidelines applied this risk-based approach to prescribing statins for primary prevention.2 Instead of focusing on low-density lipoprotein cholesterol concentration, which by itself is a poor predictor of myocardial infarction, they recommended using the Pooled Cohort Equation3 to determine the risk of a cardiovascular event within 10 years. For patients at high risk (> 7.5%), the benefits of a statin generally outweigh the harms. For those at low risk (< 5%), the opposite is true. For patients in between, there is room for shared decision-making.
Debate has focused on the predictive accuracy of the equation, the threshold for treatment, and the fact that almost all men over 60 qualify for treatment.4 These objections stem from the focus on risk rather than on diagnosis of the underlying disease.
Because one-third of “high-risk” patients never develop cardiovascular disease,5 the risk-based approach necessitates overtreatment. Those without disease cannot benefit from treatment but nonetheless suffer its side effects, cost, and inconvenience. Raising treatment thresholds (eg, treating only patients whose 10-year risk exceeds 10%) improves the ratio of patients with disease to those without but also misses diseased patients who have few risk factors. “Low risk” is not “no risk.”
TESTING FOR DISEASE IN THOSE AT INTERMEDIATE RISK
Diagnostic testing is preferred if such testing is safe and inexpensive.
In this issue of Cleveland Clinic Journal of Medicine, Parikh and colleagues6 review coronary artery calcium scoring, a diagnostic test for coronary artery disease. They conclude that calcium scoring is strongly predictive but should be reserved for patients at intermediate risk to help them decide about treatment. This is clearly the right approach, but the authors leave the term “intermediate” undefined, and their clinical examples offer little guidance as to where the borders lie.
The ACC/AHA guidelines specify a narrow intermediate range (5.0%–7.4%). For these patients, calcium scoring could reclassify most as being at high or low risk, helping to clarify whether statins are indicated.
However, only 12% of patients fall into this category.7 What about patients at higher risk? Could they be reclassified as being at low risk if their calcium score was 0?8 Conversely, could some low-risk patients discover that they are at high risk and perhaps take action?
The ACC/AHA guidelines recommend against calcium scoring in these circumstances. One concern was that calcium scoring had not been tested with the Pooled Cohort Equation. Another concern related to cost and radiation exposure, but as Parikh et al point out, the cost has now fallen to less than $100, and radiation exposure is similar to that with mammography.
SHOULD WE TEST PATIENTS AT HIGH OR LOW RISK?
Who, then, should we test? For patients at high or low risk according to the Pooled Cohort Equation, 2 questions determine whether calcium scoring is warranted: how much would an extremely high or low score (ie, 0 or > 400) change the risk of an event, and how likely is an extreme score?
The first question relates to the usefulness of the test, the second to its cost-effectiveness. If even an extreme score cannot move a patient’s risk into or out of the treatment range, then testing is unwarranted. At the same time, if few patients have an extreme score, then cost per test that changes practice will be high.
Because calcium scoring is a direct test for disease, it is extremely predictive. When added to risk-factor models, it substantially improves discrimination9 and exhibits excellent calibration.10 This is true whether the outcome is a major cardiovascular event or death from any cause.
But the calcium score is not strong enough to override all other risk factors. A patient with a predicted 10-year risk of 18% according to the Pooled Cohort Equation and a calcium score of 0 could be reclassified as being at low risk, but a patient with a 10-year predicted risk of 35% could not. The same is true for patients at low risk. A patient with a 4% risk and a calcium score higher than 400 would be reclassified as being at high risk, but not a patient with a 1% risk.
Extreme calcium scores are common, especially in patients at high risk. In the Multi-Ethnic Study of Atherosclerosis (MESA) cohort, 45% of patients with a 10-year predicted risk of 7.5% to 20% had a calcium score of 0, reclassifying them into the low-risk category.11 Even if the predicted risk was greater than 20%, 1 in 4 patients had a score of 0. In contrast, if the 10-year predicted risk was below 5%, one-fifth of patients had a calcium score greater than 0, but only 4% had a score greater than 100.
Nevertheless, patients in the low-risk category whose baseline risk is close to 5% may wish to undergo calcium scoring, because a positive test opens the door to a potentially lifesaving treatment. In general, the closer patients are to the treatment threshold, the more likely they are to be reclassified by calcium scoring.
The Society for Cardiovascular Computed Tomography currently recommends coronary artery calcium scoring for patients whose 10-year risk is between 5% and 20%.12 These numbers are easy to remember and a reasonable approximation of the number of patients likely to benefit from testing.
COMBINING CALCIUM SCORING WITH TRADITIONAL RISK FACTORS
Primary care physicians interested in more exact personalized medicine can use a risk calculator derived from the MESA cohort.13 Based on 10-year outcomes for 6,814 participants, Blaha et al8 derived and validated this risk-prediction tool incorporating all the elements of the Pooled Cohort Equation in addition to family history, race, and calcium score.
The tool offered good discrimination and calibration when validated against 2 external cohorts (the Heinz Nixdorf Recall Study and the Dallas Heart Study).10 The C statistics were 0.78 and 0.82, with 10-year risk predicted by the tool within half a percent of the observed event rate in each cohort.
The online calculator displays the 10-year risk based on risk factors alone or including a calcium score, allowing the clinician to gauge the value of testing. For example, a 70-year-old nonsmoking white man with a total cholesterol level of 240 mg/dL, high-density lipoprotein cholesterol 40 mg/dL, and systolic blood pressure 130 mm Hg on amlodipine has a 15.2% 10-year risk (well above the 7.5% threshold for statin therapy). However, if his calcium score is 0, his risk falls to 4.3% (well below the threshold). Sharing such information with patients could help them to decide whether to undergo coronary artery calcium scoring.
Ultimately, the decision to take a statin for primary prevention of coronary artery disease is a personal one. It involves weighing risks, benefits, and preferences. Physicians can facilitate the process by providing information and guidance. Patients are best served by having the most accurate information. In many cases, that information should include calcium scoring.
References
Fixx JF. The Complete Book of Running. New York: Random House, 1977.
Goff DC, Jr, Lloyd-Jones DM, Bennett G, et al. 2013 ACC/AHA guideline on the assessment of cardiovascular risk: a report of the American College of Cardiology/American Heart Association Task Force on Practice Guidelines. Circulation 2014; 129(25 suppl 2):S49–S73. doi:10.1161/01.cir.0000437741.48606.98
Pencina MJ, Navar-Boggan AM, D’Agostino RB, Sr, et al. Application of new cholesterol guidelines to a population-based sample. N Engl J Med 2014; 370(15):1422–1431. doi:10.1056/NEJMoa1315665
Wilkins JT, Ning H, Berry J, Zhao L, Dyer AR, Lloyd-Jones DM. Lifetime risk and years lived free of total cardiovascular disease. JAMA 2012; 308(17):1795–1801. doi:10.1001/jama.2012.14312
Parikh P, Shah N, Ahmed H, Schoenhagen P, Fares M. Coronary artery calcium scoring: its practicality and clinical utility in primary care. Cleve Clin J Med 2018; 85(9):707–716. doi:10.3949/ccjm.85a.17097
Blaha MJ, Dardari ZA, Blumenthal RS, Martin SS, Nasir K, Al-Mallah MH. The new “intermediate risk” group: a comparative analysis of the new 2013 ACC/AHA risk assessment guidelines versus prior guidelines in men. Atherosclerosis 2014; 237(1):1–4. doi:10.1016/j.atherosclerosis.2014.08.024
Blaha MJ, Cainzos-Achirica M, Greenland P, et al. Role of coronary artery calcium score of zero and other negative risk markers for cardiovascular disease: the Multi-Ethnic Study of Atherosclerosis (MESA). Circulation 2016; 133(9):849–858. doi:10.1161/CIRCULATIONAHA.115.018524
Peters SAE, den Ruijter HM, Bots ML, Moons KGM. Improvements in risk stratification for the occurrence of cardiovascular disease by imaging subclinical atherosclerosis: a systematic review. Heart 2012; 98(3):177–184. doi:10.1136/heartjnl-2011-300747
McClelland RL, Jorgensen NW, Budoff M, et al. Ten-year coronary heart disease risk prediction using coronary artery calcium and traditional risk factors: derivation in the Multi-Ethnic Study of Atherosclerosis with validation in the Heinz Nixdorf Recall Study and the Dallas Heart Study. J Am Coll Cardiol 2015; 66(15):1643–1653. doi:10.1016/j.jacc.2015.08.035
Nasir K, Bittencourt MS, Blaha MJ, et al. Implications of coronary artery calcium testing among statin candidates according to American College of Cardiology/American Heart Association cholesterol management guidelines: MESA (Multi-Ethnic Study of Atherosclerosis). J Am Coll Cardiol 2015; 66(15):1657–1668. doi:10.1016/j.jacc.2015.07.066
Hecht H, Blaha MJ, Berman DS, et al. Clinical indications for coronary artery calcium scoring in asymptomatic patients: expert consensus statement from the Society of Cardiovascular Computed Tomography. J Cardiovasc Comput Tomogr 2017; 11(2):157–168. doi:10.1016/j.jcct.2017.02.010
To the Editor: We read with interest the article by Cikach et al on thoracic aortic aneurysm.1 For medical management of this condition, the authors emphasized controlling blood pressure and heart rate and also avoiding isometric exercises and heavy lifting. In addition to their recommendations, we believe there is plausible evidence to advise caution if fluoroquinolone antibiotics are used in this setting.
Three large population-based studies, from Canada,2 Taiwan,3 and Sweden,4 collectively demonstrated a significant 2-fold increase in the incidence of aortic aneurysm and dissection presenting within 60 days of fluoroquinolone use compared with other antibiotic exposure. Moreover, a longer duration of fluoroquinolone use was associated with a significantly higher incidence of aortic aneurysm and dissection.3
Mechanistically, fluoroquinolones have been shown to up-regulate production of several matrix metalloproteinases, including metalloproteinase 2, leading to degradation of type I collagen.2,5 Type I and type III are the dominant collagens in the aortic wall, and collagen degradation is implicated in aortic aneurysm formation and expansion.
Fluoroquinolones are widely prescribed in both outpatient and inpatient settings and are sometimes used for long durations in the geriatric population.2 It is possible that these drugs have a propensity to increase aortic aneurysm expansion and dissection in older patients who already have aortic aneurysm. Accordingly, this might make the risk-benefit ratio unfavorable for using these drugs in these situations, and other antibiotics should be used, if indicated.
Furthermore, if fluoroquinolones are used in patients with aortic aneurysm, perhaps imaging studies of the aneurysm should be done more frequently than once a year to detect accelerated aneurysm growth. Finally, physicians should be aware of the possibility of increased aortic aneurysm expansion and dissection with fluoroquinolone use.
References
Cikach F, Desai MY, Roselli EE, Kalahasti V. Thoracic aortic aneurysm: how to counsel, when to refer. Cleve Clin J Med 2018; 85(6):481–492. doi:10.3949/ccjm.85a.17039
Daneman N, Lu H, Redelmeier DA. Fluoroquinolones and collagen associated severe adverse events: a longitudinal cohort study. BMJ Open 2015; 5:e010077. doi:10.1136/bmjopen-2015-010077
Lee C-C, Lee MG, Chen Y-S, et al. Risk of aortic dissection and aortic aneurysm in patients taking oral fluoroquinolone. JAMA Intern Med 2015; 175:1839–1847. doi:10.1001/jamainternmed.2015.5389
Pasternak B, Inghammar M, Svanström H. Fluoroquinolone use and risk of aortic aneurysm and dissection: nationwide cohort study. BMJ Open 2018; 360:k678. doi:10.1136/bmj.k678
Tsai W-C, Hsu C-C, Chen CPC, et al. Ciprofloxacin up-regulates tendon cells to express matrix metalloproteinase-2 with degradation of type I collagen. J Orthop Res 2011; 29(1):67–73. doi:10.1002/jor.21196
To the Editor: We read with interest the article by Cikach et al on thoracic aortic aneurysm.1 For medical management of this condition, the authors emphasized controlling blood pressure and heart rate and also avoiding isometric exercises and heavy lifting. In addition to their recommendations, we believe there is plausible evidence to advise caution if fluoroquinolone antibiotics are used in this setting.
Three large population-based studies, from Canada,2 Taiwan,3 and Sweden,4 collectively demonstrated a significant 2-fold increase in the incidence of aortic aneurysm and dissection presenting within 60 days of fluoroquinolone use compared with other antibiotic exposure. Moreover, a longer duration of fluoroquinolone use was associated with a significantly higher incidence of aortic aneurysm and dissection.3
Mechanistically, fluoroquinolones have been shown to up-regulate production of several matrix metalloproteinases, including metalloproteinase 2, leading to degradation of type I collagen.2,5 Type I and type III are the dominant collagens in the aortic wall, and collagen degradation is implicated in aortic aneurysm formation and expansion.
Fluoroquinolones are widely prescribed in both outpatient and inpatient settings and are sometimes used for long durations in the geriatric population.2 It is possible that these drugs have a propensity to increase aortic aneurysm expansion and dissection in older patients who already have aortic aneurysm. Accordingly, this might make the risk-benefit ratio unfavorable for using these drugs in these situations, and other antibiotics should be used, if indicated.
Furthermore, if fluoroquinolones are used in patients with aortic aneurysm, perhaps imaging studies of the aneurysm should be done more frequently than once a year to detect accelerated aneurysm growth. Finally, physicians should be aware of the possibility of increased aortic aneurysm expansion and dissection with fluoroquinolone use.
References
Cikach F, Desai MY, Roselli EE, Kalahasti V. Thoracic aortic aneurysm: how to counsel, when to refer. Cleve Clin J Med 2018; 85(6):481–492. doi:10.3949/ccjm.85a.17039
Daneman N, Lu H, Redelmeier DA. Fluoroquinolones and collagen associated severe adverse events: a longitudinal cohort study. BMJ Open 2015; 5:e010077. doi:10.1136/bmjopen-2015-010077
Lee C-C, Lee MG, Chen Y-S, et al. Risk of aortic dissection and aortic aneurysm in patients taking oral fluoroquinolone. JAMA Intern Med 2015; 175:1839–1847. doi:10.1001/jamainternmed.2015.5389
Pasternak B, Inghammar M, Svanström H. Fluoroquinolone use and risk of aortic aneurysm and dissection: nationwide cohort study. BMJ Open 2018; 360:k678. doi:10.1136/bmj.k678
Tsai W-C, Hsu C-C, Chen CPC, et al. Ciprofloxacin up-regulates tendon cells to express matrix metalloproteinase-2 with degradation of type I collagen. J Orthop Res 2011; 29(1):67–73. doi:10.1002/jor.21196
To the Editor: The review of thoracic aortic aneurysm by Cikach et al1 was excellent. However, we noted that referral for clinical genetic counseling and testing is suggested only if 1 or more first-degree relatives have aneurysmal disease.
Absence of a family history does not rule out syndromic aortopathy, which can occur de novo. In addition, a clinical diagnosis of syndromic aortopathy can be made on the basis of physical features that can be very subtle, such as pectus deformities, scoliosis, dolichostenomelia, joint hypermobility or contractures, craniofacial features, or skin fragility.2
Genetic counseling is paramount even if molecular testing is negative or inconclusive, which can occur in more than 50% of patients referred.3 Clinical genetic evaluation would also facilitate testing for other family members who may be affected, and would help to coordinate care for nonvascular conditions that may be associated with the syndrome.
References
Cikach F, Desai MY, Roselli EE, Kalahasti V. Thoracic aortic aneurysm: how to counsel, when to refer. Cleve Clin J Med 2018; 85(6):481–492. doi:10.3949/ccjm.85a.17039
McKusick-Nathans Institute of Genetic Medicine, Johns Hopkins University. OMIM. Online mendelian inheritance in man. https://omim.org. Accessed July 31, 2018.
Mazine A, Moryousef-Abitbol JH, Faghfoury H, Meza JM, Morel C, Ouzounian M. Yield of genetic testing in patients with thoracic aortic disease. J Am Coll Cardiol 2017; 69(11):2005. doi:10.1016/S0735-1097(17)35394-9
To the Editor: The review of thoracic aortic aneurysm by Cikach et al1 was excellent. However, we noted that referral for clinical genetic counseling and testing is suggested only if 1 or more first-degree relatives have aneurysmal disease.
Absence of a family history does not rule out syndromic aortopathy, which can occur de novo. In addition, a clinical diagnosis of syndromic aortopathy can be made on the basis of physical features that can be very subtle, such as pectus deformities, scoliosis, dolichostenomelia, joint hypermobility or contractures, craniofacial features, or skin fragility.2
Genetic counseling is paramount even if molecular testing is negative or inconclusive, which can occur in more than 50% of patients referred.3 Clinical genetic evaluation would also facilitate testing for other family members who may be affected, and would help to coordinate care for nonvascular conditions that may be associated with the syndrome.
References
Cikach F, Desai MY, Roselli EE, Kalahasti V. Thoracic aortic aneurysm: how to counsel, when to refer. Cleve Clin J Med 2018; 85(6):481–492. doi:10.3949/ccjm.85a.17039
McKusick-Nathans Institute of Genetic Medicine, Johns Hopkins University. OMIM. Online mendelian inheritance in man. https://omim.org. Accessed July 31, 2018.
Mazine A, Moryousef-Abitbol JH, Faghfoury H, Meza JM, Morel C, Ouzounian M. Yield of genetic testing in patients with thoracic aortic disease. J Am Coll Cardiol 2017; 69(11):2005. doi:10.1016/S0735-1097(17)35394-9
In Reply: We thank Drs. Goldstein and Mascitelli for their comments regarding fluoroquinolones and thoracic aortic aneurysms. We acknowledge that fluoroquinolones (particularly ciprofloxacin) have been associated with a risk of aortic aneurysm and dissection based on large observational studies from Taiwan, Canada, and Sweden. Although all of the studies have shown an association between ciprofloxacin and aortic aneurysm, the causative role is not well established. In addition, the numbers of events were very small in these large cohorts of patients. In our large tertiary care practice at Cleveland Clinic, we have very few patients with aortic aneurysm or dissection who have used fluoroquinolones.
We recognize the association; however, our paper was intended to emphasize the more common causes and treatment options that primary care physicians are likely to encounter in routine practice.
We also thank Drs. Ayoubieh and MacCarrick for their comments about genetic counseling. We agree that genetic counseling is important, as is a detailed physical examination for subtle features of genetically mediated aortic aneurysm. In fact, we incorporate the physical examination when patients are seen at our aortic center so as to recognize the physical features. We do routinely recommend screening of first-degree relatives even without significant family history on an individual basis and make appropriate referrals for other conditions that can be seen in these patients. Our article, however, is primarily intended to emphasize the importance of referring these patients for more-focused care at a specialized center, where we incorporate all of the suggestions that were made.
Benzodiazepines (BZDs) are among the most commonly prescribed medications. A recent study found that in 2008, more than 5% of Americans used a BZD, and the percentage was almost 9% among Americans aged ≥ 65 years.1,2 Among veterans, BZD use is even higher, in part because of the high prevalence of posttraumatic stress disorder (PTSD). One study found that more than 30% of veterans with PTSD received at least 1 BZD prescription.3 The risks associated with BZD treatment for PTSD are compounded by concurrent use of other sedatives and opioids prescribed for co-occurring chronic pain and insomnia.3
Older adults metabolize long-acting BZDs more slowly and generally have an increased sensitivity to the adverse effects (AEs) of all BZDs.4 In older adults, BZD use has been associated with cognitive decline, dementia, falls and consequent fractures, and adverse respiratory outcomes.5-12 The risk of most but not all of these AEs was increased with higher BZD dose or long-term BZD use, which this quality improvement project (QIP) defines as having at least a 60-day supply of BZD prescriptions dispensed within the past year.
Long-term BZD use increases with age. One study found that, among patients receiving a BZD, the rate of long-term BZD use was more than double in older adults (31.4%) than it was in adults aged between 18 and 35 years (14.7%).2 For these reasons, the 2012 Beers criteria of the American Geriatrics Society recommend avoiding all types of BZDs in the treatment of insomnia, agitation, or delirium in patients aged > 65 years.13 Despite this recommendation, the prevalence of BZD use in older adults remains high.14
Some innovative approaches have been developed to address the inappropriate use, including overuse and misuse, of BZDs in older adults.15 In one approach, direct-to-consumer (DTC) information is used to empower patients to collaborate with their physician to manage their health. Results from several studies suggest that providing older patients with information on BZD risks and benefits increases patient–physician interaction and thereby decreases inappropriate BZD use and improves health outcomes.4,16,17 One study found that perceptions of BZD risks increased 1 week after exposure to a DTC educational brochure (EB), with intention to discuss BZD discontinuation with their physician higher for patients who received the EB than it was for those who did not (83.1% vs 44.3%; P < .0001).16 The EMPOWER (Eliminating Medications Through Patient Ownership of End Results) cluster randomized controlled trial assessed the effectiveness of a DTC EB focused on BZD risks in older adults.17 In that seminal study, patients who received a DTC EB were more likely than were comparison patients to discontinue BZD within 6 months (27% vs 5%; risk difference, 23%; 95% CI, 14%-32%).
The Veterans Integrated Systems Network (VISN) 22 Academic Detailing Program is a pharmacy educational outreach program that uses unbiased clinical guidelines to promote physicians’ safety initiatives and align prescribing behavior with best practices.18-20 With BZD use among older veterans remaining high, the VISN 22 program initiated a clinical QIP modeled on the EMPOWER trial. Veterans in VISN 22 received the DTC EB, which included information on BZD risks and encouraged them to discuss their BZD treatment with their health care provider. VISN 22 was the first VISN in the VHA to implement the EMPOWER protocol.
As this was a QIP, all eligible veterans in VISN 22 were mailed the DTC EB, thus making it difficult to estimate the impact of the EB on BZD discontinuation in this VISN. Therefore, DTC EB efficacy was estimated by comparing BZD discontinuation between VISN 22 and VISN 21, an adjacent VISN that did not mail the DTC EB. To reduce selection bias associated with different controls in the 2 VISNs, the authors performed propensity score matching (PSM) to balance the covariates and provide an unbiased estimate of the mean treatment effect of the DTC EB in VISN 22 veterans who were included in the initial descriptive QIP and received the EB; these veterans were compared with VISN 21 veterans who did not receive the EB.
Methods
Two QIPs were undertaken to determine the impact of DTC EB on BZD use in older veterans in the VHA.
Quality Improvement Project 1
Design. A retrospective cohort analysis was performed. The VISN 22 catchment area, which encompasses VA facilities and clinics in southern California and southern Nevada, serves about 500,000 veterans, a substantial proportion of whom are aged ≥ 65 years. Among these older veterans are active long-term BZD users, who were defined as having ≥ 60-day supply of BZD prescriptions dispensed within the past year. Each active long-term user with a BZD prescription released within 200 days before the index date (the date the user was to meet with the prescribing physician) was mailed an EB 2 to 8 weeks in advance of the visit. Excluded from analysis were veterans with a schizophrenia, spinal cord injury, or seizure disorder diagnosis recorded in both their inpatient and outpatient medical records; veterans seen by Palliative Care within the past year; and veterans who died before analysis was completed.
Education Brochure. The EB for VISN 22 (Figure 1, see
) was almost identical to the EB used in the EMPOWER trial.17 The language of the EMPOWER brochure was retained, but veteran-related images were added, and the BZD taper schedule was removed. Tannenbaum and colleagues incorporated constructivist learning into the Test Your Knowledge section of the EB.
Users interact with this section, acquire new knowledge, and reflect on what they already know. Also incorporated is cognitive dissonance, which motivates users to change by confronting inconsistencies in what they know about BZD safety and efficacy. The EB mailed to veterans included a peer champion’s story of successful discontinuation of BZDs. Reading this story is thought to lead to self-identification with the champion’s success, self-efficacy, and confidence in discontinuing BZDs.
Patients. The sample consisted of all veterans identified as meeting the inclusion criteria and being enrolled in VISN 22. The EB was mailed once to veterans on a rolling basis from December 2014 to February 2016. Change in BZD use was analyzed only after 9 to 24 months had passed since the index appointment with the prescribing physician. This period included 12 weeks for BZD taper and then 6 months after taper.
Analysis. For each veteran, monthly mean lorazepam equivalent (LE) was calculated using as many as 12 fills before the index date. Average daily dose of LE was calculated by dividing the sum of LE from all included prescriptions by total number of days between the first fill and the index date. The BZD prescription fills were evaluated after the index date. Veterans who received at least 1 prescription after the index date but then had no BZD prescription activity in VA clinics for 3 consecutive months during the 9-month observation period were recorded as having tapered and then discontinued BZD. Veterans who had no BZD prescription activity in VA clinics after the index date and during the 9-month observation period were recorded as having discontinued BZD without tapering. For veterans who had BZD prescription activity in VA clinics after the index date and during the 9-month observation period, mean LE was calculated by dividing the total LE for BZD prescriptions after the index date by number of days from the first fill after the index date to the date of analysis.
Quality Improvement Project 2
Design. A retrospective cohort analysis using PSM was performed on a subgroup of the QIP-1 sample to evaluate the impact of EB on BZD prescribing in the VA during 2 periods: 6 to 9 months and 6 to 12 months after the index date. A secondary outcome was discontinuation 1 to 12 months after the index date. Veterans in the analysis were active long-term BZD users, had at least 1 BZD prescription released within 200 days before the index date, were aged ≥ 65 years, and had an appointment scheduled with their BZD prescriber within 2 to 8 weeks (Figure 2).
Excluded from analysis were veterans with a schizophrenia, spinal cord injury, or seizure disorder diagnosis recorded in both their inpatient and outpatient diagnosis medical records and veterans seen by palliative care within the past year. The authors performed an initial descriptive naïve analysis and then a naïve logistic regression analysis.
Patients. VISN 22 implemented QIP-2, a real-world application of a modified EMPOWER program, by identifying eligible veterans on a rolling basis from December 2014 to August 2015. All veterans who were identified and sent an EB during this period were included in the case group. The index date was defined as the first of the month the EB was mailed. Veterans with a pending appointment were chosen because the lead time would allow them to receive the EB and prepare to discuss it with the physician during the visit.
A comparator group was drawn from the adjacent VISN 21 catchment area, which encompasses VA facilities and clinics in Hawaii, northern California, and northern Nevada. During the observation period, VISN 21 did not mail any EBs specifically addressing BZD risks. Veterans in the comparator group had an appointment scheduled with their BZD prescribing physician within 4 weeks, were aged ≥ 65 years on the index date (first of the month before the next appointment, coinciding with the date EBs were sent to VISN 22 veterans), were active long-term BZD users, and had at least 1 BZD prescription released within 200 days before the index date. All patients were followed for up to 12 months after the index date, with BZD discontinuation recorded 9 and 12 months after the index date.
Propensity Score Matching
Propensity score (PS) was estimated with logistic regression analysis with treatment as the dependent variable and baseline characteristics as the independent variables.21,22 One-to-one matching on the PS was performed using the nearest neighbor approach without replacements. Independent variables related to outcome but unrelated to EB exposure were selected for PS development.22 These variables included year of birth; male sex; Hispanic ethnicity; annual income; service connection status; region; body mass index; Charlson Comorbidity Index category; total baseline BZD dose; and diagnosis of AIDS, nonmetastatic cancer, metastatic cancer, chronic obstructive pulmonary disease (COPD), congestive heart failure (CHF), dementia, diabetes mellitus (DM), DM with complications, gastroesophageal reflux disease (GERD), general anxiety disorder (GAD), hemiparaplegia, liver disease (mild), liver disease (moderate to severe), myocardial infarction (MI), Parkinson disease, peptic ulcer disease (PUD), psychosis, renal disease, rheumatoid arthritis (RA), or substance use disorder (SUD).
The EMPOWER cluster randomized controlled trial (RCT) demonstrated the effectiveness of EB exposure in a Canadian population of elderly patients who were long-term BZD users.17 Randomized controlled trials are the gold standard for clinical trials because they can establish causal inference.23-25 Given ethical and practical concerns, however, RCTs cannot be applied to all clinical scenarios. Although EMPOWER is reported to be an effective tool in reducing BZD use in older adults, its application in a real-world, large, integrated health care system remains untested. Observational studies are often conducted as an alternative to RCTs but are subject to selection bias because of their lack of randomization.26 Therefore, robust research methods are needed to generate unbiased estimates of the impact of an intervention on an outcome. Propensity score matching simulates an RCT by balancing the covariates across treatment groups.21,22,27 Observed patient characteristics are used to estimate PS, the probability that treatment will be received. Logistic or probit regression is used to balance the potential confounding covariates between the treatment groups.Once PSs are known, mean treatment effect can be estimated without the mean model.28 In other words, PSM methods can be used to generate an unbiased estimate of the treatment.
Propensity Score Analysis
Baseline characteristics were compared using Student t test (continuous variables) and χ2 test (discrete variables). Results are presented as means and standard deviations (continuous variables) and frequency and percentage (discrete variables).
The main outcome was BZD discontinuation 9 and 12 months after the index date. A postindex lag of 6 months was used to capture any tapering (Figure 2). Discontinuation, defined as 3 consecutive months of no BZD prescription on hand, was measured for 2 periods: 6 to 9 months and 6 to 12 months after the index date. A secondary outcome was discontinuation 1 to 12 months after the index date. An estimate was made of the difference in the proportions of BZD discontinuers who received the EB and BZD discontinuers who did not receive the EB, where mean treatment (risk difference) was presented as the absolute risk difference with a 95% CI. Standard errors and 95% CIs for the risk differences were generated with biased-corrected CIs from 1,000 bootstrap samples.
Sensitivity Analyses
Naïve multivariate logistic regression analysis was performed to evaluate the association between EB exposure and BZD discontinuation while controlling for potential confounders. Results are presented as odds ratios (ORs) and 95% CIs. Confounders identified were the same covariates used to generate the PSs.
Several analyses were performed to test the sensitivity of the methods applied using PSM by changing caliber size while maintaining the nearest neighbor approach without replacement. Linear regression analysis was performed with robust standard errors to estimate the risk difference of BZD discontinuation between EB-exposed and EB-unexposed veterans.
Statistical significance was set at P < .05. All statistical analyses were performed with Stata/SE Version 13 (College Station, TX).
Results
Quality Improvement Project 1
On a rolling basis from December 2014 to February 2016, the EB was mailed once to 3,896 VISN 22 veterans 2 to 8 weeks before a clinic appointment with their BZD prescribing physician.
Of these veterans, 1,847 (47.4%) decreased their BZD dose; 458 (11.7%) tapered and then discontinued BZD (at least 1 prescription after index date, then no refill for at least 3 consecutive months); 455 (11.7%) immediately discontinued BZD (no refill for at least 3 consecutive months after index date); 607 (15.6%) increased their dose; and 529 (13.6%) did not change their dose.
For the 1,847 veterans who decreased their dose, average daily dose (ADD) before index date was 3.17 mg LE, ADD reduction was 1.12 mg LE, and final ADD was 2.04 mg LE; of these veterans, 596 (32.3%) reduced their ADD more than 50% (ADD before index date, 2.68 mg LE; final ADD, 0.86 mg LE). The data are summarized in Table 1 and Figure 3.
Quality Improvement Project 2
Of all the VISN 22 and VISN 21 veterans, 24,420 met the inclusion and exclusion criteria. Of these 24,420 veterans, 2,020 (8.3%) were in VISN 22 and received the EB between December 2014 and August 2015 (QIP-1), and 22,400 (91.7%) were in VISN 21 and did not receive the EB.
Naïve Results Before PS Matching. In the naïve analyses, a larger proportion of EB-exposed vs unexposed veterans discontinued BZD; in addition, reductions were 6.6%, 7.4%, and 9.5% larger for 6 to 9 months, 6 to 12 months, and 1 to 12 months after the index date, respectively (P < .0001 for all comparisons; Table 2).
After controlling for potential confounders, the naïve logistic regression analyses found EB exposure was significantly associated with 44%, 32%, and 42% increases in the odds of BZD discontinuation for 6 to 9 months, 6 to 12 months, and 1 to 12 months after the index date, respectively (Table 3).
Propensity Score Matching. Before matching, there were significant differences in baseline characteristics of veterans who met the inclusion and exclusion criteria, with few exceptions (eAppendices 2 and 3, ).
After PSM, mean bias was reduced from 6.5% to 1.8%. A total of 2,632 veterans (1,316 in each group) matched according to PSM criteria.
After matching, there were no significant differences in baseline characteristics of EB-exposed and EB-unexposed veterans (eAppendix 4).
Propensity Score Matching Results. Inspection of PSs revealed good coverage across treatment groups on a histogram plot and a kernel density plot (eAppendices 5 and 6).
Table 4 lists the results of the PSM approaches. Risk differences in discontinuing BZD ranged from 6.6% to 6.9% for 6 to 9 months and from 6.5% to 7.1% for 6 to 12 months, in both cases benefiting EB-exposed veterans.
Regarding the secondary outcome, a higher proportion of EB-exposed versus -unexposed veterans (7.35%-8.92%) discontinued BZD between 1 and 12 months. All risk differences in the sensitivity analyses were significant at α = 0.05 (2-tailed).
Discussion
This QIP was the first to evaluate the impact of an EMPOWER-modeled DTC EB in a large, integrated health care system in the U.S. It was also the first to demonstrate potential benefits of a DTC EB designed for older veterans who are long-term BZD users. In this QIP, which mailed the EB to 3,896 veterans, 1,847 (47.4%) decreased their BZD dose, 458 (11.7%) tapered and then discontinued BZD, and 455 (11.7%) immediately discontinued BZD. The total percentage of veterans who discontinued BZD (23.4%; 913/3,896) was similar to the 27% reported in the EMPOWER trial.17 However, the risk difference between the 1,316 EB-exposed VISN 22 veterans (QIP-1) and the 1,316 EB-unexposed VISN 21 veterans in this QIP was significantly lower than the 23% risk difference in EMPOWER (though it still demonstrated a significantly larger reduction for EB-exposed veterans).17
Given this inclusion of all qualifying veterans from the catchment area studied in this QIP, and given the ethical and practical concerns, an RCT was not possible. Therefore, PSM methods were used to balance the covariates across treatment groups and thereby simulate an RCT.21,22,27 With use of the PSM approach, findings from the descriptive analysis were confirmed and potential selection bias reduced.
Study Limitations
The less robust risk difference found in this QIP has several possible explanations. The authors’ use of a DTC EB coincided with a national VA effort to reduce older veterans’ use of BZDs and other inappropriate medications. For instance, during the study period, academic detailing was being implemented to reduce use of BZDs, particularly in combination with opioids, across VHA facilities and clinics. (Academic detailing is a pharmacy educational outreach program that uses unbiased clinical guidelines to promote physicians’ safety initiatives and align prescribing behavior with best practices.18-20) However, QIP-2 results and PS analysis of a subgroup of the original sample suggest that EB-exposed veterans were significantly more likely than were their unexposed counterparts were to discontinue BZD. To an extent, this analysis controlled for these other efforts to reduce BZD use in VHA clinics and can be considered a study strength.
Another limitation is the study design, which lacked a control group and did not consider the possibility that some facility or clinic physicians might influence others. Although the region variable was controlled for in PSM, the authors did not capture facility characteristics, including frequency of prescribing BZD and use of a protocol for enforcing the Beers criteria. Such confounders might have influenced outcomes. Unlike the EMPOWER trial,17 this QIP did not assess or exclude cognitively impaired veterans. It is reasonable to assume that these veterans might not understand some EB messages and consequently might fail to engage their physicians. Failure to initiate discussion with a physician would attenuate the impact of the EB.
Study Strengths
A strength of this QIP was its use of a DTC EB in a large, regional sample of older veterans in a real-world clinical setting. In addition, the study group (EB-exposed veterans) and the comparator group (EB-unexposed veterans) were from similar geographic areas (primarily California and Nevada).
Conclusion
Results of this study suggest that a DTC EB, designed to reduce BZD use among older veterans, was effective in helping patients lower their BZD dose and discontinue BZD. The likelihood of discontinuing BZD 9 and 12 months after the index date was significantly higher for veterans who received an EB modeled on the EMPOWER educational brochure than for a comparator group of veterans who did not receive the EB and were receiving care during the same observation period. In the future, it would be beneficial to use a design that controls for physician exposure to academic detailing focused on BZD reduction and that accounts for the cluster effects of facility practice. Despite these limitations, this QIP is the first real-world empirical example of using an EMPOWER-modeled DTC EB to decrease BZD use among older veterans. Furthermore, these results suggest that a DTC EB can be used to target other high-risk prescription drugs, such as opioids, particularly if alternative treatment options can be provided.
Acknowledgments Dr. Hauser thanks Cathy, Anika, Katia, and Max Hauser, and Alba and Kevin Quinlan, for their support. In memory of Jirina Hauser, who died on Mother’s Day, May 14, 2017, at the age of 100.
References
1. Dell’osso B, Lader M. Do benzodiazepines still deserve a major role in the treatment of psychiatric disorders? A critical reappraisal. Eur Psychiatry. 2013;28(1):7-20.
2. Olfson M, King M, Schoenbaum M. Benzodiazepine use in the United States. JAMA Psychiatry. 2015;72(2):136-142.
3. Bernardy NC, Lund BC, Alexander B, Friedman MJ. Increased polysedative use in veterans with posttraumatic stress disorder. Pain Med. 2014;15(7):1083-1090.
4. Roberts KJ. Patient empowerment in the United States: a critical commentary. Health Expect. 1999;2(2):82-92.
5. Paterniti S, Dufouil C, Alpérovitch A. Long-term benzodiazepine use and cognitive decline in the elderly: the Epidemiology of Vascular Aging Study. J Clin Psychopharmacol. 2002;22(3):285-293.
6. van der Hooft CS, Schoofs MW, Ziere G, et al. Inappropriate benzodiazepine use in older adults and the risk of fracture. Br J Clin Pharmacol. 2008;66(2):276-282.
7. Zint K, Haefeli WE, Glynn RJ, Mogun H, Avorn J, Stürmer T. Impact of drug interactions, dosage, and duration of therapy on the risk of hip fracture associated with benzodiazepine use in older adults. Pharmacoepidemiol Drug Saf. 2010;19(12):1248-1255.
8. Finkle WD, Der JS, Greenland S, et al. Risk of fractures requiring hospitalization after an initial prescription for zolpidem, alprazolam, lorazepam, or diazepam in older adults. J Am Geriatr Soc. 2011;59(10):1883-1890.
9. de Gage SB, Bégaud B, Bazin F, et al. Benzodiazepine use and risk of dementia: prospective population based study. BMJ. 2012;345:e6231
10. Tannenbaum C, Paquette A, Hilmer S, Holroyd-Leduc J, Carnahan R. A systematic review of amnestic and non-amnestic mild cognitive impairment induced by anticholinergic, antihistamine, GABAergic and opioid drugs. Drugs Aging. 2012;29(8):639-658.
11. Vozoris NT, Fischer HD, Wang X, et al. Benzodiazepine drug use and adverse respiratory outcomes among older adults with chronic obstructive pulmonary disease. Eur Respir J. 2014;44(2):332-340.
12. Gomm W, von Holt K, Thomé F, et al. Regular benzodiazepine and z-substance use and risk of dementia: an analysis of German claims data. J Alzheimers Dis. 2016;54(2):801-808.
13. American Geriatrics Society 2012 Beers Criteria Update Expert Panel. American Geriatrics Society updated Beers criteria for potentially inappropriate medication use in older adults. J Am Geriatr Soc. 2012;60(4):616-631.
14. National Institutes of Health. Despite risks, benzodiazepine use highest in older people. https://www.nih.gov/news-events/news-releases/despite-risks-benzodiaze pine-use-highest-older-people. Published December 17, 2014. Accessed July 31, 2018.
15. Airagnes G, Pelissolo A, Lavallée M, Flament M, Limosin F. Benzodiazepine misuse in the elderly: risk factors, consequences, and management. Curr Psychiatry Rep. 2016;18(10):89.
16. Martin P, Tamblyn R, Ahmed S, Tannenbaum C. A drug education tool developed for older adults changes knowledge, beliefs and risk perceptions about inappropriate benzodiazepine prescriptions in the elderly. Patient Educ Couns. 2013;92(1):81-87.
17. Tannenbaum C, Martin P, Tamblyn R, Benedetti A, Ahmed S. Reduction of inappropriate benzodiazepine prescriptions among older adults through direct patient education: the EMPOWER cluster randomized trial. JAMA Intern Med. 2014;174(6):890-898.
18. Soumerai SB, Avorn J. Principles of educational outreach (‘academic detailing’) to improve clinical decision making. JAMA. 1990;263(4):549-556.
19. Fischer MA, Avorn J. Academic detailing can play a key role in assessing and implementing comparative effectiveness research findings. Health Aff (Millwood). 2012;31(10):2206-2212.
20. Wells DL, Popish S, Kay C, Torrise V, Christopher ML. VA Academic Detailing Service: implementation and lessons learned. Fed Pract. 2016;33(5):38-42.
21. Austin PC. An introduction to propensity score methods for reducing the effects of confounding in observational studies. Multivariate Behav Res. 2011;46(3):399-424.
22. Brookhart MA, Schneeweiss S, Rothman KJ, Glynn RJ, Avorn J, Stürmer T. Variable selection for propensity score models. Am J Epidemiol. 2006;163(12):1149-1156.
23. Rubin DB. Estimating causal effects of treatments in randomized and nonrandomized studies. J Ed Psych. 1974;66(5):688-701.
24. Greenland S. An introduction to instrumental variables for epidemiologists. Int J Epidemiol. 2000;29(4):722-729.
25. Cartwright N. What are randomized controlled trials good for? Philos Stud. 2010;147(1):59.
26. Kleinbaum DG, Morgenstern H, Kupper LL. Selection bias in epidemiologic studies. Am J Epidemiol. 1981;113(4):452-463.
27. Rosenbaum PR, Rubin DB. The central role of the propensity score in observational studies for causal effects. Biometrika. 1983;70(1):41-55.
28. Pirracchio R, Carone M, Rigon MR, Caruana E, Mebazaa A, Chevret S. Propensity score estimators for the average treatment effect and the average treatment effect on the treated may yield very different estimates. Stat Methods Med Res. 2016;25(5):1938-1954.
Dr. Mendes is a Pharmacist at the VA San Diego Healthcare System in California and Program Director of VISN 22 Academic Detailing Program at the Veterans Integrated Systems Network (VISN) 22 Network Office in Long Beach, California. Dr. Smith is Program Director of VISN 19 Academic Detailing Program in Glendale, Colorado. Dr. Marin is a VISN Pharmacy Benefits Management Data and Program Manager at the VISN 21 Network Office on Mare Island, California. Dr. Bounthavong and Dr. Lau are National Program Managers at the VHA Pharmacy Benefits Management Academic Detailing Service in Washington, DC. Mr. Miranda is a Research Assistant in the Division of Mental Health at the Long Beach VAMC in California. Dr. Gray was the VISN 22 Pharmacy Lead at the Veterans Integrated Systems Network (VISN) 22 Network Office in Long Beach, California. Dr. Brown is a Program Manager for the VISN 22 Academic Detailing Program. Dr. Hauser is the Director of the National VA Telemental Health Hub Long Beach and Psychiatrist in the Division of Mental Health at the Long Beach VAMC; Clinical Professor in the Department of Psychiatry and Human Behavior at the University of California in Irvine; and Clinical Professor in the Department of Psychiatry at the University of California in San Diego. Correspondence: Dr. Hauser (peter.hauser2@va.gov).
Disclosures The authors report no actual or potential conflicts of interest with regard to this article.
Disclaimer The opinions expressed herein are those of the authors and do not necessarily reflect those of Federal Practitioner, Frontline Medical Communications Inc., the US Government, or any of its agencies.
Author and Disclosure Information
Dr. Mendes is a Pharmacist at the VA San Diego Healthcare System in California and Program Director of VISN 22 Academic Detailing Program at the Veterans Integrated Systems Network (VISN) 22 Network Office in Long Beach, California. Dr. Smith is Program Director of VISN 19 Academic Detailing Program in Glendale, Colorado. Dr. Marin is a VISN Pharmacy Benefits Management Data and Program Manager at the VISN 21 Network Office on Mare Island, California. Dr. Bounthavong and Dr. Lau are National Program Managers at the VHA Pharmacy Benefits Management Academic Detailing Service in Washington, DC. Mr. Miranda is a Research Assistant in the Division of Mental Health at the Long Beach VAMC in California. Dr. Gray was the VISN 22 Pharmacy Lead at the Veterans Integrated Systems Network (VISN) 22 Network Office in Long Beach, California. Dr. Brown is a Program Manager for the VISN 22 Academic Detailing Program. Dr. Hauser is the Director of the National VA Telemental Health Hub Long Beach and Psychiatrist in the Division of Mental Health at the Long Beach VAMC; Clinical Professor in the Department of Psychiatry and Human Behavior at the University of California in Irvine; and Clinical Professor in the Department of Psychiatry at the University of California in San Diego. Correspondence: Dr. Hauser (peter.hauser2@va.gov).
Disclosures The authors report no actual or potential conflicts of interest with regard to this article.
Disclaimer The opinions expressed herein are those of the authors and do not necessarily reflect those of Federal Practitioner, Frontline Medical Communications Inc., the US Government, or any of its agencies.
This quality improvement project used an educational brochure to help older veterans reduce their benzodiazepine use.
This quality improvement project used an educational brochure to help older veterans reduce their benzodiazepine use.
Benzodiazepines (BZDs) are among the most commonly prescribed medications. A recent study found that in 2008, more than 5% of Americans used a BZD, and the percentage was almost 9% among Americans aged ≥ 65 years.1,2 Among veterans, BZD use is even higher, in part because of the high prevalence of posttraumatic stress disorder (PTSD). One study found that more than 30% of veterans with PTSD received at least 1 BZD prescription.3 The risks associated with BZD treatment for PTSD are compounded by concurrent use of other sedatives and opioids prescribed for co-occurring chronic pain and insomnia.3
Older adults metabolize long-acting BZDs more slowly and generally have an increased sensitivity to the adverse effects (AEs) of all BZDs.4 In older adults, BZD use has been associated with cognitive decline, dementia, falls and consequent fractures, and adverse respiratory outcomes.5-12 The risk of most but not all of these AEs was increased with higher BZD dose or long-term BZD use, which this quality improvement project (QIP) defines as having at least a 60-day supply of BZD prescriptions dispensed within the past year.
Long-term BZD use increases with age. One study found that, among patients receiving a BZD, the rate of long-term BZD use was more than double in older adults (31.4%) than it was in adults aged between 18 and 35 years (14.7%).2 For these reasons, the 2012 Beers criteria of the American Geriatrics Society recommend avoiding all types of BZDs in the treatment of insomnia, agitation, or delirium in patients aged > 65 years.13 Despite this recommendation, the prevalence of BZD use in older adults remains high.14
Some innovative approaches have been developed to address the inappropriate use, including overuse and misuse, of BZDs in older adults.15 In one approach, direct-to-consumer (DTC) information is used to empower patients to collaborate with their physician to manage their health. Results from several studies suggest that providing older patients with information on BZD risks and benefits increases patient–physician interaction and thereby decreases inappropriate BZD use and improves health outcomes.4,16,17 One study found that perceptions of BZD risks increased 1 week after exposure to a DTC educational brochure (EB), with intention to discuss BZD discontinuation with their physician higher for patients who received the EB than it was for those who did not (83.1% vs 44.3%; P < .0001).16 The EMPOWER (Eliminating Medications Through Patient Ownership of End Results) cluster randomized controlled trial assessed the effectiveness of a DTC EB focused on BZD risks in older adults.17 In that seminal study, patients who received a DTC EB were more likely than were comparison patients to discontinue BZD within 6 months (27% vs 5%; risk difference, 23%; 95% CI, 14%-32%).
The Veterans Integrated Systems Network (VISN) 22 Academic Detailing Program is a pharmacy educational outreach program that uses unbiased clinical guidelines to promote physicians’ safety initiatives and align prescribing behavior with best practices.18-20 With BZD use among older veterans remaining high, the VISN 22 program initiated a clinical QIP modeled on the EMPOWER trial. Veterans in VISN 22 received the DTC EB, which included information on BZD risks and encouraged them to discuss their BZD treatment with their health care provider. VISN 22 was the first VISN in the VHA to implement the EMPOWER protocol.
As this was a QIP, all eligible veterans in VISN 22 were mailed the DTC EB, thus making it difficult to estimate the impact of the EB on BZD discontinuation in this VISN. Therefore, DTC EB efficacy was estimated by comparing BZD discontinuation between VISN 22 and VISN 21, an adjacent VISN that did not mail the DTC EB. To reduce selection bias associated with different controls in the 2 VISNs, the authors performed propensity score matching (PSM) to balance the covariates and provide an unbiased estimate of the mean treatment effect of the DTC EB in VISN 22 veterans who were included in the initial descriptive QIP and received the EB; these veterans were compared with VISN 21 veterans who did not receive the EB.
Methods
Two QIPs were undertaken to determine the impact of DTC EB on BZD use in older veterans in the VHA.
Quality Improvement Project 1
Design. A retrospective cohort analysis was performed. The VISN 22 catchment area, which encompasses VA facilities and clinics in southern California and southern Nevada, serves about 500,000 veterans, a substantial proportion of whom are aged ≥ 65 years. Among these older veterans are active long-term BZD users, who were defined as having ≥ 60-day supply of BZD prescriptions dispensed within the past year. Each active long-term user with a BZD prescription released within 200 days before the index date (the date the user was to meet with the prescribing physician) was mailed an EB 2 to 8 weeks in advance of the visit. Excluded from analysis were veterans with a schizophrenia, spinal cord injury, or seizure disorder diagnosis recorded in both their inpatient and outpatient medical records; veterans seen by Palliative Care within the past year; and veterans who died before analysis was completed.
Education Brochure. The EB for VISN 22 (Figure 1, see
) was almost identical to the EB used in the EMPOWER trial.17 The language of the EMPOWER brochure was retained, but veteran-related images were added, and the BZD taper schedule was removed. Tannenbaum and colleagues incorporated constructivist learning into the Test Your Knowledge section of the EB.
Users interact with this section, acquire new knowledge, and reflect on what they already know. Also incorporated is cognitive dissonance, which motivates users to change by confronting inconsistencies in what they know about BZD safety and efficacy. The EB mailed to veterans included a peer champion’s story of successful discontinuation of BZDs. Reading this story is thought to lead to self-identification with the champion’s success, self-efficacy, and confidence in discontinuing BZDs.
Patients. The sample consisted of all veterans identified as meeting the inclusion criteria and being enrolled in VISN 22. The EB was mailed once to veterans on a rolling basis from December 2014 to February 2016. Change in BZD use was analyzed only after 9 to 24 months had passed since the index appointment with the prescribing physician. This period included 12 weeks for BZD taper and then 6 months after taper.
Analysis. For each veteran, monthly mean lorazepam equivalent (LE) was calculated using as many as 12 fills before the index date. Average daily dose of LE was calculated by dividing the sum of LE from all included prescriptions by total number of days between the first fill and the index date. The BZD prescription fills were evaluated after the index date. Veterans who received at least 1 prescription after the index date but then had no BZD prescription activity in VA clinics for 3 consecutive months during the 9-month observation period were recorded as having tapered and then discontinued BZD. Veterans who had no BZD prescription activity in VA clinics after the index date and during the 9-month observation period were recorded as having discontinued BZD without tapering. For veterans who had BZD prescription activity in VA clinics after the index date and during the 9-month observation period, mean LE was calculated by dividing the total LE for BZD prescriptions after the index date by number of days from the first fill after the index date to the date of analysis.
Quality Improvement Project 2
Design. A retrospective cohort analysis using PSM was performed on a subgroup of the QIP-1 sample to evaluate the impact of EB on BZD prescribing in the VA during 2 periods: 6 to 9 months and 6 to 12 months after the index date. A secondary outcome was discontinuation 1 to 12 months after the index date. Veterans in the analysis were active long-term BZD users, had at least 1 BZD prescription released within 200 days before the index date, were aged ≥ 65 years, and had an appointment scheduled with their BZD prescriber within 2 to 8 weeks (Figure 2).
Excluded from analysis were veterans with a schizophrenia, spinal cord injury, or seizure disorder diagnosis recorded in both their inpatient and outpatient diagnosis medical records and veterans seen by palliative care within the past year. The authors performed an initial descriptive naïve analysis and then a naïve logistic regression analysis.
Patients. VISN 22 implemented QIP-2, a real-world application of a modified EMPOWER program, by identifying eligible veterans on a rolling basis from December 2014 to August 2015. All veterans who were identified and sent an EB during this period were included in the case group. The index date was defined as the first of the month the EB was mailed. Veterans with a pending appointment were chosen because the lead time would allow them to receive the EB and prepare to discuss it with the physician during the visit.
A comparator group was drawn from the adjacent VISN 21 catchment area, which encompasses VA facilities and clinics in Hawaii, northern California, and northern Nevada. During the observation period, VISN 21 did not mail any EBs specifically addressing BZD risks. Veterans in the comparator group had an appointment scheduled with their BZD prescribing physician within 4 weeks, were aged ≥ 65 years on the index date (first of the month before the next appointment, coinciding with the date EBs were sent to VISN 22 veterans), were active long-term BZD users, and had at least 1 BZD prescription released within 200 days before the index date. All patients were followed for up to 12 months after the index date, with BZD discontinuation recorded 9 and 12 months after the index date.
Propensity Score Matching
Propensity score (PS) was estimated with logistic regression analysis with treatment as the dependent variable and baseline characteristics as the independent variables.21,22 One-to-one matching on the PS was performed using the nearest neighbor approach without replacements. Independent variables related to outcome but unrelated to EB exposure were selected for PS development.22 These variables included year of birth; male sex; Hispanic ethnicity; annual income; service connection status; region; body mass index; Charlson Comorbidity Index category; total baseline BZD dose; and diagnosis of AIDS, nonmetastatic cancer, metastatic cancer, chronic obstructive pulmonary disease (COPD), congestive heart failure (CHF), dementia, diabetes mellitus (DM), DM with complications, gastroesophageal reflux disease (GERD), general anxiety disorder (GAD), hemiparaplegia, liver disease (mild), liver disease (moderate to severe), myocardial infarction (MI), Parkinson disease, peptic ulcer disease (PUD), psychosis, renal disease, rheumatoid arthritis (RA), or substance use disorder (SUD).
The EMPOWER cluster randomized controlled trial (RCT) demonstrated the effectiveness of EB exposure in a Canadian population of elderly patients who were long-term BZD users.17 Randomized controlled trials are the gold standard for clinical trials because they can establish causal inference.23-25 Given ethical and practical concerns, however, RCTs cannot be applied to all clinical scenarios. Although EMPOWER is reported to be an effective tool in reducing BZD use in older adults, its application in a real-world, large, integrated health care system remains untested. Observational studies are often conducted as an alternative to RCTs but are subject to selection bias because of their lack of randomization.26 Therefore, robust research methods are needed to generate unbiased estimates of the impact of an intervention on an outcome. Propensity score matching simulates an RCT by balancing the covariates across treatment groups.21,22,27 Observed patient characteristics are used to estimate PS, the probability that treatment will be received. Logistic or probit regression is used to balance the potential confounding covariates between the treatment groups.Once PSs are known, mean treatment effect can be estimated without the mean model.28 In other words, PSM methods can be used to generate an unbiased estimate of the treatment.
Propensity Score Analysis
Baseline characteristics were compared using Student t test (continuous variables) and χ2 test (discrete variables). Results are presented as means and standard deviations (continuous variables) and frequency and percentage (discrete variables).
The main outcome was BZD discontinuation 9 and 12 months after the index date. A postindex lag of 6 months was used to capture any tapering (Figure 2). Discontinuation, defined as 3 consecutive months of no BZD prescription on hand, was measured for 2 periods: 6 to 9 months and 6 to 12 months after the index date. A secondary outcome was discontinuation 1 to 12 months after the index date. An estimate was made of the difference in the proportions of BZD discontinuers who received the EB and BZD discontinuers who did not receive the EB, where mean treatment (risk difference) was presented as the absolute risk difference with a 95% CI. Standard errors and 95% CIs for the risk differences were generated with biased-corrected CIs from 1,000 bootstrap samples.
Sensitivity Analyses
Naïve multivariate logistic regression analysis was performed to evaluate the association between EB exposure and BZD discontinuation while controlling for potential confounders. Results are presented as odds ratios (ORs) and 95% CIs. Confounders identified were the same covariates used to generate the PSs.
Several analyses were performed to test the sensitivity of the methods applied using PSM by changing caliber size while maintaining the nearest neighbor approach without replacement. Linear regression analysis was performed with robust standard errors to estimate the risk difference of BZD discontinuation between EB-exposed and EB-unexposed veterans.
Statistical significance was set at P < .05. All statistical analyses were performed with Stata/SE Version 13 (College Station, TX).
Results
Quality Improvement Project 1
On a rolling basis from December 2014 to February 2016, the EB was mailed once to 3,896 VISN 22 veterans 2 to 8 weeks before a clinic appointment with their BZD prescribing physician.
Of these veterans, 1,847 (47.4%) decreased their BZD dose; 458 (11.7%) tapered and then discontinued BZD (at least 1 prescription after index date, then no refill for at least 3 consecutive months); 455 (11.7%) immediately discontinued BZD (no refill for at least 3 consecutive months after index date); 607 (15.6%) increased their dose; and 529 (13.6%) did not change their dose.
For the 1,847 veterans who decreased their dose, average daily dose (ADD) before index date was 3.17 mg LE, ADD reduction was 1.12 mg LE, and final ADD was 2.04 mg LE; of these veterans, 596 (32.3%) reduced their ADD more than 50% (ADD before index date, 2.68 mg LE; final ADD, 0.86 mg LE). The data are summarized in Table 1 and Figure 3.
Quality Improvement Project 2
Of all the VISN 22 and VISN 21 veterans, 24,420 met the inclusion and exclusion criteria. Of these 24,420 veterans, 2,020 (8.3%) were in VISN 22 and received the EB between December 2014 and August 2015 (QIP-1), and 22,400 (91.7%) were in VISN 21 and did not receive the EB.
Naïve Results Before PS Matching. In the naïve analyses, a larger proportion of EB-exposed vs unexposed veterans discontinued BZD; in addition, reductions were 6.6%, 7.4%, and 9.5% larger for 6 to 9 months, 6 to 12 months, and 1 to 12 months after the index date, respectively (P < .0001 for all comparisons; Table 2).
After controlling for potential confounders, the naïve logistic regression analyses found EB exposure was significantly associated with 44%, 32%, and 42% increases in the odds of BZD discontinuation for 6 to 9 months, 6 to 12 months, and 1 to 12 months after the index date, respectively (Table 3).
Propensity Score Matching. Before matching, there were significant differences in baseline characteristics of veterans who met the inclusion and exclusion criteria, with few exceptions (eAppendices 2 and 3, ).
After PSM, mean bias was reduced from 6.5% to 1.8%. A total of 2,632 veterans (1,316 in each group) matched according to PSM criteria.
After matching, there were no significant differences in baseline characteristics of EB-exposed and EB-unexposed veterans (eAppendix 4).
Propensity Score Matching Results. Inspection of PSs revealed good coverage across treatment groups on a histogram plot and a kernel density plot (eAppendices 5 and 6).
Table 4 lists the results of the PSM approaches. Risk differences in discontinuing BZD ranged from 6.6% to 6.9% for 6 to 9 months and from 6.5% to 7.1% for 6 to 12 months, in both cases benefiting EB-exposed veterans.
Regarding the secondary outcome, a higher proportion of EB-exposed versus -unexposed veterans (7.35%-8.92%) discontinued BZD between 1 and 12 months. All risk differences in the sensitivity analyses were significant at α = 0.05 (2-tailed).
Discussion
This QIP was the first to evaluate the impact of an EMPOWER-modeled DTC EB in a large, integrated health care system in the U.S. It was also the first to demonstrate potential benefits of a DTC EB designed for older veterans who are long-term BZD users. In this QIP, which mailed the EB to 3,896 veterans, 1,847 (47.4%) decreased their BZD dose, 458 (11.7%) tapered and then discontinued BZD, and 455 (11.7%) immediately discontinued BZD. The total percentage of veterans who discontinued BZD (23.4%; 913/3,896) was similar to the 27% reported in the EMPOWER trial.17 However, the risk difference between the 1,316 EB-exposed VISN 22 veterans (QIP-1) and the 1,316 EB-unexposed VISN 21 veterans in this QIP was significantly lower than the 23% risk difference in EMPOWER (though it still demonstrated a significantly larger reduction for EB-exposed veterans).17
Given this inclusion of all qualifying veterans from the catchment area studied in this QIP, and given the ethical and practical concerns, an RCT was not possible. Therefore, PSM methods were used to balance the covariates across treatment groups and thereby simulate an RCT.21,22,27 With use of the PSM approach, findings from the descriptive analysis were confirmed and potential selection bias reduced.
Study Limitations
The less robust risk difference found in this QIP has several possible explanations. The authors’ use of a DTC EB coincided with a national VA effort to reduce older veterans’ use of BZDs and other inappropriate medications. For instance, during the study period, academic detailing was being implemented to reduce use of BZDs, particularly in combination with opioids, across VHA facilities and clinics. (Academic detailing is a pharmacy educational outreach program that uses unbiased clinical guidelines to promote physicians’ safety initiatives and align prescribing behavior with best practices.18-20) However, QIP-2 results and PS analysis of a subgroup of the original sample suggest that EB-exposed veterans were significantly more likely than were their unexposed counterparts were to discontinue BZD. To an extent, this analysis controlled for these other efforts to reduce BZD use in VHA clinics and can be considered a study strength.
Another limitation is the study design, which lacked a control group and did not consider the possibility that some facility or clinic physicians might influence others. Although the region variable was controlled for in PSM, the authors did not capture facility characteristics, including frequency of prescribing BZD and use of a protocol for enforcing the Beers criteria. Such confounders might have influenced outcomes. Unlike the EMPOWER trial,17 this QIP did not assess or exclude cognitively impaired veterans. It is reasonable to assume that these veterans might not understand some EB messages and consequently might fail to engage their physicians. Failure to initiate discussion with a physician would attenuate the impact of the EB.
Study Strengths
A strength of this QIP was its use of a DTC EB in a large, regional sample of older veterans in a real-world clinical setting. In addition, the study group (EB-exposed veterans) and the comparator group (EB-unexposed veterans) were from similar geographic areas (primarily California and Nevada).
Conclusion
Results of this study suggest that a DTC EB, designed to reduce BZD use among older veterans, was effective in helping patients lower their BZD dose and discontinue BZD. The likelihood of discontinuing BZD 9 and 12 months after the index date was significantly higher for veterans who received an EB modeled on the EMPOWER educational brochure than for a comparator group of veterans who did not receive the EB and were receiving care during the same observation period. In the future, it would be beneficial to use a design that controls for physician exposure to academic detailing focused on BZD reduction and that accounts for the cluster effects of facility practice. Despite these limitations, this QIP is the first real-world empirical example of using an EMPOWER-modeled DTC EB to decrease BZD use among older veterans. Furthermore, these results suggest that a DTC EB can be used to target other high-risk prescription drugs, such as opioids, particularly if alternative treatment options can be provided.
Acknowledgments Dr. Hauser thanks Cathy, Anika, Katia, and Max Hauser, and Alba and Kevin Quinlan, for their support. In memory of Jirina Hauser, who died on Mother’s Day, May 14, 2017, at the age of 100.
References
1. Dell’osso B, Lader M. Do benzodiazepines still deserve a major role in the treatment of psychiatric disorders? A critical reappraisal. Eur Psychiatry. 2013;28(1):7-20.
2. Olfson M, King M, Schoenbaum M. Benzodiazepine use in the United States. JAMA Psychiatry. 2015;72(2):136-142.
3. Bernardy NC, Lund BC, Alexander B, Friedman MJ. Increased polysedative use in veterans with posttraumatic stress disorder. Pain Med. 2014;15(7):1083-1090.
4. Roberts KJ. Patient empowerment in the United States: a critical commentary. Health Expect. 1999;2(2):82-92.
5. Paterniti S, Dufouil C, Alpérovitch A. Long-term benzodiazepine use and cognitive decline in the elderly: the Epidemiology of Vascular Aging Study. J Clin Psychopharmacol. 2002;22(3):285-293.
6. van der Hooft CS, Schoofs MW, Ziere G, et al. Inappropriate benzodiazepine use in older adults and the risk of fracture. Br J Clin Pharmacol. 2008;66(2):276-282.
7. Zint K, Haefeli WE, Glynn RJ, Mogun H, Avorn J, Stürmer T. Impact of drug interactions, dosage, and duration of therapy on the risk of hip fracture associated with benzodiazepine use in older adults. Pharmacoepidemiol Drug Saf. 2010;19(12):1248-1255.
8. Finkle WD, Der JS, Greenland S, et al. Risk of fractures requiring hospitalization after an initial prescription for zolpidem, alprazolam, lorazepam, or diazepam in older adults. J Am Geriatr Soc. 2011;59(10):1883-1890.
9. de Gage SB, Bégaud B, Bazin F, et al. Benzodiazepine use and risk of dementia: prospective population based study. BMJ. 2012;345:e6231
10. Tannenbaum C, Paquette A, Hilmer S, Holroyd-Leduc J, Carnahan R. A systematic review of amnestic and non-amnestic mild cognitive impairment induced by anticholinergic, antihistamine, GABAergic and opioid drugs. Drugs Aging. 2012;29(8):639-658.
11. Vozoris NT, Fischer HD, Wang X, et al. Benzodiazepine drug use and adverse respiratory outcomes among older adults with chronic obstructive pulmonary disease. Eur Respir J. 2014;44(2):332-340.
12. Gomm W, von Holt K, Thomé F, et al. Regular benzodiazepine and z-substance use and risk of dementia: an analysis of German claims data. J Alzheimers Dis. 2016;54(2):801-808.
13. American Geriatrics Society 2012 Beers Criteria Update Expert Panel. American Geriatrics Society updated Beers criteria for potentially inappropriate medication use in older adults. J Am Geriatr Soc. 2012;60(4):616-631.
14. National Institutes of Health. Despite risks, benzodiazepine use highest in older people. https://www.nih.gov/news-events/news-releases/despite-risks-benzodiaze pine-use-highest-older-people. Published December 17, 2014. Accessed July 31, 2018.
15. Airagnes G, Pelissolo A, Lavallée M, Flament M, Limosin F. Benzodiazepine misuse in the elderly: risk factors, consequences, and management. Curr Psychiatry Rep. 2016;18(10):89.
16. Martin P, Tamblyn R, Ahmed S, Tannenbaum C. A drug education tool developed for older adults changes knowledge, beliefs and risk perceptions about inappropriate benzodiazepine prescriptions in the elderly. Patient Educ Couns. 2013;92(1):81-87.
17. Tannenbaum C, Martin P, Tamblyn R, Benedetti A, Ahmed S. Reduction of inappropriate benzodiazepine prescriptions among older adults through direct patient education: the EMPOWER cluster randomized trial. JAMA Intern Med. 2014;174(6):890-898.
18. Soumerai SB, Avorn J. Principles of educational outreach (‘academic detailing’) to improve clinical decision making. JAMA. 1990;263(4):549-556.
19. Fischer MA, Avorn J. Academic detailing can play a key role in assessing and implementing comparative effectiveness research findings. Health Aff (Millwood). 2012;31(10):2206-2212.
20. Wells DL, Popish S, Kay C, Torrise V, Christopher ML. VA Academic Detailing Service: implementation and lessons learned. Fed Pract. 2016;33(5):38-42.
21. Austin PC. An introduction to propensity score methods for reducing the effects of confounding in observational studies. Multivariate Behav Res. 2011;46(3):399-424.
22. Brookhart MA, Schneeweiss S, Rothman KJ, Glynn RJ, Avorn J, Stürmer T. Variable selection for propensity score models. Am J Epidemiol. 2006;163(12):1149-1156.
23. Rubin DB. Estimating causal effects of treatments in randomized and nonrandomized studies. J Ed Psych. 1974;66(5):688-701.
24. Greenland S. An introduction to instrumental variables for epidemiologists. Int J Epidemiol. 2000;29(4):722-729.
25. Cartwright N. What are randomized controlled trials good for? Philos Stud. 2010;147(1):59.
26. Kleinbaum DG, Morgenstern H, Kupper LL. Selection bias in epidemiologic studies. Am J Epidemiol. 1981;113(4):452-463.
27. Rosenbaum PR, Rubin DB. The central role of the propensity score in observational studies for causal effects. Biometrika. 1983;70(1):41-55.
28. Pirracchio R, Carone M, Rigon MR, Caruana E, Mebazaa A, Chevret S. Propensity score estimators for the average treatment effect and the average treatment effect on the treated may yield very different estimates. Stat Methods Med Res. 2016;25(5):1938-1954.
Clinical question: Does a balanced crystalloid solution lead to better outcomes than does normal saline when used in critically sick adults?
Background: Balanced crystalloids are considered more physiological, with a composition closer to plasma. Observational studies have shown lower rates of hyperchloremic acidosis, renal failure, and death with use of balanced crystalloids. In spite of this, normal saline has been the most commonly used fluid. Differences in effects on important patient-related outcomes of safety and efficacy between these two interventions remain unknown.
Study design: Pragmatic, unblinded, cluster-randomized, multiple-crossover trial.
Setting: Vanderbilt University Health Center, Nashville, Tenn.
Dr. Saurabh Parasramka
Synopsis: This study comprised 15,802 adults with mean age of 58 admitted to ICU who were cluster randomized to receive either balanced crystalloid or normal saline. Primary outcome was a composite of death from any cause, renal replacement therapy, or persistent renal dysfunction at 30 days and was observed less frequently in the balanced crystalloid group (adjusted odds ratio, 0.90; 95% confidence interval, 0.82-0.99; P = .04).
Since the trial was cluster randomized, prognostic imbalance between the groups caused by confounding factors was a big risk. Results could not be generalized because the study was done in a university health center. Mean fluid amount received was modest in both groups. Questions still remain about the efficacy and safety of balanced fluids, and hospitalists should weigh their decisions in light of this new information.
Bottom line: Balanced crystalloid solution decreased 30-day composite outcome of death, renal replacement therapy, or persistent renal dysfunction.
Dr. Parasramka is an assistant professor in the division of hospital medicine at the University of Kentucky, Lexington.
Clinical question: Does a balanced crystalloid solution lead to better outcomes than does normal saline when used in critically sick adults?
Background: Balanced crystalloids are considered more physiological, with a composition closer to plasma. Observational studies have shown lower rates of hyperchloremic acidosis, renal failure, and death with use of balanced crystalloids. In spite of this, normal saline has been the most commonly used fluid. Differences in effects on important patient-related outcomes of safety and efficacy between these two interventions remain unknown.
Study design: Pragmatic, unblinded, cluster-randomized, multiple-crossover trial.
Setting: Vanderbilt University Health Center, Nashville, Tenn.
Dr. Saurabh Parasramka
Synopsis: This study comprised 15,802 adults with mean age of 58 admitted to ICU who were cluster randomized to receive either balanced crystalloid or normal saline. Primary outcome was a composite of death from any cause, renal replacement therapy, or persistent renal dysfunction at 30 days and was observed less frequently in the balanced crystalloid group (adjusted odds ratio, 0.90; 95% confidence interval, 0.82-0.99; P = .04).
Since the trial was cluster randomized, prognostic imbalance between the groups caused by confounding factors was a big risk. Results could not be generalized because the study was done in a university health center. Mean fluid amount received was modest in both groups. Questions still remain about the efficacy and safety of balanced fluids, and hospitalists should weigh their decisions in light of this new information.
Bottom line: Balanced crystalloid solution decreased 30-day composite outcome of death, renal replacement therapy, or persistent renal dysfunction.
The European Commission has granted marketing authorization for caplacizumab (Cablivi™), a humanized bivalent nanobody that inhibits the interaction between von Willebrand factor and platelets.
Caplacizumab is now approved to treat adults with acquired thrombotic thrombocytopenic purpura (aTTP) in all member countries of the European Union as well as Norway, Iceland, and Liechtenstein.
Sanofi Genzyme said it will work with relevant local authorities to make caplacizumab available in countries across Europe.
“The approval of Cablivi provides an important addition to the standard-of-care treatment for patients with aTTP in Europe because it can significantly reduce time to platelet count normalization and induce a clinically meaningful reduction in recurrences,” said Marie Scully, MD, of University College Hospital in London, UK.
The European Commission’s approval of caplacizumab is supported by data from the phase 2 TITAN study and the phase 3 HERCULES study.
The study included 75 aTTP patients who were randomized to caplacizumab (n=36) or placebo (n=39), with all patients receiving the current standard of care—daily plasma exchange and immunosuppressive therapy.
The study’s primary endpoint was time to response, which was defined as platelet count normalization (150,000/mm3 or higher).
Patients in the caplacizumab arm had a 39% reduction in the median time to response compared to patients in the placebo arm (P=0.005).
Among the 69 patients who had not undergone a plasma exchange session before enrollment, the median time to response was 3.0 days in the caplacizumab arm and 4.9 days in the placebo arm.
Among the 6 patients who did undergo a plasma exchange session before enrollment, the median time to a response was 2.4 days in the caplacizumab arm and 4.3 days in the placebo arm.
The rate of confirmed response was 86.1% (n=31) in the caplacizumab arm and 71.8% (n=28) in the placebo arm.
There were 541 adverse events (AEs) in 34 of the 35 evaluable patients receiving caplacizumab (97%) and 522 AEs in all 37 evaluable patients receiving placebo (100%). TTP exacerbations and relapses were not included as AEs.
The rate of AEs thought to be related to the study drug was 17% in the caplacizumab arm and 11% in the placebo arm. The rate of AEs that were possibly related was 54% and 8%, respectively. The rate of serious AEs was 37% and 32%, respectively.
There were no deaths in the caplacizumab arm and two in the placebo arm. One death was due to severe, refractory TTP, and the other was due to cerebral hemorrhage.
The study enrolled patients with an acute episode of aTTP. They were randomized to receive caplacizumab (n=72) or placebo (n=73) in addition to standard care—plasma exchange and immunosuppression.
The study’s primary endpoint was the time to platelet count response (normalization), which was defined as an initial platelet count of at least 150 x 109/L with subsequent stop of daily plasma exchange within 5 days.
There was a significant reduction in time to platelet count response in the caplacizumab arm compared to the placebo arm. The platelet normalization rate ratio was 1.55 (P<0.01).
A secondary endpoint was the combination of aTTP-related death, aTTP recurrence, and at least one major thromboembolic event during study treatment. The incidence of this combined endpoint was 12.7% (n=9) in the caplacizumab arm and 49.3% (n=36) in the placebo arm (P<0.0001).
The incidence of aTTP-related death was 0% (n=0) in the caplacizumab arm and 4.1% (n=3) in the placebo arm. The incidence of aTTP recurrence was 4.2% (n=3) and 38.4% (n=28), respectively. The incidence of at least one major thromboembolic event was 8.5% (n=6) and 8.2% (n=6), respectively.
The proportion of patients with at least one study-drug-related AE was 57.7% in the caplacizumab arm and 43.8% in the placebo arm. The proportion of patients with at least one study-drug-related serious AE was 14.1% (n=10) and 5.5% (n=4), respectively. The rate of discontinuation due to at least one AE was 7.0% and 12.3%, respectively.
During the treatment period, there were no deaths in the caplacizumab arm and three deaths in the placebo arm. There was one death in the caplacizumab arm during the follow-up period, but it was considered unrelated to caplacizumab.
Vials and a syringe
The European Commission has granted marketing authorization for caplacizumab (Cablivi™), a humanized bivalent nanobody that inhibits the interaction between von Willebrand factor and platelets.
Caplacizumab is now approved to treat adults with acquired thrombotic thrombocytopenic purpura (aTTP) in all member countries of the European Union as well as Norway, Iceland, and Liechtenstein.
Sanofi Genzyme said it will work with relevant local authorities to make caplacizumab available in countries across Europe.
“The approval of Cablivi provides an important addition to the standard-of-care treatment for patients with aTTP in Europe because it can significantly reduce time to platelet count normalization and induce a clinically meaningful reduction in recurrences,” said Marie Scully, MD, of University College Hospital in London, UK.
The European Commission’s approval of caplacizumab is supported by data from the phase 2 TITAN study and the phase 3 HERCULES study.
The study included 75 aTTP patients who were randomized to caplacizumab (n=36) or placebo (n=39), with all patients receiving the current standard of care—daily plasma exchange and immunosuppressive therapy.
The study’s primary endpoint was time to response, which was defined as platelet count normalization (150,000/mm3 or higher).
Patients in the caplacizumab arm had a 39% reduction in the median time to response compared to patients in the placebo arm (P=0.005).
Among the 69 patients who had not undergone a plasma exchange session before enrollment, the median time to response was 3.0 days in the caplacizumab arm and 4.9 days in the placebo arm.
Among the 6 patients who did undergo a plasma exchange session before enrollment, the median time to a response was 2.4 days in the caplacizumab arm and 4.3 days in the placebo arm.
The rate of confirmed response was 86.1% (n=31) in the caplacizumab arm and 71.8% (n=28) in the placebo arm.
There were 541 adverse events (AEs) in 34 of the 35 evaluable patients receiving caplacizumab (97%) and 522 AEs in all 37 evaluable patients receiving placebo (100%). TTP exacerbations and relapses were not included as AEs.
The rate of AEs thought to be related to the study drug was 17% in the caplacizumab arm and 11% in the placebo arm. The rate of AEs that were possibly related was 54% and 8%, respectively. The rate of serious AEs was 37% and 32%, respectively.
There were no deaths in the caplacizumab arm and two in the placebo arm. One death was due to severe, refractory TTP, and the other was due to cerebral hemorrhage.
The study enrolled patients with an acute episode of aTTP. They were randomized to receive caplacizumab (n=72) or placebo (n=73) in addition to standard care—plasma exchange and immunosuppression.
The study’s primary endpoint was the time to platelet count response (normalization), which was defined as an initial platelet count of at least 150 x 109/L with subsequent stop of daily plasma exchange within 5 days.
There was a significant reduction in time to platelet count response in the caplacizumab arm compared to the placebo arm. The platelet normalization rate ratio was 1.55 (P<0.01).
A secondary endpoint was the combination of aTTP-related death, aTTP recurrence, and at least one major thromboembolic event during study treatment. The incidence of this combined endpoint was 12.7% (n=9) in the caplacizumab arm and 49.3% (n=36) in the placebo arm (P<0.0001).
The incidence of aTTP-related death was 0% (n=0) in the caplacizumab arm and 4.1% (n=3) in the placebo arm. The incidence of aTTP recurrence was 4.2% (n=3) and 38.4% (n=28), respectively. The incidence of at least one major thromboembolic event was 8.5% (n=6) and 8.2% (n=6), respectively.
The proportion of patients with at least one study-drug-related AE was 57.7% in the caplacizumab arm and 43.8% in the placebo arm. The proportion of patients with at least one study-drug-related serious AE was 14.1% (n=10) and 5.5% (n=4), respectively. The rate of discontinuation due to at least one AE was 7.0% and 12.3%, respectively.
During the treatment period, there were no deaths in the caplacizumab arm and three deaths in the placebo arm. There was one death in the caplacizumab arm during the follow-up period, but it was considered unrelated to caplacizumab.
Prevention of cardiovascular disease (CVD) requires timely identification of people who are at increased risk in order to target effective dietary, lifestyle, or pharmacotherapeutic intervention—or a combination of the 3. Risk factors for CVD are well understood, but the relative impact of each factor on an individual’s overall risk is difficult to accurately quantify, making a validated CVD risk calculator an important clinical tool.
Despite numerous available CVD risk calculators, one best tool has yet to emerge. This state of affairs has limited the ability of front-line providers who are tasked with primary prevention of CVD—including family physicians (FPs)—to provide the best evidence-based recommendations to patients.
Implications of CVD risk assessment
Baseline CVD risk assessment is the cornerstone of recommendations for primary prevention of CVD, including aspirin and statin therapy. Interventions to lower CVD risk are of greatest benefit to those at highest risk at initiation of therapy. Overall, statins reduce the risk of a first cardiovascular event in otherwise healthy people by approximately 25% over 10 years.1 Because relative risk reduction is fairly consistent across different levels of absolute risk, a 25% relative reduction confers more actual benefit if risk starts at, say, 40% than at 10%.2 In that example, the same 25% reduction in relative risk results in 1) an absolute risk reduction of 10% when risk starts at 40%, compared to an absolute risk reduction of 2.5% when risk starts at 10% and 2) a number needed to treat (NNT) of, respectively, 10 and 40 (over 10 years).
Identifying a person with an elevated risk of developing CVD has multiple implications. Ideally, that patient is motivated to pursue positive therapeutic lifestyle modifications and make changes that positively affect long-term CVD risk. Conversely, that asymptomatic person identified as at elevated risk also becomes a patient with a medical problem that might adversely affect insurance premiums and self-esteem, and may trigger the use of medications with cost and potential adverse effects. Although the benefit of preventive therapy is greater for a patient at higher risk of disease, the harm of a therapy is relatively constant across all risk groups. Accurately discriminating high and low risk of CVD is, therefore, imperative.
The venerable Framingham risk score
Cardiovascular risk prediction has its roots in the late 1940s, when primary risk factors for CVD were not well-understood, with the inception of the Framingham Heart Study. (A greater understanding of CVD risk today notwithstanding, coronary artery disease [CAD] remains the leading cause of death among American adults.) In the late 1940s, blood pressure (BP) was recognized as the single most useful variable for identifying people at high risk of CVD; other variables were understood to be predictive as well. A composite score—the Framingham Risk Score (FRS)—was thereby developed to calculate the probability that CVD would occur over 8 years in a person who was initially free of such disease.3
While the benefit of a preventive therapy is greater for those at higher risk of disease, the harm of a therapy is relatively constant across all risk groups.
The original FRS included glucose intolerance and left ventricular hypertrophy (LVH) identified by electrocardiography (EKG) in its algorithm.3 Other, older algorithms also include a family history of premature CVD. In each risk calculator, these variables are treated as dichotomous (Yes or No), but actual risk associated with each variable is in fact more along a continuum. It is now well-recognized that the sensitivity of EKG for accurately detecting LVH is relatively low; more recent algorithms no longer include this component. A family history of premature CVD variably contributes to an individual’s CVD risk; however, its true impact is nearly impossible to accurately quantify, so this variable is also not included in more modern risk calculators.
Caution: The FRS has meaningful limitations
Although the original Framingham cohort has been expanded multiple times since its inception, clinicians and researchers continue to express concern that the predominantly white, middle-class Framingham, Massachusetts, population might not be representative of the United States in general—which would limit the accuracy of the FRS predictive tool when it is applied to a more diverse population. Furthermore, cholesterol-lowering medications were not available when the FRS was first developed. The FRS, therefore, might not accurately estimate risk in more modern populations, in whom aggressive modification of CVD risk factors has resulted in a lower overall rate of atherosclerotic CVD than when the FRS was developed.4
Continue to: Although demographic changes have increasingly...
Although demographic changes have increasingly led to an extension of primary prevention strategies for CAD to elderly people, the FRS has been demonstrated to perform less well in patients older than 70 years, particularly men.5 An ideal CAD prediction model for elderly people should take into account that, with growing age and frailty, CAD events may be increasingly preempted by death from competing non-coronary causes. In addition, the predictive association of typical CVD risk factors diminishes with increasing age.6,7 Koller and colleagues developed a CAD risk prediction model that accounted for death from non-coronary causes and was validated specifically in patients 65 years and older. Koller’s prediction model provided well-calibrated risk estimates, but it was still not substantially more accurate than the FRS—illustrating the overall difficulty in predicting CAD risk in elderly people.8
Alternative risk calculators have come on the scene
Over the past 2 decades, numerous models have been developed in an attempt to overcome the perceived shortcomings of the FRS. A recent systematic review identified 363 prediction models described in the medical literature prior to July 2013.9 The usefulness of most models remains unclear, however, owing to:
methodological shortcomings,
considerable heterogeneity in the definitions of outcomes, and
lack of external validation.
Even models that are well-validated for a specific population suffer from lack of applicability to a broad multinational population.
In the United Kingdom (UK), electronic health record systems now have the QRISK2 tool embedded to calculate 10-year CVD risk. This algorithm incorporates multiple traditional and nontraditional risk factors (TABLE10). With the inclusion of additional risk factors and validation performed in a population similar to the one from which the algorithm was derived, QRISK2 predicts CVD risk in the UK population more accurately than the modified FRS does.10 It is not clear, however, whether the same algorithm can be applied to the general US population.
New tool: 2013 ACC/AHA pooled cohort risk equations
In the context of multiple imperfect CVD risk-prediction algorithms, the American College of Cardiology/American Heart Association (ACC/AHA) Task Force on Practice Guidelines published the 2013 Pooled Cohort Risk (PCR) equations to predict 10-year risk of a first atherosclerotic CVD event. The Task Force acknowledged concern that the FRS is based on a cohort that might not accurately represent the general US population. Accordingly, PCR equations were developed from 5 large National Institutes of Health (NIH)-funded cohorts: the Framingham Heart Study, the Framingham Offspring Study, the Atherosclerosis Risk in Communities study, the Cardiovascular Health Study, and the Coronary Artery Risk Development in Young Adults Study.
Continue to: The resulting CVD risk calculator incorporates...
The resulting CVD risk calculator incorporates 4 risk equations: 1 each for African-American and non-Hispanic white males and females.11 Of note, PCR equations are typically used to estimate 10-year CVD risk, but they can be modified to estimate risk over any period. The associated Guideline on the Assessment of Cardiovascular Risk recommends statin therapy for primary prevention of CVD in patients with a predicted 10-year risk ≥7.5% and consideration of statin therapy for patients with a predicted 10-year risk between 5% and 7.5%.12
In late 2016, the US Preventive Services Task Force (USPSTF) recommended low- to moderate-dosage statin therapy in adults 40 to 75 years of age without a history of CVD but with at least 1 CVD risk factor (dyslipidemia, diabetes, hypertension, or smoking), and a PCR-calculated 10-year CVD risk of ≥10%. For people with a PCR-calculated risk of 7.5% to 10%, the USPSTF recommended that clinicians “selectively offer” low- to moderate-dosage statin therapy, noting a smaller likelihood of benefit and uncertainty in an individual’s risk prediction.13
Pooled cohort risk equations have predictive validity
Estimates are that nearly 50% of US adults and as many as 65% of European adults would be candidates for statin therapy if, using PCR equations, the 2013 ACC/AHA guidelines were broadly applied.14 Since PCR equations were released, multiple groups have attempted to evaluate the predictive validity of the algorithm in various populations, with mixed findings.
The true impact of systematic CVD risk assessment alone for healthy people has yet to be demonstrated, in terms of hard clinical outcomes.
Data from the 1999-2010 NHANES—the National Health and Nutrition Examination Survey—were used to calculate estimated CVD risk for patients free of atherosclerotic CVD at baseline. Risk prediction using PCR equations was compared to true all-cause and CVD mortality using the National Center for Health Statistics National Death Index. In this large, US adult population without CVD at baseline, PCR-estimated CVD risk was significantly associated with all-cause and CVD-specific mortality risk.15
In a community-based primary prevention cohort, 39% of participants were found statin-eligible—ie, they had an estimated 10-year CVD risk ≥7.5%—by ACC/AHA guidelines, compared with 14% found statin-eligible by the guidelines of the National Cholesterol Education Program’s 2004 updated “Third Report of the Expert Panel on Detection, Evaluation, and Treatment of High Blood Cholesterol in Adults (ATP III).” Despite the larger percentage, participants who were statin-eligible by ACC/AHA guidelines had an increased hazard ratio for incident CVD compared with those who were statin-eligible by ATP III; investigators concluded that ACC/AHA guidelines using PCR equations were associated with greater accuracy and efficiency in identifying increased risk of incident CVD.16
Continue to: Pooled cohort risk equations might overestimate CVD risk
Pooled cohort risk equations might overestimate CVD risk
In contrast, a more recent study followed a large, integrated US health-care delivery system population over 5 years, starting in 2008.17 In this group of adults without diabetes, PCR equations substantially overestimated actual 5-year risk of CVD in both sexes and across multiple socioeconomic strata. Similar overestimation of CVD risk was demonstrated in non-Hispanic white, non-Hispanic black, Asian/Pacific Islander, and Hispanic subjects. The latter 2 ethnic groups are considered “white or other” in the atherosclerotic CVD risk equation, raising additional concern that PCR equations may not be accurate for broad, multiethnic application.17 The ACC/AHA Cardiovascular Risk Assessment guideline recognizes this concern, as well, noting that PCR equations may overestimate risk for Hispanic and Asian Americans.12
ACC/AHA PCR equations might substantially overestimate CVD risk and lead to expanded use of statins in patient populations for which such treatment has less potential benefit.
Predicted 10-year CVD risk using PCR equations was compared with observed event rates in 3 large-scale primary prevention cohorts: the Women’s Health Study, the Physicians’ Health Study, and the Women’s Health Initiative Observational Study.18 In each cohort, the ACC/AHA risk prediction algorithm overestimated observed risk by 75% to 150%. The authors concluded that 40% to 50% of the 33 million middle-aged Americans deemed statin-eligible by ACC/AHA guidelines may not have actual CVD risk that exceeds the 7.5% threshold recommended for statin treatment.18
Therefore, the discrimination of PCR equations—their ability to differentiate between individuals who are more or less likely to develop clinical CVD—is good. The calibration of the equations—the difference between predicted and observed risk—is not as good, however: PCR equations appear to overestimate actual risk in many groups.15
Additional limitations to pooled cohort risk equations
The predictive value of PCR equations is hampered by several factors:
Despite expansion of the studied cohorts beyond the original Framingham population, the groups still include people screened for study participation or enrolled in clinical trials. The generalizability of this study population to the diverse population treated in a typical clinical practice is, potentially, limited.
Use of strategies for primary prevention of CVD (eg, statin therapy, antiplatelet therapy, BP control, blood glucose control) continues to increase. Lowering the risk of CVD in the general population with a broad primary prevention approach effectively widens the gap between observed and equation-predicted CVD risk—and thus strengthens the impression of overestimation of risk by PCR equations.
Lack of comprehensive surveillance in some studies may result in underassessment of CVD events. In this case, PCR equations would, again, appear to overestimate risk.19
Novel tools are available; their use is qualified
First, newer risk markers offer additional options for improving risk prediction offered by the ACC/AHA PCR equations: Coronary artery calcium, ankle-brachial index, high-sensitivity C-reactive protein, and a family history of CAD are all independently associated with incident CAD. ACC/AHA guidelines suggest that assessment of 1 or more of these variables might be considered an adjunct when risk assessment using PCR equations alone does not offer information for making a clear treatment decision.12
Continue to: Of the 4 risk markers...
Of the 4 risk markers, coronary artery calcium provides the most significant increase in discrimination compared to the FRS alone; comparative data using PCR equations is unavailable.20 ACC/AHA guidelines specifically recommend against routine measurement of carotid intima-media thickness for assessment of risk of a first atherosclerotic event.12
Second, a revised set of PCR equations offers improved discrimination and calibration compared to the 2013 PCR equations. A National Institutes of Health (NIH)-sponsored group updated the equations’ cohort by 1) eliminating the original Framingham Heart Study (FHS) data, which was first collected in 1948, and 2) adding data from the Jackson Heart Study and the Multi-Ethnic Study of Atherosclerosis (MESA). Both new cohorts include patient data from 2000 to 2012. Additionally, the NIH group modified the statistical methods used to derive PCR equations. Although these revised PCR equations offer a substantially more accurate estimate of CVD risk, they have not yet been validated for routine clinical use.21
Bottom line: In prediction there persists imperfection
It is widely held that CVD risk prediction, with subsequent treatment to reduce identified risk, is an important component of an overall strategy to reduce the burden of CVD. Cardiovascular risk factors, such as BP and lipid values, do show limited improvement among populations in which systematic screening is practiced, but the true impact of systematic CVD risk assessment alone for healthy people has yet to be demonstrated in terms of hard clinical outcomes.22
The true impact of systematic CVD risk assessment alone for healthy people has yet to be demonstrated in terms of hard clinical outcomes.
CVD risk prediction is most widely used to inform recommendations for statin treatment. However, ACC/AHA PCR equations might substantially overestimate CVD risk and lead to expanded use of statins in patient populations for which such treatment has less potential benefit. Nonetheless, PCR equations do offer good discrimination between higher-risk and lower-risk people.
CVD risk prediction remains an imperfect science—science that is best used as an adjunct to discussion of comprehensive CVD risk factor modification with the individual patient.
CORRESPONDENCE Jonathon M. Firnhaber, MD, Brody School of Medicine, East Carolina University, 101 Heart Drive, Greenville, NC 27834; firnhaberj@ecu.edu.
References
1. Taylor F, Huffman MD, Macedo AF, et al. Statins for the primary prevention of cardiovascular disease. Cochrane Database Syst Rev. 2013 Jan 31;(1):CD004816.
2. Holt T. Predicting cardiovascular disease. BMJ. 2016;353:i2621.
3. Kannel WB, McGee D, Gordon T. A general cardiovascular risk profile: the Framingham Study. Am J Cardiol. 1976;38:46-51.
4. Preiss D, Kristensen SL. The new pooled cohort equations risk calculator. Can J Cardiol. 2015;31:613-619.
5. Koller MT, Steyerberg EW, Wolbers M, et al. Validity of the Framingham point scores in the elderly: results from the Rotterdam study. Am Heart J. 2007;154:87-93.
6. Franklin SS, Larson MG, Khan SA, et al. Does the relation of blood pressure to coronary heart disease risk change with aging? The Framingham Heart Study. Circulation. 2001;103:1245-1249.
7. Law MR, Wald NJ, Thompson SG. By how much and how quickly does reduction in serum cholesterol concentration lower risk of ischaemic heart disease? BMJ. 1994;308:367-372.
8. Koller MT, Leening MJ, Wolbers M, et al. Development and validation of a coronary risk prediction model for older U.S. and European persons in the Cardiovascular Health Study and the Rotterdam Study. Ann Intern Med. 2012;157:389-397.
9. Damen JA, Hooft L, Schuit E, et al. Prediction models for cardiovascular disease risk in the general population: systematic review. BMJ. 2016;353:i2416.
10. Hippisley-Cox J, Coupland C, Vinogradova Y, et al. Predicting cardiovascular risk in England and Wales: prospective derivation and validation of QRISK2. BMJ. 2008;336:1475–1482.
11. Stone NJ, Robinson JG, Lichtenstein AH, et al. 2013 ACC/AHA guideline on the treatment of blood cholesterol to reduce atherosclerotic cardiovascular risk in adults: a report of the American College of Cardiology/American Heart Association Task Force on Practice Guidelines. J Amer Coll Cardiol. 2014;63:2889-2934.
12. Goff DC Jr, Lloyd-Jones DM, Bennett G, et al. 2013 ACC/AHA guideline on the assessment of cardiovascular risk: a report of the American College of Cardiology/American Heart Association Task Force on Practice Guidelines. J Am Coll Cardiol. 2014;63:2935-2959.
13. US Preventive Services Task Force, Bibbins-Domingo K, Grossman DC, et al. Statin use for the primary prevention of cardiovascular disease in adults: US Preventive Services Task Force Recommendation Statement. JAMA. 2016;316:1997-2007.
14. Pencina MJ, Navar-Boggan AM, D’Agostino RB Sr, et al. Application of new cholesterol guidelines to a population-based sample. New Engl J Med. 2014;370:1422-1431.
15. Loprinzi PD, Addoh O. Predictive validity of the American College of Cardiology/American Heart Association pooled cohort equations in predicting all-cause and cardiovascular disease–specific mortality in a national prospective cohort study of adults in the United States. Mayo Clin Proc. 2016;91:763-769.
16. Pursnani A, Massaro JM, D’Agostino RB Sr, et al. Guideline-based statin eligibility, coronary artery calcification, and cardiovascular events. JAMA. 2015;314:134-141.
17. Rana JS, Tabada GH, Solomon MD, et al. Accuracy of the atherosclerotic cardiovascular risk equation in a large contemporary, multiethnic population. J Am Coll Cardiol. 2016;67:2118-2130.
18. Ridker PM, Cook NR. Statins: new American guidelines for prevention of cardiovascular disease. Lancet. 2013;382:1762-1765.
19. Cook NR, Ridker PM. Further insight into the cardiovascular risk calculator: the roles of statins, revascularizations, and underascertainment in the Women’s Health Study. JAMA Intern Med. 2014;174:1964-1971.
20. Yeboah J, McClelland RJ, Polonsky TS, et al. Comparison of novel risk markers for improvement in cardiovascular risk assessment in intermediate-risk individuals. JAMA. 2012;308:788-795.
21. Yadlowsky S, Hayward RA, Sussman JB, et al. Clinical implications of revised pooled cohort equations for estimating atherosclerotic cardiovascular disease risk. Ann Intern Med. 2018;169:20-29.
22. Dyakova M, Shantikumar S, Colquitt J, et al. Systematic versus opportunistic risk assessment for the primary prevention of cardiovascular disease. Cochrane Database Syst Rev. 2016 Jan 29;(1):CD010411.
Prevention of cardiovascular disease (CVD) requires timely identification of people who are at increased risk in order to target effective dietary, lifestyle, or pharmacotherapeutic intervention—or a combination of the 3. Risk factors for CVD are well understood, but the relative impact of each factor on an individual’s overall risk is difficult to accurately quantify, making a validated CVD risk calculator an important clinical tool.
Despite numerous available CVD risk calculators, one best tool has yet to emerge. This state of affairs has limited the ability of front-line providers who are tasked with primary prevention of CVD—including family physicians (FPs)—to provide the best evidence-based recommendations to patients.
Implications of CVD risk assessment
Baseline CVD risk assessment is the cornerstone of recommendations for primary prevention of CVD, including aspirin and statin therapy. Interventions to lower CVD risk are of greatest benefit to those at highest risk at initiation of therapy. Overall, statins reduce the risk of a first cardiovascular event in otherwise healthy people by approximately 25% over 10 years.1 Because relative risk reduction is fairly consistent across different levels of absolute risk, a 25% relative reduction confers more actual benefit if risk starts at, say, 40% than at 10%.2 In that example, the same 25% reduction in relative risk results in 1) an absolute risk reduction of 10% when risk starts at 40%, compared to an absolute risk reduction of 2.5% when risk starts at 10% and 2) a number needed to treat (NNT) of, respectively, 10 and 40 (over 10 years).
Identifying a person with an elevated risk of developing CVD has multiple implications. Ideally, that patient is motivated to pursue positive therapeutic lifestyle modifications and make changes that positively affect long-term CVD risk. Conversely, that asymptomatic person identified as at elevated risk also becomes a patient with a medical problem that might adversely affect insurance premiums and self-esteem, and may trigger the use of medications with cost and potential adverse effects. Although the benefit of preventive therapy is greater for a patient at higher risk of disease, the harm of a therapy is relatively constant across all risk groups. Accurately discriminating high and low risk of CVD is, therefore, imperative.
The venerable Framingham risk score
Cardiovascular risk prediction has its roots in the late 1940s, when primary risk factors for CVD were not well-understood, with the inception of the Framingham Heart Study. (A greater understanding of CVD risk today notwithstanding, coronary artery disease [CAD] remains the leading cause of death among American adults.) In the late 1940s, blood pressure (BP) was recognized as the single most useful variable for identifying people at high risk of CVD; other variables were understood to be predictive as well. A composite score—the Framingham Risk Score (FRS)—was thereby developed to calculate the probability that CVD would occur over 8 years in a person who was initially free of such disease.3
While the benefit of a preventive therapy is greater for those at higher risk of disease, the harm of a therapy is relatively constant across all risk groups.
The original FRS included glucose intolerance and left ventricular hypertrophy (LVH) identified by electrocardiography (EKG) in its algorithm.3 Other, older algorithms also include a family history of premature CVD. In each risk calculator, these variables are treated as dichotomous (Yes or No), but actual risk associated with each variable is in fact more along a continuum. It is now well-recognized that the sensitivity of EKG for accurately detecting LVH is relatively low; more recent algorithms no longer include this component. A family history of premature CVD variably contributes to an individual’s CVD risk; however, its true impact is nearly impossible to accurately quantify, so this variable is also not included in more modern risk calculators.
Caution: The FRS has meaningful limitations
Although the original Framingham cohort has been expanded multiple times since its inception, clinicians and researchers continue to express concern that the predominantly white, middle-class Framingham, Massachusetts, population might not be representative of the United States in general—which would limit the accuracy of the FRS predictive tool when it is applied to a more diverse population. Furthermore, cholesterol-lowering medications were not available when the FRS was first developed. The FRS, therefore, might not accurately estimate risk in more modern populations, in whom aggressive modification of CVD risk factors has resulted in a lower overall rate of atherosclerotic CVD than when the FRS was developed.4
Continue to: Although demographic changes have increasingly...
Although demographic changes have increasingly led to an extension of primary prevention strategies for CAD to elderly people, the FRS has been demonstrated to perform less well in patients older than 70 years, particularly men.5 An ideal CAD prediction model for elderly people should take into account that, with growing age and frailty, CAD events may be increasingly preempted by death from competing non-coronary causes. In addition, the predictive association of typical CVD risk factors diminishes with increasing age.6,7 Koller and colleagues developed a CAD risk prediction model that accounted for death from non-coronary causes and was validated specifically in patients 65 years and older. Koller’s prediction model provided well-calibrated risk estimates, but it was still not substantially more accurate than the FRS—illustrating the overall difficulty in predicting CAD risk in elderly people.8
Alternative risk calculators have come on the scene
Over the past 2 decades, numerous models have been developed in an attempt to overcome the perceived shortcomings of the FRS. A recent systematic review identified 363 prediction models described in the medical literature prior to July 2013.9 The usefulness of most models remains unclear, however, owing to:
methodological shortcomings,
considerable heterogeneity in the definitions of outcomes, and
lack of external validation.
Even models that are well-validated for a specific population suffer from lack of applicability to a broad multinational population.
In the United Kingdom (UK), electronic health record systems now have the QRISK2 tool embedded to calculate 10-year CVD risk. This algorithm incorporates multiple traditional and nontraditional risk factors (TABLE10). With the inclusion of additional risk factors and validation performed in a population similar to the one from which the algorithm was derived, QRISK2 predicts CVD risk in the UK population more accurately than the modified FRS does.10 It is not clear, however, whether the same algorithm can be applied to the general US population.
New tool: 2013 ACC/AHA pooled cohort risk equations
In the context of multiple imperfect CVD risk-prediction algorithms, the American College of Cardiology/American Heart Association (ACC/AHA) Task Force on Practice Guidelines published the 2013 Pooled Cohort Risk (PCR) equations to predict 10-year risk of a first atherosclerotic CVD event. The Task Force acknowledged concern that the FRS is based on a cohort that might not accurately represent the general US population. Accordingly, PCR equations were developed from 5 large National Institutes of Health (NIH)-funded cohorts: the Framingham Heart Study, the Framingham Offspring Study, the Atherosclerosis Risk in Communities study, the Cardiovascular Health Study, and the Coronary Artery Risk Development in Young Adults Study.
Continue to: The resulting CVD risk calculator incorporates...
The resulting CVD risk calculator incorporates 4 risk equations: 1 each for African-American and non-Hispanic white males and females.11 Of note, PCR equations are typically used to estimate 10-year CVD risk, but they can be modified to estimate risk over any period. The associated Guideline on the Assessment of Cardiovascular Risk recommends statin therapy for primary prevention of CVD in patients with a predicted 10-year risk ≥7.5% and consideration of statin therapy for patients with a predicted 10-year risk between 5% and 7.5%.12
In late 2016, the US Preventive Services Task Force (USPSTF) recommended low- to moderate-dosage statin therapy in adults 40 to 75 years of age without a history of CVD but with at least 1 CVD risk factor (dyslipidemia, diabetes, hypertension, or smoking), and a PCR-calculated 10-year CVD risk of ≥10%. For people with a PCR-calculated risk of 7.5% to 10%, the USPSTF recommended that clinicians “selectively offer” low- to moderate-dosage statin therapy, noting a smaller likelihood of benefit and uncertainty in an individual’s risk prediction.13
Pooled cohort risk equations have predictive validity
Estimates are that nearly 50% of US adults and as many as 65% of European adults would be candidates for statin therapy if, using PCR equations, the 2013 ACC/AHA guidelines were broadly applied.14 Since PCR equations were released, multiple groups have attempted to evaluate the predictive validity of the algorithm in various populations, with mixed findings.
The true impact of systematic CVD risk assessment alone for healthy people has yet to be demonstrated, in terms of hard clinical outcomes.
Data from the 1999-2010 NHANES—the National Health and Nutrition Examination Survey—were used to calculate estimated CVD risk for patients free of atherosclerotic CVD at baseline. Risk prediction using PCR equations was compared to true all-cause and CVD mortality using the National Center for Health Statistics National Death Index. In this large, US adult population without CVD at baseline, PCR-estimated CVD risk was significantly associated with all-cause and CVD-specific mortality risk.15
In a community-based primary prevention cohort, 39% of participants were found statin-eligible—ie, they had an estimated 10-year CVD risk ≥7.5%—by ACC/AHA guidelines, compared with 14% found statin-eligible by the guidelines of the National Cholesterol Education Program’s 2004 updated “Third Report of the Expert Panel on Detection, Evaluation, and Treatment of High Blood Cholesterol in Adults (ATP III).” Despite the larger percentage, participants who were statin-eligible by ACC/AHA guidelines had an increased hazard ratio for incident CVD compared with those who were statin-eligible by ATP III; investigators concluded that ACC/AHA guidelines using PCR equations were associated with greater accuracy and efficiency in identifying increased risk of incident CVD.16
Continue to: Pooled cohort risk equations might overestimate CVD risk
Pooled cohort risk equations might overestimate CVD risk
In contrast, a more recent study followed a large, integrated US health-care delivery system population over 5 years, starting in 2008.17 In this group of adults without diabetes, PCR equations substantially overestimated actual 5-year risk of CVD in both sexes and across multiple socioeconomic strata. Similar overestimation of CVD risk was demonstrated in non-Hispanic white, non-Hispanic black, Asian/Pacific Islander, and Hispanic subjects. The latter 2 ethnic groups are considered “white or other” in the atherosclerotic CVD risk equation, raising additional concern that PCR equations may not be accurate for broad, multiethnic application.17 The ACC/AHA Cardiovascular Risk Assessment guideline recognizes this concern, as well, noting that PCR equations may overestimate risk for Hispanic and Asian Americans.12
ACC/AHA PCR equations might substantially overestimate CVD risk and lead to expanded use of statins in patient populations for which such treatment has less potential benefit.
Predicted 10-year CVD risk using PCR equations was compared with observed event rates in 3 large-scale primary prevention cohorts: the Women’s Health Study, the Physicians’ Health Study, and the Women’s Health Initiative Observational Study.18 In each cohort, the ACC/AHA risk prediction algorithm overestimated observed risk by 75% to 150%. The authors concluded that 40% to 50% of the 33 million middle-aged Americans deemed statin-eligible by ACC/AHA guidelines may not have actual CVD risk that exceeds the 7.5% threshold recommended for statin treatment.18
Therefore, the discrimination of PCR equations—their ability to differentiate between individuals who are more or less likely to develop clinical CVD—is good. The calibration of the equations—the difference between predicted and observed risk—is not as good, however: PCR equations appear to overestimate actual risk in many groups.15
Additional limitations to pooled cohort risk equations
The predictive value of PCR equations is hampered by several factors:
Despite expansion of the studied cohorts beyond the original Framingham population, the groups still include people screened for study participation or enrolled in clinical trials. The generalizability of this study population to the diverse population treated in a typical clinical practice is, potentially, limited.
Use of strategies for primary prevention of CVD (eg, statin therapy, antiplatelet therapy, BP control, blood glucose control) continues to increase. Lowering the risk of CVD in the general population with a broad primary prevention approach effectively widens the gap between observed and equation-predicted CVD risk—and thus strengthens the impression of overestimation of risk by PCR equations.
Lack of comprehensive surveillance in some studies may result in underassessment of CVD events. In this case, PCR equations would, again, appear to overestimate risk.19
Novel tools are available; their use is qualified
First, newer risk markers offer additional options for improving risk prediction offered by the ACC/AHA PCR equations: Coronary artery calcium, ankle-brachial index, high-sensitivity C-reactive protein, and a family history of CAD are all independently associated with incident CAD. ACC/AHA guidelines suggest that assessment of 1 or more of these variables might be considered an adjunct when risk assessment using PCR equations alone does not offer information for making a clear treatment decision.12
Continue to: Of the 4 risk markers...
Of the 4 risk markers, coronary artery calcium provides the most significant increase in discrimination compared to the FRS alone; comparative data using PCR equations is unavailable.20 ACC/AHA guidelines specifically recommend against routine measurement of carotid intima-media thickness for assessment of risk of a first atherosclerotic event.12
Second, a revised set of PCR equations offers improved discrimination and calibration compared to the 2013 PCR equations. A National Institutes of Health (NIH)-sponsored group updated the equations’ cohort by 1) eliminating the original Framingham Heart Study (FHS) data, which was first collected in 1948, and 2) adding data from the Jackson Heart Study and the Multi-Ethnic Study of Atherosclerosis (MESA). Both new cohorts include patient data from 2000 to 2012. Additionally, the NIH group modified the statistical methods used to derive PCR equations. Although these revised PCR equations offer a substantially more accurate estimate of CVD risk, they have not yet been validated for routine clinical use.21
Bottom line: In prediction there persists imperfection
It is widely held that CVD risk prediction, with subsequent treatment to reduce identified risk, is an important component of an overall strategy to reduce the burden of CVD. Cardiovascular risk factors, such as BP and lipid values, do show limited improvement among populations in which systematic screening is practiced, but the true impact of systematic CVD risk assessment alone for healthy people has yet to be demonstrated in terms of hard clinical outcomes.22
The true impact of systematic CVD risk assessment alone for healthy people has yet to be demonstrated in terms of hard clinical outcomes.
CVD risk prediction is most widely used to inform recommendations for statin treatment. However, ACC/AHA PCR equations might substantially overestimate CVD risk and lead to expanded use of statins in patient populations for which such treatment has less potential benefit. Nonetheless, PCR equations do offer good discrimination between higher-risk and lower-risk people.
CVD risk prediction remains an imperfect science—science that is best used as an adjunct to discussion of comprehensive CVD risk factor modification with the individual patient.
CORRESPONDENCE Jonathon M. Firnhaber, MD, Brody School of Medicine, East Carolina University, 101 Heart Drive, Greenville, NC 27834; firnhaberj@ecu.edu.
References
1. Taylor F, Huffman MD, Macedo AF, et al. Statins for the primary prevention of cardiovascular disease. Cochrane Database Syst Rev. 2013 Jan 31;(1):CD004816.
2. Holt T. Predicting cardiovascular disease. BMJ. 2016;353:i2621.
3. Kannel WB, McGee D, Gordon T. A general cardiovascular risk profile: the Framingham Study. Am J Cardiol. 1976;38:46-51.
4. Preiss D, Kristensen SL. The new pooled cohort equations risk calculator. Can J Cardiol. 2015;31:613-619.
5. Koller MT, Steyerberg EW, Wolbers M, et al. Validity of the Framingham point scores in the elderly: results from the Rotterdam study. Am Heart J. 2007;154:87-93.
6. Franklin SS, Larson MG, Khan SA, et al. Does the relation of blood pressure to coronary heart disease risk change with aging? The Framingham Heart Study. Circulation. 2001;103:1245-1249.
7. Law MR, Wald NJ, Thompson SG. By how much and how quickly does reduction in serum cholesterol concentration lower risk of ischaemic heart disease? BMJ. 1994;308:367-372.
8. Koller MT, Leening MJ, Wolbers M, et al. Development and validation of a coronary risk prediction model for older U.S. and European persons in the Cardiovascular Health Study and the Rotterdam Study. Ann Intern Med. 2012;157:389-397.
9. Damen JA, Hooft L, Schuit E, et al. Prediction models for cardiovascular disease risk in the general population: systematic review. BMJ. 2016;353:i2416.
10. Hippisley-Cox J, Coupland C, Vinogradova Y, et al. Predicting cardiovascular risk in England and Wales: prospective derivation and validation of QRISK2. BMJ. 2008;336:1475–1482.
11. Stone NJ, Robinson JG, Lichtenstein AH, et al. 2013 ACC/AHA guideline on the treatment of blood cholesterol to reduce atherosclerotic cardiovascular risk in adults: a report of the American College of Cardiology/American Heart Association Task Force on Practice Guidelines. J Amer Coll Cardiol. 2014;63:2889-2934.
12. Goff DC Jr, Lloyd-Jones DM, Bennett G, et al. 2013 ACC/AHA guideline on the assessment of cardiovascular risk: a report of the American College of Cardiology/American Heart Association Task Force on Practice Guidelines. J Am Coll Cardiol. 2014;63:2935-2959.
13. US Preventive Services Task Force, Bibbins-Domingo K, Grossman DC, et al. Statin use for the primary prevention of cardiovascular disease in adults: US Preventive Services Task Force Recommendation Statement. JAMA. 2016;316:1997-2007.
14. Pencina MJ, Navar-Boggan AM, D’Agostino RB Sr, et al. Application of new cholesterol guidelines to a population-based sample. New Engl J Med. 2014;370:1422-1431.
15. Loprinzi PD, Addoh O. Predictive validity of the American College of Cardiology/American Heart Association pooled cohort equations in predicting all-cause and cardiovascular disease–specific mortality in a national prospective cohort study of adults in the United States. Mayo Clin Proc. 2016;91:763-769.
16. Pursnani A, Massaro JM, D’Agostino RB Sr, et al. Guideline-based statin eligibility, coronary artery calcification, and cardiovascular events. JAMA. 2015;314:134-141.
17. Rana JS, Tabada GH, Solomon MD, et al. Accuracy of the atherosclerotic cardiovascular risk equation in a large contemporary, multiethnic population. J Am Coll Cardiol. 2016;67:2118-2130.
18. Ridker PM, Cook NR. Statins: new American guidelines for prevention of cardiovascular disease. Lancet. 2013;382:1762-1765.
19. Cook NR, Ridker PM. Further insight into the cardiovascular risk calculator: the roles of statins, revascularizations, and underascertainment in the Women’s Health Study. JAMA Intern Med. 2014;174:1964-1971.
20. Yeboah J, McClelland RJ, Polonsky TS, et al. Comparison of novel risk markers for improvement in cardiovascular risk assessment in intermediate-risk individuals. JAMA. 2012;308:788-795.
21. Yadlowsky S, Hayward RA, Sussman JB, et al. Clinical implications of revised pooled cohort equations for estimating atherosclerotic cardiovascular disease risk. Ann Intern Med. 2018;169:20-29.
22. Dyakova M, Shantikumar S, Colquitt J, et al. Systematic versus opportunistic risk assessment for the primary prevention of cardiovascular disease. Cochrane Database Syst Rev. 2016 Jan 29;(1):CD010411.
› Avoid the inclination to think that there is 1 best tool for accurately estimating an asymptomatic patient’s risk of cardiovascular disease (CVD). C
› Be mindful that 2013 ACC/AHA Pooled Cohort Risk equations can overestimate CVD risk depending on multiple factors, including the population being evaluated (even though the equations might be the most generalizable of available CVD risk calculators). C
› Consider using one of the newer CVD risk markers to further inform treatment recommendations when quantitative risk assessment does not offer information for making a clear treatment decision. C
Strength of recommendation (SOR)
A Good-quality patient-oriented evidence B Inconsistent or limited-quality patient-oriented evidence C Consensus, usual practice, opinion, disease-oriented evidence, case series
Disallow All Ads
Content Gating
No Gating (article Unlocked/Free)
Alternative CME
PubMed ID
30216402
Disqus Comments
Default
Consolidated Pubs: Do Not Show Source Publication Logo


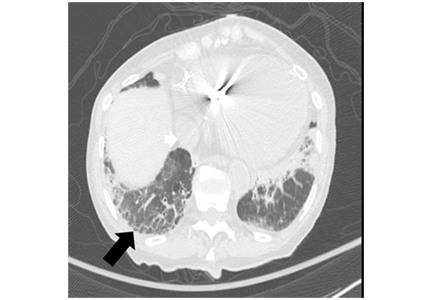
 over 5 years in normal postmenopausal women")

 from baseline to 2 years")