User login
Interventions to Improve Follow-Up of Laboratory Test Results Pending at Discharge: A Systematic Review
The 2015 National Academy of Sciences (NAS; formerly the Institute of Medicine [IOM]) report, Improving Diagnosis in Health Care, attributes up to 10% of patient deaths and 17% of hospital adverse events to diagnostic errors,1 one cause of which is absent or delayed follow-up of laboratory test results.2 Poor communication or follow-up of laboratory tests with abnormal results has been cited repeatedly as a threat to patient safety.1,3,4 In a survey of internists, 83% reported at least one unacceptably delayed laboratory test result during the previous 2 months.5
Care transitions magnify the risk of missed test results.6,7 Up to 16% of all emergency department (ED) and 23% of all hospitalized patients will have pending laboratory test results at release or discharge.6 The percentage of tests that received follow-up ranged from 1% to 75% for tests done in the ED and from 20% to 69% for tests ordered on inpatients. In one study, 41% of all surveyed medical inpatients had at least one test result pending at discharge (TPAD). When further studied, over 40% of the results were abnormal and 9% required action, but the responsible physicians were unaware of 62% of the test results.8 Many examples of morbidity from such failure have been reported. One of many described by El-Kareh et al., for example, is that of an 81-year-old man on total parenteral nutrition who was treated for suspected line infection and discharged without antibiotics, but whose blood cultures grew Klebsiella pneumoniae after his discharge.9 Another example, presented on the Agency for Healthcare Research and Quality (AHRQ) Patient Safety Network, reported a patient admitted for a urinary tract infection and then discharged from the hospital on trimethoprim–sulfamethoxazole. He returned to the hospital 11 days later with severe sepsis. Upon review, the urine culture results from his previous admission, which were returned 2 days after his discharge, indicated that the infectious agent was not sensitive to trimethoprim–sulfamethoxazole. The results had not been reviewed by hospital clinicians or forwarded to the patient’s physician, so the patient continued on the ineffective treatment. His second hospital admission lasted 7 days, but he made a complete recovery with the correct antibiotic.10
Several barriers impede the follow-up of TPAD. First, who should receive test results or who is responsible for addressing them may be unclear. Second, even if responsibility is clear, communication between the provider who ordered the test and the provider responsible for follow-up may be suboptimal.11 Finally, providers who need to follow up on abnormal results may not appreciate the urgency or significance of pending results.
The hospitalist model of care increases efficiency during hospitalization but further complicates care coordination.12 The hospitalist who orders a test may not be on duty at discharge or when test results are finalized. Primary care providers may have little contact with their patients during their admission.12 Effective communication between providers is key to ensuring appropriate follow-up care, but primary care physicians and hospital physicians communicate directly in 20% or fewer admissions.13 The hospital discharge summary is the primary method of communication with the next provider, but 65%–84% of all discharge summaries lack information on TPAD.13,14
In this work, we sought to identify and evaluate interventions aimed at improving documentation, communication, and follow-up of TPAD. This review was conducted through the Laboratory Medicine Best Practices (LMBP™) initiative, which is sponsored by the Centers for Disease Control and Prevention’s (CDC’s) Division of Laboratory Systems (https://wwwn.cdc.gov/labbestpractices/). The LMBP™ was initiated as the CDC’s response to the IOM report To Err is Human: Building a Safer Health System.15
METHODS
We applied the first four phases of the LMBP™-developed A-6 Cycle methodology to evaluate quality improvement practices as described below.16 Our report follows the Meta-analysis Of Observational Studies in Epidemiology (MOOSE) guidelines.17
Asking the Question
The full review, which is available from the corresponding author, assessed the evidence that the interventions improved (1) the timeliness of follow-up of TPAD or reduced adverse health events; (2) discharge planning, documentation, or communication with the outpatient care provider regarding TPAD; and (3) health outcomes. In this article, we present the impact of interventions to improve the documentation, communication, and follow-up of TPAD. The review protocol, which is also available from the corresponding author, was developed with the input of a panel of experts (Appendix A) in laboratory medicine, systematic reviews, informatics, and patient safety. The analytic framework (Appendix B) describes the scope of the review. The inclusion criteria for papers reporting on interventions to improve communication of TPAD are the following:
- Population: Patients who were admitted to an inpatient facility or who visited an ED (including patients released from the ED) and who had one or more TPADs.
- Interventions: Practices that explicitly aimed to improve the documentation, communication, or follow-up of TPAD, alone or as part of a broader quality improvement effort.
- Comparators: Standard practice, pre-intervention practice, or any other valid comparator.
- Outcomes: Documentation completeness, physician awareness of pending tests, or follow-up of TPAD.
Acquire the Evidence
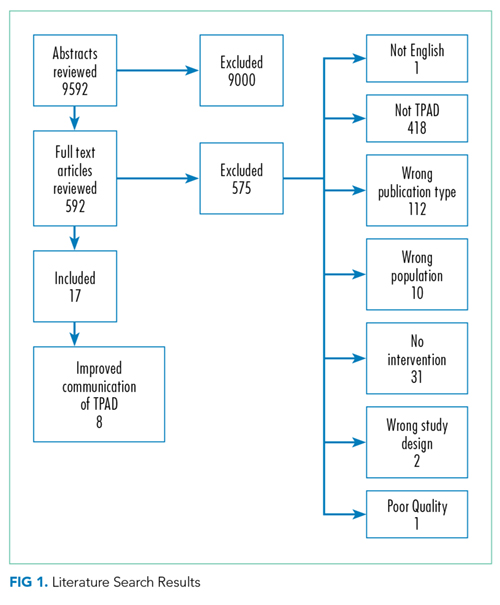
A professional librarian conducted literature searches in PubMed, CINAHL, Cochrane, and EMBASE using terms that captured relevant health care settings, transition of patient care, laboratory tests, communication, and pending or missed tests (Appendix C). Citations were also identified by expert panel members and by manual searches of bibliographies of relevant studies. We included studies published in English in 2005 or later. We sought unpublished studies through expert panelists and queries to relevant professional organizations.
Appraise the Studies
Two independent reviewers evaluated each retrieved citation for inclusion. We excluded articles that (1) did not explicitly address laboratory TPAD; (2) were letters, editorials, commentaries, or abstracts; (3) did not address transition between settings; (4) did not include an intervention; (5) were case reports or case series; or (6) were not published in English. A team member abstracted predetermined data elements (Appendix D) from each included study, and a senior scientist reviewed the abstraction. Two senior scientists independently scored the quality of the eligible studies on the A-6 domains of study characteristics, practice description, outcome measures, and results and findings; studies scored below 4 points on a 10-point scale were excluded. Based on this appraisal, studies were classified as good, fair, or poor; poor studies were excluded.
Analyze the Evidence
We synthesized the evidence by intervention type and outcome. The strength of the evidence that each intervention improved the desired outcome was rated in accordance with the A-6 methodology as high, moderate, suggestive, or insufficient based on the number of studies, the study ratings, and the consistency and magnitude of the effect size.
RESULTS
Education to Improve Discharge Summaries

Electronic Tools for Preparation of Discharge Summaries
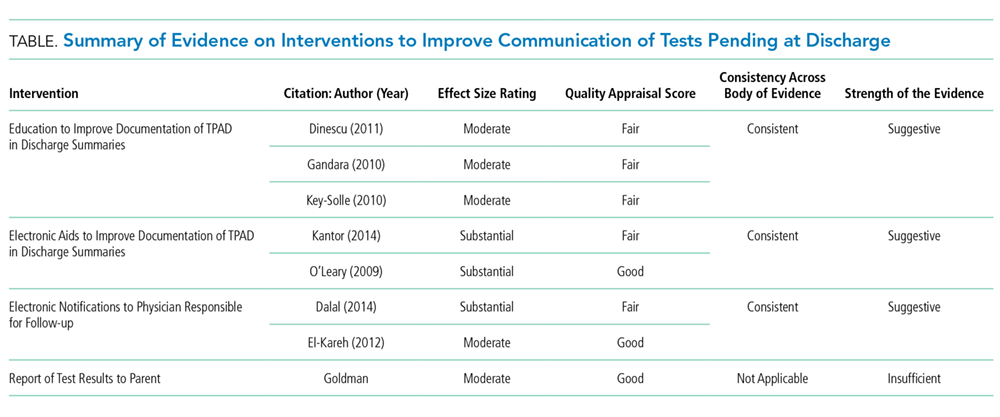
Two studies 21,22 investigated tools to aid preparation of discharge summaries. Kantor et al.,21 rated fair, evaluated an EMR-generated list of TPAD, and O’Leary et al.,22 rated good, evaluated an electronic discharge summary template. The EMR-generated list resulted in an absolute increase of 25% in the proportion of TPAD documented and of 18% in the percentage of discharge summaries with complete information on TPAD. An electronic discharge summary template increased the percentage of discharge summaries with complete information on TPAD by 32.4%.22 O’Leary et al.22 was the only study that reported a negative effect of an intervention. The authors found a 10% (P = .04) reduction in the documentation of clinically significant laboratory results after implementation of the electronic discharge summary.
Electronic Notifications to Physicians
One good study, El-Kareh et al.,23 and one fair study, Dalal et al.,24 examined the impact of electronic notification of pending laboratory tests or test results to physicians. El-Kareh et al.23 also provided evidence on improved follow-up of test results. Physicians in intervention clusters were three times more likely (OR 3.2 95% CI 1.3-8.4) to have documented follow-up of test results than those in control clusters.23 The absolute increase in awareness of TPAD was 20%,23,24 among primary care physicians and 12%23 or 38%24 among inpatient attending physicians in the intervention clusters.
Notification of Patients or Parents
One study evaluated the impact of online parental access to the results of laboratory tests ordered during a child’s ED visit.25 The intervention indirectly increased physician awareness of the test results: 36 parents (12% of enrolled families) reported informing their physician of the test results. Therapy changed for seven children (5% of 141 whose parents retrieved the child’s test results and completed the follow-up survey).
DISCUSSION
Evidence Summary
We identified four interventions aimed at improving follow-up of TPAD and found suggestive evidence indicating that individual education for preparers of discharge summaries improved the quality of discharge summary documentation of TPAD; however, this type of evidence is below the level of evidence required by the LMBP™ to issue a recommendation. Site variations in the type and timing of interventions,20 small sample size,18 short follow-up,18,19 lack of detail on educational content,18-20 and differences in evaluated interventions limited the evidence quality. The long-term impact of educational interventions is also a concern. Oluma et al., for example, found that the benefits of education interventions were not sustained over time.26
Two studies21,22 evaluated aids to completing discharge summaries. The aids, which include a list of TPADs21 and an electronic template,22 resulted in a substantial increase in the completeness of the documentation of TPAD. Because of the differences in the interventions and the limited number of studies obtained, the evidence was rated as suggestive.
Suggestive evidence that automated e-mail notifications increased awareness of TPAD results by inpatient attending physicians and primary care providers was found. A limitation of this evidence is that both studies23,24 retrieved were conducted at the same institution; thus, the findings may not be generalizable to other institutions. Only one paper25 examined the impact of patient or parental access to laboratory tests results on the primary care physician’s awareness and follow-up of TPAD; as such, we consider the available evidence insufficient to evaluate the intervention.
Limitations
The evidence regarding interventions to improve follow-up of TPAD is limited. The interventions evaluated varied considerably in design and implementation. Most studies were conducted at a single medical center. Few studies had concurrent controls, and even fewer were randomized trials. Some studies included multiple interventions, thereby rendering the isolation of the impact of any single intervention difficult to accomplish.
Comparison to Other Literature
We found no other reviews of interventions to improve follow-up of TPAD. A review of interventions to improve information transfer found that computer-generated discharge summaries improved the timeliness and, less consistently, completeness of the summary.13 The authors of this review13 recommended computer-generated structured summaries that highlight the most pertinent information for follow-up care, as supported by a recent qualitative exploration of care coordination between hospitalists and primary care physicians.27
CONCLUSIONS
Successful follow-up of TPAD during care transition is a multistep process requiring identification and documentation of TPAD, notification of person responsible for follow-up, and their recognition and execution of the appropriate follow-up actions. We found suggestive evidence that individual education and tools, such as automated templates or abstraction, can improve documentation of TPADs and that automated alerts to the physician responsible for follow-up can improve awareness of TPAD results. The interventions were distinct; evidence from one intervention and outcome should be applied cautiously to other interventions and outcomes.
None of the interventions completely resolved the problems of documentation, awareness, or follow-up of TPAD. New interventions should consider the barriers to coordination identified by Jones et al.27 and Callen et al.7 Both studies identified a lack of systems, policies, and practices to support communication across different settings, including lack of access or difficulty navigating electronic medical records at other institutions; unclear or varied accountability for follow-up care; and inconsistent receipt of discharge documents after initial follow-up visit. These systemic problems were exacerbated by a lack of personal relationships between the community physicians, hospital, and ED clinicians, and between acute care clinicians and patients. In EDs, high patient throughput and short length of stay were found to contribute to these barriers. Although laboratories have a responsibility, required by CLIA regulations, to ensure the accurate and complete transmission of test reports,28 none of the interventions appeared to include laboratorians as stakeholders during the design, implementation, or evaluation of the interventions. Incorporating laboratory personnel and processes into the design of follow-up solutions may increase their effectiveness.
Medical informatics tools have the potential to improve patient safety during care transitions. Unfortunately, the evidence regarding informatics interventions to improve follow-up of TPAD was limited by both the number and the quality of the published studies. In addition, better-designed studies in this area are needed. Studies of interventions to improve follow-up of TPAD need to include well-chosen comparator populations and single, well-defined interventions. Evaluation of the interventions would be strengthened if the studies measured both the targeted outcome of the intervention, such as physician awareness of TPAD, and its impact on patient outcomes. Evaluation of the generalizability of the interventions would be strengthened by multi-site studies and, where appropriate, application of the same intervention to multiple study populations. As failure to communicate or follow up on abnormal laboratory tests is a critical threat to patient safety, more research and interventions to address this problem are urgently needed.
Acknowledgments
The authors appreciate the thoughtful insights offered by the following expert panel members: Joanne Callen, PhD; Julie Gayken, MT; Eric Poon, MD; Meera Viswanathan, PhD; and David West, PhD. The authors thank Dr. Jennifer Taylor for her review of the draft manuscript.
Funding
This work was funded by contract number 200-2014-F-61251 from the Centers for Disease Control and Prevention, Division of Laboratory Systems. Dr. Singh was additionally supported by the Houston VA HSR&D Center for Innovations in Quality, Effectiveness, and Safety (CIN 13-413).
Disclaimer
The findings and conclusions in this study are those of the authors and do not necessarily represent the official position of the Centers for Disease Control and Prevention or the Department of Veterans Affairs.
Disclosures
Drs. Whitehead, Graber, and Meleth, Ms. Kennedy, and Mr. Epner received funding for their work on this manuscript (Contract No. 200-2014-F-61251) from the Centers for Disease Control and Prevention. Dr. Graber receives honoraria from several institutions for presentations on diagnostic errors and has a grant from the Macy Foundation to develop a curriculum on diagnostic errors. Unrelated to this publication, Mr. Epner receives payment as a board member of Silicon BioDevices, as a consultant to Kaiser Foundation Health Plan of Colorado, for lectures from Sysmex, Inc., and for meeting expenses from Abbott Laboratories. He has stock or stock options in Silicon BioDevices, Inc. and Viewics, Inc. No other authors have any financial conflicts to report.
1. National Academies of Sciences E, and Medicine. Improving diagnosis in health care. 2015. http://www.nap.edu/catalog/21794/improving-diagnosis-in-health-care. Accessed January 8, 2018.
2. Schiff GD, Hasan O, Kim S, et al. Diagnostic error in medicine: analysis of 583 physician-reported errors. Arch Intern Med. 2009;169(20):1881-1887. PubMed
3. World Alliance for Patient Safety. Summary of the evidence on patient safety: Implications for research. Geneva, Switzerland; 2008.
4. The Joint Commission. National patient safety goals. Effective January 1, 2015. NPSG.02.03.012015.
5. Poon EG, Gandhi TK, Sequist TD, Murff HJ, Karson AS, Bates DW. “I wish I had seen this test result earlier!”: Dissatisfaction with test result management systems in primary care. Arch Intern Med. 2004;164(20):2223-2228. PubMed
6. Callen J, Georgiou A, Li J, Westbrook JI. The safety implications of missed test results for hospitalised patients: a systematic review. BMJ Quality Safety. 2011;20(2):194-199. PubMed
7. Callen JL, Westbrook JI, Georgiou A, Li J. Failure to follow-up test results for ambulatory patients: a systematic review. J Gen Intern Med. 2012;27(10):1334-1348. PubMed
8. Roy CL, Poon EG, Karson AS, et al. Patient safety concerns arising from test results that return after hospital discharge. Ann Intern Med. 2005;143(2):121-128. PubMed
9. El-Kareh R, Roy C, Brodsky G, Perencevich M, Poon EG. Incidence and predictors of microbiology results returning postdischarge and requiring follow-up. J Hosp Med. 2011;6(5):291-296. PubMed
10. Coffey C. Treatment Challenges After Discharge. WebM&M, Cases & Commentaries. 2010;(November 29, 2010). https://psnet.ahrq.gov/webmm/case/227/treatment-challenges-after-discharge. Accessed November 2010.
11. Dalal AK, Schnipper JL, Poon EG, et al. Design and implementation of an automated email notification system for results of tests pending at discharge. J Am Med Inform Assoc. 2012;19(4):523-528. PubMed
12. Wachter RM, Goldman L. The hospitalist movement 5 years later. JAMA. 2002;287(4):487-494. PubMed
13. Kripalani S, LeFevre F, Phillips CO, Williams MV, Basaviah P, Baker DW. Deficits in communication and information transfer between hospital-based and primary care physicians: implications for patient safety and continuity of care. JAMA. 2007;297(8):831-841. PubMed
14. Were MC, Li X, Kesterson J, et al. Adequacy of hospital discharge summaries in documenting tests with pending results and outpatient follow-up providers. J Gen Intern Med. 2009;24(9):1002-1006. PubMed
15. Institute of Medicine. To err is human : building a safer health system Washington, DC.1999.
16. Christenson RH, Snyder SR, Shaw CS, et al. Laboratory medicine best practices: systematic evidence review and evaluation methods for quality improvement. Clin Chem. 2011;57(6):816-825. PubMed
17. Stroup DF, Berlin JA, Morton SC, et al. Meta-analysis of observational studies in epidemiology: a proposal for reporting. Meta-analysis Of Observational Studies in Epidemiology (MOOSE) group. JAMA. 2000;283(15):2008-2012. PubMed
18. Dinescu A, Fernandez H, Ross JS, Karani R. Audit and feedback: An intervention to improve discharge summary completion. J Hosp Med. 2011;6:28-32. PubMed
19. Key-Solle M, Paulk E, Bradford K, Skinner AC, Lewis MC, Shomaker K. Improving the quality of discharge communication with an educational intervention. Pediatrics. 2010;126:734-739. PubMed
20. Gandara E, Ungar J, Lee J, Chan-Macrae M, O’Malley T, Schnipper JL. Discharge documentation of patients discharged to subacute facilities: A three-year quality improvement process across an integrated health care system. Jt Comm J Qual Patient Saf. 2010;36:243-251. PubMed
21. Kantor MA, Evans KH, Shieh L. Pending Studies at Hospital Discharge: A Pre-post Analysis of an Electronic Medical Record Tool to Improve Communication at Hospital Discharge. J Gen Intern Med. 2014;30(3):312-318. PubMed
22. O’Leary KJ, Liebovitz DM, Feinglass J, et al. Creating a better discharge summary: improvement in quality and timeliness using an electronic discharge summary. J Hosp Med. 2009;4(4):219-225. PubMed
23. El-Kareh R, Roy C, Williams DH, Poon EG. Impact of automated alerts on follow-up of post-discharge microbiology results: a cluster randomized controlled trial. J Gen Intern Med. 2012;27:1243-1250. PubMed
24. Dalal AK, Roy CL, Poon EG, et al. Impact of an automated email notification system for results of tests pending at discharge: a cluster-randomized controlled trial. J Am Med Inform Assoc. 2014;21(3):473-480. PubMed
25. Goldman RD, Antoon R, Tait G, Zimmer D, Viegas A, Mounstephen B. Culture results via the internet: A novel way for communication after an emergency department visit. J Pediatr. 2005;147:221-226. PubMed
26. Olomu AB, Stommel M, Holmes-Rovner MM, et al. Is quality improvement sustainable? Findings of the American College of Cardiology’s Guidelines applied in practice. Int J Qual Health Care. 2014;26(3):215-222. PubMed
27. Jones CD, Vu MB, O’Donnell CM, et al. A failure to communicate: a qualitative exploration of care coordination between hospitalists and primary care providers around patient hospitalizations. J Gen Intern Med. 2015;30(4):417-424. PubMed
28. Clinical Laboratory Improvement Amendments Regulations, 42 CFR 493.1291(a)(1988). PubMed
The 2015 National Academy of Sciences (NAS; formerly the Institute of Medicine [IOM]) report, Improving Diagnosis in Health Care, attributes up to 10% of patient deaths and 17% of hospital adverse events to diagnostic errors,1 one cause of which is absent or delayed follow-up of laboratory test results.2 Poor communication or follow-up of laboratory tests with abnormal results has been cited repeatedly as a threat to patient safety.1,3,4 In a survey of internists, 83% reported at least one unacceptably delayed laboratory test result during the previous 2 months.5
Care transitions magnify the risk of missed test results.6,7 Up to 16% of all emergency department (ED) and 23% of all hospitalized patients will have pending laboratory test results at release or discharge.6 The percentage of tests that received follow-up ranged from 1% to 75% for tests done in the ED and from 20% to 69% for tests ordered on inpatients. In one study, 41% of all surveyed medical inpatients had at least one test result pending at discharge (TPAD). When further studied, over 40% of the results were abnormal and 9% required action, but the responsible physicians were unaware of 62% of the test results.8 Many examples of morbidity from such failure have been reported. One of many described by El-Kareh et al., for example, is that of an 81-year-old man on total parenteral nutrition who was treated for suspected line infection and discharged without antibiotics, but whose blood cultures grew Klebsiella pneumoniae after his discharge.9 Another example, presented on the Agency for Healthcare Research and Quality (AHRQ) Patient Safety Network, reported a patient admitted for a urinary tract infection and then discharged from the hospital on trimethoprim–sulfamethoxazole. He returned to the hospital 11 days later with severe sepsis. Upon review, the urine culture results from his previous admission, which were returned 2 days after his discharge, indicated that the infectious agent was not sensitive to trimethoprim–sulfamethoxazole. The results had not been reviewed by hospital clinicians or forwarded to the patient’s physician, so the patient continued on the ineffective treatment. His second hospital admission lasted 7 days, but he made a complete recovery with the correct antibiotic.10
Several barriers impede the follow-up of TPAD. First, who should receive test results or who is responsible for addressing them may be unclear. Second, even if responsibility is clear, communication between the provider who ordered the test and the provider responsible for follow-up may be suboptimal.11 Finally, providers who need to follow up on abnormal results may not appreciate the urgency or significance of pending results.
The hospitalist model of care increases efficiency during hospitalization but further complicates care coordination.12 The hospitalist who orders a test may not be on duty at discharge or when test results are finalized. Primary care providers may have little contact with their patients during their admission.12 Effective communication between providers is key to ensuring appropriate follow-up care, but primary care physicians and hospital physicians communicate directly in 20% or fewer admissions.13 The hospital discharge summary is the primary method of communication with the next provider, but 65%–84% of all discharge summaries lack information on TPAD.13,14
In this work, we sought to identify and evaluate interventions aimed at improving documentation, communication, and follow-up of TPAD. This review was conducted through the Laboratory Medicine Best Practices (LMBP™) initiative, which is sponsored by the Centers for Disease Control and Prevention’s (CDC’s) Division of Laboratory Systems (https://wwwn.cdc.gov/labbestpractices/). The LMBP™ was initiated as the CDC’s response to the IOM report To Err is Human: Building a Safer Health System.15
METHODS
We applied the first four phases of the LMBP™-developed A-6 Cycle methodology to evaluate quality improvement practices as described below.16 Our report follows the Meta-analysis Of Observational Studies in Epidemiology (MOOSE) guidelines.17
Asking the Question
The full review, which is available from the corresponding author, assessed the evidence that the interventions improved (1) the timeliness of follow-up of TPAD or reduced adverse health events; (2) discharge planning, documentation, or communication with the outpatient care provider regarding TPAD; and (3) health outcomes. In this article, we present the impact of interventions to improve the documentation, communication, and follow-up of TPAD. The review protocol, which is also available from the corresponding author, was developed with the input of a panel of experts (Appendix A) in laboratory medicine, systematic reviews, informatics, and patient safety. The analytic framework (Appendix B) describes the scope of the review. The inclusion criteria for papers reporting on interventions to improve communication of TPAD are the following:
- Population: Patients who were admitted to an inpatient facility or who visited an ED (including patients released from the ED) and who had one or more TPADs.
- Interventions: Practices that explicitly aimed to improve the documentation, communication, or follow-up of TPAD, alone or as part of a broader quality improvement effort.
- Comparators: Standard practice, pre-intervention practice, or any other valid comparator.
- Outcomes: Documentation completeness, physician awareness of pending tests, or follow-up of TPAD.
Acquire the Evidence
A professional librarian conducted literature searches in PubMed, CINAHL, Cochrane, and EMBASE using terms that captured relevant health care settings, transition of patient care, laboratory tests, communication, and pending or missed tests (Appendix C). Citations were also identified by expert panel members and by manual searches of bibliographies of relevant studies. We included studies published in English in 2005 or later. We sought unpublished studies through expert panelists and queries to relevant professional organizations.
Appraise the Studies
Two independent reviewers evaluated each retrieved citation for inclusion. We excluded articles that (1) did not explicitly address laboratory TPAD; (2) were letters, editorials, commentaries, or abstracts; (3) did not address transition between settings; (4) did not include an intervention; (5) were case reports or case series; or (6) were not published in English. A team member abstracted predetermined data elements (Appendix D) from each included study, and a senior scientist reviewed the abstraction. Two senior scientists independently scored the quality of the eligible studies on the A-6 domains of study characteristics, practice description, outcome measures, and results and findings; studies scored below 4 points on a 10-point scale were excluded. Based on this appraisal, studies were classified as good, fair, or poor; poor studies were excluded.
Analyze the Evidence
We synthesized the evidence by intervention type and outcome. The strength of the evidence that each intervention improved the desired outcome was rated in accordance with the A-6 methodology as high, moderate, suggestive, or insufficient based on the number of studies, the study ratings, and the consistency and magnitude of the effect size.
RESULTS
Education to Improve Discharge Summaries
Electronic Tools for Preparation of Discharge Summaries
Two studies 21,22 investigated tools to aid preparation of discharge summaries. Kantor et al.,21 rated fair, evaluated an EMR-generated list of TPAD, and O’Leary et al.,22 rated good, evaluated an electronic discharge summary template. The EMR-generated list resulted in an absolute increase of 25% in the proportion of TPAD documented and of 18% in the percentage of discharge summaries with complete information on TPAD. An electronic discharge summary template increased the percentage of discharge summaries with complete information on TPAD by 32.4%.22 O’Leary et al.22 was the only study that reported a negative effect of an intervention. The authors found a 10% (P = .04) reduction in the documentation of clinically significant laboratory results after implementation of the electronic discharge summary.
Electronic Notifications to Physicians
One good study, El-Kareh et al.,23 and one fair study, Dalal et al.,24 examined the impact of electronic notification of pending laboratory tests or test results to physicians. El-Kareh et al.23 also provided evidence on improved follow-up of test results. Physicians in intervention clusters were three times more likely (OR 3.2 95% CI 1.3-8.4) to have documented follow-up of test results than those in control clusters.23 The absolute increase in awareness of TPAD was 20%,23,24 among primary care physicians and 12%23 or 38%24 among inpatient attending physicians in the intervention clusters.
Notification of Patients or Parents
One study evaluated the impact of online parental access to the results of laboratory tests ordered during a child’s ED visit.25 The intervention indirectly increased physician awareness of the test results: 36 parents (12% of enrolled families) reported informing their physician of the test results. Therapy changed for seven children (5% of 141 whose parents retrieved the child’s test results and completed the follow-up survey).
DISCUSSION
Evidence Summary
We identified four interventions aimed at improving follow-up of TPAD and found suggestive evidence indicating that individual education for preparers of discharge summaries improved the quality of discharge summary documentation of TPAD; however, this type of evidence is below the level of evidence required by the LMBP™ to issue a recommendation. Site variations in the type and timing of interventions,20 small sample size,18 short follow-up,18,19 lack of detail on educational content,18-20 and differences in evaluated interventions limited the evidence quality. The long-term impact of educational interventions is also a concern. Oluma et al., for example, found that the benefits of education interventions were not sustained over time.26
Two studies21,22 evaluated aids to completing discharge summaries. The aids, which include a list of TPADs21 and an electronic template,22 resulted in a substantial increase in the completeness of the documentation of TPAD. Because of the differences in the interventions and the limited number of studies obtained, the evidence was rated as suggestive.
Suggestive evidence that automated e-mail notifications increased awareness of TPAD results by inpatient attending physicians and primary care providers was found. A limitation of this evidence is that both studies23,24 retrieved were conducted at the same institution; thus, the findings may not be generalizable to other institutions. Only one paper25 examined the impact of patient or parental access to laboratory tests results on the primary care physician’s awareness and follow-up of TPAD; as such, we consider the available evidence insufficient to evaluate the intervention.
Limitations
The evidence regarding interventions to improve follow-up of TPAD is limited. The interventions evaluated varied considerably in design and implementation. Most studies were conducted at a single medical center. Few studies had concurrent controls, and even fewer were randomized trials. Some studies included multiple interventions, thereby rendering the isolation of the impact of any single intervention difficult to accomplish.
Comparison to Other Literature
We found no other reviews of interventions to improve follow-up of TPAD. A review of interventions to improve information transfer found that computer-generated discharge summaries improved the timeliness and, less consistently, completeness of the summary.13 The authors of this review13 recommended computer-generated structured summaries that highlight the most pertinent information for follow-up care, as supported by a recent qualitative exploration of care coordination between hospitalists and primary care physicians.27
CONCLUSIONS
Successful follow-up of TPAD during care transition is a multistep process requiring identification and documentation of TPAD, notification of person responsible for follow-up, and their recognition and execution of the appropriate follow-up actions. We found suggestive evidence that individual education and tools, such as automated templates or abstraction, can improve documentation of TPADs and that automated alerts to the physician responsible for follow-up can improve awareness of TPAD results. The interventions were distinct; evidence from one intervention and outcome should be applied cautiously to other interventions and outcomes.
None of the interventions completely resolved the problems of documentation, awareness, or follow-up of TPAD. New interventions should consider the barriers to coordination identified by Jones et al.27 and Callen et al.7 Both studies identified a lack of systems, policies, and practices to support communication across different settings, including lack of access or difficulty navigating electronic medical records at other institutions; unclear or varied accountability for follow-up care; and inconsistent receipt of discharge documents after initial follow-up visit. These systemic problems were exacerbated by a lack of personal relationships between the community physicians, hospital, and ED clinicians, and between acute care clinicians and patients. In EDs, high patient throughput and short length of stay were found to contribute to these barriers. Although laboratories have a responsibility, required by CLIA regulations, to ensure the accurate and complete transmission of test reports,28 none of the interventions appeared to include laboratorians as stakeholders during the design, implementation, or evaluation of the interventions. Incorporating laboratory personnel and processes into the design of follow-up solutions may increase their effectiveness.
Medical informatics tools have the potential to improve patient safety during care transitions. Unfortunately, the evidence regarding informatics interventions to improve follow-up of TPAD was limited by both the number and the quality of the published studies. In addition, better-designed studies in this area are needed. Studies of interventions to improve follow-up of TPAD need to include well-chosen comparator populations and single, well-defined interventions. Evaluation of the interventions would be strengthened if the studies measured both the targeted outcome of the intervention, such as physician awareness of TPAD, and its impact on patient outcomes. Evaluation of the generalizability of the interventions would be strengthened by multi-site studies and, where appropriate, application of the same intervention to multiple study populations. As failure to communicate or follow up on abnormal laboratory tests is a critical threat to patient safety, more research and interventions to address this problem are urgently needed.
Acknowledgments
The authors appreciate the thoughtful insights offered by the following expert panel members: Joanne Callen, PhD; Julie Gayken, MT; Eric Poon, MD; Meera Viswanathan, PhD; and David West, PhD. The authors thank Dr. Jennifer Taylor for her review of the draft manuscript.
Funding
This work was funded by contract number 200-2014-F-61251 from the Centers for Disease Control and Prevention, Division of Laboratory Systems. Dr. Singh was additionally supported by the Houston VA HSR&D Center for Innovations in Quality, Effectiveness, and Safety (CIN 13-413).
Disclaimer
The findings and conclusions in this study are those of the authors and do not necessarily represent the official position of the Centers for Disease Control and Prevention or the Department of Veterans Affairs.
Disclosures
Drs. Whitehead, Graber, and Meleth, Ms. Kennedy, and Mr. Epner received funding for their work on this manuscript (Contract No. 200-2014-F-61251) from the Centers for Disease Control and Prevention. Dr. Graber receives honoraria from several institutions for presentations on diagnostic errors and has a grant from the Macy Foundation to develop a curriculum on diagnostic errors. Unrelated to this publication, Mr. Epner receives payment as a board member of Silicon BioDevices, as a consultant to Kaiser Foundation Health Plan of Colorado, for lectures from Sysmex, Inc., and for meeting expenses from Abbott Laboratories. He has stock or stock options in Silicon BioDevices, Inc. and Viewics, Inc. No other authors have any financial conflicts to report.
1. National Academies of Sciences E, and Medicine. Improving diagnosis in health care. 2015. http://www.nap.edu/catalog/21794/improving-diagnosis-in-health-care. Accessed January 8, 2018.
2. Schiff GD, Hasan O, Kim S, et al. Diagnostic error in medicine: analysis of 583 physician-reported errors. Arch Intern Med. 2009;169(20):1881-1887. PubMed
3. World Alliance for Patient Safety. Summary of the evidence on patient safety: Implications for research. Geneva, Switzerland; 2008.
4. The Joint Commission. National patient safety goals. Effective January 1, 2015. NPSG.02.03.012015.
5. Poon EG, Gandhi TK, Sequist TD, Murff HJ, Karson AS, Bates DW. “I wish I had seen this test result earlier!”: Dissatisfaction with test result management systems in primary care. Arch Intern Med. 2004;164(20):2223-2228. PubMed
6. Callen J, Georgiou A, Li J, Westbrook JI. The safety implications of missed test results for hospitalised patients: a systematic review. BMJ Quality Safety. 2011;20(2):194-199. PubMed
7. Callen JL, Westbrook JI, Georgiou A, Li J. Failure to follow-up test results for ambulatory patients: a systematic review. J Gen Intern Med. 2012;27(10):1334-1348. PubMed
8. Roy CL, Poon EG, Karson AS, et al. Patient safety concerns arising from test results that return after hospital discharge. Ann Intern Med. 2005;143(2):121-128. PubMed
9. El-Kareh R, Roy C, Brodsky G, Perencevich M, Poon EG. Incidence and predictors of microbiology results returning postdischarge and requiring follow-up. J Hosp Med. 2011;6(5):291-296. PubMed
10. Coffey C. Treatment Challenges After Discharge. WebM&M, Cases & Commentaries. 2010;(November 29, 2010). https://psnet.ahrq.gov/webmm/case/227/treatment-challenges-after-discharge. Accessed November 2010.
11. Dalal AK, Schnipper JL, Poon EG, et al. Design and implementation of an automated email notification system for results of tests pending at discharge. J Am Med Inform Assoc. 2012;19(4):523-528. PubMed
12. Wachter RM, Goldman L. The hospitalist movement 5 years later. JAMA. 2002;287(4):487-494. PubMed
13. Kripalani S, LeFevre F, Phillips CO, Williams MV, Basaviah P, Baker DW. Deficits in communication and information transfer between hospital-based and primary care physicians: implications for patient safety and continuity of care. JAMA. 2007;297(8):831-841. PubMed
14. Were MC, Li X, Kesterson J, et al. Adequacy of hospital discharge summaries in documenting tests with pending results and outpatient follow-up providers. J Gen Intern Med. 2009;24(9):1002-1006. PubMed
15. Institute of Medicine. To err is human : building a safer health system Washington, DC.1999.
16. Christenson RH, Snyder SR, Shaw CS, et al. Laboratory medicine best practices: systematic evidence review and evaluation methods for quality improvement. Clin Chem. 2011;57(6):816-825. PubMed
17. Stroup DF, Berlin JA, Morton SC, et al. Meta-analysis of observational studies in epidemiology: a proposal for reporting. Meta-analysis Of Observational Studies in Epidemiology (MOOSE) group. JAMA. 2000;283(15):2008-2012. PubMed
18. Dinescu A, Fernandez H, Ross JS, Karani R. Audit and feedback: An intervention to improve discharge summary completion. J Hosp Med. 2011;6:28-32. PubMed
19. Key-Solle M, Paulk E, Bradford K, Skinner AC, Lewis MC, Shomaker K. Improving the quality of discharge communication with an educational intervention. Pediatrics. 2010;126:734-739. PubMed
20. Gandara E, Ungar J, Lee J, Chan-Macrae M, O’Malley T, Schnipper JL. Discharge documentation of patients discharged to subacute facilities: A three-year quality improvement process across an integrated health care system. Jt Comm J Qual Patient Saf. 2010;36:243-251. PubMed
21. Kantor MA, Evans KH, Shieh L. Pending Studies at Hospital Discharge: A Pre-post Analysis of an Electronic Medical Record Tool to Improve Communication at Hospital Discharge. J Gen Intern Med. 2014;30(3):312-318. PubMed
22. O’Leary KJ, Liebovitz DM, Feinglass J, et al. Creating a better discharge summary: improvement in quality and timeliness using an electronic discharge summary. J Hosp Med. 2009;4(4):219-225. PubMed
23. El-Kareh R, Roy C, Williams DH, Poon EG. Impact of automated alerts on follow-up of post-discharge microbiology results: a cluster randomized controlled trial. J Gen Intern Med. 2012;27:1243-1250. PubMed
24. Dalal AK, Roy CL, Poon EG, et al. Impact of an automated email notification system for results of tests pending at discharge: a cluster-randomized controlled trial. J Am Med Inform Assoc. 2014;21(3):473-480. PubMed
25. Goldman RD, Antoon R, Tait G, Zimmer D, Viegas A, Mounstephen B. Culture results via the internet: A novel way for communication after an emergency department visit. J Pediatr. 2005;147:221-226. PubMed
26. Olomu AB, Stommel M, Holmes-Rovner MM, et al. Is quality improvement sustainable? Findings of the American College of Cardiology’s Guidelines applied in practice. Int J Qual Health Care. 2014;26(3):215-222. PubMed
27. Jones CD, Vu MB, O’Donnell CM, et al. A failure to communicate: a qualitative exploration of care coordination between hospitalists and primary care providers around patient hospitalizations. J Gen Intern Med. 2015;30(4):417-424. PubMed
28. Clinical Laboratory Improvement Amendments Regulations, 42 CFR 493.1291(a)(1988). PubMed
© 2018 Society of Hospital Medicine
Things We Do For No Reason: The Default Use of Hypotonic Maintenance Intravenous Fluids in Pediatrics
The “Things We Do for No Reason” series reviews practices which have become common parts of hospital care but which may provide little value to our patients. Practices reviewed in the TWDFNR series do not represent “black and white” conclusions or clinical practice standards, but are meant as a starting place for research and active discussions among hospitalists and patients. We invite you to be part of that discussion. https://www.choosingwisely.org/
CASE PRESENTATION
A 12-month-old female is admitted for acute bronchiolitis with increased work of breathing and decreased oral intake. She is mildly dehydrated upon exam with a sodium level of 139 mEq/L and is given a 20 mL/kg bolus of 0.9% saline. Given the patient’s poor oral intake, the admitting intern orders maintenance intravenous (IV) fluids and asks her senior resident which IV fluid should be used. The medical student on the team wonders if a different IV fluid would be selected for a 2-week-old with a similar presentation.
INTRODUCTION
Maintenance IV fluids are continuously infused to preserve extracellular volume and electrolyte balance when fluids cannot be taken orally. In contrast, resuscitation IV fluids are given as a bolus to patients in states of hypoperfusion to restore extracellular volume. The given IV fluid concentration can be categorized as approximately equal to (isotonic) or less than (hypotonic) the plasma sodium concentration. Refer to Table 1 for the electrolyte composition of commonly used IV fluids. Dextrose is rapidly metabolized upon infusion and does not affect tonicity.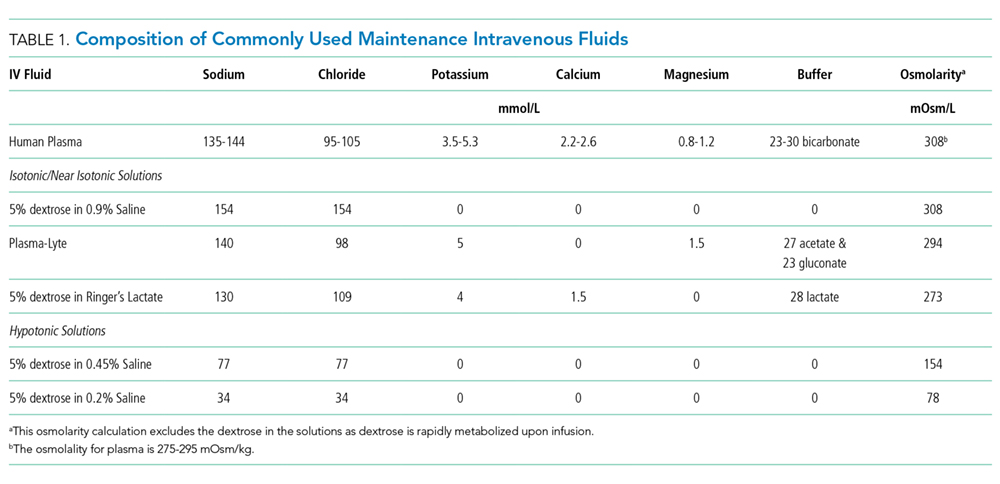
Why You Might Think Hypotonic Maintenance IV Fluids Are The Right Choice
A 1957 publication by Holliday and Segar laid the foundation for maintenance IV fluid and electrolyte requirements in children and was the initial catalyst for the use of hypotonic maintenance IV fluids.1 This manuscript contended that hypotonic IV fluids could supply the water and sodium needed to meet maintenance dietary requirements. This claim led to the predominant use of hypotonic maintenance IV fluids in children. By contrast, isotonic IV fluids have been avoided given the apprehension over electrolytes exceeding maintenance needs.
Concerns about the unintended consequences of fluid overload – edema, hypernatremia, and hypertension secondary to increased sodium load – have led some to avoid isotonic IV fluids.2 When presented with common clinical scenarios of patients at risk for excess antidiuretic hormone (ADH; also known as arginine vasopressin), pediatric residents chose hypotonic (instead of isotonic) IV fluids 78% of the time.3
Why Isotonic Maintenance IV Fluids Are Usually The Right Choice For Children
General recommendations for hypotonic IV fluids are primarily based on theoretical calculations from the fluid and electrolyte requirements of healthy individuals, and studies have not validated the use of hypotonic IV fluids in clinical practice.1 Acutely ill patients are at risk for excessive levels of ADH from numerous causes (see Table 2).2 As a result, nearly every hospitalized patient is at risk for excess ADH release, thus making them vulnerable to the development of hyponatremia. The syndrome of inappropriate secretion of ADH (SIADH) occurs when nonosmotic/nonhemodynamic stimuli trigger ADH release, which leads to excessive free-water retention and resultant hyponatremia. Schwartz and Bartter reported the first two cases of SIADH in 1957 when hyponatremia developed in the setting of bronchogenic carcinoma.4 Although the publication by Holliday and Seger did acknowledge the potential for water intoxication, it was written before this report and before the effects of ADH on the sodium levels of hospitalized patients were clearly understood.2 SIADH is now recognized as one of the most common causes of hyponatremia in hospitalized patients.5, 6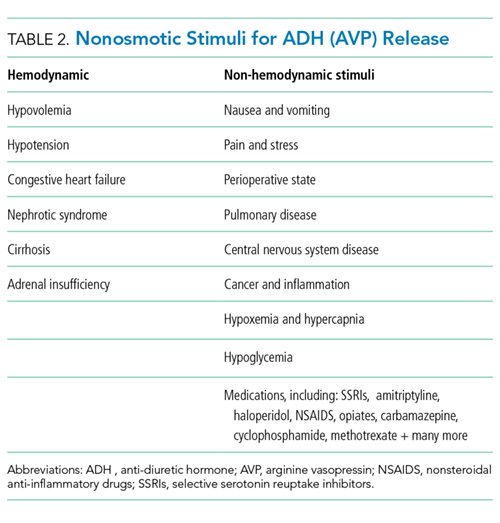
Numerous studies have demonstrated that patients who receive hypotonic IV fluids have a significantly higher risk of developing hyponatremia than patients who receive isotonic IV fluids.7,8 An infrequent, yet serious, complication of iatrogenic hyponatremia is hyponatremic encephalopathy, which carries a high rate of morbidity or mortality.9 The prevention of hyponatremia is essential as the early symptoms of hyponatremic encephalopathy are nonspecific and can be easily missed.2
More than 15 prospective randomized controlled trials (RCTs) involving over 2,000 children have demonstrated that isotonic IV fluids are more effective in preventing hospital-acquired hyponatremia than hypotonic IV fluids and are not associated with the development of fluid overload or hypernatremia. A 2014 metaanalysis comprising 10 RCTs and involving over 800 children found that when compared with isotonic IV fluids, hypotonic IV fluids present a relative risk of 2.37 for sodium levels to drop below 135 mEq/L and a relative risk of 6.1 for levels to drop below 130 mEq/L. The numbers needed to treat (NNT) with isotonic IV fluids to prevent hyponatremia in each group were 6 and 17, respectively.7 A Cochrane review published in 2014 presented comparable findings, demonstrating that hypotonic IV fluids had a 34% risk of causing hyponatremia; by comparison, isotonic IV fluids had a 17% risk of causing hyponatremia and a NNT of six to prevent hyponatremia.8 In a large RCT conducted in 2015 with 676 pediatric patients, McNabb et al. found that when compared with patients receiving isotonic IV fluids, those receiving hypotonic IV fluids had a higher incidence of developing hyponatremia (10.9% versus 3.8%) with a NNT of 15 to prevent hyponatremia with the use of isotonic fluids.10 Published trials have likely been underpowered to detect a difference in the infrequent adverse hyponatremia outcomes of seizures and mortality.
On the basis of these data, patient safety alerts have recommended the avoidance of hypotonic IV fluids in the United Kingdom (UK) and Australia, and the 2015 UK guidelines for children now recommend isotonic IV fluids for maintenance needs.11 Although many of the aforementioned studies included predominantly critically ill or surgical pediatric patients, the risk of hyponatremia with hypotonic IV fluids seems similarly increased in nonsurgical and noncritically ill pediatric patients.10
For patients at risk for excess ADH release, some have supported the use of hypotonic IV fluids at a lower than maintenance rate to theoretically decrease the risk of hyponatremia, but this practice has not been effective in preventing hyponatremia.2,12 Unless a patient is in a fluid overload state, such as in congestive heart failure, cirrhosis, or renal failure; isotonic maintenance IV fluids should not result in fluid overload.3 Available evidence for guiding maintenance IV fluid choice in neonates or young infants is limited. Nevertheless, given the aforementioned reasons, we generally recommend the prescription of isotonic IV fluids for most in this population.
Which Isotonic IV Fluid Should Be Used?
The sodium concentration (154 mmol/L) of 0.9% saline, an isotonic IV fluid, is approximately equal to the tonicity of the aqueous phase of plasma. The majority of studies evaluating the risk of hyponatremia with maintenance IV fluids have used 0.9% saline as the studied isotonic IV fluid. Plasma-Lyte and Ringer’s lactate are low-chloride, buffered/balanced solutions. Plasma-Lyte ([Na] = 140 mmol/L) has been demonstrated to be effective in preventing hyponatremia. Ringers’ lactate is slightly hypotonic ([Na] = 130 mmol/L), and its administration is associated with a decrease in serum sodium.13 A resultant dilutional and hyperchloremic metabolic acidosis is more likely to develop with the use of large volumes of 0.9% saline in resuscitation than with the use of balanced solutions.2 Whether the prolonged use of 0.9% saline maintenance IV fluids can lead to this same side effect remains unknown given insufficient evidence.2 Retrospective studies using balanced solutions have shown an association with decreased rates of acute kidney injury (AKI) and mortality when compared with 0.9% saline. However, a RCT with over 2,000 adult ICU patients showed no change in rates of AKI in those that received Plasma-Lyte compared with those who received 0.9% saline.14
Two recent, single-center, prospective studies compared the use of Ringer’s lactate or Plasma-Lyte for resuscitation with that of 0.9% saline. One study was comprised of 15,802 critically ill adults, and the other was comprised of 13,347 noncritically adults. Both studies showed that balanced solutions decreased the rate of major adverse kidney events (defined as a composite of death from any cause, new renal-replacement therapy, or persistent renal injury) within 30 days.15,16 Available published pediatric studies indicate that 0.9% saline is an effective maintenance IV fluid for the prevention of hyponatremia that is not associated with hypernatremia or fluid overload. Further pediatric studies comparing 0.9% saline with balanced solutions are needed.
When Should We Use Hypotonic IV Fluids?
Hypotonic IV fluids may be needed for patients with hypernatremia and a free-water deficit or a renal-concentrating defect with ongoing urinary free-water losses.2 Special care should be taken when choosing maintenance IV fluids for patients with renal disease, liver disease, or heart failure given that these groups have been excluded from some studies.12 These patients may be at risk for increased salt and fluid retention with any IV fluid, and fluid rates need to be restricted. The fluid intake of patients with hyponatremia secondary to SIADH needs close management; these patients benefit from total fluid restriction instead of standard maintenance IV fluid rates.2
What We Should Do Instead?
Maintenance IV fluids should only be used when necessary and should be stopped as soon as they are no longer required, especially in light of the recent shortages in 0.9% saline.17 Similar to all medications, maintenance IV fluids should be individualized to the patient’s needs on the basis of the indication for IV fluids and the patient’s comorbidities.2 Consideration should be given to checking the patient’s electrolyte levels to monitor response to IV fluids, especially during the first 24 hours of admission when risk of hyponatremia is highest. Isotonic IV fluids with 5% dextrose should be used as the maintenance IV fluid in the majority of hospitalized children given its proven benefit in decreasing the rate of hospital-acquired hyponatremia.7,8 Hypotonic IV fluids should be avoided as the default maintenance IV fluid and should only be utilized under specific circumstances.
RECOMMENDATIONS
- When needed, maintenance IV fluids should always be tailored to each individual patient.
- For most acutely ill hospitalized children, isotonic IV fluids should be the maintenance IV fluid of choice.
- Consider monitoring electrolytes to determine the effects of maintenance IV fluids.
CONCLUSION
Enteral maintenance fluids should be used first-line if possible. Although hypotonic IV fluids have historically been the maintenance IV fluid of choice, this class of IV fluids should be avoided for most hospitalized children to decrease the significant risk of iatrogenic hyponatremia, which can be severe and have catastrophic complications. When necessary, isotonic IV fluids should be used for the majority of hospitalized children given that these fluids present a significantly decreased risk for causing hyponatremia. Returning to our case presentation, to decrease the risk of hyponatremia, the senior resident should recommend starting isotonic IV fluids in the 12-month-old and theoretical 2-week-old until oral intake can be maintained.
Do you think this is a low-value practice? Is this truly a “Thing We Do for No Reason”? Let us know what you do in your practice and propose ideas for other “Things We Do for No Reason” topics. Please join in the conversation online at Twitter (#TWDFNR)/Facebook and don’t forget to “Like It” on Facebook or retweet it on Twitter.
Disclosure
The authors have no relevant conflicts of interest to report. No payment or services from a 3rd party were received for any aspect of this submitted work. The authors have no financial relationships with entities in the biomedical arena that could be perceived to influence, or that give the appearance of potentially influencing, what was written in this submitted work.
1. Holliday MA, Segar WE. The maintenance need for water in parenteral fluid therapy. Pediatrics. 1957;19(5):823-832. PubMed
2. Moritz ML, Ayus JC. Maintenance intravenous fluids in acutely Ill patients. N Engl J Med. 2015;373(14):1350-1360. doi: 10.1056/NEJMra1412877. PubMed
3. Freeman MA, Ayus JC, Moritz ML. Maintenance intravenous fluid prescribing practices among paediatric residents. Acta Paediatr. 2012;101(10):e465-e468. doi: 10.1111/j.1651-2227.2012.02780.x. PubMed
4. Schwartz WB BW, Curelop S, Bartter FC. A syndrome of renal sodium loss and hyponatremia probably resulting from inappropriate secretion of antidiuretic hormone. Am J Med. 1957;23(4):529-542. doi: 10.1016/0002-9343(57)90224-3. PubMed
5. Wattad A, Chiang ML, Hill LL. Hyponatremia in hospitalized children. Clin Pediatr. 1992;31(3):153-157. doi: 10.1177/000992289203100305. PubMed
6. Greenberg A, Verbalis JG, Amin AN, et al. Current treatment practice and outcomes. Report of the hyponatremia registry. Kidney Int. 2015;88(1):167-177. doi: 10.1038/ki.2015.4. PubMed
7. Foster BA, Tom D, Hill V. Hypotonic versus isotonic fluids in hospitalized children: A systematic review and meta-analysis. J Pediatr. 2014;165(1):163-169.e162. doi: 10.1016/j.jpeds.2014.01.040. PubMed
8. McNab S, Ware RS, Neville KA, et al. Isotonic versus hypotonic solutions for maintenance intravenous fluid administration in children. Cochrane Database Syst Rev. 2014;(12):CD009457. doi: 10.1002/14651858.CD009457.pub2. PubMed
9. Arieff AI, Ayus JC, Fraser CL. Hyponatraemia and death or permanent brain damage in healthy children. BMJ. 1992;304(6836):1218-1222. doi: 10.1136/bmj.304.6836.1218. PubMed
10. McNab S, Duke T, South M, et al. 140 mmol/L of sodium versus 77 mmol/L of sodium in maintenance intravenous fluid therapy for children in hospital (PIMS): A randomised controlled double-blind trial. Lancet. 2015;385(9974):1190-1197. doi: 10.1016/S0140-6736(14)61459-8. PubMed
11. Neilson J, O’Neill F, Dawoud D, Crean P, Guideline Development G. Intravenous fluids in children and young people: summary of NICE guidance. BMJ. 2015;351:h6388. doi: 10.1136/bmj.h6388. PubMed
12. Neville KA, Sandeman DJ, Rubinstein A, Henry GM, McGlynn M, Walker JL. Prevention of hyponatremia during maintenance intravenous fluid administration: a prospective randomized study of fluid type versus fluid rate. J Pediatr. 2010;156(2):313-319. doi: 10.1016/j.jpeds.2009.07.059. PubMed
13. Moritz ML, Ayus JC. Preventing neurological complications from dysnatremias in children. Pediatr Nephrol. 2005;20(12):1687-1700. doi: 10.1007/s00467-005-1933-6. PubMed
14. Young P, Bailey M, Beasley R, et al. Effect of a buffered crystalloid solution vs saline on acute kidney injury among patients in the intensive care unit: The SPLIT Randomized Clinical Trial. JAMA. 2015;314(16):1701-1710. doi: 10.1001/jama.2015.12334. PubMed
15. Semler MW, Self WH, Wanderer JP, et al. Balanced crystalloids versus salinein critically Ill adults. N Engl J Med. 2018;378(9):829-839. doi: 10.1056/NEJMoa1711584. PubMed
16. Self WH, Semler MW, Wanderer JP, et al. Balanced crystalloids versus saline in noncritically Ill adults. N Engl J Med. 2018;378(9):819-828. doi: 10.1056/NEJMoa1711586. PubMed
17. Mazer-Amirshahi M, Fox ER. Saline shortages - Many causes, no simple solution. N Engl J Med. 2018;378(16):1472-1474. doi: 10.1056/NEJMp1800347. PubMed
The “Things We Do for No Reason” series reviews practices which have become common parts of hospital care but which may provide little value to our patients. Practices reviewed in the TWDFNR series do not represent “black and white” conclusions or clinical practice standards, but are meant as a starting place for research and active discussions among hospitalists and patients. We invite you to be part of that discussion. https://www.choosingwisely.org/
CASE PRESENTATION
A 12-month-old female is admitted for acute bronchiolitis with increased work of breathing and decreased oral intake. She is mildly dehydrated upon exam with a sodium level of 139 mEq/L and is given a 20 mL/kg bolus of 0.9% saline. Given the patient’s poor oral intake, the admitting intern orders maintenance intravenous (IV) fluids and asks her senior resident which IV fluid should be used. The medical student on the team wonders if a different IV fluid would be selected for a 2-week-old with a similar presentation.
INTRODUCTION
Maintenance IV fluids are continuously infused to preserve extracellular volume and electrolyte balance when fluids cannot be taken orally. In contrast, resuscitation IV fluids are given as a bolus to patients in states of hypoperfusion to restore extracellular volume. The given IV fluid concentration can be categorized as approximately equal to (isotonic) or less than (hypotonic) the plasma sodium concentration. Refer to Table 1 for the electrolyte composition of commonly used IV fluids. Dextrose is rapidly metabolized upon infusion and does not affect tonicity.
Why You Might Think Hypotonic Maintenance IV Fluids Are The Right Choice
A 1957 publication by Holliday and Segar laid the foundation for maintenance IV fluid and electrolyte requirements in children and was the initial catalyst for the use of hypotonic maintenance IV fluids.1 This manuscript contended that hypotonic IV fluids could supply the water and sodium needed to meet maintenance dietary requirements. This claim led to the predominant use of hypotonic maintenance IV fluids in children. By contrast, isotonic IV fluids have been avoided given the apprehension over electrolytes exceeding maintenance needs.
Concerns about the unintended consequences of fluid overload – edema, hypernatremia, and hypertension secondary to increased sodium load – have led some to avoid isotonic IV fluids.2 When presented with common clinical scenarios of patients at risk for excess antidiuretic hormone (ADH; also known as arginine vasopressin), pediatric residents chose hypotonic (instead of isotonic) IV fluids 78% of the time.3
Why Isotonic Maintenance IV Fluids Are Usually The Right Choice For Children
General recommendations for hypotonic IV fluids are primarily based on theoretical calculations from the fluid and electrolyte requirements of healthy individuals, and studies have not validated the use of hypotonic IV fluids in clinical practice.1 Acutely ill patients are at risk for excessive levels of ADH from numerous causes (see Table 2).2 As a result, nearly every hospitalized patient is at risk for excess ADH release, thus making them vulnerable to the development of hyponatremia. The syndrome of inappropriate secretion of ADH (SIADH) occurs when nonosmotic/nonhemodynamic stimuli trigger ADH release, which leads to excessive free-water retention and resultant hyponatremia. Schwartz and Bartter reported the first two cases of SIADH in 1957 when hyponatremia developed in the setting of bronchogenic carcinoma.4 Although the publication by Holliday and Seger did acknowledge the potential for water intoxication, it was written before this report and before the effects of ADH on the sodium levels of hospitalized patients were clearly understood.2 SIADH is now recognized as one of the most common causes of hyponatremia in hospitalized patients.5, 6
Numerous studies have demonstrated that patients who receive hypotonic IV fluids have a significantly higher risk of developing hyponatremia than patients who receive isotonic IV fluids.7,8 An infrequent, yet serious, complication of iatrogenic hyponatremia is hyponatremic encephalopathy, which carries a high rate of morbidity or mortality.9 The prevention of hyponatremia is essential as the early symptoms of hyponatremic encephalopathy are nonspecific and can be easily missed.2
More than 15 prospective randomized controlled trials (RCTs) involving over 2,000 children have demonstrated that isotonic IV fluids are more effective in preventing hospital-acquired hyponatremia than hypotonic IV fluids and are not associated with the development of fluid overload or hypernatremia. A 2014 metaanalysis comprising 10 RCTs and involving over 800 children found that when compared with isotonic IV fluids, hypotonic IV fluids present a relative risk of 2.37 for sodium levels to drop below 135 mEq/L and a relative risk of 6.1 for levels to drop below 130 mEq/L. The numbers needed to treat (NNT) with isotonic IV fluids to prevent hyponatremia in each group were 6 and 17, respectively.7 A Cochrane review published in 2014 presented comparable findings, demonstrating that hypotonic IV fluids had a 34% risk of causing hyponatremia; by comparison, isotonic IV fluids had a 17% risk of causing hyponatremia and a NNT of six to prevent hyponatremia.8 In a large RCT conducted in 2015 with 676 pediatric patients, McNabb et al. found that when compared with patients receiving isotonic IV fluids, those receiving hypotonic IV fluids had a higher incidence of developing hyponatremia (10.9% versus 3.8%) with a NNT of 15 to prevent hyponatremia with the use of isotonic fluids.10 Published trials have likely been underpowered to detect a difference in the infrequent adverse hyponatremia outcomes of seizures and mortality.
On the basis of these data, patient safety alerts have recommended the avoidance of hypotonic IV fluids in the United Kingdom (UK) and Australia, and the 2015 UK guidelines for children now recommend isotonic IV fluids for maintenance needs.11 Although many of the aforementioned studies included predominantly critically ill or surgical pediatric patients, the risk of hyponatremia with hypotonic IV fluids seems similarly increased in nonsurgical and noncritically ill pediatric patients.10
For patients at risk for excess ADH release, some have supported the use of hypotonic IV fluids at a lower than maintenance rate to theoretically decrease the risk of hyponatremia, but this practice has not been effective in preventing hyponatremia.2,12 Unless a patient is in a fluid overload state, such as in congestive heart failure, cirrhosis, or renal failure; isotonic maintenance IV fluids should not result in fluid overload.3 Available evidence for guiding maintenance IV fluid choice in neonates or young infants is limited. Nevertheless, given the aforementioned reasons, we generally recommend the prescription of isotonic IV fluids for most in this population.
Which Isotonic IV Fluid Should Be Used?
The sodium concentration (154 mmol/L) of 0.9% saline, an isotonic IV fluid, is approximately equal to the tonicity of the aqueous phase of plasma. The majority of studies evaluating the risk of hyponatremia with maintenance IV fluids have used 0.9% saline as the studied isotonic IV fluid. Plasma-Lyte and Ringer’s lactate are low-chloride, buffered/balanced solutions. Plasma-Lyte ([Na] = 140 mmol/L) has been demonstrated to be effective in preventing hyponatremia. Ringers’ lactate is slightly hypotonic ([Na] = 130 mmol/L), and its administration is associated with a decrease in serum sodium.13 A resultant dilutional and hyperchloremic metabolic acidosis is more likely to develop with the use of large volumes of 0.9% saline in resuscitation than with the use of balanced solutions.2 Whether the prolonged use of 0.9% saline maintenance IV fluids can lead to this same side effect remains unknown given insufficient evidence.2 Retrospective studies using balanced solutions have shown an association with decreased rates of acute kidney injury (AKI) and mortality when compared with 0.9% saline. However, a RCT with over 2,000 adult ICU patients showed no change in rates of AKI in those that received Plasma-Lyte compared with those who received 0.9% saline.14
Two recent, single-center, prospective studies compared the use of Ringer’s lactate or Plasma-Lyte for resuscitation with that of 0.9% saline. One study was comprised of 15,802 critically ill adults, and the other was comprised of 13,347 noncritically adults. Both studies showed that balanced solutions decreased the rate of major adverse kidney events (defined as a composite of death from any cause, new renal-replacement therapy, or persistent renal injury) within 30 days.15,16 Available published pediatric studies indicate that 0.9% saline is an effective maintenance IV fluid for the prevention of hyponatremia that is not associated with hypernatremia or fluid overload. Further pediatric studies comparing 0.9% saline with balanced solutions are needed.
When Should We Use Hypotonic IV Fluids?
Hypotonic IV fluids may be needed for patients with hypernatremia and a free-water deficit or a renal-concentrating defect with ongoing urinary free-water losses.2 Special care should be taken when choosing maintenance IV fluids for patients with renal disease, liver disease, or heart failure given that these groups have been excluded from some studies.12 These patients may be at risk for increased salt and fluid retention with any IV fluid, and fluid rates need to be restricted. The fluid intake of patients with hyponatremia secondary to SIADH needs close management; these patients benefit from total fluid restriction instead of standard maintenance IV fluid rates.2
What We Should Do Instead?
Maintenance IV fluids should only be used when necessary and should be stopped as soon as they are no longer required, especially in light of the recent shortages in 0.9% saline.17 Similar to all medications, maintenance IV fluids should be individualized to the patient’s needs on the basis of the indication for IV fluids and the patient’s comorbidities.2 Consideration should be given to checking the patient’s electrolyte levels to monitor response to IV fluids, especially during the first 24 hours of admission when risk of hyponatremia is highest. Isotonic IV fluids with 5% dextrose should be used as the maintenance IV fluid in the majority of hospitalized children given its proven benefit in decreasing the rate of hospital-acquired hyponatremia.7,8 Hypotonic IV fluids should be avoided as the default maintenance IV fluid and should only be utilized under specific circumstances.
RECOMMENDATIONS
- When needed, maintenance IV fluids should always be tailored to each individual patient.
- For most acutely ill hospitalized children, isotonic IV fluids should be the maintenance IV fluid of choice.
- Consider monitoring electrolytes to determine the effects of maintenance IV fluids.
CONCLUSION
Enteral maintenance fluids should be used first-line if possible. Although hypotonic IV fluids have historically been the maintenance IV fluid of choice, this class of IV fluids should be avoided for most hospitalized children to decrease the significant risk of iatrogenic hyponatremia, which can be severe and have catastrophic complications. When necessary, isotonic IV fluids should be used for the majority of hospitalized children given that these fluids present a significantly decreased risk for causing hyponatremia. Returning to our case presentation, to decrease the risk of hyponatremia, the senior resident should recommend starting isotonic IV fluids in the 12-month-old and theoretical 2-week-old until oral intake can be maintained.
Do you think this is a low-value practice? Is this truly a “Thing We Do for No Reason”? Let us know what you do in your practice and propose ideas for other “Things We Do for No Reason” topics. Please join in the conversation online at Twitter (#TWDFNR)/Facebook and don’t forget to “Like It” on Facebook or retweet it on Twitter.
Disclosure
The authors have no relevant conflicts of interest to report. No payment or services from a 3rd party were received for any aspect of this submitted work. The authors have no financial relationships with entities in the biomedical arena that could be perceived to influence, or that give the appearance of potentially influencing, what was written in this submitted work.
1. Holliday MA, Segar WE. The maintenance need for water in parenteral fluid therapy. Pediatrics. 1957;19(5):823-832. PubMed
2. Moritz ML, Ayus JC. Maintenance intravenous fluids in acutely Ill patients. N Engl J Med. 2015;373(14):1350-1360. doi: 10.1056/NEJMra1412877. PubMed
3. Freeman MA, Ayus JC, Moritz ML. Maintenance intravenous fluid prescribing practices among paediatric residents. Acta Paediatr. 2012;101(10):e465-e468. doi: 10.1111/j.1651-2227.2012.02780.x. PubMed
4. Schwartz WB BW, Curelop S, Bartter FC. A syndrome of renal sodium loss and hyponatremia probably resulting from inappropriate secretion of antidiuretic hormone. Am J Med. 1957;23(4):529-542. doi: 10.1016/0002-9343(57)90224-3. PubMed
5. Wattad A, Chiang ML, Hill LL. Hyponatremia in hospitalized children. Clin Pediatr. 1992;31(3):153-157. doi: 10.1177/000992289203100305. PubMed
6. Greenberg A, Verbalis JG, Amin AN, et al. Current treatment practice and outcomes. Report of the hyponatremia registry. Kidney Int. 2015;88(1):167-177. doi: 10.1038/ki.2015.4. PubMed
7. Foster BA, Tom D, Hill V. Hypotonic versus isotonic fluids in hospitalized children: A systematic review and meta-analysis. J Pediatr. 2014;165(1):163-169.e162. doi: 10.1016/j.jpeds.2014.01.040. PubMed
8. McNab S, Ware RS, Neville KA, et al. Isotonic versus hypotonic solutions for maintenance intravenous fluid administration in children. Cochrane Database Syst Rev. 2014;(12):CD009457. doi: 10.1002/14651858.CD009457.pub2. PubMed
9. Arieff AI, Ayus JC, Fraser CL. Hyponatraemia and death or permanent brain damage in healthy children. BMJ. 1992;304(6836):1218-1222. doi: 10.1136/bmj.304.6836.1218. PubMed
10. McNab S, Duke T, South M, et al. 140 mmol/L of sodium versus 77 mmol/L of sodium in maintenance intravenous fluid therapy for children in hospital (PIMS): A randomised controlled double-blind trial. Lancet. 2015;385(9974):1190-1197. doi: 10.1016/S0140-6736(14)61459-8. PubMed
11. Neilson J, O’Neill F, Dawoud D, Crean P, Guideline Development G. Intravenous fluids in children and young people: summary of NICE guidance. BMJ. 2015;351:h6388. doi: 10.1136/bmj.h6388. PubMed
12. Neville KA, Sandeman DJ, Rubinstein A, Henry GM, McGlynn M, Walker JL. Prevention of hyponatremia during maintenance intravenous fluid administration: a prospective randomized study of fluid type versus fluid rate. J Pediatr. 2010;156(2):313-319. doi: 10.1016/j.jpeds.2009.07.059. PubMed
13. Moritz ML, Ayus JC. Preventing neurological complications from dysnatremias in children. Pediatr Nephrol. 2005;20(12):1687-1700. doi: 10.1007/s00467-005-1933-6. PubMed
14. Young P, Bailey M, Beasley R, et al. Effect of a buffered crystalloid solution vs saline on acute kidney injury among patients in the intensive care unit: The SPLIT Randomized Clinical Trial. JAMA. 2015;314(16):1701-1710. doi: 10.1001/jama.2015.12334. PubMed
15. Semler MW, Self WH, Wanderer JP, et al. Balanced crystalloids versus salinein critically Ill adults. N Engl J Med. 2018;378(9):829-839. doi: 10.1056/NEJMoa1711584. PubMed
16. Self WH, Semler MW, Wanderer JP, et al. Balanced crystalloids versus saline in noncritically Ill adults. N Engl J Med. 2018;378(9):819-828. doi: 10.1056/NEJMoa1711586. PubMed
17. Mazer-Amirshahi M, Fox ER. Saline shortages - Many causes, no simple solution. N Engl J Med. 2018;378(16):1472-1474. doi: 10.1056/NEJMp1800347. PubMed
© 2018 Society of Hospital Medicine
Postdischarge Emergency Department Visits: Good, Bad, or Ugly?
Once upon a time, discharges were easy to categorize: good, bad, or ugly. Good discharges allowed the patient to leave before noon, while bad discharges allowed the patient to leave without follow-up appointments. The worst discharges were defined by the two ugly cousins of acute care re-escalation: return emergency department (ED) visits and readmissions. Recently, however, much of this conventional wisdom has been turned on its head. For example, pre-noon discharges and provider-scheduled follow-up appointments may lead to unintended negative consequences and futility.1,2 In contrast, weekend discharges, which were often viewed to be unsafe, may reduce lengths of stay without compromising care even in high-risk patients.3
Having obfuscated the line between good and bad, we can now turn our attention to the ugly. Comparing return ED visits with readmissions, hospitalists may be forgiven for judging the latter cousin as uglier – and not just for reimbursement reasons. Readmitted patients are sicker, more vulnerable, and have poorer outcomes. In our healthcare system’s resultant quest to eliminate readmissions, return ED visits that do not end in readmission are generally either ignored or grouped with readmissions. Ignoring these treat-and-discharge ED visits is problematic because of their incidence, which rivals that of ED visits ending in readmission.4 On the other hand, grouping these visits with readmissions only makes sense if the two are considered to be equally ugly outcomes. Is this a valid assumption to make?
In this issue of the Journal of Hospital Medicine, Venkatesh et al5 tackle that question by studying Medicare beneficiaries hospitalized for acute myocardial infarction, heart failure, or pneumonia over a 1-year period. The authors differentiate 30-day treat-and-discharge ED visit rates from 30-day readmission rates before risk-standardizing these rates based on visit codes and hospital characteristics. Similar to the results of prior studies, the authors observe an 8%–9% overall incidence of treat-and-discharge ED visits within 30 days of hospital discharge.6 Mapping treat-and-discharge ED visit rates versus readmission rates for each hospital, the authors detect modest but noticeable inverse correlations between the two. Among hospitals discharging heart failure patients, for example, every 10% increase in postdischarge ED visit rates corresponds to a roughly 2% decrease in readmission rates.
The authors are correct to tread cautiously with their interpretation of this correlation. Dispositions for ED patients exist on a continuum, so hospitals with higher propensities to discharge patients from EDs (whether directly or from observation units) will inherently have lower admission rates. The authors hint at a causal relationship nonetheless, suggesting that ED providers may be able to intervene on high-risk patients earlier before Readmission Road becomes a one-way street. Proving this hypothesis will require careful research that controls for patient, disease, and ED factors as well as their complex interactions in the post-discharge timeline. That being said, most analyses of outpatient follow-up visits (except for heart failure patients) have failed to find any anti-readmission correlation analogous to that identified by Venkatesh et al. What powers do ED providers have that outpatient providers lack? Many, admittedly: stat phlebotomy services, on-demand consultations, and observation units. Additionally, while ED visits invariably require a patient’s presence in person, 25% of provider-scheduled posthospitalization outpatient visits end in no-shows.2 Whether patient-triggered follow-up through rapid access clinics or even urgent care centers can replicate ED functionality in recently discharged patients is unknown and warrants further study.
Venkatesh et al5 also find that reasons for postdischarge ED visits bear only a slight resemblance to reasons for index hospitalizations. For example, of all ED visits by patients recovering from hospitalizations for pneumonia, only 20% involve respiratory or pulmonary complaints. What explains the other 80%? Some variability may be attributable to the study’s use of visit codes instead of chart reviews or stakeholder interviews; in surveys of patients and ED physicians during these postdischarge visits, the two groups may have very different perceptions of why the encounter is occurring and whether it is preventable.7 Regardless of who is “right,” the heterogeneity of reasons that prompt care re-escalation lends further credence to the existence of a distinct posthospitalization syndrome:8 in the immediate postdischarge interval, patients experience many transient but real physiological risks for which they may identify the ED as their best recourse.
Whether the ED actually provides secondary prophylaxis against the posthospitalization syndrome is highly debatable, and Venkatesh et al wisely refrain from assigning a positive or negative valence to treat-and-discharge ED visits. Ultimately, postdischarge ED visits are neither inherently good nor bad (nor ugly, for that matter). Their unique nature is attracting newfound appreciation, and their potential ability to prevent readmission merits further research. If hospitals with high postdischarge ED visit rates can deliver high-quality care while truly arresting or reversing readmission-bound trajectories, then the strategies employed by these hospitals should inspire emulation, innovation, and dissemination.
Disclosures
The authors have nothing to disclose.
1. Rajkomar A, Valencia V, Novelero M, Mourad M, Auerbach A. The association between discharge before noon and length of stay in medical and surgical patients. J Hosp Med. 2016;11(12):859-861. 10.1002/jhm.2529. PubMed
2. Banerjee R, Suarez A, Kier M, et al. If you book it, will they come? Attendance at postdischarge follow-up visits scheduled by inpatient providers. J Hosp Med. 2017;12(8):618-625. 10.12788/jhm.2777. PubMed
3. McAlister FA, Youngson E, Padwal RS, Majumdar SR. Similar outcomes among general medicine patients discharged on weekends. J Hosp Med. 2015;10(2):69-74. 10.1002/jhm.2310. PubMed
4. Rising KL, White LF, Fernandez WG, Boutwell AE. Emergency department visits after hospital discharge: a missing part of the equation. Ann Emerg Med. 2013;62(2):145-150. 10.1016/j.annemergmed.2013.01.024. PubMed
5. Venkatesh A, Wang C, Wang Y, Altaf F, Bernheim S, Horwitz L. Association between post-discharge emergency department visitation and readmission rates J Hosp Med. 2018;13(9):589-594. doi: 10.12788/jhm.2937.
6. Vashi AA, Fox JP, Carr BG, et al. Use of hospital-based acute care among patients recently discharged from the hospital. JAMA. 2013;309(4):364-371. 10.1001/jama.2012.216219. PubMed
7. Suffoletto B, Hu J, Guyette M, Callaway C. Factors contributing to emergency department care within 30 days of hospital discharge and potential ways to prevent it: differences in perspectives of patients, caregivers, and emergency physicians. J Hosp Med. 2014;9(5):315-319. 10.1002/jhm.2167. PubMed
8. Krumholz HM. Post-hospital syndrome: an acquired, transient condition of generalized risk. N Engl J Med. 2013;368(2):100-102. 10.1056/NEJMp1212324. PubMed
Once upon a time, discharges were easy to categorize: good, bad, or ugly. Good discharges allowed the patient to leave before noon, while bad discharges allowed the patient to leave without follow-up appointments. The worst discharges were defined by the two ugly cousins of acute care re-escalation: return emergency department (ED) visits and readmissions. Recently, however, much of this conventional wisdom has been turned on its head. For example, pre-noon discharges and provider-scheduled follow-up appointments may lead to unintended negative consequences and futility.1,2 In contrast, weekend discharges, which were often viewed to be unsafe, may reduce lengths of stay without compromising care even in high-risk patients.3
Having obfuscated the line between good and bad, we can now turn our attention to the ugly. Comparing return ED visits with readmissions, hospitalists may be forgiven for judging the latter cousin as uglier – and not just for reimbursement reasons. Readmitted patients are sicker, more vulnerable, and have poorer outcomes. In our healthcare system’s resultant quest to eliminate readmissions, return ED visits that do not end in readmission are generally either ignored or grouped with readmissions. Ignoring these treat-and-discharge ED visits is problematic because of their incidence, which rivals that of ED visits ending in readmission.4 On the other hand, grouping these visits with readmissions only makes sense if the two are considered to be equally ugly outcomes. Is this a valid assumption to make?
In this issue of the Journal of Hospital Medicine, Venkatesh et al5 tackle that question by studying Medicare beneficiaries hospitalized for acute myocardial infarction, heart failure, or pneumonia over a 1-year period. The authors differentiate 30-day treat-and-discharge ED visit rates from 30-day readmission rates before risk-standardizing these rates based on visit codes and hospital characteristics. Similar to the results of prior studies, the authors observe an 8%–9% overall incidence of treat-and-discharge ED visits within 30 days of hospital discharge.6 Mapping treat-and-discharge ED visit rates versus readmission rates for each hospital, the authors detect modest but noticeable inverse correlations between the two. Among hospitals discharging heart failure patients, for example, every 10% increase in postdischarge ED visit rates corresponds to a roughly 2% decrease in readmission rates.
The authors are correct to tread cautiously with their interpretation of this correlation. Dispositions for ED patients exist on a continuum, so hospitals with higher propensities to discharge patients from EDs (whether directly or from observation units) will inherently have lower admission rates. The authors hint at a causal relationship nonetheless, suggesting that ED providers may be able to intervene on high-risk patients earlier before Readmission Road becomes a one-way street. Proving this hypothesis will require careful research that controls for patient, disease, and ED factors as well as their complex interactions in the post-discharge timeline. That being said, most analyses of outpatient follow-up visits (except for heart failure patients) have failed to find any anti-readmission correlation analogous to that identified by Venkatesh et al. What powers do ED providers have that outpatient providers lack? Many, admittedly: stat phlebotomy services, on-demand consultations, and observation units. Additionally, while ED visits invariably require a patient’s presence in person, 25% of provider-scheduled posthospitalization outpatient visits end in no-shows.2 Whether patient-triggered follow-up through rapid access clinics or even urgent care centers can replicate ED functionality in recently discharged patients is unknown and warrants further study.
Venkatesh et al5 also find that reasons for postdischarge ED visits bear only a slight resemblance to reasons for index hospitalizations. For example, of all ED visits by patients recovering from hospitalizations for pneumonia, only 20% involve respiratory or pulmonary complaints. What explains the other 80%? Some variability may be attributable to the study’s use of visit codes instead of chart reviews or stakeholder interviews; in surveys of patients and ED physicians during these postdischarge visits, the two groups may have very different perceptions of why the encounter is occurring and whether it is preventable.7 Regardless of who is “right,” the heterogeneity of reasons that prompt care re-escalation lends further credence to the existence of a distinct posthospitalization syndrome:8 in the immediate postdischarge interval, patients experience many transient but real physiological risks for which they may identify the ED as their best recourse.
Whether the ED actually provides secondary prophylaxis against the posthospitalization syndrome is highly debatable, and Venkatesh et al wisely refrain from assigning a positive or negative valence to treat-and-discharge ED visits. Ultimately, postdischarge ED visits are neither inherently good nor bad (nor ugly, for that matter). Their unique nature is attracting newfound appreciation, and their potential ability to prevent readmission merits further research. If hospitals with high postdischarge ED visit rates can deliver high-quality care while truly arresting or reversing readmission-bound trajectories, then the strategies employed by these hospitals should inspire emulation, innovation, and dissemination.
Disclosures
The authors have nothing to disclose.
1. Rajkomar A, Valencia V, Novelero M, Mourad M, Auerbach A. The association between discharge before noon and length of stay in medical and surgical patients. J Hosp Med. 2016;11(12):859-861. 10.1002/jhm.2529. PubMed
2. Banerjee R, Suarez A, Kier M, et al. If you book it, will they come? Attendance at postdischarge follow-up visits scheduled by inpatient providers. J Hosp Med. 2017;12(8):618-625. 10.12788/jhm.2777. PubMed
3. McAlister FA, Youngson E, Padwal RS, Majumdar SR. Similar outcomes among general medicine patients discharged on weekends. J Hosp Med. 2015;10(2):69-74. 10.1002/jhm.2310. PubMed
4. Rising KL, White LF, Fernandez WG, Boutwell AE. Emergency department visits after hospital discharge: a missing part of the equation. Ann Emerg Med. 2013;62(2):145-150. 10.1016/j.annemergmed.2013.01.024. PubMed
5. Venkatesh A, Wang C, Wang Y, Altaf F, Bernheim S, Horwitz L. Association between post-discharge emergency department visitation and readmission rates J Hosp Med. 2018;13(9):589-594. doi: 10.12788/jhm.2937.
6. Vashi AA, Fox JP, Carr BG, et al. Use of hospital-based acute care among patients recently discharged from the hospital. JAMA. 2013;309(4):364-371. 10.1001/jama.2012.216219. PubMed
7. Suffoletto B, Hu J, Guyette M, Callaway C. Factors contributing to emergency department care within 30 days of hospital discharge and potential ways to prevent it: differences in perspectives of patients, caregivers, and emergency physicians. J Hosp Med. 2014;9(5):315-319. 10.1002/jhm.2167. PubMed
8. Krumholz HM. Post-hospital syndrome: an acquired, transient condition of generalized risk. N Engl J Med. 2013;368(2):100-102. 10.1056/NEJMp1212324. PubMed
© 2018 Society of Hospital Medicine
A Tough Egg to Crack
A 68-year-old woman presented to the emergency department with altered mental status. On the morning prior to admission, she was fully alert and oriented. Over the course of the day, she became more confused and somnolent, and by the evening, she was unarousable to voice. She had not fallen and had no head trauma.
Altered mental status may arise from metabolic (eg, hyponatremia), infectious (eg, urinary tract infection), structural (eg, subdural hematoma), or toxin-related (eg, adverse medication effect) processes. Any of these categories of encephalopathy can develop gradually over the course of a day.
One year prior, the patient was admitted for a similar episode of altered mental status. Asterixis and elevated transaminases prompted an abdominal ultrasound, which revealed a nodular liver and ascites. Paracentesis revealed a high serum-ascites albumin gradient. The diagnosis of cirrhosis was made based on these findings. Testing for viral hepatitis, autoimmune hepatitis, hemochromatosis, and Wilson’s disease were negative. Although steatosis was not detected on ultrasound, nonalcoholic fatty liver disease (NAFLD) was suspected based on the patient’s risk factors of hypertension and type 2 diabetes mellitus. She had four additional presentations of altered mental status with asterixis; each episode resolved with lactulose.
Other medical history included end-stage renal disease (ESRD) requiring hemodialysis. Her medications were labetalol, amlodipine, insulin, propranolol, lactulose, and rifaximin. She was originally from China and moved to the United States 10 years earlier. Given concerns about her ability to consistently take medications, she had moved to a long-term facility. She did not use alcohol, tobacco, or illicit substances.
The normalization of the patient’s mental status after lactulose treatment, especially in the context of recurrent episodes, is characteristic of hepatic encephalopathy, in which ammonia and other substances bypass hepatic metabolism and impair cerebral function. Hepatic encephalopathy is the most common cause of lactulose-responsive encephalopathy, and may recur in the setting of infection or nonadherence with lactulose and rifaximin. Other causes of lactulose-responsive encephalopathy include hyperammonemia caused by urease-producing bacterial infection (eg, Proteus), valproic acid toxicity, and urea cycle abnormalities.
Other causes of confusion with a self-limited course should be considered for the current episode. A postictal state is possible, but convulsions were not reported. The patient is at risk of hypoglycemia from insulin use and impaired gluconeogenesis due to cirrhosis and ESRD, but low blood sugar would have likely been detected at the time of hospitalization. Finally, she might have experienced episodic encephalopathy from ingestion of unreported medications or toxins, whose effects may have resolved with abstinence during hospitalization.
The patient’s temperature was 37.8°C, pulse 73 beats/minute, blood pressure 133/69 mmHg, respiratory rate 12 breaths/minute, and oxygen saturation 98% on ambient air. Her body mass index (BMI) was 19 kg/m2. She was somnolent but was moving all four extremities spontaneously. Her pupils were symmetric and reactive. There was no facial asymmetry. Biceps and patellar reflexes were 2+ bilaterally. Babinski sign was absent bilaterally. The patient could not cooperate with the assessment for asterixis. Her sclerae were anicteric. The jugular venous pressure was estimated at 13 cm of water. Her heart was regular with no murmurs. Her lungs were clear. She had a distended, nontender abdomen with caput medusae. She had symmetric pitting edema in her lower extremities up to the shins.
The elevated jugular venous pressure, lower extremity edema, and distended abdomen suggest volume overload. Jugular venous distention with clear lungs is characteristic of right ventricular failure from pulmonary hypertension, right ventricular myocardial infarction, tricuspid regurgitation, or constrictive pericarditis. However, chronic biventricular heart failure often presents in this manner and is more common than the aforementioned conditions. ESRD and cirrhosis may be contributing to the hypervolemia.
Although Asian patients may exhibit metabolic syndrome and NAFLD at a lower BMI than non-Asians, her BMI is uncharacteristically low for NAFLD, especially given the increased weight expected from volume overload. There are no signs of infection to account for worsening of hepatic encephalopathy.
Laboratory tests demonstrated a white blood cell count of 4400/µL with a normal differential, hemoglobin of 10.3 g/dL, and platelet count of 108,000 per cubic millimeter. Mean corpuscular volume was 103 fL. Basic metabolic panel was normal with the exception of blood urea nitrogen of 46 mg/dL and a creatinine of 6.4 mg/dL. Aspartate aminotransferase was 34 units/L, alanine aminotransferase 34 units/L, alkaline phosphatase 289 units/L (normal, 31-95), gamma-glutamyl transferase 104 units (GGT, normal, 12-43), total bilirubin 0.8 mg/dL, and albumin 2.5 g/dL (normal, 3.5-4.5). Pro-brain natriuretic peptide was 1429 pg/mL (normal, <100). The international normalized ratio (INR) was 1.0. Urinalysis showed trace proteinuria. The chest x-ray was normal. A noncontrast computed tomography (CT) of the head demonstrated no intracranial pathology. An abdominal ultrasound revealed a normal-sized nodular liver, a nonocclusive portal vein thrombus (PVT), splenomegaly (15 cm in length), and trace ascites. There was no biliary dilation, hepatic steatosis, or hepatic mass.
The evolving data set presents a mixed picture about the state of the liver. The distended abdominal wall veins, thrombocytopenia, and splenomegaly are commonly observed in advanced cirrhosis, but these findings reflect the associated portal hypertension and not the liver disease itself. The normal bilirubin and INR suggest preserved liver function and decrease the likelihood of cirrhosis being responsible for the portal hypertension. However, the elevated alkaline phosphatase and GGT levels suggest an infiltrative liver disease, such as lymphoma, sarcoidosis, or amyloidosis.
Furthermore, while a nodular liver on imaging is consistent with cirrhosis, no steatosis was noted to support the presumed diagnosis of NAFLD. One explanation for this discrepancy is that fatty infiltration may be absent when NAFLD-associated cirrhosis develops. In summary, there is evidence of liver disease, and there is evidence of portal hypertension, but there is no evidence of liver parenchymal failure. The key features of the latter – spider angiomata, palmar erythema, hyperbilirubinemia, and coagulopathy – are absent.
Noncirrhotic portal hypertension (NCPH) is an alternative explanation for the patient’s findings. NCPH is an elevation in the portal venous system pressure that arises from intrahepatic (but noncirrhotic) disease or from extrahepatic disease. Hepatic schistosomiasis is an example of intrahepatic but noncirrhotic portal hypertension. PVT that arises on account of a hypercoagulable condition (eg, abdominal malignancy, pancreatitis, or myeloproliferative disorders) is a prototype of extrahepatic NCPH. At this point, it is impossible to know if the PVT is a complication of NCPH or a cause of NCPH. PVT as a complication of cirrhosis is less likely.
An abdominal CT scan would better assess the hepatic parenchyma and exclude abdominal malignancies such as pancreatic adenocarcinoma. An echocardiogram is indicated to evaluate the cause of the elevated jugular venous pressure. A liver biopsy and measurement of portal venous pressure would help distinguish between cirrhotic and noncirrhotic portal hypertension.
Hepatitis A, B, and C serologies were negative as were antinuclear and antimitochondrial antibodies. Ferritin and ceruloplasmin levels were normal. A CT scan of the abdomen with contrast demonstrated a nodular liver contour, splenomegaly, and a nonocclusive PVT (Figure 1). A transthoracic echocardiogram showed normal biventricular systolic function and size, normal diastolic function, a pulmonary artery systolic pressure of 57 mmHg (normal, < 25), moderate tricuspid regurgitation, and no pericardial effusion or thickening. The patient’s confusion and somnolence resolved after two days of lactulose therapy. She denied the use of other medications, supplements, or herbs.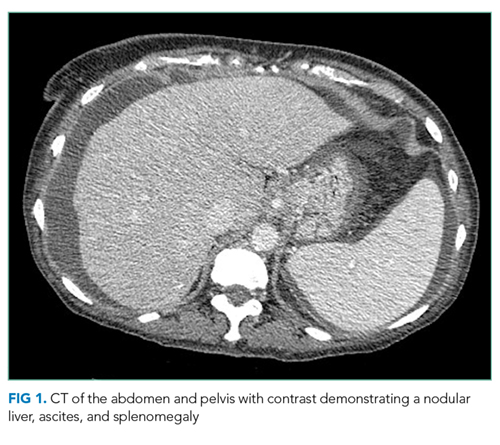
Pulmonary hypertension is usually a consequence of cardiopulmonary disease, but there is no exam or imaging evidence for left ventricular failure, mitral stenosis, obstructive lung disease, or interstitial lung disease. Portopulmonary hypertension (a form of pulmonary hypertension) can develop as a consequence of end-stage liver disease. The most common cause of hepatic encephalopathy due to portosystemic shunting is cirrhosis, but such shunting also arises in NCPH.
Schistosomiasis is the most common cause of NCPH worldwide. Parasite eggs trapped within the terminal portal venules cause inflammation, leading to fibrosis and intrahepatic portal hypertension. The liver becomes nodular on account of these changes, but the overall hepatic function is typically preserved. Portal hypertension, variceal bleeding, and pulmonary hypertension are common complications. The latter can arise from portosystemic shunting, which leads to embolization of schistosome eggs into the pulmonary circulation, where a granulomatous reaction ensues.
A percutaneous liver biopsy showed granulomatous inflammation and dilated portal venules consistent with increased resistance to venous inflow (Figure 2). There was no sinusoidal congestion to indicate impaired hepatic venous outflow. Mild sinusoidal and portal fibrosis and increased iron in Kupffer cells were noted. There was no evidence of cirrhosis or steatohepatitis. Stains for acid-fast bacilli and fungi were negative. 16S rDNA (a test assessing for bacterial DNA) and Mycobacterium tuberculosis polymerase chain reactions were negative. The biopsy confirmed the diagnosis of noncirrhotic portal hypertension.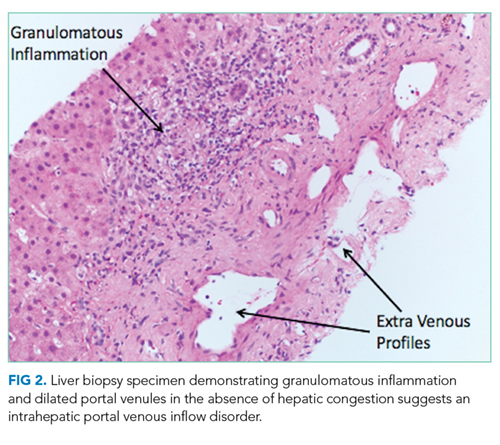
Hepatic granulomas can arise from infectious, immunologic, toxic, and malignant diseases. In the United States, immunologic disorders, such as sarcoidosis and primary biliary cholangitis, are the most common causes of granulomatous hepatitis. The patient lacks extrahepatic features of the former. The absence of bile duct injury and negative antimitochondrial antibody exclude the latter. None of the listed medications are commonly associated with hepatic granulomas. The ultrasound, CT scan, and biopsy did not reveal a granulomatous malignancy such as lymphoma.
Infections, such as brucellosis, Q fever, and tuberculosis, are common causes of granulomatous hepatitis in the developing world. Tuberculosis is prevalent in China, but the test results do not support tuberculosis as a unifying diagnosis.
Schistosomiasis accounts for the major clinical features (portal and pulmonary hypertension and preserved liver function) and hepatic pathology (ie, portal venous fibrosis with granulomatous inflammation) in this case and is prevalent in China, where the patient emigrated from. The biopsy specimen should be re-examined for schistosome eggs and serologic tests for schistosomiasis pursued.
Antibodies to human immunodeficiency virus, Brucella, Bartonella quintana, Bartonella henselae, Coxiella burnetii, Francisella tularensis, and Histoplasma were negative. Cryptococcal antigen and rapid plasma reagin were negative. IgG antibodies to Schistosoma were 0.21 units (normal, < 0.19 units). Based on the patient’s epidemiology, biopsy findings, and serology results, hepatic schistosomiasis was diagnosed. Praziquantel was prescribed. She continues to receive daily lactulose and rifaximin and has not had any episodes of encephalopathy in the year after discharge.
COMMENTARY
Portal hypertension arises when there is resistance to flow in the portal venous system. It is defined as a pressure gradient greater than 5 mmHg between the portal vein and the intra-abdominal portion of the inferior vena cava.1 Clinicians are familiar with the manifestations of portal hypertension – portosystemic shunting leading to encephalopathy and variceal hemorrhage, ascites, and splenomegaly with thrombocytopenia – because of their close association with cirrhosis. In developed countries, cirrhosis accounts for over 90% of cases of portal hypertension.1 In the remaining 10%, conditions such as portal vein thrombosis primarily affect the portal vasculature and increase resistance to portal blood flow while leaving hepatic synthetic function relatively spared (Figure 3). Therefore, cirrhosis cannot be inferred with certainty from signs of portal hypertension alone.
Liver biopsy is the gold standard for the diagnosis of cirrhosis, but this method is increasingly being replaced by noninvasive assessments of liver fibrosis, including imaging and scoring systems.2 Clinicians often infer cirrhosis from the combination of a known cause of liver injury, abnormal liver biochemical tests, evidence of liver dysfunction, and signs of portal hypertension.3 However, when signs of portal hypertension are present, but liver dysfunction cannot be established on physical exam (eg, palmar erythema, spider nevi, gynecomastia, and testicular atrophy) or laboratory testing (eg, low albumin, elevated INR, and elevated bilirubin), noncirrhotic causes of portal hypertension should be considered. In this case, the biopsy showed vascular changes that suggested impaired venous inflow without bridging fibrosis, which pointed to NCPH.
NCPH is categorized based on the location of resistance to blood flow: prehepatic (eg, portal vein thrombosis), intrahepatic (eg, schistosomiasis), and posthepatic (eg, right-sided heart failure).1 In our patient, the dilated portal venules (inflow) in the presence of normal hepatic vein outflow suggested an increased intrahepatic resistance to blood flow. This finding excluded a causal role of the portal vein thrombosis and prompted testing for schistosomiasis.
Schistosomiasis affects more than 200 million people worldwide and is prevalent in Sub-Saharan Africa, South America, Egypt, China, and Southeast Asia.4,5 Transmission occurs in fresh water, where the infectious form of the parasite is released from snails.4,6 Schistosome worms are not found in the United States, but as a result of immigration and travel, more than 400,000 people in the United States are estimated to be infected.5
Chronic schistosomiasis develops from the host’s granulomatous reaction to schistosome eggs whose location (depending on the species) leads to genitourinary, intestinal, hepatic, or rarely, neurologic disease.6 Hepatic schistosomiasis arises when eggs released in the portal venous system lodge in small portal venules and cause granulomatous inflammation, periportal fibrosis, and microvascular obstruction.6 The resultant portal hypertension develops insidiously, but the architecture and synthetic function of the liver is maintained until the very late stages of disease.6,7 Pulmonary hypertension can arise from the embolization of eggs to the pulmonary arterioles via portosystemic collaterals.
The demonstration of eggs in stool is the gold standard for the diagnosis of hepatic schistosomiasis, which is most commonly caused by Schistosoma mansoni and S. japonicum.7 Serologic assays provide evidence of infection or exposure but may cross-react with other helminths. Liver biopsy may reveal characteristic histopathologic findings, including granulomatous inflammation, distorted vasculature, and the deposition of collagen deposits in the periportal space, leading to “pipestem fibrosis.”8,9 If eggs cannot be detected on stool or histology, then serology, secondary histologic changes, and sometimes PCR are used to diagnose hepatic schistosomiasis. In our patient, the epidemiology, Schistosoma antibody titer, pulmonary hypertension, and liver biopsy with granulomatous inflammation, periportal fibrosis, and intrahepatic portal venule dilation were diagnostic of hepatic schistosomiasis.
The recurrent episodes of confusion which resolved with lactulose therapy were suggestive of hepatic encephalopathy, which results from shunting and accumulation of neurotoxic substances that would otherwise undergo hepatic metabolism.10 Clinicians are most familiar with hepatic encephalopathy in cirrhosis, where multiple liver functions – synthesis, excretion, metabolism, and circulation – simultaneously fail. NCPH represents a scenario where only the circulation is impaired, but this is sufficient to cause the portosystemic shunting that leads to encephalopathy. Our patient’s recurrent hepatic encephalopathy, despite adherence to lactulose and rifaximin and its resolution after praziquantel treatment, underscores the importance of addressing the underlying cause of portosystemic shunting.Associating portal hypertension with cirrhosis is efficient and accurate in many cases. However, when specific manifestations of cirrhosis are lacking, clinicians must decouple this association and pursue an alternative explanation for portal hypertension. The presence of some intrahepatic pathology (from schistosomiasis) but no cirrhosis made this case a particularly tough egg to crack.
Teaching Points
- In the developed world, 90% of portal hypertension is due to cirrhosis. Hepatic schistosomiasis is the most common cause of NCPH worldwide.
- Chronic schistosomiasis affects the gastrointestinal, hepatic, and genitourinary systems and causes significant global morbidity and mortality.
- Visualization of schistosome eggs is the diagnostic gold standard. Indirect testing such as schistosoma antibodies and secondary histologic changes may be required for the diagnosis in patients with a low burden of eggs.
Disclosures
Dr. Geha has no disclosures. Dr. Dhaliwal reports receiving honoraria from ISMIE Mutual Insurance Company and Physicians’ Reciprocal Insurers. Dr. Peters’ spouse is employed by Hoffman-La Roche. Dr. Manesh is supported by the Jeremiah A. Barondess Fellowship in the Clinical Transaction of the New York Academy of Medicine, in collaboration with the Accreditation Council for Graduate Medical Education (ACGME).
1. Sarin SK, Khanna R. Non-cirrhotic portal hypertension. Clin Liver Dis. 2014;18(2):451-76. doi: 10.1016/j.cld.2014.01.009. PubMed
2. Tapper EB, Lok AS. Use of liver imaging and biopsy in clinical practice. N Engl J Med. 2017;377(8):756-768. doi: 10.1056/NEJMra1610570. PubMed
3. Udell JA, Wang CS, Tinmouth J, et al. Does this patient with liver disease have cirrhosis? JAMA. 2012;307(8):832-42. doi: 10.1001/jama.2012.186. PubMed
4. Centers for Disease Control and Prevention. Parasites–Schistosomiasis. https://www.cdc.gov/parasites/schistosomiasis/. Accessed December 2, 2017.
5. Bica I, Hamer DH, Stadecker MJ. Hepatic schistosomiasis. Infect Dis Clin N Am. 2000;14(3):583-604. PubMed
6. Ross AG, Bartley PB, Sleigh AC, et al. Schistosomiasis. N Engl J Med. 2002;346(16):1212-20. doi: 10.1056/NEJMra012396. PubMed
7. Gray DJ, Ross AG, Li YS, McManus DP. Diagnosis and management of schistosomiasis. BMJ. 2011;342: 2561-2561. doi: doi.org/10.1136/bmj.d2651. PubMed
8. Manzella A, Ohtomo K, Monzawa S, Lim JH. Schistosomiasis of the liver. Abdom Imaging. 2008;33(2):144-50. doi: 10.1007/s00261-007-9329-7. PubMed
9. Gryseels B, Polman K, Clerinx J, Kestens L. Human schistosomiasis. Lancet. 2006;368(9541):1106-18. doi: 10.1016/S0140-6736(06)69440-3. PubMed
10. Blei AT, Córdoba J. Practice Parameters Committee of the American College of Gastroenterology. Hepatic encephalopathy. Am J Gastroenterol. 2001;96(7):1968. doi: 10.1111/j.1572-0241.2001.03964.x. PubMed
A 68-year-old woman presented to the emergency department with altered mental status. On the morning prior to admission, she was fully alert and oriented. Over the course of the day, she became more confused and somnolent, and by the evening, she was unarousable to voice. She had not fallen and had no head trauma.
Altered mental status may arise from metabolic (eg, hyponatremia), infectious (eg, urinary tract infection), structural (eg, subdural hematoma), or toxin-related (eg, adverse medication effect) processes. Any of these categories of encephalopathy can develop gradually over the course of a day.
One year prior, the patient was admitted for a similar episode of altered mental status. Asterixis and elevated transaminases prompted an abdominal ultrasound, which revealed a nodular liver and ascites. Paracentesis revealed a high serum-ascites albumin gradient. The diagnosis of cirrhosis was made based on these findings. Testing for viral hepatitis, autoimmune hepatitis, hemochromatosis, and Wilson’s disease were negative. Although steatosis was not detected on ultrasound, nonalcoholic fatty liver disease (NAFLD) was suspected based on the patient’s risk factors of hypertension and type 2 diabetes mellitus. She had four additional presentations of altered mental status with asterixis; each episode resolved with lactulose.
Other medical history included end-stage renal disease (ESRD) requiring hemodialysis. Her medications were labetalol, amlodipine, insulin, propranolol, lactulose, and rifaximin. She was originally from China and moved to the United States 10 years earlier. Given concerns about her ability to consistently take medications, she had moved to a long-term facility. She did not use alcohol, tobacco, or illicit substances.
The normalization of the patient’s mental status after lactulose treatment, especially in the context of recurrent episodes, is characteristic of hepatic encephalopathy, in which ammonia and other substances bypass hepatic metabolism and impair cerebral function. Hepatic encephalopathy is the most common cause of lactulose-responsive encephalopathy, and may recur in the setting of infection or nonadherence with lactulose and rifaximin. Other causes of lactulose-responsive encephalopathy include hyperammonemia caused by urease-producing bacterial infection (eg, Proteus), valproic acid toxicity, and urea cycle abnormalities.
Other causes of confusion with a self-limited course should be considered for the current episode. A postictal state is possible, but convulsions were not reported. The patient is at risk of hypoglycemia from insulin use and impaired gluconeogenesis due to cirrhosis and ESRD, but low blood sugar would have likely been detected at the time of hospitalization. Finally, she might have experienced episodic encephalopathy from ingestion of unreported medications or toxins, whose effects may have resolved with abstinence during hospitalization.
The patient’s temperature was 37.8°C, pulse 73 beats/minute, blood pressure 133/69 mmHg, respiratory rate 12 breaths/minute, and oxygen saturation 98% on ambient air. Her body mass index (BMI) was 19 kg/m2. She was somnolent but was moving all four extremities spontaneously. Her pupils were symmetric and reactive. There was no facial asymmetry. Biceps and patellar reflexes were 2+ bilaterally. Babinski sign was absent bilaterally. The patient could not cooperate with the assessment for asterixis. Her sclerae were anicteric. The jugular venous pressure was estimated at 13 cm of water. Her heart was regular with no murmurs. Her lungs were clear. She had a distended, nontender abdomen with caput medusae. She had symmetric pitting edema in her lower extremities up to the shins.
The elevated jugular venous pressure, lower extremity edema, and distended abdomen suggest volume overload. Jugular venous distention with clear lungs is characteristic of right ventricular failure from pulmonary hypertension, right ventricular myocardial infarction, tricuspid regurgitation, or constrictive pericarditis. However, chronic biventricular heart failure often presents in this manner and is more common than the aforementioned conditions. ESRD and cirrhosis may be contributing to the hypervolemia.
Although Asian patients may exhibit metabolic syndrome and NAFLD at a lower BMI than non-Asians, her BMI is uncharacteristically low for NAFLD, especially given the increased weight expected from volume overload. There are no signs of infection to account for worsening of hepatic encephalopathy.
Laboratory tests demonstrated a white blood cell count of 4400/µL with a normal differential, hemoglobin of 10.3 g/dL, and platelet count of 108,000 per cubic millimeter. Mean corpuscular volume was 103 fL. Basic metabolic panel was normal with the exception of blood urea nitrogen of 46 mg/dL and a creatinine of 6.4 mg/dL. Aspartate aminotransferase was 34 units/L, alanine aminotransferase 34 units/L, alkaline phosphatase 289 units/L (normal, 31-95), gamma-glutamyl transferase 104 units (GGT, normal, 12-43), total bilirubin 0.8 mg/dL, and albumin 2.5 g/dL (normal, 3.5-4.5). Pro-brain natriuretic peptide was 1429 pg/mL (normal, <100). The international normalized ratio (INR) was 1.0. Urinalysis showed trace proteinuria. The chest x-ray was normal. A noncontrast computed tomography (CT) of the head demonstrated no intracranial pathology. An abdominal ultrasound revealed a normal-sized nodular liver, a nonocclusive portal vein thrombus (PVT), splenomegaly (15 cm in length), and trace ascites. There was no biliary dilation, hepatic steatosis, or hepatic mass.
The evolving data set presents a mixed picture about the state of the liver. The distended abdominal wall veins, thrombocytopenia, and splenomegaly are commonly observed in advanced cirrhosis, but these findings reflect the associated portal hypertension and not the liver disease itself. The normal bilirubin and INR suggest preserved liver function and decrease the likelihood of cirrhosis being responsible for the portal hypertension. However, the elevated alkaline phosphatase and GGT levels suggest an infiltrative liver disease, such as lymphoma, sarcoidosis, or amyloidosis.
Furthermore, while a nodular liver on imaging is consistent with cirrhosis, no steatosis was noted to support the presumed diagnosis of NAFLD. One explanation for this discrepancy is that fatty infiltration may be absent when NAFLD-associated cirrhosis develops. In summary, there is evidence of liver disease, and there is evidence of portal hypertension, but there is no evidence of liver parenchymal failure. The key features of the latter – spider angiomata, palmar erythema, hyperbilirubinemia, and coagulopathy – are absent.
Noncirrhotic portal hypertension (NCPH) is an alternative explanation for the patient’s findings. NCPH is an elevation in the portal venous system pressure that arises from intrahepatic (but noncirrhotic) disease or from extrahepatic disease. Hepatic schistosomiasis is an example of intrahepatic but noncirrhotic portal hypertension. PVT that arises on account of a hypercoagulable condition (eg, abdominal malignancy, pancreatitis, or myeloproliferative disorders) is a prototype of extrahepatic NCPH. At this point, it is impossible to know if the PVT is a complication of NCPH or a cause of NCPH. PVT as a complication of cirrhosis is less likely.
An abdominal CT scan would better assess the hepatic parenchyma and exclude abdominal malignancies such as pancreatic adenocarcinoma. An echocardiogram is indicated to evaluate the cause of the elevated jugular venous pressure. A liver biopsy and measurement of portal venous pressure would help distinguish between cirrhotic and noncirrhotic portal hypertension.
Hepatitis A, B, and C serologies were negative as were antinuclear and antimitochondrial antibodies. Ferritin and ceruloplasmin levels were normal. A CT scan of the abdomen with contrast demonstrated a nodular liver contour, splenomegaly, and a nonocclusive PVT (Figure 1). A transthoracic echocardiogram showed normal biventricular systolic function and size, normal diastolic function, a pulmonary artery systolic pressure of 57 mmHg (normal, < 25), moderate tricuspid regurgitation, and no pericardial effusion or thickening. The patient’s confusion and somnolence resolved after two days of lactulose therapy. She denied the use of other medications, supplements, or herbs.
Pulmonary hypertension is usually a consequence of cardiopulmonary disease, but there is no exam or imaging evidence for left ventricular failure, mitral stenosis, obstructive lung disease, or interstitial lung disease. Portopulmonary hypertension (a form of pulmonary hypertension) can develop as a consequence of end-stage liver disease. The most common cause of hepatic encephalopathy due to portosystemic shunting is cirrhosis, but such shunting also arises in NCPH.
Schistosomiasis is the most common cause of NCPH worldwide. Parasite eggs trapped within the terminal portal venules cause inflammation, leading to fibrosis and intrahepatic portal hypertension. The liver becomes nodular on account of these changes, but the overall hepatic function is typically preserved. Portal hypertension, variceal bleeding, and pulmonary hypertension are common complications. The latter can arise from portosystemic shunting, which leads to embolization of schistosome eggs into the pulmonary circulation, where a granulomatous reaction ensues.
A percutaneous liver biopsy showed granulomatous inflammation and dilated portal venules consistent with increased resistance to venous inflow (Figure 2). There was no sinusoidal congestion to indicate impaired hepatic venous outflow. Mild sinusoidal and portal fibrosis and increased iron in Kupffer cells were noted. There was no evidence of cirrhosis or steatohepatitis. Stains for acid-fast bacilli and fungi were negative. 16S rDNA (a test assessing for bacterial DNA) and Mycobacterium tuberculosis polymerase chain reactions were negative. The biopsy confirmed the diagnosis of noncirrhotic portal hypertension.
Hepatic granulomas can arise from infectious, immunologic, toxic, and malignant diseases. In the United States, immunologic disorders, such as sarcoidosis and primary biliary cholangitis, are the most common causes of granulomatous hepatitis. The patient lacks extrahepatic features of the former. The absence of bile duct injury and negative antimitochondrial antibody exclude the latter. None of the listed medications are commonly associated with hepatic granulomas. The ultrasound, CT scan, and biopsy did not reveal a granulomatous malignancy such as lymphoma.
Infections, such as brucellosis, Q fever, and tuberculosis, are common causes of granulomatous hepatitis in the developing world. Tuberculosis is prevalent in China, but the test results do not support tuberculosis as a unifying diagnosis.
Schistosomiasis accounts for the major clinical features (portal and pulmonary hypertension and preserved liver function) and hepatic pathology (ie, portal venous fibrosis with granulomatous inflammation) in this case and is prevalent in China, where the patient emigrated from. The biopsy specimen should be re-examined for schistosome eggs and serologic tests for schistosomiasis pursued.
Antibodies to human immunodeficiency virus, Brucella, Bartonella quintana, Bartonella henselae, Coxiella burnetii, Francisella tularensis, and Histoplasma were negative. Cryptococcal antigen and rapid plasma reagin were negative. IgG antibodies to Schistosoma were 0.21 units (normal, < 0.19 units). Based on the patient’s epidemiology, biopsy findings, and serology results, hepatic schistosomiasis was diagnosed. Praziquantel was prescribed. She continues to receive daily lactulose and rifaximin and has not had any episodes of encephalopathy in the year after discharge.
COMMENTARY
Portal hypertension arises when there is resistance to flow in the portal venous system. It is defined as a pressure gradient greater than 5 mmHg between the portal vein and the intra-abdominal portion of the inferior vena cava.1 Clinicians are familiar with the manifestations of portal hypertension – portosystemic shunting leading to encephalopathy and variceal hemorrhage, ascites, and splenomegaly with thrombocytopenia – because of their close association with cirrhosis. In developed countries, cirrhosis accounts for over 90% of cases of portal hypertension.1 In the remaining 10%, conditions such as portal vein thrombosis primarily affect the portal vasculature and increase resistance to portal blood flow while leaving hepatic synthetic function relatively spared (Figure 3). Therefore, cirrhosis cannot be inferred with certainty from signs of portal hypertension alone.
Liver biopsy is the gold standard for the diagnosis of cirrhosis, but this method is increasingly being replaced by noninvasive assessments of liver fibrosis, including imaging and scoring systems.2 Clinicians often infer cirrhosis from the combination of a known cause of liver injury, abnormal liver biochemical tests, evidence of liver dysfunction, and signs of portal hypertension.3 However, when signs of portal hypertension are present, but liver dysfunction cannot be established on physical exam (eg, palmar erythema, spider nevi, gynecomastia, and testicular atrophy) or laboratory testing (eg, low albumin, elevated INR, and elevated bilirubin), noncirrhotic causes of portal hypertension should be considered. In this case, the biopsy showed vascular changes that suggested impaired venous inflow without bridging fibrosis, which pointed to NCPH.
NCPH is categorized based on the location of resistance to blood flow: prehepatic (eg, portal vein thrombosis), intrahepatic (eg, schistosomiasis), and posthepatic (eg, right-sided heart failure).1 In our patient, the dilated portal venules (inflow) in the presence of normal hepatic vein outflow suggested an increased intrahepatic resistance to blood flow. This finding excluded a causal role of the portal vein thrombosis and prompted testing for schistosomiasis.
Schistosomiasis affects more than 200 million people worldwide and is prevalent in Sub-Saharan Africa, South America, Egypt, China, and Southeast Asia.4,5 Transmission occurs in fresh water, where the infectious form of the parasite is released from snails.4,6 Schistosome worms are not found in the United States, but as a result of immigration and travel, more than 400,000 people in the United States are estimated to be infected.5
Chronic schistosomiasis develops from the host’s granulomatous reaction to schistosome eggs whose location (depending on the species) leads to genitourinary, intestinal, hepatic, or rarely, neurologic disease.6 Hepatic schistosomiasis arises when eggs released in the portal venous system lodge in small portal venules and cause granulomatous inflammation, periportal fibrosis, and microvascular obstruction.6 The resultant portal hypertension develops insidiously, but the architecture and synthetic function of the liver is maintained until the very late stages of disease.6,7 Pulmonary hypertension can arise from the embolization of eggs to the pulmonary arterioles via portosystemic collaterals.
The demonstration of eggs in stool is the gold standard for the diagnosis of hepatic schistosomiasis, which is most commonly caused by Schistosoma mansoni and S. japonicum.7 Serologic assays provide evidence of infection or exposure but may cross-react with other helminths. Liver biopsy may reveal characteristic histopathologic findings, including granulomatous inflammation, distorted vasculature, and the deposition of collagen deposits in the periportal space, leading to “pipestem fibrosis.”8,9 If eggs cannot be detected on stool or histology, then serology, secondary histologic changes, and sometimes PCR are used to diagnose hepatic schistosomiasis. In our patient, the epidemiology, Schistosoma antibody titer, pulmonary hypertension, and liver biopsy with granulomatous inflammation, periportal fibrosis, and intrahepatic portal venule dilation were diagnostic of hepatic schistosomiasis.
The recurrent episodes of confusion which resolved with lactulose therapy were suggestive of hepatic encephalopathy, which results from shunting and accumulation of neurotoxic substances that would otherwise undergo hepatic metabolism.10 Clinicians are most familiar with hepatic encephalopathy in cirrhosis, where multiple liver functions – synthesis, excretion, metabolism, and circulation – simultaneously fail. NCPH represents a scenario where only the circulation is impaired, but this is sufficient to cause the portosystemic shunting that leads to encephalopathy. Our patient’s recurrent hepatic encephalopathy, despite adherence to lactulose and rifaximin and its resolution after praziquantel treatment, underscores the importance of addressing the underlying cause of portosystemic shunting.Associating portal hypertension with cirrhosis is efficient and accurate in many cases. However, when specific manifestations of cirrhosis are lacking, clinicians must decouple this association and pursue an alternative explanation for portal hypertension. The presence of some intrahepatic pathology (from schistosomiasis) but no cirrhosis made this case a particularly tough egg to crack.
Teaching Points
- In the developed world, 90% of portal hypertension is due to cirrhosis. Hepatic schistosomiasis is the most common cause of NCPH worldwide.
- Chronic schistosomiasis affects the gastrointestinal, hepatic, and genitourinary systems and causes significant global morbidity and mortality.
- Visualization of schistosome eggs is the diagnostic gold standard. Indirect testing such as schistosoma antibodies and secondary histologic changes may be required for the diagnosis in patients with a low burden of eggs.
Disclosures
Dr. Geha has no disclosures. Dr. Dhaliwal reports receiving honoraria from ISMIE Mutual Insurance Company and Physicians’ Reciprocal Insurers. Dr. Peters’ spouse is employed by Hoffman-La Roche. Dr. Manesh is supported by the Jeremiah A. Barondess Fellowship in the Clinical Transaction of the New York Academy of Medicine, in collaboration with the Accreditation Council for Graduate Medical Education (ACGME).
1. Sarin SK, Khanna R. Non-cirrhotic portal hypertension. Clin Liver Dis. 2014;18(2):451-76. doi: 10.1016/j.cld.2014.01.009. PubMed
2. Tapper EB, Lok AS. Use of liver imaging and biopsy in clinical practice. N Engl J Med. 2017;377(8):756-768. doi: 10.1056/NEJMra1610570. PubMed
3. Udell JA, Wang CS, Tinmouth J, et al. Does this patient with liver disease have cirrhosis? JAMA. 2012;307(8):832-42. doi: 10.1001/jama.2012.186. PubMed
4. Centers for Disease Control and Prevention. Parasites–Schistosomiasis. https://www.cdc.gov/parasites/schistosomiasis/. Accessed December 2, 2017.
5. Bica I, Hamer DH, Stadecker MJ. Hepatic schistosomiasis. Infect Dis Clin N Am. 2000;14(3):583-604. PubMed
6. Ross AG, Bartley PB, Sleigh AC, et al. Schistosomiasis. N Engl J Med. 2002;346(16):1212-20. doi: 10.1056/NEJMra012396. PubMed
7. Gray DJ, Ross AG, Li YS, McManus DP. Diagnosis and management of schistosomiasis. BMJ. 2011;342: 2561-2561. doi: doi.org/10.1136/bmj.d2651. PubMed
8. Manzella A, Ohtomo K, Monzawa S, Lim JH. Schistosomiasis of the liver. Abdom Imaging. 2008;33(2):144-50. doi: 10.1007/s00261-007-9329-7. PubMed
9. Gryseels B, Polman K, Clerinx J, Kestens L. Human schistosomiasis. Lancet. 2006;368(9541):1106-18. doi: 10.1016/S0140-6736(06)69440-3. PubMed
10. Blei AT, Córdoba J. Practice Parameters Committee of the American College of Gastroenterology. Hepatic encephalopathy. Am J Gastroenterol. 2001;96(7):1968. doi: 10.1111/j.1572-0241.2001.03964.x. PubMed
© 2018 Society of Hospital Medicine
Relative Weights for Pediatric Inpatients: Children Now Have a Scale of Their Own
For the last 35 years, Medicare’s prospective payment system has transformed reimbursement for hospital-based care of patients. This “revolutionary” system shifted payment from being retrospective—the government paid hospitals for what they did—to prospective—the government paid hospitals against a predetermined fee schedule based on a patient’s condition and other factors.1 When the system started in 1983, the then-new payment system classified patients into 467 Diagnosis-Related Groups (DRGs). In those early days, Medicare paid hospitals “an average price for an average patient within the DRG.”2 Not surprisingly, early critics were concerned that this average payment would disadvantage hospitals that cared for more complex patients, such as teaching hospitals; studies then demonstrated that theoretical concern.3 The Severity of Illness (SOI) index, which was developed in the 1980s, attempted to correct this problem by using SOI-stratified DRGs as a payment mechanism. By adding SOI to DRGs, the homogeneity of resource consumption in each group increased, resulting in more accurate comparisons about complexity, outcomes, resource utilization, and ultimately payment. Eventually, along with the risk of mortality, the SOI made its way into the All Patients Refined (APR) DRG system, which is more representative of non-Medicare populations and thus could be applied to children.
The ongoing challenge with SOI classification is that its 4-level categories (1-mild, 2-moderate, 3-severe, 4-extreme) is not comparable across DRGs; that is, a “moderate” patient in one DRG may be sicker and use more resources than an “extreme” patient in another DRG. For this reason, more than a decade ago, Medicare replaced the DRG/SOI approach with the Medicare Severity (MS)-DRG for Medicare payments to hospitals. The distinguishing feature of MS-DRGs is that they represent a complete relative scale; the relative weights are not categorical but can be lined up and payments assigned relative to the average Medicare patient. For example, a look at the 2015 tables shows that heart transplant has the highest relative weight and is the most expensive one, whereas false labor has the lowest relative weight and is the least expensive.4 Due to its exclusive intent for use on Medicare patients, the system could not be used for pediatrics. Interestingly, New York State developed a Service Intensity Weight (SIW) in 2009 by using 3 years of Medicaid and commercial payer data to create a relative scale for payment within the state.5
Thanks to Richardson, et al, in this issue of Journal of Hospital Medicine, pediatrics has its first relative weight system for hospitalized children across the United States.6 Similar to the MS-DRG system, those with the interest or need can line up the APR-DRGs into a relative scale and see that a normal newborn has a relative weight on their H-RISK scale of 0.18, while a heart transplant patient has a weight of 91.66. This is a welcome and much-needed addition to the world of pediatric health services and health service research. Stakeholders can use this system for comparative analyses, risk adjustment, resource utilization comparison, and payment. For those inclined, one can explore the comparisons of relative weights on different scales; for example, the ratio between simple pneumonia and heart transplant is 21 on the MS-DRG, 60 on the NY State SIW scale,7 and 187 on H-RISK. A generation of health service researchers and economists may find great satisfaction in elucidating why this relativity in relative scales exists!
There are limitations to all weighting and relative weighting systems. The H-RISK is based on DRG and SOI, which rely on accurate coding. In addition, as the authors note, iatrogenic complications are not differentiated from naturally occurring ones. Thus, a hospital may obtain a higher relative weight applied to a patient who did not enter the hospital as sick as the final score suggests. Researchers noted this problem from the start of the DRG/SOI journey, and all systems that rely on post hoc scoring based on coded diagnoses and activities, without differentiation of presence on admission, have this limitation.8 Furthermore, children’s hospitals have far more variable use of observation status than in Medicare, and many DRG analyses exclude observation-status patients.
Despite these limitations, this is an important first step for children’s hospitals to be better able to do comparative analyses and benchmarking with a true relative weight scale that is appropriate for use among hospitalized children.
Disclosure
The author declares no conflicts of interest.
1. Mayes R. The origins, development, and passage of Medicare’s revolutionary prospective payment system. J Hist Med Allied Sci. 2007;62(1):21-55. DOI: 10.1093/jhmas/jrj038. PubMed
2. Iglehart JK. Medicare begins prospective payment of hospitals. N Engl J Med. 1983;303(23):1428-1432. DOI: 10.1056/NEJM198306093082331. PubMed
3. Horn SD, Sharkey PD, Chambers AF, Horn RA. Severity of illness within DRGs: impact on prospective payment. Am J Public Health. 1985;75(10):1195-1199. PMCID: PMC1646367 PubMed
4. Inpatient Charge Data FY2015, https://www.cms.gov/Research-Statistics-Data-and-Systems/Statistics-Trends-and-Reports/Medicare-Provider-Charge-Data/Inpatient2015.html. Accessed February 20, 2018.
5. Service Intensity Weights (SIW) and average length-of-stay (LOS). https://regs.health.ny.gov/content/section-86-118-service-intensity-weights-siw-and-average-length-stay-los. Accessed February 22, 2018.
6. Richardson T, Rodean J, Harris M, Berry J, Gay JC, Hall M. Development of hospitalization resource intensity scores for kids (H-RISK) and comparison across pediatric populations. J Hosp Med. 2018;13(9); 602-608. doi: 10.12788/jhm.2948 PubMed
7. APR-DRG Service Intensity Weights and Average Length of Stay, July 1, 2014. Department of Health, New York State. https://www.health.ny.gov/facilities/hospital/reimbursement/apr-drg/weights/siw_alos_2014.htm. Accessed February 20, 2018.
8. Horn SD, Horn RA, Sharkey PD. The severity of illness index as a severity adjustment to diagnosis-related groups. Health Care Financ Rev. 1984;(Suppl):33-45. PubMed
For the last 35 years, Medicare’s prospective payment system has transformed reimbursement for hospital-based care of patients. This “revolutionary” system shifted payment from being retrospective—the government paid hospitals for what they did—to prospective—the government paid hospitals against a predetermined fee schedule based on a patient’s condition and other factors.1 When the system started in 1983, the then-new payment system classified patients into 467 Diagnosis-Related Groups (DRGs). In those early days, Medicare paid hospitals “an average price for an average patient within the DRG.”2 Not surprisingly, early critics were concerned that this average payment would disadvantage hospitals that cared for more complex patients, such as teaching hospitals; studies then demonstrated that theoretical concern.3 The Severity of Illness (SOI) index, which was developed in the 1980s, attempted to correct this problem by using SOI-stratified DRGs as a payment mechanism. By adding SOI to DRGs, the homogeneity of resource consumption in each group increased, resulting in more accurate comparisons about complexity, outcomes, resource utilization, and ultimately payment. Eventually, along with the risk of mortality, the SOI made its way into the All Patients Refined (APR) DRG system, which is more representative of non-Medicare populations and thus could be applied to children.
The ongoing challenge with SOI classification is that its 4-level categories (1-mild, 2-moderate, 3-severe, 4-extreme) is not comparable across DRGs; that is, a “moderate” patient in one DRG may be sicker and use more resources than an “extreme” patient in another DRG. For this reason, more than a decade ago, Medicare replaced the DRG/SOI approach with the Medicare Severity (MS)-DRG for Medicare payments to hospitals. The distinguishing feature of MS-DRGs is that they represent a complete relative scale; the relative weights are not categorical but can be lined up and payments assigned relative to the average Medicare patient. For example, a look at the 2015 tables shows that heart transplant has the highest relative weight and is the most expensive one, whereas false labor has the lowest relative weight and is the least expensive.4 Due to its exclusive intent for use on Medicare patients, the system could not be used for pediatrics. Interestingly, New York State developed a Service Intensity Weight (SIW) in 2009 by using 3 years of Medicaid and commercial payer data to create a relative scale for payment within the state.5
Thanks to Richardson, et al, in this issue of Journal of Hospital Medicine, pediatrics has its first relative weight system for hospitalized children across the United States.6 Similar to the MS-DRG system, those with the interest or need can line up the APR-DRGs into a relative scale and see that a normal newborn has a relative weight on their H-RISK scale of 0.18, while a heart transplant patient has a weight of 91.66. This is a welcome and much-needed addition to the world of pediatric health services and health service research. Stakeholders can use this system for comparative analyses, risk adjustment, resource utilization comparison, and payment. For those inclined, one can explore the comparisons of relative weights on different scales; for example, the ratio between simple pneumonia and heart transplant is 21 on the MS-DRG, 60 on the NY State SIW scale,7 and 187 on H-RISK. A generation of health service researchers and economists may find great satisfaction in elucidating why this relativity in relative scales exists!
There are limitations to all weighting and relative weighting systems. The H-RISK is based on DRG and SOI, which rely on accurate coding. In addition, as the authors note, iatrogenic complications are not differentiated from naturally occurring ones. Thus, a hospital may obtain a higher relative weight applied to a patient who did not enter the hospital as sick as the final score suggests. Researchers noted this problem from the start of the DRG/SOI journey, and all systems that rely on post hoc scoring based on coded diagnoses and activities, without differentiation of presence on admission, have this limitation.8 Furthermore, children’s hospitals have far more variable use of observation status than in Medicare, and many DRG analyses exclude observation-status patients.
Despite these limitations, this is an important first step for children’s hospitals to be better able to do comparative analyses and benchmarking with a true relative weight scale that is appropriate for use among hospitalized children.
Disclosure
The author declares no conflicts of interest.
1. Mayes R. The origins, development, and passage of Medicare’s revolutionary prospective payment system. J Hist Med Allied Sci. 2007;62(1):21-55. DOI: 10.1093/jhmas/jrj038. PubMed
2. Iglehart JK. Medicare begins prospective payment of hospitals. N Engl J Med. 1983;303(23):1428-1432. DOI: 10.1056/NEJM198306093082331. PubMed
3. Horn SD, Sharkey PD, Chambers AF, Horn RA. Severity of illness within DRGs: impact on prospective payment. Am J Public Health. 1985;75(10):1195-1199. PMCID: PMC1646367 PubMed
4. Inpatient Charge Data FY2015, https://www.cms.gov/Research-Statistics-Data-and-Systems/Statistics-Trends-and-Reports/Medicare-Provider-Charge-Data/Inpatient2015.html. Accessed February 20, 2018.
5. Service Intensity Weights (SIW) and average length-of-stay (LOS). https://regs.health.ny.gov/content/section-86-118-service-intensity-weights-siw-and-average-length-stay-los. Accessed February 22, 2018.
6. Richardson T, Rodean J, Harris M, Berry J, Gay JC, Hall M. Development of hospitalization resource intensity scores for kids (H-RISK) and comparison across pediatric populations. J Hosp Med. 2018;13(9); 602-608. doi: 10.12788/jhm.2948 PubMed
7. APR-DRG Service Intensity Weights and Average Length of Stay, July 1, 2014. Department of Health, New York State. https://www.health.ny.gov/facilities/hospital/reimbursement/apr-drg/weights/siw_alos_2014.htm. Accessed February 20, 2018.
8. Horn SD, Horn RA, Sharkey PD. The severity of illness index as a severity adjustment to diagnosis-related groups. Health Care Financ Rev. 1984;(Suppl):33-45. PubMed
© 2018 Society of Hospital Medicine
FYI: This Message Will Interrupt You – Texting Impact on Clinical Learning Environment
Fifteen years ago, beepers with 5-digit call-back numbers were the norm. Pushing a call light button outside the patient’s room to flag the desk clerk that a new order had been hand-written was all part of the lived experience of residency. Using that as our baseline, we have clearly come a long way in the way that we communicate with other clinicians in hospitals. Communication among the patient care team in the digital age predominantly involves bidirectional messaging using mobile devices. The approach is both immediate and convenient. Mobile devices can improve work efficiency, patient safety, and quality of care, but their main advantage may be real-time bedside decision support.1,2 However, the widespread use of mobile devices for communication in healthcare is not without its concerns. First and foremost, there has been abundant literature around short message service (SMS) use in the healthcare setting, and there are concerns surrounding both threats to privacy and the prevalence and impact of interruptions in clinical care.
The first SMS was sent in 1992.3 Text messaging since then has become ubiquitous, even in healthcare, raising concerns around the protection of patient health information under the Health Insurance Portability and Accountability Act (HIPAA). Interestingly, the United States Department of Health and Human Services Office for Civil Rights, enforcer of HIPAA, is tech neutral on the subject.3 Multiple studies have assessed physician stances on SMS communication in the healthcare setting using routine, non-HIPAA-compliant mobile phones. Overall, 60%-80% of respondents admitted to using SMS in patient care, while in another study, 72% and 80% of Internal Medicine residents surveyed found SMS to be the most efficient form of communication and overall preferred method of communication, respectively.3,4 Interestingly, 82.5% of those same residents preferred the hospital-based alphanumeric paging system for security purposes, even though Freundlich et al. make a compelling argument that unidirectional alphanumeric paging systems are most certainly less HIPAA compliant, lacking encryption and password protection.5 Newer platforms that enable HIPAA-compliant messaging are promising, although they may not be fully adopted by clinical teams without full-scale implementation in hospitals.6In addition to privacy concerns with SMS applications on mobile phones, interruptions in healthcare – be it from phone calls, emails, text messages, or in-person conversations – are common. In fact, famed communication researcher Enrico Coeira has notoriously described healthcare communication as ”interrupt-driven.”7 Prior work has shown that frequent interruptions in the healthcare setting can lead to medication prescription errors, errors in computerized physician order entry, and even surgical procedural errors.8-10
While studies have focused on interruptions in clinical care in the healthcare setting, little is known about how education may be compromised by interruptions due to mobile devices. Text messaging during dedicated conference time can lead to inadequate learning and a sense of frustration among residents. In this issue of the Journal of Hospital Medicine, Mendel et al. performed a quality improvement study involving eight academic inpatient clinical training units with the aim of reducing nonurgent text messages during education rounds.11 Their unique interventions included learning sessions, posters, adding alerts to the digital communication platform, and alternative messaging options. Of four sequential interventions, a message alerting the sender that they will be interrupting educational rounds and suggesting a “delayed send” or “send as an FYI” showed the greatest impact, reducing the number of text interruptions per team per educational hour from 0.81 to 0.59 (95% CI 0.51-0.67). When comparing a four-week pre-intervention sample with a four-week end-intervention sample, the percentage of nonurgent messages decreased from 82% to 68% (P < .01).
While these results are promising, challenges to large-scale implementation of such a program exist. Buy-in from the ancillary healthcare team is critical for such interventions to succeed and be sustained. It also places a burden of “point triage” on the healthcare team members, who must assess the patient situation and determine the level of urgency and whether to immediately interrupt, delay interrupt or send an FYI message. For example, in the study by Mendel et al.,11 it is noteworthy that urgent patient care issues were mislabeled as “FYI” in 2% of patients. While this is a seemingly low rate, even one of these mislabeled messages could result in significant adverse patient outcomes and should be considered a “never event.” Finally, the study used a messaging platform with programming flexibility and IT personnel to assist. This could be cost prohibitive for some programs, especially if rolled out to an entire institution.
Communication is critical for effective patient care and unfortunately, the timing of such communication is often not orderly but rather, chaotic. Text message communication can introduce interruptions into all aspects of patient care and education, not only dedicated learning conferences. If the goal is for all residents to attend all conferences, it seems impossible (and likely dangerous) to eliminate all messaging interruptions during conference hours. Nevertheless, it is worth noting that Mandel et al. have moved us creatively toward that goal with a multifaceted approach.11 Future work should address more downstream outcomes, such as objective resident learning retention and adverse patient events relative to the number of interruptions per educational hour. If such studies showed improved learning outcomes and fewer adverse patient events, the next step would be to further strengthen and refine their protocol with real-time and scheduled feedback sessions between providers and other patient care team members in addition to the continued search for additional innovative approaches. In addition, combining artificial intelligence or predictive modeling may help us delineate when an interruption is warranted, for example, when a patient is at high clinical risk without intervention. Likewise, human factors research may help us understand the best way to time and execute an interruption to minimize the risk to clinical care or education. After all, the ideal system would not eliminate interruptions entirely but allow clinicians to know when someone should be interrupted and when they do not need to be interrupted.
Disclosures
The authors have no financial relationships relevant to this article to disclose.
1. Berner ES, Houston TK, Ray MN, et al. Improving ambulatory prescribing safety with a handheld decision support system: a ran domized controlled trial. J Am Med Inform Assoc. 2006;13(2):171-179. doi: 10.1197/jamia.M1961. PubMed
2. Sintchenko V, Iredell JR, Gilbert GL, et al. Handheld computer-based decision support reduces patient length of stay and antibiotic prescribing in critical care. J Am Med Inform Assoc. 2005;12(4):398-402. doi: 10.1197/jamia.M1798. PubMed
3. Drolet BC. Text messaging and protected health information: what is permitted? JAMA. 2017;317(23):2369-2370. doi: 10.1001/jama.2017.5646. PubMed
4. Prochaska MT, Bird AN, Chadaga A, Arora VM. Resident use of text messaging for patient care: ease of use or breach of privacy? JMIR Med Inform. 2015;3(4):e37. doi: 10.2196/medinform.4797. PubMed
5. Samora JB, Blazar PE, Lifchez SD, et al. Mobile messaging communication in health care rules, regulations, penalties, and safety of provider use. JBJS Rev. 2018;6(3):e4. doi: 10.2106/JBJS.RVW.17.00070 PubMed
6. Freundlich RE, Freundlich KL, Drolet BC. Pagers, smartphones, and HIPAA: finding the best solution for electronic communication of protected health information. J Med Syst. 2017;42(1):9. doi: 10.1007/s10916-017-0870-9. PubMed
7. Coiera E. Clinical communication—a new informatics paradigm. In Proceedings of the American. Medical Informatics Association Autumn Symposium. 1996;17-21.
8. Feuerbacher RL, Funk KH, Spight DH, et al. Realistic distractions and interruptions that impair simulated surgical performance by novice surgeons. Arch Surg. 2012;147(11):1026-1030. doi: 10.1001/archsurg.2012.1480. PubMed
9. Agency for Healthcare Research and Quality–Patient Safety Network (AHRQ-PSNet). https://psnet.ahrq.gov/webmm/case/257/order-interrupted-by-text-multitasking-mishapCases & Commentaries. Order Interrupted by Text: Multitasking Mishap. December 2011. Commentary by John Halamka, MD, MS.
10. Westbrook JI, Raban MZ, Walter SR, et al. Task errors by emergency physicians are associated with interruptions, multitasking, fatigue and working memory capacity: a prospective, direct observation study [published online ahead of print January 9, 2018]. BMJ Qual Saf. doi: 10.1136/bmjqs-2017-007333. [Epub ahead of print]. PubMed
11. Mendel A, Lott A, Lo L, et al. A matter of urgency: reducing clinical text message interruptions during educational sessions. J Hosp Med. 2018;13(9):616-622. doi: 10.12788/jhm.2959. PubMed
Fifteen years ago, beepers with 5-digit call-back numbers were the norm. Pushing a call light button outside the patient’s room to flag the desk clerk that a new order had been hand-written was all part of the lived experience of residency. Using that as our baseline, we have clearly come a long way in the way that we communicate with other clinicians in hospitals. Communication among the patient care team in the digital age predominantly involves bidirectional messaging using mobile devices. The approach is both immediate and convenient. Mobile devices can improve work efficiency, patient safety, and quality of care, but their main advantage may be real-time bedside decision support.1,2 However, the widespread use of mobile devices for communication in healthcare is not without its concerns. First and foremost, there has been abundant literature around short message service (SMS) use in the healthcare setting, and there are concerns surrounding both threats to privacy and the prevalence and impact of interruptions in clinical care.
The first SMS was sent in 1992.3 Text messaging since then has become ubiquitous, even in healthcare, raising concerns around the protection of patient health information under the Health Insurance Portability and Accountability Act (HIPAA). Interestingly, the United States Department of Health and Human Services Office for Civil Rights, enforcer of HIPAA, is tech neutral on the subject.3 Multiple studies have assessed physician stances on SMS communication in the healthcare setting using routine, non-HIPAA-compliant mobile phones. Overall, 60%-80% of respondents admitted to using SMS in patient care, while in another study, 72% and 80% of Internal Medicine residents surveyed found SMS to be the most efficient form of communication and overall preferred method of communication, respectively.3,4 Interestingly, 82.5% of those same residents preferred the hospital-based alphanumeric paging system for security purposes, even though Freundlich et al. make a compelling argument that unidirectional alphanumeric paging systems are most certainly less HIPAA compliant, lacking encryption and password protection.5 Newer platforms that enable HIPAA-compliant messaging are promising, although they may not be fully adopted by clinical teams without full-scale implementation in hospitals.6In addition to privacy concerns with SMS applications on mobile phones, interruptions in healthcare – be it from phone calls, emails, text messages, or in-person conversations – are common. In fact, famed communication researcher Enrico Coeira has notoriously described healthcare communication as ”interrupt-driven.”7 Prior work has shown that frequent interruptions in the healthcare setting can lead to medication prescription errors, errors in computerized physician order entry, and even surgical procedural errors.8-10
While studies have focused on interruptions in clinical care in the healthcare setting, little is known about how education may be compromised by interruptions due to mobile devices. Text messaging during dedicated conference time can lead to inadequate learning and a sense of frustration among residents. In this issue of the Journal of Hospital Medicine, Mendel et al. performed a quality improvement study involving eight academic inpatient clinical training units with the aim of reducing nonurgent text messages during education rounds.11 Their unique interventions included learning sessions, posters, adding alerts to the digital communication platform, and alternative messaging options. Of four sequential interventions, a message alerting the sender that they will be interrupting educational rounds and suggesting a “delayed send” or “send as an FYI” showed the greatest impact, reducing the number of text interruptions per team per educational hour from 0.81 to 0.59 (95% CI 0.51-0.67). When comparing a four-week pre-intervention sample with a four-week end-intervention sample, the percentage of nonurgent messages decreased from 82% to 68% (P < .01).
While these results are promising, challenges to large-scale implementation of such a program exist. Buy-in from the ancillary healthcare team is critical for such interventions to succeed and be sustained. It also places a burden of “point triage” on the healthcare team members, who must assess the patient situation and determine the level of urgency and whether to immediately interrupt, delay interrupt or send an FYI message. For example, in the study by Mendel et al.,11 it is noteworthy that urgent patient care issues were mislabeled as “FYI” in 2% of patients. While this is a seemingly low rate, even one of these mislabeled messages could result in significant adverse patient outcomes and should be considered a “never event.” Finally, the study used a messaging platform with programming flexibility and IT personnel to assist. This could be cost prohibitive for some programs, especially if rolled out to an entire institution.
Communication is critical for effective patient care and unfortunately, the timing of such communication is often not orderly but rather, chaotic. Text message communication can introduce interruptions into all aspects of patient care and education, not only dedicated learning conferences. If the goal is for all residents to attend all conferences, it seems impossible (and likely dangerous) to eliminate all messaging interruptions during conference hours. Nevertheless, it is worth noting that Mandel et al. have moved us creatively toward that goal with a multifaceted approach.11 Future work should address more downstream outcomes, such as objective resident learning retention and adverse patient events relative to the number of interruptions per educational hour. If such studies showed improved learning outcomes and fewer adverse patient events, the next step would be to further strengthen and refine their protocol with real-time and scheduled feedback sessions between providers and other patient care team members in addition to the continued search for additional innovative approaches. In addition, combining artificial intelligence or predictive modeling may help us delineate when an interruption is warranted, for example, when a patient is at high clinical risk without intervention. Likewise, human factors research may help us understand the best way to time and execute an interruption to minimize the risk to clinical care or education. After all, the ideal system would not eliminate interruptions entirely but allow clinicians to know when someone should be interrupted and when they do not need to be interrupted.
Disclosures
The authors have no financial relationships relevant to this article to disclose.
1. Berner ES, Houston TK, Ray MN, et al. Improving ambulatory prescribing safety with a handheld decision support system: a ran domized controlled trial. J Am Med Inform Assoc. 2006;13(2):171-179. doi: 10.1197/jamia.M1961. PubMed
2. Sintchenko V, Iredell JR, Gilbert GL, et al. Handheld computer-based decision support reduces patient length of stay and antibiotic prescribing in critical care. J Am Med Inform Assoc. 2005;12(4):398-402. doi: 10.1197/jamia.M1798. PubMed
3. Drolet BC. Text messaging and protected health information: what is permitted? JAMA. 2017;317(23):2369-2370. doi: 10.1001/jama.2017.5646. PubMed
4. Prochaska MT, Bird AN, Chadaga A, Arora VM. Resident use of text messaging for patient care: ease of use or breach of privacy? JMIR Med Inform. 2015;3(4):e37. doi: 10.2196/medinform.4797. PubMed
5. Samora JB, Blazar PE, Lifchez SD, et al. Mobile messaging communication in health care rules, regulations, penalties, and safety of provider use. JBJS Rev. 2018;6(3):e4. doi: 10.2106/JBJS.RVW.17.00070 PubMed
6. Freundlich RE, Freundlich KL, Drolet BC. Pagers, smartphones, and HIPAA: finding the best solution for electronic communication of protected health information. J Med Syst. 2017;42(1):9. doi: 10.1007/s10916-017-0870-9. PubMed
7. Coiera E. Clinical communication—a new informatics paradigm. In Proceedings of the American. Medical Informatics Association Autumn Symposium. 1996;17-21.
8. Feuerbacher RL, Funk KH, Spight DH, et al. Realistic distractions and interruptions that impair simulated surgical performance by novice surgeons. Arch Surg. 2012;147(11):1026-1030. doi: 10.1001/archsurg.2012.1480. PubMed
9. Agency for Healthcare Research and Quality–Patient Safety Network (AHRQ-PSNet). https://psnet.ahrq.gov/webmm/case/257/order-interrupted-by-text-multitasking-mishapCases & Commentaries. Order Interrupted by Text: Multitasking Mishap. December 2011. Commentary by John Halamka, MD, MS.
10. Westbrook JI, Raban MZ, Walter SR, et al. Task errors by emergency physicians are associated with interruptions, multitasking, fatigue and working memory capacity: a prospective, direct observation study [published online ahead of print January 9, 2018]. BMJ Qual Saf. doi: 10.1136/bmjqs-2017-007333. [Epub ahead of print]. PubMed
11. Mendel A, Lott A, Lo L, et al. A matter of urgency: reducing clinical text message interruptions during educational sessions. J Hosp Med. 2018;13(9):616-622. doi: 10.12788/jhm.2959. PubMed
© 2018 Society of Hospital Medicine
It Is What It Is…. For Now.
This issue of the Journal of Hospital Medicine addresses an emerging trend in internal medicine graduate medical education: the hospitalist rotation.
In the article, Training Residents in Hospital Medicine: The Hospitalist Elective National Survey (HENS). by Ludwin et al., the authors present a descriptive overview of the composition of hospital medicine rotations, as described by program directors from some of the largest training programs. 1 It can be said for sure that hospital medicine rotations exist: half of the 82 programs that replied to the survey noted that a hospital medicine rotation was already in place. That is where the certainty ends. Although there are common themes across these rotations, there is no one clear definition of such a rotation. Like all good contributions to the medical literature, this study inspires more questions than it answers.
The Mark Twain-inspired cynic would be quick to make an interpretation of the hospital medicine rotation: Is this not just a clever way to coax residents into using their elective time to cover the service needs left over from Accreditation Council for Graduate Medical Education (ACGME)-mandated shift limits and admission caps? Seventy-one percent of these rotations were involved in “admitting new patients.” And since forty-six percent were tasked with taking hold-over admissions, it is reasonable to surmise that these rotations are playing a role in covering patient care duties left over from traditional ward services.
But is there anything wrong with that? Within the confines of reasonable intensity, caring for more patients usually benefits a resident’s education. And if the resident is learning knowledge, skills and attitudes that are unique from those that are acquired on a traditional ward service, painting the fence for free might not be that bad. The question is: “Does the hospitalist rotation help in the acquisition of those unique knowledge, skills and attitudes?” Although this study alludes to such unique components via its qualitative analysis (ie, more autonomy, co-management of non-medicine services, etc.), it does not fully answer that question. It does, however, inspire the next study: How do residents perceive the unique and additional value (if any) of the hospital medicine rotation?
For the sake of argument, let’s say that residents’ perception of the hospital medicine rotation is one of meaning and value. Does that matter? It is great if they do, but equally important is the question of whether or not hospital medicine rotations are effective in preparing resident graduates for a career in hospital medicine. This study suggests that those who have designed these rotations have tried to anticipate and address this need. Components such as quality, patient safety, co-management, and billing and compliance are all clearly a part of a hospitalist’s practice, and all are elements that have not been traditionally emphasized in residency training. The question is: ”Are these elements the knowledge, skills and attitudes that are most lacking in the residency graduate as he/she enters the practice of hospital medicine?” The unfortunate answer is that we do not know for sure, and this uncertainty has been the Achilles heel of our current residency-training infrastructure. Not unique to hospital medicine, there is simply not a well-defined feedback loop between practice requirements and residency training requirements. A structured and regular gap analysis comparing the residents’ areas of competence at the end of training to what they need in practice, would go a long way in answering questions such as this one, and would most certainly inform the components of a hospital medicine elective going forward.
Even if the components of a hospital medicine rotation are valuable, and even if they do align with what the practice needs, there is still the question of whether a month-long hospital medicine rotation can even come close to closing the gap of what is needed versus what is delivered. One can surmise that the answer to that question is what has extended the “hospital medicine rotation” to the “hospital medicine track,” comprised of a multiple of such rotations. Like all discussions on time-constrained medical education curricula, what will be discarded to make room for these rotations? In thirty-six months of training, there is opportunity cost: every month spent on a hospital medicine elective is a month that could have been spent on something else (rheumatology, nephrology, etc.). Again, this is not unique to hospital medicine; the same could be said of the resident who does too many cardiology electives at the exclusion of learning about endocrinology. It would be overly dramatic to say that devoting a month to a hospital medicine rotation, or any elective for that matter, meaningfully compromises the resident’s overall competence as an internist. It is, instead, a question of degree: an excessive number of these electives would likely compromise the resident’s overall competence. The likelihood of this happening is proportional to the size of the gap between what is required to effectively enter hospital medicine practice and what can be delivered in a month-long hospital medicine rotation. We return, then, to the question: How much hospital medicine training in residency would be required to fully prepare a resident for the current practice of a hospitalist?
Whatever the answer might be, that question takes us to a difficult dilemma that has lurked in the background of residency training for some time now; one that is not at all unique to hospital medicine. Should residency training be “voc-tech” or “liberal arts”? A purist would argue that an understanding and appreciation of all things not hospital medicine is what truly makes for the great hospitalist. An understanding of primary care, for example, would seem to optimize a hospitalist’s performance with respect to transitions of care. Adding to the gravity of such an argument is that residency might be the last time to acquire such “non-hospital-medicine” experiences.
Noting that the practice of hospital medicine being so dynamic and heterogeneous, the realist might pile on by saying that it is simply impossible to fully prepare a resident for the actual practice of hospital medicine. Further, many of these skills might be impossible to fully master outside of being fully immersed in the practice of hospital medicine (i.e., billing and coding). The best that can be done is to set a solid foundation that would enable them to learn further as they practice; there will be opportunities to learn the specific components of the field later on.
On the other hand, it is hard to justify residency training if the graduate is unprepared to practice, and without the fundamental knowledge, skills and attitudes specific to their career as they practice. For example, it is reasonable to suspect that a new hospitalist who has had no prior training in quality improvement will, because of the inertia that comes with engaging in any new and foreign skill, find it much harder to engage in quality improvement as a part of her career. It is also worth considering the role that mastery, autonomy and purpose have upon the overall residency experience. Engaging in electives that have a palpable purpose for the resident’s eventual career, and engender an opportunity to begin developing a sense of mastery in that field, could be an effective antidote in mitigating the burn-out that is far too common in residency training today.
For residents engaged in a future practice of hospital medicine, the hospital medicine rotation seems like a promising way out of this dilemma. An effectively designed elective approach could enable maintaining a core foundational education, while getting an early start on the specific components necessary for a promising career in hospital medicine. The operative words, of course, are “effectively designed.” What exactly does that entail? That is why this study is so important; even if we do not fully know what it should look like, we now have our first glimpse of what it is.
Disclosures
The author has nothing to disclose.
1. Ludwin S, Harrison J, Ranji S, et al. Training Residents in Hospital Medicine: The Hospitalist Elective National Survey (HENS). J Hosp Med. 2018;13(9):623-625. doi: 10.12788/jhm.2952. PubMed
This issue of the Journal of Hospital Medicine addresses an emerging trend in internal medicine graduate medical education: the hospitalist rotation.
In the article, Training Residents in Hospital Medicine: The Hospitalist Elective National Survey (HENS). by Ludwin et al., the authors present a descriptive overview of the composition of hospital medicine rotations, as described by program directors from some of the largest training programs. 1 It can be said for sure that hospital medicine rotations exist: half of the 82 programs that replied to the survey noted that a hospital medicine rotation was already in place. That is where the certainty ends. Although there are common themes across these rotations, there is no one clear definition of such a rotation. Like all good contributions to the medical literature, this study inspires more questions than it answers.
The Mark Twain-inspired cynic would be quick to make an interpretation of the hospital medicine rotation: Is this not just a clever way to coax residents into using their elective time to cover the service needs left over from Accreditation Council for Graduate Medical Education (ACGME)-mandated shift limits and admission caps? Seventy-one percent of these rotations were involved in “admitting new patients.” And since forty-six percent were tasked with taking hold-over admissions, it is reasonable to surmise that these rotations are playing a role in covering patient care duties left over from traditional ward services.
But is there anything wrong with that? Within the confines of reasonable intensity, caring for more patients usually benefits a resident’s education. And if the resident is learning knowledge, skills and attitudes that are unique from those that are acquired on a traditional ward service, painting the fence for free might not be that bad. The question is: “Does the hospitalist rotation help in the acquisition of those unique knowledge, skills and attitudes?” Although this study alludes to such unique components via its qualitative analysis (ie, more autonomy, co-management of non-medicine services, etc.), it does not fully answer that question. It does, however, inspire the next study: How do residents perceive the unique and additional value (if any) of the hospital medicine rotation?
For the sake of argument, let’s say that residents’ perception of the hospital medicine rotation is one of meaning and value. Does that matter? It is great if they do, but equally important is the question of whether or not hospital medicine rotations are effective in preparing resident graduates for a career in hospital medicine. This study suggests that those who have designed these rotations have tried to anticipate and address this need. Components such as quality, patient safety, co-management, and billing and compliance are all clearly a part of a hospitalist’s practice, and all are elements that have not been traditionally emphasized in residency training. The question is: ”Are these elements the knowledge, skills and attitudes that are most lacking in the residency graduate as he/she enters the practice of hospital medicine?” The unfortunate answer is that we do not know for sure, and this uncertainty has been the Achilles heel of our current residency-training infrastructure. Not unique to hospital medicine, there is simply not a well-defined feedback loop between practice requirements and residency training requirements. A structured and regular gap analysis comparing the residents’ areas of competence at the end of training to what they need in practice, would go a long way in answering questions such as this one, and would most certainly inform the components of a hospital medicine elective going forward.
Even if the components of a hospital medicine rotation are valuable, and even if they do align with what the practice needs, there is still the question of whether a month-long hospital medicine rotation can even come close to closing the gap of what is needed versus what is delivered. One can surmise that the answer to that question is what has extended the “hospital medicine rotation” to the “hospital medicine track,” comprised of a multiple of such rotations. Like all discussions on time-constrained medical education curricula, what will be discarded to make room for these rotations? In thirty-six months of training, there is opportunity cost: every month spent on a hospital medicine elective is a month that could have been spent on something else (rheumatology, nephrology, etc.). Again, this is not unique to hospital medicine; the same could be said of the resident who does too many cardiology electives at the exclusion of learning about endocrinology. It would be overly dramatic to say that devoting a month to a hospital medicine rotation, or any elective for that matter, meaningfully compromises the resident’s overall competence as an internist. It is, instead, a question of degree: an excessive number of these electives would likely compromise the resident’s overall competence. The likelihood of this happening is proportional to the size of the gap between what is required to effectively enter hospital medicine practice and what can be delivered in a month-long hospital medicine rotation. We return, then, to the question: How much hospital medicine training in residency would be required to fully prepare a resident for the current practice of a hospitalist?
Whatever the answer might be, that question takes us to a difficult dilemma that has lurked in the background of residency training for some time now; one that is not at all unique to hospital medicine. Should residency training be “voc-tech” or “liberal arts”? A purist would argue that an understanding and appreciation of all things not hospital medicine is what truly makes for the great hospitalist. An understanding of primary care, for example, would seem to optimize a hospitalist’s performance with respect to transitions of care. Adding to the gravity of such an argument is that residency might be the last time to acquire such “non-hospital-medicine” experiences.
Noting that the practice of hospital medicine being so dynamic and heterogeneous, the realist might pile on by saying that it is simply impossible to fully prepare a resident for the actual practice of hospital medicine. Further, many of these skills might be impossible to fully master outside of being fully immersed in the practice of hospital medicine (i.e., billing and coding). The best that can be done is to set a solid foundation that would enable them to learn further as they practice; there will be opportunities to learn the specific components of the field later on.
On the other hand, it is hard to justify residency training if the graduate is unprepared to practice, and without the fundamental knowledge, skills and attitudes specific to their career as they practice. For example, it is reasonable to suspect that a new hospitalist who has had no prior training in quality improvement will, because of the inertia that comes with engaging in any new and foreign skill, find it much harder to engage in quality improvement as a part of her career. It is also worth considering the role that mastery, autonomy and purpose have upon the overall residency experience. Engaging in electives that have a palpable purpose for the resident’s eventual career, and engender an opportunity to begin developing a sense of mastery in that field, could be an effective antidote in mitigating the burn-out that is far too common in residency training today.
For residents engaged in a future practice of hospital medicine, the hospital medicine rotation seems like a promising way out of this dilemma. An effectively designed elective approach could enable maintaining a core foundational education, while getting an early start on the specific components necessary for a promising career in hospital medicine. The operative words, of course, are “effectively designed.” What exactly does that entail? That is why this study is so important; even if we do not fully know what it should look like, we now have our first glimpse of what it is.
Disclosures
The author has nothing to disclose.
1. Ludwin S, Harrison J, Ranji S, et al. Training Residents in Hospital Medicine: The Hospitalist Elective National Survey (HENS). J Hosp Med. 2018;13(9):623-625. doi: 10.12788/jhm.2952. PubMed
1. Ludwin S, Harrison J, Ranji S, et al. Training Residents in Hospital Medicine: The Hospitalist Elective National Survey (HENS). J Hosp Med. 2018;13(9):623-625. doi: 10.12788/jhm.2952. PubMed
© 2018 Society of Hospital Medicine
Healthy Skepticism and Due Process
For more than 75 years, pediatrics has sought sound guidelines for prescribing maintenance intravenous fluid (mIVF) for children. In 1957, Holliday and Segar (H&S)1 introduced a breakthrough method for estimating mIVF needs. Their guidelines for calculating free-water and electrolyte needs for mIVF gained wide-spread acceptance and became the standard of care for decades.
Over the last two decades, awareness has grown around the occurrence of rare, life-threatening hyponatremic conditions, especially hyponatremic encephalopathy, in hospitalized children. Concomitantly, an increasing awareness shows that serum levels of antidiuretic hormone (ADH) are often elevated in sick children and triggered by nonosmotic conditions (pain, vomiting, perioperative state, meningitis, and pulmonary disease). This situation led to heightened concern of clinicians and investigators who assumed that hospitalized patients would exhibit reduced tolerance for hypotonic mIVF the mainstay of the H&S method. The possibility that the H&S method could be a significant contributing factor to the development of hyponatremic encephalopathy in hospitalized children became a research topic. This research speculated that even mildly reduced serum sodium levels might be a marker for the much rarer condition of hyponatremic encephalopathy. A number of hospitalists also switched from quarter-normal to half-normal saline in mIVF.
The substitution of hypotonic fluids with isotonic fluids (eg, 0.9% normal saline or lactated Ringer’s) is the current front-runner alternative to increase sodium delivery. The hypothesis is that the delivery of additional sodium, while maintaining the same H&S method volume/rate of fluid delivery, will protect against life-threatening hyponatremic events.
The challenge we face is whether we are moving from mIVF therapy, which features a long track record of success and an excellent safety profile, to a safer or more effective therapeutic approach. We should consider the burden of proof which should be satisfied to support creating new guidelines which center on changing from hypotonic mIVF to isotonic mIVF.
Is there sufficient scientific proof that isotonic mIVF is safer and/or more effective than hypotonic mIVF in preventing life-threatening hyponatremic events?
Is there compelling biologic plausibility for this change for patients with risk factors that are associated with elevated serum ADH levels?
What is the magnitude of the benefit?
What is the magnitude of unintended harms?
We offer our perspective on each of these questions.
The primary difficulty with addressing the adverse events of catastrophic hyponatremia (encephalopathy, seizures, cerebral edema, and death) is their rarity. The events stand out when they occur, prompting mortality and morbidity (M&M) conferences to blunder into action. But that action is not evidence-based, even if a rationale mentions a meta-analysis, because the rationales lack estimates of the number needed to treat (NNT) to prevent one catastrophic event. Estimates of the NNT to prevent mild hypernatremia are not useful. Furthermore, estimates of the number needed to harm (NNH) via unintended consequences of infusing extra sodium chloride are unavailable. True evidence-based medicine (EBM) is rigorous in requiring NNT and NNH. Anything less is considered M&M-based medicine masquerading as EBM.
No technical jargon distinguishes the profound and catastrophic events from the common, mild hyponatremia frequently observed in ill toddlers upon admission. As an analogy, in dealing with fever, astute pediatricians recognize that a moderate fever of 103.4 °F is not halfway to a heatstroke of 108 °F. Fever is not a near miss for heatstroke. Physicians do not recommend acetaminophen to prevent heatstroke, although many parents act that way.
No published randomized controlled trials (RCTs) showed the incidence of these catastrophic hyponatremic events. In the meta-analysis of 10 disparate and uncoordinated trials in 2014,2 no serious adverse events were noted among the 1,000 patients involved. Since then, newer RCTs have added another 1,000 patients to the meta-analysis pool, but still no serious adverse event has been observed.
The H&S method features 60 years of proven safety and remains the appropriate estimate when composing long-term parenteral nutrition. No recommendation is perfect for all situations. Many hospitalized children will exhibit an increased level of ADH. A very small fraction of those children will present a sufficiently elevated ADH level long enough to risk creating profound hyponatremia. An approximation is in the order of magnitude of 1 per 100,000 pediatric medical admissions and 1 per 10,000 postoperative patients. With 3 million pediatric admissions yearly in the United States, such numbers mean that large children’s hospitals might see one or two catastrophic adverse events each decade due to mIVF in previously healthy children. The risk in chronically ill children and in the ICU will be higher. The potential for causing unintended greater harm amongst the other millions of patients is high, requiring application of the precautionary principle.
Thus, EBM and RCTs are poor methodologies for quality improvement of this issue. Assigning surrogate measures, such as moderate hyponatremia or even mild hyponatremia, to increase sensitivity and incidence for research purposes lacks a validated scientific link to the much rarer profound hyponatremic events. The resulting nonvalid extrapolation is precisely what true EBM seeks to avoid. A serum sodium of 132 mEq/L is not a near miss. The NNT to prevent the catastrophic events is unknown. Indeed, no paper advocating adoption of isotonic mIVF has even ventured an approximation.
The RCTs are also, therefore, underpowered to identify harms from using normal saline as a maintenance fluid. A few studies mention hypernatremia, but serum sodium is not a statistical variable. Renal physiology predicts that kidneys can easily handle excess infused sodium and can protect against hypernatremia. However, the extra chloride load risks creating hyperchloremic acidosis, particularly when a patient with respiratory insufficiency cannot compensate by lowering pCO2 through increased minute ventilation. Edema is another risk. Both respiratory insufficiency and edema already occur more frequently (by orders of magnitude) in hospitalized patients on any mIVF than the profound hyponatremia events in hospitalized patients on hypotonic mIVF. For instance, about 1% of hospitalized infants with bronchiolitis are ventilated for respiratory failure. If hyperchloremic acidosis unintentionally caused by isotonic mIVF slightly increases the frequency of intubation, then such result far outweighs any benefit from reducing catastrophic hyponatremic events. Difficulty will also arise in detecting this unintended increase in the rate of intubation compared with the current background frequency. Detecting these unintended harms becomes impossible if the RCT is underpowered by 100-fold due to utilizing a surrogate measure, such as serum sodium <135 mEq/L, as the dependent variable instead of measuring serious hyponatremic adverse events.
All claims that “no evidence of harm” was found from using normal saline as mIVF are type II statistical errors. There is little chance of detecting any harm with a grossly underpowered study or a meta-analysis of 10 such studies. Simply put, EBM is impossible to use for events that occur less than 1 per 10,000 patients using RCTs with 1,000 patients. No usable safety data are available for normal saline as mIVF in any published RCT. As the RCTs are underpowered, one should rely on science to guide therapy, rather than on invalid statistics.
Using the precautionary principle, hypothetically, adding extra sodium chloride to maintenance fluids should be considered in the same manner as adding any other drug. Based on the current evidence, would the Food and Drug Administration approve the drug intravenous sodium chloride for the prevention of hyponatremia induced by maintenance fluids? An increasing evidence of a minimal beneficial effect is observed, but no evidence of safety nor physiology is available. A new drug application for using normal saline as a default maintenance fluid would be soundly rejected by an FDA panel, just as it has been rejected by the majority of pediatric hospitalists throughout the past 15 years since the idea was proposed in 2003.
With the lack of compelling statistical evidence to guide practice, clinicians often rely on biologic plausibility. Relatively recent studies have revealed that many sick children develop elevated blood levels of ADH due to nonosmotic and nonhemodynamic triggers. Fortunately, we also possess a strong body of knowledge around management of children with syndrome of inappropriate secretion of antidiuretic hormone (SIADH). We understand that elevated levels of ADH in the blood causes an increase in the resorption of free water from the renal collecting tubules. No increase in loss of renal sodium nor chloride is associated with this hormonal influence. The resultant hyponatremia is due to excess free-water retention and not the excess loss of sodium or chloride. To manage this condition, patients are not given a salt shaker and then allowed to drink ad libitum. The standard and well-accepted management of patients with SIADH is the restriction of free-water intake because this step addresses the dysfunctional renal process. Administering sodium chloride to a child with SIADH might possibly slow down the progression of hyponatremia but would also expand the total fluid volumes of the patient and would indirectly deal with a problem that could be addressed directly.
Understandably, in an intensive care setting, when hemodynamics is dicey, and when fluid-restriction could risk hypovolemia, employing a volume-expanding solution for mIVF therapy might be reasonable. However, in an ICU setting, SIADH is routinely treated with free-water restriction, and careful calculations of an individual patient’s fluid and electrolyte losses and needs are made.
In conclusion, we recognize the motivation for questioning the H&S method for mIVF as our field surveilles more than a half-century of accumulated experience with this method and the advances in our understanding of physiology and pathophysiology. However, we believe that the current body of evidence fails to substantiate the proposed recommendations.3 The avoidance of laboratory-detectable decreases in serum sodium levels is an unproven marker for the development of life-threatening hyponatremic events. Concerns for untoward effects (eg, excessive volume expansion and effects of hyperchloremia toward acidosis) and the exploration of alternative approaches (eg, modifications in volumes/rates of fluid delivery) have been inadequately explored. The proposed changes in practice may provide no mitigation in the rare events we hope to avoid, may fail to serve all subpopulations within the proposed scope of patients, and will likely
Disclosures
Dr. Powell and Dr. Zaoutis have nothing to disclose.
1. Holliday MA, Segar WE. The maintenance need for water in parenteral fluid therapy. Pediatrics 1957;19(5):823-832. PubMed
2. Wang J, Xu E, Xiao Y. Isotonic versus hypotonic maintenance IV fluids in hospitalized children: a meta-analysis. Pediatrics 2014;133(1):105-113. doi: 10.1542/peds.2013-2041. PubMed
3. Hall AM, Ayus JC, Moritz ML. The default use of hypotonic maintenance intravenous fluids in pediatrics. J Hosp Med. 2018;13(9)637-640. doi: 10.12788/jhm.3040. PubMed
For more than 75 years, pediatrics has sought sound guidelines for prescribing maintenance intravenous fluid (mIVF) for children. In 1957, Holliday and Segar (H&S)1 introduced a breakthrough method for estimating mIVF needs. Their guidelines for calculating free-water and electrolyte needs for mIVF gained wide-spread acceptance and became the standard of care for decades.
Over the last two decades, awareness has grown around the occurrence of rare, life-threatening hyponatremic conditions, especially hyponatremic encephalopathy, in hospitalized children. Concomitantly, an increasing awareness shows that serum levels of antidiuretic hormone (ADH) are often elevated in sick children and triggered by nonosmotic conditions (pain, vomiting, perioperative state, meningitis, and pulmonary disease). This situation led to heightened concern of clinicians and investigators who assumed that hospitalized patients would exhibit reduced tolerance for hypotonic mIVF the mainstay of the H&S method. The possibility that the H&S method could be a significant contributing factor to the development of hyponatremic encephalopathy in hospitalized children became a research topic. This research speculated that even mildly reduced serum sodium levels might be a marker for the much rarer condition of hyponatremic encephalopathy. A number of hospitalists also switched from quarter-normal to half-normal saline in mIVF.
The substitution of hypotonic fluids with isotonic fluids (eg, 0.9% normal saline or lactated Ringer’s) is the current front-runner alternative to increase sodium delivery. The hypothesis is that the delivery of additional sodium, while maintaining the same H&S method volume/rate of fluid delivery, will protect against life-threatening hyponatremic events.
The challenge we face is whether we are moving from mIVF therapy, which features a long track record of success and an excellent safety profile, to a safer or more effective therapeutic approach. We should consider the burden of proof which should be satisfied to support creating new guidelines which center on changing from hypotonic mIVF to isotonic mIVF.
Is there sufficient scientific proof that isotonic mIVF is safer and/or more effective than hypotonic mIVF in preventing life-threatening hyponatremic events?
Is there compelling biologic plausibility for this change for patients with risk factors that are associated with elevated serum ADH levels?
What is the magnitude of the benefit?
What is the magnitude of unintended harms?
We offer our perspective on each of these questions.
The primary difficulty with addressing the adverse events of catastrophic hyponatremia (encephalopathy, seizures, cerebral edema, and death) is their rarity. The events stand out when they occur, prompting mortality and morbidity (M&M) conferences to blunder into action. But that action is not evidence-based, even if a rationale mentions a meta-analysis, because the rationales lack estimates of the number needed to treat (NNT) to prevent one catastrophic event. Estimates of the NNT to prevent mild hypernatremia are not useful. Furthermore, estimates of the number needed to harm (NNH) via unintended consequences of infusing extra sodium chloride are unavailable. True evidence-based medicine (EBM) is rigorous in requiring NNT and NNH. Anything less is considered M&M-based medicine masquerading as EBM.
No technical jargon distinguishes the profound and catastrophic events from the common, mild hyponatremia frequently observed in ill toddlers upon admission. As an analogy, in dealing with fever, astute pediatricians recognize that a moderate fever of 103.4 °F is not halfway to a heatstroke of 108 °F. Fever is not a near miss for heatstroke. Physicians do not recommend acetaminophen to prevent heatstroke, although many parents act that way.
No published randomized controlled trials (RCTs) showed the incidence of these catastrophic hyponatremic events. In the meta-analysis of 10 disparate and uncoordinated trials in 2014,2 no serious adverse events were noted among the 1,000 patients involved. Since then, newer RCTs have added another 1,000 patients to the meta-analysis pool, but still no serious adverse event has been observed.
The H&S method features 60 years of proven safety and remains the appropriate estimate when composing long-term parenteral nutrition. No recommendation is perfect for all situations. Many hospitalized children will exhibit an increased level of ADH. A very small fraction of those children will present a sufficiently elevated ADH level long enough to risk creating profound hyponatremia. An approximation is in the order of magnitude of 1 per 100,000 pediatric medical admissions and 1 per 10,000 postoperative patients. With 3 million pediatric admissions yearly in the United States, such numbers mean that large children’s hospitals might see one or two catastrophic adverse events each decade due to mIVF in previously healthy children. The risk in chronically ill children and in the ICU will be higher. The potential for causing unintended greater harm amongst the other millions of patients is high, requiring application of the precautionary principle.
Thus, EBM and RCTs are poor methodologies for quality improvement of this issue. Assigning surrogate measures, such as moderate hyponatremia or even mild hyponatremia, to increase sensitivity and incidence for research purposes lacks a validated scientific link to the much rarer profound hyponatremic events. The resulting nonvalid extrapolation is precisely what true EBM seeks to avoid. A serum sodium of 132 mEq/L is not a near miss. The NNT to prevent the catastrophic events is unknown. Indeed, no paper advocating adoption of isotonic mIVF has even ventured an approximation.
The RCTs are also, therefore, underpowered to identify harms from using normal saline as a maintenance fluid. A few studies mention hypernatremia, but serum sodium is not a statistical variable. Renal physiology predicts that kidneys can easily handle excess infused sodium and can protect against hypernatremia. However, the extra chloride load risks creating hyperchloremic acidosis, particularly when a patient with respiratory insufficiency cannot compensate by lowering pCO2 through increased minute ventilation. Edema is another risk. Both respiratory insufficiency and edema already occur more frequently (by orders of magnitude) in hospitalized patients on any mIVF than the profound hyponatremia events in hospitalized patients on hypotonic mIVF. For instance, about 1% of hospitalized infants with bronchiolitis are ventilated for respiratory failure. If hyperchloremic acidosis unintentionally caused by isotonic mIVF slightly increases the frequency of intubation, then such result far outweighs any benefit from reducing catastrophic hyponatremic events. Difficulty will also arise in detecting this unintended increase in the rate of intubation compared with the current background frequency. Detecting these unintended harms becomes impossible if the RCT is underpowered by 100-fold due to utilizing a surrogate measure, such as serum sodium <135 mEq/L, as the dependent variable instead of measuring serious hyponatremic adverse events.
All claims that “no evidence of harm” was found from using normal saline as mIVF are type II statistical errors. There is little chance of detecting any harm with a grossly underpowered study or a meta-analysis of 10 such studies. Simply put, EBM is impossible to use for events that occur less than 1 per 10,000 patients using RCTs with 1,000 patients. No usable safety data are available for normal saline as mIVF in any published RCT. As the RCTs are underpowered, one should rely on science to guide therapy, rather than on invalid statistics.
Using the precautionary principle, hypothetically, adding extra sodium chloride to maintenance fluids should be considered in the same manner as adding any other drug. Based on the current evidence, would the Food and Drug Administration approve the drug intravenous sodium chloride for the prevention of hyponatremia induced by maintenance fluids? An increasing evidence of a minimal beneficial effect is observed, but no evidence of safety nor physiology is available. A new drug application for using normal saline as a default maintenance fluid would be soundly rejected by an FDA panel, just as it has been rejected by the majority of pediatric hospitalists throughout the past 15 years since the idea was proposed in 2003.
With the lack of compelling statistical evidence to guide practice, clinicians often rely on biologic plausibility. Relatively recent studies have revealed that many sick children develop elevated blood levels of ADH due to nonosmotic and nonhemodynamic triggers. Fortunately, we also possess a strong body of knowledge around management of children with syndrome of inappropriate secretion of antidiuretic hormone (SIADH). We understand that elevated levels of ADH in the blood causes an increase in the resorption of free water from the renal collecting tubules. No increase in loss of renal sodium nor chloride is associated with this hormonal influence. The resultant hyponatremia is due to excess free-water retention and not the excess loss of sodium or chloride. To manage this condition, patients are not given a salt shaker and then allowed to drink ad libitum. The standard and well-accepted management of patients with SIADH is the restriction of free-water intake because this step addresses the dysfunctional renal process. Administering sodium chloride to a child with SIADH might possibly slow down the progression of hyponatremia but would also expand the total fluid volumes of the patient and would indirectly deal with a problem that could be addressed directly.
Understandably, in an intensive care setting, when hemodynamics is dicey, and when fluid-restriction could risk hypovolemia, employing a volume-expanding solution for mIVF therapy might be reasonable. However, in an ICU setting, SIADH is routinely treated with free-water restriction, and careful calculations of an individual patient’s fluid and electrolyte losses and needs are made.
In conclusion, we recognize the motivation for questioning the H&S method for mIVF as our field surveilles more than a half-century of accumulated experience with this method and the advances in our understanding of physiology and pathophysiology. However, we believe that the current body of evidence fails to substantiate the proposed recommendations.3 The avoidance of laboratory-detectable decreases in serum sodium levels is an unproven marker for the development of life-threatening hyponatremic events. Concerns for untoward effects (eg, excessive volume expansion and effects of hyperchloremia toward acidosis) and the exploration of alternative approaches (eg, modifications in volumes/rates of fluid delivery) have been inadequately explored. The proposed changes in practice may provide no mitigation in the rare events we hope to avoid, may fail to serve all subpopulations within the proposed scope of patients, and will likely
Disclosures
Dr. Powell and Dr. Zaoutis have nothing to disclose.
1. Holliday MA, Segar WE. The maintenance need for water in parenteral fluid therapy. Pediatrics 1957;19(5):823-832. PubMed
2. Wang J, Xu E, Xiao Y. Isotonic versus hypotonic maintenance IV fluids in hospitalized children: a meta-analysis. Pediatrics 2014;133(1):105-113. doi: 10.1542/peds.2013-2041. PubMed
3. Hall AM, Ayus JC, Moritz ML. The default use of hypotonic maintenance intravenous fluids in pediatrics. J Hosp Med. 2018;13(9)637-640. doi: 10.12788/jhm.3040. PubMed
© 2018 Society of Hospital Medicine
September 2018 Digital Edition
Click here to access the September 2018 Digital Edition.
Table of Contents
- Huddling for High-Performing
- Flexible Bronchoscopic Removal of 3 Foreign Objects
- Improved Transitional Care Through an Innovative Hospitalist Model
- Reducing Prescribing of Benzodiazepines in Older Veterans
- Outcomes of Palliative Care Consults With Hospitalized Veterans
- Transforming Primary Care Clinical Learning Environments to Optimize Education, Outcomes, and Satisfaction
Pharmacogenetic testing in children: What to test and how to use it
The use of pharmacogenetic testing to help drive decisions for medication management of patients with psychiatric illnesses is growing. It’s becoming increasingly common for patients or the parents of pediatric patients to request pharmacogenetic testing or to bring the results of prior testing to their appointment. In these situations, patients may ask clinicians to consider the recommendations from these testing reports, which rarely provide guidance specific to pediatric patients. However, this can be difficult for clinicians who did not receive education in pharmacogenetics and may not be familiar with the evidence or options for pharmacogenetic testing. Many of the pharmacogenetic associations identified thus far have been discovered in adults, but studies in pediatric patients are relatively rare. This article reviews pharmacogenetic testing and the evidence supporting it, and describes implementation of routine pharmacogenetics testing at a children’s hospital.
CASE
Testing leads to dose adjustment, improvement
Ms. R, age 16, presents with treatment-resistant major depressive disorder that is characterized by a significant neurovegetative burden and prominent anhedonia, as well as intermittent suicidal ideation without intent or plan. She reportedly did not improve after multiple medication trials, including
Augmentation strategies included
_
Drug metabolism and genetic variants
It is common for patients with psychiatric disorders to receive trials of multiple psychotropic medications prior to identifying one that reduces symptom burden without producing intolerable adverse effects. Due to the high frequency of toxicity-related adverse effects (observed in 20% to 70% of patients),1 these medications are frequently initiated at low doses and titrated slowly until the patient either experiences an intolerable adverse effect or achieves symptomatic remission.1,2 The practice of slow titration at the start of treatment increases the risk of undertreatment in many patients, and may ultimately lead to a medication change due to the lack of response.
Many of the medications used to treat psychiatric illnesses are primarily metabolized by 2 CYP enzymes expressed in the liver, encoded by the CYP2D6 and CYP2C19 genes3 (Table 13-7 and Table 23,6,7). These drug-metabolizing enzymes affect the pharmacokinetics of many medications. Some medications are converted to an active form by these enzymes, and some are inactivated. The contributions of CYP enzymes to the pharmacokinetics of neuropsychiatric medications have been well-described; however, there is less evidence on whether variants in these genes are associated with treatment efficacy, especially in pediatric patients.8,9 CYP2D6 enzyme activity reaches adult levels soon after birth, but children may have higher CYP2C19 activity than adults.4 CYP3A4 also contributes to the metabolism of many medications; however, there is only weak evidence that genetic variants in CYP3A4 contribute to variability in the pharmacokinetics of these medications, and there are currently no dosing guidelines based on pharmacogenetics available for this gene.10

As is common in the pharmacogenetic field, genotypes are denoted with a “star allele” (eg, *2) rather than positional nomenclature (eg, c.681G>A). The normal allele is usually designated as *1, and this result is given in the absence of the tested alleles. There is no consensus on the minimum set of alleles to be tested for most genes,11 so commercially available tests vary widely in what alleles are tested (and therefore what they exclude before calling a normal allele).12 The metabolizer phenotype for a patient is determined by taking into account the activity of each of the patient’s 2 alleles (eg, *1/*2). A patient is categorized as a poor-, intermediate-, normal- (extensive-), or ultra-rapid metabolizer. Generally, the allele definitions are widely agreed upon (what genetic variant or variants comprise the *2 allele) due to nomenclature committees for each gene; however, because there are no standards for interpretation, the interpretation of the activity of the alleles and conversion to metabolizer phenotype varies among clinics.13
Continue to: Guidelines help with genotype-guided dosing
Guidelines help with genotype-guided dosing

Each CPIC guideline specifically addresses use in pediatric patients, indicating that there are relatively few studies in pediatrics, but “it may be appropriate to extrapolate these recommendations to adolescents or possibly younger children with close monitoring.”4 The DPWG guidelines do not mention whether or not the recommendations are applicable to children. Neither CPIC nor the DPWG provides guidance on when to test; however, the French National Network of Pharmacogenetics (Réseau national de pharmacogénétique) recommends CYP2D6 and CYP2C19 genotyping before initiating antidepressant treatment, especially in patients with a high risk of toxicity.16
In the case above, Ms. R was determined to be a CYP2D6 ultra-rapid metabolizer. Because she showed some initial response to aripiprazole and venlafaxine ER, which are both metabolized by CYP2D6, these medications were very quickly titrated up, and the increased dosages produced the desired response. Venlafaxine is metabolized to the active metabolite O-desmethylvenlafaxine by CYP2D6. The DPWG recommends increasing the dose of venlafaxine in CYP2D6 ultra-rapid metabolizers to 150% of the normal dose based on the decreased serum concentrations of venlafaxine and O-desmethylvenlafaxine in these patients.6 Aripiprazole is also metabolized by CYP2D6; however, the FDA and DPWG give no recommendations for ultra-rapid metabolizers, but do recommend reducing the dose of aripiprazole in CYP2D6 poor metabolizers.
Multiple studies in adults have analyzed the association between pharmacokinetic (CYP2D6 and CYP2C19) or pharmacodynamic genes (SLC6A4, HTR2A, and GRIK4) and outcomes,17 including some large clinical trials that conducted genome-wide association studies18-20 and meta-analyses across multiple studies.21,22 Most pharmacogenetic studies in psychiatric patients are small, and very few have included pediatric patients. However, with more interest in neuropsychiatric pharmacogenetics, these studies are becoming more common.23-26
Continue to: Limited evidence from studies of commercially available tests
Limited evidence from studies of commercially available tests
Several pharmacogenetic tests are commercially available, including some that focus on providing information that can be used specifically when prescribing psychiatric medications, such as the GeneSight Psychotropic test, CNSdose, Genomind, and Neuropharmagen.
In an industry-sponsored, nonrandomized clinical trial that included patients for whom prescribing decisions were made based on the GeneSight test, outcomes in adults were improved compared with treatment as usual,27 inpatient stays were shorter,28 and pharmacy costs were reduced.29 In one of these studies, the authors noted that the traditional, single-gene analysis was not associated with improved outcomes, whereas the multiple gene combination (pharmacokinetic and pharmacodynamic genes) was associated with improved outcomes among patients with depression.27 However, when GeneSightwas compared with treatment as usual in a small randomized trial, there was not a significant association between use of the test and improved outcomes among patients with treatment-resistant depression.30 The results of a much larger randomized trial (N = 1,167) are available31 and expected to be published, but patients younger than age 18 were excluded from this study.32 A retrospective study conducted in adult psychiatric patients found that patients whose treatment followed recommendations of a pharmacogenetic test including 20 genes were almost 4 times more likely to improve than patients whose treatment did not follow the recommendations.33
Pharmacogenetic testing at our pediatric inpatient unit
The Cincinnati Children’s Division of Child and Adolescent Psychiatry is the largest psychiatric inpatient service in a U.S. pediatric hospital. Starting in 2004, we adopted pharmacogenetically-guided dosing of psychiatric medications.34 CYP2D6 and CYP2C19 were chosen for testing because the enzymes encoded by these genes metabolize many of the antidepressants and antipsychotics that patients admitted to our unit will receive, and the clinicians wanted all available tools to help improve the care of these patients. To date, the Genetic Pharmacology Service (GPS) has performed >25,000 tests for variants in CYP2D6 and CYP2C19 as part of inpatient care. Patients provide a specimen (blood or buccal swab) at the time of admission to inpatient psychiatry, genotyping is performed onsite by the Molecular Genetics Laboratory (certified by the College of American Pathologists [CAP]/Clinical Laboratory Improvement Amendments [CLIA]) and the results are posted to the medical record within 2 business days. The report contains the patient’s alleles for CYP2D6 and CYP2C19, the genotype-predicted metabolizer phenotype, and dosing recommendations for 19 drugs (provided as a percentage of the standard dose). Insurance is billed for the test, and reimbursement is usually received when the test is performed as part of an inpatient stay.
The GPS team performed a retrospective chart review after the first panel was implemented in 2005.23 The study included 279 patients who were receiving a medication metabolized by one of the 2 genes tested. The poor metabolizers had the highest efficacy and highest number of adverse drug reactions, while ultra-rapid metabolizers had the lowest efficacy and lowest number of adverse reactions during their initial inpatient stay. In patients not treated with medications metabolized by CYP2D6 or CYP2C19, there was no association between metabolizer status and efficacy or adverse drug reactions. In this retrospective study, there was no association between metabolizer status and length of stay.
Overcoming the challenges
One challenge with many of the pharmacogenetic tests is interpretation of the results. The reports can span more than 20 pages, and clinicians may not have time to thoroughly read and understand how best to use all of this information. Sometimes the reports can make it seem like the first-line medication for the patient’s condition is not the best choice, but it could work well when dosed appropriately based on the patient’s genotype. Each commercially available test has a different way of presenting results,13 so when choosing a pharmacogenetic test, one should be sure to see a sample report. Vo et al35 recently reviewed factors to consider when choosing a pharmacogenetic test.
Continue to: Because patients and families also have difficulty understanding the reports...
Because patients and families also have difficulty understanding the reports, we created patient education sheets,36 written at an eighth grade level with feedback from parents and modeled on those provided by St. Jude Children’s Research Hospital.37 St. Jude Children’s Research Hospital also has pharmacogenetic competencies that pharmacists and nurses must pass.38,39 The following is a sample explanation that one of our nurses uses to educate parents on what is being tested and what effect the results will have on the treatment plan.
“During your child’s stay we will be completing a genetic test to help us understand how he/she processes the types of medications that we may be likely to start during their hospitalization. This does not tell us which medication will be best—unfortunately within the field of psychiatry there is still some unavoidable trial and error; rather, what it will do is tell us how to make sure that the dosing is at a level that would be safe for the way your child’s body breaks down the medicine, so that he/she can get the intended benefit of the medicine’s effects, while decreasing the risk of uncomfortable side effects, where possible.”
Other challenges in pharmacogenetic testing are the cost, disease risk, and concern about how genetic information will be used. Because these tests are often not covered by health insurance, some commercial pharmacogenetic testing companies offer an out-of-pocket maximum in the $250 to $350 range to reduce the cost to the patient. Some pharmacogenetic testing companies also test for genes associated with disease, so if a clinician orders the test, he or she may be responsible for sharing that information with the patient. For most pharmacogenetic testing companies, the turn-around time is 2 to 10 days. Genetic information is protected by federal laws, including Genetic Information Nondiscrimination Act (GINA) and Health Insurance Portability and Accountability Act (HIPAA).
The choice of psychotropic medication is complex, and although we would like pharmacogenetics to be the only answer to why every patient does or does not respond to a medication, it is not. Response to medication is influenced by age, comorbidities, illness severity, illness duration, compliance, gender, concomitant medications, and potentially more.40 Pharmacogenetics is another tool at the clinician’s disposal to help in choosing a medication and dose. There is a clear association between CYP2D6 and CYP2C19 and exposure to many antidepressants and antipsychotics (reviewed by Stingl et al3); however, the link between exposure and response is much weaker. It may be strengthened by the inclusion of pharmacodynamic information (the level of expression of the drug target), which can be influenced by genetic variants.41 At the present time, the most evidence exists for testing CYP2D6 and CYP2C19, and the CPIC4,5,15 and DWPG6 guidelines provide evidence-based recommendations for how to adjust medication dosages based on the results.
There is clearly much more research that needs to be done in the field of neuropsychiatric pharmacogenetics, especially in pediatric populations. As we see increased utilization of pharmacogenetic tests in psychiatry, there is also a need for pharmacogenetic education of patients, families, nurses, pharmacists, and psychiatrists. Several good pharmacogenetic resources that contain up-to-date summaries of the available evidence linking pharmacogenetic variants to medication response, implementation resources, and educational resources are available. These include CPIC (www.cpicpgx.org), PharmGKB (www.pharmgkb.org), and the IGNITE Spark Toolbox (https://ignite-genomics.org/spark-toolbox/clinicians/).
Acknowledgements
The author thanks Jen Milau, APRN, for the case study and sample explanation, and Jeffrey Strawn, MD, FAACP, Ethan Poweleit, and Stacey Aldrich, MS, for help with preparing this manuscript.
1. Cipriani A, Zhou X, Del Giovane C, et al. Comparative efficacy and tolerability of antidepressants for major depressive disorder in children and adolescents: a network meta-analysis. Lancet. 2016; 388(10047):881-890.
2. Correll CU, Sheridan EM, DelBello MP. Antipsychotic and mood stabilizer efficacy and tolerability in pediatric and adult patients with bipolar I mania: a comparative analysis of acute, randomized, placebo-controlled trials. Bipolar Disord. 2010;12(2):116-141.
3. Stingl JC, Brockmoller J, Viviani R. Genetic variability of drug-metabolizing enzymes: the dual impact on psychiatric therapy and regulation of brain function. Mol Psychiatry. 2013;18(3):273-287.
4. Hicks JK, Bishop JR, Sangkuhl K, et al. Clinical Pharmacogenetics Implementation Consortium (CPIC) guideline for CYP2D6 and CYP2C19 genotypes and dosing of selective serotonin reuptake inhibitors. Clin Pharmacol Ther. 2015;98(2):127-134.
5. Hicks JK, Sangkuhl K, Swen JJ, et al. Clinical pharmacogenetics implementation consortium guideline (CPIC) for CYP2D6 and CYP2C19 genotypes and dosing of tricyclic antidepressants: 2016 update. Clin Pharmacol Ther. 2017;102(1):37-44.
6. Swen JJ, Nijenhuis M, de Boer A, et al. Pharmacogenetics: from bench to byte--an update of guidelines. Clin Pharmacol Ther. 2011;89(5):662-673.
7. Swen JJ, Wilting I, de Goede AL, et al. Pharmacogenetics: from bench to byte. Clin Pharmacol Ther. 2008;83(5):781-787.
8. GENDEP Investigators, MARS Investigators, and STAR*D Investigators. Common genetic variation and antidepressant efficacy in major depressive disorder: a meta-analysis of three genome-wide pharmacogenetic studies. Am J Psychiatry. 2013;170(2):207-217.
9. Ji Y, Schaid DJ, Desta Z, et al. Citalopram and escitalopram plasma drug and metabolite concentrations: genome-wide associations. Br J Clin Pharmacol. 2014;78(2):373-383.
10. Werk AN, Cascorbi I. Functionalgene variants of CYP3A4. Clin Pharmacol Ther. 2014:96(3):340-348.
11. Pratt VM, Del Tredici AL, Hachad H, et al. Recommendations for clinical CYP2C19 genotyping allele selection: a report of the Association for Molecular Pathology. J Mol Diagn. 2018;20(3):269-276.
12. Bousman CA, Jaksa P, Pantelis C. Systematic evaluation of commercial pharmacogenetic testing in psychiatry: a focus on CYP2D6 and CYP2C19 allele coverage and results reporting. Pharmacogenet Genomics. 2017;27(11):387-393.
13. Hicks JK, Swen JJ, Gaedigk A. Challenges in CYP2D6 phenotype assignment from genotype data: a critical assessment and call for standardization. Curr Drug Metab. 2014;15(2):218-232.
14. Caudle KE, Klein TE, Hoffman JM, et al. Incorporation of pharmacogenomics into routine clinical practice: the Clinical Pharmacogenetics Implementation Consortium (CPIC) guideline development process. Curr Drug Metab. 2014;15(2):209-217.
15. Hicks JK, Swen JJ, Thorn CF, et al. Clinical Pharmacogenetics Implementation Consortium guideline for CYP2D6 and CYP2C19 genotypes and dosing of tricyclic antidepressants. Clin Pharmacol Ther. 2013;93(5):402-408.
16. Quaranta S, Dupouey J, Colle R, et al. Pharmacogenetics of antidepressant drugs: State of the art and clinical implementation - recommendations from the French National Network of Pharmacogenetics. Therapie. 2017;72(2):311-318.
17. Fabbri C, Minarini A, Nitsu T, et al. Understanding the pharmacogenetics of selective serotonin reuptake inhibitors. Expert Opin Drug Metab Toxicol. 2014;10(8):1093-1118.
18. Mrazek DA, Rush AJ, Biernacka JM, et al. SLC6A4 variation and citalopram response. Am J Med Genet B Neuropsychiatr Genet. 2009;150B(3):341-351.
19. Biernacka JM, Sangkuhl K, Jenkins G, et al. The International SSRI Pharmacogenomics Consortium (ISPC): a genome-wide association study of antidepressant treatment response. Transl Psychiatry. 2015;5:e553. doi: 10.1038/tp.2015.47.
20. Horstmann S, Lucae S, Menke A, et al. Polymorphisms in GRIK4, HTR2A, and FKBP5 show interactive effects in predicting remission to antidepressant treatment. Neuropsychopharmacology. 2010;35(3):727-740.
21. Porcelli S, Fabbri C, Serretti A. Meta-analysis of serotonin transporter gene promoter polymorphism (5-HTTLPR) association with antidepressant efficacy. Eur Neuropsychopharmacol. 2012;22(4):239-258.
22. Niitsu T, Fabbri C, Bentini F, et al. Pharmacogenetics in major depression: a comprehensive meta-analysis. Prog Neuropsychopharmacol Biol Psychiatry. 2013;45:183-194.
23. Prows CA, Nick TG, Saldaña SN, et al. Drug-metabolizing enzyme genotypes and aggressive behavior treatment response in hospitalized pediatric psychiatric patients. J Child Adolesc Psychopharmacol. 2009;19(4):385-394.
24. Rotberg B, Kronenberg S, Carmel M, et al. Additive effects of 5-HTTLPR (serotonin transporter) and tryptophan hydroxylase 2 G-703T gene polymorphisms on the clinical response to citalopram among children and adolescents with depression and anxiety disorders. J Child Adolesc Psychopharmacol. 2013;23(2):117-122.
25. Kronenberg S, Apter A, Brent D, et al. Serotonin transporter polymorphism (5-HTTLPR) and citalopram effectiveness and side effects in children with depression and/or anxiety disorders. J Child Adolesc Psychopharmacol. 2007;17(6):741-750.
26. AlOlaby RR, Sweha SR, Silva M, et al. Molecular biomarkers predictive of sertraline treatment response in young children with fragile X syndrome. Brain Dev. 2017;39(6):483-492.
27. Altar CA, Carhart JM, Allen JD, et al. Clinical validity: Combinatorial pharmacogenomics predicts antidepressant responses and healthcare utilizations better than single gene phenotypes. Pharmacogenomics J. 2015;15(5):443-451.
28. Winner J, Allen JD, Altar CA, et al. Psychiatric pharmacogenomics predicts health resource utilization of outpatients with anxiety and depression. Transl Psychiatry. 2013;3:e242. doi:10.1038/tp.2013.2.
29. Winner JG, Carhart JM, Altar CA, et al. Combinatorial pharmacogenomic guidance for psychiatric medications reduces overall pharmacy costs in a 1 year prospective evaluation. Curr Med Res Opin. 2015;31(9):1633-1643.
30. Winner JG, Carhart JM, Altar CA, et al. A prospective, randomized, double-blind study assessing the clinical impact of integrated pharmacogenomic testing for major depressive disorder. Discov Med. 2013;16(89):219-227.
31. Genesight. GUIDED clinical study. https://genesight.com/greden-study/. Updated May 31, 2018. Accessed August 1, 2018.
32. U.S. National Library of Medicine ClinicalTrials.gov. Genomics used to improve DEpression decisions (GUIDED). https://clinicaltrials.gov/ct2/show/NCT02109939. Accessed July 24, 2018.
33. Espadaler J, Tuson M, Lopez-Ibor JM, et al. Pharmacogenetic testing for the guidance of psychiatric treatment: a multicenter retrospective analysis. CNS Spectrums. 2017;22(4):315-324.
34. Ramsey LB, Prows CA, Zhang K, et al. Implementation of pharmacogenetics at Cincinnati Children’s Hospital Medical Center: lessons learned over 14 years of personalizing medicine. Clin Pharmacol Ther. 2018. doi: 10.1002/cpt.1165. [Epub ahead of print].
35. Vo TT, Bell GC, Owusu Obeng A, et al. Pharmacogenomics implementation: considerations for selecting a reference laboratory. Pharmacotherapy. 2017;37(9):1014-1022.
36. Cincinnati Children’s Hospital. Genetic Pharmacology Service: Education. www.cincinnatichildrens.org/gpsinfo. Accessed August 1, 2018.
37. St. Jude Children’s Research Hospital. Do You Know...Cytochrome P450 2D6 (CYP2D6) and medicines. https://www.stjude.org/treatment/patient-resources/caregiver-resources/patient-family-education-sheets/pharmacy-and-medicines/cytochrome-p450-2d6-cyp2d6-and-medicines.html. Accessed August 1, 2018.
38. St. Jude Children’s Research Hospital. Implementation Resources for Professionals: Clinical Pharmacogenetics at St. Jude. https://www.stjude.org/research/clinical-trials/pg4kds-pharmaceutical-science/implementation-resources-for-professionals.html. Accessed August 1, 2018.
39. Hoffman JM, Haider CE, Wilkinson MR, et al. PG4KDS: a model for the clinical implementation of pre-emptive pharmacogenetics. Am J Med Genet C Semin Med Genet. 2014;166C(1):45-55.
40. Wehry AM, Ramsey LB, Dulemba SE, et al. Pharmacogenomic testing in child and adolescent psychiatry: an evidence-based review. Curr Probl Pediatr Adolesc Health Care. 2018;48(2):40-49.
41. Tomita T, Yasui-Furukori N, Nakagami T, et al. The influence of 5-HTTLPR genotype on the association between the plasma concentration and therapeutic effect of paroxetine in patients with major depressive disorder. PLoS One. 2014;9(5):e98099. doi: 10.1371/journal.pone.0098099.
The use of pharmacogenetic testing to help drive decisions for medication management of patients with psychiatric illnesses is growing. It’s becoming increasingly common for patients or the parents of pediatric patients to request pharmacogenetic testing or to bring the results of prior testing to their appointment. In these situations, patients may ask clinicians to consider the recommendations from these testing reports, which rarely provide guidance specific to pediatric patients. However, this can be difficult for clinicians who did not receive education in pharmacogenetics and may not be familiar with the evidence or options for pharmacogenetic testing. Many of the pharmacogenetic associations identified thus far have been discovered in adults, but studies in pediatric patients are relatively rare. This article reviews pharmacogenetic testing and the evidence supporting it, and describes implementation of routine pharmacogenetics testing at a children’s hospital.
CASE
Testing leads to dose adjustment, improvement
Ms. R, age 16, presents with treatment-resistant major depressive disorder that is characterized by a significant neurovegetative burden and prominent anhedonia, as well as intermittent suicidal ideation without intent or plan. She reportedly did not improve after multiple medication trials, including
Augmentation strategies included
_
Drug metabolism and genetic variants
It is common for patients with psychiatric disorders to receive trials of multiple psychotropic medications prior to identifying one that reduces symptom burden without producing intolerable adverse effects. Due to the high frequency of toxicity-related adverse effects (observed in 20% to 70% of patients),1 these medications are frequently initiated at low doses and titrated slowly until the patient either experiences an intolerable adverse effect or achieves symptomatic remission.1,2 The practice of slow titration at the start of treatment increases the risk of undertreatment in many patients, and may ultimately lead to a medication change due to the lack of response.
Many of the medications used to treat psychiatric illnesses are primarily metabolized by 2 CYP enzymes expressed in the liver, encoded by the CYP2D6 and CYP2C19 genes3 (Table 13-7 and Table 23,6,7). These drug-metabolizing enzymes affect the pharmacokinetics of many medications. Some medications are converted to an active form by these enzymes, and some are inactivated. The contributions of CYP enzymes to the pharmacokinetics of neuropsychiatric medications have been well-described; however, there is less evidence on whether variants in these genes are associated with treatment efficacy, especially in pediatric patients.8,9 CYP2D6 enzyme activity reaches adult levels soon after birth, but children may have higher CYP2C19 activity than adults.4 CYP3A4 also contributes to the metabolism of many medications; however, there is only weak evidence that genetic variants in CYP3A4 contribute to variability in the pharmacokinetics of these medications, and there are currently no dosing guidelines based on pharmacogenetics available for this gene.10
As is common in the pharmacogenetic field, genotypes are denoted with a “star allele” (eg, *2) rather than positional nomenclature (eg, c.681G>A). The normal allele is usually designated as *1, and this result is given in the absence of the tested alleles. There is no consensus on the minimum set of alleles to be tested for most genes,11 so commercially available tests vary widely in what alleles are tested (and therefore what they exclude before calling a normal allele).12 The metabolizer phenotype for a patient is determined by taking into account the activity of each of the patient’s 2 alleles (eg, *1/*2). A patient is categorized as a poor-, intermediate-, normal- (extensive-), or ultra-rapid metabolizer. Generally, the allele definitions are widely agreed upon (what genetic variant or variants comprise the *2 allele) due to nomenclature committees for each gene; however, because there are no standards for interpretation, the interpretation of the activity of the alleles and conversion to metabolizer phenotype varies among clinics.13
Continue to: Guidelines help with genotype-guided dosing
Guidelines help with genotype-guided dosing
Each CPIC guideline specifically addresses use in pediatric patients, indicating that there are relatively few studies in pediatrics, but “it may be appropriate to extrapolate these recommendations to adolescents or possibly younger children with close monitoring.”4 The DPWG guidelines do not mention whether or not the recommendations are applicable to children. Neither CPIC nor the DPWG provides guidance on when to test; however, the French National Network of Pharmacogenetics (Réseau national de pharmacogénétique) recommends CYP2D6 and CYP2C19 genotyping before initiating antidepressant treatment, especially in patients with a high risk of toxicity.16
In the case above, Ms. R was determined to be a CYP2D6 ultra-rapid metabolizer. Because she showed some initial response to aripiprazole and venlafaxine ER, which are both metabolized by CYP2D6, these medications were very quickly titrated up, and the increased dosages produced the desired response. Venlafaxine is metabolized to the active metabolite O-desmethylvenlafaxine by CYP2D6. The DPWG recommends increasing the dose of venlafaxine in CYP2D6 ultra-rapid metabolizers to 150% of the normal dose based on the decreased serum concentrations of venlafaxine and O-desmethylvenlafaxine in these patients.6 Aripiprazole is also metabolized by CYP2D6; however, the FDA and DPWG give no recommendations for ultra-rapid metabolizers, but do recommend reducing the dose of aripiprazole in CYP2D6 poor metabolizers.
Multiple studies in adults have analyzed the association between pharmacokinetic (CYP2D6 and CYP2C19) or pharmacodynamic genes (SLC6A4, HTR2A, and GRIK4) and outcomes,17 including some large clinical trials that conducted genome-wide association studies18-20 and meta-analyses across multiple studies.21,22 Most pharmacogenetic studies in psychiatric patients are small, and very few have included pediatric patients. However, with more interest in neuropsychiatric pharmacogenetics, these studies are becoming more common.23-26
Continue to: Limited evidence from studies of commercially available tests
Limited evidence from studies of commercially available tests
Several pharmacogenetic tests are commercially available, including some that focus on providing information that can be used specifically when prescribing psychiatric medications, such as the GeneSight Psychotropic test, CNSdose, Genomind, and Neuropharmagen.
In an industry-sponsored, nonrandomized clinical trial that included patients for whom prescribing decisions were made based on the GeneSight test, outcomes in adults were improved compared with treatment as usual,27 inpatient stays were shorter,28 and pharmacy costs were reduced.29 In one of these studies, the authors noted that the traditional, single-gene analysis was not associated with improved outcomes, whereas the multiple gene combination (pharmacokinetic and pharmacodynamic genes) was associated with improved outcomes among patients with depression.27 However, when GeneSightwas compared with treatment as usual in a small randomized trial, there was not a significant association between use of the test and improved outcomes among patients with treatment-resistant depression.30 The results of a much larger randomized trial (N = 1,167) are available31 and expected to be published, but patients younger than age 18 were excluded from this study.32 A retrospective study conducted in adult psychiatric patients found that patients whose treatment followed recommendations of a pharmacogenetic test including 20 genes were almost 4 times more likely to improve than patients whose treatment did not follow the recommendations.33
Pharmacogenetic testing at our pediatric inpatient unit
The Cincinnati Children’s Division of Child and Adolescent Psychiatry is the largest psychiatric inpatient service in a U.S. pediatric hospital. Starting in 2004, we adopted pharmacogenetically-guided dosing of psychiatric medications.34 CYP2D6 and CYP2C19 were chosen for testing because the enzymes encoded by these genes metabolize many of the antidepressants and antipsychotics that patients admitted to our unit will receive, and the clinicians wanted all available tools to help improve the care of these patients. To date, the Genetic Pharmacology Service (GPS) has performed >25,000 tests for variants in CYP2D6 and CYP2C19 as part of inpatient care. Patients provide a specimen (blood or buccal swab) at the time of admission to inpatient psychiatry, genotyping is performed onsite by the Molecular Genetics Laboratory (certified by the College of American Pathologists [CAP]/Clinical Laboratory Improvement Amendments [CLIA]) and the results are posted to the medical record within 2 business days. The report contains the patient’s alleles for CYP2D6 and CYP2C19, the genotype-predicted metabolizer phenotype, and dosing recommendations for 19 drugs (provided as a percentage of the standard dose). Insurance is billed for the test, and reimbursement is usually received when the test is performed as part of an inpatient stay.
The GPS team performed a retrospective chart review after the first panel was implemented in 2005.23 The study included 279 patients who were receiving a medication metabolized by one of the 2 genes tested. The poor metabolizers had the highest efficacy and highest number of adverse drug reactions, while ultra-rapid metabolizers had the lowest efficacy and lowest number of adverse reactions during their initial inpatient stay. In patients not treated with medications metabolized by CYP2D6 or CYP2C19, there was no association between metabolizer status and efficacy or adverse drug reactions. In this retrospective study, there was no association between metabolizer status and length of stay.
Overcoming the challenges
One challenge with many of the pharmacogenetic tests is interpretation of the results. The reports can span more than 20 pages, and clinicians may not have time to thoroughly read and understand how best to use all of this information. Sometimes the reports can make it seem like the first-line medication for the patient’s condition is not the best choice, but it could work well when dosed appropriately based on the patient’s genotype. Each commercially available test has a different way of presenting results,13 so when choosing a pharmacogenetic test, one should be sure to see a sample report. Vo et al35 recently reviewed factors to consider when choosing a pharmacogenetic test.
Continue to: Because patients and families also have difficulty understanding the reports...
Because patients and families also have difficulty understanding the reports, we created patient education sheets,36 written at an eighth grade level with feedback from parents and modeled on those provided by St. Jude Children’s Research Hospital.37 St. Jude Children’s Research Hospital also has pharmacogenetic competencies that pharmacists and nurses must pass.38,39 The following is a sample explanation that one of our nurses uses to educate parents on what is being tested and what effect the results will have on the treatment plan.
“During your child’s stay we will be completing a genetic test to help us understand how he/she processes the types of medications that we may be likely to start during their hospitalization. This does not tell us which medication will be best—unfortunately within the field of psychiatry there is still some unavoidable trial and error; rather, what it will do is tell us how to make sure that the dosing is at a level that would be safe for the way your child’s body breaks down the medicine, so that he/she can get the intended benefit of the medicine’s effects, while decreasing the risk of uncomfortable side effects, where possible.”
Other challenges in pharmacogenetic testing are the cost, disease risk, and concern about how genetic information will be used. Because these tests are often not covered by health insurance, some commercial pharmacogenetic testing companies offer an out-of-pocket maximum in the $250 to $350 range to reduce the cost to the patient. Some pharmacogenetic testing companies also test for genes associated with disease, so if a clinician orders the test, he or she may be responsible for sharing that information with the patient. For most pharmacogenetic testing companies, the turn-around time is 2 to 10 days. Genetic information is protected by federal laws, including Genetic Information Nondiscrimination Act (GINA) and Health Insurance Portability and Accountability Act (HIPAA).
The choice of psychotropic medication is complex, and although we would like pharmacogenetics to be the only answer to why every patient does or does not respond to a medication, it is not. Response to medication is influenced by age, comorbidities, illness severity, illness duration, compliance, gender, concomitant medications, and potentially more.40 Pharmacogenetics is another tool at the clinician’s disposal to help in choosing a medication and dose. There is a clear association between CYP2D6 and CYP2C19 and exposure to many antidepressants and antipsychotics (reviewed by Stingl et al3); however, the link between exposure and response is much weaker. It may be strengthened by the inclusion of pharmacodynamic information (the level of expression of the drug target), which can be influenced by genetic variants.41 At the present time, the most evidence exists for testing CYP2D6 and CYP2C19, and the CPIC4,5,15 and DWPG6 guidelines provide evidence-based recommendations for how to adjust medication dosages based on the results.
There is clearly much more research that needs to be done in the field of neuropsychiatric pharmacogenetics, especially in pediatric populations. As we see increased utilization of pharmacogenetic tests in psychiatry, there is also a need for pharmacogenetic education of patients, families, nurses, pharmacists, and psychiatrists. Several good pharmacogenetic resources that contain up-to-date summaries of the available evidence linking pharmacogenetic variants to medication response, implementation resources, and educational resources are available. These include CPIC (www.cpicpgx.org), PharmGKB (www.pharmgkb.org), and the IGNITE Spark Toolbox (https://ignite-genomics.org/spark-toolbox/clinicians/).
Acknowledgements
The author thanks Jen Milau, APRN, for the case study and sample explanation, and Jeffrey Strawn, MD, FAACP, Ethan Poweleit, and Stacey Aldrich, MS, for help with preparing this manuscript.
1. Cipriani A, Zhou X, Del Giovane C, et al. Comparative efficacy and tolerability of antidepressants for major depressive disorder in children and adolescents: a network meta-analysis. Lancet. 2016; 388(10047):881-890.
2. Correll CU, Sheridan EM, DelBello MP. Antipsychotic and mood stabilizer efficacy and tolerability in pediatric and adult patients with bipolar I mania: a comparative analysis of acute, randomized, placebo-controlled trials. Bipolar Disord. 2010;12(2):116-141.
3. Stingl JC, Brockmoller J, Viviani R. Genetic variability of drug-metabolizing enzymes: the dual impact on psychiatric therapy and regulation of brain function. Mol Psychiatry. 2013;18(3):273-287.
4. Hicks JK, Bishop JR, Sangkuhl K, et al. Clinical Pharmacogenetics Implementation Consortium (CPIC) guideline for CYP2D6 and CYP2C19 genotypes and dosing of selective serotonin reuptake inhibitors. Clin Pharmacol Ther. 2015;98(2):127-134.
5. Hicks JK, Sangkuhl K, Swen JJ, et al. Clinical pharmacogenetics implementation consortium guideline (CPIC) for CYP2D6 and CYP2C19 genotypes and dosing of tricyclic antidepressants: 2016 update. Clin Pharmacol Ther. 2017;102(1):37-44.
6. Swen JJ, Nijenhuis M, de Boer A, et al. Pharmacogenetics: from bench to byte--an update of guidelines. Clin Pharmacol Ther. 2011;89(5):662-673.
7. Swen JJ, Wilting I, de Goede AL, et al. Pharmacogenetics: from bench to byte. Clin Pharmacol Ther. 2008;83(5):781-787.
8. GENDEP Investigators, MARS Investigators, and STAR*D Investigators. Common genetic variation and antidepressant efficacy in major depressive disorder: a meta-analysis of three genome-wide pharmacogenetic studies. Am J Psychiatry. 2013;170(2):207-217.
9. Ji Y, Schaid DJ, Desta Z, et al. Citalopram and escitalopram plasma drug and metabolite concentrations: genome-wide associations. Br J Clin Pharmacol. 2014;78(2):373-383.
10. Werk AN, Cascorbi I. Functionalgene variants of CYP3A4. Clin Pharmacol Ther. 2014:96(3):340-348.
11. Pratt VM, Del Tredici AL, Hachad H, et al. Recommendations for clinical CYP2C19 genotyping allele selection: a report of the Association for Molecular Pathology. J Mol Diagn. 2018;20(3):269-276.
12. Bousman CA, Jaksa P, Pantelis C. Systematic evaluation of commercial pharmacogenetic testing in psychiatry: a focus on CYP2D6 and CYP2C19 allele coverage and results reporting. Pharmacogenet Genomics. 2017;27(11):387-393.
13. Hicks JK, Swen JJ, Gaedigk A. Challenges in CYP2D6 phenotype assignment from genotype data: a critical assessment and call for standardization. Curr Drug Metab. 2014;15(2):218-232.
14. Caudle KE, Klein TE, Hoffman JM, et al. Incorporation of pharmacogenomics into routine clinical practice: the Clinical Pharmacogenetics Implementation Consortium (CPIC) guideline development process. Curr Drug Metab. 2014;15(2):209-217.
15. Hicks JK, Swen JJ, Thorn CF, et al. Clinical Pharmacogenetics Implementation Consortium guideline for CYP2D6 and CYP2C19 genotypes and dosing of tricyclic antidepressants. Clin Pharmacol Ther. 2013;93(5):402-408.
16. Quaranta S, Dupouey J, Colle R, et al. Pharmacogenetics of antidepressant drugs: State of the art and clinical implementation - recommendations from the French National Network of Pharmacogenetics. Therapie. 2017;72(2):311-318.
17. Fabbri C, Minarini A, Nitsu T, et al. Understanding the pharmacogenetics of selective serotonin reuptake inhibitors. Expert Opin Drug Metab Toxicol. 2014;10(8):1093-1118.
18. Mrazek DA, Rush AJ, Biernacka JM, et al. SLC6A4 variation and citalopram response. Am J Med Genet B Neuropsychiatr Genet. 2009;150B(3):341-351.
19. Biernacka JM, Sangkuhl K, Jenkins G, et al. The International SSRI Pharmacogenomics Consortium (ISPC): a genome-wide association study of antidepressant treatment response. Transl Psychiatry. 2015;5:e553. doi: 10.1038/tp.2015.47.
20. Horstmann S, Lucae S, Menke A, et al. Polymorphisms in GRIK4, HTR2A, and FKBP5 show interactive effects in predicting remission to antidepressant treatment. Neuropsychopharmacology. 2010;35(3):727-740.
21. Porcelli S, Fabbri C, Serretti A. Meta-analysis of serotonin transporter gene promoter polymorphism (5-HTTLPR) association with antidepressant efficacy. Eur Neuropsychopharmacol. 2012;22(4):239-258.
22. Niitsu T, Fabbri C, Bentini F, et al. Pharmacogenetics in major depression: a comprehensive meta-analysis. Prog Neuropsychopharmacol Biol Psychiatry. 2013;45:183-194.
23. Prows CA, Nick TG, Saldaña SN, et al. Drug-metabolizing enzyme genotypes and aggressive behavior treatment response in hospitalized pediatric psychiatric patients. J Child Adolesc Psychopharmacol. 2009;19(4):385-394.
24. Rotberg B, Kronenberg S, Carmel M, et al. Additive effects of 5-HTTLPR (serotonin transporter) and tryptophan hydroxylase 2 G-703T gene polymorphisms on the clinical response to citalopram among children and adolescents with depression and anxiety disorders. J Child Adolesc Psychopharmacol. 2013;23(2):117-122.
25. Kronenberg S, Apter A, Brent D, et al. Serotonin transporter polymorphism (5-HTTLPR) and citalopram effectiveness and side effects in children with depression and/or anxiety disorders. J Child Adolesc Psychopharmacol. 2007;17(6):741-750.
26. AlOlaby RR, Sweha SR, Silva M, et al. Molecular biomarkers predictive of sertraline treatment response in young children with fragile X syndrome. Brain Dev. 2017;39(6):483-492.
27. Altar CA, Carhart JM, Allen JD, et al. Clinical validity: Combinatorial pharmacogenomics predicts antidepressant responses and healthcare utilizations better than single gene phenotypes. Pharmacogenomics J. 2015;15(5):443-451.
28. Winner J, Allen JD, Altar CA, et al. Psychiatric pharmacogenomics predicts health resource utilization of outpatients with anxiety and depression. Transl Psychiatry. 2013;3:e242. doi:10.1038/tp.2013.2.
29. Winner JG, Carhart JM, Altar CA, et al. Combinatorial pharmacogenomic guidance for psychiatric medications reduces overall pharmacy costs in a 1 year prospective evaluation. Curr Med Res Opin. 2015;31(9):1633-1643.
30. Winner JG, Carhart JM, Altar CA, et al. A prospective, randomized, double-blind study assessing the clinical impact of integrated pharmacogenomic testing for major depressive disorder. Discov Med. 2013;16(89):219-227.
31. Genesight. GUIDED clinical study. https://genesight.com/greden-study/. Updated May 31, 2018. Accessed August 1, 2018.
32. U.S. National Library of Medicine ClinicalTrials.gov. Genomics used to improve DEpression decisions (GUIDED). https://clinicaltrials.gov/ct2/show/NCT02109939. Accessed July 24, 2018.
33. Espadaler J, Tuson M, Lopez-Ibor JM, et al. Pharmacogenetic testing for the guidance of psychiatric treatment: a multicenter retrospective analysis. CNS Spectrums. 2017;22(4):315-324.
34. Ramsey LB, Prows CA, Zhang K, et al. Implementation of pharmacogenetics at Cincinnati Children’s Hospital Medical Center: lessons learned over 14 years of personalizing medicine. Clin Pharmacol Ther. 2018. doi: 10.1002/cpt.1165. [Epub ahead of print].
35. Vo TT, Bell GC, Owusu Obeng A, et al. Pharmacogenomics implementation: considerations for selecting a reference laboratory. Pharmacotherapy. 2017;37(9):1014-1022.
36. Cincinnati Children’s Hospital. Genetic Pharmacology Service: Education. www.cincinnatichildrens.org/gpsinfo. Accessed August 1, 2018.
37. St. Jude Children’s Research Hospital. Do You Know...Cytochrome P450 2D6 (CYP2D6) and medicines. https://www.stjude.org/treatment/patient-resources/caregiver-resources/patient-family-education-sheets/pharmacy-and-medicines/cytochrome-p450-2d6-cyp2d6-and-medicines.html. Accessed August 1, 2018.
38. St. Jude Children’s Research Hospital. Implementation Resources for Professionals: Clinical Pharmacogenetics at St. Jude. https://www.stjude.org/research/clinical-trials/pg4kds-pharmaceutical-science/implementation-resources-for-professionals.html. Accessed August 1, 2018.
39. Hoffman JM, Haider CE, Wilkinson MR, et al. PG4KDS: a model for the clinical implementation of pre-emptive pharmacogenetics. Am J Med Genet C Semin Med Genet. 2014;166C(1):45-55.
40. Wehry AM, Ramsey LB, Dulemba SE, et al. Pharmacogenomic testing in child and adolescent psychiatry: an evidence-based review. Curr Probl Pediatr Adolesc Health Care. 2018;48(2):40-49.
41. Tomita T, Yasui-Furukori N, Nakagami T, et al. The influence of 5-HTTLPR genotype on the association between the plasma concentration and therapeutic effect of paroxetine in patients with major depressive disorder. PLoS One. 2014;9(5):e98099. doi: 10.1371/journal.pone.0098099.
