User login
SEAL: Selinexor extends PFS in advanced dedifferentiated liposarcoma
The investigational drug selinexor appears to be improving progression-free survival in patients with advanced dedifferentiated liposarcoma, based on phase 2 results from the randomized, placebo-controlled SEAL study.
But the statistical significance of the improvements varied depending on whether progression-free survival (PFS) was assessed by the World Health Organization criteria, which looks at two-dimensional measurements of these irregular three-dimensional objects, or RECIST v1.1 criteria, which only looks at a unidimensional measure, reported Mrinal M. Gounder, MD, of Memorial Sloan Kettering Cancer Center, New York, at the annual meeting of the American Society of Clinical Oncology. When tumor response was based on WHO criteria, there was no difference in median PFS for the 24 patients on active therapy (1.4 months) and the 27 patients on placebo (1.8 months). By RECIST v1.1 criteria, however, median PFS was 5.6 months with selinexor.
Dedifferentiated liposarcoma is incurable, and palliative therapies are associated with an overall survival of 11-20 months in these patients. Selinexor is an oral selective inhibitor of exportin-1 which exports proteins from the nucleus into the cytoplasm. The drug appears to prevent p53 from leaving the nucleus, thereby protecting it from overexpressed MDM2, which is a negative regulator of p53, but the drug might have other potential mechanisms of action.
The double-blind study included 56 evaluable patients who had progressive dedifferentiated liposarcoma and had received at least one prior systemic therapy. Patients’ median age was 61 years and they had received a median of two prior therapies. Patients were randomized to get either 60 mg of selinexor (26 patients) or placebo (30 patients) twice weekly until their disease progressed or they were no longer able to tolerate therapy. Patients whose disease progressed on placebo (24 patients) were allowed to cross over to open-label selinexor therapy.
Treatments were unblinded for 51 of the patients, 24 on selinexor and 27 on placebo. Disease progression as confirmed by Independent Central Radiological Review using WHO criteria was the main reason for ending blinded treatment.
Grade 1/2 adverse events for selinexor versus placebo, respectively, were nausea (85% vs. 31%), anorexia (62% vs. 14%), and fatigue (58% vs. 45%). The comparable rates of grade 3/4 adverse events were hyponatremia (15% vs. 0%), anemia (15% vs. 7%), and thrombocytopenia (12% vs. 0%). Selinexor dose was reduced because of adverse events in 12 patients.
In a discussion of the study’s implications, Mark Andrew Dickson, MD, also of Memorial Sloan Kettering Cancer Center, called the adverse events profile “mostly manageable but predictable grade 1/2 adverse events ... and median progression-free survival of 5 and a half months is quite encouraging.
“Changing response assessment method midtrial in a study with progression-free survival as the primary endpoint is obviously problematic, but it also highlights how difficult it is to measure three-dimensional tumors like complex retroperitoneal liposarcomas, which move and change and grow and shrink over time,” he said. “And I would conclude that RECIST is probably the worst method of tumor assessment for sarcoma, except for all the other methods of tumor assessment.”
To illustrate the difficulty of measuring tumor response, Dr. Dickson presented examples of different tumor shapes and scenarios where one method would indicate tumor progression and the other would indicate stable disease.
“There can be differences between the two methods in how progression responds and is determined. And you can do this experiment with a number of different shapes and find scenarios where one method would call it progression at a different time than the other. So this is really critically important when we look at the results of the clinical trial, because it was designed to look at WHO PFS. And you can see that, based on that, there was no significant difference between the selinexor and placebo arm,” he said.
Additionally, he reviewed cases from the study where “either way you measure this, you can see that [the] tumor is getting smaller over time,” as well as cases where the tumor grew in patients on placebo first, but decreased in size after switching to the active therapy.
“The improvement in progression-free survival is promising and ... selinexor probably does have activity in dediff lipo compared to historical data,” said Dr. Dickson, adding that he looks forward to selinexor progressing to a randomized, phase 3 trial and “seeing those data perhaps next year.”
Dr. Gounder disclosed financial relationships with multiple drug companies including Karyopharm Therapeutics, the maker of selinexor. Dr. Dickson disclosed a consult or adviser role with Celgene and research funding from Eli Lilly.
SOURCE: Gounder M et al. ASCO 2018, Abstract 11512.
FROM ASCO 2018
Key clinical point: The investigational drug selinexor appears to be improving progression-free survival (PFS) in patients with advanced dedifferentiated liposarcoma.
Major finding: When tumor response was based on World Health Organization criteria, there was no difference in median PFS for the 24 patients on active therapy (1.4 months) and the 27 patients on placebo (1.8 months). By RECIST v1.1 criteria, however, median PFS was 5.6 months with selinexor.
Study details: Phase 2 results from 56 patients with dedifferentiated liposarcoma in the randomized, placebo-controlled SEAL study.
Disclosures: Dr. Gounder reported financial relationships with multiple drug companies including Karyopharm Therapeutics, the maker of selinexor. Dr. Dickson reported a consultant or adviser role with Celgene and research funding from Eli Lilly.
Source: Gounder M et al. ASCO 2018, Abstract 11512.
Chromoplexy linked to aggressive Ewing sarcomas
Chromoplexy, a sudden burst of complex, loop-like gene rearrangements that gives rise to a fusion gene, appears to be associated with aggressive Ewing sarcomas, based on a study of 124 tumors reported in Science.
Ewing sarcomas with complex karyotypes are associated with a poorer prognosis compared with those with simpler karyotypes. The new findings show that these complex karyotypes are the product of chromoplexy, and that chromoplexy-generated fusions arise early, giving rise to both primary and relapse Ewing sarcoma tumors, which can continue to evolve in parallel.
Analysis of the sequence context surrounding chromoplexy breaks may provide clues and potentially point to a therapeutic vulnerability that could be used to treat Ewing sarcomas. Further, given the preference of chromoplexy events for transcriptionally active regions, Ewing sarcomas arising from chromoplexy may be responsive to immune checkpoint inhibition.
In a study of the whole genomes of 124 Ewing sarcomas, chromoplexy rather than simple reciprocal translocations defined the gene fusions seen in 52 tumors (42%). Ewing sarcoma involves fusions between EWSR1, a gene encoding an RNA binding protein, and E26 transformation-specific (ETS) transcription factors.
“Our analyses reveal rearrangement bursts (chromoplectic loops) as a source of gene fusion in human bone and soft tissue tumors. Ewing sarcomas with complex karyotypes are associated with a poorer prognosis than those with simpler karyotypes, and here we show chromoplexy as the mechanism in 42% of tumors. It is possible that the chromoplectic tumor’s additional gene disruptions and fusions contribute to the difference in patient survival,” wrote Nathaniel D. Anderson of the Hospital for Sick Children, Toronto, and the University of Toronto, and his colleagues.
Standard reciprocal translocations involve DNA breaks in two fusion partners. Chromoplexy involves three or more breakpoints in the genome. A loop pattern emerges as these three or more broken chromosome ends are forced to find a new partner. The result is the formation of functional EWSR1-FLI1 or EWSR1-ERG fusions that, upon expression, provide a selective growth or survival advantage
The researchers found that the loop rearrangements always contained the disease-defining fusion at the center, but they disrupted multiple additional genes. The loops occurred preferentially in early replicating and transcriptionally active genomic regions.
They found similar loops forming canonical fusions in three other sarcoma types.
“Our whole-genome sequence data support a model in which there is an early clone of (Ewing sarcoma), containing EWSR1-ETS and chromoplexy, arising at least 1 year before diagnosis, which gives rise to both the primary and metastatic or relapse tumors. Whether the bursts ... are chance events or driven by specific mutational processes, akin to the RAG machinery operative in leukemia, remains to be established. As an increasing and diverse number of tumor genome sequences become available, we may be able to define further rearrangement processes that underlie fusion genes and thus unravel the causes of fusion-driven human cancers,” the researchers wrote.
The clinical features and demographics of the study patients were typical of Ewing sarcoma patients. Average patient age at diagnosis was 14.8 years (2.8 to 36.6 years); the male to female ratio was 1.38:1; and 14 patients had relapsed, with 13 having died from their disease.
About half of fusions between the EWS RNA binding protein 1 (EWSR1) gene on chromosome 22 and an E26 transformation-specific (ETS) family transcription factor gene, either FLI1 at 11q24 or ERG at 21q11 arose via chromoplexy.
SOURCE: Anderson et al. Science 2018 Aug 31. doi: 10.1126/science.aam8419.
The contribution of genetic analysis to the current standard of care for Ewing sarcoma is limited to confirmation of the diagnostic EWSR1-FLI1 or EWSR1-ERG fusions. The discovery of genomic patterns associated with subsets of Ewing sarcomas raises the question of whether additional molecular diagnostic modalities are warranted. If chromoplexy events are important clinical biomarkers for disease aggressiveness in this tumor, as the authors suggest, their findings may support a new indication for clinical whole genome sequencing.
Analysis of additional patient samples will be needed, however, to confirm that the presence of chromoplexy is an independent prognostic predictor in Ewing sarcoma. This is because the researchers find that chromoplexy-driven Ewing sarcoma more likely contains tumor protein 53 (TP53) mutations. Because TP53 and stromal antigen 2 (STAG2) mutations and genomic complexity have each been associated with more aggressive Ewing sarcoma, dissecting the contribution of these factors to poor clinical outcomes in chromoplexy-derived Ewing sarcoma will be an important area of future work.
More generally, the study has important clinical implications for the genomic diagnosis of these and other cancers, as well as the expanding biological role of complex rearrangements in cancer evolution.
Could chromoplexy events in Ewing sarcoma be linked, for example, to the activity of an aberrantly expressed endogenous transposase such as PiggyBac transposase 5 (PGBD5), which was recently implicated in the genesis of the pathogenic gene rearrangements in childhood malignant rhabdoid tumors? An alternative possibility is a constitutional or acquired DNA repair defect (Science 2018 Aug 31. doi: 10.1126/science.aau8231).
Marcin Imielinski is with the Meyer Cancer Center, Cornell University, and the New York Genome Center, New York. Marc Ladanyi is with Memorial Sloan Kettering Cancer Center, New York. They made their remarks in an editorial in Science that accompanied the study.
Chromoplexy, a sudden burst of complex, loop-like gene rearrangements that gives rise to a fusion gene, appears to be associated with aggressive Ewing sarcomas, based on a study of 124 tumors reported in Science.
Ewing sarcomas with complex karyotypes are associated with a poorer prognosis compared with those with simpler karyotypes. The new findings show that these complex karyotypes are the product of chromoplexy, and that chromoplexy-generated fusions arise early, giving rise to both primary and relapse Ewing sarcoma tumors, which can continue to evolve in parallel.
Analysis of the sequence context surrounding chromoplexy breaks may provide clues and potentially point to a therapeutic vulnerability that could be used to treat Ewing sarcomas. Further, given the preference of chromoplexy events for transcriptionally active regions, Ewing sarcomas arising from chromoplexy may be responsive to immune checkpoint inhibition.
In a study of the whole genomes of 124 Ewing sarcomas, chromoplexy rather than simple reciprocal translocations defined the gene fusions seen in 52 tumors (42%). Ewing sarcoma involves fusions between EWSR1, a gene encoding an RNA binding protein, and E26 transformation-specific (ETS) transcription factors.
“Our analyses reveal rearrangement bursts (chromoplectic loops) as a source of gene fusion in human bone and soft tissue tumors. Ewing sarcomas with complex karyotypes are associated with a poorer prognosis than those with simpler karyotypes, and here we show chromoplexy as the mechanism in 42% of tumors. It is possible that the chromoplectic tumor’s additional gene disruptions and fusions contribute to the difference in patient survival,” wrote Nathaniel D. Anderson of the Hospital for Sick Children, Toronto, and the University of Toronto, and his colleagues.
Standard reciprocal translocations involve DNA breaks in two fusion partners. Chromoplexy involves three or more breakpoints in the genome. A loop pattern emerges as these three or more broken chromosome ends are forced to find a new partner. The result is the formation of functional EWSR1-FLI1 or EWSR1-ERG fusions that, upon expression, provide a selective growth or survival advantage
The researchers found that the loop rearrangements always contained the disease-defining fusion at the center, but they disrupted multiple additional genes. The loops occurred preferentially in early replicating and transcriptionally active genomic regions.
They found similar loops forming canonical fusions in three other sarcoma types.
“Our whole-genome sequence data support a model in which there is an early clone of (Ewing sarcoma), containing EWSR1-ETS and chromoplexy, arising at least 1 year before diagnosis, which gives rise to both the primary and metastatic or relapse tumors. Whether the bursts ... are chance events or driven by specific mutational processes, akin to the RAG machinery operative in leukemia, remains to be established. As an increasing and diverse number of tumor genome sequences become available, we may be able to define further rearrangement processes that underlie fusion genes and thus unravel the causes of fusion-driven human cancers,” the researchers wrote.
The clinical features and demographics of the study patients were typical of Ewing sarcoma patients. Average patient age at diagnosis was 14.8 years (2.8 to 36.6 years); the male to female ratio was 1.38:1; and 14 patients had relapsed, with 13 having died from their disease.
About half of fusions between the EWS RNA binding protein 1 (EWSR1) gene on chromosome 22 and an E26 transformation-specific (ETS) family transcription factor gene, either FLI1 at 11q24 or ERG at 21q11 arose via chromoplexy.
SOURCE: Anderson et al. Science 2018 Aug 31. doi: 10.1126/science.aam8419.
FROM SCIENCE
Key clinical point: Chromoplexy, a sudden burst of complex, loop-like gene rearrangements that gives rise to a fusion gene, appears to be associated with aggressive Ewing sarcomas.
Major finding: Chromoplexy rather than simple reciprocal translocations defined the gene fusions seen in 42% of Ewing sarcoma tumors.
Study details: A study of the whole genomes of 124 Ewing sarcomas.
Disclosures: This research project was conducted with support from C17 and partially funded by Ewings Cancer Foundation of Canada and Childhood Cancer Canada Foundation. The authors declared no competing interests.
Source: Anderson et al. Science 2018 Aug 31. doi: 10.1126/science.aam8419.
Tribulus terrestris
A member of the Zygophyllaceae family, Tribulus terrestris, also known as Gokshura, Gokharu, or puncture vine, is an annual herb; its aerial parts, roots, and fruits have been used in traditional medicine for anti-inflammatory, diuretic, tonic, antimicrobial, and aphrodisiac purposes for thousands of years in China, India, Pakistan, and Sudan.1-3 In modern times, the health benefits of T. terrestris have been attributed to the constituent saponins, flavonoids, alkaloids, lignins, amides, and glycosides that have been isolated and found as bioactive compounds in the plant.2-4

In an ethnobotanical survey of medicinal plants used in Nepal that was conducted in 2010 and 2011, Singh et al. found that T. terrestris was one of the 66 plant species important in the region. They also reported that it is one of the threatened species requiring conservation efforts.5 Although T. terrestris has long had a reputation for aphrodisiac qualities, critical reviews of the literature have undermined this historical reputation.1,6 Nevertheless, the botanical agent is used most often to treat infertility and loss of libido.4 More germane to the dermatologic realm, T. terrestris is thought to exhibit antioxidant, anticarcinogenic, and immunomodulatory potential, among other health benefits.4
Skin lightening activity
In a study published in 2002, Deng et al. evaluated the effects of a decoction of T. terrestris on tyrosinase activity and melanogenesis on cultured human melanocytes. They found that the amount of melanin increased when the decoction was administered in higher concentrations (optimally 1.5 mg/mL) but the effects were reversed at lower concentrations (0.5 mg/mL). Similarly, tyrosinase activity was facilitated by high concentrations of the decoction (optimally 100 mg/mL) and hindered at low concentrations (10 mg/mL). The investigators concluded that T. terrestris showed intriguing potential for use as a skin lightening agent that warranted further study.7
A mouse study performed by Yang et al. in 2006 revealed that T. terrestris extract administered orally to C57BL/6J mice resulted in a significantly higher expression of melanocyte-stimulating hormone in the hair follicles of treated mice (75%), compared with that in the control group (18.75%). The researchers concluded that T. terrestris galvanizes tyrosinase activity and fosters melanocyte increase, melanin production, and the epidermal movement of dormant melanocytes.8
Anticancer activity
Kumar et al. showed in 2006 that the aqueous extracts of T. terrestris roots and fruits displayed chemopreventive activity in male Swiss albino mice. Specifically, oral administration of T. terrestris before, during, and after papillomagenesis induced by 7, 12-Dimethylbenz(a)anthracene (DMBA) resulted in significant decreases in tumor incidence, tumor burden, and cumulative number of papillomas, as well as a significant increase in average latent period as compared with the control group treated with DMBA and croton oil.9
The next year, Neychev et al. published a study on the effects of T. terrestris–derived saponins on normal human skin fibroblasts with a focus on anticancer activities. The researchers noted that the botanical engendered a dose-dependent reduction in [3H]-thymidine incorporation into the DNA of treated fibroblasts, which was not the case for untreated controls. This and several other metrics suggested that T. terrestris poses much less toxicity to normal human skin fibroblasts than multiple previously explored cancer lines by virtue of the up-regulation and down-regulation of polyamine homeostasis, hampering proliferation, and apoptosis induction.10 
In 2012, Sisto et al. investigated the effects of T. terrestris–derived saponins on apoptosis in normal human keratinocytes exposed to UVB, as well as their antitumoral activity. They found that the saponins blunted UVB-induced apoptosis in normal human keratinocytes and did not render malignant keratinocytes more resistant to UVB in squamous cell carcinomas. The investigators concluded that their findings suggest a preventive capacity of T. terrestris against UVB-induced damage and carcinogenesis.11
Conclusion
As is the case with numerous botanical agents used for health purposes, where there’s smoke, there’s fire. That is, T. terrestris has warranted investigation for its applicability in the modern health armamentarium. I hope that conservation efforts for this plant will prevail, as much more research is necessary to determine whether it can become useful in the dermatologic realm.
Dr. Baumann is a private practice dermatologist, researcher, author, and entrepreneur who practices in Miami. She founded the Cosmetic Dermatology Center at the University of Miami in 1997. Dr. Baumann has written two textbooks: “Cosmetic Dermatology: Principles and Practice” (New York: McGraw-Hill, 2002) and “Cosmeceuticals and Cosmetic Ingredients” (New York: McGraw-Hill, 2014), as well as a New York Times Best Sellers book for consumers,“The Skin Type Solution” (New York: Bantam Dell, 2006). Dr. Baumann has received funding for advisory boards and/or clinical research trials from Allergan, Evolus, Galderma, and Revance. She is the founder and CEO of Skin Type Solutions Franchise Systems.
References
1. Qureshi A et al. J Diet Suppl. 2014 Mar;11(1):64-79.
2. Zhu W et al. Chem Cent J. 2017 Jul 11;11(1):60.
3. Chhatre S et al. Pharmacogn Rev. 2014 Jan;8(15):45-51
4. Shahid M et al. J Biol Regul Homeost Agents. 2016 Jul-Sep;30(3):785-8.
5. Singh AG et al. J Ethnobiol Ethnomed. 2012 May 16;8:19.
6. Neychev V et al. J Ethnopharmacol. 2016 Feb 17;179:345-55.
7. Deng Y et al. Di Yi Jun Yi Da Xue Xue Bao. 2002 Nov;22(11):1017-9.
8. Yang L et al. Nan Fang Yi Ke Da Xue Xue Bao. 2006 Dec;26(12):1777-9.
9. Kumar M et al. Asian Pac J Cancer Prev. 2006 Apr-Jun;7(2):289-94.
10. Neychev VK et al. Exp Biol Med (Maywood). 2007 Jan;232(1):126-33.
11. Sisto M et al. J Photochem Photobiol B. 2012 Dec 5;117:193-201.
A member of the Zygophyllaceae family, Tribulus terrestris, also known as Gokshura, Gokharu, or puncture vine, is an annual herb; its aerial parts, roots, and fruits have been used in traditional medicine for anti-inflammatory, diuretic, tonic, antimicrobial, and aphrodisiac purposes for thousands of years in China, India, Pakistan, and Sudan.1-3 In modern times, the health benefits of T. terrestris have been attributed to the constituent saponins, flavonoids, alkaloids, lignins, amides, and glycosides that have been isolated and found as bioactive compounds in the plant.2-4
In an ethnobotanical survey of medicinal plants used in Nepal that was conducted in 2010 and 2011, Singh et al. found that T. terrestris was one of the 66 plant species important in the region. They also reported that it is one of the threatened species requiring conservation efforts.5 Although T. terrestris has long had a reputation for aphrodisiac qualities, critical reviews of the literature have undermined this historical reputation.1,6 Nevertheless, the botanical agent is used most often to treat infertility and loss of libido.4 More germane to the dermatologic realm, T. terrestris is thought to exhibit antioxidant, anticarcinogenic, and immunomodulatory potential, among other health benefits.4
Skin lightening activity
In a study published in 2002, Deng et al. evaluated the effects of a decoction of T. terrestris on tyrosinase activity and melanogenesis on cultured human melanocytes. They found that the amount of melanin increased when the decoction was administered in higher concentrations (optimally 1.5 mg/mL) but the effects were reversed at lower concentrations (0.5 mg/mL). Similarly, tyrosinase activity was facilitated by high concentrations of the decoction (optimally 100 mg/mL) and hindered at low concentrations (10 mg/mL). The investigators concluded that T. terrestris showed intriguing potential for use as a skin lightening agent that warranted further study.7
A mouse study performed by Yang et al. in 2006 revealed that T. terrestris extract administered orally to C57BL/6J mice resulted in a significantly higher expression of melanocyte-stimulating hormone in the hair follicles of treated mice (75%), compared with that in the control group (18.75%). The researchers concluded that T. terrestris galvanizes tyrosinase activity and fosters melanocyte increase, melanin production, and the epidermal movement of dormant melanocytes.8
Anticancer activity
Kumar et al. showed in 2006 that the aqueous extracts of T. terrestris roots and fruits displayed chemopreventive activity in male Swiss albino mice. Specifically, oral administration of T. terrestris before, during, and after papillomagenesis induced by 7, 12-Dimethylbenz(a)anthracene (DMBA) resulted in significant decreases in tumor incidence, tumor burden, and cumulative number of papillomas, as well as a significant increase in average latent period as compared with the control group treated with DMBA and croton oil.9
The next year, Neychev et al. published a study on the effects of T. terrestris–derived saponins on normal human skin fibroblasts with a focus on anticancer activities. The researchers noted that the botanical engendered a dose-dependent reduction in [3H]-thymidine incorporation into the DNA of treated fibroblasts, which was not the case for untreated controls. This and several other metrics suggested that T. terrestris poses much less toxicity to normal human skin fibroblasts than multiple previously explored cancer lines by virtue of the up-regulation and down-regulation of polyamine homeostasis, hampering proliferation, and apoptosis induction.10
In 2012, Sisto et al. investigated the effects of T. terrestris–derived saponins on apoptosis in normal human keratinocytes exposed to UVB, as well as their antitumoral activity. They found that the saponins blunted UVB-induced apoptosis in normal human keratinocytes and did not render malignant keratinocytes more resistant to UVB in squamous cell carcinomas. The investigators concluded that their findings suggest a preventive capacity of T. terrestris against UVB-induced damage and carcinogenesis.11
Conclusion
As is the case with numerous botanical agents used for health purposes, where there’s smoke, there’s fire. That is, T. terrestris has warranted investigation for its applicability in the modern health armamentarium. I hope that conservation efforts for this plant will prevail, as much more research is necessary to determine whether it can become useful in the dermatologic realm.
Dr. Baumann is a private practice dermatologist, researcher, author, and entrepreneur who practices in Miami. She founded the Cosmetic Dermatology Center at the University of Miami in 1997. Dr. Baumann has written two textbooks: “Cosmetic Dermatology: Principles and Practice” (New York: McGraw-Hill, 2002) and “Cosmeceuticals and Cosmetic Ingredients” (New York: McGraw-Hill, 2014), as well as a New York Times Best Sellers book for consumers,“The Skin Type Solution” (New York: Bantam Dell, 2006). Dr. Baumann has received funding for advisory boards and/or clinical research trials from Allergan, Evolus, Galderma, and Revance. She is the founder and CEO of Skin Type Solutions Franchise Systems.
References
1. Qureshi A et al. J Diet Suppl. 2014 Mar;11(1):64-79.
2. Zhu W et al. Chem Cent J. 2017 Jul 11;11(1):60.
3. Chhatre S et al. Pharmacogn Rev. 2014 Jan;8(15):45-51
4. Shahid M et al. J Biol Regul Homeost Agents. 2016 Jul-Sep;30(3):785-8.
5. Singh AG et al. J Ethnobiol Ethnomed. 2012 May 16;8:19.
6. Neychev V et al. J Ethnopharmacol. 2016 Feb 17;179:345-55.
7. Deng Y et al. Di Yi Jun Yi Da Xue Xue Bao. 2002 Nov;22(11):1017-9.
8. Yang L et al. Nan Fang Yi Ke Da Xue Xue Bao. 2006 Dec;26(12):1777-9.
9. Kumar M et al. Asian Pac J Cancer Prev. 2006 Apr-Jun;7(2):289-94.
10. Neychev VK et al. Exp Biol Med (Maywood). 2007 Jan;232(1):126-33.
11. Sisto M et al. J Photochem Photobiol B. 2012 Dec 5;117:193-201.
Association Between Postdischarge Emergency Department Visitation and Readmission Rates
Hospital readmissions for acute myocardial infarction (AMI), heart failure, and pneumonia have become central to quality-measurement efforts by the Centers for Medicare & Medicaid Services (CMS), which seek to improve hospital care transitions through public reporting and payment programs.1 Most current measures are limited to readmissions that require inpatient hospitalization and do not capture return visits to the emergency department (ED) that do not result in readmission but rather ED discharge. These visits may reflect important needs for acute, unscheduled care during the vulnerable posthospitalization period.2-5 While previous research has suggested that nearly 10% of patients may return to the ED following hospital discharge without readmission, the characteristics of these visits among Medicare beneficiaries and the implications for national care-coordination quality-measurement initiatives have not been explored.6,7
As the locus of acute outpatient care and the primary portal of hospital admissions and readmissions, ED visits following hospital discharge may convey meaningful information about posthospitalization care transitions.8,9 In addition, recent reviews and perspectives have highlighted the role of ED care-coordination services as interventions to reduce inpatient hospitalizations and improve care transitions,10,11 yet no empirical studies have evaluated the relationship between these unique care-coordination opportunities in the ED and care-coordination outcomes, such as hospital readmissions. As policymakers seek to develop accountability measures that capture the totality of acute, unscheduled visits following hospital discharge, describing the relationship between ED visits and readmissions will be essential to providers for benchmarking and to policymakers and payers seeking to reduce the total cost of care.12,13
Accordingly, we sought to characterize the frequency, diagnoses, and hospital-level variation in treat-and-discharge ED visitation following hospital discharge for 3 conditions for which hospital readmission is publicly reported by the CMS: AMI, heart failure, and pneumonia. We also sought to evaluate the relationship between hospital-level ED visitation following hospital discharge and publicly reported, risk-standardized readmission rates (RSRRs).
METHODS
Study Design
This study was a cross-sectional analysis of Medicare beneficiaries discharged alive following hospitalization for AMI, heart failure, and pneumonia between July 2011 and June 2012.
Selection of Participants
We used Medicare Standard Analytic Files to identify inpatient hospitalizations for each disease cohort based on principal discharge diagnoses. Each condition-specific cohort was constructed to be consistent with the CMS’s readmission measures using International Classification of Diseases, 9th Revision-Clinical Modification codes to identify AMI, heart failure, and pneumonia discharges.1 We included only patients who were enrolled in fee-for-service (FFS) Medicare parts A and B for 12 months prior to their index hospitalization to maximize the capture of diagnoses for risk adjustment. Each cohort included only patients who were discharged alive while maintaining FFS coverage for at least 30 days following hospital discharge to minimize bias in outcome ascertainment. We excluded patients who were discharged against medical advice. All contiguous admissions that were identified in a transfer chain were considered to be a single admission. Hospitals with fewer than 25 condition-specific index hospital admissions were excluded from this analysis for consistency with publicly reported measures.1
Measurements
Outcomes
We describe hospital-level, postdischarge ED visitation as the risk-standardized postdischarge ED visit rate. The general construct of this measure is consistent with those of prior studies that define postdischarge ED visitation as the proportion of index admissions followed by a treat-and-discharge ED visit without hospital readmission2,3; however, this outcome also incorporates a risk-standardization model with covariates that are identical to the risk-standardization approach that is used for readmission measurement.
We describe hospital-level readmission by calculating RSRRs consistent with CMS readmission measures, which are endorsed by the National Quality Forum and used for public reporting.15-17 Detailed technical documentation, including the SAS code used to replicate hospital-level measures of readmission, are available publicly through the CMS QualityNet portal.18
We calculated risk-standardized postdischarge ED visit rates and RSRRs as the ratio of the predicted number of postdischarge ED visits or readmissions for a hospital given its observed case mix to the expected number of postdischarge ED visits or readmissions based on the nation’s performance with that hospital’s case mix, respectively. This approach estimates a distinct risk-standardized postdischarge ED visit rate and RSRR for each hospital using hierarchical generalized linear models (HGLMs) and using a logit link with a first-level adjustment for age, sex, 29 clinical covariates for AMI, 35 clinical covariates for heart failure, and 38 clinical covariates for pneumonia. Each clinical covariate is identified based on inpatient and outpatient claims during the 12 months prior to the index hospitalization. The second level of the HGLM includes a random hospital-level intercept. This approach to measuring hospital readmissions accounts for the correlated nature of observed readmission rates within a hospital and reflects the assumption that after adjustment for patient characteristics and sampling variability, the remaining variation in postdischarge ED visit rates or readmission rates reflects hospital quality.
Analysis
In order to characterize treat-and-discharge postdischarge ED visits, we first described the clinical conditions that were evaluated during the first postdischarge ED visit. Based on the principal discharge diagnosis, ED visits were grouped into clinically meaningful categories using the Agency for Healthcare Research and Quality Clinical Classifications Software (CCS).19 We also report hospital-level variation in risk-standardized postdischarge ED visit rates for AMI, heart failure, and pneumonia.
Next, we examined the relationship between hospital characteristics and risk-standardized postdischarge ED visit rates. We linked hospital characteristics from the American Hospital Association (AHA) Annual Survey to the study dataset, including the following: safety-net status, teaching status, and urban or rural status. Consistent with prior work, hospital safety-net status was defined as a hospital Medicaid caseload greater than 1 standard deviation above the mean Medicaid caseload in the hospital’s state. Approximately 94% of the hospitals included in the 3 condition cohorts in the dataset had complete data in the 2011 AHA Annual Survey to be included in this analysis.
We evaluated the relationship between postdischarge ED visit rates and hospital readmission rates in 2 ways. First, we calculated Spearman rank correlation coefficients between hospital-level, risk-standardized postdischarge ED visit rates and RSRRs. Second, we calculated hospital-level variation in RSRRs based on the strata of risk-standardized postdischarge ED visit rates. Given the normal distribution of postdischarge ED visit rates, we grouped hospitals by quartile of postdischarge ED visit rates and 1 group for hospitals with no postdischarge ED visits.
Based on preliminary analyses indicating a relationship between hospital size, measured by condition-specific index hospitalization volume, and postdischarge treat-and-discharge ED visit rates, all descriptive statistics and correlations reported are weighted by the volume of condition-specific index hospitalizations. The study was approved by the Yale University Human Research Protection Program. All analyses were conducted using SAS 9.1 (SAS Institute Inc, Cary, NC). The analytic plan and results reported in this work are in compliance with the Strengthening the Reporting of Observational Studies in Epidemiology checklist.20
RESULTS
During the 1-year study period, we included a total of 157,035 patients who were hospitalized at 1656 hospitals for AMI, 391,209 at 3044 hospitals for heart failure, and 342,376 at 3484 hospitals for pneumonia. Details of study cohort creation are available in supplementary Table 1. After hospitalization for AMI, 14,714 patients experienced a postdischarge ED visit (8.4%) and 27,214 an inpatient readmissions (17.3%) within 30 days of discharge; 31,621 (7.6%) and 88,106 (22.5%) patients after hospitalization for heart failure and 26,681 (7.4%) and 59,352 (17.3%) patients after hospitalization for pneumonia experienced a postdischarge ED visit and an inpatient readmission within 30 days of discharge, respectively.
Postdischarge ED visits were for a wide variety of conditions, with the top 10 CCS categories comprising 44% of postdischarge ED visits following AMI hospitalizations, 44% of following heart failure hospitalizations, and 41% following pneumonia hospitalizations (supplementary Table 2). The first postdischarge ED visit was rarely for the same condition as the index hospitalization in the AMI cohort (224 visits; 1.5%) as well as the pneumonia cohort (1401 visits; 5.3%). Among patients who were originally admitted for heart failure, 10.6% of the first postdischarge ED visits were also for congestive heart failure.
We found wide hospital-level variation in postdischarge ED visit rates for each condition: AMI (median: 8.3%; 5th and 95th percentile: 2.8%-14.3%), heart failure (median: 7.3%; 5th and 95th percentile: 3.0%-13.3%), and pneumonia (median: 7.1%; 5th and 95th percentile: 2.4%-13.2%; supplementary Table 3). The variation persisted after accounting for hospital case mix, as evidenced in the supplementary Figure, which describes hospital variation in risk-standardized postdischarge ED visit rates. This variation was statistically significant (P < .001), as demonstrated by the isolated relationship between the random effect and the outcome (AMI: random effect estimate 0.0849 [95% confidence interval (CI), 0.0832 to 0.0866]; heart failure: random effect estimate 0.0796 [95% CI, 0.0784 to 0.0809]; pneumonia: random effect estimate 0.0753 [95% CI, 0.0741 to 0.0764]).
Across all 3 conditions, hospitals located in rural areas had significantly higher risk-standardized postdischarge ED visit rates than hospitals located in urban areas (10.1% vs 8.6% for AMI, 8.4% vs 7.5% for heart failure, and 8.0% vs 7.4% for pneumonia). In comparison to teaching hospitals, nonteaching hospitals had significantly higher risk-standardized postdischarge ED visit rates following hospital discharge for pneumonia (7.6% vs 7.1%). Safety-net hospitals also had higher risk-standardized postdischarge ED visitation rates following discharge for heart failure (8.4% vs 7.7%) and pneumonia (7.7% vs 7.3%). Risk-standardized postdischarge ED visit rates were higher in publicly owned hospitals than in nonprofit or privately owned hospitals for heart failure (8.0% vs 7.5% in nonprofit hospitals or 7.5% in private hospitals) and pneumonia (7.7% vs 7.4% in nonprofit hospitals and 7.3% in private hospitals; Table).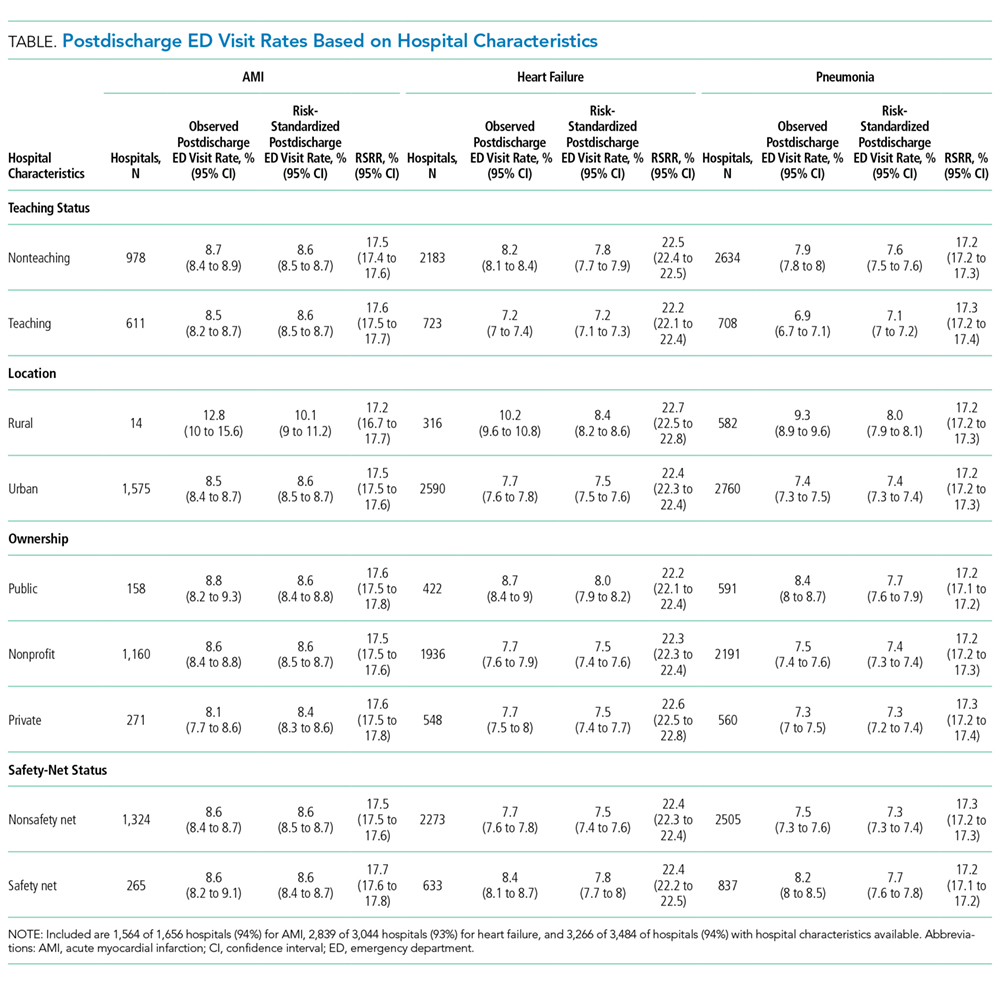
Among hospitals with RSRRs that were publicly reported by CMS, we found a moderate inverse correlation between risk-standardized postdischarge ED visit rates and hospital RSRRs for each condition: AMI (r = −0.23; 95% CI, −0.29 to −0.19), heart failure (r = −0.29; 95% CI, −0.34 to −0.27), and pneumonia (r = −0.18; 95% CI, −0.22 to −0.15; Figure).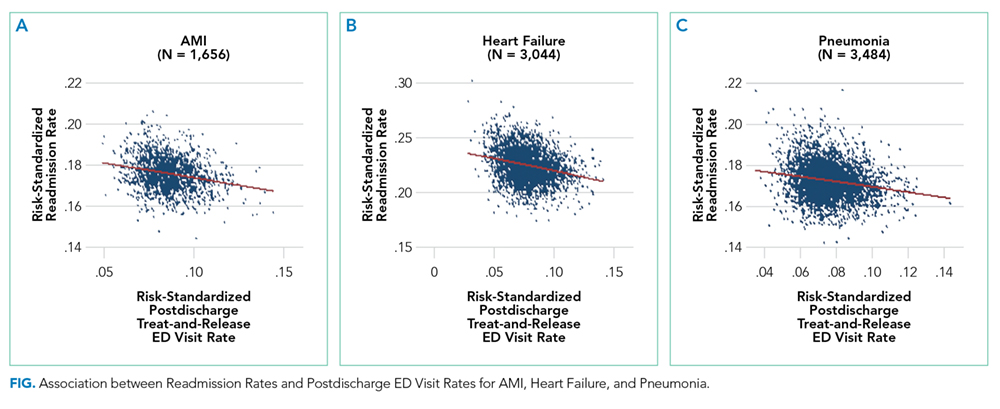
DISCUSSION
Across a national cohort of Medicare beneficiaries, we found frequent treat-and-discharge ED utilization following hospital discharge for AMI, heart failure, and pneumonia, suggesting that publicly reported readmission measures are capturing only a portion of postdischarge acute-care use. Our findings confirm prior work describing a 30-day postdischarge ED visit rate of 8% to 9% among Medicare beneficiaries for all hospitalizations in several states.3,6
We also described substantial hospital-level variation in risk-standardized ED postdischarge rates. Prior work by Vashi et al.3 demonstrated substantial variation in observed postdischarge ED visit rates and inpatient readmissions following hospital discharge between clinical conditions in a population-level study. Our work extends upon this by demonstrating hospital-level variation for 3 conditions of high volume and substantial policy importance after accounting for differences in hospital case mix. Interestingly, our work also found similar rates of postdischarge ED treat-and-discharge visitation as recent work by Sabbatini et al.23 analyzing an all-payer, adult population with any clinical condition. Taken together, these studies show the substantial volume of postdischarge acute-care utilization in the ED not captured by existing readmission measures.
We found several hospital characteristics of importance in describing variation in postdischarge ED visitation rates. Notably, hospitals located in rural areas and safety-net hospitals demonstrated higher postdischarge ED visitation rates. This may reflect a higher use of the ED as an acute, unscheduled care access point in rural communities without access to alternative acute diagnostic and treatment services.24 Similarly, safety-net hospitals may be more likely to provide unscheduled care for patients with poor access to primary care in the ED setting. Yet, consistent with prior work, our results also indicate that these differences do not result in different readmission rates.25 Regarding hospital teaching status, unlike prior work suggesting that teaching hospitals care for more safety-net Medicare beneficiaries,26 our work found opposite patterns of postdischarge ED visitation between hospital teaching and safety-net status following pneumonia hospitalization. This may reflect differences in the organization of acute care as patients with limited access to unscheduled primary and specialty care in safety-net communities utilize the ED, whereas patients in teaching-hospital communities may be able to access hospital-based clinics for care.
Contrary to the expectations of many clinicians and policymakers, we found an inverse relationship between postdischarge ED visit rates and readmission rates. While the cross-sectional design of our study cannot provide a causal explanation, these findings merit policy attention and future exploration of several hypotheses. One possible explanation for this finding is that hospitals with high postdischarge ED visit rates provide care in communities in which acute, unscheduled care is consolidated to the ED setting and thereby permits the ED to serve a gatekeeper function for scarce inpatient resources. This hypothesis may also be supported by recent interventions demonstrating that the use of ED care coordination and geriatric ED services at higher-volume EDs can reduce hospitalizations. Also, hospitals with greater ED capacity may have easier ED access and may be able to see patients earlier in their disease courses post discharge or more frequently in the ED for follow-up, therefore increasing ED visits but avoiding rehospitalization. Another possible explanation is that hospitals with lower postdischarge ED visit rates may also have a lower propensity to admit patients. Because our definition of postdischarge ED visitation did not include ED visits that result in hospitalization, hospitals with a lower propensity to admit from the ED may therefore appear to have higher ED visit rates. This explanation may be further supported by our finding that many postdischarge ED visits are for conditions that are associated with discretionary hospitalization in the ED.27 A third explanation for this finding may be that poor access to outpatient care outside the hospital setting results in higher postdischarge ED visit rates without increasing the acuity of these revisits or increasing readmission rates28; however, given the validated, risk-standardized approach to readmission measurement, this is unlikely. This is also unlikely given recent work by Sabbatini et al.23 demonstrating substantial acuity among patients who return to the ED following hospital discharge. Future work should seek to evaluate the relationship between the availability of ED care-coordination services and the specific ED, hospital, and community care-coordination activities undertaken in the ED following hospital discharge to reduce readmission rates.
This work should be interpreted within the confines of its design. First, it is possible that some of the variation detected in postdischarge ED visit rates is mediated by hospital-level variation in postdischarge observation visits that are not captured in this outcome. However, in previous work, we have demonstrated that almost one-third of hospitals have no postdischarge observation stays and that most postdischarge observation stays are for more than 24 hours, which is unlikely to reflect the intensity of care of postdischarge ED visits.27 Second, our analyses were limited to Medicare FFS beneficiaries, which may limit the generalizability of this work to other patient populations. However, this dataset did include a national cohort of Medicare beneficiaries that is identical to those included in publicly reported CMS readmission measures; therefore, these results have substantial policy relevance. Third, this work was limited to 3 conditions of high illness severity of policy focus, and future work applying similar analyses to less severe conditions may find different degrees of hospital-level variation in postdischarge outcomes that are amenable to quality improvement. Finally, we assessed the rate of treat-and-discharge ED visits only after hospital discharge; this understates the frequency of ED visits since repeat ED visits and ED visits resulting in rehospitalization are not included. However, our definition was designed to mirror the definition used to assess hospital readmissions for policy purposes and is a conservative approach.
In summary, ED visits following hospital discharge are common, as Medicare beneficiaries have 1 treat-and-discharge ED visit for every 2 readmissions within 30 days of hospital discharge. Postdischarge ED visits occur for a wide variety of conditions, with wide risk-standardized, hospital-level variation. Hospitals with the highest risk-standardized postdischarge ED visitation rates demonstrated lower RSRRs, suggesting that policymakers and researchers should further examine the role of the hospital-based ED in providing access to acute care and supporting care transitions for the vulnerable Medicare population.
Disclosure
Dr. Venkatesh received contract support from the CMS, an agency of the U.S. Department of Health & Human Services, and grant support from the Emergency Medicine Foundation’s Health Policy Research Scholar Award during the conduct of the study; and Dr. Wang, Mr. Wang, Ms. Altaf, Dr. Bernheim, and Dr. Horwitz received contract support from the CMS, an agency of the U.S. Department of Health & Human Services, during the conduct of the study.
1. Dorsey KB GJ, Desai N, Lindenauer P, et al. 2015 Condition-Specific Measures Updates and Specifications Report Hospital-Level 30-Day Risk-Standardized Readmission Measures: AMI-Version 8.0, HF-Version 8.0, Pneumonia-Version 8.0, COPD-Version 4.0, and Stroke-Version 4.0. 2015. https://www.qualitynet.org/dcs/BlobServer?blobkey=id&blobnocache=true&blobwhere=1228890435217&blobheader=multipart%2Foctet-stream&blobheadername1=Content-Disposition&blobheadervalue1=attachment%3Bfilename%3DRdmn_AMIHFPNCOPDSTK_Msr_UpdtRpt.pdf&blobcol=urldata&blobtable=MungoBlobs. Accessed on July 8, 2015.
2. Rising KL, White LF, Fernandez WG, Boutwell AE. Emergency department visits after hospital discharge: a missing part of the equation. Ann Emerg Med. 2013;62(2):145-150. PubMed
3. Vashi AA, Fox JP, Carr BG, et al. Use of hospital-based acute care among patients recently discharged from the hospital. JAMA. 2013;309(4):364-371. PubMed
4. Kocher KE, Nallamothu BK, Birkmeyer JD, Dimick JB. Emergency department visits after surgery are common for Medicare patients, suggesting opportunities to improve care. Health Aff (Millwood). 2013;32(9):1600-1607. PubMed
5. Krumholz HM. Post-hospital syndrome–an acquired, transient condition of generalized risk. N Engl J Med. 2013;368(2):100-102. PubMed
6. Baier RR, Gardner RL, Coleman EA, Jencks SF, Mor V, Gravenstein S. Shifting the dialogue from hospital readmissions to unplanned care. Am J Manag Care. 2013;19(6):450-453. PubMed
7. Schuur JD, Venkatesh AK. The growing role of emergency departments in hospital admissions. N Engl J Med. 2012;367(5):391-393. PubMed
8. Kocher KE, Dimick JB, Nallamothu BK. Changes in the source of unscheduled hospitalizations in the United States. Med Care. 2013;51(8):689-698. PubMed
9. Morganti KG, Bauhoff S, Blanchard JC, Abir M, Iyer N. The evolving role of emergency departments in the United States. Santa Monica, CA: Rand Corporation; 2013. PubMed
10. Katz EB, Carrier ER, Umscheid CA, Pines JM. Comparative effectiveness of care coordination interventions in the emergency department: a systematic review. Ann Emerg Med. 2012;60(1):12.e1-23.e1. PubMed
11. Jaquis WP, Kaplan JA, Carpenter C, et al. Transitions of Care Task Force Report. 2012. http://www.acep.org/workarea/DownloadAsset.aspx?id=91206. Accessed on January 2, 2016.
12. Horwitz LI, Wang C, Altaf FK, et al. Excess Days in Acute Care after Hospitalization for Heart Failure (Version 1.0) Final Measure Methodology Report. 2015. https://www.cms.gov/Medicare/Quality-Initiatives-Patient-Assessment-Instruments/HospitalQualityInits/Measure-Methodology.html. Accessed on January 2, 2016.
13. Horwitz LI, Wang C, Altaf FK, et al. Excess Days in Acute Care after Hospitalization for Acute Myocardial Infarction (Version 1.0) Final Measure Methodology Report. 2015. https://www.cms.gov/Medicare/Quality-Initiatives-Patient-Assessment-Instruments/HospitalQualityInits/Measure-Methodology.html. Accessed on January 2, 2016.
14. Hennessy S, Leonard CE, Freeman CP, et al. Validation of diagnostic codes for outpatient-originating sudden cardiac death and ventricular arrhythmia in Medicaid and Medicare claims data. Pharmacoepidemiol Drug Saf. 2010;19(6):555-562. PubMed
15. Krumholz H, Normand S, Keenan P, et al. Hospital 30-Day Acute Myocardial Infarction Readmission Measure Methodology. 2008. http://www.qualitynet.org/dcs/BlobServer?blobkey=id&blobnocache=true&blobwhere=1228873653724&blobheader=multipart%2Foctet-stream&blobheadername1=Content-Disposition&blobheadervalue1=attachment%3Bfilename%3DAMI_ReadmMeasMethod.pdf&blobcol=urldata&blobtable=MungoBlobs. Accessed on February 22, 2016.
16. Krumholz H, Normand S, Keenan P, et al. Hospital 30-Day Heart Failure Readmission Measure Methodology. 2008. http://69.28.93.62/wp-content/uploads/2017/01/2007-Baseline-info-on-Readmissions-krumholz.pdf. Accessed on February 22, 2016.
17. Krumholz H, Normand S, Keenan P, et al. Hospital 30-Day Pneumonia Readmission Measure Methodology. 2008. http://www.qualitynet.org/dcs/BlobServer?blobkey=id&blobnocache=true&blobwhere=1228873654295&blobheader=multipart%2Foctet-stream&blobheadername1=Content-Disposition&blobheadervalue1=attachment%3Bfilename%3DPneumo_ReadmMeasMethod.pdf&blobcol=urldata&blobtable=MungoBlobs. Accessed on February 22, 2016.
18. QualityNet. Claims-based measures: readmission measures. 2016. http://www.qualitynet.org/dcs/ContentServer?cid=1219069855273&pagename=QnetPublic%2FPage%2FQnetTier3. Accessed on December 14, 2017.
19. Agency for Healthcare Research and Quality. Clinical classifications software (CCS) for ICD-9-CM. Healthcare Cost and Utilization Project 2013; https://www.hcup-us.ahrq.gov/toolssoftware/ccs/ccs.jsp. Accessed December 14, 2017.
20. Von Elm E, Altman DG, Egger M, et al. The Strengthening the Reporting of Observational Studies in Epidemiology (STROBE) statement: guidelines for reporting observational studies. Prev Med. 2007;45(4):247-251. PubMed
21. Dharmarajan K, Hsieh AF, Lin Z, et al. Diagnoses and timing of 30-day readmissions after hospitalization for heart failure, acute myocardial infarction, or pneumonia. JAMA. 2013;309(4):355-363. PubMed
22. Venkatesh AK, Wang C, Ross JS, et al. Hospital Use of Observation Stays: Cross-Sectional Study of the Impact on Readmission Rates. Med Care. 2016;54(12):1070-1077. PubMed
23. Sabbatini AK, Kocher KE, Basu A, Hsia RY. In-hospital outcomes and costs among patients hospitalized during a return visit to the emergency department. JAMA. 2016;315(7):663-671. PubMed
24. Pitts SR, Carrier ER, Rich EC, Kellermann AL. Where Americans get acute care: increasingly, it’s not at their doctor’s office. Health Aff (Millwood). 2010;29(9):1620-1629. PubMed
25. Ross JS, Bernheim SM, Lin Z, et al. Based on key measures, care quality for Medicare enrollees at safety-net and non-safety-net hospitals was almost equal. Health Aff (Millwood). 2012;31(8):1739-1748. PubMed
26. Joynt KE, Orav EJ, Jha AK. Thirty-day readmission rates for Medicare beneficiaries by race and site of care. JAMA. 2011;305(7):675-681. PubMed
27. Venkatesh A, Wang C, Suter LG, et al. Hospital Use of Observation Stays: Cross-Sectional Study of the Impact on Readmission Rates. In: Academy Health Annual Research Meeting. San Diego, CA; 2014. PubMed
28. Pittsenbarger ZE, Thurm CW, Neuman MI, et al. Hospital-level factors associated with pediatric emergency department return visits. J Hosp Med. 2017;12(7):536-543. PubMed
Hospital readmissions for acute myocardial infarction (AMI), heart failure, and pneumonia have become central to quality-measurement efforts by the Centers for Medicare & Medicaid Services (CMS), which seek to improve hospital care transitions through public reporting and payment programs.1 Most current measures are limited to readmissions that require inpatient hospitalization and do not capture return visits to the emergency department (ED) that do not result in readmission but rather ED discharge. These visits may reflect important needs for acute, unscheduled care during the vulnerable posthospitalization period.2-5 While previous research has suggested that nearly 10% of patients may return to the ED following hospital discharge without readmission, the characteristics of these visits among Medicare beneficiaries and the implications for national care-coordination quality-measurement initiatives have not been explored.6,7
As the locus of acute outpatient care and the primary portal of hospital admissions and readmissions, ED visits following hospital discharge may convey meaningful information about posthospitalization care transitions.8,9 In addition, recent reviews and perspectives have highlighted the role of ED care-coordination services as interventions to reduce inpatient hospitalizations and improve care transitions,10,11 yet no empirical studies have evaluated the relationship between these unique care-coordination opportunities in the ED and care-coordination outcomes, such as hospital readmissions. As policymakers seek to develop accountability measures that capture the totality of acute, unscheduled visits following hospital discharge, describing the relationship between ED visits and readmissions will be essential to providers for benchmarking and to policymakers and payers seeking to reduce the total cost of care.12,13
Accordingly, we sought to characterize the frequency, diagnoses, and hospital-level variation in treat-and-discharge ED visitation following hospital discharge for 3 conditions for which hospital readmission is publicly reported by the CMS: AMI, heart failure, and pneumonia. We also sought to evaluate the relationship between hospital-level ED visitation following hospital discharge and publicly reported, risk-standardized readmission rates (RSRRs).
METHODS
Study Design
This study was a cross-sectional analysis of Medicare beneficiaries discharged alive following hospitalization for AMI, heart failure, and pneumonia between July 2011 and June 2012.
Selection of Participants
We used Medicare Standard Analytic Files to identify inpatient hospitalizations for each disease cohort based on principal discharge diagnoses. Each condition-specific cohort was constructed to be consistent with the CMS’s readmission measures using International Classification of Diseases, 9th Revision-Clinical Modification codes to identify AMI, heart failure, and pneumonia discharges.1 We included only patients who were enrolled in fee-for-service (FFS) Medicare parts A and B for 12 months prior to their index hospitalization to maximize the capture of diagnoses for risk adjustment. Each cohort included only patients who were discharged alive while maintaining FFS coverage for at least 30 days following hospital discharge to minimize bias in outcome ascertainment. We excluded patients who were discharged against medical advice. All contiguous admissions that were identified in a transfer chain were considered to be a single admission. Hospitals with fewer than 25 condition-specific index hospital admissions were excluded from this analysis for consistency with publicly reported measures.1
Measurements
Outcomes
We describe hospital-level, postdischarge ED visitation as the risk-standardized postdischarge ED visit rate. The general construct of this measure is consistent with those of prior studies that define postdischarge ED visitation as the proportion of index admissions followed by a treat-and-discharge ED visit without hospital readmission2,3; however, this outcome also incorporates a risk-standardization model with covariates that are identical to the risk-standardization approach that is used for readmission measurement.
We describe hospital-level readmission by calculating RSRRs consistent with CMS readmission measures, which are endorsed by the National Quality Forum and used for public reporting.15-17 Detailed technical documentation, including the SAS code used to replicate hospital-level measures of readmission, are available publicly through the CMS QualityNet portal.18
We calculated risk-standardized postdischarge ED visit rates and RSRRs as the ratio of the predicted number of postdischarge ED visits or readmissions for a hospital given its observed case mix to the expected number of postdischarge ED visits or readmissions based on the nation’s performance with that hospital’s case mix, respectively. This approach estimates a distinct risk-standardized postdischarge ED visit rate and RSRR for each hospital using hierarchical generalized linear models (HGLMs) and using a logit link with a first-level adjustment for age, sex, 29 clinical covariates for AMI, 35 clinical covariates for heart failure, and 38 clinical covariates for pneumonia. Each clinical covariate is identified based on inpatient and outpatient claims during the 12 months prior to the index hospitalization. The second level of the HGLM includes a random hospital-level intercept. This approach to measuring hospital readmissions accounts for the correlated nature of observed readmission rates within a hospital and reflects the assumption that after adjustment for patient characteristics and sampling variability, the remaining variation in postdischarge ED visit rates or readmission rates reflects hospital quality.
Analysis
In order to characterize treat-and-discharge postdischarge ED visits, we first described the clinical conditions that were evaluated during the first postdischarge ED visit. Based on the principal discharge diagnosis, ED visits were grouped into clinically meaningful categories using the Agency for Healthcare Research and Quality Clinical Classifications Software (CCS).19 We also report hospital-level variation in risk-standardized postdischarge ED visit rates for AMI, heart failure, and pneumonia.
Next, we examined the relationship between hospital characteristics and risk-standardized postdischarge ED visit rates. We linked hospital characteristics from the American Hospital Association (AHA) Annual Survey to the study dataset, including the following: safety-net status, teaching status, and urban or rural status. Consistent with prior work, hospital safety-net status was defined as a hospital Medicaid caseload greater than 1 standard deviation above the mean Medicaid caseload in the hospital’s state. Approximately 94% of the hospitals included in the 3 condition cohorts in the dataset had complete data in the 2011 AHA Annual Survey to be included in this analysis.
We evaluated the relationship between postdischarge ED visit rates and hospital readmission rates in 2 ways. First, we calculated Spearman rank correlation coefficients between hospital-level, risk-standardized postdischarge ED visit rates and RSRRs. Second, we calculated hospital-level variation in RSRRs based on the strata of risk-standardized postdischarge ED visit rates. Given the normal distribution of postdischarge ED visit rates, we grouped hospitals by quartile of postdischarge ED visit rates and 1 group for hospitals with no postdischarge ED visits.
Based on preliminary analyses indicating a relationship between hospital size, measured by condition-specific index hospitalization volume, and postdischarge treat-and-discharge ED visit rates, all descriptive statistics and correlations reported are weighted by the volume of condition-specific index hospitalizations. The study was approved by the Yale University Human Research Protection Program. All analyses were conducted using SAS 9.1 (SAS Institute Inc, Cary, NC). The analytic plan and results reported in this work are in compliance with the Strengthening the Reporting of Observational Studies in Epidemiology checklist.20
RESULTS
During the 1-year study period, we included a total of 157,035 patients who were hospitalized at 1656 hospitals for AMI, 391,209 at 3044 hospitals for heart failure, and 342,376 at 3484 hospitals for pneumonia. Details of study cohort creation are available in supplementary Table 1. After hospitalization for AMI, 14,714 patients experienced a postdischarge ED visit (8.4%) and 27,214 an inpatient readmissions (17.3%) within 30 days of discharge; 31,621 (7.6%) and 88,106 (22.5%) patients after hospitalization for heart failure and 26,681 (7.4%) and 59,352 (17.3%) patients after hospitalization for pneumonia experienced a postdischarge ED visit and an inpatient readmission within 30 days of discharge, respectively.
Postdischarge ED visits were for a wide variety of conditions, with the top 10 CCS categories comprising 44% of postdischarge ED visits following AMI hospitalizations, 44% of following heart failure hospitalizations, and 41% following pneumonia hospitalizations (supplementary Table 2). The first postdischarge ED visit was rarely for the same condition as the index hospitalization in the AMI cohort (224 visits; 1.5%) as well as the pneumonia cohort (1401 visits; 5.3%). Among patients who were originally admitted for heart failure, 10.6% of the first postdischarge ED visits were also for congestive heart failure.
We found wide hospital-level variation in postdischarge ED visit rates for each condition: AMI (median: 8.3%; 5th and 95th percentile: 2.8%-14.3%), heart failure (median: 7.3%; 5th and 95th percentile: 3.0%-13.3%), and pneumonia (median: 7.1%; 5th and 95th percentile: 2.4%-13.2%; supplementary Table 3). The variation persisted after accounting for hospital case mix, as evidenced in the supplementary Figure, which describes hospital variation in risk-standardized postdischarge ED visit rates. This variation was statistically significant (P < .001), as demonstrated by the isolated relationship between the random effect and the outcome (AMI: random effect estimate 0.0849 [95% confidence interval (CI), 0.0832 to 0.0866]; heart failure: random effect estimate 0.0796 [95% CI, 0.0784 to 0.0809]; pneumonia: random effect estimate 0.0753 [95% CI, 0.0741 to 0.0764]).
Across all 3 conditions, hospitals located in rural areas had significantly higher risk-standardized postdischarge ED visit rates than hospitals located in urban areas (10.1% vs 8.6% for AMI, 8.4% vs 7.5% for heart failure, and 8.0% vs 7.4% for pneumonia). In comparison to teaching hospitals, nonteaching hospitals had significantly higher risk-standardized postdischarge ED visit rates following hospital discharge for pneumonia (7.6% vs 7.1%). Safety-net hospitals also had higher risk-standardized postdischarge ED visitation rates following discharge for heart failure (8.4% vs 7.7%) and pneumonia (7.7% vs 7.3%). Risk-standardized postdischarge ED visit rates were higher in publicly owned hospitals than in nonprofit or privately owned hospitals for heart failure (8.0% vs 7.5% in nonprofit hospitals or 7.5% in private hospitals) and pneumonia (7.7% vs 7.4% in nonprofit hospitals and 7.3% in private hospitals; Table).
Among hospitals with RSRRs that were publicly reported by CMS, we found a moderate inverse correlation between risk-standardized postdischarge ED visit rates and hospital RSRRs for each condition: AMI (r = −0.23; 95% CI, −0.29 to −0.19), heart failure (r = −0.29; 95% CI, −0.34 to −0.27), and pneumonia (r = −0.18; 95% CI, −0.22 to −0.15; Figure).
DISCUSSION
Across a national cohort of Medicare beneficiaries, we found frequent treat-and-discharge ED utilization following hospital discharge for AMI, heart failure, and pneumonia, suggesting that publicly reported readmission measures are capturing only a portion of postdischarge acute-care use. Our findings confirm prior work describing a 30-day postdischarge ED visit rate of 8% to 9% among Medicare beneficiaries for all hospitalizations in several states.3,6
We also described substantial hospital-level variation in risk-standardized ED postdischarge rates. Prior work by Vashi et al.3 demonstrated substantial variation in observed postdischarge ED visit rates and inpatient readmissions following hospital discharge between clinical conditions in a population-level study. Our work extends upon this by demonstrating hospital-level variation for 3 conditions of high volume and substantial policy importance after accounting for differences in hospital case mix. Interestingly, our work also found similar rates of postdischarge ED treat-and-discharge visitation as recent work by Sabbatini et al.23 analyzing an all-payer, adult population with any clinical condition. Taken together, these studies show the substantial volume of postdischarge acute-care utilization in the ED not captured by existing readmission measures.
We found several hospital characteristics of importance in describing variation in postdischarge ED visitation rates. Notably, hospitals located in rural areas and safety-net hospitals demonstrated higher postdischarge ED visitation rates. This may reflect a higher use of the ED as an acute, unscheduled care access point in rural communities without access to alternative acute diagnostic and treatment services.24 Similarly, safety-net hospitals may be more likely to provide unscheduled care for patients with poor access to primary care in the ED setting. Yet, consistent with prior work, our results also indicate that these differences do not result in different readmission rates.25 Regarding hospital teaching status, unlike prior work suggesting that teaching hospitals care for more safety-net Medicare beneficiaries,26 our work found opposite patterns of postdischarge ED visitation between hospital teaching and safety-net status following pneumonia hospitalization. This may reflect differences in the organization of acute care as patients with limited access to unscheduled primary and specialty care in safety-net communities utilize the ED, whereas patients in teaching-hospital communities may be able to access hospital-based clinics for care.
Contrary to the expectations of many clinicians and policymakers, we found an inverse relationship between postdischarge ED visit rates and readmission rates. While the cross-sectional design of our study cannot provide a causal explanation, these findings merit policy attention and future exploration of several hypotheses. One possible explanation for this finding is that hospitals with high postdischarge ED visit rates provide care in communities in which acute, unscheduled care is consolidated to the ED setting and thereby permits the ED to serve a gatekeeper function for scarce inpatient resources. This hypothesis may also be supported by recent interventions demonstrating that the use of ED care coordination and geriatric ED services at higher-volume EDs can reduce hospitalizations. Also, hospitals with greater ED capacity may have easier ED access and may be able to see patients earlier in their disease courses post discharge or more frequently in the ED for follow-up, therefore increasing ED visits but avoiding rehospitalization. Another possible explanation is that hospitals with lower postdischarge ED visit rates may also have a lower propensity to admit patients. Because our definition of postdischarge ED visitation did not include ED visits that result in hospitalization, hospitals with a lower propensity to admit from the ED may therefore appear to have higher ED visit rates. This explanation may be further supported by our finding that many postdischarge ED visits are for conditions that are associated with discretionary hospitalization in the ED.27 A third explanation for this finding may be that poor access to outpatient care outside the hospital setting results in higher postdischarge ED visit rates without increasing the acuity of these revisits or increasing readmission rates28; however, given the validated, risk-standardized approach to readmission measurement, this is unlikely. This is also unlikely given recent work by Sabbatini et al.23 demonstrating substantial acuity among patients who return to the ED following hospital discharge. Future work should seek to evaluate the relationship between the availability of ED care-coordination services and the specific ED, hospital, and community care-coordination activities undertaken in the ED following hospital discharge to reduce readmission rates.
This work should be interpreted within the confines of its design. First, it is possible that some of the variation detected in postdischarge ED visit rates is mediated by hospital-level variation in postdischarge observation visits that are not captured in this outcome. However, in previous work, we have demonstrated that almost one-third of hospitals have no postdischarge observation stays and that most postdischarge observation stays are for more than 24 hours, which is unlikely to reflect the intensity of care of postdischarge ED visits.27 Second, our analyses were limited to Medicare FFS beneficiaries, which may limit the generalizability of this work to other patient populations. However, this dataset did include a national cohort of Medicare beneficiaries that is identical to those included in publicly reported CMS readmission measures; therefore, these results have substantial policy relevance. Third, this work was limited to 3 conditions of high illness severity of policy focus, and future work applying similar analyses to less severe conditions may find different degrees of hospital-level variation in postdischarge outcomes that are amenable to quality improvement. Finally, we assessed the rate of treat-and-discharge ED visits only after hospital discharge; this understates the frequency of ED visits since repeat ED visits and ED visits resulting in rehospitalization are not included. However, our definition was designed to mirror the definition used to assess hospital readmissions for policy purposes and is a conservative approach.
In summary, ED visits following hospital discharge are common, as Medicare beneficiaries have 1 treat-and-discharge ED visit for every 2 readmissions within 30 days of hospital discharge. Postdischarge ED visits occur for a wide variety of conditions, with wide risk-standardized, hospital-level variation. Hospitals with the highest risk-standardized postdischarge ED visitation rates demonstrated lower RSRRs, suggesting that policymakers and researchers should further examine the role of the hospital-based ED in providing access to acute care and supporting care transitions for the vulnerable Medicare population.
Disclosure
Dr. Venkatesh received contract support from the CMS, an agency of the U.S. Department of Health & Human Services, and grant support from the Emergency Medicine Foundation’s Health Policy Research Scholar Award during the conduct of the study; and Dr. Wang, Mr. Wang, Ms. Altaf, Dr. Bernheim, and Dr. Horwitz received contract support from the CMS, an agency of the U.S. Department of Health & Human Services, during the conduct of the study.
1. Dorsey KB GJ, Desai N, Lindenauer P, et al. 2015 Condition-Specific Measures Updates and Specifications Report Hospital-Level 30-Day Risk-Standardized Readmission Measures: AMI-Version 8.0, HF-Version 8.0, Pneumonia-Version 8.0, COPD-Version 4.0, and Stroke-Version 4.0. 2015. https://www.qualitynet.org/dcs/BlobServer?blobkey=id&blobnocache=true&blobwhere=1228890435217&blobheader=multipart%2Foctet-stream&blobheadername1=Content-Disposition&blobheadervalue1=attachment%3Bfilename%3DRdmn_AMIHFPNCOPDSTK_Msr_UpdtRpt.pdf&blobcol=urldata&blobtable=MungoBlobs. Accessed on July 8, 2015.
2. Rising KL, White LF, Fernandez WG, Boutwell AE. Emergency department visits after hospital discharge: a missing part of the equation. Ann Emerg Med. 2013;62(2):145-150. PubMed
3. Vashi AA, Fox JP, Carr BG, et al. Use of hospital-based acute care among patients recently discharged from the hospital. JAMA. 2013;309(4):364-371. PubMed
4. Kocher KE, Nallamothu BK, Birkmeyer JD, Dimick JB. Emergency department visits after surgery are common for Medicare patients, suggesting opportunities to improve care. Health Aff (Millwood). 2013;32(9):1600-1607. PubMed
5. Krumholz HM. Post-hospital syndrome–an acquired, transient condition of generalized risk. N Engl J Med. 2013;368(2):100-102. PubMed
6. Baier RR, Gardner RL, Coleman EA, Jencks SF, Mor V, Gravenstein S. Shifting the dialogue from hospital readmissions to unplanned care. Am J Manag Care. 2013;19(6):450-453. PubMed
7. Schuur JD, Venkatesh AK. The growing role of emergency departments in hospital admissions. N Engl J Med. 2012;367(5):391-393. PubMed
8. Kocher KE, Dimick JB, Nallamothu BK. Changes in the source of unscheduled hospitalizations in the United States. Med Care. 2013;51(8):689-698. PubMed
9. Morganti KG, Bauhoff S, Blanchard JC, Abir M, Iyer N. The evolving role of emergency departments in the United States. Santa Monica, CA: Rand Corporation; 2013. PubMed
10. Katz EB, Carrier ER, Umscheid CA, Pines JM. Comparative effectiveness of care coordination interventions in the emergency department: a systematic review. Ann Emerg Med. 2012;60(1):12.e1-23.e1. PubMed
11. Jaquis WP, Kaplan JA, Carpenter C, et al. Transitions of Care Task Force Report. 2012. http://www.acep.org/workarea/DownloadAsset.aspx?id=91206. Accessed on January 2, 2016.
12. Horwitz LI, Wang C, Altaf FK, et al. Excess Days in Acute Care after Hospitalization for Heart Failure (Version 1.0) Final Measure Methodology Report. 2015. https://www.cms.gov/Medicare/Quality-Initiatives-Patient-Assessment-Instruments/HospitalQualityInits/Measure-Methodology.html. Accessed on January 2, 2016.
13. Horwitz LI, Wang C, Altaf FK, et al. Excess Days in Acute Care after Hospitalization for Acute Myocardial Infarction (Version 1.0) Final Measure Methodology Report. 2015. https://www.cms.gov/Medicare/Quality-Initiatives-Patient-Assessment-Instruments/HospitalQualityInits/Measure-Methodology.html. Accessed on January 2, 2016.
14. Hennessy S, Leonard CE, Freeman CP, et al. Validation of diagnostic codes for outpatient-originating sudden cardiac death and ventricular arrhythmia in Medicaid and Medicare claims data. Pharmacoepidemiol Drug Saf. 2010;19(6):555-562. PubMed
15. Krumholz H, Normand S, Keenan P, et al. Hospital 30-Day Acute Myocardial Infarction Readmission Measure Methodology. 2008. http://www.qualitynet.org/dcs/BlobServer?blobkey=id&blobnocache=true&blobwhere=1228873653724&blobheader=multipart%2Foctet-stream&blobheadername1=Content-Disposition&blobheadervalue1=attachment%3Bfilename%3DAMI_ReadmMeasMethod.pdf&blobcol=urldata&blobtable=MungoBlobs. Accessed on February 22, 2016.
16. Krumholz H, Normand S, Keenan P, et al. Hospital 30-Day Heart Failure Readmission Measure Methodology. 2008. http://69.28.93.62/wp-content/uploads/2017/01/2007-Baseline-info-on-Readmissions-krumholz.pdf. Accessed on February 22, 2016.
17. Krumholz H, Normand S, Keenan P, et al. Hospital 30-Day Pneumonia Readmission Measure Methodology. 2008. http://www.qualitynet.org/dcs/BlobServer?blobkey=id&blobnocache=true&blobwhere=1228873654295&blobheader=multipart%2Foctet-stream&blobheadername1=Content-Disposition&blobheadervalue1=attachment%3Bfilename%3DPneumo_ReadmMeasMethod.pdf&blobcol=urldata&blobtable=MungoBlobs. Accessed on February 22, 2016.
18. QualityNet. Claims-based measures: readmission measures. 2016. http://www.qualitynet.org/dcs/ContentServer?cid=1219069855273&pagename=QnetPublic%2FPage%2FQnetTier3. Accessed on December 14, 2017.
19. Agency for Healthcare Research and Quality. Clinical classifications software (CCS) for ICD-9-CM. Healthcare Cost and Utilization Project 2013; https://www.hcup-us.ahrq.gov/toolssoftware/ccs/ccs.jsp. Accessed December 14, 2017.
20. Von Elm E, Altman DG, Egger M, et al. The Strengthening the Reporting of Observational Studies in Epidemiology (STROBE) statement: guidelines for reporting observational studies. Prev Med. 2007;45(4):247-251. PubMed
21. Dharmarajan K, Hsieh AF, Lin Z, et al. Diagnoses and timing of 30-day readmissions after hospitalization for heart failure, acute myocardial infarction, or pneumonia. JAMA. 2013;309(4):355-363. PubMed
22. Venkatesh AK, Wang C, Ross JS, et al. Hospital Use of Observation Stays: Cross-Sectional Study of the Impact on Readmission Rates. Med Care. 2016;54(12):1070-1077. PubMed
23. Sabbatini AK, Kocher KE, Basu A, Hsia RY. In-hospital outcomes and costs among patients hospitalized during a return visit to the emergency department. JAMA. 2016;315(7):663-671. PubMed
24. Pitts SR, Carrier ER, Rich EC, Kellermann AL. Where Americans get acute care: increasingly, it’s not at their doctor’s office. Health Aff (Millwood). 2010;29(9):1620-1629. PubMed
25. Ross JS, Bernheim SM, Lin Z, et al. Based on key measures, care quality for Medicare enrollees at safety-net and non-safety-net hospitals was almost equal. Health Aff (Millwood). 2012;31(8):1739-1748. PubMed
26. Joynt KE, Orav EJ, Jha AK. Thirty-day readmission rates for Medicare beneficiaries by race and site of care. JAMA. 2011;305(7):675-681. PubMed
27. Venkatesh A, Wang C, Suter LG, et al. Hospital Use of Observation Stays: Cross-Sectional Study of the Impact on Readmission Rates. In: Academy Health Annual Research Meeting. San Diego, CA; 2014. PubMed
28. Pittsenbarger ZE, Thurm CW, Neuman MI, et al. Hospital-level factors associated with pediatric emergency department return visits. J Hosp Med. 2017;12(7):536-543. PubMed
© 2018 Society of Hospital Medicine
The Burden of Guardianship: A Matched Cohort Study
A central tenet of modern medicine is that patients must provide fully informed consent to receive or refuse medical care offered by their clinical teams.1–4 If a patient is unable to make and communicate a choice or clearly indicate an understanding of the information presented, then he or she is considered to lack the capacity to make medical decisions and the medical team must seek consent from the patient’s surrogate decision-maker.2-7 Every U.S. state recognizes a patient’s healthcare proxy (HCP) and a court-appointed guardian as a legally recognized surrogate.8,9 Most of the states also have statutes or regulations establishing a hierarchy of legally recognized surrogate decision-makers in the absence of a HCP or a court-appointed guardian, such as spouses, adult children, parents, siblings, and grandparents.8,10 In states that do not have such a statute, hospitals develop their own institutional policies for surrogate decision-making.
However, there are important limitations on the authority of these surrogate decision-makers.10 For instance, patients may not have a family member or a friend to serve as a surrogate decision-maker, often family members cannot override a patient’s objection, even when that patient lacks decision-making capacity, and certain decisions require a guardian or a HCP.8-10 In these circumstances, the hospital must petition a court to appoint a guardian as a legally recognized surrogate decision-maker. This can be an involved family member, if one exists, or an independent, typically volunteer, guardian.11 The process of guardian appointment is complex7,11 and can range from a few days to more than a month, largely dependent on court dates and finding a volunteer guardian. Much of the process occurs during the patient’s hospital stay. This prolongation of hospitalization would be expected to increase health care costs and iatrogenic complications,12–14 but data quantifying these for patients requiring guardianship are lacking. The goal of this study was to describe the characteristics of patients who undergo the process of guardianship and measure the associated burdens. These burdens include the financial costs to the medical system, the prolonged length of stay beyond medical necessity, and the costs to the patient in the form of hospital-acquired complications. Investigating the burden of guardianship is an important first step in uncovering opportunities to improve the process. We hypothesized that patients requiring guardianship would have lengths of stay and healthcare costs that were at least as large as those for patients whose conditions required similar durations of hospitalization prior to medical clearance, in part due to iatrogenic complications that would accrue while awaiting guardian appointment.
METHODS
Setting
We conducted a retrospective matched cohort study of adult inpatients at Beth Israel Deaconess Medical Center (BIDMC), a 651-bed academic, tertiary care facility in Boston, MA. The study was approved by the BIDMC Institutional Review Board as a nonhuman subject research consistent with hospital operations.
Population
For this matched cohort study, we identified case patients as those hospitalized for any reason for whom guardianship proceedings were initiated and obtained; only the first hospitalization during which the guardianship was pursued was used. Cases were identified by obtaining the data of all patients for whom the BIDMC general counsel completed the process of guardianship between October 2014 and September 2015. At BIDMC, all the guardianship proceedings are referred to the general counsel.
To determine the postclearance experience for referred patients compared with that for other patients with similar lengths of stay up to those of the referred patients’ point of clearance, we identified up to three matched controls for each case (Supplemental Figure 1). Medical clearance was defined as the date when the patient was medically stable to be discharged from the hospital, and it was determined in an iterative manner. We identified controls as hospitalized patients admitted for any cause and matched to the cases requiring guardianship on discharging service and length of stay prior to clearance. Specifically, we identified patients on the same service as the case whose length of stay was at least as long as the length of stay of the case patient until medical clearance, as defined below. We then determined the total and the excess length of stay, defined as the duration beyond clearance for each case referred for guardianship; for controls, the ‘excess’ length of stay was the number of hospitalized days beyond the corresponding time that a matched case had been provided clearance. To account for seasonal influences and the training level of house officers, we selected the three controls whose discharge date was closest (before or after) to the discharge date of their matched case.
From legal team files, we identified 61 patients hospitalized at BIDMC for whom new guardianship was pursued to completion. Of these 61 patients, 10 could not be matched to an appropriate control and were included in descriptive analyses but not in comparisons with controls.
Covariates and Outcomes
We collected the details regarding age, gender, primary language, highest level of education, marital status, insurance status, race, date of admission, date of discharge, discharge disposition, principal diagnosis, case mix index (CMI), and discharging service from our administrative and billing data. Outcomes of interest included length of stay and total hospital charges that were collected from the same databases. We used hospital charges, rather than payments, to ensure uniformity across payers.
Chart Review
Unique to cases, a team of two medical residents (JP, RP) and a hospitalist (DR) determined the date of medical clearance and hospital-associated complications by a chart review. The date of medical clearance was then used to calculate excess length of stay, ie, the duration of stay beyond the date of medical clearance, by subtracting the time to medical clearance from the total inpatient length of stay.
We developed a novel algorithm to determine the date of medical clearance consistently (Figure 1). We first determined whether the discharge summary indicated a clear date of medical readiness for discharge. If the discharge summary was unclear, then a case management or a social work note was used. The date of medical clearance determined by the case management or the social work note was then confirmed with clinical data. The date was confirmed if there were no significant laboratory orders and major medication changes or procedures for 24 h from the date identified. If notes were also inconclusive, then the medical clearance was determined by a review of provider order entry. Medical readiness for discharge was then defined as the first day when there were no laboratory orders for 48 h and no significant medication changes, imaging studies, or microbiologic orders.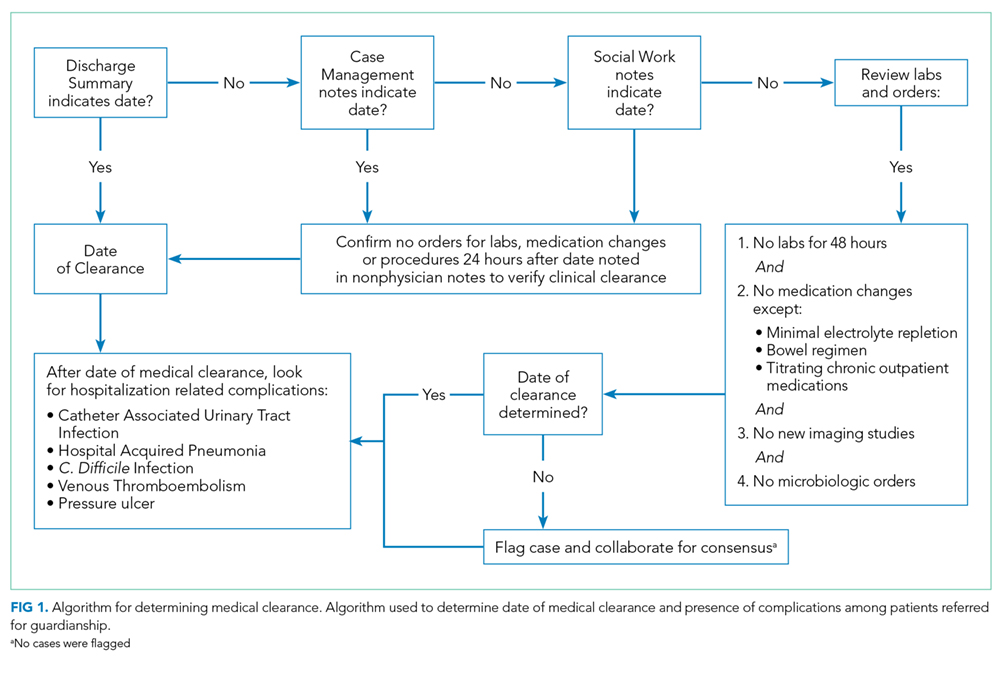
Hospital-acquired complications were determined to be related to the guardianship process if they occurred after the date of medical stability but prior to discharge. We did not investigate hospital-acquired complications among controls. Hospital-acquired complications were defined as follows:
- Catheter-associated urinary tract infection (CAUTI): active Foley catheter order and positive urine culture that resulted in antibiotic administration.
- Hospital-acquired pneumonia (HAP): chest X-ray or computed tomography (CT) scan showing a consolidation that resulted in antibiotic administration.
- Venous thromboembolism (VTE): positive venous ultrasound or CT angiography of the chest for deep venous thrombosis (DVT) or pulmonary embolism (PE).
- Decubitus ulcer: new wound care consultation for sacral decubitus ulceration.
- Clostridium difficile (C. diff) infection: positive stool polymerase chain reaction that resulted in antibiotic administration.
The algorithm for identifying the date of clearance and the presence of complications was piloted independently by three investigators (RP, JP, DR) using a single chart review and was redesigned until a consensus was obtained. The same three investigators then independently reviewed three additional charts, including all notes, laboratory results, imaging results, and orders, with complete agreement for both date of clearance and presence of complications. Two investigators (RP, JP) then individually reviewed the remaining 57 charts. Of these, 10 were selected a priori for review by both investigators for interrater reliability, with a mean difference of 0.5 days in the estimated time to clearance and complete concordance in complications. In addition, a third investigator (DR) independently reread 5 of the 57 reviewed charts, with complete concordance in both time to clearance and presence of complications with the original readings.
Statistical Analysis
SAS 9.3 was used for all analyses (SAS Institute Inc., Cary, NC, USA).
We first examined the demographic and clinical characteristics of all 61 patients who underwent guardianship proceedings. Second, we described the primary outcomes of interest–length of stay, costs, and likelihood of complications–in this series of patients with associated 95% confidence intervals.
Third, we examined the associations between guardianship and length of stay and healthcare costs using generalized estimating equations with clustering by matched set and compound symmetry. For length of stay, we specifically assessed excess length of stay (the matching variable) to avoid immortal time bias; we also examined the total length of stay. For all regression analyses, we adjusted for the following covariates: age, gender, education, marital status, race/ethnicity, CMI, insurance status, discharging service, and principal diagnosis. To maximize normality of residuals, costs were log-transformed; length of stay beyond clearance was log-transformed after addition of 1. For both outcomes, we back-transformed the regression coefficients and presented percent change between case and control patients. All reported tests are two-sided.
RESULTS
A total of 61 guardianship cases and 118 controls were included in the analysis.
General Characteristics
The characteristics of all cases prior to matching are included in Table 1. The department of internal medicine discharged the largest proportion of cases, followed by neurosurgery and neurology departments. More than 65% of cases were insured by Medicare or Medicaid. Three-quarters of cases were discharged from the hospital to another medical facility, with about half discharged to a skilled nursing facility (SNF) or a rehabilitation center and one-quarter to a long-term acute care hospital (LTACH).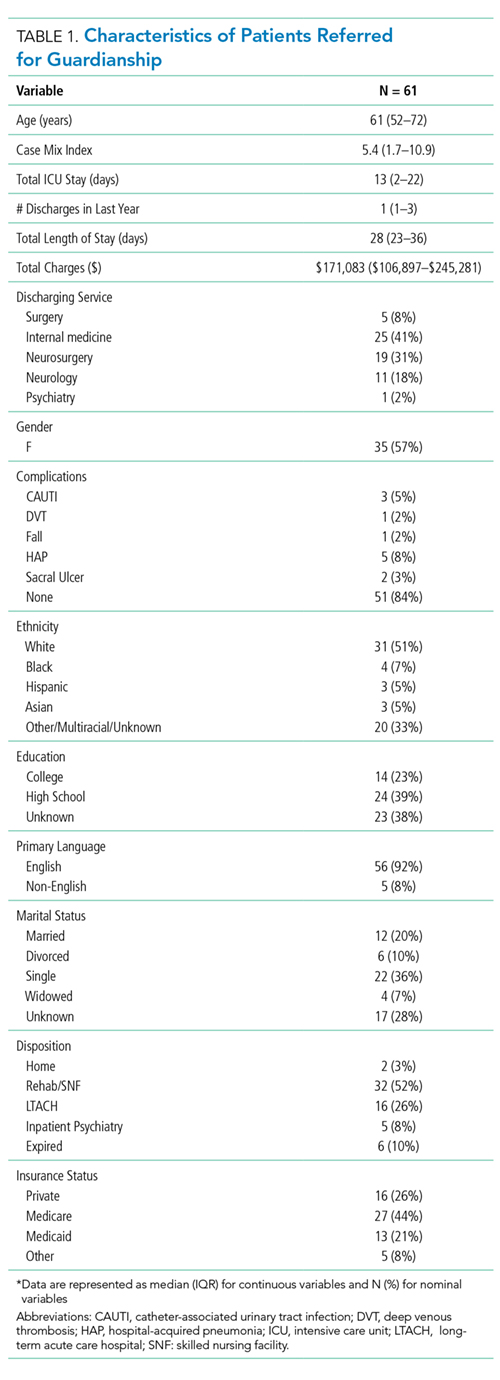
The median length of stay for patients requiring guardianship was 28 (range, 23-36) days, and the median total charges were $171,083 ($106,897-$245,281), with a total cost approximating $10.9 million for these patients. Regarding hospital-acquired complications, 10 (16%; 95% confidence interval, 8%–28%) unique cases suffered from a complication, with HAP being the most frequently (n = 5) occurring complication.
Comparison with Matched Controls
No statistically significant differences were observed between cases and controls in terms of age, primary language, highest level of education, ethnicity, insurance status, or discharging service as shown in Table 2; discharging service was a matched variable and comparable by design. However, cases tended to be less likely to be married and had a higher CMI.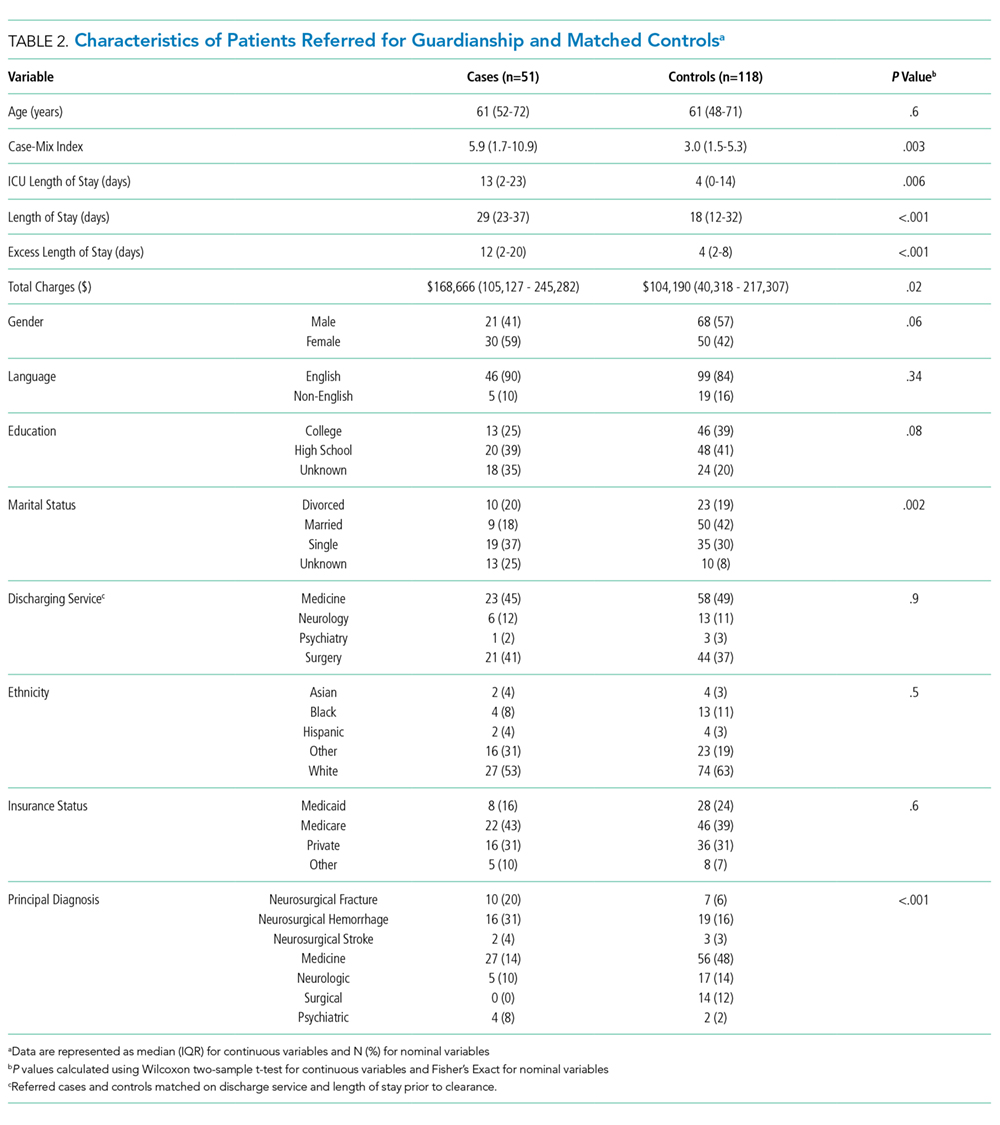
When compared with control patients in terms of similar services who stayed for at least as long as their duration to clearance, the cases had significantly longer lengths of stay compared to those of controls (29 total days compared to 18 days, P < .001; Figure 2). In addition, cases incurred significantly higher median total charges ($168,666) compared to those of controls ($104,190; P = .02).
After accounting for potential confounders, including age, gender, language, education, marital status, discharging service, ethnicity, insurance status, CMI, and principal diagnosis, guardianship was associated with 58% higher excess length of stay (P = .04, 95% CI [2%-145%]). Furthermore, guardianship was associated with 23% higher total charges (P = .02, 95% CI [4%-46%]) and 37% longer total length of stay (P = .002, 95% CI [12%-67%]).
DISCUSSION
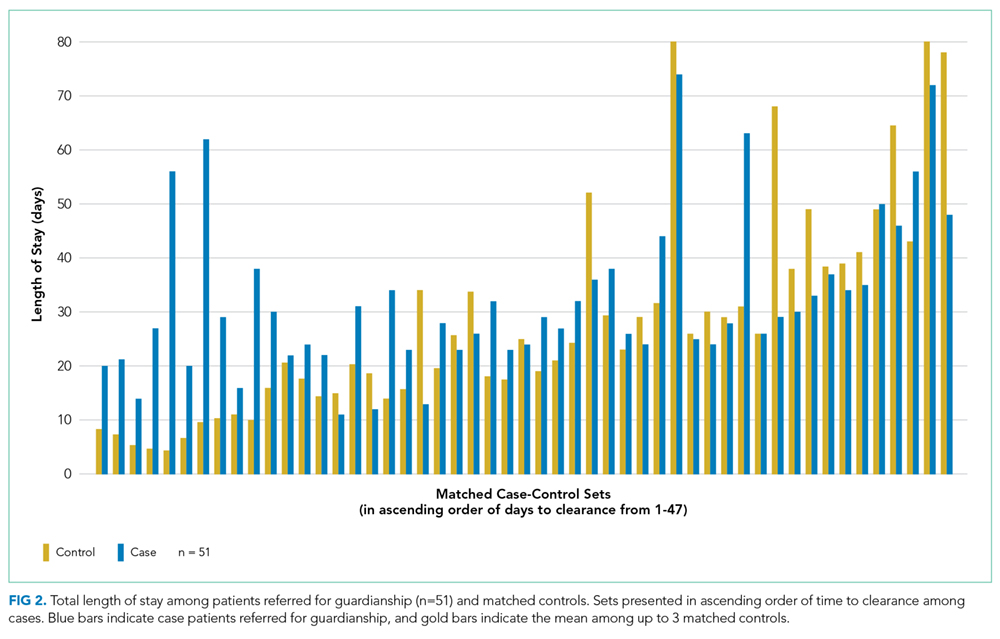
To our knowledge, this is among the first studies to investigate healthcare costs and harm to the patient in the form of hospital-associated complications as a result of guardianship proceedings. Other studies15,16 have also demonstrated excessive length of stay attributed to nonclinical factors such as guardianship, though they did not quantify the excess stay or compare guardianship cases with a matched control. One study17 demonstrated total charges of $150,000 per patient requiring guardianship, which are similar to our results. However, Chen et al. also observed an average of 27.8 medically unnecessary days, which are 16 more days than those in our study sample. This may reflect the difference in how excess days were determined, namely, statistical process control analysis in the previous study compared with a manual chart review in our study. To our knowledge, no other study has compared guardianship cases with matched controls to compare their experiences to patients with similarly prolonged stays prior to clearance.
After matching by service and the length of stay until medical clearance in each guardianship case, the subsequent length of stay was higher among cases than among controls, even after adjustment for differences in CMI and diagnosis. This suggests that the process of obtaining guardianship results in a particularly prolonged length of stay, which is presumably attributable to factors other than medical complexity or ongoing illness.
It is probable that at least two interrelated mechanisms are responsible for the particularly high costs and the long stay of patients who require guardianship. First, the process of obtaining guardianship is itself protracted in several cases, necessitating long-term admissions well beyond the point of medical stability. Second, our results suggest that longer hospital stays are apt to grow further in a feed-forward cycle due to hospital-acquired complications that develop after the date of medical clearance. Indeed, in our series, 16% of patients sustained a complication that is readily attributable to hospital care after their date of clearance, and these types of complications are likely to lengthen the stay even further.
We compared cases referred for guardianship to control patients on the same services, at similar time points, whose length of stay was at least as long as the point of medical clearance as their corresponding case patient. Because cases were hospitalized with active medical needs to at least the point of clearance, we anticipated that costs might well be lower among cases, who had no medical necessity for hospitalization at the point of clearance, compared with controls who remained hospitalized presumably for active medical needs. Counter to this hypothesis, and accounting for potentially confounding variables, undergoing a guardianship proceeding was associated with nearly 25% higher costs of patient care. This may ultimately represent a substantial burden on the healthcare system. For example, in just 1 year in our hospital, the total hospital charges reached almost $11 million for the 61 patients who underwent guardianship proceedings. Considering that 65% of the patients requiring guardianship had Medicaid or Medicare coverage, there are significant financial implications for the hospital systems and to the public.
Limitations of our study relate to its retrospective nature at a single center. Investigating guardianship cases at a single center and with a small sample size of 61 patients limits generalizability. Nevertheless, we still had enough power to detect significant differences compared with matched controls, and this study remains the largest investigation into the cost associated with guardianship to date and the only study comparing guardianship cases with matched controls. Furthermore, we did not complete chart reviews of controls, which limits direct comparisons of complications and precluded our matching on variables that required detailed review.
The retrospective design may include confounders unaccounted for in our statistical design, though we attempted to match cases with controls to account for some of these potential differences and included a broad set of covariates that included measures of comorbidity and diagnosis. To this point, we included only CMI and principal diagnosis as the measures of severity, and adjustment for CMI, which includes features of the index hospitalization itself, may represent overadjustment. However, this type of overadjustment would tend to bias toward the null hypothesis.
Investigators only completed chart reviews for cases, which limits our ability to contrast the rate of hospital-associated complications for cases with that of controls. However, the rates of CAUTI and HAP complications among our cases were notably higher than national inpatient estimates, ie, 5% and 8% compared to 0.2%18 and 0.5%-1%,19 respectively. Furthermore, we demonstrated higher total costs and total lengths of stay among guardianship patients, analyses for which the attributed date of clearance for controls was not required, and the rate of complications among the case patients was sizable despite their being formally medically cleared. In other words, regardless of whether a complication rate of 16% is “typical” for inpatients hospitalized for these durations, this suggests that persistent hospitalization after clearance does not carry a benign prognosis.
In addition, to estimate healthcare costs, we relied on total hospital charges, which are readily available and reflect, at least in part, payer costs but do not reflect true costs to the medical center. Nonetheless, charges approximately reflect costs–with some variation across cost centers–and hence provide a useful metric for comparing cases and controls. To provide context, for academic medical centers such as ours, costs are typically about half of charges.
Finally, each state has different statutes for surrogate decision-making. The results of this study reflect the Massachusetts’ experience, with no public guardianship program or hierarchy statute. That being said, while this presumably causes the need for more guardianships in Massachusetts, the mechanisms for guardianship are broadly similar nationwide and are likely to result in excessive length of stay and cost similar to those in our population, as demonstrated in studies from other states.7,15–17
Implications
At a time where medical systems are searching for opportunities to reduce the length of stay, prevent unnecessary hospitalization, and improve the quality of care, reevaluating the guardianship process is ripe with opportunity. In this single academic center, the process of guardianship was associated with 58% excess length of stay and 23% higher total hospital charges. Furthermore, one in six patients requiring guardianship suffered from hospital-associated complications.
This matched cohort study adds quantitative data demonstrating substantial burdens to the healthcare system as a result of the guardianship process and can be used as an impetus for hospital administration and legal systems to expedite the process. Potential improvements include increasing HCP form completions (which would eliminate the need to pursue guardianship for most of such patients), identifying patients who lack a legally recognized surrogate decision-maker earlier in their hospital stay (ideally upon admission), and providing resources to assist clinical teams in the completion of affidavits necessary to support the appointment of a guardian, so that paperwork can be filed with courts sooner. Further research that provides more generalizable prospective data could potentially improve the guardianship process and reduce its burden on hospitals and patients even further.
Acknowledgments
The authors express their tremendous thanks to Gail Piatkowski for her invaluable assistance in collecting administrative and billing data.
Disclosures
The authors report no conflicts of interest. The authors alone are responsible for the content and writing of the article
1. O’Neill O. Autonomy and Trust in Bioethics. Cambridge: Cambridge University Press; 2002. PubMed
2. Beauchamp T, Childress J. Principles of Biomedical Ethics. 7th ed. New York: Oxford University Press; 2013.
3. McMurray RJ, Clarke OW, Barrasso JA, et al. Decisions near the end of life. J Am Med Assoc. 1992;267(16):2229-2233.
4. American Medical Association. AMA Principles of Medical Ethics: Chapter 2 - Opinions on Consent, Communication and Decision Making.; 2016.
5. Arnold RM, Kellum J. Moral justifications for surrogate decision making in the intensive care unit: Implications and limitations. Crit Care Med. 2003;31(Supplement):S347-S353. PubMed
6. Karp N, Wood E. Incapacitated and Alone: Healthcare Decision Making for Unbefriended Older People. Am Bar Assoc Hum Rights. 2003;31(2).
7. Bandy RJ, Helft PR, Bandy RW, Torke AM. Medical decision-making during the guardianship process for incapacitated, hospitalized adults: a descriptive cohort study. J Gen Intern Med. 2010;25(10):1003-1008. PubMed
8. Wynn S. Decisions by surrogates: an overview of surrogate consent laws in the United States. Bifocal. 2014;36(1):10-14.
9. Massachusetts General Laws. Chapter 201D: Health Care Proxies. https://malegislature.gov/Laws/GeneralLaws/PartII/TitleII/Chapter201D. Published 2017. Accessed March 31, 2017.
10. American Bar Association Commision on Law and Aging. Default Surrogate Consent Statutes. Am Bar Assoc. 2016:1-17.
11. Massachusetts General Laws. Chapter 190B: Massachusetts Probate Code. https://malegislature.gov/Laws/GeneralLaws/PartII/TitleII/Chapter190B. Published 2017. Accessed March 31, 2017.
12. Rosman M, Rachminov O, Segal O, Segal G. Prolonged patients’ in-hospital waiting period after discharge eligibility is associated with increased risk of infection, morbidity and mortality: a retrospective cohort analysis. BMC Health Serv Res. 2015;15:246. PubMed
13. Majeed MU, Williams DT, Pollock R, et al. Delay in discharge and its impact on unnecessary hospital bed occupancy. 2012. PubMed
14. Nobili A, Licata G, Salerno F, et al. Polypharmacy, length of hospital stay, and in-hospital mortality among elderly patients in internal medicine wards. The REPOSI study. Eur J Clin Pharmacol. 2011;67(5):507-519. PubMed
15. Chen JJ, Finn CT, Homa K, St Onge KP, Caller TA. Discharge delays for patients requiring in-hospital guardianship: A Cohort Analysis. J Healthc Qual. 2016;38(4):235-242. PubMed
16. Chen JJ, Kwon A, Stevens Y, Finn CT. Barriers beyond clinical control affecting timely hospital discharge for a patient requiring guardianship. Psychosomatics. 2015;56(2):206-209. PubMed
17. Chen JJ, Blanchard MA, Finn CT, et al. A clinical pathway for guardianship at dartmouth-hitchcock medical center. Jt Comm J Qual Patient Saf. 2014;40(9):389-397. PubMed
18. McEachern R, Campbell Jr GD. Hospital-Acquired Pneumonia: Epidemiology, Etiology, and Treatment. Infect Dis Clin North Am. 1998;12(3):761-779. PubMed
19. Zimlichman E, Henderson D, Tamir O, et al. Health care–associated infections. JAMA Intern Med. 2013;173(22):2039. PubMed
A central tenet of modern medicine is that patients must provide fully informed consent to receive or refuse medical care offered by their clinical teams.1–4 If a patient is unable to make and communicate a choice or clearly indicate an understanding of the information presented, then he or she is considered to lack the capacity to make medical decisions and the medical team must seek consent from the patient’s surrogate decision-maker.2-7 Every U.S. state recognizes a patient’s healthcare proxy (HCP) and a court-appointed guardian as a legally recognized surrogate.8,9 Most of the states also have statutes or regulations establishing a hierarchy of legally recognized surrogate decision-makers in the absence of a HCP or a court-appointed guardian, such as spouses, adult children, parents, siblings, and grandparents.8,10 In states that do not have such a statute, hospitals develop their own institutional policies for surrogate decision-making.
However, there are important limitations on the authority of these surrogate decision-makers.10 For instance, patients may not have a family member or a friend to serve as a surrogate decision-maker, often family members cannot override a patient’s objection, even when that patient lacks decision-making capacity, and certain decisions require a guardian or a HCP.8-10 In these circumstances, the hospital must petition a court to appoint a guardian as a legally recognized surrogate decision-maker. This can be an involved family member, if one exists, or an independent, typically volunteer, guardian.11 The process of guardian appointment is complex7,11 and can range from a few days to more than a month, largely dependent on court dates and finding a volunteer guardian. Much of the process occurs during the patient’s hospital stay. This prolongation of hospitalization would be expected to increase health care costs and iatrogenic complications,12–14 but data quantifying these for patients requiring guardianship are lacking. The goal of this study was to describe the characteristics of patients who undergo the process of guardianship and measure the associated burdens. These burdens include the financial costs to the medical system, the prolonged length of stay beyond medical necessity, and the costs to the patient in the form of hospital-acquired complications. Investigating the burden of guardianship is an important first step in uncovering opportunities to improve the process. We hypothesized that patients requiring guardianship would have lengths of stay and healthcare costs that were at least as large as those for patients whose conditions required similar durations of hospitalization prior to medical clearance, in part due to iatrogenic complications that would accrue while awaiting guardian appointment.
METHODS
Setting
We conducted a retrospective matched cohort study of adult inpatients at Beth Israel Deaconess Medical Center (BIDMC), a 651-bed academic, tertiary care facility in Boston, MA. The study was approved by the BIDMC Institutional Review Board as a nonhuman subject research consistent with hospital operations.
Population
For this matched cohort study, we identified case patients as those hospitalized for any reason for whom guardianship proceedings were initiated and obtained; only the first hospitalization during which the guardianship was pursued was used. Cases were identified by obtaining the data of all patients for whom the BIDMC general counsel completed the process of guardianship between October 2014 and September 2015. At BIDMC, all the guardianship proceedings are referred to the general counsel.
To determine the postclearance experience for referred patients compared with that for other patients with similar lengths of stay up to those of the referred patients’ point of clearance, we identified up to three matched controls for each case (Supplemental Figure 1). Medical clearance was defined as the date when the patient was medically stable to be discharged from the hospital, and it was determined in an iterative manner. We identified controls as hospitalized patients admitted for any cause and matched to the cases requiring guardianship on discharging service and length of stay prior to clearance. Specifically, we identified patients on the same service as the case whose length of stay was at least as long as the length of stay of the case patient until medical clearance, as defined below. We then determined the total and the excess length of stay, defined as the duration beyond clearance for each case referred for guardianship; for controls, the ‘excess’ length of stay was the number of hospitalized days beyond the corresponding time that a matched case had been provided clearance. To account for seasonal influences and the training level of house officers, we selected the three controls whose discharge date was closest (before or after) to the discharge date of their matched case.
From legal team files, we identified 61 patients hospitalized at BIDMC for whom new guardianship was pursued to completion. Of these 61 patients, 10 could not be matched to an appropriate control and were included in descriptive analyses but not in comparisons with controls.
Covariates and Outcomes
We collected the details regarding age, gender, primary language, highest level of education, marital status, insurance status, race, date of admission, date of discharge, discharge disposition, principal diagnosis, case mix index (CMI), and discharging service from our administrative and billing data. Outcomes of interest included length of stay and total hospital charges that were collected from the same databases. We used hospital charges, rather than payments, to ensure uniformity across payers.
Chart Review
Unique to cases, a team of two medical residents (JP, RP) and a hospitalist (DR) determined the date of medical clearance and hospital-associated complications by a chart review. The date of medical clearance was then used to calculate excess length of stay, ie, the duration of stay beyond the date of medical clearance, by subtracting the time to medical clearance from the total inpatient length of stay.
We developed a novel algorithm to determine the date of medical clearance consistently (Figure 1). We first determined whether the discharge summary indicated a clear date of medical readiness for discharge. If the discharge summary was unclear, then a case management or a social work note was used. The date of medical clearance determined by the case management or the social work note was then confirmed with clinical data. The date was confirmed if there were no significant laboratory orders and major medication changes or procedures for 24 h from the date identified. If notes were also inconclusive, then the medical clearance was determined by a review of provider order entry. Medical readiness for discharge was then defined as the first day when there were no laboratory orders for 48 h and no significant medication changes, imaging studies, or microbiologic orders.
Hospital-acquired complications were determined to be related to the guardianship process if they occurred after the date of medical stability but prior to discharge. We did not investigate hospital-acquired complications among controls. Hospital-acquired complications were defined as follows:
- Catheter-associated urinary tract infection (CAUTI): active Foley catheter order and positive urine culture that resulted in antibiotic administration.
- Hospital-acquired pneumonia (HAP): chest X-ray or computed tomography (CT) scan showing a consolidation that resulted in antibiotic administration.
- Venous thromboembolism (VTE): positive venous ultrasound or CT angiography of the chest for deep venous thrombosis (DVT) or pulmonary embolism (PE).
- Decubitus ulcer: new wound care consultation for sacral decubitus ulceration.
- Clostridium difficile (C. diff) infection: positive stool polymerase chain reaction that resulted in antibiotic administration.
The algorithm for identifying the date of clearance and the presence of complications was piloted independently by three investigators (RP, JP, DR) using a single chart review and was redesigned until a consensus was obtained. The same three investigators then independently reviewed three additional charts, including all notes, laboratory results, imaging results, and orders, with complete agreement for both date of clearance and presence of complications. Two investigators (RP, JP) then individually reviewed the remaining 57 charts. Of these, 10 were selected a priori for review by both investigators for interrater reliability, with a mean difference of 0.5 days in the estimated time to clearance and complete concordance in complications. In addition, a third investigator (DR) independently reread 5 of the 57 reviewed charts, with complete concordance in both time to clearance and presence of complications with the original readings.
Statistical Analysis
SAS 9.3 was used for all analyses (SAS Institute Inc., Cary, NC, USA).
We first examined the demographic and clinical characteristics of all 61 patients who underwent guardianship proceedings. Second, we described the primary outcomes of interest–length of stay, costs, and likelihood of complications–in this series of patients with associated 95% confidence intervals.
Third, we examined the associations between guardianship and length of stay and healthcare costs using generalized estimating equations with clustering by matched set and compound symmetry. For length of stay, we specifically assessed excess length of stay (the matching variable) to avoid immortal time bias; we also examined the total length of stay. For all regression analyses, we adjusted for the following covariates: age, gender, education, marital status, race/ethnicity, CMI, insurance status, discharging service, and principal diagnosis. To maximize normality of residuals, costs were log-transformed; length of stay beyond clearance was log-transformed after addition of 1. For both outcomes, we back-transformed the regression coefficients and presented percent change between case and control patients. All reported tests are two-sided.
RESULTS
A total of 61 guardianship cases and 118 controls were included in the analysis.
General Characteristics
The characteristics of all cases prior to matching are included in Table 1. The department of internal medicine discharged the largest proportion of cases, followed by neurosurgery and neurology departments. More than 65% of cases were insured by Medicare or Medicaid. Three-quarters of cases were discharged from the hospital to another medical facility, with about half discharged to a skilled nursing facility (SNF) or a rehabilitation center and one-quarter to a long-term acute care hospital (LTACH).
The median length of stay for patients requiring guardianship was 28 (range, 23-36) days, and the median total charges were $171,083 ($106,897-$245,281), with a total cost approximating $10.9 million for these patients. Regarding hospital-acquired complications, 10 (16%; 95% confidence interval, 8%–28%) unique cases suffered from a complication, with HAP being the most frequently (n = 5) occurring complication.
Comparison with Matched Controls
No statistically significant differences were observed between cases and controls in terms of age, primary language, highest level of education, ethnicity, insurance status, or discharging service as shown in Table 2; discharging service was a matched variable and comparable by design. However, cases tended to be less likely to be married and had a higher CMI.
When compared with control patients in terms of similar services who stayed for at least as long as their duration to clearance, the cases had significantly longer lengths of stay compared to those of controls (29 total days compared to 18 days, P < .001; Figure 2). In addition, cases incurred significantly higher median total charges ($168,666) compared to those of controls ($104,190; P = .02).
After accounting for potential confounders, including age, gender, language, education, marital status, discharging service, ethnicity, insurance status, CMI, and principal diagnosis, guardianship was associated with 58% higher excess length of stay (P = .04, 95% CI [2%-145%]). Furthermore, guardianship was associated with 23% higher total charges (P = .02, 95% CI [4%-46%]) and 37% longer total length of stay (P = .002, 95% CI [12%-67%]).
DISCUSSION
To our knowledge, this is among the first studies to investigate healthcare costs and harm to the patient in the form of hospital-associated complications as a result of guardianship proceedings. Other studies15,16 have also demonstrated excessive length of stay attributed to nonclinical factors such as guardianship, though they did not quantify the excess stay or compare guardianship cases with a matched control. One study17 demonstrated total charges of $150,000 per patient requiring guardianship, which are similar to our results. However, Chen et al. also observed an average of 27.8 medically unnecessary days, which are 16 more days than those in our study sample. This may reflect the difference in how excess days were determined, namely, statistical process control analysis in the previous study compared with a manual chart review in our study. To our knowledge, no other study has compared guardianship cases with matched controls to compare their experiences to patients with similarly prolonged stays prior to clearance.
After matching by service and the length of stay until medical clearance in each guardianship case, the subsequent length of stay was higher among cases than among controls, even after adjustment for differences in CMI and diagnosis. This suggests that the process of obtaining guardianship results in a particularly prolonged length of stay, which is presumably attributable to factors other than medical complexity or ongoing illness.
It is probable that at least two interrelated mechanisms are responsible for the particularly high costs and the long stay of patients who require guardianship. First, the process of obtaining guardianship is itself protracted in several cases, necessitating long-term admissions well beyond the point of medical stability. Second, our results suggest that longer hospital stays are apt to grow further in a feed-forward cycle due to hospital-acquired complications that develop after the date of medical clearance. Indeed, in our series, 16% of patients sustained a complication that is readily attributable to hospital care after their date of clearance, and these types of complications are likely to lengthen the stay even further.
We compared cases referred for guardianship to control patients on the same services, at similar time points, whose length of stay was at least as long as the point of medical clearance as their corresponding case patient. Because cases were hospitalized with active medical needs to at least the point of clearance, we anticipated that costs might well be lower among cases, who had no medical necessity for hospitalization at the point of clearance, compared with controls who remained hospitalized presumably for active medical needs. Counter to this hypothesis, and accounting for potentially confounding variables, undergoing a guardianship proceeding was associated with nearly 25% higher costs of patient care. This may ultimately represent a substantial burden on the healthcare system. For example, in just 1 year in our hospital, the total hospital charges reached almost $11 million for the 61 patients who underwent guardianship proceedings. Considering that 65% of the patients requiring guardianship had Medicaid or Medicare coverage, there are significant financial implications for the hospital systems and to the public.
Limitations of our study relate to its retrospective nature at a single center. Investigating guardianship cases at a single center and with a small sample size of 61 patients limits generalizability. Nevertheless, we still had enough power to detect significant differences compared with matched controls, and this study remains the largest investigation into the cost associated with guardianship to date and the only study comparing guardianship cases with matched controls. Furthermore, we did not complete chart reviews of controls, which limits direct comparisons of complications and precluded our matching on variables that required detailed review.
The retrospective design may include confounders unaccounted for in our statistical design, though we attempted to match cases with controls to account for some of these potential differences and included a broad set of covariates that included measures of comorbidity and diagnosis. To this point, we included only CMI and principal diagnosis as the measures of severity, and adjustment for CMI, which includes features of the index hospitalization itself, may represent overadjustment. However, this type of overadjustment would tend to bias toward the null hypothesis.
Investigators only completed chart reviews for cases, which limits our ability to contrast the rate of hospital-associated complications for cases with that of controls. However, the rates of CAUTI and HAP complications among our cases were notably higher than national inpatient estimates, ie, 5% and 8% compared to 0.2%18 and 0.5%-1%,19 respectively. Furthermore, we demonstrated higher total costs and total lengths of stay among guardianship patients, analyses for which the attributed date of clearance for controls was not required, and the rate of complications among the case patients was sizable despite their being formally medically cleared. In other words, regardless of whether a complication rate of 16% is “typical” for inpatients hospitalized for these durations, this suggests that persistent hospitalization after clearance does not carry a benign prognosis.
In addition, to estimate healthcare costs, we relied on total hospital charges, which are readily available and reflect, at least in part, payer costs but do not reflect true costs to the medical center. Nonetheless, charges approximately reflect costs–with some variation across cost centers–and hence provide a useful metric for comparing cases and controls. To provide context, for academic medical centers such as ours, costs are typically about half of charges.
Finally, each state has different statutes for surrogate decision-making. The results of this study reflect the Massachusetts’ experience, with no public guardianship program or hierarchy statute. That being said, while this presumably causes the need for more guardianships in Massachusetts, the mechanisms for guardianship are broadly similar nationwide and are likely to result in excessive length of stay and cost similar to those in our population, as demonstrated in studies from other states.7,15–17
Implications
At a time where medical systems are searching for opportunities to reduce the length of stay, prevent unnecessary hospitalization, and improve the quality of care, reevaluating the guardianship process is ripe with opportunity. In this single academic center, the process of guardianship was associated with 58% excess length of stay and 23% higher total hospital charges. Furthermore, one in six patients requiring guardianship suffered from hospital-associated complications.
This matched cohort study adds quantitative data demonstrating substantial burdens to the healthcare system as a result of the guardianship process and can be used as an impetus for hospital administration and legal systems to expedite the process. Potential improvements include increasing HCP form completions (which would eliminate the need to pursue guardianship for most of such patients), identifying patients who lack a legally recognized surrogate decision-maker earlier in their hospital stay (ideally upon admission), and providing resources to assist clinical teams in the completion of affidavits necessary to support the appointment of a guardian, so that paperwork can be filed with courts sooner. Further research that provides more generalizable prospective data could potentially improve the guardianship process and reduce its burden on hospitals and patients even further.
Acknowledgments
The authors express their tremendous thanks to Gail Piatkowski for her invaluable assistance in collecting administrative and billing data.
Disclosures
The authors report no conflicts of interest. The authors alone are responsible for the content and writing of the article
1. O’Neill O. Autonomy and Trust in Bioethics. Cambridge: Cambridge University Press; 2002. PubMed
2. Beauchamp T, Childress J. Principles of Biomedical Ethics. 7th ed. New York: Oxford University Press; 2013.
3. McMurray RJ, Clarke OW, Barrasso JA, et al. Decisions near the end of life. J Am Med Assoc. 1992;267(16):2229-2233.
4. American Medical Association. AMA Principles of Medical Ethics: Chapter 2 - Opinions on Consent, Communication and Decision Making.; 2016.
5. Arnold RM, Kellum J. Moral justifications for surrogate decision making in the intensive care unit: Implications and limitations. Crit Care Med. 2003;31(Supplement):S347-S353. PubMed
6. Karp N, Wood E. Incapacitated and Alone: Healthcare Decision Making for Unbefriended Older People. Am Bar Assoc Hum Rights. 2003;31(2).
7. Bandy RJ, Helft PR, Bandy RW, Torke AM. Medical decision-making during the guardianship process for incapacitated, hospitalized adults: a descriptive cohort study. J Gen Intern Med. 2010;25(10):1003-1008. PubMed
8. Wynn S. Decisions by surrogates: an overview of surrogate consent laws in the United States. Bifocal. 2014;36(1):10-14.
9. Massachusetts General Laws. Chapter 201D: Health Care Proxies. https://malegislature.gov/Laws/GeneralLaws/PartII/TitleII/Chapter201D. Published 2017. Accessed March 31, 2017.
10. American Bar Association Commision on Law and Aging. Default Surrogate Consent Statutes. Am Bar Assoc. 2016:1-17.
11. Massachusetts General Laws. Chapter 190B: Massachusetts Probate Code. https://malegislature.gov/Laws/GeneralLaws/PartII/TitleII/Chapter190B. Published 2017. Accessed March 31, 2017.
12. Rosman M, Rachminov O, Segal O, Segal G. Prolonged patients’ in-hospital waiting period after discharge eligibility is associated with increased risk of infection, morbidity and mortality: a retrospective cohort analysis. BMC Health Serv Res. 2015;15:246. PubMed
13. Majeed MU, Williams DT, Pollock R, et al. Delay in discharge and its impact on unnecessary hospital bed occupancy. 2012. PubMed
14. Nobili A, Licata G, Salerno F, et al. Polypharmacy, length of hospital stay, and in-hospital mortality among elderly patients in internal medicine wards. The REPOSI study. Eur J Clin Pharmacol. 2011;67(5):507-519. PubMed
15. Chen JJ, Finn CT, Homa K, St Onge KP, Caller TA. Discharge delays for patients requiring in-hospital guardianship: A Cohort Analysis. J Healthc Qual. 2016;38(4):235-242. PubMed
16. Chen JJ, Kwon A, Stevens Y, Finn CT. Barriers beyond clinical control affecting timely hospital discharge for a patient requiring guardianship. Psychosomatics. 2015;56(2):206-209. PubMed
17. Chen JJ, Blanchard MA, Finn CT, et al. A clinical pathway for guardianship at dartmouth-hitchcock medical center. Jt Comm J Qual Patient Saf. 2014;40(9):389-397. PubMed
18. McEachern R, Campbell Jr GD. Hospital-Acquired Pneumonia: Epidemiology, Etiology, and Treatment. Infect Dis Clin North Am. 1998;12(3):761-779. PubMed
19. Zimlichman E, Henderson D, Tamir O, et al. Health care–associated infections. JAMA Intern Med. 2013;173(22):2039. PubMed
© 2018 Society of Hospital Medicine
Development of Hospitalization Resource Intensity Scores for Kids (H-RISK) and Comparison across Pediatric Populations
Hospitals are increasingly assessed comparatively in terms of costs and quality for benchmarking purposes. These comparisons can be used by patients and families to determine where to seek care, to report compliance and grant certifications by oversight organizations (eg, Leapfrog, Magnet, Joint Commission), and by payers, to determine reimbursement models and/or to assess financial penalty or bonuses for underperforming or overperforming hospitals. As these efforts can cause substantial reputational and financial consequences for hospitals, these metrics must be contextualized within the population of patients that each hospital serves.
In adult Medicare patient populations, methods have been developed to assess the relative severity of a hospital’s full complement of patients.1,2 These methods assume a relationship between severity and hospital resource intensity (ie, cost) and typically assume the form of relative weights (RWs), which are developed for clinically similar groups of patients (eg, Medicare Diagnosis Related Groups; MS-DRG) from a reference population. A RW for each MS-DRG is calculated as the average cost of patients within the group divided by the average cost for all patients in the reference population. These weights are then applied to a hospital’s discharges over a specific time period and averaged to obtain a hospital-level case-mix index (CMI). A value of 1 indicates that a hospital serves a mix of patients with similar severity (or resource intensity) to that of an “average” hospital discharge in the reference population, whereas a value of 1.2 indicates that a hospital serves a population of patients with 20% more severity than that of an “average” hospital discharge. Since 1983, the Centers for Medicare and Medicaid Services (CMS) has used RWs in their inpatient prospective payment system.3
Similar pediatric methods are less developed and necessitate special consideration as the use of existing weights may be inappropriate for a pediatric population. First, MS-DRGs were developed primarily for the Medicare population and lack sufficient granularity for pediatric populations, specifically newborns. Second, a severity stratification which incorporates important patient characteristics, such as age in pediatrics, does not exist in the MS-DRG system . Finally, although the reference populations that are used to develop MS-DRG weights do not explicitly exclude children, children typically account for approximately 15% of hospitalizations (6% excluding neonatal/maternal) and possibly feature different utilization patterns than adults with similar conditions. Thus, weights developed from a combined pediatric/adult reference population primarily reflect an adult population.
With valid pediatric RWs, stakeholders can assess a hospital’s severity mix of patients in a comparable fashion and contextualize outcome metrics. Additionally, these same weights can be used to estimate expected costs for hospitalizations or for risk adjusting various outcomes at the discharge- or hospital-level. Thus, we sought to develop hospitalization resource intensity scores for kids (H-RISK) using pediatric-specific weights and compare hospital-level CMIs across various hospital types and locations as an example of the application of this novel methodology.
METHODS
Dataset
Data for this analysis were obtained from the 2012 Healthcare Cost and Utilization Project (HCUP) Kids’ Inpatient Database (KID).4 KID is the largest publicly available all-payer inpatient administrative database in the United States and is sponsored by the Agency for Healthcare Research and Quality as part of the HCUP. The 2012 KID included a sample of approximately 3.2 million discharge records of children <21 years old from 44 states and 4,179 community, nonrehabilitation hospitals weighted for national estimates.
Hospital discharge costs were estimated from charges using cost-to-charge ratios (CCR) provided by HCUP as a supplement to the 2012 KID.5 Cost estimates associated with a specific discharge were estimated by multiplying the total charges reported in the data by the appropriate hospital-specific CCR and then adjusted for price factors beyond a hospital’s control using the area wage index also provided by HCUP as a supplement.
H-RISK and Case-Mix Index Calculations
We calculated H-RISK as pediatric-specific RWs based on version 30 of 3M’s All Patient Refined DRG (APR-DRG; 3M Health Information Systems, Salt Lake City, Utah) system as a measure of resource intensity. The APR-DRG system classifies hospital discharges into over 300 base DRGs based on demographic, diagnostic, and therapeutic characteristics. Each APR-DRG is further sub-divided into 4 subclasses of severity of illness (SOI; eg, minor, moderate, major, and extreme) to indicate the intensity of resource utilization during hospitalization. However, SOI levels for differing APR-DRGs are not comparable.
For every APR-DRG SOI combinations available in the 2012 KID, calculation of RW was based on the ratio of the mean cost for patients assigned to a particular APR-DRG SOI compared with the mean cost for all patients in the database. Inpatient costs less than $0.50 were set to missing and removed from analysis. Mortalities and discharges with missing CCR and wage index values were also excluded from analysis. We required that estimates for RWs be based on a reasonable set of data (ie, 10 or more discharges) for each APR-DRG SOI, and that estimates across the 4 SOI levels within an APR-DRG be monotonically nondecreasing (ie, as SOI level increases, weights must either be the same or increasing). Winsorized means were used as point estimates for mean cost in both the numerator and denominator of RW computation. Winsorizing refers to an analytic transformation by which the influence of outliers (eg, values beyond a certain threshold) is mitigated by replacing the value of outliers with the value of the threshold. We used the 5th and 95th percentiles as thresholds for Winsorizing our point estimates.
Winsorized point estimates failing to meet the minimum sample size of 10 or nondecreasing monotonicity requirement were modified by one of the two following methods:
- Cost data were modeled using a generalized linear model assuming an exponential distribution. Covariates in the model included APR-DRG and SOI within APR-DRG as a continuous variable. Where applicable, Winsorized estimates of the mean were replaced with modeled estimates.
- Data from an APR-DRG SOI in question were combined with other SOIs within the same APR-DRG with the closest Winsorized mean value. Once data were combined, a common Winsorized value was re-computed and values across SOIs were checked to ensure that nondecreasing monotonicity was maintained. In some APR-DRGs with sparse data, this involved combining pairs of severity levels; in others, it involved combining three or four severity levels together.
For APR-DRGs in which no discharges at any SOI were recorded in the 2012 KID, we used the Winsorized mean of all encounters with a common major diagnostic category (MDC) as the missing APR-DRG as point estimate for all 4 SOI levels.
To calculate the CMI for a set of discharges (eg, discharges at a hospital in a year), RWs were assigned to each discharge based on APR-DRG SOI designation. Consequently, all discharges from a specific APR-DRG SOI were assigned the same RW. Once RWs were assigned, CMI was calculated as the mean RW across all discharges. To compare hospital types based on acute-care hospital stays which are usually considered with the realm of pediatric care, we excluded RWs for normal newborns, defined as APR-DRG 626 (neonate birthweight of 2000–2499 g, normal newborn or neonate with other problems) and 640 (neonate birthweight >2499 g, normal newborn or neonate with other problems), and maternal hospitalizations, defined as APR-DRG 540 (cesarean delivery) and 560 (vaginal delivery), from our CMI calculations.
Statistical Methodology
Categorical variables were summarized using frequencies and percentages; continuous variables were summarized using medians and interquartile ranges. Differences between hospital
types (eg, rural, urban nonteaching, urban teaching, and
free-standing) were assessed using a Chi-square test for association for categorical variables. Differences in continuous variables including comparisons of neonatal (MDC 15) and nonneonatal discharges, and medical versus procedural discharges as defined by the APR-DRG grouper were assessed using a Kruskal–Wallis test. All analyses were performed using SAS, Version 9.4 (SAS Institute, Cary, North Carolina); P values <.05 were considered statistically significant.
This study was considered nonhuman subjects research by the Institutional Review Board of Vanderbilt University Medical Center.
RESULTS
Patient Population
Table 1 summarizes the patient characteristics for all 4 hospital types. All comparisons of patient characteristics across the four hospital types are significant (P < .001). Of the 6,675,222 weighted discharges in HCUP KID 2012, almost two-thirds were less than one year old (4,269,984). Three-quarters of those infant discharges (3,733,760) were in-hospital births. The South was the Census region with the most number of discharges (38.8%), and over half of discharges (53.2%) included patients who lived in metro areas with more than 1 million residents. Patients disproportionately originated from lower-income areas with 30.9% living in zip codes with median incomes in the first quartile.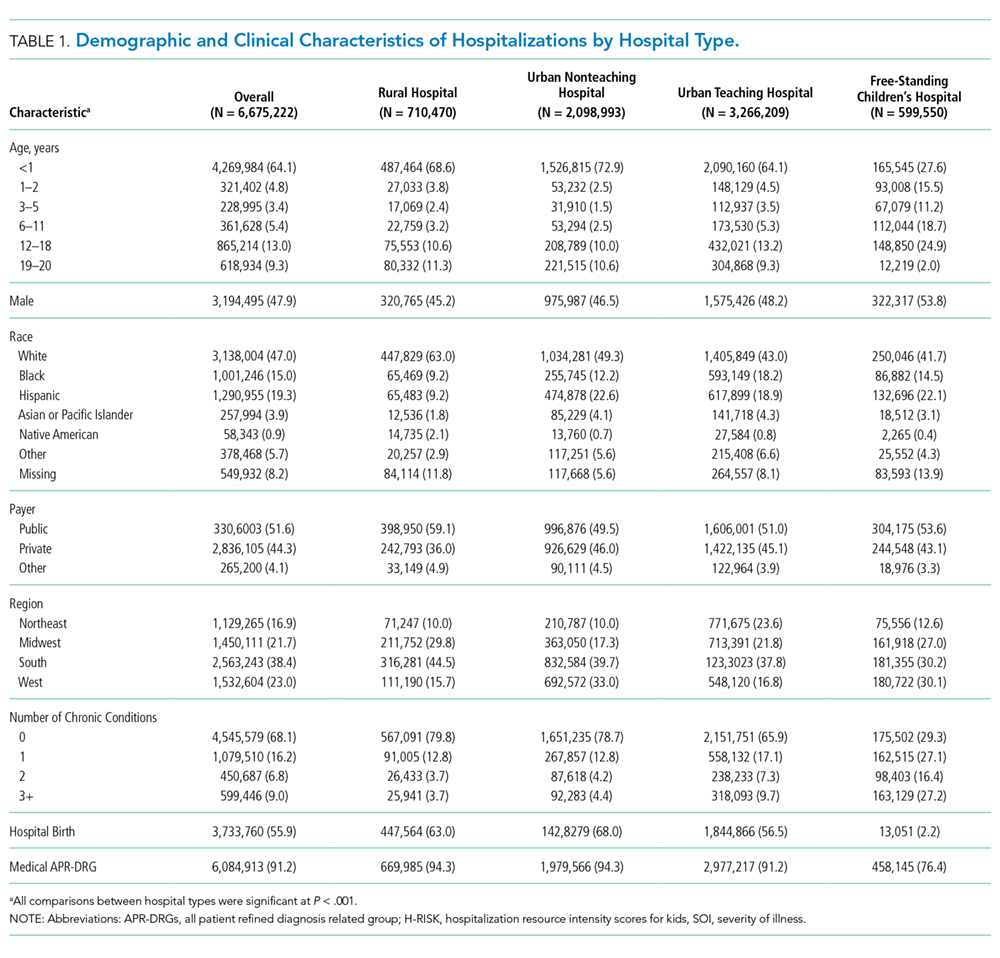
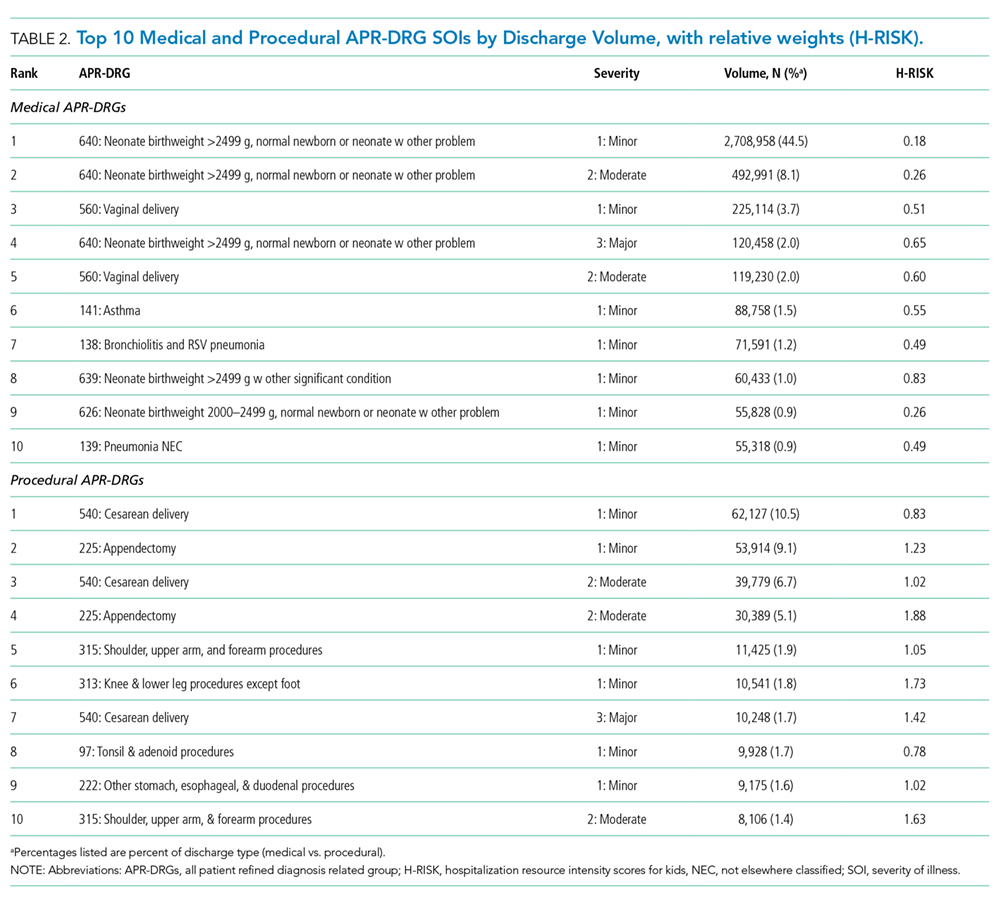
H-RISK Generation
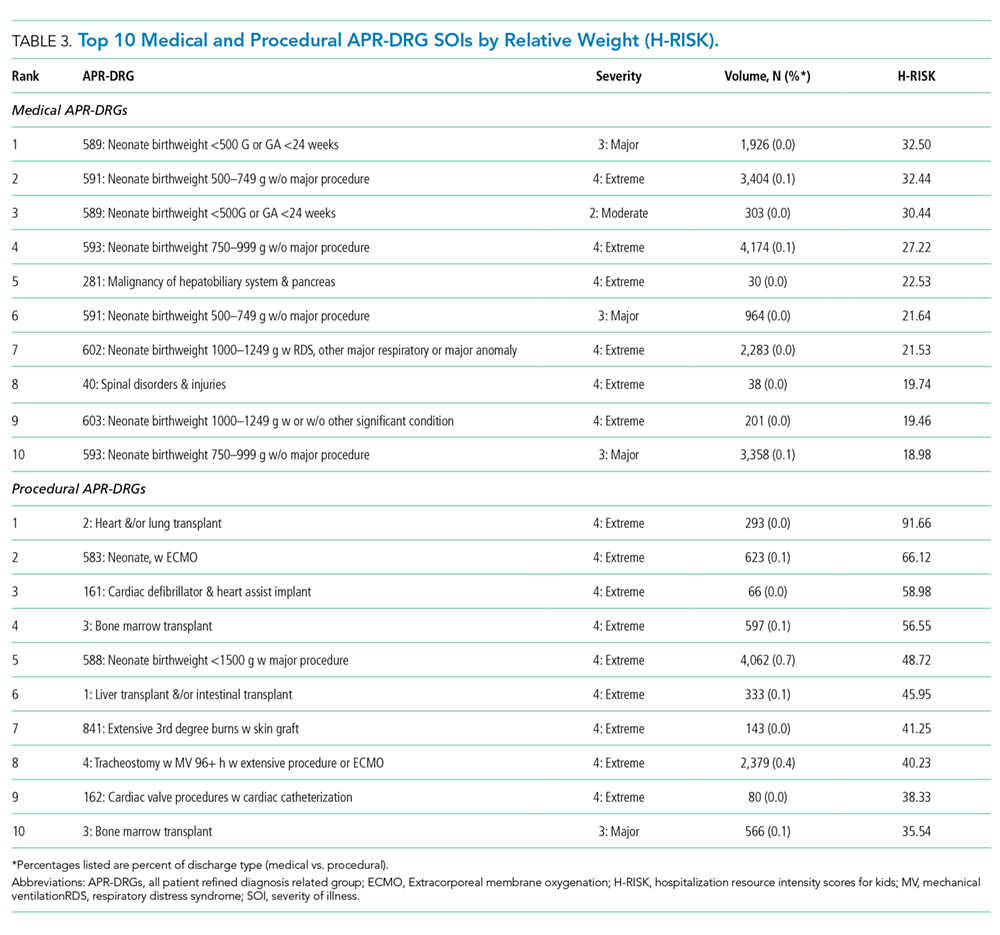
The weighted Winsorized mean cost of all discharges was $6,135 per discharge. The majority of cost-based H-RISK were higher than 1, with 1,038 (82.5%) of APR-DRG SOIs incurring an estimated cost higher than $6,135. Solid organ and bone marrow transplantations represented 4 of the 10 highest cost-based RWs for procedural APR-DRG SOIs (Table 3). Neonatal APR-DRG SOIs accounted for 8 of the 10 highest medical RWs. A list of all APR-DRG SOIs and H-RISK can be found in Appendix A.
Hospital-Level Case-Mix Index for Acute Hospitalizations
After excluding normal newborn and maternal hospitalizations, median CMI of the 3117 hospitals with at least 20 unweighted discharges was 1.0 (interquartile range [IQR]: 0.8, 1.7). CMI varied significantly across hospital types (P < .001). Free-standing children’s hospitals exhibited the highest cost-based CMI (median: 2.7, IQR: 2.2–3.1), followed by urban teaching hospitals (median: 1.8, IQR: 1.3–2.6), urban nonteaching hospitals (median: 1.1, IQR: 0.9–1.5), and rural hospitals (median: 0.9, IQR: 0.7–0.9).
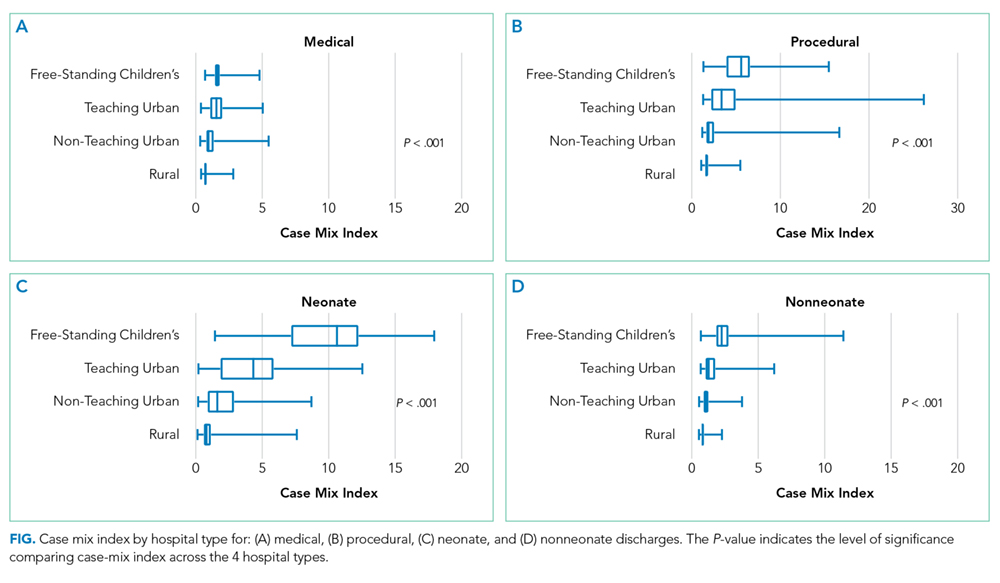
DISCUSSION
Currently, no widely available measures can compare the relative intensity of hospital care specific for inpatient pediatric populations. To meet this important need, we have developed a methodology to determine valid pediatric RWs (H-RISK) which can be used to estimate the intensity of care for applications across entire hospital patient populations and specific subpopulations. H-RISK allow calculation of CMIs for risk adjustment of various outcomes at the discharge- or hospital-level and for comparisons among hospitals and populations. Using this methodology, we demonstrated that the CMI for free-standing children’s hospitals was significantly higher than those of rural, urban, nonteaching and urban teaching hospitals for all discharges and medical or procedural subgroups.
CMS has used RWs based on DRGs since the inception of the prospective payment system in 1983. The sequence of DRGs used by CMS has purposely focused on older adult Medicare population, and CMS itself recommends applying Medicare-focused DRGs (MS-DRGs being the current iteration) only for the >65 year population.6 Nevertheless, many payers, both government and commercial, utilize MS-DRGs and their RWs for payment purposes when reimbursing children’s hospitals. The validity of using weights developed using this grouper in hospitals treating large numbers of pediatric patients and childhood illnesses has been called into question, particularly when such weights are used in reimbursement of children’s hospitals.7
Several factors contribute to the validity of a model for developing RWs. First, the system used to describe patient hospitalizations and illnesses should be appropriate to the population in question. As described above, the original DRG system and its subsequent iterations were designed to describe hospitalizations for adults >65 years of age.8, 9 Over the years, CMS DRGs incorporated rudimentary categories for neonatal and obstetrical hospitalizations. Still, the current MS-DRGs lack sufficient focus on common inpatient pediatric conditions to adequately describe pediatric hospitalizations, particularly those in free-standing children’s hospitals delivering tertiary and quaternary care. Thus, a more appropriate classification schema for developing RWs specific for pediatric hospitalization should include patients across the entire age spectrum. APR-DRGs represent one such classification system.
Once an appropriate patient classification system is selected, then the population of hospitalized patients to be used as the reference group becomes important. For a system targeting a pediatric inpatient population, a hospital discharge database representing a broad sample of pediatric hospitalizations offers the best basis for developing a system of weights applicable to different types of hospitals providing care for children. For this purpose, we selected the 2012 KID database, a nationally representative dataset containing data on newborn and pediatric discharges from the majority of states within the US. This choice assured that the RWs developed were based on and applicable to pediatric hospitalizations across the entire spectrum of SOI and resource intensity.
A number of measures of hospital performance and quality have been developed and are used by various entities, including individual hospitals, CMS, Leapfrog, Magnet, Joint Commission, and payers, for purposes ranging from benchmarking for improvement to payment models to reimbursement penalties. However, SOI of a hospital’s patient population influences not only the intensity of care that a hospital provides but also presents a potential impact on process and outcome measures. Thus, fair and appropriate measures must consider differences in SOI when comparing hospital performances. Using the weights derived in this paper, these adjustments can be possibly made at either the discharge- or hospital-level, depending on the application, and may include comparisons by hospital location, ownership, payer mix, or socioeconomic strata.
It is also common for hospitals to quantitatively express the uniqueness of services that they deliver to payers or the general public. A hospital-level CMI (derived as the average discharge weight for patients within a hospital) is one way that hospitals may differentiate themselves. This can be accomplished by considering the ratio of one hospital’s CMI to another hospital’s (or an average of a group of hospitals) as an expression of the relative intensity of services. For example, if hospital x has a CMI of 2.3, and hospital y has a CMI of 1.4, the population of children hospitalized at hospital x was 64.3% (1–2.3/1.4) more resource intensive than the children seen at hospital y.
This study should be considered in terms of several limitations. We used costs as the basis for determining intensity of service. Thus, the difference in cost structure among children’s hospitals and between children’s hospitals and other hospital types in the KID could have affected the final calculated weights. Also, the RWs calculated in this study rely on hospital discharge data. Thus, complications which were not “present on admission” and occurred during a hospitalization could have reflected poor quality of care yet still increase resource intensity as measured by total costs. Future studies should examine the potential impact of using present-on-admission diagnoses only for the APR-DRG grouping on the values of RWs. Significant variation may have existed among hospitals in resource utilization, and some hospitals may have exhibited significant overutilization of resources for the same conditions. However, as we used Winsorized means, the impact of potential outliers should have been reduced. Some APR-DRG-SOI combinations were seen mainly at children’s hospitals. Thus, cost structure and resource utilization practices of this subset of hospitals would have been the only contributors to weights for these patients. Given that the 2012 KID contained a broad representation of pediatric hospitalizations, with age 0–20 years, newborns accounted for the majority of total cases in the database. While providing a full range of pediatric weights, inclusion of these patients lowered the overall average RW. For this reason, we excluded normal newborn categories and maternal categories from analysis of CMI across hospital types and focused on acute-care hospitalizations. Lastly, as with any study relying on administrative data, there is always the possibility of coding errors or data entry errors in the reference dataset.
CONCLUSIONS
H-RISK can be used to risk adjust measures to account for severity differences across populations. These weights can also be averaged across hospitals’ patient populations to compare relative resource intensities of the patients served.
Disclosures
The authors have nothing to disclose.
1. Pettengill J, Vertrees J. Reliability and Validity in Hospital Case-Mix Measurement. Health Care Financ Rev. 1982; 4(2): 101-128. PubMed
2. Centers for Medicare & Medicaid Services. Details for title: Case Mix Index. https://www.cms.gov/Medicare/Medicare-Fee-for-Service-Payment/AcuteInpatientPPS/Acute-Inpatient-Files-for-Download-Items/CMS022630.html#. Accessed August 30, 2017.
3. Iglehart JK. Medicare begins prospective payment of hospitals. N. Engl. J. Med 1983; 308(23): 1428-1432. PubMed
4. Healthcare Cost Utilization Project. Overview of the Kids’ Inpatient Database (KID). 2017; https://www.hcup-us.ahrq.gov/kidoverview.jsp. Accessed August 30, 2017.
5. Healthcare Cost Utilization Project. Cost-to-Charge Ratio Files: 2012 Kids’ Inpatient Database (KID) User Guide. 2014; https://www.hcup-us.ahrq.gov/db/state/CCR2012KIDUserGuide.pdf. Accessed August 30, 2017.
6. Centers for Medicare & Medicaid Services. Medicare Program; Changes to the Hospital Inpatient Prospective Payment Systems and Fiscal Year 2005 Rates; Final Rule. Federal Register. 2004;69(154):48,939. PubMed
7. Muldoon JH. Structure and performance of different DRG classification systems for neonatal medicine. Pediatrics. 1999; 103(1 Suppl E): 302-318. PubMed
8. Averill R, Goldfield N, Muldoon J, Steinbeck B, Grant T. A Closer Look at All Patient Refined DRGs. J AHIMA. 2002; 73(1): 46-50. PubMed
9. Centers for Medicare & Medicaid Services. Design and development of the Diagnosis Related Group (DRG). https://www.cms.gov/ICD10Manual/version34-fullcode-cms/fullcode_cms/Design_and_development_of_the_Diagnosis_Related_Group_(DRGs)_PBL-038.pdf. Accessed December 6, 2017.
Hospitals are increasingly assessed comparatively in terms of costs and quality for benchmarking purposes. These comparisons can be used by patients and families to determine where to seek care, to report compliance and grant certifications by oversight organizations (eg, Leapfrog, Magnet, Joint Commission), and by payers, to determine reimbursement models and/or to assess financial penalty or bonuses for underperforming or overperforming hospitals. As these efforts can cause substantial reputational and financial consequences for hospitals, these metrics must be contextualized within the population of patients that each hospital serves.
In adult Medicare patient populations, methods have been developed to assess the relative severity of a hospital’s full complement of patients.1,2 These methods assume a relationship between severity and hospital resource intensity (ie, cost) and typically assume the form of relative weights (RWs), which are developed for clinically similar groups of patients (eg, Medicare Diagnosis Related Groups; MS-DRG) from a reference population. A RW for each MS-DRG is calculated as the average cost of patients within the group divided by the average cost for all patients in the reference population. These weights are then applied to a hospital’s discharges over a specific time period and averaged to obtain a hospital-level case-mix index (CMI). A value of 1 indicates that a hospital serves a mix of patients with similar severity (or resource intensity) to that of an “average” hospital discharge in the reference population, whereas a value of 1.2 indicates that a hospital serves a population of patients with 20% more severity than that of an “average” hospital discharge. Since 1983, the Centers for Medicare and Medicaid Services (CMS) has used RWs in their inpatient prospective payment system.3
Similar pediatric methods are less developed and necessitate special consideration as the use of existing weights may be inappropriate for a pediatric population. First, MS-DRGs were developed primarily for the Medicare population and lack sufficient granularity for pediatric populations, specifically newborns. Second, a severity stratification which incorporates important patient characteristics, such as age in pediatrics, does not exist in the MS-DRG system . Finally, although the reference populations that are used to develop MS-DRG weights do not explicitly exclude children, children typically account for approximately 15% of hospitalizations (6% excluding neonatal/maternal) and possibly feature different utilization patterns than adults with similar conditions. Thus, weights developed from a combined pediatric/adult reference population primarily reflect an adult population.
With valid pediatric RWs, stakeholders can assess a hospital’s severity mix of patients in a comparable fashion and contextualize outcome metrics. Additionally, these same weights can be used to estimate expected costs for hospitalizations or for risk adjusting various outcomes at the discharge- or hospital-level. Thus, we sought to develop hospitalization resource intensity scores for kids (H-RISK) using pediatric-specific weights and compare hospital-level CMIs across various hospital types and locations as an example of the application of this novel methodology.
METHODS
Dataset
Data for this analysis were obtained from the 2012 Healthcare Cost and Utilization Project (HCUP) Kids’ Inpatient Database (KID).4 KID is the largest publicly available all-payer inpatient administrative database in the United States and is sponsored by the Agency for Healthcare Research and Quality as part of the HCUP. The 2012 KID included a sample of approximately 3.2 million discharge records of children <21 years old from 44 states and 4,179 community, nonrehabilitation hospitals weighted for national estimates.
Hospital discharge costs were estimated from charges using cost-to-charge ratios (CCR) provided by HCUP as a supplement to the 2012 KID.5 Cost estimates associated with a specific discharge were estimated by multiplying the total charges reported in the data by the appropriate hospital-specific CCR and then adjusted for price factors beyond a hospital’s control using the area wage index also provided by HCUP as a supplement.
H-RISK and Case-Mix Index Calculations
We calculated H-RISK as pediatric-specific RWs based on version 30 of 3M’s All Patient Refined DRG (APR-DRG; 3M Health Information Systems, Salt Lake City, Utah) system as a measure of resource intensity. The APR-DRG system classifies hospital discharges into over 300 base DRGs based on demographic, diagnostic, and therapeutic characteristics. Each APR-DRG is further sub-divided into 4 subclasses of severity of illness (SOI; eg, minor, moderate, major, and extreme) to indicate the intensity of resource utilization during hospitalization. However, SOI levels for differing APR-DRGs are not comparable.
For every APR-DRG SOI combinations available in the 2012 KID, calculation of RW was based on the ratio of the mean cost for patients assigned to a particular APR-DRG SOI compared with the mean cost for all patients in the database. Inpatient costs less than $0.50 were set to missing and removed from analysis. Mortalities and discharges with missing CCR and wage index values were also excluded from analysis. We required that estimates for RWs be based on a reasonable set of data (ie, 10 or more discharges) for each APR-DRG SOI, and that estimates across the 4 SOI levels within an APR-DRG be monotonically nondecreasing (ie, as SOI level increases, weights must either be the same or increasing). Winsorized means were used as point estimates for mean cost in both the numerator and denominator of RW computation. Winsorizing refers to an analytic transformation by which the influence of outliers (eg, values beyond a certain threshold) is mitigated by replacing the value of outliers with the value of the threshold. We used the 5th and 95th percentiles as thresholds for Winsorizing our point estimates.
Winsorized point estimates failing to meet the minimum sample size of 10 or nondecreasing monotonicity requirement were modified by one of the two following methods:
- Cost data were modeled using a generalized linear model assuming an exponential distribution. Covariates in the model included APR-DRG and SOI within APR-DRG as a continuous variable. Where applicable, Winsorized estimates of the mean were replaced with modeled estimates.
- Data from an APR-DRG SOI in question were combined with other SOIs within the same APR-DRG with the closest Winsorized mean value. Once data were combined, a common Winsorized value was re-computed and values across SOIs were checked to ensure that nondecreasing monotonicity was maintained. In some APR-DRGs with sparse data, this involved combining pairs of severity levels; in others, it involved combining three or four severity levels together.
For APR-DRGs in which no discharges at any SOI were recorded in the 2012 KID, we used the Winsorized mean of all encounters with a common major diagnostic category (MDC) as the missing APR-DRG as point estimate for all 4 SOI levels.
To calculate the CMI for a set of discharges (eg, discharges at a hospital in a year), RWs were assigned to each discharge based on APR-DRG SOI designation. Consequently, all discharges from a specific APR-DRG SOI were assigned the same RW. Once RWs were assigned, CMI was calculated as the mean RW across all discharges. To compare hospital types based on acute-care hospital stays which are usually considered with the realm of pediatric care, we excluded RWs for normal newborns, defined as APR-DRG 626 (neonate birthweight of 2000–2499 g, normal newborn or neonate with other problems) and 640 (neonate birthweight >2499 g, normal newborn or neonate with other problems), and maternal hospitalizations, defined as APR-DRG 540 (cesarean delivery) and 560 (vaginal delivery), from our CMI calculations.
Statistical Methodology
Categorical variables were summarized using frequencies and percentages; continuous variables were summarized using medians and interquartile ranges. Differences between hospital
types (eg, rural, urban nonteaching, urban teaching, and
free-standing) were assessed using a Chi-square test for association for categorical variables. Differences in continuous variables including comparisons of neonatal (MDC 15) and nonneonatal discharges, and medical versus procedural discharges as defined by the APR-DRG grouper were assessed using a Kruskal–Wallis test. All analyses were performed using SAS, Version 9.4 (SAS Institute, Cary, North Carolina); P values <.05 were considered statistically significant.
This study was considered nonhuman subjects research by the Institutional Review Board of Vanderbilt University Medical Center.
RESULTS
Patient Population
Table 1 summarizes the patient characteristics for all 4 hospital types. All comparisons of patient characteristics across the four hospital types are significant (P < .001). Of the 6,675,222 weighted discharges in HCUP KID 2012, almost two-thirds were less than one year old (4,269,984). Three-quarters of those infant discharges (3,733,760) were in-hospital births. The South was the Census region with the most number of discharges (38.8%), and over half of discharges (53.2%) included patients who lived in metro areas with more than 1 million residents. Patients disproportionately originated from lower-income areas with 30.9% living in zip codes with median incomes in the first quartile.
H-RISK Generation
The weighted Winsorized mean cost of all discharges was $6,135 per discharge. The majority of cost-based H-RISK were higher than 1, with 1,038 (82.5%) of APR-DRG SOIs incurring an estimated cost higher than $6,135. Solid organ and bone marrow transplantations represented 4 of the 10 highest cost-based RWs for procedural APR-DRG SOIs (Table 3). Neonatal APR-DRG SOIs accounted for 8 of the 10 highest medical RWs. A list of all APR-DRG SOIs and H-RISK can be found in Appendix A.
Hospital-Level Case-Mix Index for Acute Hospitalizations
After excluding normal newborn and maternal hospitalizations, median CMI of the 3117 hospitals with at least 20 unweighted discharges was 1.0 (interquartile range [IQR]: 0.8, 1.7). CMI varied significantly across hospital types (P < .001). Free-standing children’s hospitals exhibited the highest cost-based CMI (median: 2.7, IQR: 2.2–3.1), followed by urban teaching hospitals (median: 1.8, IQR: 1.3–2.6), urban nonteaching hospitals (median: 1.1, IQR: 0.9–1.5), and rural hospitals (median: 0.9, IQR: 0.7–0.9).
DISCUSSION
Currently, no widely available measures can compare the relative intensity of hospital care specific for inpatient pediatric populations. To meet this important need, we have developed a methodology to determine valid pediatric RWs (H-RISK) which can be used to estimate the intensity of care for applications across entire hospital patient populations and specific subpopulations. H-RISK allow calculation of CMIs for risk adjustment of various outcomes at the discharge- or hospital-level and for comparisons among hospitals and populations. Using this methodology, we demonstrated that the CMI for free-standing children’s hospitals was significantly higher than those of rural, urban, nonteaching and urban teaching hospitals for all discharges and medical or procedural subgroups.
CMS has used RWs based on DRGs since the inception of the prospective payment system in 1983. The sequence of DRGs used by CMS has purposely focused on older adult Medicare population, and CMS itself recommends applying Medicare-focused DRGs (MS-DRGs being the current iteration) only for the >65 year population.6 Nevertheless, many payers, both government and commercial, utilize MS-DRGs and their RWs for payment purposes when reimbursing children’s hospitals. The validity of using weights developed using this grouper in hospitals treating large numbers of pediatric patients and childhood illnesses has been called into question, particularly when such weights are used in reimbursement of children’s hospitals.7
Several factors contribute to the validity of a model for developing RWs. First, the system used to describe patient hospitalizations and illnesses should be appropriate to the population in question. As described above, the original DRG system and its subsequent iterations were designed to describe hospitalizations for adults >65 years of age.8, 9 Over the years, CMS DRGs incorporated rudimentary categories for neonatal and obstetrical hospitalizations. Still, the current MS-DRGs lack sufficient focus on common inpatient pediatric conditions to adequately describe pediatric hospitalizations, particularly those in free-standing children’s hospitals delivering tertiary and quaternary care. Thus, a more appropriate classification schema for developing RWs specific for pediatric hospitalization should include patients across the entire age spectrum. APR-DRGs represent one such classification system.
Once an appropriate patient classification system is selected, then the population of hospitalized patients to be used as the reference group becomes important. For a system targeting a pediatric inpatient population, a hospital discharge database representing a broad sample of pediatric hospitalizations offers the best basis for developing a system of weights applicable to different types of hospitals providing care for children. For this purpose, we selected the 2012 KID database, a nationally representative dataset containing data on newborn and pediatric discharges from the majority of states within the US. This choice assured that the RWs developed were based on and applicable to pediatric hospitalizations across the entire spectrum of SOI and resource intensity.
A number of measures of hospital performance and quality have been developed and are used by various entities, including individual hospitals, CMS, Leapfrog, Magnet, Joint Commission, and payers, for purposes ranging from benchmarking for improvement to payment models to reimbursement penalties. However, SOI of a hospital’s patient population influences not only the intensity of care that a hospital provides but also presents a potential impact on process and outcome measures. Thus, fair and appropriate measures must consider differences in SOI when comparing hospital performances. Using the weights derived in this paper, these adjustments can be possibly made at either the discharge- or hospital-level, depending on the application, and may include comparisons by hospital location, ownership, payer mix, or socioeconomic strata.
It is also common for hospitals to quantitatively express the uniqueness of services that they deliver to payers or the general public. A hospital-level CMI (derived as the average discharge weight for patients within a hospital) is one way that hospitals may differentiate themselves. This can be accomplished by considering the ratio of one hospital’s CMI to another hospital’s (or an average of a group of hospitals) as an expression of the relative intensity of services. For example, if hospital x has a CMI of 2.3, and hospital y has a CMI of 1.4, the population of children hospitalized at hospital x was 64.3% (1–2.3/1.4) more resource intensive than the children seen at hospital y.
This study should be considered in terms of several limitations. We used costs as the basis for determining intensity of service. Thus, the difference in cost structure among children’s hospitals and between children’s hospitals and other hospital types in the KID could have affected the final calculated weights. Also, the RWs calculated in this study rely on hospital discharge data. Thus, complications which were not “present on admission” and occurred during a hospitalization could have reflected poor quality of care yet still increase resource intensity as measured by total costs. Future studies should examine the potential impact of using present-on-admission diagnoses only for the APR-DRG grouping on the values of RWs. Significant variation may have existed among hospitals in resource utilization, and some hospitals may have exhibited significant overutilization of resources for the same conditions. However, as we used Winsorized means, the impact of potential outliers should have been reduced. Some APR-DRG-SOI combinations were seen mainly at children’s hospitals. Thus, cost structure and resource utilization practices of this subset of hospitals would have been the only contributors to weights for these patients. Given that the 2012 KID contained a broad representation of pediatric hospitalizations, with age 0–20 years, newborns accounted for the majority of total cases in the database. While providing a full range of pediatric weights, inclusion of these patients lowered the overall average RW. For this reason, we excluded normal newborn categories and maternal categories from analysis of CMI across hospital types and focused on acute-care hospitalizations. Lastly, as with any study relying on administrative data, there is always the possibility of coding errors or data entry errors in the reference dataset.
CONCLUSIONS
H-RISK can be used to risk adjust measures to account for severity differences across populations. These weights can also be averaged across hospitals’ patient populations to compare relative resource intensities of the patients served.
Disclosures
The authors have nothing to disclose.
1. Pettengill J, Vertrees J. Reliability and Validity in Hospital Case-Mix Measurement. Health Care Financ Rev. 1982; 4(2): 101-128. PubMed
2. Centers for Medicare & Medicaid Services. Details for title: Case Mix Index. https://www.cms.gov/Medicare/Medicare-Fee-for-Service-Payment/AcuteInpatientPPS/Acute-Inpatient-Files-for-Download-Items/CMS022630.html#. Accessed August 30, 2017.
3. Iglehart JK. Medicare begins prospective payment of hospitals. N. Engl. J. Med 1983; 308(23): 1428-1432. PubMed
4. Healthcare Cost Utilization Project. Overview of the Kids’ Inpatient Database (KID). 2017; https://www.hcup-us.ahrq.gov/kidoverview.jsp. Accessed August 30, 2017.
5. Healthcare Cost Utilization Project. Cost-to-Charge Ratio Files: 2012 Kids’ Inpatient Database (KID) User Guide. 2014; https://www.hcup-us.ahrq.gov/db/state/CCR2012KIDUserGuide.pdf. Accessed August 30, 2017.
6. Centers for Medicare & Medicaid Services. Medicare Program; Changes to the Hospital Inpatient Prospective Payment Systems and Fiscal Year 2005 Rates; Final Rule. Federal Register. 2004;69(154):48,939. PubMed
7. Muldoon JH. Structure and performance of different DRG classification systems for neonatal medicine. Pediatrics. 1999; 103(1 Suppl E): 302-318. PubMed
8. Averill R, Goldfield N, Muldoon J, Steinbeck B, Grant T. A Closer Look at All Patient Refined DRGs. J AHIMA. 2002; 73(1): 46-50. PubMed
9. Centers for Medicare & Medicaid Services. Design and development of the Diagnosis Related Group (DRG). https://www.cms.gov/ICD10Manual/version34-fullcode-cms/fullcode_cms/Design_and_development_of_the_Diagnosis_Related_Group_(DRGs)_PBL-038.pdf. Accessed December 6, 2017.
© 2018 Society of Hospital Medicine
Safety Huddle Intervention for Reducing Physiologic Monitor Alarms: A Hybrid Effectiveness-Implementation Cluster Randomized Trial
Physiologic monitor alarms occur frequently in the hospital environment, with average rates on pediatric wards between 42 and 155 alarms per monitored patient-day.1 However, average rates do not depict the full story, because only 9%–25% of patients are responsible for most alarms on inpatient wards.1,2 In addition, only 0.5%–1% of alarms on pediatric wards warrant action.3,4 Downstream consequences of high alarm rates include interruptions5,6 and alarm fatigue.3,4,7
Alarm customization, the process of reviewing individual patients’ alarm data and using that data to implement patient-specific alarm reduction interventions, has emerged as a potential approach to unit-wide alarm management.8-11 Potential customizations include broadening alarm thresholds, instituting delays between the time the alarm condition is met and the time the alarm sounds, and changing electrodes.8-11 However, the workflows within which to identify the patients who will benefit from customization, make decisions about how to customize, and implement customizations have not been delineated.
Safety huddles are brief structured discussions among physicians, nurses, and other staff aiming to identify and mitigate threats to patient safety.11-13 In this study, we aimed to evaluate the influence of a safety huddle-based alarm intervention strategy targeting high alarm pediatric ward patients on (a) unit-level alarm rates and (b) patient-level alarm rates, as well as to (c) evaluate implementation outcomes. We hypothesized that patients discussed in huddles would have greater reductions in alarm rates in the 24 hours following their huddle than patients who were not discussed. Given that most alarms are generated by a small fraction of patients,1,2 we hypothesized that patient-level reductions would translate to unit-level reductions.
METHODS
Human Subject Protection
The Institutional Review Board of Children’s Hospital of Philadelphia approved this study with a waiver of informed consent. We registered the study at ClinicalTrials.gov (identifier NCT02458872). The original protocol is available as an Online Supplement.
Design and Framework

For our secondary effectiveness outcome evaluating the effect of the intervention on the alarm rates of the individual patients discussed in huddles, we used a cohort design embedded within the trial to analyze patient-specific alarm data collected only on randomly selected “intensive data collection days,” described below and in Figure 1.
Setting and Subjects
All patients hospitalized on 8 units that admit general pediatric and medical subspecialty patients at Children’s Hospital of Philadelphia between June 15, 2015 and May 8, 2016 were included in the primary (unit-level) analysis. Every patient’s bedside included a General Electric Dash 3000 physiologic monitor. Decisions to monitor patients were made by physicians and required orders. Default alarm settings are available in Supplementary Table 1; these settings required orders to change.
All 8 units were already convening scheduled safety huddles led by the charge nurse each day. All nurses and at least one resident were expected to attend; attending physicians and fellows were welcome but not expected to attend. Huddles focused on discussing safety concerns and patient flow. None of the preexisting huddles included alarm discussion.
Intervention
For each nonholiday weekday, we generated customized paper-based alarm huddle data “dashboards” (Supplementary Figure 1) displaying data from the patients (up to a maximum of 4) on each intervention unit with the highest numbers of high-acuity alarms (“crisis” and “warning” audible alarms, see Supplementary Table 2 for detailed listing of alarm types) in the preceding 4 hours by reviewing data from the monitor network using BedMasterEx v4.2 (Excel Medical Electronics). Dashboards listed the most frequent types of alarms, alarm settings, and included a script for discussing the alarms with checkboxes to indicate changes agreed upon by the team during the huddle. Patients with fewer than 20 alarms in the preceding 4h were not included; thus, sometimes fewer than 4 patients’ data were available for discussion. We hand-delivered dashboards to the charge nurses leading huddles, and they facilitated the multidisciplinary alarm discussions focused on reviewing alarm data and customizing settings to reduce unnecessary alarms.
Study Periods
The study had 3 periods as shown in Supplementary Figure 2: (1) 16-week baseline data collection, (2) phased intervention implementation during which we serially spent 2-8 weeks on each of the 4 intervention units implementing the intervention, and (3) 16-week postimplementation data collection.
Outcomes
The primary effectiveness outcome was the change in unit-level alarms per patient-day between the baseline and postimplementation periods in intervention versus control units, with all patients on the units included. The secondary effectiveness outcome (analyzed using the embedded cohort design) was the change in individual patient-level alarms between the 24 hours leading up to a huddle and the 24 hours following huddles in patients who were versus patients who were not discussed in huddles.
Implementation outcomes included adoption and fidelity measures. To measure adoption (defined as “intention to try” the intervention),16 we measured the frequency of discussions attended by patients’ nurses and physicians. We evaluated 3 elements of fidelity: adherence, dose, and quality of delivery.17 We measured adherence as the incorporation of alarm discussion into huddles when there were eligible patients to discuss. We measured dose as the average number of patients discussed on each unit per calendar day during the postimplementation period. We measured quality of delivery as the extent to which changes to monitoring that were agreed upon in the huddles were made at the bedside.
Safety Measures
To surveil for unintended consequences of reduced monitoring, we screened the hospital’s rapid response and code blue team database weekly for any events in patients previously discussed in huddles that occurred between huddle and hospital discharge. We reviewed charts to determine if the events were related to the intervention.
Randomization
Prior to randomization, the 8 units were divided into pairs based on participation in hospital-wide Joint Commission alarm management activities, use of alarm middleware that relayed detailed alarm information to nurses’ mobile phones, and baseline alarm rates. One unit in each pair was randomized to intervention and the other to control by coin flip.
Data Collection
We used Research Electronic Data Capture (REDCap)18 database tools.
Data for Unit-Level Analyses
We captured all alarms occurring on the study units during the study period using data from BedMasterEx. We obtained census data accurate to the hour from the Clinical Data Warehouse.
Data Captured in All Huddles
During each huddle, we collected the number of patients whose alarms were discussed, patient characteristics, presence of nurses and physicians, and monitoring changes agreed upon. We then followed up 4 hours later to determine if changes were made at the bedside by examining monitor settings.
Data Captured Only During Intensive Data Collection Days
We randomly selected 1 day during each of the 16 weeks of the postimplementation period to obtain additional patient-level data. On each intensive data collection day, the 4 monitored patients on each intervention and control unit with the most high-acuity alarms in the 4 hours prior to huddles occurring — regardless of whether or not these patients were later discussed in huddles — were identified for data collection. On these dates, a member of the research team reviewed each patient’s alarm counts in 4-hour blocks during the 24 hours before and after the huddle. Given that the huddles were not always at the same time every day (ranging between 10:00 and 13:00), we operationally set the huddle time as 12:00 for all units.
Data Analysis
We used Stata/SE 14.2 for all analyses.
Unit-Level Alarm Rates
To compare unit-level rates, we performed an interrupted time series analysis using segmented (piecewise) regression to evaluate the impact of the intervention.19,20 We used a multivariable generalized estimating equation model with the negative binomial distribution21 and clustering by unit. We bootstrapped the model and generated percentile-based 95% confidence intervals. We then used the model to estimate the alarm rate difference in differences between the baseline data collection period and the postimplementation data collection period for intervention versus control units.
Patient-Level Alarm Rates
In contrast to unit-level analysis, we used an embedded cohort design to model the change in individual patients’ alarms between the 24 hours leading up to huddles and the 24 hours following huddles in patients who were versus patients who were not discussed in huddles. The analysis was restricted to the patients included in intensive data collection days. We performed bootstrapped linear regression and generated percentile-based 95% confidence intervals using the difference in 4-hour block alarm rate between pre- and posthuddle as the outcome. We clustered within patients. We stratified by unit and preceding alarm rate. We modeled the alarm rate difference between the 24-hour prehuddle and the 24-hour posthuddle for huddled and nonhuddled patients and the difference in differences between exposure groups.
Implementation Outcomes
We summarized adoption and fidelity using proportions.
RESULTS
Alarm dashboards informed 580 structured alarm discussions during 353 safety huddles (huddles often included discussion of more than one patient).
Unit-Level Alarm Rates
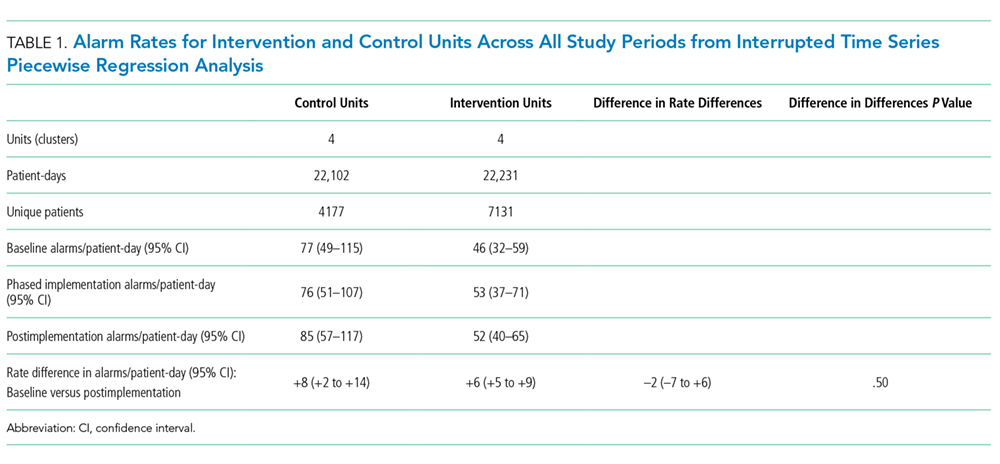
Visually, alarm rates over time on each individual unit appeared flat despite the intervention (Supplementary Figure 3). Using piecewise regression, we found that intervention and control units had small increases in alarm rates between the baseline and postimplementation periods with a nonsignificant difference in these differences between the control and intervention groups (Table 1).
Patient-Level Alarm Rates
We then restricted the analysis to the patients whose data were collected during intensive data collection days. We obtained data from 1974 pre-post pairs of 4-hour time periods.
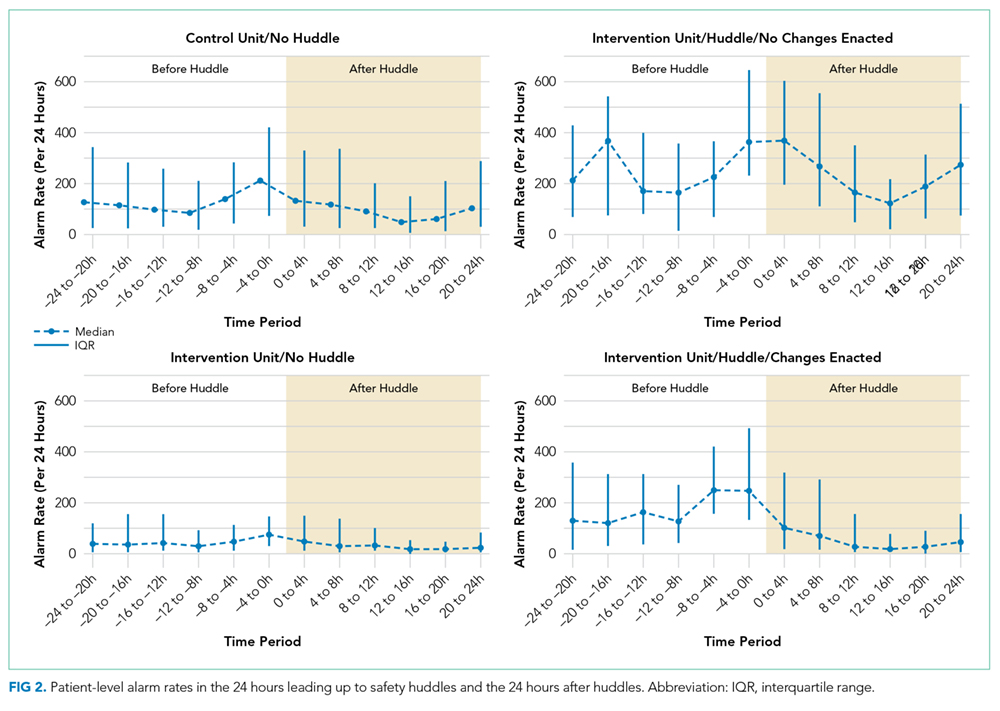

Implementation Outcomes
Adoption
The patient’s nurse attended 482 of the 580 huddle discussions (83.1%), and at least one of the patient’s physicians (resident, fellow, or attending) attended 394 (67.9%).
Fidelity: Adherence
In addition to the 353 huddles that included alarm discussion, 123 instances had no patients with ≥20 high acuity alarms in the preceding 4 hours therefore, no data were brought to the huddle. There were an additional 30 instances when a huddle did not occur or there was no alarm discussion in the huddle despite data being available. Thus, adherence occurred in 353 of 383 huddles (92.2%).
Fidelity: Dose
During the 112 calendar day postimplementation period, 379 patients’ alarms were discussed in huddles for an average intervention dose of 0.85 discussions per unit per calendar day.
Fidelity: Quality of Delivery
In 362 of the 580 huddle discussions (62.4%), changes were agreed upon. The most frequently agreed upon changes were discontinuing monitoring (32.0%), monitoring only when asleep or unsupervised (23.8%), widening heart rate parameters (12.7%), changing electrocardiographic leads/wires (8.6%), changing the pulse oximetry probe (8.0%), and increasing the delay time between when oxygen desaturation was detected and when the alarm was generated (4.7%). Of the huddle discussions with changes agreed upon, 346 (95.6%) changes were enacted at the bedside.
Safety Measures
There were 0 code blue events and 26 rapid response team activations for patients discussed in huddles. None were related to the intervention.
Discussion
Our main finding was that the huddle strategy was effective in safely reducing the burden of alarms for the high alarm pediatric ward patients whose alarms were discussed, but it did not reduce unit-level alarm rates. Implementation outcomes explained this finding. Although adoption and adherence were high, the overall dose of the intervention was low.
We also found that 36% of alarms had technical causes, the majority of which were related to the pulse oximetry probe detecting that it was off the patient or searching for a pulse. Although these alarms are likely perceived differently by clinical staff (most monitors generate different sounds for technical alarms), they still represent a substantial contribution to the alarm environment. Minimizing them in patients who must remain continuously monitored requires more intensive effort to implement other types of interventions than the main focus of this study, such as changing pulse oximetry probes and electrocardiographic leads/wires.
In one-third of huddles, monitoring was simply discontinued. We observed in many cases that, while these patients may have had legitimate indications for monitoring upon admission, their conditions had improved; after brief multidisciplinary discussion, the team concluded that monitoring was no longer indicated. This observation may suggest interventions at the ordering phase, such as prespecifying a monitoring duration.22,23
This study’s findings were consistent with a quasi-experimental study of safety huddle-based alarm discussions in a pediatric intensive care unit that showed a patient-level reduction of 116 alarms per patient-day in those discussed in huddles relative to controls.11 A smaller quasi-experimental study of implementing a nighttime alarm “ward round” in an adult intensive care unit showed a significant reduction in unit-level alarms/patient-day from 168 to 84.9 In a quality improvement report, a monitoring care process bundle that included discussion of alarm settings showed a reduction in unit-level alarms/patient-day from 180 to 40.10 Our study strengthens the body of literature using a cluster-randomized design, measuring patient- and unit-level outcomes, and including implementation outcomes that explain effectiveness findings.
On a hypothetical unit similar to the ones we studied with 20 occupied beds and 60 alarms/patient-day, an average of 1200 alarms would occur each day. We delivered the intervention to 0.85 patients per day. Changes were made at the bedside in 60% of those with the intervention delivered, and those patients had a difference in differences of 119 fewer alarms compared with the comparison patients on control units. In this scenario, we could expect a relative reduction of 0.85 x 0.60 x 119 = 61 fewer alarms/day total on the unit or a 5% reduction. However, that estimated reduction did not account for the arrival of new patients with high alarm rates, which certainly occurred in this study and explained the lack of effect at the unit level.
As described above, the intervention dose was low, which translated into a lack of effect at the unit level despite a strong effect at the patient level. This result was partly due to the manual process required to produce the alarm dashboards that restricted their availability to nonholiday weekdays. The study was performed at one hospital, which limited generalizability. The study hospital was already convening daily safety huddles that were well attended by nurses and physicians. Other hospitals without existing huddle structures may face challenges in implementing similar multidisciplinary alarm discussions. In addition, the study design was randomized at the unit (rather than patient) level, which limited our ability to balance potential confounders at the patient level.
Conclusion
A safety huddle intervention strategy to drive alarm customization was effective in safely reducing alarms for individual children discussed. However, unit-level alarm rates were not affected by the intervention due to a low dose. Leaders of efforts to reduce alarms should consider beginning with passive interventions (such as changes to default settings and alarm delays) and use huddle-based discussion as a second-line intervention to address remaining patients with high alarm rates.
Acknowledgments
We thank Matthew MacMurchy, BA, for his assistance with data collection.
Funding/Support
This study was supported by a Young Investigator Award (Bonafide, PI) from the Academic Pediatric Association.
Role of the Funder/Sponsor
The Academic Pediatric Association had no role in the design or conduct of the study; collection, management, analysis, or interpretation of the data; preparation, review, or approval of the manuscript; or decision to submit for publication.
Disclosures
No relevant financial activities, aside from the grant funding from the Academic Pediatric Association listed above, are reported.
1. Schondelmeyer AC, Brady PW, Goel VV, et al. Physiologic monitor alarm rates at 5 children’s hospitals. J Hosp Med. 2018;In press. PubMed
2. Cvach M, Kitchens M, Smith K, Harris P, Flack MN. Customizing alarm limits based on specific needs of patients. Biomed Instrum Technol. 2017;51(3):227-234. PubMed
3. Bonafide CP, Lin R, Zander M, et al. Association between exposure to nonactionable physiologic monitor alarms and response time in a children’s hospital. J Hosp Med. 2015;10(6):345-351. PubMed
4. Bonafide CP, Localio AR, Holmes JH, et al. Video analysis of factors associated with response time to physiologic monitor alarms in a children’s hospital. JAMA Pediatr. 2017;171(6):524-531. PubMed
5. Lange K, Nowak M, Zoller R, Lauer W. Boundary conditions for safe detection of clinical alarms: An observational study to identify the cognitive and perceptual demands on an Intensive Care Unit. In: In: D. de Waard, K.A. Brookhuis, A. Toffetti, A. Stuiver, C. Weikert, D. Coelho, D. Manzey, A.B. Ünal, S. Röttger, and N. Merat (Eds.) Proceedings of the Human Factors and Ergonomics Society Europe Chapter 2015 Annual Conference. Groningen, Netherlands; 2016.
6. Westbrook JI, Li L, Hooper TD, Raban MZ, Middleton S, Lehnbom EC. Effectiveness of a ‘Do not interrupt’ bundled intervention to reduce interruptions during medication administration: a cluster randomised controlled feasibility study. BMJ Qual Saf. 2017;26:734-742. PubMed
7. Chopra V, McMahon LF Jr. Redesigning hospital alarms for patient safety: alarmed and potentially dangerous. JAMA. 2014;311(12):1199-1200. PubMed
8. Turmell JW, Coke L, Catinella R, Hosford T, Majeski A. Alarm fatigue: use of an evidence-based alarm management strategy. J Nurs Care Qual. 2017;32(1):47-54. PubMed
9. Koerber JP, Walker J, Worsley M, Thorpe CM. An alarm ward round reduces the frequency of false alarms on the ICU at night. J Intensive Care Soc. 2011;12(1):75-76.
10. Dandoy CE, Davies SM, Flesch L, et al. A team-based approach to reducing cardiac monitor alarms. Pediatrics. 2014;134(6):e1686-1694. PubMed
11. Dewan M, Wolfe H, Lin R, et al. Impact of a safety huddle–based intervention on monitor alarm rates in low-acuity pediatric intensive care unit patients. J Hosp Med. 2017;12(8):652-657. PubMed
12. Goldenhar LM, Brady PW, Sutcliffe KM, Muething SE. Huddling for high reliability and situation awareness. BMJ Qual Saf. 2013;22(11):899-906. PubMed
13. Brady PW, Muething S, Kotagal U, et al. Improving situation awareness to reduce unrecognized clinical deterioration and serious safety events. Pediatrics. 2013;131:e298-308. PubMed
14. Curran GM, Bauer M, Mittman B, Pyne JM, Stetler C. Effectiveness-implementation hybrid designs: combining elements of clinical effectiveness and implementation research to enhance public health impact. Med Care. 2012;50(3):217-226. PubMed
15. Damschroder LJ, Aron DC, Keith RE, Kirsh SR, Alexander JA, Lowery JC. Fostering implementation of health services research findings into practice: a consolidated framework for advancing implementation science. Implement Sci. 2009;4(1):50. PubMed
16. Proctor E, Silmere H, Raghavan R, et al. Outcomes for implementation research: conceptual distinctions, measurement challenges, and research agenda. Adm Policy Ment Health. 2011;38(2):65-76. PubMed
17. Allen JD, Linnan LA, Emmons KM. Fidelity and its relationship to implementation effectiveness, adaptation, and dissemination. In: Dissemination and Implementation Research in Health: Translating Science to Practice (Brownson RC, Proctor EK, Colditz GA Eds.). Oxford University Press; 2012:281-304.
18. Harris PA, Taylor R, Thielke R, Payne J, Gonzalez N, Conde JG. Research electronic data capture (REDCap)—a metadata-driven methodology and workflow process for providing translational research informatics support. J Biomed Inf. 2009;42:377-381. PubMed
19. Singer JD, Willett JB. Applied Longitudinal Data Analysis: Modeling Change and Event Occurrence. New York: Oxford University Press; 2003.
20. Wagner AK, Soumerai SB, Zhang F, Ross-Degnan D. Segmented regression analysis of interrupted time series studies in medication use research. J Clin Pharm Ther. 2002;27:299-309. PubMed
21. Gardner W, Mulvey EP, Shaw EC. Regression analyses of counts and rates: Poisson, overdispersed Poisson, and negative binomial models. Psychol Bull. 1995;118:392-404. PubMed
22. Dressler R, Dryer MM, Coletti C, Mahoney D, Doorey AJ. Altering overuse of cardiac telemetry in non-intensive care unit settings by hardwiring the use of American Heart Association guidelines. JAMA Intern Med. 2014;174(11):1852-1854. PubMed
23. Boggan JC, Navar-Boggan AM, Patel V, Schulteis RD, Simel DL. Reductions in telemetry order duration do not reduce telemetry utilization. J Hosp Med. 2014;9(12):795-796. PubMed
Physiologic monitor alarms occur frequently in the hospital environment, with average rates on pediatric wards between 42 and 155 alarms per monitored patient-day.1 However, average rates do not depict the full story, because only 9%–25% of patients are responsible for most alarms on inpatient wards.1,2 In addition, only 0.5%–1% of alarms on pediatric wards warrant action.3,4 Downstream consequences of high alarm rates include interruptions5,6 and alarm fatigue.3,4,7
Alarm customization, the process of reviewing individual patients’ alarm data and using that data to implement patient-specific alarm reduction interventions, has emerged as a potential approach to unit-wide alarm management.8-11 Potential customizations include broadening alarm thresholds, instituting delays between the time the alarm condition is met and the time the alarm sounds, and changing electrodes.8-11 However, the workflows within which to identify the patients who will benefit from customization, make decisions about how to customize, and implement customizations have not been delineated.
Safety huddles are brief structured discussions among physicians, nurses, and other staff aiming to identify and mitigate threats to patient safety.11-13 In this study, we aimed to evaluate the influence of a safety huddle-based alarm intervention strategy targeting high alarm pediatric ward patients on (a) unit-level alarm rates and (b) patient-level alarm rates, as well as to (c) evaluate implementation outcomes. We hypothesized that patients discussed in huddles would have greater reductions in alarm rates in the 24 hours following their huddle than patients who were not discussed. Given that most alarms are generated by a small fraction of patients,1,2 we hypothesized that patient-level reductions would translate to unit-level reductions.
METHODS
Human Subject Protection
The Institutional Review Board of Children’s Hospital of Philadelphia approved this study with a waiver of informed consent. We registered the study at ClinicalTrials.gov (identifier NCT02458872). The original protocol is available as an Online Supplement.
Design and Framework
For our secondary effectiveness outcome evaluating the effect of the intervention on the alarm rates of the individual patients discussed in huddles, we used a cohort design embedded within the trial to analyze patient-specific alarm data collected only on randomly selected “intensive data collection days,” described below and in Figure 1.
Setting and Subjects
All patients hospitalized on 8 units that admit general pediatric and medical subspecialty patients at Children’s Hospital of Philadelphia between June 15, 2015 and May 8, 2016 were included in the primary (unit-level) analysis. Every patient’s bedside included a General Electric Dash 3000 physiologic monitor. Decisions to monitor patients were made by physicians and required orders. Default alarm settings are available in Supplementary Table 1; these settings required orders to change.
All 8 units were already convening scheduled safety huddles led by the charge nurse each day. All nurses and at least one resident were expected to attend; attending physicians and fellows were welcome but not expected to attend. Huddles focused on discussing safety concerns and patient flow. None of the preexisting huddles included alarm discussion.
Intervention
For each nonholiday weekday, we generated customized paper-based alarm huddle data “dashboards” (Supplementary Figure 1) displaying data from the patients (up to a maximum of 4) on each intervention unit with the highest numbers of high-acuity alarms (“crisis” and “warning” audible alarms, see Supplementary Table 2 for detailed listing of alarm types) in the preceding 4 hours by reviewing data from the monitor network using BedMasterEx v4.2 (Excel Medical Electronics). Dashboards listed the most frequent types of alarms, alarm settings, and included a script for discussing the alarms with checkboxes to indicate changes agreed upon by the team during the huddle. Patients with fewer than 20 alarms in the preceding 4h were not included; thus, sometimes fewer than 4 patients’ data were available for discussion. We hand-delivered dashboards to the charge nurses leading huddles, and they facilitated the multidisciplinary alarm discussions focused on reviewing alarm data and customizing settings to reduce unnecessary alarms.
Study Periods
The study had 3 periods as shown in Supplementary Figure 2: (1) 16-week baseline data collection, (2) phased intervention implementation during which we serially spent 2-8 weeks on each of the 4 intervention units implementing the intervention, and (3) 16-week postimplementation data collection.
Outcomes
The primary effectiveness outcome was the change in unit-level alarms per patient-day between the baseline and postimplementation periods in intervention versus control units, with all patients on the units included. The secondary effectiveness outcome (analyzed using the embedded cohort design) was the change in individual patient-level alarms between the 24 hours leading up to a huddle and the 24 hours following huddles in patients who were versus patients who were not discussed in huddles.
Implementation outcomes included adoption and fidelity measures. To measure adoption (defined as “intention to try” the intervention),16 we measured the frequency of discussions attended by patients’ nurses and physicians. We evaluated 3 elements of fidelity: adherence, dose, and quality of delivery.17 We measured adherence as the incorporation of alarm discussion into huddles when there were eligible patients to discuss. We measured dose as the average number of patients discussed on each unit per calendar day during the postimplementation period. We measured quality of delivery as the extent to which changes to monitoring that were agreed upon in the huddles were made at the bedside.
Safety Measures
To surveil for unintended consequences of reduced monitoring, we screened the hospital’s rapid response and code blue team database weekly for any events in patients previously discussed in huddles that occurred between huddle and hospital discharge. We reviewed charts to determine if the events were related to the intervention.
Randomization
Prior to randomization, the 8 units were divided into pairs based on participation in hospital-wide Joint Commission alarm management activities, use of alarm middleware that relayed detailed alarm information to nurses’ mobile phones, and baseline alarm rates. One unit in each pair was randomized to intervention and the other to control by coin flip.
Data Collection
We used Research Electronic Data Capture (REDCap)18 database tools.
Data for Unit-Level Analyses
We captured all alarms occurring on the study units during the study period using data from BedMasterEx. We obtained census data accurate to the hour from the Clinical Data Warehouse.
Data Captured in All Huddles
During each huddle, we collected the number of patients whose alarms were discussed, patient characteristics, presence of nurses and physicians, and monitoring changes agreed upon. We then followed up 4 hours later to determine if changes were made at the bedside by examining monitor settings.
Data Captured Only During Intensive Data Collection Days
We randomly selected 1 day during each of the 16 weeks of the postimplementation period to obtain additional patient-level data. On each intensive data collection day, the 4 monitored patients on each intervention and control unit with the most high-acuity alarms in the 4 hours prior to huddles occurring — regardless of whether or not these patients were later discussed in huddles — were identified for data collection. On these dates, a member of the research team reviewed each patient’s alarm counts in 4-hour blocks during the 24 hours before and after the huddle. Given that the huddles were not always at the same time every day (ranging between 10:00 and 13:00), we operationally set the huddle time as 12:00 for all units.
Data Analysis
We used Stata/SE 14.2 for all analyses.
Unit-Level Alarm Rates
To compare unit-level rates, we performed an interrupted time series analysis using segmented (piecewise) regression to evaluate the impact of the intervention.19,20 We used a multivariable generalized estimating equation model with the negative binomial distribution21 and clustering by unit. We bootstrapped the model and generated percentile-based 95% confidence intervals. We then used the model to estimate the alarm rate difference in differences between the baseline data collection period and the postimplementation data collection period for intervention versus control units.
Patient-Level Alarm Rates
In contrast to unit-level analysis, we used an embedded cohort design to model the change in individual patients’ alarms between the 24 hours leading up to huddles and the 24 hours following huddles in patients who were versus patients who were not discussed in huddles. The analysis was restricted to the patients included in intensive data collection days. We performed bootstrapped linear regression and generated percentile-based 95% confidence intervals using the difference in 4-hour block alarm rate between pre- and posthuddle as the outcome. We clustered within patients. We stratified by unit and preceding alarm rate. We modeled the alarm rate difference between the 24-hour prehuddle and the 24-hour posthuddle for huddled and nonhuddled patients and the difference in differences between exposure groups.
Implementation Outcomes
We summarized adoption and fidelity using proportions.
RESULTS
Alarm dashboards informed 580 structured alarm discussions during 353 safety huddles (huddles often included discussion of more than one patient).
Unit-Level Alarm Rates
Visually, alarm rates over time on each individual unit appeared flat despite the intervention (Supplementary Figure 3). Using piecewise regression, we found that intervention and control units had small increases in alarm rates between the baseline and postimplementation periods with a nonsignificant difference in these differences between the control and intervention groups (Table 1).
Patient-Level Alarm Rates
We then restricted the analysis to the patients whose data were collected during intensive data collection days. We obtained data from 1974 pre-post pairs of 4-hour time periods.
Implementation Outcomes
Adoption
The patient’s nurse attended 482 of the 580 huddle discussions (83.1%), and at least one of the patient’s physicians (resident, fellow, or attending) attended 394 (67.9%).
Fidelity: Adherence
In addition to the 353 huddles that included alarm discussion, 123 instances had no patients with ≥20 high acuity alarms in the preceding 4 hours therefore, no data were brought to the huddle. There were an additional 30 instances when a huddle did not occur or there was no alarm discussion in the huddle despite data being available. Thus, adherence occurred in 353 of 383 huddles (92.2%).
Fidelity: Dose
During the 112 calendar day postimplementation period, 379 patients’ alarms were discussed in huddles for an average intervention dose of 0.85 discussions per unit per calendar day.
Fidelity: Quality of Delivery
In 362 of the 580 huddle discussions (62.4%), changes were agreed upon. The most frequently agreed upon changes were discontinuing monitoring (32.0%), monitoring only when asleep or unsupervised (23.8%), widening heart rate parameters (12.7%), changing electrocardiographic leads/wires (8.6%), changing the pulse oximetry probe (8.0%), and increasing the delay time between when oxygen desaturation was detected and when the alarm was generated (4.7%). Of the huddle discussions with changes agreed upon, 346 (95.6%) changes were enacted at the bedside.
Safety Measures
There were 0 code blue events and 26 rapid response team activations for patients discussed in huddles. None were related to the intervention.
Discussion
Our main finding was that the huddle strategy was effective in safely reducing the burden of alarms for the high alarm pediatric ward patients whose alarms were discussed, but it did not reduce unit-level alarm rates. Implementation outcomes explained this finding. Although adoption and adherence were high, the overall dose of the intervention was low.
We also found that 36% of alarms had technical causes, the majority of which were related to the pulse oximetry probe detecting that it was off the patient or searching for a pulse. Although these alarms are likely perceived differently by clinical staff (most monitors generate different sounds for technical alarms), they still represent a substantial contribution to the alarm environment. Minimizing them in patients who must remain continuously monitored requires more intensive effort to implement other types of interventions than the main focus of this study, such as changing pulse oximetry probes and electrocardiographic leads/wires.
In one-third of huddles, monitoring was simply discontinued. We observed in many cases that, while these patients may have had legitimate indications for monitoring upon admission, their conditions had improved; after brief multidisciplinary discussion, the team concluded that monitoring was no longer indicated. This observation may suggest interventions at the ordering phase, such as prespecifying a monitoring duration.22,23
This study’s findings were consistent with a quasi-experimental study of safety huddle-based alarm discussions in a pediatric intensive care unit that showed a patient-level reduction of 116 alarms per patient-day in those discussed in huddles relative to controls.11 A smaller quasi-experimental study of implementing a nighttime alarm “ward round” in an adult intensive care unit showed a significant reduction in unit-level alarms/patient-day from 168 to 84.9 In a quality improvement report, a monitoring care process bundle that included discussion of alarm settings showed a reduction in unit-level alarms/patient-day from 180 to 40.10 Our study strengthens the body of literature using a cluster-randomized design, measuring patient- and unit-level outcomes, and including implementation outcomes that explain effectiveness findings.
On a hypothetical unit similar to the ones we studied with 20 occupied beds and 60 alarms/patient-day, an average of 1200 alarms would occur each day. We delivered the intervention to 0.85 patients per day. Changes were made at the bedside in 60% of those with the intervention delivered, and those patients had a difference in differences of 119 fewer alarms compared with the comparison patients on control units. In this scenario, we could expect a relative reduction of 0.85 x 0.60 x 119 = 61 fewer alarms/day total on the unit or a 5% reduction. However, that estimated reduction did not account for the arrival of new patients with high alarm rates, which certainly occurred in this study and explained the lack of effect at the unit level.
As described above, the intervention dose was low, which translated into a lack of effect at the unit level despite a strong effect at the patient level. This result was partly due to the manual process required to produce the alarm dashboards that restricted their availability to nonholiday weekdays. The study was performed at one hospital, which limited generalizability. The study hospital was already convening daily safety huddles that were well attended by nurses and physicians. Other hospitals without existing huddle structures may face challenges in implementing similar multidisciplinary alarm discussions. In addition, the study design was randomized at the unit (rather than patient) level, which limited our ability to balance potential confounders at the patient level.
Conclusion
A safety huddle intervention strategy to drive alarm customization was effective in safely reducing alarms for individual children discussed. However, unit-level alarm rates were not affected by the intervention due to a low dose. Leaders of efforts to reduce alarms should consider beginning with passive interventions (such as changes to default settings and alarm delays) and use huddle-based discussion as a second-line intervention to address remaining patients with high alarm rates.
Acknowledgments
We thank Matthew MacMurchy, BA, for his assistance with data collection.
Funding/Support
This study was supported by a Young Investigator Award (Bonafide, PI) from the Academic Pediatric Association.
Role of the Funder/Sponsor
The Academic Pediatric Association had no role in the design or conduct of the study; collection, management, analysis, or interpretation of the data; preparation, review, or approval of the manuscript; or decision to submit for publication.
Disclosures
No relevant financial activities, aside from the grant funding from the Academic Pediatric Association listed above, are reported.
1. Schondelmeyer AC, Brady PW, Goel VV, et al. Physiologic monitor alarm rates at 5 children’s hospitals. J Hosp Med. 2018;In press. PubMed
2. Cvach M, Kitchens M, Smith K, Harris P, Flack MN. Customizing alarm limits based on specific needs of patients. Biomed Instrum Technol. 2017;51(3):227-234. PubMed
3. Bonafide CP, Lin R, Zander M, et al. Association between exposure to nonactionable physiologic monitor alarms and response time in a children’s hospital. J Hosp Med. 2015;10(6):345-351. PubMed
4. Bonafide CP, Localio AR, Holmes JH, et al. Video analysis of factors associated with response time to physiologic monitor alarms in a children’s hospital. JAMA Pediatr. 2017;171(6):524-531. PubMed
5. Lange K, Nowak M, Zoller R, Lauer W. Boundary conditions for safe detection of clinical alarms: An observational study to identify the cognitive and perceptual demands on an Intensive Care Unit. In: In: D. de Waard, K.A. Brookhuis, A. Toffetti, A. Stuiver, C. Weikert, D. Coelho, D. Manzey, A.B. Ünal, S. Röttger, and N. Merat (Eds.) Proceedings of the Human Factors and Ergonomics Society Europe Chapter 2015 Annual Conference. Groningen, Netherlands; 2016.
6. Westbrook JI, Li L, Hooper TD, Raban MZ, Middleton S, Lehnbom EC. Effectiveness of a ‘Do not interrupt’ bundled intervention to reduce interruptions during medication administration: a cluster randomised controlled feasibility study. BMJ Qual Saf. 2017;26:734-742. PubMed
7. Chopra V, McMahon LF Jr. Redesigning hospital alarms for patient safety: alarmed and potentially dangerous. JAMA. 2014;311(12):1199-1200. PubMed
8. Turmell JW, Coke L, Catinella R, Hosford T, Majeski A. Alarm fatigue: use of an evidence-based alarm management strategy. J Nurs Care Qual. 2017;32(1):47-54. PubMed
9. Koerber JP, Walker J, Worsley M, Thorpe CM. An alarm ward round reduces the frequency of false alarms on the ICU at night. J Intensive Care Soc. 2011;12(1):75-76.
10. Dandoy CE, Davies SM, Flesch L, et al. A team-based approach to reducing cardiac monitor alarms. Pediatrics. 2014;134(6):e1686-1694. PubMed
11. Dewan M, Wolfe H, Lin R, et al. Impact of a safety huddle–based intervention on monitor alarm rates in low-acuity pediatric intensive care unit patients. J Hosp Med. 2017;12(8):652-657. PubMed
12. Goldenhar LM, Brady PW, Sutcliffe KM, Muething SE. Huddling for high reliability and situation awareness. BMJ Qual Saf. 2013;22(11):899-906. PubMed
13. Brady PW, Muething S, Kotagal U, et al. Improving situation awareness to reduce unrecognized clinical deterioration and serious safety events. Pediatrics. 2013;131:e298-308. PubMed
14. Curran GM, Bauer M, Mittman B, Pyne JM, Stetler C. Effectiveness-implementation hybrid designs: combining elements of clinical effectiveness and implementation research to enhance public health impact. Med Care. 2012;50(3):217-226. PubMed
15. Damschroder LJ, Aron DC, Keith RE, Kirsh SR, Alexander JA, Lowery JC. Fostering implementation of health services research findings into practice: a consolidated framework for advancing implementation science. Implement Sci. 2009;4(1):50. PubMed
16. Proctor E, Silmere H, Raghavan R, et al. Outcomes for implementation research: conceptual distinctions, measurement challenges, and research agenda. Adm Policy Ment Health. 2011;38(2):65-76. PubMed
17. Allen JD, Linnan LA, Emmons KM. Fidelity and its relationship to implementation effectiveness, adaptation, and dissemination. In: Dissemination and Implementation Research in Health: Translating Science to Practice (Brownson RC, Proctor EK, Colditz GA Eds.). Oxford University Press; 2012:281-304.
18. Harris PA, Taylor R, Thielke R, Payne J, Gonzalez N, Conde JG. Research electronic data capture (REDCap)—a metadata-driven methodology and workflow process for providing translational research informatics support. J Biomed Inf. 2009;42:377-381. PubMed
19. Singer JD, Willett JB. Applied Longitudinal Data Analysis: Modeling Change and Event Occurrence. New York: Oxford University Press; 2003.
20. Wagner AK, Soumerai SB, Zhang F, Ross-Degnan D. Segmented regression analysis of interrupted time series studies in medication use research. J Clin Pharm Ther. 2002;27:299-309. PubMed
21. Gardner W, Mulvey EP, Shaw EC. Regression analyses of counts and rates: Poisson, overdispersed Poisson, and negative binomial models. Psychol Bull. 1995;118:392-404. PubMed
22. Dressler R, Dryer MM, Coletti C, Mahoney D, Doorey AJ. Altering overuse of cardiac telemetry in non-intensive care unit settings by hardwiring the use of American Heart Association guidelines. JAMA Intern Med. 2014;174(11):1852-1854. PubMed
23. Boggan JC, Navar-Boggan AM, Patel V, Schulteis RD, Simel DL. Reductions in telemetry order duration do not reduce telemetry utilization. J Hosp Med. 2014;9(12):795-796. PubMed
© 2018 Society of Hospital Medicine
A Matter of Urgency: Reducing Clinical Text Message Interruptions During Educational Sessions
On general medical wards, effective interprofessional communication is essential for high-quality patient care. Hospitals increasingly adopt secure text-messaging systems for healthcare team members to communicate with physicians in lieu of paging.1-3 Text messages facilitate bidirectional communication4,5 and increase perceived efficiency6-8 and are thus preferred over paging by nurses and trainees. However, this novel technology unintentionally causes high volumes of interruptions.9,10 Compared to paging, sending text messages and calling smartphones are more convenient and encourage communication of issues in real time, regardless of urgency.11 Interrupting messages are often perceived as nonurgent by physicians.6,12 In particular, 73%-93% of pages or messages sent to physicians are found to be nonurgent.13-17
Pages, text messages, or calls not only interrupt day-to-day tasks on the ward6,7,10,11,17,18 but also educational sessions,18-21 which are essential to the clinical teaching unit (CTU). Interruptions reduce learning and retention22 and are disruptive to the medical learning climate.18-20,23
Internal medicine CTUs at our large urban academic hospital network utilize a smartphone-based text messaging tool for interdisciplinary communication. Nonurgent interruptions are frequent during educational seminars, which occur at our institution between 8 AM and 9 AM and 12 PM and 1 PM on weekdays.10,11,19 In a preliminary analysis at one hospital site, an average of three text messages (range 1-11), 2 calls (range 0-8), and 3 emails (range 0-13) interrupted each educational session. Physicians and nurses can disagree on the urgency of messages or calls for the purposes of patient care and workflow.6,11,12,24 Nurses have expressed a desire for guidance regarding what constitutes an urgent clinical communication.6
This project aimed to reduce nonurgent text message interruptions during educational rounds. We hypothesized that improved decision support around clinical prioritization and reminders about educational hours could reduce unnecessary interruptions.
METHODS
This study was approved by the institution’s Research Ethics Board and conducted across 8 general medical CTU teams at an academic hospital network (Sites 1 and 2). Each CTU team provides 24-hour coverage of approximately 20–28 patients. The most responsible resident from each team carries an institution-provided smartphone, which receives secure texts, phone calls, and emails from nurses, social workers, physiotherapists, speech language pathologists, dieticians, pharmacists, and other physicians. Close collaboration with the platform developer permitted changes to be made to the system when needed. Prior to our interventions, a nurse could send a text message as either an “immediate interrupt” or a “delayed interrupt” message. Messages sent via the “delayed interrupt” option would be added to a queue and would eventually lead to an interrupting message if not replied to after a defined period. Direct phone calls were reserved for especially urgent or emergent communications.
Meetings were held with physicians and nursing managers at Site 1 (August 2014) and Site 2 (January 2015) to establish consensus on the communication process and determine clinical scenarios, regardless of time of day, that warrant a phone call, an “immediate interrupt” text, or a “delayed interrupt” text. In March 2015, resident feedback led to the addition of a third option to the sender interface. This option allowed messages to be sent as “For Your Information (FYI)” only, which would not lead to an interruption. “FYI” messages (for example, to notify that an ambulance had been booked for a patient), were instead placed in an electronic message board that could be viewed by the resident through the application. This change relied upon interdisciplinary trust and a commitment from residents to ensure that “FYI” messages were reviewed regularly.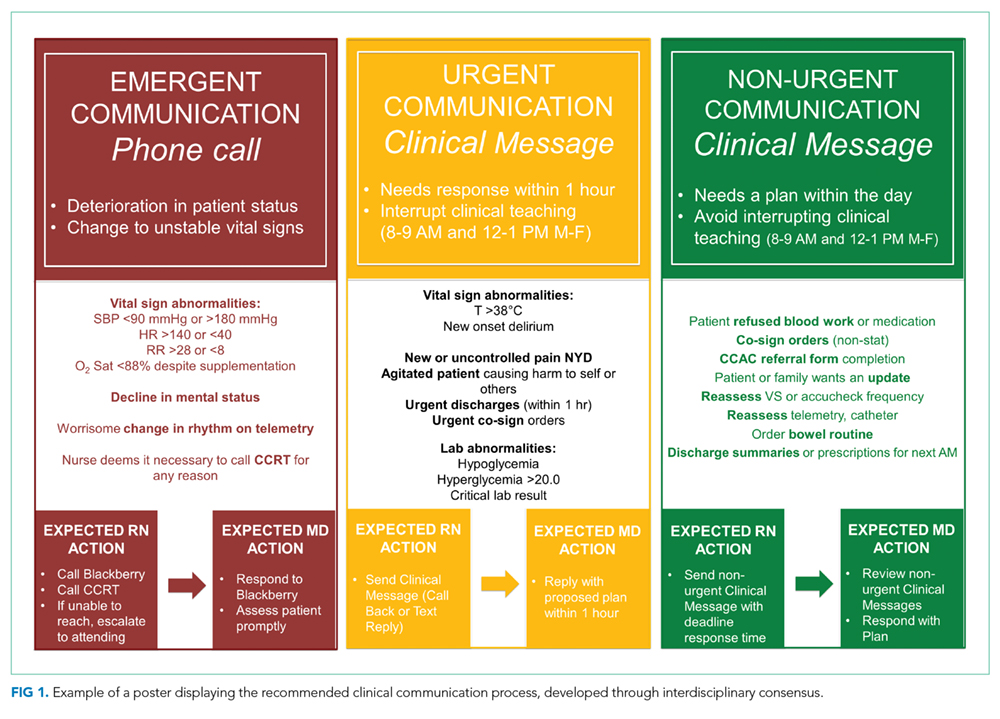
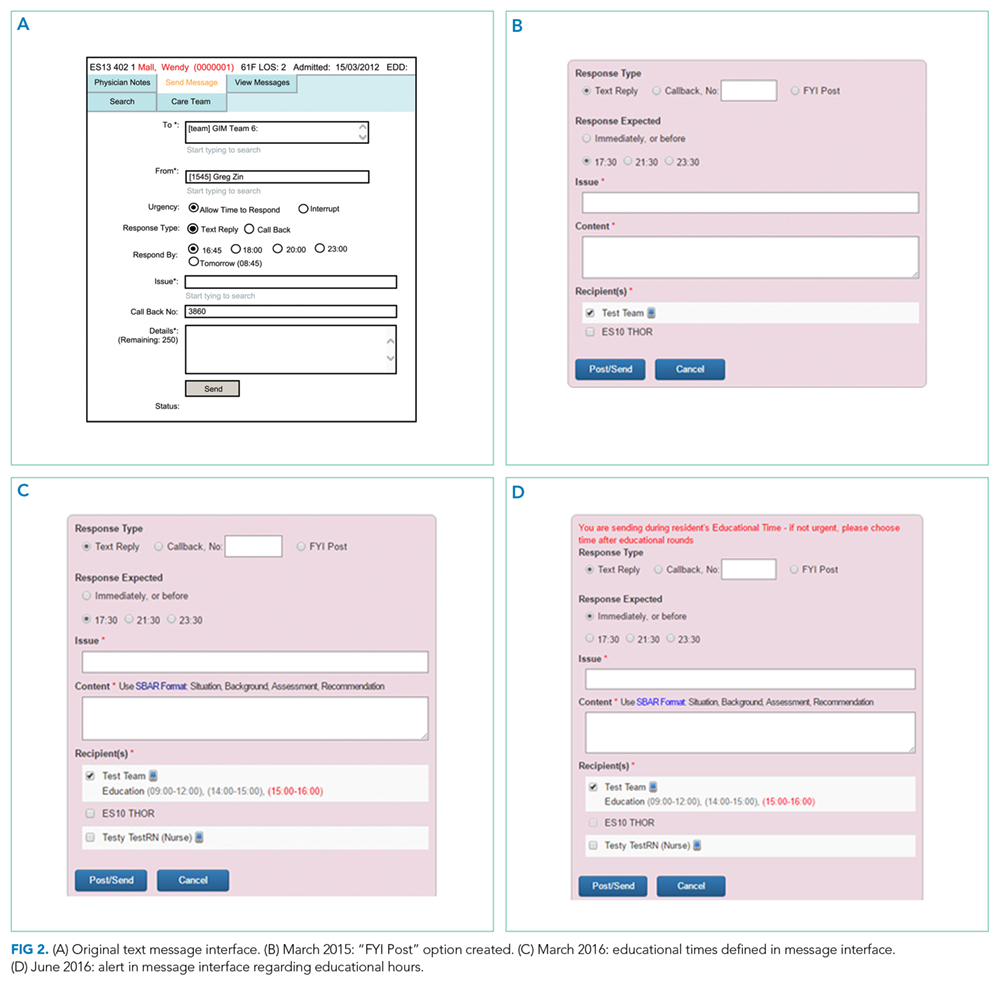
Statistical process control charts (u charts) assessed the frequency of each type of educational interruption (text, call, or email) per team on a monthly basis. The total educational interruptions per month were divided by the number of educational hours per month to account for variation in educational hours each month (for example, during holidays when educational rounds do not take place). If call logs or email data were unavailable for individual teams or time periods, then the denominator was adjusted to reflect the number of teams and educational hours in the sample for that month.
Two 4-week samples of interrupting text messages received by the 8 teams during educational hours were deidentified, analyzed, and compared in terms of content and urgency. A preintervention sample (November 17 to December 14, 2014) was compared to a postintervention sample (November 14 to December 11, 2016). Messages from the 2014 and 2016 samples were randomized, deidentified for date and time, and analyzed for urgency by 3 independent adjudicators (2 senior residents and 1 staff physician) to avoid biasing the postintervention analysis toward improvement. Messages were classified as “urgent” if the adjudicator felt a response or action was required within 1 hour. Messages not meeting these criteria were classified as “nonurgent” or “indeterminate” if the urgency of the message could not be assessed because it required further context. Fleiss kappa statistic evaluated agreement among adjudicators. Individual urgency designations were compared for each message, and discrepant rankings were addressed through repeated joint assessments. Disagreements were resolved through discussion and comparison against communication guidelines. In addition, messages reporting a “critical lab,” requiring physician notification as per institutional policy, were reclassified as “urgent.” The proportion of “nonurgent” messages sent during educational hours was compared between baseline and post-intervention periods using the Chi-square test.
“FYI” messages sent from November 14 to December 11, 2016 were audited using the same adjudication process to determine if “FYI” designations were appropriate and did not contain urgent patient care communications.
RESULTS
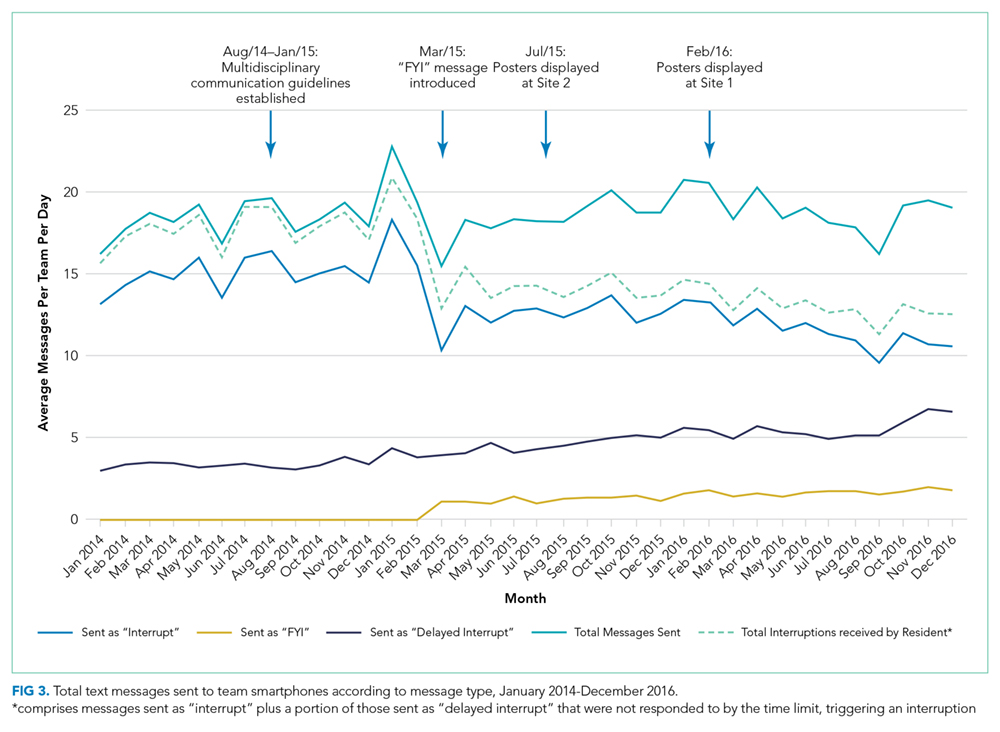

Incoming phone call logs were available from April 2015 to December 2016, with a mean of 0.62 (95% CI, 0.56 to 0.67) calls per team per educational hour, which did not change over the study period (Supplementary Figure 2). The overall number of calls to team smartphones also did not change during the measurement period. Incoming email data were available from October 2014 to December 2016, with a mean of 0.94 (95% CI, 0.88 to 1.0) emails per team per educational hour, which did not change over the study period (Supplementary Figure 3). Internal medicine service discharges, “Code Blue” announcements, and Critical Care Outreach Team consultations remained stable over the measurement period.
Independent ranking of the combined 4-week samples of educational text interruptions from 2014 and 2016 revealed an initial 3-way agreement on 257/455 (56%) messages (Fleiss Kappa 0.298, fair agreement), which increased to 405/455 (89%) messages after the first joint assessment and reached full consensus after a third joint assessment that included classifying all messages that communicated institution-defined “critical lab” values as “urgent.”
Overall, 71 (16%) messages were classified as “urgent,” 346 (76%) as “nonurgent,” and 38 (8%) as “indeterminate.” After unblinding of the message date and time, 273 text messages were received during the baseline measurement period (November 17 to December 14, 2014) and 182 messages were received during the equivalent time period 2 years later (November 14 to December 11, 2016), consistent with the reduced volume of educational interruptions observed (Figure 4). A total of 426 (94%) messages were sent by nurses, and the remaining ones were sent by pharmacists (n = 20), ward clerks (n = 3), social workers (n = 4), speech language pathologist (n = 1), or device administrator (n = 1).
The proportion of “nonurgent” messages decreased from 223/273 (82%) in 2014 to 123/182 (68%) in 2016 (P ≤ .01). Although the absolute number of urgent messages remained similar (33 in 2014 and 38 in 2016), the proportion of “urgent” messages increased from 12% to 21% of the total messages received (P = .02). Seventeen (6%) messages had indeterminate frequency in 2014 compared to 21 (11.5%) in 2016 (NS).
An audit of consecutive “FYI” messages (November 14-December 11, 2016) revealed an initial agreement in 384/431 (89%), reaching full consensus after repeated joint assessments. A total of 406 (94%) “FYI” messages were appropriately sent, while 10 (2%) represented urgent communications that should have been sent as interruptions. In 15 (4%) cases, the appropriateness of the message was indeterminate.
DISCUSSION
Sequential interventions over a 36-month period were associated with reduced nonurgent text message interruptions during educational hours. A clinical communication process was formally defined to accurately match message urgency with communication modality. A “noninterrupt” option allowed nonurgent text messages to be posted to an electronic message board, rather than causing real-time interruption, thereby reducing the overall volume of interrupting text messages. Modifying the interface to alert potential senders to protected educational hours was associated with reductions in educational interruptions. Through a blinded analysis of the text message content between 2014 and 2016, we determined that nonurgent educational interruptions were significantly reduced, and the number of urgent communications remained constant. Reduced nonurgent interruptions have the potential to improve the learning climate on the medical teaching unit during protected educational hours.
At baseline, 82% of the sampled text messages sent during educational hours across both sites were considered nonurgent. The estimated proportion of urgent messages varies in the literature (5%-34%)13-18 possibly due to center-specific methods of defining and measuring urgent messages. For example, different assessor training backgrounds, different numbers of assessors, and varying institutional policies are described.13-17 We considered an urgent message to require a response or action within 1 hour or to represent an established “critical lab value” as per the institution. The high proportion of nonurgent interruptions found in this study and other works demonstrates the widespread nature of this problem within inpatient hospital settings; this phenomenon could potentially lead to unintended consequences on efficiency and medical education.
Few other initiatives have aimed to reduce interruptions to medical trainees during educational sessions. At one center, replacing numeric pagers with alphanumeric pagers decreased the need to return pages during educational sessions but did not decrease the overall number of pages.21 Another center implemented an inbox tool that reduced daytime nonurgent numeric pages.15 Similar to our center’s previous experience,11 the total number of communications increased with the creation of the inbox tool.15 Unexpectedly, the introduction of an “FYI” option for senders in March 2015 did not increase the total number of messages.
Increasing use of text messages for communication between physicians and allied health professions has resulted in higher volumes of interruptions compared with conventional paging.6,7,9 Excessive interruptions create a “crisis mode” work climate,10 which could compromise patient safety25-27 and hamper trainees’ attainment of educational objectives.18-20,23 During educational sessions, audible text, phone call, and email interruptions disrupt all learners in addition to the resident receiving the message. The creation of the “FYI” message option in March 2015 was associated with reduced overall daily interruptions, which may improve efficiency in residents’ clinical duties17,18 and minimize multi-tasking that could lead to errors.28 However, adding a real-time notification during educational hours (March 2016, modified June 2016) exerted the greatest impact specifically on educational interruptions. Engaging physicians in the creation and ongoing modification of instant-messaging interfaces can help customize technology to meet the needs of users.15,29 Our work provides a strategy for improving communication between nurses and physicians in a teaching hospital setting, by achieving consensus on levels of urgency of different messages, providing a non-interrupting message option, and providing nurses with real-time information about educational hours.
Potential unintended consequences of the interventions require consideration. Discouraging interruptions may have reduced urgent patient care communications but were mitigated by enabling senders to ignore/override interruption warnings. We did not observe an increase in the number of overall calls to team devices, “Code Blues,” or critical care team consultations. However, we found that a very small (2%) but important group of “FYI” messages should have been sent as urgent interrupting messages, thereby underscoring the necessity for continuous feedback to senders on the clinical communication process.
Our study has limitations. Although educational interruptions can cause fragmented learning at our institution,19 the impact of reduced interruptions on the quality of educational sessions can only be inferred because we did not formally assess resident or staff physician perceptions on this outcome during the interventions. Moreover, we were unable to quantify interruptions received through personal smartphones, a frequent method of physician-physician communication.30 Phone calls are the most intrusive of interruptions but were not the focus of interventions. Future work must consider documenting perceived appropriateness of calls in real time, similar to previous studies assessing paging urgency.13,14,18 Biased ranking of message urgency was minimized by utilizing 3 independent adjudicators blinded to message date throughout the adjudication process and by applying established communication guidelines where available. Nevertheless, retrospective assessment of message urgency could be limited by a lack of clinical context, which may have been more apparent to the original sender and the recipient. Finally, at our center, a close relationship with the communication platform programmer made sequential modifications possible, while other institutions may have limited ability to make such changes. A different approach may be useful in some cases, such as modifying academic teaching times to limit interruptions.23
In a large academic center, a high number of interrupting smartphone messages cause unnecessary distractions and reduce learning during educational hours. “Nonurgent” educational interruptions were reduced through successive improvement cycles, and ultimately by modifying the program interface to alert senders of educational hours. Further reduction in interruptions and sustainability may be achieved by studying phone call interruptions and by formalizing audit and feedback of sender’s adherence to standardized clinical communication methods.
ACKNOWLEDGMENT
Dr. Wu is supported by an award from the Mak Pak Chiu and Mak-Soo Lai Hing Chair in General Internal Medicine, University of Toronto. The authors would like to acknowledge Jason Uppal for his ongoing contribution to the improvement of clinical text message communications at our institution.
Disclosures
The authors have nothing to disclose.
1. Wu R, Lo V, Morra D, et al. A smartphone-enabled communication system to improve hospital communication: usage and perceptions of medical trainees and nurses on general internal medicine wards. J Hosp Med. 2015;10(2):83-89. PubMed
2. Smith CN, Quan SD, Morra D, et al. Understanding interprofessional communication: a content analysis of email communications between doctors and nurses. Appl Clin Inform. 2012;3(1):38-51. PubMed
3. Frizzell JD, Ahmed B. Text messaging versus paging: new technology for the next generation. J Am Coll Cardiol. 2014;64(24):2703-2705. PubMed
4. Wu RC, Morra D, Quan S, et al. The use of smartphones for clinical communication on internal medicine wards. J Hosp Med. 2010;5(9):553-559. PubMed
5. Ighani F, Kapoor KG, Gibran SK, et al. A comparison of two-way text versus conventional paging systems in an academic ophthalmology department. J Med Syst. 2010;34(4):677-684. PubMed
6. Wu R, Rossos P, Quan S, et al. An evaluation of the use of smartphones to communicate between clinicians: a mixed-methods study. J Med Internet Res. 2011;13(3):e59. PubMed
7. Wu RC, Lo V, Morra D, et al. The intended and unintended consequences of communication systems on general internal medicine inpatient care delivery: a prospective observational case study of five teaching hospitals. J Am Med Inform Assoc. 2013;20(4):766-777. PubMed
8. Patel N, Siegler JE, Stromberg N, Ravitz N, Hanson CW. Perfect storm of inpatient communication needs and an innovative solution utilizing smartphones and secured messaging. Appl Clin Inform. 2016;7(3):777-789. PubMed
9. Aungst TD, Belliveau P. Leveraging mobile smart devices to improve interprofessional communications in inpatient practice setting: A literature review. J Interprof Care. 2015;29(6):570-578. PubMed
10. Vaisman A, Wu RC. Analysis of Smartphone Interruptions on Academic General Internal Medicine Wards. Frequent Interruptions may cause a ‘Crisis Mode’ Work Climate. Appl Clin Inform. 2017;8(1):1-11. PubMed
11. Quan SD, Wu RC, Rossos PG, et al. It’s not about pager replacement: an in-depth look at the interprofessional nature of communication in healthcare. J Hosp Med. 2013;8(3):137-143. PubMed
12. Quan SD, Morra D, Lau FY, et al. Perceptions of urgency: defining the gap between what physicians and nurses perceive to be an urgent issue. Int J Med Inform. 2013;82(5):378-386. PubMed
13. Katz MH, Schroeder SA. The sounds of the hospital. Paging patterns in three teaching hospitals. N Engl J Med. 1988;319(24):1585-1589. PubMed
14. Patel R, Reilly K, Old A, Naden G, Child S. Appropriate use of pagers in a New Zealand tertiary hospital. N Z Med J. 2006;119(1231):U1912. PubMed
15. Ferguson A, Aaronson B, Anuradhika A. Inbox messaging: an effective tool for minimizing non-urgent paging related interruptions in hospital medicine provider workflow. BMJ Qual Improv Rep. 2016;5(1):u215856.w7316. PubMed
16. Luxenberg A, Chan B, Khanna R, Sarkar U. Efficiency and interpretability of text paging communication for medical inpatients: A mixed-methods analysis. JAMA Intern Med. 2017;177(8):1218-1220. PubMed
17. Ly T, Korb-Wells CS, Sumpton D, Russo RR, Barnsley L. Nature and impact of interruptions on clinical workflow of medical residents in the inpatient setting. J Grad Med Educ. 2013;5(2):232-237. PubMed
18. Blum NJ, Lieu TA. Interrupted care. The effects of paging on pediatric resident activities. Am J Dis Child. 1992;146(7):806-808. PubMed
19. Wu RC, Tzanetos K, Morra D, Quan S, Lo V, Wong BM. Educational impact of using smartphones for clinical communication on general medicine: more global, less local. J Hosp Med. 2013;8(7):365-372. PubMed
20. Katz-Sidlow RJ, Ludwig A, Miller S, Sidlow R. Smartphone use during inpatient attending rounds: prevalence, patterns and potential for distraction. J Hosp Med. 2012;7(8):595-599. PubMed
21. Wong BM, Quan S, Shadowitz S, Etchells E. Implementation and evaluation of an alpha-numeric paging system on a resident inpatient teaching service. J Hosp Med. 2009;4(8):E34-E40. PubMed
22. Conard MA MR. Interest level improves learning but does not moderate the effects of interruptions: An experiment using simultaneous multitasking. Learn Individ Differ. 2014;30:112-117.
23. Zastoupil L, McIntosh A, Sopfe J, et al. Positive impact of transition from noon conference to academic half day in a pediatric residency program. Acad Pediatr. 2017;17(4):436-442. PubMed
24. Lo V, Wu RC, Morra D, Lee L, Reeves S. The use of smartphones in general and internal medicine units: a boon or a bane to the promotion of interprofessional collaboration? J Interprof Care. 2012;26(4):276-282. PubMed
25. Patterson ME, Bogart MS, Starr KR. Associations between perceived crisis mode work climate and poor information exchange within hospitals. J Hosp Med. 2015;10(3):152-159. PubMed
26. Laxmisan A, Hakimzada F, Sayan OR, Green RA, Zhang J, Patel VL. The multitasking clinician: decision-making and cognitive demand during and after team handoffs in emergency care. Int J Med Inform. 2007;76(11-12):801-811. PubMed
27. Westbrook JI, Woods A, Rob MI, Dunsmuir WT, Day RO. Association of interruptions with an increased risk and severity of medication administration errors. Arch Intern Med. 2010;170(8):683-690. PubMed
28. Collins S, Currie L, Patel V, Bakken S, Cimino JJ. Multitasking by clinicians in the context of CPOE and CIS use. Stud Health Technol Inform. 2007;129(Pt 2):958-962. PubMed
29. Huang ME. It is from mars and physicians from venus: Bridging the gap. PM R. 2017;9(5S):S19-S25. PubMed
30. Tran K, Morra D, Lo V, Quan S, Wu R. The use of smartphones on General Internal Medicine wards: A mixed methods study. Appl Clin Inform. 2014;5(3):814-823. PubMed
On general medical wards, effective interprofessional communication is essential for high-quality patient care. Hospitals increasingly adopt secure text-messaging systems for healthcare team members to communicate with physicians in lieu of paging.1-3 Text messages facilitate bidirectional communication4,5 and increase perceived efficiency6-8 and are thus preferred over paging by nurses and trainees. However, this novel technology unintentionally causes high volumes of interruptions.9,10 Compared to paging, sending text messages and calling smartphones are more convenient and encourage communication of issues in real time, regardless of urgency.11 Interrupting messages are often perceived as nonurgent by physicians.6,12 In particular, 73%-93% of pages or messages sent to physicians are found to be nonurgent.13-17
Pages, text messages, or calls not only interrupt day-to-day tasks on the ward6,7,10,11,17,18 but also educational sessions,18-21 which are essential to the clinical teaching unit (CTU). Interruptions reduce learning and retention22 and are disruptive to the medical learning climate.18-20,23
Internal medicine CTUs at our large urban academic hospital network utilize a smartphone-based text messaging tool for interdisciplinary communication. Nonurgent interruptions are frequent during educational seminars, which occur at our institution between 8 AM and 9 AM and 12 PM and 1 PM on weekdays.10,11,19 In a preliminary analysis at one hospital site, an average of three text messages (range 1-11), 2 calls (range 0-8), and 3 emails (range 0-13) interrupted each educational session. Physicians and nurses can disagree on the urgency of messages or calls for the purposes of patient care and workflow.6,11,12,24 Nurses have expressed a desire for guidance regarding what constitutes an urgent clinical communication.6
This project aimed to reduce nonurgent text message interruptions during educational rounds. We hypothesized that improved decision support around clinical prioritization and reminders about educational hours could reduce unnecessary interruptions.
METHODS
This study was approved by the institution’s Research Ethics Board and conducted across 8 general medical CTU teams at an academic hospital network (Sites 1 and 2). Each CTU team provides 24-hour coverage of approximately 20–28 patients. The most responsible resident from each team carries an institution-provided smartphone, which receives secure texts, phone calls, and emails from nurses, social workers, physiotherapists, speech language pathologists, dieticians, pharmacists, and other physicians. Close collaboration with the platform developer permitted changes to be made to the system when needed. Prior to our interventions, a nurse could send a text message as either an “immediate interrupt” or a “delayed interrupt” message. Messages sent via the “delayed interrupt” option would be added to a queue and would eventually lead to an interrupting message if not replied to after a defined period. Direct phone calls were reserved for especially urgent or emergent communications.
Meetings were held with physicians and nursing managers at Site 1 (August 2014) and Site 2 (January 2015) to establish consensus on the communication process and determine clinical scenarios, regardless of time of day, that warrant a phone call, an “immediate interrupt” text, or a “delayed interrupt” text. In March 2015, resident feedback led to the addition of a third option to the sender interface. This option allowed messages to be sent as “For Your Information (FYI)” only, which would not lead to an interruption. “FYI” messages (for example, to notify that an ambulance had been booked for a patient), were instead placed in an electronic message board that could be viewed by the resident through the application. This change relied upon interdisciplinary trust and a commitment from residents to ensure that “FYI” messages were reviewed regularly.
Statistical process control charts (u charts) assessed the frequency of each type of educational interruption (text, call, or email) per team on a monthly basis. The total educational interruptions per month were divided by the number of educational hours per month to account for variation in educational hours each month (for example, during holidays when educational rounds do not take place). If call logs or email data were unavailable for individual teams or time periods, then the denominator was adjusted to reflect the number of teams and educational hours in the sample for that month.
Two 4-week samples of interrupting text messages received by the 8 teams during educational hours were deidentified, analyzed, and compared in terms of content and urgency. A preintervention sample (November 17 to December 14, 2014) was compared to a postintervention sample (November 14 to December 11, 2016). Messages from the 2014 and 2016 samples were randomized, deidentified for date and time, and analyzed for urgency by 3 independent adjudicators (2 senior residents and 1 staff physician) to avoid biasing the postintervention analysis toward improvement. Messages were classified as “urgent” if the adjudicator felt a response or action was required within 1 hour. Messages not meeting these criteria were classified as “nonurgent” or “indeterminate” if the urgency of the message could not be assessed because it required further context. Fleiss kappa statistic evaluated agreement among adjudicators. Individual urgency designations were compared for each message, and discrepant rankings were addressed through repeated joint assessments. Disagreements were resolved through discussion and comparison against communication guidelines. In addition, messages reporting a “critical lab,” requiring physician notification as per institutional policy, were reclassified as “urgent.” The proportion of “nonurgent” messages sent during educational hours was compared between baseline and post-intervention periods using the Chi-square test.
“FYI” messages sent from November 14 to December 11, 2016 were audited using the same adjudication process to determine if “FYI” designations were appropriate and did not contain urgent patient care communications.
RESULTS
Incoming phone call logs were available from April 2015 to December 2016, with a mean of 0.62 (95% CI, 0.56 to 0.67) calls per team per educational hour, which did not change over the study period (Supplementary Figure 2). The overall number of calls to team smartphones also did not change during the measurement period. Incoming email data were available from October 2014 to December 2016, with a mean of 0.94 (95% CI, 0.88 to 1.0) emails per team per educational hour, which did not change over the study period (Supplementary Figure 3). Internal medicine service discharges, “Code Blue” announcements, and Critical Care Outreach Team consultations remained stable over the measurement period.
Independent ranking of the combined 4-week samples of educational text interruptions from 2014 and 2016 revealed an initial 3-way agreement on 257/455 (56%) messages (Fleiss Kappa 0.298, fair agreement), which increased to 405/455 (89%) messages after the first joint assessment and reached full consensus after a third joint assessment that included classifying all messages that communicated institution-defined “critical lab” values as “urgent.”
Overall, 71 (16%) messages were classified as “urgent,” 346 (76%) as “nonurgent,” and 38 (8%) as “indeterminate.” After unblinding of the message date and time, 273 text messages were received during the baseline measurement period (November 17 to December 14, 2014) and 182 messages were received during the equivalent time period 2 years later (November 14 to December 11, 2016), consistent with the reduced volume of educational interruptions observed (Figure 4). A total of 426 (94%) messages were sent by nurses, and the remaining ones were sent by pharmacists (n = 20), ward clerks (n = 3), social workers (n = 4), speech language pathologist (n = 1), or device administrator (n = 1).
The proportion of “nonurgent” messages decreased from 223/273 (82%) in 2014 to 123/182 (68%) in 2016 (P ≤ .01). Although the absolute number of urgent messages remained similar (33 in 2014 and 38 in 2016), the proportion of “urgent” messages increased from 12% to 21% of the total messages received (P = .02). Seventeen (6%) messages had indeterminate frequency in 2014 compared to 21 (11.5%) in 2016 (NS).
An audit of consecutive “FYI” messages (November 14-December 11, 2016) revealed an initial agreement in 384/431 (89%), reaching full consensus after repeated joint assessments. A total of 406 (94%) “FYI” messages were appropriately sent, while 10 (2%) represented urgent communications that should have been sent as interruptions. In 15 (4%) cases, the appropriateness of the message was indeterminate.
DISCUSSION
Sequential interventions over a 36-month period were associated with reduced nonurgent text message interruptions during educational hours. A clinical communication process was formally defined to accurately match message urgency with communication modality. A “noninterrupt” option allowed nonurgent text messages to be posted to an electronic message board, rather than causing real-time interruption, thereby reducing the overall volume of interrupting text messages. Modifying the interface to alert potential senders to protected educational hours was associated with reductions in educational interruptions. Through a blinded analysis of the text message content between 2014 and 2016, we determined that nonurgent educational interruptions were significantly reduced, and the number of urgent communications remained constant. Reduced nonurgent interruptions have the potential to improve the learning climate on the medical teaching unit during protected educational hours.
At baseline, 82% of the sampled text messages sent during educational hours across both sites were considered nonurgent. The estimated proportion of urgent messages varies in the literature (5%-34%)13-18 possibly due to center-specific methods of defining and measuring urgent messages. For example, different assessor training backgrounds, different numbers of assessors, and varying institutional policies are described.13-17 We considered an urgent message to require a response or action within 1 hour or to represent an established “critical lab value” as per the institution. The high proportion of nonurgent interruptions found in this study and other works demonstrates the widespread nature of this problem within inpatient hospital settings; this phenomenon could potentially lead to unintended consequences on efficiency and medical education.
Few other initiatives have aimed to reduce interruptions to medical trainees during educational sessions. At one center, replacing numeric pagers with alphanumeric pagers decreased the need to return pages during educational sessions but did not decrease the overall number of pages.21 Another center implemented an inbox tool that reduced daytime nonurgent numeric pages.15 Similar to our center’s previous experience,11 the total number of communications increased with the creation of the inbox tool.15 Unexpectedly, the introduction of an “FYI” option for senders in March 2015 did not increase the total number of messages.
Increasing use of text messages for communication between physicians and allied health professions has resulted in higher volumes of interruptions compared with conventional paging.6,7,9 Excessive interruptions create a “crisis mode” work climate,10 which could compromise patient safety25-27 and hamper trainees’ attainment of educational objectives.18-20,23 During educational sessions, audible text, phone call, and email interruptions disrupt all learners in addition to the resident receiving the message. The creation of the “FYI” message option in March 2015 was associated with reduced overall daily interruptions, which may improve efficiency in residents’ clinical duties17,18 and minimize multi-tasking that could lead to errors.28 However, adding a real-time notification during educational hours (March 2016, modified June 2016) exerted the greatest impact specifically on educational interruptions. Engaging physicians in the creation and ongoing modification of instant-messaging interfaces can help customize technology to meet the needs of users.15,29 Our work provides a strategy for improving communication between nurses and physicians in a teaching hospital setting, by achieving consensus on levels of urgency of different messages, providing a non-interrupting message option, and providing nurses with real-time information about educational hours.
Potential unintended consequences of the interventions require consideration. Discouraging interruptions may have reduced urgent patient care communications but were mitigated by enabling senders to ignore/override interruption warnings. We did not observe an increase in the number of overall calls to team devices, “Code Blues,” or critical care team consultations. However, we found that a very small (2%) but important group of “FYI” messages should have been sent as urgent interrupting messages, thereby underscoring the necessity for continuous feedback to senders on the clinical communication process.
Our study has limitations. Although educational interruptions can cause fragmented learning at our institution,19 the impact of reduced interruptions on the quality of educational sessions can only be inferred because we did not formally assess resident or staff physician perceptions on this outcome during the interventions. Moreover, we were unable to quantify interruptions received through personal smartphones, a frequent method of physician-physician communication.30 Phone calls are the most intrusive of interruptions but were not the focus of interventions. Future work must consider documenting perceived appropriateness of calls in real time, similar to previous studies assessing paging urgency.13,14,18 Biased ranking of message urgency was minimized by utilizing 3 independent adjudicators blinded to message date throughout the adjudication process and by applying established communication guidelines where available. Nevertheless, retrospective assessment of message urgency could be limited by a lack of clinical context, which may have been more apparent to the original sender and the recipient. Finally, at our center, a close relationship with the communication platform programmer made sequential modifications possible, while other institutions may have limited ability to make such changes. A different approach may be useful in some cases, such as modifying academic teaching times to limit interruptions.23
In a large academic center, a high number of interrupting smartphone messages cause unnecessary distractions and reduce learning during educational hours. “Nonurgent” educational interruptions were reduced through successive improvement cycles, and ultimately by modifying the program interface to alert senders of educational hours. Further reduction in interruptions and sustainability may be achieved by studying phone call interruptions and by formalizing audit and feedback of sender’s adherence to standardized clinical communication methods.
ACKNOWLEDGMENT
Dr. Wu is supported by an award from the Mak Pak Chiu and Mak-Soo Lai Hing Chair in General Internal Medicine, University of Toronto. The authors would like to acknowledge Jason Uppal for his ongoing contribution to the improvement of clinical text message communications at our institution.
Disclosures
The authors have nothing to disclose.
1. Wu R, Lo V, Morra D, et al. A smartphone-enabled communication system to improve hospital communication: usage and perceptions of medical trainees and nurses on general internal medicine wards. J Hosp Med. 2015;10(2):83-89. PubMed
2. Smith CN, Quan SD, Morra D, et al. Understanding interprofessional communication: a content analysis of email communications between doctors and nurses. Appl Clin Inform. 2012;3(1):38-51. PubMed
3. Frizzell JD, Ahmed B. Text messaging versus paging: new technology for the next generation. J Am Coll Cardiol. 2014;64(24):2703-2705. PubMed
4. Wu RC, Morra D, Quan S, et al. The use of smartphones for clinical communication on internal medicine wards. J Hosp Med. 2010;5(9):553-559. PubMed
5. Ighani F, Kapoor KG, Gibran SK, et al. A comparison of two-way text versus conventional paging systems in an academic ophthalmology department. J Med Syst. 2010;34(4):677-684. PubMed
6. Wu R, Rossos P, Quan S, et al. An evaluation of the use of smartphones to communicate between clinicians: a mixed-methods study. J Med Internet Res. 2011;13(3):e59. PubMed
7. Wu RC, Lo V, Morra D, et al. The intended and unintended consequences of communication systems on general internal medicine inpatient care delivery: a prospective observational case study of five teaching hospitals. J Am Med Inform Assoc. 2013;20(4):766-777. PubMed
8. Patel N, Siegler JE, Stromberg N, Ravitz N, Hanson CW. Perfect storm of inpatient communication needs and an innovative solution utilizing smartphones and secured messaging. Appl Clin Inform. 2016;7(3):777-789. PubMed
9. Aungst TD, Belliveau P. Leveraging mobile smart devices to improve interprofessional communications in inpatient practice setting: A literature review. J Interprof Care. 2015;29(6):570-578. PubMed
10. Vaisman A, Wu RC. Analysis of Smartphone Interruptions on Academic General Internal Medicine Wards. Frequent Interruptions may cause a ‘Crisis Mode’ Work Climate. Appl Clin Inform. 2017;8(1):1-11. PubMed
11. Quan SD, Wu RC, Rossos PG, et al. It’s not about pager replacement: an in-depth look at the interprofessional nature of communication in healthcare. J Hosp Med. 2013;8(3):137-143. PubMed
12. Quan SD, Morra D, Lau FY, et al. Perceptions of urgency: defining the gap between what physicians and nurses perceive to be an urgent issue. Int J Med Inform. 2013;82(5):378-386. PubMed
13. Katz MH, Schroeder SA. The sounds of the hospital. Paging patterns in three teaching hospitals. N Engl J Med. 1988;319(24):1585-1589. PubMed
14. Patel R, Reilly K, Old A, Naden G, Child S. Appropriate use of pagers in a New Zealand tertiary hospital. N Z Med J. 2006;119(1231):U1912. PubMed
15. Ferguson A, Aaronson B, Anuradhika A. Inbox messaging: an effective tool for minimizing non-urgent paging related interruptions in hospital medicine provider workflow. BMJ Qual Improv Rep. 2016;5(1):u215856.w7316. PubMed
16. Luxenberg A, Chan B, Khanna R, Sarkar U. Efficiency and interpretability of text paging communication for medical inpatients: A mixed-methods analysis. JAMA Intern Med. 2017;177(8):1218-1220. PubMed
17. Ly T, Korb-Wells CS, Sumpton D, Russo RR, Barnsley L. Nature and impact of interruptions on clinical workflow of medical residents in the inpatient setting. J Grad Med Educ. 2013;5(2):232-237. PubMed
18. Blum NJ, Lieu TA. Interrupted care. The effects of paging on pediatric resident activities. Am J Dis Child. 1992;146(7):806-808. PubMed
19. Wu RC, Tzanetos K, Morra D, Quan S, Lo V, Wong BM. Educational impact of using smartphones for clinical communication on general medicine: more global, less local. J Hosp Med. 2013;8(7):365-372. PubMed
20. Katz-Sidlow RJ, Ludwig A, Miller S, Sidlow R. Smartphone use during inpatient attending rounds: prevalence, patterns and potential for distraction. J Hosp Med. 2012;7(8):595-599. PubMed
21. Wong BM, Quan S, Shadowitz S, Etchells E. Implementation and evaluation of an alpha-numeric paging system on a resident inpatient teaching service. J Hosp Med. 2009;4(8):E34-E40. PubMed
22. Conard MA MR. Interest level improves learning but does not moderate the effects of interruptions: An experiment using simultaneous multitasking. Learn Individ Differ. 2014;30:112-117.
23. Zastoupil L, McIntosh A, Sopfe J, et al. Positive impact of transition from noon conference to academic half day in a pediatric residency program. Acad Pediatr. 2017;17(4):436-442. PubMed
24. Lo V, Wu RC, Morra D, Lee L, Reeves S. The use of smartphones in general and internal medicine units: a boon or a bane to the promotion of interprofessional collaboration? J Interprof Care. 2012;26(4):276-282. PubMed
25. Patterson ME, Bogart MS, Starr KR. Associations between perceived crisis mode work climate and poor information exchange within hospitals. J Hosp Med. 2015;10(3):152-159. PubMed
26. Laxmisan A, Hakimzada F, Sayan OR, Green RA, Zhang J, Patel VL. The multitasking clinician: decision-making and cognitive demand during and after team handoffs in emergency care. Int J Med Inform. 2007;76(11-12):801-811. PubMed
27. Westbrook JI, Woods A, Rob MI, Dunsmuir WT, Day RO. Association of interruptions with an increased risk and severity of medication administration errors. Arch Intern Med. 2010;170(8):683-690. PubMed
28. Collins S, Currie L, Patel V, Bakken S, Cimino JJ. Multitasking by clinicians in the context of CPOE and CIS use. Stud Health Technol Inform. 2007;129(Pt 2):958-962. PubMed
29. Huang ME. It is from mars and physicians from venus: Bridging the gap. PM R. 2017;9(5S):S19-S25. PubMed
30. Tran K, Morra D, Lo V, Quan S, Wu R. The use of smartphones on General Internal Medicine wards: A mixed methods study. Appl Clin Inform. 2014;5(3):814-823. PubMed
© 2018 Society of Hospital Medicine
Training Residents in Hospital Medicine: The Hospitalist Elective National Survey
Hospital medicine has become the fastest growing medicine subspecialty, though no standardized hospitalist-focused educational program is required to become a practicing adult medicine hospitalist.1 Historically, adult hospitalists have had little additional training beyond residency, yet, as residency training adapts to duty hour restrictions, patient caps, and increasing attending oversight, it is not clear if traditional rotations and curricula provide adequate preparation for independent practice as an adult hospitalist.2-5 Several types of training and educational programs have emerged to fill this potential gap. These include hospital medicine fellowships, residency pathways, early career faculty development programs (eg, Society of Hospital Medicine/ Society of General Internal Medicine sponsored Academic Hospitalist Academy), and hospitalist-focused resident rotations.6-10 These activities are intended to ensure that residents and early career physicians gain the skills and competencies required to effectively practice hospital medicine.
Hospital medicine fellowships, residency pathways, and faculty development have been described previously.6-8 However, the prevalence and characteristics of hospital medicine-focused resident rotations are unknown, and these rotations are rarely publicized beyond local residency programs. Our study aims to determine the prevalence, purpose, and function of hospitalist-focused rotations within residency programs and explore the role these rotations have in preparing residents for a career in hospital medicine.
METHODS
Study Design, Setting, and Participants
We conducted a cross-sectional study involving the largest 100 Accreditation Council for Graduate Medical Education (ACGME) internal medicine residency programs. We chose the largest programs as we hypothesized that these programs would be most likely to have the infrastructure to support hospital medicine focused rotations compared to smaller programs. The UCSF Committee on Human Research approved this study.
Survey Development
We developed a study-specific survey (the Hospitalist Elective National Survey [HENS]) to assess the prevalence, structure, curricular goals, and perceived benefits of distinct hospitalist rotations as defined by individual resident programs. The survey prompted respondents to consider a “hospitalist-focused” rotation as one that is different from a traditional inpatient “ward” rotation and whose emphasis is on hospitalist-specific training, clinical skills, or career development. The 18-question survey (Appendix 1) included fixed choice, multiple choice, and open-ended responses.
Data Collection
Using publicly available data from the ACGME website (www.acgme.org), we identified the largest 100 medicine programs based on the total number of residents. This included programs with 81 or more residents. An electronic survey was e-mailed to the leadership of each program. In May 2015, surveys were sent to Residency Program Directors (PD), and if they did not respond after 2 attempts, then Associate Program Directors (APD) were contacted twice. If both these leaders did not respond, then the survey was sent to residency program administrators or Hospital Medicine Division Chiefs. Only one survey was completed per site.
Data Analysis
We used descriptive statistics to summarize quantitative data. Responses to open-ended qualitative questions about the goals, strengths, and design of rotations were analyzed using thematic analysis.11 During analysis, we iteratively developed and refined codes that identified important concepts that emerged from the data. Two members of the research team trained in qualitative data analysis coded these data independently (SL & JH).
RESULTS
Eighty-two residency program leaders (53 PD, 19 APD, 10 chiefs/admin) responded to the survey (82% total response rate). Among all responders, the prevalence of hospitalist-focused rotations was 50% (41/82). Of these 41 rotations, 85% (35/41) were elective rotations and 15% (6/41) were mandatory rotations. Hospitalist rotations ranged in existence from 1 to 15 years with a mean duration of 4.78 years (S.D. 3.5).
Of the 41 programs that did not have a hospital medicine-focused rotation, the key barriers identified were a lack of a well-defined model (29%), low faculty interest (15%), low resident interest (12%), and lack of funding (5%). Despite these barriers, 9 of these 41 programs (22%) stated they planned to start a rotation in the future – of which, 3 programs (7%) planned to start a rotation within the year.
Most programs with rotations (39/41, 95%) reported that their hospitalist rotation filled at least one gap in traditional residency curriculum. The most frequently identified gaps the rotation filled included: allowing progressive clinical autonomy (59%, 24/41), learning about quality improvement and high value care (41%, 17/41), and preparing to become a practicing hospitalist (39%, 16/41). Most respondents (66%, 27/41) reported that the rotation helped to prepare trainees for their first year as an attending.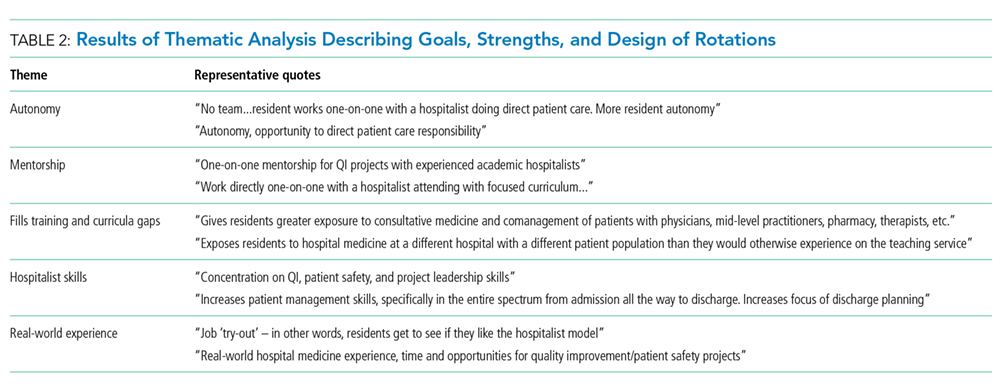
DISCUSSION
The Hospital Elective National Survey provides insight into a growing component of hospitalist-focused training and preparation. Fifty percent of ACGME residency programs surveyed in this study had a hospitalist-focused rotation. Rotation characteristics were heterogeneous, perhaps reflecting both the homegrown nature of their development and the lack of national study or data to guide what constitutes an “ideal” rotation. Common functions of rotations included providing career mentorship and allowing for trainees to get experience “being a hospitalist.” Other key elements of the rotations included providing additional clinical autonomy and teaching material outside of traditional residency curricula such as quality improvement, patient safety, billing, and healthcare finances.
Prior research has explored other training for hospitalists such as fellowships, pathways, and faculty development.6-8 A hospital medicine fellowship provides extensive training but without a practice requirement in adult medicine (as now exists in pediatric hospital medicine), the impact of fellowship training may be limited by its scale.12,13 Longitudinal hospitalist residency pathways provide comprehensive skill development and often require an early career commitment from trainees.7 Faculty development can be another tool to foster career growth, though requires local investment from hospitalist groups that may not have the resources or experience to support this.8 Our study has highlighted that hospitalist-focused rotations within residency programs can train physicians for a career in hospital medicine. Hospitalist and residency leaders should consider that these rotations might be the only hospital medicine-focused training that new hospitalists will have. Given the variable nature of these rotations nationally, developing standards around core hospitalist competencies within these rotations should be a key component to career preparation and a goal for the field at large.14,15
Our study has limitations. The survey focused only on internal medicine as it is the most common training background of hospitalists; however, the field has grown to include other specialties including pediatrics, neurology, family medicine, and surgery. In addition, the survey reviewed the largest ACGME Internal Medicine programs to best evaluate prevalence and content—it may be that some smaller programs have rotations with different characteristics that we have not captured. Lastly, the survey reviewed the rotations through the lens of residency program leadership and not trainees. A future survey of trainees or early career hospitalists who participated in these rotations could provide a better understanding of their achievements and effectiveness.
CONCLUSION
We anticipate that the demand for hospitalist-focused training will continue to grow as more residents in training seek to enter the specialty. Hospitalist and residency program leaders have an opportunity within residency training programs to build new or further develop existing hospital medicine-focused rotations. The HENS survey demonstrates that hospitalist-focused rotations are prevalent in residency education and have the potential to play an important role in hospitalist training.
Disclosure
The authors declare no conflicts of interest in relation to this manuscript.
1. Wachter RM, Goldman L. Zero to 50,000 – The 20th Anniversary of the Hospitalist. N Engl J Med. 2016;375:1009-1011. PubMed
2. Glasheen JJ, Siegal EM, Epstein K, Kutner J, Prochazka AV. Fulfilling the promise of hospital medicine: tailoring internal medicine training to address hospitalists’ needs. J Gen Intern Med. 2008;23:1110-1115. PubMed
3. Glasheen JJ, Goldenberg J, Nelson JR. Achieving hospital medicine’s promise through internal medicine residency redesign. Mt Sinai J Med. 2008; 5:436-441. PubMed
4. Plauth WH 3rd, Pantilat SZ, Wachter RM, Fenton CL. Hospitalists’ perceptions of their residency training needs: results of a national survey. Am J Med. 2001; 15;111:247-254. PubMed
5. Kumar A, Smeraglio A, Witteles R, Harman S, Nallamshetty, S, Rogers A, Harrington R, Ahuja N. A resident-created hospitalist curriculum for internal medicine housestaff. J Hosp Med. 2016;11:646-649. PubMed
6. Ranji, SR, Rosenman, DJ, Amin, AN, Kripalani, S. Hospital medicine fellowships: works in progress. Am J Med. 2006;119(1):72.e1-7. PubMed
7. Sweigart JR, Tad-Y D, Kneeland P, Williams MV, Glasheen JJ. Hospital medicine resident training tracks: developing the hospital medicine pipeline. J Hosp Med. 2017;12:173-176. PubMed
8. Sehgal NL, Sharpe BA, Auerbach AA, Wachter RM. Investing in the future: building an academic hospitalist faculty development program. J Hosp Med. 2011;6:161-166. PubMed
9. Academic Hospitalist Academy. Course Description, Objectives and Society Sponsorship. Available at: https://academichospitalist.org/. Accessed August 23, 2017.
10. Amin AN. A successful hospitalist rotation for senior medicine residents. Med Educ. 2003;37:1042. PubMed
11. Braun V, Clarke V. Using thematic analysis in psychology. Qual Res Psychol. 2006;3:77-101.
12. American Board of Medical Specialties. ABMS Officially Recognizes Pediatric Hospital Medicine Subspecialty Certification Available at: http://www.abms.org/news-events/abms-officially-recognizes-pediatric-hospital-medicine-subspecialty-certification/. Accessed August 23, 2017. PubMed
13. Wiese J. Residency training: beginning with the end in mind. J Gen Intern Med. 2008; 23(7):1122-1123. PubMed
14. Dressler DD, Pistoria MJ, Budnitz TL, McKean SC, Amin AN. Core competencies in hospital medicine: development and methodology. J Hosp Med. 2006; 1 Suppl 1:48-56. PubMed
15. Nichani S, Crocker J, Fitterman N, Lukela M. Updating the core competencies in hospital medicine – 2017 revision: introduction and methodology. J Hosp Med. 2017;4:283-287. PubMed
Hospital medicine has become the fastest growing medicine subspecialty, though no standardized hospitalist-focused educational program is required to become a practicing adult medicine hospitalist.1 Historically, adult hospitalists have had little additional training beyond residency, yet, as residency training adapts to duty hour restrictions, patient caps, and increasing attending oversight, it is not clear if traditional rotations and curricula provide adequate preparation for independent practice as an adult hospitalist.2-5 Several types of training and educational programs have emerged to fill this potential gap. These include hospital medicine fellowships, residency pathways, early career faculty development programs (eg, Society of Hospital Medicine/ Society of General Internal Medicine sponsored Academic Hospitalist Academy), and hospitalist-focused resident rotations.6-10 These activities are intended to ensure that residents and early career physicians gain the skills and competencies required to effectively practice hospital medicine.
Hospital medicine fellowships, residency pathways, and faculty development have been described previously.6-8 However, the prevalence and characteristics of hospital medicine-focused resident rotations are unknown, and these rotations are rarely publicized beyond local residency programs. Our study aims to determine the prevalence, purpose, and function of hospitalist-focused rotations within residency programs and explore the role these rotations have in preparing residents for a career in hospital medicine.
METHODS
Study Design, Setting, and Participants
We conducted a cross-sectional study involving the largest 100 Accreditation Council for Graduate Medical Education (ACGME) internal medicine residency programs. We chose the largest programs as we hypothesized that these programs would be most likely to have the infrastructure to support hospital medicine focused rotations compared to smaller programs. The UCSF Committee on Human Research approved this study.
Survey Development
We developed a study-specific survey (the Hospitalist Elective National Survey [HENS]) to assess the prevalence, structure, curricular goals, and perceived benefits of distinct hospitalist rotations as defined by individual resident programs. The survey prompted respondents to consider a “hospitalist-focused” rotation as one that is different from a traditional inpatient “ward” rotation and whose emphasis is on hospitalist-specific training, clinical skills, or career development. The 18-question survey (Appendix 1) included fixed choice, multiple choice, and open-ended responses.
Data Collection
Using publicly available data from the ACGME website (www.acgme.org), we identified the largest 100 medicine programs based on the total number of residents. This included programs with 81 or more residents. An electronic survey was e-mailed to the leadership of each program. In May 2015, surveys were sent to Residency Program Directors (PD), and if they did not respond after 2 attempts, then Associate Program Directors (APD) were contacted twice. If both these leaders did not respond, then the survey was sent to residency program administrators or Hospital Medicine Division Chiefs. Only one survey was completed per site.
Data Analysis
We used descriptive statistics to summarize quantitative data. Responses to open-ended qualitative questions about the goals, strengths, and design of rotations were analyzed using thematic analysis.11 During analysis, we iteratively developed and refined codes that identified important concepts that emerged from the data. Two members of the research team trained in qualitative data analysis coded these data independently (SL & JH).
RESULTS
Eighty-two residency program leaders (53 PD, 19 APD, 10 chiefs/admin) responded to the survey (82% total response rate). Among all responders, the prevalence of hospitalist-focused rotations was 50% (41/82). Of these 41 rotations, 85% (35/41) were elective rotations and 15% (6/41) were mandatory rotations. Hospitalist rotations ranged in existence from 1 to 15 years with a mean duration of 4.78 years (S.D. 3.5).
Of the 41 programs that did not have a hospital medicine-focused rotation, the key barriers identified were a lack of a well-defined model (29%), low faculty interest (15%), low resident interest (12%), and lack of funding (5%). Despite these barriers, 9 of these 41 programs (22%) stated they planned to start a rotation in the future – of which, 3 programs (7%) planned to start a rotation within the year.
Most programs with rotations (39/41, 95%) reported that their hospitalist rotation filled at least one gap in traditional residency curriculum. The most frequently identified gaps the rotation filled included: allowing progressive clinical autonomy (59%, 24/41), learning about quality improvement and high value care (41%, 17/41), and preparing to become a practicing hospitalist (39%, 16/41). Most respondents (66%, 27/41) reported that the rotation helped to prepare trainees for their first year as an attending.
DISCUSSION
The Hospital Elective National Survey provides insight into a growing component of hospitalist-focused training and preparation. Fifty percent of ACGME residency programs surveyed in this study had a hospitalist-focused rotation. Rotation characteristics were heterogeneous, perhaps reflecting both the homegrown nature of their development and the lack of national study or data to guide what constitutes an “ideal” rotation. Common functions of rotations included providing career mentorship and allowing for trainees to get experience “being a hospitalist.” Other key elements of the rotations included providing additional clinical autonomy and teaching material outside of traditional residency curricula such as quality improvement, patient safety, billing, and healthcare finances.
Prior research has explored other training for hospitalists such as fellowships, pathways, and faculty development.6-8 A hospital medicine fellowship provides extensive training but without a practice requirement in adult medicine (as now exists in pediatric hospital medicine), the impact of fellowship training may be limited by its scale.12,13 Longitudinal hospitalist residency pathways provide comprehensive skill development and often require an early career commitment from trainees.7 Faculty development can be another tool to foster career growth, though requires local investment from hospitalist groups that may not have the resources or experience to support this.8 Our study has highlighted that hospitalist-focused rotations within residency programs can train physicians for a career in hospital medicine. Hospitalist and residency leaders should consider that these rotations might be the only hospital medicine-focused training that new hospitalists will have. Given the variable nature of these rotations nationally, developing standards around core hospitalist competencies within these rotations should be a key component to career preparation and a goal for the field at large.14,15
Our study has limitations. The survey focused only on internal medicine as it is the most common training background of hospitalists; however, the field has grown to include other specialties including pediatrics, neurology, family medicine, and surgery. In addition, the survey reviewed the largest ACGME Internal Medicine programs to best evaluate prevalence and content—it may be that some smaller programs have rotations with different characteristics that we have not captured. Lastly, the survey reviewed the rotations through the lens of residency program leadership and not trainees. A future survey of trainees or early career hospitalists who participated in these rotations could provide a better understanding of their achievements and effectiveness.
CONCLUSION
We anticipate that the demand for hospitalist-focused training will continue to grow as more residents in training seek to enter the specialty. Hospitalist and residency program leaders have an opportunity within residency training programs to build new or further develop existing hospital medicine-focused rotations. The HENS survey demonstrates that hospitalist-focused rotations are prevalent in residency education and have the potential to play an important role in hospitalist training.
Disclosure
The authors declare no conflicts of interest in relation to this manuscript.
1. Wachter RM, Goldman L. Zero to 50,000 – The 20th Anniversary of the Hospitalist. N Engl J Med. 2016;375:1009-1011. PubMed
2. Glasheen JJ, Siegal EM, Epstein K, Kutner J, Prochazka AV. Fulfilling the promise of hospital medicine: tailoring internal medicine training to address hospitalists’ needs. J Gen Intern Med. 2008;23:1110-1115. PubMed
3. Glasheen JJ, Goldenberg J, Nelson JR. Achieving hospital medicine’s promise through internal medicine residency redesign. Mt Sinai J Med. 2008; 5:436-441. PubMed
4. Plauth WH 3rd, Pantilat SZ, Wachter RM, Fenton CL. Hospitalists’ perceptions of their residency training needs: results of a national survey. Am J Med. 2001; 15;111:247-254. PubMed
5. Kumar A, Smeraglio A, Witteles R, Harman S, Nallamshetty, S, Rogers A, Harrington R, Ahuja N. A resident-created hospitalist curriculum for internal medicine housestaff. J Hosp Med. 2016;11:646-649. PubMed
6. Ranji, SR, Rosenman, DJ, Amin, AN, Kripalani, S. Hospital medicine fellowships: works in progress. Am J Med. 2006;119(1):72.e1-7. PubMed
7. Sweigart JR, Tad-Y D, Kneeland P, Williams MV, Glasheen JJ. Hospital medicine resident training tracks: developing the hospital medicine pipeline. J Hosp Med. 2017;12:173-176. PubMed
8. Sehgal NL, Sharpe BA, Auerbach AA, Wachter RM. Investing in the future: building an academic hospitalist faculty development program. J Hosp Med. 2011;6:161-166. PubMed
9. Academic Hospitalist Academy. Course Description, Objectives and Society Sponsorship. Available at: https://academichospitalist.org/. Accessed August 23, 2017.
10. Amin AN. A successful hospitalist rotation for senior medicine residents. Med Educ. 2003;37:1042. PubMed
11. Braun V, Clarke V. Using thematic analysis in psychology. Qual Res Psychol. 2006;3:77-101.
12. American Board of Medical Specialties. ABMS Officially Recognizes Pediatric Hospital Medicine Subspecialty Certification Available at: http://www.abms.org/news-events/abms-officially-recognizes-pediatric-hospital-medicine-subspecialty-certification/. Accessed August 23, 2017. PubMed
13. Wiese J. Residency training: beginning with the end in mind. J Gen Intern Med. 2008; 23(7):1122-1123. PubMed
14. Dressler DD, Pistoria MJ, Budnitz TL, McKean SC, Amin AN. Core competencies in hospital medicine: development and methodology. J Hosp Med. 2006; 1 Suppl 1:48-56. PubMed
15. Nichani S, Crocker J, Fitterman N, Lukela M. Updating the core competencies in hospital medicine – 2017 revision: introduction and methodology. J Hosp Med. 2017;4:283-287. PubMed
© 2018 Society of Hospital Medicine
Update in Hospital Medicine: Practical Lessons from the Literature
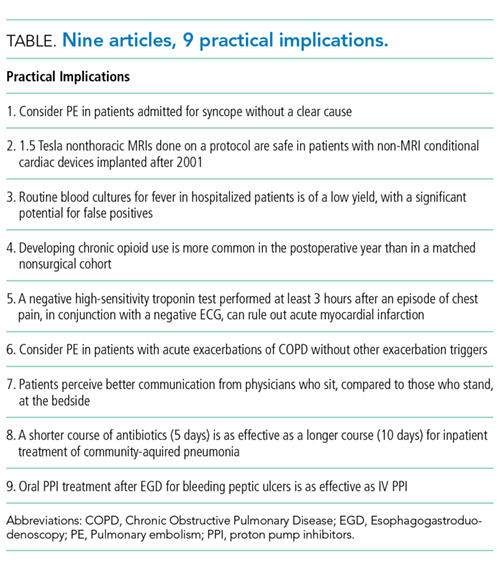
ESSENTIAL PUBLICATIONS
Prevalence of Pulmonary Embolism among Patients Hospitalized for Syncope. Prandoni P et al. New England Journal of Medicine, 2016;375(16):1524-31.1
Background
Pulmonary embolism (PE), a potentially fatal disease, is rarely considered as a likely cause of syncope. To determine the prevalence of PE among patients presenting with their first episode of syncope, the authors performed a systematic workup for pulmonary embolism in adult patients admitted for syncope at 11 hospitals in Italy.
Findings
Of the 2584 patients who presented to the emergency department (ED) with syncope during the study, 560 patients were admitted and met the inclusion criteria. A modified Wells Score was applied, and a D-dimer was measured on every hospitalized patient. Those with a high pretest probability, a Wells Score of 4.0 or higher, or a positive D-dimer underwent further testing for pulmonary embolism by a CT scan, a ventilation perfusion scan, or an autopsy. Ninety-seven of the 560 patients admitted to the hospital for syncope were found to have a PE (17%). One in
Cautions
Nearly 72% of the patients with common explanations for syncope, such as vasovagal, drug-induced, or volume depletion, were discharged from the ED and not included in the study. The authors focused on the prevalence of PE. The causation between PE and syncope is not clear in each of the patients. Of the patients’ diagnosis by a CT, only 67% of the PEs were found to be in a main pulmonary artery or lobar artery. The other 33% were segmental or subsegmental. Of those diagnosed by a ventilation perfusion scan, 50% of the patients had 25% or more of the area of both lungs involved. The other 50% involved less than 25% of the area of both lungs. Also, it is important to note that 75% of the patients admitted to the hospital in this study were 70 years of age or older.
Implications
After common diagnoses are ruled out, it is important to consider pulmonary embolism in patients hospitalized with syncope. Providers should calculate a Wells Score and measure a D-dimer to guide the decision making.
Assessing the Risks Associated with MRI in Patients with a Pacemaker or Defibrillator. Russo RJ et al. New England Journal of Medicine, 2017;376(8):755-64.2
Background
Magnetic resonance imaging (MRI) in patients with implantable cardiac devices is considered a safety risk due to the potential of cardiac lead heating and subsequent myocardial injury or alterations of the pacing properties. Although manufacturers have developed “MRI-conditional” devices designed to reduce these risks, still 2 million people in the United States and 6 million people worldwide have “non–MRI-conditional” devices. The authors evaluated the event rates in patients with “non-MRI-conditional” devices undergoing an MRI.
Findings
The authors prospectively followed up 1500 adults with cardiac devices placed since 2001 who received nonthoracic MRIs according to a specific protocol available in the supplemental materials published with this article in the New England Journal of Medicine. Of the 1000 patients with pacemakers only, they observed 5 atrial arrhythmias and 6 electrical resets. Of the 500 patients with implantable cardioverter defibrillators (ICDs), they observed 1 atrial arrhythmia and 1 generator failure (although this case had deviated from the protocol). All of the atrial arrhythmias were self-terminating. No deaths, lead failure requiring an immediate replacement, a loss of capture, or ventricular arrhythmias were observed.
Cautions
Patients who were pacing dependent were excluded. No devices implanted before 2001 were included in the study, and the MRIs performed were only 1.5 Tesla (a lower field strength than the also available 3 Tesla MRIs).
Implications
It is safe to proceed with 1.5 Tesla nonthoracic MRIs in patients, following the protocol outlined in this article, with non–MRI conditional cardiac devices implanted since 2001.
Culture If Spikes? Indications and Yield of Blood Cultures in Hospitalized Medical Patients. Linsenmeyer K et al. Journal of Hospital Medicine, 2016;11(5):336-40.3
Background
Blood cultures are frequently drawn for the evaluation of an inpatient fever. This “culture if spikes” approach may lead to unnecessary testing and false positive results. In this study, the authors evaluated rates of true positive and false positive blood cultures in the setting of an inpatient fever.
Findings
The patients hospitalized on the general medicine or cardiology floors at a Veterans Affairs teaching hospital were prospectively followed over 7 months. A total of 576 blood cultures were ordered among 323 unique patients. The patients were older (average age of 70 years) and predominantly male (94%). The true-positive rate for cultures, determined by a consensus among the microbiology and infectious disease departments based on a review of clinical and laboratory data, was 3.6% compared with a false-positive rate of 2.3%. The clinical characteristics associated with a higher likelihood of a true positive included: the indication for a culture as a follow-up from a previous culture (likelihood ratio [LR] 3.4), a working diagnosis of bacteremia or endocarditis (LR 3.7), and the constellation of fever and leukocytosis in a patient who has not been on antibiotics (LR 5.6).
Cautions
This study was performed at a single center with patients in the medicine and cardiology services, and thus, the data is representative of clinical practice patterns specific to that site.
Implications
Reflexive ordering of blood cultures for inpatient fever is of a low yield with a false-positive rate that approximates the true positive rate. A large number of patients are tested unnecessarily, and for those with positive tests, physicians are as likely to be misled as they are certain to truly identify a pathogen. The positive predictive value of blood cultures is improved when drawn on patients who are not on antibiotics and when the patient has a specific diagnosis, such as pneumonia, previous bacteremia, or suspected endocarditis.
Incidence of and Risk Factors for Chronic Opioid Use among Opioid-Naive Patients in the Postoperative Period. Sun EC et al. JAMA Internal Medicine, 2016;176(9):1286-93.4
Background
Each day in the United States, 650,000 opioid prescriptions are filled, and 78 people suffer an opiate-related death. Opioids are frequently prescribed for inpatient management of postoperative pain. In this study, authors compared the development of chronic opioid use between patients who had undergone surgery and those who had not.
Findings
This was a retrospective analysis of a nationwide insurance claims database. A total of 641,941 opioid-naive patients underwent 1 of 11 designated surgeries in the study period and were compared with 18,011,137 opioid-naive patients who did not undergo surgery. Chronic opioid use was defined as the filling of 10 or more prescriptions or receiving more than a 120-day supply between 90 and 365 days postoperatively (or following the assigned faux surgical date in those not having surgery). This was observed in a small proportion of the surgical patients (less than 0.5%). However, several procedures were associated with the increased odds of postoperative chronic opioid use, including a simple mastectomy (Odds ratio [OR] 2.65), a cesarean delivery (OR 1.28), an open appendectomy (OR 1.69), an open and laparoscopic cholecystectomy (ORs 3.60 and 1.62, respectively), and a total hip and total knee arthroplasty (ORs 2.52 and 5.10, respectively). Also, male sex, age greater than 50 years, preoperative benzodiazepines or antidepressants, and a history of drug abuse were associated with increased odds.
Cautions
This study was limited by the claims-based data and that the nonsurgical population was inherently different from the surgical population in ways that could lead to confounding.
Implications
In perioperative care, there is a need to focus on multimodal approaches to pain and to implement opioid reducing and sparing strategies that might include options such as acetaminophen, NSAIDs, neuropathic pain medications, and Lidocaine patches. Moreover, at discharge, careful consideration should be given to the quantity and duration of the postoperative opioids.
Rapid Rule-out of Acute Myocardial Infarction with a Single High-Sensitivity Cardiac Troponin T Measurement below the Limit of Detection: A Collaborative Meta-Analysis. Pickering JW et al. Annals of Internal Medicine, 2017;166:715-24.5
Background
High-sensitivity cardiac troponin testing (hs-cTnT) is now available in the United States. Studies have found that these can play a significant role in a rapid rule-out of acute myocardial infarction (AMI).
Findings
In this meta-analysis, the authors identified 11 studies with 9241 participants that prospectively evaluated patients presenting to the emergency department (ED) with chest pain, underwent an ECG, and had hs-cTnT drawn. A total of 30% of the patients were classified as low risk with negative hs-cTnT and negative ECG (defined as no ST changes or T-wave inversions indicative of ischemia). Among the low risk patients, only 14 of the 2825 (0.5%) had AMI according to the Global Task Forces definition.6 Seven of these were in patients with hs-cTnT drawn within 3 hours of a chest pain onset. The pooled negative predictive value was 99.0% (CI 93.8%–99.8%).
Cautions
The heterogeneity between the studies in this meta-analysis, especially in the exclusion criteria, warrants careful consideration when being implemented in new settings. A more sensitive test will result in more positive troponins due to different limits of detection. Thus, medical teams and institutions need to plan accordingly. Caution should be taken for any patient presenting within 3 hours of a chest pain onset.
Implications
Rapid rule-out protocols—which include clinical evaluation, a negative ECG, and a negative high-sensitivity cardiac troponin—identify a large proportion of low-risk patients who are unlikely to have a true AMI.
Prevalence and Localization of Pulmonary Embolism in Unexplained Acute Exacerbations of COPD: A Systematic Review and Meta-analysis. Aleva FE et al. Chest, 2017;151(3):544-54.7
Background
Acute exacerbations of chronic obstructive pulmonary disease (AE-COPD) are frequent. In up to 30%, no clear trigger is found. Previous studies suggested that 1 in 4 of these patients may have a pulmonary embolus (PE).7 This study reviewed the literature and meta-data to describe the prevalence, the embolism location, and the clinical predictors of PE among patients with unexplained AE-COPD.
Findings
A systematic review of the literature and meta-analysis identified 7 studies with 880 patients. In the pooled analysis, 16% had PE (range: 3%–29%). Of the 120 patients with PE, two-thirds were in lobar or larger arteries and one-third in segmental or smaller. Pleuritic chest pain and signs of cardiac compromise (hypotension, syncope, and right-sided heart failure) were associated with PE.
Cautions
This study was heterogeneous leading to a broad confidence interval for prevalence ranging from 8%–25%. Given the frequency of AE-COPD with no identified trigger, physicians need to attend to risks of repeat radiation exposure when considering an evaluation for PE.
Implications
One in 6 patients with unexplained AE-COPD was found to have PE; the odds were greater in those with pleuritic chest pain or signs of cardiac compromise. In patients with AE-COPD with an unclear trigger, the providers should consider an evaluation for PE by using a clinical prediction rule and/or a D-dimer.
Sitting at Patients’ Bedsides May Improve Patients’ Perceptions of Physician Communication Skills. Merel SE et al. Journal of Hospital Medicine, 2016;11(12):865-8.9
Background
Sitting at a patient’s bedside in the inpatient setting is considered a best practice, yet it has not been widely adopted. The authors conducted a cluster-randomized trial of physicians on a single 28-bed hospitalist only run unit where physicians were assigned to sitting or standing for the first 3 days of a 7-day workweek assignment. New admissions or transfers to the unit were considered eligible for the study.
Findings
Sixteen hospitalists saw on an average 13 patients daily during the study (a total of 159 patients were included in the analysis after 52 patients were excluded or declined to participate). The hospitalists were 69% female, and 81% had been in practice 3 years or less. The average time spent in the patient’s room was 12:00 minutes while seated and 12:10 minutes while standing. There was no difference in the patients’ perception of the amount of time spent—the patients overestimated this by 4 minutes in both groups. Sitting was associated with higher ratings for “listening carefully” and “explaining things in a way that was easy to understand.” There was no difference in ratings on the physicians interrupting the patient when talking or in treating patients with courtesy and respect.
Cautions
The study had a small sample size, was limited to English-speaking patients, and was a single-site study. It involved only attending-level physicians and did not involve nonphysician team members. The physicians were not blinded and were aware that the interactions were monitored, perhaps creating a Hawthorne effect. The analysis did not control for other factors such as the severity of the illness, the number of consultants used, or the degree of health literacy.
Implications
This study supports an important best practice highlighted in etiquette-based medicine 10: sitting at the bedside provided a benefit in the patient’s perception of communication by physicians without a negative effect on the physician’s workflow.
The Duration of Antibiotic Treatment in Community-Acquired Pneumonia: A Multi-Center Randomized Clinical Trial. Uranga A et al. JAMA Intern Medicine, 2016;176(9):1257-65.11
Background
The optimal duration of treatment for community-acquired pneumonia (CAP) is unclear; a growing body of evidence suggests shorter and longer durations may be equivalent.
Findings
At 4 hospitals in Spain, 312 adults with a mean age of 65 years and a diagnosis of CAP (non-ICU) were randomized to a short (5 days) versus a long (provider discretion) course of antibiotics. In the short-course group, the antibiotics were stopped after 5 days if the body temperature had been 37.8o C or less for 48 hours, and no more than 1 sign of clinical instability was present (SBP < 90 mmHg, HR >100/min, RR > 24/min, O2Sat < 90%). The median number of antibiotic days was 5 for the short-course group and 10 for the long-course group (P < .01). There was no difference in the resolution of pneumonia symptoms at 10 days or 30 days or in 30-day mortality. There were no differences in in-hospital side effects. However, 30-day readmissions were higher in the long-course group compared with the short-course group (6.6% vs 1.4%; P = .02). The results were similar across all of the Pneumonia Severity Index (PSI) classes.
Cautions
Most of the patients were not severely ill (~60% PSI I-III), the level of comorbid disease was low, and nearly 80% of the patients received fluoroquinolone. There was a significant cross over with 30% of patients assigned to the short-course group receiving antibiotics for more than 5 days.
Implications
Inpatient providers should aim to treat patients with community-acquired pneumonia (regardless of the severity of the illness) for 5 days. At day 5, if the patient is afebrile and has no signs of clinical instability, clinicians should be comfortable stopping antibiotics.
Is the Era of Intravenous Proton Pump Inhibitors Coming to an End in Patients with Bleeding Peptic Ulcers? A Meta-Analysis of the Published Literature. Jian Z et al. British Journal of Clinical Pharmacology, 2016;82(3):880-9.12
Background
Guidelines recommend intravenous proton pump inhibitors (PPI) after an endoscopy for patients with a bleeding peptic ulcer. Yet, acid suppression with oral PPI is deemed equivalent to the intravenous route.
Findings
This systematic review and meta-analysis identified 7 randomized controlled trials involving 859 patients. After an endoscopy, the patients were randomized to receive either oral or intravenous PPI. Most of the patients had “high-risk” peptic ulcers (active bleeding, a visible vessel, an adherent clot). The PPI dose and frequency varied between the studies. Re-bleeding rates were no different between the oral and intravenous route at 72 hours (2.4% vs 5.1%; P = .26), 7 days (5.6% vs 6.8%; P =.68), or 30 days (7.9% vs 8.8%; P = .62). There was also no difference in 30-day mortality (2.1% vs 2.4%; P = .88), and the length of stay was the same in both groups. Side effects were not reported.
Cautions
This systematic review and meta-analysis included multiple heterogeneous small studies of moderate quality. A large number of patients were excluded, increasing the risk of a selection bias.
Implications
There is no clear indication for intravenous PPI in the treatment of bleeding peptic ulcers following an endoscopy. Converting to oral PPI is equivalent to intravenous and is a safe, effective, and cost-saving option for patients with bleeding peptic ulcers.
1. Prandoni P, Lensing AW, Prins MH, et al. Prevalence of pulmonary embolism among patients hospitalized for syncope. N Engl J Med. 2016; 375(16):1524-1531. PubMed
2. Russo RJ, Costa HS, Silva PD, et al. Assessing the risks associated with MRI in patients with a pacemaker or defibrillator. N Engl J Med. 2017;376(8):755-764. PubMed
3. Linsenmeyer K, Gupta K, Strymish JM, Dhanani M, Brecher SM, Breu AC. Culture if spikes? Indications and yield of blood cultures in hospitalized medical patients. J Hosp Med. 2016;11(5):336-340. PubMed
4. Sun EC, Darnall BD, Baker LC, Mackey S. Incidence of and risk factors for chronic opioid use among opioid-naive patients in the postoperative period. JAMA Intern Med. 2016;176(9):1286-1293. PubMed
5. Pickering JW, Than MP, Cullen L, et al. Rapid rule-out of acute myocardial infarction with a single high-sensitivity cardiac troponin T measurement below the limit of detection: A collaborative meta-analysis. Ann Intern Med. 2017;166(10):715-724. PubMed
6. Thygesen K, Alpert JS, White HD, Jaffe AS, Apple FS, Galvani M, et al; Joint ESC/ACCF/AHA/WHF Task Force for the Redefinition of Myocardial Infarction. Universal definition of myocardial infarction. Circulation. 2007;116:2634-2653. PubMed
7. Aleva FE, Voets LWLM, Simons SO, de Mast Q, van der Ven AJAM, Heijdra YF. Prevalence and localization of pulmonary embolism in unexplained acute exacerbations of COPD: A systematic review and meta-analysis. Chest. 2017; 151(3):544-554. PubMed
8. Rizkallah J, Man SFP, Sin DD. Prevalence of pulmonary embolism in acute exacerbations of COPD: A systematic review and meta-analysis. Chest. 2009;135(3):786-793. PubMed
9. Merel SE, McKinney CM, Ufkes P, Kwan AC, White AA. Sitting at patients’ bedsides may improve patients’ perceptions of physician communication skills. J Hosp Med. 2016;11(12):865-868. PubMed
10. Kahn MW. Etiquette-based medicine. N Engl J Med. 2008;358(19):1988-1989. PubMed
11. Uranga A, España PP, Bilbao A, et al. Duration of antibiotic treatment in community-acquired pneumonia: A multicenter randomized clinical trial. JAMA Intern Med. 2016;176(9):1257-1265. PubMed
12. Jian Z, Li H, Race NS, Ma T, Jin H, Yin Z. Is the era of intravenous proton pump inhibitors coming to an end in patients with bleeding peptic ulcers? Meta-analysis of the published literature. Br J Clin Pharmacol. 2016;82(3):880-889. PubMed
ESSENTIAL PUBLICATIONS
Prevalence of Pulmonary Embolism among Patients Hospitalized for Syncope. Prandoni P et al. New England Journal of Medicine, 2016;375(16):1524-31.1
Background
Pulmonary embolism (PE), a potentially fatal disease, is rarely considered as a likely cause of syncope. To determine the prevalence of PE among patients presenting with their first episode of syncope, the authors performed a systematic workup for pulmonary embolism in adult patients admitted for syncope at 11 hospitals in Italy.
Findings
Of the 2584 patients who presented to the emergency department (ED) with syncope during the study, 560 patients were admitted and met the inclusion criteria. A modified Wells Score was applied, and a D-dimer was measured on every hospitalized patient. Those with a high pretest probability, a Wells Score of 4.0 or higher, or a positive D-dimer underwent further testing for pulmonary embolism by a CT scan, a ventilation perfusion scan, or an autopsy. Ninety-seven of the 560 patients admitted to the hospital for syncope were found to have a PE (17%). One in
Cautions
Nearly 72% of the patients with common explanations for syncope, such as vasovagal, drug-induced, or volume depletion, were discharged from the ED and not included in the study. The authors focused on the prevalence of PE. The causation between PE and syncope is not clear in each of the patients. Of the patients’ diagnosis by a CT, only 67% of the PEs were found to be in a main pulmonary artery or lobar artery. The other 33% were segmental or subsegmental. Of those diagnosed by a ventilation perfusion scan, 50% of the patients had 25% or more of the area of both lungs involved. The other 50% involved less than 25% of the area of both lungs. Also, it is important to note that 75% of the patients admitted to the hospital in this study were 70 years of age or older.
Implications
After common diagnoses are ruled out, it is important to consider pulmonary embolism in patients hospitalized with syncope. Providers should calculate a Wells Score and measure a D-dimer to guide the decision making.
Assessing the Risks Associated with MRI in Patients with a Pacemaker or Defibrillator. Russo RJ et al. New England Journal of Medicine, 2017;376(8):755-64.2
Background
Magnetic resonance imaging (MRI) in patients with implantable cardiac devices is considered a safety risk due to the potential of cardiac lead heating and subsequent myocardial injury or alterations of the pacing properties. Although manufacturers have developed “MRI-conditional” devices designed to reduce these risks, still 2 million people in the United States and 6 million people worldwide have “non–MRI-conditional” devices. The authors evaluated the event rates in patients with “non-MRI-conditional” devices undergoing an MRI.
Findings
The authors prospectively followed up 1500 adults with cardiac devices placed since 2001 who received nonthoracic MRIs according to a specific protocol available in the supplemental materials published with this article in the New England Journal of Medicine. Of the 1000 patients with pacemakers only, they observed 5 atrial arrhythmias and 6 electrical resets. Of the 500 patients with implantable cardioverter defibrillators (ICDs), they observed 1 atrial arrhythmia and 1 generator failure (although this case had deviated from the protocol). All of the atrial arrhythmias were self-terminating. No deaths, lead failure requiring an immediate replacement, a loss of capture, or ventricular arrhythmias were observed.
Cautions
Patients who were pacing dependent were excluded. No devices implanted before 2001 were included in the study, and the MRIs performed were only 1.5 Tesla (a lower field strength than the also available 3 Tesla MRIs).
Implications
It is safe to proceed with 1.5 Tesla nonthoracic MRIs in patients, following the protocol outlined in this article, with non–MRI conditional cardiac devices implanted since 2001.
Culture If Spikes? Indications and Yield of Blood Cultures in Hospitalized Medical Patients. Linsenmeyer K et al. Journal of Hospital Medicine, 2016;11(5):336-40.3
Background
Blood cultures are frequently drawn for the evaluation of an inpatient fever. This “culture if spikes” approach may lead to unnecessary testing and false positive results. In this study, the authors evaluated rates of true positive and false positive blood cultures in the setting of an inpatient fever.
Findings
The patients hospitalized on the general medicine or cardiology floors at a Veterans Affairs teaching hospital were prospectively followed over 7 months. A total of 576 blood cultures were ordered among 323 unique patients. The patients were older (average age of 70 years) and predominantly male (94%). The true-positive rate for cultures, determined by a consensus among the microbiology and infectious disease departments based on a review of clinical and laboratory data, was 3.6% compared with a false-positive rate of 2.3%. The clinical characteristics associated with a higher likelihood of a true positive included: the indication for a culture as a follow-up from a previous culture (likelihood ratio [LR] 3.4), a working diagnosis of bacteremia or endocarditis (LR 3.7), and the constellation of fever and leukocytosis in a patient who has not been on antibiotics (LR 5.6).
Cautions
This study was performed at a single center with patients in the medicine and cardiology services, and thus, the data is representative of clinical practice patterns specific to that site.
Implications
Reflexive ordering of blood cultures for inpatient fever is of a low yield with a false-positive rate that approximates the true positive rate. A large number of patients are tested unnecessarily, and for those with positive tests, physicians are as likely to be misled as they are certain to truly identify a pathogen. The positive predictive value of blood cultures is improved when drawn on patients who are not on antibiotics and when the patient has a specific diagnosis, such as pneumonia, previous bacteremia, or suspected endocarditis.
Incidence of and Risk Factors for Chronic Opioid Use among Opioid-Naive Patients in the Postoperative Period. Sun EC et al. JAMA Internal Medicine, 2016;176(9):1286-93.4
Background
Each day in the United States, 650,000 opioid prescriptions are filled, and 78 people suffer an opiate-related death. Opioids are frequently prescribed for inpatient management of postoperative pain. In this study, authors compared the development of chronic opioid use between patients who had undergone surgery and those who had not.
Findings
This was a retrospective analysis of a nationwide insurance claims database. A total of 641,941 opioid-naive patients underwent 1 of 11 designated surgeries in the study period and were compared with 18,011,137 opioid-naive patients who did not undergo surgery. Chronic opioid use was defined as the filling of 10 or more prescriptions or receiving more than a 120-day supply between 90 and 365 days postoperatively (or following the assigned faux surgical date in those not having surgery). This was observed in a small proportion of the surgical patients (less than 0.5%). However, several procedures were associated with the increased odds of postoperative chronic opioid use, including a simple mastectomy (Odds ratio [OR] 2.65), a cesarean delivery (OR 1.28), an open appendectomy (OR 1.69), an open and laparoscopic cholecystectomy (ORs 3.60 and 1.62, respectively), and a total hip and total knee arthroplasty (ORs 2.52 and 5.10, respectively). Also, male sex, age greater than 50 years, preoperative benzodiazepines or antidepressants, and a history of drug abuse were associated with increased odds.
Cautions
This study was limited by the claims-based data and that the nonsurgical population was inherently different from the surgical population in ways that could lead to confounding.
Implications
In perioperative care, there is a need to focus on multimodal approaches to pain and to implement opioid reducing and sparing strategies that might include options such as acetaminophen, NSAIDs, neuropathic pain medications, and Lidocaine patches. Moreover, at discharge, careful consideration should be given to the quantity and duration of the postoperative opioids.
Rapid Rule-out of Acute Myocardial Infarction with a Single High-Sensitivity Cardiac Troponin T Measurement below the Limit of Detection: A Collaborative Meta-Analysis. Pickering JW et al. Annals of Internal Medicine, 2017;166:715-24.5
Background
High-sensitivity cardiac troponin testing (hs-cTnT) is now available in the United States. Studies have found that these can play a significant role in a rapid rule-out of acute myocardial infarction (AMI).
Findings
In this meta-analysis, the authors identified 11 studies with 9241 participants that prospectively evaluated patients presenting to the emergency department (ED) with chest pain, underwent an ECG, and had hs-cTnT drawn. A total of 30% of the patients were classified as low risk with negative hs-cTnT and negative ECG (defined as no ST changes or T-wave inversions indicative of ischemia). Among the low risk patients, only 14 of the 2825 (0.5%) had AMI according to the Global Task Forces definition.6 Seven of these were in patients with hs-cTnT drawn within 3 hours of a chest pain onset. The pooled negative predictive value was 99.0% (CI 93.8%–99.8%).
Cautions
The heterogeneity between the studies in this meta-analysis, especially in the exclusion criteria, warrants careful consideration when being implemented in new settings. A more sensitive test will result in more positive troponins due to different limits of detection. Thus, medical teams and institutions need to plan accordingly. Caution should be taken for any patient presenting within 3 hours of a chest pain onset.
Implications
Rapid rule-out protocols—which include clinical evaluation, a negative ECG, and a negative high-sensitivity cardiac troponin—identify a large proportion of low-risk patients who are unlikely to have a true AMI.
Prevalence and Localization of Pulmonary Embolism in Unexplained Acute Exacerbations of COPD: A Systematic Review and Meta-analysis. Aleva FE et al. Chest, 2017;151(3):544-54.7
Background
Acute exacerbations of chronic obstructive pulmonary disease (AE-COPD) are frequent. In up to 30%, no clear trigger is found. Previous studies suggested that 1 in 4 of these patients may have a pulmonary embolus (PE).7 This study reviewed the literature and meta-data to describe the prevalence, the embolism location, and the clinical predictors of PE among patients with unexplained AE-COPD.
Findings
A systematic review of the literature and meta-analysis identified 7 studies with 880 patients. In the pooled analysis, 16% had PE (range: 3%–29%). Of the 120 patients with PE, two-thirds were in lobar or larger arteries and one-third in segmental or smaller. Pleuritic chest pain and signs of cardiac compromise (hypotension, syncope, and right-sided heart failure) were associated with PE.
Cautions
This study was heterogeneous leading to a broad confidence interval for prevalence ranging from 8%–25%. Given the frequency of AE-COPD with no identified trigger, physicians need to attend to risks of repeat radiation exposure when considering an evaluation for PE.
Implications
One in 6 patients with unexplained AE-COPD was found to have PE; the odds were greater in those with pleuritic chest pain or signs of cardiac compromise. In patients with AE-COPD with an unclear trigger, the providers should consider an evaluation for PE by using a clinical prediction rule and/or a D-dimer.
Sitting at Patients’ Bedsides May Improve Patients’ Perceptions of Physician Communication Skills. Merel SE et al. Journal of Hospital Medicine, 2016;11(12):865-8.9
Background
Sitting at a patient’s bedside in the inpatient setting is considered a best practice, yet it has not been widely adopted. The authors conducted a cluster-randomized trial of physicians on a single 28-bed hospitalist only run unit where physicians were assigned to sitting or standing for the first 3 days of a 7-day workweek assignment. New admissions or transfers to the unit were considered eligible for the study.
Findings
Sixteen hospitalists saw on an average 13 patients daily during the study (a total of 159 patients were included in the analysis after 52 patients were excluded or declined to participate). The hospitalists were 69% female, and 81% had been in practice 3 years or less. The average time spent in the patient’s room was 12:00 minutes while seated and 12:10 minutes while standing. There was no difference in the patients’ perception of the amount of time spent—the patients overestimated this by 4 minutes in both groups. Sitting was associated with higher ratings for “listening carefully” and “explaining things in a way that was easy to understand.” There was no difference in ratings on the physicians interrupting the patient when talking or in treating patients with courtesy and respect.
Cautions
The study had a small sample size, was limited to English-speaking patients, and was a single-site study. It involved only attending-level physicians and did not involve nonphysician team members. The physicians were not blinded and were aware that the interactions were monitored, perhaps creating a Hawthorne effect. The analysis did not control for other factors such as the severity of the illness, the number of consultants used, or the degree of health literacy.
Implications
This study supports an important best practice highlighted in etiquette-based medicine 10: sitting at the bedside provided a benefit in the patient’s perception of communication by physicians without a negative effect on the physician’s workflow.
The Duration of Antibiotic Treatment in Community-Acquired Pneumonia: A Multi-Center Randomized Clinical Trial. Uranga A et al. JAMA Intern Medicine, 2016;176(9):1257-65.11
Background
The optimal duration of treatment for community-acquired pneumonia (CAP) is unclear; a growing body of evidence suggests shorter and longer durations may be equivalent.
Findings
At 4 hospitals in Spain, 312 adults with a mean age of 65 years and a diagnosis of CAP (non-ICU) were randomized to a short (5 days) versus a long (provider discretion) course of antibiotics. In the short-course group, the antibiotics were stopped after 5 days if the body temperature had been 37.8o C or less for 48 hours, and no more than 1 sign of clinical instability was present (SBP < 90 mmHg, HR >100/min, RR > 24/min, O2Sat < 90%). The median number of antibiotic days was 5 for the short-course group and 10 for the long-course group (P < .01). There was no difference in the resolution of pneumonia symptoms at 10 days or 30 days or in 30-day mortality. There were no differences in in-hospital side effects. However, 30-day readmissions were higher in the long-course group compared with the short-course group (6.6% vs 1.4%; P = .02). The results were similar across all of the Pneumonia Severity Index (PSI) classes.
Cautions
Most of the patients were not severely ill (~60% PSI I-III), the level of comorbid disease was low, and nearly 80% of the patients received fluoroquinolone. There was a significant cross over with 30% of patients assigned to the short-course group receiving antibiotics for more than 5 days.
Implications
Inpatient providers should aim to treat patients with community-acquired pneumonia (regardless of the severity of the illness) for 5 days. At day 5, if the patient is afebrile and has no signs of clinical instability, clinicians should be comfortable stopping antibiotics.
Is the Era of Intravenous Proton Pump Inhibitors Coming to an End in Patients with Bleeding Peptic Ulcers? A Meta-Analysis of the Published Literature. Jian Z et al. British Journal of Clinical Pharmacology, 2016;82(3):880-9.12
Background
Guidelines recommend intravenous proton pump inhibitors (PPI) after an endoscopy for patients with a bleeding peptic ulcer. Yet, acid suppression with oral PPI is deemed equivalent to the intravenous route.
Findings
This systematic review and meta-analysis identified 7 randomized controlled trials involving 859 patients. After an endoscopy, the patients were randomized to receive either oral or intravenous PPI. Most of the patients had “high-risk” peptic ulcers (active bleeding, a visible vessel, an adherent clot). The PPI dose and frequency varied between the studies. Re-bleeding rates were no different between the oral and intravenous route at 72 hours (2.4% vs 5.1%; P = .26), 7 days (5.6% vs 6.8%; P =.68), or 30 days (7.9% vs 8.8%; P = .62). There was also no difference in 30-day mortality (2.1% vs 2.4%; P = .88), and the length of stay was the same in both groups. Side effects were not reported.
Cautions
This systematic review and meta-analysis included multiple heterogeneous small studies of moderate quality. A large number of patients were excluded, increasing the risk of a selection bias.
Implications
There is no clear indication for intravenous PPI in the treatment of bleeding peptic ulcers following an endoscopy. Converting to oral PPI is equivalent to intravenous and is a safe, effective, and cost-saving option for patients with bleeding peptic ulcers.
1. Prandoni P, Lensing AW, Prins MH, et al. Prevalence of pulmonary embolism among patients hospitalized for syncope. N Engl J Med. 2016; 375(16):1524-1531. PubMed
2. Russo RJ, Costa HS, Silva PD, et al. Assessing the risks associated with MRI in patients with a pacemaker or defibrillator. N Engl J Med. 2017;376(8):755-764. PubMed
3. Linsenmeyer K, Gupta K, Strymish JM, Dhanani M, Brecher SM, Breu AC. Culture if spikes? Indications and yield of blood cultures in hospitalized medical patients. J Hosp Med. 2016;11(5):336-340. PubMed
4. Sun EC, Darnall BD, Baker LC, Mackey S. Incidence of and risk factors for chronic opioid use among opioid-naive patients in the postoperative period. JAMA Intern Med. 2016;176(9):1286-1293. PubMed
5. Pickering JW, Than MP, Cullen L, et al. Rapid rule-out of acute myocardial infarction with a single high-sensitivity cardiac troponin T measurement below the limit of detection: A collaborative meta-analysis. Ann Intern Med. 2017;166(10):715-724. PubMed
6. Thygesen K, Alpert JS, White HD, Jaffe AS, Apple FS, Galvani M, et al; Joint ESC/ACCF/AHA/WHF Task Force for the Redefinition of Myocardial Infarction. Universal definition of myocardial infarction. Circulation. 2007;116:2634-2653. PubMed
7. Aleva FE, Voets LWLM, Simons SO, de Mast Q, van der Ven AJAM, Heijdra YF. Prevalence and localization of pulmonary embolism in unexplained acute exacerbations of COPD: A systematic review and meta-analysis. Chest. 2017; 151(3):544-554. PubMed
8. Rizkallah J, Man SFP, Sin DD. Prevalence of pulmonary embolism in acute exacerbations of COPD: A systematic review and meta-analysis. Chest. 2009;135(3):786-793. PubMed
9. Merel SE, McKinney CM, Ufkes P, Kwan AC, White AA. Sitting at patients’ bedsides may improve patients’ perceptions of physician communication skills. J Hosp Med. 2016;11(12):865-868. PubMed
10. Kahn MW. Etiquette-based medicine. N Engl J Med. 2008;358(19):1988-1989. PubMed
11. Uranga A, España PP, Bilbao A, et al. Duration of antibiotic treatment in community-acquired pneumonia: A multicenter randomized clinical trial. JAMA Intern Med. 2016;176(9):1257-1265. PubMed
12. Jian Z, Li H, Race NS, Ma T, Jin H, Yin Z. Is the era of intravenous proton pump inhibitors coming to an end in patients with bleeding peptic ulcers? Meta-analysis of the published literature. Br J Clin Pharmacol. 2016;82(3):880-889. PubMed
© 2018 Society of Hospital Medicine