User login
The Effect of an Inpatient Smoking Cessation Treatment Program on Hospital Readmissions and Length of Stay
Successful smoking cessation interventions result in substantial gains in health and life expectancy by reducing smoking-related illnesses and preventing premature deaths.1,2 The Department of Health and Human Services recommends clinicians use hospitalization as “an opportunity to promote smoking cessation’’ and ‘‘to prescribe medications to alleviate withdrawal symptoms”3 because individual readiness to quit may be high during hospitalizations. A meta-analysis of 50 studies (21 from the United States) examining the efficacy of hospital-initiated smoking cessation interventions concluded that smoking cessation support programs that began in the hospital and continued for at least 1 month postdischarge significantly increase the likelihood of patients being smoke-free in the long term.4 The most efficacious strategies included counseling and pharmacotherapy rather than counseling alone.3 Most inpatient smoking cessation studies have focused on quit-rates or medical outcomes, while fewer studies have looked at healthcare utilization.
However, previous research has shown that smoking cessation for inpatients has relatively immediate economic and health benefits. Patients who quit smoking during hospitalizations for cardiovascular disease are less likely to be readmitted or to die during follow-up.5,6 Patients with acute myocardial infarction (AMI), unstable angina, heart failure, and chronic obstructive pulmonary disease who received an inpatient smoking cessation intervention had reductions in inpatient readmission rates.7 A 1% reduction in overall smoking rates would lead to an annual reduction of 3,022 hospitalizations for stroke and 1,684 hospitalizations for AMI.8 One comprehensive program, the Ottawa Model for Smoking Cessation (OMSC), found that a hospital-initiated intervention increased long-term cessation rates by 15% in cardiac patients and by 11% in general hospital populations.9,10 The applicability of this result to US healthcare systems is unknown. This paper adds to the existing literature by evaluating the impact of an inpatient smoking cessation program on healthcare utilization among patients hospitalized for any reason, rather than solely focused on those with cardiopulmonary diagnoses.
The current study focuses on an inpatient smoking cessation program at a teaching hospital in the Rocky Mountain region. The hospital implemented a smoking cessation treatment program on July 1, 2013, based on the OMSC. The goal was to identify and support inpatient adult smokers who wanted to make a quit attempt and help them remain smoke-free after discharge. The objective of the current study was to determine the effect of the program on 30-day readmission rates and length of stay (LOS) of the index hospitalization. Although the general cost effectiveness of properly structured smoking cessation programs are well established,11-13 the healthcare utilization effects of inpatient smoking cessation programs are not well understood.
METHODS
Data
The study population consists of patients over age 18 who were admitted to the hospital between July 1, 2012, and July 1, 2014. Baseline smoking status was assessed at hospital admission and recorded in Epic (Epic Systems Corporation, Verona, Wisconsin), the electronic medical records system, as a current smoker (every day and some days), former smoker, never smoker, and never assessed. To check the accuracy of recorded smoking status, a random sample of 819 inpatients was selected and contacted via telephone for verification; 93% of Epic-identified smokers confirmed that they were smokers at hospital admission.14
Intervention
The intervention, which launched July 13, 2014, modified the Epic system to automatically alert providers viewing a tobacco user’s medical record that the patient should receive standardized orders for a bedside consultation with a Tobacco Treatment Specialist (TTS) and a prescription for nicotine replacement therapy (NRT) while in the hospital.15 Previously, referrals for tobacco treatment were done on an ad-hoc basis by the physician, and NRT was not routinely available. This system-level intervention standardized and automated the referral process. For patients with a bedside consultation order, TTS used a patient-centered approach (motivational interviewing) to explore patients’ motivation to quit smoking and offered NRT to improve comfort and safety while in the hospital. Patients who chose to make a quit attempt received a free 2-week supply of NRT at discharge and 6 months of free follow-up counseling by interactive voice response (IVR) telephone technology that included (a) prerecorded advice keyed to individual patient needs, (b) a warm-transfer option to speak with a live TTS (later dropped), and (c) a collection of patient smoking and cessation treatment measures.15
Statistical Analysis
We used an intent-to-treat (ITT) framework for the analysis, which considers everyone eligible for the treatment to be in the treatment group. The approach ignores treatment nonacceptance, nonadherence, protocol deviations, withdrawal from treatment, and cessation outcomes,
Readmission rates and LOS were estimated by using a “difference-in-differences” model, comparing outcomes between smokers before versus after the introduction of the cessation treatment program with nonsmokers before versus after program introduction. The difference-in-differences method looks at the difference pre-and-post in the exposed group (smokers) and unexposed group (nonsmokers). Subtracting the difference between the 2 groups gives an estimate of the policy effect controlling for background trends.19 The smoking cessation treatment effect on readmission is measured by the coefficient on the interaction term between the smoking variable and an indicator that the program is operational. The coefficient is the “difference-in-differences.”
Other control variables include demographic factors (gender, age, race), hospitalization payer (Medicare, Medicaid, commercial), and the service line of the admission. We also included a severity of illness variable from the APR-DRG Grouper (3M, Maplewood, Minnesota)20 and the number of days spent in the intensive care unit. For the readmission model, we included LOS as a control variable, because individuals with longer LOS had a better opportunity to access the intervention.
For readmissions, the model was estimated by using a probit model, predicting the effect of each of the intervention variables and the control variables on the marginal probability of a readmission. Because patients can appear in both the pre- and postyears, clustered standard errors were used, which correct for the lack of independence from multiple observations from the same individual.21 For LOS, a truncated negative binomial model was used. The negative binomial model is a specification for count models with a mass of observations plus a long right tail. The truncation is because zero and negative values for LOS are not possible. The dependent variable represents the number of days the individual was hospitalized. For both models, the reported coefficients represent the marginal effect of the independent variable on the dependent variable. This was calculated using the “margins” command in Stata version 13 (StataCorp LLC, College Station, Texas).
RESULTS
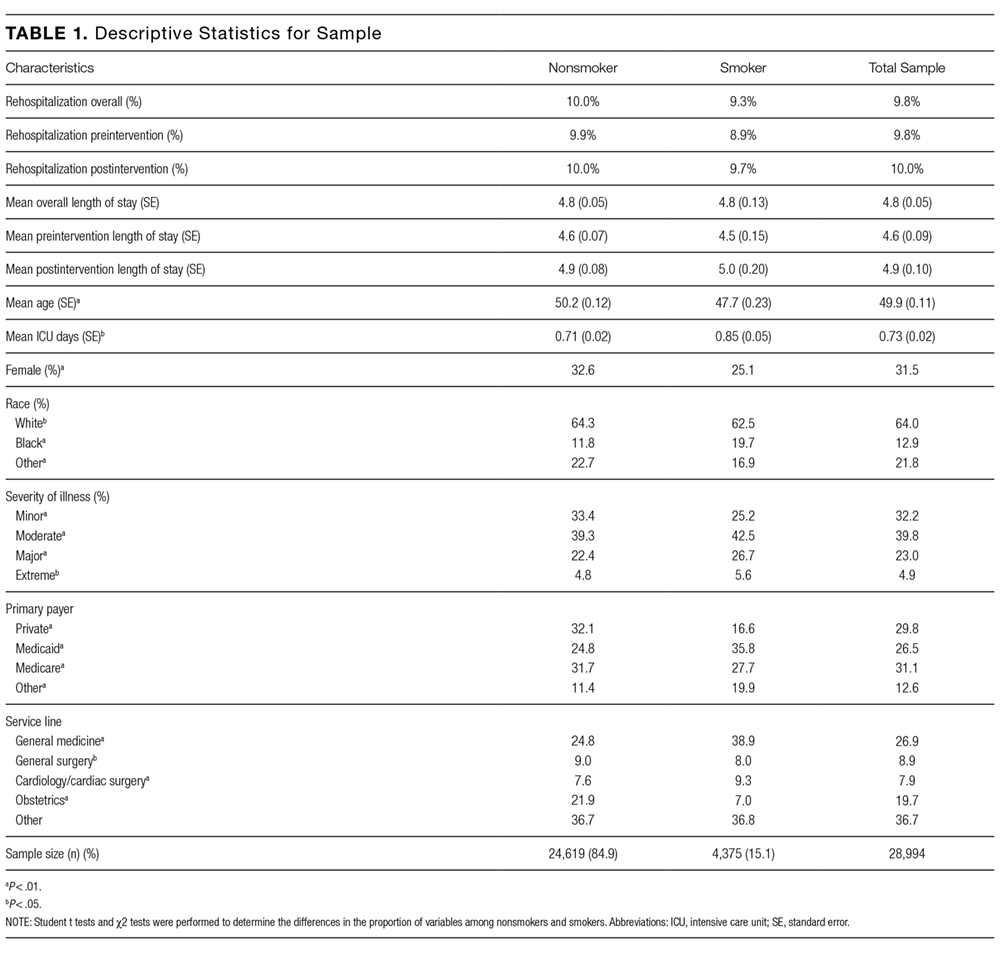
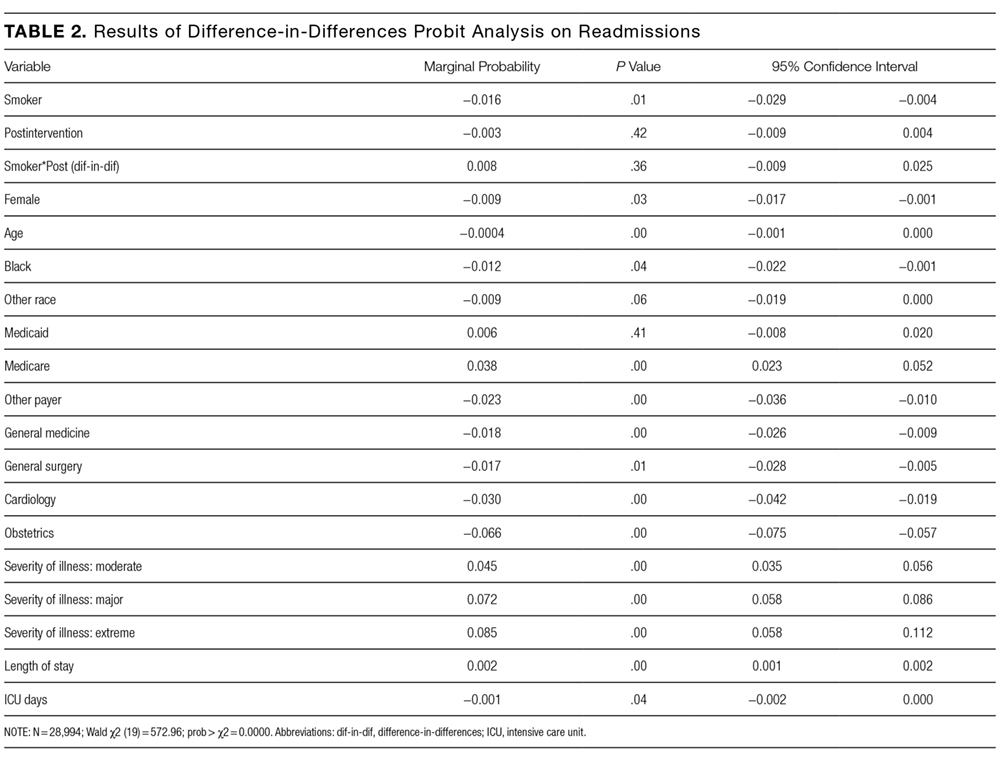
In the probit analysis, the smoking cessation intervention (Smoker*post intervention) showed no significant effect on the probability of readmission (Table 2). The coefficient is positive (β = 0.008) and statistically insignificant (P = 0.36). This indicates that we failed to reject the null hypothesis that there was not a systematic difference in the probability of readmission because of the smoking cessation intervention. Other significant variables generally had the expected relationship with readmission rates. Smokers were 1.6% less likely to be readmitted than nonsmokers (P = 0.01), controlling for other factors.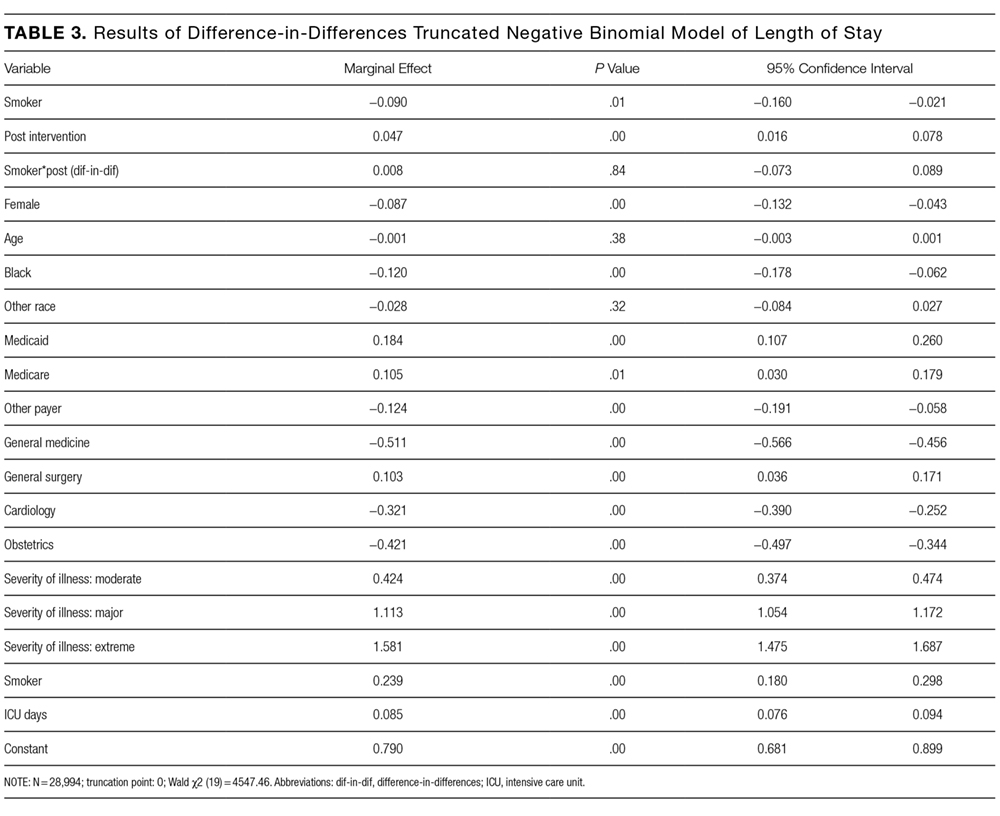
The program effect on smoker LOS was statistically insignificant (β = 0.008; P = 0.36). Smokers overall had a shorter LOS than nonsmokers (β = −0.090; P = 0.01), controlling for other factors. Overall LOS was longer postintervention (β = 0.047; P < 0.01). The control variables generally had the same relationship for the LOS model as for the readmission model.
DISCUSSION
This study investigated the effect of an inpatient smoking cessation program, based on a successful Canadian model, on inpatient readmission rates and LOS. The program showed no effect on 30-day readmission rates or LOS. We see several potential explanations for the absence of a detectable impact.
First, the ITT approach reflected real-world implementation of smoking cessation services. The ITT approach adopts the hospital’s perspective because the hospital will assess overall effectiveness without regard to programmatic limitations. The intervention group for this analysis included individuals who were offered but declined treatment, individuals who accepted treatment but failed to quit smoking, and individuals who both accepted treatment and quit smoking. If the analysis had focused only on the latter group, an effect would have been more likely to be found. Further analysis of the subset of patients who accepted the intervention and quit smoking is warranted. Nevertheless, hospitals cannot expect all inpatient smokers, or even a majority, to embrace an offer of cessation treatment. This also emphasizes the challenges hospitals will face in offering tobacco cessation programs to smokers in a timely way. Reasons for patients not receiving orders varied but included issues with weekend admissions.
Second, the timeframe of the analysis is limited to the inpatient stay (for LOS) and 30 days (for readmission). A longer-term analysis might have found an effect. However, we examined this from the hospital perspective. For the hospital, LOS is a key cost driver; thus, reductions in LOS would create a strong financial incentive for hospitals to implement smoking cessation programs. Similarly, reducing readmissions is now a priority for hospitals because of new Medicare rules that penalize hospitals for readmissions. Thus, the 2 outcomes we examined are outcomes that are financially important to hospitals.
There are several limitations to our analysis. First, the difference-in-differences model assumes that in the absence of treatment, the average change in the dependent variables would have been the same for both the treatment and control groups, also known as the parallel trends assumption. Specification tests showed this assumption was met for the preperiod. Second, our study relies on electronic health record data to identify smokers. However, 93% of individuals who were identified as smokers confirmed their smoking status upon interview. Finally, we looked at all categories of inpatient admissions. Improvement in LOS and short-term readmission rates may be limited to patients admitted for specific conditions, such as cardiovascular and respiratory conditions.
There are a number of plausible reasons for our null finding. First, the “dose” of intervention may have been too weak; that is, the number of smokers who were offered the treatment, accepted the treatment, and adhered to the treatment may have been too low, leading to too few smokers quitting smoking and, thus, no effect of the intervention on our outcomes. This follows directly from the ITT design of the study.23 This suggests that hospitals who wish to adopt smoking cessation programs need to focus on ensuring a timely offering of treatment and encouragement of uptake by smokers.
A second reason for the null finding may have been the short duration for the NRT, which was only offered for 2 weeks. Research suggests that use of NRT for less than 4 weeks is associated with a reduced likelihood of smoking cessation.24 However, a review of the literature concludes that the duration of NRT is less important than the dosage and the combination of NRT with other forms of smoking cessation therapy.25 It is important to note that this study used NRT; other treatments such as Chantix could have different effectiveness.26,27 Further research on different treatment approaches, including longer duration of NRT, would be appropriate.
Disclosure
The authors have no competing interests or conflicts to report. The study was supported by contract number 15FLA68717 from the Colorado Department of Public Health and Environment.
1. Taylor DH Jr, Hasselblad V, Henley SJ, Thun MJ, Sloan FA. Benefits of Smoking Cessation for Longevity. Am J Public Health. 2002;92(6):990-996. PubMed
2. Weitkunat R, Coggins CRE, Sponsiello-Wang Z, Kallischnigg G, Dempsey R. Assessment of Cigarette Smoking in Epidemiologic Studies. Tobacco Research. 2013;25(7).
3. Fiore MC, Jaen CR, Baker TB, et al. Treating Tobacco Use and Dependence: 2008 Update. Rockville (MD): US Department of Health and Human Services. 2008. https://www.ncbi.nlm.nih.gov/books/NBK63952/.
4. Rigotti, NA, Clair, C, Munafo, MR, et al., Interventions for smoking cessation in hospitalised patients. Cochrane Database Syst Rev. 2012(5): CD001837. PubMed
5. Ladapo JA, Jaffer FA, Weinstein MC, Froelicher ES. Projected cost-effectiveness of smoking cessation interventions in patients hospitalized with myocardial infarction. Arch Intern Med. 2011;171:39-45. PubMed
6. Mohiuddin SM, Mooss AN, Hunter CB, Grollmes TL, Cloutier DA, Hilleman DE. Intensive smoking cessation intervention reduces mortality in high-risk smokers with cardiovascular disease. Chest. 2007;131:446-452. PubMed
7. Mullen K, Coyle D, Manuel D, et al. Economic evaluation of a hospital-initiated intervention for smokers with chronic disease, in Ontario, Canada. Tob Control. 2015;24(5):489-496. PubMed
8. Lightwood JM, Glantz SA. Short-term economic and health benefits of smoking cessation: myocardial infarction and stroke. Circulation. 1997;96(4):1089-1096. PubMed
9. Reid RD, Mullen KA, Slovinec D’Angelo ME, et al. Smoking cessation for hospitalized smokers: an evaluation of the “Ottawa Model.” Nicotine Tob Res. 2010;12:11-18. PubMed
10. Reid RD, Pipe AL, Quinlan B. Promoting smoking cessation during hospitalization for coronary artery disease. Can J Cardiol. 2006;22:775-780. PubMed
11. Krumholz H, Cohen B, Tsevat J, Pasternak R, Weinstein M. Cost-effectiveness of a smoking cessation program after myocardial infarction. J Am Coll Cardiol. 1993;22(6):1697-1702. PubMed
12. Curry S, Grothaus L, McAfee T, Pabiniak C. Use and Cost Effectiveness of Smoking-Cessation Services under Four Insurance Plans in a Health Maintenance Organization. N Engl J Med. 1998;339:673-679. PubMed
12. Fiscella K, Franks P. Cost-effectiveness of the transdermal nicotine patch as an adjunct to physicians’ smoking cessation counseling. JAMA. 1996;275:1247-1251. PubMed
13. CEPEG. Independent Evaluation: University of Colorado Hospital’s Smoking Cessation Treatment Program, preliminary report. Aurora: Colorado School of Public Health; 2014.
15. Cooper S, Pray S. Independent Evaluation: Hospital systems change to improve inpatient tobacco dependence treatment final results. Aurora: Colorado School of Public Health; June 2015.
16. Gupta S. Intention-to-treat concept: A review. Perspect Clin Res. 2011;2(3):109-112. DOI:10.4103/2229-3485.83221 PubMed
17. Fisher LD, Dixon DO, Herson J, Frankowski RK, Hearron MS, Peace KE. Intention to treat in clinical trials. In: Peace KE, editor. Statistical Issues in Drug Research and Development. New York: Marcel Dekker; 1990:331-350
18. Newell DJ. Intention-to-treat analysis: implications for quantitative and qualitative research. Int J Epidemiol. 1992;21(5):837-841. PubMed
19. Dimick JB, Ryan AM. Methods for Evaluating Changes in Health Care Policy: The Difference-in-Differences Approach. JAMA. 2014;312(22):2401-2402. DOI:10.1001/jama.2014.16153 PubMed
20. Averill R, Goldfield N, Steinbeck B, et al. Development of the All Patient Refined DRGs (APR-DRGs). Maplewood: 3M Health Information Systems; 1997. Report 8-9. PubMed
21. Cameron A, Miller D. A Practitioner’s Guide to Cluster-Robust Inference. J Hum Resour. 2015;50(2):317-372.
22. Cooper S, Pray S. Independent Evaluation: Hospital systems change to improve inpatient tobacco dependence treatment Final Results. Aurora: Colorado School of Public Health; April 2015.
23. Gupta SK. Intention-to-treat concept: A review. Perspect Clin Res. 2011;2(3):109-112. DOI:10.4103/2229-3485.83221. PubMed
24. Zhang B, Cohen J, Bondy S. Duration of Nicotine Replacement Therapy Use and Smoking Cessation: A Population-Based Longitudinal Study. Am J Epidemiol. 2015;181(7):513-520. PubMed
25. Silagy C, Lancaster T, Stead L, Mant D, Fowler G. Nicotine replacement therapy for smoking cessation. Cochrane Database Syst Rev. 2004;3:CD000146. DOI:10.1002/14651858.CD000146 PubMed
26. C, , . Nicotine receptor partial agonists for smoking cessation. Cochrane Database Syst Rev. 2008;3:CD006103. DOI:10.1002/14651858.CD006103.pub3. PubMed
27. Hurt R, Sachs D, Glover E, et al. A Comparison of Sustained-Release Bupropion and Placebo for Smoking Cessation. N Engl J Med. 1997;337:1195-1202. PubMed
Successful smoking cessation interventions result in substantial gains in health and life expectancy by reducing smoking-related illnesses and preventing premature deaths.1,2 The Department of Health and Human Services recommends clinicians use hospitalization as “an opportunity to promote smoking cessation’’ and ‘‘to prescribe medications to alleviate withdrawal symptoms”3 because individual readiness to quit may be high during hospitalizations. A meta-analysis of 50 studies (21 from the United States) examining the efficacy of hospital-initiated smoking cessation interventions concluded that smoking cessation support programs that began in the hospital and continued for at least 1 month postdischarge significantly increase the likelihood of patients being smoke-free in the long term.4 The most efficacious strategies included counseling and pharmacotherapy rather than counseling alone.3 Most inpatient smoking cessation studies have focused on quit-rates or medical outcomes, while fewer studies have looked at healthcare utilization.
However, previous research has shown that smoking cessation for inpatients has relatively immediate economic and health benefits. Patients who quit smoking during hospitalizations for cardiovascular disease are less likely to be readmitted or to die during follow-up.5,6 Patients with acute myocardial infarction (AMI), unstable angina, heart failure, and chronic obstructive pulmonary disease who received an inpatient smoking cessation intervention had reductions in inpatient readmission rates.7 A 1% reduction in overall smoking rates would lead to an annual reduction of 3,022 hospitalizations for stroke and 1,684 hospitalizations for AMI.8 One comprehensive program, the Ottawa Model for Smoking Cessation (OMSC), found that a hospital-initiated intervention increased long-term cessation rates by 15% in cardiac patients and by 11% in general hospital populations.9,10 The applicability of this result to US healthcare systems is unknown. This paper adds to the existing literature by evaluating the impact of an inpatient smoking cessation program on healthcare utilization among patients hospitalized for any reason, rather than solely focused on those with cardiopulmonary diagnoses.
The current study focuses on an inpatient smoking cessation program at a teaching hospital in the Rocky Mountain region. The hospital implemented a smoking cessation treatment program on July 1, 2013, based on the OMSC. The goal was to identify and support inpatient adult smokers who wanted to make a quit attempt and help them remain smoke-free after discharge. The objective of the current study was to determine the effect of the program on 30-day readmission rates and length of stay (LOS) of the index hospitalization. Although the general cost effectiveness of properly structured smoking cessation programs are well established,11-13 the healthcare utilization effects of inpatient smoking cessation programs are not well understood.
METHODS
Data
The study population consists of patients over age 18 who were admitted to the hospital between July 1, 2012, and July 1, 2014. Baseline smoking status was assessed at hospital admission and recorded in Epic (Epic Systems Corporation, Verona, Wisconsin), the electronic medical records system, as a current smoker (every day and some days), former smoker, never smoker, and never assessed. To check the accuracy of recorded smoking status, a random sample of 819 inpatients was selected and contacted via telephone for verification; 93% of Epic-identified smokers confirmed that they were smokers at hospital admission.14
Intervention
The intervention, which launched July 13, 2014, modified the Epic system to automatically alert providers viewing a tobacco user’s medical record that the patient should receive standardized orders for a bedside consultation with a Tobacco Treatment Specialist (TTS) and a prescription for nicotine replacement therapy (NRT) while in the hospital.15 Previously, referrals for tobacco treatment were done on an ad-hoc basis by the physician, and NRT was not routinely available. This system-level intervention standardized and automated the referral process. For patients with a bedside consultation order, TTS used a patient-centered approach (motivational interviewing) to explore patients’ motivation to quit smoking and offered NRT to improve comfort and safety while in the hospital. Patients who chose to make a quit attempt received a free 2-week supply of NRT at discharge and 6 months of free follow-up counseling by interactive voice response (IVR) telephone technology that included (a) prerecorded advice keyed to individual patient needs, (b) a warm-transfer option to speak with a live TTS (later dropped), and (c) a collection of patient smoking and cessation treatment measures.15
Statistical Analysis
We used an intent-to-treat (ITT) framework for the analysis, which considers everyone eligible for the treatment to be in the treatment group. The approach ignores treatment nonacceptance, nonadherence, protocol deviations, withdrawal from treatment, and cessation outcomes,
Readmission rates and LOS were estimated by using a “difference-in-differences” model, comparing outcomes between smokers before versus after the introduction of the cessation treatment program with nonsmokers before versus after program introduction. The difference-in-differences method looks at the difference pre-and-post in the exposed group (smokers) and unexposed group (nonsmokers). Subtracting the difference between the 2 groups gives an estimate of the policy effect controlling for background trends.19 The smoking cessation treatment effect on readmission is measured by the coefficient on the interaction term between the smoking variable and an indicator that the program is operational. The coefficient is the “difference-in-differences.”
Other control variables include demographic factors (gender, age, race), hospitalization payer (Medicare, Medicaid, commercial), and the service line of the admission. We also included a severity of illness variable from the APR-DRG Grouper (3M, Maplewood, Minnesota)20 and the number of days spent in the intensive care unit. For the readmission model, we included LOS as a control variable, because individuals with longer LOS had a better opportunity to access the intervention.
For readmissions, the model was estimated by using a probit model, predicting the effect of each of the intervention variables and the control variables on the marginal probability of a readmission. Because patients can appear in both the pre- and postyears, clustered standard errors were used, which correct for the lack of independence from multiple observations from the same individual.21 For LOS, a truncated negative binomial model was used. The negative binomial model is a specification for count models with a mass of observations plus a long right tail. The truncation is because zero and negative values for LOS are not possible. The dependent variable represents the number of days the individual was hospitalized. For both models, the reported coefficients represent the marginal effect of the independent variable on the dependent variable. This was calculated using the “margins” command in Stata version 13 (StataCorp LLC, College Station, Texas).
RESULTS
In the probit analysis, the smoking cessation intervention (Smoker*post intervention) showed no significant effect on the probability of readmission (Table 2). The coefficient is positive (β = 0.008) and statistically insignificant (P = 0.36). This indicates that we failed to reject the null hypothesis that there was not a systematic difference in the probability of readmission because of the smoking cessation intervention. Other significant variables generally had the expected relationship with readmission rates. Smokers were 1.6% less likely to be readmitted than nonsmokers (P = 0.01), controlling for other factors.
The program effect on smoker LOS was statistically insignificant (β = 0.008; P = 0.36). Smokers overall had a shorter LOS than nonsmokers (β = −0.090; P = 0.01), controlling for other factors. Overall LOS was longer postintervention (β = 0.047; P < 0.01). The control variables generally had the same relationship for the LOS model as for the readmission model.
DISCUSSION
This study investigated the effect of an inpatient smoking cessation program, based on a successful Canadian model, on inpatient readmission rates and LOS. The program showed no effect on 30-day readmission rates or LOS. We see several potential explanations for the absence of a detectable impact.
First, the ITT approach reflected real-world implementation of smoking cessation services. The ITT approach adopts the hospital’s perspective because the hospital will assess overall effectiveness without regard to programmatic limitations. The intervention group for this analysis included individuals who were offered but declined treatment, individuals who accepted treatment but failed to quit smoking, and individuals who both accepted treatment and quit smoking. If the analysis had focused only on the latter group, an effect would have been more likely to be found. Further analysis of the subset of patients who accepted the intervention and quit smoking is warranted. Nevertheless, hospitals cannot expect all inpatient smokers, or even a majority, to embrace an offer of cessation treatment. This also emphasizes the challenges hospitals will face in offering tobacco cessation programs to smokers in a timely way. Reasons for patients not receiving orders varied but included issues with weekend admissions.
Second, the timeframe of the analysis is limited to the inpatient stay (for LOS) and 30 days (for readmission). A longer-term analysis might have found an effect. However, we examined this from the hospital perspective. For the hospital, LOS is a key cost driver; thus, reductions in LOS would create a strong financial incentive for hospitals to implement smoking cessation programs. Similarly, reducing readmissions is now a priority for hospitals because of new Medicare rules that penalize hospitals for readmissions. Thus, the 2 outcomes we examined are outcomes that are financially important to hospitals.
There are several limitations to our analysis. First, the difference-in-differences model assumes that in the absence of treatment, the average change in the dependent variables would have been the same for both the treatment and control groups, also known as the parallel trends assumption. Specification tests showed this assumption was met for the preperiod. Second, our study relies on electronic health record data to identify smokers. However, 93% of individuals who were identified as smokers confirmed their smoking status upon interview. Finally, we looked at all categories of inpatient admissions. Improvement in LOS and short-term readmission rates may be limited to patients admitted for specific conditions, such as cardiovascular and respiratory conditions.
There are a number of plausible reasons for our null finding. First, the “dose” of intervention may have been too weak; that is, the number of smokers who were offered the treatment, accepted the treatment, and adhered to the treatment may have been too low, leading to too few smokers quitting smoking and, thus, no effect of the intervention on our outcomes. This follows directly from the ITT design of the study.23 This suggests that hospitals who wish to adopt smoking cessation programs need to focus on ensuring a timely offering of treatment and encouragement of uptake by smokers.
A second reason for the null finding may have been the short duration for the NRT, which was only offered for 2 weeks. Research suggests that use of NRT for less than 4 weeks is associated with a reduced likelihood of smoking cessation.24 However, a review of the literature concludes that the duration of NRT is less important than the dosage and the combination of NRT with other forms of smoking cessation therapy.25 It is important to note that this study used NRT; other treatments such as Chantix could have different effectiveness.26,27 Further research on different treatment approaches, including longer duration of NRT, would be appropriate.
Disclosure
The authors have no competing interests or conflicts to report. The study was supported by contract number 15FLA68717 from the Colorado Department of Public Health and Environment.
1. Taylor DH Jr, Hasselblad V, Henley SJ, Thun MJ, Sloan FA. Benefits of Smoking Cessation for Longevity. Am J Public Health. 2002;92(6):990-996. PubMed
2. Weitkunat R, Coggins CRE, Sponsiello-Wang Z, Kallischnigg G, Dempsey R. Assessment of Cigarette Smoking in Epidemiologic Studies. Tobacco Research. 2013;25(7).
3. Fiore MC, Jaen CR, Baker TB, et al. Treating Tobacco Use and Dependence: 2008 Update. Rockville (MD): US Department of Health and Human Services. 2008. https://www.ncbi.nlm.nih.gov/books/NBK63952/.
4. Rigotti, NA, Clair, C, Munafo, MR, et al., Interventions for smoking cessation in hospitalised patients. Cochrane Database Syst Rev. 2012(5): CD001837. PubMed
5. Ladapo JA, Jaffer FA, Weinstein MC, Froelicher ES. Projected cost-effectiveness of smoking cessation interventions in patients hospitalized with myocardial infarction. Arch Intern Med. 2011;171:39-45. PubMed
6. Mohiuddin SM, Mooss AN, Hunter CB, Grollmes TL, Cloutier DA, Hilleman DE. Intensive smoking cessation intervention reduces mortality in high-risk smokers with cardiovascular disease. Chest. 2007;131:446-452. PubMed
7. Mullen K, Coyle D, Manuel D, et al. Economic evaluation of a hospital-initiated intervention for smokers with chronic disease, in Ontario, Canada. Tob Control. 2015;24(5):489-496. PubMed
8. Lightwood JM, Glantz SA. Short-term economic and health benefits of smoking cessation: myocardial infarction and stroke. Circulation. 1997;96(4):1089-1096. PubMed
9. Reid RD, Mullen KA, Slovinec D’Angelo ME, et al. Smoking cessation for hospitalized smokers: an evaluation of the “Ottawa Model.” Nicotine Tob Res. 2010;12:11-18. PubMed
10. Reid RD, Pipe AL, Quinlan B. Promoting smoking cessation during hospitalization for coronary artery disease. Can J Cardiol. 2006;22:775-780. PubMed
11. Krumholz H, Cohen B, Tsevat J, Pasternak R, Weinstein M. Cost-effectiveness of a smoking cessation program after myocardial infarction. J Am Coll Cardiol. 1993;22(6):1697-1702. PubMed
12. Curry S, Grothaus L, McAfee T, Pabiniak C. Use and Cost Effectiveness of Smoking-Cessation Services under Four Insurance Plans in a Health Maintenance Organization. N Engl J Med. 1998;339:673-679. PubMed
12. Fiscella K, Franks P. Cost-effectiveness of the transdermal nicotine patch as an adjunct to physicians’ smoking cessation counseling. JAMA. 1996;275:1247-1251. PubMed
13. CEPEG. Independent Evaluation: University of Colorado Hospital’s Smoking Cessation Treatment Program, preliminary report. Aurora: Colorado School of Public Health; 2014.
15. Cooper S, Pray S. Independent Evaluation: Hospital systems change to improve inpatient tobacco dependence treatment final results. Aurora: Colorado School of Public Health; June 2015.
16. Gupta S. Intention-to-treat concept: A review. Perspect Clin Res. 2011;2(3):109-112. DOI:10.4103/2229-3485.83221 PubMed
17. Fisher LD, Dixon DO, Herson J, Frankowski RK, Hearron MS, Peace KE. Intention to treat in clinical trials. In: Peace KE, editor. Statistical Issues in Drug Research and Development. New York: Marcel Dekker; 1990:331-350
18. Newell DJ. Intention-to-treat analysis: implications for quantitative and qualitative research. Int J Epidemiol. 1992;21(5):837-841. PubMed
19. Dimick JB, Ryan AM. Methods for Evaluating Changes in Health Care Policy: The Difference-in-Differences Approach. JAMA. 2014;312(22):2401-2402. DOI:10.1001/jama.2014.16153 PubMed
20. Averill R, Goldfield N, Steinbeck B, et al. Development of the All Patient Refined DRGs (APR-DRGs). Maplewood: 3M Health Information Systems; 1997. Report 8-9. PubMed
21. Cameron A, Miller D. A Practitioner’s Guide to Cluster-Robust Inference. J Hum Resour. 2015;50(2):317-372.
22. Cooper S, Pray S. Independent Evaluation: Hospital systems change to improve inpatient tobacco dependence treatment Final Results. Aurora: Colorado School of Public Health; April 2015.
23. Gupta SK. Intention-to-treat concept: A review. Perspect Clin Res. 2011;2(3):109-112. DOI:10.4103/2229-3485.83221. PubMed
24. Zhang B, Cohen J, Bondy S. Duration of Nicotine Replacement Therapy Use and Smoking Cessation: A Population-Based Longitudinal Study. Am J Epidemiol. 2015;181(7):513-520. PubMed
25. Silagy C, Lancaster T, Stead L, Mant D, Fowler G. Nicotine replacement therapy for smoking cessation. Cochrane Database Syst Rev. 2004;3:CD000146. DOI:10.1002/14651858.CD000146 PubMed
26. C, , . Nicotine receptor partial agonists for smoking cessation. Cochrane Database Syst Rev. 2008;3:CD006103. DOI:10.1002/14651858.CD006103.pub3. PubMed
27. Hurt R, Sachs D, Glover E, et al. A Comparison of Sustained-Release Bupropion and Placebo for Smoking Cessation. N Engl J Med. 1997;337:1195-1202. PubMed
© 2017 Society of Hospital Medicine
Treatment Trends and Outcomes in Healthcare-Associated Pneumonia
Bacterial pneumonia remains an important cause of morbidity and mortality in the United States, and is the 8th leading cause of death with 55,227 deaths among adults annually.1 In 2005, the American Thoracic Society (ATS) and the Infectious Diseases Society of America (IDSA) collaborated to update guidelines for hospital-acquired pneumonia (HAP), ventilator-associated pneumonia, and healthcare-associated pneumonia (HCAP).2 This broad document outlines an evidence-based approach to diagnostic testing and antibiotic management based on the epidemiology and risk factors for these conditions. The guideline specifies the following criteria for HCAP: hospitalization in the past 90 days, residence in a skilled nursing facility (SNF), home infusion therapy, hemodialysis, home wound care, family members with multidrug resistant organisms (MDRO), and immunosuppressive diseases or medications, with the presumption that these patients are more likely to be harboring MDRO and should thus be treated empirically with broad-spectrum antibiotic therapy. Prior studies have shown that patients with HCAP have a more severe illness, are more likely to have MDRO, are more likely to be inadequately treated, and are at a higher risk for mortality than patients with community-acquired pneumonia (CAP).3,4
These guidelines are controversial, especially in regard to the recommendations to empirically treat broadly with 2 antibiotics targeting Pseudomonas species, whether patients with HCAP merit broader spectrum coverage than patients with CAP, and whether the criteria for defining HCAP are adequate to predict which patients are harboring MDRO. It has subsequently been proposed that HCAP is more related to CAP than to HAP, and a recent update to the guideline removed recommendations for treatment of HCAP and will be placing HCAP into the guidelines for CAP instead.5 We sought to investigate the degree of uptake of the ATS and IDSA guideline recommendations by physicians over time, and whether this led to a change in outcomes among patients who met the criteria for HCAP.
METHODS
Setting and Patients
We identified patients discharged between July 1, 2007, and November 30, 2011, from 488 US hospitals that participated in the Premier database (Premier Inc., Charlotte, North Carolina), an inpatient database developed for measuring quality and healthcare utilization. The database is frequently used for healthcare research and has been described previously.6 Member hospitals are in all regions of the US and are generally reflective of US hospitals. This database contains multiple data elements, including sociodemographic information, International Classification of Diseases, 9th Revision-Clinical Modification (ICD-9-CM) diagnosis and procedure codes, hospital and physician information, source of admission, and discharge status. It also includes a date-stamped log of all billed items and services, including diagnostic tests, medications, and other treatments. Because the data do not contain identifiable information, the institutional review board at our medical center determined that this study did not constitute human subjects research.
We included all patients aged ≥18 years with a principal diagnosis of pneumonia or with a secondary diagnosis of pneumonia paired with a principal diagnosis of respiratory failure, acute respiratory distress syndrome, respiratory arrest, sepsis, or influenza. Patients were excluded if they were transferred to or from another acute care institution, had a length of stay of 1 day or less, had cystic fibrosis, did not have a chest radiograph, or did not receive antibiotics within 48 hours of admission.
For each patient, we extracted age, gender, principal diagnosis, comorbidities, and the specialty of the attending physician. Comorbidities were identified from ICD-9-CM secondary diagnosis codes and Diagnosis Related Groups by using Healthcare Cost and Utilization Project Comorbidity Software, version 3.1, based on the work of Elixhauser (Agency for Healthcare Research and Quality, Rockville, Maryland).7 In order to ensure that patients had HCAP, we required the presence of ≥1 HCAP criteria, including hospitalization in the past 90 days, hemodialysis, admission from an SNF, or immune suppression (which was derived from either a secondary diagnosis for neutropenia, hematological malignancy, organ transplant, acquired immunodeficiency virus, or receiving immunosuppressant drugs or corticosteroids [equivalent to ≥20 mg/day of prednisone]).
Definitions of Guideline-Concordant and Discordant Antibiotic Therapy
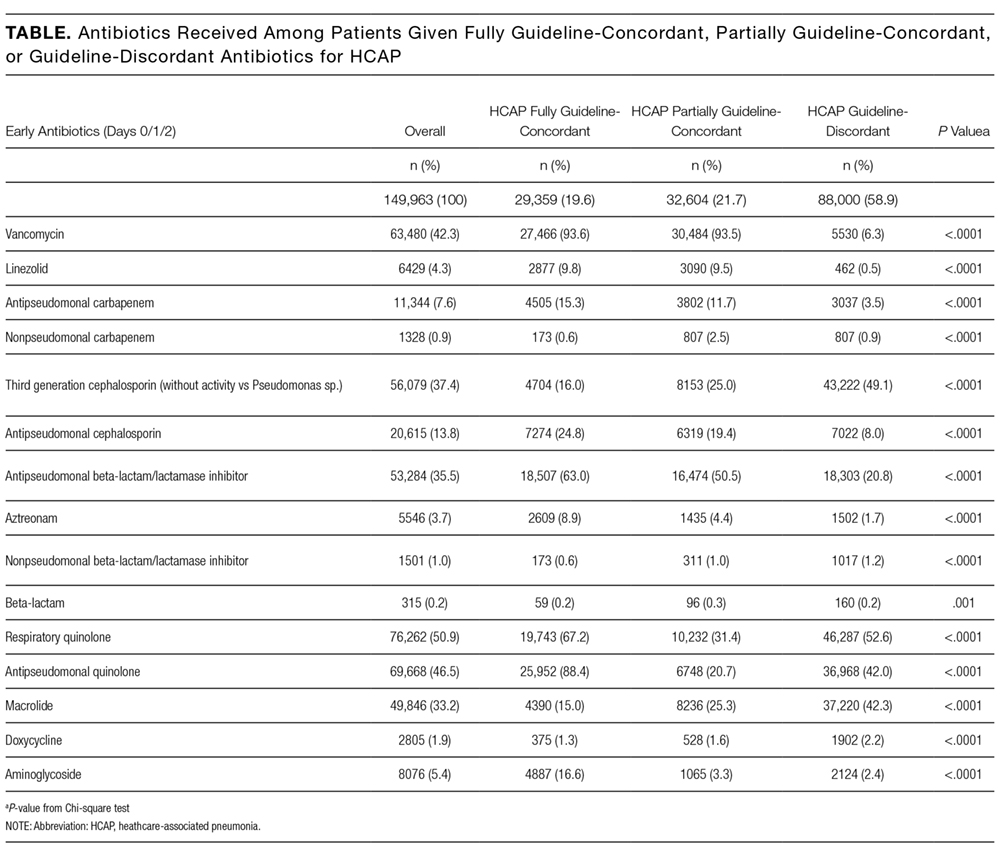
The ATS and IDSA guidelines recommended the following antibiotic combinations for HCAP: an antipseudomonal cephalosporin or carbapenem or a beta-lactam/lactamase inhibitor, plus an antipseudomonal quinolone or aminoglycoside, plus an antibiotic with activity versus methicillin resistant Staphylococcus aureus (MRSA), such as vancomycin or linezolid. Based on these guidelines, we defined the receipt of fully guideline-concordant antibiotics as 2 recommended antibiotics for Pseudomonas species plus 1 for MRSA administered by the second day of admission. Partially guideline-concordant antibiotics were defined as 1 recommended antibiotic for Pseudomonas species plus 1 for MRSA by the second day of hospitalization. Guideline-discordant antibiotics were defined as all other combinations.
Statistical Analysis
Descriptive statistics on patient characteristics are presented as frequency, proportions for categorical factors, and median with interquartile range (IQR) for continuous variables for the full cohort and by treatment group, defined as fully or partially guideline-concordant antibiotic therapy or discordant therapy. Hospital rates of fully guideline-concordant treatment are presented overall and by hospital characteristics. The association of hospital characteristics with rates of fully guideline-concordant therapy were assessed by using 1-way analysis of variance tests.
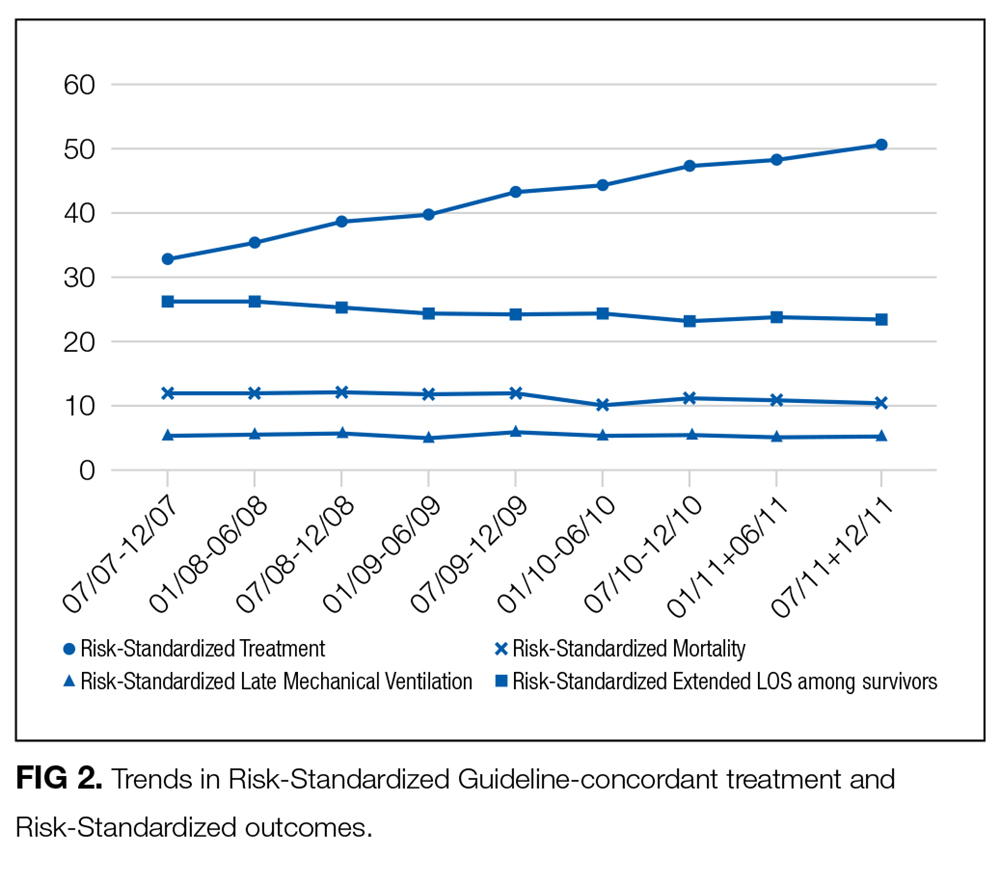
To assess trends across hospitals for the association between the use of guideline-concordant therapy and mortality, progression to respiratory failure as measured by the late initiation of invasive mechanical ventilation (day 3 or later), and the length of stay among survivors, we divided the 4.5-year study period into 9 intervals of 6 months each; 292 hospitals that submitted data for all 9 time points were examined in this analysis. Based on the distribution of length of stay in the first time period, we created an indicator variable for extended length of stay with length of stay at or above the 75th percentile, defined as extended. For each hospital at each 6-month interval, we then computed risk-standardized guideline-concordant treatment (RS-treatment) rates and risk-standardized in-hospital outcome rates similar to methods used by the Centers for Medicare and Medicaid Services for public reporting.8 For each hospital at each time interval, we estimated a predicted rate of guideline-concordant treatment as the sum of predicted probabilities of guideline-concordant treatment from patient factors and the random intercept for the hospital in which they were admitted. We then calculated the expected rate of guideline-concordant treatment as the sum of expected probabilities of treatment received from patient factors only. RS-treatment was then calculated as the ratio of predicted to expected rates multiplied by the overall unadjusted mean treatment rate from all patients.9 We repeated the same modeling strategy to calculate risk-standardized outcome (RS-outcome) rates for each hospital across all time points. All models were adjusted for patient demographics and comorbidities. Similar models using administrative data have moderate discrimination for mortality.10
We then fit mixed-effects linear models with random hospital intercept and slope across time for the RS-treatment and outcome rates, respectively. From these models, we estimated the mean slope for RS-treatment and for RS-outcome over time. In addition, we estimated a slope or trend over time for each hospital for treatment and for outcome and evaluated the correlation between the treatment and outcome trends.
All analyses were performed using the Statistical Analysis System version 9.4 (SAS Institute Inc., Cary, NC) and STATA release 13 (StataCorp, LLC, College Station, Texas).
RESULTS

DISCUSSION
In this large, retrospective cohort study, we found that there was a substantial gap between the empiric antibiotics recommended by the ATS and IDSA guidelines and the empiric antibiotics that patients actually received. Over the study period, we saw an increased adherence to guidelines, in spite of growing evidence that HCAP risk factors do not adequately predict which patients are at risk for infection with an MDRO.11 We used this change in antibiotic prescribing behavior over time to determine if there was a clinical impact on patient outcomes and found that at the hospital level, there were no improvements in mortality, excess length of stay, or progression to respiratory failure despite a doubling in guideline-concordant antibiotic use.
At least 2 other large studies have assessed the association between guideline-concordant therapy and outcomes in HCAP.12,13 Both found that guideline-concordant therapy was associated with increased mortality, despite propensity matching. Both were conducted at the individual patient level by using administrative data, and results were likely affected by unmeasured clinical confounders, with sicker patients being more likely to receive guideline-concordant therapy. Our focus on the outcomes at the hospital level avoids this selection bias because the overall severity of illness of patients at any given hospital would not be expected to change over the study period, while physician uptake of antibiotic prescribing guidelines would be expected to increase over time. Determining the correlation between increases in guideline adherence and changes in patient outcome may offer a better assessment of the impact of guideline adherence. In this regard, our results are similar to those achieved by 1 quality improvement collaborative that was aimed at increasing guideline concordant therapy in ICUs. Despite an increase in guideline concordance from 33% to 47% of patients, they found no change in overall mortality.14
There were several limitations to our study. We did not have access to microbiologic data, so we were unable to determine which patients had MDRO infection or determine antibiotic-pathogen matching. However, the treating physicians in our study population presumably did not have access to this data at the time of treatment either because the time period we examined was within the first 48 hours of hospitalization, the interval during which cultures are incubating and the patients are being treated empirically. In addition, there may have been HCAP patients that we failed to identify, such as patients who were admitted in the past 90 days to a hospital that does not submit data to Premier. However, it is unlikely that prescribing for such patients should differ systematically from what we observed. While the database draws from 488 hospitals nationwide, it is possible that practices may be different at facilities that are not contained within the Premier database, such as Veterans Administration Hospitals. Similarly, we did not have readings for chest x-rays; hence, there could be some patients in the dataset who did not have pneumonia. However, we tried to overcome this by including only those patients with a principal diagnosis of pneumonia or sepsis with a secondary pneumonia diagnosis, a chest x-ray, and antibiotics administered within the first 48 hours of admission.
There are likely several reasons why so few HCAP patients in our study received guideline-concordant antibiotics. A lack of knowledge about the ATS and IDSA guidelines may have impacted the physicians in our study population. El-Solh et al.15 surveyed physicians about the ATS-IDSA guidelines 4 years after publication and found that only 45% were familiar with the document. We found that the rate of prescribing at least partially guideline-concordant antibiotics rose steadily over time, supporting the idea that the newness of the guidelines was 1 barrier. Additionally, prior studies have shown that many physicians may not agree with or choose to follow guidelines, with only 20% of physicians indicating that guidelines have a major impact on their clinical decision making,16 and the majority do not choose HCAP guideline-concordant antibiotics when tested.17 Alternatively, clinicians may not follow the guidelines because of a belief that the HCAP criteria do not adequately indicate patients who are at risk for MDRO. Previous studies have demonstrated the relative inability of HCAP risk factors to predict patients who harbor MDRO18 and suggest that better tools such as clinical scoring systems, which include not only the traditional HCAP risk factors but also prior exposure to antibiotics, prior culture data, and a cumulative assessment of both intrinsic and extrinsic factors, could more accurately predict MDRO and lead to a more judicious use of broad-spectrum antimicrobial agents.19-25 Indeed, these collective findings have led the authors of the recently updated guidelines to remove HCAP as a clinical entity from the hospital-acquired or ventilator-associated pneumonia guidelines and place them instead in the upcoming updated guidelines on the management of CAP.5 Of these 3 explanations, the lack of familiarity fits best with our observation that guideline-concordant therapy increased steadily over time with no evidence of reaching a plateau. Ironically, as consensus was building that HCAP is a poor marker for MDROs, routine empiric treatment with vancomycin and piperacillin-tazobactam (“vanco and zosyn”) have become routine in many hospitals. Additional studies are needed to know if this trend has stabilized or reversed.
CONCLUSIONS
In conclusion, clinicians in our large, nationally representative sample treated the majority of HCAP patients as though they had CAP. Although there was an increase in the administration of guideline-concordant therapy over time, this increase was not associated with improved outcomes. This study supports the growing consensus that HCAP criteria do not accurately predict which patients benefit from broad-spectrum antibiotics for pneumonia, and most patients fare well with antibiotics targeting common community-acquired organisms.
Disclosure
This work was supported by grant # R01HS018723 from the Agency for Healthcare Research and Quality. Dr. Lagu is also supported by the National Heart, Lung, and Blood Institute of the National Institutes of Health under award number K01HL114745. Dr. Lindenauer is supported by grant K24HL132008 from the National Heart, Lung, and Blood Institute. The funding agency had no role in the data acquisition, analysis, or manuscript preparation for this study. Drs. Haessler and Rothberg had full access to all the data in the study and take responsibility for the integrity of the data and the accuracy of the data analysis. Drs. Haessler, Lagu, Lindenauer, Skiest, Zilberberg, Higgins, and Rothberg conceived of the study and analyzed and interpreted the data. Dr. Lindenauer acquired the data. Dr. Pekow and Ms. Priya carried out the statistical analyses. Dr. Haessler drafted the manuscript. All authors critically reviewed the manuscript for accuracy and integrity. All authors certify no potential conflicts of interest. Preliminary results from this study were presented in oral and poster format at IDWeek in 2012 and 2013.
1. Kochanek KD, Murphy SL, Xu JQ, Tejada-Vera B. Deaths: Final data for 2014. National vital statistics reports; vol 65 no 4. Hyattsville, MD: National Center for Health Statistics. 2016. PubMed
2. American Thoracic Society, Infectious Diseases Society of America. Guidelines for the Management of Adults with Hospital-acquired, Ventilator-associated, and Healthcare-associated Pneumonia. Am J Respir Crit Care Med. 2005;171(4):388-416. PubMed
3. Zilberberg MD, Shorr A. Healthcare-associated pneumonia: the state of the evidence to date. Curr Opin Pulm Med. 2011;17(3):142-147. PubMed
4. Kollef MK, Shorr A, Tabak YP, Gupta V, Liu LZ, Johannes RS. Epidemiology and Outcomes of Health-care-associated pneumonia. Chest. 2005;128(6):3854-3862. PubMed
5. Kalil AC, Metersky ML, Klompas M, et al. Management of Adults With Hospital-acquired and Ventilator-associated Pneumonia: 2016 Clinical Practice Guidelines by the Infectious Diseases Society of America and the American Thoracic Society. Clin Infect Dis. 2016;63(5):575-582. PubMed
6. Lindenauer PK, Pekow PS, Lahti MC, Lee Y, Benjamin EM, Rothberg MB. Association of corticosteroid dose and route of administration with risk of treatment failure in acute exacerbation of chronic obstructive pulmonary disease. JAMA. 2010;303(23):2359-2367. PubMed
7. Elixhauser A, Steiner C, Harris DR, Coffey RM. Comorbidity measures for use with administrative data. Med Care. 1998;36(1):8-27. PubMed
8. Centers for Medicare & Medicaid Services. Frequently asked questions (FAQs): Implementation and maintenance of CMS mortality measures for AMI & HF. 2007. https://www.cms.gov/Medicare/Quality-Initiatives-Patient-Assessment-Instruments/HospitalQualityInits/downloads/HospitalMortalityAboutAMI_HF.pdf. Accessed November 1, 2016.
9. Normand SL, Shahian DM. Statistical and Clinical Aspects of Hospital Outcomes Profiling. Stat Sci. 2007;22(2):206-226.
10. Rothberg MB, Pekow PS, Priya A, et al. Using highly detailed administrative data to predict pneumonia mortality. PLoS One. 2014;9(1):e87382. PubMed
11. Jones BE, Jones MM, Huttner B, et al. Trends in antibiotic use and nosocomial pathogens in hospitalized veterans with pneumonia at 128 medical centers, 2006-2010. Clin Infect Dis. 2015;61(9):1403-1410. PubMed
12. Attridge RT, Frei CR, Restrepo MI, et al. Guideline-concordant therapy and outcomes in healthcare-associated pneumonia. Eur Respir J. 2011;38(4):878-887. PubMed
13. Rothberg MB, Zilberberg MD, Pekow PS, et al. Association of Guideline-based Antimicrobial Therapy and Outcomes in Healthcare-Associated Pneumonia. J Antimicrob Chemother. 2015;70(5):1573-1579. PubMed
14. Kett DH, Cano E, Quartin AA, et al. Improving Medicine through Pathway Assessment of Critical Therapy of Hospital-Acquired Pneumonia (IMPACT-HAP) Investigators. Implementation of guidelines for management of possible multidrug-resistant pneumonia in intensive care: an observational, multicentre cohort study. Lancet Infect Dis. 2011;11(3):181-189. PubMed
15. El-Solh AA, Alhajhusain A, Saliba RG, Drinka P. Physicians’ Attitudes Toward Guidelines for the Treatment of Hospitalized Nursing-Home -Acquired Pneumonia. J Am Med Dir Assoc. 2011;12(4):270-276. PubMed
16. Tunis S, Hayward R, Wilson M, et al. Internists’ Attitudes about Clinical Practice Guidelines. Ann Intern Med. 1994;120(11):956-963. PubMed
17. Seymann GB, Di Francesco L, Sharpe B, et al. The HCAP Gap: Differences between Self-Reported Practice Patterns and Published Guidelines for Health Care-Associated Pneumonia. Clin Infect Dis. 2009;49(12):1868-1874. PubMed
18. Chalmers JD, Rother C, Salih W, Ewig S. Healthcare associated pneumonia does not accurately identify potentially resistant pathogens: a systematic review and meta-analysis. Clin Infect Dis. 2014;58(3):330-339. PubMed
19. Shorr A, Zilberberg MD, Reichley R, et al. Validation of a Clinical Score for Assessing the Risk of Resistant Pathogens in Patients with Pneumonia Presenting to the Emergency Department. Clin Infect Dis. 2012;54(2):193-198. PubMed
20. Aliberti S, Pasquale MD, Zanaboni AM, et al. Stratifying Risk Factors for Multidrug-Resistant Pathogens in Hospitalized Patients Coming from the Community with Pneumonia. Clin Infect Dis. 2012;54(4):470-478. PubMed
21. Schreiber MP, Chan CM, Shorr AF. Resistant Pathogens in Nonnosocomial Pneumonia and Respiratory Failure: Is it Time to Refine the Definition of Health-care-Associated Pneumonia? Chest. 2010;137(6):1283-1288. PubMed
22. Madaras-Kelly KJ, Remington RE, Fan VS, Sloan KL. Predicting antibiotic resistance to community-acquired pneumonia antibiotics in culture-positive patients with healthcare-associated pneumonia. J Hosp Med. 2012;7(3):195-202. PubMed
23. Shindo Y, Ito R, Kobayashi D, et al. Risk factors for drug-resistant pathogens in community-acquired and healthcare-associated pneumonia. Am J Respir Crit Care Med. 2013;188(8):985-995. PubMed
24. Metersky ML, Frei CR, Mortensen EM. Predictors of Pseudomonas and methicillin-resistant Staphylococcus aureus in hospitalized patients with healthcare-associated pneumonia. Respirology. 2016;21(1):157-163. PubMed
25. Webb BJ, Dascomb K, Stenehjem E, Dean N. Predicting risk of drug-resistant organisms in pneumonia: moving beyond the HCAP model. Respir Med. 2015;109(1):1-10. PubMed
Bacterial pneumonia remains an important cause of morbidity and mortality in the United States, and is the 8th leading cause of death with 55,227 deaths among adults annually.1 In 2005, the American Thoracic Society (ATS) and the Infectious Diseases Society of America (IDSA) collaborated to update guidelines for hospital-acquired pneumonia (HAP), ventilator-associated pneumonia, and healthcare-associated pneumonia (HCAP).2 This broad document outlines an evidence-based approach to diagnostic testing and antibiotic management based on the epidemiology and risk factors for these conditions. The guideline specifies the following criteria for HCAP: hospitalization in the past 90 days, residence in a skilled nursing facility (SNF), home infusion therapy, hemodialysis, home wound care, family members with multidrug resistant organisms (MDRO), and immunosuppressive diseases or medications, with the presumption that these patients are more likely to be harboring MDRO and should thus be treated empirically with broad-spectrum antibiotic therapy. Prior studies have shown that patients with HCAP have a more severe illness, are more likely to have MDRO, are more likely to be inadequately treated, and are at a higher risk for mortality than patients with community-acquired pneumonia (CAP).3,4
These guidelines are controversial, especially in regard to the recommendations to empirically treat broadly with 2 antibiotics targeting Pseudomonas species, whether patients with HCAP merit broader spectrum coverage than patients with CAP, and whether the criteria for defining HCAP are adequate to predict which patients are harboring MDRO. It has subsequently been proposed that HCAP is more related to CAP than to HAP, and a recent update to the guideline removed recommendations for treatment of HCAP and will be placing HCAP into the guidelines for CAP instead.5 We sought to investigate the degree of uptake of the ATS and IDSA guideline recommendations by physicians over time, and whether this led to a change in outcomes among patients who met the criteria for HCAP.
METHODS
Setting and Patients
We identified patients discharged between July 1, 2007, and November 30, 2011, from 488 US hospitals that participated in the Premier database (Premier Inc., Charlotte, North Carolina), an inpatient database developed for measuring quality and healthcare utilization. The database is frequently used for healthcare research and has been described previously.6 Member hospitals are in all regions of the US and are generally reflective of US hospitals. This database contains multiple data elements, including sociodemographic information, International Classification of Diseases, 9th Revision-Clinical Modification (ICD-9-CM) diagnosis and procedure codes, hospital and physician information, source of admission, and discharge status. It also includes a date-stamped log of all billed items and services, including diagnostic tests, medications, and other treatments. Because the data do not contain identifiable information, the institutional review board at our medical center determined that this study did not constitute human subjects research.
We included all patients aged ≥18 years with a principal diagnosis of pneumonia or with a secondary diagnosis of pneumonia paired with a principal diagnosis of respiratory failure, acute respiratory distress syndrome, respiratory arrest, sepsis, or influenza. Patients were excluded if they were transferred to or from another acute care institution, had a length of stay of 1 day or less, had cystic fibrosis, did not have a chest radiograph, or did not receive antibiotics within 48 hours of admission.
For each patient, we extracted age, gender, principal diagnosis, comorbidities, and the specialty of the attending physician. Comorbidities were identified from ICD-9-CM secondary diagnosis codes and Diagnosis Related Groups by using Healthcare Cost and Utilization Project Comorbidity Software, version 3.1, based on the work of Elixhauser (Agency for Healthcare Research and Quality, Rockville, Maryland).7 In order to ensure that patients had HCAP, we required the presence of ≥1 HCAP criteria, including hospitalization in the past 90 days, hemodialysis, admission from an SNF, or immune suppression (which was derived from either a secondary diagnosis for neutropenia, hematological malignancy, organ transplant, acquired immunodeficiency virus, or receiving immunosuppressant drugs or corticosteroids [equivalent to ≥20 mg/day of prednisone]).
Definitions of Guideline-Concordant and Discordant Antibiotic Therapy
The ATS and IDSA guidelines recommended the following antibiotic combinations for HCAP: an antipseudomonal cephalosporin or carbapenem or a beta-lactam/lactamase inhibitor, plus an antipseudomonal quinolone or aminoglycoside, plus an antibiotic with activity versus methicillin resistant Staphylococcus aureus (MRSA), such as vancomycin or linezolid. Based on these guidelines, we defined the receipt of fully guideline-concordant antibiotics as 2 recommended antibiotics for Pseudomonas species plus 1 for MRSA administered by the second day of admission. Partially guideline-concordant antibiotics were defined as 1 recommended antibiotic for Pseudomonas species plus 1 for MRSA by the second day of hospitalization. Guideline-discordant antibiotics were defined as all other combinations.
Statistical Analysis
Descriptive statistics on patient characteristics are presented as frequency, proportions for categorical factors, and median with interquartile range (IQR) for continuous variables for the full cohort and by treatment group, defined as fully or partially guideline-concordant antibiotic therapy or discordant therapy. Hospital rates of fully guideline-concordant treatment are presented overall and by hospital characteristics. The association of hospital characteristics with rates of fully guideline-concordant therapy were assessed by using 1-way analysis of variance tests.
To assess trends across hospitals for the association between the use of guideline-concordant therapy and mortality, progression to respiratory failure as measured by the late initiation of invasive mechanical ventilation (day 3 or later), and the length of stay among survivors, we divided the 4.5-year study period into 9 intervals of 6 months each; 292 hospitals that submitted data for all 9 time points were examined in this analysis. Based on the distribution of length of stay in the first time period, we created an indicator variable for extended length of stay with length of stay at or above the 75th percentile, defined as extended. For each hospital at each 6-month interval, we then computed risk-standardized guideline-concordant treatment (RS-treatment) rates and risk-standardized in-hospital outcome rates similar to methods used by the Centers for Medicare and Medicaid Services for public reporting.8 For each hospital at each time interval, we estimated a predicted rate of guideline-concordant treatment as the sum of predicted probabilities of guideline-concordant treatment from patient factors and the random intercept for the hospital in which they were admitted. We then calculated the expected rate of guideline-concordant treatment as the sum of expected probabilities of treatment received from patient factors only. RS-treatment was then calculated as the ratio of predicted to expected rates multiplied by the overall unadjusted mean treatment rate from all patients.9 We repeated the same modeling strategy to calculate risk-standardized outcome (RS-outcome) rates for each hospital across all time points. All models were adjusted for patient demographics and comorbidities. Similar models using administrative data have moderate discrimination for mortality.10
We then fit mixed-effects linear models with random hospital intercept and slope across time for the RS-treatment and outcome rates, respectively. From these models, we estimated the mean slope for RS-treatment and for RS-outcome over time. In addition, we estimated a slope or trend over time for each hospital for treatment and for outcome and evaluated the correlation between the treatment and outcome trends.
All analyses were performed using the Statistical Analysis System version 9.4 (SAS Institute Inc., Cary, NC) and STATA release 13 (StataCorp, LLC, College Station, Texas).
RESULTS
DISCUSSION
In this large, retrospective cohort study, we found that there was a substantial gap between the empiric antibiotics recommended by the ATS and IDSA guidelines and the empiric antibiotics that patients actually received. Over the study period, we saw an increased adherence to guidelines, in spite of growing evidence that HCAP risk factors do not adequately predict which patients are at risk for infection with an MDRO.11 We used this change in antibiotic prescribing behavior over time to determine if there was a clinical impact on patient outcomes and found that at the hospital level, there were no improvements in mortality, excess length of stay, or progression to respiratory failure despite a doubling in guideline-concordant antibiotic use.
At least 2 other large studies have assessed the association between guideline-concordant therapy and outcomes in HCAP.12,13 Both found that guideline-concordant therapy was associated with increased mortality, despite propensity matching. Both were conducted at the individual patient level by using administrative data, and results were likely affected by unmeasured clinical confounders, with sicker patients being more likely to receive guideline-concordant therapy. Our focus on the outcomes at the hospital level avoids this selection bias because the overall severity of illness of patients at any given hospital would not be expected to change over the study period, while physician uptake of antibiotic prescribing guidelines would be expected to increase over time. Determining the correlation between increases in guideline adherence and changes in patient outcome may offer a better assessment of the impact of guideline adherence. In this regard, our results are similar to those achieved by 1 quality improvement collaborative that was aimed at increasing guideline concordant therapy in ICUs. Despite an increase in guideline concordance from 33% to 47% of patients, they found no change in overall mortality.14
There were several limitations to our study. We did not have access to microbiologic data, so we were unable to determine which patients had MDRO infection or determine antibiotic-pathogen matching. However, the treating physicians in our study population presumably did not have access to this data at the time of treatment either because the time period we examined was within the first 48 hours of hospitalization, the interval during which cultures are incubating and the patients are being treated empirically. In addition, there may have been HCAP patients that we failed to identify, such as patients who were admitted in the past 90 days to a hospital that does not submit data to Premier. However, it is unlikely that prescribing for such patients should differ systematically from what we observed. While the database draws from 488 hospitals nationwide, it is possible that practices may be different at facilities that are not contained within the Premier database, such as Veterans Administration Hospitals. Similarly, we did not have readings for chest x-rays; hence, there could be some patients in the dataset who did not have pneumonia. However, we tried to overcome this by including only those patients with a principal diagnosis of pneumonia or sepsis with a secondary pneumonia diagnosis, a chest x-ray, and antibiotics administered within the first 48 hours of admission.
There are likely several reasons why so few HCAP patients in our study received guideline-concordant antibiotics. A lack of knowledge about the ATS and IDSA guidelines may have impacted the physicians in our study population. El-Solh et al.15 surveyed physicians about the ATS-IDSA guidelines 4 years after publication and found that only 45% were familiar with the document. We found that the rate of prescribing at least partially guideline-concordant antibiotics rose steadily over time, supporting the idea that the newness of the guidelines was 1 barrier. Additionally, prior studies have shown that many physicians may not agree with or choose to follow guidelines, with only 20% of physicians indicating that guidelines have a major impact on their clinical decision making,16 and the majority do not choose HCAP guideline-concordant antibiotics when tested.17 Alternatively, clinicians may not follow the guidelines because of a belief that the HCAP criteria do not adequately indicate patients who are at risk for MDRO. Previous studies have demonstrated the relative inability of HCAP risk factors to predict patients who harbor MDRO18 and suggest that better tools such as clinical scoring systems, which include not only the traditional HCAP risk factors but also prior exposure to antibiotics, prior culture data, and a cumulative assessment of both intrinsic and extrinsic factors, could more accurately predict MDRO and lead to a more judicious use of broad-spectrum antimicrobial agents.19-25 Indeed, these collective findings have led the authors of the recently updated guidelines to remove HCAP as a clinical entity from the hospital-acquired or ventilator-associated pneumonia guidelines and place them instead in the upcoming updated guidelines on the management of CAP.5 Of these 3 explanations, the lack of familiarity fits best with our observation that guideline-concordant therapy increased steadily over time with no evidence of reaching a plateau. Ironically, as consensus was building that HCAP is a poor marker for MDROs, routine empiric treatment with vancomycin and piperacillin-tazobactam (“vanco and zosyn”) have become routine in many hospitals. Additional studies are needed to know if this trend has stabilized or reversed.
CONCLUSIONS
In conclusion, clinicians in our large, nationally representative sample treated the majority of HCAP patients as though they had CAP. Although there was an increase in the administration of guideline-concordant therapy over time, this increase was not associated with improved outcomes. This study supports the growing consensus that HCAP criteria do not accurately predict which patients benefit from broad-spectrum antibiotics for pneumonia, and most patients fare well with antibiotics targeting common community-acquired organisms.
Disclosure
This work was supported by grant # R01HS018723 from the Agency for Healthcare Research and Quality. Dr. Lagu is also supported by the National Heart, Lung, and Blood Institute of the National Institutes of Health under award number K01HL114745. Dr. Lindenauer is supported by grant K24HL132008 from the National Heart, Lung, and Blood Institute. The funding agency had no role in the data acquisition, analysis, or manuscript preparation for this study. Drs. Haessler and Rothberg had full access to all the data in the study and take responsibility for the integrity of the data and the accuracy of the data analysis. Drs. Haessler, Lagu, Lindenauer, Skiest, Zilberberg, Higgins, and Rothberg conceived of the study and analyzed and interpreted the data. Dr. Lindenauer acquired the data. Dr. Pekow and Ms. Priya carried out the statistical analyses. Dr. Haessler drafted the manuscript. All authors critically reviewed the manuscript for accuracy and integrity. All authors certify no potential conflicts of interest. Preliminary results from this study were presented in oral and poster format at IDWeek in 2012 and 2013.
1. Kochanek KD, Murphy SL, Xu JQ, Tejada-Vera B. Deaths: Final data for 2014. National vital statistics reports; vol 65 no 4. Hyattsville, MD: National Center for Health Statistics. 2016. PubMed
2. American Thoracic Society, Infectious Diseases Society of America. Guidelines for the Management of Adults with Hospital-acquired, Ventilator-associated, and Healthcare-associated Pneumonia. Am J Respir Crit Care Med. 2005;171(4):388-416. PubMed
3. Zilberberg MD, Shorr A. Healthcare-associated pneumonia: the state of the evidence to date. Curr Opin Pulm Med. 2011;17(3):142-147. PubMed
4. Kollef MK, Shorr A, Tabak YP, Gupta V, Liu LZ, Johannes RS. Epidemiology and Outcomes of Health-care-associated pneumonia. Chest. 2005;128(6):3854-3862. PubMed
5. Kalil AC, Metersky ML, Klompas M, et al. Management of Adults With Hospital-acquired and Ventilator-associated Pneumonia: 2016 Clinical Practice Guidelines by the Infectious Diseases Society of America and the American Thoracic Society. Clin Infect Dis. 2016;63(5):575-582. PubMed
6. Lindenauer PK, Pekow PS, Lahti MC, Lee Y, Benjamin EM, Rothberg MB. Association of corticosteroid dose and route of administration with risk of treatment failure in acute exacerbation of chronic obstructive pulmonary disease. JAMA. 2010;303(23):2359-2367. PubMed
7. Elixhauser A, Steiner C, Harris DR, Coffey RM. Comorbidity measures for use with administrative data. Med Care. 1998;36(1):8-27. PubMed
8. Centers for Medicare & Medicaid Services. Frequently asked questions (FAQs): Implementation and maintenance of CMS mortality measures for AMI & HF. 2007. https://www.cms.gov/Medicare/Quality-Initiatives-Patient-Assessment-Instruments/HospitalQualityInits/downloads/HospitalMortalityAboutAMI_HF.pdf. Accessed November 1, 2016.
9. Normand SL, Shahian DM. Statistical and Clinical Aspects of Hospital Outcomes Profiling. Stat Sci. 2007;22(2):206-226.
10. Rothberg MB, Pekow PS, Priya A, et al. Using highly detailed administrative data to predict pneumonia mortality. PLoS One. 2014;9(1):e87382. PubMed
11. Jones BE, Jones MM, Huttner B, et al. Trends in antibiotic use and nosocomial pathogens in hospitalized veterans with pneumonia at 128 medical centers, 2006-2010. Clin Infect Dis. 2015;61(9):1403-1410. PubMed
12. Attridge RT, Frei CR, Restrepo MI, et al. Guideline-concordant therapy and outcomes in healthcare-associated pneumonia. Eur Respir J. 2011;38(4):878-887. PubMed
13. Rothberg MB, Zilberberg MD, Pekow PS, et al. Association of Guideline-based Antimicrobial Therapy and Outcomes in Healthcare-Associated Pneumonia. J Antimicrob Chemother. 2015;70(5):1573-1579. PubMed
14. Kett DH, Cano E, Quartin AA, et al. Improving Medicine through Pathway Assessment of Critical Therapy of Hospital-Acquired Pneumonia (IMPACT-HAP) Investigators. Implementation of guidelines for management of possible multidrug-resistant pneumonia in intensive care: an observational, multicentre cohort study. Lancet Infect Dis. 2011;11(3):181-189. PubMed
15. El-Solh AA, Alhajhusain A, Saliba RG, Drinka P. Physicians’ Attitudes Toward Guidelines for the Treatment of Hospitalized Nursing-Home -Acquired Pneumonia. J Am Med Dir Assoc. 2011;12(4):270-276. PubMed
16. Tunis S, Hayward R, Wilson M, et al. Internists’ Attitudes about Clinical Practice Guidelines. Ann Intern Med. 1994;120(11):956-963. PubMed
17. Seymann GB, Di Francesco L, Sharpe B, et al. The HCAP Gap: Differences between Self-Reported Practice Patterns and Published Guidelines for Health Care-Associated Pneumonia. Clin Infect Dis. 2009;49(12):1868-1874. PubMed
18. Chalmers JD, Rother C, Salih W, Ewig S. Healthcare associated pneumonia does not accurately identify potentially resistant pathogens: a systematic review and meta-analysis. Clin Infect Dis. 2014;58(3):330-339. PubMed
19. Shorr A, Zilberberg MD, Reichley R, et al. Validation of a Clinical Score for Assessing the Risk of Resistant Pathogens in Patients with Pneumonia Presenting to the Emergency Department. Clin Infect Dis. 2012;54(2):193-198. PubMed
20. Aliberti S, Pasquale MD, Zanaboni AM, et al. Stratifying Risk Factors for Multidrug-Resistant Pathogens in Hospitalized Patients Coming from the Community with Pneumonia. Clin Infect Dis. 2012;54(4):470-478. PubMed
21. Schreiber MP, Chan CM, Shorr AF. Resistant Pathogens in Nonnosocomial Pneumonia and Respiratory Failure: Is it Time to Refine the Definition of Health-care-Associated Pneumonia? Chest. 2010;137(6):1283-1288. PubMed
22. Madaras-Kelly KJ, Remington RE, Fan VS, Sloan KL. Predicting antibiotic resistance to community-acquired pneumonia antibiotics in culture-positive patients with healthcare-associated pneumonia. J Hosp Med. 2012;7(3):195-202. PubMed
23. Shindo Y, Ito R, Kobayashi D, et al. Risk factors for drug-resistant pathogens in community-acquired and healthcare-associated pneumonia. Am J Respir Crit Care Med. 2013;188(8):985-995. PubMed
24. Metersky ML, Frei CR, Mortensen EM. Predictors of Pseudomonas and methicillin-resistant Staphylococcus aureus in hospitalized patients with healthcare-associated pneumonia. Respirology. 2016;21(1):157-163. PubMed
25. Webb BJ, Dascomb K, Stenehjem E, Dean N. Predicting risk of drug-resistant organisms in pneumonia: moving beyond the HCAP model. Respir Med. 2015;109(1):1-10. PubMed
© 2017 Society of Hospital Medicine
Visual Tools to Increase Patient Satisfaction: Just Decorative or Actually Effective?
Patient satisfaction and the ability to effectively communicate with hospitalized patients has become a core tenet to providing high-quality healthcare. Over the past few decades, medicine has gradually moved away from many paternalistic practices, and the profession has sought to engage patients as true partners in their own care. It is in this setting that effective communication has risen to be a key factor in the patient and provider relationship. It has also become a closely monitored quality metric tied to financial incentives and penalties. Most importantly, it has been well documented that failures in communication are a frequent cause of adverse events that compromise the ability of healthcare providers to provide safe and effective care.1 It is in this climate that healthcare systems have worked to implement solutions designed to engage patients and their families to improve their healthcare experience. These solutions vary from low to high tech and include patient whiteboards, provider face cards, and web-based patient portals. Despite the numerous innovative solutions being implemented by hospitalists, studies supporting their effectiveness are few. There continues to be limited evidence on the value of these practices and whether they positively impact the desired outcomes of patient satisfaction and engagement.
In this issue of the Journal of Hospital Medicine, Goyal et al.2 performed a systematic review to evaluate whether the use of bedside visual tools for hospitalized medical patients impacts patient satisfaction, patient–provider communication, and provider identification and understanding of roles. The authors were able to identify 16 studies that evaluated the use of these tools, which included provider face cards and whiteboards. The majority of the studies reviewed showed a positive effect on provider identification, understanding providers’ role, and patient satisfaction. The authors found that of the tools evaluated, whiteboards and picture-based techniques were the most effective visually based interventions. However, the authors also highlighted the difficulty in identifying 1 optimal approach to the use of these tools as a result of variations in content, format, and outcome measurement.
Variation in the use of visual tools to improve communication and patient satisfaction limits the ability to identify and evaluate the most effective approaches to their use. Without a streamlined approach, these tools may not produce the desired effect of improving patient and provider communication, which is essential in providing high-quality inpatient care and ensuring patient satisfaction. It has been documented that many patients cannot even identify their providers in the hospital setting, which limits the ability of the patient to be fully engaged in decisions made about their care.3 In addition, substantial portions of hospitalized patients do not understand their plan of care.4 Patients’ understanding of their plan of care is essential for patients to provide informed consent for hospital treatments and better prepare them to assume their own care after discharge, with a full understanding of their diagnosis.5 It has become increasingly clear that healthcare providers must incorporate effective approaches in their daily workflow to address these findings.
Aside from patient satisfaction and engagement, the effect communications failures have on patient safety have been evaluated and recognized. From the National Academy of Medicine’s report emphasizing patient-centered care to the addition of patients’ active engagement in their care as a National Patient Safety Goal by The Joint Commission, the medical field has committed to a continued focus in this area.5,6
The business case can also be made for identifying effective tools that improve patient satisfaction and patient–provider communication. Private and public health insurance providers have incentivized high performance in these areas and have now begun to levy penalties for underperformers. As patients’ level of satisfaction and engagement continue to be assessed via patient surveys, healthcare systems continue to search for effective practices to improve performance in patient-perceived provider communication. Patients’ reporting of their assessment of nurse and physician communication through questions such as “How often did nurses/doctors explain things in a way you could understand?” will continue to be a moving target requiring future studies of effective interventions
Are visual aids the effective tools that hospitals need to improve communication and patient satisfaction, or are they merely decorations? The whiteboard provides an excellent example of the effectiveness that can be seen with the use of these tools. Used to improve patient-provider communication in medicine, the whiteboard has become almost ubiquitous in patient hospital rooms.7 It is now an expected aspect of hospital design and has inspired the development of higher tech solutions, including patient tablets and media walls. It is known to enhance the interaction for both the provider and patient and facilitate the exchange of complicated medical information within an anxiety prone environment in a simple manner by using short phrases or drawings.6 Yet, there is a scarcity of strong evidence to support the most effective approach to the use of whiteboards in improving patient satisfaction and communication. Standardizing how the whiteboard is used during the patient interaction will allow for the effectiveness of this tool to be realized and evaluated and prevent it from becoming another ornamental fixture on our hospital walls.
The systematic review by Goyal et al.2 is a necessary step in the evaluation of common communication tools for their effectiveness and ability to improve patient satisfaction. This exhaustive review of key studies in this area is an excellent addition to the current literature, which has a paucity of extensive evaluations of these approaches. It provides an important signal that visual tools are more than decorative and can be effective when a streamlined approach is utilized. It highlights the importance of identifying effective best practices for the use of these tools that can be studied empirically and subsequently disseminated for widespread use. Continued work is necessary to fill this void and to enable healthcare professionals to provide the highest level of safe, effective, and engaging care that our patients deserve.
Disclosure
The authors have no conflicts of interest.
1. Sutcliffe KM, Lewton E, Rosenthal MM. Communication failures: an insidious contributor to medical mishaps. Acad Med. 2004;79(2):186-194. PubMed
2. Goyal AA, Komalpreet T, Mann J, Townsend W, Flanders SA, Chopra V. Do bedside visual tools improve patient and caregiver satisfaction? A systematic review of the literature. J Hosp Med. 2017. In press. PubMed
3. Makaryus AN, Friedman EA. Does your patient know your name? An approach to enhancing patients’ awareness of their caretaker’s name. J Healthc Qual. 2005;27(4):53-56. PubMed
4. O’Leary KJ, Kulkarni N, Landler MP, et al. Hospitalized patients’ understanding of their plan of care. Mayo Clin Proc.2010;85(1):47-52. PubMed
5. Committee on Quality of Health Care in America. Crossing the Quality Chasm: A New Health System for the 21st Century. [Internet] Washington, DC: National Academy Press; 2001. 8 p. http://www.nationalacademies.org/hmd/~/media/Files/Report%20Files/2001/Crossing-the-Quality-Chasm/Quality%20Chasm%202001%20%20report%20brief.pdf. Accessed on
6. The Joint Commission’s National Patient Safety Goals 2007 for Hospital/Critical Access Hospital. http://www.jointcommission.org/PatientSafety/NationalPatientSafetyGoals/07_hap_cah_npsgs.htm. Accessed on July 2017.
7. Singh S, Fletcher KE, Pandl GJ, et al. It’s the writing on the wall: whiteboards improve inpatient satisfaction with provider communication. Am J Med Qual.2011;26(2):127-131. PubMed
Patient satisfaction and the ability to effectively communicate with hospitalized patients has become a core tenet to providing high-quality healthcare. Over the past few decades, medicine has gradually moved away from many paternalistic practices, and the profession has sought to engage patients as true partners in their own care. It is in this setting that effective communication has risen to be a key factor in the patient and provider relationship. It has also become a closely monitored quality metric tied to financial incentives and penalties. Most importantly, it has been well documented that failures in communication are a frequent cause of adverse events that compromise the ability of healthcare providers to provide safe and effective care.1 It is in this climate that healthcare systems have worked to implement solutions designed to engage patients and their families to improve their healthcare experience. These solutions vary from low to high tech and include patient whiteboards, provider face cards, and web-based patient portals. Despite the numerous innovative solutions being implemented by hospitalists, studies supporting their effectiveness are few. There continues to be limited evidence on the value of these practices and whether they positively impact the desired outcomes of patient satisfaction and engagement.
In this issue of the Journal of Hospital Medicine, Goyal et al.2 performed a systematic review to evaluate whether the use of bedside visual tools for hospitalized medical patients impacts patient satisfaction, patient–provider communication, and provider identification and understanding of roles. The authors were able to identify 16 studies that evaluated the use of these tools, which included provider face cards and whiteboards. The majority of the studies reviewed showed a positive effect on provider identification, understanding providers’ role, and patient satisfaction. The authors found that of the tools evaluated, whiteboards and picture-based techniques were the most effective visually based interventions. However, the authors also highlighted the difficulty in identifying 1 optimal approach to the use of these tools as a result of variations in content, format, and outcome measurement.
Variation in the use of visual tools to improve communication and patient satisfaction limits the ability to identify and evaluate the most effective approaches to their use. Without a streamlined approach, these tools may not produce the desired effect of improving patient and provider communication, which is essential in providing high-quality inpatient care and ensuring patient satisfaction. It has been documented that many patients cannot even identify their providers in the hospital setting, which limits the ability of the patient to be fully engaged in decisions made about their care.3 In addition, substantial portions of hospitalized patients do not understand their plan of care.4 Patients’ understanding of their plan of care is essential for patients to provide informed consent for hospital treatments and better prepare them to assume their own care after discharge, with a full understanding of their diagnosis.5 It has become increasingly clear that healthcare providers must incorporate effective approaches in their daily workflow to address these findings.
Aside from patient satisfaction and engagement, the effect communications failures have on patient safety have been evaluated and recognized. From the National Academy of Medicine’s report emphasizing patient-centered care to the addition of patients’ active engagement in their care as a National Patient Safety Goal by The Joint Commission, the medical field has committed to a continued focus in this area.5,6
The business case can also be made for identifying effective tools that improve patient satisfaction and patient–provider communication. Private and public health insurance providers have incentivized high performance in these areas and have now begun to levy penalties for underperformers. As patients’ level of satisfaction and engagement continue to be assessed via patient surveys, healthcare systems continue to search for effective practices to improve performance in patient-perceived provider communication. Patients’ reporting of their assessment of nurse and physician communication through questions such as “How often did nurses/doctors explain things in a way you could understand?” will continue to be a moving target requiring future studies of effective interventions
Are visual aids the effective tools that hospitals need to improve communication and patient satisfaction, or are they merely decorations? The whiteboard provides an excellent example of the effectiveness that can be seen with the use of these tools. Used to improve patient-provider communication in medicine, the whiteboard has become almost ubiquitous in patient hospital rooms.7 It is now an expected aspect of hospital design and has inspired the development of higher tech solutions, including patient tablets and media walls. It is known to enhance the interaction for both the provider and patient and facilitate the exchange of complicated medical information within an anxiety prone environment in a simple manner by using short phrases or drawings.6 Yet, there is a scarcity of strong evidence to support the most effective approach to the use of whiteboards in improving patient satisfaction and communication. Standardizing how the whiteboard is used during the patient interaction will allow for the effectiveness of this tool to be realized and evaluated and prevent it from becoming another ornamental fixture on our hospital walls.
The systematic review by Goyal et al.2 is a necessary step in the evaluation of common communication tools for their effectiveness and ability to improve patient satisfaction. This exhaustive review of key studies in this area is an excellent addition to the current literature, which has a paucity of extensive evaluations of these approaches. It provides an important signal that visual tools are more than decorative and can be effective when a streamlined approach is utilized. It highlights the importance of identifying effective best practices for the use of these tools that can be studied empirically and subsequently disseminated for widespread use. Continued work is necessary to fill this void and to enable healthcare professionals to provide the highest level of safe, effective, and engaging care that our patients deserve.
Disclosure
The authors have no conflicts of interest.
1. Sutcliffe KM, Lewton E, Rosenthal MM. Communication failures: an insidious contributor to medical mishaps. Acad Med. 2004;79(2):186-194. PubMed
2. Goyal AA, Komalpreet T, Mann J, Townsend W, Flanders SA, Chopra V. Do bedside visual tools improve patient and caregiver satisfaction? A systematic review of the literature. J Hosp Med. 2017. In press. PubMed
3. Makaryus AN, Friedman EA. Does your patient know your name? An approach to enhancing patients’ awareness of their caretaker’s name. J Healthc Qual. 2005;27(4):53-56. PubMed
4. O’Leary KJ, Kulkarni N, Landler MP, et al. Hospitalized patients’ understanding of their plan of care. Mayo Clin Proc.2010;85(1):47-52. PubMed
5. Committee on Quality of Health Care in America. Crossing the Quality Chasm: A New Health System for the 21st Century. [Internet] Washington, DC: National Academy Press; 2001. 8 p. http://www.nationalacademies.org/hmd/~/media/Files/Report%20Files/2001/Crossing-the-Quality-Chasm/Quality%20Chasm%202001%20%20report%20brief.pdf. Accessed on
6. The Joint Commission’s National Patient Safety Goals 2007 for Hospital/Critical Access Hospital. http://www.jointcommission.org/PatientSafety/NationalPatientSafetyGoals/07_hap_cah_npsgs.htm. Accessed on July 2017.
7. Singh S, Fletcher KE, Pandl GJ, et al. It’s the writing on the wall: whiteboards improve inpatient satisfaction with provider communication. Am J Med Qual.2011;26(2):127-131. PubMed
© 2017 Society of Hospital Medicine
MACRA Monday: Colorectal cancer screening
If you haven’t started reporting quality data for the Merit-Based Incentive Payment System (MIPS), there’s still time to avoid a 4% cut to your Medicare payments.
Under the Pick Your Pace approach being offered this year, the Centers for Medicare & Medicaid Services allows clinicians to test the system by reporting on one quality measure for one patient through paper-based claims. Be sure to append a Quality Data Code (QDC) to the claim form for care provided up to Dec. 31, 2017, in order to avoid a penalty in payment year 2019.
Consider this measure:
The video associated with this article is no longer available on this site. Please view all of our videos on the MDedge YouTube channel
Measure #113: Colorectal Cancer Screening
This measure is aimed at capturing the percentage of patients aged 50-75 years who were screened for colorectal cancer.
What you need to do: The patient should be screened for colorectal cancer during calendar 2017 (or specified alternative time frame) using an appropriate test. Document the screening and results in the medical record.
Appropriate tests include:
- Fecal occult blood test (FOBT) during the performance period (calendar 2017).
- Flexible sigmoidoscopy during the performance period or the 4 years prior.
- Colonoscopy during the performance period or the 9 years prior.
- Computed tomography (CT) colonography during the performance period or the 4 years prior.
- Fecal immunochemical DNA test (FIT-DNA) during the measurement period or the 2 years prior.
Eligible cases include patients aged 50-75 years of age on the date of the encounter and a patient encounter during the performance period. Applicable codes include (CPT or HCPCS): 99201, 99202, 99203, 99204, 99205, 99212, 99213, 99214, 99215, 99341, 99342, 99343, 99344, 99345, 99347, 99348, 99349, 99350, G0402, G0438, G0439.
To get credit under MIPS, be sure to include a QDC that shows that you successfully performed the measure or had a good reason for not doing so. For instance, CPT II 3017F indicates that colorectal cancer screening results were documented and reviewed. The exclusion code G9711 should be used for patients with a diagnosis or past history of total colectomy or colorectal cancer.
CMS has a full list measures available for claims-based reporting at qpp.cms.gov. The American Medical Association has also created a step-by-step guide for reporting on one quality measure.
Certain clinicians are exempt from reporting and do not face a penalty under MIPS:
- Those who enrolled in Medicare for the first time during a performance period.
- Those who have Medicare Part B allowed charges of $30,000 or less.
- Those who have 100 or fewer Medicare Part B patients.
- Those who are significantly participating in an Advanced Alternative Payment Model (APM).
FDA Boxed Warning Updates
The FDA’s MedWatch program safety labeling changes for boxed warnings are compiled quarterly for drugs and therapeutic biologics where important changes have been made to the safety information. These and other label changes are searchable in the Drug Safety Labeling Changes (SLC) database, where data are available to the public in downloadable and searchable formats. Boxed warnings are ordinarily used to highlight either adverse reactions so serious in proportion to the potential bene t from the drug that it is essential that it be considered in assessing the risks and bene ts of using the drug; or serious adverse reactions that can be prevented/reduced in frequency or severity by appropriate use of the drug; or FDA approved the drug with restrictions to ensure safe use because FDA concluded that the drug can be safely used only if distribution or use is restricted.
PRANDIMET (METFORMIN HYDROCHLORIDE; REPAGLINIDE):
- Edited boxed warning April 7, 2017
Post-marketing cases of metforminassociated lactic acidosis have resulted in death, hypothermia, hypotension, and resistant bradyarrhythmias. The onset of metformin-associated lactic acidosis is often subtle, accompanied only by nonspecific symptoms such as malaise, myalgias, respiratory distress, somnolence, and abdominal pain. Metformin-associated lactic acidosis was characterized by elevated blood lactate levels (> 5 mmol/Liter), anion gap acidosis (without evidence of ketonuria or ketonemia), an increased lactate/pyruvate ratio; and metformin plasma levels generally > 5 mcg/mL.
Risk factors for metformin-associated lactic acidosis include renal impairment, concomitant use of certain drugs (eg, carbonic anyhydrase inhibitors such as topiramate), age 65 years old or greater, having a radiological study with contrast, surgery and other procedures, hypoxic states (eg, acute congestive heart failure), excessive alcohol intake, and hepatic impairment.
Steps to reduce the risk of and manage metformin-associated lactic acidosis in these high risk groups are provided in the full prescribing information.
If metformin-associated lactic acidosis is suspected, immediately discontinue PrandiMet and institute general supportive measures in a hospital setting. Prompt hemodialysis is recommended.
AVANDAMET (METFORMIN HYDROCHLORIDE; ROSIGLITAZONE MALEATE):
- Edited and updated boxed warning April 7, 2017
WARNING: CONGESTIVE HEART FAILURE and LACTIC ACIDOSIS
Rosiglitazone maleate: CONGESTIVE HEART FAILURE
- Thiazolidinediones, including rosiglitazone, cause or exacerbate congestive heart failure in some patients. After initiation of Avandamet, and after dose increases, observe patients carefully for signs and symptoms of heart failure (including excessive, rapid weight gain, dyspnea, and/or edema). If these signs and symptoms develop, the heart failure should be managed according to current standards of care. Furthermore, discontinuation or dose reduction of Avandamet must be considered.
- Avandamet is not recommended in patients with symptomatic heart failure. Initiation of Avandamet in patients with established NYHA Class III or IV heart failure is contraindicated.
Metformin hydrochloride: LACTIC ACIDOSIS
- Postmarketing cases of metformin-associated lactic acidosis have resulted in death, hypothermia, hypotension, and resistant bradyarrhythmias. The onset of metformin- associated lactic acidosis often subtle, accompanied only by nonspeci c symptoms such as malaise, myalgias, respiratory distress, somnolence, and abdominal pain. Metformin- associated lactic acidosis was characterized by elevated blood lactate levels (> 5 mmol/L), anion gap acidosis (without evidence of ketonuria or ketonemia), and increased lactate/pyruvate ratio; and metformin plasma levels generally > 5 mcg/mL.
- Risk factors for metformin-associated lactic acidosis include renal impairment, concomitant use of certain drugs (eg, carbonic anhydrase
inhibitors such as topiramate), age 65 years old or greater, having a radiological study with contrast, surgery and other procedures, hypoxic states (eg, acute congestive heart failure), excessive alcohol intake, and hepatic impairment. Steps to reduce the risk of and manage metformin-associated lactic acidosis in these highrisk groups are provided in the Full Prescribing Information. - If metformin-associated lactic acidosis is suspected, immediately discontinue Avandamet and institute general supportive measures in a hospital setting. Prompt hemodialysis is recommended.
OPTIRAY (160, 240, 300, 320, AND 350):
- Edited boxed warning April 7, 2017
PLR conversion, addition of the following:
WARNING: NOT FOR INTRATHECAL USE
Inadvertent intrathecal administration may cause death, convulsions, cerebral hemorrhage, coma, paralysis, arachnoiditis, acute renal failure, cardiac arrest, seizures, rhabdomyolysis, hyperthermia, and brain edema.
GLUMETZA (METFORMIN HYDROCHLORIDE):
- Edited boxed warning April 7, 2017
LACTIC ACIDOSIS
Postmarketing cases of metformin-associated lactic acidosis have resulted in death, hypothermia, hypotension, and resistant bradyarrhythmias. The onset of metforminassociated lactic acidosis is often subtle, accompanied only by nonspeci c symptoms such as malaise, myalgias, respiratory distress, somnolence, and abdominal pain. Metformin-associated lactic acidosis was characterized by elevated blood lactate levels (> 5 mmol/Liter), anion gap acidosis (without evidence of ketonuria or ketonemia), an increased lactate/pyruvate ratio, and metformin plasma levels generally > 5 mcg/mL.
Risk factors for metformin-associated lactic acidosis include renal impairment, concomitant use of certain drugs (eg, carbonic anhydrase inhibitors such as topiramate), age 65 years old or greater, having a radiological study with contrast, surgery and other procedures, hypoxic states (eg, acute congestive heart failure), excessive alcohol intake, and hepatic impairment.
Steps to reduce the risk of and manage metformin-associated lactic acidosis in these high risk groups are provided in the full prescribing information.
If metformin-associated lactic acidosis is suspected, immediately discontinue Glumetza and institute general supportive measures in a hospital setting. Prompt hemodialysis is recommended.
SABRIL (VIGABATRIN):
- Edited boxed warning April 7, 2017
WARNING: PERMANENT VISION LOSS
Because of the risk of permanent vision loss, Sabril is available only through a restricted program under a Risk Evaluation and Mitigation Strategy (REMS) called the Vigabatrin REMS Program. Further information is available at www.vigabatrinREMS.com or 1-866-244-8175.
VALCYTE (VALGANCICLOVIR HYDROCHLORIDE):
- Edited boxed warning April 7, 2017
WARNING: HEMATOLOGIC TOXICITY, IMPAIRMENT OF FERTILITY, FETAL TOXICITY, MUTAGENESIS AND CARCINOGENESIS
- Hematologic Toxicity: Severe leukopenia, neutropenia, anemia, thrombocytopenia, pancytopenia, and bone marrow failure including aplastic anemia have been reported in patients treated with Valcyte.
- Impairment of Fertility: Based on animal data, Valcyte may cause temporary or permanent inhibition of spermatogenesis in males and suppression of fertility in females.

JZP-110 improves excessive sleepiness in OSA patients
The selective dopamine norepinephrine reuptake inhibitor JZP-110 was effective at treating excessive sleepiness in obstructive sleep apnea patients, according to an abstract on a study to be presented at the CHEST annual meeting.
In a 12-week, phase 3 trial, adult patients with obstructive sleep apnea were randomized to receive placebo or once-daily JZP-110 at dosages of 37.5 mg, 75 mg, 150 mg, or 300 mg. A total of 459 patients were included in the final analysis.
At the end of the trial, the mean reduction from baseline on a maintenance of wakefulness test was 0.2 minutes for patients in the placebo group, 4.7 minutes in the 37.5-mg group, 9.1 minutes in the 75-mg group, 11 minutes in the 150-mg group, and 13 minutes in the 300-mg group. Mean changes in Epworth Sleepiness Scale scores were –3.3 for patients in the placebo group, –5.1 in the 37.5-mg group, –5 in the 75-mg group, –7.7 in the 150-mg group, and –7.9 in the 300-mg group.
A significantly higher rate of patients in the 75-mg (72.4%), 150-mg (89.7%), and 300-mg (88.7%) groups improved on the Patient Global Impression of Change scale, compared with patients in the placebo (49.1%) and 37.5-mg (55.4%) groups.
Just under 68% of patients who received JZP-110 experienced at least one adverse event, compared with 47.9% of patients who received placebo. The most common adverse events were headache, nausea, decreased appetite, and anxiety. Six serious adverse events were reported over the study period, but none was related to JZP-110.
The study is scheduled to be presented on Sunday, Oct. 29, from 1:30 p.m. to 1:45 p.m. in Room 601A of the Toronto Convention Centre South Building as part of the “Obstructive Sleep Apnea: Insights & Management” session, which will run from 1:30 p.m. to 3 p.m.
FROM CHEST 2017
Sepsis response team does not improve mortality/organ dysfunction
A sepsis response team did not have a positive effect on mortality or organ dysfunction in septic patients, compared with standard treatment by a primary care team, according to a study abstract scheduled to be presented at CHEST 2017.

Compared with the primary care team, the sepsis team was more likely to intervene on patients with a quick Sepsis-Related Organ Failure Assessment score greater than 1 (33.8% vs. 22.8%), change or initiate antibiotics within 3 hours (64.6% vs. 37.2%), and obtain blood cultures on time (66.4% vs 45.2%). An additional difference between the two groups was that the sepsis team had better compliance with the 3-hour bundle (15.2% vs 8.4%).
Despite the sepsis team’s higher level of compliance with certain protocols, the combined outcome measure of mortality and organ dysfunction within 28 days was not significantly higher for patients treated by the sepsis team (11.3% vs. 9.8%; P = .6). In fact, there was at least one downside to being treated by the sepsis team, which was having a 14% longer hospital stay.
Chhaya Patel, MD, is scheduled to present the abstract on Sun., Oct. 29th, at 2:30-2:45 p.m. in Convention Center – 602B. This research is part of the Sepsis & Septic Shock session at the CHEST annual meeting, which will run from 1:30 to 3:00 p.m.
A sepsis response team did not have a positive effect on mortality or organ dysfunction in septic patients, compared with standard treatment by a primary care team, according to a study abstract scheduled to be presented at CHEST 2017.
Compared with the primary care team, the sepsis team was more likely to intervene on patients with a quick Sepsis-Related Organ Failure Assessment score greater than 1 (33.8% vs. 22.8%), change or initiate antibiotics within 3 hours (64.6% vs. 37.2%), and obtain blood cultures on time (66.4% vs 45.2%). An additional difference between the two groups was that the sepsis team had better compliance with the 3-hour bundle (15.2% vs 8.4%).
Despite the sepsis team’s higher level of compliance with certain protocols, the combined outcome measure of mortality and organ dysfunction within 28 days was not significantly higher for patients treated by the sepsis team (11.3% vs. 9.8%; P = .6). In fact, there was at least one downside to being treated by the sepsis team, which was having a 14% longer hospital stay.
Chhaya Patel, MD, is scheduled to present the abstract on Sun., Oct. 29th, at 2:30-2:45 p.m. in Convention Center – 602B. This research is part of the Sepsis & Septic Shock session at the CHEST annual meeting, which will run from 1:30 to 3:00 p.m.
FROM CHEST 2017
Robotic-assisted pulmonary lobectomy effective for large tumors
Robotic-assisted pulmonary lobectomy is a safe and effective way to remove large tumors in patients with non–small cell lung cancer (NSCLC), according to the abstract of a study scheduled to be presented at the CHEST annual meeting.
The study covers a retrospective analysis of 345 NSCLC patients with tumors who underwent robotic-assisted pulmonary lobectomy performed by one surgeon from September 2010 through August 2016. The participants were grouped into the following three cohorts: patients with tumors less than 5 cm in diameter, patients with tumors from 5 to 7 cm, and patients with tumors larger than 7 cm. The researchers excluded patients with pulmonary metastases or benign lesions from the study.
Patients with smaller tumors were more likely to have simple lobectomy or lobectomy plus wedge, while patients with larger tumors were more likely to require lobectomy with chest wall resection. Increased tumor size was also associated with increased intraoperative estimated blood loss, skin-to-skin operative time, hospital length of stay, and overall conversion to open lobectomy.
There was no association found between tumor size and increased overall intraoperative or postoperative complications, or in-hospital mortality.
Nirav Patel, MD, FCCP, of the Tampa Bay Sleep Center is scheduled to present his abstract on Sunday Oct. 29th, between 2:15 and 2:30 p.m. in Convention Center – 606. Dr. Patel’s research is part of the Cardiothoracic Surgery session, running from 1:30 p.m. to 3:00 p.m. at the CHEST annual meeting.
FROM CHEST 2017
Near-fatal asthma treated effectively by ECMO
Extracorporeal membrane oxygenation (ECMO) is an effective way to treat near fatal asthma, but physicians must remember the risk of complications, according to an abstract on a study scheduled to be presented at CHEST 2017.
The study covers a retrospective analysis of 371 children with asthma who were treated with ECMO; it used data collected by the Extracorporeal Life Support Organization registry from 1988 to 2016. The median age of the children in the study was 7.5 years; the participant group was 43% white and 39% black, as well as 56% male, according to the abstract, which is mentioned in the program for the CHEST annual meeting.
About 80% of children experienced at least one complication, with 20% experiencing three or more. Children who had three or more complications were significantly less likely to experience lung recovery.
Of the children who received VV cannulation, 90% experienced lung recovery, whereas only 69% of children who received VA cannulation recovered. (P less than .0001). VA cannulation was also associated with a higher risk of neurological complications, while those who received VV cannulation were significantly more likely to survive.
The abstract is scheduled to be presented on Sunday Oct. 29 from 2:30 p.m. to 2:45 p.m. in Room 603 of Toronto Convention Centre South Building as part of the Acute Lung Injury & Respiratory Failure session, which will run from 1:30 p.m. to 3 p.m.
New assay may aid diagnosis, treatment of DLBCL
A new assay may help improve the diagnosis and treatment of diffuse large B-cell lymphoma (DLBCL), according to researchers.
The gene expression signature assay can be used to classify subtypes of DLBCL and may enhance disease management by helping to match tumors with the appropriate targeted therapy.
Researchers described the assay in the Journal of Molecular Diagnostics.
The assay is a novel gene expression profiling DLBCL classifier based on reverse transcriptase multiplex ligation-dependent probe amplification (RT-MLPA).
It can simultaneously evaluate the expression of 21 markers, allowing differentiation of the 3 subtypes of DLBCL—germinal center B-cell-like (GCB), activated B-cell-like (ABC), and primary mediastinal B-cell lymphoma (PMBL)—as well as other individualized disease characteristics, such as Epstein-Barr infection status.
Researchers used the RT-MLPA assay to test 150 samples from DLBCL patients. Forty-two percent of the samples were the ABC subtype, 37% the GCB subtype, and 10% molecular PMBL. Eleven percent of the samples could not be classified.
Overall, the RT-MLPA assay correctly assigned 85.0% of the cases into the expected subtypes, compared to 78.8% of samples assigned via immunohistochemistry.
The RT-MLPA assay was also able to detect the MYD88 L265P mutation, one of the most common genetic abnormalities found in ABC DLBCLs. This information can influence treatment, since the presence of the mutation is thought to be predictive of ibrutinib sensitivity.
The researchers said RT-MLPA is a robust, efficient, rapid, and cost-effective alternative to current methods used in the clinic to establish the cell-of-origin classification of DLBCLs.
RT-MLPA requires only common laboratory equipment and can be applied to formalin-fixed, paraffin-embedded samples. Other types of diagnostic methods may not provide the level of detail needed and may also be limited by poor reproducibility and lack of adaptability to routine use in standard laboratories.
“Because we have provided the classification algorithms, other laboratories will be able to verify our results and adjust the procedures to suit their environment,” said study author Philippe Ruminy, PhD, of the Henri Becquerel Cancer Treatment Center, INSERM U1245 in Rouen, France.
“It is our hope that the assay we have developed, which addresses an important recommendation of the recent WHO classifications, will contribute to better management of these tumors and improved patient outcomes.” ![]()