User login
Height is independent predictor of VTE

Taller individuals have an increased risk of venous thromboembolism (VTE), according to research published in Circulation: Cardiovascular Genetics.
In a study of more than 2 million Swedish siblings, researchers found that height was an independent predictor of VTE, with the lowest VTE risk observed in the shortest participants.
The association between height and VTE was present in both men and women (all of whom had been pregnant).
“Height is not something we can do anything about,” noted study author Bengt Zöller, MD, PhD, of Lund University and Malmö University Hospital in Sweden.
“However, the height in the population has increased and continues increasing, which could be contributing to the fact that the incidence of thrombosis has increased.”
For this study, Dr Zöller and his colleagues analyzed 2 cohorts of Swedish individuals without a prior VTE.
There were 1,610,870 men who were followed from enrollment—1969 to 2010—until 2012.
And there were 1,093,342 women who were followed from their first pregnancy—1982 to 2012—until 2012.
The researchers identified sibling pairs so they could adjust their analysis for genetic and environmental factors that might impact VTE risk.
The team found the risk of VTE was 69% lower for the shortest women (<155 cm, <5′1″) than it was for the tallest women (≥185 cm, ≥6′).
The risk of VTE was 65% lower for the shortest men (<160 cm, <5′3″) than the tallest men (≥190 cm, ≥6′2″).
Dr Zöller said gravity may influence the association between height and VTE risk.
“It could just be that because taller individuals have longer leg veins, there is more surface area where problems can occur,” he said. “There is also more gravitational pressure in leg veins of taller persons that can increase the risk of blood flow slowing or temporarily stopping.”
It is worth noting that the researchers didn’t have access to data for childhood and parent lifestyle factors that might influence VTE risk, such as smoking, diet, and physical activity. In addition, the study consisted of Swedish people and may not be translatable to other populations.
Nevertheless, Dr Zöller said, “I think we should start to include height in [VTE] risk assessment, just as [we do] overweight, although formal studies are needed to determine exactly how height interacts with inherited blood disorders and other conditions.” ![]()
Anticoagulant prompts weight gain in mice

Researchers say they have discovered a novel role for heparin as a promoter of food intake and weight gain in animal models.
The team’s findings suggest heparin could be a potential target for drugs regulating appetite and weight control.
“In addition to its role as an anticoagulant, heparin, which is normally produced by the body, has been known to affect other biological functions,” said Yong Xu, MD, PhD, of Baylor College of Medicine in Houston, Texas.
“In this study, we are among the first groups to investigate heparin’s potential role in regulating the body’s energy balance.”
Dr Xu and his colleagues described this study in Cell Reports.
“Our earlier studies showed that serum heparin levels in mice increased significantly during starvation,” said Dr Gang Shu, of South China Agricultural University in Guangzhou, China.
“These encouraged us to explore a potential role of heparin in feeding control.”
This exploration revealed that treatment with heparin increased food intake and body weight in male and female mice.
Then, the researchers found that heparin stimulates AgRP neurons located in the hypothalamus. This results in increased production of AgRP protein, a neuropeptide that stimulates food intake.
“We also demonstrated that heparin activates AgRP neurons by competing with insulin for binding to the insulin receptor,” Dr Shu said.
“Insulin and heparin have opposite effects on AgRP neurons,” Dr Xu noted. “Insulin treatment suppresses AgRP neuron firing of electrical impulses and expression of AgRP neuropeptides. We found that heparin competes with and prevents insulin from binding to insulin receptors on AgRP neurons.”
The researchers also found that, by competing for insulin receptor binding, heparin inhibits FoxO1 activity to promote AgRP release and feeding.
The team noted that FoxO1 has been shown to be highly expressed in AgRP neurons and to represent a key intracellular component of pathways integrating AgRP-mediated food intake and peripheral metabolic signals.
Although this study was conducted in animals, the researchers believe its results have implications for patients. The research suggests heparin can affect how the body regulates appetite, so heparin might be a target for treating eating disorders. ![]()
How thyroid hormone affects RBC production

Physicians have long known that patients with an underactive thyroid tend to have anemia because thyroid hormone stimulates red blood cell (RBC) production.
Now, researchers say they have determined how this occurs.
Xiaofei Gao, PhD, of Westlake Institute for Advanced Study in Hangzhou, Zhejiang Province, China, and his colleagues conducted this research and reported the results in PNAS.
The team began by studying the formation of human RBCs in culture. They wondered if something in the culture serum was essential for RBC maturation. So they ran the serum through a charcoal filter, which attracts and retains hydrophobic molecules.
Once filtered, the serum no longer supported RBC production. This validated the researchers’ theory that one of the hydrophobic molecules was key to RBC maturation.
In fact, the team found thyroid hormone was essential for the final step of RBC maturation.
When the researchers added thyroid hormone back to the serum, RBC progenitors once again started down the path to maturation.
If thyroid hormone was added at an earlier stage of development, the RBCs short-circuited their usual developmental processes and began turning into mature RBCs.
With further investigation, the researchers pinpointed the receptor inside maturing RBCs to which thyroid hormone binds—thyroid hormone receptor beta (TRβ).
From there, the team found that nuclear receptor coactivator 4 (NCOA4), a protein necessary for thyroid hormone stimulation, works with TRβ to regulate RBC development.
Finally, experiments showed that TRβ agonists could stimulate RBC development and alleviate anemic symptoms in a mouse model of chronic anemia.
The researchers therefore believe this work could lead to new therapies for anemic patients, including those with an underactive thyroid. ![]()
Postpartum depression screening in well-child care appears promising
, according to results of a study from the Netherlands.
“This promising finding warrants wider implementation of screening for postpartum depression,” said Dr. Angarath I. Van der Zee-van den Berg of the University of Twente, Enschede, the Netherlands, and associates. 
Results showed significantly fewer mothers in the intervention group were depressed at 9 months post partum, compared with the CAU group (0.6% of 1,843 vs. 2.5% 1,246 for major depression), with an adjusted odds ratio of 0.28 (95% confidence interval, 0.12-0.63). The difference also was significant for minor and major depression, with 3.0% of the intervention group affected vs. 8.4% of the CAU group, and the adjusted odds ratio was 0.40 (95% confidence interval, 0.27-0.58). For parenting, anxiety symptoms, and mental health functioning, the intervention resulted in effect sizes ranging from 0.23 to 0.27.
“We found screening for postpartum depression to have a negligible effect on socioemotional development of the child with no former evidence to compare with,” Dr. Van der Zee-van den Berg and his associates said. “Attention for the mother-child interaction in the trajectory after screening may improve child outcomes; this evidently requires further study.”
To find out more information see Pediatrics (2017;140[4]:e20170110).
, according to results of a study from the Netherlands.
“This promising finding warrants wider implementation of screening for postpartum depression,” said Dr. Angarath I. Van der Zee-van den Berg of the University of Twente, Enschede, the Netherlands, and associates.
Results showed significantly fewer mothers in the intervention group were depressed at 9 months post partum, compared with the CAU group (0.6% of 1,843 vs. 2.5% 1,246 for major depression), with an adjusted odds ratio of 0.28 (95% confidence interval, 0.12-0.63). The difference also was significant for minor and major depression, with 3.0% of the intervention group affected vs. 8.4% of the CAU group, and the adjusted odds ratio was 0.40 (95% confidence interval, 0.27-0.58). For parenting, anxiety symptoms, and mental health functioning, the intervention resulted in effect sizes ranging from 0.23 to 0.27.
“We found screening for postpartum depression to have a negligible effect on socioemotional development of the child with no former evidence to compare with,” Dr. Van der Zee-van den Berg and his associates said. “Attention for the mother-child interaction in the trajectory after screening may improve child outcomes; this evidently requires further study.”
To find out more information see Pediatrics (2017;140[4]:e20170110).
FROM PEDIATRICS
Behavioral Health: Using Rating Scales in a Clinical Setting
In the current health care environment, there is an increasing demand for objective assessment of disease states.1 This is particularly apparent in the realm of behavioral health, where documentation of outcomes lags that of other areas of medicine.
In 2012, the additional health care costs incurred by persons with mental health diagnoses were estimated to be $293 billion among commercially insured, Medicaid, and Medicare beneficiaries in the United States—a figure that is 273% higher than the cost for those without psychiatric diagnoses.2 Psychiatric and medical illnesses can be so tightly linked that accurate diagnosis and treatment of psychiatric disorders becomes essential to control medical illnesses. It is not surprising that there is increased scrutiny to the ways in which behavioral health care can be objectively assessed and monitored, and payers such as the Centers for Medicare and Medicaid Services increasingly require objective documentation of disease state improvement for payment.3
Support for objective assessment of disease derives from the collaborative care model. This model is designed to better integrate mental health and primary care (among other practices) by establishing the Patient-Centered Medical Home and emphasizing screening and monitoring patient-reported outcomes over time to assess treatment response.4 This approach, which is endorsed by the American Psychiatric Association, is associated with significant improvements in outcomes compared with usual care.5 It tracks patient progress using validated clinical rating scales and other screening tools (eg, Patient Health Questionnaire [PHQ-9] for depression), an approach that is analogous to how patients with type 2 diabetes are monitored by A1C lab tests.6 An extensive body of research supports the impact of this approach on treatment. A 2012 Cochrane review associated collaborative care with significant improvements in depression and anxiety outcomes compared with usual treatment.7
Despite these findings, a recent Kennedy Forum brief asserts that behavioral health is characterized by a "lack of systematic measurement to determine whether patients are responding to treatment."8 That same brief points to the many validated, easy-to-administer rating scales and screening tools that can reliably measure the frequency and severity of psychiatric symptoms over time, and likens the lack of their use to "treating high blood pressure without using a blood pressure cuff to measure if a patient's blood pressure is improving."8 In fact, it is estimated that only 18% of psychiatrists and 11% of psychologists use rating scales routinely.9,10 This lack of use denies clinicians important information that can help detect deterioration or lack of improvement in their patients; implementing these scales in primary care can help early detection of behavioral health problems.
Behavioral health is replete with rating scales and screening tools, and the number of competing scales can make choosing a measure difficult.1 Nonetheless, not all scales are appropriate for clinical use; many are designed for research, for instance, and are lengthy and difficult to administer.
Let's review a number of rating scales that are brief, useful, and easy to administer. A framework for the screening tools addressed in this article is available on the federally funded Center for Integrated Health Solutions website (www.integration.samhsa.gov). This site promotes the use of tools designed to assist in screening and monitoring for depression, anxiety, bipolar disorder, substance use, and suicidality.11
QUALITY CRITERIA FOR RATING SCALES
The quality of a rating scale is determined by the following attributes.
Objectivity. The ability of a scale to obtain the same results, regardless of who administers, analyzes, or interprets it.
Reliability. The ability of a scale to convey consistent and reproducible information across time, patients, and raters.
Validity. The degree to which the scale measures what it is supposed to measure (eg, depressive symptoms). Sensitivity and specificity are measures of validity and provide additional information about the rating scale; namely, whether the scale can detect the presence of a disease (sensitivity) and whether it detects only that disease or condition and not another (specificity).
Establishment of norms. Whether a scale provides reference values for different clinical groups.
Practicability. The resources required to administer the assessment instrument in terms of time, staff, and material.12
In addition to meeting these quality criteria, selection of a scale can be based on whether it is self-rated or observer-rated. Advantages to self-rated scales, such as the PHQ-9, Mood Disorder Questionnaire (MDQ), and Generalized Anxiety Disorder 7-item (GAD-7) scale, are their practicability—they are easy to administer and don't require much time—and their use in evaluating and raising awareness of subjective states.
However, reliability may be a concern, as some patients may lack insight or exaggerate or mask symptoms when completing such scales.13 Both observer- and self-rated scales can be used together to minimize bias, identify symptoms that might have been missed/not addressed in the clinical interview, and drive clinical decision-making. Both can also help patients communicate with their providers and make them feel more involved in clinical decision-making.8
ENDORSED RATING SCALES
The following scales have met many of the quality criteria described here and are endorsed by the government payer system. They can easily be incorporated into clinical practice and will provide useful clinical information that can assist in diagnosis and monitoring patient outcomes.
Patient Health Questionnaire
PHQ-9 is a nine-item self-report questionnaire that can help to detect depression and supplement a thorough mental health interview. It scores the nine DSM-IV criteria for depression on a scale of 0 (not at all) to 3 (nearly every day). It is a public resource that is easy to find online, available without cost in several languages, and takes just a few minutes to complete.14
PHQ-9 has shown excellent test-retest reliability in screening for depression, and normative data on the instrument's use are available in various clinical populations.15 Research has shown that as PHQ-9 depression scores increase, functional status decreases, while depressive symptoms, sick days, and health care utilization increase.15 In one study, a PHQ-9 score of ≥ 10 had 88% sensitivity and specificity for detecting depression, with scores of 5, 10, 15, and 20 indicating mild, moderate, moderately severe, and severe depression, respectively.16 In addition to its use as a screening tool, PHQ-9 is a responsive and reliable measure of depression treatment outcomes.17
Mood Disorder Questionnaire
MDQ is another brief, self-report questionnaire that is available online. It is designed to identify and monitor patients who are likely to meet diagnostic criteria for bipolar disorder.18,19
The first question on the MDQ asks if the patient has experienced any of 13 common mood and behavior symptoms. The second question asks if these symptoms have ever occurred at the same time, and the third asks the degree to which the patient finds the symptoms to be problematic. The remaining two questions provide additional clinical information, addressing family history of manic-depressive illness or bipolar disorder and whether a diagnosis of either disorder has been made.
The MDQ has shown validity in assessing bipolar disorder symptoms in a general population, although recent research suggests that imprecise recall bias may limit its reliability in detecting hypomanic episodes earlier in life.20,21 Nonetheless, its specificity of > 97% means that it will effectively screen out just about all true negatives.18
Generalized Anxiety Disorder 7-item scale
The GAD-7 scale is a brief, self-administered questionnaire for screening and measuring severity of GAD.22 It asks patients to rate seven items that represent problems with general anxiety and scores each item on a scale of 0 (not at all) to 3 (nearly every day). Similar to the other measures, it is easily accessible online.
Research evidence supports the reliability and validity of GAD-7 as a measure of anxiety in the general population. Sensitivity and specificity are 89% and 82%, respectively. Normative data for age- and sex-specific subgroups support its use across age groups and in both males and females.23 The GAD-7 performs well for detecting and monitoring not only GAD but also panic disorder, social anxiety disorder, and posttraumatic stress disorder.24
CAGE questionnaire for detection of substance use
The CAGE questionnaire is a widely used screening tool that was originally developed to detect alcohol abuse but has been adapted to assess other substance abuse.25,26 The omission of substance abuse from diagnostic consideration can have a major effect on quality of care, because substance abuse can be the underlying cause of other diseases. Therefore, routine administration of this instrument in clinical practice can lead to better understanding and monitoring of patient health.27
Similar to other instruments, CAGE is free and available online.27 It contains four simple questions, with 1 point assigned to each positive answer (see Table); the simple mnemonic makes the questions easy to remember and to administer in a clinical setting.
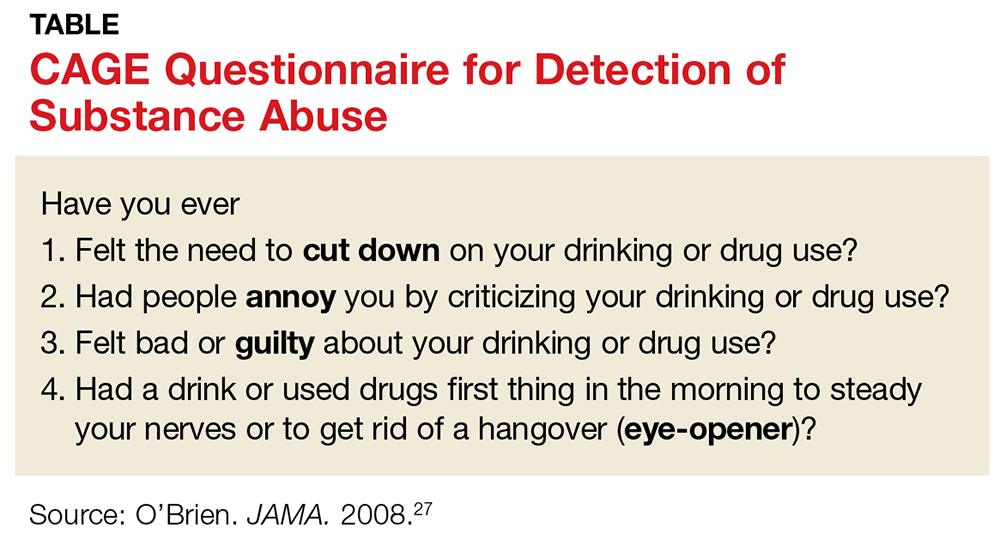
CAGE has demonstrated validity, with one study determining that scores ≥ 2 had a specificity and sensitivity of 76% and 93%, respectively, for identifying excessive drinking, and a specificity and sensitivity of 77% and 91%, respectively, for identifying alcohol abuse.28
Columbia Suicide Severity Rating Scale (C-SSRS)
C-SSRS was developed by researchers at Columbia University to assess the severity of and track changes over time in suicidal ideation and behavior. C-SSRS is two pages and takes only a few minutes to administer; however, it also may be completed as a self-report measure. The questions are phrased in an interview format, and while clinicians are encouraged to receive training prior to its administration, specific training in mental health is not required.
The "Lifetime/Recent" version allows practitioners to gather lifetime history of suicidality as well as any recent suicidal ideation and/or behavior, whereas the "Since Last Visit" version of the scale assesses suicidality in patients who have completed at least one Lifetime/Recent C-SSRS assessment. A truncated, six-item "Screener" version is typically used in emergency situations. A risk assessment can be added to either the Full or Screener version to summarize the answers from C-SSRS and document risk and protective factors.29
Several studies have found C-SSRS to be reliable and valid for identifying suicide risk in children and adults.30,31USA Today reported that an individual exhibiting even a single behavior identified by the scale is eight to 10 times more likely to complete suicide.32 In addition, the C-SSRS has helped reduce the suicide rate by 65% in one of the largest providers of community-based behavioral health care in the United States.32
USING SCALES TO AUGMENT CARE
Each of the scales described in this article can easily be incorporated into clinical practice. The information the scales provide can be used to track progression of symptoms and effectiveness of treatment. Although rating scales should never be used alone to establish a diagnosis or clinical treatment plan, they can and should be used to augment information from the clinician's assessment and follow-up interviews.5
1. McDowell I. Measuring Health: A Guide to Rating Scales and Questionnaires. 3rd ed. New York, NY: Oxford University Press; 2006.
2. Kennedy Forum. Fixing behavioral health care in America: a national call for integrating and coordinating specialty behavioral health care with the medical system. http://thekennedyforum-dot-org.s3.amazonaws.com/documents/KennedyForum-BehavioralHealth_FINAL_3.pdf. Accessed August 14, 2017.
3. The Office of the National Coordinator for Health Information Technology. Behavioral health (BH) Clinical Quality Measures (CQMs) Program initiatives. www.healthit.gov/sites/default/files/pdf/2012-09-27-behavioral-health-clinical-quality-measures-program-initiatives-public-forum.pdf. Accessed August 14, 2017.
4. Unutzer J, Harbin H, Schoenbaum M. The collaborative care model: an approach for integrating physical and mental health care in Medicaid health homes. www.medicaid.gov/State-Resource-Center/Medicaid-State-Technical-Assistance/Health-Homes-Technical-Assistance/Downloads/HH-IRC-Collaborative-5-13.pdf. Accessed August 14, 2017.
5. World Group On Psychiatric Evaluation; American Psychiatric Association Steering Committee On Practice Guidelines. Practice guideline for the psychiatric evaluation of adults. 2nd ed. http://psychiatryonline.org/pb/assets/raw/sitewide/practice_guidelines/guidelines/psychevaladults.pdf. Accessed August 14, 2017.
6. Melek S, Norris D, Paulus J. Economic Impact of Integrated Medical-Behavioral Healthcare: Implications for Psychiatry. Denver, CO: Milliman, Inc; 2014.
7. Archer J, Bower P, Gilbody S, et al. Collaborative care for depression and anxiety problems. Cochrane Database Syst Rev. 2012;10:CD006525.
8. Kennedy Forum. Fixing behavioral health care in America: a national call for measurement-based care. www.thekennedyforum.org/a-national-call-for-measurement-based-care/. Accessed August 14, 2017.
9. Zimmerman M, McGlinchey JB. Why don't psychiatrists use scales to measure outcome when treating depressed patients? J Clin Psychiatry. 2008;69(12):1916-1919.
10. Hatfield D, McCullough L, Frantz SH, et al. Do we know when our clients get worse? An investigation of therapists' ability to detect negative client change. Clin Psychol Psychother. 2010;17(1):25-32.
11. SAMHSA-HRSA Center for Integrated Solutions. Screening tools. www.integration.samhsa.gov/clinical-practice/screening-tools. Accessed August 14, 2017.
12. Moller HJ. Standardised rating scales in psychiatry: methodological basis, their possibilities and limitations and descriptions of important rating scales. World J Biol Psychiatry. 2009;10(1):6-26.
13. Sajatovic M, Ramirez LF. Rating Scales in Mental Health. 2nd ed. Hudson, OH: Lexi-Comp; 2003.
14. Patient Health Questionnaire-9 (PHQ-9). www.agencymeddirectors.wa.gov/files/AssessmentTools/14-PHQ-9%20overview.pdf. Accessed August 14, 2017.
15. Patient Health Questionnaire-9 (PHQ-9). Rehab Measures Web site. www.rehabmeasures.org/Lists/RehabMeasures/DispForm.aspx?ID=954. Accessed August 14, 2017.
16. Kroenke K, Spitzer RL, Williams JB. The PHQ-9: validity of a brief depression severity measure. J Gen Intern Med. 2001;16(9):606-613.
17. Löwe B, Unützer J, Callahan CM, et al. Monitoring depression treatment outcomes with the Patient Health Questionnaire-9. Med Care. 2004;42(12):1194-1201.
18. Ketter TA. Strategies for monitoring outcomes in patients with bipolar disorder. Prim Care Companion J Clin Psychiatry. 2010;12(suppl 1):10-16.
19. The Mood Disorder Questionnaire. University of Texas Medical Branch. www.dbsalliance.org/pdfs/MDQ.pdf. Accessed August 14, 2017.
20. Hirschfeld RM, Holzer C, Calabrese JR, et al. Validity of the Mood Disorder Questionnaire: a general population study. Am J Psychiatry. 2003;160(1):178-180.
21. Boschloo L, Nolen WA, Spijker AT, et al. The Mood Disorder Questionnaire (MDQ) for detecting (hypo) manic episodes: its validity and impact of recall bias. J Affect Disord. 2013;151(1):203-208.
22. Spitzer RL, Kroenke K, Williams JB, et al. A brief measure for assessing generalized anxiety disorder: the GAD-7. Arch Intern Med. 2006;166(10):1092-1097.
23. Lowe B, Decker O, Müller S, et al. Validation and standardization of the Generalized Anxiety Disorder Screener (GAD-7) in the general population. Med Care. 2008;46(3):266-274.
24. Kroenke K, Spitzer RL, Williams JB, et al. Anxiety disorders in primary care: prevalence, impairment, comorbidity, and detection. Ann Intern Med. 2007;146(5):317-325.
25. Ewing JA. Detecting alcoholism. The CAGE Questionnaire. JAMA. 1984;252(14):1905-1907.
26. CAGE substance abuse screening tool. Johns Hopkins Medicine. www.hopkinsmedicine.org/johns_hopkins_healthcare/downloads/cage%20substance%20screening%20tool.pdf. Accessed August 14, 2017.
27. O'Brien CP. The CAGE questionnaire for detection of alcoholism: a remarkably useful but simple tool. JAMA. 2008;300(17):2054-2056.
28. Bernadt MW, Mumford J, Taylor C, et al. Comparison of questionnaire and laboratory tests in the detection of excessive drinking and alcoholism. Lancet. 1982;1(8267):325-328.
29. Columbia Suicide-Severity Rating Scale (CS-SRS). http://cssrs.columbia.edu/the-columbia-scale-c-ssrs/cssrs-for-communities-and-healthcare/#filter=.general-use.english. Accessed August 14, 2017.
30. Mundt JC, Greist JH, Jefferson JW, et al. Prediction of suicidal behavior in clinical research by lifetime suicidal ideation and behavior ascertained by the electronic Columbia-Suicide Severity Rating Scale. J Clin Psychiatry. 2013;74(9):887-893.
31. Posner K, Brown GK, Stanley B, et al. The Columbia-Suicide Severity Rating Scale: initial validity and internal consistency findings from three multisite studies with adolescents and adults. Am J Psychiatry. 2011;168(12):1266-1277.
32. Esposito L. Suicide checklist spots people at highest risk. USA Today. http://usatoday30.usatoday.com/news/health/story/health/story/2011-11-09/Suicide-checklist-spots-peo ple-at-highest-risk/51135944/1. Accessed August 14, 2017.
In the current health care environment, there is an increasing demand for objective assessment of disease states.1 This is particularly apparent in the realm of behavioral health, where documentation of outcomes lags that of other areas of medicine.
In 2012, the additional health care costs incurred by persons with mental health diagnoses were estimated to be $293 billion among commercially insured, Medicaid, and Medicare beneficiaries in the United States—a figure that is 273% higher than the cost for those without psychiatric diagnoses.2 Psychiatric and medical illnesses can be so tightly linked that accurate diagnosis and treatment of psychiatric disorders becomes essential to control medical illnesses. It is not surprising that there is increased scrutiny to the ways in which behavioral health care can be objectively assessed and monitored, and payers such as the Centers for Medicare and Medicaid Services increasingly require objective documentation of disease state improvement for payment.3
Support for objective assessment of disease derives from the collaborative care model. This model is designed to better integrate mental health and primary care (among other practices) by establishing the Patient-Centered Medical Home and emphasizing screening and monitoring patient-reported outcomes over time to assess treatment response.4 This approach, which is endorsed by the American Psychiatric Association, is associated with significant improvements in outcomes compared with usual care.5 It tracks patient progress using validated clinical rating scales and other screening tools (eg, Patient Health Questionnaire [PHQ-9] for depression), an approach that is analogous to how patients with type 2 diabetes are monitored by A1C lab tests.6 An extensive body of research supports the impact of this approach on treatment. A 2012 Cochrane review associated collaborative care with significant improvements in depression and anxiety outcomes compared with usual treatment.7
Despite these findings, a recent Kennedy Forum brief asserts that behavioral health is characterized by a "lack of systematic measurement to determine whether patients are responding to treatment."8 That same brief points to the many validated, easy-to-administer rating scales and screening tools that can reliably measure the frequency and severity of psychiatric symptoms over time, and likens the lack of their use to "treating high blood pressure without using a blood pressure cuff to measure if a patient's blood pressure is improving."8 In fact, it is estimated that only 18% of psychiatrists and 11% of psychologists use rating scales routinely.9,10 This lack of use denies clinicians important information that can help detect deterioration or lack of improvement in their patients; implementing these scales in primary care can help early detection of behavioral health problems.
Behavioral health is replete with rating scales and screening tools, and the number of competing scales can make choosing a measure difficult.1 Nonetheless, not all scales are appropriate for clinical use; many are designed for research, for instance, and are lengthy and difficult to administer.
Let's review a number of rating scales that are brief, useful, and easy to administer. A framework for the screening tools addressed in this article is available on the federally funded Center for Integrated Health Solutions website (www.integration.samhsa.gov). This site promotes the use of tools designed to assist in screening and monitoring for depression, anxiety, bipolar disorder, substance use, and suicidality.11
QUALITY CRITERIA FOR RATING SCALES
The quality of a rating scale is determined by the following attributes.
Objectivity. The ability of a scale to obtain the same results, regardless of who administers, analyzes, or interprets it.
Reliability. The ability of a scale to convey consistent and reproducible information across time, patients, and raters.
Validity. The degree to which the scale measures what it is supposed to measure (eg, depressive symptoms). Sensitivity and specificity are measures of validity and provide additional information about the rating scale; namely, whether the scale can detect the presence of a disease (sensitivity) and whether it detects only that disease or condition and not another (specificity).
Establishment of norms. Whether a scale provides reference values for different clinical groups.
Practicability. The resources required to administer the assessment instrument in terms of time, staff, and material.12
In addition to meeting these quality criteria, selection of a scale can be based on whether it is self-rated or observer-rated. Advantages to self-rated scales, such as the PHQ-9, Mood Disorder Questionnaire (MDQ), and Generalized Anxiety Disorder 7-item (GAD-7) scale, are their practicability—they are easy to administer and don't require much time—and their use in evaluating and raising awareness of subjective states.
However, reliability may be a concern, as some patients may lack insight or exaggerate or mask symptoms when completing such scales.13 Both observer- and self-rated scales can be used together to minimize bias, identify symptoms that might have been missed/not addressed in the clinical interview, and drive clinical decision-making. Both can also help patients communicate with their providers and make them feel more involved in clinical decision-making.8
ENDORSED RATING SCALES
The following scales have met many of the quality criteria described here and are endorsed by the government payer system. They can easily be incorporated into clinical practice and will provide useful clinical information that can assist in diagnosis and monitoring patient outcomes.
Patient Health Questionnaire
PHQ-9 is a nine-item self-report questionnaire that can help to detect depression and supplement a thorough mental health interview. It scores the nine DSM-IV criteria for depression on a scale of 0 (not at all) to 3 (nearly every day). It is a public resource that is easy to find online, available without cost in several languages, and takes just a few minutes to complete.14
PHQ-9 has shown excellent test-retest reliability in screening for depression, and normative data on the instrument's use are available in various clinical populations.15 Research has shown that as PHQ-9 depression scores increase, functional status decreases, while depressive symptoms, sick days, and health care utilization increase.15 In one study, a PHQ-9 score of ≥ 10 had 88% sensitivity and specificity for detecting depression, with scores of 5, 10, 15, and 20 indicating mild, moderate, moderately severe, and severe depression, respectively.16 In addition to its use as a screening tool, PHQ-9 is a responsive and reliable measure of depression treatment outcomes.17
Mood Disorder Questionnaire
MDQ is another brief, self-report questionnaire that is available online. It is designed to identify and monitor patients who are likely to meet diagnostic criteria for bipolar disorder.18,19
The first question on the MDQ asks if the patient has experienced any of 13 common mood and behavior symptoms. The second question asks if these symptoms have ever occurred at the same time, and the third asks the degree to which the patient finds the symptoms to be problematic. The remaining two questions provide additional clinical information, addressing family history of manic-depressive illness or bipolar disorder and whether a diagnosis of either disorder has been made.
The MDQ has shown validity in assessing bipolar disorder symptoms in a general population, although recent research suggests that imprecise recall bias may limit its reliability in detecting hypomanic episodes earlier in life.20,21 Nonetheless, its specificity of > 97% means that it will effectively screen out just about all true negatives.18
Generalized Anxiety Disorder 7-item scale
The GAD-7 scale is a brief, self-administered questionnaire for screening and measuring severity of GAD.22 It asks patients to rate seven items that represent problems with general anxiety and scores each item on a scale of 0 (not at all) to 3 (nearly every day). Similar to the other measures, it is easily accessible online.
Research evidence supports the reliability and validity of GAD-7 as a measure of anxiety in the general population. Sensitivity and specificity are 89% and 82%, respectively. Normative data for age- and sex-specific subgroups support its use across age groups and in both males and females.23 The GAD-7 performs well for detecting and monitoring not only GAD but also panic disorder, social anxiety disorder, and posttraumatic stress disorder.24
CAGE questionnaire for detection of substance use
The CAGE questionnaire is a widely used screening tool that was originally developed to detect alcohol abuse but has been adapted to assess other substance abuse.25,26 The omission of substance abuse from diagnostic consideration can have a major effect on quality of care, because substance abuse can be the underlying cause of other diseases. Therefore, routine administration of this instrument in clinical practice can lead to better understanding and monitoring of patient health.27
Similar to other instruments, CAGE is free and available online.27 It contains four simple questions, with 1 point assigned to each positive answer (see Table); the simple mnemonic makes the questions easy to remember and to administer in a clinical setting.
CAGE has demonstrated validity, with one study determining that scores ≥ 2 had a specificity and sensitivity of 76% and 93%, respectively, for identifying excessive drinking, and a specificity and sensitivity of 77% and 91%, respectively, for identifying alcohol abuse.28
Columbia Suicide Severity Rating Scale (C-SSRS)
C-SSRS was developed by researchers at Columbia University to assess the severity of and track changes over time in suicidal ideation and behavior. C-SSRS is two pages and takes only a few minutes to administer; however, it also may be completed as a self-report measure. The questions are phrased in an interview format, and while clinicians are encouraged to receive training prior to its administration, specific training in mental health is not required.
The "Lifetime/Recent" version allows practitioners to gather lifetime history of suicidality as well as any recent suicidal ideation and/or behavior, whereas the "Since Last Visit" version of the scale assesses suicidality in patients who have completed at least one Lifetime/Recent C-SSRS assessment. A truncated, six-item "Screener" version is typically used in emergency situations. A risk assessment can be added to either the Full or Screener version to summarize the answers from C-SSRS and document risk and protective factors.29
Several studies have found C-SSRS to be reliable and valid for identifying suicide risk in children and adults.30,31USA Today reported that an individual exhibiting even a single behavior identified by the scale is eight to 10 times more likely to complete suicide.32 In addition, the C-SSRS has helped reduce the suicide rate by 65% in one of the largest providers of community-based behavioral health care in the United States.32
USING SCALES TO AUGMENT CARE
Each of the scales described in this article can easily be incorporated into clinical practice. The information the scales provide can be used to track progression of symptoms and effectiveness of treatment. Although rating scales should never be used alone to establish a diagnosis or clinical treatment plan, they can and should be used to augment information from the clinician's assessment and follow-up interviews.5
1. McDowell I. Measuring Health: A Guide to Rating Scales and Questionnaires. 3rd ed. New York, NY: Oxford University Press; 2006.
2. Kennedy Forum. Fixing behavioral health care in America: a national call for integrating and coordinating specialty behavioral health care with the medical system. http://thekennedyforum-dot-org.s3.amazonaws.com/documents/KennedyForum-BehavioralHealth_FINAL_3.pdf. Accessed August 14, 2017.
3. The Office of the National Coordinator for Health Information Technology. Behavioral health (BH) Clinical Quality Measures (CQMs) Program initiatives. www.healthit.gov/sites/default/files/pdf/2012-09-27-behavioral-health-clinical-quality-measures-program-initiatives-public-forum.pdf. Accessed August 14, 2017.
4. Unutzer J, Harbin H, Schoenbaum M. The collaborative care model: an approach for integrating physical and mental health care in Medicaid health homes. www.medicaid.gov/State-Resource-Center/Medicaid-State-Technical-Assistance/Health-Homes-Technical-Assistance/Downloads/HH-IRC-Collaborative-5-13.pdf. Accessed August 14, 2017.
5. World Group On Psychiatric Evaluation; American Psychiatric Association Steering Committee On Practice Guidelines. Practice guideline for the psychiatric evaluation of adults. 2nd ed. http://psychiatryonline.org/pb/assets/raw/sitewide/practice_guidelines/guidelines/psychevaladults.pdf. Accessed August 14, 2017.
6. Melek S, Norris D, Paulus J. Economic Impact of Integrated Medical-Behavioral Healthcare: Implications for Psychiatry. Denver, CO: Milliman, Inc; 2014.
7. Archer J, Bower P, Gilbody S, et al. Collaborative care for depression and anxiety problems. Cochrane Database Syst Rev. 2012;10:CD006525.
8. Kennedy Forum. Fixing behavioral health care in America: a national call for measurement-based care. www.thekennedyforum.org/a-national-call-for-measurement-based-care/. Accessed August 14, 2017.
9. Zimmerman M, McGlinchey JB. Why don't psychiatrists use scales to measure outcome when treating depressed patients? J Clin Psychiatry. 2008;69(12):1916-1919.
10. Hatfield D, McCullough L, Frantz SH, et al. Do we know when our clients get worse? An investigation of therapists' ability to detect negative client change. Clin Psychol Psychother. 2010;17(1):25-32.
11. SAMHSA-HRSA Center for Integrated Solutions. Screening tools. www.integration.samhsa.gov/clinical-practice/screening-tools. Accessed August 14, 2017.
12. Moller HJ. Standardised rating scales in psychiatry: methodological basis, their possibilities and limitations and descriptions of important rating scales. World J Biol Psychiatry. 2009;10(1):6-26.
13. Sajatovic M, Ramirez LF. Rating Scales in Mental Health. 2nd ed. Hudson, OH: Lexi-Comp; 2003.
14. Patient Health Questionnaire-9 (PHQ-9). www.agencymeddirectors.wa.gov/files/AssessmentTools/14-PHQ-9%20overview.pdf. Accessed August 14, 2017.
15. Patient Health Questionnaire-9 (PHQ-9). Rehab Measures Web site. www.rehabmeasures.org/Lists/RehabMeasures/DispForm.aspx?ID=954. Accessed August 14, 2017.
16. Kroenke K, Spitzer RL, Williams JB. The PHQ-9: validity of a brief depression severity measure. J Gen Intern Med. 2001;16(9):606-613.
17. Löwe B, Unützer J, Callahan CM, et al. Monitoring depression treatment outcomes with the Patient Health Questionnaire-9. Med Care. 2004;42(12):1194-1201.
18. Ketter TA. Strategies for monitoring outcomes in patients with bipolar disorder. Prim Care Companion J Clin Psychiatry. 2010;12(suppl 1):10-16.
19. The Mood Disorder Questionnaire. University of Texas Medical Branch. www.dbsalliance.org/pdfs/MDQ.pdf. Accessed August 14, 2017.
20. Hirschfeld RM, Holzer C, Calabrese JR, et al. Validity of the Mood Disorder Questionnaire: a general population study. Am J Psychiatry. 2003;160(1):178-180.
21. Boschloo L, Nolen WA, Spijker AT, et al. The Mood Disorder Questionnaire (MDQ) for detecting (hypo) manic episodes: its validity and impact of recall bias. J Affect Disord. 2013;151(1):203-208.
22. Spitzer RL, Kroenke K, Williams JB, et al. A brief measure for assessing generalized anxiety disorder: the GAD-7. Arch Intern Med. 2006;166(10):1092-1097.
23. Lowe B, Decker O, Müller S, et al. Validation and standardization of the Generalized Anxiety Disorder Screener (GAD-7) in the general population. Med Care. 2008;46(3):266-274.
24. Kroenke K, Spitzer RL, Williams JB, et al. Anxiety disorders in primary care: prevalence, impairment, comorbidity, and detection. Ann Intern Med. 2007;146(5):317-325.
25. Ewing JA. Detecting alcoholism. The CAGE Questionnaire. JAMA. 1984;252(14):1905-1907.
26. CAGE substance abuse screening tool. Johns Hopkins Medicine. www.hopkinsmedicine.org/johns_hopkins_healthcare/downloads/cage%20substance%20screening%20tool.pdf. Accessed August 14, 2017.
27. O'Brien CP. The CAGE questionnaire for detection of alcoholism: a remarkably useful but simple tool. JAMA. 2008;300(17):2054-2056.
28. Bernadt MW, Mumford J, Taylor C, et al. Comparison of questionnaire and laboratory tests in the detection of excessive drinking and alcoholism. Lancet. 1982;1(8267):325-328.
29. Columbia Suicide-Severity Rating Scale (CS-SRS). http://cssrs.columbia.edu/the-columbia-scale-c-ssrs/cssrs-for-communities-and-healthcare/#filter=.general-use.english. Accessed August 14, 2017.
30. Mundt JC, Greist JH, Jefferson JW, et al. Prediction of suicidal behavior in clinical research by lifetime suicidal ideation and behavior ascertained by the electronic Columbia-Suicide Severity Rating Scale. J Clin Psychiatry. 2013;74(9):887-893.
31. Posner K, Brown GK, Stanley B, et al. The Columbia-Suicide Severity Rating Scale: initial validity and internal consistency findings from three multisite studies with adolescents and adults. Am J Psychiatry. 2011;168(12):1266-1277.
32. Esposito L. Suicide checklist spots people at highest risk. USA Today. http://usatoday30.usatoday.com/news/health/story/health/story/2011-11-09/Suicide-checklist-spots-peo ple-at-highest-risk/51135944/1. Accessed August 14, 2017.

Prenatal antidepressant use linked to psychiatric illness in offspring
Antidepressant use before and during pregnancy may be associated with an increased risk of psychiatric disorders in offspring, according to the results of a population-based cohort study published Sept. 7 in the BMJ.
There have been contradictory findings in the literature about whether in utero exposure to SSRIs is associated with autism spectrum disorder and ADHD. “However, these studies did not investigate the overall risk of psychiatric disorders, which is important because differentiating between overlapping symptoms and diagnosing specific disorders are challenging in children and adolescents,” Xiaoqin Liu, MD, PhD, of Aarhus University in Denmark, and her coauthors wrote (BMJ 2017;358:j3668. doi: 10.1136/bmj.j3668).
Participants were categorized into four groups based on maternal use of antidepressants; unexposed, antidepressant discontinuation (if the mother had used in the 2 years before but not during pregnancy), antidepressant continuation (if the use happened in the 2 years before pregnancy and during it), and new users (if antidepressant use happened only during pregnancy).
The study found that children whose mothers used antidepressants both in the 2 years before pregnancy and during pregnancy had a 27% higher incidence of any psychiatric disorder, compared with children whose mothers had used antidepressants but discontinued them before becoming pregnant (95% confidence interval, 1.17-1.38).
This figure was adjusted for factors such as maternal age and psychiatric history at delivery, psychiatric treatment in the 2 years before pregnancy, other psychotropic medications used during pregnancy, and paternal psychiatric history at the time of delivery.
Any maternal antidepressant use was associated with an increased risk of psychiatric disorders in the offspring, compared with the unexposed group. The 15-year cumulative incidence of psychiatric disorders in offspring was 8% in the unexposed group, 11.5% in the discontinuation group, 13.6% in the continuation group, and 14.5% in the new user group.
There were no differences in risk between children exposed to SSRI monotherapy and those exposed to non-SSRI monotherapy, although the statistical precision for the latter was low, the researchers noted. However, they did see a lower risk of psychiatric disorder in children who were exposed only during the first trimester, compared with those exposed in the second or third trimesters.
The researchers suggested that the association between in utero exposure and the risk of psychiatric disorders in offspring may be the result of a combination of underlying maternal disorders and in utero antidepressant exposure. “We speculated that this increased risk could be due to the severity of underlying maternal psychiatric disorders because mothers with severe symptoms are more likely to continue treatment during pregnancy,” they wrote.
The researchers cautioned that discontinuation of treatment could lead to psychiatric episodes that could have long-lasting effects on both mother and child.
The investigators reported support from several research foundations, as well as institutional grants from Sage Therapeutics and Janssen. No conflicts of interest were declared.
Only the most severely sick women have drugs prescribed during pregnancy. Consequently, confounding by indication is a major challenge in pharmacoepidemiological studies. Including a disease comparison group with women discontinuing antidepressants before pregnancy, as in Liu and her colleagues’ study, offers an important advantage over studies that use only healthy comparison groups because it allows researchers to disentangle the effect of antidepressants from the underlying maternal psychiatric disease.
It is important that researchers report absolute risks to facilitate communication between clinicians and pregnant women. For example, if prenatal exposure to antidepressants is associated with a 23% increased risk of autism in children, and if we assume a baseline prevalence of autism of 1%, then for every 10,000 women who continue treatment during pregnancy, 23 additional cases of autism would occur. This number may be alarming to some patients and reassuring to others.
Hedvig Nordeng, PhD, Angela Lupattelli, PhD, and Mollie Wood, PhD, are from the University of Oslo. These comments are adapted from an accompanying editorial (BMJ 2017;358:j3950 doi: 10.1136/bmj.j3950). No conflicts of interest were declared.
Antidepressant use before and during pregnancy may be associated with an increased risk of psychiatric disorders in offspring, according to the results of a population-based cohort study published Sept. 7 in the BMJ.
There have been contradictory findings in the literature about whether in utero exposure to SSRIs is associated with autism spectrum disorder and ADHD. “However, these studies did not investigate the overall risk of psychiatric disorders, which is important because differentiating between overlapping symptoms and diagnosing specific disorders are challenging in children and adolescents,” Xiaoqin Liu, MD, PhD, of Aarhus University in Denmark, and her coauthors wrote (BMJ 2017;358:j3668. doi: 10.1136/bmj.j3668).
Participants were categorized into four groups based on maternal use of antidepressants; unexposed, antidepressant discontinuation (if the mother had used in the 2 years before but not during pregnancy), antidepressant continuation (if the use happened in the 2 years before pregnancy and during it), and new users (if antidepressant use happened only during pregnancy).
The study found that children whose mothers used antidepressants both in the 2 years before pregnancy and during pregnancy had a 27% higher incidence of any psychiatric disorder, compared with children whose mothers had used antidepressants but discontinued them before becoming pregnant (95% confidence interval, 1.17-1.38).
This figure was adjusted for factors such as maternal age and psychiatric history at delivery, psychiatric treatment in the 2 years before pregnancy, other psychotropic medications used during pregnancy, and paternal psychiatric history at the time of delivery.
Any maternal antidepressant use was associated with an increased risk of psychiatric disorders in the offspring, compared with the unexposed group. The 15-year cumulative incidence of psychiatric disorders in offspring was 8% in the unexposed group, 11.5% in the discontinuation group, 13.6% in the continuation group, and 14.5% in the new user group.
There were no differences in risk between children exposed to SSRI monotherapy and those exposed to non-SSRI monotherapy, although the statistical precision for the latter was low, the researchers noted. However, they did see a lower risk of psychiatric disorder in children who were exposed only during the first trimester, compared with those exposed in the second or third trimesters.
The researchers suggested that the association between in utero exposure and the risk of psychiatric disorders in offspring may be the result of a combination of underlying maternal disorders and in utero antidepressant exposure. “We speculated that this increased risk could be due to the severity of underlying maternal psychiatric disorders because mothers with severe symptoms are more likely to continue treatment during pregnancy,” they wrote.
The researchers cautioned that discontinuation of treatment could lead to psychiatric episodes that could have long-lasting effects on both mother and child.
The investigators reported support from several research foundations, as well as institutional grants from Sage Therapeutics and Janssen. No conflicts of interest were declared.
FROM THE BMJ
Key clinical point:
Major finding: Children whose mothers took antidepressants both before and during pregnancy are 27% more likely to develop psychiatric illness than are those whose mothers stopped taking antidepressants before pregnancy.
Data source: A population-based cohort study in 905,383 liveborn singletons.
Disclosures: The investigators reported support from several research foundations, as well as institutional grants from Sage Therapeutics and Janssen. No conflicts of interest were declared.
Does microneedling have a role in aesthetics?
AT MOAS 2017
SAN DIEGO – When Jill S. Waibel, MD, first saw a dermal roller microneedling device around 2004, it reminded her of a weapon that might be conjured up by the character Dr. Kaufman, a professional assassin who appeared in the 1997 James Bond film, “Tomorrow Never Dies.”
“I’m thinking, that thing looks super painful,” Dr. Waibel said at the annual Masters of Aesthetics Symposium.
Patients seek microneedling treatments to rejuvenate skin; to treat acne scarring, other scars, striae, and rhytides; and to improve pigmentation. Its mechanism of action remains elusive. The hypothesis for microneedling’s effects on superficial rhytides, the wound that it creates induces production of new collagen and that multiple tiny wounds in the skin stimulate the release of various growth factors that play a role in collagen synthesis. When used on atrophic scars, the hypothesis is that microneedling breaks apart collagen bundles in the superficial layer of the dermis while inducing production of collagen. Authors of a recent systematic review on the topic found that the procedure showed noteworthy results on its own, particularly when combined with radio-frequency features (J Plast Reconstr Aesthet Surg. 2017 Jun 17. pii: S1748-6815[17]30250-4. doi: 10.1016/j.bjps.2017.06.006).
“However, there were shortcomings with most of the research: There were small numbers of patients, studies that were not randomized, not controlled, and further research is needed to see if microneedling truly works,” said Dr. Waibel, who was not involved with the analysis.
Microneedling devices come in many forms, including manual rollers, fixed-needle rollers, electric-powered pens, and devices with a new light-emitting microneedling technology. Of the five devices currently cleared by the Food and Drug Administration, four feature bipolar radio frequency and insulated needles, while one is a bipolar radio-frequency device (Infini) that contains noninsulated needles. Dr. Waibel favors the electric-powered pens, such as the StrataPen and the Eclipse MicroPen, that enable the user to adjust operating speed and penetration depths from 0.5 mm-3.0 mm, as well as feature disposable needle tips and disposable needles. These devices allow the depth of penetration to be changed according to what part of the face is being treated: “So on thinner areas of the face, like the forehead and the nose, you’re going to treat with a depth of 0.5 mm-1.0 mm, whereas in thicker areas, like the cheeks, you go up to 3.0 mm,” she said. “Typically, we do vertical and horizontal passes, repeating three to six times. When you see pinpoint bleeding, that’s the sign to stop. You can stop prior to that as well.”
One split-face study compared microneedling with nonablative fractional laser in 30 patients with atrophic scars, who underwent five sessions 1 month apart. (Dermatol Surg 2017; 43:S47-56). At 3 months, the side of the face treated with the laser showed a 70% improvement, compared with 30% for the side treated with microneedling (P less than .001). The researchers observed significantly lower pain scores with the laser procedure, but microneedling had a significantly shorter down time. A separate study of 12 healthy adults found that pretreatment with an ablative fractional laser significantly intensifies protoporphyrin IX fluorescence to a larger extent than curettage, microdermabrasion, microneedling, and nonablative fractional laser (JAMA Derm. 2017;153[4]:270-8). “So the message is that lasers are still superior, but there may be a role for microneedling,” Dr. Waibel said.
Since she began dabbling with microneedling in her practice over the past year, Dr. Waibel has found it is a good option for younger patients and for patients who desire little to no recovery time. “These are not expensive procedures for someone who doesn’t have a lot of skin damage,” she said. “It’s also good for difficult indications to improve, like striae. If I charge patients a few hundred dollars for a laser treatment, maybe I can do two or three follow-ups with the microneedle to stimulate collagen. This has become one of my go-tos with the radio-frequency device. I’ll do one fractional ablative laser treatment, then I’ll do two of the radiofrequency microneedle devices 1 and 2 months later. Then I’ll reassess to see what they need next. Or you might tweak [the course of treatment] after isolated laser treatments.”
Using a microneedle device requires meticulous cleaning of the intended treatment area prior to the procedure to avoid introducing bacteria or makeup into the skin. Dr. Waibel uses topical anesthesia for 20-30 minutes and then applies hyaluronic acid gel on the treatment surface to facilitate the gliding action of the device. “The technique involves perpendicular device placement with manual skin traction for smooth delivery of microneedles, going in vertical, horizontal, and oblique motions,” she explained. “Pinpoint bleeding is your guide for the pens. You don’t get pinpoint bleeding with some of the actual devices. Use manual pressure with ice and water to stop the bleeding.”
Contraindications for microneedling include patients with an active infection (such as herpes labialis), acne, and a predisposition for keloid scarring. Caution is advised with concomitant use of topical products of any type during a microneedling procedure because of the risk of granuloma formation. In 2014, researchers published a case series of three patients who developed biopsy-proven foreign body granulomas after the application of topical products during microneedling, including two cases that involved topical vitamin C (JAMA Dermatol 2014;150[1]:68-72).
“These are new devices, and we have new questions,” Dr. Waibel concluded. “I think they have a role, but we don’t fully understand the mechanism of action, and we have to be very careful about putting pharmacology down these channels. We don’t know the best treatment intervals, and we don’t know the best devices,” she added, pointing out that many of the devices have no indications cleared by the FDA yet.
She also noted that the FDA has put a hold on many microneedling devices from being sold in the United States until appropriate safety and efficacy data are collected.
Dr. Waibel disclosed that she has conducted clinical research for Strata Sciences, Aquavit, and Lutronic. She is also a member of the advisory board for Lutronic.
Risk factors for pulmonary hypertension identified in lupus patients
The presence of specific autoantibodies may help to identify the small percentage of patients with systemic lupus erythematosus (SLE) who are at higher risk of developing pulmonary arterial hypertension after SLE diagnosis and may also detect those at lower risk of death, according to findings from a retrospective study of French patients.
Eric Hachulla, MD, of the University of Lille (France) and his coinvestigators reported that 51 SLE patients in the French Pulmonary Hypertension Registry who had a diagnosis of pulmonary arterial hypertension (PAH) confirmed by right heart catheterization were more likely to have the condition if they had anti-SSA and anti-SSB antibodies, compared with a control group of 101 SLE patients without known PAH who were selected from SLE expert centers participating in the registry. Overall, anti-SSA antibodies were present in 62% of PAH patients vs. 40% of non-PAH patients, and anti-SSB antibodies were detected in 27% with PAH, compared with 8% of those without.
Following SLE diagnosis, the 51 SLE patients had a median delay in diagnosis of PAH by about 5 years. Their survival was 89% at 3 years and 84% at 5 years. “Survival appeared to be substantially better than that still observed today in [PAH associated with systemic sclerosis], where estimated 3-year survival is about 50%. Our survival rates are comparable to those reported by Sobanski et al. in the recently published study for the U.K. SLE-PAH cohort (85% at 5 years),” the authors wrote.
In the current study, mortality during 10 years of follow-up was significantly lower among patients who had anti–U1-RNP antibodies than among those who did not (0% vs. 25%; P = .04). This finding of improved survival in patients with anti–U1-RNP antibodies mirrored the results reported in the British SLE-PAH cohort study and a 2016 Chinese study, indicating that “the presence of anti–U1-RNP antibodies appears to be a protective factor in terms of survival.”
Treatment with hydroxychloroquine followed a trend toward increased survival, but was not statistically significant (hazard ratio, 0.31; 95% confidence interval, 0.09-1.11; P = .07).
“These findings must be interpreted with caution due to the small number of untreated patients and require further investigations in other cohorts,” the investigators wrote. But “based on our results on the potential effect of hydroxychloroquine, this treatment might be used in association with the immunosuppressive strategy for SLE-PAH patients.”
Read more of the findings in CHEST (2017 Aug 26. doi: 10.1016/j.chest.2017.08.014).
FROM CHEST
Sen. Alexander seeks quick, passable steps to stabilize individual markets
WASHINGTON – Sen. Lamar Alexander (R-Tenn.) wants two quick fixes to stabilize the individual health insurance market so that Congress can come together to craft a long-term solution.
There seems to be “general consensus that we should see what can we do, No. 1, on the cost-sharing payments and, No. 2, on amending 1332 [waiver program] to provide flexibility to the states,” Sen. Alexander*, chairman of the Senate Health, Education, Labor, and Pensions Committee said Sept. 6 after the first of four hearings the committee is holding on creating stability for the individual health insurance market.
Chairman Alexander said that he hopes to have a small, passable legislative proposal ready by Sept. 14, in time to allow insurers to make last-minute adjustments to their individual market bids, which are due to state insurance commissioners by Sept. 20.
Sen. Patty Murray (D-Wash.), the committee’s ranking member, stressed the urgent need to pass a quick fix, noting that insurance premiums could rise as much as 20% higher than they would have, if there is no guarantee on the cost-sharing reduction (CSR) payments.
A panel of state insurance commissioners all agreed with the two proposals, though there were suggestions that the CSR payments should be guaranteed for at least a year, if not longer, beyond 2018, which was when Chairman Alexander suggested the guarantee should sunset.
“The CSR funding issue is the single most critical issue you can address to help stabilize insurance markets in 2018,” Julie Mix McPeak, commissioner of the Tennessee Department of Commerce and Insurance, testified at the hearing. She emphasized that it is not an insurance bailout. “CSR funding ensures that some of our most vulnerable consumers receive assistance for copays and deductibles that are required to be paid under federal law and has the effect of reducing proposed premium increases and has a direct impact on the amount of subsidy assistance provided by the federal government.”
“You must permanently fund the cost-sharing reduction payments,” Mike Kreidler, insurance commissioner for the state of Washington, testified during the hearing. “That is something that is going help a great deal in our marketplace.”
The commissioners also advocated for a reinsurance program.
Ms. McPeak called for Congress to “establish a reinsurance mechanism that would stop losses for individual claims at a specified amount to increase market participation by carriers. For the most immediate impact, this backstop mechanism must be federal, as it would be impossible for many states to develop such a program for the 2018 plan year.”
“I urge you to create a federal reinsurance program this year,” Mr. Kreidler said. “Doing this would show your commitment to stabilizing the market. They worked very well in the state of Washington for the first 3 years we had a reinsurance program. We would like to see it continue and go forward.”
In talking about fixing 1332 waivers, which allow states to develop a specific proposal that works within the parameters of the Affordable Care Act but offers flexibility to create programs that are unique to a state’s needs, Lori Wing-Heier, director of the Alaska Division of Insurance talked about her state’s successful efforts to get a wavier for its reinsurance program.
“The waiver process is somewhat onerous in the fact that there is not a defined application to submit,” Ms. Wing-Heier said, leaving it up to states to make sure they are providing all the requested information. “After that, the part that is stifling states right now is the 6-month waiting period before they receive final approval.”
Other issues were raised by both panelists and senators, including the cost of delivering health care, the cost of prescription drugs, and cuts to marketing budgets, but Chairman Alexander said that he did not want to expand a proposal beyond his two points.
“My whole focus right now is: What can we do to take a couple of steps to stabilize the individual market?” he said, although he suggested that if there were clear consensus on other aspects, they could be considered.
The archived hearing can be viewed on the committee’s website.
gtwachtman@frontlinemedcom.com
CORRECTION, 9/8/17: An earlier version of this story misidentified the HELP Committee chairman.
AT A SENATE HELP COMMITTEE HEARING
Can High Frequency Oscillations Help Predict Seizures?
A recently published practical guide can help epilepsy specialists record and interpret high-frequency oscillations (HFOs), which have been implicated as promising markers for the disease. Such biomarkers may help better locate areas in which to perform surgery. Researchers offer the following observations:
- To accurately record HFOs, experts emphasize the importance of low noise recording to reduce artifacts.
- Even under ideal conditions, artifacts can still occur, including muscle contractions, movement, and filtering.
- Magnetoencephalography (MEG) and EEG recordings are capable of recording ripples while intracranial EEG can record ripples, fast ripples, and very high frequency oscillations.
- Nonetheless, MEG and intracranial EEG recordings can also experience artifacts.
- Researchers believe that HFOs represent a new type of electromagnetic biomarker that can detect epileptogenic brain tissue, but several technical barriers need to be overcome before clinicians can use them as tools in community practice.
- Software engineers are in the process of developing HFO filters and automatic detection tools to help bring this technology to market.
Zijlmans M, Worrell GA, Dümpelmann M, et al. How to record high-frequency oscillations in epilepsy: A practical guideline. Epilepsia. 2017;58(8):1305-1315. d