User login
Incorporating an EWS Into Practice
Patients who deteriorate outside highly monitored settings and who require unplanned transfer to the intensive care unit (ICU) are known to have high mortality and morbidity.[1, 2, 3, 4, 5] The notion that early detection of a deteriorating patient improves outcomes has intuitive appeal and is discussed in a large number of publications.[6, 7, 8, 9, 10] However, much less information is available on what should be done after early detection is made.[11] Existing literature on early warning systems (EWSs) does not provide enough detail to serve as a map for implementation. This lack of transparency is complicated by the fact that, although the comprehensive inpatient electronic medical record (EMR) now constitutes the central locus for clinical practice, much of the existing literature comes from research institutions that may employ home‐grown EMRs, not community hospitals that employ commercially available systems.
In this issue of the Journal of Hospital Medicine, we describe our efforts to bridge that gap by implementing an EWS in a pair of community hospitals. The EWS's development and its basic statistical and electronic infrastructure are described in the articles by Escobar and Dellinger and Escobar et al.[2, 12, 13] In this report, we focus on how we addressed clinicians' primary concern: What do we do when we get an alert? Because it is described in detail by Granich et al.[14] elsewhere in this issue of the Journal of Hospital Medicine, a critical component of our implementation process (ensuring that patient preferences with respect to supportive care are honored) is not discussed.
Our article is divided into the following sections: rationale, preimplementation preparatory work, workflow development, response protocols, challenges and key learnings, and concluding reflections.
RATIONALE
Much of the previous work on the implementation of alarm systems has focused on the statistics behind detection or on the quantification of processes (eg, how many rapid response calls were triggered) or on outcomes such as mortality. The conceptual underpinnings and practical steps necessary for successful integration of an alarm system into the clinicians' workflow have not been articulated. Our theoretical framework was based on (1) improving situational awareness[15] (knowing what is going on around you and what is likely to happen next) and (2) mitigating cognitive errors.
An EWS enhances situational awareness most directly by earlier identification of a problem with a particular patient. As is detailed by Escobar et al.[16] in this issue of the Journal of Hospital Medicine, our EWS extracts EMR data every 6 hours, performs multiple calculations, and then displays 3 scores in real time in the inpatient dashboard (known as the Patient Lists activity in the Epic EMR). The first of these scores is the Laboratory‐Based Acute Physiologic Score, version 2 (LAPS2), an objective severity score whose retrospective version is already in use in Kaiser Permanente Northern California (KPNC) for internal benchmarking.[13] This score captures a patient's overall degree of physiologic instability within the preceding 72 hours. The second is the Comorbidity Point Score, version 2 (COPS2), a longitudinal comorbidity score based on the patient's diagnoses over the preceding 12 months.[13] This score captures a patient's overall comorbidity burden. Thus, it is possible for a patient to be very ill (high COPS2) while also being stable (low LAPS2) or vice versa. Both of these scores have other uses, including prediction of rehospitalization risk in real time,[17] which is also being piloted at KPNC. Finally, the Advanced Alert Monitoring (AAM) score, which integrates the LAPS2 and COPS2 with other variables, provides a 12‐hour deterioration risk, with a threshold value of 8% triggering response protocols. At or above this threshold, which was agreed to prior to implementation, the system achieves 25% sensitivity, 98% specificity, with a number needed to evaluate of 10 to 12, a level of workload that was felt to be acceptable by clinicians. Actions triggered by the EWS may be quite different from those one would take when being notified of a code blue, which is called at the time an event occurs. The EWS focuses attention on patients who might be missed because they do not yet appear critically ill. It also provides a shared, quantifiable measure of a patient's risk that can trigger a standardized plan of action to follow in evaluating and treating a patient.[15]
In addition to enhancing situational awareness, we intended the alarms to produce cognitive change in practitioners. Our goal was to replace medical intuition with analytic, evidence‐based judgment of future illness. We proceeded with the understanding that replacing quick intuition with slower analytic response is an essential skill in developing sound clinical reasoning.[18, 19, 20] The alert encourages physicians to reassess high‐risk patients facilitating a cognitive shift from automatic, error‐prone processing to slower, deliberate processing. Given the busy pace of ward work, slowing down permits clinicians to reassess previously overlooked details. Related to this process of inducing cognitive change is a secondary effect: we uncovered and discussed physician biases. Physicians are subject to potential biases that allow patients to deteriorate.[18, 19, 20] Therefore, we addressed bias through education. By reviewing particular cases of unanticipated deterioration at each hospital facility, we provided evidence for the problem of in‐hospital deterioration. This framed the new tool as an opportunity for improving treatment and encouraged physicians to act on the alert using a structured process.
INTERVENTIONS
Preimplementation Preparatory Work
Initial KPNC data provided strong support for the generally accepted notion that unplanned transfer patients have poor outcomes.[2, 4, 5] However, published reports failed to provide the granular detail clinicians need to implement a response arm at the unit and patient level. In preparation for going live, we conducted a retrospective chart review. This included data from patients hospitalized from January 1, 2011 through December 31, 2012 (additional detail is provided in the Supporting Information, Appendix, in the online version of this article). The key findings from our internal review of subjective documentation preceding deterioration are similar to those described in the literature and summarized in Figure 1, which displays the 5 most common clinical presentations associated with unplanned transfers.
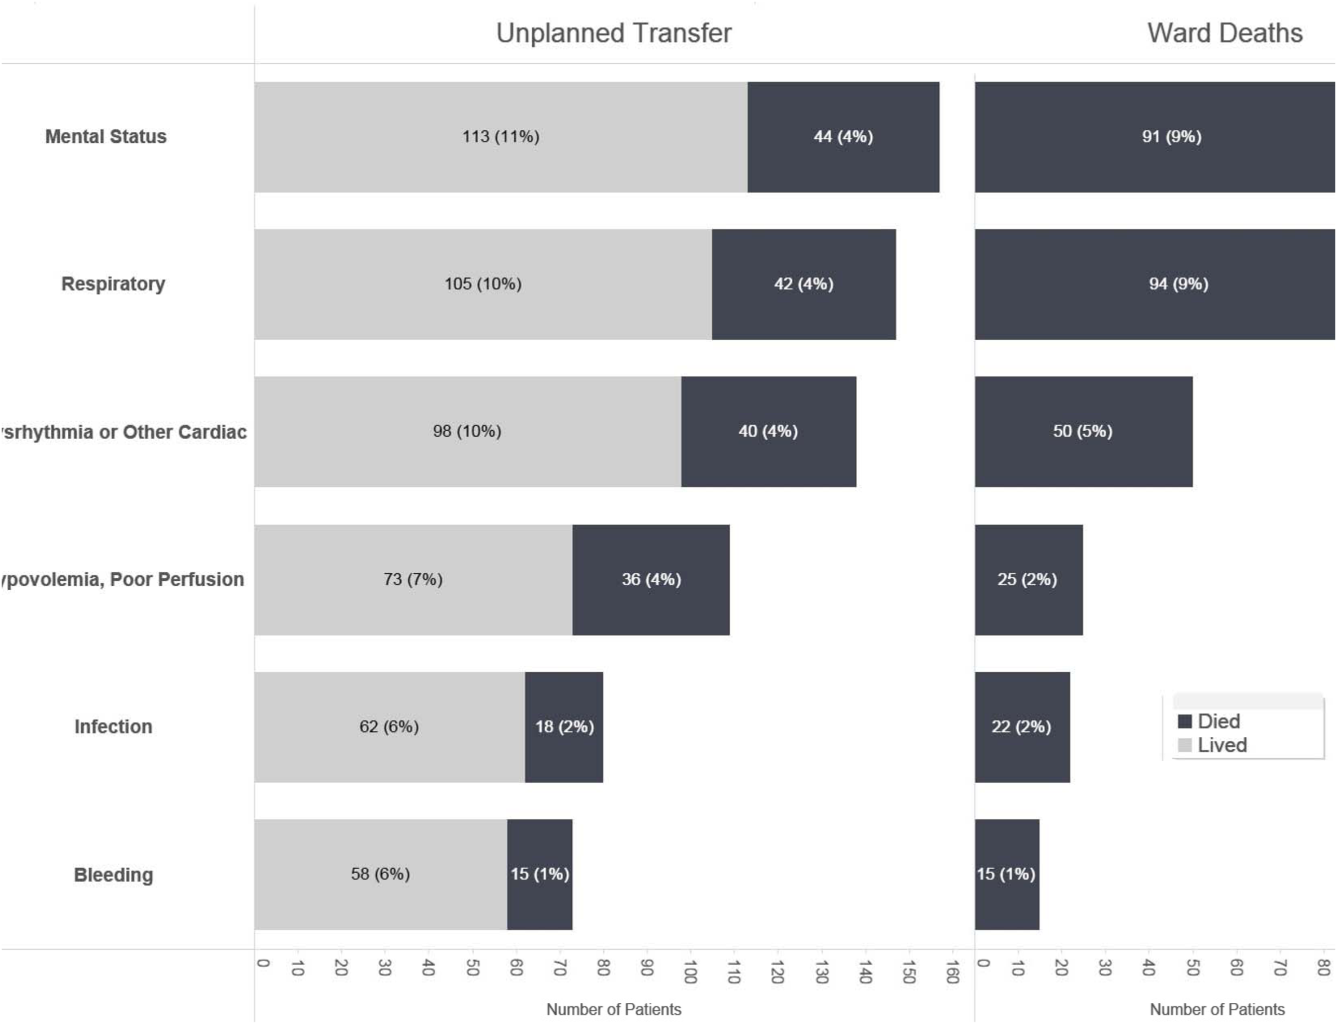
The chart review served several major roles. First, it facilitated cognitive change by eliminating the notion that it can't happen here. Second, it provided considerable guidance on key clinical components that had to be incorporated into the workflow. Third, it engaged the rapid response team (RRT) in reviewing our work retrospectively to identify future opportunities. Finally, the review provided considerable guidance with respect to structuring documentation requirements.
As a result of the above efforts, other processes detailed below, and knowledge described in several of the companion articles in this issue of the Journal of Hospital Medicine, 3 critical elements, which had been explicitly required by our leadership, were in place prior to the go‐live date: a general consensus among hospitalists and nurses that this would be worth testing, a basic clinical response workflow, and an automated checklist for documentation. We refined these in a 2‐week shadowing phase preceding the start date. In this phase, the alerts were not displayed in the EMR. Instead, programmers working on the project notified selected physician leaders by phone. This permitted them to understand exactly what sort of patients were reaching the physiologic threshold so that they could better prepare both RRT registered nurses (RNs) and hospitalists for the go‐live date. This also provided an opportunity to begin refining the documentation process using actual patients.
The original name for our project was Early Detection of Impending Physiologic Deterioration. However, during the preparatory phase, consultation with our public relations staff led to a concern that the name could be frightening to some patients. This highlights the need to consider patient perceptions and how words used in 1 way by physicians can have different connotations to nonclinicians. Consequently, the system was renamed, and it is now referred to as Advance Alert Monitoring (AAM).
Workflow Development
We carefully examined the space where electronic data, graphical user interfaces, and clinical practice blend, a nexus now commonly referred to as workflow or user experience.[21] To promote situational awareness and effect cognitive change, we utilized the Institute for Health Care Improvement's Plan‐Do‐Study‐Act model.[22, 23] We then facilitated the iterative development of a clinician‐endorsed workflow.[22, 23, 24, 25] By adjusting the workflow based on ongoing experience and giving clinicians multiple opportunities to revise (a process that continues to date), we ensured clinicians would approach and endorse the alarm system as a useful tool for decision support.
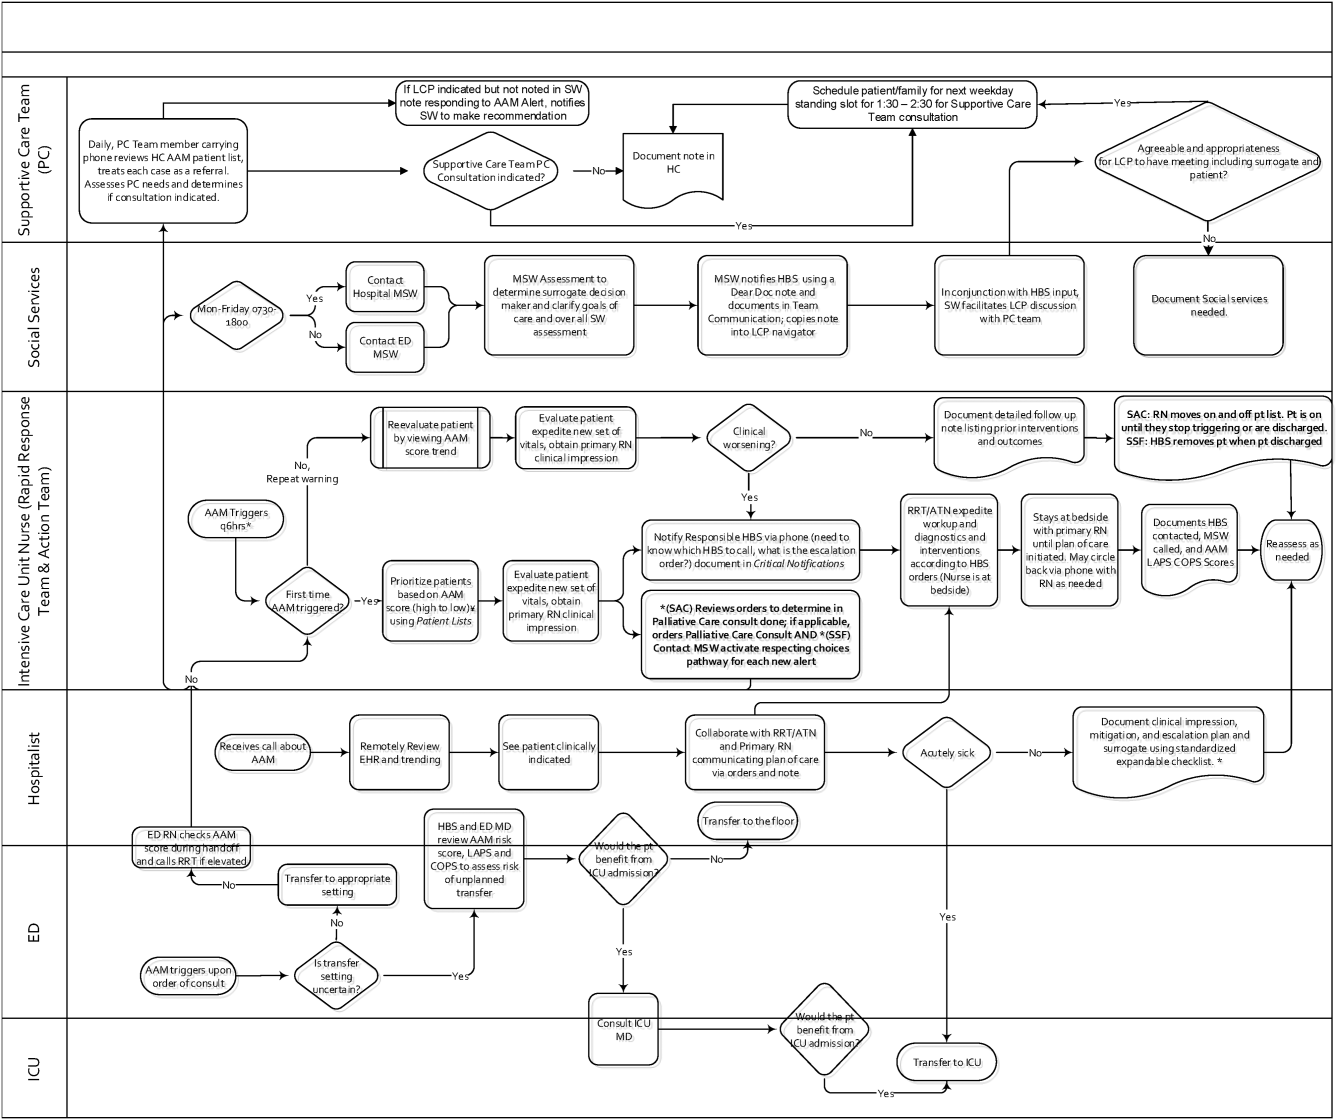
Table 1 summarizes the work groups assembled for our implementation, and Table 2 provides a system‐oriented checklist indicating key components that need to be in place prior to having an early warning system go live in a hospital. Figure 2 summarizes the alert response protocols we developed through an iterative process at the 2 pilot sites. The care path shown in Figure 2 is the result of considerable revision, mostly due to actual experience acquired following the go live date. The diagram also includes a component that is still work in progress. This is how an emergency department probability estimate (triage support) will be integrated into both the ward as well as the ICU workflows. Although this is beyond the scope of this article, other hospitals may be experimenting with triage support (eg, for sepsis patients), so it is important to consider how one would incorporate such support into workflows.
| Workgroup | Goals |
|---|---|
| |
| Clinical checklist | Perform structured chart review of selected unplanned transfer patients and near misses |
| Develop a checklist for mitigation strategies given an alert | |
| Develop documentation standards given an alert | |
| Develop escalation protocol given an alert | |
| Workload and threshold | Determine threshold for sensitivity of alerts and resulting impact on clinician workload |
| Patient preferences | Prepare background information to be presented to providers regarding end‐of‐life care and POLST orders |
| Coordinate with clinical checklist workgroup to generate documentation templates that provide guidance for appropriate management of patients regarding preferences on escalation of care and end‐of‐life care | |
| Electronic medical record coordination | Review proposed electronic medical record changes |
| Make recommendation for further changes as needed | |
| Develop plan for rollout of new and/or revised electronic record tools | |
| Designate contact list for questions/emssues that may arise regarding electronic record changes during the pilot | |
| Determine alert display choices and mode of alert notification | |
| Nursing committee | Review staffing needs in anticipation of alert |
| Coordinate with workload and threshold group | |
| Develop training calendar to ensure skills necessary for successful implementation of alerts | |
| Make recommendations for potential modification of rapid response team's role in development of a clinical checklist for nurses responding to an alert | |
| Design educational materials for clinicians | |
| Local communication strategy | Develop internal communication plan (for clinical staff not directly involved with pilot) |
| Develop external communication plan (for nonclinicians who may hear about the project) | |
| Level | Tasks |
|---|---|
| Administration | Obtain executive committee approval |
| Establish communication protocols with quality assurance and quality improvement committees | |
| Review protocols with medicallegal department | |
| Communication | Write media material for patients and families |
| Develop and disseminate scripts for front‐line staff | |
| Develop communication and meet with all relevant front‐line staff on merits of project | |
| Educate all staff on workflow changes and impacts | |
| Clinical preparation | Conduct internal review of unplanned transfers and present results to all clinicians |
| Determine service level agreements, ownership of at‐risk patients, who will access alerts | |
| Conduct staff meetings to educate staff | |
| Perform debriefs on relevant cases | |
| Determine desired outcomes, process measures, balancing measures | |
| Determine acceptable clinician burden (alerts/day) | |
| Technology | Establish documentation templates |
| Ensure access to new data fields (electronic medical record security process must be followed for access rights) | |
| Workflows | Workflows (clinical response, patient preferences, supportive care, communication, documentation) must be in place prior to actual go live |
| Shadowing | Testing period (alerts communicated to selected clinicians prior to going live) should occur |
RESPONSE PROTOCOLS
At South San Francisco, the RRT consists of an ICU nurse, a respiratory care therapist, and a designated hospitalist; at Sacramento, the team is also augmented by an additional nurse (the house supervisor). In addition to responding to the AAM alerts, RRT nurses respond to other emergency calls such as code blues, stroke alerts, and patient or patient‐familyinitiated rapid response calls. They also expedite time sensitive workups and treatments. They check up on recent transfers from the ICU to ensure continued improvement justifying staying on the ward. Serving as peer educators, they assist with processes such as chest tube or central line insertions, troubleshoot high‐risk medication administration, and ensure that treatment bundles (eg, for sepsis) occur expeditiously.
The RRT reviews EWS scores every 6 hours. The AAM score is seen as soon as providers open the chart, which helps triage patients for evaluation. Because patients can still be at risk even without an elevated AAM score, all normal escalation pathways remain in place. Once an alert is noted in the inpatient dashboard, the RRT nurse obtains a fresh set of vital signs, assesses the patient's clinical status, and informs the physician, social worker, and primary nurse (Figure 2). Team members work with the bedside nurse, providing support with assessment, interventions, plans, and follow‐up. Once advised of the alert, the hospitalist performs a second chart review and evaluates the patient at the bedside to identify factors that could underlie potential deterioration. After this evaluation, the hospitalist documents concerns, orders appropriate interventions (which can include escalation), and determines appropriate follow‐up. We made sure the team knew that respiratory distress, arrhythmias, mental status changes, or worsening infection were responsible for over 80% of in‐hospital deterioration cases. We also involved palliative care earlier in patient care, streamlining the process so the RRT makes just 1 phone call to the social worker, who contacts the palliative care physician and nurse to ensure patients have a designated surrogate in the event of further deterioration.
Our initial documentation template consisted of a comprehensive organ system‐based physician checklist. However, although this was of use to covering physicians unfamiliar with a given patient, it was redundant and annoying to attending providers already familiar with the patient. After more than 30 iterations, we settled on a succinct note that only documented the clinicians' clinical judgment as to what constituted the major risk for deterioration and what the mitigation strategies would be. Both of these judgments are in a checklist format (see Supporting Information, Appendix, in the online version of this article for the components of the physician and nurse notes).
Prior to the implementation of the system, RRT nurses performed proactive rounding by manually checking patient labs and vital signs, an inefficient process due to the poor sensitivity and specificity of individual values. Following implementation of the system, RRT RNs and clinicians switched to sorting patients by the 3 scores (COPS2, LAPS2, AAM). For example, patients may be stable at admission (as evidenced by their AAM score) but be at high risk due to their comorbidities. One approach that has been employed is to proactively check such patients to ensure they have a care directive in place, as is described in the article by Granich et al.[14] The Supportive Care Team (detailed in Granich et al.) assesses needs for palliative care and provides in‐hospital consultation as needed. Social services staff perform chart reviews to ensure a patient surrogate has been defined and also works with patients and their families to clarify goals of care.
CHALLENGES AND KEY LEARNINGS
One challenge that arose was reconciling the periodic nature of the alert (every 6 hours) with physicians' availability, which varied due to different rounding workflows at the 2 sites. Consequently, the alert cycle was changed; at the first site, the cycle was set to 1000‐1600‐2200‐0400, whereas the second site chose 0800‐1400‐2000‐0200.
One essential but problematic component of the clinical response is the issue of documentation. Inadequate documentation could lead to adverse outcomes, clinician malpractice exposure, and placing the entire hospital at risk for enterprise liability when clinical responses are not documented. This issue is complicated by the fact that overzealous efforts could lead to less or no documentation by making it too onerous for busy clinicians. We found that the ease with which data can populate progress notes in the EMR can lead to note bloat. Clearly, no documentation is not enough, and a complete history and physical is too much. Paradoxically, 1 of the issues underlying our problems with documentation was the proactive nature of the alerts themselves; because they are based on an outcome prediction in the next 12 hours, documenting the response to them may lack (perceived) urgency.
Shortly after the system went live, a patient who had been recently transferred out to the ward from the ICU triggered an alert. As a response was mounted, the team realized that existing ward protocols did not specify which physician service (intensivist or hospitalist) was responsible for patients who were transitioning from 1 unit to another. We also had to perform multiple revisions of the protocols specifying how alerts were handled when they occurred at times of change of shift. Eventually, we settled on having the combination of a hospitalist and an RRT nurse as the cornerstone of the response, with the hospitalist service as the primary owner of the entire process, but this arrangement might need to be varied in different settings. As a result of the experience with the pilot, the business case for deployment in the remaining 19 hospitals includes a formal budget request so that all have properly staffed RRTs, although the issue of primary ownership of the alert process for different patient types (eg, surgical patients) will be decided on a hospital‐by‐hospital basis. These experiences raise the intriguing possibility that implementation of alert systems can lead to the identification of systemic gaps in existing protocols. These gaps can include specific components of the hospital service agreements between multiple departments (emergency, hospital medicine, ICU, palliative care, surgery) as well as problems with existing workflows.
In addition to ongoing tweaking of care protocols, 3 issues remain unresolved. First is the issue of documentation. The current documentation notes are not completely satisfactory, and we are working with the KPNC EMR administrators to refine the tool. Desirable refinements include (1) having the system scores populate in more accessible sectors of the EMR where their retrieval will facilitate increased automation of the note writing process, (2) changing the note type to a note that will facilitate process audits, and (3) linking the note to other EMR tools so that the response arm can be tracked more formally. The second issue is the need to develop strategies to address staff turnover; for example, newer staff may not have received the same degree of exposure to the system as those who were there when it was started. Finally, due to limited resources, we have done very limited work on more mechanistic analyses of the clinical response itself. For example, it would be desirable to perform a formal quantitative, risk‐adjusted process‐outcome analysis of why some patients' outcomes are better than others following an alert.
Finally, it is also the case that we have had some unexpected occurrences that hint at new uses and benefits of alert systems. One of these is the phenomenon of chasing the alert. Some clinicians, on their own, have taken a more proactive stance in the care of patients in whom the AAM score is rising or near the alert threshold. This has 2 potential consequences. Some patients are stabilized and thus do not reach threshold instability levels. In other cases, patients reach threshold but the response team is informed that things are already under control. A second unexpected result is increased requests for COPS2 scores by clinicians who have heard about the system, particularly surgeons who would like to use the comorbidity scores as a screening tool in the outpatient setting. Because KPNC is an integrated system, it is not likely that such alternatives will be implemented immediately without considerable analysis, but it is clear that the system's deployment has captured the clinicians' imagination.
CONCLUSIONS AND FUTURE DIRECTIONS
Our preparatory efforts have been successful. We have found that embedding an EWS in a commercially available EMR is acceptable to hospital physicians and nurses. We have developed a coordinated workflow for mitigation and escalation that is tightly linked to the availability of probabilistic alerts in real time. Although resource limitations have precluded us from conducting formal clinician surveys, the EWS has been discussed at multiple hospital‐wide as well as department‐specific meetings. Although there have been requests for clarification, refinements, and modifications in workflows, no one has suggested that the system be discontinued. Further, many of the other KPNC hospitals have requested that the EWS be deployed at their site. We have examined KPNC databases that track patient complaints and have not found any complaints that could be linked to the EWS. Most importantly, the existence of the workflows we have developed has played a major role in KPNC's decision to deploy the system in its remaining hospitals.
Although alert fatigue is the number 1 reason that clinicians do not utilize embedded clinical decision support,[26] simply calibrating statistical models is insufficient. Careful consideration of clinicians' needs and responsibilities, particularly around ownership of patients and documentation, is essential. Such consideration needs to include planning time and socializing the system (providing multiple venues for clinicians to learn about the system as well as participate in the process for using it).
We anticipate that, as the system leaves the pilot stage and becomes a routine component of hospital care, additional enhancements (eg, sending notifications to smart phones, providing an alert response tracking system) will be added. Our organization is also implementing real‐time concurrent review of inpatient EMRs (eg, for proactive detection of an expanded range of potential process failures), and work is underway on how to link the workflows we describe here with this effort. As has been the case with other systems,[27] it is likely that we will eventually move to continuous scanning of patient data rather than only every 6 hours. Given that the basic workflow is quite robust and amenable to local modifications, we are confident that our clinicians and hospitals will adapt to future system enhancements.
Lastly, we intend to conduct additional research on the clinical response itself. In particular, we consider it extremely important to conduct formal quantitative analyses on why some patients' outcomes are better than others following an alert. A key component of this effort will be to develop tools that can permit an automatedor nearly automatedassessment of the clinical response. For example, we are considering automated approaches that would scan the EMR for the presence of specific orders, notes, vital signs patterns, and laboratory tests following an alert. Whereas it may not be possible to dispense with manual chart review, even partial automation of a feedback process could lead to significant enhancement of our quality improvement efforts.
Acknowledgements
The authors thank Dr. Michelle Caughey, Dr. Philip Madvig, Dr. Brian Hoberman, Dr. Patricia Conolly, and Ms. Barbara Crawford for their administrative support; Dr. Tracy Lieu for reviewing the manuscript; and Ms. Rachel Lesser for formatting the manuscript. The authors also thank Drs. Jason Anderson, John Fitzgibbon, Elena M. Nishimura, and Najm Haq for their support of the project. We are particularly grateful to our nurses, Theresa A. Villorente, Zoe Sutton, Doanh Ly, Catherine Burger, and Hillary R. Mitchell, for their critical assistance. Last but not least, we also thank all the hospitalists and nurses at the Kaiser Permanente Sacramento and South San Francisco hospitals.
Disclosures: This work was supported by a grant from the Gordon and Betty Moore Foundation (Early Detection, Prevention, and Mitigation of Impending Physiologic Deterioration in Hospitalized Patients Outside Intensive Care: Phase 3, pilot), The Permanente Medical Group, Inc., and Kaiser Foundation Hospitals, Inc. Dr. Liu was supported by the National Institute for General Medical Sciences award K23GM112018. As part of our agreement with the Moore Foundation, we made a commitment to disseminate our findings in articles such as this one. However, the Gordon and Betty Moore Foundation played no role in how we actually structured our articles, nor did they review or preapprove any of the manuscripts submitted as part of the dissemination component; the same was the case with the other sponsors. None of the authors has any conflicts of interest to declare of relevance to this work
- , , , , . Location of patients before transfer to a tertiary care intensive care unit: impact on outcome. J Crit Care. 2009;24(1):108–113.
- , , , , , . Intra‐hospital transfers to a higher level of care: contribution to total hospital and intensive care unit (ICU) mortality and length of stay (LOS). J Hosp Med. 2011;6(2):74–80.
- , , , . Unplanned transfers to a medical intensive care unit: causes and relationship to preventable errors in care. J Hosp Med. 2011;6(2):68–72.
- , , , . Adverse outcomes associated with delayed intensive care unit transfers in an integrated healthcare system. J Hosp Med. 2012;7(3):224–230.
- , , , , , . Risk factors for unplanned transfer to intensive care within 24 hours of admission from the emergency department in an integrated healthcare system. J Hosp Med. 2013;8(1):13–19.
- , , , , , . Reducing hospital standardized mortality rate with early interventions. J Trauma Nursing. 2006;13(4):178–182.
- , , , , , . Centile‐based early warning scores derived from statistical distributions of vital signs. Resuscitation. 2011;82(8):1013–1018.
- , , , et al. Randomized trial of automated, electronic monitoring to facilitate early detection of sepsis in the intensive care unit. Crit Care Med. 2012;40(7):2096–2101.
- , , , et al. Early recognition of acutely deteriorating patients in non‐intensive care units: assessment of an innovative monitoring technology. J Hosp Med. 2012;7(8):628–633.
- , , , et al. A randomized trial of real‐time automated clinical deterioration alerts sent to a rapid response team. J Hosp Med. 2014;9(7):424–429.
- , , , et al. Improving situation awareness to reduce unrecognized clinical deterioration and serious safety events. Pediatrics. 2013;131(1):e298–e308.
- , , , , , . Early detection of impending physiologic deterioration among patients who are not in intensive care: development of predictive models using data from an automated electronic medical record. J Hosp Med. 2012;7(5):388–395.
- , , , , . Risk‐adjusting hospital mortality using a comprehensive electronic record in an integrated healthcare delivery system. Med Care. 2013;51(5):446–453.
- , , . et al. Early detection of critical illness outside the intensive care unit: clarifying treatment plans and honoring goals of care using a supportive care team. J Hosp Med. 2016;11:000–000.
- , . A qualitative study examining the influences on situation awareness and the identification, mitigation and escalation of recognised patient risk. BMJ Qual Saf. 2014;23(2):153–161.
- , , , et al. Piloting electronic medical record‐based early detection of inpatient deterioration in community hospitals. J Hosp Med. 2016;11:000–000.
- , , , , , . Nonelective rehospitalizations and postdischarge mortality: predictive models suitable for use in real time. Med Care. 2015;53(11):916–923.
- . The importance of cognitive errors in diagnosis and strategies to minimize them. Acad Med. 2003;78(8):775–780.
- , , . Cognitive debiasing 1: origins of bias and theory of debiasing. BMJ Qual Saf. 2013;22(suppl 2):ii58–ii64.
- , , . Cognitive debiasing 2: impediments to and strategies for change. BMJ Qual Saf. 2013;22(suppl 2):ii65–ii72.
- , , . Use of health information technology to reduce diagnostic errors. BMJ Qual Saf. 2013;22(suppl 2):ii40–ii51.
- , , , , , . The Improvement Guide: A Practical Approach to Enhancing Organizational Performance. 2nd ed. San Francisco, CA: Jossey‐Bass; 2009.
- , , , , . Understanding the components of quality improvement collaboratives: a systematic literature review. Milbank Q. 2013;91(2):354–394.
- , , . Reducing diagnostic errors in medicine: what's the goal? Acad Med. 2002;77(10):981–992.
- , , , . Huddling for high reliability and situation awareness. BMJ Qual Saf. 2013;22(11):899–906.
- Top 10 patient safety concerns for healthcare organizations. ECRI Institute website. Available at: https://www.ecri.org/Pages/Top‐10‐Patient‐Safety‐Concerns.aspx. Accessed February 18, 2016.
- , , , et al. Automated detection of physiologic deterioration in hospitalized patients. J Am Med Inform Assoc. 2015;22(2):350–360.
Patients who deteriorate outside highly monitored settings and who require unplanned transfer to the intensive care unit (ICU) are known to have high mortality and morbidity.[1, 2, 3, 4, 5] The notion that early detection of a deteriorating patient improves outcomes has intuitive appeal and is discussed in a large number of publications.[6, 7, 8, 9, 10] However, much less information is available on what should be done after early detection is made.[11] Existing literature on early warning systems (EWSs) does not provide enough detail to serve as a map for implementation. This lack of transparency is complicated by the fact that, although the comprehensive inpatient electronic medical record (EMR) now constitutes the central locus for clinical practice, much of the existing literature comes from research institutions that may employ home‐grown EMRs, not community hospitals that employ commercially available systems.
In this issue of the Journal of Hospital Medicine, we describe our efforts to bridge that gap by implementing an EWS in a pair of community hospitals. The EWS's development and its basic statistical and electronic infrastructure are described in the articles by Escobar and Dellinger and Escobar et al.[2, 12, 13] In this report, we focus on how we addressed clinicians' primary concern: What do we do when we get an alert? Because it is described in detail by Granich et al.[14] elsewhere in this issue of the Journal of Hospital Medicine, a critical component of our implementation process (ensuring that patient preferences with respect to supportive care are honored) is not discussed.
Our article is divided into the following sections: rationale, preimplementation preparatory work, workflow development, response protocols, challenges and key learnings, and concluding reflections.
RATIONALE
Much of the previous work on the implementation of alarm systems has focused on the statistics behind detection or on the quantification of processes (eg, how many rapid response calls were triggered) or on outcomes such as mortality. The conceptual underpinnings and practical steps necessary for successful integration of an alarm system into the clinicians' workflow have not been articulated. Our theoretical framework was based on (1) improving situational awareness[15] (knowing what is going on around you and what is likely to happen next) and (2) mitigating cognitive errors.
An EWS enhances situational awareness most directly by earlier identification of a problem with a particular patient. As is detailed by Escobar et al.[16] in this issue of the Journal of Hospital Medicine, our EWS extracts EMR data every 6 hours, performs multiple calculations, and then displays 3 scores in real time in the inpatient dashboard (known as the Patient Lists activity in the Epic EMR). The first of these scores is the Laboratory‐Based Acute Physiologic Score, version 2 (LAPS2), an objective severity score whose retrospective version is already in use in Kaiser Permanente Northern California (KPNC) for internal benchmarking.[13] This score captures a patient's overall degree of physiologic instability within the preceding 72 hours. The second is the Comorbidity Point Score, version 2 (COPS2), a longitudinal comorbidity score based on the patient's diagnoses over the preceding 12 months.[13] This score captures a patient's overall comorbidity burden. Thus, it is possible for a patient to be very ill (high COPS2) while also being stable (low LAPS2) or vice versa. Both of these scores have other uses, including prediction of rehospitalization risk in real time,[17] which is also being piloted at KPNC. Finally, the Advanced Alert Monitoring (AAM) score, which integrates the LAPS2 and COPS2 with other variables, provides a 12‐hour deterioration risk, with a threshold value of 8% triggering response protocols. At or above this threshold, which was agreed to prior to implementation, the system achieves 25% sensitivity, 98% specificity, with a number needed to evaluate of 10 to 12, a level of workload that was felt to be acceptable by clinicians. Actions triggered by the EWS may be quite different from those one would take when being notified of a code blue, which is called at the time an event occurs. The EWS focuses attention on patients who might be missed because they do not yet appear critically ill. It also provides a shared, quantifiable measure of a patient's risk that can trigger a standardized plan of action to follow in evaluating and treating a patient.[15]
In addition to enhancing situational awareness, we intended the alarms to produce cognitive change in practitioners. Our goal was to replace medical intuition with analytic, evidence‐based judgment of future illness. We proceeded with the understanding that replacing quick intuition with slower analytic response is an essential skill in developing sound clinical reasoning.[18, 19, 20] The alert encourages physicians to reassess high‐risk patients facilitating a cognitive shift from automatic, error‐prone processing to slower, deliberate processing. Given the busy pace of ward work, slowing down permits clinicians to reassess previously overlooked details. Related to this process of inducing cognitive change is a secondary effect: we uncovered and discussed physician biases. Physicians are subject to potential biases that allow patients to deteriorate.[18, 19, 20] Therefore, we addressed bias through education. By reviewing particular cases of unanticipated deterioration at each hospital facility, we provided evidence for the problem of in‐hospital deterioration. This framed the new tool as an opportunity for improving treatment and encouraged physicians to act on the alert using a structured process.
INTERVENTIONS
Preimplementation Preparatory Work
Initial KPNC data provided strong support for the generally accepted notion that unplanned transfer patients have poor outcomes.[2, 4, 5] However, published reports failed to provide the granular detail clinicians need to implement a response arm at the unit and patient level. In preparation for going live, we conducted a retrospective chart review. This included data from patients hospitalized from January 1, 2011 through December 31, 2012 (additional detail is provided in the Supporting Information, Appendix, in the online version of this article). The key findings from our internal review of subjective documentation preceding deterioration are similar to those described in the literature and summarized in Figure 1, which displays the 5 most common clinical presentations associated with unplanned transfers.
The chart review served several major roles. First, it facilitated cognitive change by eliminating the notion that it can't happen here. Second, it provided considerable guidance on key clinical components that had to be incorporated into the workflow. Third, it engaged the rapid response team (RRT) in reviewing our work retrospectively to identify future opportunities. Finally, the review provided considerable guidance with respect to structuring documentation requirements.
As a result of the above efforts, other processes detailed below, and knowledge described in several of the companion articles in this issue of the Journal of Hospital Medicine, 3 critical elements, which had been explicitly required by our leadership, were in place prior to the go‐live date: a general consensus among hospitalists and nurses that this would be worth testing, a basic clinical response workflow, and an automated checklist for documentation. We refined these in a 2‐week shadowing phase preceding the start date. In this phase, the alerts were not displayed in the EMR. Instead, programmers working on the project notified selected physician leaders by phone. This permitted them to understand exactly what sort of patients were reaching the physiologic threshold so that they could better prepare both RRT registered nurses (RNs) and hospitalists for the go‐live date. This also provided an opportunity to begin refining the documentation process using actual patients.
The original name for our project was Early Detection of Impending Physiologic Deterioration. However, during the preparatory phase, consultation with our public relations staff led to a concern that the name could be frightening to some patients. This highlights the need to consider patient perceptions and how words used in 1 way by physicians can have different connotations to nonclinicians. Consequently, the system was renamed, and it is now referred to as Advance Alert Monitoring (AAM).
Workflow Development
We carefully examined the space where electronic data, graphical user interfaces, and clinical practice blend, a nexus now commonly referred to as workflow or user experience.[21] To promote situational awareness and effect cognitive change, we utilized the Institute for Health Care Improvement's Plan‐Do‐Study‐Act model.[22, 23] We then facilitated the iterative development of a clinician‐endorsed workflow.[22, 23, 24, 25] By adjusting the workflow based on ongoing experience and giving clinicians multiple opportunities to revise (a process that continues to date), we ensured clinicians would approach and endorse the alarm system as a useful tool for decision support.
Table 1 summarizes the work groups assembled for our implementation, and Table 2 provides a system‐oriented checklist indicating key components that need to be in place prior to having an early warning system go live in a hospital. Figure 2 summarizes the alert response protocols we developed through an iterative process at the 2 pilot sites. The care path shown in Figure 2 is the result of considerable revision, mostly due to actual experience acquired following the go live date. The diagram also includes a component that is still work in progress. This is how an emergency department probability estimate (triage support) will be integrated into both the ward as well as the ICU workflows. Although this is beyond the scope of this article, other hospitals may be experimenting with triage support (eg, for sepsis patients), so it is important to consider how one would incorporate such support into workflows.
| Workgroup | Goals |
|---|---|
| |
| Clinical checklist | Perform structured chart review of selected unplanned transfer patients and near misses |
| Develop a checklist for mitigation strategies given an alert | |
| Develop documentation standards given an alert | |
| Develop escalation protocol given an alert | |
| Workload and threshold | Determine threshold for sensitivity of alerts and resulting impact on clinician workload |
| Patient preferences | Prepare background information to be presented to providers regarding end‐of‐life care and POLST orders |
| Coordinate with clinical checklist workgroup to generate documentation templates that provide guidance for appropriate management of patients regarding preferences on escalation of care and end‐of‐life care | |
| Electronic medical record coordination | Review proposed electronic medical record changes |
| Make recommendation for further changes as needed | |
| Develop plan for rollout of new and/or revised electronic record tools | |
| Designate contact list for questions/emssues that may arise regarding electronic record changes during the pilot | |
| Determine alert display choices and mode of alert notification | |
| Nursing committee | Review staffing needs in anticipation of alert |
| Coordinate with workload and threshold group | |
| Develop training calendar to ensure skills necessary for successful implementation of alerts | |
| Make recommendations for potential modification of rapid response team's role in development of a clinical checklist for nurses responding to an alert | |
| Design educational materials for clinicians | |
| Local communication strategy | Develop internal communication plan (for clinical staff not directly involved with pilot) |
| Develop external communication plan (for nonclinicians who may hear about the project) | |
| Level | Tasks |
|---|---|
| Administration | Obtain executive committee approval |
| Establish communication protocols with quality assurance and quality improvement committees | |
| Review protocols with medicallegal department | |
| Communication | Write media material for patients and families |
| Develop and disseminate scripts for front‐line staff | |
| Develop communication and meet with all relevant front‐line staff on merits of project | |
| Educate all staff on workflow changes and impacts | |
| Clinical preparation | Conduct internal review of unplanned transfers and present results to all clinicians |
| Determine service level agreements, ownership of at‐risk patients, who will access alerts | |
| Conduct staff meetings to educate staff | |
| Perform debriefs on relevant cases | |
| Determine desired outcomes, process measures, balancing measures | |
| Determine acceptable clinician burden (alerts/day) | |
| Technology | Establish documentation templates |
| Ensure access to new data fields (electronic medical record security process must be followed for access rights) | |
| Workflows | Workflows (clinical response, patient preferences, supportive care, communication, documentation) must be in place prior to actual go live |
| Shadowing | Testing period (alerts communicated to selected clinicians prior to going live) should occur |
RESPONSE PROTOCOLS
At South San Francisco, the RRT consists of an ICU nurse, a respiratory care therapist, and a designated hospitalist; at Sacramento, the team is also augmented by an additional nurse (the house supervisor). In addition to responding to the AAM alerts, RRT nurses respond to other emergency calls such as code blues, stroke alerts, and patient or patient‐familyinitiated rapid response calls. They also expedite time sensitive workups and treatments. They check up on recent transfers from the ICU to ensure continued improvement justifying staying on the ward. Serving as peer educators, they assist with processes such as chest tube or central line insertions, troubleshoot high‐risk medication administration, and ensure that treatment bundles (eg, for sepsis) occur expeditiously.
The RRT reviews EWS scores every 6 hours. The AAM score is seen as soon as providers open the chart, which helps triage patients for evaluation. Because patients can still be at risk even without an elevated AAM score, all normal escalation pathways remain in place. Once an alert is noted in the inpatient dashboard, the RRT nurse obtains a fresh set of vital signs, assesses the patient's clinical status, and informs the physician, social worker, and primary nurse (Figure 2). Team members work with the bedside nurse, providing support with assessment, interventions, plans, and follow‐up. Once advised of the alert, the hospitalist performs a second chart review and evaluates the patient at the bedside to identify factors that could underlie potential deterioration. After this evaluation, the hospitalist documents concerns, orders appropriate interventions (which can include escalation), and determines appropriate follow‐up. We made sure the team knew that respiratory distress, arrhythmias, mental status changes, or worsening infection were responsible for over 80% of in‐hospital deterioration cases. We also involved palliative care earlier in patient care, streamlining the process so the RRT makes just 1 phone call to the social worker, who contacts the palliative care physician and nurse to ensure patients have a designated surrogate in the event of further deterioration.
Our initial documentation template consisted of a comprehensive organ system‐based physician checklist. However, although this was of use to covering physicians unfamiliar with a given patient, it was redundant and annoying to attending providers already familiar with the patient. After more than 30 iterations, we settled on a succinct note that only documented the clinicians' clinical judgment as to what constituted the major risk for deterioration and what the mitigation strategies would be. Both of these judgments are in a checklist format (see Supporting Information, Appendix, in the online version of this article for the components of the physician and nurse notes).
Prior to the implementation of the system, RRT nurses performed proactive rounding by manually checking patient labs and vital signs, an inefficient process due to the poor sensitivity and specificity of individual values. Following implementation of the system, RRT RNs and clinicians switched to sorting patients by the 3 scores (COPS2, LAPS2, AAM). For example, patients may be stable at admission (as evidenced by their AAM score) but be at high risk due to their comorbidities. One approach that has been employed is to proactively check such patients to ensure they have a care directive in place, as is described in the article by Granich et al.[14] The Supportive Care Team (detailed in Granich et al.) assesses needs for palliative care and provides in‐hospital consultation as needed. Social services staff perform chart reviews to ensure a patient surrogate has been defined and also works with patients and their families to clarify goals of care.
CHALLENGES AND KEY LEARNINGS
One challenge that arose was reconciling the periodic nature of the alert (every 6 hours) with physicians' availability, which varied due to different rounding workflows at the 2 sites. Consequently, the alert cycle was changed; at the first site, the cycle was set to 1000‐1600‐2200‐0400, whereas the second site chose 0800‐1400‐2000‐0200.
One essential but problematic component of the clinical response is the issue of documentation. Inadequate documentation could lead to adverse outcomes, clinician malpractice exposure, and placing the entire hospital at risk for enterprise liability when clinical responses are not documented. This issue is complicated by the fact that overzealous efforts could lead to less or no documentation by making it too onerous for busy clinicians. We found that the ease with which data can populate progress notes in the EMR can lead to note bloat. Clearly, no documentation is not enough, and a complete history and physical is too much. Paradoxically, 1 of the issues underlying our problems with documentation was the proactive nature of the alerts themselves; because they are based on an outcome prediction in the next 12 hours, documenting the response to them may lack (perceived) urgency.
Shortly after the system went live, a patient who had been recently transferred out to the ward from the ICU triggered an alert. As a response was mounted, the team realized that existing ward protocols did not specify which physician service (intensivist or hospitalist) was responsible for patients who were transitioning from 1 unit to another. We also had to perform multiple revisions of the protocols specifying how alerts were handled when they occurred at times of change of shift. Eventually, we settled on having the combination of a hospitalist and an RRT nurse as the cornerstone of the response, with the hospitalist service as the primary owner of the entire process, but this arrangement might need to be varied in different settings. As a result of the experience with the pilot, the business case for deployment in the remaining 19 hospitals includes a formal budget request so that all have properly staffed RRTs, although the issue of primary ownership of the alert process for different patient types (eg, surgical patients) will be decided on a hospital‐by‐hospital basis. These experiences raise the intriguing possibility that implementation of alert systems can lead to the identification of systemic gaps in existing protocols. These gaps can include specific components of the hospital service agreements between multiple departments (emergency, hospital medicine, ICU, palliative care, surgery) as well as problems with existing workflows.
In addition to ongoing tweaking of care protocols, 3 issues remain unresolved. First is the issue of documentation. The current documentation notes are not completely satisfactory, and we are working with the KPNC EMR administrators to refine the tool. Desirable refinements include (1) having the system scores populate in more accessible sectors of the EMR where their retrieval will facilitate increased automation of the note writing process, (2) changing the note type to a note that will facilitate process audits, and (3) linking the note to other EMR tools so that the response arm can be tracked more formally. The second issue is the need to develop strategies to address staff turnover; for example, newer staff may not have received the same degree of exposure to the system as those who were there when it was started. Finally, due to limited resources, we have done very limited work on more mechanistic analyses of the clinical response itself. For example, it would be desirable to perform a formal quantitative, risk‐adjusted process‐outcome analysis of why some patients' outcomes are better than others following an alert.
Finally, it is also the case that we have had some unexpected occurrences that hint at new uses and benefits of alert systems. One of these is the phenomenon of chasing the alert. Some clinicians, on their own, have taken a more proactive stance in the care of patients in whom the AAM score is rising or near the alert threshold. This has 2 potential consequences. Some patients are stabilized and thus do not reach threshold instability levels. In other cases, patients reach threshold but the response team is informed that things are already under control. A second unexpected result is increased requests for COPS2 scores by clinicians who have heard about the system, particularly surgeons who would like to use the comorbidity scores as a screening tool in the outpatient setting. Because KPNC is an integrated system, it is not likely that such alternatives will be implemented immediately without considerable analysis, but it is clear that the system's deployment has captured the clinicians' imagination.
CONCLUSIONS AND FUTURE DIRECTIONS
Our preparatory efforts have been successful. We have found that embedding an EWS in a commercially available EMR is acceptable to hospital physicians and nurses. We have developed a coordinated workflow for mitigation and escalation that is tightly linked to the availability of probabilistic alerts in real time. Although resource limitations have precluded us from conducting formal clinician surveys, the EWS has been discussed at multiple hospital‐wide as well as department‐specific meetings. Although there have been requests for clarification, refinements, and modifications in workflows, no one has suggested that the system be discontinued. Further, many of the other KPNC hospitals have requested that the EWS be deployed at their site. We have examined KPNC databases that track patient complaints and have not found any complaints that could be linked to the EWS. Most importantly, the existence of the workflows we have developed has played a major role in KPNC's decision to deploy the system in its remaining hospitals.
Although alert fatigue is the number 1 reason that clinicians do not utilize embedded clinical decision support,[26] simply calibrating statistical models is insufficient. Careful consideration of clinicians' needs and responsibilities, particularly around ownership of patients and documentation, is essential. Such consideration needs to include planning time and socializing the system (providing multiple venues for clinicians to learn about the system as well as participate in the process for using it).
We anticipate that, as the system leaves the pilot stage and becomes a routine component of hospital care, additional enhancements (eg, sending notifications to smart phones, providing an alert response tracking system) will be added. Our organization is also implementing real‐time concurrent review of inpatient EMRs (eg, for proactive detection of an expanded range of potential process failures), and work is underway on how to link the workflows we describe here with this effort. As has been the case with other systems,[27] it is likely that we will eventually move to continuous scanning of patient data rather than only every 6 hours. Given that the basic workflow is quite robust and amenable to local modifications, we are confident that our clinicians and hospitals will adapt to future system enhancements.
Lastly, we intend to conduct additional research on the clinical response itself. In particular, we consider it extremely important to conduct formal quantitative analyses on why some patients' outcomes are better than others following an alert. A key component of this effort will be to develop tools that can permit an automatedor nearly automatedassessment of the clinical response. For example, we are considering automated approaches that would scan the EMR for the presence of specific orders, notes, vital signs patterns, and laboratory tests following an alert. Whereas it may not be possible to dispense with manual chart review, even partial automation of a feedback process could lead to significant enhancement of our quality improvement efforts.
Acknowledgements
The authors thank Dr. Michelle Caughey, Dr. Philip Madvig, Dr. Brian Hoberman, Dr. Patricia Conolly, and Ms. Barbara Crawford for their administrative support; Dr. Tracy Lieu for reviewing the manuscript; and Ms. Rachel Lesser for formatting the manuscript. The authors also thank Drs. Jason Anderson, John Fitzgibbon, Elena M. Nishimura, and Najm Haq for their support of the project. We are particularly grateful to our nurses, Theresa A. Villorente, Zoe Sutton, Doanh Ly, Catherine Burger, and Hillary R. Mitchell, for their critical assistance. Last but not least, we also thank all the hospitalists and nurses at the Kaiser Permanente Sacramento and South San Francisco hospitals.
Disclosures: This work was supported by a grant from the Gordon and Betty Moore Foundation (Early Detection, Prevention, and Mitigation of Impending Physiologic Deterioration in Hospitalized Patients Outside Intensive Care: Phase 3, pilot), The Permanente Medical Group, Inc., and Kaiser Foundation Hospitals, Inc. Dr. Liu was supported by the National Institute for General Medical Sciences award K23GM112018. As part of our agreement with the Moore Foundation, we made a commitment to disseminate our findings in articles such as this one. However, the Gordon and Betty Moore Foundation played no role in how we actually structured our articles, nor did they review or preapprove any of the manuscripts submitted as part of the dissemination component; the same was the case with the other sponsors. None of the authors has any conflicts of interest to declare of relevance to this work
- , , , , . Location of patients before transfer to a tertiary care intensive care unit: impact on outcome. J Crit Care. 2009;24(1):108–113.
- , , , , , . Intra‐hospital transfers to a higher level of care: contribution to total hospital and intensive care unit (ICU) mortality and length of stay (LOS). J Hosp Med. 2011;6(2):74–80.
- , , , . Unplanned transfers to a medical intensive care unit: causes and relationship to preventable errors in care. J Hosp Med. 2011;6(2):68–72.
- , , , . Adverse outcomes associated with delayed intensive care unit transfers in an integrated healthcare system. J Hosp Med. 2012;7(3):224–230.
- , , , , , . Risk factors for unplanned transfer to intensive care within 24 hours of admission from the emergency department in an integrated healthcare system. J Hosp Med. 2013;8(1):13–19.
- , , , , , . Reducing hospital standardized mortality rate with early interventions. J Trauma Nursing. 2006;13(4):178–182.
- , , , , , . Centile‐based early warning scores derived from statistical distributions of vital signs. Resuscitation. 2011;82(8):1013–1018.
- , , , et al. Randomized trial of automated, electronic monitoring to facilitate early detection of sepsis in the intensive care unit. Crit Care Med. 2012;40(7):2096–2101.
- , , , et al. Early recognition of acutely deteriorating patients in non‐intensive care units: assessment of an innovative monitoring technology. J Hosp Med. 2012;7(8):628–633.
- , , , et al. A randomized trial of real‐time automated clinical deterioration alerts sent to a rapid response team. J Hosp Med. 2014;9(7):424–429.
- , , , et al. Improving situation awareness to reduce unrecognized clinical deterioration and serious safety events. Pediatrics. 2013;131(1):e298–e308.
- , , , , , . Early detection of impending physiologic deterioration among patients who are not in intensive care: development of predictive models using data from an automated electronic medical record. J Hosp Med. 2012;7(5):388–395.
- , , , , . Risk‐adjusting hospital mortality using a comprehensive electronic record in an integrated healthcare delivery system. Med Care. 2013;51(5):446–453.
- , , . et al. Early detection of critical illness outside the intensive care unit: clarifying treatment plans and honoring goals of care using a supportive care team. J Hosp Med. 2016;11:000–000.
- , . A qualitative study examining the influences on situation awareness and the identification, mitigation and escalation of recognised patient risk. BMJ Qual Saf. 2014;23(2):153–161.
- , , , et al. Piloting electronic medical record‐based early detection of inpatient deterioration in community hospitals. J Hosp Med. 2016;11:000–000.
- , , , , , . Nonelective rehospitalizations and postdischarge mortality: predictive models suitable for use in real time. Med Care. 2015;53(11):916–923.
- . The importance of cognitive errors in diagnosis and strategies to minimize them. Acad Med. 2003;78(8):775–780.
- , , . Cognitive debiasing 1: origins of bias and theory of debiasing. BMJ Qual Saf. 2013;22(suppl 2):ii58–ii64.
- , , . Cognitive debiasing 2: impediments to and strategies for change. BMJ Qual Saf. 2013;22(suppl 2):ii65–ii72.
- , , . Use of health information technology to reduce diagnostic errors. BMJ Qual Saf. 2013;22(suppl 2):ii40–ii51.
- , , , , , . The Improvement Guide: A Practical Approach to Enhancing Organizational Performance. 2nd ed. San Francisco, CA: Jossey‐Bass; 2009.
- , , , , . Understanding the components of quality improvement collaboratives: a systematic literature review. Milbank Q. 2013;91(2):354–394.
- , , . Reducing diagnostic errors in medicine: what's the goal? Acad Med. 2002;77(10):981–992.
- , , , . Huddling for high reliability and situation awareness. BMJ Qual Saf. 2013;22(11):899–906.
- Top 10 patient safety concerns for healthcare organizations. ECRI Institute website. Available at: https://www.ecri.org/Pages/Top‐10‐Patient‐Safety‐Concerns.aspx. Accessed February 18, 2016.
- , , , et al. Automated detection of physiologic deterioration in hospitalized patients. J Am Med Inform Assoc. 2015;22(2):350–360.

The Learning Hospital System
In the landmark Best Care at Lower Cost report, the Institute of Medicine presents a compelling vision of a US healthcare system where science, information technology, incentives, and care culture are brought together seamlessly to produce high‐quality healthcare.[1] At the center of this transformation is the learning healthcare system, a system characterized by its ability to leverage data arising from care provision to drive rapid improvements in care delivery.[2] When steeped within the right organizational milieu, these data help to close the virtuous cycle of continuous learning moving from science to evidence to care and back to new science. The anticipated end result is a healthcare system that can provide Americans with superior care at lower cost.
Hospital‐based practitioners will recognize the inpatient setting as an ideal demonstration opportunity for continuous learning. Hospital care is costly, accounting for more than 30% of all US healthcare costs[3]; intensive care alone accounts for a notable proportion of the US gross domestic product.[4] Inpatient care is associated with significant mortality and morbidity, and its use is often greatly increased in patients' last days.[5, 6] Fortunately, the inpatient setting also offers an ideal opportunity to leverage high‐quality data to help inform and improve care. The digitization of medicine means that far more data are now available through electronic health records, medical devices, and tests.[7] This is particularly true for inpatients, for whom a large volume of data are produced even over relatively short hospital stays.
Whereas the challenge to improve hospital care is daunting, there is an incredible opportunity to advance the quality of inpatient care through realizing the vision of the learning hospital system. In the sections that follow, we use an object lessonsepsis care within hospitals of the Kaiser Permanente Northern California (KPNC) integrated healthcare delivery systemto evaluate the challenges and insights gleaned from working toward building a learning hospital system. Then, we describe further steps that could enhance the use of inpatient data to drive improved care.
THE FRAMEWORK OF A LEARNING HEALTHCARE SYSTEM
Best Care at Lower Cost notes a fundamental paradox in US healthcare: although we have witnessed a dramatic expansion in biomedical knowledge, innovative therapies and surgical procedures, and clinical treatments to extend survival, US healthcare persistently falls short on the basic dimensions of quality, outcomes, cost, and equity.[1] The proposed path forward lies in building the learning healthcare system, a system characterized by continuous knowledge development, improvement, and application. Figure 1 shows the critical nodes in the framework for continuous learning, which include: (1) the development of new scientific knowledge (science), (2) the translation of science into clinical evidence of efficacy (evidence), and (3) the application of efficacious interventions through effective care delivery (care). In healthcare today, transitions between these nodes are rife with missed or wasted opportunities like delays in applying high‐quality evidence or poorly managed insights arising from scientific discovery. If such opportunities could be recovered, however, the quality of healthcare could be improved dramatically.[8]

The pursuit of continuous learning is aided by rapid changes in the quality and quantity of biomedical data available over the past decade, especially through the use of electronic health records, novel biomolecular tools, and digital sensors.[2, 7, 9] The Internet has ushered in a new era of data connectivity, for example, allowing for highly engaged communication between patients and providers as well as collaboration between professional or citizen scientists on data of unprecedented scale.[10] New methodologic approaches, including data mining and machine learning, increasingly leverage commodity hardware to conduct previously computationally intractable analyses.[9] Moreover, the development of domain ontologies fosters the discovery of meaningful insights from data of heterogeneous types.[11]
Ultimately, however, improvements in data alone are inadequate to achieve continuous learning. As shown in Figure 1, whereas data form the channels that allow for transitions from science to evidence to care, novel insights need to be steeped within the right culture, motivated by the right incentives, and supported by the right leaders.[1, 12] Within the sustainable learning healthcare system, knowledge generation feeds practice change with the support and guidance of system leadership; improved practice, in turn, generates new knowledge and completes the virtuous cycle of learning.
THE PROMISE OF CONTINUOUS LEARNING IN HOSPITAL SETTINGS
The hospital is an ideal setting in which to foster continuous learning because advances in inpatient care have the potential to substantially improve healthcare quality and value.[8] Americans were hospitalized roughly 37 million times in 2012; in total, these episodes cost $378 billion.[3] Over 700,000 patients die in US hospitals annually, with reports showing that many patients utilize greatly increased inpatient and critical care services near the end of their lives in a manner that appears misaligned with their preferences.[11, 13] Hospital care is also highly variable in quality and cost; this heterogeneity is not closely associated with improved outcomes.[14, 15] Preventable harm and medical injury occur commonly in hospitals and are now recognized to be a leading cause of inpatient death.[16] Finally, emerging research illuminates the substantial toll that acute care has on patients and families resulting in new comorbidity, functional or neuropsychiatric impairment, rehospitalization, and financial burden that persist long after patients are discharged.[17]
Fortunately, inpatient care also exhibits several qualities that improve the likelihood that continuous learning can be achieved. Although it is clear that hospitalizations occur within the arc of a patient's larger health trajectory, these distinct episodes offer the potential to observe patient trajectories and treatments evolving within relatively compressed time intervals; over that same interval, a large volume of data are produced. Stored within comprehensive electronic health records, these granular data now allow inpatient episodes to be digitally recapitulated with high fidelity, bolstering their use in driving care improvements.[18]
AN OBJECT LESSON IN THE LEARNING FRAMEWORK: SEPSIS CARE
Translating Science to Evidence in Sepsis
Although sepsis has attracted great attention in modern hospital care, sepsis was described long ago by Hippocrates to describe the process by which wounds fester.[19] Recast after the confirmation of germ theory, sepsis came to be known primarily as the blood poisoning resulting from pathogenic organisms.[20] However, with the advent of antibiotics, numerous scientific studies now recognize that sepsis actually results from the dysregulated host immune response to systemic infection, which can also cause organ dysfunction.[21] Based on this knowledge, landmark translational and clinical studies in the 2000s provided strong evidence that early identification of sepsis patients and aggressive infection control and resuscitation were associated with improved mortality (Figure 2, step 1).[22]
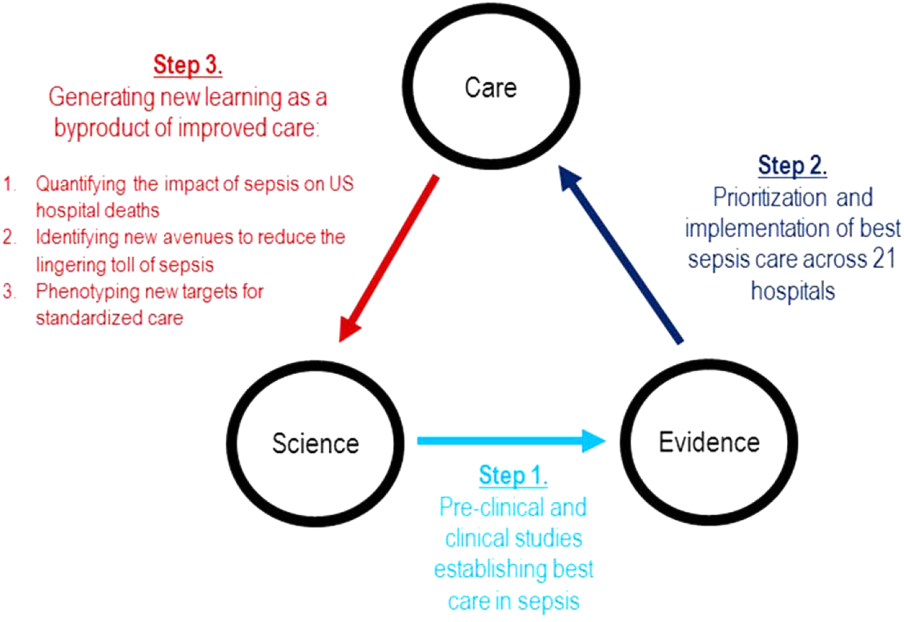
Translating Evidence to Care in Sepsis at KPNC
In 2007, the leadership of KPNC initiated a regional effort to improve the quality of care and reduce the variability in performance at its medical centers (Table 1).[23] Reviewing data from nearly 1000 inpatientsthe last 50 consecutive hospital deaths from each of 19 medical centersa mortality diagnostic based on Institute for Healthcare Improvement recommendations[24] revealed that sepsis had a major impact on hospital outcomes. For example, even though sepsis patients were still relatively under‐recognized at the time, accounting for fewer than 3% of hospitalizations, they contributed to one‐quarter of hospital deaths. In light of these compelling data, senior regional leadership identified reducing sepsis mortality as a key performance improvement goal (Figure 2, step 2).
| Time Period | Event Summary |
|---|---|
| |
| 2007 | Variability in hospital standardized mortality ratio observed, indicating an opportunity to drive improved outcomes. |
| Initiation of staggered implementation of unified electronic medical record across all KP sites (starting in 2006 and ending in 2009). | |
| Spring 2008 | Mortality diagnostic chart review completed identifying sepsis and infection‐related causes as key factors in hospital outcomes. |
| May 2008 | Regional Mortality Summit held with a focus on patient safety and mortality reduction efforts through performance improvement. Executive regional and local leadership alignment to focus on sepsis performance improvement. |
| Summer 2008 | Sepsis Steering Committee evaluates best available evidence, develops treatment algorithms, and plans for medical center pilots. |
| Fall 2008 | Pilot intervention deployed at 2 medical centers. |
| November 2008 | First Regional Sepsis Summit: development of sepsis performance improvement playbook, training materials, implementation plans, and measurement strategy. |
| November 2008 | All medical centers begin to form multidisciplinary sepsis teams and performance improvement committees, obtain equipment and supplies including assembly of a sepsis cart. Multidisciplinary teams included ED physician champion, ED nurse champion, improvement advisor, hospitalists, intensivists, quality improvement personnel, nurse educators, and even resident physicians. |
| January 2009 | Performance data collection begins on EGDT processes and outcomes. Initiation of 2 key elements to enhance screening for and detection of sepsis: (1) concomitant ordering of serum lactic acid along with blood cultures, and (2) definition of lactate >2.0 as a critical lab value. |
| Use of manual chart review for case finding and central database entry because of ongoing implementation of electronic medical record and limited sepsis‐specific data infrastructure. | |
| March 2009 | Regional train the trainer sessions occur and local educational spread efforts begin including: collaborative calls, in‐person training events, and medical center site visits. |
| August 2009 | Grant funding from the Gordon and Betty Moore Foundation begins with a planned 2‐year duration providing funding for improvement advisors with performance improvement expertise and data infrastructure development. |
| November 2009 | Second Regional Sepsis Summit. Identification of intermediate lactate sepsis patients having significant mortality. |
| January 2010 | Initiate measurement of performance for intermediate lactate sepsis patients with a focus on lactate clearance as an outcome measure of interest. |
| 2010 | Development of an intranet Web‐based data abstraction tool to identify cases and auto‐populate specific fields for review. Facilities were responsible for review of cases at the local level to foster rapid feedback cycles for local performance improvement. Standardized data query tools were deployed to foster local medical center engagement and system‐level evaluation. |
| Accompanying development of a sepsis performance improvement scorecard allowing for comparison of longitudinal performance metrics across all facilities. Scorecard elements included: proportion of lactates drawn following ED blood culture, EGDT‐specific bundle elements (ie, number of EGDT cases, antibiotics within 1 hour, first central venous pressure within 2 hours of EGDT start, target mean arterial pressure achievement), repeat lactate elements, balancing measures for central line placement (ie, pneumothorax, central line infection), and overall sepsis statistics. | |
| April 2011 | Third Regional Sepsis Summit. Refinement of EGDT bundle and further development of intermediate lactate bundle approach, including piloting specific treatment bundles targeting this population. Collaborative performance improvement environment in which successful strategies at 1 site were rapidly disseminated to other sites including the Sepsis Alert and the Sepsis Clock. |
| May 2012 | Research analysis of fluid volume and lactate clearance in intermediate lactate sepsis population begins. |
| February 2013 | Fourth Regional Sepsis Summit. Regional spread of intermediate lactate bundle including the use of fluids, antibiotics, and repeat lactate measurements. |
| May 2013 | Research analysis of the contribution of sepsis to hospital deaths (within KP and in national sample) as well as post‐sepsis resource utilization and mortality |
| March 2014 | Publication of ProCESS randomized clinical trial, requiring systemic reevaluation of EGDT‐based sepsis strategy. Subsequent publications of ARISE and ProMISe trials confirming findings from ProCESS. Updated approach under consideration and informally disseminated to practitioners. |
| October 2014 | Updated sepsis treatment guidelines and data capture strategy fully implemented moving away from a catheter‐based strategy for all EGDT‐eligible patients. |
| October 2015 | Sixth Regional Sepsis Summit held to adjust sepsis treatment and data measurement strategy to align more closely with CMS SEP‐1 guidelines. |
Based on the principles of performance improvement methodology, clinical and operational leaders established an environment with aligned culture, incentives, and leadership around sepsis care. The effort was launched in late 2008 at a Sepsis Summit, bringing together a multidisciplinary group of stakeholders (eg, hospitalist, emergency department, and intensive care chiefs of staff and nursing managers; medical center and nursing executive and operational leadership) and providing sepsis care pathways based on the best available evidence.[23] Regional investments in the digital infrastructure to support implementation resulted in the provision of granular data within monthly sepsis scorecards quantifying each medical center's performance and trends for a diverse set of sepsis bundle metrics.
The resulting changes in sepsis care were substantial. For example, improved early recognition of infected patients meeting the criteria for sepsis resulted in large changes in the standardized diagnostic criteria used to label patients (Figure 3A). Implementing screening strategies using serum lactate testing for any patient receiving blood cultures resulted in a roughly 10‐fold increase in the use of lactate testing in the emergency department (Figure 3B). Earlier recognition of sepsis also increased the number of patients receiving early antibiotics and receiving central venous catheters for quantitative resuscitation.[23]
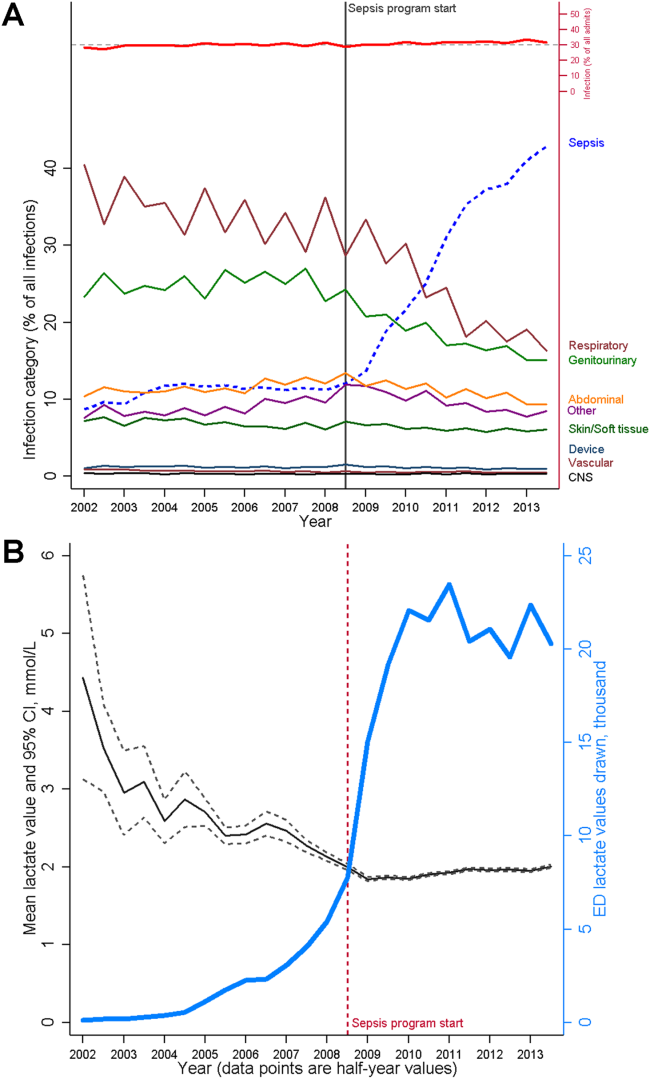
CLOSING THE LOOP TOWARD CONTINUOUS LEARNING IN SEPSIS
Leveraging timely and actionable data steeped within an aligned organizational milieu resulted in large‐scale changes across a heterogeneous set of hospitals. However, to realize the true vision of a learning hospital system, a looming question remained: Could the data generated as the byproduct of routine care now be used to complete the virtuous cycle and drive new scientific discovery (Figure 2, step 3)?
Confirming Concordance in the Impact of Sepsis Nationally
The heightened identification of sepsis patients through program implementation revealed that the impact of sepsis on hospital mortality was greater than originally estimated; based on improved patient identification, sepsis now accounted for upward of 1 in 2 hospital deaths.[25] This sobering statistic confirmed that the investments in standardizing best sepsis care following the mortality diagnostic were critical. However, were similar estimates of sepsis‐attributable mortality consistent outside of the KPNC system? To study this, we examined US hospitalizations occurring across >1000 hospitals and involving >6 million hospital stays to estimate corresponding prevalence.[25] In this national sample, sepsis contributed to as many as half of hospital deaths in the United States in 2010, lending strong support to ongoing international and state‐based efforts to improve sepsis care. These studies also paved the way to use these data drawn from our large sepsis population to inform updated international consensus definitions for sepsis and septic shock.[26, 27, 28]
Identifying New Avenues for Reducing the Toll of Sepsis
A major concern of sepsis program leaders was the prior findings that sepsis hospitalizations among Medicare beneficiaries were associated with substantial new cognitive and functional disability.[29] This lingering toll of sepsis had been termed a hidden public health disaster.[30] To further understand the posthospital impact of sepsis and to begin investigating new avenues to reduce this impact, a cohort of patients was followed for 1 year following sepsis hospitalization.[31] Over that period, nearly half of sepsis survivors were rehospitalized. When compared with their presepsis levels of healthcare utilization, middle‐aged and elderly sepsis patients experienced a 3‐fold increase in their days using facility‐based care. Subsequent studies in other populations outside of KPNC have confirmed these concerning findings, resulting in new efforts to address postsepsis survivorship care.[32, 33]
Phenotyping New Targets for Standardized Sepsis Care
At its outset, the sepsis improvement program applied the best available evidence to treat patients with the most severe forms of sepsisseptic shock. However, once the initial implementation phase had succeeded, clinicians and operational leaders quickly realized from the emerging data that there was a far larger group of sepsis patients for whom treatment guidelines were poorly defined.[25, 34, 35] These were severe sepsis patients with so‐called intermediate lactate values between 2 mmol/L and 4 mmol/L; they comprised a substantial proportion of all sepsis patients dying in the hospital. Using data generated from the routine care of sepsis patients treated across 21 hospitals, the sepsis leadership group was able to rapidly assemble a cohort of intermediate lactate sepsis patients up to 20‐ to 100‐fold larger than that reported in prior studies and evaluate their outcomes.[34, 35]
The data used to evaluate these intermediate lactate sepsis patients now spurred a new implementation program in 2013 for a group of patients in whom there was essentially no existing evidence to guide care. Rapidly implemented within a mature sepsis performance improvement program, evaluations at the 6‐month and 1‐year intervals demonstrated significant decreases in mortality.[36] Importantly, to allay the justified concerns of clinicians, these evaluations also clearly showed no evidence of harm from more aggressive fluid resuscitation (eg, increased transfer to intensive care, increased rates of mechanical ventilation). Again, driven by clinician input, subgroup analyses further revealed that the implementation program was only associated with reduced mortality in patients who could be at risk for iatrogenic fluid overload (ie, those with a history of congestive heart failure or chronic kidney disease).[36] Spurred by these provocative findings, operational and clinical leaders are currently considering how to guide future care in these patients, especially with the emerging use of noninvasive methods to quantify patients' fluid responsiveness.
PRINCIPLES FOR LEVERAGING DATA IN THE LEARNING HOSPITAL SYSTEM
The object lesson of using data to drive improved sepsis care and further new scientific discovery offers some important insights for continuous learning.
Building a Digital Infrastructure for Utilizing Granular Hospital Data
As described above, current transitions between the nodes of the learning framework are rife with missed opportunities. Perhaps one of the most glaring is the inability to use highly granular data already collected within the electronic health record (eg, trajectories and trends across vital signs or laboratory results, large‐scale medication administration records to evaluate multidrug interactions). An essential starting point for continuous learning is investing in the digital infrastructure to improve the use of data beyond traditional claims (administrative dataadmission source codes, disposition codes, diagnoses, and procedures). As shown in Table 2, the first key step is incorporating laboratory data into the quality assessment/emmprovement process. In addition, using these data to automate severity of illness and risk adjustment metrics fosters use of similar comparison cohorts across time or disease types.[18, 37, 38, 39, 40]
| Data Type | Contents | Degree of Difficulty in Accessing | Degree of Difficulty in Analyzing |
|---|---|---|---|
| Administrative | Traditional claims data, diagnostic or procedural codes | Low | Low to moderate |
| Standard cohort profiling | Limited instances of vitals signs, laboratory, diagnostic testing, or treatment data | Low to moderate | Low to moderate |
| Metrics reporting for care improvement | Standard cohort identification, aggregated achievement of treatment targets, scorecard dissemination | Moderate | Moderate |
| Advanced cohort profiling | Time series of physiologic data, inpatient triage and treatment data within short temporal intervals | Moderate to high | High |
| Research‐grade discovery | Data with breadth (representative sample size) and depth (highly granular physiologic and treatment data) | High | Very high |
| Patient‐reported outcomes | Quality of life, functional and cognitive disability | Very high | High |
Employing Novel Methods to Address the Limitations of Using Real‐World Data
The rapid digitization of medicine through the use of electronic medical records offers tremendous opportunities to facilitate continuous learning. However, these opportunities are accompanied by important limitations.[41] Data collected as a byproduct of real‐world care can be vulnerable to many forms of bias and confounding, potentially clouding the validity and robustness of corresponding analytic results. Fortunately, advanced methods including causal inference are now used routinely to address some limitations.[42] In the context of a learning healthcare system, other opportunities for improved study design including cluster randomized trials or stepped wedge implementation can also be employed to preserve the statistical rigor of subsequent analyses.[43] Finally, emerging methods employing randomization through the electronic medical record alongside adaptive trial design offer great potential to increase the efficiency of continuous learning.[44]
Evaluating the Hospital as a Single System
Advances in contemporary hospital care require seamless transitions of patient care, screening strategies, and therapeutic approaches across multiple hospital domains and with diverse providers; these interventions also need to happen rapidly. Many traditional approaches to inpatient care have taken a bottom‐up approach (eg, studying a specific disease within a specific hospital ward like the intensive care unit) that have proven useful but may limit generalizability when applied to a real‐world hospital operating with Pareto optimality (ie, the trade‐off scenario where new resource allocation to 1 area also requires resource withdrawal from another area). In certain cases, an empiric approach, without initial preference for any specific ward or disease, can aid decision making by hospital operational and clinical leaders by providing a global picture of impact and value.
Focusing on Early Detection in Hospital Settings as Secondary Prevention
Once patients have been admitted to the hospital, a race against the clock begins. Each additional hour of hospitalization increases the risks of iatrogenic injury or medical harm manifested by immobility, disorientation and delirium, nosocomial infections, or medication errors, among others. In this context, detection systems that use granular hospital data to focus on the earliest detection of risk can aid critical approaches to secondary prevention (Although the hospitalization for sepsis cannot be avoided, careful attention to mobility can limit the risk of developing delirium. In turn, preventing delirium can limit the risk of new functional disability).
Contextualizing Hospital Care Within a Longitudinal Trajectory
Although we described the benefit of hospital episodes having well‐demarcated beginning and ending points, it remains essential to recognize that the harms associated with hospitalization extend well beyond discharge. In this context, hospitalizations can serve as waypoints in patients' health trajectories as well as an opportunity to achieve patient‐centered care including discussing and aligning goals of care with actual care provision. Furthermore, although we have seen steady declines in hospital mortality over time, it is highly likely that we will reach a nadir in mortality where additional metrics of hospital outcomes will need to include postdischarge events like readmission, long‐term mortality, quality of life, and the prevention of disability or decline.
CONCLUSION
Hospitalizations in the United States are costly and associated with high mortality and morbidity; the toll of hospitalization also extends well beyond hospital discharge. The promise of the learning hospital system has marked improvements in the quality of hospital care, especially where healthcare systems can steep critical investments in data and digital infrastructure within the right culture, incentives, and leadership. Where continuous learning is achieved, data generated during routine care offer the potential to yield new scientific discovery and drive further improvements in hospital care.
Disclosures
As part of our agreement with the Gordon and Betty Moore Foundation, we made a commitment to disseminate our findings in articles such as this one. However, the Foundation and its staff played no role in how we actually structured our articles, nor did they review or preapprove any of the manuscripts submitted as part of the dissemination component. None of the authors has any conflicts of interest to declare of relevance to this work, which was funded by a combination of funding from the Gordon and Betty Moore Foundation, The Permanente Medical Group, Inc., and Kaiser Foundation Hospitals, Inc. VXL was supported by NIH K23GM112018.
- Institute of Medicine. Best Care at Lower Cost: The Path to Continuously Learning Health Care in America. Washington, DC: The National Academies Press; 2012.
- , , , et al. Toward a science of learning systems: a research agenda for the high‐functioning Learning Health System. J Am Med Inform Assoc. 2015;22(1):43–50.
- National Center for Health Statistics. Health, United States, 2014: With Special Feature on Adults Aged 55–64. Hyattsville, MD; 2015.
- , . Critical care medicine in the United States 2000‐2005: an analysis of bed numbers, occupancy rates, payer mix, and costs. Crit Care Med. 2010;38(1):65–71.
- , , , . Trends and variation in end‐of‐life care for medicare beneficiaries with severe chronic illness. A report of the Dartmouth Atlas Project. Lebanon, NH: The Dartmouth Institute for Health Policy and Clinical Practice; 2011.
- , , , et al. Change in end‐of‐life care for Medicare beneficiaries: site of death, place of care, and health care transitions in 2000, 2005, and 2009. JAMA. 2013;309(5):470–477.
- , , . Finding the missing link for big biomedical data. JAMA. 2014;311(24):2479–2480.
- . Code red and blue—safely limiting health care's GDP footprint. N Engl J Med. 2013;368(1):1–3.
- , . The inevitable application of big data to health care. JAMA. 2013;309(13):1351–1352.
- , . What is citizen science?—a scientometric meta‐analysis. PLoS One. 2016;11(1):e0147152.
- , , . Biomedical ontologies: a functional perspective. Brief Bioinform. 2008;9(1):75–90.
- . Rapid learning: a breakthrough agenda. Health Aff (Millwood). 2014;33(7):1155–1162.
- , , , et al. Are regional variations in end‐of‐life care intensity explained by patient preferences?: a study of the US Medicare population. Med Care. 2007;45(5):386–393.
- , . Extreme markup: the fifty US hospitals with the highest charge‐to‐cost ratios. Health Aff (Millwood). 2015;34(6):922–928.
- , , , . The price ain't right? Hospital prices and health spending on the privately insured. Health Care Pricing Project website. Available at: http://www.healthcarepricingproject.org/sites/default/files/pricing_variation_manuscript_0.pdf. Accessed February 15, 2016
- . A new, evidence‐based estimate of patient harms associated with hospital care. J Patient Saf. 2013;9(3):122–128.
- , , . Hospitalization‐associated disability: “she was probably able to ambulate, but I'm not sure”. JAMA. 2011;306(16):1782–1793.
- , , , , . Risk‐adjusting hospital mortality using a comprehensive electronic record in an integrated health care delivery system. Med Care. 2013;51(5):446–453.
- . New definitions for sepsis and septic shock: continuing evolution but with much still to be done. JAMA. 2016;315(8):757–759.
- , . Severe sepsis and septic shock. N Engl J Med. 2013;369(21):2063.
- , , . Sepsis‐induced immunosuppression: from cellular dysfunctions to immunotherapy. Nat Rev Immunol. 2013;13(12):862–874.
- , , , et al. Early goal‐directed therapy in the treatment of severe sepsis and septic shock. N Engl J Med. 2001;345(19):1368–1377.
- , , , et al. Kaiser Permanente's performance improvement system, part 3: multisite improvements in care for patients with sepsis. Jt Comm J Qual Patient Saf. 2011;37(11):483–493.
- , , , , . Understanding the components of quality improvement collaboratives: a systematic literature review. Milbank Q. 2013;91(2):354–394.
- , , , et al. Hospital deaths in patients with sepsis from 2 independent cohorts. JAMA. 2014;312(1):90–92.
- , , , et al. Assessment of clinical criteria for sepsis: for the Third International Consensus Definitions for Sepsis and Septic Shock (Sepsis‐3). JAMA. 2016;315(8):762–774.
- , , , et al. Developing a new definition and assessing new clinical criteria for septic shock: for the Third International Consensus Definitions for Sepsis and Septic Shock (Sepsis‐3). JAMA. 2016;315(8):775–787.
- , , , et al. The Third International Consensus Definitions for Sepsis and Septic Shock (Sepsis‐3). JAMA. 2016;315(8):801–810.
- , , , . Long‐term cognitive impairment and functional disability among survivors of severe sepsis. JAMA. 2010;304(16):1787–1794.
- . The lingering consequences of sepsis: a hidden public health disaster? JAMA. 2010;304(16):1833–1834.
- , , , , , . Hospital readmission and healthcare utilization following sepsis in community settings. J Hosp Med. 2014;9(8):502–507.
- , , , , . Increased 1‐year healthcare use in survivors of severe sepsis. Am J Respir Crit Care Med. 2014;190(1):62–69.
- , , , et al. Post‐acute care use and hospital readmission after sepsis. Ann Am Thorac Soc. 2015;12(6):904–913.
- , , , , . Fluid volume, lactate values, and mortality in sepsis patients with intermediate lactate values. Ann Am Thorac Soc. 2013;10(5):466–473.
- , , . Prognosis of emergency department patients with suspected infection and intermediate lactate levels: a systematic review. J Crit Care. 2014;29(3):334–339.
- , , , et al. Multicenter implementation of a treatment bundle for sepsis patients with intermediate lactate values. Am J Respir Crit Care Med. 2016;193(11):1264–1270.
- , , , et al. Risk adjusting community‐acquired pneumonia hospital outcomes using automated databases. Am J Manag Care. 2008;14(3):158–166.
- , , , , , . Intra‐hospital transfers to a higher level of care: contribution to total hospital and intensive care unit (ICU) mortality and length of stay (LOS). J Hosp Med. 2011;6(2):74–80.
- , , , , , . Early detection of impending physiologic deterioration among patients who are not in intensive care: development of predictive models using data from an automated electronic medical record. J Hosp Med. 2012;7(5):388–395.
- , , , , . An electronic Simplified Acute Physiology Score‐based risk adjustment score for critical illness in an integrated healthcare system. Crit Care Med. 2013;41(1):41–48.
- . Learning from big health care data. N Engl J Med. 2014;370(23):2161–2163.
- , . Getting the methods right—the foundation of patient‐centered outcomes research. N Engl J Med. 2012;367(9):787–790.
- , , , , . The stepped wedge cluster randomised trial: rationale, design, analysis, and reporting. BMJ. 2015;350:h391.
- . Fusing randomized trials with big data: the key to self‐learning health care systems? JAMA. 2015;314(8):767–768.
In the landmark Best Care at Lower Cost report, the Institute of Medicine presents a compelling vision of a US healthcare system where science, information technology, incentives, and care culture are brought together seamlessly to produce high‐quality healthcare.[1] At the center of this transformation is the learning healthcare system, a system characterized by its ability to leverage data arising from care provision to drive rapid improvements in care delivery.[2] When steeped within the right organizational milieu, these data help to close the virtuous cycle of continuous learning moving from science to evidence to care and back to new science. The anticipated end result is a healthcare system that can provide Americans with superior care at lower cost.
Hospital‐based practitioners will recognize the inpatient setting as an ideal demonstration opportunity for continuous learning. Hospital care is costly, accounting for more than 30% of all US healthcare costs[3]; intensive care alone accounts for a notable proportion of the US gross domestic product.[4] Inpatient care is associated with significant mortality and morbidity, and its use is often greatly increased in patients' last days.[5, 6] Fortunately, the inpatient setting also offers an ideal opportunity to leverage high‐quality data to help inform and improve care. The digitization of medicine means that far more data are now available through electronic health records, medical devices, and tests.[7] This is particularly true for inpatients, for whom a large volume of data are produced even over relatively short hospital stays.
Whereas the challenge to improve hospital care is daunting, there is an incredible opportunity to advance the quality of inpatient care through realizing the vision of the learning hospital system. In the sections that follow, we use an object lessonsepsis care within hospitals of the Kaiser Permanente Northern California (KPNC) integrated healthcare delivery systemto evaluate the challenges and insights gleaned from working toward building a learning hospital system. Then, we describe further steps that could enhance the use of inpatient data to drive improved care.
THE FRAMEWORK OF A LEARNING HEALTHCARE SYSTEM
Best Care at Lower Cost notes a fundamental paradox in US healthcare: although we have witnessed a dramatic expansion in biomedical knowledge, innovative therapies and surgical procedures, and clinical treatments to extend survival, US healthcare persistently falls short on the basic dimensions of quality, outcomes, cost, and equity.[1] The proposed path forward lies in building the learning healthcare system, a system characterized by continuous knowledge development, improvement, and application. Figure 1 shows the critical nodes in the framework for continuous learning, which include: (1) the development of new scientific knowledge (science), (2) the translation of science into clinical evidence of efficacy (evidence), and (3) the application of efficacious interventions through effective care delivery (care). In healthcare today, transitions between these nodes are rife with missed or wasted opportunities like delays in applying high‐quality evidence or poorly managed insights arising from scientific discovery. If such opportunities could be recovered, however, the quality of healthcare could be improved dramatically.[8]
The pursuit of continuous learning is aided by rapid changes in the quality and quantity of biomedical data available over the past decade, especially through the use of electronic health records, novel biomolecular tools, and digital sensors.[2, 7, 9] The Internet has ushered in a new era of data connectivity, for example, allowing for highly engaged communication between patients and providers as well as collaboration between professional or citizen scientists on data of unprecedented scale.[10] New methodologic approaches, including data mining and machine learning, increasingly leverage commodity hardware to conduct previously computationally intractable analyses.[9] Moreover, the development of domain ontologies fosters the discovery of meaningful insights from data of heterogeneous types.[11]
Ultimately, however, improvements in data alone are inadequate to achieve continuous learning. As shown in Figure 1, whereas data form the channels that allow for transitions from science to evidence to care, novel insights need to be steeped within the right culture, motivated by the right incentives, and supported by the right leaders.[1, 12] Within the sustainable learning healthcare system, knowledge generation feeds practice change with the support and guidance of system leadership; improved practice, in turn, generates new knowledge and completes the virtuous cycle of learning.
THE PROMISE OF CONTINUOUS LEARNING IN HOSPITAL SETTINGS
The hospital is an ideal setting in which to foster continuous learning because advances in inpatient care have the potential to substantially improve healthcare quality and value.[8] Americans were hospitalized roughly 37 million times in 2012; in total, these episodes cost $378 billion.[3] Over 700,000 patients die in US hospitals annually, with reports showing that many patients utilize greatly increased inpatient and critical care services near the end of their lives in a manner that appears misaligned with their preferences.[11, 13] Hospital care is also highly variable in quality and cost; this heterogeneity is not closely associated with improved outcomes.[14, 15] Preventable harm and medical injury occur commonly in hospitals and are now recognized to be a leading cause of inpatient death.[16] Finally, emerging research illuminates the substantial toll that acute care has on patients and families resulting in new comorbidity, functional or neuropsychiatric impairment, rehospitalization, and financial burden that persist long after patients are discharged.[17]
Fortunately, inpatient care also exhibits several qualities that improve the likelihood that continuous learning can be achieved. Although it is clear that hospitalizations occur within the arc of a patient's larger health trajectory, these distinct episodes offer the potential to observe patient trajectories and treatments evolving within relatively compressed time intervals; over that same interval, a large volume of data are produced. Stored within comprehensive electronic health records, these granular data now allow inpatient episodes to be digitally recapitulated with high fidelity, bolstering their use in driving care improvements.[18]
AN OBJECT LESSON IN THE LEARNING FRAMEWORK: SEPSIS CARE
Translating Science to Evidence in Sepsis
Although sepsis has attracted great attention in modern hospital care, sepsis was described long ago by Hippocrates to describe the process by which wounds fester.[19] Recast after the confirmation of germ theory, sepsis came to be known primarily as the blood poisoning resulting from pathogenic organisms.[20] However, with the advent of antibiotics, numerous scientific studies now recognize that sepsis actually results from the dysregulated host immune response to systemic infection, which can also cause organ dysfunction.[21] Based on this knowledge, landmark translational and clinical studies in the 2000s provided strong evidence that early identification of sepsis patients and aggressive infection control and resuscitation were associated with improved mortality (Figure 2, step 1).[22]
Translating Evidence to Care in Sepsis at KPNC
In 2007, the leadership of KPNC initiated a regional effort to improve the quality of care and reduce the variability in performance at its medical centers (Table 1).[23] Reviewing data from nearly 1000 inpatientsthe last 50 consecutive hospital deaths from each of 19 medical centersa mortality diagnostic based on Institute for Healthcare Improvement recommendations[24] revealed that sepsis had a major impact on hospital outcomes. For example, even though sepsis patients were still relatively under‐recognized at the time, accounting for fewer than 3% of hospitalizations, they contributed to one‐quarter of hospital deaths. In light of these compelling data, senior regional leadership identified reducing sepsis mortality as a key performance improvement goal (Figure 2, step 2).
| Time Period | Event Summary |
|---|---|
| |
| 2007 | Variability in hospital standardized mortality ratio observed, indicating an opportunity to drive improved outcomes. |
| Initiation of staggered implementation of unified electronic medical record across all KP sites (starting in 2006 and ending in 2009). | |
| Spring 2008 | Mortality diagnostic chart review completed identifying sepsis and infection‐related causes as key factors in hospital outcomes. |
| May 2008 | Regional Mortality Summit held with a focus on patient safety and mortality reduction efforts through performance improvement. Executive regional and local leadership alignment to focus on sepsis performance improvement. |
| Summer 2008 | Sepsis Steering Committee evaluates best available evidence, develops treatment algorithms, and plans for medical center pilots. |
| Fall 2008 | Pilot intervention deployed at 2 medical centers. |
| November 2008 | First Regional Sepsis Summit: development of sepsis performance improvement playbook, training materials, implementation plans, and measurement strategy. |
| November 2008 | All medical centers begin to form multidisciplinary sepsis teams and performance improvement committees, obtain equipment and supplies including assembly of a sepsis cart. Multidisciplinary teams included ED physician champion, ED nurse champion, improvement advisor, hospitalists, intensivists, quality improvement personnel, nurse educators, and even resident physicians. |
| January 2009 | Performance data collection begins on EGDT processes and outcomes. Initiation of 2 key elements to enhance screening for and detection of sepsis: (1) concomitant ordering of serum lactic acid along with blood cultures, and (2) definition of lactate >2.0 as a critical lab value. |
| Use of manual chart review for case finding and central database entry because of ongoing implementation of electronic medical record and limited sepsis‐specific data infrastructure. | |
| March 2009 | Regional train the trainer sessions occur and local educational spread efforts begin including: collaborative calls, in‐person training events, and medical center site visits. |
| August 2009 | Grant funding from the Gordon and Betty Moore Foundation begins with a planned 2‐year duration providing funding for improvement advisors with performance improvement expertise and data infrastructure development. |
| November 2009 | Second Regional Sepsis Summit. Identification of intermediate lactate sepsis patients having significant mortality. |
| January 2010 | Initiate measurement of performance for intermediate lactate sepsis patients with a focus on lactate clearance as an outcome measure of interest. |
| 2010 | Development of an intranet Web‐based data abstraction tool to identify cases and auto‐populate specific fields for review. Facilities were responsible for review of cases at the local level to foster rapid feedback cycles for local performance improvement. Standardized data query tools were deployed to foster local medical center engagement and system‐level evaluation. |
| Accompanying development of a sepsis performance improvement scorecard allowing for comparison of longitudinal performance metrics across all facilities. Scorecard elements included: proportion of lactates drawn following ED blood culture, EGDT‐specific bundle elements (ie, number of EGDT cases, antibiotics within 1 hour, first central venous pressure within 2 hours of EGDT start, target mean arterial pressure achievement), repeat lactate elements, balancing measures for central line placement (ie, pneumothorax, central line infection), and overall sepsis statistics. | |
| April 2011 | Third Regional Sepsis Summit. Refinement of EGDT bundle and further development of intermediate lactate bundle approach, including piloting specific treatment bundles targeting this population. Collaborative performance improvement environment in which successful strategies at 1 site were rapidly disseminated to other sites including the Sepsis Alert and the Sepsis Clock. |
| May 2012 | Research analysis of fluid volume and lactate clearance in intermediate lactate sepsis population begins. |
| February 2013 | Fourth Regional Sepsis Summit. Regional spread of intermediate lactate bundle including the use of fluids, antibiotics, and repeat lactate measurements. |
| May 2013 | Research analysis of the contribution of sepsis to hospital deaths (within KP and in national sample) as well as post‐sepsis resource utilization and mortality |
| March 2014 | Publication of ProCESS randomized clinical trial, requiring systemic reevaluation of EGDT‐based sepsis strategy. Subsequent publications of ARISE and ProMISe trials confirming findings from ProCESS. Updated approach under consideration and informally disseminated to practitioners. |
| October 2014 | Updated sepsis treatment guidelines and data capture strategy fully implemented moving away from a catheter‐based strategy for all EGDT‐eligible patients. |
| October 2015 | Sixth Regional Sepsis Summit held to adjust sepsis treatment and data measurement strategy to align more closely with CMS SEP‐1 guidelines. |
Based on the principles of performance improvement methodology, clinical and operational leaders established an environment with aligned culture, incentives, and leadership around sepsis care. The effort was launched in late 2008 at a Sepsis Summit, bringing together a multidisciplinary group of stakeholders (eg, hospitalist, emergency department, and intensive care chiefs of staff and nursing managers; medical center and nursing executive and operational leadership) and providing sepsis care pathways based on the best available evidence.[23] Regional investments in the digital infrastructure to support implementation resulted in the provision of granular data within monthly sepsis scorecards quantifying each medical center's performance and trends for a diverse set of sepsis bundle metrics.
The resulting changes in sepsis care were substantial. For example, improved early recognition of infected patients meeting the criteria for sepsis resulted in large changes in the standardized diagnostic criteria used to label patients (Figure 3A). Implementing screening strategies using serum lactate testing for any patient receiving blood cultures resulted in a roughly 10‐fold increase in the use of lactate testing in the emergency department (Figure 3B). Earlier recognition of sepsis also increased the number of patients receiving early antibiotics and receiving central venous catheters for quantitative resuscitation.[23]
CLOSING THE LOOP TOWARD CONTINUOUS LEARNING IN SEPSIS
Leveraging timely and actionable data steeped within an aligned organizational milieu resulted in large‐scale changes across a heterogeneous set of hospitals. However, to realize the true vision of a learning hospital system, a looming question remained: Could the data generated as the byproduct of routine care now be used to complete the virtuous cycle and drive new scientific discovery (Figure 2, step 3)?
Confirming Concordance in the Impact of Sepsis Nationally
The heightened identification of sepsis patients through program implementation revealed that the impact of sepsis on hospital mortality was greater than originally estimated; based on improved patient identification, sepsis now accounted for upward of 1 in 2 hospital deaths.[25] This sobering statistic confirmed that the investments in standardizing best sepsis care following the mortality diagnostic were critical. However, were similar estimates of sepsis‐attributable mortality consistent outside of the KPNC system? To study this, we examined US hospitalizations occurring across >1000 hospitals and involving >6 million hospital stays to estimate corresponding prevalence.[25] In this national sample, sepsis contributed to as many as half of hospital deaths in the United States in 2010, lending strong support to ongoing international and state‐based efforts to improve sepsis care. These studies also paved the way to use these data drawn from our large sepsis population to inform updated international consensus definitions for sepsis and septic shock.[26, 27, 28]
Identifying New Avenues for Reducing the Toll of Sepsis
A major concern of sepsis program leaders was the prior findings that sepsis hospitalizations among Medicare beneficiaries were associated with substantial new cognitive and functional disability.[29] This lingering toll of sepsis had been termed a hidden public health disaster.[30] To further understand the posthospital impact of sepsis and to begin investigating new avenues to reduce this impact, a cohort of patients was followed for 1 year following sepsis hospitalization.[31] Over that period, nearly half of sepsis survivors were rehospitalized. When compared with their presepsis levels of healthcare utilization, middle‐aged and elderly sepsis patients experienced a 3‐fold increase in their days using facility‐based care. Subsequent studies in other populations outside of KPNC have confirmed these concerning findings, resulting in new efforts to address postsepsis survivorship care.[32, 33]
Phenotyping New Targets for Standardized Sepsis Care
At its outset, the sepsis improvement program applied the best available evidence to treat patients with the most severe forms of sepsisseptic shock. However, once the initial implementation phase had succeeded, clinicians and operational leaders quickly realized from the emerging data that there was a far larger group of sepsis patients for whom treatment guidelines were poorly defined.[25, 34, 35] These were severe sepsis patients with so‐called intermediate lactate values between 2 mmol/L and 4 mmol/L; they comprised a substantial proportion of all sepsis patients dying in the hospital. Using data generated from the routine care of sepsis patients treated across 21 hospitals, the sepsis leadership group was able to rapidly assemble a cohort of intermediate lactate sepsis patients up to 20‐ to 100‐fold larger than that reported in prior studies and evaluate their outcomes.[34, 35]
The data used to evaluate these intermediate lactate sepsis patients now spurred a new implementation program in 2013 for a group of patients in whom there was essentially no existing evidence to guide care. Rapidly implemented within a mature sepsis performance improvement program, evaluations at the 6‐month and 1‐year intervals demonstrated significant decreases in mortality.[36] Importantly, to allay the justified concerns of clinicians, these evaluations also clearly showed no evidence of harm from more aggressive fluid resuscitation (eg, increased transfer to intensive care, increased rates of mechanical ventilation). Again, driven by clinician input, subgroup analyses further revealed that the implementation program was only associated with reduced mortality in patients who could be at risk for iatrogenic fluid overload (ie, those with a history of congestive heart failure or chronic kidney disease).[36] Spurred by these provocative findings, operational and clinical leaders are currently considering how to guide future care in these patients, especially with the emerging use of noninvasive methods to quantify patients' fluid responsiveness.
PRINCIPLES FOR LEVERAGING DATA IN THE LEARNING HOSPITAL SYSTEM
The object lesson of using data to drive improved sepsis care and further new scientific discovery offers some important insights for continuous learning.
Building a Digital Infrastructure for Utilizing Granular Hospital Data
As described above, current transitions between the nodes of the learning framework are rife with missed opportunities. Perhaps one of the most glaring is the inability to use highly granular data already collected within the electronic health record (eg, trajectories and trends across vital signs or laboratory results, large‐scale medication administration records to evaluate multidrug interactions). An essential starting point for continuous learning is investing in the digital infrastructure to improve the use of data beyond traditional claims (administrative dataadmission source codes, disposition codes, diagnoses, and procedures). As shown in Table 2, the first key step is incorporating laboratory data into the quality assessment/emmprovement process. In addition, using these data to automate severity of illness and risk adjustment metrics fosters use of similar comparison cohorts across time or disease types.[18, 37, 38, 39, 40]
| Data Type | Contents | Degree of Difficulty in Accessing | Degree of Difficulty in Analyzing |
|---|---|---|---|
| Administrative | Traditional claims data, diagnostic or procedural codes | Low | Low to moderate |
| Standard cohort profiling | Limited instances of vitals signs, laboratory, diagnostic testing, or treatment data | Low to moderate | Low to moderate |
| Metrics reporting for care improvement | Standard cohort identification, aggregated achievement of treatment targets, scorecard dissemination | Moderate | Moderate |
| Advanced cohort profiling | Time series of physiologic data, inpatient triage and treatment data within short temporal intervals | Moderate to high | High |
| Research‐grade discovery | Data with breadth (representative sample size) and depth (highly granular physiologic and treatment data) | High | Very high |
| Patient‐reported outcomes | Quality of life, functional and cognitive disability | Very high | High |
Employing Novel Methods to Address the Limitations of Using Real‐World Data
The rapid digitization of medicine through the use of electronic medical records offers tremendous opportunities to facilitate continuous learning. However, these opportunities are accompanied by important limitations.[41] Data collected as a byproduct of real‐world care can be vulnerable to many forms of bias and confounding, potentially clouding the validity and robustness of corresponding analytic results. Fortunately, advanced methods including causal inference are now used routinely to address some limitations.[42] In the context of a learning healthcare system, other opportunities for improved study design including cluster randomized trials or stepped wedge implementation can also be employed to preserve the statistical rigor of subsequent analyses.[43] Finally, emerging methods employing randomization through the electronic medical record alongside adaptive trial design offer great potential to increase the efficiency of continuous learning.[44]
Evaluating the Hospital as a Single System
Advances in contemporary hospital care require seamless transitions of patient care, screening strategies, and therapeutic approaches across multiple hospital domains and with diverse providers; these interventions also need to happen rapidly. Many traditional approaches to inpatient care have taken a bottom‐up approach (eg, studying a specific disease within a specific hospital ward like the intensive care unit) that have proven useful but may limit generalizability when applied to a real‐world hospital operating with Pareto optimality (ie, the trade‐off scenario where new resource allocation to 1 area also requires resource withdrawal from another area). In certain cases, an empiric approach, without initial preference for any specific ward or disease, can aid decision making by hospital operational and clinical leaders by providing a global picture of impact and value.
Focusing on Early Detection in Hospital Settings as Secondary Prevention
Once patients have been admitted to the hospital, a race against the clock begins. Each additional hour of hospitalization increases the risks of iatrogenic injury or medical harm manifested by immobility, disorientation and delirium, nosocomial infections, or medication errors, among others. In this context, detection systems that use granular hospital data to focus on the earliest detection of risk can aid critical approaches to secondary prevention (Although the hospitalization for sepsis cannot be avoided, careful attention to mobility can limit the risk of developing delirium. In turn, preventing delirium can limit the risk of new functional disability).
Contextualizing Hospital Care Within a Longitudinal Trajectory
Although we described the benefit of hospital episodes having well‐demarcated beginning and ending points, it remains essential to recognize that the harms associated with hospitalization extend well beyond discharge. In this context, hospitalizations can serve as waypoints in patients' health trajectories as well as an opportunity to achieve patient‐centered care including discussing and aligning goals of care with actual care provision. Furthermore, although we have seen steady declines in hospital mortality over time, it is highly likely that we will reach a nadir in mortality where additional metrics of hospital outcomes will need to include postdischarge events like readmission, long‐term mortality, quality of life, and the prevention of disability or decline.
CONCLUSION
Hospitalizations in the United States are costly and associated with high mortality and morbidity; the toll of hospitalization also extends well beyond hospital discharge. The promise of the learning hospital system has marked improvements in the quality of hospital care, especially where healthcare systems can steep critical investments in data and digital infrastructure within the right culture, incentives, and leadership. Where continuous learning is achieved, data generated during routine care offer the potential to yield new scientific discovery and drive further improvements in hospital care.
Disclosures
As part of our agreement with the Gordon and Betty Moore Foundation, we made a commitment to disseminate our findings in articles such as this one. However, the Foundation and its staff played no role in how we actually structured our articles, nor did they review or preapprove any of the manuscripts submitted as part of the dissemination component. None of the authors has any conflicts of interest to declare of relevance to this work, which was funded by a combination of funding from the Gordon and Betty Moore Foundation, The Permanente Medical Group, Inc., and Kaiser Foundation Hospitals, Inc. VXL was supported by NIH K23GM112018.
- Institute of Medicine. Best Care at Lower Cost: The Path to Continuously Learning Health Care in America. Washington, DC: The National Academies Press; 2012.
- , , , et al. Toward a science of learning systems: a research agenda for the high‐functioning Learning Health System. J Am Med Inform Assoc. 2015;22(1):43–50.
- National Center for Health Statistics. Health, United States, 2014: With Special Feature on Adults Aged 55–64. Hyattsville, MD; 2015.
- , . Critical care medicine in the United States 2000‐2005: an analysis of bed numbers, occupancy rates, payer mix, and costs. Crit Care Med. 2010;38(1):65–71.
- , , , . Trends and variation in end‐of‐life care for medicare beneficiaries with severe chronic illness. A report of the Dartmouth Atlas Project. Lebanon, NH: The Dartmouth Institute for Health Policy and Clinical Practice; 2011.
- , , , et al. Change in end‐of‐life care for Medicare beneficiaries: site of death, place of care, and health care transitions in 2000, 2005, and 2009. JAMA. 2013;309(5):470–477.
- , , . Finding the missing link for big biomedical data. JAMA. 2014;311(24):2479–2480.
- . Code red and blue—safely limiting health care's GDP footprint. N Engl J Med. 2013;368(1):1–3.
- , . The inevitable application of big data to health care. JAMA. 2013;309(13):1351–1352.
- , . What is citizen science?—a scientometric meta‐analysis. PLoS One. 2016;11(1):e0147152.
- , , . Biomedical ontologies: a functional perspective. Brief Bioinform. 2008;9(1):75–90.
- . Rapid learning: a breakthrough agenda. Health Aff (Millwood). 2014;33(7):1155–1162.
- , , , et al. Are regional variations in end‐of‐life care intensity explained by patient preferences?: a study of the US Medicare population. Med Care. 2007;45(5):386–393.
- , . Extreme markup: the fifty US hospitals with the highest charge‐to‐cost ratios. Health Aff (Millwood). 2015;34(6):922–928.
- , , , . The price ain't right? Hospital prices and health spending on the privately insured. Health Care Pricing Project website. Available at: http://www.healthcarepricingproject.org/sites/default/files/pricing_variation_manuscript_0.pdf. Accessed February 15, 2016
- . A new, evidence‐based estimate of patient harms associated with hospital care. J Patient Saf. 2013;9(3):122–128.
- , , . Hospitalization‐associated disability: “she was probably able to ambulate, but I'm not sure”. JAMA. 2011;306(16):1782–1793.
- , , , , . Risk‐adjusting hospital mortality using a comprehensive electronic record in an integrated health care delivery system. Med Care. 2013;51(5):446–453.
- . New definitions for sepsis and septic shock: continuing evolution but with much still to be done. JAMA. 2016;315(8):757–759.
- , . Severe sepsis and septic shock. N Engl J Med. 2013;369(21):2063.
- , , . Sepsis‐induced immunosuppression: from cellular dysfunctions to immunotherapy. Nat Rev Immunol. 2013;13(12):862–874.
- , , , et al. Early goal‐directed therapy in the treatment of severe sepsis and septic shock. N Engl J Med. 2001;345(19):1368–1377.
- , , , et al. Kaiser Permanente's performance improvement system, part 3: multisite improvements in care for patients with sepsis. Jt Comm J Qual Patient Saf. 2011;37(11):483–493.
- , , , , . Understanding the components of quality improvement collaboratives: a systematic literature review. Milbank Q. 2013;91(2):354–394.
- , , , et al. Hospital deaths in patients with sepsis from 2 independent cohorts. JAMA. 2014;312(1):90–92.
- , , , et al. Assessment of clinical criteria for sepsis: for the Third International Consensus Definitions for Sepsis and Septic Shock (Sepsis‐3). JAMA. 2016;315(8):762–774.
- , , , et al. Developing a new definition and assessing new clinical criteria for septic shock: for the Third International Consensus Definitions for Sepsis and Septic Shock (Sepsis‐3). JAMA. 2016;315(8):775–787.
- , , , et al. The Third International Consensus Definitions for Sepsis and Septic Shock (Sepsis‐3). JAMA. 2016;315(8):801–810.
- , , , . Long‐term cognitive impairment and functional disability among survivors of severe sepsis. JAMA. 2010;304(16):1787–1794.
- . The lingering consequences of sepsis: a hidden public health disaster? JAMA. 2010;304(16):1833–1834.
- , , , , , . Hospital readmission and healthcare utilization following sepsis in community settings. J Hosp Med. 2014;9(8):502–507.
- , , , , . Increased 1‐year healthcare use in survivors of severe sepsis. Am J Respir Crit Care Med. 2014;190(1):62–69.
- , , , et al. Post‐acute care use and hospital readmission after sepsis. Ann Am Thorac Soc. 2015;12(6):904–913.
- , , , , . Fluid volume, lactate values, and mortality in sepsis patients with intermediate lactate values. Ann Am Thorac Soc. 2013;10(5):466–473.
- , , . Prognosis of emergency department patients with suspected infection and intermediate lactate levels: a systematic review. J Crit Care. 2014;29(3):334–339.
- , , , et al. Multicenter implementation of a treatment bundle for sepsis patients with intermediate lactate values. Am J Respir Crit Care Med. 2016;193(11):1264–1270.
- , , , et al. Risk adjusting community‐acquired pneumonia hospital outcomes using automated databases. Am J Manag Care. 2008;14(3):158–166.
- , , , , , . Intra‐hospital transfers to a higher level of care: contribution to total hospital and intensive care unit (ICU) mortality and length of stay (LOS). J Hosp Med. 2011;6(2):74–80.
- , , , , , . Early detection of impending physiologic deterioration among patients who are not in intensive care: development of predictive models using data from an automated electronic medical record. J Hosp Med. 2012;7(5):388–395.
- , , , , . An electronic Simplified Acute Physiology Score‐based risk adjustment score for critical illness in an integrated healthcare system. Crit Care Med. 2013;41(1):41–48.
- . Learning from big health care data. N Engl J Med. 2014;370(23):2161–2163.
- , . Getting the methods right—the foundation of patient‐centered outcomes research. N Engl J Med. 2012;367(9):787–790.
- , , , , . The stepped wedge cluster randomised trial: rationale, design, analysis, and reporting. BMJ. 2015;350:h391.
- . Fusing randomized trials with big data: the key to self‐learning health care systems? JAMA. 2015;314(8):767–768.
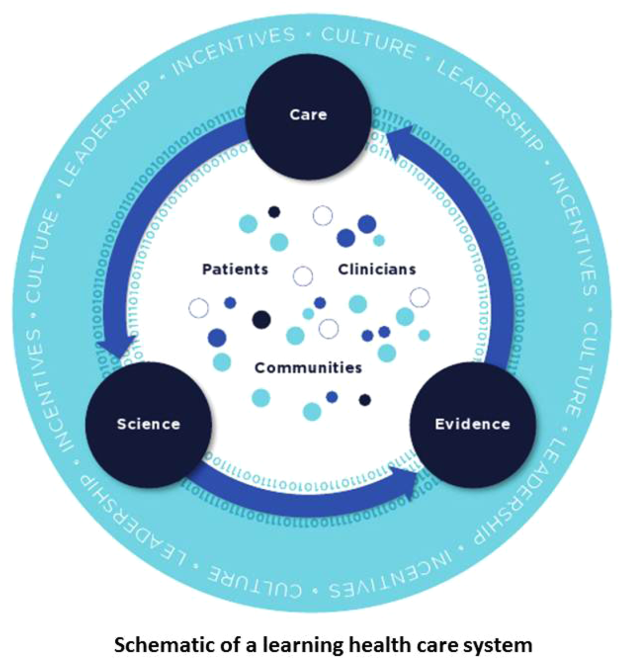
Connecticut gets top ranking for mental health
The state of mental health in Connecticut makes it the state for mental health in 2016, according to the advocacy group Mental Health America.
Connecticut had the top overall score in an analysis that combined 15 prevalence and access measures for adults and children. Massachusetts finished second, and Vermont was third for a New England sweep of the medal positions, with South Dakota and Minnesota rounding out the top five, Mental Health America reported.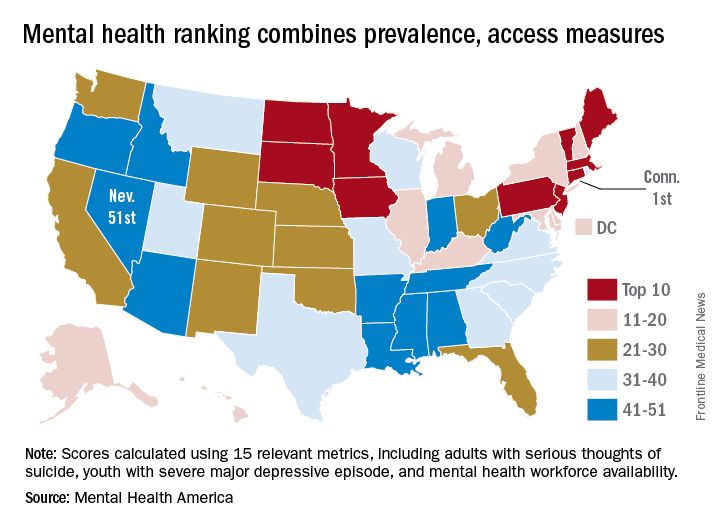
Connecticut finished first in the subgroups of measures pertaining to adults and to prevalence, Minnesota ranked first in the subgroup of child measures, and Vermont was first in access to care. Nevada was 51st in the adult measures and in access to care, Arkansas ranked 51st in the child measures, and Oregon was 51st in the prevalence ranking, noted Mental Health America, which also gave a ranking to the District of Columbia.
Considerable variation can be seen between states on some of the 15 measures. For mental health workforce availability, Massachusetts was first with 1 mental health provider per 200 residents, while Alabama was 51st with one provider for every 1,200 individuals. In South Dakota, 39.5% of children with severe depression received some consistent treatment, compared with 9.4% in Nevada. In Hawaii, 13.6% of adults with mental illness were not able to get the treatment they needed, compared with 25.9% in Missouri, according to Mental Health America.
The Substance Abuse and Mental Health Services Administration was the main source of data for the analysis; other sources included the Centers for Disease Control and Prevention, the Centers for Medicare & Medicaid Services, and the Department of Education.
Promoting yourself and building your practice
Training in cardiothoracic surgery is long and arduous. Through it all, one’s chief concerns are generally limited to becoming a proficient physician and surgeon while attending to the basic necessities of life (i.e., sleep and the occasional meal). Then, mercifully, it ends, and you take that first job, typically move to a new city, and, if you’re lucky, get right to work with a full clinic and caseload. On the other hand, as is common for many, you now have an ample amount of time and very few patients or cases. At this point you have two options: Sit and wait, or get out there and do what comes least naturally to most of us; promote yourself.
Full disclosure, I’ve done a lot of this self-promotion; driving around, shaking hands, getting gently rebuffed or offered empty pleasantries. Admittedly, it’s not a lot of fun, and at the end of the day you might come home feeling a bit like Willy Loman in “Death of a Salesman,” with no clear idea if you have accomplished anything or not. Please don’t despair, however, because even in the era of social media there remains no substitute for the face to face, and I can tell you from personal experience that, with persistence and a strategic approach, good things can happen. The following are some key steps in the process of self-promotion and practice building:
• Familiarize yourself with your institution’s marketing department. Each institution typically employs liaisons whose job it is to promote new hires. In addition, they can arrange meetings between you and referring physicians.
• Make yourself available to travel with the liaisons. They can sell you only so much in your absence. The more they hear you speak about your clinical interests, the better equipped they are to discuss your practice when you are not with them.
• Determine how you want to market yourself. It is not enough to say you are a new cardiac surgeon. Make sure marketing and potential referring physicians know exactly what it is you do (i.e., cardiac surgeon with aortic expertise or thoracic surgeon with interest in benign esophageal disease).
• Learn the demographics of your state and/or region. It is important to know the key population centers and their access to care. People of means will usually perform thorough research and seek out the best care, whereas individuals of lesser means will be motivated by proximity. In the case of the latter, consideration for a satellite clinic may be in order.
• Learn the geography of your state and/or region. The physical location of your hospital can heavily influence referral patterns. If patients believe that your hospital/clinic is hard to get to, and they are overwhelmed by the idea of navigating the campus, you may have a problem. In this case, once again a satellite clinic with easy access and parking may go a long way to keeping those patients.
• When you are out and about, take the time to learn who are the new members of the group that you are visiting. These are individuals who have no established referral patterns and would probably be more than happy to send you a patient or two. Older members tend to have their preferences, which they have developed long before you came to town.
• Give out that cellphone. Accessibility is still king and it can’t get any easier for the busy cardiologist or oncologist than to have your phone number. Plus, some hospital systems track the referral patterns of their physicians in an attempt to discourage sending patients outside the system. Thus, the cellphone provides a way around that barrier.
• Make the most of your call! When the outside hospital wants to transfer someone in, take that patient. Even if you don’t operate on them, that patient has an internist or a pulmonologist or an oncologist, and your subsequent phone call lets them know that you are out there and eager to help.
Did I mention that practice building is hard? Some of the bullet points listed above will work well, and others will be less fruitful. If things remain slow, a little introspection and reinvention may be required. Try to think of yourself as the Rolling Stones (or not, your choice, but this is my analogy). The Stones made a couple of nice pop records and could have drifted into oblivion, but instead they escaped to the south of France (for tax reasons mind you) and turned out “Exile on Main Street.” The result was sustained relevance and an album that is forever etched in the rock pantheon.
So ask yourself, What can I do to make myself unique and offer what others want or need and will continue to both want and need into the future? Many times this requires a willingness to take on challenging cases and to develop new skill sets. Not an easy pursuit, mind you, but one that will be recognized by your peers both within your institution and outside of it.
Personally, I recognized a need for the treatment of large paraesophageal hernias. Perhaps not my first choice, but clearly a group of patients who were underserved and an operation I was willing to offer.
Perseverance is in order when you first start out, and it can be easy to get discouraged, but continued belief in oneself and your abilities is tantamount to success. For instance, take F. Scott Fitzgerald. In 1925, he published “The Great Gatsby,” to less than rave reviews, and by 1940 the book was largely forgotten. Despite this setback, Fitzgerald never stopped believing that Gatsby was his masterpiece and promoted it as such. Interestingly, in 1942, a group of publishers began to distribute leftover copies to GIs fighting overseas, who loved it, and now today the book is considered by some to be one of the great American novels. So get out there, tell your story, believe in yourself, deliver good service to your patients and referring physicians, and good things will happen.
Dr. Klapper is an assistant professor of surgery in the division of cardiothoracic surgery, Duke University Medical Center, Durham, N.C.
14% of ASCVD patients need a PCSK9 inhibitor to reach LDL goal
ROME – An estimated 14% of Americans with atherosclerotic cardiovascular disease can’t reach the LDL cholesterol goal of less than 70 mg/dL on maximal intensified oral lipid-lowering therapy and thus are candidates for a PCSK9 inhibitor such as alirocumab, Christopher P. Cannon, MD, reported at the annual congress of the European Society of Cardiology.
After adding alirocumab (Praluent) at 75 mg by subcutaneous injection every 2 weeks, that figure drops to 2%. And by increasing the alirocumab dose to 150 mg in that 2%, the result is that fewer than 1% of patients with atherosclerotic cardiovascular disease (ASCVD) will have an LDL cholesterol level of 70 mg/dL or more, assuming no tolerability issues along the way, added Dr. Cannon, professor of medicine at Harvard Medical School, Boston.
This Monte Carlo simulation relies on lipid-lowering treatment outcome rates from published landmark clinical trials such as IMPROVE-IT (N Engl J Med. 2015 Jun 18;372[25]:2387-97), for which Dr. Cannon was a lead investigator, as well as data from the ongoing ODYSSEY program of alirocumab studies. Importantly, the model doesn’t factor in drug intolerance.
In this model, the average age of the hypothetical 1 million ASCVD patients was 66.5 years and 54.6% were men. The distribution of ASCVD diagnoses was representative of the real-world experience: 70% had coronary heart disease, 25% had ischemic cerebrovascular disease, 35% had peripheral artery disease, and 5% had experienced an acute coronary syndrome within the past 12 months.
Current guidelines would strongly recommend that all of these patients be on lipid-lowering therapy, yet only 53% were at baseline. Guideline-recommended lipid-lowering strategies would suggest that those patients not on a lipid-lowering drug be placed on atorvastatin at 20 mg/day; by that step, 50% of the 1 million ASCVD patients would be at the goal of an LDL cholesterol level below 70 mg/dL.
For the other 50%, a reasonable next step would be a high-intensity statin: say, atorvastatin at 80 mg/day instead of 20. That would leave only 21% of the original ASCVD population with an LDL cholesterol level of 70 mg/dL or higher. The next step for those patients, as established in IMPROVE-IT, would be to add ezetimibe (Zetia). That constitutes maximal oral lipid-lowering therapy, and 14% of the original ASCVD population would still have an LDL cholesterol level of 70 mg/dL or more on that multidrug regimen.
On the basis of the results of the ODYSSEY trials, adding alirocumab at 75 mg would drop that figure from 14% down to 2%. And by switching to alirocumab at 150 mg every 2 weeks in those outliers, less than 1% of the 1 million patients with ASCVD would still have an LDL cholesterol level of 70 mg/dL or more. The mean LDL cholesterol level would be 52.0 mg/dL in patients on full treatment intensification with a high-dose statin, ezetimibe, and alirocumab.
If future studies were to establish that the new LDL cholesterol level goal for patients with known ASCVD was less than 55 mg/dL, the simulation indicates that just under 59% of patients on full-on treatment intensification including alirocumab would achieve it, according to Dr. Cannon.
He reported receiving research grants from and/or serving as a consultant to well over a dozen pharmaceutical companies, including Sanofi and Regeneron, which sponsored this analysis.
AT THE ESC CONGRESS 2016
Key clinical point:
Major finding: The combination of a high-intensity statin, ezetimibe, and alirocumab should enable more than 99% of Americans with atherosclerotic cardiovascular disease to achieve an LDL cholesterol level below 70 mg/dL.
Data source: This Monte Carlo simulation model created a hypothetical cohort of 1 million Americans with ASCVD and utilized outcome data from landmark clinical trials to estimate the patients’ ability to achieve a guideline-recommended LDL cholesterol level below 70 mg/dL in response to various intensities of lipid-lowering therapy.
Disclosures: This analysis was funded by Sanofi and Regeneron. The presenter reported receiving research grants from and serving as a consultant to those pharmaceutical companies and more than a dozen others.
PsA bone loss measurement: A surrogate for radiographic progression?
An advanced computer assisted digital x-ray radiogrammetry technique that measures bone thickness has the potential to be a surrogate marker of radiographic progression in psoriatic arthritis, according to a report in Arthritis Research & Therapy.
The method uses software called BoneXpert to sensitively differentiate between the different stages of disease manifestation affecting bone integrity. Digital x-ray radiogrammetry (DXR) with BoneXpert has a clinical advantage over standard techniques such as radiographs through its ability to be integrated into a picture archiving and communication system that allows direct image analysis and quantification of bone loss, according to the study authors, led by Alexander Pfeil, MD, of Jena (Germany) University Hospital – Friedrich Schiller University.
The researchers used the computer-assisted diagnosis software to measure the metacarpal index (MCI) and its cortical thickness score (MCI T-score) in the metacarpal bones of 104 psoriatic arthritis (PsA) patients who fulfilled the CASPAR criteria. All patients were treated either with nonsteroidal anti-inflammatory drugs or disease-modifying antirheumatic drugs (Arthritis Res Ther. 2016;18:248. doi: 10.1186/s13075-016-1145-4).
In the total PsA cohort, the MCI T-score showed a significantly reduced negative value of –1.289. “The reduced MCI T-score was clearly associated with a reduced bone mineral density of the metacarpal bones in PsA,” the investigators wrote.
For all scores, the researchers found a severity-dependent reduction for the BoneXpert parameters of MCI, MCI T-score, T, and Bone Health Index.
The strongest reductions were seen for MCI and T using the Proliferation Score (MCI: –28.3%; T: –31.9%) and the Destruction Score (MCI: –30.8%; T: –30.9%) of the Psoriatic Arthritis Ratingen Score.
A reduced MCI and T-score was directly associated with cortical thinning and the periarticular demineralization of the metacarpal bones, and highlighted a direct association with bone destruction and bone proliferation in PsA, the investigators said.
“The measurement of periarticular bone loss can be considered a complementary approach to verify PsA-related bony changes and a surrogate marker for PsA progression,” the researchers suggested.
The technique’s high reproducibility can also be used to optimize an appropriate individual therapeutic strategy, they added.
The study had no specific funding source, and the authors declared no conflicts of interest.
FROM ARTHRITIS RESEARCH & THERAPY
Key clinical point:
Main finding: In the total PsA cohort, the MCI T-score showed a significantly reduced negative value of –1.289.
Data source: A cohort of 104 PsA patients fulfilling the CASPAR criteria who were taking nonsteroidal inflammatory drugs or disease-modifying antirheumatic drugs.
Disclosures: The study had no specific funding source, and the authors declared no conflicts of interest.
Alemtuzumab Reduces Preexisting MS Disability
In addition to slowing disability accumulation, alemtuzumab improves preexisting disability in patients with relapsing-remitting multiple sclerosis (MS) who have had inadequate responses to prior therapies, according to research published online ahead of print October 12 in Neurology. “Disabilities may often be reversible (at least partially) in patients with active relapsing-remitting MS if they receive suitable therapy, irrespective of the type of baseline functional deficit,” said Gavin Giovannoni, MD, PhD, Professor of Neurology at Barts and the London School of Medicine and Dentistry, and colleagues. 
Most currently approved therapies for relapsing-remitting MS delay confirmed disability worsening, compared with placebo. The introduction of more potent drugs in recent years, however, has made the goal of confirmed disability improvement (CDI) appear more feasible. In the CARE-MS II (Comparison of Alemtuzumab and Rebif Efficacy in MS II) trial, CDI was more likely among patients receiving alemtuzumab than among those receiving interferon beta-1a.
An Analysis of CARE-MS II Data
Dr. Giovannoni and colleagues examined prespecified and post hoc disability outcomes of CARE-MS II to characterize alemtuzumab’s effect on preexisting disability. In the trial, patients with relapsing-remitting MS with inadequate response to prior disease-modifying therapies were randomized to alemtuzumab or subcutaneous interferon beta-1a. Patients randomized to alemtuzumab received 12 mg/day of the treatment on five consecutive days at month 0, and on three consecutive days at month 12. Participants randomized to interferon received 44 mg three times weekly. The study lasted for two years.
Blinded raters performed Expanded Disability Status Scale (EDSS) assessments at baseline, every three months, and when relapse was suspected. They administered the MS Functional Composite (MSFC) three times before baseline to attenuate practice effects, and then every six months. Finally, they assessed visual function every six months with the binocular Sloan low-contrast letter acuity (SLCLA) test.
Dr. Giovannoni and colleagues assessed four tertiary end points of CARE-MS II. The first was time to CDI, which was defined as a decrease of one or more points in EDSS from baseline sustained for three or more or six or more months in patients with a baseline score of 2 or greater. The second was the proportion worsened (increase of 0.5 or more points), stable, or improved (decrease of 0.5 or more points) from baseline EDSS. The third was mean change from baseline in MSFC and MSFC plus SLCLA scores and their components. The fourth was proportions worsened (decrease of 0.5 or more standard deviations), stable, or improved (increase of 0.5 or more standard deviations) from baseline MSFC scores.
Results Consistently Favored Alemtuzumab
In all, 202 patients were randomized to interferon beta-1a, and 426 patients were randomized to alemtuzumab. Baseline demographic and clinical characteristics were similar between treatment groups. The groups had comparable percentages of patients with recent prestudy relapse.
At month 24, EDSS improvement, as well as improvement in all seven EDSS functional systems, was more common among patients receiving alemtuzumab, compared with those receiving interferon. Participants receiving alemtuzumab were more than twice as likely as those receiving interferon to have three-month CDI. Among patients with a baseline EDSS of 3 or higher, the proportion of patients with six-month CDI was also significantly greater with alemtuzumab than with interferon. Stratification of results by presence or absence of prior interferon use did not affect the results, nor did stratification by presence or absence of relapse within three months before initiating treatment.
In addition, the likelihood of six-month CDI in MSFC score from baseline to month 24 was greater for patients receiving alemtuzumab than those receiving interferon. Participants in the interferon group were significantly more likely than those in the alemtuzumab group to have 15% or greater worsening in MSFC sustained for six months. The difference between treatment groups in 20% or greater worsening in MSFC sustained for six months was not statistically significant.
At months 12 and 24, visual acuity in patients receiving alemtuzumab was stable at 2.5% contrast and at 100% contrast, but the results were not statistically significant. Participants receiving interferon had a significant decline in visual acuity from baseline to month 12 and from baseline to month 24 at 1.25% contrast and 2.5% contrast. Visual acuity declined significantly from baseline to month 24 in the interferon group at 100% contrast. Differences between treatment groups were significant at 2.5% contrast at months 12 and 24, and at 1.25% contrast at month 12.
Structural or Functional Repair?
“Giovannoni et al demonstrated that comparing two drugs for their efficacy on disability progression omits a crucial aspect of the MS disease process: sustained reduction in disability,” said Bibiana Bielekova, MD, investigator at the National Institute of Neurological Disorders and Stroke in Bethesda, Maryland, and Mar Tintoré, MD, PhD, neurologist at the MS Centre of Catalonia in Barcelona, in an accompanying editorial. “Comparing both sides of the disability changes [ie, disability progression and disability reduction] between the two drugs doubles the amount of clinically useful information.”
The CARE-MS II design, however, may artificially overestimate the benefit of alemtuzumab over interferon, they added. More than 50% of enrolled patients were previously treated with interferon beta-1a, and the inclusion criteria required the presence of relapses while on this therapy. These factors “technically excluded patients who had optimal therapeutic response to interferon beta-1a,” said Drs. Bielekova and Tintoré. “Nevertheless, a similar observation was seen in treatment-naive patients with relapsing-remitting MS in the CAMMS223 phase II trial.”
Dr. Giovannoni’s group ruled out, to an extent, the possibility that disability improvements resulted solely from the reversal of exacerbation-related disability. Similarly, the observed sustained reduction in disability likely did not simply reflect measurement variance, because the results on various outcomes consistently favored alemtuzumab. “One can only speculate whether the sustained reduction in disability is due to structural repair (ie, remyelination) or functional repair (ie, plasticity, such as formation of new synapses). We favor the latter idea, based on the early experience with CD52-depleting antibody,” said Drs. Bielekova and Tintoré.
“Despite unarguable progress in MS therapeutics, there is still a long road ahead until we can eliminate disease progression for all patients,” they concluded.
—Erik Greb
Suggested Reading
Giovannoni G, Cohen JA, Coles AJ, et al. Alemtuzumab improves preexisting disability in active relapsing-remitting MS patients. Neurology. 2016 Oct 12 [Epub ahead of print].
Bielekova B, Tintore M. Sustained reduction of MS disability: New player in comparing disease-modifying treatments. Neurology. 2016 Oct 12 [Epub ahead of print].
In addition to slowing disability accumulation, alemtuzumab improves preexisting disability in patients with relapsing-remitting multiple sclerosis (MS) who have had inadequate responses to prior therapies, according to research published online ahead of print October 12 in Neurology. “Disabilities may often be reversible (at least partially) in patients with active relapsing-remitting MS if they receive suitable therapy, irrespective of the type of baseline functional deficit,” said Gavin Giovannoni, MD, PhD, Professor of Neurology at Barts and the London School of Medicine and Dentistry, and colleagues.
Most currently approved therapies for relapsing-remitting MS delay confirmed disability worsening, compared with placebo. The introduction of more potent drugs in recent years, however, has made the goal of confirmed disability improvement (CDI) appear more feasible. In the CARE-MS II (Comparison of Alemtuzumab and Rebif Efficacy in MS II) trial, CDI was more likely among patients receiving alemtuzumab than among those receiving interferon beta-1a.
An Analysis of CARE-MS II Data
Dr. Giovannoni and colleagues examined prespecified and post hoc disability outcomes of CARE-MS II to characterize alemtuzumab’s effect on preexisting disability. In the trial, patients with relapsing-remitting MS with inadequate response to prior disease-modifying therapies were randomized to alemtuzumab or subcutaneous interferon beta-1a. Patients randomized to alemtuzumab received 12 mg/day of the treatment on five consecutive days at month 0, and on three consecutive days at month 12. Participants randomized to interferon received 44 mg three times weekly. The study lasted for two years.
Blinded raters performed Expanded Disability Status Scale (EDSS) assessments at baseline, every three months, and when relapse was suspected. They administered the MS Functional Composite (MSFC) three times before baseline to attenuate practice effects, and then every six months. Finally, they assessed visual function every six months with the binocular Sloan low-contrast letter acuity (SLCLA) test.
Dr. Giovannoni and colleagues assessed four tertiary end points of CARE-MS II. The first was time to CDI, which was defined as a decrease of one or more points in EDSS from baseline sustained for three or more or six or more months in patients with a baseline score of 2 or greater. The second was the proportion worsened (increase of 0.5 or more points), stable, or improved (decrease of 0.5 or more points) from baseline EDSS. The third was mean change from baseline in MSFC and MSFC plus SLCLA scores and their components. The fourth was proportions worsened (decrease of 0.5 or more standard deviations), stable, or improved (increase of 0.5 or more standard deviations) from baseline MSFC scores.
Results Consistently Favored Alemtuzumab
In all, 202 patients were randomized to interferon beta-1a, and 426 patients were randomized to alemtuzumab. Baseline demographic and clinical characteristics were similar between treatment groups. The groups had comparable percentages of patients with recent prestudy relapse.
At month 24, EDSS improvement, as well as improvement in all seven EDSS functional systems, was more common among patients receiving alemtuzumab, compared with those receiving interferon. Participants receiving alemtuzumab were more than twice as likely as those receiving interferon to have three-month CDI. Among patients with a baseline EDSS of 3 or higher, the proportion of patients with six-month CDI was also significantly greater with alemtuzumab than with interferon. Stratification of results by presence or absence of prior interferon use did not affect the results, nor did stratification by presence or absence of relapse within three months before initiating treatment.
In addition, the likelihood of six-month CDI in MSFC score from baseline to month 24 was greater for patients receiving alemtuzumab than those receiving interferon. Participants in the interferon group were significantly more likely than those in the alemtuzumab group to have 15% or greater worsening in MSFC sustained for six months. The difference between treatment groups in 20% or greater worsening in MSFC sustained for six months was not statistically significant.
At months 12 and 24, visual acuity in patients receiving alemtuzumab was stable at 2.5% contrast and at 100% contrast, but the results were not statistically significant. Participants receiving interferon had a significant decline in visual acuity from baseline to month 12 and from baseline to month 24 at 1.25% contrast and 2.5% contrast. Visual acuity declined significantly from baseline to month 24 in the interferon group at 100% contrast. Differences between treatment groups were significant at 2.5% contrast at months 12 and 24, and at 1.25% contrast at month 12.
Structural or Functional Repair?
“Giovannoni et al demonstrated that comparing two drugs for their efficacy on disability progression omits a crucial aspect of the MS disease process: sustained reduction in disability,” said Bibiana Bielekova, MD, investigator at the National Institute of Neurological Disorders and Stroke in Bethesda, Maryland, and Mar Tintoré, MD, PhD, neurologist at the MS Centre of Catalonia in Barcelona, in an accompanying editorial. “Comparing both sides of the disability changes [ie, disability progression and disability reduction] between the two drugs doubles the amount of clinically useful information.”
The CARE-MS II design, however, may artificially overestimate the benefit of alemtuzumab over interferon, they added. More than 50% of enrolled patients were previously treated with interferon beta-1a, and the inclusion criteria required the presence of relapses while on this therapy. These factors “technically excluded patients who had optimal therapeutic response to interferon beta-1a,” said Drs. Bielekova and Tintoré. “Nevertheless, a similar observation was seen in treatment-naive patients with relapsing-remitting MS in the CAMMS223 phase II trial.”
Dr. Giovannoni’s group ruled out, to an extent, the possibility that disability improvements resulted solely from the reversal of exacerbation-related disability. Similarly, the observed sustained reduction in disability likely did not simply reflect measurement variance, because the results on various outcomes consistently favored alemtuzumab. “One can only speculate whether the sustained reduction in disability is due to structural repair (ie, remyelination) or functional repair (ie, plasticity, such as formation of new synapses). We favor the latter idea, based on the early experience with CD52-depleting antibody,” said Drs. Bielekova and Tintoré.
“Despite unarguable progress in MS therapeutics, there is still a long road ahead until we can eliminate disease progression for all patients,” they concluded.
—Erik Greb
Suggested Reading
Giovannoni G, Cohen JA, Coles AJ, et al. Alemtuzumab improves preexisting disability in active relapsing-remitting MS patients. Neurology. 2016 Oct 12 [Epub ahead of print].
Bielekova B, Tintore M. Sustained reduction of MS disability: New player in comparing disease-modifying treatments. Neurology. 2016 Oct 12 [Epub ahead of print].
Nonsteroidal Anti-inflammatory Drugs and Cardiovascular Risk: Where Are We Today?
- Historical Overview
- Mechanistic Basis for a Cardiovascular Hazard
- Evidence from Meta-Analyses
- Cardiovascular Risk
- Implications for Patient Management
Faculty/Faculty Disclosure:
Gary Rouff, MD
Clinical Professor of Family Medicine,
Department of Family Practice,
Michigan State University
College of Medicine, Director of Clinical
Research, Westside Family Medical Center
Kalamazoo, MI
Dr. Rouff discloses that he has no real or apparent conflict of interest to report
Using CHIMPS for type A dissection in a high-risk patient
Traditional open repair for type A aortic dissection in patients with Marfan syndrome and a previous cardiovascular surgery carries a high risk of morbidity and mortality, but a team of surgeons from China have reported on a hybrid technique that combines open and endovascular approaches to repair type A dissection in a patient with Marfan syndrome.
In the October issue of the Journal of Thoracic and Cardiovascular Surgery (2016;152:1191-3), Hong-wei Zhang, MD, and colleagues from West China Hospital of Sichuan University, explained their technique using chimney and sandwich grafts to repair a type A dissection in the patient late after Bentall surgery. “With great advancements in recent thoracic endovascular aortic repair technology, innovative hybrid operations combining open and endovascular techniques hold promising potential to expand treatment options,” Dr. Zhang and coauthors said.
They reported on a 33-year-old male with Marfan syndrome (MFS) who had elective aortic root and mechanical valve replacement 10 years earlier. Three days of persistent chest and back pain caused the patient to go to the emergency department, where computed tomography angiography (CTA) confirmed a type A aortic dissection from the distal ascending aorta to the iliac arteries and involving the proximal innominate artery and left common carotid artery (LCCA).
Because the patient refused another open surgery, Dr. Zhang and colleagues executed their hybrid approach, the first step of which was to create an LCCA-left axillar artery bypass with a 6-mm Gore-Tex graft (W.L. Gore & Associates). After they led the graft through the costoclavicular passage, they introduced the first (distal) thoracic stent (Valiant Captivia, Medtronic) from the right femoral artery and deployed it at the proximal descending aorta. They then inserted the second (proximal) thoracic stent graft into the previous ascending synthetic graft.
Next, they delivered the chimney grafts, two Fluency Plus covered stents (Bard Peripheral Vascular), from the right brachial and innominate artery into the ascending graft. Then they delivered two more Fluency grafts from the LCCA into the endolumen of the first (distal) thoracic stent graft.
After they deployed the second (proximal) thoracic stent graft, they deployed the precisely positioned stent grafts from the innominate artery and the LCCA, sandwiching the covered stents for the LCCA between the two thoracic stent grafts. They then occluded the left subclavian artery with a 10-mm double-disk vascular occlude.
Upon angiography at completion, Dr. Zhang and coauthors found an endoleak from the overlap zones between the two thoracic stent grafts.
However, the patient’s postoperative course was uneventful, and CTA 5 days after surgery showed complete sealing of the primary entry tear with patent chimney and sandwich grafts. The patient remained symptom-free at 30 days, when CTA again confirmed patency of the supra-arch grafts.
Dr. Zhang and coauthors acknowledge that carotid-to-carotid bypass could have been an alternative in order to use fewer stent grafts and to reduce the risk of endoleaks in this case, but they opted for this approach because of the dissection of the proximal innominate artery and LCCA and their concern of the long-term patency of a carotid-to-carotid bypass. “To our knowledge, this is the first reported case of a hybrid treatment for new-onset, type A aortic dissection in patients with MFS with a previous Bentall procedure,” Dr. Zhang and coauthors said. “Although further staged repairs are required in our case, this endovascular technique could be an effective and life-saving treatment option for the high-risk repeated surgical patients with MFS.”
Dr. Zhang and coauthors had no financial relationships to disclose.
In their invited commentary, Lars Svensson, MD, PhD, Matthew Eagleton, MD, and Eric Roselli, MD, of the Cleveland Clinic, said the approach Dr. Zhang and colleagues reported on is one of the “novel” endovascular CHIMPS methods for aortic arch repair – CHIMPS meaning chimneys, periscopes, snorkels, and sandwiches (J Thorac Cardiovasc Surg. 2016;152:958-9). But they noted that one of the ongoing challenges with these types of parallel grafts is the gutter leaks that occur between the sandwich grafts.
The commentators noted that CHIMPS procedures are easier alternatives to using spiral branch graft stents for the thoracoabdominal aorta or direct-connecting branch stems from an aortic stent in the arch, but they added, “An important caveat is that the blood supply maintenance and long-term durability may not be adequate.”
The patient Dr. Zhang and colleagues reported on “is young and will need a durable operation,” Dr. Svensson, Dr. Eagleton, and Dr. Roselli said. “Unfortunately, in our experience over time we have observed that these CHIMPS procedures tend to break down and leak into the arch, including the arch actually rupturing,” they said. These patients will need “intensive” monitoring. What’s more, patients with Marfan syndrome are prone to aneurysm formation “and are not good candidates for stenting,” the commentators said.
“Nevertheless, further engineering iterations of CHIMPS may address the problem with gutter leaks and become an alternative to the elephant trunk procedure for those patients who are at particularly high risk,” the commentators said.
Dr. Svensson disclosed he holds a patent with potential royalties for an aortic valve and aortic root stent graft with connecting branch grafts to the coronary ostia. Dr. Roselli is a consultant and investigator for Bolton, Gore, and Medtronic. Dr. Eagleton has no relationships to disclose.
Traditional open repair for type A aortic dissection in patients with Marfan syndrome and a previous cardiovascular surgery carries a high risk of morbidity and mortality, but a team of surgeons from China have reported on a hybrid technique that combines open and endovascular approaches to repair type A dissection in a patient with Marfan syndrome.
In the October issue of the Journal of Thoracic and Cardiovascular Surgery (2016;152:1191-3), Hong-wei Zhang, MD, and colleagues from West China Hospital of Sichuan University, explained their technique using chimney and sandwich grafts to repair a type A dissection in the patient late after Bentall surgery. “With great advancements in recent thoracic endovascular aortic repair technology, innovative hybrid operations combining open and endovascular techniques hold promising potential to expand treatment options,” Dr. Zhang and coauthors said.
They reported on a 33-year-old male with Marfan syndrome (MFS) who had elective aortic root and mechanical valve replacement 10 years earlier. Three days of persistent chest and back pain caused the patient to go to the emergency department, where computed tomography angiography (CTA) confirmed a type A aortic dissection from the distal ascending aorta to the iliac arteries and involving the proximal innominate artery and left common carotid artery (LCCA).
Because the patient refused another open surgery, Dr. Zhang and colleagues executed their hybrid approach, the first step of which was to create an LCCA-left axillar artery bypass with a 6-mm Gore-Tex graft (W.L. Gore & Associates). After they led the graft through the costoclavicular passage, they introduced the first (distal) thoracic stent (Valiant Captivia, Medtronic) from the right femoral artery and deployed it at the proximal descending aorta. They then inserted the second (proximal) thoracic stent graft into the previous ascending synthetic graft.
Next, they delivered the chimney grafts, two Fluency Plus covered stents (Bard Peripheral Vascular), from the right brachial and innominate artery into the ascending graft. Then they delivered two more Fluency grafts from the LCCA into the endolumen of the first (distal) thoracic stent graft.
After they deployed the second (proximal) thoracic stent graft, they deployed the precisely positioned stent grafts from the innominate artery and the LCCA, sandwiching the covered stents for the LCCA between the two thoracic stent grafts. They then occluded the left subclavian artery with a 10-mm double-disk vascular occlude.
Upon angiography at completion, Dr. Zhang and coauthors found an endoleak from the overlap zones between the two thoracic stent grafts.
However, the patient’s postoperative course was uneventful, and CTA 5 days after surgery showed complete sealing of the primary entry tear with patent chimney and sandwich grafts. The patient remained symptom-free at 30 days, when CTA again confirmed patency of the supra-arch grafts.
Dr. Zhang and coauthors acknowledge that carotid-to-carotid bypass could have been an alternative in order to use fewer stent grafts and to reduce the risk of endoleaks in this case, but they opted for this approach because of the dissection of the proximal innominate artery and LCCA and their concern of the long-term patency of a carotid-to-carotid bypass. “To our knowledge, this is the first reported case of a hybrid treatment for new-onset, type A aortic dissection in patients with MFS with a previous Bentall procedure,” Dr. Zhang and coauthors said. “Although further staged repairs are required in our case, this endovascular technique could be an effective and life-saving treatment option for the high-risk repeated surgical patients with MFS.”
Dr. Zhang and coauthors had no financial relationships to disclose.
FROM THE JOURNAL OF THORACIC AND CARDIOVASCULAR SURGERY
Key clinical point: Chimney and sandwich grafts facilitate hybrid repair of type A aortic dissection for a Marfan syndrome patient after Bentall surgery.
Major finding: A 33-year-old male with Marfan syndrome and a history of cardiac surgery was asymptomatic 30 days after hybrid repair for type A aortic dissection.
Data source: Case report of single patient at an academic medical center.
Disclosures: Dr. Zhang and coauthors reported having no financial disclosures.
Newborns with CHD have reduced cerebral oxygen delivery
Using a newer form of MRI to investigate oxygen levels in newborns with congenital heart disease, researchers in Canada reported that these patients may have impaired brain growth and development in the first weeks of life because of significantly lower cerebral oxygen delivery levels.
These findings suggest that oxygen delivery may impact brain growth, particularly in newborns with single-ventricle physiology, reported Jessie Mei Lim, BSc, of the University of Toronto, and her colleagues from McGill University, Montreal, and the Hospital for Sick Children, Toronto. The findings were published in the October issue of the Journal of Thoracic and Cardiovascular Surgery (2016;152:1095-103). Ms. Lim and her colleagues used cine phase-contrast (PC) MRI to measure cerebral blood flow in newborns with congenital heard disease (CHD). Previous studies used optical measures of tissue oxygenation and MRI arterial spin labeling to suggests that newborns with severe CHD have impaired CBF and cerebral oxygen delivery (CDO2) and CBF.
This single-center study involved 63 newborns from June 2013 to April 2015 at the Hospital for Sick Children. These subjects received an MRI of the head before surgery at an average of age 7.5 days. The scans were done without sedation or contrast while the infants were asleep. The study compared 31 age-matched controls with 32 subjects with various forms of CHD – 12 were managed surgically along a single-ventricle pathway (SVP), 4 had coarctation of the aorta, 13 had transposition of the great arteries (TGA), and 3 had other forms of CHD.
The researchers validated their method by reporting similarities between flows in the basilar and vertebral arteries in 14 controls, “suggesting good consistency and accuracy of our method for measuring CBF,” Ms. Lim and her coauthors noted. A comparison of CBF measured with an unpaired Student t test revealed no significant differences between the CHD group and controls. The average net CBF in CHD patients was 103.5 mL/min vs. 119.7 mL/min in controls.
However, when evaluating CDO2 using a Student t test, the researchers found significantly lower levels in the CHD group – an average of 1,1881 mLO2/min. vs. 2,712 mL O2/min in controls (P less than .0001). And when the researchers indexed CDO2 to brain volume yielding indexed oxygen delivery, the difference between the two groups was still significant: an average of 523.1 mL O2/min-1 .100 g-1 in the CHD group and 685.6 mL O2/min-1.100 g-1 in controls (P = .0006).
Among the CHD group, those with SVP and TGA had significantly lower CDO2 than that of controls. Brain volumes were also lower in those with CHD (mean of 338.5 mL vs. 377.7 mL in controls, P = .002).
The MRI findings were telling in the study population, Ms. Lim and her coauthors said. Five subjects in the CHD group had a combination of diffuse excessive high-signal intensity (DEHSI) and white-matter injury (WMI), 10 had an isolated finding of DEHSI, two had WMI alone and five others had other minor brain abnormalities. But the control group had no abnormal findings on conventional brain MRI.
The researchers acknowledged that, while the impact of reduced cerebral oxygen delivery is unknown, “theoretical reasons for thinking it might adversely impact ongoing brain growth and development during this period of rapid brain growth are considered.”
Cardiovascular surgeons should consider these findings when deciding on when to operate on newborns with CHD, the researchers said. “Further support for the concept that such a mechanism could lead to irreversible deficits in brain growth and development might result in attempts to expedite surgical repair of congenital cardiac lesions, which have conventionally not been addressed in the neonatal period,” they wrote.
Ms. Lim and her coauthors had no financial relationships to disclose.
Congenital heart disease (CHD) is heterogeneous and different types of lesions may cause different hemodynamics, Caitlin K. Rollins, MD, of Boston Children’s Hospital and Harvard Medical School said in her invited commentary (J Thorac Cardiovasc Surg. 2016;152-960-1).
Ms. Lim and her colleagues in this study confirmed that premise with their finding that newborns with CHD and controls had similar cerebral blood flow, but that those with CHD had reduced oxygen delivery. “These differences were most apparent in the neonates with single-ventricle physiology and transposition of the great arteries,” Dr. Rollins said. The study authors’ finding of an association between reduced oxygen delivery and impaired brain development, along with this group’s previous reports (Circulation 2015;131:1313-23) suggesting preserved cerebral blood flow in the late prenatal period, differ from other studies using traditional methods to show reduced cerebral blood flow in obstructive left-sided lesions, Dr. Rollins said. “Although technical differences may in part account for the discrepancy, the contrasting results also reflect that the relative contributions of abnormal cerebral blood flow and oxygenation differ among forms of CHD,” Dr. Rollins said.
Using a newer form of MRI to investigate oxygen levels in newborns with congenital heart disease, researchers in Canada reported that these patients may have impaired brain growth and development in the first weeks of life because of significantly lower cerebral oxygen delivery levels.
These findings suggest that oxygen delivery may impact brain growth, particularly in newborns with single-ventricle physiology, reported Jessie Mei Lim, BSc, of the University of Toronto, and her colleagues from McGill University, Montreal, and the Hospital for Sick Children, Toronto. The findings were published in the October issue of the Journal of Thoracic and Cardiovascular Surgery (2016;152:1095-103). Ms. Lim and her colleagues used cine phase-contrast (PC) MRI to measure cerebral blood flow in newborns with congenital heard disease (CHD). Previous studies used optical measures of tissue oxygenation and MRI arterial spin labeling to suggests that newborns with severe CHD have impaired CBF and cerebral oxygen delivery (CDO2) and CBF.
This single-center study involved 63 newborns from June 2013 to April 2015 at the Hospital for Sick Children. These subjects received an MRI of the head before surgery at an average of age 7.5 days. The scans were done without sedation or contrast while the infants were asleep. The study compared 31 age-matched controls with 32 subjects with various forms of CHD – 12 were managed surgically along a single-ventricle pathway (SVP), 4 had coarctation of the aorta, 13 had transposition of the great arteries (TGA), and 3 had other forms of CHD.
The researchers validated their method by reporting similarities between flows in the basilar and vertebral arteries in 14 controls, “suggesting good consistency and accuracy of our method for measuring CBF,” Ms. Lim and her coauthors noted. A comparison of CBF measured with an unpaired Student t test revealed no significant differences between the CHD group and controls. The average net CBF in CHD patients was 103.5 mL/min vs. 119.7 mL/min in controls.
However, when evaluating CDO2 using a Student t test, the researchers found significantly lower levels in the CHD group – an average of 1,1881 mLO2/min. vs. 2,712 mL O2/min in controls (P less than .0001). And when the researchers indexed CDO2 to brain volume yielding indexed oxygen delivery, the difference between the two groups was still significant: an average of 523.1 mL O2/min-1 .100 g-1 in the CHD group and 685.6 mL O2/min-1.100 g-1 in controls (P = .0006).
Among the CHD group, those with SVP and TGA had significantly lower CDO2 than that of controls. Brain volumes were also lower in those with CHD (mean of 338.5 mL vs. 377.7 mL in controls, P = .002).
The MRI findings were telling in the study population, Ms. Lim and her coauthors said. Five subjects in the CHD group had a combination of diffuse excessive high-signal intensity (DEHSI) and white-matter injury (WMI), 10 had an isolated finding of DEHSI, two had WMI alone and five others had other minor brain abnormalities. But the control group had no abnormal findings on conventional brain MRI.
The researchers acknowledged that, while the impact of reduced cerebral oxygen delivery is unknown, “theoretical reasons for thinking it might adversely impact ongoing brain growth and development during this period of rapid brain growth are considered.”
Cardiovascular surgeons should consider these findings when deciding on when to operate on newborns with CHD, the researchers said. “Further support for the concept that such a mechanism could lead to irreversible deficits in brain growth and development might result in attempts to expedite surgical repair of congenital cardiac lesions, which have conventionally not been addressed in the neonatal period,” they wrote.
Ms. Lim and her coauthors had no financial relationships to disclose.
FROM THE JOURNAL OF THORACIC AND CARDIOVASCULAR SURGERY
Key clinical point: Cerebral blood flow is maintained but cerebral oxygen delivery is decreased in preoperative newborns with cyanotic congenital heart disease (CHD).
Major finding: Average cerebral oxygen delivery measured 1,1881 mLO2/min in the CHD group when measured with Student t testing vs. 2,712 mLO2/min in controls (P less than .0001).
Data source: Single-center study of 32 neonates with various forms of CHD 31 age-matched controls.
Disclosures: Ms. Lim and coauthors have no financial relationships to disclose.