User login
Yeast Infection in Pregnancy? Think Twice About Fluconazole
A 25-year-old woman who is 16 weeks pregnant with her first child is experiencing increased vaginal discharge associated with vaginal itching. A microscopic examination of the discharge confirms your suspicions of vaginal candidiasis. Is oral fluconazole or a topical azole your treatment of choice?
Because of the increased production of sex hormones, vaginal candidiasis is common during pregnancy, affecting up to 10% of pregnant women in the United States.1,2 Treatment options include oral fluconazole and a variety of topical azoles. Although the latter are recommended as firstline therapy, the ease of oral therapy makes it an attractive option.3,4
However, the safety of oral fluconazole during pregnancy has recently come under scrutiny. Case reports have linked high-dose use with congenital malformation.5,6 These case reports led to epidemiologic studies in which no such association was found.7,8
A large cohort study involving 1,079 fluconazole-exposed pregnancies and 170,453 unexposed pregnancies found no increased risk for congenital malformation or stillbirth; rates of spontaneous abortion and miscarriage were not evaluated.9 A prospective cohort study of 226 pregnant women found no association between fluconazole use during the first trimester and miscarriage.10 However, the validity of both studies’ findings was limited by small numbers of participants.
The current study is the largest to date to evaluate whether use of fluconazole in early pregnancy is associated with increased rates of spontaneous abortion and stillbirth, compared to topical azoles.
STUDY SUMMARY
Increased risk for miscarriage, but not stillbirth
This nationwide cohort study, conducted using the Medical Birth Register in Denmark, evaluated more than 1.4 million pregnancies occurring from 1997 to 2013 for exposure to oral fluconazole between 7 and 22 weeks’ gestation. Each oral fluconazole–exposed pregnancy was matched with up to four unexposed pregnancies (based on propensity score, maternal age, calendar year, and gestational age) and to pregnancies exposed to intravaginal formulations of topical azoles. Exposure to fluconazole was documented by filled prescriptions from the National Prescription Register. Primary outcomes were rates of spontaneous abortion (loss before 22 weeks) and stillbirth (loss after 23 weeks).
Rates of spontaneous abortion. Of the total cohort, 3,315 pregnancies were exposed to oral fluconazole between 7 and 22 weeks’ gestation. Spontaneous abortion occurred in 147 of these pregnancies and in 563 of 13,246 unexposed, matched pregnancies (hazard ratio [HR], 1.48).
Rates of stillbirth. Of 5,382 pregnancies exposed to fluconazole from week 7 to birth, 21 resulted in stillbirth; 77 stillbirths occurred in the 21,506 unexposed matched pregnancies (HR, 1.32). In a sensitivity analysis, however, higher doses of fluconazole (350 mg) were four times more likely than lower doses (150 mg) to be associated with stillbirth (HRs, 4.10 and 0.99, respectively).
Oral fluconazole vs topical azole. Use of oral fluconazole in pregnancy was associated with an increased risk for spontaneous abortion, compared to topical azole use (130 of 2,823 pregnancies vs 118 of 2,823 pregnancies; HR, 1.62)—but not an increased risk for stillbirth (20 of 4,301 pregnancies vs 22 of 4,301 pregnancies; HR, 1.18).
WHAT'S NEW
A sizeable study with a treatment comparison
The authors found that exposure in early pregnancy to oral fluconazole, as compared to topical azoles, increases the risk for spontaneous abortion. By comparing treatments in a sensitivity analysis, the researchers were able to eliminate Candida infections causing spontaneous abortion as a confounding factor. In addition, this study challenges the balance between ease of use and safety.
CAVEATS
A skewed population?
This cohort study using a Danish hospital registry may not be generalizable to a larger, non-Scandinavian population. Those not seeking care through a hospital were likely missed; if those seeking care through the hospital had a higher risk for abortion, the results could be biased. However, this would not have affected the results of the comparison between the two active treatments.
In addition, the study focused on women exposed from 7 to 22 weeks’ gestation; the findings may not be generalizable to fluconazole exposure prior to 7 weeks. Likewise, the registry is unlikely to capture very early spontaneous abortions that are not recognized clinically.
In all, given the large sample size and the care taken to match each exposed pregnancy with up to four unexposed pregnancies, these limitations likely had little influence on the overall findings.
CHALLENGES TO IMPLEMENTATION
Balancing ease of use with safety
Given the ease of using oral fluconazole, compared with daily topical azole therapy, many clinicians and patients may still opt for oral treatment.
ACKNOWLEDGEMENT
The PURLs Surveillance System was supported in part by Grant Number UL1RR024999 from the National Center For Research Resources, a Clinical Translational Science Award to the University of Chicago. The content is solely the responsibility of the authors and does not necessarily represent the official views of the National Center For Research Resources or the National Institutes of Health.
Copyright © 2016. The Family Physicians Inquiries Network. All rights reserved.
Reprinted with permission from the Family Physicians Inquiries Network and The Journal of Family Practice. 2016;65(9):624-626.
1. Mølgaard-Nielsen D, Svanström H, Melbye M, et al. Association between use of oral fluconazole during pregnancy and risk of spontaneous abortion and stillbirth. JAMA. 2016;315:58-67.
2. Cotch MF, Hillier SL, Gibbs RS, et al; Vaginal Infections and Prematurity Study Group. Epidemiology and outcomes associated with moderate to heavy Candida colonization during pregnancy. Am J Obstet Gynecol. 1998;178:374-380.
3. Workowski KA, Bolan GA, Centers for Disease Control and Prevention. Sexually transmitted diseases treatment guidelines, 2015. MMWR Recomm Rep. 2015;64:1-137.
4. Tooley PJ. Patient and doctor preferences in the treatment of vaginal candidiasis. Practitioner. 1985;229:655-660.
5. Aleck KA, Bartley DL. Multiple malformation syndrome following fluconazole use in pregnancy: report of an additional patient. Am J Med Genet. 1997;72:253-256.
6. Lee BE, Feinberg M, Abraham JJ, et al. Congenital malformations in an infant born to a woman treated with fluconazole. Pediatr Infect Dis J. 1992;11:1062-1064.
7. Jick SS. Pregnancy outcomes after maternal exposure to fluconazole. Pharmacotherapy. 1999;19:221-222.
8. Mølgaard-Nielsen D, Pasternak B, Hviid A. Use of oral fluconazole during pregnancy and the risk of birth defects. N Engl J Med. 2013;369:830-839.
9. Nørgaard M, Pedersen L, Gislum M, et al. Maternal use of fluconazole and risk of congenital malformations: a Danish population-based cohort study. J Antimicrob Chemother. 2008;62:172-176.
10. Mastroiacovo P, Mazzone T, Botto LD, et al. Prospective assessment of pregnancy outcomes after first-trimester exposure to fluconazole. Am J Obstet Gynecol. 1996;175:1645-1650.
A 25-year-old woman who is 16 weeks pregnant with her first child is experiencing increased vaginal discharge associated with vaginal itching. A microscopic examination of the discharge confirms your suspicions of vaginal candidiasis. Is oral fluconazole or a topical azole your treatment of choice?
Because of the increased production of sex hormones, vaginal candidiasis is common during pregnancy, affecting up to 10% of pregnant women in the United States.1,2 Treatment options include oral fluconazole and a variety of topical azoles. Although the latter are recommended as firstline therapy, the ease of oral therapy makes it an attractive option.3,4
However, the safety of oral fluconazole during pregnancy has recently come under scrutiny. Case reports have linked high-dose use with congenital malformation.5,6 These case reports led to epidemiologic studies in which no such association was found.7,8
A large cohort study involving 1,079 fluconazole-exposed pregnancies and 170,453 unexposed pregnancies found no increased risk for congenital malformation or stillbirth; rates of spontaneous abortion and miscarriage were not evaluated.9 A prospective cohort study of 226 pregnant women found no association between fluconazole use during the first trimester and miscarriage.10 However, the validity of both studies’ findings was limited by small numbers of participants.
The current study is the largest to date to evaluate whether use of fluconazole in early pregnancy is associated with increased rates of spontaneous abortion and stillbirth, compared to topical azoles.
STUDY SUMMARY
Increased risk for miscarriage, but not stillbirth
This nationwide cohort study, conducted using the Medical Birth Register in Denmark, evaluated more than 1.4 million pregnancies occurring from 1997 to 2013 for exposure to oral fluconazole between 7 and 22 weeks’ gestation. Each oral fluconazole–exposed pregnancy was matched with up to four unexposed pregnancies (based on propensity score, maternal age, calendar year, and gestational age) and to pregnancies exposed to intravaginal formulations of topical azoles. Exposure to fluconazole was documented by filled prescriptions from the National Prescription Register. Primary outcomes were rates of spontaneous abortion (loss before 22 weeks) and stillbirth (loss after 23 weeks).
Rates of spontaneous abortion. Of the total cohort, 3,315 pregnancies were exposed to oral fluconazole between 7 and 22 weeks’ gestation. Spontaneous abortion occurred in 147 of these pregnancies and in 563 of 13,246 unexposed, matched pregnancies (hazard ratio [HR], 1.48).
Rates of stillbirth. Of 5,382 pregnancies exposed to fluconazole from week 7 to birth, 21 resulted in stillbirth; 77 stillbirths occurred in the 21,506 unexposed matched pregnancies (HR, 1.32). In a sensitivity analysis, however, higher doses of fluconazole (350 mg) were four times more likely than lower doses (150 mg) to be associated with stillbirth (HRs, 4.10 and 0.99, respectively).
Oral fluconazole vs topical azole. Use of oral fluconazole in pregnancy was associated with an increased risk for spontaneous abortion, compared to topical azole use (130 of 2,823 pregnancies vs 118 of 2,823 pregnancies; HR, 1.62)—but not an increased risk for stillbirth (20 of 4,301 pregnancies vs 22 of 4,301 pregnancies; HR, 1.18).
WHAT'S NEW
A sizeable study with a treatment comparison
The authors found that exposure in early pregnancy to oral fluconazole, as compared to topical azoles, increases the risk for spontaneous abortion. By comparing treatments in a sensitivity analysis, the researchers were able to eliminate Candida infections causing spontaneous abortion as a confounding factor. In addition, this study challenges the balance between ease of use and safety.
CAVEATS
A skewed population?
This cohort study using a Danish hospital registry may not be generalizable to a larger, non-Scandinavian population. Those not seeking care through a hospital were likely missed; if those seeking care through the hospital had a higher risk for abortion, the results could be biased. However, this would not have affected the results of the comparison between the two active treatments.
In addition, the study focused on women exposed from 7 to 22 weeks’ gestation; the findings may not be generalizable to fluconazole exposure prior to 7 weeks. Likewise, the registry is unlikely to capture very early spontaneous abortions that are not recognized clinically.
In all, given the large sample size and the care taken to match each exposed pregnancy with up to four unexposed pregnancies, these limitations likely had little influence on the overall findings.
CHALLENGES TO IMPLEMENTATION
Balancing ease of use with safety
Given the ease of using oral fluconazole, compared with daily topical azole therapy, many clinicians and patients may still opt for oral treatment.
ACKNOWLEDGEMENT
The PURLs Surveillance System was supported in part by Grant Number UL1RR024999 from the National Center For Research Resources, a Clinical Translational Science Award to the University of Chicago. The content is solely the responsibility of the authors and does not necessarily represent the official views of the National Center For Research Resources or the National Institutes of Health.
Copyright © 2016. The Family Physicians Inquiries Network. All rights reserved.
Reprinted with permission from the Family Physicians Inquiries Network and The Journal of Family Practice. 2016;65(9):624-626.
1. Mølgaard-Nielsen D, Svanström H, Melbye M, et al. Association between use of oral fluconazole during pregnancy and risk of spontaneous abortion and stillbirth. JAMA. 2016;315:58-67.
2. Cotch MF, Hillier SL, Gibbs RS, et al; Vaginal Infections and Prematurity Study Group. Epidemiology and outcomes associated with moderate to heavy Candida colonization during pregnancy. Am J Obstet Gynecol. 1998;178:374-380.
3. Workowski KA, Bolan GA, Centers for Disease Control and Prevention. Sexually transmitted diseases treatment guidelines, 2015. MMWR Recomm Rep. 2015;64:1-137.
4. Tooley PJ. Patient and doctor preferences in the treatment of vaginal candidiasis. Practitioner. 1985;229:655-660.
5. Aleck KA, Bartley DL. Multiple malformation syndrome following fluconazole use in pregnancy: report of an additional patient. Am J Med Genet. 1997;72:253-256.
6. Lee BE, Feinberg M, Abraham JJ, et al. Congenital malformations in an infant born to a woman treated with fluconazole. Pediatr Infect Dis J. 1992;11:1062-1064.
7. Jick SS. Pregnancy outcomes after maternal exposure to fluconazole. Pharmacotherapy. 1999;19:221-222.
8. Mølgaard-Nielsen D, Pasternak B, Hviid A. Use of oral fluconazole during pregnancy and the risk of birth defects. N Engl J Med. 2013;369:830-839.
9. Nørgaard M, Pedersen L, Gislum M, et al. Maternal use of fluconazole and risk of congenital malformations: a Danish population-based cohort study. J Antimicrob Chemother. 2008;62:172-176.
10. Mastroiacovo P, Mazzone T, Botto LD, et al. Prospective assessment of pregnancy outcomes after first-trimester exposure to fluconazole. Am J Obstet Gynecol. 1996;175:1645-1650.
Zika funding slated for prevention, vaccine development
Federal health officials are wasting no time in putting to use long-awaited congressional funding aimed at strengthening Zika prevention and advancing research efforts.
The country’s health care agencies will split the $1.1 billion in funding approved by Congress on Sept. 28, dividing the money among Zika vaccine development, mosquito control, and response to virus outbreaks in the United States and globally, Sylvia Burwell, Health and Human Services secretary, said during an Oct. 3 press conference.
“At HHS, we’ll put this funding to use quickly and wisely,” Secretary Burwell said during the press conference. “It will support essential strategies to combat this virus, like expanding mosquito surveillance and control programs. It will also help us further accelerate the development of tests to detect Zika treatment and vaccines, including beginning human testing of additional vaccine candidates. It will also fund vital research as we continue to learn about the virus and monitor the progress of babies born with Zika-related birth defects.”
Of the $1.1 billion included in the final package to fight Zika, $15 million will go to the state of Florida and $60 million to the territory of Puerto Rico to respond to Zika outbreaks in those areas.
The Centers for Disease Control and Prevention will receive $394 million, of which $44 million will go toward replenishing funds pulled from the Public Health Emergency Preparedness (PHEP) cooperative agreement to address the Zika crisis, said CDC Director Tom Frieden, MD. The CDC’s remaining $350 million will allow the agency to extend existing responses to Zika outbreaks and grow partnerships with state and local authorities.
The National Institutes of Health will use its portion of the Zika funding – $152 million – to further vaccine development and move forward clinical trials already in the works, said Anthony Fauci, MD, director of the National Institute of Allergy and Infectious Diseases. The NIH is well on its way with a phase I vaccine trial, having enrolled 80 patients thus far, Dr. Fauci said during the press call. The agency will soon have enough information to determine to move onto phase II, he said.
Meanwhile, HHS will use its portion of the funding – $245 million – to support advanced vaccine development and ensure the drug manufacturing process runs smoothly and quickly, said Nicole Lurie, MD, HHS assistant secretary for preparedness and response. Agency officials also plan to support more clinical trials that will be integrated with the ongoing NIH trials, she said.
The remaining funds from the bill will go toward global health programs, operating costs, and other expenses.
Despite the positives from the supplemental funding, Secretary Burwell noted that Congress’ delay in approving the extra money has caused irreparable harm to other health care programs and initiatives. HHS diverted funds from other departments, such as the Administration for Children and Families and the Substance Abuse and Mental Health Services Administration to address Zika outbreaks and begin research. Vaccine and diagnostic developments are also behind because of funding delays, according to officials.
“The damage that occurred because we took those funds will continue,” Secretary Burwell said. “The time and energy that was spent in seeking and working to get the funding instead of working to use the funding [was detrimental]. That money would be out the door if we were in a situation where we had received that money at the point at which we had asked for it.”
agallegos@frontlinemedcom.com
On Twitter @legal_med
Absorbable suture performs well in sacrocolpopexy with mesh
DENVER – Using absorbable polydioxanone suture during laparoscopic sacrocolpopexy was associated with a mesh erosion rate of just 1.6%, according to a single-center, 1-year prospective study of 64 patients.
That is substantially less than typical erosion rates of about 5% when permanent suture is used, Danielle Taylor, DO, of Akron (Ohio ) General Medical Center said at Pelvic Floor Disorders Week sponsored by the American Urogynecologic Society.
The researchers observed no anatomic failures or suture extrusions, and patients reported significant postoperative improvements on several validated measures of quality of life.
“Larger samples and longer follow-up may be needed,” said Dr. Taylor. “But our study suggests that permanent, nondissolving suture material may not be necessary for sacrocolpopexy.”
Sacrocolpopexy with mesh usually involves using nonabsorbable suture to attach its anterior and posterior arms to the vaginal mucosa. Instead, Dr. Taylor and colleagues used 90-day delayed absorbable 2.0 V-Loc (Covidien) suture during laparoscopic sacrocolpopexy for patients with baseline Pelvic Organ Prolapse Quantification (POP-Q) scores of at least 2 and symptomatic uterovaginal prolapse.
Two permanent Gore-Tex sutures were also placed at the apex of the cervix in each of the 64 patients, said Dr. Taylor, a urogynecology fellow at the University of Massachusetts, Worcester, who worked on the study as a resident at the Cleveland Clinic Akron General, in Ohio. She and her colleagues rechecked patients at postoperative weeks 2 and 6, and at months 6 and 12. They lost two patients to follow-up, both after week 2.
At baseline, 37 patients (58%) were in stage II pelvic organ prolapse, 27% were in stage III, and 14% were in stage IV. At 6 months after surgery, 85% had no detectable prolapse, 8% had stage I, and 6% had stage II. At 1 year, 82% remained in pelvic organ prolapse stage 0 and the rest were in stage I or II. All stage II patients remained asymptomatic, Dr. Taylor said.
At baseline, the median value for POP-Q point C was -3 (range, –8 to +6). At 6 months and 1 year later, the median value had improved to –8, and patients ranged between –10 and –8.
Quality of life surveys of 54 patients reflected these outcomes, Dr. Taylor said. A year after surgery, average scores on the Pelvic Floor Distress Index (PFDI) dropped by 67 points, from 103 to 35 (P less than .0001). Likewise, average scores on the Pelvic Floor Impact Questionnaire (PFIQ) dropped by 29 points (P less than .0001), and scores on the Pelvic Organ Prolapse/Urinary Incontinence Sexual Function Questionnaire (PISQ) indicated a significant decrease in the effects of pelvic organ prolapse on sexual functioning (P = .008).
In addition to a single case of mesh erosion, one patient developed postoperative ileus and one experienced small bowel obstruction, both of which resolved, Dr. Taylor reported. The researchers aim to continue the study with longer follow-up intervals and detailed analyses of postoperative pain.
Dr. Taylor reported no funding sources and had no disclosures. One coauthor disclosed ties to Coloplast Corp.
Key clinical point:
Major finding: When 90-day delayed absorbable polydioxanone suture was used, the mesh erosion rate was 1.6%. There were no anatomic failures or cases of suture extrusion.
Data source: A single-center prospective case series of 64 patients.
Disclosures: Dr. Taylor reported having no financial disclosures. One coauthor reported ties to Coloplast Corp.
The EHR time suck gets quantified
How many hours a day do you typically work?
I’m not just talking about seeing patients, although that’s included. I’m also thinking about all the time spent reviewing tests, filling out forms, returning calls, refilling meds, talking to your staff about what needs to be done for the patients who called with questions or problems, and (a big one) dictating and charting notes for the day.
Sadly, the issue appears to be getting worse. A recent study in Annals of Internal Medicine found that for every hour you spend seeing patients, you’re spending another 2 hours working on the computer EHR doing ancillary stuff for the visits. I’m pretty sure insurance companies aren’t paying for that time.
That’s just in the office. The same study found most of us spend another 1-2 hours of our home time each night doing more office work to finish up what we didn’t get done during the day. So much for that work-life balance we hear so much about.
Ready for the breakdown? Here it is:
• Percentage of the total office day spent with patients = 27%
• Percentage of the total office day spent on charting and other EHR-related tasks = 49%
That’s just overall. Now let’s look at the time you’re actually with the patient in an exam room:
• Face-to-face with patient = 53%
• Time on the computer = 37%
So even in a room with a patient in front of you, over one-third of the time is still spent on the computer.
The degree of drudgery is surprising, too. How many mouse clicks are needed, in one system, to order and record a flu shot? Take a guess. 5? 10? 15? How about 32. Yeah, you read that right. No wonder your index finger hurts.
But let’s go back to the main point here, that 1 hour of patient time equals 2 hours of computer time ratio. At its core, it suggests that in order to get everything done, you should only be seeing patients for 3 hours a day because you’ll need at least another 6 hours to get all the computer stuff for them done. You think you can make a living, or even pay your overhead, billing for 3 hours of patient time a day? Me neither. I need to put in at least 8 hours of patient time, which means another 16 hours or so of computer time crammed in somewhere, overflowing into evenings and weekends. There are, quite literally, not enough hours in the day to practice good medicine and still get all the ancillary work done quickly and correctly.
With this kind of formula it’s only a matter of time before people get hurt. And the bean counters who run many medical practices these days will never see that aspect of medicine. The more patients, the more revenue, in their minds.
Rather than making life easier for us, EHRs have taken things the opposite way. In a profession where face-to-face time is the most critical part of what we do and the center of the doctor-patient relationship, it’s now second to face-to-screen time. That can’t be good for those who need our help.
Dr. Block has a solo neurology practice in Scottsdale, Ariz.
Conference News Roundup—European Society of Cardiology
Low Socioeconomic Status Associated With Higher Risk of Second Heart Attack or Stroke
Low socioeconomic status is associated with a higher risk of a second heart attack or stroke, according to Joel Ohm, MD, a physician at the Karolinska University Hospital and Karolinska Institute in Stockholm. The study of nearly 30,000 patients with a prior heart attack revealed that the risk of a second event was 36% lower for those in the highest income quintile, compared with the lowest, and increased by 14% in divorced patients, compared with married patients.
"Are you rich or poor? Married or divorced? That might affect your risk of a second heart attack or stroke," said Dr. Ohm. "Advances in prevention and acute treatment have increased survival after heart attack and stroke over the past several decades. The result is that more people live with cardiovascular disease in Sweden. Almost one-fifth of the total population is in this group."
Most research on cardiovascular prevention is based on healthy people, and it is unclear whether the findings apply to patients with established disease. An association between socioeconomic status in healthy individuals and future cardiovascular disease was found in the 1950s. This study investigated the link between socioeconomic status in patients who had survived a first heart attack and the risk of a second heart attack or a stroke.
The study included 29,953 patients from the Swedish nationwide registry, Secondary Prevention after Heart Intensive Care Admission (SEPHIA), who had been discharged approximately one year previously from a cardiac intensive care unit after treatment for a first myocardial infarction. Data on outcome over time and socioeconomic status (defined as disposable income, marital status, and level of education) was obtained from Statistics Sweden and the National Board of Health and Welfare.
During an average follow-up of four years, 2,405 patients (8%) had a heart attack or stroke. After adjustments for age, gender, smoking status, and the defined measures of socioeconomic status, being divorced was independently associated with a 14% greater risk of a second event, compared with being married. There was an independent and linear relationship between disposable income and the risk of a second event, with those in the highest quintile of income having a 36% lower risk than those in the lowest quintile. A higher level of education was associated with a lower risk of events, but the association was not significant after adjustment for income.
"Our study shows that in the years following a first myocardial infarction, men and women with low socioeconomic status have a higher risk of suffering another heart attack or stroke. This is a new finding and suggests that socioeconomic status should be included in risk assessment for secondary prevention after a heart attack," said Dr Ohm. "Even though health care providers are unlikely to keep track of their patients' yearly salary, simple questions about other socioeconomic variables such as marital status and educational level could make a difference."
According to the widely used assessment tools for cardiovascular risk, survivors of heart attacks are at the highest possible risk for subsequent events, regardless of other risk factors. There is, for example, no difference in the estimated risk level between a previously healthy 40-year old female from Spain and a heavily smoking, obese, elderly man with diabetes and high blood pressure from Finland.
"Risk assessment tools are designed for individuals without previous cardiovascular disease, and the calculations may not apply to patients with established cardiovascular disease. Socioeconomic status is perhaps a better marker to assess risk of future events in heart attack patients, and more research is needed to determine other factors that could be included, such as occupation or residential area," said Dr Ohm.
Alcohol-Related Hospitalization Associated With Doubled Stroke Risk in Atrial Fibrillation
Alcohol-related hospitalization is associated with a doubled risk of ischemic stroke in patients with nonvalvular atrial fibrillation (AF), according to research presented by Faris Al-Khalili, MD, PhD, a cardiologist at the Karolinska Institute Danderyd Hospital in Stockholm. The observational study was conducted in more than 25,000 patients with nonvalvular AF at low risk of stroke.
"AF is the most common heart rhythm disturbance and is associated with a fivefold ncreased risk of ischemic stroke," said Dr. Al-Khalili. "AF is also associated with increased mortality, reduced quality of life, and a higher risk of heart failure."
Treatment with oral anticoagulants reduces the risk of stroke and is recommended according to the patient's number of stroke risk factors. Risk is estimated using the CHA2DS2-VASc score, which gives points for clinical risk factors. Patients with nonvalvular AF under age 65 who have a score of zero (in men) or one (in women) are considered to be at low risk for ischemic stroke, and oral anticoagulation therapy is not indicated for them.
"Even if the risk for stroke is low, it is not negligible, and a number of such low-risk patients do present with ischemic stroke in clinical practice and in patient registers," said Dr. Al-Khalili.
The objective of this study was to assess the incidence and predictors of ischemic stroke among low-risk patients with nonvalvular AF. This retrospective study included 25,252 patients (ages 18 to 64) of a total of 34,523 patients with AF identified from the Swedish nationwide patient register for the period between January 1, 2006 and December 31, 2012. The median age was 55, and 72% of participants were men.
Information was available regarding all hospitalizations and visits to hospital-affiliated open clinics in Sweden. Socioeconomic variables were obtained from a database for health insurance and labor market studies. Information about current medication was obtained from the National Drug Register, which has information about all dispensed prescription in Sweden and is 100% complete.
During a median follow-up of five years, ischemic stroke occurred at an annual rate of 3.4 per 1,000 patient-years. The overall mortality was 7.5 per 1,000 patient-years in patients without ischemic stroke and 29.6 per 1,000 patient-years in patients who had had an ischemic stroke during follow-up.
In the multivariable analysis, the only variables that remained significantly associated with an increased risk of ischemic stroke were age (hazard ratio [HR], 1.06) and alcohol-related hospitalization (HR, 2.01). Use of oral anticoagulants was associated with a lower risk of ischemic stroke (HR, 0.78).
"Even though these patients are classified as low-risk, the incidence of ischemic stroke in our study population is neither negligible nor ignorable, and it carries a relatively high mortality," said Dr. Al-Khalili.
"Previous studies have shown a causal and dose-response relation between alcohol and AF. Our study found that alcohol is an independent risk factor for stroke in patients with AF. Alcohol might induce AF, leading to embolic stroke, or there could be a specific alcohol effect that causes systemic or cerebral thromboembolism. Using alcohol-related hospitalization as a proxy for alcohol abuse likely underestimates the extent of the problem and does not allow grading of the amount of alcohol consumed.
"Doctors should ask their AF patients about alcohol use and advise patients to cut down if they are drinking more than is recommended. The beneficial link between oral anticoagulant use and ischemic stroke in this low-risk population without a recognized indication for these drugs needs further investigation, including the benefit to harm (bleeding) ratio," Dr. Al-Khalili concluded.
New Oral Anticoagulants Provide Same Stroke Prevention as Warfarin But Cause Less Bleeding
The new oral anticoagulants provide the same stroke prevention as warfarin, but cause less intracranial bleeding, according to research presented by Laila Staerk, PhD, a research fellow at Herlev and Gentofte University Hospital in Hellerup, Denmark.
"Atrial fibrillation is the most common cardiac rhythm disorder and currently affects more than 10 million Europeans," said Dr. Staerk. "Atrial fibrillation is associated with a fivefold risk of stroke, potentially leading to disability and death. In the next four decades, the number of patients with atrial fibrillation is expected to triple, so the number of Europeans diagnosed could rise to a staggering 25 to 30 million."
Patients with atrial fibrillation are treated life-long with oral anticoagulation to reduce their risk of stroke. But treatment with non-vitamin K antagonist oral anticoagulants (NOACs) and vitamin K antagonists (eg, warfarin) lowers the risk of stroke at the cost of increased bleeding risk.
Several treatment options are available, and physicians may be unsure about which one to use. "There has been a need to investigate the safety and effectiveness of NOACs versus warfarin in a real-world population, and our Danish registries provide this opportunity," said Dr. Staerk.
The current study compared the risk of stroke and intracranial bleeding associated with NOACs (ie, dabigatran, rivaroxaban, and apixaban) versus that associated with warfarin in a real-world setting. The study was conducted at the Cardiovascular Research Centre at Herlev and Gentofte University Hospital. It included 43,299 patients with atrial fibrillation who were recruited from Danish nationwide administrative registries.
Approximately 42% of patients were taking warfarin, while 29%, 16%, and 13% were taking dabigatran, apixaban, and rivaroxaban, respectively. During follow-up, stroke occurred in 1,054 patients, and there were 261 intracranial bleedings.
The risk of having a stroke within one year was similar between the NOAC and warfarin groups and ranged from 2.0% to 2.5%. At one year, the risk of intracranial bleeding was significantly lower in patients treated with dabigatran and apixaban (0.3% to 0.4%), compared with that in those treated with warfarin (0.6%).
"The inclusion and exclusion criteria in our study were broadly similar for patients initiating NOACs or warfarin, and this gave a straightforward opportunity to directly compare the treatment regimens, which is in contrast to the randomized trials. The results suggest that although they have similar effects in preventing stroke, dabigatran and apixaban were associated with a safer use regarding the absolute one-year risk of intracranial bleeding," said Dr Staerk. "Our results complement the large randomized phase III trials by providing real-world data on stroke and intracranial bleeding with NOACs versus warfarin, since fragile patients were not excluded from our nationwide cohort. For example, patients with increased risk of bleeding, liver disease, and chronic kidney disease are less represented in trials."
"Registry studies have some limitations such as the observational design, residual confounding, and confounding by drug indication. In the future, it would be exciting to see a head-to-head randomized trial performed to compare the different NOAC treatments in patients with atrial fibrillation," said Dr Staerk.
Moderate Physical Activity Reduces Risk of Cardiovascular Death
Moderate physical activity is associated with a greater than 50% reduction in cardiovascular death in people older than 65, according to Riitta Antikainen, MD, Professor of Geriatrics at the University of Oulu in Finland. "These results prompt us to investigate the mechanisms through which the Mediterranean diet may protect against death," she said.
The 12-year study in nearly 2,500 adults between ages 65 and 74 found that moderate physical activity reduced the risk of an acute cardiovascular event by more than 30%. High levels of physical activity led to greater risk reductions.
"The role of physical activity in preventing cardiovascular disease [CVD] in people of working age is well established," said Dr. Antikainen. "But relatively little is known about the effect of regular physical activity on CVD risk in older people."
The present study assessed the association between leisure time physical activity and CVD risk and mortality in 2,456 men and women who were enrolled into the National FINRISK Study between 1997 and 2007.
Baseline data collection included self-administered questionnaires on physical activity and other health related behavior, clinical measurements (eg, blood pressure, weight, and height), and laboratory measurements, including serum cholesterol. Participants were followed up until the end of 2013. Deaths were recorded from the National Causes of Death Register, and incident CVD events (ie, coronary heart disease and stroke) were collected from the National Hospital Discharge register.
The researchers classified self-reported physical activity as low, moderate, or high. Low physical activity included reading, watching TV, and working in the household without much physical activity. Moderate physical activity encompassed walking, cycling, or practicing other forms of light exercise (eg, fishing, gardening, hunting) for at least four hours per week. High physical activity included recreational sports (eg, running, jogging, skiing, gymnastics, swimming, or ball games) or intense training or sports competitions for at least three hours per week.
During a median follow-up of 11.8 years, 197 participants died from CVD, and 416 had a first CVD event.
When the researchers assessed the link between physical activity and outcome, they adjusted for other cardiovascular risk factors (ie, blood pressure, smoking, and cholesterol) and social factors (ie, marital status and education). To minimize reverse causality, where worse health leads to less physical activity, patients with coronary heart disease, heart failure, cancer, or prior stroke at baseline were excluded from the analysis.
The investigators found that moderate and high leisure-time physical activity were associated with a 31% and 45% reduced risk of an acute CVD event, respectively. Moderate and high leisure-time physical activity were associated with a 54% and 66% reduction in CVD mortality, respectively.
"Our study provides further evidence that older adults who are physically active have a lower risk of coronary heart disease, stroke, and death from cardiovascular disease. The protective effect of leisure time physical activity is dose dependent. In other words, the more you do, the better. Activity is protective even if you have other risk factors for cardiovascular disease such as high cholesterol," said Dr. Antikainen.
"Physical exercise may become more challenging with aging. However, it is important for older people to still get enough safe physical activity to stay healthy after their transition to retirement."
NIH workshop yields youth suicide prevention road map
The National Institutes of Health has released a 10-year road map for optimizing youth suicide prevention efforts.
The abridged version of the final report from a March 2016 NIH Pathways to Prevention Workshop entitled “Advancing Research to Prevent Youth Suicide,” highlights strategies for guiding the next decade of research on youth suicide prevention, Todd D. Little, PhD, from Texas Tech University, Lubbock, and his colleagues reported online Oct. 3.
The article outlines 29 recommendations aimed at improving data systems, enhancing data collection and analysis, and strengthening the research and practice community, and calls on researchers and practitioners to “unite to stop youth suicide in order to circumvent its associated economic cost and devastating pain and suffering” (Ann Intern Med. 2016 Oct 4. doi: 10.7326/M16-1568).
“Adherence to the recommendations summarized herein provides us with a road map to our ultimate goal – eliminating suicide,” the authors concluded.
In an accompanying evidence review, Holly C. Wilcox, PhD, and her colleagues from Johns Hopkins University, Baltimore, identified studies and potentially linkable external data systems with suicide outcomes and concluded that community data systems should be linked to suicide prevention data for the purpose of evaluating and enhancing prevention efforts.
“By integrating data from health care delivery systems, health insurance systems, and other populationwide data sources ... a national health research data infrastructure could be developed,” they wrote, adding that such a “national resource” could facilitate linkage with suicide prevention data (Ann Intern Med. 2016 Oct 4. doi: 10.7326/M16-1281).
During a press telebriefing on the panel’s findings, Dr. Little, who served as panel and workshop chair, stressed that suicide is the second-leading cause of death among youth aged 10 to 24 years, and in young adults aged 25 to 34 years.
“Although these numbers are disheartening, we feel that suicide prevention is possible. New research strategies that embrace the complex factors involved in suicide can be coordinated and are necessary,” he said, adding that “the complexity of suicide prevention must be embraced in order to forge new research strategies,” and that researchers and practitioners must work together and with the larger “policy, practice, and research communities” to promote data sharing and stop youth suicide.
Dr. Little also noted the importance of destigmatizing suicide attempts and suicidal behavior to remove one of the roadblocks to reporting, which in turn will increase the available data for linkage.
The linkage of data from various sources, such as emergency departments, electronic health records, Medicaid, and Medicare, is particularly important for informing future prevention efforts, said panelist Leslie-Ann Byam, project director for the Families First Project at Evidence-Based Associates in Washington.
Continuing to work in the field and to work with young people without having information that encompasses that kind of data leaves practitioners at a disadvantage in terms of planning, she said.
Panelist Kathleen M. Roche, PhD, of George Washington University in Washington, stressed the importance of obtaining data on subpopulations of youth at very elevated risk of suicide, including transgender youth, Latinas, and Native Americans.
The NIH workshop was cosponsored by the NIH Office of Disease Prevention, the National Institute of Mental Health, the National Institute on Drug Abuse, and the National Center for Complementary and Integrative Health. Individual authors were supported by grants from the National Science Foundation; the NIH; the Penn State Quantitative Social Sciences Initiative; the Institute for Measurement, Methodology, Analysis, and Policy at Texas Tech University; and the National Center for Advancing Translational Sciences. Dr. Little reported receiving fees from Yhat Enterprises outside the submitted work. The evidence review was funded by the Agency for Healthcare Research and Quality. The review authors reported having no disclosures.
Influenza vaccine highly beneficial for people with type 2 diabetes
Individuals with type 2 diabetes should receive the seasonal influenza vaccines annually, as doing so significantly mitigates their chances of being hospitalized for – or dying from – cardiovascular complications such as stroke, heart failure, and myocardial infarction.
“Studies assessing influenza vaccine effectiveness in people with diabetes are scarce and have shown inconclusive results,” wrote Eszter P. Vamos, MD, PhD, of Imperial College London and her coauthors in a study published in the Canadian Medical Association Journal. “None of the previous studies adjusted for residual confounding, and most of them reported composite endpoints such as admission to hospital for any cause.”
Each year included was divided into four seasons: preinfluenza season (Sept. 1 through the date of influenza season starting); influenza season (date of season onset as defined by national surveillance data through 4 weeks after the determined date of season ending); postinfluenza season (from the end of influenza season through April 30); and summer season (May 1 through Aug. 31). The primary outcomes were defined as hospital admissions for acute myocardial infarction, stroke, heart failure, pneumonia or influenza, and all-cause death, comparing between those who received their seasonal influenza vaccines and those who did not.
Following adjustment to account for any possible residual confounding, individuals who received their influenza vaccines were found to have a 19% reduction in their rate of hospital admissions for acute myocardial infarction (incidence rate ratio, 0.81; 95% confidence interval, 0.62-1.04), a 30% reduction in admissions for stroke (IRR, 0.70; 95% CI, 0.53-0.91), a 22% reduction in admissions for heart failure (IRR, 0.78; 95% CI, 0.65-0.92), a 15% reduction in admissions for either pneumonia or influenza (IRR, 0.85; 95% CI, 0.74-0.99), and a 24% lower death rate than those who had not been vaccinated (IRR, 0.76; 95% CI, 0.65-0.83).
“Our study provides valuable information on the long-term average benefits of influenza vaccine in people with type 2 diabetes,” the authors concluded, adding that “These findings underline the importance of influenza vaccination as part of comprehensive secondary prevention in this high-risk population.”
The study was supported by National Institute of Health Research. Dr. Vamos and her coauthors did not report any relevant financial disclosures.
Key clinical point:
Major finding: Vaccination resulted in a 19% reduction in myocardial infarction, 30% reduction in stroke, 22% reduction in heart failure, and 15% reduction in pneumonia or influenza, compared with those who went unvaccinated, after adjusting.
Data source: Retrospective cohort study of 124,503 adults with type 2 diabetes for 7 years, starting in 2003-2004 and going through 2009-2010.
Disclosures: Study supported by the National Institute of Health Research. Authors report no relevant financial disclosures.
Residency is like an IRONMAN
At the end of my junior surgical residency years, I was in a pretty bad physical and mental space. With resident coverage shortages, long hours, chronic fatigue, and personal pressures to perform and shine, I wound up digging myself into a hole, heading straight to resident burnout. Although there were others around me experiencing similar environmental stressors, I certainly felt alone – not knowing how to climb out of the hole I created for myself.
This was probably the lowest I have been in my life, but I finally got myself back on track. Coming from a fairly physically active background, I returned to a life of proper nutrition and physical activity. I began swimming, biking, and running, with the hopes of maybe one day doing a triathlon. There were a few health care professionals at my institution who competed in yearly triathlons, which certainly inspired me to take up the sport. So, last August, I signed up for my first Half-IRONMAN in Mont-Tremblant, Quebec, and had roughly 10 months to train. Looking back, I am not sure what possessed me to think I could achieve such a feat, but it was certainly a goal to work toward.
First, take it slow and steady. Residency is long and arduous, and it is easy to overpace yourself in the first few months – but keep in mind that you are in it for the long haul (for some, it’s longer than 5 years).
Second, be nice to your body and mind. You wouldn’t believe how some of the most-challenging experiences are all psychological; therefore, eat well, sleep well, and practice mindfulness every day. Develop a routine early on, so that when you meet grueling experiences and challenges, your routine will make you equipped to overcome them. The practice of mindfulness (a mental state of being aware in the present moment) will be unique to each individual and may be performed through exercising, yoga, or more traditionally, through meditation. Third, develop or strengthen a support system to help you identify and overcome problems that you may face during residency.
Ideally, this will be a support system (for example, residents, coworkers, and staff) that know exactly what you will be facing and offer constructive advice for the trials and tribulations you will be confronting. Finally, residency will be the most-challenging experience you may go through yet in your pursuit of postgraduate medical education. You are not alone on this journey, and the path to success will be burdened with physical and mental exhaustion, tears, groans, as well as smiles. But when you cross that finish line, let me tell you that the emotions that will overwhelm you will be those of complete exuberance and utter disbelief that you had the courage and determination to not only undertake the challenge but to succeed, as well.
Presenting Treatment Safety Data: Subjective Interpretations of Objective Information
The Nuremberg Code in 1947,1 the Declaration of Helsinki in 1964,2 and the Belmont Report in 19793 were cornerstones in the establishment of ethical principles in the medical field. These documents specifically highlight the concept of informed consent, which maintains that to practice ethical medicine, physicians must fully inform patients of all therapeutic benefits and especially risks as well as treatment alternatives before they consent to therapeutic intervention. Educating patients about risks of treatment is obligatory. Risk communication involves a mutual exchange of information between physicians and patients; the physician presents risk information in an understandable manner that adequately conveys pertinent data that is critical for the patient to make an informed therapeutic decision.4
An inherent problem with risk education is that patients may be terrified about risks associated with treatment. Some patients will refuse needed treatment because of fear.5 When patients have concerns about the safety profile of a treatment regimen and potential adverse effects, they may be less compliant with treatment.6 The intelligent noncompliance phenomenon occurs when a patient knowingly makes the choice to not adhere to treatment, and concern regarding treatment risks relative to benefits is a common reason underlying this phenomenon.7,8
Behavioral economists have studied how individuals weigh risks. Kahneman and Tversky’s9 prospect theory asserts that individuals tend to overweigh unlikely risks and underweigh more certain risks, which they call the certainty effect; it is the basis of the human tendency to avoid risks in situations of likely gain and to pursue risks in situations of likely loss. The tendency to overweigh rare risks is even more pronounced for affect-rich events such as serious side effects.10 The way data are presented can affect how patients interpret the information. Context and framing of data affect patients’ perceptions.11 We describe several ways to present safety data using graphical presentation of psoriasis treatment safety data as an example and explain how each one can affect patients’ perception of treatment risks.
Approaches to Presenting Safety Data
There are numerous ways to present safety data to patients, including verbal, numeric, and visual strategies.12 Many methods of presentation are a combination of these strategies. Graphs are visual strategies to further categorize and present numeric data, and physicians may choose to incorporate these aids when presenting safety information to patients. Graphical presentations give the patient a mental picture of the data. Numerous types of graphs can be constructed. Kalb et al13 determined the effect of psoriasis treatment on the risk of serious infection from the Psoriasis Longitudinal Assessment and Registry (PSOLAR). We used the results from this study to demonstrate multiple ways of presenting safety data (Figures 1–3).
A graphical presentation with a truncated y-axis is a common approach (Figure 1). Graphs with truncated axes are sometimes used to conserve space or to accentuate certain differences in the graph that would otherwise be less obvious without the zoomed in y-axis.14 These graphs present quantitatively accurate information that can be visually misleading at the same time. Truncated axes accentuate differences, creating mental impressions that are not reflective of the magnitude of the numeric differences. Alternatively, a graph with a full y-axis includes both the maximum and minimum data values on the y-axis (Figure 2). The y-axis also extends maximally to the total number of patients or patient-years studied. This type of graph presents all of the numeric data without distortion.
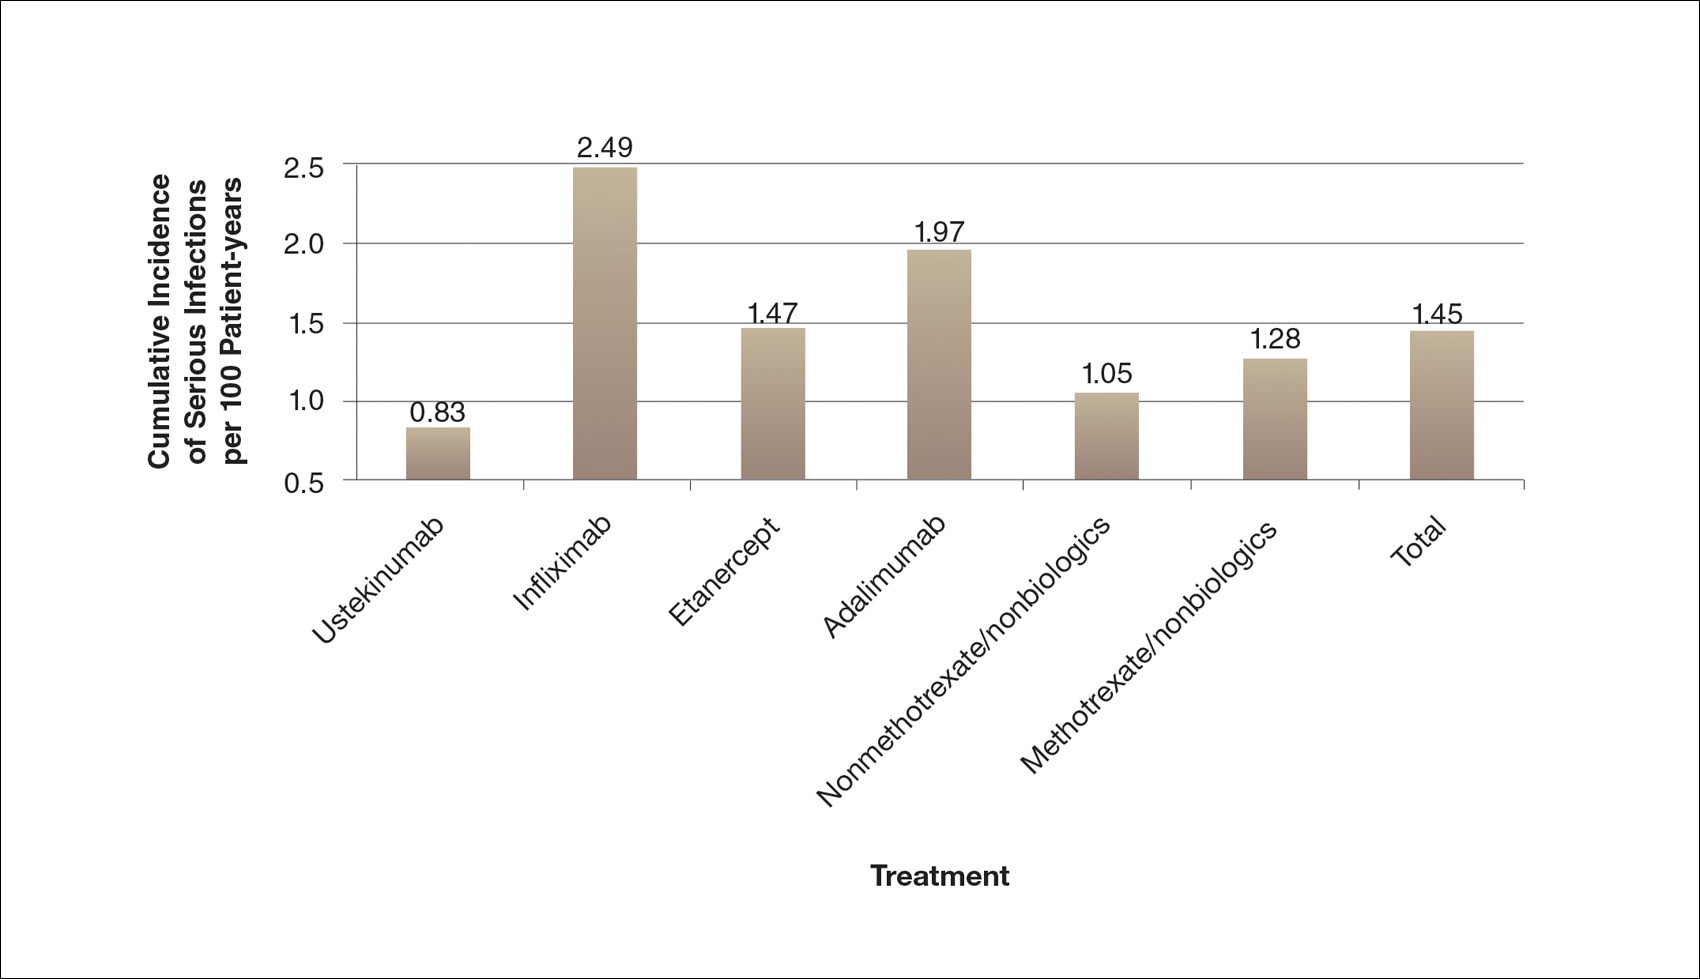
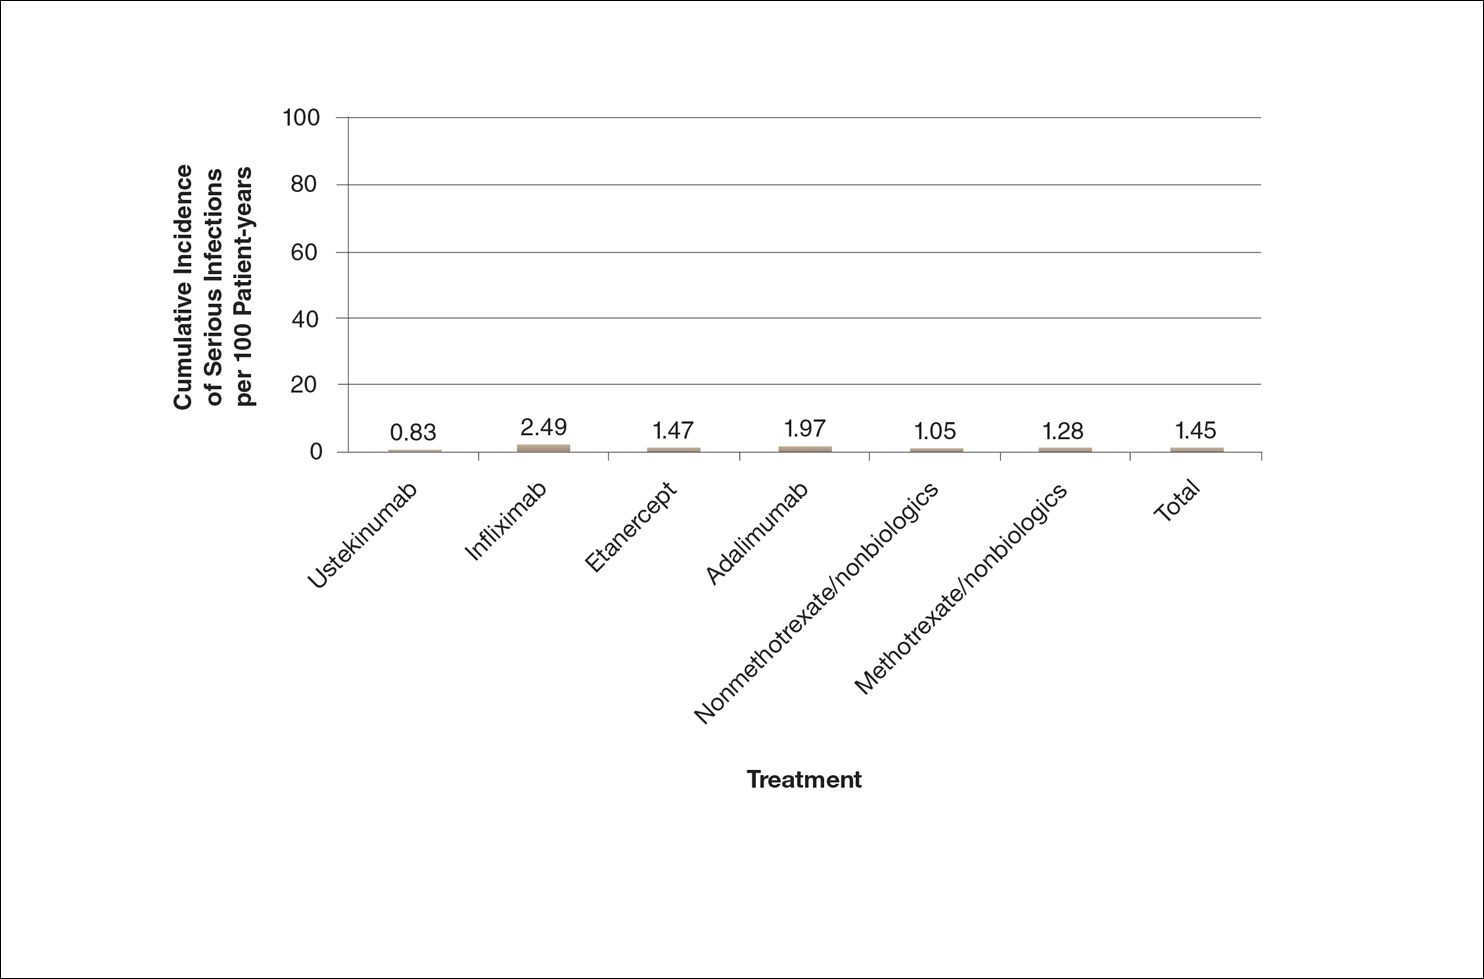
A graph also can present the percentage of patients or patient-years that do not have an adverse effect (Figure 3). This inverse presentation of the data does not emphasize rare cases of patients who have had adverse effects; instead, it emphasizes the large percentage of patients who did not have adverse effects and presents a far more reassuring perspective, even though mathematically the information is identical.
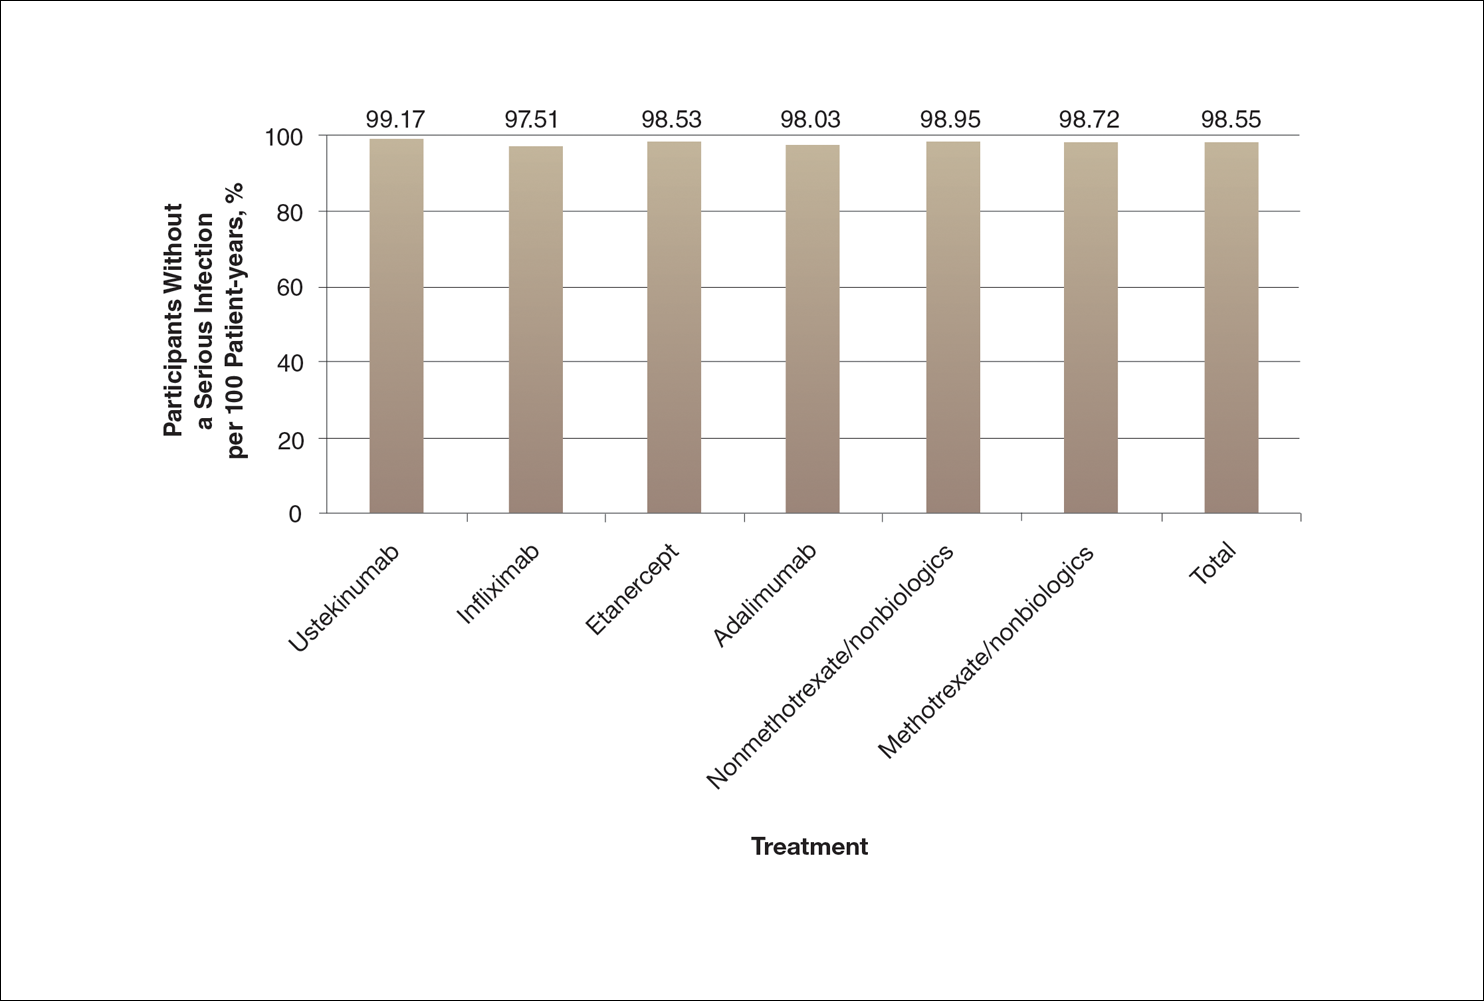
Focus on the Patients Who Do Not Have Adverse Effects of Treatments
Fear of adverse effects is one of the most commonly reported causes of poor treatment adherence.15 New therapies for psoriasis are highly effective and safe, but as with all treatments, they also are associated with some risks. Patients may latch onto those risks too tightly or perhaps, in other circumstances, not tightly enough. The method used by a physician to present safety data to a patient may determine the patient’s perception about treatments.
When trying to give patients an accurate impression of treatment risks, it may be helpful to avoid approaches that focus on presenting the (few) cases of severe adverse drug effects since patients (and physicians) are likely to overweigh the unlikely risk of having an adverse effect if presented with this information. It may be more reassuring to focus on presenting information about the chance of not having an adverse drug effect, assuming the physician’s goal is to be reassuring.
Poor communication with patients when presenting safety data can foster exaggerated fears of an unlikely consequence to the point that patients can be left undertreated and sustaining disease symptoms.16 Physicians may strive to do no harm to their patients, but without careful presentation of safety data in the process of helping the patient make an informed decision, it is possible to do mental harm to patients in the form of fear or even, in the case of nonadherence or treatment refusal, physical harm in the form of continued disease symptoms.
One limitation of this review is that we only used graphical presentation of data as an example. Similar concerns apply to numerical data presentation. Telling a patient the risk of a severe adverse reaction is doubled by a certain treatment may be terrifying, though if the baseline risk is rare, doubling the baseline risk may represent only a minimal increase in the absolute risk. Telling a patient the risk is only 1 in 1000 may still be alarming because many patients tend to focus on the 1, but telling a patient that 999 of 1000 patients do not have a problem can be much more reassuring.
The physician’s goal—to help patients make informed decisions about their treatment—calls for him/her to assimilate safety data into useful information that the patient can use to make an informed decision.17 Overly comforting or alarming, confusing, and inaccurate information can misguide the patient, violating the ethical principle of nonmaleficence. Although there is an obligation to educate patients about risks, there may not be a purely objective way to do it. When physicians present objective data to patients, whether in numerical or graphical form, there will be an unavoidable subjective interpretation of the data. The form of presentation will have a critical effect on patients’ subjective perceptions. Physicians can present objective data in such a way as to be reassuring or frightening.
Conclusion
Despite physicians’ best-intentioned efforts, it may be impossible to avoid presenting safety data in a way that will be subjectively interpreted by patients. Physicians have a choice in how they present data to patients; their best judgment should be used in how they present data to inform patients, guide them, and offer them the best treatment outcomes.
Acknowledgment
We thank Scott Jaros, BA (Winston-Salem, North Carolina), for his assistance in the revision of the manuscript.
- Freyhofer HH. The Nuremberg Medical Trial: The Holocaust and the Origin of the Nuremberg Medical Code. New York, NY: Peter Lang Publishing; 2004.
- Carlson R, Boyd KM, Webb DJ. The revision of the Declaration of Helsinki: past, present and future. Br J Clin Pharmacol. 2004;57:695-713.
- Office for Human Research Protections. The Belmont Report. Rockville, MD: US Department of Health and Human Services; 1979.
- Edwards A, Elwyn G, Mulley A. Explaining risks: turning numerical data into meaningful pictures. BMJ. 2002;324:827-830.
- Hayden C, Neame R, Tarrant C. Patients’ adherence-related beliefs about methotrexate: a qualitative study of the role of written patient information. BMJ Open. 2015;5:e006918.
- Horne R, Weinman J. Patients’ beliefs about prescribed medicines and their role in adherence to treatment in chronic physical illness. J Psychosom Res. 1999;47:555-567.
- Weintraub M. Intelligent noncompliance with special emphasis on the elderly. Contemp Pharm Pract. 1981;4:8-11.
- Horne R. Representations of medication and treatment: advances in theory and measurement. In: Petrie KJ, Weinman JA, eds. Perceptions of Health and Illness: Current Research and Applications. London, England: Routledge, Taylor & Francis Group; 1997:155-188.
- Kahneman D, Tversky A. Prospect theory: an analysis of decision under risk. Econometrica. 1979;47:263-291.
- Rottenstreich Y, Hsee CK. Money, kisses, and electric shocks: on the affective psychology of risk. Psychol Sci. 2001;12:185-190.
- Kessler JB, Zhang CY. Behavioural economics and health. In: Detels R, Gulliford M, Abdool Karim Q, et al, eds. Oxford Textbook of Global Public Health. 6th ed. Oxford, UK: Oxford University Press; 2015:775-789.
- Lipkus IM. Numeric, verbal, and visual formats of conveying health risks: suggested best practices and future recommendations [published online September 14, 2007]. Med Decis Making. 2007;27:696-713.
- Kalb RE, Fiorentino DF, Lebwohl MG, et al. Risk of serious infection with biologic and systemic treatment of psoriasis: results from the Psoriasis Longitudinal Assessment and Registry (PSOLAR). JAMA Dermatol. 2015;151:961-969.
- Rensberger B. Slanting the slopes of graphs. The Washington Post. May 10, 1995. http://www.washingtonpost.com/archive/1995/05/10/slanting-the-slope-of-graphs/08a34412-60a2-4719-86e5-d7433938c166/. Accessed September 21, 2016.
- Horne R, Weinman J. Patients’ beliefs about prescribed medicines and their role in adherence to treatment in chronic physical illness. J Psychosom Res. 1999;47:555-567.
- Hahn RA. The nocebo phenomenon: concept, evidence, and implications for public health. Prev Med. 1997;26(5, pt 1):607-611.
- Paling J. Strategies to help patients understand risks. BMJ. 2003;327:745-748.
The Nuremberg Code in 1947,1 the Declaration of Helsinki in 1964,2 and the Belmont Report in 19793 were cornerstones in the establishment of ethical principles in the medical field. These documents specifically highlight the concept of informed consent, which maintains that to practice ethical medicine, physicians must fully inform patients of all therapeutic benefits and especially risks as well as treatment alternatives before they consent to therapeutic intervention. Educating patients about risks of treatment is obligatory. Risk communication involves a mutual exchange of information between physicians and patients; the physician presents risk information in an understandable manner that adequately conveys pertinent data that is critical for the patient to make an informed therapeutic decision.4
An inherent problem with risk education is that patients may be terrified about risks associated with treatment. Some patients will refuse needed treatment because of fear.5 When patients have concerns about the safety profile of a treatment regimen and potential adverse effects, they may be less compliant with treatment.6 The intelligent noncompliance phenomenon occurs when a patient knowingly makes the choice to not adhere to treatment, and concern regarding treatment risks relative to benefits is a common reason underlying this phenomenon.7,8
Behavioral economists have studied how individuals weigh risks. Kahneman and Tversky’s9 prospect theory asserts that individuals tend to overweigh unlikely risks and underweigh more certain risks, which they call the certainty effect; it is the basis of the human tendency to avoid risks in situations of likely gain and to pursue risks in situations of likely loss. The tendency to overweigh rare risks is even more pronounced for affect-rich events such as serious side effects.10 The way data are presented can affect how patients interpret the information. Context and framing of data affect patients’ perceptions.11 We describe several ways to present safety data using graphical presentation of psoriasis treatment safety data as an example and explain how each one can affect patients’ perception of treatment risks.
Approaches to Presenting Safety Data
There are numerous ways to present safety data to patients, including verbal, numeric, and visual strategies.12 Many methods of presentation are a combination of these strategies. Graphs are visual strategies to further categorize and present numeric data, and physicians may choose to incorporate these aids when presenting safety information to patients. Graphical presentations give the patient a mental picture of the data. Numerous types of graphs can be constructed. Kalb et al13 determined the effect of psoriasis treatment on the risk of serious infection from the Psoriasis Longitudinal Assessment and Registry (PSOLAR). We used the results from this study to demonstrate multiple ways of presenting safety data (Figures 1–3).
A graphical presentation with a truncated y-axis is a common approach (Figure 1). Graphs with truncated axes are sometimes used to conserve space or to accentuate certain differences in the graph that would otherwise be less obvious without the zoomed in y-axis.14 These graphs present quantitatively accurate information that can be visually misleading at the same time. Truncated axes accentuate differences, creating mental impressions that are not reflective of the magnitude of the numeric differences. Alternatively, a graph with a full y-axis includes both the maximum and minimum data values on the y-axis (Figure 2). The y-axis also extends maximally to the total number of patients or patient-years studied. This type of graph presents all of the numeric data without distortion.
A graph also can present the percentage of patients or patient-years that do not have an adverse effect (Figure 3). This inverse presentation of the data does not emphasize rare cases of patients who have had adverse effects; instead, it emphasizes the large percentage of patients who did not have adverse effects and presents a far more reassuring perspective, even though mathematically the information is identical.
Focus on the Patients Who Do Not Have Adverse Effects of Treatments
Fear of adverse effects is one of the most commonly reported causes of poor treatment adherence.15 New therapies for psoriasis are highly effective and safe, but as with all treatments, they also are associated with some risks. Patients may latch onto those risks too tightly or perhaps, in other circumstances, not tightly enough. The method used by a physician to present safety data to a patient may determine the patient’s perception about treatments.
When trying to give patients an accurate impression of treatment risks, it may be helpful to avoid approaches that focus on presenting the (few) cases of severe adverse drug effects since patients (and physicians) are likely to overweigh the unlikely risk of having an adverse effect if presented with this information. It may be more reassuring to focus on presenting information about the chance of not having an adverse drug effect, assuming the physician’s goal is to be reassuring.
Poor communication with patients when presenting safety data can foster exaggerated fears of an unlikely consequence to the point that patients can be left undertreated and sustaining disease symptoms.16 Physicians may strive to do no harm to their patients, but without careful presentation of safety data in the process of helping the patient make an informed decision, it is possible to do mental harm to patients in the form of fear or even, in the case of nonadherence or treatment refusal, physical harm in the form of continued disease symptoms.
One limitation of this review is that we only used graphical presentation of data as an example. Similar concerns apply to numerical data presentation. Telling a patient the risk of a severe adverse reaction is doubled by a certain treatment may be terrifying, though if the baseline risk is rare, doubling the baseline risk may represent only a minimal increase in the absolute risk. Telling a patient the risk is only 1 in 1000 may still be alarming because many patients tend to focus on the 1, but telling a patient that 999 of 1000 patients do not have a problem can be much more reassuring.
The physician’s goal—to help patients make informed decisions about their treatment—calls for him/her to assimilate safety data into useful information that the patient can use to make an informed decision.17 Overly comforting or alarming, confusing, and inaccurate information can misguide the patient, violating the ethical principle of nonmaleficence. Although there is an obligation to educate patients about risks, there may not be a purely objective way to do it. When physicians present objective data to patients, whether in numerical or graphical form, there will be an unavoidable subjective interpretation of the data. The form of presentation will have a critical effect on patients’ subjective perceptions. Physicians can present objective data in such a way as to be reassuring or frightening.
Conclusion
Despite physicians’ best-intentioned efforts, it may be impossible to avoid presenting safety data in a way that will be subjectively interpreted by patients. Physicians have a choice in how they present data to patients; their best judgment should be used in how they present data to inform patients, guide them, and offer them the best treatment outcomes.
Acknowledgment
We thank Scott Jaros, BA (Winston-Salem, North Carolina), for his assistance in the revision of the manuscript.
- Freyhofer HH. The Nuremberg Medical Trial: The Holocaust and the Origin of the Nuremberg Medical Code. New York, NY: Peter Lang Publishing; 2004.
- Carlson R, Boyd KM, Webb DJ. The revision of the Declaration of Helsinki: past, present and future. Br J Clin Pharmacol. 2004;57:695-713.
- Office for Human Research Protections. The Belmont Report. Rockville, MD: US Department of Health and Human Services; 1979.
- Edwards A, Elwyn G, Mulley A. Explaining risks: turning numerical data into meaningful pictures. BMJ. 2002;324:827-830.
- Hayden C, Neame R, Tarrant C. Patients’ adherence-related beliefs about methotrexate: a qualitative study of the role of written patient information. BMJ Open. 2015;5:e006918.
- Horne R, Weinman J. Patients’ beliefs about prescribed medicines and their role in adherence to treatment in chronic physical illness. J Psychosom Res. 1999;47:555-567.
- Weintraub M. Intelligent noncompliance with special emphasis on the elderly. Contemp Pharm Pract. 1981;4:8-11.
- Horne R. Representations of medication and treatment: advances in theory and measurement. In: Petrie KJ, Weinman JA, eds. Perceptions of Health and Illness: Current Research and Applications. London, England: Routledge, Taylor & Francis Group; 1997:155-188.
- Kahneman D, Tversky A. Prospect theory: an analysis of decision under risk. Econometrica. 1979;47:263-291.
- Rottenstreich Y, Hsee CK. Money, kisses, and electric shocks: on the affective psychology of risk. Psychol Sci. 2001;12:185-190.
- Kessler JB, Zhang CY. Behavioural economics and health. In: Detels R, Gulliford M, Abdool Karim Q, et al, eds. Oxford Textbook of Global Public Health. 6th ed. Oxford, UK: Oxford University Press; 2015:775-789.
- Lipkus IM. Numeric, verbal, and visual formats of conveying health risks: suggested best practices and future recommendations [published online September 14, 2007]. Med Decis Making. 2007;27:696-713.
- Kalb RE, Fiorentino DF, Lebwohl MG, et al. Risk of serious infection with biologic and systemic treatment of psoriasis: results from the Psoriasis Longitudinal Assessment and Registry (PSOLAR). JAMA Dermatol. 2015;151:961-969.
- Rensberger B. Slanting the slopes of graphs. The Washington Post. May 10, 1995. http://www.washingtonpost.com/archive/1995/05/10/slanting-the-slope-of-graphs/08a34412-60a2-4719-86e5-d7433938c166/. Accessed September 21, 2016.
- Horne R, Weinman J. Patients’ beliefs about prescribed medicines and their role in adherence to treatment in chronic physical illness. J Psychosom Res. 1999;47:555-567.
- Hahn RA. The nocebo phenomenon: concept, evidence, and implications for public health. Prev Med. 1997;26(5, pt 1):607-611.
- Paling J. Strategies to help patients understand risks. BMJ. 2003;327:745-748.
Practice Points
- Physicians can guide patients’ perceptions of drug safety by the way safety data are presented.
- For patients who are concerned about rare treatment risks, presenting data on the patients who have not experienced adverse effects can be reassuring.
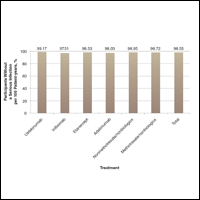
Psoriasis not consistently linked to adverse pregnancy outcomes
Psoriasis was not consistently associated with adverse pregnancy outcomes across nine studies in a systematic review of the literature, but four of the studies reported significant increases in at least one adverse outcome among women with psoriasis, according to a report in the British Journal of Dermatology.
Many women with psoriasis develop the disorder during their reproductive years, and more than 100,000 births to such patients are estimated to occur in the United States each year. Other autoimmune diseases are known to adversely affect pregnancy outcomes, but the issue has not been well studied among women with psoriasis, said Robert Bobotsis, a medical student at Western University, London (Ont.), and his associates.
They performed a systematic review of the literature to examine a possible link, but were only able to find nine fair- or good-quality studies involving a total of 4,756 pregnancies from which to extract data concerning a possible association. This small sample size may have been underpowered to detect the uncommon adverse pregnancy outcomes being assessed. Moreover, the investigators were unable to conduct a meta-analysis pooling the data because the effect measures were inconsistent across the nine studies, Mr. Bobotsis and his associates noted.
The review included a retrospective case series, a retrospective case control study, three retrospective cohort studies, two prospective cohort studies, one cross-sectional study, and one study combining prospective and retrospective cohorts. It “did not demonstrate an increased risk of poor outcomes in pregnant women with psoriasis” (Br J Dermatol. 2016 Jul 24;175:464-72).
However, four studies showed that compared with women who didn’t have psoriasis, those who did were at significantly increased risk for spontaneous abortion, cesarean delivery, low birth weight, macrosomia, large for gestational age, and prematurity, with odds ratios as high as 5.6. “Our results should be viewed as an opportunity to further research pregnancy outcomes in psoriasis,” the investigators said.
Key clinical point: Psoriasis is not consistently associated with adverse pregnancy outcomes across studies, but individual studies reported such links.
Major finding: Four of nine studies showed that compared with women who did not have psoriasis, those who did were at significantly increased risk for spontaneous abortion, cesarean delivery, low birth weight, macrosomia, large for gestational age, and prematurity, with odds ratios as high as 5.6.
Data source: A systematic review of nine reports in the literature concerning adverse outcomes in 4,756 pregnancies among women with psoriasis.
Disclosures: The authors reported that this work had no funding sources. Mr. Bobotsis reported having no relevant financial disclosures; two of his associates reported ties to AbbVie, Actelion, Amgen, Bio-K, Celgene, Eli Lilly, Galderma, Janssen, LEO Pharma, Merck, Novartis, Pfizer, Roche, and Valeant.