User login
When loved ones get cancer, people turn to the Web

chemotherapy
Photo by Rhoda Baer
Loved ones of cancer patients often turn to the Internet for further information about the disease, but they are less inclined to seek emotional support from social media forums, according to a study published in Computers, Informatics, Nursing.
It is fairly common for loved ones of cancer patients to develop depression or anxiety disorders as a result of the diagnosis, but there aren’t many studies focusing specifically on cancer patients’ caregivers and family members, said study author Carolyn Lauckner, PhD, of the University of Georgia in Athens.
“I think, sometimes, the loved ones and caregivers get forgotten about,” she said. “And that’s why I wanted to research this population to see if there are ways that we can better support these individuals.”
Dr Lauckner surveyed 191 people whose loved ones were diagnosed with cancer in the past year or who were currently acting as caregivers to someone with cancer. The motivation behind the research was personal for Dr Lauckner.
“I went through a period of time where I had 3 loved ones diagnosed within a short amount of time,” she said. “I had these experiences where I heard about the diagnosis and I would go online to look it up, and then I would immediately become terrified and freak out about all the stuff I read online.”
Like Dr Lauckner, more than 75% of the subjects she surveyed searched online for information on a loved one’s disease. Most looked for treatment options, prevention strategies and risk factors, and prognosis information.
“I was pleasantly surprised by the amount of people who said that they were looking for prevention information online and detection information,” Dr Lauckner said. “[T]hat shows that not only are they concerned for their loved one but they’re also concerned about how they themselves can avoid cancer, which, from a public health perspective, is great.”
Respondents were less inclined to view blogs or go online to hear about others’ cancer experiences. These kinds of sites were linked to negative emotions for participants, such as fear, sadness, and anger.
“A lot of people, especially in the cancer realm, they will use blogs or discussion posts to vent and to talk about the harsh realities of living with an illness,” Dr Lauckner said.
“And while I think that that is beneficial for both the person who is writing it and potentially for some people who want an idea of what to expect, when someone is dealing with the prospect of their loved one having to go through that experience, it can be extremely distressing.”
The most commonly visited websites were those of charitable organizations like the American Cancer Society, which were associated with positive emotions. Dr Lauckner said she found this information encouraging because it shows that participants were consulting reliable sources of information and not being swayed by personal accounts as much.
Dr Lauckner ultimately wants to build on the information gleaned in this study to determine the most effective use of social media and technology to distribute cancer prevention and risk reduction messages to the public. ![]()
Bile acid supports production of HSCs, team says

Photo by Åsa Hansdotter
Experiments in pregnant mice indicate that bile acid supports the production of hematopoietic stem cells (HSCs) in fetuses.
The work revealed large amounts of bile acids inside mouse fetuses and suggested these acids are transferred from the mothers via the placenta to help the fetuses produce HSCs.
“Fetuses produce small amounts of bile acids on their own, but here we are talking about much larger quantities,” said study author Kenichi Miharada, PhD, of Lund University in Sweden.
“The bile acid appears to be produced by the mother and then transferred to the fetus via the placenta.”
Dr Miharada and his colleagues detailed this discovery in Cell Stem Cell.
The investigators already knew that bile acid is produced in the fetal liver, but they did not know why.
With this study, they discovered that bile acid supports the production of HSCs in the fetal liver and enables them to develop normally. The additional contribution from the mother is important for the fetus to develop normally.
And although a large part of bile acid is toxic for cells, it undergoes a purification process when transferred through the placenta, letting only harmless bile acid through to the fetus.
“Our hypothesis is that the consequence of a damaged placenta, which, for various reasons, is unable to transfer bile acids to the fetus, can lead to leukemia or other blood diseases later in life, and we will continue our research to see if this hypothesis holds up,” Dr Miharada said.
He and his colleagues also said this work has implications for producing HSCs that could treat these blood diseases.
The problem with making HSCs proliferate outside the body is that the artificial growth gives rise to an accumulation of abnormal proteins in the endoplasmic reticulum (ER). This ER stress, if severe and chronic, causes cell death.
Dr Miharada and his colleagues previously showed it is possible to reduce ER stress chemically by adding bile acids to the cell culture. Bile acids, which are produced naturally in the liver and stored in the gallbladder, support protein production during the cell division process.
“Compared to other ways of trying to develop stem cells to treat blood diseases, this method is safer and quicker because it does not involve using any artificial substances or any genetic modifications, merely a substance that already exists inside the body,” Dr Miharada explained. ![]()
Group identifies SNPs associated with MBD

New research has revealed single-nucleotide polymorphisms (SNPs) that may increase the risk of bone disease in patients with multiple myeloma (MM).
One of these SNPs affects a gene encoding osteoprotegerin (OPG), a signaling protein that helps regulate the density of bones.
In patients with MM bone disease (MBD), bones are broken down faster than they can be repaired, resulting in fractures and lesions.
OPG is known to keep the numbers of osteoclasts in check, so it follows that mutations adversely affecting the gene may contribute to excessive bone breakdown.
Richard Houlston, MD, PhD, of The Institute of Cancer Research in London, UK, and his colleagues reported these findings in Leukemia.
The researchers analyzed the DNA of 3774 MM patients and used imaging techniques to detect which of these patients had MBD and which did not. The team used statistical analysis to compare sequencing data from the group of patients who developed MBD with those who did not.
The analysis revealed 9 SNPs that showed an association with MBD and reached genome-wide significance. They were all located in the same region at 8q24.12 and were in strong linkage disequilibrium (LD).
The strongest association at 8q24.12 was observed with the SNP rs4407910, which localizes 19Kb 3’ to the gene encoding TNFRSF11B, also known as OPG (odds ratio=1.38, P=4.02×10⁻⁹).
The researchers also found a “promising association” for MBD with the SNP rs74676832 at 19q13.43, which is located within a 29 kb region of LD intergenic to ZNF444 and GALP (odds ratio=1.97, P=9.33×10⁻⁷).
The team said these findings demonstrate that germline variation influences MBD, and they highlight the importance of the RANK/RANKL/OPG pathway in MBD development.
Furthermore, the work could enable scientists to develop new strategies to prevent MBD development and identify which patients might benefit from treatment with existing bone therapies such as bisphosphonates.
“It is really important to understand why some patients with myeloma are severely affected by bone disease,” Dr Houlston said. “This study tells us that at least part of the answer is in the patient’s DNA, greatly improving our understanding of the disease.”
“We want to be able to identify which patients are most at risk and which treatments are most likely to help them. This study gives us clues that can begin to help us do this. In the longer term, understanding the factors that contributed to bone breakdown could help us find new treatments for the disease.” ![]()
Readmission Analysis Using Fault Tree
As physicians strive to increase the value of healthcare delivery, there has been increased focus on improving the quality of care that patients receive while lowering per capita costs. A provision of the Affordable Care Act implemented in 2012 identified all‐cause 30‐day readmission rates as a measure of hospital quality, and as part of the Act's Hospital Readmission and Reduction Program, Medicare now penalizes hospitals with higher than expected all‐cause readmissions rates for adult patients with certain conditions by lowering reimbursements.[1] Although readmissions are not yet commonly used to determine reimbursements for pediatric hospitals, several states are penalizing higher than expected readmission rates for Medicaid enrollees,[2, 3] using an imprecise algorithm to determine which readmissions resulted from low‐quality care during the index admission.[4, 5, 6]
There is growing concern, however, that readmission rates are not an accurate gauge of the quality of care patients receive while in the hospital or during the discharge process to prepare them for their transition home.[7, 8, 9, 10] This is especially true in pediatric settings, where overall readmission rates are much lower than in adult settings, many readmissions are expected as part of a patient's planned course of care, and variation in readmission rates between hospitals is correlated with the percentage of patients with certain complex chronic conditions.[1, 7, 11] Thus, there is increasing agreement that hospitals and external evaluators need to shift the focus from all‐cause readmissions to a reliable, consistent, and fair measure of potentially preventable readmissions.[12, 13] In addition to being a more useful quality metric, analyzing preventable readmissions will help hospitals focus resources on patients with potentially modifiable risk factors and develop meaningful quality‐improvement initiatives to improve inpatient care as well as the discharge process to prepare families for their transition to home.[14]
Although previous studies have attempted to distinguish preventable from nonpreventable readmissions, many reported significant challenges in completing reviews efficiently, achieving consistency in how readmissions were classified, and attaining consensus on final determinations.[12, 13, 14] Studies have also demonstrated that the algorithms some states are using to streamline preventability reviews and determine reimbursements overestimate the rate of potentially preventable readmissions.[4, 5, 6]
To increase the efficiency of preventability reviews and reduce the subjectivity involved in reaching final determinations, while still accounting for the nuances necessary to conduct a fair review, a quality‐improvement team from the Division of General Pediatrics at The Children's Hospital of Philadelphia (CHOP) implemented a fault tree analysis tool based on a framework developed by Howard Parker at Intermountain Primary Children's Hospital. The CHOP team coded this framework into a secure Web‐based data‐collection tool in the form of a decision tree to guide reviewers through a logical progression of questions that result in 1 of 18 root causes of readmissions, 8 of which are considered potentially preventable. We hypothesized that this method would help reviewers efficiently reach consensus on the root causes of hospital readmissions, and thus help the division and the hospital focus efforts on developing relevant quality‐improvement initiatives.
METHODS
Inclusion Criteria and Study Design
This study was conducted at CHOP, a 535‐bed urban, tertiary‐care, freestanding children's hospital with approximately 29,000 annual discharges. Of those discharges, 7000 to 8000 are from the general pediatrics service, meaning that the attending of record was a general pediatrician. Patients were included in the study if (1) they were discharged from the general pediatrics service between January 2014 and December 2014, and (2) they were readmitted to the hospital, for any reason, within 15 days of discharge. Because this analysis was done as part of a quality‐improvement initiative, it focuses on 15‐day, early readmissions to target cases with a higher probability of being potentially preventable from the perspective of the hospital care team.[10, 12, 13] Patients under observation status during the index admission or the readmission were included. However, patients who returned to the emergency department but were not admitted to an inpatient unit were excluded. Objective details about each case, including the patient's name, demographics, chart number, and diagnosis code, were pre‐loaded from EPIC (Epic Systems Corp., Verona, WI) into REDCap (Research Electronic Data Capture;
A panel of 10 general pediatricians divided up the cases to perform retrospective chart reviews. For each case, REDCap guided reviewers through the fault tree analysis. Reviewers met monthly to discuss difficult cases and reach consensus on any identified ambiguities in the process. After all cases were reviewed once, 3 panel members independently reviewed a random selection of cases to measure inter‐rater reliability and confirm reproducibility of final determinations. The inter‐rater reliability statistic was calculated using Stata 12.1 (StataCorp LP, College Station, TX). During chart reviews, panel members were not blinded to the identity of physicians and other staff members caring for the patients under review. CHOP's institutional review board determined this study to be exempt from ongoing review.
Fault Tree Analysis
Using the decision tree framework for analyzing readmissions that was developed at Intermountain Primary Children's Hospital, the REDCap tool prompted reviewers with a series of sequential questions, each with mutually exclusive options. Using imbedded branching logic to select follow‐up questions, the tool guided reviewers to 1 of 18 terminal nodes, each representing a potential root cause of the readmission. Of those 18 potential causes, 8 were considered potentially preventable. A diagram of the fault tree framework, color coded to indicate which nodes were considered potentially preventable, is shown in Figure 1.

RESULTS
In 2014, 7252 patients were discharged from the general pediatrics service at CHOP. Of those patients, 248 were readmitted within 15 days for an overall general pediatrics 15‐day readmission rate of 3.4%.
Preventability Analysis
Of the 248 readmissions, 233 (94.0%) were considered not preventable. The most common cause for readmission, which accounted for 145 cases (58.5%), was a patient developing an unpredictable problem related to the index diagnosis or a natural progression of the disease that required readmission. The second most common cause, which accounted for 53 cases (21.4%), was a patient developing a new condition unrelated to the index diagnosis or a readmission unrelated to the quality of care received during the index stay. The third most frequent cause, which accounted for 11 cases (4.4%), was a legitimate nonclinical readmission due to lack of alternative resources, psychosocial or economic factors, or case‐specific factors. Other nonpreventable causes of readmission, including scheduled readmissions, each accounted for 7 or fewer cases and <3% of total readmissions.
The 15 readmissions considered potentially preventable accounted for 6.0% of total readmissions and 0.2% of total discharges from the general pediatrics service in 2014. The most common cause of preventable readmissions, which accounted for 6 cases, was premature discharge. The second most common cause, which accounted for 4 cases, was a problem resulting from nosocomial or iatrogenic factors. Other potentially preventable causes included delayed detection of problem (3 cases), inappropriate readmission (1 case), and inadequate postdischarge care planning (1 case).
A breakdown of fault tree results, including examples of cases associated with each terminal node, is shown in Table 1. Information about general pediatrics patients and readmitted patients is included in Tables 2 and 3. A breakdown of determinations for each reviewer is included in Supporting Table 1 in the online version of this article.
| Fault Tree Terminal Node | Root Cause of Readmission | No. of Cases | % of Total Readmissions | % Within Preventability Category | % of Total Discharges |
|---|---|---|---|---|---|
| |||||
| 2 (Potentially Preventable) | Problematic condition on discharge. Example:* Index admission: Infant with history of prematurity admitted with RSV and rhinovirus bronchiolitis. Had some waxing and waning symptoms. Just prior to discharge, noted to have increased work of breathing related to feeds. Readmission: 12 hours later with tachypnea, retractions, and hypoxia. | 6 | 2.4% | 40.0% | 0.08% |
| 3 (Potentially Preventable) | Nosocomial/Iatrogenic factors. Example*: Index admission: Toddler admitted with fever and neutropenia. Treated with antibiotics 24 hours. Diagnosed with viral illness and discharged home. Readmission: symptomatic Clostridum difficile infection. | 4 | 1.6% | 26.7% | 0.06% |
| 8 (Potentially Preventable) | Detection/treatment of problem was delayed and not appropriately facilitated. Example:* Index admission: Preteen admitted with abdominal pain, concern for appendicitis. Ultrasound and abdominal MRI negative for appendicitis. Symptoms improved. Tolerated PO. Readmission: 3 days later with similar abdominal pain. Diagnosed with constipation with significant improvement following clean‐out. | 3 | 1.2% | 20.0% | 0.04% |
| 1 (Potentially Preventable) | Inappropriate readmission. Example:* Index admission: Infant with laryngomalacia admitted with bronchiolitis. Readmission: Continued mild bronchiolitis symptoms but did not require oxygen or suctioning, normal CXR. | 1 | 0.4% | 6.7% | 0.01% |
| 5 (Potentially Preventable) | Resulted from inadequate postdischarge care planning. Example:* Index diagnosis: Infant with vomiting, prior admissions, and extensive evaluation, diagnosed with milk protein allergy and GERD. PPI increased. Readmission: Persistent symptoms, required NGT feeds supplementation. | 1 | 0.4% | 6.7% | 0.01% |
| 4 (Potentially Preventable) | Resulted from a preventable complication and hospital/physician did not take the appropriate steps to minimize likelihood of complication. | ||||
| 6 (Potentially Preventable) | Resulted from improper care by patient/family and effort by hospital/physician to ensure correct postdischarge care was inadequate. | ||||
| 7 (Potentially Preventable) | Resulted from inadequate care by community services and effort by hospital/physician to ensure correct postdischarge care was inadequate. | ||||
| 15 | 6.0% | 100% | 0.2% | ||
| 12 (Not Preventable) | Problem was unpredictable. Example:* Index admission: Infant admitted with gastroenteritis and dehydration with an anion gap metabolic acidosis. Vomiting and diarrhea improved, rehydrated, acidosis improved. Readmission: 1 day later, presented with emesis and fussiness. Readmitted for metabolic acidosis. | 145 | 58.5% | 62.2% | 2.00% |
| 10 (Not Preventable) | Patient developed new condition unrelated to index diagnosis or quality of care. Example:* Index admission: Toddler admitted with cellulitis. Readmission: Bronchiolitis (did not meet CDC guidelines for nosocomial infection). | 53 | 21.4% | 22.7% | 0.73% |
| 9 (Not Preventable) | Legitimate nonclinical readmission. Example:* Index admission: Infant admitted with second episode of bronchiolitis. Readmission: 4 days later with mild diarrhea. Tolerated PO challenge in emergency department. Admitted due to parental anxiety. | 11 | 4.4% | 4.7% | 0.15% |
| 17 (Not Preventable) | Problem resulted from improper care by patient/family but effort by hospital/physician to ensure correct postdischarge care was appropriate. Example:* Index admission: Infant admitted with diarrhea, diagnosed with milk protein allergy. Discharged on soy formula. Readmission: Developed vomiting and diarrhea with cow milk formula. | 7 | 2.8% | 3.0% | 0.10% |
| 11 (Not Preventable) | Scheduled readmission. Example:* Index admission: Infant with conjunctivitis and preseptal cellulitis with nasolacrimal duct obstruction. Readmission: Postoperatively following scheduled nasolacrimal duct repair. | 7 | 2.8% | 3.0% | 0.10% |
| 14 (Not Preventable) | Detection/treatment of problem was delayed, but earlier detection was not feasible. Example:* Index admission: Preteen admitted with fever, abdominal pain, and elevated inflammatory markers. Fever resolved and symptoms improved. Diagnosed with unspecified viral infection. Readmission: 4 days later with lower extremity pyomyositis and possible osteomyelitis. | 4 | 1.6% | 1.7% | 0.06% |
| 15 (Not Preventable) | Detection/treatment of problem was delayed, earlier detection was feasible, but detection was appropriately facilitated. Example:* Index admission: Infant with history of laryngomalacia and GER admitted with an ALTE. No events during hospitalization. Appropriate workup and cleared by consultants for discharge. Zantac increased. Readmission: Infant had similar ALTE events within a week after discharge. Ultimately underwent supraglottoplasty. | 2 | 0.8% | 0.9% | 0.03% |
| 13 (Not Preventable) | Resulted from preventable complication but efforts to minimize likelihood were appropriate. Example:* Index admission: Patient on GJ feeds admitted for dislodged GJ. Extensive conversations between primary team and multiple consulting services regarding best type of tube. Determined that no other tube options were appropriate. Temporizing measures were initiated. Readmission: GJ tube dislodged again. | 2 | 0.8% | 0.9% | 0.03% |
| 18 (Not Preventable) | Resulted from medication side effect (after watch period). Example:* Index admission: Preteen with MSSA bacteremia spread to other organs. Sent home on appropriate IV antibiotics. Readmission: Fever, rash, increased LFTs. Blood cultures negative. Presumed drug reaction. Fevers resolved with alternate medication. | 2 | 0.8% | 0.9% | 0.03% |
| 16 (Not Preventable) | Resulted from inadequate care by community services, but effort by hospital/physician to ensure correct postdischarge care was appropriate. | ||||
| 233 | 94.0% | 100% | 3.2% | ||
| Fault Tree Terminal Node | Root Cause of Potentially Preventable Readmission with Case Descriptions* |
|---|---|
| |
| 2 (Potentially Preventable) | Problematic condition on discharge |
| Case 1: Index admission: Infant with history of prematurity admitted with RSV and rhinovirus bronchiolitis. Had some waxing and waning symptoms. Just prior to discharge, noted to have increased work of breathing related to feeds. Readmission: 12 hours later with tachypnea, retractions, and hypoxia. | |
| Case 2: Index admission: Toddler admitted with febrile seizure in setting of gastroenteritis. Poor PO intake during hospitalization. Readmission: 1 day later with dehydration. | |
| Case 3: Index admission: Infant admitted with a prolonged complex febrile seizure. Workup included an unremarkable lumbar puncture. No additional seizures. No inpatient imaging obtained. Readmission: Abnormal outpatient MRI requiring intervention. | |
| Case 4: Index admission: Teenager with wheezing and history of chronic daily symptoms. Discharged <24 hours later on albuterol every 4 hours and prednisone. Readmission: 1 day later, seen by primary care physician with persistent asthma flare. | |
| Case 5: Index admission: Exfull‐term infant admitted with bronchiolitis, early in course. At time of discharge, had been off oxygen for 24 hours, but last recorded respiratory rate was >70. Readmission: 1 day later due to continued tachypnea and increased work of breathing. No hypoxia. CXR normal. | |
| Case 6: Exfull‐term infant admitted with bilious emesis, diarrhea, and dehydration. Ultrasound of pylorus, UGI, and BMP all normal. Tolerated oral intake but had emesis and loose stools prior to discharge. Readmission: <48 hours later with severe metabolic acidosis. | |
| 3 (Potentially Preventable) | Nosocomial/ematrogenic factors |
| Case 1: Index admission: Toddler admitted with fever and neutropenia. Treated with antibiotics 24 hours. Diagnosed with viral illness and discharged home. Readmission: Symptomatic Clostridum difficile infection. | |
| Case 2: Index admission: Patient with autism admitted with viral gastroenteritis. Readmission: Presumed nosocominal upper respiratory infection. | |
| Case 3: Index admission: Infant admitted with bronchiolitis. Recovered from initial infection. Readmission: New upper respiratory infection and presumed nosocomial infection. | |
| Case 4: Index admission: <28‐day‐old full‐term neonate presenting with neonatal fever and rash. Full septic workup performed and all cultures negative at 24 hours. Readmission: CSF culture positive at 36 hours and readmitted while awaiting speciation. Discharged once culture grew out a contaminant. | |
| 8 (Potentially Preventable) | Detection/treatment of problem was delayed and/or not appropriately facilitated |
| Case 1: Index admission: Preteen admitted with abdominal pain, concern for appendicitis. Ultrasound and MRI abdomen negative for appendicitis. Symptoms improved. Tolerated PO. Readmission: 3 days later with similar abdominal pain. Diagnosed with constipation with significant improvement following clean‐out. | |
| Case 2: Index admission: Infant with history of macrocephaly presented with fever and full fontanelle. Head CT showed mild prominence of the extra‐axial space, and lumbar puncture was normal. Readmission: Patient developed torticollis. MRI demonstrated a malignant lesion. | |
| Case 3: Index admission: School‐age child with RLQ abdominal pain, fever, leukocytosis, and indeterminate RLQ abdominal ultrasound. Twelve‐hour observation with no further fevers. Pain and appetite improved. Readmission: 1 day later with fever, anorexia, and abdominal pain. RLQ ultrasound unchanged. Appendectomy performed with inflamed appendix. | |
| 1 (Potentially Preventable) | Inappropriate readmission |
| Case 1: Index admission: Infant with laryngomalacia admitted with bronchiolitis. Readmission: Continued mild bronchiolitis symptoms but did not require oxygen or suctioning. Normal CXR. | |
| 5 (Potentially Preventable) | Resulted from inadequate postdischarge care planning |
| Case 1: Index diagnosis: Infant with vomiting, prior admissions, and extensive evaluation, diagnosed with milk protein allergy and GERD. PPI increased. Readmission: Persistent symptoms, required NGT feeds supplementation. | |
| All General Pediatrics Patients in 2014 | General Pediatric Readmitted Patients in 2014 | ||||
|---|---|---|---|---|---|
| Major Diagnosis Category at Index Admission | No. | % | Major Diagnosis Category at Index Admission | No. | % |
| |||||
| Respiratory | 2,723 | 37.5% | Respiratory | 79 | 31.9% |
| Digestive | 748 | 10.3% | Digestive | 41 | 16.5% |
| Ear, nose, mouth, throat | 675 | 9.3% | Ear, nose, mouth, throat | 24 | 9.7% |
| Skin, subcutaneous tissue | 480 | 6.6% | Musculoskeletal and connective tissue | 14 | 5.6% |
| Infectious, parasitic, systemic | 455 | 6.3% | Nervous | 13 | 5.2% |
| Factors influencing health status | 359 | 5.0% | Endocrine, nutritional, metabolic | 13 | 5.2% |
| Endocrine, nutritional, metabolic | 339 | 4.7% | Infectious, parasitic, systemic | 12 | 4.8% |
| Nervous | 239 | 3.3% | Newborn, neonate, perinatal period | 11 | 4.4% |
| Musculoskeletal and connective tissue | 228 | 3.1% | Hepatobiliary system and pancreas | 8 | 3.2% |
| Newborn, neonate, perinatal period | 206 | 2.8% | Skin, subcutaneous tissue | 8 | 3.2% |
| Other* | 800 | 11.0% | Other | 25 | 10.1% |
| Total | 7,252 | 100% | Total | 248 | 100% |
Inter‐Rater Reliability Analysis
A random selection of 50 cases (20% of total readmissions) was selected for a second review to test the tool's inter‐rater reliability. The second review resulted in the same terminal node for 44 (86%) of the cross‐checked files ( = 0.79; 95% confidence interval: 0.60‐0.98). Of the 6 cross‐checked files that ended at different nodes, 5 resulted in the same final determination about preventability. Only 1 of the cross‐checks (2% of total cross‐checked files) resulted in a different conclusion about preventability.
Efficiency Analysis
Reviewers reported that using the tool to reach a determination about preventability took approximately 20 minutes per case. Thus, initial reviews on the 248 cases required approximately 82.6 reviewer hours. Divided across 10 reviewers, this resulted in 8 to 9 hours of review time per reviewer over the year.
DISCUSSION
As part of an effort to direct quality‐improvement initiatives, this project used a Web‐based fault tree tool to identify root causes of general pediatrics readmissions at a freestanding children's hospital and classify them as either preventable or not preventable. The project also investigated the efficiency and inter‐rater reliability of the tool, which was designed to systematically guide physicians through the chart review process to a final determination about preventability. The project confirmed that using the tool helped reviewers reach final determinations about preventability efficiently with a high degree of consistency. It also confirmed that only a very small percentage of general pediatrics 15‐day readmissions are potentially preventable. Specifically, potentially preventable readmissions accounted for only 6.0% of total readmissions and 0.2% of general pediatrics discharges in 2014. Although our analysis focused on 15‐day readmissions, the fault tree methodology can be applied to any timeframe.
Previous studies attempting to distinguish preventable from nonpreventable readmissions, which used a range of methodologies to reach final determinations, reported that their review process was both time intensive and highly subjective. One study, which had 4 reviewers independently review charts and assign each case a preventability score on a 5‐point Likert scale, reported that reviewers disagreed on the final determination in 62.5% of cases.[12] Another study had 2 physicians independently review a selection of cases and assign a preventability score on a scale from 0 to 3. Scores for the 2 reviewers were added together, and cases above a certain composite threshold were classified as preventable. Despite being time‐intensive, this method resulted in only moderate agreement among physicians about the likelihood of preventability (weighted statistic of 0.44).[14] A more recent study, in which 2 physicians independently classified readmissions into 1 of 4 predefined categories, also reported only moderate agreement between reviewers ( = 0.44).[13] Other methods that have been reported include classifying readmissions as preventable only if multiple reviewers independently agreed, and using a third reviewer as a tie‐breaker.[14]
In an attempt to identify potentially preventable readmissions without using chart reviews, 3M (St. Paul, MN) developed its Potentially Preventable Readmissions software (3M‐PPR), which uses administrative data to identify which readmissions were potentially preventable. Although this automated approach is less time intensive, evidence suggests that due to a lack of nuance, the algorithm significantly overestimates the percentage of readmissions that are potentially preventable.[4, 5] A study that used 3M‐PPR to assess 1.7 million hospitalizations across 58 children's hospitals found that the algorithm classified 81% of sickle cell crisis and asthma readmissions, and 83% of bronchiolitis readmissions as potentially preventable.[10, 11] However, many readmissions for asthma and bronchiolitis are due to social factors that are outside of a hospital's direct control,[4, 5] and at many hospitals, readmissions for sickle cell crisis are part of a high‐value care model that weighs length of stay against potential readmissions. In addition, when assessing readmissions 7, 15, and 30 days after discharge, the algorithm classified almost the same percentage as potentially preventable, which is inconsistent with the notion that readmissions are more likely to have been preventable if they occurred closer to the initial discharge.[4, 13] Another study that assessed the performance of the software in the adult population reported that the algorithm performed with 85% sensitivity, but only 28% specificity.[5, 6]
The results of this quality‐improvement project indicate that using the fault tree tool to guide physicians through the chart review process helped address some of the shortcomings of methods reported in previous studies, by increasing the efficiency and reducing the subjectivity of final determinations, while still accounting for the nuances necessary to conduct a fair review. Because the tool provided a systematic framework for reviews, each case was completed in approximately 20 minutes, and because the process was the same for all reviewers, inter‐rater reliability was extremely high. In 86% of cross‐checked cases, the second reviewer ended at the same terminal node in the decision tree as the original reviewer, and in 98% of cross‐checked cases the second reviewer reached the same conclusion about preventability, even if they did not end at the same terminal node. Even accounting for agreement due to chance, the statistic of 0.79 confirmed that there was substantial agreement among reviewers about final determinations. Because the tool is easily adaptable, other hospitals can adopt this framework for their own preventability reviews and quality‐improvement initiatives.
Using the fault tree tool to access root causes of all 15‐day general pediatric readmissions helped the division focus quality‐improvement efforts on the most common causes of potentially preventable readmissions. Because 40% of potentially preventable readmissions were due to premature discharges, this prompted quality‐improvement teams to focus efforts on improving and clarifying the division's discharge criteria and clinical pathways. The division also initiated processes to improve discharge planning, including improved teaching of discharge instructions and having families pick up prescriptions prior to discharge.
Although these results did help the division identify a few areas of focus to potentially reduce readmissions, the fact that the overall 15‐day readmission rate for general pediatrics, as well as the percentage of readmissions and total discharges that were deemed potentially preventable, were so low (3.4%, 6.0%, and 0.2%, respectively), supports those who question whether prioritizing pediatric readmissions is the best place for hospitals to focus quality‐improvement efforts.[10, 12, 15, 16] As these results indicate, most pediatric readmissions are not preventable, and thus consistent with an efficient, effective, timely, patient‐centered, and equitable health system. Other studies have also shown that because overall and condition‐specific readmissions at pediatric hospitals are low, few pediatric hospitals are high or low performing for readmissions, and thus readmission rates are likely not a good measure of hospital quality.[8]
However, other condition‐specific studies of readmissions in pediatrics have indicated that there are some areas of opportunity to identify populations at high risk for readmission. One study found that although pneumonia‐specific 30‐day readmission rates in a national cohort of children hospitalized with pneumonia was only 3.1%, the chances of readmission were higher for children <1 year old, children with chronic comorbidities or complicated pneumonia, and children cared for in hospitals with lower volumes of pneumonia admissions.[17] Another study found that 17.1% of adolescents in a statewide database were readmitted post‐tonsillectomy for pain, nausea, and dehydration.[18] Thus, adapting the tool to identify root causes of condition‐specific or procedure‐specific readmissions, especially for surgical patients, may be an area of opportunity for future quality‐improvement efforts.[5] However, for general pediatrics, shifting the focus from reducing readmissions to improving the quality of care patients receive in the hospital, improving the discharge process, and adopting a population health approach to mitigate external risk factors, may be appropriate.
This project was subject to limitations. First, because it was conducted at a single site and only on general pediatrics patients, results may not be generalizable to other hospitals or other pediatric divisions. Thus, future studies might use the fault tree framework to assess preventability of pediatric readmissions in other divisions or specialties. Second, because readmissions to other hospitals were not included in the sample, the overall readmissions rate is likely underestimated.[19] However, it is unclear how this would affect the rate of potentially preventable readmissions. Third, although the fault tree framework reduced the subjectivity of the review process, there is still a degree of subjectivity inherent at each decision node. To minimize this, reviewers should try to discuss and come to consensus on how they are making determinations at each juncture in the decision tree. Similarly, because reviewers' answers to decision‐tree questions rely heavily on chart documentation, reviews may be compromised by unclear or incomplete documentation. For example, if information about steps the hospital team took to prepare a family for discharge were not properly documented, it would be difficult to determine whether appropriate steps were taken to minimize the likelihood of a complication. In the case of insufficient documentation of relevant social concerns, cases may be incorrectly classified as preventable, because addressing social issues is often not within a hospital's direct control. Finally, because reviewers were not blinded to the original discharging physician, there may have been some unconscious bias of unknown direction in the reviews.
CONCLUSION
Using the Web‐based fault tree tool helped physicians to identify the root causes of hospital readmissions and classify them as preventable or not preventable in a standardized, efficient, and consistent way, while still accounting for the nuances necessary to conduct a fair review. Thus, other hospitals should consider adopting this framework for their own preventability reviews and quality‐improvement initiatives. However, this project also confirmed that only a very small percentage of general pediatrics 15‐day readmissions are potentially preventable, suggesting that general pediatrics readmissions are not an appropriate measure of hospital quality. Instead, adapting the tool to identify root causes of condition‐specific or procedure‐specific readmission rates may be an area of opportunity for future quality‐improvement efforts.
Disclosures: This work was supported through internal funds from The Children's Hospital of Philadelphia. The authors have no financial interests, relationships or affiliations relevant to the subject matter or materials discussed in the article to disclose. The authors have no potential conflicts of interest relevant to the subject matter or materials discussed in the article to disclose.
- , . Pediatric readmissions as a hospital quality measure. JAMA. 2013;309(4):396–398.
- Texas Health and Human Services Commission. Potentially preventable readmissions in the Texas Medicaid population, state fiscal year 2012. Available at: http://www.hhsc.state.tx.us/reports/2013/ppr‐report.pdf. Published November 2013. Accessed August 16, 2015.
- Illinois Department of Healthcare and Family Services. Quality initiative to reduce hospital potentially preventable readmissions (PPR): Status update. Available at: http://www.illinois.gov/hfs/SiteCollectionDocuments/PPRPolicyStatusUpdate.pdf. Published September 3, 2014. Accessed August 16, 2015.
- , , , et al. Rates and impact of potentially preventable readmissions at children's hospitals. J Pediatr. 2015;166(3):613–619.e615.
- , . Preventing pediatric readmissions: which ones and how? J Pediatr. 2015;166(3):519–520.
- , , , , , . Manual and automated methods for identifying potentially preventable readmissions: a comparison in a large healthcare system. BMC Med Inform Decis Mak. 2014;14:28.
- , . Section on hospital medicine leadership and staff. Hosp Pediatr. 2013;3(4):390–393.
- , , , et al. Measuring hospital quality using pediatric readmission and revisit rates. Pediatrics. 2013;132(3):429–436.
- , . Hospital readmissions—not just a measure of quality. JAMA. 2011;306(16):1796–1797.
- , . Preventing readmissions in children: how do we do that? Hosp Pediatr. 2015;5(11):602–604.
- , , , et al. Pediatric readmission prevalence and variability across hospitals. JAMA. 2013;309(4):372–380.
- , , , , , . Preventability of early readmissions at a children's hospital. Pediatrics. 2013;131(1):e171–e181.
- , , , et al. An examination of physician‐, caregiver‐, and disease‐related factors associated with readmission from a pediatric hospital medicine service. Hosp Pediatr. 2015;5(11):566–573.
- , , , et al. Clinical preventability of 30‐day readmission after percutaneous coronary intervention. J Am Heart Assoc. 2014;3(5):e001290.
- . 3M algorithm overestimates preventable pediatric readmissions. Hospitalist News website. Available at: http://www.ehospitalistnews.com/specialty‐focus/pediatrics/single‐article‐page/3m‐algorithm‐overestimates‐preventable‐pediatric‐readmissions.html. Published August 16, 2013. Accessed August 16, 2015.
- . The 30‐day readmission rate: not a quality measure but an accountability measure. An Ounce of Evidence: Health Policy blog. Available at: https://blogs.sph.harvard.edu/ashish‐jha/?s=30‐day+readmission+rate. Published February 14, 2013. Accessed August 16, 2015.
- , , , et al. Readmissions among children previously hospitalized with pneumonia. Pediatrics. 2014;134(1):100–109.
- , , . A population‐based study of acute care revisits following tonsillectomy. J Pediatr. 2015;166(3):607–612.e605.
- , , , et al. Same‐hospital readmission rates as a measure of pediatric quality of care. JAMA Pediatr. 2015;169(10):905–912.
As physicians strive to increase the value of healthcare delivery, there has been increased focus on improving the quality of care that patients receive while lowering per capita costs. A provision of the Affordable Care Act implemented in 2012 identified all‐cause 30‐day readmission rates as a measure of hospital quality, and as part of the Act's Hospital Readmission and Reduction Program, Medicare now penalizes hospitals with higher than expected all‐cause readmissions rates for adult patients with certain conditions by lowering reimbursements.[1] Although readmissions are not yet commonly used to determine reimbursements for pediatric hospitals, several states are penalizing higher than expected readmission rates for Medicaid enrollees,[2, 3] using an imprecise algorithm to determine which readmissions resulted from low‐quality care during the index admission.[4, 5, 6]
There is growing concern, however, that readmission rates are not an accurate gauge of the quality of care patients receive while in the hospital or during the discharge process to prepare them for their transition home.[7, 8, 9, 10] This is especially true in pediatric settings, where overall readmission rates are much lower than in adult settings, many readmissions are expected as part of a patient's planned course of care, and variation in readmission rates between hospitals is correlated with the percentage of patients with certain complex chronic conditions.[1, 7, 11] Thus, there is increasing agreement that hospitals and external evaluators need to shift the focus from all‐cause readmissions to a reliable, consistent, and fair measure of potentially preventable readmissions.[12, 13] In addition to being a more useful quality metric, analyzing preventable readmissions will help hospitals focus resources on patients with potentially modifiable risk factors and develop meaningful quality‐improvement initiatives to improve inpatient care as well as the discharge process to prepare families for their transition to home.[14]
Although previous studies have attempted to distinguish preventable from nonpreventable readmissions, many reported significant challenges in completing reviews efficiently, achieving consistency in how readmissions were classified, and attaining consensus on final determinations.[12, 13, 14] Studies have also demonstrated that the algorithms some states are using to streamline preventability reviews and determine reimbursements overestimate the rate of potentially preventable readmissions.[4, 5, 6]
To increase the efficiency of preventability reviews and reduce the subjectivity involved in reaching final determinations, while still accounting for the nuances necessary to conduct a fair review, a quality‐improvement team from the Division of General Pediatrics at The Children's Hospital of Philadelphia (CHOP) implemented a fault tree analysis tool based on a framework developed by Howard Parker at Intermountain Primary Children's Hospital. The CHOP team coded this framework into a secure Web‐based data‐collection tool in the form of a decision tree to guide reviewers through a logical progression of questions that result in 1 of 18 root causes of readmissions, 8 of which are considered potentially preventable. We hypothesized that this method would help reviewers efficiently reach consensus on the root causes of hospital readmissions, and thus help the division and the hospital focus efforts on developing relevant quality‐improvement initiatives.
METHODS
Inclusion Criteria and Study Design
This study was conducted at CHOP, a 535‐bed urban, tertiary‐care, freestanding children's hospital with approximately 29,000 annual discharges. Of those discharges, 7000 to 8000 are from the general pediatrics service, meaning that the attending of record was a general pediatrician. Patients were included in the study if (1) they were discharged from the general pediatrics service between January 2014 and December 2014, and (2) they were readmitted to the hospital, for any reason, within 15 days of discharge. Because this analysis was done as part of a quality‐improvement initiative, it focuses on 15‐day, early readmissions to target cases with a higher probability of being potentially preventable from the perspective of the hospital care team.[10, 12, 13] Patients under observation status during the index admission or the readmission were included. However, patients who returned to the emergency department but were not admitted to an inpatient unit were excluded. Objective details about each case, including the patient's name, demographics, chart number, and diagnosis code, were pre‐loaded from EPIC (Epic Systems Corp., Verona, WI) into REDCap (Research Electronic Data Capture;
A panel of 10 general pediatricians divided up the cases to perform retrospective chart reviews. For each case, REDCap guided reviewers through the fault tree analysis. Reviewers met monthly to discuss difficult cases and reach consensus on any identified ambiguities in the process. After all cases were reviewed once, 3 panel members independently reviewed a random selection of cases to measure inter‐rater reliability and confirm reproducibility of final determinations. The inter‐rater reliability statistic was calculated using Stata 12.1 (StataCorp LP, College Station, TX). During chart reviews, panel members were not blinded to the identity of physicians and other staff members caring for the patients under review. CHOP's institutional review board determined this study to be exempt from ongoing review.
Fault Tree Analysis
Using the decision tree framework for analyzing readmissions that was developed at Intermountain Primary Children's Hospital, the REDCap tool prompted reviewers with a series of sequential questions, each with mutually exclusive options. Using imbedded branching logic to select follow‐up questions, the tool guided reviewers to 1 of 18 terminal nodes, each representing a potential root cause of the readmission. Of those 18 potential causes, 8 were considered potentially preventable. A diagram of the fault tree framework, color coded to indicate which nodes were considered potentially preventable, is shown in Figure 1.
RESULTS
In 2014, 7252 patients were discharged from the general pediatrics service at CHOP. Of those patients, 248 were readmitted within 15 days for an overall general pediatrics 15‐day readmission rate of 3.4%.
Preventability Analysis
Of the 248 readmissions, 233 (94.0%) were considered not preventable. The most common cause for readmission, which accounted for 145 cases (58.5%), was a patient developing an unpredictable problem related to the index diagnosis or a natural progression of the disease that required readmission. The second most common cause, which accounted for 53 cases (21.4%), was a patient developing a new condition unrelated to the index diagnosis or a readmission unrelated to the quality of care received during the index stay. The third most frequent cause, which accounted for 11 cases (4.4%), was a legitimate nonclinical readmission due to lack of alternative resources, psychosocial or economic factors, or case‐specific factors. Other nonpreventable causes of readmission, including scheduled readmissions, each accounted for 7 or fewer cases and <3% of total readmissions.
The 15 readmissions considered potentially preventable accounted for 6.0% of total readmissions and 0.2% of total discharges from the general pediatrics service in 2014. The most common cause of preventable readmissions, which accounted for 6 cases, was premature discharge. The second most common cause, which accounted for 4 cases, was a problem resulting from nosocomial or iatrogenic factors. Other potentially preventable causes included delayed detection of problem (3 cases), inappropriate readmission (1 case), and inadequate postdischarge care planning (1 case).
A breakdown of fault tree results, including examples of cases associated with each terminal node, is shown in Table 1. Information about general pediatrics patients and readmitted patients is included in Tables 2 and 3. A breakdown of determinations for each reviewer is included in Supporting Table 1 in the online version of this article.
| Fault Tree Terminal Node | Root Cause of Readmission | No. of Cases | % of Total Readmissions | % Within Preventability Category | % of Total Discharges |
|---|---|---|---|---|---|
| |||||
| 2 (Potentially Preventable) | Problematic condition on discharge. Example:* Index admission: Infant with history of prematurity admitted with RSV and rhinovirus bronchiolitis. Had some waxing and waning symptoms. Just prior to discharge, noted to have increased work of breathing related to feeds. Readmission: 12 hours later with tachypnea, retractions, and hypoxia. | 6 | 2.4% | 40.0% | 0.08% |
| 3 (Potentially Preventable) | Nosocomial/Iatrogenic factors. Example*: Index admission: Toddler admitted with fever and neutropenia. Treated with antibiotics 24 hours. Diagnosed with viral illness and discharged home. Readmission: symptomatic Clostridum difficile infection. | 4 | 1.6% | 26.7% | 0.06% |
| 8 (Potentially Preventable) | Detection/treatment of problem was delayed and not appropriately facilitated. Example:* Index admission: Preteen admitted with abdominal pain, concern for appendicitis. Ultrasound and abdominal MRI negative for appendicitis. Symptoms improved. Tolerated PO. Readmission: 3 days later with similar abdominal pain. Diagnosed with constipation with significant improvement following clean‐out. | 3 | 1.2% | 20.0% | 0.04% |
| 1 (Potentially Preventable) | Inappropriate readmission. Example:* Index admission: Infant with laryngomalacia admitted with bronchiolitis. Readmission: Continued mild bronchiolitis symptoms but did not require oxygen or suctioning, normal CXR. | 1 | 0.4% | 6.7% | 0.01% |
| 5 (Potentially Preventable) | Resulted from inadequate postdischarge care planning. Example:* Index diagnosis: Infant with vomiting, prior admissions, and extensive evaluation, diagnosed with milk protein allergy and GERD. PPI increased. Readmission: Persistent symptoms, required NGT feeds supplementation. | 1 | 0.4% | 6.7% | 0.01% |
| 4 (Potentially Preventable) | Resulted from a preventable complication and hospital/physician did not take the appropriate steps to minimize likelihood of complication. | ||||
| 6 (Potentially Preventable) | Resulted from improper care by patient/family and effort by hospital/physician to ensure correct postdischarge care was inadequate. | ||||
| 7 (Potentially Preventable) | Resulted from inadequate care by community services and effort by hospital/physician to ensure correct postdischarge care was inadequate. | ||||
| 15 | 6.0% | 100% | 0.2% | ||
| 12 (Not Preventable) | Problem was unpredictable. Example:* Index admission: Infant admitted with gastroenteritis and dehydration with an anion gap metabolic acidosis. Vomiting and diarrhea improved, rehydrated, acidosis improved. Readmission: 1 day later, presented with emesis and fussiness. Readmitted for metabolic acidosis. | 145 | 58.5% | 62.2% | 2.00% |
| 10 (Not Preventable) | Patient developed new condition unrelated to index diagnosis or quality of care. Example:* Index admission: Toddler admitted with cellulitis. Readmission: Bronchiolitis (did not meet CDC guidelines for nosocomial infection). | 53 | 21.4% | 22.7% | 0.73% |
| 9 (Not Preventable) | Legitimate nonclinical readmission. Example:* Index admission: Infant admitted with second episode of bronchiolitis. Readmission: 4 days later with mild diarrhea. Tolerated PO challenge in emergency department. Admitted due to parental anxiety. | 11 | 4.4% | 4.7% | 0.15% |
| 17 (Not Preventable) | Problem resulted from improper care by patient/family but effort by hospital/physician to ensure correct postdischarge care was appropriate. Example:* Index admission: Infant admitted with diarrhea, diagnosed with milk protein allergy. Discharged on soy formula. Readmission: Developed vomiting and diarrhea with cow milk formula. | 7 | 2.8% | 3.0% | 0.10% |
| 11 (Not Preventable) | Scheduled readmission. Example:* Index admission: Infant with conjunctivitis and preseptal cellulitis with nasolacrimal duct obstruction. Readmission: Postoperatively following scheduled nasolacrimal duct repair. | 7 | 2.8% | 3.0% | 0.10% |
| 14 (Not Preventable) | Detection/treatment of problem was delayed, but earlier detection was not feasible. Example:* Index admission: Preteen admitted with fever, abdominal pain, and elevated inflammatory markers. Fever resolved and symptoms improved. Diagnosed with unspecified viral infection. Readmission: 4 days later with lower extremity pyomyositis and possible osteomyelitis. | 4 | 1.6% | 1.7% | 0.06% |
| 15 (Not Preventable) | Detection/treatment of problem was delayed, earlier detection was feasible, but detection was appropriately facilitated. Example:* Index admission: Infant with history of laryngomalacia and GER admitted with an ALTE. No events during hospitalization. Appropriate workup and cleared by consultants for discharge. Zantac increased. Readmission: Infant had similar ALTE events within a week after discharge. Ultimately underwent supraglottoplasty. | 2 | 0.8% | 0.9% | 0.03% |
| 13 (Not Preventable) | Resulted from preventable complication but efforts to minimize likelihood were appropriate. Example:* Index admission: Patient on GJ feeds admitted for dislodged GJ. Extensive conversations between primary team and multiple consulting services regarding best type of tube. Determined that no other tube options were appropriate. Temporizing measures were initiated. Readmission: GJ tube dislodged again. | 2 | 0.8% | 0.9% | 0.03% |
| 18 (Not Preventable) | Resulted from medication side effect (after watch period). Example:* Index admission: Preteen with MSSA bacteremia spread to other organs. Sent home on appropriate IV antibiotics. Readmission: Fever, rash, increased LFTs. Blood cultures negative. Presumed drug reaction. Fevers resolved with alternate medication. | 2 | 0.8% | 0.9% | 0.03% |
| 16 (Not Preventable) | Resulted from inadequate care by community services, but effort by hospital/physician to ensure correct postdischarge care was appropriate. | ||||
| 233 | 94.0% | 100% | 3.2% | ||
| Fault Tree Terminal Node | Root Cause of Potentially Preventable Readmission with Case Descriptions* |
|---|---|
| |
| 2 (Potentially Preventable) | Problematic condition on discharge |
| Case 1: Index admission: Infant with history of prematurity admitted with RSV and rhinovirus bronchiolitis. Had some waxing and waning symptoms. Just prior to discharge, noted to have increased work of breathing related to feeds. Readmission: 12 hours later with tachypnea, retractions, and hypoxia. | |
| Case 2: Index admission: Toddler admitted with febrile seizure in setting of gastroenteritis. Poor PO intake during hospitalization. Readmission: 1 day later with dehydration. | |
| Case 3: Index admission: Infant admitted with a prolonged complex febrile seizure. Workup included an unremarkable lumbar puncture. No additional seizures. No inpatient imaging obtained. Readmission: Abnormal outpatient MRI requiring intervention. | |
| Case 4: Index admission: Teenager with wheezing and history of chronic daily symptoms. Discharged <24 hours later on albuterol every 4 hours and prednisone. Readmission: 1 day later, seen by primary care physician with persistent asthma flare. | |
| Case 5: Index admission: Exfull‐term infant admitted with bronchiolitis, early in course. At time of discharge, had been off oxygen for 24 hours, but last recorded respiratory rate was >70. Readmission: 1 day later due to continued tachypnea and increased work of breathing. No hypoxia. CXR normal. | |
| Case 6: Exfull‐term infant admitted with bilious emesis, diarrhea, and dehydration. Ultrasound of pylorus, UGI, and BMP all normal. Tolerated oral intake but had emesis and loose stools prior to discharge. Readmission: <48 hours later with severe metabolic acidosis. | |
| 3 (Potentially Preventable) | Nosocomial/ematrogenic factors |
| Case 1: Index admission: Toddler admitted with fever and neutropenia. Treated with antibiotics 24 hours. Diagnosed with viral illness and discharged home. Readmission: Symptomatic Clostridum difficile infection. | |
| Case 2: Index admission: Patient with autism admitted with viral gastroenteritis. Readmission: Presumed nosocominal upper respiratory infection. | |
| Case 3: Index admission: Infant admitted with bronchiolitis. Recovered from initial infection. Readmission: New upper respiratory infection and presumed nosocomial infection. | |
| Case 4: Index admission: <28‐day‐old full‐term neonate presenting with neonatal fever and rash. Full septic workup performed and all cultures negative at 24 hours. Readmission: CSF culture positive at 36 hours and readmitted while awaiting speciation. Discharged once culture grew out a contaminant. | |
| 8 (Potentially Preventable) | Detection/treatment of problem was delayed and/or not appropriately facilitated |
| Case 1: Index admission: Preteen admitted with abdominal pain, concern for appendicitis. Ultrasound and MRI abdomen negative for appendicitis. Symptoms improved. Tolerated PO. Readmission: 3 days later with similar abdominal pain. Diagnosed with constipation with significant improvement following clean‐out. | |
| Case 2: Index admission: Infant with history of macrocephaly presented with fever and full fontanelle. Head CT showed mild prominence of the extra‐axial space, and lumbar puncture was normal. Readmission: Patient developed torticollis. MRI demonstrated a malignant lesion. | |
| Case 3: Index admission: School‐age child with RLQ abdominal pain, fever, leukocytosis, and indeterminate RLQ abdominal ultrasound. Twelve‐hour observation with no further fevers. Pain and appetite improved. Readmission: 1 day later with fever, anorexia, and abdominal pain. RLQ ultrasound unchanged. Appendectomy performed with inflamed appendix. | |
| 1 (Potentially Preventable) | Inappropriate readmission |
| Case 1: Index admission: Infant with laryngomalacia admitted with bronchiolitis. Readmission: Continued mild bronchiolitis symptoms but did not require oxygen or suctioning. Normal CXR. | |
| 5 (Potentially Preventable) | Resulted from inadequate postdischarge care planning |
| Case 1: Index diagnosis: Infant with vomiting, prior admissions, and extensive evaluation, diagnosed with milk protein allergy and GERD. PPI increased. Readmission: Persistent symptoms, required NGT feeds supplementation. | |
| All General Pediatrics Patients in 2014 | General Pediatric Readmitted Patients in 2014 | ||||
|---|---|---|---|---|---|
| Major Diagnosis Category at Index Admission | No. | % | Major Diagnosis Category at Index Admission | No. | % |
| |||||
| Respiratory | 2,723 | 37.5% | Respiratory | 79 | 31.9% |
| Digestive | 748 | 10.3% | Digestive | 41 | 16.5% |
| Ear, nose, mouth, throat | 675 | 9.3% | Ear, nose, mouth, throat | 24 | 9.7% |
| Skin, subcutaneous tissue | 480 | 6.6% | Musculoskeletal and connective tissue | 14 | 5.6% |
| Infectious, parasitic, systemic | 455 | 6.3% | Nervous | 13 | 5.2% |
| Factors influencing health status | 359 | 5.0% | Endocrine, nutritional, metabolic | 13 | 5.2% |
| Endocrine, nutritional, metabolic | 339 | 4.7% | Infectious, parasitic, systemic | 12 | 4.8% |
| Nervous | 239 | 3.3% | Newborn, neonate, perinatal period | 11 | 4.4% |
| Musculoskeletal and connective tissue | 228 | 3.1% | Hepatobiliary system and pancreas | 8 | 3.2% |
| Newborn, neonate, perinatal period | 206 | 2.8% | Skin, subcutaneous tissue | 8 | 3.2% |
| Other* | 800 | 11.0% | Other | 25 | 10.1% |
| Total | 7,252 | 100% | Total | 248 | 100% |
Inter‐Rater Reliability Analysis
A random selection of 50 cases (20% of total readmissions) was selected for a second review to test the tool's inter‐rater reliability. The second review resulted in the same terminal node for 44 (86%) of the cross‐checked files ( = 0.79; 95% confidence interval: 0.60‐0.98). Of the 6 cross‐checked files that ended at different nodes, 5 resulted in the same final determination about preventability. Only 1 of the cross‐checks (2% of total cross‐checked files) resulted in a different conclusion about preventability.
Efficiency Analysis
Reviewers reported that using the tool to reach a determination about preventability took approximately 20 minutes per case. Thus, initial reviews on the 248 cases required approximately 82.6 reviewer hours. Divided across 10 reviewers, this resulted in 8 to 9 hours of review time per reviewer over the year.
DISCUSSION
As part of an effort to direct quality‐improvement initiatives, this project used a Web‐based fault tree tool to identify root causes of general pediatrics readmissions at a freestanding children's hospital and classify them as either preventable or not preventable. The project also investigated the efficiency and inter‐rater reliability of the tool, which was designed to systematically guide physicians through the chart review process to a final determination about preventability. The project confirmed that using the tool helped reviewers reach final determinations about preventability efficiently with a high degree of consistency. It also confirmed that only a very small percentage of general pediatrics 15‐day readmissions are potentially preventable. Specifically, potentially preventable readmissions accounted for only 6.0% of total readmissions and 0.2% of general pediatrics discharges in 2014. Although our analysis focused on 15‐day readmissions, the fault tree methodology can be applied to any timeframe.
Previous studies attempting to distinguish preventable from nonpreventable readmissions, which used a range of methodologies to reach final determinations, reported that their review process was both time intensive and highly subjective. One study, which had 4 reviewers independently review charts and assign each case a preventability score on a 5‐point Likert scale, reported that reviewers disagreed on the final determination in 62.5% of cases.[12] Another study had 2 physicians independently review a selection of cases and assign a preventability score on a scale from 0 to 3. Scores for the 2 reviewers were added together, and cases above a certain composite threshold were classified as preventable. Despite being time‐intensive, this method resulted in only moderate agreement among physicians about the likelihood of preventability (weighted statistic of 0.44).[14] A more recent study, in which 2 physicians independently classified readmissions into 1 of 4 predefined categories, also reported only moderate agreement between reviewers ( = 0.44).[13] Other methods that have been reported include classifying readmissions as preventable only if multiple reviewers independently agreed, and using a third reviewer as a tie‐breaker.[14]
In an attempt to identify potentially preventable readmissions without using chart reviews, 3M (St. Paul, MN) developed its Potentially Preventable Readmissions software (3M‐PPR), which uses administrative data to identify which readmissions were potentially preventable. Although this automated approach is less time intensive, evidence suggests that due to a lack of nuance, the algorithm significantly overestimates the percentage of readmissions that are potentially preventable.[4, 5] A study that used 3M‐PPR to assess 1.7 million hospitalizations across 58 children's hospitals found that the algorithm classified 81% of sickle cell crisis and asthma readmissions, and 83% of bronchiolitis readmissions as potentially preventable.[10, 11] However, many readmissions for asthma and bronchiolitis are due to social factors that are outside of a hospital's direct control,[4, 5] and at many hospitals, readmissions for sickle cell crisis are part of a high‐value care model that weighs length of stay against potential readmissions. In addition, when assessing readmissions 7, 15, and 30 days after discharge, the algorithm classified almost the same percentage as potentially preventable, which is inconsistent with the notion that readmissions are more likely to have been preventable if they occurred closer to the initial discharge.[4, 13] Another study that assessed the performance of the software in the adult population reported that the algorithm performed with 85% sensitivity, but only 28% specificity.[5, 6]
The results of this quality‐improvement project indicate that using the fault tree tool to guide physicians through the chart review process helped address some of the shortcomings of methods reported in previous studies, by increasing the efficiency and reducing the subjectivity of final determinations, while still accounting for the nuances necessary to conduct a fair review. Because the tool provided a systematic framework for reviews, each case was completed in approximately 20 minutes, and because the process was the same for all reviewers, inter‐rater reliability was extremely high. In 86% of cross‐checked cases, the second reviewer ended at the same terminal node in the decision tree as the original reviewer, and in 98% of cross‐checked cases the second reviewer reached the same conclusion about preventability, even if they did not end at the same terminal node. Even accounting for agreement due to chance, the statistic of 0.79 confirmed that there was substantial agreement among reviewers about final determinations. Because the tool is easily adaptable, other hospitals can adopt this framework for their own preventability reviews and quality‐improvement initiatives.
Using the fault tree tool to access root causes of all 15‐day general pediatric readmissions helped the division focus quality‐improvement efforts on the most common causes of potentially preventable readmissions. Because 40% of potentially preventable readmissions were due to premature discharges, this prompted quality‐improvement teams to focus efforts on improving and clarifying the division's discharge criteria and clinical pathways. The division also initiated processes to improve discharge planning, including improved teaching of discharge instructions and having families pick up prescriptions prior to discharge.
Although these results did help the division identify a few areas of focus to potentially reduce readmissions, the fact that the overall 15‐day readmission rate for general pediatrics, as well as the percentage of readmissions and total discharges that were deemed potentially preventable, were so low (3.4%, 6.0%, and 0.2%, respectively), supports those who question whether prioritizing pediatric readmissions is the best place for hospitals to focus quality‐improvement efforts.[10, 12, 15, 16] As these results indicate, most pediatric readmissions are not preventable, and thus consistent with an efficient, effective, timely, patient‐centered, and equitable health system. Other studies have also shown that because overall and condition‐specific readmissions at pediatric hospitals are low, few pediatric hospitals are high or low performing for readmissions, and thus readmission rates are likely not a good measure of hospital quality.[8]
However, other condition‐specific studies of readmissions in pediatrics have indicated that there are some areas of opportunity to identify populations at high risk for readmission. One study found that although pneumonia‐specific 30‐day readmission rates in a national cohort of children hospitalized with pneumonia was only 3.1%, the chances of readmission were higher for children <1 year old, children with chronic comorbidities or complicated pneumonia, and children cared for in hospitals with lower volumes of pneumonia admissions.[17] Another study found that 17.1% of adolescents in a statewide database were readmitted post‐tonsillectomy for pain, nausea, and dehydration.[18] Thus, adapting the tool to identify root causes of condition‐specific or procedure‐specific readmissions, especially for surgical patients, may be an area of opportunity for future quality‐improvement efforts.[5] However, for general pediatrics, shifting the focus from reducing readmissions to improving the quality of care patients receive in the hospital, improving the discharge process, and adopting a population health approach to mitigate external risk factors, may be appropriate.
This project was subject to limitations. First, because it was conducted at a single site and only on general pediatrics patients, results may not be generalizable to other hospitals or other pediatric divisions. Thus, future studies might use the fault tree framework to assess preventability of pediatric readmissions in other divisions or specialties. Second, because readmissions to other hospitals were not included in the sample, the overall readmissions rate is likely underestimated.[19] However, it is unclear how this would affect the rate of potentially preventable readmissions. Third, although the fault tree framework reduced the subjectivity of the review process, there is still a degree of subjectivity inherent at each decision node. To minimize this, reviewers should try to discuss and come to consensus on how they are making determinations at each juncture in the decision tree. Similarly, because reviewers' answers to decision‐tree questions rely heavily on chart documentation, reviews may be compromised by unclear or incomplete documentation. For example, if information about steps the hospital team took to prepare a family for discharge were not properly documented, it would be difficult to determine whether appropriate steps were taken to minimize the likelihood of a complication. In the case of insufficient documentation of relevant social concerns, cases may be incorrectly classified as preventable, because addressing social issues is often not within a hospital's direct control. Finally, because reviewers were not blinded to the original discharging physician, there may have been some unconscious bias of unknown direction in the reviews.
CONCLUSION
Using the Web‐based fault tree tool helped physicians to identify the root causes of hospital readmissions and classify them as preventable or not preventable in a standardized, efficient, and consistent way, while still accounting for the nuances necessary to conduct a fair review. Thus, other hospitals should consider adopting this framework for their own preventability reviews and quality‐improvement initiatives. However, this project also confirmed that only a very small percentage of general pediatrics 15‐day readmissions are potentially preventable, suggesting that general pediatrics readmissions are not an appropriate measure of hospital quality. Instead, adapting the tool to identify root causes of condition‐specific or procedure‐specific readmission rates may be an area of opportunity for future quality‐improvement efforts.
Disclosures: This work was supported through internal funds from The Children's Hospital of Philadelphia. The authors have no financial interests, relationships or affiliations relevant to the subject matter or materials discussed in the article to disclose. The authors have no potential conflicts of interest relevant to the subject matter or materials discussed in the article to disclose.
- , . Pediatric readmissions as a hospital quality measure. JAMA. 2013;309(4):396–398.
- Texas Health and Human Services Commission. Potentially preventable readmissions in the Texas Medicaid population, state fiscal year 2012. Available at: http://www.hhsc.state.tx.us/reports/2013/ppr‐report.pdf. Published November 2013. Accessed August 16, 2015.
- Illinois Department of Healthcare and Family Services. Quality initiative to reduce hospital potentially preventable readmissions (PPR): Status update. Available at: http://www.illinois.gov/hfs/SiteCollectionDocuments/PPRPolicyStatusUpdate.pdf. Published September 3, 2014. Accessed August 16, 2015.
- , , , et al. Rates and impact of potentially preventable readmissions at children's hospitals. J Pediatr. 2015;166(3):613–619.e615.
- , . Preventing pediatric readmissions: which ones and how? J Pediatr. 2015;166(3):519–520.
- , , , , , . Manual and automated methods for identifying potentially preventable readmissions: a comparison in a large healthcare system. BMC Med Inform Decis Mak. 2014;14:28.
- , . Section on hospital medicine leadership and staff. Hosp Pediatr. 2013;3(4):390–393.
- , , , et al. Measuring hospital quality using pediatric readmission and revisit rates. Pediatrics. 2013;132(3):429–436.
- , . Hospital readmissions—not just a measure of quality. JAMA. 2011;306(16):1796–1797.
- , . Preventing readmissions in children: how do we do that? Hosp Pediatr. 2015;5(11):602–604.
- , , , et al. Pediatric readmission prevalence and variability across hospitals. JAMA. 2013;309(4):372–380.
- , , , , , . Preventability of early readmissions at a children's hospital. Pediatrics. 2013;131(1):e171–e181.
- , , , et al. An examination of physician‐, caregiver‐, and disease‐related factors associated with readmission from a pediatric hospital medicine service. Hosp Pediatr. 2015;5(11):566–573.
- , , , et al. Clinical preventability of 30‐day readmission after percutaneous coronary intervention. J Am Heart Assoc. 2014;3(5):e001290.
- . 3M algorithm overestimates preventable pediatric readmissions. Hospitalist News website. Available at: http://www.ehospitalistnews.com/specialty‐focus/pediatrics/single‐article‐page/3m‐algorithm‐overestimates‐preventable‐pediatric‐readmissions.html. Published August 16, 2013. Accessed August 16, 2015.
- . The 30‐day readmission rate: not a quality measure but an accountability measure. An Ounce of Evidence: Health Policy blog. Available at: https://blogs.sph.harvard.edu/ashish‐jha/?s=30‐day+readmission+rate. Published February 14, 2013. Accessed August 16, 2015.
- , , , et al. Readmissions among children previously hospitalized with pneumonia. Pediatrics. 2014;134(1):100–109.
- , , . A population‐based study of acute care revisits following tonsillectomy. J Pediatr. 2015;166(3):607–612.e605.
- , , , et al. Same‐hospital readmission rates as a measure of pediatric quality of care. JAMA Pediatr. 2015;169(10):905–912.
© 2016 Society of Hospital Medicine
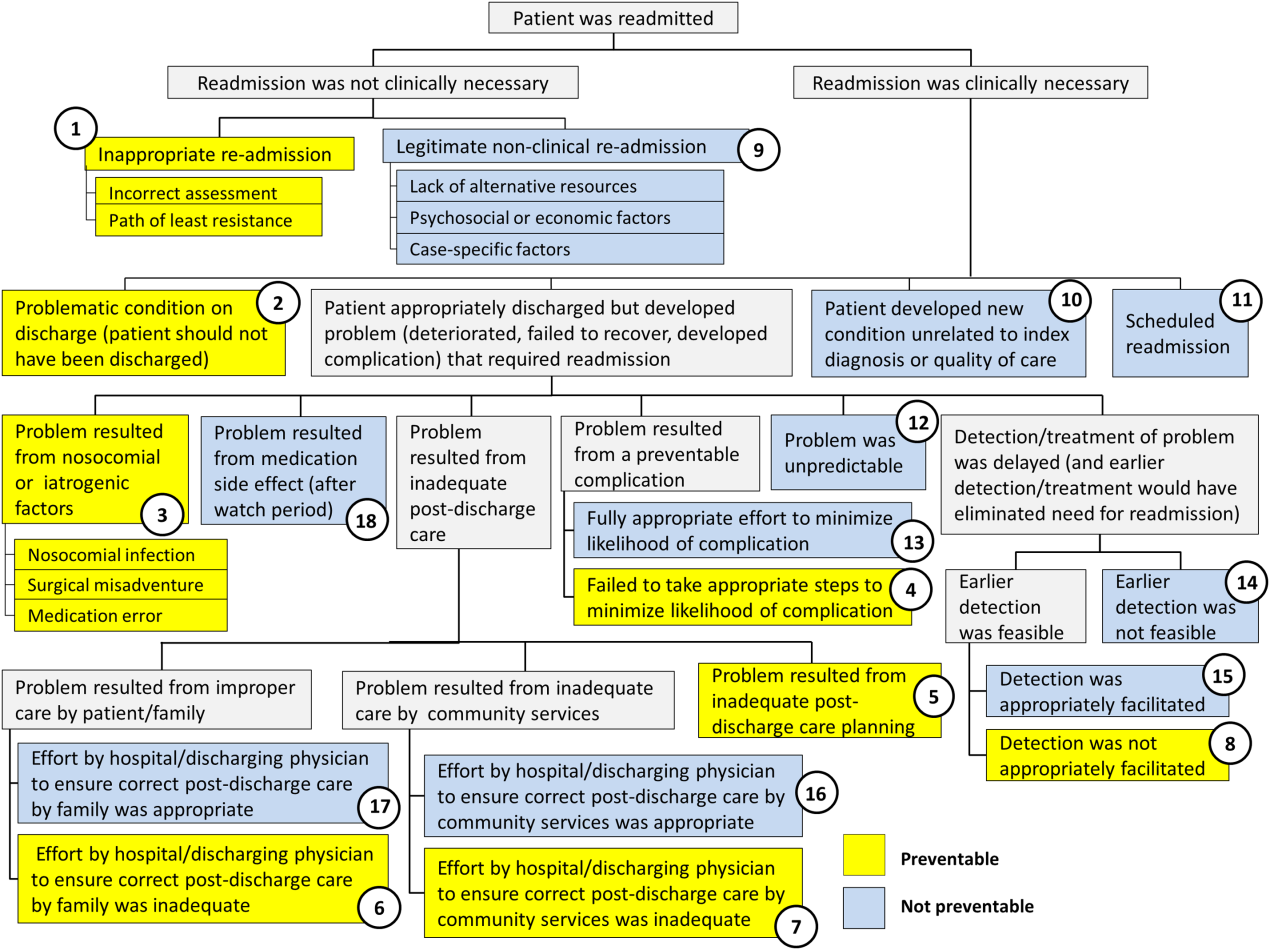
Hereditary Cancer Testing in a Value Based World: The Evolving Standard of Care
Commemorating the 20th anniversary of BRCA genetic testing, we are increasingly conscious of the social, economic, and medico-legal impacts of genetic cancer risk on both personal and public health. An ever-growing number of medical societies and expert panels have now charged clinicians with the duty to evaluate and manage their patients’ cancer risk profiles, with particular attention to those individuals carrying genetic mutations that confer elevated cancer susceptibility, a process commonly known as hereditary cancer risk assessment, or HCRA.
Click here to download the PDF.
This article is written for women’s health care clinicians, and will address the current status of hereditary cancer genetic testing, focusing on the evolution of pan-cancer, multigene panel testing in the context of value-based medicine.
Click on the video below to watch Dr. Frieder discuss Hereditary Cancer Testing.
Hepatitis C May Increase Risk of Parkinson’s Disease
Hepatitis C infection may increase the risk of Parkinson’s disease, according to a nationwide population-based study published online ahead of print December 23, 2015, in Neurology. Researchers analyzed 10 years of data from the Taiwan National Health Insurance Research Database, which included 49,967 patients with viral hepatitis—35,619 with hepatitis B infection, 10,286 with hepatitis C, and 4,062 with both—and 199,868 noninfected controls.
Individuals with hepatitis C infection had a 29% greater incidence of Parkinson’s disease after adjustment for confounders such as sex, age, heart disease, stroke, and head injury. The researchers found no significant associations between hepatitis B or coinfection and Parkinson’s disease risk.
Age was the most common risk factor for Parkinson’s disease across all cohorts, and in the control group, comorbidities such as hyperlipidemia, hypertension, ischemic heart disease, diabetes, and head injury all were associated with a significant increase in the risk of Parkinson’s disease. Among individuals with hepatitis C infection, however, only ischemic heart disease and head injury remained significantly associated with Parkinson’s disease risk.
The possibility of an association between hepatitis C infection and Parkinson’s disease has emerged recently, with evidence showing that the virus is neurotropic and can replicate in the CNS, reported Hsin-Hsi Tsai, MD, a neurologist at the National Taiwan University Hospital in Taipei, and coauthors.
“Parkinsonism is rarely a described feature in patients with hepatitis C virus. However, a recent study has discovered that hepatitis C virus can induce dopaminergic neuron death, suggesting a possible association between hepatitis C virus infection and” Parkinson’s disease, said the authors.
The study also showed that the association between hepatitis C infection and Parkinson’s disease was more significant in individuals younger than 65, who had a 61% greater risk of developing the neurodegenerative disease.
“Some of the risk factors for hepatitis C virus infection, such as illicit drug use and associated behaviors, may be confounding factors in this age group,” said the authors. They pointed out, however, that in Taiwan, use of IV drugs was not known to be a risk factor for infection. Commenting on a possible mechanism for the association between hepatitis C infection and Parkinson’s disease, Dr. Tsai and associates suggested that the hepatitis C virus could be a possible viral candidate for triggering the neuroinflammation that is a characteristic feature of Parkinson’s disease.
“An earlier imaging study that involved using magnetic resonance spectroscopy to investigate the cerebral effect of hepatitis C virus showed that chronic hepatitis C virus infection was associated with elevated choline/creatinine ratios, a biomarker indicating inflammatory and infective conditions, in the basal ganglia and white matter,” they said.
—Bianca Nogrady
Suggested Reading
Tsai HH, Liou HH, Muo CH, et al. Hepatitis C virus infection as a risk factor for Parkinson disease: A nationwide cohort study. Neurology. 2015 Dec 23 [Epub ahead of print].
Hepatitis C infection may increase the risk of Parkinson’s disease, according to a nationwide population-based study published online ahead of print December 23, 2015, in Neurology. Researchers analyzed 10 years of data from the Taiwan National Health Insurance Research Database, which included 49,967 patients with viral hepatitis—35,619 with hepatitis B infection, 10,286 with hepatitis C, and 4,062 with both—and 199,868 noninfected controls.
Individuals with hepatitis C infection had a 29% greater incidence of Parkinson’s disease after adjustment for confounders such as sex, age, heart disease, stroke, and head injury. The researchers found no significant associations between hepatitis B or coinfection and Parkinson’s disease risk.
Age was the most common risk factor for Parkinson’s disease across all cohorts, and in the control group, comorbidities such as hyperlipidemia, hypertension, ischemic heart disease, diabetes, and head injury all were associated with a significant increase in the risk of Parkinson’s disease. Among individuals with hepatitis C infection, however, only ischemic heart disease and head injury remained significantly associated with Parkinson’s disease risk.
The possibility of an association between hepatitis C infection and Parkinson’s disease has emerged recently, with evidence showing that the virus is neurotropic and can replicate in the CNS, reported Hsin-Hsi Tsai, MD, a neurologist at the National Taiwan University Hospital in Taipei, and coauthors.
“Parkinsonism is rarely a described feature in patients with hepatitis C virus. However, a recent study has discovered that hepatitis C virus can induce dopaminergic neuron death, suggesting a possible association between hepatitis C virus infection and” Parkinson’s disease, said the authors.
The study also showed that the association between hepatitis C infection and Parkinson’s disease was more significant in individuals younger than 65, who had a 61% greater risk of developing the neurodegenerative disease.
“Some of the risk factors for hepatitis C virus infection, such as illicit drug use and associated behaviors, may be confounding factors in this age group,” said the authors. They pointed out, however, that in Taiwan, use of IV drugs was not known to be a risk factor for infection. Commenting on a possible mechanism for the association between hepatitis C infection and Parkinson’s disease, Dr. Tsai and associates suggested that the hepatitis C virus could be a possible viral candidate for triggering the neuroinflammation that is a characteristic feature of Parkinson’s disease.
“An earlier imaging study that involved using magnetic resonance spectroscopy to investigate the cerebral effect of hepatitis C virus showed that chronic hepatitis C virus infection was associated with elevated choline/creatinine ratios, a biomarker indicating inflammatory and infective conditions, in the basal ganglia and white matter,” they said.
—Bianca Nogrady
Suggested Reading
Tsai HH, Liou HH, Muo CH, et al. Hepatitis C virus infection as a risk factor for Parkinson disease: A nationwide cohort study. Neurology. 2015 Dec 23 [Epub ahead of print].
Suggested Reading
Tsai HH, Liou HH, Muo CH, et al. Hepatitis C virus infection as a risk factor for Parkinson disease: A nationwide cohort study. Neurology. 2015 Dec 23 [Epub ahead of print].
High Urate Concentration May Protect Men Against Parkinson’s Disease
Men with a high plasma urate concentration have a decreased risk of developing Parkinson’s disease, independent of potential risk factors such as age, smoking, and caffeine intake, according to research published online ahead of print January 13 in Neurology. Plasma urate concentration appears to have no association with risk of Parkinson’s disease among women, however. For men, urate could protect against Parkinson’s disease risk or slow the progression of preclinical Parkinson’s disease, according to the authors.
“Our findings, together with previous observations that urate can be elevated by administration of its precursor inosine, which is generally safe and tolerable, in early Parkinson’s disease, provide strong evidence supporting the design of a randomized trial of urate elevation in patients with early Parkinson’s disease or pre-Parkinson syndrome,” said Xiang Gao, MD, PhD, Director of the Nutritional Epidemiology Laboratory at Pennsylvania State University in University Park.
Dr. Gao and colleagues examined blood samples for more than 90,000 men and women who participated in the Health Professionals Follow-up Study, the Nurses’ Health Study, or the Cancer Prevention Study II Nutrition. The researchers confirmed cases of Parkinson’s disease based on a detailed questionnaire that the treating neurologist or internists completed, or through a movement disorder specialist’s review of medical records. Only patients with definite or probable Parkinson’s disease were included in the analysis. Between one and six controls were selected randomly for each case. The investigators used questionnaires to collect data on potential confounders, including age, smoking status, height, weight, chronic diseases, and consumption of caffeinated coffee and alcohol.
Dr. Gao’s group identified 388 new incident cases of Parkinson’s disease since blood collection and matched them with 1,267 controls. Higher baseline urate concentrations were associated with lower risk of Parkinson’s disease in men, but not in women. The multivariate-adjusted risk ratios of Parkinson’s disease, comparing the highest and lowest quartiles of urate, were 0.63 in men and 1.04 in women. Adjusting the data for cardiovascular factors, including history of cardiovascular disease and diabetes, did not affect the results.
The researchers pooled the results of their study with those of three previous investigations that included 325 patients with Parkinson’s disease. The pooled risk ratios comparing the highest and lowest categories of urate were 0.63 in men and 0.89 in women.
Animal and human studies suggest that urate is a neuroprotective agent, noted the authors. Their own previous research indicates that urate may slow disease progression during the preclinical stage of Parkinson’s disease.
The strengths of the current study include its prospective design, large sample size, and availability of information on covariates that may confound the potential association between serum urate and Parkinson’s disease risk, according to the authors. The study was based on a single measure of plasma urate, however, and did not account for within-person variability in urate levels. In addition, the results may be difficult to generalize because the majority of participants were Caucasian and had high educational attainment and socioeconomic status.
—Erik Greb
Suggested Reading
Gao X, O’Reilly ÉJ, Schwarzschild MA, Ascherio A. Prospective study of plasma urate and risk of Parkinson disease in men and women. Neurology. 2016 Jan 13 [Epub ahead of print].
Men with a high plasma urate concentration have a decreased risk of developing Parkinson’s disease, independent of potential risk factors such as age, smoking, and caffeine intake, according to research published online ahead of print January 13 in Neurology. Plasma urate concentration appears to have no association with risk of Parkinson’s disease among women, however. For men, urate could protect against Parkinson’s disease risk or slow the progression of preclinical Parkinson’s disease, according to the authors.
“Our findings, together with previous observations that urate can be elevated by administration of its precursor inosine, which is generally safe and tolerable, in early Parkinson’s disease, provide strong evidence supporting the design of a randomized trial of urate elevation in patients with early Parkinson’s disease or pre-Parkinson syndrome,” said Xiang Gao, MD, PhD, Director of the Nutritional Epidemiology Laboratory at Pennsylvania State University in University Park.
Dr. Gao and colleagues examined blood samples for more than 90,000 men and women who participated in the Health Professionals Follow-up Study, the Nurses’ Health Study, or the Cancer Prevention Study II Nutrition. The researchers confirmed cases of Parkinson’s disease based on a detailed questionnaire that the treating neurologist or internists completed, or through a movement disorder specialist’s review of medical records. Only patients with definite or probable Parkinson’s disease were included in the analysis. Between one and six controls were selected randomly for each case. The investigators used questionnaires to collect data on potential confounders, including age, smoking status, height, weight, chronic diseases, and consumption of caffeinated coffee and alcohol.
Dr. Gao’s group identified 388 new incident cases of Parkinson’s disease since blood collection and matched them with 1,267 controls. Higher baseline urate concentrations were associated with lower risk of Parkinson’s disease in men, but not in women. The multivariate-adjusted risk ratios of Parkinson’s disease, comparing the highest and lowest quartiles of urate, were 0.63 in men and 1.04 in women. Adjusting the data for cardiovascular factors, including history of cardiovascular disease and diabetes, did not affect the results.
The researchers pooled the results of their study with those of three previous investigations that included 325 patients with Parkinson’s disease. The pooled risk ratios comparing the highest and lowest categories of urate were 0.63 in men and 0.89 in women.
Animal and human studies suggest that urate is a neuroprotective agent, noted the authors. Their own previous research indicates that urate may slow disease progression during the preclinical stage of Parkinson’s disease.
The strengths of the current study include its prospective design, large sample size, and availability of information on covariates that may confound the potential association between serum urate and Parkinson’s disease risk, according to the authors. The study was based on a single measure of plasma urate, however, and did not account for within-person variability in urate levels. In addition, the results may be difficult to generalize because the majority of participants were Caucasian and had high educational attainment and socioeconomic status.
—Erik Greb
Suggested Reading
Gao X, O’Reilly ÉJ, Schwarzschild MA, Ascherio A. Prospective study of plasma urate and risk of Parkinson disease in men and women. Neurology. 2016 Jan 13 [Epub ahead of print].
Suggested Reading
Gao X, O’Reilly ÉJ, Schwarzschild MA, Ascherio A. Prospective study of plasma urate and risk of Parkinson disease in men and women. Neurology. 2016 Jan 13 [Epub ahead of print].
Point/Counterpoint: So you think you can make a vascular surgeon in 5 years?
YES
BY MALACHI G. SHEAHAN III, M.D.
Believe it or not, one thing just about all vascular surgeons will agree upon is the proper way to train. For most of us, the best way to become a surgeon is the way we became a surgeon. Therefore, unless there is some aberration in the readership circulation of Vascular Specialist, I begin this debate facing an uphill battle with most of you.
The question of how to become a vascular surgeon should not be some esoteric matter left to be debated in the late Friday session of some educational symposium. Indeed, I commend the editors for bringing this issue to a more public forum. As much as I enjoy listening to the twenty-seventh abstract redefining the risks of type 2 endoleaks at our national meeting, the matter of how to create a vascular surgeon will define our profession for years to come.

Data from the Association of American Medical Colleges shows that there is now one vascular surgeon for every 100,000 people in the U.S. That is one vascular surgeon for every 350 dialysis patients or one for every 2,600 individuals with peripheral artery disease. We are already in short supply and 40% of us are over 55 years old. Applicant numbers to traditional 5 + 2 programs have plateaued over the past 10 years, suggesting that expanding fellowship positions is not the answer. Who then will fill this gap? As Dr. Ian Malcolm warned us in “Jurassic Park,” life will find a way.
If vascular surgeons don’t act to address this need, I know two candidates who are interested. Both interventional cardiology (10% over 55) and interventional radiology (12% over 55) have younger workforces that are growing at a superior rate. Between 2008 and 2013, the largest increases in training positions offered among all medical specialties were seen in interventional cardiology and interventional radiology.
Luckily our profession has not been caught completely off guard. Integrated vascular residency positions were first offered in 2007. Based on the quality and quantity of applicants, the number of institutions offering the integrated 0 + 5 vascular residency has grown from 17 in 2009 to 51 in 2015.
As practiced today, vascular surgery bears little similarity to even a decade ago. Limb salvage, aortic interventions, vein care, and access management all require highly specific training not typically offered in a general surgery residency. Our new board certification emphasizes the ability to supervise and interpret radiologic tests. Vascular surgery training is no longer a honing of general surgical skills. We must teach and develop completely new areas of expertise in our trainees. I propose the longer we have to focus on these specific abilities, the better our product will be.
A classic argument against traditional 5 + 2 training is why have a postgraduate-year 4 or 5 performing a pancreaticoduodenectomy (Whipple procedure) when they will never perform one in practice? This, however, is a flawed point, as open abdominal cases contain many aspects that translate well to vascular surgery. I believe the enemy is not Allen O. Whipple, but rather Harvey J. Laparoscope.1 Much like the declining numbers of open aortic cases, laparoscopic surgery has replaced much of the open surgical volume in general surgery training programs. How well these skills translate to vascular is unknown, but at face value, the cross-applicability doesn’t seem to pass muster. So while no case is wasted, perhaps our trainees’ time could be spent more efficiently.
Integrated 0 + 5 programs give total control of the rotations and curriculum to the vascular program director. This allows a truly cohesive approach to developing vascular skills and knowledge over a five year period interspersed with core general surgery skills and principals. Surgery rotations such as trauma, ICU, and cardiothoracic surgery that provide the best educational content to our trainees can now be handpicked, while avoiding lower-yield content like advanced laparoscopy and breast. Quality control is now in the hands of a vascular surgeon.
After all, Erica, if the sanctity of the five year general surgery residency must be preserved, why do you run one of the world’s only 4 + 2 programs? Clearly you believe we can condense our trainees’ education without losing quality.
Using the available metrics and data points it would be difficult to prove superiority of the 0 + 5 pathway to the 5 + 2. Therefore, I will borrow a technique from my clinical trials’ friends and claim noninferiority. Follow my logic here and I promise not to include a convoluted endpoint like strokes, deaths, and non-Q wave MIs induced in training directors.
Our best test for measuring cognitive development during vascular training remains the Vascular Surgery In-Training Examination (VSITE). Looking at the 2015 results, the L5 integrated residents received a better average standard score (565 vs. 542) than their L2 fellowship counterparts. In fact, the L5 integrated residents had a superior score on seven of the nine vascular sub-tests.
For technical skill acquisition, we can look at both Accreditation Council for Graduate Medical Education (ACGME) case logs and the Fundamentals of Vascular Surgery (FVS) exam. The largest study of vascular surgical experience was published by P. Batista and colleagues from Thomas Jefferson University, Philadelphia, in 2015. They found integrated residents had performed 12% more vascular procedures than traditional 5 + 2 residents (851 vs. 758) despite 2 years less training time. Our own FVS exam was conducted on more than 280 vascular trainees representing all levels from both paradigms. On this validated exam of technical skill, 94% of PGY 5 integrated residents received a passing score, compared with 92% of PGY 7 fellows. Interestingly, means scores were significantly higher for PGY 5 integrated residents vs. first year fellows (P less than .005) despite the former group receiving one year less training.
Perhaps the final barrier to the success of the integrated pathway is our own preconceived notions. Doubters often cite some unmeasurable like “maturity” as a deterrent. Do we question the maturity of the general surgeon with five years of residency? How about the pediatrician or general practitioner with fewer? Isn’t maturity a key aspect of any physician?
I believe it is time to put our doubts to rest and embrace this new paradigm. We now have ample evidence that under the supervision of a vascular program director, a competent surgeon can be produced in five years.
These young people may not have followed our exact path, but they are our future.
Dr. Sheahan is an associate professor and the program director of the Vascular Surgery Fellowship at the Health Sciences Center, School of Medicine, Louisiana State University, New Orleans.
References
1. Possibly not the actual name of the inventor of the laparoscope, but I’m working on a deadline here. [Editor’s Note; A summary of the complex history of the development of laparascopy can be found here: J Laparoendosc Adv Surg Tech A. 1997 Dec;7:369-73.]
NO
BY ERICA L. MITCHELL, M.D.
Dr. Sheahan has already convinced himself that he has won this debate because he honestly believes that he has persuaded the Vascular Specialist readers of the merits and benefits of the integrated vascular surgery training paradigm. While I respect Mal for supporting a 5 year training paradigm, I am prepared to argue for a potentially even shorter surgical training model than that set by the integrated 0 + 5 (and in some cases 0 + 6 or 0 + 7) time-based archetype.
I propose, and implore, that vascular surgery educators adopt a competency-based educational (CBE) framework in which trainees complete their training when competence has been met and demonstrated through objective performance benchmarks, whether that is after 7 years, 5 years, or even 4 or fewer years of vascular surgical training.

The goal of all graduate medical education is to ensure that the graduating physician is competent to practice independently in his or her chosen field of medicine. For nearly a century, surgical training has been based on the apprenticeship model as articulated by Halsted. Residents work with faculty members on clinical rotations, gaining experience while providing service to patients. The rotations have formal educational goals and objectives, but resident experience relies heavily on the patients who present to the clinical service. The time in training is set and for vascular surgery, the required time in training is either 5 years via the integrated 0 + 5 track or 6-7 years via the early-specialization or traditional training tracks. Board eligibility requires completion of this training time, documentation of operative case logs, and a “ready to practice independently” attestation from the vascular surgery program director. It is unusual for surgical residents not to complete their program or to remain in their program for additional training, despite recent evidence suggesting that current surgical training may be resulting in suboptimal experiences.1
As a consequence of time-based residency training, residents completing vascular surgical training vary in competence, and currently there is no mechanism to solve this situation. While, I am sure you will agree, none of us think we are graduating incompetent vascular surgeons, we do, however, come across residents or fellows whom we believe are not yet ready for autonomous practice at completion of their training, regardless of their training paradigm. With time determining completion of training these residents, unfortunately, at the end of their designated training period the training is done, regardless of demonstrated skills or knowledge. While this is concerning, we also see the counter to this unprepared resident.
We have all witnessed exceptional trainees in our programs. These trainees, regardless of their training program, sail through their surgical residencies. They meet all of the defined educational milestones, finish all of the program requirements, and demonstrate ability to care for patients unsupervised way before their set graduation date. For both these types of residents, educational landmarks, as defined by the ACGME, are of secondary importance and since only time determines completion of training, the curriculum becomes irrelevant. The question then becomes: why work to define a body of vascular surgical knowledge or a required set of technical and non-technical skills if competence is defined as time in training? Mal, surely you don’t support graduating a trainee simply because they have spent five years in training? Hopefully you would want to know that this graduating trainee is ready and competent to safely and autonomously practice the full scope of vascular surgical practice.
Competency-based education is gaining momentum around the world as medical educators, physicians, and policy makers try to ensure that our graduating specialists are acquiring and demonstrating the competencies needed to practice in today’s rapidly evolving heath care systems. It is becoming the standard in training of physicians because of the perception that it provides more transparent standards and increased public accountability. Competency-based training is learner centric, outcomes based, and differentiated. A key distinguishing feature of CBE is that residents can progress through the educational process at different rates: the most capable and talented individuals should be able to make career transitions earlier, thus allowing them to enter the workforce at an accelerated rate. Others, requiring more time, would still attain the appropriate level of knowledge, skills, and attitudes needed to enter independent practice, and leave the program only when competent.
With the emerging reality of numerous nonsurgical specialties encroaching upon various traditional domains of vascular surgery, it is essential that our specialty lead the field in vascular education so as to maintain our stronghold on these areas of expertise. Competency-based training is a logical evolutionary step from our traditional years-in-place based system. Such training should improve, or at least verify, the quality of educational outcomes for our vascular trainees and our varying training programs. This model of education will allow comparisons among training programs, differing training tracks and even differing specialty practices. I urge the vascular surgery community to discuss this concept and ultimately to implement it.
Dr. Mitchell is a professor of surgery, program director for vascular surgery, and vice-chair of Quality, Department of Surgery, Division of Vascular Surgery, Oregon Health and Science University, Portland.
References
YES
BY MALACHI G. SHEAHAN III, M.D.
Believe it or not, one thing just about all vascular surgeons will agree upon is the proper way to train. For most of us, the best way to become a surgeon is the way we became a surgeon. Therefore, unless there is some aberration in the readership circulation of Vascular Specialist, I begin this debate facing an uphill battle with most of you.
The question of how to become a vascular surgeon should not be some esoteric matter left to be debated in the late Friday session of some educational symposium. Indeed, I commend the editors for bringing this issue to a more public forum. As much as I enjoy listening to the twenty-seventh abstract redefining the risks of type 2 endoleaks at our national meeting, the matter of how to create a vascular surgeon will define our profession for years to come.
Data from the Association of American Medical Colleges shows that there is now one vascular surgeon for every 100,000 people in the U.S. That is one vascular surgeon for every 350 dialysis patients or one for every 2,600 individuals with peripheral artery disease. We are already in short supply and 40% of us are over 55 years old. Applicant numbers to traditional 5 + 2 programs have plateaued over the past 10 years, suggesting that expanding fellowship positions is not the answer. Who then will fill this gap? As Dr. Ian Malcolm warned us in “Jurassic Park,” life will find a way.
If vascular surgeons don’t act to address this need, I know two candidates who are interested. Both interventional cardiology (10% over 55) and interventional radiology (12% over 55) have younger workforces that are growing at a superior rate. Between 2008 and 2013, the largest increases in training positions offered among all medical specialties were seen in interventional cardiology and interventional radiology.
Luckily our profession has not been caught completely off guard. Integrated vascular residency positions were first offered in 2007. Based on the quality and quantity of applicants, the number of institutions offering the integrated 0 + 5 vascular residency has grown from 17 in 2009 to 51 in 2015.
As practiced today, vascular surgery bears little similarity to even a decade ago. Limb salvage, aortic interventions, vein care, and access management all require highly specific training not typically offered in a general surgery residency. Our new board certification emphasizes the ability to supervise and interpret radiologic tests. Vascular surgery training is no longer a honing of general surgical skills. We must teach and develop completely new areas of expertise in our trainees. I propose the longer we have to focus on these specific abilities, the better our product will be.
A classic argument against traditional 5 + 2 training is why have a postgraduate-year 4 or 5 performing a pancreaticoduodenectomy (Whipple procedure) when they will never perform one in practice? This, however, is a flawed point, as open abdominal cases contain many aspects that translate well to vascular surgery. I believe the enemy is not Allen O. Whipple, but rather Harvey J. Laparoscope.1 Much like the declining numbers of open aortic cases, laparoscopic surgery has replaced much of the open surgical volume in general surgery training programs. How well these skills translate to vascular is unknown, but at face value, the cross-applicability doesn’t seem to pass muster. So while no case is wasted, perhaps our trainees’ time could be spent more efficiently.
Integrated 0 + 5 programs give total control of the rotations and curriculum to the vascular program director. This allows a truly cohesive approach to developing vascular skills and knowledge over a five year period interspersed with core general surgery skills and principals. Surgery rotations such as trauma, ICU, and cardiothoracic surgery that provide the best educational content to our trainees can now be handpicked, while avoiding lower-yield content like advanced laparoscopy and breast. Quality control is now in the hands of a vascular surgeon.
After all, Erica, if the sanctity of the five year general surgery residency must be preserved, why do you run one of the world’s only 4 + 2 programs? Clearly you believe we can condense our trainees’ education without losing quality.
Using the available metrics and data points it would be difficult to prove superiority of the 0 + 5 pathway to the 5 + 2. Therefore, I will borrow a technique from my clinical trials’ friends and claim noninferiority. Follow my logic here and I promise not to include a convoluted endpoint like strokes, deaths, and non-Q wave MIs induced in training directors.
Our best test for measuring cognitive development during vascular training remains the Vascular Surgery In-Training Examination (VSITE). Looking at the 2015 results, the L5 integrated residents received a better average standard score (565 vs. 542) than their L2 fellowship counterparts. In fact, the L5 integrated residents had a superior score on seven of the nine vascular sub-tests.
For technical skill acquisition, we can look at both Accreditation Council for Graduate Medical Education (ACGME) case logs and the Fundamentals of Vascular Surgery (FVS) exam. The largest study of vascular surgical experience was published by P. Batista and colleagues from Thomas Jefferson University, Philadelphia, in 2015. They found integrated residents had performed 12% more vascular procedures than traditional 5 + 2 residents (851 vs. 758) despite 2 years less training time. Our own FVS exam was conducted on more than 280 vascular trainees representing all levels from both paradigms. On this validated exam of technical skill, 94% of PGY 5 integrated residents received a passing score, compared with 92% of PGY 7 fellows. Interestingly, means scores were significantly higher for PGY 5 integrated residents vs. first year fellows (P less than .005) despite the former group receiving one year less training.
Perhaps the final barrier to the success of the integrated pathway is our own preconceived notions. Doubters often cite some unmeasurable like “maturity” as a deterrent. Do we question the maturity of the general surgeon with five years of residency? How about the pediatrician or general practitioner with fewer? Isn’t maturity a key aspect of any physician?
I believe it is time to put our doubts to rest and embrace this new paradigm. We now have ample evidence that under the supervision of a vascular program director, a competent surgeon can be produced in five years.
These young people may not have followed our exact path, but they are our future.
Dr. Sheahan is an associate professor and the program director of the Vascular Surgery Fellowship at the Health Sciences Center, School of Medicine, Louisiana State University, New Orleans.
References
1. Possibly not the actual name of the inventor of the laparoscope, but I’m working on a deadline here. [Editor’s Note; A summary of the complex history of the development of laparascopy can be found here: J Laparoendosc Adv Surg Tech A. 1997 Dec;7:369-73.]
NO
BY ERICA L. MITCHELL, M.D.
Dr. Sheahan has already convinced himself that he has won this debate because he honestly believes that he has persuaded the Vascular Specialist readers of the merits and benefits of the integrated vascular surgery training paradigm. While I respect Mal for supporting a 5 year training paradigm, I am prepared to argue for a potentially even shorter surgical training model than that set by the integrated 0 + 5 (and in some cases 0 + 6 or 0 + 7) time-based archetype.
I propose, and implore, that vascular surgery educators adopt a competency-based educational (CBE) framework in which trainees complete their training when competence has been met and demonstrated through objective performance benchmarks, whether that is after 7 years, 5 years, or even 4 or fewer years of vascular surgical training.
The goal of all graduate medical education is to ensure that the graduating physician is competent to practice independently in his or her chosen field of medicine. For nearly a century, surgical training has been based on the apprenticeship model as articulated by Halsted. Residents work with faculty members on clinical rotations, gaining experience while providing service to patients. The rotations have formal educational goals and objectives, but resident experience relies heavily on the patients who present to the clinical service. The time in training is set and for vascular surgery, the required time in training is either 5 years via the integrated 0 + 5 track or 6-7 years via the early-specialization or traditional training tracks. Board eligibility requires completion of this training time, documentation of operative case logs, and a “ready to practice independently” attestation from the vascular surgery program director. It is unusual for surgical residents not to complete their program or to remain in their program for additional training, despite recent evidence suggesting that current surgical training may be resulting in suboptimal experiences.1
As a consequence of time-based residency training, residents completing vascular surgical training vary in competence, and currently there is no mechanism to solve this situation. While, I am sure you will agree, none of us think we are graduating incompetent vascular surgeons, we do, however, come across residents or fellows whom we believe are not yet ready for autonomous practice at completion of their training, regardless of their training paradigm. With time determining completion of training these residents, unfortunately, at the end of their designated training period the training is done, regardless of demonstrated skills or knowledge. While this is concerning, we also see the counter to this unprepared resident.
We have all witnessed exceptional trainees in our programs. These trainees, regardless of their training program, sail through their surgical residencies. They meet all of the defined educational milestones, finish all of the program requirements, and demonstrate ability to care for patients unsupervised way before their set graduation date. For both these types of residents, educational landmarks, as defined by the ACGME, are of secondary importance and since only time determines completion of training, the curriculum becomes irrelevant. The question then becomes: why work to define a body of vascular surgical knowledge or a required set of technical and non-technical skills if competence is defined as time in training? Mal, surely you don’t support graduating a trainee simply because they have spent five years in training? Hopefully you would want to know that this graduating trainee is ready and competent to safely and autonomously practice the full scope of vascular surgical practice.
Competency-based education is gaining momentum around the world as medical educators, physicians, and policy makers try to ensure that our graduating specialists are acquiring and demonstrating the competencies needed to practice in today’s rapidly evolving heath care systems. It is becoming the standard in training of physicians because of the perception that it provides more transparent standards and increased public accountability. Competency-based training is learner centric, outcomes based, and differentiated. A key distinguishing feature of CBE is that residents can progress through the educational process at different rates: the most capable and talented individuals should be able to make career transitions earlier, thus allowing them to enter the workforce at an accelerated rate. Others, requiring more time, would still attain the appropriate level of knowledge, skills, and attitudes needed to enter independent practice, and leave the program only when competent.
With the emerging reality of numerous nonsurgical specialties encroaching upon various traditional domains of vascular surgery, it is essential that our specialty lead the field in vascular education so as to maintain our stronghold on these areas of expertise. Competency-based training is a logical evolutionary step from our traditional years-in-place based system. Such training should improve, or at least verify, the quality of educational outcomes for our vascular trainees and our varying training programs. This model of education will allow comparisons among training programs, differing training tracks and even differing specialty practices. I urge the vascular surgery community to discuss this concept and ultimately to implement it.
Dr. Mitchell is a professor of surgery, program director for vascular surgery, and vice-chair of Quality, Department of Surgery, Division of Vascular Surgery, Oregon Health and Science University, Portland.
References

Appendicitis, antibiotics, and surgery: An evolving trilogy
Appendicitis is the most common surgical emergency in children. It is seen at all ages; however, it is less common in infants and toddlers younger than 4 years of age and peaks at an incidence of 25/100,000 in children 12- to 18-years-old. Fortunately, appendicitis is rarely fatal but can be associated with significant morbidity, especially in young children in whom the diagnosis is often delayed and perforation is more common. Reducing morbidity requires early diagnosis and optimizing management such that perforation and associated peritonitis are prevented.
The classical signs and symptoms of appendicitis are periumbilical pain migrating to the right lower quadrant, nausea, and low-grade fever. Presentation may vary if the location of the appendix is atypical, but primarily is age associated. In young children, abdominal distension, hip pain with or without limp, and fever are commonplace. In older children, right lower quadrant abdominal pain that intensifies with coughing or movement is frequent. Localized tenderness also appears to be age related; right lower quadrant tenderness and rebound are more often found in older children and adolescents, whereas younger children have more diffuse signs.

When I started my career, abdominal x-rays would be performed in search of a fecalith. However, such studies were of low sensitivity, and clinical acumen had a primary role in the decision to take the child to the operating room. In the current era, ultrasound and CT scan provide reasonable sensitivity and specificity. Ultrasound criteria include a diameter greater than 6 mm, concentric rings (target sign), an appendicolith, high echogenicity, obstruction of the lumen, and fluid surrounding the appendix.
As the pathogenesis of appendicitis represents occlusion of the appendiceal lumen, followed by overgrowth or translocation of bowel flora resulting in inflammation of the wall of the appendix, anaerobes and gram-negative gut flora represent the most important pathogens. In advanced cases, necrosis and gangrene of the appendix result with progression to rupture and peritonitis.
The traditional management was early surgical intervention to reduce the risk of perforation and peritonitis with acceptance of high rates of negative abdominal explorations as an acceptable consequence. Today, the approach to management of appendicitis is undergoing reevaluation. Early antimicrobial treatment has become routine in the management of nonperforated, perforated, or abscessed appendicitis. However, the question being asked is, “Do all children with uncomplicated appendicitis need appendectomy, or is antibiotic management sufficient?”
P. Salminen et al. reported on the results of a randomized clinical trial in 530 patients aged 18-60 years, comparing antimicrobial treatment alone with early appendectomy. Among 273 patients in the surgical group, all but 1 underwent successful appendectomy, resulting in a success rate of 99.6% (95% CI, 98.0%-100.0%). In the antibiotic group, 186 of 256 patients (70%) treated with antibiotics did not require surgery; 70 (27%) underwent appendectomy within 1 year of initial presentation for appendicitis (JAMA. 2015 Jun 16;313[23]:2340-8). There were no intraabdominal abscesses or other major complications associated with delayed appendectomy in patients randomized to antibiotic treatment. The authors concluded that among patients with CT-proven, uncomplicated appendicitis, antibiotic treatment did not meet the prespecified criterion for noninferiority, compared with appendectomy. However, most patients randomized to antibiotics for uncomplicated appendicitis did not require appendectomy during the 1-year follow-up period.
J.A. Horst et al. reviewed published reports of medical management of appendicitis in children (Ann Emerg Med. 2015 Aug;66[2]:119-22). They concluded that medical management of uncomplicated appendicitis in a select low-risk pediatric population is safe and does not result in significant morbidity. The arguments against a nonoperative approach include the risk of recurrent appendicitis, including the anxiety associated with any recurrences of abdominal pain, the risk of antibiotic-related complications, the potential for increased duration of hospitalization, and the relatively low morbidity of appendectomy in children. Factors associated with failed antibiotic management included fecaliths, fluid collections, or an appendiceal diameter greater than 1.1 cm on CT scan. The investigators concluded such children are poor candidates for nonsurgical management.
The bottom line is that antimicrobial therapy, in the absence of surgery, can be effective. Certainly in remote settings where surgery is not readily available, antimicrobial therapy with fluid and electrolyte management and close observation can be used in children with uncomplicated appendicitis with few failures and relatively few children requiring subsequent appendectomy. In more complicated cases with evidence of fecalith, or appendiceal abscess or phlegm, initial antimicrobial therapy reduces the acute inflammation and urgent need for surgery, but persistent inflammation of the appendix is often observed and appendectomy, either acutely or after improvement following antimicrobial therapy, appears indicated. Many different antimicrobial regimens have proven effective; ceftriaxone and metronidazole are associated with low rates of complications, offer an opportunity for once-daily therapy, and are cost effective, compared with other once-daily regimens.
Dr. Pelton is chief of pediatric infectious disease and coordinator of the maternal-child HIV program at Boston Medical Center.
Appendicitis is the most common surgical emergency in children. It is seen at all ages; however, it is less common in infants and toddlers younger than 4 years of age and peaks at an incidence of 25/100,000 in children 12- to 18-years-old. Fortunately, appendicitis is rarely fatal but can be associated with significant morbidity, especially in young children in whom the diagnosis is often delayed and perforation is more common. Reducing morbidity requires early diagnosis and optimizing management such that perforation and associated peritonitis are prevented.
The classical signs and symptoms of appendicitis are periumbilical pain migrating to the right lower quadrant, nausea, and low-grade fever. Presentation may vary if the location of the appendix is atypical, but primarily is age associated. In young children, abdominal distension, hip pain with or without limp, and fever are commonplace. In older children, right lower quadrant abdominal pain that intensifies with coughing or movement is frequent. Localized tenderness also appears to be age related; right lower quadrant tenderness and rebound are more often found in older children and adolescents, whereas younger children have more diffuse signs.
When I started my career, abdominal x-rays would be performed in search of a fecalith. However, such studies were of low sensitivity, and clinical acumen had a primary role in the decision to take the child to the operating room. In the current era, ultrasound and CT scan provide reasonable sensitivity and specificity. Ultrasound criteria include a diameter greater than 6 mm, concentric rings (target sign), an appendicolith, high echogenicity, obstruction of the lumen, and fluid surrounding the appendix.
As the pathogenesis of appendicitis represents occlusion of the appendiceal lumen, followed by overgrowth or translocation of bowel flora resulting in inflammation of the wall of the appendix, anaerobes and gram-negative gut flora represent the most important pathogens. In advanced cases, necrosis and gangrene of the appendix result with progression to rupture and peritonitis.
The traditional management was early surgical intervention to reduce the risk of perforation and peritonitis with acceptance of high rates of negative abdominal explorations as an acceptable consequence. Today, the approach to management of appendicitis is undergoing reevaluation. Early antimicrobial treatment has become routine in the management of nonperforated, perforated, or abscessed appendicitis. However, the question being asked is, “Do all children with uncomplicated appendicitis need appendectomy, or is antibiotic management sufficient?”
P. Salminen et al. reported on the results of a randomized clinical trial in 530 patients aged 18-60 years, comparing antimicrobial treatment alone with early appendectomy. Among 273 patients in the surgical group, all but 1 underwent successful appendectomy, resulting in a success rate of 99.6% (95% CI, 98.0%-100.0%). In the antibiotic group, 186 of 256 patients (70%) treated with antibiotics did not require surgery; 70 (27%) underwent appendectomy within 1 year of initial presentation for appendicitis (JAMA. 2015 Jun 16;313[23]:2340-8). There were no intraabdominal abscesses or other major complications associated with delayed appendectomy in patients randomized to antibiotic treatment. The authors concluded that among patients with CT-proven, uncomplicated appendicitis, antibiotic treatment did not meet the prespecified criterion for noninferiority, compared with appendectomy. However, most patients randomized to antibiotics for uncomplicated appendicitis did not require appendectomy during the 1-year follow-up period.
J.A. Horst et al. reviewed published reports of medical management of appendicitis in children (Ann Emerg Med. 2015 Aug;66[2]:119-22). They concluded that medical management of uncomplicated appendicitis in a select low-risk pediatric population is safe and does not result in significant morbidity. The arguments against a nonoperative approach include the risk of recurrent appendicitis, including the anxiety associated with any recurrences of abdominal pain, the risk of antibiotic-related complications, the potential for increased duration of hospitalization, and the relatively low morbidity of appendectomy in children. Factors associated with failed antibiotic management included fecaliths, fluid collections, or an appendiceal diameter greater than 1.1 cm on CT scan. The investigators concluded such children are poor candidates for nonsurgical management.
The bottom line is that antimicrobial therapy, in the absence of surgery, can be effective. Certainly in remote settings where surgery is not readily available, antimicrobial therapy with fluid and electrolyte management and close observation can be used in children with uncomplicated appendicitis with few failures and relatively few children requiring subsequent appendectomy. In more complicated cases with evidence of fecalith, or appendiceal abscess or phlegm, initial antimicrobial therapy reduces the acute inflammation and urgent need for surgery, but persistent inflammation of the appendix is often observed and appendectomy, either acutely or after improvement following antimicrobial therapy, appears indicated. Many different antimicrobial regimens have proven effective; ceftriaxone and metronidazole are associated with low rates of complications, offer an opportunity for once-daily therapy, and are cost effective, compared with other once-daily regimens.
Dr. Pelton is chief of pediatric infectious disease and coordinator of the maternal-child HIV program at Boston Medical Center.

Make the Diagnosis - February 2016
Diagnosis: Pyoderma gangrenosum
Pyoderma gangrenosum (PG) is an uncommon, noninfectious neutrophilic dermatosis that results in chronic ulcerative lesions. This disease process favors adult women and can be associated with systemic diseases in the majority of cases. The most common underlying systemic ailments include inflammatory bowel disease, arthritis, infection, and hematologic malignancy; it can also be drug induced.
Typically, the lesions begin as an erythematous pustule or nodule on an extremity. As was the case with our patient, a history of a "spider bite" or other arthropod assault may be elicited in the history as patients try to attribute a cause to the development of the initial ulceration. The pustule then develops into an ulcer with a characteristic necrotic, violaceous undermined border with a purulent base. Also, this disease process is associated with pathergy, in which minor trauma can induce additional lesions at remote sites.
There are four well-known types of pyoderma gangrenosum including the classic ulcerative lesions, pustular, bullous, and superficial granulomatous type, also known as vegetative PG. The pustular type may be seen more frequently in patients with inflammatory bowel disease, the bullous type may predominate in hematologic disorders, and the superficial granulomatous type is known to occur following surgery or other trauma.
The pathology of lesions can be nonspecific. However, in untreated lesions, widespread infiltration of neutrophils can be demonstrated at the base of the ulcers with accompanying necrosis at the periphery of lesions.
Dr. Bilu Martin is in private practice at Premier Dermatology, MD, in Aventura, Fla. More diagnostic cases are available at edermatologynews.com. To submit your case for possible publication, send an email to dermnews@frontlinemedcom.com.

A 42-year-old woman with a 10-year history of Crohn's disease, treated with weekly subcutaneous injections of adalimumab, and hypertension presented with ulcerations on the lower extremities. She stated that the ulcerations began after she had been camping and reported being bitten by several ants during the trip, approximately 3 months earlier.