User login
Generic imatinib launched with savings program

Photo by Rhoda Baer
Sun Pharma has announced the US launch of imatinib mesylate tablets, which are a generic version of Novartis’s Gleevec, for indications approved by the US Food and Drug Administration (FDA).
As part of this launch, Sun Pharma has rolled out a savings card program. The goal is to provide greater access to imatinib mesylate tablets for patients who have commercial insurance, but their out-of-pocket cost may exceed an affordable amount.
Sun Pharma’s Imatinib Mesylate Savings Card will reduce patient’s co-payment to $10. The card will also offer patients an additional savings benefit of up to $700 for a 30-day fill to offset any additional out-of-pocket cost should they be required to meet their deductible or co-insurance.
Participating pharmacies across the US can use the patient’s card as part of this program.
Eligible patients can participate in Sun Pharma’s Imatinib Mesylate Savings Card program by registering at www.imatinibrx.com or by requesting a savings card from their oncologist. Sun Pharma will be supplying its Imatinib Mesylate Savings Cards to more than 4500 oncologists.
Sun Pharma has established a Hub service so patients can call and speak with a trained healthcare professional about imatinib mesylate. The number is 1-844-502-5950.
In addition, qualifying patients can receive Sun Pharma’s imatinib mesylate at no cost. Based on qualifications for applying and including a doctor’s prescription, the Hub service will determine if a patient is qualified to receive imatinib mesylate for free. Upon acceptance, the prescription will be processed and delivered to the qualifying patient at no cost.
Sun Pharma’s imatinib mesylate was approved by the FDA in December 2015 and was granted 180 days of marketing exclusivity from the time of its launch. The drug is available in 100 mg and 400 mg tablets.
It is approved to treat:
- Newly diagnosed adult and pediatric patients with Philadelphia-chromosome-positive chronic myeloid leukemia (Ph+ CML) in chronic phase
- Patients with Ph+ CML in blast crisis, accelerated phase, or in chronic phase after failure of interferon-alpha therapy
- Adults with relapsed or refractory Ph+ acute lymphoblastic leukemia
- Adults with myelodysplastic/myeloproliferative diseases associated with PDGFR gene re-arrangements
- Adults with aggressive systemic mastocytosis without the D816V c-Kit mutation or with c-Kit mutational status unknown
- Adults with hypereosinophilic syndrome and/or chronic eosinophilic leukemia, including those who have the FIP1L1-PDGFRα fusion kinase
- Adult patients with unresectable, recurrent, and/or metastatic dermatofibrosarcoma protuberans.
Sun Pharma’s imatinib mesylate is not approved to treat patients with KIT (CD117)-positive unresectable and/or metastatic malignant gastrointestinal stromal tumors. ![]()
Drug may improve outcomes of VOD with MOF after HSCT
![]()
Photo by Chad McNeeley
Results of a phase 3 trial suggest defibrotide may improve survival in patients who develop hepatic veno-occlusive disease (VOD) and multi-organ failure (MOF) after hematopoietic stem cell transplant (HSCT).
The patients in this trial had a significant improvement in complete response (CR) rate and survival at day 100 after HSCT, when compared with historical controls.
The researchers said defibrotide was generally well-tolerated, and toxicity was manageable.
However, nearly all defibrotide-treated patients had at least 1 adverse event (AE), as did all historical controls. And a majority of patients in both groups had a fatal AE.
Paul G. Richardson, MD, of the Dana-Farber Cancer Institute in Boston, Massachusetts, and his colleagues reported these results in Blood. The trial was sponsored by Jazz Pharmaceuticals, makers of defibrotide.
“Based on the results of this pivotal phase 3 study, we believe defibrotide provides a promising treatment option for patients with this urgent unmet need,” Dr Richardson said.
“Although HSCT has improved substantially over the last decade, hepatic [VOD] with MOF remains a very real and life-threatening complication post-HSCT, and for which there are no currently approved therapies."
Dr Richardson and his colleagues investigated the safety and efficacy of defibrotide in 102 adult and pediatric HSCT patients with established hepatic VOD with MOF.
The patients received defibrotide intravenously at 25 mg/kg/day for a minimum of 21 days. Treatment was scheduled to continue beyond 21 days until the resolution of VOD or the patient’s discharge from the hospital.
The researchers compared the 102 patients who received defibrotide with 32 historical controls who were treated at the same institutions. The controls were identified via a review of medical charts of HSCT patients by an independent medical review committee, which was blinded to outcomes.
Baseline characteristics
Baseline characteristics between the groups were largely well balanced. This includes underlying disease, graft source, conditioning regimen, myeloablative regimen, and VOD and MOF parameters.
However, 15% of defibrotide-treated patients received tacrolimus plus sirolimus as graft-versus-host disease prophylaxis, compared with none of the historical controls. Most patients discontinued this regimen upon diagnosis of VOD.
All patients had hyperbilirubinemia. Ascites, weight gain, and hepatomegaly were present in 72% of patients in the defibrotide group and 59% of historical controls.
Renal dysfunction was present in 78% of patients in the defibrotide group (20% dialysis-dependent) and 75% of historical controls (6% dialysis-dependent). Pulmonary dysfunction was present in 85% (26% ventilator-dependent) and 97% (19% ventilator-dependent), respectively.
Sixty-four percent of patients in the defibrotide group and 72% of historical controls had both renal and pulmonary dysfunction.
Response and survival
The primary endpoint was survival at day 100 post-HSCT, which was 38.2% in the defibrotide group and 25% in the historical control group. The estimated between-group difference, using a propensity-adjusted analysis, was 23% (P=0.0109).
The CR rate was 25.5% in the defibrotide group and 12.5% in the historical control group. The estimated difference, adjusted for propensity score, was 19% (P=0.0160).
The median time to CR was 34.5 days in the defibrotide group and 39.5 days in the control group. CR was durable for 22 of 26 patients in the defibrotide group, who still had a CR at last observation. Four patients in the defibrotide group had CR end dates before day 180. All 4 patients died of sepsis or leukemia.
In the historical control group, 1 patient had a durable CR (162 days), 2 patients had a limited CR duration (9 and 10 days, respectively), and 1 patient could not be assessed.
Safety
The median duration of defibrotide treatment was 21.5 days. Eleven patients discontinued treatment prematurely due to possible drug-related toxicity (10.7%).
All but 1 of the defibrotide-treated patients and all historical controls had at least 1 AE. Hypotension was the most common AE in both groups—39.2% with defibrotide and 50.0% for historical controls. Diarrhea was also common—23.5% and 37.5%, respectively.
Sixty-four percent of patients in the defibrotide group (n=65) and 69% of historical controls (n=22) had a fatal AE.
Fifteen patients (14.7%) in the defibrotide group and 2 (6.3%) in the historical control group had 1 or more hemorrhagic AEs leading to death.
For the defibrotide group, these were gastrointestinal hemorrhage (n=1), cerebral hemorrhage (n=2), intracranial hemorrhage (n=1), subarachnoid hemorrhage (n=1), pulmonary alveolar hemorrhage (n=7), pulmonary hemorrhage (n=2), and vascular disorders hemorrhage (n=1).
Both hemorrhagic AEs leading to death in historical controls were pulmonary alveolar hemorrhage. ![]()
Journal questions results of rivaroxaban trial

An investigation by The BMJ has called into question the validity of the ROCKET AF trial, which was used to support approval for the direct oral anticoagulant rivaroxaban (Xarelto) in the US and European Union (EU).
For this trial, which was published in NEJM in 2011, researchers compared rivaroxaban to warfarin in patients with nonvalvular atrial fibrillation.
Results suggested rivaroxaban was noninferior to warfarin for preventing stroke or systemic embolism.
And there was no significant difference between the treatment arms with regard to major or nonmajor clinically relevant bleeding.
However, The BMJ article questions these results because the Alere INRatio Monitor System (INRatio Monitor or INRatio2 Monitor and INRatio Test Strips), which was used to measure patients’ international
normalized ratios (INRs) during the trial, was recalled in December 2014 after giving falsely low test results.
“In terms of the trial results, [the defect with the system] could make rivaroxaban seem safer than it was with respect to the risk of bleeding and throws doubt onto outcomes used to support the use of the world’s best-selling new oral anticoagulant,” said Deborah Cohen, The BMJ’s associate editor and author of the article.
In November 2015, the European Medicines Agency told The BMJ they were investigating the potential implications of the issue with the INRatio system. And the US Food and Drug Administration (FDA) said they were “aware of concerns regarding the INRatio device and its use in the ROCKET AF trial and [were] reviewing relevant data.”
The makers of the INRatio system (Alere) confirmed that the fault dates back to 2002. However, neither they nor the FDA responded to questions about why nothing had been done about the problem earlier.
In the meantime, Harlan Krumholz, MD, of Yale University in New Haven, Connecticut, said NEJM should place an “immediate Expression of Concern” on the paper describing ROCKET AF to notify the medical community, and there should be “an investigation by an independent group of experts to quickly determine if there are grounds for retraction.”
In December, Duke University’s Clinical Research Institute, which carried out the trial on behalf of Johnson and Johnson and Bayer Healthcare, said analyses conducted after the ROCKET AF trial was first published “are consistent with the results from the original trial and do not alter the conclusions of ROCKET AF.”
But former FDA reviewer Thomas Marciniak, MD, told The BMJ he would not rely on any re-analyses done by Duke, Johnson and Johnson, or the FDA. He added that public release of the data is “the only solution that would lead to unbiased analyses.”
However, Bayer told The BMJ the company has only signed up to share information on “study reports for new medicines approved in the US and the EU after January 1, 2014.”
According to former FDA clinical pharmacologist Bob Powell, PharmD, once a drug is on the market, the regulators lack a mandate to act without a safety signal.
“It is this lack of safety signal that appears to be hindering the FDA in their desire to pursue tailored dosing for [direct oral anticoagulants],” he said. “If it turns out that the issue with the INRatio device changes the safety profile of rivaroxaban, this very well may constitute the safety signal necessary for the FDA to act in this regard.” ![]()
Primary care endures in heart failure management
Heart failure management has become increasingly complex over the past couple of decades, with new drugs and drug combinations, new uses for potentially life-saving implanted devices, and a more sophisticated appreciation of the ways that various comorbidities complicate a heart failure patient’s clinical status. These expanded dimensions of heart failure care resulted in the establishment in 2008 of a new secondary subspecialty, Advanced Heart Failure and Transplant Cardiology, aimed at training and certifying physicians in all the nuances of complex heart failure diagnostics and care.
But as the 2009 manifesto announcing this new heart failure subspecialty detailed, care for the vast majority of U.S. patients with heart failure remains in the hands of internal medicine primary care physicians (PCPs) and general cardiologists (J Am Coll Cardiol. 2009 Mar 10;53[10]:834-6). To some extent this is a manpower issue. The estimated number of Americans living with heart failure exceeds 5 million, a figure that dwarfs the very modest number of U.S. physicians and clinicians who are certified or self-identified heart failure specialists.
As of today, fewer than 1,000 U.S. physicians have received formal certification as heart failure subspecialists through the examination administered in 2010, 2012, and 2014, said Michele Blair, chief executive officer of the Heart Failure Society of America. A more liberal definition of a heart failure specialist might include the roughly 3,000 unique physicians (mostly cardiologists, but also some hospitalists and emergency physicians) who have recently attended an annual meeting of the HFSA, as well as the roughly 2,300 physician assistants and nurse practitioners who have shown a heart failure interest by coming to a recent HFSA meeting. But even these expanded estimates calculate out to about 1 clinician with a special interest in heart failure for each 1,000 heart failure patients, not a very reassuring ratio.
The burgeoning numbers of heart failure patients, compared with the relative scarcity of both heart failure experts and general cardiologists, raises issues of how primary-care internists best share this management responsibility. Recent interviews with several heart failure subspecialists and primary care internists provide some insight into how this division of labor is now playing out in routine U.S. practice. What often occurs is that primary care internists take exclusive responsibility for caring for heart failure patients until they feel they are getting in over their heads, at which time they’ll consult with a cardiology colleague or refer the patient to a cardiologist. That moment of recognition by the generalist – that the demands and complexity of the case exceed their comfort level – varies widely, with some PCPs referring patients as soon as heart failure symptoms appear while others stay comfortable as the primary care giver even as a patient’s disease deteriorates to a more advanced stage.
Heart failure specialists highlighted their reliance on PCPs to take an ongoing, active role even for patients with significantly advanced heart failure, as generalists are well suited to coordinating the multispecialty care that such patients usually require, with attention to their need for lifestyle modifications as well as management of their diabetes, sleep apnea, chronic obstructive pulmonary disease, renal failure, and other comorbidities.

As Dr. Michael K. Ong, a primary care internist at the University of California, Los Angeles, said in an interview, his heart failure specialist colleague manages patients’ heart failure; “I manage [or refer] everything else not directly related to the heart failure.”
The most successful U.S. care models seem to be some variation on a team-care approach, in which physicians collaborate with pharmacists, nurses, rehabilitation specialists, and social workers as well as specialists, a team that would include and perhaps be led by either a primary care internist, a cardiologist, or a heart failure specialist but would also broadly include physicians able to deal with all the morbidity facets of heart failure. It’s a model that remains unavailable in many U.S. settings or is just starting to emerge, as fee-for-service coverage of patients gets replaced by population-management models that better accommodate the upfront financial demands of coordinated team care. It makes financial sense a few years down the road when improved patient outcomes result in cost savings.
Primary care and patients with symptomatic heart failure
The heart failure definitions and staging system established in 2001 by a guidelines panel of the American College of Cardiology and American Heart Association defined stage A heart failure as starting before a patient exhibits any heart failure symptoms (the classic ones include dyspnea, rales, and peripheral edema). The panel designated symptomatic heart failure patients as stage C. Patients without heart failure symptoms but with one or more risk factors (such as hypertension, diabetes, obesity, and cardiovascular disease) plus structural heart disease (such as cardiomyopathy or other forms of heart remodeling) were designated stage B. The panel said that people at stage A had one or more risk factors but no structural heart changes and no heart failure symptoms.
Although stage-A heart failure patients are clearly the types of people most often seen and cared for by PCPs, many of these physicians, as well as many heart failure specialists, don’t consider patients who have only hypertension or only diabetes or only obesity as yet having heart failure. That paradox deserves more discussion, but the best way to begin talking about PCPs and heart failure patients is when patients are symptomatic and have what everyone would agree is heart failure.

Even though the ACC/AHA staging system places stage C patients well down the heart failure road, stage C is usually when patients are first diagnosed with heart failure. Although the diagnosis is often first made by a hospitalist or emergency-department physician when severe and sudden-onset heart failure symptoms drive the patient to a hospital, or the diagnosis originates with a cardiologist or heart failure specialist when the patient’s presentation and differential diagnosis isn’t straightforward, most commonly the diagnosis starts with a PCP in an office encounter with a patient who is symptomatic but not acutely ill.
“Patients with shortness of breath or other forms of effort intolerance most often seek care from PCPs. The differential diagnosis of dyspnea is long and complex. Recognition that a patient with dyspnea may have HF is crucial” for timely management and treatment, said Dr. Mary Norine Walsh, medical director of Heart Failure and Cardiac Transplantation at St. Vincent Heart Center in Indianapolis.
At the Mayo Clinic in Rochester, Minn., “most of the heart failure diagnoses are done by PCPs, usually first identified at stage C when a patient comes in with symptoms. Stage B heart failure is usually only identified as an incidental finding when echocardiography is done for some other reason,” said Dr. Paul M. McKie, a heart failure cardiologist who works closely with the primary-care staff at Mayo as an embedded consultant cardiologist.
According to Dr. Mariell L. Jessup, a heart failure physician and professor at the University of Pennsylvania in Philadelphia, a key to PCPs promptly identifying patients with recent-onset, stage C heart failure is to keep the disease as well as its prominent risk factors at the top of their differential-diagnosis list for at-risk patients. “Heart failure is a common disorder,” Dr. Jessup said, and must be considered for patients with shortness of breath. “The leading causes of heart failure are hypertension, obesity, and diabetes. So keep heart failure in mind, especially for patients with one or more of these risk factors.”
Although PCPs might order an echocardiography examination or a lab test like measurement of brain natriuretic protein (BNP) to help nail down the diagnosis, they often leave reading the echocardiography results to a cardiologist colleague. “When a PCP orders an echo it’s automatically read by a cardiologist, and then we get the cardiologist’s report. I don’t read echos myself,” said Dr. Rebecca J. Cunningham, an internal medicine PCP at Brigham and Women’s Hospital in Boston who frequently sees patients with heart failure as medical director of the hospital’s Integrated Care Management Program. “I had one PCP colleague who undertook additional training to learn to read echos himself, but that’s unusual.”
Dr. Mary Ann Bauman, an internal medicine PCP and medical director for Women’s Health and Community Relations at INTEGRIS Health in Oklahoma City, noted a similar division of labor. “If a patient has shortness of breath, maybe some edema, and I hear a few rales, but is totally functional, I always order an echo but I don’t read it. I refer the echo to a cardiologist who then sends me a report,” Dr. Bauman said in an interview. “If I think the patient may have heart failure I’ll also order a BNP or NT-proBNP test. If I suspect heart failure and the BNP is high, it’s a red flag. BNP is another tool for getting the diagnosis right.”

The next step seems much more variable. Some PCPs retain primary control of heart failure management for many of their patients, especially when stage C patients remain stable and functional on simple, straightforward treatment and particularly when they have heart failure with preserved ejection fraction (HFpEF), usually defined as a left ventricular ejection fraction that is at least 40%-45%. Consultation or referral to a cardiologist or heart-failure physician seems much more common for patients with frequent decompensations and hospitalizations or patients with heart failure with reduced ejection fraction (HFrEF). But the main thread reported by both PCPs and cardiologists is that it all depends and varies for each patient and for each PCP depending on what patient responsibilities a PCP feels comfortable taking on.
Dr. Bauman sits at one end of the spectrum: “If it looks like a patient has heart failure, I refer them right away; I don’t wait for decompensation to occur. I want to be sure that there are no nuances in the patient that need something before I recognize it. Most of my PCP partners do the same. You don’t know what it is you don’t know. For me, it’s better to refer the patient right away so the patient has a cardiologist who already knows them who can be called if they start to decompensate.”
Dr. Bauman cited the increasing complexity of heart failure management as the main driver of her current approach, which she contrasted to how she dealt with heart failure patients 20 years ago. “It’s become so complicated that, as a PCP, I don’t feel that I can keep up” with the optimal ways to manage every heart failure patient. “I might not give my heart failure patients the best care they could receive.” The aspects of care that Dr. Bauman said she can provide to heart failure patients she has referred include “dealing with lifestyle changes, making sure patients are taking their medications and getting to their appointments, adjusting their heart-failure medication dosages as needed once they start on the drugs, and seeing that their diabetes and hypertension are well controlled. That is the role of the PCP. But when it comes to deciding which HF medications to use, that’s when I like to have a cardiologist involved.”
But the PCPs at Mayo Clinic often take a different tack, said Dr. McKie. “If the patient is a simple case of heart failure with no red flags and the patient is doing relatively well on treatment with simple diuretic treatment, then initiation of heart failure medications and ongoing management is often directed by the PCP with some cardiology backup as needed,” he said. But Dr. McKie conceded that a spectrum of PCP approaches exists at Mayo as well. “A lot depends on the patient and on the specific provider. Some patients we never get calls about; their PCPs are excellent at managing diuretics and uptitrating beta-blockers and ACE inhibitors. We may only get called if the patient decompensates, But other PCPs are very uncomfortable and they request that we get involved as soon as the diagnosis of stage C heart failure is made. So there is a wide range.” Dr. McKie noted that he thinks it is appropriate for himself or one of his cardiology colleagues to get more active when the HFrEF patient’s ejection fraction drops below 40% and certainly below 35%. That’s because at this stage, patients also need treatment with an aldosterone receptor antagonist such as spironolactone, and they undergo consideration for receiving an implantable cardioverter defibrillator or a cardiac resynchronization therapy device.
“There is nothing magic about heart failure management; it is very well proscribed by guidelines. Nothing precludes a PCP from taking ownership” of heart failure patients, said Dr. Akshay S. Desai, a heart failure cardiologist at Brigham and Women’s Hospital. “I think there is some fear among PCPs that they intrude” by managing heart failure patients. But for patients with structural heart disease or even left ventricular dysfunction, “PCPs should feel empowered to start standard heart failure treatments, including ACE inhibitors and beta-blockers, especially because half of heart failure patients have HFpEF, and PCPs often don’t refer HFpEF patients to cardiologists. It’s the patients with left ventricular dysfunction who end up in heart failure clinics,” Dr. Desai said.
On the other hand, Dr. Desai cautioned PCPs against waiting too long to bring more complex, sicker, and harder-to-manage patients to the attention of a heart failure specialist.
“What we worry about are late referrals, when patients are profoundly decompensated,” he said. “By the time they show up [at a heart failure clinic or emergency department] they have end-organ dysfunction,” which makes them much harder to treat and maybe irreversible. “Recognizing heart failure early is the key, and early referral is an obligation” when a heart failure patient is deteriorating or becomes too complex for a PCP to properly manage, Dr. Desai advised.
But even when heart failure patients develop more severe disease, with significantly depressed left ventricular function or frequent decompensations, PCPs continue to play a valuable role in coordinating the wide range of treatments patients need for their various comorbidities.
“Once a cardiologist or heart failure physician is involved there is still a role for PCPs” said Dr. Monica R. Shah, deputy chief of the Heart Failure and Arrhythmia Branch of the National Heart, Lung, and Blood Institute in Bethesda, Md. “Heart failure patients are complex, it’s not just one organ system that’s affected, and you need a partnership between cardiologists and PCPs to coordinate all of a patient’s care. A heart failure physician needs to work with a PCP to be sure that the patient’s health is optimal. Collaboration between cardiologists and PCPs is key to ensure that optimal care is effectively delivered to patients,” Dr. Shah said in an interview.
“Keeping the PCP at the center of the care team is critical, especially with the multiple comorbidities that HF patients can have, including chronic obstructive pulmonary disease, diabetes, renal failure, sleep apnea, atrial fibrillation, and degenerative joint disease. Before you know it you have a half-dozen subspecialists involved in care and it can become uncoordinated. Keeping the PCP at the center of the team and providing the PCP with support from specialists as needed is critical,” said Dr. McKie.
Even for the most severe heart failure patients, PCPs can still play an important role by providing palliative care and dealing with end-of-life issues, specialists said.
Primary care and heart failure’s antecedents
The other, obvious time in heart failure’s severity spectrum for PCPs to take a very active role is with presymptomatic, stage A patients. Perhaps the only controversial element of this is whether such patients really have a form of heart failure and whether is it important to conceptualize heart failure this way.
The notion of stage A heart failure dates back to the 2001 edition of heart failure diagnosis and management recommendations issued by a panel organized by the ACC and AHA (J Am Coll Cardiol. 2001 Dec;38[7]:2101-13). The 2001 writing committee members said that they “decided to take a new approach to the classification of heart failure that emphasized both the evolution and progression of the disease.” They defined stage A patients as presymptomatic and without structural heart disease but with “conditions strongly associated with the development of heart failure,” specifically systemic hypertension, coronary artery disease, diabetes, a history of cardiotoxic drug therapy or alcohol abuse, a history of rheumatic fever, or a family history of cardiomyopathy.
When the ACC and AHA panel members next updated the heart failure recommendations in 2005, they seemed to take a rhetorical step back, saying that stage A and B “are clearly not heart failure but are an attempt to help healthcare providers identify patients early who are at risk for developing heart failure. Stage A and B patients are best defined as those with risk factors that clearly predispose toward the development of HF.” (J Am Coll Cardiol. 2005 Sept. 46[6]:1116-43) In 2005, the panel also streamlined the list of risk factors that identify stage A heart failure patients: hypertension, atherosclerotic disease, diabetes, obesity, metabolic syndrome, patients who have taken cardiotoxins, or patients with a family history of cardiomyopathy. The 2009 recommendation update left this definition of stage A heart failure unchanged, but in 2013 the most recent update devoted less attention to explaining the significance of the stage-A heart failure, although it clearly highlighted the importance of controlling hypertension, diabetes, and obesity as ways to prevent patients from developing symptomatic heart failure (J Am Coll Cardiol. 2013 Oct 15;62[16]:e147-e239).
The subtle, official tweaking of the stage A (and B) heart failure concept during 2001-2013, as well establishment of stage A in the first place, seems to have left both PCPs and heart failure specialists unsure on exactly how to think about presymptomatic people with one or more of the prominent heart failure risk factors of hypertension, diabetes, and obesity. While they uniformly agree that identifying these risk factors and then treating them according to contemporary guidelines is hugely important for stopping or deferring the onset of heart failure, and they also agree that this aspect of patient care is clearly a core responsibility for PCPs, many also say that they don’t think of presymptomatic patients as having heart failure of any type despite the stage A designation on the books.
One exception is St. Vincent’s Dr. Walsh. “I think the writers of the 2001 heart failure guidelines had an inspired approach. Identifying patients with hypertension, diabetes, coronary artery disease, etc., as patients with heart failure has helped drive home the point that treatment and control of these diseases is crucial,” she said in an interview. “But I am not sure all physicians have adopted the concept. “Uncontrolled hypertension is prevalent, and not viewed by all as resulting in heart failure down the road. Diabetes and hypertension are very important risk factors for the development of heart failure in women,” she added. “I’m especially diligent in ensuring that women with one or both of these diseases get treated aggressively.”
Highlighting specifically the fundamental role that uncontrolled hypertension plays in causing heart failure, the University of Pennsylvania’s Dr. Jessup estimated that controlling hypertension throughout the U.S. population could probably cut heart failure incidence in half.
Others draw a sharper contrast between the risk factor stage and the symptomatic stages of heart failure, though they all agree on the importance of risk factor management by PCPs. “Hypertension does not mean that a patient has heart failure; it means they have a risk factor for heart failure and the patient is in the prevention stage,” said the NHLBI’s Dr. Shah. ”The most important role for PCPs is to identify the risk factors and prevent development of [symptomatic] heart failure. This is where PCPs are critically important because patients present to them at the early stages.”
Dr. Bauman, the PCP with INTEGRIS in Oklahoma City, generally doesn’t conflate risk factors with stage A heart failure. “I look at every patient with hypertension or diabetes as a person at risk for cardiovascular disease. I push them to get their blood pressure and glycemia under control. But I don’t think of them as stage A heart failure patients. I think of them as patients at risk for heart failure, but also at risk for atrial fibrillation, MI, and stroke. I think about their risk, but I don’t label them in my mind as having stage A heart failure. I think that this is a patient at risk for cardiovascular disease and that I must do what I should to manage their risk factors.”
“I don’t personally think about patients having stage A heart failure,” agreed Dr. Cunningham, a PCP at Brigham and Women’s Hospital. “When I see patients with hypertension, I counsel them about what matters to them so that they will take their medications, because if they currently feel fine they may not understand the long-term risk they face. So I invest time in making the patient understand why their hypertension is important and the risks it poses, so that in the long-run they won’t have a stroke or MI or develop heart failure. But I don’t think that the stage A definition has changed my approach; I already think of hypertension as a precursor to a variety of bad downstream consequences. I don’t think of someone as a heart failure patient just because they have hypertension, and I don’t think that every patient with hypertension will develop heart failure.” Speaking of her colleagues, Dr. Cunningham added, “I don’t have a sense that the stages of heart failure have made much of an impact on how other PCPs talk with patients or plan their care.”
“The heart failure staging system is useful from the standpoint of emphasizing that the disease begins with primordial risk and progresses through a period of structural injury during which patients may not be symptomatic,” summed up Dr. Desai. “But practically, most of us confront the diagnosis of heart failure when patients become symptomatic and reach stage C.”
Can an intensified approach better slow stage A progression?
One of the inherent limitations right now in referring to patients as having stage A heart failure is that it adds little to how heart failure risk factors are managed. A patient with hypertension undergoing appropriate care will receive treatment to lower blood pressure to recommended goal levels. The antihypertensive treatment remains the same regardless of whether the patient is considered to have only hypertension or whether the treating physician also thinks of the patient as having stage A heart failure. The same applies to patients diagnosed with diabetes; their hyperglycemia-controlling treatment remains unchanged whether or not their physician labels them as stage A heart failure patients.
But what if an evidence-based way existed to not only identify patients with hypertension or diabetes, but to identify within those patients the subset who faced a particularly increased risk for developing heart failure? And what if an evidence-based intervention existed that could be added to standard blood pressure–lowering or hyperglycemia-controlling interventions and had proved to slow or stop progression of patients to heart failure?
Preliminary evidence that screening for stage A heart failure patients can successfully identify a subset at elevated risk for developing symptomatic heart failure and that intensified risk-factor control helped mitigate this risk appeared in two reports published in 2013. But both studies were relatively small, they ran in Europe, and neither has undergone replication in a U.S. study in the 2.5 years since their publication.
The larger study, STOP-HF (St. Vincent’s Screening to Prevent Heart Failure), included patients at 39 primary care practices in Ireland, a study organized by researchers at St. Vincent’s University Hospital in Dublin. They enrolled people without symptoms of heart failure who were at least 41 years old and had at least one of these risk factors: hypertension, hypercholesterolemia, obesity, vascular disease, diabetes, an arrhythmia, or valvular disease: In short, primarily stage A heart failure patients.
The researchers then tested 1,374 of these people for their baseline blood level of BNP and randomized them into two intervention arms. For those randomized to the active arm, the PCPs for these people received an unblinded report of the BNP results, and those with a level of 50 pg/mL or higher underwent further assessment by screening echocardiography and intensified risk-factor control, including risk-factor coaching by a nurse. Those randomized to this arm who had a lower BNP level at baseline underwent annual follow-up BNP screening, and if their level reached the 50 pg/ML threshold they switched to the more intensified protocol. Those randomized to the control arm received a more standard program of risk-factor modification and their BNP levels were never unblinded.
After an average follow-up of 4.2 years, people in the active intervention arm of STOP-HF had a 5% cumulative incidence of left ventricular dysfunction or heart failure, while those in the control arm had a 9% rate, a 45% relative risk reduction from the active intervention that was statistically significant for the study’s primary endpoint (JAMA. 2013 July 3;310[1]:66-74).
The second study, PONTIAC (NT-proBNP Selected Prevention of Cardiac Events in a Population of Diabetic Patients Without a History of Cardiac Disease), ran in Austria and Germany and involved 300 patients who had type 2 diabetes and were free from cardiac disease at baseline. At baseline, all people considered for the study underwent a screening measure of their blood level of NT-proBNP (a physiologic precursor to BNP) and those with a level above 125 pg/mL were randomized to either a usual-care group or an arm that underwent more intensified up-titration treatment with a renin-angiotensin system antagonist drug and with a beta-blocker. The primary endpoint was the incidence of hospitalization or death due to cardiac disease after 2 years, which was a relative 65% lower in the intensified intervention group, a statistically significant difference (J Am Coll Cardiol. 2013 Oct 8;62[15]:1365-72).
Both studies focused on people with common risk factors seen in primary care practices and used BNP or a BNP-like blood marker to identify people with an elevated risk for developing heart failure or other cardiac disease, and both studies showed that application of a more aggressive risk-factor intervention program resulted in a significant reduction in heart failure or heart failure–related outcomes after 2-4 years. Both studies appeared to offer models for improving risk-factor management by PCPs for people with stage A heart failure, but at the end of 2015 neither model had undergone U.S. testing.
“The STOP-HF and PONTIAC studies were proofs of concept for using biomarkers to gain a better sense of cardiac health,” said Dr. Tariq Ahmad, a heart failure physician at Yale University in New Haven, Conn., who is interested in developing biomarkers for guiding heart failure management. “Metrics like blood pressure and heart rate are relatively crude measures of cardiac health. We need to see in a large trial if we can use these more objective measures of cardiac health to decide how to treat patients,” In addition to BNP and NT-proBNP, Dr. Ahmad cited ST2 and galectin-3 as other promising biomarkers in the blood that may better gauge a person’s risk for developing heart failure and the need for intensified risk-factor control. The current inability of PCPs to better risk stratify people who meet the stage A heart failure definition so that those at highest risk could undergo more intensified interventions constitutes a missed opportunity for heart failure prevention, he said.
“The STOP-HF trial is really important and desperately needs replication,” said Dr. Margaret M. Redfield, professor of medicine and a heart failure physician at Mayo Clinic in Rochester, Minn.
She, and her Mayo associates, including Dr. McKie, are planning to launch a research protocol this year to finally test a STOP-HF type of program in a U.S. setting. They are planning to measure NT-proBNP levels in patients with stage A heart failure and then randomize some to an intervention arm with intensified risk reduction treatments.
“The problem with stage A today is, if we apply it according to the ACC and AHA definition, it would include quite a large number of patients, and not all of them – in fact a minority – would go on to develop symptomatic heart failure,” said Dr. McKie. “How you can further risk stratify the stage A population with simple testing is an issue for ongoing research,” he said. “The STOP-HF and PONTIAC strategies need more testing. Both studies were done in Europe, and we haven’t studied this approach in the U.S. Their approach makes sense and is appealing but it needs more testing.”
The economic barrier to intensified stage-A management
Even if a U.S. based study could replicate the STOP-HF results and provide an evidence base for improved prevention of symptomatic heart failure by interventions instituted by PCPs, it’s not clear whether the U.S. health care system as it currently is structured provides a framework that is able to invest in intensified upfront management of risk factors to achieve a reduced incidence of symptomatic heart failure several years later.
“One of the interesting aspects of STOP-HF was its use of a nurse-based intervention. We don’t have the resources for that in our practices right now,” noted Dr. Cunningham, the PCP at Brigham and Women’s Hospital who is medical director of the hospital’s Integrated Care Management Program for medically complex patients. While that program uses nurse care coordinators to pull together the disparate elements of care for heart failure patients and others with more severe, chronic illnesses, the program currently serves only patients with advanced disease, not presymptomatic patients who face a potentially elevated risk for bad outcomes that would happen many years in the future.
“This speaks to the need for more population-based preventive management, which PCPs are trying to start to do, but currently we are nowhere near fulfilling that potential,” said Dr. Cunningham. The barrier is having clinical resources for help in managing lower-risk patients, to make sure they receive all the interventions they should. We’re now trying to start using care teams for patients with diabetes or other conditions. The biggest gap is that we don’t have the resources; we don’t have enough nurses on our staff to intervene” for all the patients who could potentially benefit. “Right now, we can only afford to use nurses for selected, high-risk patients.” The challenge is to have a care model that allows a lot of upfront costs to generate savings over a long-term time horizon, he said. “It’s very important for improving population health, but it’s hard to make it happen in our current health care system.”
Dr. Ahmad noted the enormous downside of a health system that is not proactive and often waits for heart failure patients to declare themselves with severe illness.
“The majority of heart failure patients I see drifted through the health care system” without recognition of their accumulating morbidity. “By the time they show heart failure symptoms, their disease is pretty advanced and we have real difficulty managing it. A lot of patients do not have their heart failure managed until they fall off the edge and their condition is much less modifiable. If we could identify these patients sooner, it would help both them and the health care system. It would be great to have objective measures that could help PCPs identify early abnormal patients who need more aggressive management. In much of U.S. practice, heart failure management is more specialty driven. It might be different in closed systems, but in many heart failure practices there is no PCP coordination. The health care system is not set up to allow PCPs to take care of these issues.”
Dr. Bauman said she sees some reason for optimism in looming reimbursement changes, where population management might help drive a shift toward more team care for heart failure and a focus on earlier identification of patients at risk and intervention at early stages of their disease.
“As we move toward population management it becomes more obvious that you need a team approach to managing heart failure, involving not just physicians but also pharmacists, nurses, social workers, and care coordinators. In my system, INTEGRIS, the whole-team management approach is beginning to happen. It’s new to primary care to apply a large team of clinicians; it takes a lot of resources. Being able to afford a team was a problem when we were paid by fee-for-service, it wasn’t practical. Population management will make it possible.”
Dr. Desai has been a consultant to Novartis, Merck, St. Jude, and Relypsa and has received research funding from Novartis and AtCor Medical. Dr. Redfield has been a consultant to Merck and Eli Lilly. Dr. Ahmad has been a consultant to Roche. Dr. Ong, Dr. Walsh, Dr. Jessup, Dr. McKie, Dr. Bauman, Dr. Shah, and Dr. Cunningham had no disclosures.
On Twitter @mitchelzoler
Heart failure management has become increasingly complex over the past couple of decades, with new drugs and drug combinations, new uses for potentially life-saving implanted devices, and a more sophisticated appreciation of the ways that various comorbidities complicate a heart failure patient’s clinical status. These expanded dimensions of heart failure care resulted in the establishment in 2008 of a new secondary subspecialty, Advanced Heart Failure and Transplant Cardiology, aimed at training and certifying physicians in all the nuances of complex heart failure diagnostics and care.
But as the 2009 manifesto announcing this new heart failure subspecialty detailed, care for the vast majority of U.S. patients with heart failure remains in the hands of internal medicine primary care physicians (PCPs) and general cardiologists (J Am Coll Cardiol. 2009 Mar 10;53[10]:834-6). To some extent this is a manpower issue. The estimated number of Americans living with heart failure exceeds 5 million, a figure that dwarfs the very modest number of U.S. physicians and clinicians who are certified or self-identified heart failure specialists.
As of today, fewer than 1,000 U.S. physicians have received formal certification as heart failure subspecialists through the examination administered in 2010, 2012, and 2014, said Michele Blair, chief executive officer of the Heart Failure Society of America. A more liberal definition of a heart failure specialist might include the roughly 3,000 unique physicians (mostly cardiologists, but also some hospitalists and emergency physicians) who have recently attended an annual meeting of the HFSA, as well as the roughly 2,300 physician assistants and nurse practitioners who have shown a heart failure interest by coming to a recent HFSA meeting. But even these expanded estimates calculate out to about 1 clinician with a special interest in heart failure for each 1,000 heart failure patients, not a very reassuring ratio.
The burgeoning numbers of heart failure patients, compared with the relative scarcity of both heart failure experts and general cardiologists, raises issues of how primary-care internists best share this management responsibility. Recent interviews with several heart failure subspecialists and primary care internists provide some insight into how this division of labor is now playing out in routine U.S. practice. What often occurs is that primary care internists take exclusive responsibility for caring for heart failure patients until they feel they are getting in over their heads, at which time they’ll consult with a cardiology colleague or refer the patient to a cardiologist. That moment of recognition by the generalist – that the demands and complexity of the case exceed their comfort level – varies widely, with some PCPs referring patients as soon as heart failure symptoms appear while others stay comfortable as the primary care giver even as a patient’s disease deteriorates to a more advanced stage.
Heart failure specialists highlighted their reliance on PCPs to take an ongoing, active role even for patients with significantly advanced heart failure, as generalists are well suited to coordinating the multispecialty care that such patients usually require, with attention to their need for lifestyle modifications as well as management of their diabetes, sleep apnea, chronic obstructive pulmonary disease, renal failure, and other comorbidities.
As Dr. Michael K. Ong, a primary care internist at the University of California, Los Angeles, said in an interview, his heart failure specialist colleague manages patients’ heart failure; “I manage [or refer] everything else not directly related to the heart failure.”
The most successful U.S. care models seem to be some variation on a team-care approach, in which physicians collaborate with pharmacists, nurses, rehabilitation specialists, and social workers as well as specialists, a team that would include and perhaps be led by either a primary care internist, a cardiologist, or a heart failure specialist but would also broadly include physicians able to deal with all the morbidity facets of heart failure. It’s a model that remains unavailable in many U.S. settings or is just starting to emerge, as fee-for-service coverage of patients gets replaced by population-management models that better accommodate the upfront financial demands of coordinated team care. It makes financial sense a few years down the road when improved patient outcomes result in cost savings.
Primary care and patients with symptomatic heart failure
The heart failure definitions and staging system established in 2001 by a guidelines panel of the American College of Cardiology and American Heart Association defined stage A heart failure as starting before a patient exhibits any heart failure symptoms (the classic ones include dyspnea, rales, and peripheral edema). The panel designated symptomatic heart failure patients as stage C. Patients without heart failure symptoms but with one or more risk factors (such as hypertension, diabetes, obesity, and cardiovascular disease) plus structural heart disease (such as cardiomyopathy or other forms of heart remodeling) were designated stage B. The panel said that people at stage A had one or more risk factors but no structural heart changes and no heart failure symptoms.
Although stage-A heart failure patients are clearly the types of people most often seen and cared for by PCPs, many of these physicians, as well as many heart failure specialists, don’t consider patients who have only hypertension or only diabetes or only obesity as yet having heart failure. That paradox deserves more discussion, but the best way to begin talking about PCPs and heart failure patients is when patients are symptomatic and have what everyone would agree is heart failure.
Even though the ACC/AHA staging system places stage C patients well down the heart failure road, stage C is usually when patients are first diagnosed with heart failure. Although the diagnosis is often first made by a hospitalist or emergency-department physician when severe and sudden-onset heart failure symptoms drive the patient to a hospital, or the diagnosis originates with a cardiologist or heart failure specialist when the patient’s presentation and differential diagnosis isn’t straightforward, most commonly the diagnosis starts with a PCP in an office encounter with a patient who is symptomatic but not acutely ill.
“Patients with shortness of breath or other forms of effort intolerance most often seek care from PCPs. The differential diagnosis of dyspnea is long and complex. Recognition that a patient with dyspnea may have HF is crucial” for timely management and treatment, said Dr. Mary Norine Walsh, medical director of Heart Failure and Cardiac Transplantation at St. Vincent Heart Center in Indianapolis.
At the Mayo Clinic in Rochester, Minn., “most of the heart failure diagnoses are done by PCPs, usually first identified at stage C when a patient comes in with symptoms. Stage B heart failure is usually only identified as an incidental finding when echocardiography is done for some other reason,” said Dr. Paul M. McKie, a heart failure cardiologist who works closely with the primary-care staff at Mayo as an embedded consultant cardiologist.
According to Dr. Mariell L. Jessup, a heart failure physician and professor at the University of Pennsylvania in Philadelphia, a key to PCPs promptly identifying patients with recent-onset, stage C heart failure is to keep the disease as well as its prominent risk factors at the top of their differential-diagnosis list for at-risk patients. “Heart failure is a common disorder,” Dr. Jessup said, and must be considered for patients with shortness of breath. “The leading causes of heart failure are hypertension, obesity, and diabetes. So keep heart failure in mind, especially for patients with one or more of these risk factors.”
Although PCPs might order an echocardiography examination or a lab test like measurement of brain natriuretic protein (BNP) to help nail down the diagnosis, they often leave reading the echocardiography results to a cardiologist colleague. “When a PCP orders an echo it’s automatically read by a cardiologist, and then we get the cardiologist’s report. I don’t read echos myself,” said Dr. Rebecca J. Cunningham, an internal medicine PCP at Brigham and Women’s Hospital in Boston who frequently sees patients with heart failure as medical director of the hospital’s Integrated Care Management Program. “I had one PCP colleague who undertook additional training to learn to read echos himself, but that’s unusual.”
Dr. Mary Ann Bauman, an internal medicine PCP and medical director for Women’s Health and Community Relations at INTEGRIS Health in Oklahoma City, noted a similar division of labor. “If a patient has shortness of breath, maybe some edema, and I hear a few rales, but is totally functional, I always order an echo but I don’t read it. I refer the echo to a cardiologist who then sends me a report,” Dr. Bauman said in an interview. “If I think the patient may have heart failure I’ll also order a BNP or NT-proBNP test. If I suspect heart failure and the BNP is high, it’s a red flag. BNP is another tool for getting the diagnosis right.”
The next step seems much more variable. Some PCPs retain primary control of heart failure management for many of their patients, especially when stage C patients remain stable and functional on simple, straightforward treatment and particularly when they have heart failure with preserved ejection fraction (HFpEF), usually defined as a left ventricular ejection fraction that is at least 40%-45%. Consultation or referral to a cardiologist or heart-failure physician seems much more common for patients with frequent decompensations and hospitalizations or patients with heart failure with reduced ejection fraction (HFrEF). But the main thread reported by both PCPs and cardiologists is that it all depends and varies for each patient and for each PCP depending on what patient responsibilities a PCP feels comfortable taking on.
Dr. Bauman sits at one end of the spectrum: “If it looks like a patient has heart failure, I refer them right away; I don’t wait for decompensation to occur. I want to be sure that there are no nuances in the patient that need something before I recognize it. Most of my PCP partners do the same. You don’t know what it is you don’t know. For me, it’s better to refer the patient right away so the patient has a cardiologist who already knows them who can be called if they start to decompensate.”
Dr. Bauman cited the increasing complexity of heart failure management as the main driver of her current approach, which she contrasted to how she dealt with heart failure patients 20 years ago. “It’s become so complicated that, as a PCP, I don’t feel that I can keep up” with the optimal ways to manage every heart failure patient. “I might not give my heart failure patients the best care they could receive.” The aspects of care that Dr. Bauman said she can provide to heart failure patients she has referred include “dealing with lifestyle changes, making sure patients are taking their medications and getting to their appointments, adjusting their heart-failure medication dosages as needed once they start on the drugs, and seeing that their diabetes and hypertension are well controlled. That is the role of the PCP. But when it comes to deciding which HF medications to use, that’s when I like to have a cardiologist involved.”
But the PCPs at Mayo Clinic often take a different tack, said Dr. McKie. “If the patient is a simple case of heart failure with no red flags and the patient is doing relatively well on treatment with simple diuretic treatment, then initiation of heart failure medications and ongoing management is often directed by the PCP with some cardiology backup as needed,” he said. But Dr. McKie conceded that a spectrum of PCP approaches exists at Mayo as well. “A lot depends on the patient and on the specific provider. Some patients we never get calls about; their PCPs are excellent at managing diuretics and uptitrating beta-blockers and ACE inhibitors. We may only get called if the patient decompensates, But other PCPs are very uncomfortable and they request that we get involved as soon as the diagnosis of stage C heart failure is made. So there is a wide range.” Dr. McKie noted that he thinks it is appropriate for himself or one of his cardiology colleagues to get more active when the HFrEF patient’s ejection fraction drops below 40% and certainly below 35%. That’s because at this stage, patients also need treatment with an aldosterone receptor antagonist such as spironolactone, and they undergo consideration for receiving an implantable cardioverter defibrillator or a cardiac resynchronization therapy device.
“There is nothing magic about heart failure management; it is very well proscribed by guidelines. Nothing precludes a PCP from taking ownership” of heart failure patients, said Dr. Akshay S. Desai, a heart failure cardiologist at Brigham and Women’s Hospital. “I think there is some fear among PCPs that they intrude” by managing heart failure patients. But for patients with structural heart disease or even left ventricular dysfunction, “PCPs should feel empowered to start standard heart failure treatments, including ACE inhibitors and beta-blockers, especially because half of heart failure patients have HFpEF, and PCPs often don’t refer HFpEF patients to cardiologists. It’s the patients with left ventricular dysfunction who end up in heart failure clinics,” Dr. Desai said.
On the other hand, Dr. Desai cautioned PCPs against waiting too long to bring more complex, sicker, and harder-to-manage patients to the attention of a heart failure specialist.
“What we worry about are late referrals, when patients are profoundly decompensated,” he said. “By the time they show up [at a heart failure clinic or emergency department] they have end-organ dysfunction,” which makes them much harder to treat and maybe irreversible. “Recognizing heart failure early is the key, and early referral is an obligation” when a heart failure patient is deteriorating or becomes too complex for a PCP to properly manage, Dr. Desai advised.
But even when heart failure patients develop more severe disease, with significantly depressed left ventricular function or frequent decompensations, PCPs continue to play a valuable role in coordinating the wide range of treatments patients need for their various comorbidities.
“Once a cardiologist or heart failure physician is involved there is still a role for PCPs” said Dr. Monica R. Shah, deputy chief of the Heart Failure and Arrhythmia Branch of the National Heart, Lung, and Blood Institute in Bethesda, Md. “Heart failure patients are complex, it’s not just one organ system that’s affected, and you need a partnership between cardiologists and PCPs to coordinate all of a patient’s care. A heart failure physician needs to work with a PCP to be sure that the patient’s health is optimal. Collaboration between cardiologists and PCPs is key to ensure that optimal care is effectively delivered to patients,” Dr. Shah said in an interview.
“Keeping the PCP at the center of the care team is critical, especially with the multiple comorbidities that HF patients can have, including chronic obstructive pulmonary disease, diabetes, renal failure, sleep apnea, atrial fibrillation, and degenerative joint disease. Before you know it you have a half-dozen subspecialists involved in care and it can become uncoordinated. Keeping the PCP at the center of the team and providing the PCP with support from specialists as needed is critical,” said Dr. McKie.
Even for the most severe heart failure patients, PCPs can still play an important role by providing palliative care and dealing with end-of-life issues, specialists said.
Primary care and heart failure’s antecedents
The other, obvious time in heart failure’s severity spectrum for PCPs to take a very active role is with presymptomatic, stage A patients. Perhaps the only controversial element of this is whether such patients really have a form of heart failure and whether is it important to conceptualize heart failure this way.
The notion of stage A heart failure dates back to the 2001 edition of heart failure diagnosis and management recommendations issued by a panel organized by the ACC and AHA (J Am Coll Cardiol. 2001 Dec;38[7]:2101-13). The 2001 writing committee members said that they “decided to take a new approach to the classification of heart failure that emphasized both the evolution and progression of the disease.” They defined stage A patients as presymptomatic and without structural heart disease but with “conditions strongly associated with the development of heart failure,” specifically systemic hypertension, coronary artery disease, diabetes, a history of cardiotoxic drug therapy or alcohol abuse, a history of rheumatic fever, or a family history of cardiomyopathy.
When the ACC and AHA panel members next updated the heart failure recommendations in 2005, they seemed to take a rhetorical step back, saying that stage A and B “are clearly not heart failure but are an attempt to help healthcare providers identify patients early who are at risk for developing heart failure. Stage A and B patients are best defined as those with risk factors that clearly predispose toward the development of HF.” (J Am Coll Cardiol. 2005 Sept. 46[6]:1116-43) In 2005, the panel also streamlined the list of risk factors that identify stage A heart failure patients: hypertension, atherosclerotic disease, diabetes, obesity, metabolic syndrome, patients who have taken cardiotoxins, or patients with a family history of cardiomyopathy. The 2009 recommendation update left this definition of stage A heart failure unchanged, but in 2013 the most recent update devoted less attention to explaining the significance of the stage-A heart failure, although it clearly highlighted the importance of controlling hypertension, diabetes, and obesity as ways to prevent patients from developing symptomatic heart failure (J Am Coll Cardiol. 2013 Oct 15;62[16]:e147-e239).
The subtle, official tweaking of the stage A (and B) heart failure concept during 2001-2013, as well establishment of stage A in the first place, seems to have left both PCPs and heart failure specialists unsure on exactly how to think about presymptomatic people with one or more of the prominent heart failure risk factors of hypertension, diabetes, and obesity. While they uniformly agree that identifying these risk factors and then treating them according to contemporary guidelines is hugely important for stopping or deferring the onset of heart failure, and they also agree that this aspect of patient care is clearly a core responsibility for PCPs, many also say that they don’t think of presymptomatic patients as having heart failure of any type despite the stage A designation on the books.
One exception is St. Vincent’s Dr. Walsh. “I think the writers of the 2001 heart failure guidelines had an inspired approach. Identifying patients with hypertension, diabetes, coronary artery disease, etc., as patients with heart failure has helped drive home the point that treatment and control of these diseases is crucial,” she said in an interview. “But I am not sure all physicians have adopted the concept. “Uncontrolled hypertension is prevalent, and not viewed by all as resulting in heart failure down the road. Diabetes and hypertension are very important risk factors for the development of heart failure in women,” she added. “I’m especially diligent in ensuring that women with one or both of these diseases get treated aggressively.”
Highlighting specifically the fundamental role that uncontrolled hypertension plays in causing heart failure, the University of Pennsylvania’s Dr. Jessup estimated that controlling hypertension throughout the U.S. population could probably cut heart failure incidence in half.
Others draw a sharper contrast between the risk factor stage and the symptomatic stages of heart failure, though they all agree on the importance of risk factor management by PCPs. “Hypertension does not mean that a patient has heart failure; it means they have a risk factor for heart failure and the patient is in the prevention stage,” said the NHLBI’s Dr. Shah. ”The most important role for PCPs is to identify the risk factors and prevent development of [symptomatic] heart failure. This is where PCPs are critically important because patients present to them at the early stages.”
Dr. Bauman, the PCP with INTEGRIS in Oklahoma City, generally doesn’t conflate risk factors with stage A heart failure. “I look at every patient with hypertension or diabetes as a person at risk for cardiovascular disease. I push them to get their blood pressure and glycemia under control. But I don’t think of them as stage A heart failure patients. I think of them as patients at risk for heart failure, but also at risk for atrial fibrillation, MI, and stroke. I think about their risk, but I don’t label them in my mind as having stage A heart failure. I think that this is a patient at risk for cardiovascular disease and that I must do what I should to manage their risk factors.”
“I don’t personally think about patients having stage A heart failure,” agreed Dr. Cunningham, a PCP at Brigham and Women’s Hospital. “When I see patients with hypertension, I counsel them about what matters to them so that they will take their medications, because if they currently feel fine they may not understand the long-term risk they face. So I invest time in making the patient understand why their hypertension is important and the risks it poses, so that in the long-run they won’t have a stroke or MI or develop heart failure. But I don’t think that the stage A definition has changed my approach; I already think of hypertension as a precursor to a variety of bad downstream consequences. I don’t think of someone as a heart failure patient just because they have hypertension, and I don’t think that every patient with hypertension will develop heart failure.” Speaking of her colleagues, Dr. Cunningham added, “I don’t have a sense that the stages of heart failure have made much of an impact on how other PCPs talk with patients or plan their care.”
“The heart failure staging system is useful from the standpoint of emphasizing that the disease begins with primordial risk and progresses through a period of structural injury during which patients may not be symptomatic,” summed up Dr. Desai. “But practically, most of us confront the diagnosis of heart failure when patients become symptomatic and reach stage C.”
Can an intensified approach better slow stage A progression?
One of the inherent limitations right now in referring to patients as having stage A heart failure is that it adds little to how heart failure risk factors are managed. A patient with hypertension undergoing appropriate care will receive treatment to lower blood pressure to recommended goal levels. The antihypertensive treatment remains the same regardless of whether the patient is considered to have only hypertension or whether the treating physician also thinks of the patient as having stage A heart failure. The same applies to patients diagnosed with diabetes; their hyperglycemia-controlling treatment remains unchanged whether or not their physician labels them as stage A heart failure patients.
But what if an evidence-based way existed to not only identify patients with hypertension or diabetes, but to identify within those patients the subset who faced a particularly increased risk for developing heart failure? And what if an evidence-based intervention existed that could be added to standard blood pressure–lowering or hyperglycemia-controlling interventions and had proved to slow or stop progression of patients to heart failure?
Preliminary evidence that screening for stage A heart failure patients can successfully identify a subset at elevated risk for developing symptomatic heart failure and that intensified risk-factor control helped mitigate this risk appeared in two reports published in 2013. But both studies were relatively small, they ran in Europe, and neither has undergone replication in a U.S. study in the 2.5 years since their publication.
The larger study, STOP-HF (St. Vincent’s Screening to Prevent Heart Failure), included patients at 39 primary care practices in Ireland, a study organized by researchers at St. Vincent’s University Hospital in Dublin. They enrolled people without symptoms of heart failure who were at least 41 years old and had at least one of these risk factors: hypertension, hypercholesterolemia, obesity, vascular disease, diabetes, an arrhythmia, or valvular disease: In short, primarily stage A heart failure patients.
The researchers then tested 1,374 of these people for their baseline blood level of BNP and randomized them into two intervention arms. For those randomized to the active arm, the PCPs for these people received an unblinded report of the BNP results, and those with a level of 50 pg/mL or higher underwent further assessment by screening echocardiography and intensified risk-factor control, including risk-factor coaching by a nurse. Those randomized to this arm who had a lower BNP level at baseline underwent annual follow-up BNP screening, and if their level reached the 50 pg/ML threshold they switched to the more intensified protocol. Those randomized to the control arm received a more standard program of risk-factor modification and their BNP levels were never unblinded.
After an average follow-up of 4.2 years, people in the active intervention arm of STOP-HF had a 5% cumulative incidence of left ventricular dysfunction or heart failure, while those in the control arm had a 9% rate, a 45% relative risk reduction from the active intervention that was statistically significant for the study’s primary endpoint (JAMA. 2013 July 3;310[1]:66-74).
The second study, PONTIAC (NT-proBNP Selected Prevention of Cardiac Events in a Population of Diabetic Patients Without a History of Cardiac Disease), ran in Austria and Germany and involved 300 patients who had type 2 diabetes and were free from cardiac disease at baseline. At baseline, all people considered for the study underwent a screening measure of their blood level of NT-proBNP (a physiologic precursor to BNP) and those with a level above 125 pg/mL were randomized to either a usual-care group or an arm that underwent more intensified up-titration treatment with a renin-angiotensin system antagonist drug and with a beta-blocker. The primary endpoint was the incidence of hospitalization or death due to cardiac disease after 2 years, which was a relative 65% lower in the intensified intervention group, a statistically significant difference (J Am Coll Cardiol. 2013 Oct 8;62[15]:1365-72).
Both studies focused on people with common risk factors seen in primary care practices and used BNP or a BNP-like blood marker to identify people with an elevated risk for developing heart failure or other cardiac disease, and both studies showed that application of a more aggressive risk-factor intervention program resulted in a significant reduction in heart failure or heart failure–related outcomes after 2-4 years. Both studies appeared to offer models for improving risk-factor management by PCPs for people with stage A heart failure, but at the end of 2015 neither model had undergone U.S. testing.
“The STOP-HF and PONTIAC studies were proofs of concept for using biomarkers to gain a better sense of cardiac health,” said Dr. Tariq Ahmad, a heart failure physician at Yale University in New Haven, Conn., who is interested in developing biomarkers for guiding heart failure management. “Metrics like blood pressure and heart rate are relatively crude measures of cardiac health. We need to see in a large trial if we can use these more objective measures of cardiac health to decide how to treat patients,” In addition to BNP and NT-proBNP, Dr. Ahmad cited ST2 and galectin-3 as other promising biomarkers in the blood that may better gauge a person’s risk for developing heart failure and the need for intensified risk-factor control. The current inability of PCPs to better risk stratify people who meet the stage A heart failure definition so that those at highest risk could undergo more intensified interventions constitutes a missed opportunity for heart failure prevention, he said.
“The STOP-HF trial is really important and desperately needs replication,” said Dr. Margaret M. Redfield, professor of medicine and a heart failure physician at Mayo Clinic in Rochester, Minn.
She, and her Mayo associates, including Dr. McKie, are planning to launch a research protocol this year to finally test a STOP-HF type of program in a U.S. setting. They are planning to measure NT-proBNP levels in patients with stage A heart failure and then randomize some to an intervention arm with intensified risk reduction treatments.
“The problem with stage A today is, if we apply it according to the ACC and AHA definition, it would include quite a large number of patients, and not all of them – in fact a minority – would go on to develop symptomatic heart failure,” said Dr. McKie. “How you can further risk stratify the stage A population with simple testing is an issue for ongoing research,” he said. “The STOP-HF and PONTIAC strategies need more testing. Both studies were done in Europe, and we haven’t studied this approach in the U.S. Their approach makes sense and is appealing but it needs more testing.”
The economic barrier to intensified stage-A management
Even if a U.S. based study could replicate the STOP-HF results and provide an evidence base for improved prevention of symptomatic heart failure by interventions instituted by PCPs, it’s not clear whether the U.S. health care system as it currently is structured provides a framework that is able to invest in intensified upfront management of risk factors to achieve a reduced incidence of symptomatic heart failure several years later.
“One of the interesting aspects of STOP-HF was its use of a nurse-based intervention. We don’t have the resources for that in our practices right now,” noted Dr. Cunningham, the PCP at Brigham and Women’s Hospital who is medical director of the hospital’s Integrated Care Management Program for medically complex patients. While that program uses nurse care coordinators to pull together the disparate elements of care for heart failure patients and others with more severe, chronic illnesses, the program currently serves only patients with advanced disease, not presymptomatic patients who face a potentially elevated risk for bad outcomes that would happen many years in the future.
“This speaks to the need for more population-based preventive management, which PCPs are trying to start to do, but currently we are nowhere near fulfilling that potential,” said Dr. Cunningham. The barrier is having clinical resources for help in managing lower-risk patients, to make sure they receive all the interventions they should. We’re now trying to start using care teams for patients with diabetes or other conditions. The biggest gap is that we don’t have the resources; we don’t have enough nurses on our staff to intervene” for all the patients who could potentially benefit. “Right now, we can only afford to use nurses for selected, high-risk patients.” The challenge is to have a care model that allows a lot of upfront costs to generate savings over a long-term time horizon, he said. “It’s very important for improving population health, but it’s hard to make it happen in our current health care system.”
Dr. Ahmad noted the enormous downside of a health system that is not proactive and often waits for heart failure patients to declare themselves with severe illness.
“The majority of heart failure patients I see drifted through the health care system” without recognition of their accumulating morbidity. “By the time they show heart failure symptoms, their disease is pretty advanced and we have real difficulty managing it. A lot of patients do not have their heart failure managed until they fall off the edge and their condition is much less modifiable. If we could identify these patients sooner, it would help both them and the health care system. It would be great to have objective measures that could help PCPs identify early abnormal patients who need more aggressive management. In much of U.S. practice, heart failure management is more specialty driven. It might be different in closed systems, but in many heart failure practices there is no PCP coordination. The health care system is not set up to allow PCPs to take care of these issues.”
Dr. Bauman said she sees some reason for optimism in looming reimbursement changes, where population management might help drive a shift toward more team care for heart failure and a focus on earlier identification of patients at risk and intervention at early stages of their disease.
“As we move toward population management it becomes more obvious that you need a team approach to managing heart failure, involving not just physicians but also pharmacists, nurses, social workers, and care coordinators. In my system, INTEGRIS, the whole-team management approach is beginning to happen. It’s new to primary care to apply a large team of clinicians; it takes a lot of resources. Being able to afford a team was a problem when we were paid by fee-for-service, it wasn’t practical. Population management will make it possible.”
Dr. Desai has been a consultant to Novartis, Merck, St. Jude, and Relypsa and has received research funding from Novartis and AtCor Medical. Dr. Redfield has been a consultant to Merck and Eli Lilly. Dr. Ahmad has been a consultant to Roche. Dr. Ong, Dr. Walsh, Dr. Jessup, Dr. McKie, Dr. Bauman, Dr. Shah, and Dr. Cunningham had no disclosures.
On Twitter @mitchelzoler
Multifaceted Intervention Reduces Cost
Healthcare costs continue to increase and are estimated to be approximately $3.1 trillion per year in the United States.[1] Waste is a major contributor to this cost, accounting for an estimated $910 billion/year.[2] Laboratory tests are well documented to contribute to healthcare waste, with an estimated 30% to 50% of tests for hospitalized patients being unnecessary.[3, 4, 5] This issue has been highlighted by the American Board of Internal Medicine Foundation's Choosing Wisely campaign as an area to reduce waste.[6] Evaluating this concern locally, a University Health Systems Consortium 2011 analysis indicated that the University of Utah general internal medicine hospitalist service had a higher average direct lab cost per discharge compared to top performers, indicating an opportunity for improvement.
Multiple interventions have been described in the literature to address excessive laboratory utilization, including physician education, audit and feedback, cost information display, and administrative rules restricting certain types of ordering.[7, 8, 9, 10, 11] Despite these interventions, barriers remain common and not all interventions are sustained. For example, interventions focused mainly on education see a small improvement initially that is not sustained.[4, 12, 13] Additionally, although most studies focus on individual interventions, those that target multiple factors have been found to be more successful at producing and sustaining change.[14] Therefore, the opportunity existed to incorporate multiple etiologies into a single intervention and apply a checklist to laboratory ordering to see if combined modalities could be effective at reducing laboratory costs in a sustainable manner.
In addition to cost, there is potential patient harm resulting from unnecessary laboratory testing. For prolonged hospitalizations, anemia is a well‐recognized side effect of phlebotomy,[15, 16] and a recent evaluation of cardiac surgery patients found an average cumulative blood loss due to phlebotomy of 454 mL/hospital stay.[17] The sheer number of tests ordered can lead to false positive tests that result in additional testing and monitoring. Furthermore, patients subjected to laboratory blood draws are often awakened early in the morning, which is unpleasant and could adversely affect the patient experience.
Recognizing laboratory cost as a problem, the University of Utah general internal medicine hospitalist service implemented a multifaceted quality‐improvement initiative with a goal to reduce laboratory testing. At the time of this project, University of Utah Health Care (UUHC) developed a Value Driven Outcomes (VDO) tool to give direct data related to costs of care, including the actual cost paid by the hospital to the university‐owned laboratory vendor (ARUP Laboratories, Salt Lake City, UT) for testing.[18] The hospitalist group incorporated VDO into the initiative for routine cost feedback. This study evaluates the impact of this intervention on laboratory costs.
METHODS
Design
A retrospective, controlled, interrupted time series (ITS) study was performed to compare changes in lab costs between hospitalists (intervention study group) and other providers (control study group). The intervention initiation date was February 1, 2013. The baseline period was July 1, 2012 to January 31, 2013, as that was the period in which the VDO tool became available for cost analysis prior to intervention. The intervention period was February 1, 2013 to April 30, 2014, as there was a change in the electronic health record (EHR) in May 2014 that affected data flow and could act as a major confounder. The institutional review board classified this project as quality improvement and did not require review and oversight.
Setting
UUHC is a 500‐bed academic medical center in Salt Lake City, Utah. The hospitalist service is a teaching service composed of 4 teams with internal medicine residents and medical students. The nonhospitalist services include all surgical services, as well as pulmonary, cardiology, hematology, and oncology services on which internal medicine residents rotate. All services at UUHC are staffed by academic physicians affiliated with the University of Utah School of Medicine.
Population
All patients 18 years and older admitted to the hospital to a service other than obstetrics, rehabilitation, or psychiatry between July 1, 2012 and April 30, 2014 were evaluated. Patients with missing data for outcomes or covariates were excluded.
Intervention
Initial evaluation included an informal review of patient charts and discussion with hospitalist group members, both indicating laboratory overuse. A working group was then established including hospitalists and process engineers to evaluate the workflow by which laboratory tests were ordered. Concurrently, a literature review was performed to help identify the scope of the problem and evaluate methods that had been successful at other institutions. Through this review, it was noted that interns were the most frequent orderers of tests and the largest contributors to variation of testing for inpatients.[19] Two specific studies with direct applicability to this project demonstrated that discussion of costs with attendings in a trauma intensive care unit resulted in a 30% reduction of tests ordered,[20] and discussion of testing with a senior resident in an internal medicine inpatient setting demonstrated a 20% reduction in laboratory testing.[21]
Our laboratory reduction intervention expanded on the current literature to incorporate education, process change, cost feedback, and financial incentives. Specifically, starting February 1, 2013, the following interventions were performed:
- Education of all providers involved, including the hospitalist group and all internal medicine residents at the start of their rotation with the hospitalist service. Education included a 30‐minute discussion of laboratory overuse, costs associated with laboratory overuse, previous interventions and their success, and current intervention with goals. Each resident was provided a pocket card with the most common lab tests and associated charges. Charges were used instead of costs due to concerns regarding the possible public dissemination of institutional costs.
- Standardization of the rounding process including a checklist review (see Supporting Information, Appendix, in the online version of this article) for all patients that ensured discussion of labs, telemetry, pain, lines/tubes, nursing presence, and follow‐up needed. The expectation was that all plans for lab testing would be discussed during rounds. The third‐year medical student was responsible to ensure that all items were covered daily on each patient.
- Monthly feedback at the hospitalist group meeting regarding laboratory costs using the VDO tool. Data were presented as a monthly group average and compared to preintervention baseline costs. Individual performance could be viewed and compared to other providers within the group.
- Financial incentive through a program that shares 50% of cost savings realized by the hospital with the Division of General Internal Medicine. The incentive could be used to support future quality‐improvement projects, but there was no individual physician incentive.
Data Collection and Preparation
Clinical data were collected in the inpatient EHR (Cerner Corp., Kansas City, MO) and later imported into the enterprise data warehouse (EDW) as part of the normal data flow. Billing data were imported into the EDW from the billing system. Cost data were estimated using the VDO tool developed by the University of Utah to identify clinical costs to the UUHC system.[18]
Clinical and Cost Outcomes
We hypothesized that following the intervention, the number of tests and lab costs would decrease greater for patients in the intervention group than in the control group, with no adverse effect on length of stay (LOS) or 30‐day readmissions.
Lab cost per day was calculated as the total lab cost per visit divided by the LOS. We adjusted all lab costs to 2013 US dollars using Consumer Price Index inflation data.[22] To account for different LOS, we used LOS as a weight variable when estimating descriptive characteristics and P values for lab cost per day and the number of tests. Thirty‐day readmissions included inpatient encounters followed by another inpatient encounter within 30 days excluding obstetrics, rehabilitation, and psychiatry visits.
Descriptive Variables
We included information on age at admission in years and Charlson Comorbidity Index (CCI) to evaluate differences in control and intervention groups.[23]
Statistical Analysis
First, unadjusted descriptive statistics were calculated for study outcomes and visit characteristics. Descriptive statistics were expressed as n (%) and mean standard deviation. Simple comparisons were performed based on 2 tests of homogeneity for categorical variables and on t tests for continuous variables.
Second, an ITS analysis was conducted to evaluate the impact of the intervention while accounting for baseline trends.[24] In this analysis, the dependent variable (yt) was the difference in aggregated outcome measures between the intervention and control groups every 2 weeks (eg, difference in average lab costs in a given 2‐week period between the 2 groups). Intervention impact was then evaluated in terms of changes in the level of the outcome (b2) as well as in the trend over time (b3) compared to the initial difference in means (b0) and baseline trend (b1). The following difference‐in‐differences segmented regression model was fitted using the autoreg procedure in SAS: yt = b0 + b1*timet + b2*study periodt + b3*time after the interventiont + errort, where timet is biweekly intervals after the beginning of the study, time after the interventiont is biweekly intervals after the intervention date, and study periodt is 1 postintervention and 0 preintervention. The models were fitted using maximum likelihood and stepwise autoregression to test 24 lags.
P values <0.05 were considered significant. SAS (version 9.3; SAS Institute Inc., Cary, NC) was used for data analysis.
RESULTS
We analyzed 48,327 inpatient visits that met inclusion criteria. We excluded 15,659 obstetrics, rehabilitation, and psychiatry visits. Seven hundred seventy‐two (2.4%) of the remaining visits were excluded due to missing data. A total of 31,896 inpatient visits by 22,545 patients were included in the analysis. There were 10,136 visits before the intervention and 21,760 visits after. Characteristics of the study groups for the full study timeframe (July 1, 2012April 30, 2014) are summarized in Table 1.
| Characteristic | Study Group* | |||
|---|---|---|---|---|
| Overall, N = 31,896 | Control, N = 25,586 | Intervention, N = 6,310 | P Value | |
| ||||
| Patient characteristics | ||||
| Age, y | 55.47 17.61 | 55.27 17.13 | 56.30 19.39 | <0.001 |
| Female gender | 14,995 (47%) | 11,753 (46%) | 3,242 (51%) | <0.001 |
| CCI | 3.73 3.25 | 3.61 3.17 | 4.20 3.54 | <0.001 |
| Outcomes | ||||
| Cost per day, $ | 130.95 392.16 | 131.57 423.94 | 127.68 220.40 | 0.022 |
| Cost per visit, $ | 733.75 1,693.98 | 772.30 1,847.65 | 577.40 795.29 | <0.001 |
| BMP tests per day | 0.73 1.17 | 0.74 1.19 | 0.67 1.05 | <0.001 |
| CMP tests per day | 0.20 0.67 | 0.19 0.68 | 0.26 0.62 | <0.001 |
| CBC tests per day | 0.83 1.10 | 0.84 1.15 | 0.73 0.82 | <0.001 |
| PT/INR tests per day | 0.36 1.03 | 0.36 1.07 | 0.34 0.83 | <.001 |
| LOS, d | 5.60 7.12 | 5.87 7.55 | 4.52 4.82 | <0.001 |
| 30‐day readmissions | 4,374 (14%) | 3,603 (14%) | 771 (12%) | <0.001 |
During the study period, there were 25,586 visits in the control group and 6310 visits in the intervention group. Patients in the intervention group were on average older than patients in the control group. There were more female patients in the intervention group. Mean CCI was 4.2 in the intervention group and 3.6 in the control group. The intervention group had lower LOS and 30‐day readmissions than the control group.
Descriptive statistics and simple comparisons of covariates and outcomes before and after the intervention are shown in Table 2. Age and gender distributions remained unchanged in both groups. CCI increased in the control group by 0.24 (P < 0.001) and remained unchanged in the intervention group. In the intervention group, lab cost per day was reduced from $138 before the intervention to $123 after the intervention (P < 0.001). In contrast, among control patients, cost per day increased nonsignificantly from $130 preintervention to $132 postintervention (P = 0.37). Number of tests per day significantly decreased for all specific tests in the intervention group. Readmission rates decreased significantly from 14% to 11% in the intervention group (P = 0.01). LOS remained constant in both groups.
| Characteristic* | Control | Intervention | ||||
|---|---|---|---|---|---|---|
| Preintervention, N = 8,102 | Postintervention, N = 17,484 | P Value | Preintervention, N = 2,034 | Postintervention, N = 4,276 | P Value | |
| ||||||
| Patient characteristics | ||||||
| Age, yr | 55.17 17.46 | 55.31 16.98 | 0.55 | 55.90 19.47 | 56.50 19.35 | 0.25 |
| Female gender | 3,707 (46%) | 8,046 (46%) | 0.69 | 1,039 (51%) | 2,203 (52%) | 0.74 |
| CCI | 3.45 3.06 | 3.69 3.21 | <0.001 | 4.19 3.51 | 4.20 3.56 | 0.89 |
| Outcomes | ||||||
| Cost per day, $ | 130.1 431.8 | 132.2 420.3 | 0.37 | 137.9 232.9 | 122.9 213.5 | <0.001 |
| Cost per visit, $ | 760.4 1,813.6 | 777.8 1,863.3 | 0.48 | 617.8 844.1 | 558.2 770.3 | 0.005 |
| BMP tests per day | 0.74 1.21 | 0.74 1.18 | 0.67 | 0.75 1.03 | 0.63 1.05 | <0.001 |
| CMP tests per day | 0.19 0.68 | 0.19 0.68 | 0.85 | 0.32 0.68 | 0.23 0.58 | <0.001 |
| CBC tests per day | 0.85 1.14 | 0.84 1.15 | 0.045 | 0.92 0.79 | 0.64 0.76 | <0.001 |
| PT/INR tests per day | 0.34 1.04 | 0.37 1.08 | <0.001 | 0.35 0.82 | 0.33 0.84 | 0.020 |
| LOS, d | 5.84 7.66 | 5.88 7.50 | 0.71 | 4.48 5.12 | 4.54 4.67 | 0.63 |
| 30‐day readmissions | 1,173 (14%) | 2,430 (14%) | 0.22 | 280 (14%) | 491 (11%) | 0.010 |
ITS analysis results are shown in Table 3. After the intervention, the difference in monthly means between the 2 groups dropped by $16 for cost per day (P = 0.034) and by $128 for cost per visit (P = 0.02). The decreased cost in the intervention group amounts to approximately $251,427 (95% confidence interval [CI]: $20,370‐$482,484) savings over the first year. If the intervention was rolled out for the control group and had a similar impact, it could have led to an additional cost savings of $1,321,669 (95% CI: 107,081‐2,536,256). Moreover, the number of basic metabolic panel, comprehensive metabolic panel, and complete blood count test per day were reduced significantly more in the intervention group compared to the control group (<0.001, 0.004, and <0.001).
| Outcome | Parameter* | Parameter Estimate | Standard Error | t Value | Pr > |t| |
|---|---|---|---|---|---|
| |||||
| Lab cost per day ($) | Baseline difference level (b0) | 9.3450 | 6.5640 | 1.4237 | 0.16 |
| Baseline difference trend (b1) | 0.2150 | 0.7709 | 0.2789 | 0.78 | |
| Change in difference level after intervention(b2) | 16.1200 | 7.3297 | 2.1993 | 0.034 | |
| Change in difference trend after intervention (b3) | 0.2388 | 0.8090 | 0.2952 | 0.77 | |
| Lab cost per visit ($) | Baseline difference level (b0) | 166.081 | 48.3425 | 3.4355 | 0.001 |
| Baseline difference trend (b1) | 3.6663 | 5.8571 | 0.6260 | 0.53 | |
| Change in difference level after intervention(b2) | 128.527 | 53.0278 | 2.4238 | 0.020 | |
| Change in difference trend after intervention (b3) | 2.2586 | 5.8463 | 0.3863 | 0.70 | |
| BMP tests per day | Baseline difference level (b0) | 0.0061 | 0.0250 | 0.2439 | 0.81 |
| Baseline difference trend (b1) | 0.0004 | 0.0030 | 0.1449 | 0.89 | |
| Change in difference level after intervention(b2) | 0.1034 | 0.0276 | 3.7426 | <0.001 | |
| Change in difference trend after intervention (b3) | 0.0014 | 0.0030 | 0.4588 | 0.65 | |
| CMP tests per day | Baseline difference level (b0) | 0.1226 | 0.0226 | 5.4302 | <0.001 |
| Baseline difference trend (b1) | 0.0015 | 0.0028 | 0.5539 | 0.58 | |
| Change in difference level after intervention(b2) | 0.0754 | 0.0248 | 3.0397 | 0.004 | |
| Change in difference trend after intervention (b3) | 0.0030 | 0.0028 | 1.0937 | 0.28 | |
| CBC tests per day | Baseline difference level (b0) | 0.0539 | 0.0190 | 2.8338 | 0.007 |
| Baseline difference trend (b1) | 0.0013 | 0.0023 | 0.5594 | 0.58 | |
| Change in difference level after intervention(b2) | 0.2343 | 0.0213 | 10.997 | <0.001 | |
| Change in difference trend after intervention (b3) | 0.0036 | 0.0023 | 1.5539 | 0.13 | |
| PT/INR tests per day | Baseline difference level (b0) | 0.0413 | 0.0242 | 1.7063 | 0.096 |
| Baseline difference trend (b1) | 0.0040 | 0.0028 | 1.4095 | 0.17 | |
| Change in difference level after intervention(b2) | 0.0500 | 0.0270 | 1.8507 | 0.072 | |
| Change in difference trend after intervention (b3) | 0.0054 | 0.0030 | 1.7940 | 0.080 | |
| LOS, d | Baseline difference level (b0) | 1.4211 | 0.2746 | 5.1743 | <0.001 |
| Baseline difference trend (b1) | 0.0093 | 0.0333 | 0.2807 | 0.78 | |
| Change in difference level after intervention(b2) | 0.1007 | 0.2988 | 0.3368 | 0.74 | |
| Change in difference trend after intervention (b3) | 0.0053 | 0.0331 | 0.1588 | 0.87 | |
| 30‐day readmissions | Baseline difference level (b0) | 0.0057 | 0.0185 | 0.3084 | 0.76 |
| Baseline difference trend (b1) | 0.0017 | 0.0022 | 0.8016 | 0.43 | |
| Change in difference level after intervention(b2) | 0.0110 | 0.0206 | 0.5315 | 0.60 | |
| Change in difference trend after intervention (b3) | 0.0021 | 0.0023 | 0.9111 | 0.37 | |
Figure 1 shows a graphical representation of the biweekly means for the 2 primary outcomeslab cost per day and lab cost per visit. Figure 2 shows all other outcomes. To the right of each figure, P values are provided for the b2 coefficients from Table 3.
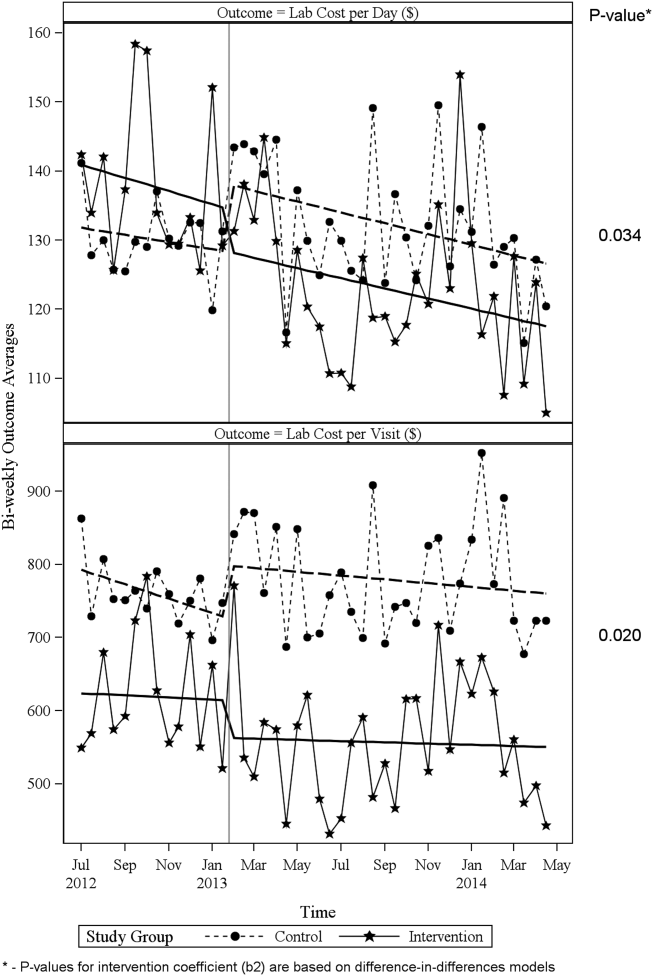
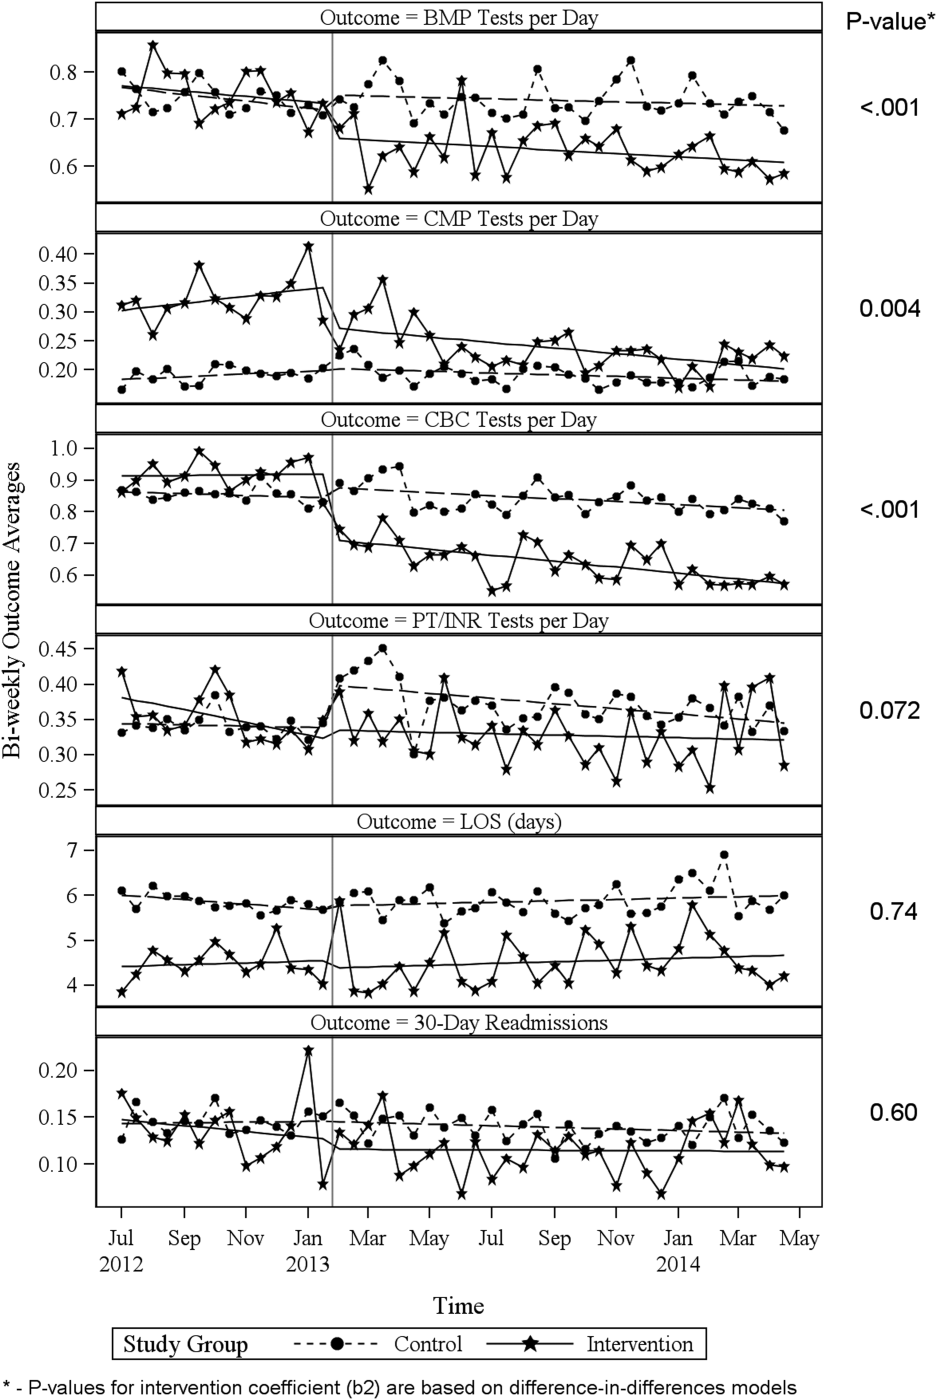
DISCUSSION
Through a multifaceted quality‐improvement initiative, the UUHC hospitalist group was able to reduce lab cost per day and per visit as well as commonly ordered routine labs as compared to an institutional control group. A multifaceted approach was selected given the literature supporting this approach as the most likely method to sustain improvement.[14] At the same time, the use of a multifaceted intervention makes it difficult to rigorously determine the relative impact of different components of the intervention. In discussing this issue, however, the hospitalist group felt that the driving factors for change were those related to process change, specifically, the use of a standardized rounding checklist to discuss lab testing and the routine review of lab costs at group meetings. The ultimate goal was to change the culture of routine test ordering into a thoughtful process of needed tests and thereby reduce costs. Prior to this intervention, the least experienced person on this team (the intern) ordered any test he or she wanted, usually without discussion. The intervention focused on this issue through standardized supervision and explicit discussion of laboratory tests. Importantly, although improvements from education initiatives typically decrease over time, the incorporation of process change in this intervention was felt to likely contribute to the sustained reduction seen at 15 months. Although use of the rounding checklist added another step to daily rounds, the routine cost feedback, including comparisons to peers, helped encourage use of the checklist. Thus, we feel that routine feedback was essential to sustaining the intervention and its impact.
Inappropriate and unnecessary testing has been recognized for decades, and multiple interventions have been attempted, including a recent article that demonstrated a 10% reduction in common laboratory ordering through an initiative mainly focused on education and ordering feedback.[25] Despite reported success of several interventions, none have combined multiple interventions and explicitly required discussion of laboratory tests on rounds. For example, although the UUHC intervention used Attali et al.[21] and Barie and Hydo's[20] work to develop the intervention, neither of these studies described how laboratory testing was discussed with the attending or supervising resident. The UUHC intervention thus builds on the current literature by combining other successful modalities with explicit discussion of laboratory testing via a rounding checklist and feedback with the novel VDO tool to reduce laboratory costs. A major strength of this intervention is the relatively low cost and the generalizability of implementing rounding checklists. Initial support from the hospital was needed to provide accurate VDO information to the hospitalist group. However, ongoing costs were minimal and related to any additional time spent during rounds to discuss laboratory tests. Thus, we feel that this intervention is feasible for wide replication.
Another strength of the study is the use of the VDO tool to measure actual costs. Whereas previous studies have relied on estimated costs with extrapolation to potential cost savings, this study used direct costs to the institution as a more accurate marker of cost savings. Additionally, most studies on lab utilization have used a before/after analysis without a control group. The presence of a control group for this analysis is important to help assess for institutional trends that may not be reflected in a before/after intervention. The reduction in cost in the intervention group despite a trend toward increased cost in the institutional control group supports the impact of this intervention.
Limitations of this study include that it was a single‐center, controlled ITS study and not a randomized controlled trial. Related to this limitation, the control group reflected a different patient population compared to the intervention group, with a longer LOS, lower CCI, and inclusion of nonmedical patients. However, these differences were relatively stable before and after the intervention. Also, ITS is considered one of the most robust research designs outside of randomized controlled trials, and it accounts for baseline differences in both levels and trends.[24] Nevertheless, it remains possible that secular trends existed that we did not capture and that affected the 2 populations differently.
A further limitation is that the baseline period was only 7 months and the intervention was 15 months. As the 7 months started in July, this could have reflected the time when interns were least experienced with ordering. Unfortunately, we did not have VDO availability for a full year prior to the intervention. We believe that any major effect due to this shortened baseline period should have been seen in the control group as well, and therefore accounted for in the analysis. Additionally, it is possible that there was spillover of the intervention to the control group, as internal medicine residents rotated throughout the hospital to other medical services (pulmonary, cardiology, hematology, and oncology). However, any effect of their rotation should have been to lower the control lab cost, thus making differences less profound.
CONCLUSIONS
A multifaceted approach to laboratory reduction through education, process change, cost feedback, and financial incentive resulted in a significant reduction in laboratory cost per day, laboratory cost per visit, and the ordering of common laboratory tests at a major academic medical center.
Acknowledgements
The authors thank Mr. Michael Swanicke for his assistance in process engineering, Mr. Tony Clawson for his routine provision of VDO data, and Ms. Selma Lopez for her editorial support.
Disclosures: K.K. is or has been a consultant on clinical decision support (CDS) or electronic clinical quality measurement to the US Office of the National Coordinator for Health IT, ARUP Laboratories, McKesson InterQual, ESAC, Inc., JBS International, Inc., Inflexxion, Inc., Intelligent Automation, Inc., Partners HealthCare, Mayo Clinic, and the RAND Corporation. K.K. receives royalties for a Duke University‐owned CDS technology for infectious disease management known as CustomID that he helped develop. K.K. was formerly a consultant for Religent, Inc. and a co‐owner and consultant for Clinica Software, Inc., both of which provide commercial CDS services, including through use of a CDS technology known as SEBASTIAN that K.K. developed. K.K. no longer has a financial relationship with either Religent or Clinica Software. K.K. has no competing interest with any specific product or intervention evaluated in this article. All other authors declare no competing interests.
- , , , et al. National health expenditure projections, 2014–24: spending growth faster than recent trends. Health Aff (Millwood). 2015;34(8):1407–1417.
- , . Eliminating waste in US health care. JAMA. 2012;307(14):1513–1516.
- , , , et al. Utilization of arterial blood gas measurements in a large tertiary care hospital. Am J Clin Pathol. 2007;127:604–609.
- , . Strategies to promote rational clinical chemistry test utilization. Clin Biochem. 1996;29:291–299.
- , , , , . The landscape of inappropriate laboratory testing: a 15‐year meta‐analysis. PLoS One. 2013;8:e78962.
- ABIM Choosing Wisely Society of Hospital Medicine–Adult Hospital Medicine. Five things physicians and patients should question. Available at: http://www.choosingwisely.org/societies/society‐of‐hospital‐medicine‐adult. Published February 21, 2013. Accessed September 2, 2015.
- , , , , , . Effect of daily charge feedback on inpatient charges and physician knowledge and behavior. Arch Intern Med. 1989;149:426–429.
- , , , et al. A utilization management intervention to reduce unnecessary testing in the coronary care unit. Arch Intern Med. 2002;162:1885–1890.
- , , , et al. The impact of peer management on test‐ordering behavior. Ann Intern Med. 2004;141:196–204.
- , , , , . An administrative intervention to improve the utilization of laboratory tests within a university hospital. Int J Qual Health Care. 2005;17:243–248.
- , , , et al. Impact of providing fee data on laboratory test ordering. JAMA Intern Med. 2013;173(10):903–908.
- , , , et al. The failure of physician education as a cost containment strategy. JAMA. 1984;252:225–230.
- . Is that lab test necessary? Am J Clin Pathol. 2006;126:335–336.
- , , , . Techniques to improve physicians' use of diagnostic tests. JAMA. 1998;280:2020–2027.
- , , . Laboratory testing in the intensive care unit. Crit Care Clin. 2007;23:435–465.
- . Complications of critical care: lab testing and iatrogenic anemia. MLO Med Lab Obs. 200;33(10):28–31.
- , , , et al. Contemporary bloodletting in cardiac surgical care. Ann Thorac Surg. 2015;99:779–785.
- , , , et al. Value Driven Outcomes (VDO): a pragmatic, modular, and extensible software framework for understanding and improving health care costs and outcomes. J Am Med Inform Assoc. 2015:22:223–235.
- , , . The impact of residents, interns, and attendings on inpatient laboratory ordering patterns: a report from one university's hospitalist service. Acad Med. 2011;86:139–145.
- , . Learning to not know: results of a program for ancillary cost reduction in surgical care. J Trauma. 1996;41:714–720.
- , , , et al. A cost‐effective method for reducing the volume of laboratory tests in a university‐associated teaching hospital. Mt Sinai J Med. 2006;73:787–794.
- US Bureau of Labor Statistics. CPI inflation calculator. Available at: http://www.bls.gov/data/inflation_calculator.htm. Accessed May 22, 2015.
- , , , et al. Coding algorithms for defining comorbidities in ICD‐9‐CM and ICD‐10 administrative data. Med Care. 2005;43:113–1139.
- , , , . Segmented regression analysis of interrupted time series studies in medication use research. J Clin Pharm Ther. 2002;27(4):299–309.
- , , , et al. A multifaceted hospitalist quality improvement intervention: decreased frequency of common labs. J Hosp Med. 2015;10:390–395.
Healthcare costs continue to increase and are estimated to be approximately $3.1 trillion per year in the United States.[1] Waste is a major contributor to this cost, accounting for an estimated $910 billion/year.[2] Laboratory tests are well documented to contribute to healthcare waste, with an estimated 30% to 50% of tests for hospitalized patients being unnecessary.[3, 4, 5] This issue has been highlighted by the American Board of Internal Medicine Foundation's Choosing Wisely campaign as an area to reduce waste.[6] Evaluating this concern locally, a University Health Systems Consortium 2011 analysis indicated that the University of Utah general internal medicine hospitalist service had a higher average direct lab cost per discharge compared to top performers, indicating an opportunity for improvement.
Multiple interventions have been described in the literature to address excessive laboratory utilization, including physician education, audit and feedback, cost information display, and administrative rules restricting certain types of ordering.[7, 8, 9, 10, 11] Despite these interventions, barriers remain common and not all interventions are sustained. For example, interventions focused mainly on education see a small improvement initially that is not sustained.[4, 12, 13] Additionally, although most studies focus on individual interventions, those that target multiple factors have been found to be more successful at producing and sustaining change.[14] Therefore, the opportunity existed to incorporate multiple etiologies into a single intervention and apply a checklist to laboratory ordering to see if combined modalities could be effective at reducing laboratory costs in a sustainable manner.
In addition to cost, there is potential patient harm resulting from unnecessary laboratory testing. For prolonged hospitalizations, anemia is a well‐recognized side effect of phlebotomy,[15, 16] and a recent evaluation of cardiac surgery patients found an average cumulative blood loss due to phlebotomy of 454 mL/hospital stay.[17] The sheer number of tests ordered can lead to false positive tests that result in additional testing and monitoring. Furthermore, patients subjected to laboratory blood draws are often awakened early in the morning, which is unpleasant and could adversely affect the patient experience.
Recognizing laboratory cost as a problem, the University of Utah general internal medicine hospitalist service implemented a multifaceted quality‐improvement initiative with a goal to reduce laboratory testing. At the time of this project, University of Utah Health Care (UUHC) developed a Value Driven Outcomes (VDO) tool to give direct data related to costs of care, including the actual cost paid by the hospital to the university‐owned laboratory vendor (ARUP Laboratories, Salt Lake City, UT) for testing.[18] The hospitalist group incorporated VDO into the initiative for routine cost feedback. This study evaluates the impact of this intervention on laboratory costs.
METHODS
Design
A retrospective, controlled, interrupted time series (ITS) study was performed to compare changes in lab costs between hospitalists (intervention study group) and other providers (control study group). The intervention initiation date was February 1, 2013. The baseline period was July 1, 2012 to January 31, 2013, as that was the period in which the VDO tool became available for cost analysis prior to intervention. The intervention period was February 1, 2013 to April 30, 2014, as there was a change in the electronic health record (EHR) in May 2014 that affected data flow and could act as a major confounder. The institutional review board classified this project as quality improvement and did not require review and oversight.
Setting
UUHC is a 500‐bed academic medical center in Salt Lake City, Utah. The hospitalist service is a teaching service composed of 4 teams with internal medicine residents and medical students. The nonhospitalist services include all surgical services, as well as pulmonary, cardiology, hematology, and oncology services on which internal medicine residents rotate. All services at UUHC are staffed by academic physicians affiliated with the University of Utah School of Medicine.
Population
All patients 18 years and older admitted to the hospital to a service other than obstetrics, rehabilitation, or psychiatry between July 1, 2012 and April 30, 2014 were evaluated. Patients with missing data for outcomes or covariates were excluded.
Intervention
Initial evaluation included an informal review of patient charts and discussion with hospitalist group members, both indicating laboratory overuse. A working group was then established including hospitalists and process engineers to evaluate the workflow by which laboratory tests were ordered. Concurrently, a literature review was performed to help identify the scope of the problem and evaluate methods that had been successful at other institutions. Through this review, it was noted that interns were the most frequent orderers of tests and the largest contributors to variation of testing for inpatients.[19] Two specific studies with direct applicability to this project demonstrated that discussion of costs with attendings in a trauma intensive care unit resulted in a 30% reduction of tests ordered,[20] and discussion of testing with a senior resident in an internal medicine inpatient setting demonstrated a 20% reduction in laboratory testing.[21]
Our laboratory reduction intervention expanded on the current literature to incorporate education, process change, cost feedback, and financial incentives. Specifically, starting February 1, 2013, the following interventions were performed:
- Education of all providers involved, including the hospitalist group and all internal medicine residents at the start of their rotation with the hospitalist service. Education included a 30‐minute discussion of laboratory overuse, costs associated with laboratory overuse, previous interventions and their success, and current intervention with goals. Each resident was provided a pocket card with the most common lab tests and associated charges. Charges were used instead of costs due to concerns regarding the possible public dissemination of institutional costs.
- Standardization of the rounding process including a checklist review (see Supporting Information, Appendix, in the online version of this article) for all patients that ensured discussion of labs, telemetry, pain, lines/tubes, nursing presence, and follow‐up needed. The expectation was that all plans for lab testing would be discussed during rounds. The third‐year medical student was responsible to ensure that all items were covered daily on each patient.
- Monthly feedback at the hospitalist group meeting regarding laboratory costs using the VDO tool. Data were presented as a monthly group average and compared to preintervention baseline costs. Individual performance could be viewed and compared to other providers within the group.
- Financial incentive through a program that shares 50% of cost savings realized by the hospital with the Division of General Internal Medicine. The incentive could be used to support future quality‐improvement projects, but there was no individual physician incentive.
Data Collection and Preparation
Clinical data were collected in the inpatient EHR (Cerner Corp., Kansas City, MO) and later imported into the enterprise data warehouse (EDW) as part of the normal data flow. Billing data were imported into the EDW from the billing system. Cost data were estimated using the VDO tool developed by the University of Utah to identify clinical costs to the UUHC system.[18]
Clinical and Cost Outcomes
We hypothesized that following the intervention, the number of tests and lab costs would decrease greater for patients in the intervention group than in the control group, with no adverse effect on length of stay (LOS) or 30‐day readmissions.
Lab cost per day was calculated as the total lab cost per visit divided by the LOS. We adjusted all lab costs to 2013 US dollars using Consumer Price Index inflation data.[22] To account for different LOS, we used LOS as a weight variable when estimating descriptive characteristics and P values for lab cost per day and the number of tests. Thirty‐day readmissions included inpatient encounters followed by another inpatient encounter within 30 days excluding obstetrics, rehabilitation, and psychiatry visits.
Descriptive Variables
We included information on age at admission in years and Charlson Comorbidity Index (CCI) to evaluate differences in control and intervention groups.[23]
Statistical Analysis
First, unadjusted descriptive statistics were calculated for study outcomes and visit characteristics. Descriptive statistics were expressed as n (%) and mean standard deviation. Simple comparisons were performed based on 2 tests of homogeneity for categorical variables and on t tests for continuous variables.
Second, an ITS analysis was conducted to evaluate the impact of the intervention while accounting for baseline trends.[24] In this analysis, the dependent variable (yt) was the difference in aggregated outcome measures between the intervention and control groups every 2 weeks (eg, difference in average lab costs in a given 2‐week period between the 2 groups). Intervention impact was then evaluated in terms of changes in the level of the outcome (b2) as well as in the trend over time (b3) compared to the initial difference in means (b0) and baseline trend (b1). The following difference‐in‐differences segmented regression model was fitted using the autoreg procedure in SAS: yt = b0 + b1*timet + b2*study periodt + b3*time after the interventiont + errort, where timet is biweekly intervals after the beginning of the study, time after the interventiont is biweekly intervals after the intervention date, and study periodt is 1 postintervention and 0 preintervention. The models were fitted using maximum likelihood and stepwise autoregression to test 24 lags.
P values <0.05 were considered significant. SAS (version 9.3; SAS Institute Inc., Cary, NC) was used for data analysis.
RESULTS
We analyzed 48,327 inpatient visits that met inclusion criteria. We excluded 15,659 obstetrics, rehabilitation, and psychiatry visits. Seven hundred seventy‐two (2.4%) of the remaining visits were excluded due to missing data. A total of 31,896 inpatient visits by 22,545 patients were included in the analysis. There were 10,136 visits before the intervention and 21,760 visits after. Characteristics of the study groups for the full study timeframe (July 1, 2012April 30, 2014) are summarized in Table 1.
| Characteristic | Study Group* | |||
|---|---|---|---|---|
| Overall, N = 31,896 | Control, N = 25,586 | Intervention, N = 6,310 | P Value | |
| ||||
| Patient characteristics | ||||
| Age, y | 55.47 17.61 | 55.27 17.13 | 56.30 19.39 | <0.001 |
| Female gender | 14,995 (47%) | 11,753 (46%) | 3,242 (51%) | <0.001 |
| CCI | 3.73 3.25 | 3.61 3.17 | 4.20 3.54 | <0.001 |
| Outcomes | ||||
| Cost per day, $ | 130.95 392.16 | 131.57 423.94 | 127.68 220.40 | 0.022 |
| Cost per visit, $ | 733.75 1,693.98 | 772.30 1,847.65 | 577.40 795.29 | <0.001 |
| BMP tests per day | 0.73 1.17 | 0.74 1.19 | 0.67 1.05 | <0.001 |
| CMP tests per day | 0.20 0.67 | 0.19 0.68 | 0.26 0.62 | <0.001 |
| CBC tests per day | 0.83 1.10 | 0.84 1.15 | 0.73 0.82 | <0.001 |
| PT/INR tests per day | 0.36 1.03 | 0.36 1.07 | 0.34 0.83 | <.001 |
| LOS, d | 5.60 7.12 | 5.87 7.55 | 4.52 4.82 | <0.001 |
| 30‐day readmissions | 4,374 (14%) | 3,603 (14%) | 771 (12%) | <0.001 |
During the study period, there were 25,586 visits in the control group and 6310 visits in the intervention group. Patients in the intervention group were on average older than patients in the control group. There were more female patients in the intervention group. Mean CCI was 4.2 in the intervention group and 3.6 in the control group. The intervention group had lower LOS and 30‐day readmissions than the control group.
Descriptive statistics and simple comparisons of covariates and outcomes before and after the intervention are shown in Table 2. Age and gender distributions remained unchanged in both groups. CCI increased in the control group by 0.24 (P < 0.001) and remained unchanged in the intervention group. In the intervention group, lab cost per day was reduced from $138 before the intervention to $123 after the intervention (P < 0.001). In contrast, among control patients, cost per day increased nonsignificantly from $130 preintervention to $132 postintervention (P = 0.37). Number of tests per day significantly decreased for all specific tests in the intervention group. Readmission rates decreased significantly from 14% to 11% in the intervention group (P = 0.01). LOS remained constant in both groups.
| Characteristic* | Control | Intervention | ||||
|---|---|---|---|---|---|---|
| Preintervention, N = 8,102 | Postintervention, N = 17,484 | P Value | Preintervention, N = 2,034 | Postintervention, N = 4,276 | P Value | |
| ||||||
| Patient characteristics | ||||||
| Age, yr | 55.17 17.46 | 55.31 16.98 | 0.55 | 55.90 19.47 | 56.50 19.35 | 0.25 |
| Female gender | 3,707 (46%) | 8,046 (46%) | 0.69 | 1,039 (51%) | 2,203 (52%) | 0.74 |
| CCI | 3.45 3.06 | 3.69 3.21 | <0.001 | 4.19 3.51 | 4.20 3.56 | 0.89 |
| Outcomes | ||||||
| Cost per day, $ | 130.1 431.8 | 132.2 420.3 | 0.37 | 137.9 232.9 | 122.9 213.5 | <0.001 |
| Cost per visit, $ | 760.4 1,813.6 | 777.8 1,863.3 | 0.48 | 617.8 844.1 | 558.2 770.3 | 0.005 |
| BMP tests per day | 0.74 1.21 | 0.74 1.18 | 0.67 | 0.75 1.03 | 0.63 1.05 | <0.001 |
| CMP tests per day | 0.19 0.68 | 0.19 0.68 | 0.85 | 0.32 0.68 | 0.23 0.58 | <0.001 |
| CBC tests per day | 0.85 1.14 | 0.84 1.15 | 0.045 | 0.92 0.79 | 0.64 0.76 | <0.001 |
| PT/INR tests per day | 0.34 1.04 | 0.37 1.08 | <0.001 | 0.35 0.82 | 0.33 0.84 | 0.020 |
| LOS, d | 5.84 7.66 | 5.88 7.50 | 0.71 | 4.48 5.12 | 4.54 4.67 | 0.63 |
| 30‐day readmissions | 1,173 (14%) | 2,430 (14%) | 0.22 | 280 (14%) | 491 (11%) | 0.010 |
ITS analysis results are shown in Table 3. After the intervention, the difference in monthly means between the 2 groups dropped by $16 for cost per day (P = 0.034) and by $128 for cost per visit (P = 0.02). The decreased cost in the intervention group amounts to approximately $251,427 (95% confidence interval [CI]: $20,370‐$482,484) savings over the first year. If the intervention was rolled out for the control group and had a similar impact, it could have led to an additional cost savings of $1,321,669 (95% CI: 107,081‐2,536,256). Moreover, the number of basic metabolic panel, comprehensive metabolic panel, and complete blood count test per day were reduced significantly more in the intervention group compared to the control group (<0.001, 0.004, and <0.001).
| Outcome | Parameter* | Parameter Estimate | Standard Error | t Value | Pr > |t| |
|---|---|---|---|---|---|
| |||||
| Lab cost per day ($) | Baseline difference level (b0) | 9.3450 | 6.5640 | 1.4237 | 0.16 |
| Baseline difference trend (b1) | 0.2150 | 0.7709 | 0.2789 | 0.78 | |
| Change in difference level after intervention(b2) | 16.1200 | 7.3297 | 2.1993 | 0.034 | |
| Change in difference trend after intervention (b3) | 0.2388 | 0.8090 | 0.2952 | 0.77 | |
| Lab cost per visit ($) | Baseline difference level (b0) | 166.081 | 48.3425 | 3.4355 | 0.001 |
| Baseline difference trend (b1) | 3.6663 | 5.8571 | 0.6260 | 0.53 | |
| Change in difference level after intervention(b2) | 128.527 | 53.0278 | 2.4238 | 0.020 | |
| Change in difference trend after intervention (b3) | 2.2586 | 5.8463 | 0.3863 | 0.70 | |
| BMP tests per day | Baseline difference level (b0) | 0.0061 | 0.0250 | 0.2439 | 0.81 |
| Baseline difference trend (b1) | 0.0004 | 0.0030 | 0.1449 | 0.89 | |
| Change in difference level after intervention(b2) | 0.1034 | 0.0276 | 3.7426 | <0.001 | |
| Change in difference trend after intervention (b3) | 0.0014 | 0.0030 | 0.4588 | 0.65 | |
| CMP tests per day | Baseline difference level (b0) | 0.1226 | 0.0226 | 5.4302 | <0.001 |
| Baseline difference trend (b1) | 0.0015 | 0.0028 | 0.5539 | 0.58 | |
| Change in difference level after intervention(b2) | 0.0754 | 0.0248 | 3.0397 | 0.004 | |
| Change in difference trend after intervention (b3) | 0.0030 | 0.0028 | 1.0937 | 0.28 | |
| CBC tests per day | Baseline difference level (b0) | 0.0539 | 0.0190 | 2.8338 | 0.007 |
| Baseline difference trend (b1) | 0.0013 | 0.0023 | 0.5594 | 0.58 | |
| Change in difference level after intervention(b2) | 0.2343 | 0.0213 | 10.997 | <0.001 | |
| Change in difference trend after intervention (b3) | 0.0036 | 0.0023 | 1.5539 | 0.13 | |
| PT/INR tests per day | Baseline difference level (b0) | 0.0413 | 0.0242 | 1.7063 | 0.096 |
| Baseline difference trend (b1) | 0.0040 | 0.0028 | 1.4095 | 0.17 | |
| Change in difference level after intervention(b2) | 0.0500 | 0.0270 | 1.8507 | 0.072 | |
| Change in difference trend after intervention (b3) | 0.0054 | 0.0030 | 1.7940 | 0.080 | |
| LOS, d | Baseline difference level (b0) | 1.4211 | 0.2746 | 5.1743 | <0.001 |
| Baseline difference trend (b1) | 0.0093 | 0.0333 | 0.2807 | 0.78 | |
| Change in difference level after intervention(b2) | 0.1007 | 0.2988 | 0.3368 | 0.74 | |
| Change in difference trend after intervention (b3) | 0.0053 | 0.0331 | 0.1588 | 0.87 | |
| 30‐day readmissions | Baseline difference level (b0) | 0.0057 | 0.0185 | 0.3084 | 0.76 |
| Baseline difference trend (b1) | 0.0017 | 0.0022 | 0.8016 | 0.43 | |
| Change in difference level after intervention(b2) | 0.0110 | 0.0206 | 0.5315 | 0.60 | |
| Change in difference trend after intervention (b3) | 0.0021 | 0.0023 | 0.9111 | 0.37 | |
Figure 1 shows a graphical representation of the biweekly means for the 2 primary outcomeslab cost per day and lab cost per visit. Figure 2 shows all other outcomes. To the right of each figure, P values are provided for the b2 coefficients from Table 3.
DISCUSSION
Through a multifaceted quality‐improvement initiative, the UUHC hospitalist group was able to reduce lab cost per day and per visit as well as commonly ordered routine labs as compared to an institutional control group. A multifaceted approach was selected given the literature supporting this approach as the most likely method to sustain improvement.[14] At the same time, the use of a multifaceted intervention makes it difficult to rigorously determine the relative impact of different components of the intervention. In discussing this issue, however, the hospitalist group felt that the driving factors for change were those related to process change, specifically, the use of a standardized rounding checklist to discuss lab testing and the routine review of lab costs at group meetings. The ultimate goal was to change the culture of routine test ordering into a thoughtful process of needed tests and thereby reduce costs. Prior to this intervention, the least experienced person on this team (the intern) ordered any test he or she wanted, usually without discussion. The intervention focused on this issue through standardized supervision and explicit discussion of laboratory tests. Importantly, although improvements from education initiatives typically decrease over time, the incorporation of process change in this intervention was felt to likely contribute to the sustained reduction seen at 15 months. Although use of the rounding checklist added another step to daily rounds, the routine cost feedback, including comparisons to peers, helped encourage use of the checklist. Thus, we feel that routine feedback was essential to sustaining the intervention and its impact.
Inappropriate and unnecessary testing has been recognized for decades, and multiple interventions have been attempted, including a recent article that demonstrated a 10% reduction in common laboratory ordering through an initiative mainly focused on education and ordering feedback.[25] Despite reported success of several interventions, none have combined multiple interventions and explicitly required discussion of laboratory tests on rounds. For example, although the UUHC intervention used Attali et al.[21] and Barie and Hydo's[20] work to develop the intervention, neither of these studies described how laboratory testing was discussed with the attending or supervising resident. The UUHC intervention thus builds on the current literature by combining other successful modalities with explicit discussion of laboratory testing via a rounding checklist and feedback with the novel VDO tool to reduce laboratory costs. A major strength of this intervention is the relatively low cost and the generalizability of implementing rounding checklists. Initial support from the hospital was needed to provide accurate VDO information to the hospitalist group. However, ongoing costs were minimal and related to any additional time spent during rounds to discuss laboratory tests. Thus, we feel that this intervention is feasible for wide replication.
Another strength of the study is the use of the VDO tool to measure actual costs. Whereas previous studies have relied on estimated costs with extrapolation to potential cost savings, this study used direct costs to the institution as a more accurate marker of cost savings. Additionally, most studies on lab utilization have used a before/after analysis without a control group. The presence of a control group for this analysis is important to help assess for institutional trends that may not be reflected in a before/after intervention. The reduction in cost in the intervention group despite a trend toward increased cost in the institutional control group supports the impact of this intervention.
Limitations of this study include that it was a single‐center, controlled ITS study and not a randomized controlled trial. Related to this limitation, the control group reflected a different patient population compared to the intervention group, with a longer LOS, lower CCI, and inclusion of nonmedical patients. However, these differences were relatively stable before and after the intervention. Also, ITS is considered one of the most robust research designs outside of randomized controlled trials, and it accounts for baseline differences in both levels and trends.[24] Nevertheless, it remains possible that secular trends existed that we did not capture and that affected the 2 populations differently.
A further limitation is that the baseline period was only 7 months and the intervention was 15 months. As the 7 months started in July, this could have reflected the time when interns were least experienced with ordering. Unfortunately, we did not have VDO availability for a full year prior to the intervention. We believe that any major effect due to this shortened baseline period should have been seen in the control group as well, and therefore accounted for in the analysis. Additionally, it is possible that there was spillover of the intervention to the control group, as internal medicine residents rotated throughout the hospital to other medical services (pulmonary, cardiology, hematology, and oncology). However, any effect of their rotation should have been to lower the control lab cost, thus making differences less profound.
CONCLUSIONS
A multifaceted approach to laboratory reduction through education, process change, cost feedback, and financial incentive resulted in a significant reduction in laboratory cost per day, laboratory cost per visit, and the ordering of common laboratory tests at a major academic medical center.
Acknowledgements
The authors thank Mr. Michael Swanicke for his assistance in process engineering, Mr. Tony Clawson for his routine provision of VDO data, and Ms. Selma Lopez for her editorial support.
Disclosures: K.K. is or has been a consultant on clinical decision support (CDS) or electronic clinical quality measurement to the US Office of the National Coordinator for Health IT, ARUP Laboratories, McKesson InterQual, ESAC, Inc., JBS International, Inc., Inflexxion, Inc., Intelligent Automation, Inc., Partners HealthCare, Mayo Clinic, and the RAND Corporation. K.K. receives royalties for a Duke University‐owned CDS technology for infectious disease management known as CustomID that he helped develop. K.K. was formerly a consultant for Religent, Inc. and a co‐owner and consultant for Clinica Software, Inc., both of which provide commercial CDS services, including through use of a CDS technology known as SEBASTIAN that K.K. developed. K.K. no longer has a financial relationship with either Religent or Clinica Software. K.K. has no competing interest with any specific product or intervention evaluated in this article. All other authors declare no competing interests.
- , , , et al. National health expenditure projections, 2014–24: spending growth faster than recent trends. Health Aff (Millwood). 2015;34(8):1407–1417.
- , . Eliminating waste in US health care. JAMA. 2012;307(14):1513–1516.
- , , , et al. Utilization of arterial blood gas measurements in a large tertiary care hospital. Am J Clin Pathol. 2007;127:604–609.
- , . Strategies to promote rational clinical chemistry test utilization. Clin Biochem. 1996;29:291–299.
- , , , , . The landscape of inappropriate laboratory testing: a 15‐year meta‐analysis. PLoS One. 2013;8:e78962.
- ABIM Choosing Wisely Society of Hospital Medicine–Adult Hospital Medicine. Five things physicians and patients should question. Available at: http://www.choosingwisely.org/societies/society‐of‐hospital‐medicine‐adult. Published February 21, 2013. Accessed September 2, 2015.
- , , , , , . Effect of daily charge feedback on inpatient charges and physician knowledge and behavior. Arch Intern Med. 1989;149:426–429.
- , , , et al. A utilization management intervention to reduce unnecessary testing in the coronary care unit. Arch Intern Med. 2002;162:1885–1890.
- , , , et al. The impact of peer management on test‐ordering behavior. Ann Intern Med. 2004;141:196–204.
- , , , , . An administrative intervention to improve the utilization of laboratory tests within a university hospital. Int J Qual Health Care. 2005;17:243–248.
- , , , et al. Impact of providing fee data on laboratory test ordering. JAMA Intern Med. 2013;173(10):903–908.
- , , , et al. The failure of physician education as a cost containment strategy. JAMA. 1984;252:225–230.
- . Is that lab test necessary? Am J Clin Pathol. 2006;126:335–336.
- , , , . Techniques to improve physicians' use of diagnostic tests. JAMA. 1998;280:2020–2027.
- , , . Laboratory testing in the intensive care unit. Crit Care Clin. 2007;23:435–465.
- . Complications of critical care: lab testing and iatrogenic anemia. MLO Med Lab Obs. 200;33(10):28–31.
- , , , et al. Contemporary bloodletting in cardiac surgical care. Ann Thorac Surg. 2015;99:779–785.
- , , , et al. Value Driven Outcomes (VDO): a pragmatic, modular, and extensible software framework for understanding and improving health care costs and outcomes. J Am Med Inform Assoc. 2015:22:223–235.
- , , . The impact of residents, interns, and attendings on inpatient laboratory ordering patterns: a report from one university's hospitalist service. Acad Med. 2011;86:139–145.
- , . Learning to not know: results of a program for ancillary cost reduction in surgical care. J Trauma. 1996;41:714–720.
- , , , et al. A cost‐effective method for reducing the volume of laboratory tests in a university‐associated teaching hospital. Mt Sinai J Med. 2006;73:787–794.
- US Bureau of Labor Statistics. CPI inflation calculator. Available at: http://www.bls.gov/data/inflation_calculator.htm. Accessed May 22, 2015.
- , , , et al. Coding algorithms for defining comorbidities in ICD‐9‐CM and ICD‐10 administrative data. Med Care. 2005;43:113–1139.
- , , , . Segmented regression analysis of interrupted time series studies in medication use research. J Clin Pharm Ther. 2002;27(4):299–309.
- , , , et al. A multifaceted hospitalist quality improvement intervention: decreased frequency of common labs. J Hosp Med. 2015;10:390–395.
© 2016 Society of Hospital Medicine

Therapeutic hypothermia called biggest recent advance in cardiac arrest
SNOWMASS, COLO. – By far the most-important contributor to improved outcomes following out-of-hospital cardiac arrest during the past decade has been therapeutic hypothermia, Dr. N.A. Mark Estes III said at the Annual Cardiovascular Conference at Snowmass.
The No. 1 cause of in-hospital death in patients who arrive at the hospital with a perfusable rhythm following resuscitation from out-of-hospital cardiac arrest isn’t sepsis, hepatic or renal failure, or cardiogenic shock. It’s neurologic death caused by anoxic brain injury, which begins several hours after cardiac arrest and continues for about 48 hours. This is where therapeutic hypothermia has made a huge difference, said Dr. Estes, professor of medicine and director of cardiac arrhythmia services at Tufts University, Boston.

“One-half of out-of-hospital cardiac arrest survivors experience secondary anoxic brain damage of varying degrees. Until recently, there was no treatment with documented efficacy in preventing this damage. Despite multiple agents being looked at for neuroprevention, none really has worked. But therapeutic hypothermia has drastically improved outcomes. More than half of patients who arrive at the hospital with a perfusable rhythm and receive therapeutic hypothermia are discharged relatively neurologically intact. That’s a huge difference from what we used to see,” the electrophysiologist observed.
Indeed, the proportion of U.S. patients who experience out-of-hospital cardiac arrest and survive to hospital discharge neurologically intact is “dismal” at about 10%, he noted.
Virtually all specialized cardiac arrest centers now provide therapeutic hypothermia using various protocols. The demonstrated effectiveness of this postresuscitation therapy was an impetus for the American Heart Association policy statement calling for creation of regional cardiac resuscitation systems of care (Circulation. 2010 Feb 9;121[5]:709-29). To date, however, such organized systems exist in only a handful of states or portions of states.
Nonetheless, when an out-of-hospital cardiac arrest patient arrives at a community hospital that can’t provide emergency coronary angiography and therapeutic hypothermia, it’s appropriate to stabilize that patient in the emergency department and then transfer to a hospital that can, according to Dr. Estes.
The mechanism by which therapeutic hypothermia works has been well elucidated. The treatment curbs the process by which ischemia as a second blow triggers formation of oxygen free radicals, glutamate release, calcium shifts, and mitochondrial dysfunction, with resultant destruction of brain tissue.
Roughly 250,000 sudden cardiac deaths (SCDs) occur annually in this country. In addition to more widespread availability of therapeutic hypothermia and other forms of specialized postresuscitation care through creation of regional systems of care for out-of-hospital cardiac arrest, there are other opportunities for improving outcomes. These include earlier activation of the chain of survival that begins with a bystander dialing 911 as well as greater availability of public access defibrillation.
Dr. Estes emphasized that while these measures will further improve outcomes of cardiac arrest, they won’t actually reduce its frequency. By far the greatest opportunity in that realm lies in primordial prevention of coronary artery disease; that is, prevention of the risk factors for CAD. After all, he noted, 80% of all SCDs are associated with underlying ischemic heart disease. In 30% of SCDs, the fatal event is the first manifestation of previously unrecognized CAD. Another one-third of SCDs occur in patients with known CAD, but who weren’t considered at high risk for SCD because of their preserved left ventricular ejection fraction.
“There are a number of luminaries in the field who feel that if we’re really going to make an impact on sudden cardiac death, it’s going to be through primordial prevention of CAD,” the cardiologist said.

For this reason, he was thrilled to hear Dr. Robert A. Vogel elsewhere at the conference describe research by investigators at Affiris AG in Vienna who’ve created a peptide-based vaccine that inhibits PCSK9. Moreover, they showed it to be effective in sharply lowering LDL in mice (PLoS One. 2014 Dec 4;9[12]:e114469).
“I believe that in my lifetime, we will have an antiatherosclerotic vaccine that will lower LDL to an extent where this disease will not disappear but may get to a manageable extent, perhaps a 10% lifetime risk instead of the 55% lifetime risk of MI or stroke that we as Americans currently have,” predicted Dr. Vogel of the University of Colorado, Denver.
Dr. Vogel reported serving as a consultant to the National Football League and the Pritikin Longevity Center as well as acting as the national coordinator for the Sanofi-sponsored ODYSSEY Outcomes trial studying the PCSK9 inhibitor alirocumab (Praluent).
Dr. Estes reported serving as a consultant to Boston Scientific, Medtronic, and St. Jude Medical.
SNOWMASS, COLO. – By far the most-important contributor to improved outcomes following out-of-hospital cardiac arrest during the past decade has been therapeutic hypothermia, Dr. N.A. Mark Estes III said at the Annual Cardiovascular Conference at Snowmass.
The No. 1 cause of in-hospital death in patients who arrive at the hospital with a perfusable rhythm following resuscitation from out-of-hospital cardiac arrest isn’t sepsis, hepatic or renal failure, or cardiogenic shock. It’s neurologic death caused by anoxic brain injury, which begins several hours after cardiac arrest and continues for about 48 hours. This is where therapeutic hypothermia has made a huge difference, said Dr. Estes, professor of medicine and director of cardiac arrhythmia services at Tufts University, Boston.
“One-half of out-of-hospital cardiac arrest survivors experience secondary anoxic brain damage of varying degrees. Until recently, there was no treatment with documented efficacy in preventing this damage. Despite multiple agents being looked at for neuroprevention, none really has worked. But therapeutic hypothermia has drastically improved outcomes. More than half of patients who arrive at the hospital with a perfusable rhythm and receive therapeutic hypothermia are discharged relatively neurologically intact. That’s a huge difference from what we used to see,” the electrophysiologist observed.
Indeed, the proportion of U.S. patients who experience out-of-hospital cardiac arrest and survive to hospital discharge neurologically intact is “dismal” at about 10%, he noted.
Virtually all specialized cardiac arrest centers now provide therapeutic hypothermia using various protocols. The demonstrated effectiveness of this postresuscitation therapy was an impetus for the American Heart Association policy statement calling for creation of regional cardiac resuscitation systems of care (Circulation. 2010 Feb 9;121[5]:709-29). To date, however, such organized systems exist in only a handful of states or portions of states.
Nonetheless, when an out-of-hospital cardiac arrest patient arrives at a community hospital that can’t provide emergency coronary angiography and therapeutic hypothermia, it’s appropriate to stabilize that patient in the emergency department and then transfer to a hospital that can, according to Dr. Estes.
The mechanism by which therapeutic hypothermia works has been well elucidated. The treatment curbs the process by which ischemia as a second blow triggers formation of oxygen free radicals, glutamate release, calcium shifts, and mitochondrial dysfunction, with resultant destruction of brain tissue.
Roughly 250,000 sudden cardiac deaths (SCDs) occur annually in this country. In addition to more widespread availability of therapeutic hypothermia and other forms of specialized postresuscitation care through creation of regional systems of care for out-of-hospital cardiac arrest, there are other opportunities for improving outcomes. These include earlier activation of the chain of survival that begins with a bystander dialing 911 as well as greater availability of public access defibrillation.
Dr. Estes emphasized that while these measures will further improve outcomes of cardiac arrest, they won’t actually reduce its frequency. By far the greatest opportunity in that realm lies in primordial prevention of coronary artery disease; that is, prevention of the risk factors for CAD. After all, he noted, 80% of all SCDs are associated with underlying ischemic heart disease. In 30% of SCDs, the fatal event is the first manifestation of previously unrecognized CAD. Another one-third of SCDs occur in patients with known CAD, but who weren’t considered at high risk for SCD because of their preserved left ventricular ejection fraction.
“There are a number of luminaries in the field who feel that if we’re really going to make an impact on sudden cardiac death, it’s going to be through primordial prevention of CAD,” the cardiologist said.
For this reason, he was thrilled to hear Dr. Robert A. Vogel elsewhere at the conference describe research by investigators at Affiris AG in Vienna who’ve created a peptide-based vaccine that inhibits PCSK9. Moreover, they showed it to be effective in sharply lowering LDL in mice (PLoS One. 2014 Dec 4;9[12]:e114469).
“I believe that in my lifetime, we will have an antiatherosclerotic vaccine that will lower LDL to an extent where this disease will not disappear but may get to a manageable extent, perhaps a 10% lifetime risk instead of the 55% lifetime risk of MI or stroke that we as Americans currently have,” predicted Dr. Vogel of the University of Colorado, Denver.
Dr. Vogel reported serving as a consultant to the National Football League and the Pritikin Longevity Center as well as acting as the national coordinator for the Sanofi-sponsored ODYSSEY Outcomes trial studying the PCSK9 inhibitor alirocumab (Praluent).
Dr. Estes reported serving as a consultant to Boston Scientific, Medtronic, and St. Jude Medical.
EXPERT ANALYSIS FROM THE CARDIOVASCULAR CONFERENCE AT SNOWMASS

New test showed promise in ocular myasthenia gravis
A test for ocular vestibular evoked myogenic potentials (oVEMP) had a sensitivity of 89% and a specificity of 64% for detecting myasthenia gravis (MG), according to a case-control study of 55 adults published online in Neurology.
“The presence of an oVEMP decrement is a sensitive and specific marker for MG,” said Dr. Yulia Valko at University Hospital Zurich in Switzerland and her associates. “This test allows direct and noninvasive examination of extraocular muscle activity, with similarly good diagnostic accuracy in ocular and generalized MG.”
Myasthenia gravis usually manifests first in the eyes, and early diagnosis and treatment can limit generalization. But nearly half of patients remain undiagnosed a year after onset, partly because standard tests often fail to detect isolated ocular MG, the researchers noted. The recently developed oVEMP test directly measures the activity of the extraocular inferior oblique muscle in response to repeated bursts of vibratory stimulation to the forehead. A decreased response, or decrement, indicates failed neuromuscular transmission, as with standard repetitive nerve stimulation. The researchers evaluated the test in 13 patients with isolated ocular MG, 14 patients with generalized MG, and 28 healthy controls. They defined the oVEMP decrement as the decrease between the second stimulus and the average of the fifth through ninth stimuli (Neurology. 2016 Jan 20. doi: 10.1212/WNL.0000000000002383).
A repetition rate of 20 Hz best differentiated between cases (average decrement, –21.5% plus or minus 29.6%) and controls (–2.8% plus or minus 16.9%), the researchers reported. When at least one eye showed a decrement, the ideal cutoff was a drop of at least 15.2%, which detected MG with a sensitivity of 89% and a sensitivity of 64%. When both eyes were affected, the ideal cutoff for the smallest of the two decrements was at least 20.4%, which yielded a sensitivity of 100% and a specificity of 63%. For both cutoffs, the test was similarly sensitive for detecting ocular and generalized MG, the investigators noted. For the unilateral cutoff, the sensitivity was 92% for patients with isolated ocular MG and 86% for patients with generalized MG. For the bilateral cutoff, specificity was 62% in ocular MG and 64% in generalized MG.
The results provide class III evidence that oVEMP can distinguish between patients with MG and healthy controls, “but future studies will need to confirm its diagnostic utility in clinical practice, where the main challenge is differentiation from patients with other neuro-opthalmologic conditions,” the researchers said. “The possibility to apply fast repetition rates is one important advantage of oVEMP, which is not possible by measuring voluntary saccadic eye movements. As a consequence, oVEMP allowed us to unmask myasthenic decrements even in clinically asymptomatic eyes,” they added.
Because the study used a confirmed diagnosis of MG as a benchmark, all patients were already being treated with cholinesterase inhibitors, the investigators noted. Although they underwent oVEMP testing in the morning before their first dose of medication, the test needs further study in drug-naïve patients, as well as in patients with worse limitations in their upward gaze, they added.
The study was funded by the University of Zurich, the Betty and David Koetser Foundation for Brain Research, the Albert Bruppacher Foundation for Eye Research, and the OPOS Foundation. The investigators had no relevant disclosures.
Autoimmune myasthenia gravis (MG) commonly presents with fatigable ptosis and diplopia. In isolation, these symptoms often herald the restricted form of the disease known as ocular MG. In some cases, ocular MG progresses to involve bulbar musculature as well as limb muscles. Because some individuals with myasthenia have the signs intermittently or may never have ptosis, the diagnosis is sometimes difficult to ascertain on clinical grounds alone.
Clinical and laboratory tests available for confirming the diagnosis have been in use for many years, as well as some recent refinements. These include serologic testing for acetylcholine receptor and MuSK antibodies; the edrophonium (Tensilon) test in which an acetylcholinesterase inhibitor is delivered intravenously to temporarily improve ptosis and diplopia; slow repetitive (electrical) nerve stimulation (RNS), particularly of proximal limb and facial nerves and single fiber electromyography (SFEMG). Each of these approaches has limitations. Antibody testing has relatively low sensitivity (in the range of 0.50-0.71 for ocular MG and 0.87-0.98 for generalized MG). For RNS, the sensitivity numbers are even less positive (0.11-0.39 for ocular MG and 0.53-0.98 for generalized MG). Even though the edrophonium test is said to have a sensitivity of 0.60-0.90, this procedure has largely fallen into disuse among neuromuscular specialists partly because of the risks of bradycardia, syncope, and even asystole, as well as high rates of false positivity. Some neurologists use an icepack on the forehead as a diagnostic substitute or so-called “poor man’s edrophonium test,” although false positive rates are considerable. SFEMG is considered the most sensitive diagnostic test for MG (sensitivity of 0.62-1.0 in ocular MG and 0.75-0.98 in generalized MG) but is technically demanding, time consuming, available almost exclusively in academic centers, and until relatively recently meant using expensive SFEMG needle electrodes requiring sterilization and periodic sharpening.
 |
Dr. Benn E. Smith |
Two recent publications have introduced advances in the diagnosis of MG. The first is a report by Dr. Erik Stålberg and colleagues from Sweden, the United States, United Kingdom, Slovenia, Norway, Brazil, and Spain of normative data for concentric SFEMG using both the stimulated and the volitional techniques in the extensor digitorum, frontalis, and orbicularis oculi muscles from 59 to 92 subjects for each muscle (Muscle Nerve. 2016 Mar;53[3]:351-62). The value of this set of reference data is that neurologists who perform SFEMG now have a rigorously collected reliable set of statistically validated normal values using commercially available concentric needle electrodes as conventional single fiber needle electrodes are becoming more and more challenging to use in practice.
A second publication by Yulia Valko and colleagues from Zurich and Sydney describes the novel application of ocular vestibular myogenic potentials (oVEMP) as a new form of RNS in MG. By delivering 4-ms bursts of 500-Hz bone conducted vibration in trains of 10 stimuli and recording just below the inferior orbital rim with surface electrodes, the investigators found that a frequency of 20 Hz resulted in the cleanest separation of tracings in subjects with documented MG from age- and gender-matched healthy controls. The oVEMP technique has been in use for evaluating vestibular disorders for more than 10 years and is an accepted diagnostic technique for this purpose. While this novel approach also shows promise as a candidate diagnostic technique in evaluating extraocular neuromuscular junction dysfunction, further prospective studies are needed. By comparing the sensitivity and specificity of oVEMP RNS with that of accepted diagnostic tests, including conventional facial RNS and SFEMG, in subjects suspected of having MG, the neurology and neuromuscular communities will be in a better position to judge whether oVEMP will one day be an accepted diagnostic test for MG.
Dr. Benn E. Smith is with the department of neurology at the Mayo Clinic, Scottsdale, Ariz. He has no relevant disclosures.
Autoimmune myasthenia gravis (MG) commonly presents with fatigable ptosis and diplopia. In isolation, these symptoms often herald the restricted form of the disease known as ocular MG. In some cases, ocular MG progresses to involve bulbar musculature as well as limb muscles. Because some individuals with myasthenia have the signs intermittently or may never have ptosis, the diagnosis is sometimes difficult to ascertain on clinical grounds alone.
Clinical and laboratory tests available for confirming the diagnosis have been in use for many years, as well as some recent refinements. These include serologic testing for acetylcholine receptor and MuSK antibodies; the edrophonium (Tensilon) test in which an acetylcholinesterase inhibitor is delivered intravenously to temporarily improve ptosis and diplopia; slow repetitive (electrical) nerve stimulation (RNS), particularly of proximal limb and facial nerves and single fiber electromyography (SFEMG). Each of these approaches has limitations. Antibody testing has relatively low sensitivity (in the range of 0.50-0.71 for ocular MG and 0.87-0.98 for generalized MG). For RNS, the sensitivity numbers are even less positive (0.11-0.39 for ocular MG and 0.53-0.98 for generalized MG). Even though the edrophonium test is said to have a sensitivity of 0.60-0.90, this procedure has largely fallen into disuse among neuromuscular specialists partly because of the risks of bradycardia, syncope, and even asystole, as well as high rates of false positivity. Some neurologists use an icepack on the forehead as a diagnostic substitute or so-called “poor man’s edrophonium test,” although false positive rates are considerable. SFEMG is considered the most sensitive diagnostic test for MG (sensitivity of 0.62-1.0 in ocular MG and 0.75-0.98 in generalized MG) but is technically demanding, time consuming, available almost exclusively in academic centers, and until relatively recently meant using expensive SFEMG needle electrodes requiring sterilization and periodic sharpening.
|
Dr. Benn E. Smith |
Two recent publications have introduced advances in the diagnosis of MG. The first is a report by Dr. Erik Stålberg and colleagues from Sweden, the United States, United Kingdom, Slovenia, Norway, Brazil, and Spain of normative data for concentric SFEMG using both the stimulated and the volitional techniques in the extensor digitorum, frontalis, and orbicularis oculi muscles from 59 to 92 subjects for each muscle (Muscle Nerve. 2016 Mar;53[3]:351-62). The value of this set of reference data is that neurologists who perform SFEMG now have a rigorously collected reliable set of statistically validated normal values using commercially available concentric needle electrodes as conventional single fiber needle electrodes are becoming more and more challenging to use in practice.
A second publication by Yulia Valko and colleagues from Zurich and Sydney describes the novel application of ocular vestibular myogenic potentials (oVEMP) as a new form of RNS in MG. By delivering 4-ms bursts of 500-Hz bone conducted vibration in trains of 10 stimuli and recording just below the inferior orbital rim with surface electrodes, the investigators found that a frequency of 20 Hz resulted in the cleanest separation of tracings in subjects with documented MG from age- and gender-matched healthy controls. The oVEMP technique has been in use for evaluating vestibular disorders for more than 10 years and is an accepted diagnostic technique for this purpose. While this novel approach also shows promise as a candidate diagnostic technique in evaluating extraocular neuromuscular junction dysfunction, further prospective studies are needed. By comparing the sensitivity and specificity of oVEMP RNS with that of accepted diagnostic tests, including conventional facial RNS and SFEMG, in subjects suspected of having MG, the neurology and neuromuscular communities will be in a better position to judge whether oVEMP will one day be an accepted diagnostic test for MG.
Dr. Benn E. Smith is with the department of neurology at the Mayo Clinic, Scottsdale, Ariz. He has no relevant disclosures.
A test for ocular vestibular evoked myogenic potentials (oVEMP) had a sensitivity of 89% and a specificity of 64% for detecting myasthenia gravis (MG), according to a case-control study of 55 adults published online in Neurology.
“The presence of an oVEMP decrement is a sensitive and specific marker for MG,” said Dr. Yulia Valko at University Hospital Zurich in Switzerland and her associates. “This test allows direct and noninvasive examination of extraocular muscle activity, with similarly good diagnostic accuracy in ocular and generalized MG.”
Myasthenia gravis usually manifests first in the eyes, and early diagnosis and treatment can limit generalization. But nearly half of patients remain undiagnosed a year after onset, partly because standard tests often fail to detect isolated ocular MG, the researchers noted. The recently developed oVEMP test directly measures the activity of the extraocular inferior oblique muscle in response to repeated bursts of vibratory stimulation to the forehead. A decreased response, or decrement, indicates failed neuromuscular transmission, as with standard repetitive nerve stimulation. The researchers evaluated the test in 13 patients with isolated ocular MG, 14 patients with generalized MG, and 28 healthy controls. They defined the oVEMP decrement as the decrease between the second stimulus and the average of the fifth through ninth stimuli (Neurology. 2016 Jan 20. doi: 10.1212/WNL.0000000000002383).
A repetition rate of 20 Hz best differentiated between cases (average decrement, –21.5% plus or minus 29.6%) and controls (–2.8% plus or minus 16.9%), the researchers reported. When at least one eye showed a decrement, the ideal cutoff was a drop of at least 15.2%, which detected MG with a sensitivity of 89% and a sensitivity of 64%. When both eyes were affected, the ideal cutoff for the smallest of the two decrements was at least 20.4%, which yielded a sensitivity of 100% and a specificity of 63%. For both cutoffs, the test was similarly sensitive for detecting ocular and generalized MG, the investigators noted. For the unilateral cutoff, the sensitivity was 92% for patients with isolated ocular MG and 86% for patients with generalized MG. For the bilateral cutoff, specificity was 62% in ocular MG and 64% in generalized MG.
The results provide class III evidence that oVEMP can distinguish between patients with MG and healthy controls, “but future studies will need to confirm its diagnostic utility in clinical practice, where the main challenge is differentiation from patients with other neuro-opthalmologic conditions,” the researchers said. “The possibility to apply fast repetition rates is one important advantage of oVEMP, which is not possible by measuring voluntary saccadic eye movements. As a consequence, oVEMP allowed us to unmask myasthenic decrements even in clinically asymptomatic eyes,” they added.
Because the study used a confirmed diagnosis of MG as a benchmark, all patients were already being treated with cholinesterase inhibitors, the investigators noted. Although they underwent oVEMP testing in the morning before their first dose of medication, the test needs further study in drug-naïve patients, as well as in patients with worse limitations in their upward gaze, they added.
The study was funded by the University of Zurich, the Betty and David Koetser Foundation for Brain Research, the Albert Bruppacher Foundation for Eye Research, and the OPOS Foundation. The investigators had no relevant disclosures.
FROM NEUROLOGY
Key clinical point:Testing ocular vestibular evoked myogenic potentials (oVEMP) shows promise for diagnosing ocular myasthenia gravis.
Major finding: The sensitivity of the test when at least one eye was affected was 89%, and its specificity was 64%.
Data source: A case-control study of 27 patients with myasthenia gravis and 28 healthy controls.
Disclosures: The study was funded by the University of Zurich, the Betty and David Koetser Foundation for Brain Research, the Albert Bruppacher Foundation for Eye Research, and the OPOS Foundation. The investigators had no relevant disclosures.

Three lesions needed for MRI diagnosis of MS
A European expert group has proposed several revisions to the 2010 McDonald criteria for the use of MRI in diagnosing multiple sclerosis.
The MAGNIMS collaborative research network argued that new data on the application of MRI, as well as improvements in MRI technology, demanded changes to the multiple sclerosis (MS) diagnostic criteria.
The first proposed recommendation is that three or more focal lesions, rather than a single lesion, should be present to diagnose the involvement of the periventricular region and to show disease dissemination in space (Lancet Neurol. 2016 Jan 25. doi: 10.1016/S1474-4422[15]00393-2).

“A single lesion was deemed not sufficiently specific to determine whether involvement of the periventricular region is due to a demyelinating inflammatory event, and the use of one periventricular lesion for assessing dissemination in space has never been formally validated,” wrote Dr. Massimo Filippi of Vita-Salute San Raffaele University, Milan, and his coauthors.
They also pointed out that incidental periventricular lesions can be found in up to 30% of patients with migraine, and in individuals with other neurologic disorders.
In addition, the group recommended that optic nerve lesions be added to the criteria for dissemination in space.
“Clinical documentation of optic nerve atrophy or pallor, neurophysiological confirmation of optic nerve dysfunction (slowed conduction), or imaging features of clinically silent optic nerve inflammation (MRI lesions or retinal nerve fiber layer thinning) support dissemination in space and, in patients without concurrent visual symptoms, dissemination in time.”
According to the new recommendations, disease dissemination in space can be shown by the involvement of at least two areas from a list of five possibilities: three or more periventricular lesions, one or more infratentorial lesions, one or more spinal cord lesions, one or more optic nerve lesions, or one or more cortical or juxtacortical lesions.
However, the group did not propose any significant changes to the criteria for dissemination in time, other than saying that the presence of nonenhancing black holes should not be considered as a potential alternative criterion to show dissemination in time in adult patients.
The committee also backed the existing recommendations that children aged 11 years or older with nonacute disseminated encephalomyelitis–like presentation should be diagnosed with the same criteria as adults, for dissemination in time and space.
“Several studies have confirmed that the 2010 McDonald criteria perform better than or similar to previously proposed pediatric MS criteria for diagnosis of children with nonacute disseminated encephalomyelitis presentations and pediatric patients older than 11 years, and the consensus group therefore recommend caution when using these criteria in children younger than 11 years,” they wrote.
Other recommendations include that there be no distinction required between symptomatic and asymptomatic MRI lesions for diagnosing dissemination in time or space; that the whole spinal cord be imaged to define dissemination in space, particularly in patients who do not fulfill the brain MRI criteria; and that the same criteria for dissemination in space be used for both primary progressive MS and relapse-onset MS, with cerebrospinal fluid results considered for clinically uncertain cases of primary progressive MS.
The expenses of the workshop where the recommendations were formulated were supported by an unrestricted educational grant from Novartis. The authors of the paper declared grants, consultancies, speaking fees, travel support, and honoraria from numerous pharmaceutical companies, including Novartis.
 |
Dr. Robert J. Fox |
Including the initial symptomatic lesion in the lesion count to satisfy criteria for dissemination in space and time might be the most useful contribution of the revised criteria to clinical practice.
In addition, the broad applicability of the MRI criteria were affirmed in primary progressive multiple sclerosis, relapse-onset multiple sclerosis, children aged 11 years or older without an acute disseminated encephalomyelitis presentation, and patients with multiple sclerosis in Asia and Latin America.
Dr. Robert J. Fox is from the Mellen Center for MS Treatment and Research at the Cleveland Clinic. These comments were taken from an accompanying editorial (Lancet Neurol. 2016 Jan 25. doi: 10.1016/S1474-4422[16]00023-5). Dr. Fox declared personal consulting fees from Actelion, Biogen, Genentech, Mallinckrodt, MedDay, Novartis, Teva, and XenoPort; advisory committee roles for Biogen and Novartis; and research grant funding from Novartis.
|
Dr. Robert J. Fox |
Including the initial symptomatic lesion in the lesion count to satisfy criteria for dissemination in space and time might be the most useful contribution of the revised criteria to clinical practice.
In addition, the broad applicability of the MRI criteria were affirmed in primary progressive multiple sclerosis, relapse-onset multiple sclerosis, children aged 11 years or older without an acute disseminated encephalomyelitis presentation, and patients with multiple sclerosis in Asia and Latin America.
Dr. Robert J. Fox is from the Mellen Center for MS Treatment and Research at the Cleveland Clinic. These comments were taken from an accompanying editorial (Lancet Neurol. 2016 Jan 25. doi: 10.1016/S1474-4422[16]00023-5). Dr. Fox declared personal consulting fees from Actelion, Biogen, Genentech, Mallinckrodt, MedDay, Novartis, Teva, and XenoPort; advisory committee roles for Biogen and Novartis; and research grant funding from Novartis.
A European expert group has proposed several revisions to the 2010 McDonald criteria for the use of MRI in diagnosing multiple sclerosis.
The MAGNIMS collaborative research network argued that new data on the application of MRI, as well as improvements in MRI technology, demanded changes to the multiple sclerosis (MS) diagnostic criteria.
The first proposed recommendation is that three or more focal lesions, rather than a single lesion, should be present to diagnose the involvement of the periventricular region and to show disease dissemination in space (Lancet Neurol. 2016 Jan 25. doi: 10.1016/S1474-4422[15]00393-2).
“A single lesion was deemed not sufficiently specific to determine whether involvement of the periventricular region is due to a demyelinating inflammatory event, and the use of one periventricular lesion for assessing dissemination in space has never been formally validated,” wrote Dr. Massimo Filippi of Vita-Salute San Raffaele University, Milan, and his coauthors.
They also pointed out that incidental periventricular lesions can be found in up to 30% of patients with migraine, and in individuals with other neurologic disorders.
In addition, the group recommended that optic nerve lesions be added to the criteria for dissemination in space.
“Clinical documentation of optic nerve atrophy or pallor, neurophysiological confirmation of optic nerve dysfunction (slowed conduction), or imaging features of clinically silent optic nerve inflammation (MRI lesions or retinal nerve fiber layer thinning) support dissemination in space and, in patients without concurrent visual symptoms, dissemination in time.”
According to the new recommendations, disease dissemination in space can be shown by the involvement of at least two areas from a list of five possibilities: three or more periventricular lesions, one or more infratentorial lesions, one or more spinal cord lesions, one or more optic nerve lesions, or one or more cortical or juxtacortical lesions.
However, the group did not propose any significant changes to the criteria for dissemination in time, other than saying that the presence of nonenhancing black holes should not be considered as a potential alternative criterion to show dissemination in time in adult patients.
The committee also backed the existing recommendations that children aged 11 years or older with nonacute disseminated encephalomyelitis–like presentation should be diagnosed with the same criteria as adults, for dissemination in time and space.
“Several studies have confirmed that the 2010 McDonald criteria perform better than or similar to previously proposed pediatric MS criteria for diagnosis of children with nonacute disseminated encephalomyelitis presentations and pediatric patients older than 11 years, and the consensus group therefore recommend caution when using these criteria in children younger than 11 years,” they wrote.
Other recommendations include that there be no distinction required between symptomatic and asymptomatic MRI lesions for diagnosing dissemination in time or space; that the whole spinal cord be imaged to define dissemination in space, particularly in patients who do not fulfill the brain MRI criteria; and that the same criteria for dissemination in space be used for both primary progressive MS and relapse-onset MS, with cerebrospinal fluid results considered for clinically uncertain cases of primary progressive MS.
The expenses of the workshop where the recommendations were formulated were supported by an unrestricted educational grant from Novartis. The authors of the paper declared grants, consultancies, speaking fees, travel support, and honoraria from numerous pharmaceutical companies, including Novartis.
FROM LANCET NEUROLOGY

Cosmeceuticals and rosacea: which ones are worth your time
ORLANDO – When treating rosacea, consider adding cosmeceuticals to more conventional prescriptions and over-the-counter treatments to improve the management of symptoms and patient satisfaction.
The recommendation comes from Dr. Julie Harper, a dermatologist at the University of Alabama-Birmingham, who spoke about the benefits of cosmeceuticals for rosacea at the Orlando Dermatology Aesthetic and Clinical Conference.
“I see about 40 people a day on my regular dermatology days [and] it’s easy to just write a prescription and hand it to that rosacea patient, but you do them a big disservice when you do that,” explained Dr. Harper. “We’ve got to talk about triggers, about skin care, about sun protection, [and] start that discussion from there.”
The most-important point for patients to understand is the main triggers of their rosacea, which can include ultraviolet light, spices, stress, exercise, heat, barrier disruption, and Demodex. Since sunlight is the No. 1 trigger for rosacea, treatment strategies often need to start there and revolve around how to avoid or manage the condition based on sun exposure.
As for cosmeceuticals, Dr. Harper focused on three types that have been shown to be effective against rosacea: niacinamide, licorice, and green tea.
The available data on niacinamide for rosacea are primarily from the 2006 Nicomide Improvement in Clinical Outcomes Study (NICOS), an open-label, multicenter, prospective cohort study that recruited people with acne vulgaris and acne rosacea from 100 centers and administered 750 mg of niacinamide with zinc and copper, while some got niacinamide plus oral antibiotics. The 49 people with rosacea who were enrolled received baseline assessments in the clinic, but 4-week and 8-week follow-ups were done via self-reported surveys (Cutis. 2006 Jan;77[1 Suppl]:17-28).
At 8 weeks, “75% of the rosacea group reported that appearance of their rosacea was moderately or much better [and] that there was also significant reduction in inflammatory lesions,” Dr. Harper said. “There was not a big difference in the group that had an oral antibiotic and niacinamide, versus niacinamide without the oral antibiotic,” although the design of the study leaves the findings somewhat questionable, she noted.
Topical niacinamide also has the potential to benefit certain rosacea patients, she said, referring to a 2005 study examining the effects of a niacinamide-containing moisturizer on the face and one forearm of 50 patients over 4 weeks. The primary outcome of the trial was barrier function, as measured by a dimethyl sulfoxide (DMSO) chemical probe (Cutis. 2005 Aug;76[2]:135-41).
While the results of this trial are “difficult” to interpret – due largely to the lack of any real measurement of facial improvement in barrier function and the confusion over whether any improvement on the forearm can be attributed to the niacinamide specifically or to the moisturizer itself – “long story short, niacinamide did seem to help the barrier function in this particular study,” Dr. Harper said. The takeaway, therefore, is that topical niacinamide treatments may offer some value to certain patients.
Moving on to licorice, Dr. Harper discussed an open label study recently published online in the Journal of the European Academy of Dermatology and Venereology, in which subjects were given a complete skin care system – which contained a cleanser, a day cream, a night cream, and a concealer product containing licochalcone A (licorice extract). They were evaluated over a period of 8 weeks for improvement in erythema, burning, stinging, tingling, and tightness, all of which were measured at baseline (J Eur Acad Dermatol Venereol. 2016 Feb;30 Suppl 1:21-7).
Results showed “improvement of statistical significance,” Dr. Harper said. “All groups had improvement over time, and did better at 8 weeks than at 4 weeks [although] the rosacea group did not reach statistical significance until week 8.”
Finally, with green tea, Dr. Harper pointed to a 2010 randomized double-blind split-face study of just four healthy individuals with erythema and telangiectasia of the face, treated for 6 weeks with a cream containing epigallocatechin-3-gallate (EGCG), the major catechin found in green tea, on one side of their face; a vehicle cream was applied to the other side and punch biopsies were performed to determine improvements (Int J Clin Exp Pathol. 2010;3[7]:705-9). EGCG cream was used because of its “antioxidant, immunomodulatory, photoprotective, antiangiogenic – that’s the standout here, that’s what we really need – and anti-inflammatory properties,” Dr. Harper said.
While biopsies did not reveal any changes to facial vasculature, there “was a significant reduction in hypoxia-inducible factor-1 and VEGF [vascular endothelial growth factor],” which are both markers of angiogenesis – indicating some degree of usefulness against rosacea, Dr. Harper said. However, a longer, more definitive study would be needed to substantiate these findings, she added.
Dr. Harper did not report any relevant financial disclosures.
AT THE ODAC CONFERENCE
Terminalia chebula
Terminalia chebula, a member of the Combretaceae family, is an evergreen plant found abundantly in India, Pakistan, China, Thailand, Sri Lanka, and Malaysia.1,2 It has long been used in traditional medicine, particularly Ayurveda, as well as in Thai traditional medicine.3 It also has also been used for many years in the traditional medicine of the Samahni valley of Pakistan to treat chronic ulcers as well as dental caries and heart ailments.4 Other traditional indications include asthma and urinary disorders.5 In Thailand, it has been used to treat skin diseases and to promote wound healing and rejuvenation.1 It is particularly known for its potent antioxidant and antimicrobial properties.6 The wide array of health benefits associated with T. chebula is attributed to its high content of phenolic compounds, flavonol glycosides, and other phytonutrients.7
Antioxidant, anti-aging, and depigmenting effects
In 2004, Na et al. observed that T. chebula fruit extract exerted an inhibitory effect on the age-dependent shortening of telomeres and UVB-induced oxidative damage in vitro.8
Kim et al. screened 50 Korean plants to identify natural sources of elastase and hyaluronidase inhibitors in 2010. The strong efficacy of T. chebula led the investigators to choose it for additional study in which the fruits of the methanol crude extract at 1 mg/mL demonstrated 80% elastase and 87% hyaluronidase inhibitory activities. In addition, the investigators isolated 1,2,3,4,6-penta-O-galloyl-beta-D-glucose (PGG), which also exhibited significant inhibition of elastase and hyaluronidase and induction of type II collagen expression. The authors concluded that PGG has the potential as a cutaneous anti-aging agent posing no cytotoxicity concerns and warrants further in vivo study.9
A 2010 in vitro study of the anti-aging properties of the extracts of 15 plant species, including T. chebula galls, outgrowths that result from insect bites, was conducted by Manosroi et al. The cold aqueous extract of T. chebula manifested the highest 2,2-diphenyl-1-picrylhydrazyl (DPPH) radical-scavenging activity and highest stimulation index for proliferation of normal human skin fibroblasts. T. chebula, which also inhibited matrix metalloproteinase (MMP)-2 activity, was compared against compounds such as ascorbic acid, alpha-tocopherol, and butylated hydroxytoluene. The investigators concluded that their findings supported the traditional uses of T. chebula gall in Thai medicine and suggest that T. chebula would be beneficial for inclusion in new anti-aging formulations.3
Later that year, Manosroi et al. characterized the biological activities of the phenolic compounds isolated from T. chebula galls, finding that these compounds (gallic acid, punicalagin, isoterchebulin, 1,3,6-tri-O-galloyl-beta-D-glucopyranose, chebulagic acid, and chebulinic acid) exhibited greater radical-scavenging and melanin-inhibitory activity than the reference compounds ascorbic acid, butylated hydroxytoluene, alpha-tocopherol, arbutin, and kojic acid. Although the T. chebula constituents were less effective than the reference compounds in mushroom tyrosinase inhibition and human tumor cytotoxicity assays, the investigators concluded that the antioxidant and depigmenting activity of the constituents of T. chebula accounted for the beneficial profile of the plant that has emerged over time.10
The next year, Manosroi et al. assessed the cutaneous anti-aging effects of a gel containing niosomes incorporating a semi-purified fraction including gallic acid derived from T. chebula galls or outgrowths. Human volunteers were enlisted to test skin elasticity and roughness and rabbit skin was used to evaluate skin irritation. The gel containing the semi-purified fractions loaded in niosomes was compared with an unloaded fraction, revealing that the loaded niosomes yielded greater gallic acid chemical stability as well as in vivo anti-aging effects.11 Earlier that year, the team had shown the viability of niosomes, particularly elastic ones, to promote chemical stability for the transdermal absorption of gallic acid in semipurified T. chebula gall fractions in rats. Their findings, they concluded, point to the potential for achieving topical anti-aging benefits from such formulations.12

In 2012, Akhtar et al. developed a water-in-oil T. chebula formulation and assessed its effects on various parameters. The investigators prepared a base with no active ingredients and a 5% T. chebula formulation, which remained stable at various storage conditions. For 8 weeks, they applied the base as well as the formulation to the cheeks of human volunteers, with weekly evaluations indicating that the formulation as opposed to the base yielded significant improvement, irrespective of time elapsed, in skin moisture content and erythema. The authors concluded that their T. chebula topical cream was effective in rejuvenating human skin.13
Wound healing
In 2002, Suguna et al. investigated in vivo the effects of a topically administered alcohol extract of the leaves of T. chebula on the healing of rat dermal wounds. The researchers found that treatment with T. chebula accelerated wound healing, with improved contraction rates and shorter epithelialization periods. T. chebula treatment yielded a 40% increase in the tensile strength of tissues from treated wounds. The authors concluded that T. chebula is beneficial in speeding the wound healing process.2
Immature T. chebula fruit extracts high in tannins are thought to be effective in enhancing the wound healing process, according to Li et al., who found in 2011 that the extracts promoted wound healing in rats, likely due to the antibacterial and angiogenic potency of its tannins.1
In a 2014 study on wound healing, Singh et al. observed in vitro that T. chebula extracts effectively scavenged free radicals in a DPPH assay and enhanced proliferation of keratinocytes and fibroblasts. They concluded that T. chebula can be considered for use as a bioactive approach to wound healing for its effects in promoting cellular proliferation and inhibiting production of free radicals.7
Other biologic activities
A 1995 study by Kurokawa et al. showed that T. chebula was one of four herbal extracts among 10 tested to exhibit a discrete anti–herpes simplex virus type 1 (HSV-1) activity in vitro when combined with acyclovir. Oral administration of the herbs with acyclovir in mice in doses corresponding to human use significantly limited skin lesion development and/or extended mean survival time of infected mice in comparison to any of the herbs or acyclovir used alone.14
Nam et al. used a 2,4-dinitrofluorobenzene (DNFB)-induced mouse model of atopic symptoms in 2011 and found that a T. chebula seed extract attenuated atopic dermatitis symptoms, resulting in a 52% decrease in the immune response and lower eosinophil levels in nearby skin tissue.6
In 2013, Manosroi et al. found that various tannins and one oleanane-type triterpene acid isolated from T. chebula galls displayed strong inhibitory capacity against melanogenesis in mice, with one of the tannins (isoterchebulin) shown to decrease protein levels of tyrosinase, microphthalmia-associated transcription factor, and tyrosine-related protein 1 in mainly a concentration-dependent fashion. Another tannin and several triterpenoids were noted for suppressing 12-O-tetradecanoylphorbol 13-acetate (TPA)-induced inflammation. In addition, constituent phenols manifested strong radical-scavenging activity. In a two-stage carcinogenesis mouse model, the investigators observed that the triterpene acid arjungenin hindered skin tumor promotion after initiation with 7,12-dimethylbenz[a]anthracene (DMBA) and promotion by TPA. Their findings indicate a wide range of biologic activity and potential health benefits associated with T. chebula.15
In a mouse study in 2014, Singh et al. determined that a new antifungal agent, an apigenin ointment containing extract of T. chebula stem, was effective in significantly reducing the fungal burden from the experimentally-induced dermatophyte Trichopython mentagrophytes. They suggested that this agent warrants consideration in clinically treating dermatophytosis in humans.16
Triphala, a traditional combination formulation
Long used in Ayurveda, triphala (the word is derived from the Sanskrit tri, three, and phala, fruits) is an antioxidant-rich herbal formulation that combines the dried fruits of T. chebula, Terminalia bellirica, and Emblica officinalis. Naik et al. observed, in a 2005 in vitro study of the aqueous extract of the fruits of T. chebula, T. bellirica, and E. officinalis, as well as their equiproportional mixture triphala, that T. chebula was the most effective at scavenging free radicals. They noted that triphala appears to synergistically combine the strengths of each of its primary components.17 Subsequent studies have demonstrated that triphala is a strong source of natural antioxidants and exhibits a wide range of beneficial activities, including free radical scavenging, antioxidant, anti-inflammatory, analgesic, antibacterial, antimutagenic, wound healing, antistress, adaptogenic, hypoglycemic, anticancer, chemoprotective, radioprotective, chemopreventive, and wound healing.5,18-21
Extracts of T. chebula also have been combined with those of E. officinalis, T. bellirica, Albizia lebbeck, Piper nigrum, Zingiber officinale, and Piper longum in a polyherbal formulation (Aller-7/NR-A2) that has been found safe for the treatment of allergic rhinitis.22
Conclusion
The use of T. chebula in various traditional medical practices around the world is well established. There is ample evidence supporting multiple biologic properties of this Ayurvedic staple. While it is not a standard ingredient in dermatologic health care in the West, the data support continued research as to how best to incorporate this agent.
References
1. BMC Complement Altern Med. 2011 Oct 7;11:86.
2. Phytother Res. 2002 May;16(3):227-31.
3. Pharm Biol. 2010 Apr;48(4):469-81.
4. Pak J Biol Sci. 2007 Jul 1;10(13):2241-56.
5. BMC Complement Altern Med. 2010 May 13;10:20.
6. Int J Mol Med. 2011 Dec;28(6):1013-8.
7. Evid Based Complement Alternat Med. 2014;2014:701656.
8. Phytother Res. 2004 Sep;18:737-41.
9. Acta Pol Pharm. 2010 Mar-Apr;67(2):145-50.
10. Nat Prod Res. 2010 Dec;24(20):1915-26.
11. Pharm Biol. 2011 Nov;49(11):1190-203.
12. Pharm Biol. 2011 Jun;49(6):553-62.
13. Forsch Komplementmed. 2012;19(1):20-5.
14. Antiviral Res. 1995 May;27(1-2):19-37.
15. Chem Biodivers. 2013 Aug;10(8):1448-63.
16. Mycoses. 2014 Aug;57(8):497-506.
17. Phytother Res. 2005 Jul;19(7):582-6.
18. Chin J Integr Med. 2012 Dec;18(12):946-54.
19. J Surg Res. 2008 Jan;144(1):94-101.
20. J Surg Res. 2010 Jan;158(1):162-70.
21. J Altern Complement Med. 2010 Dec;16(12):1301-8.
22. Toxicol Mech Methods. 2005;15(3):193-204.
Dr. Baumann is chief executive officer of the Baumann Cosmetic & Research Institute in the Design District in Miami. She founded the Cosmetic Dermatology Center at the University of Miami in 1997. Dr. Baumann wrote the textbook, “Cosmetic Dermatology: Principles and Practice” (New York: McGraw-Hill, 2002), and a book for consumers, “The Skin Type Solution” (New York: Bantam Dell, 2006). She has contributed to the Cosmeceutical Critique column in Dermatology News since January 2001. Her latest book, “Cosmeceuticals and Cosmetic Ingredients,” was published in November 2014. Dr. Baumann has received funding for clinical grants from Allergan, Aveeno, Avon Products, Evolus, Galderma, GlaxoSmithKline, Kythera Biopharmaceuticals, Mary Kay, Medicis Pharmaceuticals, Neutrogena, Philosophy, Topix Pharmaceuticals, and Unilever.
Terminalia chebula, a member of the Combretaceae family, is an evergreen plant found abundantly in India, Pakistan, China, Thailand, Sri Lanka, and Malaysia.1,2 It has long been used in traditional medicine, particularly Ayurveda, as well as in Thai traditional medicine.3 It also has also been used for many years in the traditional medicine of the Samahni valley of Pakistan to treat chronic ulcers as well as dental caries and heart ailments.4 Other traditional indications include asthma and urinary disorders.5 In Thailand, it has been used to treat skin diseases and to promote wound healing and rejuvenation.1 It is particularly known for its potent antioxidant and antimicrobial properties.6 The wide array of health benefits associated with T. chebula is attributed to its high content of phenolic compounds, flavonol glycosides, and other phytonutrients.7
Antioxidant, anti-aging, and depigmenting effects
In 2004, Na et al. observed that T. chebula fruit extract exerted an inhibitory effect on the age-dependent shortening of telomeres and UVB-induced oxidative damage in vitro.8
Kim et al. screened 50 Korean plants to identify natural sources of elastase and hyaluronidase inhibitors in 2010. The strong efficacy of T. chebula led the investigators to choose it for additional study in which the fruits of the methanol crude extract at 1 mg/mL demonstrated 80% elastase and 87% hyaluronidase inhibitory activities. In addition, the investigators isolated 1,2,3,4,6-penta-O-galloyl-beta-D-glucose (PGG), which also exhibited significant inhibition of elastase and hyaluronidase and induction of type II collagen expression. The authors concluded that PGG has the potential as a cutaneous anti-aging agent posing no cytotoxicity concerns and warrants further in vivo study.9
A 2010 in vitro study of the anti-aging properties of the extracts of 15 plant species, including T. chebula galls, outgrowths that result from insect bites, was conducted by Manosroi et al. The cold aqueous extract of T. chebula manifested the highest 2,2-diphenyl-1-picrylhydrazyl (DPPH) radical-scavenging activity and highest stimulation index for proliferation of normal human skin fibroblasts. T. chebula, which also inhibited matrix metalloproteinase (MMP)-2 activity, was compared against compounds such as ascorbic acid, alpha-tocopherol, and butylated hydroxytoluene. The investigators concluded that their findings supported the traditional uses of T. chebula gall in Thai medicine and suggest that T. chebula would be beneficial for inclusion in new anti-aging formulations.3
Later that year, Manosroi et al. characterized the biological activities of the phenolic compounds isolated from T. chebula galls, finding that these compounds (gallic acid, punicalagin, isoterchebulin, 1,3,6-tri-O-galloyl-beta-D-glucopyranose, chebulagic acid, and chebulinic acid) exhibited greater radical-scavenging and melanin-inhibitory activity than the reference compounds ascorbic acid, butylated hydroxytoluene, alpha-tocopherol, arbutin, and kojic acid. Although the T. chebula constituents were less effective than the reference compounds in mushroom tyrosinase inhibition and human tumor cytotoxicity assays, the investigators concluded that the antioxidant and depigmenting activity of the constituents of T. chebula accounted for the beneficial profile of the plant that has emerged over time.10
The next year, Manosroi et al. assessed the cutaneous anti-aging effects of a gel containing niosomes incorporating a semi-purified fraction including gallic acid derived from T. chebula galls or outgrowths. Human volunteers were enlisted to test skin elasticity and roughness and rabbit skin was used to evaluate skin irritation. The gel containing the semi-purified fractions loaded in niosomes was compared with an unloaded fraction, revealing that the loaded niosomes yielded greater gallic acid chemical stability as well as in vivo anti-aging effects.11 Earlier that year, the team had shown the viability of niosomes, particularly elastic ones, to promote chemical stability for the transdermal absorption of gallic acid in semipurified T. chebula gall fractions in rats. Their findings, they concluded, point to the potential for achieving topical anti-aging benefits from such formulations.12
In 2012, Akhtar et al. developed a water-in-oil T. chebula formulation and assessed its effects on various parameters. The investigators prepared a base with no active ingredients and a 5% T. chebula formulation, which remained stable at various storage conditions. For 8 weeks, they applied the base as well as the formulation to the cheeks of human volunteers, with weekly evaluations indicating that the formulation as opposed to the base yielded significant improvement, irrespective of time elapsed, in skin moisture content and erythema. The authors concluded that their T. chebula topical cream was effective in rejuvenating human skin.13
Wound healing
In 2002, Suguna et al. investigated in vivo the effects of a topically administered alcohol extract of the leaves of T. chebula on the healing of rat dermal wounds. The researchers found that treatment with T. chebula accelerated wound healing, with improved contraction rates and shorter epithelialization periods. T. chebula treatment yielded a 40% increase in the tensile strength of tissues from treated wounds. The authors concluded that T. chebula is beneficial in speeding the wound healing process.2
Immature T. chebula fruit extracts high in tannins are thought to be effective in enhancing the wound healing process, according to Li et al., who found in 2011 that the extracts promoted wound healing in rats, likely due to the antibacterial and angiogenic potency of its tannins.1
In a 2014 study on wound healing, Singh et al. observed in vitro that T. chebula extracts effectively scavenged free radicals in a DPPH assay and enhanced proliferation of keratinocytes and fibroblasts. They concluded that T. chebula can be considered for use as a bioactive approach to wound healing for its effects in promoting cellular proliferation and inhibiting production of free radicals.7
Other biologic activities
A 1995 study by Kurokawa et al. showed that T. chebula was one of four herbal extracts among 10 tested to exhibit a discrete anti–herpes simplex virus type 1 (HSV-1) activity in vitro when combined with acyclovir. Oral administration of the herbs with acyclovir in mice in doses corresponding to human use significantly limited skin lesion development and/or extended mean survival time of infected mice in comparison to any of the herbs or acyclovir used alone.14
Nam et al. used a 2,4-dinitrofluorobenzene (DNFB)-induced mouse model of atopic symptoms in 2011 and found that a T. chebula seed extract attenuated atopic dermatitis symptoms, resulting in a 52% decrease in the immune response and lower eosinophil levels in nearby skin tissue.6
In 2013, Manosroi et al. found that various tannins and one oleanane-type triterpene acid isolated from T. chebula galls displayed strong inhibitory capacity against melanogenesis in mice, with one of the tannins (isoterchebulin) shown to decrease protein levels of tyrosinase, microphthalmia-associated transcription factor, and tyrosine-related protein 1 in mainly a concentration-dependent fashion. Another tannin and several triterpenoids were noted for suppressing 12-O-tetradecanoylphorbol 13-acetate (TPA)-induced inflammation. In addition, constituent phenols manifested strong radical-scavenging activity. In a two-stage carcinogenesis mouse model, the investigators observed that the triterpene acid arjungenin hindered skin tumor promotion after initiation with 7,12-dimethylbenz[a]anthracene (DMBA) and promotion by TPA. Their findings indicate a wide range of biologic activity and potential health benefits associated with T. chebula.15
In a mouse study in 2014, Singh et al. determined that a new antifungal agent, an apigenin ointment containing extract of T. chebula stem, was effective in significantly reducing the fungal burden from the experimentally-induced dermatophyte Trichopython mentagrophytes. They suggested that this agent warrants consideration in clinically treating dermatophytosis in humans.16
Triphala, a traditional combination formulation
Long used in Ayurveda, triphala (the word is derived from the Sanskrit tri, three, and phala, fruits) is an antioxidant-rich herbal formulation that combines the dried fruits of T. chebula, Terminalia bellirica, and Emblica officinalis. Naik et al. observed, in a 2005 in vitro study of the aqueous extract of the fruits of T. chebula, T. bellirica, and E. officinalis, as well as their equiproportional mixture triphala, that T. chebula was the most effective at scavenging free radicals. They noted that triphala appears to synergistically combine the strengths of each of its primary components.17 Subsequent studies have demonstrated that triphala is a strong source of natural antioxidants and exhibits a wide range of beneficial activities, including free radical scavenging, antioxidant, anti-inflammatory, analgesic, antibacterial, antimutagenic, wound healing, antistress, adaptogenic, hypoglycemic, anticancer, chemoprotective, radioprotective, chemopreventive, and wound healing.5,18-21
Extracts of T. chebula also have been combined with those of E. officinalis, T. bellirica, Albizia lebbeck, Piper nigrum, Zingiber officinale, and Piper longum in a polyherbal formulation (Aller-7/NR-A2) that has been found safe for the treatment of allergic rhinitis.22
Conclusion
The use of T. chebula in various traditional medical practices around the world is well established. There is ample evidence supporting multiple biologic properties of this Ayurvedic staple. While it is not a standard ingredient in dermatologic health care in the West, the data support continued research as to how best to incorporate this agent.
References
1. BMC Complement Altern Med. 2011 Oct 7;11:86.
2. Phytother Res. 2002 May;16(3):227-31.
3. Pharm Biol. 2010 Apr;48(4):469-81.
4. Pak J Biol Sci. 2007 Jul 1;10(13):2241-56.
5. BMC Complement Altern Med. 2010 May 13;10:20.
6. Int J Mol Med. 2011 Dec;28(6):1013-8.
7. Evid Based Complement Alternat Med. 2014;2014:701656.
8. Phytother Res. 2004 Sep;18:737-41.
9. Acta Pol Pharm. 2010 Mar-Apr;67(2):145-50.
10. Nat Prod Res. 2010 Dec;24(20):1915-26.
11. Pharm Biol. 2011 Nov;49(11):1190-203.
12. Pharm Biol. 2011 Jun;49(6):553-62.
13. Forsch Komplementmed. 2012;19(1):20-5.
14. Antiviral Res. 1995 May;27(1-2):19-37.
15. Chem Biodivers. 2013 Aug;10(8):1448-63.
16. Mycoses. 2014 Aug;57(8):497-506.
17. Phytother Res. 2005 Jul;19(7):582-6.
18. Chin J Integr Med. 2012 Dec;18(12):946-54.
19. J Surg Res. 2008 Jan;144(1):94-101.
20. J Surg Res. 2010 Jan;158(1):162-70.
21. J Altern Complement Med. 2010 Dec;16(12):1301-8.
22. Toxicol Mech Methods. 2005;15(3):193-204.
Dr. Baumann is chief executive officer of the Baumann Cosmetic & Research Institute in the Design District in Miami. She founded the Cosmetic Dermatology Center at the University of Miami in 1997. Dr. Baumann wrote the textbook, “Cosmetic Dermatology: Principles and Practice” (New York: McGraw-Hill, 2002), and a book for consumers, “The Skin Type Solution” (New York: Bantam Dell, 2006). She has contributed to the Cosmeceutical Critique column in Dermatology News since January 2001. Her latest book, “Cosmeceuticals and Cosmetic Ingredients,” was published in November 2014. Dr. Baumann has received funding for clinical grants from Allergan, Aveeno, Avon Products, Evolus, Galderma, GlaxoSmithKline, Kythera Biopharmaceuticals, Mary Kay, Medicis Pharmaceuticals, Neutrogena, Philosophy, Topix Pharmaceuticals, and Unilever.
