User login
Uncovering the origin of ALCL

In studying a mouse model of anaplastic large cell lymphoma (ALCL), investigators may have discovered how the disease develops.
“The origins of ALCL could be traced to a gene disorder in the development of blood-producing stem cells which are located in the thymus,” explained study author Lukas Kenner, MD, of the Medical University of Vienna in Austria.
He and his colleagues found that ALCL began in early thymocytes before T-cell receptor (TCR) β-rearrangement.
And the spread of ALCL required a major change in the TCR. A TCR was required for thymic emigration and peripheral tumor development, but the TCR had to be downregulated for T-cell lymphomagenesis.
In mice in which ALCL had spread, the TCR was initially required but was then lost from the surface of lymphoma cells.
“This means that the TCR molecule has a strong suppressive effect on tumor development,” Dr Kenner said.
He and his colleagues recounted these findings in Nature Communications.
“We now have a better understanding of the origin of this type of lymphoma and the crucial role played by the major changes to the immune system in the spread of this tumor through the body,” said study author Suzanne Turner, PhD, of the University of Cambridge in the UK.
“With this knowledge, we can better combat the cancer genes which are key to the formation and development of lymphomas and, in the future, develop new treatments which offer a better possibility of finding a long-term cure.”
“Current chemotherapy is particularly exhausting for children and adolescents, especially if a relapse occurs and additional treatment is needed,” Dr Kenner added.
“Our new findings about this lymphoma enable the development of more efficient and less toxic medicines, with which every child will soon be able to return to a normal life after treatment.” ![]()
Real‐Time Patient Experience Surveys
In 2010, the Centers for Medicare and Medicaid Services implemented value‐based purchasing, a payment model that incentivizes hospitals for reaching certain quality and patient experience thresholds and penalizes those that do not, in part on the basis of patient satisfaction scores.[1] Although low patient satisfaction scores will adversely affect institutions financially, they also reflect patients' perceptions of their care. Some studies suggest that hospitals with higher patient satisfaction scores score higher overall on clinical care processes such as core measures compliance, readmission rates, lower mortality rates, and other quality‐of‐care metrics.[2, 3, 4, 5, 6, 7, 8, 9, 10, 11]
The Hospital Consumer Assessment of Healthcare Providers and Systems (HCAHPS) survey assesses patients' experience following their hospital stay.[1] The percent of top box scores (ie, response of always on a four point scale, or scores of 9 or 10 on a 10‐point scale) are utilized to compare hospitals and determine the reimbursement or penalty a hospital will receive. Although these scores are available to the public on the Hospital Compare website,[12] physicians may not know how their hospital is ranked or how they are individually perceived by their patients. Additionally, these surveys are typically conducted 48 hours to 6 weeks after patients are discharged, and the results are distributed back to the hospitals well after the time that care was provided, thereby offering providers no chance of improving patient satisfaction during a given hospital stay.
Institutions across the country are trying to improve their HCAHPS scores, but there is limited research identifying specific measures providers can implement. Some studies have suggested that utilizing etiquette‐based communication and sitting at the bedside[13, 14] may help improve patient experience with their providers, and more recently, it has been suggested that providing real‐time deidentified patient experience survey results with education and a rewards/emncentive system to residents may help as well.[15]
Surveys conducted during a patient's hospitalization can offer real‐time actionable feedback to providers. We performed a quality‐improvement project that was designed to determine if real‐time feedback to hospitalist physicians, followed by coaching, and revisits to the patients' bedside could improve the results recorded on provider‐specific patient surveys and/or patients' HCAHPS scores or percentile rankings.
METHODS
Design
This was a prospective, randomized quality‐improvement initiative that was approved by the Colorado Multiple Institutional Review Board and conducted at Denver Health, a 525‐bed university‐affiliated public safety net hospital. The initiative was conducted on both teaching and nonteaching general internal medicine services, which typically have a daily census of between 10 and 15 patients. No protocol changes occurred during the study.
Participants
Participants included all English‐ or Spanish‐speaking patients who were hospitalized on a general internal medicine service, had been admitted within the 2 days prior to enrollment, and had a hospitalist as their attending physician. Patients were excluded if they were enrolled in the study during a previous hospitalization, refused to participate, lacked capacity to participate, had hearing or speech impediments precluding regular conversation, were prisoners, if their clinical condition precluded participation, or their attending was an investigator in the project.
Intervention
Participants were prescreened by investigators by reviewing team sign‐outs to determine if patients had any exclusion criteria. Investigators attempted to survey each patient who met inclusion criteria on a daily basis between 9:00 am and 11:00 am. An investigator administered the survey to each patient verbally using scripted language. Patients were asked to rate how well their doctors were listening to them, explaining what they wanted to know, and whether the doctors were being friendly and helpful, all questions taken from a survey that was available on the US Department of Health and Human Services website (to be referred to as here forward daily survey).[16] We converted the original 5‐point Likert scale used in this survey to a 4‐point scale by removing the option of ok, leaving participants the options of poor, fair, good, or great. Patients were also asked to provide any personalized feedback they had, and these comments were recorded in writing by the investigator.
After being surveyed on day 1, patients were randomized to an intervention or control group using an automated randomization module in Research Electronic Data Capture (REDCap).[17] Patients in both groups who did not provide answers to all 3 questions that qualified as being top box (ie, great) were resurveyed on a daily basis until their responses were all top box or they were discharged, met exclusion criteria, or had been surveyed for a total of 4 consecutive days. In the pilot phase of this study, we found that if patients reported all top box scores on the initial survey their responses typically did not change over time, and the patients became frustrated if asked the same questions again when the patient felt there was not room for improvement. Accordingly, we elected to stop surveying patients when all top box responses were reported.
The attending hospitalist caring for each patient in the intervention group was given feedback about their patients' survey results (both their scores and any specific comments) on a daily basis. Feedback was provided in person by 1 of the investigators. The hospitalist also received an automatically generated electronic mail message with the survey results at 11:00 am on each study day. After informing the hospitalists of the patients' scores, the investigator provided a brief education session that included discussing Denver Health's most recent HCAHPS scores, value‐based purchasing, and the financial consequences of poor patient satisfaction scores. The investigator then coached the hospitalist on etiquette‐based communication,[18, 19] suggested that they sit down when communicating with their patients,[19, 20] and then asked the hospitalist to revisit each patient to discuss how the team could improve in any of the 3 areas where the patient did not give a top box score. These educational sessions were conducted in person and lasted a maximum of 5 minutes. An investigator followed up with each hospitalist the following day to determine whether the revisit occurred. Hospitalists caring for patients who were randomized to the control group were not given real‐time feedback or coaching and were not asked to revisit patients.
A random sample of patients surveyed for this initiative also received HCAHPS surveys 48 hours to 6 weeks following their hospital discharge, according to the standard methodology used to acquire HCAHPS data,[21] by an outside vendor contracted by Denver Health. Our vendor conducted these surveys via telephone in English or Spanish.
Outcomes
The primary outcome was the proportion of patients in each group who reported top box scores on the daily surveys. Secondary outcomes included the percent change for the scores recorded for 3 provider‐specific questions from the daily survey, the median top box HCAHPS scores for the 3 provider related questions and overall hospital rating, and the HCAHPS percentiles of top box scores for these questions.
Sample Size
The sample size for this intervention assumed that the proportion of patients whose treating physicians did not receive real‐time feedback who rated their providers as top box would be 75%, and that the effect of providing real‐time feedback would increase this proportion to 85% on the daily surveys. To have 80% power with a type 1 error of 0.05, we estimated a need to enroll 430 patients, 215 in each group.
Statistics
Data were collected and managed using a secure, Web‐based electronic data capture tool hosted at Denver Health (REDCap), which is designed to support data collection for research studies providing: (1) an intuitive interface for validated data entry, (2) audit trails for tracking data manipulation and export procedures, (3) automated export procedures for seamless data downloads to common statistical packages, and (4) procedures for importing data from external sources.[17]
A 2 test was used to compare the proportion of patients in the 2 groups who reported great scores for each question on the study survey on the first and last day. With the intent of providing a framework for understanding the effect real‐time feedback could have on patient experience, a secondary analysis of HCAHPS results was conducted using several different methods.
First, the proportion of patients in the 2 groups who reported scores of 9 or 10 for the overall hospital rating question or reported always for each doctor communication question on the HCHAPS survey was compared using a 2. Second, to allow for detection of differences in a sample with a smaller N, the median overall hospital rating scores from the HCAHPS survey reported by patients in the 2 groups who completed a survey following discharge were compared using a Wilcoxon rank sum test. Lastly, to place changes in proportion into a larger context (ie, how these changes would relate to value‐based purchasing), HCAHPS scores were converted to percentiles of national performance using the 2014 percentile rankings obtained from the external vendor that conducts the HCAHPS surveys for our hospital and compared between the intervention and control groups using a Wilcoxon rank sum test.
All comments collected from patients during their daily surveys were reviewed, and key words were abstracted from each comment. These key words were sorted and reviewed to categorize recurring key words into themes. Exemplars were then selected for each theme derived from patient comments.
RESULTS
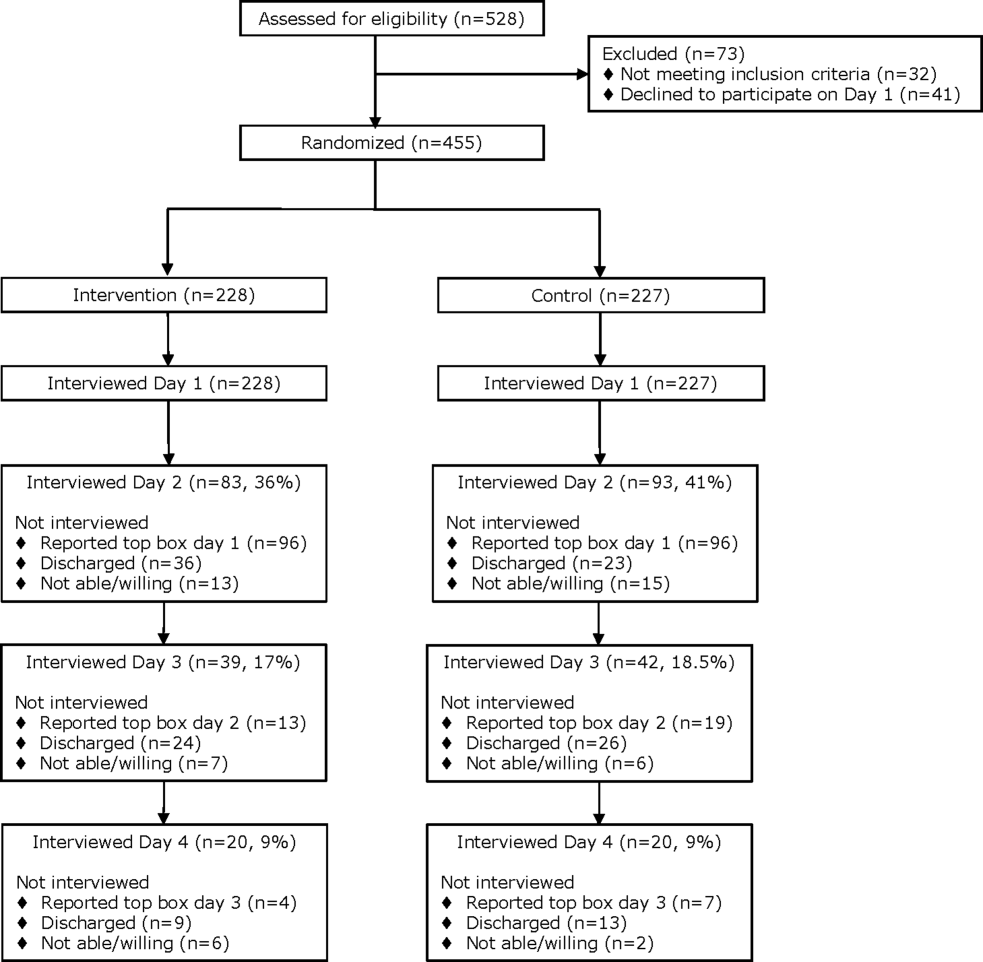
From April 14, 2014 to September 19, 2014, we enrolled 227 patients in the control group and 228 in the intervention group (Figure 1). Patient demographics are summarized in Table 1. Of the 132 patients in the intervention group who reported anything less than top box scores for any of the 3 questions (thus prompting a revisit by their provider), 106 (80%) were revisited by their provider at least once during their hospitalization.
| All Patients | HCAHPS Patients | |||
|---|---|---|---|---|
| Control, N = 227 | Intervention, N = 228 | Control, N = 35 | Intervention, N = 30 | |
| ||||
| Age, mean SD | 55 14 | 55 15 | 55 15 | 57 16 |
| Gender | ||||
| Male | 126 (60) | 121 (55) | 20 (57) | 12 (40) |
| Female | 85 (40) | 98 (45) | 15(43) | 18 (60) |
| Race/ethnicity | ||||
| Hispanic | 84 (40) | 90 (41) | 17 (49) | 12 (40) |
| Black | 38 (18) | 28 (13) | 6 (17) | 7 (23) |
| White | 87 (41) | 97 (44) | 12 (34) | 10 (33) |
| Other | 2 (1) | 4 (2) | 0 (0) | 1 (3) |
| Payer | ||||
| Medicare | 65 (29) | 82 (36) | 15 (43) | 12 (40) |
| Medicaid | 122 (54) | 108 (47) | 17 (49) | 14 (47) |
| Commercial | 12 (5) | 15 (7) | 1 (3) | 1 (3) |
| Medically indigent | 4 (2) | 7 (3) | 0 (0) | 3 (10) |
| Self‐pay | 5 (2) | 4 (2) | 1 (3) | 0 (0) |
| Other/unknown | 19 (8) | 12 (5) | 0 (0) | 0 (0) |
| Team | ||||
| Teaching | 187 (82) | 196 (86) | 27 (77) | 24 (80) |
| Nonteaching | 40 (18) | 32 (14) | 8 (23) | 6 (20) |
| Top 5 primary discharge diagnoses* | ||||
| Septicemia | 26 (11) | 34 (15) | 3 (9) | 5 (17) |
| Heart failure | 14 (6) | 13 (6) | 2 (6) | |
| Acute pancreatitis | 12 (5) | 9 (4) | 3 (9) | 2 (7) |
| Diabetes mellitus | 11 (5) | 8 (4) | 2 (6) | |
| Alcohol withdrawal | 9 (4) | |||
| Cellulitis | 7 (3) | 2 (7) | ||
| Pulmonary embolism | 2 (7) | |||
| Chest pain | 2 (7) | |||
| Atrial fibrillation | 2 (6) | |||
| Length of stay, median (IQR) | 3 (2, 5) | 3 (2, 5) | 3 (2, 5) | 3 (2, 4) |
| Charlson Comorbidity Index, median (IQR) | 1 (0, 3) | 2 (0, 3) | 1 (0, 3) | 1.5 (1, 3) |
Daily Surveys
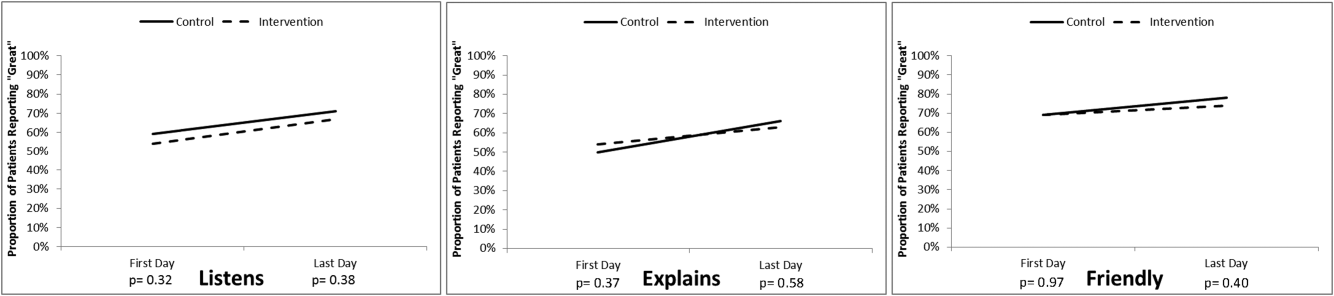
The proportion of patients in both study groups reporting top box scores tended to increase from the first day to the last day of the survey (Figure 2); however, we found no statistically significant differences between the proportion of patients who reported top box scores on first day or last day in the intervention group compared to the control group. The comments made by the patients are summarized in Supporting Table 1 in the online version of this article.
HCAHPS Scores
The proportion of top box scores from the HCAHPS surveys were higher, though not statistically significant, for all 3 provider‐specific questions and for the overall hospital rating for patients whose hospitalists received real‐time feedback (Table 2). The median [interquartile range] score for the overall hospital rating was higher for patients in the intervention group compared with those in the control group, (10 [9, 10] vs 9 [8, 10], P = 0.04]. After converting the HCAHPS scores to percentiles, we found considerably higher rankings for all 3 provider‐related questions and for the overall hospital rating in the intervention group compared to the control group (P = 0.02 for overall differences in percentiles [Table 2]).
| HCAHPS Questions | Proportion Top Box* | Percentile Rank | ||
|---|---|---|---|---|
| Control, N = 35 | Intervention, N = 30 | Control, N = 35 | Intervention, N = 30 | |
| ||||
| Overall hospital rating | 61% | 80% | 6 | 87 |
| Courtesy/respect | 86% | 93% | 23 | 88 |
| Clear communication | 77% | 80% | 39 | 60 |
| Listening | 83% | 90% | 57 | 95 |
No adverse events occurred during the course of the study in either group.
DISCUSSION
The important findings of this study were that (1) daily patient satisfaction scores improved from first day to last day regardless of study group, (2) patients whose providers received real‐time feedback had a trend toward higher HCAHPS proportions for the 3 provider‐related questions as well as the overall rating of the hospital but were not statistically significant, (3) the percentile differences in these 3 questions as well as the overall rating of the hospital were significantly higher in the intervention group as was the median score for the overall hospital rating.
Our original sample size calculation was based upon our own preliminary data, indicating that our baseline top box scores for the daily survey was around 75%. The daily survey top box score on the first day was, however, much lower (Figure 2). Accordingly, although we did not find a significant difference in these daily scores, we were underpowered to find such a difference. Additionally, because only a small percentage of patients are selected for the HCAHPS survey, our ability to detect a difference in this secondary outcome was also limited. We felt that it was important to analyze the percentile comparisons in addition to the proportion of top box scores on the HCAHPS, because the metrics for value‐based purchasing are based upon, in part, how a hospital system compares to other systems. Finally, to improve our power to detect a difference given a small sample size, we converted the scoring system for overall hospital ranking to a continuous variable, which again was noted to be significant.
To our knowledge, this is the first randomized investigation designed to assess the effect of real‐time, patient‐specific feedback to physicians. Real‐time feedback is increasingly being incorporated into medical practice, but there is only limited information available describing how this type of feedback affects outcomes.[22, 23, 24] Banka et al.[15] found that HCAHPS scores improved as a result of real‐time feedback given to residents, but the study was not randomized, utilized a pre‐post design that resulted in there being differences between the patients studied before and after the intervention, and did not provide patient‐specific data to the residents. Tabib et al.[25] found that operating costs decreased 17% after instituting real‐time feedback to providers about these costs. Reeves et al.[26] conducted a cluster randomized trial of a patient feedback survey that was designed to improve nursing care, but the results were reviewed by the nurses several months after patients had been discharged.
The differences in median top box scores and percentile rank that we observed could have resulted from the real‐time feedback, the educational coaching, the fact that the providers revisited the majority of the patients, or a combination of all of the above. Gross et al.[27] found that longer visits lead to higher satisfaction, though others have not found this to necessarily be the case.[28, 29] Lin et al.[30] found that patient satisfaction was affected by the perceived duration of the visit as well as whether expectations on visit length were met and/or exceeded. Brown et al.[31] found that training providers in communication skills improved the providers perception of their communication skills, although patient experience scores did not improve. We feel that the results seen are more likely a combination thereof as opposed to any 1 component of the intervention.
The most commonly reported complaints or concerns in patients' undirected comments often related to communication issues. Comments on subsequent surveys suggested that patient satisfaction improved over time in the intervention group, indicating that perhaps physicians did try to improve in areas that were highlighted by the real‐time feedback, and that patients perceived the physician efforts to do so (eg, They're doing better than the last time you asked. They sat down and talked to me and listened better. They came back and explained to me about my care. They listened better. They should do this survey at the clinic. See Supporting Table 1 in the online version of this article).
Our study has several limitations. First, we did not randomize providers, and many of our providers (approximately 65%) participated in both the control group and also in the intervention group, and thus received real‐time feedback at some point during the study, which could have affected their overall practice and limited our ability to find a difference between the 2 groups. In an attempt to control for this possibility, the study was conducted on an intermittent basis during the study time frame. Furthermore, the proportion of patients who reported top box scores at the beginning of the study did not have a clear trend of change by the end of the study, suggesting that overall clinician practices with respect to patient satisfaction did not change during this short time period.
Second, only a small number of our patients were randomly selected for the HCAHPS survey, which limited our ability to detect significant differences in HCAHPS proportions. Third, the HCAHPS percentiles at our institution at that time were low. Accordingly, the improvements that we observed in patient satisfaction scores might not be reproducible at institutions with higher satisfactions scores. Fourth, time and resources were needed to obtain patient feedback to provide to providers during this study. There are, however, other ways to obtain feedback that are less resource intensive (eg, electronic feedback, the utilization of volunteers, or partnering this with manager rounding). Finally, the study was conducted at a single, university‐affiliated public teaching hospital and was a quality‐improvement initiative, and thus our results are not generalizable to other institutions.
In conclusion, real‐time feedback of patient experience to their providers, coupled with provider education, coaching, and revisits, seems to improve satisfaction of patients hospitalized on general internal medicine units who were cared for by hospitalists.
Acknowledgements
The authors thank Kate Fagan, MPH, for her excellent technical assistance.
Disclosure: Nothing to report.
- HCAHPS Fact Sheet. 2015. Available at: http://www.hcahpsonline.org/Files/HCAHPS_Fact_Sheet_June_2015.pdf. Accessed August 25, 2015.
- , , , . The relationship between commercial website ratings and traditional hospital performance measures in the USA. BMJ Qual Saf. 2013;22:194–202.
- , , , . Patients' perception of hospital care in the United States. N Engl J Med. 2008;359:1921–1931.
- , , , . The relationship between patients' perception of care and measures of hospital quality and safety. Health Serv Res. 2010;45:1024–1040.
- , , , et al. Relationship between quality of diabetes care and patient satisfaction. J Natl Med Assoc. 2003;95:64–70.
- , , , , . Relationship between patient satisfaction with inpatient care and hospital readmission within 30 days. Am J Manag Care. 2011;17:41–48.
- , , . A systematic review of evidence on the links between patient experience and clinical safety and effectiveness. BMJ Open. 2013;3(1).
- , . The association between satisfaction with services provided in primary care and outcomes in type 2 diabetes mellitus. Diabet Med. 2003;20:486–490.
- , , , et al. Associations between Web‐based patient ratings and objective measures of hospital quality. Arch Intern Med. 2012;172:435–436.
- , , , et al. Patient satisfaction and its relationship with clinical quality and inpatient mortality in acute myocardial infarction. Circ Cardiovasc Qual Outcomes. 2010;3:188–195.
- , , , , . Patients' perceptions of care are associated with quality of hospital care: a survey of 4605 hospitals. Am J Med Qual. 2015;30(4):382–388.
- Centers for Medicare 28:908–913.
- , , , , , . Effect of sitting vs. standing on perception of provider time at bedside: a pilot study. Patient Educ Couns. 2012;86:166–171.
- , , , et al. Improving patient satisfaction through physician education, feedback, and incentives. J Hosp Med. 2015;10:497–502.
- US Department of Health and Human Services. Patient satisfaction survey. Available at: http://bphc.hrsa.gov/policiesregulations/performancemeasures/patientsurvey/surveyform.html. Accessed November 15, 2013.
- , , , , , . Research electronic data capture (REDCap)—a metadata‐driven methodology and workflow process for providing translational research informatics support. J Biomed Inform. 2009;42:377–381.
- . The HCAHPS Handbook. Gulf Breeze, FL: Fire Starter; 2010.
- . Etiquette‐based medicine. N Engl J Med. 2008;358:1988–1989.
- . 5 years after the Kahn's etiquette‐based medicine: a brief checklist proposal for a functional second meeting with the patient. Front Psychol. 2013;4:723.
- Frequently Asked Questions. Hospital Value‐Based Purchasing Program. Available at: http://www.cms.gov/Medicare/Quality‐Initiatives‐Patient‐Assessment‐Instruments/hospital‐value‐based‐purchasing/Downloads/FY‐2013‐Program‐Frequently‐Asked‐Questions‐about‐Hospital‐VBP‐3‐9‐12.pdf. Accessed February 8, 2014.
- , , , . Real‐time patient survey data during routine clinical activities for rapid‐cycle quality improvement. JMIR Med Inform. 2015;3:e13.
- . Mount Sinai launches real‐time patient‐feedback survey tool. Healthcare Informatics website. Available at: http://www.healthcare‐informatics.com/news‐item/mount‐sinai‐launches‐real‐time‐patient‐feedback‐survey‐tool. Accessed August 25, 2015.
- , . Hospitals are finally starting to put real‐time data to use. Harvard Business Review website. Available at: https://hbr.org/2014/11/hospitals‐are‐finally‐starting‐to‐put‐real‐time‐data‐to‐use. Published November 12, 2014. Accessed August 25, 2015.
- , , , , . Reducing operating room costs through real‐time cost information feedback: a pilot study. J Endourol. 2015;29:963–968.
- , , . Facilitated patient experience feedback can improve nursing care: a pilot study for a phase III cluster randomised controlled trial. BMC Health Serv Res. 2013;13:259.
- , , , , . Patient satisfaction with time spent with their physician. J Fam Pract. 1998;47:133–137.
- , , , , , . The relationship between time spent communicating and communication outcomes on a hospital medicine service. J Gen Intern Med. 2012;27:185–189.
- , . Cognitive interview techniques reveal specific behaviors and issues that could affect patient satisfaction relative to hospitalists. J Hosp Med. 2009;4:E1–E6.
- , , , et al. Is patients' perception of time spent with the physician a determinant of ambulatory patient satisfaction? Arch Intern Med. 2001;161:1437–1442.
- , , , . Effect of clinician communication skills training on patient satisfaction. A randomized, controlled trial. Ann Intern Med. 1999;131:822–829.
In 2010, the Centers for Medicare and Medicaid Services implemented value‐based purchasing, a payment model that incentivizes hospitals for reaching certain quality and patient experience thresholds and penalizes those that do not, in part on the basis of patient satisfaction scores.[1] Although low patient satisfaction scores will adversely affect institutions financially, they also reflect patients' perceptions of their care. Some studies suggest that hospitals with higher patient satisfaction scores score higher overall on clinical care processes such as core measures compliance, readmission rates, lower mortality rates, and other quality‐of‐care metrics.[2, 3, 4, 5, 6, 7, 8, 9, 10, 11]
The Hospital Consumer Assessment of Healthcare Providers and Systems (HCAHPS) survey assesses patients' experience following their hospital stay.[1] The percent of top box scores (ie, response of always on a four point scale, or scores of 9 or 10 on a 10‐point scale) are utilized to compare hospitals and determine the reimbursement or penalty a hospital will receive. Although these scores are available to the public on the Hospital Compare website,[12] physicians may not know how their hospital is ranked or how they are individually perceived by their patients. Additionally, these surveys are typically conducted 48 hours to 6 weeks after patients are discharged, and the results are distributed back to the hospitals well after the time that care was provided, thereby offering providers no chance of improving patient satisfaction during a given hospital stay.
Institutions across the country are trying to improve their HCAHPS scores, but there is limited research identifying specific measures providers can implement. Some studies have suggested that utilizing etiquette‐based communication and sitting at the bedside[13, 14] may help improve patient experience with their providers, and more recently, it has been suggested that providing real‐time deidentified patient experience survey results with education and a rewards/emncentive system to residents may help as well.[15]
Surveys conducted during a patient's hospitalization can offer real‐time actionable feedback to providers. We performed a quality‐improvement project that was designed to determine if real‐time feedback to hospitalist physicians, followed by coaching, and revisits to the patients' bedside could improve the results recorded on provider‐specific patient surveys and/or patients' HCAHPS scores or percentile rankings.
METHODS
Design
This was a prospective, randomized quality‐improvement initiative that was approved by the Colorado Multiple Institutional Review Board and conducted at Denver Health, a 525‐bed university‐affiliated public safety net hospital. The initiative was conducted on both teaching and nonteaching general internal medicine services, which typically have a daily census of between 10 and 15 patients. No protocol changes occurred during the study.
Participants
Participants included all English‐ or Spanish‐speaking patients who were hospitalized on a general internal medicine service, had been admitted within the 2 days prior to enrollment, and had a hospitalist as their attending physician. Patients were excluded if they were enrolled in the study during a previous hospitalization, refused to participate, lacked capacity to participate, had hearing or speech impediments precluding regular conversation, were prisoners, if their clinical condition precluded participation, or their attending was an investigator in the project.
Intervention
Participants were prescreened by investigators by reviewing team sign‐outs to determine if patients had any exclusion criteria. Investigators attempted to survey each patient who met inclusion criteria on a daily basis between 9:00 am and 11:00 am. An investigator administered the survey to each patient verbally using scripted language. Patients were asked to rate how well their doctors were listening to them, explaining what they wanted to know, and whether the doctors were being friendly and helpful, all questions taken from a survey that was available on the US Department of Health and Human Services website (to be referred to as here forward daily survey).[16] We converted the original 5‐point Likert scale used in this survey to a 4‐point scale by removing the option of ok, leaving participants the options of poor, fair, good, or great. Patients were also asked to provide any personalized feedback they had, and these comments were recorded in writing by the investigator.
After being surveyed on day 1, patients were randomized to an intervention or control group using an automated randomization module in Research Electronic Data Capture (REDCap).[17] Patients in both groups who did not provide answers to all 3 questions that qualified as being top box (ie, great) were resurveyed on a daily basis until their responses were all top box or they were discharged, met exclusion criteria, or had been surveyed for a total of 4 consecutive days. In the pilot phase of this study, we found that if patients reported all top box scores on the initial survey their responses typically did not change over time, and the patients became frustrated if asked the same questions again when the patient felt there was not room for improvement. Accordingly, we elected to stop surveying patients when all top box responses were reported.
The attending hospitalist caring for each patient in the intervention group was given feedback about their patients' survey results (both their scores and any specific comments) on a daily basis. Feedback was provided in person by 1 of the investigators. The hospitalist also received an automatically generated electronic mail message with the survey results at 11:00 am on each study day. After informing the hospitalists of the patients' scores, the investigator provided a brief education session that included discussing Denver Health's most recent HCAHPS scores, value‐based purchasing, and the financial consequences of poor patient satisfaction scores. The investigator then coached the hospitalist on etiquette‐based communication,[18, 19] suggested that they sit down when communicating with their patients,[19, 20] and then asked the hospitalist to revisit each patient to discuss how the team could improve in any of the 3 areas where the patient did not give a top box score. These educational sessions were conducted in person and lasted a maximum of 5 minutes. An investigator followed up with each hospitalist the following day to determine whether the revisit occurred. Hospitalists caring for patients who were randomized to the control group were not given real‐time feedback or coaching and were not asked to revisit patients.
A random sample of patients surveyed for this initiative also received HCAHPS surveys 48 hours to 6 weeks following their hospital discharge, according to the standard methodology used to acquire HCAHPS data,[21] by an outside vendor contracted by Denver Health. Our vendor conducted these surveys via telephone in English or Spanish.
Outcomes
The primary outcome was the proportion of patients in each group who reported top box scores on the daily surveys. Secondary outcomes included the percent change for the scores recorded for 3 provider‐specific questions from the daily survey, the median top box HCAHPS scores for the 3 provider related questions and overall hospital rating, and the HCAHPS percentiles of top box scores for these questions.
Sample Size
The sample size for this intervention assumed that the proportion of patients whose treating physicians did not receive real‐time feedback who rated their providers as top box would be 75%, and that the effect of providing real‐time feedback would increase this proportion to 85% on the daily surveys. To have 80% power with a type 1 error of 0.05, we estimated a need to enroll 430 patients, 215 in each group.
Statistics
Data were collected and managed using a secure, Web‐based electronic data capture tool hosted at Denver Health (REDCap), which is designed to support data collection for research studies providing: (1) an intuitive interface for validated data entry, (2) audit trails for tracking data manipulation and export procedures, (3) automated export procedures for seamless data downloads to common statistical packages, and (4) procedures for importing data from external sources.[17]
A 2 test was used to compare the proportion of patients in the 2 groups who reported great scores for each question on the study survey on the first and last day. With the intent of providing a framework for understanding the effect real‐time feedback could have on patient experience, a secondary analysis of HCAHPS results was conducted using several different methods.
First, the proportion of patients in the 2 groups who reported scores of 9 or 10 for the overall hospital rating question or reported always for each doctor communication question on the HCHAPS survey was compared using a 2. Second, to allow for detection of differences in a sample with a smaller N, the median overall hospital rating scores from the HCAHPS survey reported by patients in the 2 groups who completed a survey following discharge were compared using a Wilcoxon rank sum test. Lastly, to place changes in proportion into a larger context (ie, how these changes would relate to value‐based purchasing), HCAHPS scores were converted to percentiles of national performance using the 2014 percentile rankings obtained from the external vendor that conducts the HCAHPS surveys for our hospital and compared between the intervention and control groups using a Wilcoxon rank sum test.
All comments collected from patients during their daily surveys were reviewed, and key words were abstracted from each comment. These key words were sorted and reviewed to categorize recurring key words into themes. Exemplars were then selected for each theme derived from patient comments.
RESULTS
From April 14, 2014 to September 19, 2014, we enrolled 227 patients in the control group and 228 in the intervention group (Figure 1). Patient demographics are summarized in Table 1. Of the 132 patients in the intervention group who reported anything less than top box scores for any of the 3 questions (thus prompting a revisit by their provider), 106 (80%) were revisited by their provider at least once during their hospitalization.
| All Patients | HCAHPS Patients | |||
|---|---|---|---|---|
| Control, N = 227 | Intervention, N = 228 | Control, N = 35 | Intervention, N = 30 | |
| ||||
| Age, mean SD | 55 14 | 55 15 | 55 15 | 57 16 |
| Gender | ||||
| Male | 126 (60) | 121 (55) | 20 (57) | 12 (40) |
| Female | 85 (40) | 98 (45) | 15(43) | 18 (60) |
| Race/ethnicity | ||||
| Hispanic | 84 (40) | 90 (41) | 17 (49) | 12 (40) |
| Black | 38 (18) | 28 (13) | 6 (17) | 7 (23) |
| White | 87 (41) | 97 (44) | 12 (34) | 10 (33) |
| Other | 2 (1) | 4 (2) | 0 (0) | 1 (3) |
| Payer | ||||
| Medicare | 65 (29) | 82 (36) | 15 (43) | 12 (40) |
| Medicaid | 122 (54) | 108 (47) | 17 (49) | 14 (47) |
| Commercial | 12 (5) | 15 (7) | 1 (3) | 1 (3) |
| Medically indigent | 4 (2) | 7 (3) | 0 (0) | 3 (10) |
| Self‐pay | 5 (2) | 4 (2) | 1 (3) | 0 (0) |
| Other/unknown | 19 (8) | 12 (5) | 0 (0) | 0 (0) |
| Team | ||||
| Teaching | 187 (82) | 196 (86) | 27 (77) | 24 (80) |
| Nonteaching | 40 (18) | 32 (14) | 8 (23) | 6 (20) |
| Top 5 primary discharge diagnoses* | ||||
| Septicemia | 26 (11) | 34 (15) | 3 (9) | 5 (17) |
| Heart failure | 14 (6) | 13 (6) | 2 (6) | |
| Acute pancreatitis | 12 (5) | 9 (4) | 3 (9) | 2 (7) |
| Diabetes mellitus | 11 (5) | 8 (4) | 2 (6) | |
| Alcohol withdrawal | 9 (4) | |||
| Cellulitis | 7 (3) | 2 (7) | ||
| Pulmonary embolism | 2 (7) | |||
| Chest pain | 2 (7) | |||
| Atrial fibrillation | 2 (6) | |||
| Length of stay, median (IQR) | 3 (2, 5) | 3 (2, 5) | 3 (2, 5) | 3 (2, 4) |
| Charlson Comorbidity Index, median (IQR) | 1 (0, 3) | 2 (0, 3) | 1 (0, 3) | 1.5 (1, 3) |
Daily Surveys
The proportion of patients in both study groups reporting top box scores tended to increase from the first day to the last day of the survey (Figure 2); however, we found no statistically significant differences between the proportion of patients who reported top box scores on first day or last day in the intervention group compared to the control group. The comments made by the patients are summarized in Supporting Table 1 in the online version of this article.
HCAHPS Scores
The proportion of top box scores from the HCAHPS surveys were higher, though not statistically significant, for all 3 provider‐specific questions and for the overall hospital rating for patients whose hospitalists received real‐time feedback (Table 2). The median [interquartile range] score for the overall hospital rating was higher for patients in the intervention group compared with those in the control group, (10 [9, 10] vs 9 [8, 10], P = 0.04]. After converting the HCAHPS scores to percentiles, we found considerably higher rankings for all 3 provider‐related questions and for the overall hospital rating in the intervention group compared to the control group (P = 0.02 for overall differences in percentiles [Table 2]).
| HCAHPS Questions | Proportion Top Box* | Percentile Rank | ||
|---|---|---|---|---|
| Control, N = 35 | Intervention, N = 30 | Control, N = 35 | Intervention, N = 30 | |
| ||||
| Overall hospital rating | 61% | 80% | 6 | 87 |
| Courtesy/respect | 86% | 93% | 23 | 88 |
| Clear communication | 77% | 80% | 39 | 60 |
| Listening | 83% | 90% | 57 | 95 |
No adverse events occurred during the course of the study in either group.
DISCUSSION
The important findings of this study were that (1) daily patient satisfaction scores improved from first day to last day regardless of study group, (2) patients whose providers received real‐time feedback had a trend toward higher HCAHPS proportions for the 3 provider‐related questions as well as the overall rating of the hospital but were not statistically significant, (3) the percentile differences in these 3 questions as well as the overall rating of the hospital were significantly higher in the intervention group as was the median score for the overall hospital rating.
Our original sample size calculation was based upon our own preliminary data, indicating that our baseline top box scores for the daily survey was around 75%. The daily survey top box score on the first day was, however, much lower (Figure 2). Accordingly, although we did not find a significant difference in these daily scores, we were underpowered to find such a difference. Additionally, because only a small percentage of patients are selected for the HCAHPS survey, our ability to detect a difference in this secondary outcome was also limited. We felt that it was important to analyze the percentile comparisons in addition to the proportion of top box scores on the HCAHPS, because the metrics for value‐based purchasing are based upon, in part, how a hospital system compares to other systems. Finally, to improve our power to detect a difference given a small sample size, we converted the scoring system for overall hospital ranking to a continuous variable, which again was noted to be significant.
To our knowledge, this is the first randomized investigation designed to assess the effect of real‐time, patient‐specific feedback to physicians. Real‐time feedback is increasingly being incorporated into medical practice, but there is only limited information available describing how this type of feedback affects outcomes.[22, 23, 24] Banka et al.[15] found that HCAHPS scores improved as a result of real‐time feedback given to residents, but the study was not randomized, utilized a pre‐post design that resulted in there being differences between the patients studied before and after the intervention, and did not provide patient‐specific data to the residents. Tabib et al.[25] found that operating costs decreased 17% after instituting real‐time feedback to providers about these costs. Reeves et al.[26] conducted a cluster randomized trial of a patient feedback survey that was designed to improve nursing care, but the results were reviewed by the nurses several months after patients had been discharged.
The differences in median top box scores and percentile rank that we observed could have resulted from the real‐time feedback, the educational coaching, the fact that the providers revisited the majority of the patients, or a combination of all of the above. Gross et al.[27] found that longer visits lead to higher satisfaction, though others have not found this to necessarily be the case.[28, 29] Lin et al.[30] found that patient satisfaction was affected by the perceived duration of the visit as well as whether expectations on visit length were met and/or exceeded. Brown et al.[31] found that training providers in communication skills improved the providers perception of their communication skills, although patient experience scores did not improve. We feel that the results seen are more likely a combination thereof as opposed to any 1 component of the intervention.
The most commonly reported complaints or concerns in patients' undirected comments often related to communication issues. Comments on subsequent surveys suggested that patient satisfaction improved over time in the intervention group, indicating that perhaps physicians did try to improve in areas that were highlighted by the real‐time feedback, and that patients perceived the physician efforts to do so (eg, They're doing better than the last time you asked. They sat down and talked to me and listened better. They came back and explained to me about my care. They listened better. They should do this survey at the clinic. See Supporting Table 1 in the online version of this article).
Our study has several limitations. First, we did not randomize providers, and many of our providers (approximately 65%) participated in both the control group and also in the intervention group, and thus received real‐time feedback at some point during the study, which could have affected their overall practice and limited our ability to find a difference between the 2 groups. In an attempt to control for this possibility, the study was conducted on an intermittent basis during the study time frame. Furthermore, the proportion of patients who reported top box scores at the beginning of the study did not have a clear trend of change by the end of the study, suggesting that overall clinician practices with respect to patient satisfaction did not change during this short time period.
Second, only a small number of our patients were randomly selected for the HCAHPS survey, which limited our ability to detect significant differences in HCAHPS proportions. Third, the HCAHPS percentiles at our institution at that time were low. Accordingly, the improvements that we observed in patient satisfaction scores might not be reproducible at institutions with higher satisfactions scores. Fourth, time and resources were needed to obtain patient feedback to provide to providers during this study. There are, however, other ways to obtain feedback that are less resource intensive (eg, electronic feedback, the utilization of volunteers, or partnering this with manager rounding). Finally, the study was conducted at a single, university‐affiliated public teaching hospital and was a quality‐improvement initiative, and thus our results are not generalizable to other institutions.
In conclusion, real‐time feedback of patient experience to their providers, coupled with provider education, coaching, and revisits, seems to improve satisfaction of patients hospitalized on general internal medicine units who were cared for by hospitalists.
Acknowledgements
The authors thank Kate Fagan, MPH, for her excellent technical assistance.
Disclosure: Nothing to report.
- HCAHPS Fact Sheet. 2015. Available at: http://www.hcahpsonline.org/Files/HCAHPS_Fact_Sheet_June_2015.pdf. Accessed August 25, 2015.
- , , , . The relationship between commercial website ratings and traditional hospital performance measures in the USA. BMJ Qual Saf. 2013;22:194–202.
- , , , . Patients' perception of hospital care in the United States. N Engl J Med. 2008;359:1921–1931.
- , , , . The relationship between patients' perception of care and measures of hospital quality and safety. Health Serv Res. 2010;45:1024–1040.
- , , , et al. Relationship between quality of diabetes care and patient satisfaction. J Natl Med Assoc. 2003;95:64–70.
- , , , , . Relationship between patient satisfaction with inpatient care and hospital readmission within 30 days. Am J Manag Care. 2011;17:41–48.
- , , . A systematic review of evidence on the links between patient experience and clinical safety and effectiveness. BMJ Open. 2013;3(1).
- , . The association between satisfaction with services provided in primary care and outcomes in type 2 diabetes mellitus. Diabet Med. 2003;20:486–490.
- , , , et al. Associations between Web‐based patient ratings and objective measures of hospital quality. Arch Intern Med. 2012;172:435–436.
- , , , et al. Patient satisfaction and its relationship with clinical quality and inpatient mortality in acute myocardial infarction. Circ Cardiovasc Qual Outcomes. 2010;3:188–195.
- , , , , . Patients' perceptions of care are associated with quality of hospital care: a survey of 4605 hospitals. Am J Med Qual. 2015;30(4):382–388.
- Centers for Medicare 28:908–913.
- , , , , , . Effect of sitting vs. standing on perception of provider time at bedside: a pilot study. Patient Educ Couns. 2012;86:166–171.
- , , , et al. Improving patient satisfaction through physician education, feedback, and incentives. J Hosp Med. 2015;10:497–502.
- US Department of Health and Human Services. Patient satisfaction survey. Available at: http://bphc.hrsa.gov/policiesregulations/performancemeasures/patientsurvey/surveyform.html. Accessed November 15, 2013.
- , , , , , . Research electronic data capture (REDCap)—a metadata‐driven methodology and workflow process for providing translational research informatics support. J Biomed Inform. 2009;42:377–381.
- . The HCAHPS Handbook. Gulf Breeze, FL: Fire Starter; 2010.
- . Etiquette‐based medicine. N Engl J Med. 2008;358:1988–1989.
- . 5 years after the Kahn's etiquette‐based medicine: a brief checklist proposal for a functional second meeting with the patient. Front Psychol. 2013;4:723.
- Frequently Asked Questions. Hospital Value‐Based Purchasing Program. Available at: http://www.cms.gov/Medicare/Quality‐Initiatives‐Patient‐Assessment‐Instruments/hospital‐value‐based‐purchasing/Downloads/FY‐2013‐Program‐Frequently‐Asked‐Questions‐about‐Hospital‐VBP‐3‐9‐12.pdf. Accessed February 8, 2014.
- , , , . Real‐time patient survey data during routine clinical activities for rapid‐cycle quality improvement. JMIR Med Inform. 2015;3:e13.
- . Mount Sinai launches real‐time patient‐feedback survey tool. Healthcare Informatics website. Available at: http://www.healthcare‐informatics.com/news‐item/mount‐sinai‐launches‐real‐time‐patient‐feedback‐survey‐tool. Accessed August 25, 2015.
- , . Hospitals are finally starting to put real‐time data to use. Harvard Business Review website. Available at: https://hbr.org/2014/11/hospitals‐are‐finally‐starting‐to‐put‐real‐time‐data‐to‐use. Published November 12, 2014. Accessed August 25, 2015.
- , , , , . Reducing operating room costs through real‐time cost information feedback: a pilot study. J Endourol. 2015;29:963–968.
- , , . Facilitated patient experience feedback can improve nursing care: a pilot study for a phase III cluster randomised controlled trial. BMC Health Serv Res. 2013;13:259.
- , , , , . Patient satisfaction with time spent with their physician. J Fam Pract. 1998;47:133–137.
- , , , , , . The relationship between time spent communicating and communication outcomes on a hospital medicine service. J Gen Intern Med. 2012;27:185–189.
- , . Cognitive interview techniques reveal specific behaviors and issues that could affect patient satisfaction relative to hospitalists. J Hosp Med. 2009;4:E1–E6.
- , , , et al. Is patients' perception of time spent with the physician a determinant of ambulatory patient satisfaction? Arch Intern Med. 2001;161:1437–1442.
- , , , . Effect of clinician communication skills training on patient satisfaction. A randomized, controlled trial. Ann Intern Med. 1999;131:822–829.
© 2016 Society of Hospital Medicine

How malaria fools the immune system

infecting a red blood cell
Image courtesy of St. Jude
Children’s Research Hospital
Researchers have reconstructed how malaria parasite proteins bind to the antibodies that act as the first line of defense against the parasite.
The team described the binding of immunoglobulin M (IgM) to Plasmodium falciparum erythrocyte membrane protein-1 (PfEMP1).
They said their findings, published in Cell Reports, may provide valuable knowledge for the design of antimalarial drugs.
One strategy the malaria parasite Plasmodium falciparum uses to amplify its probability of spreading is the formation of rosette-shaped clusters of uninfected red blood cells (RBCs) surrounding a malaria-infected RBC.
Since the parasite in the central cell of the rosette can easily infect the surrounding cells, the rosette enhances the infection. Rosetting is associated with severe malaria and high fever.
One of the key players in the formation of the rosette is PfEMP1. PfEMP1 sticks out of the infected RBC and deceives one of the first defenses against malaria—IgM antibodies.
IgMs bind to the parasite or parasite-infected cells and call other immune molecules, like the complement system, for backup.
With the current study, researchers have shown that IgMs bind 1 or 2 PfEMP1 proteins, forming a bouquet-type shape on the surface of the infected cells.
Plasmodium falciparum exploits these IgMs to its own advantage because the bouquet attracts more RBCs, facilitating the formation of rosettes. Moreover, the IgMs in the bouquet are not able to bind the complement system and destroy the infected cell.
“The bond between PfEMP1s and IgMs is like the perfect Velcro—not too loose, not too strong,” said Ulf Skoglund, PhD, of Okinawa Institute for Science and Technology Graduate University in Japan.
“It is devilishly engineered to fool our immune system.”
The technique Dr Skoglund and his colleagues used to assess this bond allowed them to have a unique view of the proteins’ conformation.
“We have seen that PfEMP1 is a stiff, C-shaped protein,” he said. “Being stiff is an advantage. If it was floppy, it would not work so well. IgM, instead, assume 3 conformations: extended, bell, and turtle shape.”
Dr Skoglund and his colleagues believe that having this 3D structural model of the PfEMP1 and IgM complex can help scientists design antimalarial treatments that can break down or wash out malaria rosettes without hurting the patient. ![]()
Endocrine Society issues first-ever guidelines for primary adrenal insufficiency
New guidelines on the diagnosis and management of primary adrenal insufficiency stress the importance of early recognition and the need to prevent life-threatening adrenal crises in these patients.
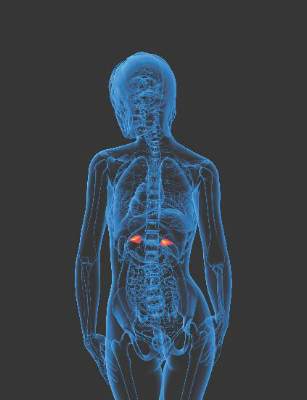
These are the first clinical practice guidelines on primary adrenal insufficiency (PAI), also known as Addison’s disease, issued by Endocrine Society (J Clin Endocrinol Metab. 2016 Jan 13:jc20151710 [Epub ahead of print]).
“Because it’s a rare disease and symptoms can mimic common conditions, adrenal insufficiency is often, at least initially, overlooked,” guideline co-author Dr. Deborah Merke, a senior investigator with the National Institutes of Health Clinical Center in Bethesda, Md., said. “So the main goal of these clinical practice guidelines is to improve patient care.”
The guidelines suggest clinicians should have a low diagnostic threshold in acutely ill patients with unexplained symptoms or signs suggestive of PAI such as volume depletion, hypotension, hyponatremia, hyperkalemia, fever, abdominal pain, hyperpigmentation, or, especially in children, hypoglycemia.
This low diagnostic threshold for PAI should also be extended to pregnant women with unexplained persistent nausea, fatigue, and hypotension.
For adult patients with a suspected adrenal crisis, an immediate parenteral injection of hydrocortisone 100 mg should be given, followed by appropriate fluid resuscitation and 200 mg of hydrocortisone for 24 hours, according to the guidelines, which were co-sponsored by the European Society of Endocrinology and American Association for Clinical Chemistry.
Despite a known association between adrenal crisis and mortality, there is a knowledge gap regarding how to prevent, recognize, and reduce the risk of these life-threatening events, Dr. Merke said.
To that end, the task force has taken a page from the diabetes community in recommending all PAI patients carry steroid emergency identification cards and be equipped with a glucocorticoid injection kit for emergency use and be educated on how to use it.
The guidelines also advocate education about stress dosing to counter the increased demand for corticosteroids during periods of stress, which can encompass something as common as the flu.
“Just like diabetics carry around emergency medicines, it’s important for patients with adrenal insufficiency to carry around an emergency kit and to realize that should they start to get sick, they need to increase their doses,” she said. “There often seems to be a lack of awareness among physicians as well that these patients have a potentially life-threatening condition, should they get a common illness.”
One of the key unanswered clinical questions the task force sought to address was whether the widely used high-dose (250 mcg) corticotropin stimulation test, also known as the adrenocorticotropin (ACTH) or short Synacthen test, should be replaced by the low-dose test (1 mcg) to diagnosis PAI.
Despite a review of published data and a systematic review commissioned by the task force, “We didn’t come up with much scientific evidence to say we should be changing the historic standard,” Dr. Merke said.
The systematic review identified only five studies of high-dose corticotropin testing specifically in PAI and none of low-dose testing. The low-dose test has shown higher sensitivity in the detection of adrenal insufficiency in critically ill patients and secondary adrenal insufficiency, but the limited available data suggest it does not provide better diagnostic accuracy for PAI than the high-dose test.
As a result, the guidelines recommend the standard, short corticotropin test (250 mcg for adults and children aged at least 2 years) as the “gold standard” diagnostic test to establish a PAI diagnosis.
The low-dose (1 mcg) test is recommended only when corticotropin is in short supply, which is not typically a problem in the United States, she said.
If corticotropin testing isn’t feasible, a combination of a morning plasma ACTH and cortisol levels (less than 5 mcg/dL) can be used as an initial screening, though confirmatory testing with corticotropin stimulation is strongly recommended.
Glucocorticoid therapy is recommended in all patients with confirmed PAI based on the highest quality of evidence, with a clear preference given for the short-acting steroids, Dr. Merke observed.
Hydrocortisone 15 mg-25 mg or cortisone acetate 20 mg-35 mg given in two to three divided doses per day is suggested for adults, with the highest dose to be given in the morning. Once- or twice-daily prednisolone 3 mg-5 mg is suggested as an alternative.
Hydrocortisone is also suggested over cortisone acetate, prednisolone, or prednisone for pregnant women and recommended for children (about 8 mg/m2 per day), but the evidence supporting these items was of low quality.
The guidelines suggest against using dexamethasone, the longest-acting glucocorticoid, because of the potential long-term side effects of overt-treatment and the frequent appearance of cushingoid side effects. They also recommend against dexamethasone in pregnant women because it is not inactivated in the placenta.
The guidelines are also quite clear in their suggestion against hormonal monitoring of glucocorticoid replacement and instead favor adjusting treatment based only on clinical response.
“This is a very important suggestion that we made because often clinicians use ACTH to adjust doses and this commonly results in overreplacement and there are side effects to overreplacement,” including weight gain, insomnia, and peripheral edema, Dr. Merke said.
A second systematic review commissioned by the task force involving 15 observational studies of glucocorticoid replacement regimens uncovered very sparse data on mortality, bone density, and incidence of adrenal crisis.
It has been suggested that newer extended-release and dual-release glucocorticoid formulations may result in higher health-reality quality of life than once-, twice-, or thrice-daily regimens, but once again, the evidence was insufficient to support a specific recommendation.
Dr. Merke acknowledged that many of the guidelines recommendations were ungraded or best practices, reflecting the lack of randomized clinical trials in PAI.
“I think that’s why it was so important for us to do this,” she said. “We had a group of experts that were very familiar with this disease providing guidance, but I think it’s also one reason why physicians out there in practice get confused about exactly what to do because of the lack of hard evidence. ... It does certainly cry for the need for more studies in these rare diseases.”
The guidelines were funded by the Endocrine Society, and the authors reported receiving no external funding or remuneration.
New guidelines on the diagnosis and management of primary adrenal insufficiency stress the importance of early recognition and the need to prevent life-threatening adrenal crises in these patients.
These are the first clinical practice guidelines on primary adrenal insufficiency (PAI), also known as Addison’s disease, issued by Endocrine Society (J Clin Endocrinol Metab. 2016 Jan 13:jc20151710 [Epub ahead of print]).
“Because it’s a rare disease and symptoms can mimic common conditions, adrenal insufficiency is often, at least initially, overlooked,” guideline co-author Dr. Deborah Merke, a senior investigator with the National Institutes of Health Clinical Center in Bethesda, Md., said. “So the main goal of these clinical practice guidelines is to improve patient care.”
The guidelines suggest clinicians should have a low diagnostic threshold in acutely ill patients with unexplained symptoms or signs suggestive of PAI such as volume depletion, hypotension, hyponatremia, hyperkalemia, fever, abdominal pain, hyperpigmentation, or, especially in children, hypoglycemia.
This low diagnostic threshold for PAI should also be extended to pregnant women with unexplained persistent nausea, fatigue, and hypotension.
For adult patients with a suspected adrenal crisis, an immediate parenteral injection of hydrocortisone 100 mg should be given, followed by appropriate fluid resuscitation and 200 mg of hydrocortisone for 24 hours, according to the guidelines, which were co-sponsored by the European Society of Endocrinology and American Association for Clinical Chemistry.
Despite a known association between adrenal crisis and mortality, there is a knowledge gap regarding how to prevent, recognize, and reduce the risk of these life-threatening events, Dr. Merke said.
To that end, the task force has taken a page from the diabetes community in recommending all PAI patients carry steroid emergency identification cards and be equipped with a glucocorticoid injection kit for emergency use and be educated on how to use it.
The guidelines also advocate education about stress dosing to counter the increased demand for corticosteroids during periods of stress, which can encompass something as common as the flu.
“Just like diabetics carry around emergency medicines, it’s important for patients with adrenal insufficiency to carry around an emergency kit and to realize that should they start to get sick, they need to increase their doses,” she said. “There often seems to be a lack of awareness among physicians as well that these patients have a potentially life-threatening condition, should they get a common illness.”
One of the key unanswered clinical questions the task force sought to address was whether the widely used high-dose (250 mcg) corticotropin stimulation test, also known as the adrenocorticotropin (ACTH) or short Synacthen test, should be replaced by the low-dose test (1 mcg) to diagnosis PAI.
Despite a review of published data and a systematic review commissioned by the task force, “We didn’t come up with much scientific evidence to say we should be changing the historic standard,” Dr. Merke said.
The systematic review identified only five studies of high-dose corticotropin testing specifically in PAI and none of low-dose testing. The low-dose test has shown higher sensitivity in the detection of adrenal insufficiency in critically ill patients and secondary adrenal insufficiency, but the limited available data suggest it does not provide better diagnostic accuracy for PAI than the high-dose test.
As a result, the guidelines recommend the standard, short corticotropin test (250 mcg for adults and children aged at least 2 years) as the “gold standard” diagnostic test to establish a PAI diagnosis.
The low-dose (1 mcg) test is recommended only when corticotropin is in short supply, which is not typically a problem in the United States, she said.
If corticotropin testing isn’t feasible, a combination of a morning plasma ACTH and cortisol levels (less than 5 mcg/dL) can be used as an initial screening, though confirmatory testing with corticotropin stimulation is strongly recommended.
Glucocorticoid therapy is recommended in all patients with confirmed PAI based on the highest quality of evidence, with a clear preference given for the short-acting steroids, Dr. Merke observed.
Hydrocortisone 15 mg-25 mg or cortisone acetate 20 mg-35 mg given in two to three divided doses per day is suggested for adults, with the highest dose to be given in the morning. Once- or twice-daily prednisolone 3 mg-5 mg is suggested as an alternative.
Hydrocortisone is also suggested over cortisone acetate, prednisolone, or prednisone for pregnant women and recommended for children (about 8 mg/m2 per day), but the evidence supporting these items was of low quality.
The guidelines suggest against using dexamethasone, the longest-acting glucocorticoid, because of the potential long-term side effects of overt-treatment and the frequent appearance of cushingoid side effects. They also recommend against dexamethasone in pregnant women because it is not inactivated in the placenta.
The guidelines are also quite clear in their suggestion against hormonal monitoring of glucocorticoid replacement and instead favor adjusting treatment based only on clinical response.
“This is a very important suggestion that we made because often clinicians use ACTH to adjust doses and this commonly results in overreplacement and there are side effects to overreplacement,” including weight gain, insomnia, and peripheral edema, Dr. Merke said.
A second systematic review commissioned by the task force involving 15 observational studies of glucocorticoid replacement regimens uncovered very sparse data on mortality, bone density, and incidence of adrenal crisis.
It has been suggested that newer extended-release and dual-release glucocorticoid formulations may result in higher health-reality quality of life than once-, twice-, or thrice-daily regimens, but once again, the evidence was insufficient to support a specific recommendation.
Dr. Merke acknowledged that many of the guidelines recommendations were ungraded or best practices, reflecting the lack of randomized clinical trials in PAI.
“I think that’s why it was so important for us to do this,” she said. “We had a group of experts that were very familiar with this disease providing guidance, but I think it’s also one reason why physicians out there in practice get confused about exactly what to do because of the lack of hard evidence. ... It does certainly cry for the need for more studies in these rare diseases.”
The guidelines were funded by the Endocrine Society, and the authors reported receiving no external funding or remuneration.
FROM THE JOURNAL OF CLINICAL ENDOCRINOLOGY & METABOLISM

AHA: Bariatric surgery slashes heart failure exacerbations
ORLANDO – Bariatric surgery in obese patients with heart failure was associated with a marked decrease in the subsequent rate of ED visits and hospitalizations for heart failure in a large, real-world, case-control study presented at the American Heart Association scientific sessions.
“This decline in the rate of heart failure morbidity was rapid in onset and sustained for at least 2 years after bariatric surgery,” according to Dr. Yuichi J. Shimada of Massachusetts General Hospital, Boston.

In a separate study, however, he found that bariatric surgery for obesity in patients with atrial fibrillation didn’t produce a reduction in ED visits and hospitalizations for the arrhythmia.
The heart failure study was a case-control study of 1,664 consecutive obese patients with heart failure who underwent a single bariatric surgical procedure in California, Florida, or Nebraska. Their median age was 49 years. Women accounted for 70% of the participants. Drawing upon federal Healthcare Cost and Utility Project databases on ED visits and hospital admissions in those three states, Dr. Shimada and coinvestigators compared the group’s rates of ED visits and hospitalizations for heart failure for 2 years before and 2 years after bariatric surgery. Thus, the subjects served as their own controls.
During the reference period, which lasted from months 13-24 presurgery, the group’s combined rate of ED visits and hospital admission for heart failure exacerbation was 14.4%. The rate wasn’t significantly different during the 12 months immediately prior to surgery, at 13.3%.
The rate dropped to 8.7% during the first 12 months after bariatric surgery and remained rock solid at 8.7% during months 13-24 postsurgery. In a logistic regression analysis, this translated to a 44% reduction in the risk of ED visits or hospital admission for heart failure during the first 2 years following bariatric surgery.
These findings are consistent with previous work by other investigators showing a link between obesity and heart failure exacerbations. The new data advance the field by providing the best evidence to date of the effectiveness of substantial weight loss on heart failure morbidity, Dr. Shimada observed.
Nonbariatric surgeries such as hysterectomy or cholecysectomy in the study population had no effect on the rate of heart failure exacerbations.
Dr. Shimada’s atrial fibrillation study was structured in the same way. It included 1,056 patients with atrial fibrillation who underwent bariatric surgery for obesity in the same three states. The rate of ED visits or hospitalization for heart failure was 12.1% in months 13-24 prior to bariatric surgery, 12.6% in presurgical months 1-12, 14.2% in the first 12 months post-bariatric surgery, and 13.4% during postsurgical months 13-24. These rates weren’t statistically different.
Dr. Shimada reported having no financial conflicts of interest regarding the two studies.
ORLANDO – Bariatric surgery in obese patients with heart failure was associated with a marked decrease in the subsequent rate of ED visits and hospitalizations for heart failure in a large, real-world, case-control study presented at the American Heart Association scientific sessions.
“This decline in the rate of heart failure morbidity was rapid in onset and sustained for at least 2 years after bariatric surgery,” according to Dr. Yuichi J. Shimada of Massachusetts General Hospital, Boston.
In a separate study, however, he found that bariatric surgery for obesity in patients with atrial fibrillation didn’t produce a reduction in ED visits and hospitalizations for the arrhythmia.
The heart failure study was a case-control study of 1,664 consecutive obese patients with heart failure who underwent a single bariatric surgical procedure in California, Florida, or Nebraska. Their median age was 49 years. Women accounted for 70% of the participants. Drawing upon federal Healthcare Cost and Utility Project databases on ED visits and hospital admissions in those three states, Dr. Shimada and coinvestigators compared the group’s rates of ED visits and hospitalizations for heart failure for 2 years before and 2 years after bariatric surgery. Thus, the subjects served as their own controls.
During the reference period, which lasted from months 13-24 presurgery, the group’s combined rate of ED visits and hospital admission for heart failure exacerbation was 14.4%. The rate wasn’t significantly different during the 12 months immediately prior to surgery, at 13.3%.
The rate dropped to 8.7% during the first 12 months after bariatric surgery and remained rock solid at 8.7% during months 13-24 postsurgery. In a logistic regression analysis, this translated to a 44% reduction in the risk of ED visits or hospital admission for heart failure during the first 2 years following bariatric surgery.
These findings are consistent with previous work by other investigators showing a link between obesity and heart failure exacerbations. The new data advance the field by providing the best evidence to date of the effectiveness of substantial weight loss on heart failure morbidity, Dr. Shimada observed.
Nonbariatric surgeries such as hysterectomy or cholecysectomy in the study population had no effect on the rate of heart failure exacerbations.
Dr. Shimada’s atrial fibrillation study was structured in the same way. It included 1,056 patients with atrial fibrillation who underwent bariatric surgery for obesity in the same three states. The rate of ED visits or hospitalization for heart failure was 12.1% in months 13-24 prior to bariatric surgery, 12.6% in presurgical months 1-12, 14.2% in the first 12 months post-bariatric surgery, and 13.4% during postsurgical months 13-24. These rates weren’t statistically different.
Dr. Shimada reported having no financial conflicts of interest regarding the two studies.
AT THE AHA SCIENTIFIC SESSIONS
Key clinical point: Bariatric surgery in obese patients with heart failure results in a dramatic reduction in ED visits and hospital admission for heart failure.
Major finding: The combined rate of ED visits and hospital admissions for heart failure dropped by 44% during the 2 years after a large group of patients with heart failure underwent bariatric surgery for obesity.
Data source: This case-control study compared the rates of ED visits and hospital admissions for worsening heart failure in 1,664 patients with heart failure during the 2 years before and 2 years after they underwent bariatric surgery for obesity.
Disclosures: The presenter reported having no financial conflicts of interest regarding the study, which utilized publicly available patient data.

San Diego Hospitalist Weijen Chang, MD, SFHM, Offers Suggestions on Things to Do at HM16
Weijen Chang, MD, SFHM, associate clinical professor at the University of California at San Diego, has a concern: If people attending HM16 don’t get out and about, he worries, they might leave with the impression that his town is sort of, well, normal.
“San Diego is a very laid-back place in general,” says Dr. Chang, director of the hospitalist service in the La Jolla location of the UCSD Health System and longtime pediatrics editor for The Hospitalist. “I think tourists end up being in very touristy areas and don’t generally get a sense of that.”
Read more about the new tracks, speakers at HM16.
Like a good doctor, he’s here to offer a cure. Here are Dr. Chang’s tips for seeing the city. Some are fairly standard and, yes, even a little touristy. But some do give you a taste of that true San Diego vibe, if you’re up for it. He hopes you are.
Mission Beach, Pacific Beach
“Mission Beach is kind of funky,” Dr. Chang says. “Pacific Beach is a little less funky, but it kind of gives you that sort of funky San Diego feeling that a lot of people don’t get when they’re in touristy areas.”
If you make it to Pacific Beach, he says, keep an eye out for “Slomo,” the nickname of a neurologist-turned-Rollerblader who constantly skates up and down the promenade and is nationally known.
“He’s kind of like a fixture,” Dr. Chang says. “Literally, he’s there every single day.”
Harbor Cruise
“If you don’t have access to a car, a really fun and easy thing is a harbor cruise,” Dr. Chang says. “It takes you around all the different ships in the harbor.”
The cruise also goes to Coronado, an island just across the San Diego Bay from downtown.
Lunch at Hotel del Coronado
For those willing to hitch a ride via Uber, Lyft, or a regular taxi—you don’t really need a car to see quite a bit in San Diego—this is a good option. “It’s not super-expensive, and you could see the hotel and walk around the beach there,” Dr. Chang says.
Torrey Pines State Natural Reserve, La Jolla Cove
Torrey Pines is north of downtown and is a good choice for a family outing, Dr. Chang suggests.
“It’s a beautiful hike. They have cliffs in that area. It’s a good family thing to do because the whole family can hike along,” he says. “They have a museum there.”
And beautiful Torrey pine trees are unique to that area.
Also, La Jolla Cove is an option. It’s a touristy spot but a “really pretty” one, Dr. Chang adds.
Balboa Park, Gaslamp Quarter, Little Italy
Dr. Chang suggests Panama 66, a restaurant in Balboa Park.
“It’s in a sculpture garden, and there’s usually a live band playing,” he says. “You can buy a beer or glass of wine and have dinner, too. Or you can just get a couple snacks and hang out and listen to music. That’s sort of my speed when it comes to nightlife. And I imagine for most doctors, it’s sort of their speed.”
There’s also the Old Globe theater in the park. Attendees might want to catch a show. “Just walking around Balboa Park at night is kind of fun,” he says.
Hitting the Gaslamp Quarter, a trendy restaurant and shop area near the convention center, is a nice, “easy thing to do,” he says. One spot there worth checking out is a new speakeasy-style place called Prohibition.
“It’s quieter; it’s got nice jazz and is a little more laid-back than perhaps a big loud, bustling bar would be,” he notes.
Little Italy, a long walk or a taxi ride from the conference, is an area “that some people overlook that has a lot of nice restaurants and bars. And it’s a little more laid-back than the Gaslamp,” Dr. Chang says. “The Gaslamp can sometimes be a little bit overwhelming.”
Coronado, Mission Beach
If you want suggestions for seeing a great sunset, he says, Coronado and Mission Beach would be worthwhile, but “anywhere along the westward-facing beach is pretty spectacular.”

Thomas R. Collins is a freelance writer in South Florida.
Weijen Chang, MD, SFHM, associate clinical professor at the University of California at San Diego, has a concern: If people attending HM16 don’t get out and about, he worries, they might leave with the impression that his town is sort of, well, normal.
“San Diego is a very laid-back place in general,” says Dr. Chang, director of the hospitalist service in the La Jolla location of the UCSD Health System and longtime pediatrics editor for The Hospitalist. “I think tourists end up being in very touristy areas and don’t generally get a sense of that.”
Read more about the new tracks, speakers at HM16.
Like a good doctor, he’s here to offer a cure. Here are Dr. Chang’s tips for seeing the city. Some are fairly standard and, yes, even a little touristy. But some do give you a taste of that true San Diego vibe, if you’re up for it. He hopes you are.
Mission Beach, Pacific Beach
“Mission Beach is kind of funky,” Dr. Chang says. “Pacific Beach is a little less funky, but it kind of gives you that sort of funky San Diego feeling that a lot of people don’t get when they’re in touristy areas.”
If you make it to Pacific Beach, he says, keep an eye out for “Slomo,” the nickname of a neurologist-turned-Rollerblader who constantly skates up and down the promenade and is nationally known.
“He’s kind of like a fixture,” Dr. Chang says. “Literally, he’s there every single day.”
Harbor Cruise
“If you don’t have access to a car, a really fun and easy thing is a harbor cruise,” Dr. Chang says. “It takes you around all the different ships in the harbor.”
The cruise also goes to Coronado, an island just across the San Diego Bay from downtown.
Lunch at Hotel del Coronado
For those willing to hitch a ride via Uber, Lyft, or a regular taxi—you don’t really need a car to see quite a bit in San Diego—this is a good option. “It’s not super-expensive, and you could see the hotel and walk around the beach there,” Dr. Chang says.
Torrey Pines State Natural Reserve, La Jolla Cove
Torrey Pines is north of downtown and is a good choice for a family outing, Dr. Chang suggests.
“It’s a beautiful hike. They have cliffs in that area. It’s a good family thing to do because the whole family can hike along,” he says. “They have a museum there.”
And beautiful Torrey pine trees are unique to that area.
Also, La Jolla Cove is an option. It’s a touristy spot but a “really pretty” one, Dr. Chang adds.
Balboa Park, Gaslamp Quarter, Little Italy
Dr. Chang suggests Panama 66, a restaurant in Balboa Park.
“It’s in a sculpture garden, and there’s usually a live band playing,” he says. “You can buy a beer or glass of wine and have dinner, too. Or you can just get a couple snacks and hang out and listen to music. That’s sort of my speed when it comes to nightlife. And I imagine for most doctors, it’s sort of their speed.”
There’s also the Old Globe theater in the park. Attendees might want to catch a show. “Just walking around Balboa Park at night is kind of fun,” he says.
Hitting the Gaslamp Quarter, a trendy restaurant and shop area near the convention center, is a nice, “easy thing to do,” he says. One spot there worth checking out is a new speakeasy-style place called Prohibition.
“It’s quieter; it’s got nice jazz and is a little more laid-back than perhaps a big loud, bustling bar would be,” he notes.
Little Italy, a long walk or a taxi ride from the conference, is an area “that some people overlook that has a lot of nice restaurants and bars. And it’s a little more laid-back than the Gaslamp,” Dr. Chang says. “The Gaslamp can sometimes be a little bit overwhelming.”
Coronado, Mission Beach
If you want suggestions for seeing a great sunset, he says, Coronado and Mission Beach would be worthwhile, but “anywhere along the westward-facing beach is pretty spectacular.”
Thomas R. Collins is a freelance writer in South Florida.
Monitoring drug release with nanoparticles

Image courtesy of PNAS
Researchers say they have devised a system that allows for real-time monitoring of drug release.
The team created a luminescent nanoparticle and attached it to the anticancer drug doxorubicin, which allowed them to visualize the drug’s arrival in cancer cells.
Thus far, the team has only tested this system in vitro, but animal studies are currently underway.
“We really want to see what’s going on when we give chemo drugs, and this work paves the way for the exciting endeavor,” said Mingjun Zhang, PhD, of The Ohio State University in Columbus.
He and his colleagues described their work in Nature Nanotechnology.
The researchers noted that peptide nanoparticles with fluorescence properties are highly sought after because they are biodegradable and considered safe. However, peptides have limited intrinsic optical properties and therefore don’t make effective imaging probes.
In an attempt to overcome the imaging problem without compromising safety, the researchers created tryptophan–phenylalanine dipeptide nanoparticles (DNPs).
“Composed of natural amino acids, the nanoparticle is inherently biocompatible,” Dr Zhang said. “Our biological machines can easily take care of it.”
In addition, the DNPs proved photostable and could maintain their luminescence for extended periods of time.
To test the imaging capabilities of the DNPs, the researchers modified the nanoparticles with MUC1 aptamers so they would recognize the overexpressed MUC1 proteins on A549 human carcinoma epithelial cells.
Experiments showed these DNP/aptamer conjugates could effectively target and light up the cancer cells.
The researchers then tested the DNPs’ ability to monitor drug release by hitching the nanoparticles to doxorubicin. In experiments with A549 cells, the team was able to visualize the doxorubicin inside the cells.
Dr Zhang and his colleagues said the DNPs could be effective with other drugs as well. In fact, the team hopes this method might one day provide patients and their doctors with information on how well and how quickly a medication is working. ![]()
Oral Leukoedema with Mucosal Desquamation Caused by Toothpaste Containing Sodium Lauryl Sulfate
To the Editor:
A 34-year-old woman presented for evaluation of dry mouth and painless peeling of the oral mucosa of 2 months’ duration. She denied any other skin eruptions, dry eyes, vulvar or vaginal pain, or recent hair loss. A recent antinuclear antibodies test was negative. The patient’s medical history was otherwise unremarkable and her current medications included multivitamins only.
Oral examination revealed peeling gray-white tissue on the buccal mucosa and mouth floor (Figure 1). After the tissue was manually removed with a tongue blade, the mucosal base was normal in color and texture. The patient denied bruxism, biting of the mucosa or other oral trauma, or use of tobacco or nonsteroidal anti-inflammatory drugs.
Biopsies from the buccal mucosa were performed to rule out erosive lichen planus and autoimmune blistering disorders. Microscopy revealed parakeratosis and intracellular edema of the mucosa. An intraepithelial cleft at the parakeratotic surface also was present (Figure 2). Minimal inflammation was noted. Fungal staining and direct immunofluorescence were negative.
The gray-white clinical appearance of the oral mucosa resembled leukoedema, but the peeling phenomenon was uncharacteristic. Histologically, leukoedema typically has a parakeratotic and acanthotic epithelium with marked intracellular edema of the spinous layer.1,2 Our patient demonstrated intracellular edema with the additional finding of a superficial intraepithelial cleft. These features were consistent with the observed mucosal sloughing and normal tissue base and led to our diagnosis of leukoedema with mucosal desquamation. This clinical and histologic picture was previously described in another report, but a causative agent could not be identified.2
Because leukoedema can be secondary to chemical or mechanical trauma,3 we hypothesized that the patient’s toothpaste may be the causative agent. After discontinuing use of her regular toothpaste and keeping the rest of her oral hygiene routine unchanged, the patient’s condition resolved within 2 days. The patient could not identify how long she had been using the toothpaste before symptoms began.
Our case as well as a report in the literature suggest that leukoedema with mucosal desquamation may be the result of contact mucositis to dental hygiene products.3 Reports in the dental literature suggest that a possible cause for oral mucosal desquamation is sensitivity to sodium lauryl sulfate (SLS),1,4 an ingredient used in some toothpastes, including the one used by our patient. The patient has since switched to a non–SLS-containing toothpaste and has remained asymptomatic. She was unwilling to reintroduce an SLS-containing product for further evaluation.
Sodium lauryl sulfate is a strong anionic detergent that is commonly used as a foaming agent in dentifrices.4 In products with higher concentrations of SLS, the incidence of oral epithelial desquamation increases. Triclosan has been shown to protect against this irritant phenomenon.5 Interestingly, the SLS-containing toothpaste used by our patient did not contain triclosan.
Although leukoedema and mucosal desquamation induced by oral care products are well-described in the dental literature, it is important for dermatologists to be aware of this phenomenon, as the differential diagnosis includes autoimmune blistering disorders and erosive lichen planus, for which dermatology referral may be requested. Further studies of SLS and other toothpaste ingredients are needed to establish if sloughing of the oral mucosa is primarily caused by SLS or another ingredient.
- Shafer WG, Hine MK, Levy BM. A Textbook of Oral Pathology. Philadelphia, PA: WB Saunders; 1983.
- Zegarelli DJ, Silvers DN. Shedding oral mucosa. Cutis. 1994;54:323-326.
- Archard HO, Carlson KP, Stanley HR. Leukoedema of the human oral mucosa. Oral Surg Oral Med Oral Pathol. 1971;25:717-728.
- Herlofson BB, Barkvoll P. Desquamative effect of sodium lauryl sulfate on oral mucosa. a preliminary study. Acta Odontol Scand. 1993;51:39-43.
- Skaare A, Eide G, Herlofson B, et al. The effect of toothpaste containing triclosan on oral mucosal desquamation. a model study. J Clin Periodontology. 1996;23:1100-1103.
To the Editor:
A 34-year-old woman presented for evaluation of dry mouth and painless peeling of the oral mucosa of 2 months’ duration. She denied any other skin eruptions, dry eyes, vulvar or vaginal pain, or recent hair loss. A recent antinuclear antibodies test was negative. The patient’s medical history was otherwise unremarkable and her current medications included multivitamins only.
Oral examination revealed peeling gray-white tissue on the buccal mucosa and mouth floor (Figure 1). After the tissue was manually removed with a tongue blade, the mucosal base was normal in color and texture. The patient denied bruxism, biting of the mucosa or other oral trauma, or use of tobacco or nonsteroidal anti-inflammatory drugs.
Biopsies from the buccal mucosa were performed to rule out erosive lichen planus and autoimmune blistering disorders. Microscopy revealed parakeratosis and intracellular edema of the mucosa. An intraepithelial cleft at the parakeratotic surface also was present (Figure 2). Minimal inflammation was noted. Fungal staining and direct immunofluorescence were negative.
The gray-white clinical appearance of the oral mucosa resembled leukoedema, but the peeling phenomenon was uncharacteristic. Histologically, leukoedema typically has a parakeratotic and acanthotic epithelium with marked intracellular edema of the spinous layer.1,2 Our patient demonstrated intracellular edema with the additional finding of a superficial intraepithelial cleft. These features were consistent with the observed mucosal sloughing and normal tissue base and led to our diagnosis of leukoedema with mucosal desquamation. This clinical and histologic picture was previously described in another report, but a causative agent could not be identified.2
Because leukoedema can be secondary to chemical or mechanical trauma,3 we hypothesized that the patient’s toothpaste may be the causative agent. After discontinuing use of her regular toothpaste and keeping the rest of her oral hygiene routine unchanged, the patient’s condition resolved within 2 days. The patient could not identify how long she had been using the toothpaste before symptoms began.
Our case as well as a report in the literature suggest that leukoedema with mucosal desquamation may be the result of contact mucositis to dental hygiene products.3 Reports in the dental literature suggest that a possible cause for oral mucosal desquamation is sensitivity to sodium lauryl sulfate (SLS),1,4 an ingredient used in some toothpastes, including the one used by our patient. The patient has since switched to a non–SLS-containing toothpaste and has remained asymptomatic. She was unwilling to reintroduce an SLS-containing product for further evaluation.
Sodium lauryl sulfate is a strong anionic detergent that is commonly used as a foaming agent in dentifrices.4 In products with higher concentrations of SLS, the incidence of oral epithelial desquamation increases. Triclosan has been shown to protect against this irritant phenomenon.5 Interestingly, the SLS-containing toothpaste used by our patient did not contain triclosan.
Although leukoedema and mucosal desquamation induced by oral care products are well-described in the dental literature, it is important for dermatologists to be aware of this phenomenon, as the differential diagnosis includes autoimmune blistering disorders and erosive lichen planus, for which dermatology referral may be requested. Further studies of SLS and other toothpaste ingredients are needed to establish if sloughing of the oral mucosa is primarily caused by SLS or another ingredient.
- Shafer WG, Hine MK, Levy BM. A Textbook of Oral Pathology. Philadelphia, PA: WB Saunders; 1983.
- Zegarelli DJ, Silvers DN. Shedding oral mucosa. Cutis. 1994;54:323-326.
- Archard HO, Carlson KP, Stanley HR. Leukoedema of the human oral mucosa. Oral Surg Oral Med Oral Pathol. 1971;25:717-728.
- Herlofson BB, Barkvoll P. Desquamative effect of sodium lauryl sulfate on oral mucosa. a preliminary study. Acta Odontol Scand. 1993;51:39-43.
- Skaare A, Eide G, Herlofson B, et al. The effect of toothpaste containing triclosan on oral mucosal desquamation. a model study. J Clin Periodontology. 1996;23:1100-1103.
ADHD, Part 2: How important is a teacher’s assessment?
Dr. David Pickar and Dr. Lillian M. Beard address the importance of flagging ADHD in the classroom, addressing family resistance to treatment, and situations that might call for the involvement of other mental health colleagues.
“I find a lot of resistance [to the ADHD diagnosis], particularly among African American families,” says Dr. Beard, physician director, Children’s Pediatricians and Associates, Silver Spring, Md.
“An untreated ADHD kid is difficult for the teacher, but it is toughest on the kid,” says Dr. Pickar, adjunct professor of psychiatry at Johns Hopkins University, Baltimore. “Families may not hear it all, but a doctor pays a lot of attention to what the teacher is saying about that child in the classroom.”
The video associated with this article is no longer available on this site. Please view all of our videos on the MDedge YouTube channel

ADHD, Part 1: Is prevalence overstated in children?
Primary care physicians are on the front lines for diagnosing and prescribing to treat attention-deficit/hyperactivity disorder in children. In this video, Dr. David Pickar and Dr. Lillian M. Beard discuss what primary care physicians should know to feel confident when diagnosing and treating ADHD.
“[The first time] you see a patient with ADHD respond to stimulants, you see it is lifesaving … [the result] takes your breath away,” Dr. Pickar says.
The video associated with this article is no longer available on this site. Please view all of our videos on the MDedge YouTube channel
Primary care physicians are on the front lines for diagnosing and prescribing to treat attention-deficit/hyperactivity disorder in children. In this video, Dr. David Pickar and Dr. Lillian M. Beard discuss what primary care physicians should know to feel confident when diagnosing and treating ADHD.
“[The first time] you see a patient with ADHD respond to stimulants, you see it is lifesaving … [the result] takes your breath away,” Dr. Pickar says.