User login
Team identifies new mechanism of megakaryocyte differentiation

in the bone marrow
Investigators have discovered a new mechanism of megakaryocyte differentiation, according to a paper published in eLife.
They found that overexpression of the methyltransferase enzyme PRMT1 in acute megakaryocytic leukemia blocks megakaryocyte differentiation by downregulating levels of the RNA-binding protein RBM15.
The team therefore believes that targeting PRMT1 could restore megakaryocyte differentiation in this malignancy.
They also think their findings could lead to new approaches for researching and treating other hematologic malignancies and solid tumors.
Xinyang Zhao, PhD, of the University of Alabama at Birmingham, and his colleagues began this study looking at PRMT1, which attaches a methyl group onto specific arginine amino acid residues of target proteins.
The investigators screened for proteins that were tagged with methyl groups by PRMT1 and selected one of them—RBM15—for further study. RBM15 was of interest because a mutant fusion of RBM15 and MKL1 proteins is associated with acute megakaryoblastic leukemia.
The team discovered that when a cell’s PRMT1 levels are high, a greater proportion of RBM15 is tagged with methyl groups on certain arginine residues. This tagging causes a ligase called CNOT4 to mark RBM15 with another tag, ubiquitin, which marks the protein for transport to the cell’s garbage removal machinery.
The methyl-tagged RBM15 proteins rapidly disappear, even though the amount of RBM15 messenger RNA does not change. Thus, the expression levels of PRMT1 inversely affect the amount of RBM15.
When the concentration of RBM15 is low, megakaryocytic progenitor cells cannot move forward to differentiation. But when the concentration of RBM15 is high enough, the progenitor cells differentiate into mature megakaryocytes.
The investigators also found that RBM15 binds to intron regions of the pre-messenger RNA for genes known to be important in megakaryocyte differentiation, including 3 transcription factors—RUNX1, GATA1, and TAL1—that are important for normal and abnormal hematopoiesis.
And RBM15 appears to recruit the splicing factor SF3B1 to correctly splice exons. When RBM15 is low, one or more exons are not correctly spliced.
The team said this is a new mechanism for cell differentiation, initiated by methylation of RNA-binding proteins.
“The regulation of alternative splicing by RBM15 through SF3B1 is an exciting and novel pathway that clearly participates in the decision of a megakaryocyte to grow or differentiate,” said John Crispino, PhD, of the Northwestern University Feinberg School of Medicine in Chicago, Illinois, who was not involved in this study.
“These findings suggest that modulation of RBM15 activity by suppressing PRMT1 activity may change the splicing pattern of megakaryocytic tumor cells and facilitate their differentiation.”
The investigators also believe RBM15 may have broader functions in cells. They found that RBM15 binds directly to the pre-messenger RNA of 1257 genes. Among them are genes involved in metabolic regulation.
In agreement with this finding, the team discovered that overexpression of PRMT1 or reduced expression of RBM15 enhances the creation of more mitochondria.
The investigators have further identified metabolic pathways regulated by PRMT1 in leukemia cells. They said these data, in a manuscript under preparation, will further link tumorigenesis to metabolic pathways.
The team also noted that SF3B1 contains mutations in more than 70% of myelodysplastic syndrome patients and 20% of chronic lymphocytic leukemia patients, and mutated SF3B1 appears in other hematologic malignancies as well.
So the investigators believe that understanding the PRMT1-RBM15 axis can shed new light on SF3B1-mutated hematologic malignancies and may lead to targeting PRMT1 as a novel therapy for myelodysplastic syndromes. The team is already testing PRMT1 inhibitors. ![]()
Impact of Pneumonia Guidelines
Overutilization of resources is a significant, yet underappreciated, problem in medicine. Many interventions target underutilization (eg, immunizations) or misuse (eg, antibiotic prescribing for viral pharyngitis), yet overutilization remains as a significant contributor to healthcare waste.[1] In an effort to reduce waste, the Choosing Wisely campaign created a work group to highlight areas of overutilization, specifically noting both diagnostic tests and therapies for common pediatric conditions with no proven benefit and possible harm to the patient.[2] Respiratory illnesses have been a target of many quality‐improvement efforts, and pneumonia represents a common diagnosis in pediatrics.[3] The use of diagnostic testing for pneumonia is an area where care can be optimized and aligned with evidence.
Laboratory testing and diagnostic imaging are routinely used for the management of children with community‐acquired pneumonia (CAP). Several studies have documented substantial variability in the use of these resources for pneumonia management, with higher resource use associated with a higher chance of hospitalization after emergency department (ED) evaluation and a longer length of stay among those requiring hospitalization.[4, 5] This variation in diagnostic resource utilization has been attributed, at least in part, to a lack of consensus on the management of pneumonia. There is wide variability in diagnostic testing, and due to potential consequences for patients presenting with pneumonia, efforts to standardize care offer an opportunity to improve healthcare value.
In August 2011, the first national, evidence‐based consensus guidelines for the management of childhood CAP were published jointly by the Pediatric Infectious Diseases Society (PIDS) and the Infectious Diseases Society of America (IDSA).[6] A primary focus of these guidelines was the recommendation for the use of narrow spectrum antibiotics for the management of uncomplicated pneumonia. Previous studies have assessed the impact of the publication of the PIDS/IDSA guidelines on empiric antibiotic selection for the management of pneumonia.[7, 8] In addition, the guidelines provided recommendations regarding diagnostic test utilization, in particular discouraging blood tests (eg, complete blood counts) and radiologic studies for nontoxic, fully immunized children treated as outpatients, as well as repeat testing for children hospitalized with CAP who are improving.
Although single centers have demonstrated changes in utilization patterns based on clinical practice guidelines,[9, 10, 11, 12] whether these guidelines have impacted diagnostic test utilization among US children with CAP in a larger scale remains unknown. Therefore, we sought to determine the impact of the PIDS/IDSA guidelines on the use of diagnostic testing among children with CAP using a national sample of US children's hospitals. Because the guidelines discourage repeat diagnostic testing in patients who are improving, we also evaluated the association between repeat diagnostic studies and severity of illness.
METHODS
This retrospective cohort study used data from the Pediatric Health Information System (PHIS) (Children's Hospital Association, Overland Park, KS). The PHIS database contains deidentified administrative data, detailing demographic, diagnostic, procedure, and billing data from 47 freestanding, tertiary care children's hospitals. This database accounts for approximately 20% of all annual pediatric hospitalizations in the United States. Data quality is ensured through a joint effort between the Children's Hospital Association and participating hospitals.
Patient Population
Data from 32 (of the 47) hospitals included in PHIS with complete inpatient and ED data were used to evaluate hospital‐level resource utilization for children 1 to 18 years of age discharged January 1, 2008 to June 30, 2014 with a diagnosis of pneumonia (International Classification of Diseases, 9th Revision [ICD‐9] codes 480.x‐486.x, 487.0).[13] Our goal was to identify previously healthy children with uncomplicated pneumonia, so we excluded patients with complex chronic conditions,[14] billing charges for intensive care management and/or pleural drainage procedure (IDC‐9 codes 510.0, 510.9, 511.0, 511.1, 511.8, 511.9, 513.x) on day of admission or the next day, or prior pneumonia admission in the last 30 days. We studied 2 mutually exclusive populations: children with pneumonia treated in the ED (ie, patients who were evaluated in the ED and discharged to home), and children hospitalized with pneumonia, including those admitted through the ED.
Guideline Publication and Study Periods
For an exploratory before and after comparison, patients were grouped into 2 cohorts based on a guideline online publication date of August 1, 2011: preguideline (January 1, 2008 to July 31, 2011) and postguideline (August 1, 2011 to June 30, 2014).
Study Outcomes
The measured outcomes were the monthly proportion of pneumonia patients for whom specific diagnostic tests were performed, as determined from billing data. The diagnostic tests evaluated were complete blood count (CBC), blood culture, C‐reactive protein (CRP), and chest radiograph (CXR). Standardized costs were also calculated from PHIS charges as previously described to standardize the cost of the individual tests and remove interhospital cost variation.[3]
Relationship of Repeat Testing and Severity of Illness
Because higher illness severity and clinical deterioration may warrant repeat testing, we also explored the association of repeat diagnostic testing for inpatients with severity of illness by using the following variables as measures of severity: length of stay (LOS), transfer to intensive care unit (ICU), or pleural drainage procedure after admission (>2 calendar days after admission). Repeat diagnostic testing was stratified by number of tests.
Statistical Analysis
The categorical demographic characteristics of the pre‐ and postguideline populations were summarized using frequencies and percentages, and compared using 2 tests. Continuous demographics were summarized with medians and interquartile ranges (IQRs) and compared with the Wilcoxon rank sum test. Segmented regression, clustered by hospital, was used to assess trends in monthly resource utilization as well as associated standardized costs before and after guidelines publication. To estimate the impact of the guidelines overall, we compared the observed diagnostic resource use at the end of the study period with expected use projected from trends in the preguidelines period (ie, if there were no new guidelines). Individual interrupted time series were also built for each hospital. From these models, we assessed which hospitals had a significant difference between the rate observed at the end of the study and that estimated from their preguideline trajectory. To assess the relationship between the number of positive improvements at a hospital and hospital characteristics, we used Spearman's correlation and Kruskal‐Wallis tests. All analyses were performed with SAS version 9.3 (SAS Institute, Inc., Cary, NC), and P values <0.05 were considered statistically significant. In accordance with the policies of the Cincinnati Children's Hospital Medical Center Institutional Review Board, this research, using a deidentified dataset, was not considered human subjects research.
RESULTS
There were 275,288 hospital admissions meeting study inclusion criteria of 1 to 18 years of age with a diagnosis of pneumonia from 2008 to 2014. Of these, 54,749 met exclusion criteria (1874 had pleural drainage procedure on day 0 or 1, 51,306 had complex chronic conditions, 1569 were hospitalized with pneumonia in the last 30 days). Characteristics of the remaining 220,539 patients in the final sample are shown in Table 1. The median age was 4 years (IQR, 27 years); a majority of the children were male (53%) and had public insurance (58%). There were 128,855 patients in the preguideline period (January 1, 2008 to July 31, 2011) and 91,684 in the post guideline period (August 1, 2011June 30, 2014).
| Overall | Preguideline | Postguideline | P | |
|---|---|---|---|---|
| ||||
| No. of discharges | 220,539 | 128,855 | 91,684 | |
| Type of encounter | ||||
| ED only | 150,215 (68.1) | 88,790 (68.9) | 61,425 (67) | <0.001 |
| Inpatient | 70,324 (31.9) | 40,065 (31.1) | 30,259 (33) | |
| Age | ||||
| 14 years | 129,360 (58.7) | 77,802 (60.4) | 51,558 (56.2) | <0.001 |
| 59 years | 58,609 (26.6) | 32,708 (25.4) | 25,901 (28.3) | |
| 1018 years | 32,570 (14.8) | 18,345 (14.2) | 14,225 (15.5) | |
| Median [IQR] | 4 [27] | 3 [27] | 4 [27] | <0.001 |
| Gender | ||||
| Male | 116,718 (52.9) | 68,319 (53) | 48,399 (52.8) | 00.285 |
| Female | 103,813 (47.1) | 60,532 (47) | 43,281 (47.2) | |
| Race | ||||
| Non‐Hispanic white | 84,423 (38.3) | 47,327 (36.7) | 37,096 (40.5) | <0.001 |
| Non‐Hispanic black | 60,062 (27.2) | 35,870 (27.8) | 24,192 (26.4) | |
| Hispanic | 51,184 (23.2) | 31,167 (24.2) | 20,017 (21.8) | |
| Asian | 6,444 (2.9) | 3,691 (2.9) | 2,753 (3) | |
| Other | 18,426 (8.4) | 10,800 (8.4) | 7,626 (8.3) | |
| Payer | ||||
| Government | 128,047 (58.1) | 70,742 (54.9) | 57,305 (62.5) | <0.001 |
| Private | 73,338 (33.3) | 44,410 (34.5) | 28,928 (31.6) | |
| Other | 19,154 (8.7) | 13,703 (10.6) | 5,451 (5.9) | |
| Disposition | ||||
| HHS | 684 (0.3) | 411 (0.3) | 273 (0.3) | <0.001 |
| Home | 209,710 (95.1) | 123,236 (95.6) | 86,474 (94.3) | |
| Other | 9,749 (4.4) | 4,962 (3.9) | 4,787 (5.2) | |
| SNF | 396 (0.2) | 246 (0.2) | 150 (0.2) | |
| Season | ||||
| Spring | 60,171 (27.3) | 36,709 (28.5) | 23,462 (25.6) | <0.001 |
| Summer | 29,891 (13.6) | 17,748 (13.8) | 12,143 (13.2) | |
| Fall | 52,161 (23.7) | 28,332 (22) | 23,829 (26) | |
| Winter | 78,316 (35.5) | 46,066 (35.8) | 32,250 (35.2) | |
| LOS | ||||
| 13 days | 204,812 (92.9) | 119,497 (92.7) | 85,315 (93.1) | <0.001 |
| 46 days | 10,454 (4.7) | 6,148 (4.8) | 4,306 (4.7) | |
| 7+ days | 5,273 (2.4) | 3,210 (2.5) | 2,063 (2.3) | |
| Median [IQR] | 1 [11] | 1 [11] | 1 [11] | 0.144 |
| Admitted patients, median [IQR] | 2 [13] | 2 [13] | 2 [13] | <0.001 |
Discharged From the ED
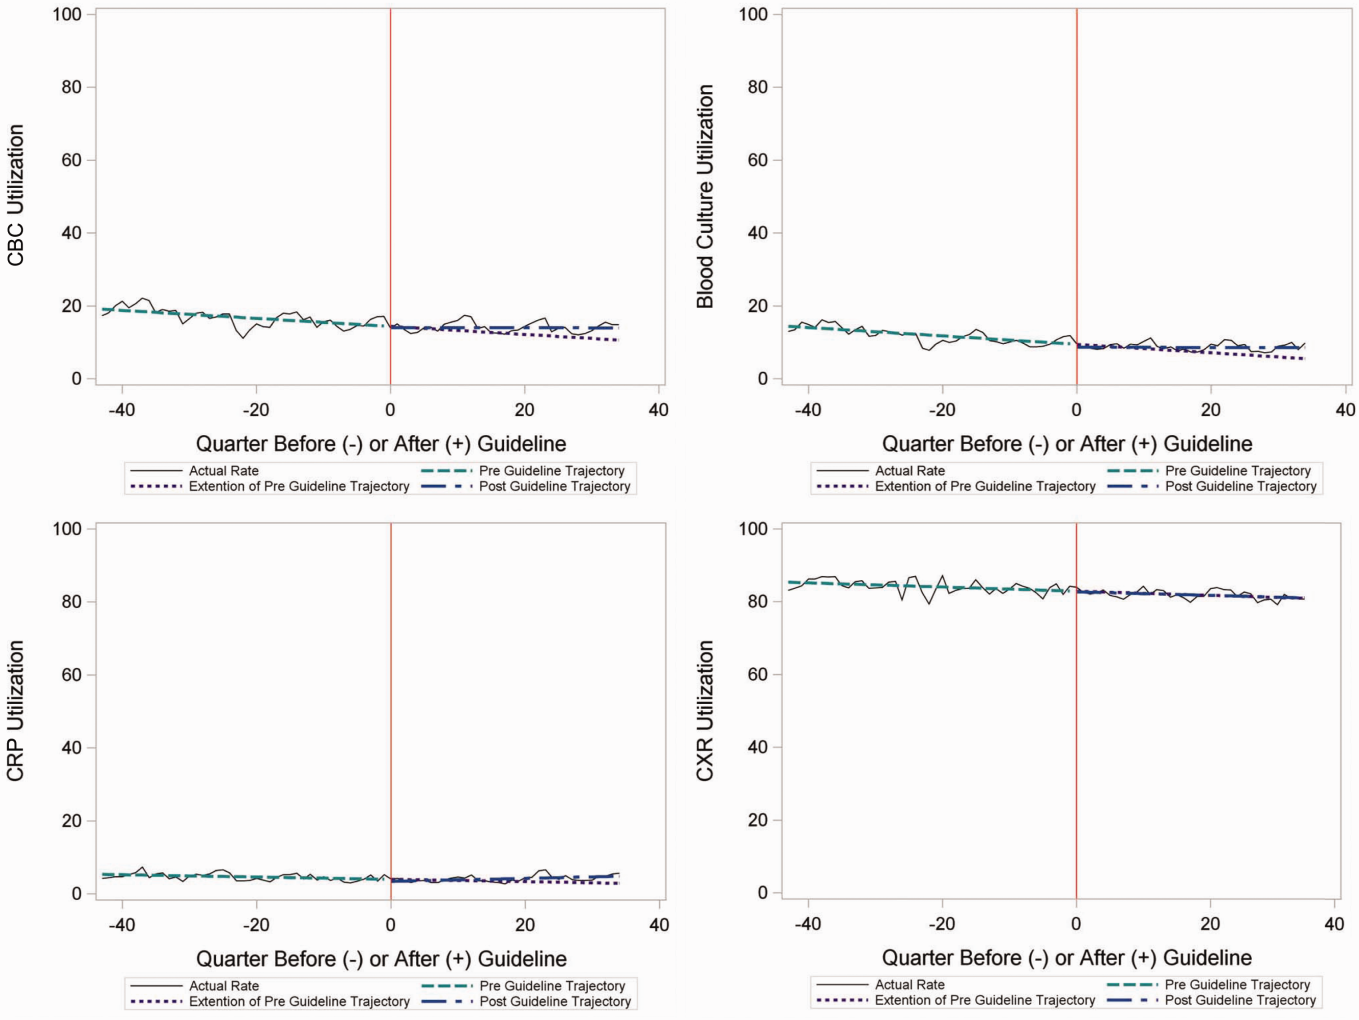
Throughout the study, utilization of CBC, blood cultures, and CRP was <20%, whereas CXR use was >75%. In segmented regression analysis, CRP utilization was relatively stable before the guidelines publication. However, by the end of the study period, the projected estimate of CRP utilization without guidelines (expected) was 2.9% compared with 4.8% with the guidelines (observed) (P < 0.05) (Figure 1). A similar pattern of higher rates of diagnostic utilization after the guidelines compared with projected estimates without the guidelines was also seen in the ED utilization of CBC, blood cultures, and CXR (Figure 1); however, these trends did not achieve statistical significance. Table 2 provides specific values. Using a standard cost of $19.52 for CRP testing, annual costs across all hospitals increased $11,783 for ED evaluation of CAP.
Baseline (%) | Preguideline Trend | Level Change at Guideline | Change in Trend After Guideline | Estimates at End of Study* | |||
|---|---|---|---|---|---|---|---|
Without Guideline (%) | With Guideline (%) | P | |||||
| |||||||
| ED‐only encounters | |||||||
| Blood culture | 14.6 | 0.1 | 0.8 | 0.1 | 5.5 | 8.6 | NS |
| CBC | 19.2 | 0.1 | 0.4 | 0.1 | 10.7 | 14.0 | NS |
| CRP | 5.4 | 0.0 | 0.6 | 0.1 | 2.9 | 4.8 | <0.05 |
| Chest x‐ray | 85.4 | 0.1 | 0.1 | 0.0 | 80.9 | 81.1 | NS |
| Inpatient encounters | |||||||
| Blood culture | 50.6 | 0.0 | 1.7 | 0.2 | 49.2 | 41.4 | <0.05 |
| Repeat blood culture | 6.5 | 0.0 | 1.0 | 0.1 | 8.9 | 5.8 | NS |
| CBC | 65.2 | 0.0 | 3.1 | 0.0 | 65.0 | 62.2 | NS |
| Repeat CBC | 23.4 | 0.0 | 4.2 | 0.0 | 20.8 | 16.0 | NS |
| CRP | 25.7 | 0.0 | 1.1 | 0.0 | 23.8 | 23.5 | NS |
| Repeat CRP | 12.5 | 0.1 | 2.2 | 0.1 | 7.1 | 7.3 | NS |
| Chest x‐ray | 89.4 | 0.1 | 0.7 | 0.0 | 85.4 | 83.9 | NS |
| Repeat chest x‐ray | 25.5 | 0.0 | 2.0 | 0.1 | 24.1 | 17.7 | <0.05 |
Inpatient Encounters
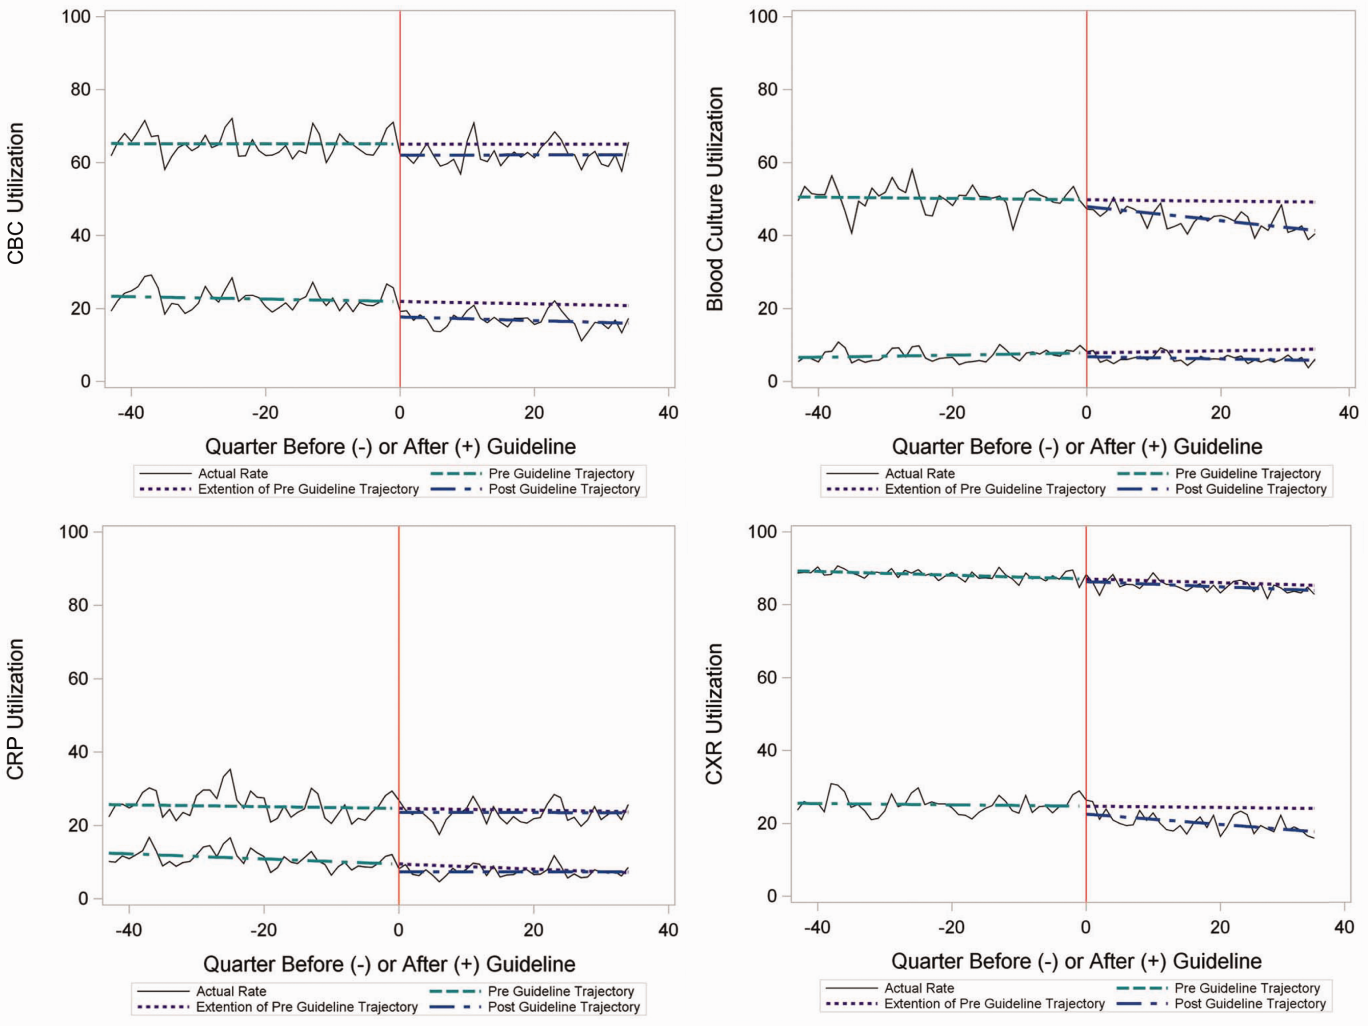
In the segmented regression analysis of children hospitalized with CAP, guideline publication was associated with changes in the monthly use of some diagnostic tests. For example, by the end of the study period, the use of blood culture was 41.4% (observed), whereas the projected estimated use in the absence of the guidelines was 49.2% (expected) (P < 0.05) (Figure 2). Table 2 includes the data for the other tests, CBC, CRP, and CXR, in which similar patterns are noted with lower utilization rates after the guidelines, compared with expected utilization rates without the guidelines; however, these trends did not achieve statistical significance. Evaluating the utilization of repeat testing for inpatients, only repeat CXR achieved statistical significance (P < 0.05), with utilization rates of 17.7% with the guidelines (actual) compared with 24.1% without the guidelines (predicted).
To better understand the use of repeat testing, a comparison of severity outcomesLOS, ICU transfer, and pleural drainage procedureswas performed between patients with no repeat testing (70%) and patients with 1 or more repeat tests (30%). Patients with repeat testing had longer LOS (no repeat testing LOS 1 [IQR, 12]) versus 1 repeat test LOS 3 ([IQR, 24] vs 2+ repeat tests LOS 5 [IQR, 38]), higher rate of ICU transfer (no repeat testing 4.6% vs 1 repeat test 14.6% vs 2+ repeat test 35.6%), and higher rate of pleural drainage (no repeat testing 0% vs 1 repeat test 0.1% vs 2+ repeat test 5.9%] (all P < 0.001).
Using standard costs of $37.57 for blood cultures and $73.28 for CXR, annual costs for children with CAP across all hospitals decreased by $91,512 due to decreased utilization of blood cultures, and by $146,840 due to decreased utilization of CXR.
Hospital‐Level Variation in the Impact of the National Guideline
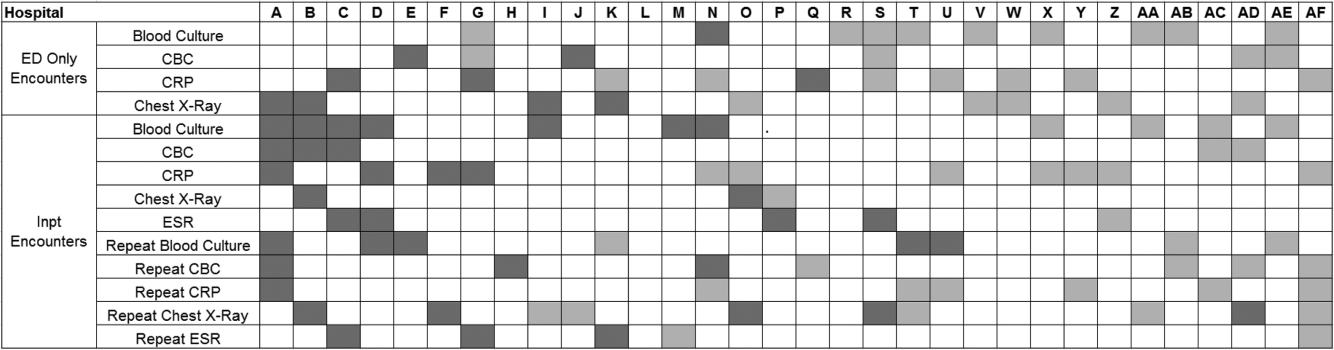
Figure 3 is a visual representation (heat map) of the impact of the guidelines at the hospital level at the end of the study from the individual interrupted time series. Based on this heat map (Figure 3), there was wide variability between hospitals in the impact of the guideline on each test in different settings (ED or inpatient). By diagnostic testing, 7 hospitals significantly decreased utilization of blood cultures for inpatients, and 5 hospitals significantly decreased utilization for repeat blood cultures and repeat CXR. Correlation between the number of positive improvements at a hospital and region (P = 0.974), number of CAP cases (P = 0.731), or percentage of public insurance (P = 0.241) were all nonsignificant.
DISCUSSION
This study complements previous assessments by evaluating the impact of the 2011 IDSA/PIDS consensus guidelines on the management of children with CAP cared for at US children's hospitals. Prior studies have shown increased use of narrow‐spectrum antibiotics for children with CAP after the publication of these guidelines.[7] The current study focused on diagnostic testing for CAP before and after the publication of the 2011 guidelines. In the ED setting, use of some diagnostic tests (blood culture, CBC, CXR, CRP) was declining prior to guideline publication, but appeared to plateau and/or increase after 2011. Among children admitted with CAP, use of diagnostic testing was relatively stable prior to 2011, and use of these tests (blood culture, CBC, CXR, CRP) declined after guideline publication. Overall, changes in diagnostic resource utilization 3 years after publication were modest, with few changes achieving statistical significance. There was a large variability in the impact of guidelines on test use between hospitals.
For outpatients, including those managed in the ED, the PIDS/IDSA guidelines recommend limited laboratory testing in nontoxic, fully immunized patients. The guidelines discourage the use of diagnostic testing among outpatients because of their low yield (eg, blood culture), and because test results may not impact management (eg, CBC).[6] In the years prior to guideline publication, there was already a declining trend in testing rates, including blood cultures, CBC, and CRP, for patients in the ED. After guideline publication, the rate of blood cultures, CBC, and CRP increased, but only the increase in CRP utilization achieved statistical significance. We would not expect utilization for common diagnostic tests (eg, CBC for outpatients with CAP) to be at or close to 0% because of the complexity of clinical decision making regarding admission that factors in aspects of patient history, exam findings, and underlying risk.[15] ED utilization of blood cultures was <10%, CBC <15%, and CRP <5% after guideline publication, which may represent the lowest testing limit that could be achieved.
CXRs obtained in the ED did not decrease over the entire study period. The rates of CXR use (close to 80%) seen in our study are similar to prior ED studies.[5, 16] Management of children with CAP in the ED might be different than outpatient primary care management because (1) unlike primary care providers, ED providers do not have an established relationship with their patients and do not have the opportunity for follow‐up and serial exams, making them less likely to tolerate diagnostic uncertainty; and (2) ED providers may see sicker patients. However, use of CXR in the ED does represent an opportunity for further study to understand if decreased utilization is feasible without adversely impacting clinical outcomes.
The CAP guidelines provide a strong recommendation to obtain blood culture in moderate to severe pneumonia. Despite this, blood culture utilization declined after guideline publication. Less than 10% of children hospitalized with uncomplicated CAP have positive blood cultures, which calls into question the utility of blood cultures for all admitted patients.[17, 18, 19] The recent EPIC (Epidemiology of Pneumonia in the Community) study showed that a majority of children hospitalized with pneumonia do not have growth of bacteria in culture, but there may be a role for blood cultures in patients with a strong suspicion of complicated CAP or in the patient with moderate to severe disease.[20] In addition to blood cultures, the guidelines also recommend CBC and CXR in moderate to severely ill children. This observed decline in testing in CBC and CXR may be related to individual physician assessments of which patients are moderately to severely ill, as the guidelines do not recommend testing for children with less severe disease. Our exclusion of patients requiring intensive care management or pleural drainage on admission might have selected children with a milder course of illness, although still requiring admission.
The guidelines discourage repeat diagnostic testing among children hospitalized with CAP who are improving. In this study, repeat CXR and CBC occurred in approximately 20% of patients, but repeat blood culture and CRP was much lower. As with initial diagnostic testing for inpatients with CAP, the rates of some repeat testing decreased with the guidelines. However, those with repeat testing had longer LOS and were more likely to require ICU transfer or a pleural drainage procedure compared to children without repeat testing. This suggests that repeat testing is used more often in children with a severe presentation or a worsening clinical course, and not done routinely on hospitalized patients.
The financial impact of decreased testing is modest, because the tests themselves are relatively inexpensive. However, the lack of substantial cost savings should not preclude efforts to continue to improve adherence to the guidelines. Not only is increased testing associated with higher hospitalization rates,[5] potentially yielding higher costs and family stress, increased testing may also lead to patient discomfort and possibly increased radiation exposure through chest radiography.
Many of the diagnostic testing recommendations in the CAP guidelines are based on weak evidence, which may contribute to the lack of substantial adoption. Nevertheless, adherence to guideline recommendations requires sustained effort on the part of individual physicians that should be encouraged through institutional support.[21] Continuous education and clinical decision support, as well as reminders in the electronic medical record, would make guideline recommendations more visible and may help overcome the inertia of previous practice.[15] The hospital‐level heat map (Figure 3) included in this study demonstrates that the impact of the guidelines was variable across sites. Although a few sites had decreased diagnostic testing in many areas with no increased testing in any category, there were several sites that had no improvement in any diagnostic testing category. In addition, hospital‐level factors like size, geography, and insurance status were not associated with number of improvements. To better understand drivers of change at individual hospitals, future studies should evaluate specific strategies utilized by the rapid guideline adopters.
This study is subject to several limitations. The use of ICD‐9 codes to identify patients with CAP may not capture all patients with this diagnosis; however, these codes have been previously validated.[13] Additionally, because patients were identified using ICD‐9 coding assigned at the time of discharge, testing performed in the ED setting may not reflect care for a child with known pneumonia, but rather may reflect testing for a child with fever or other signs of infection. PHIS collects data from freestanding children's hospitals, which care for a majority of children with CAP in the US, but our findings may not be generalizable to other hospitals. In addition, we did not examine drivers of trends within individual institutions. We did not have detailed information to examine whether the PHIS hospitals in our study had actively worked to adopt the CAP guidelines. We were also unable to assess physician's familiarity with guidelines or the level of disagreement with the recommendations. Furthermore, the PHIS database does not permit detailed correlation of diagnostic testing with clinical parameters. In contrast to the diagnostic testing evaluated in this study, which is primarily discouraged by the IDSA/PIDS guidelines, respiratory viral testing for children with CAP is recommended but could not be evaluated, as data on such testing are not readily available in PHIS.
CONCLUSION
Publication of the IDSA/PIDS evidence‐based guidelines for the management of CAP was associated with modest, variable changes in use of diagnostic testing. Further adoption of the CAP guidelines should reduce variation in care and decrease unnecessary resource utilization in the management of CAP. Our study demonstrates that efforts to promote decreased resource utilization should target specific situations (eg, repeat testing for inpatients who are improving). Adherence to guidelines may be improved by the adoption of local practices that integrate and improve daily workflow, like order sets and clinical decision support tools.
Disclosure: Nothing to report.
- , . Eliminating waste in US health care. JAMA. 2012;307(14):1513–1516.
- , , , et al. Choosing wisely in pediatric hospital medicine: five opportunities for improved healthcare value. J Hosp Med. 2013;8(9):479–485.
- , , , et al.; Pediatric Research in Inpatient Settings (PRIS) Network. Prioritization of comparative effectiveness research topics in hospital pediatrics. Arch Pediatr Adolesc Med. 2012;166(12):1155–1164.
- , , , et al. Variability in processes of care and outcomes among children hospitalized with community‐acquired pneumonia. Pediatr Infect Dis J. 2012;31(10):1036–1041.
- , , , , . Variation in emergency department diagnostic testing and disposition outcomes in pneumonia. Pediatrics. 2013;132(2):237–244.
- , , , et al.; Pediatric Infectious Diseases Society and the Infectious Diseases Society of America. The management of community‐acquired pneumonia in infants and children older than 3 months of age: clinical practice guidelines by the Pediatric Infectious Diseases Society and the Infectious Diseases Society of America. Clin Infect Dis. 2011;53(7):e25–e76.
- , , , et al., Impact of Infectious Diseases Society of America/Pediatric Infectious Diseases Society guidelines on treatment of community‐acquired pneumonia in hospitalized children. Clin Infect Dis. 2014;58(6):834–838.
- , , , et al. Antibiotic choice for children hospitalized with pneumonia and adherence to national guidelines. Pediatrics. 2015;136(1):44–52.
- , , , et al. Quality improvement methods increase appropriate antibiotic prescribing for childhood pneumonia. Pediatrics. 2013;131(5):e1623–e1631.
- , , , et al. Improvement methodology increases guideline recommended blood cultures in children with pneumonia. Pediatrics. 2015;135(4):e1052–e1059.
- , , , , , . Impact of a guideline on management of children hospitalized with community‐acquired pneumonia. Pediatrics. 2012;129(3):e597–e604.
- , , , . Effectiveness of antimicrobial guidelines for community‐acquired pneumonia in children. Pediatrics. 2012;129(5):e1326–e1333.
- , , , et al. Identifying pediatric community‐acquired pneumonia hospitalizations: accuracy of administrative billing codes. JAMA Pediatr. 2013;167(9):851–858.
- , , , , . Pediatric complex chronic conditions classification system version 2: updated for ICD‐10 and complex medical technology dependence and transplantation. BMC Pediatr. 2014;14:199.
- , . Establishing superior benchmarks of care in clinical practice: a proposal to drive achievable health care value. JAMA Pediatr. 2015;169(4):301–302.
- , , , . Emergency department management of childhood pneumonia in the United States prior to publication of national guidelines. Acad Emerg Med. 2013;20(3):240–246.
- , , , et al. Prevalence of bacteremia in hospitalized pediatric patients with community‐acquired pneumonia. Pediatr Infect Dis J. 2013;32(7):736–740.
- , , , , . The prevalence of bacteremia in pediatric patients with community‐acquired pneumonia: guidelines to reduce the frequency of obtaining blood cultures. Hosp Pediatr. 2013;3(2):92–96.
- . Do all children hospitalized with community‐acquired pneumonia require blood cultures? Hosp Pediatr. 2013;3(2):177–179.
- , , , et al.; CDC EPIC Study Team. Community‐acquired pneumonia requiring hospitalization among U.S. children. N Engl J Med. 2015;372(9):835–845.
- , , , et al. Influence of hospital guidelines on management of children hospitalized with pneumonia. Pediatrics. 2012;130(5):e823–e830.
Overutilization of resources is a significant, yet underappreciated, problem in medicine. Many interventions target underutilization (eg, immunizations) or misuse (eg, antibiotic prescribing for viral pharyngitis), yet overutilization remains as a significant contributor to healthcare waste.[1] In an effort to reduce waste, the Choosing Wisely campaign created a work group to highlight areas of overutilization, specifically noting both diagnostic tests and therapies for common pediatric conditions with no proven benefit and possible harm to the patient.[2] Respiratory illnesses have been a target of many quality‐improvement efforts, and pneumonia represents a common diagnosis in pediatrics.[3] The use of diagnostic testing for pneumonia is an area where care can be optimized and aligned with evidence.
Laboratory testing and diagnostic imaging are routinely used for the management of children with community‐acquired pneumonia (CAP). Several studies have documented substantial variability in the use of these resources for pneumonia management, with higher resource use associated with a higher chance of hospitalization after emergency department (ED) evaluation and a longer length of stay among those requiring hospitalization.[4, 5] This variation in diagnostic resource utilization has been attributed, at least in part, to a lack of consensus on the management of pneumonia. There is wide variability in diagnostic testing, and due to potential consequences for patients presenting with pneumonia, efforts to standardize care offer an opportunity to improve healthcare value.
In August 2011, the first national, evidence‐based consensus guidelines for the management of childhood CAP were published jointly by the Pediatric Infectious Diseases Society (PIDS) and the Infectious Diseases Society of America (IDSA).[6] A primary focus of these guidelines was the recommendation for the use of narrow spectrum antibiotics for the management of uncomplicated pneumonia. Previous studies have assessed the impact of the publication of the PIDS/IDSA guidelines on empiric antibiotic selection for the management of pneumonia.[7, 8] In addition, the guidelines provided recommendations regarding diagnostic test utilization, in particular discouraging blood tests (eg, complete blood counts) and radiologic studies for nontoxic, fully immunized children treated as outpatients, as well as repeat testing for children hospitalized with CAP who are improving.
Although single centers have demonstrated changes in utilization patterns based on clinical practice guidelines,[9, 10, 11, 12] whether these guidelines have impacted diagnostic test utilization among US children with CAP in a larger scale remains unknown. Therefore, we sought to determine the impact of the PIDS/IDSA guidelines on the use of diagnostic testing among children with CAP using a national sample of US children's hospitals. Because the guidelines discourage repeat diagnostic testing in patients who are improving, we also evaluated the association between repeat diagnostic studies and severity of illness.
METHODS
This retrospective cohort study used data from the Pediatric Health Information System (PHIS) (Children's Hospital Association, Overland Park, KS). The PHIS database contains deidentified administrative data, detailing demographic, diagnostic, procedure, and billing data from 47 freestanding, tertiary care children's hospitals. This database accounts for approximately 20% of all annual pediatric hospitalizations in the United States. Data quality is ensured through a joint effort between the Children's Hospital Association and participating hospitals.
Patient Population
Data from 32 (of the 47) hospitals included in PHIS with complete inpatient and ED data were used to evaluate hospital‐level resource utilization for children 1 to 18 years of age discharged January 1, 2008 to June 30, 2014 with a diagnosis of pneumonia (International Classification of Diseases, 9th Revision [ICD‐9] codes 480.x‐486.x, 487.0).[13] Our goal was to identify previously healthy children with uncomplicated pneumonia, so we excluded patients with complex chronic conditions,[14] billing charges for intensive care management and/or pleural drainage procedure (IDC‐9 codes 510.0, 510.9, 511.0, 511.1, 511.8, 511.9, 513.x) on day of admission or the next day, or prior pneumonia admission in the last 30 days. We studied 2 mutually exclusive populations: children with pneumonia treated in the ED (ie, patients who were evaluated in the ED and discharged to home), and children hospitalized with pneumonia, including those admitted through the ED.
Guideline Publication and Study Periods
For an exploratory before and after comparison, patients were grouped into 2 cohorts based on a guideline online publication date of August 1, 2011: preguideline (January 1, 2008 to July 31, 2011) and postguideline (August 1, 2011 to June 30, 2014).
Study Outcomes
The measured outcomes were the monthly proportion of pneumonia patients for whom specific diagnostic tests were performed, as determined from billing data. The diagnostic tests evaluated were complete blood count (CBC), blood culture, C‐reactive protein (CRP), and chest radiograph (CXR). Standardized costs were also calculated from PHIS charges as previously described to standardize the cost of the individual tests and remove interhospital cost variation.[3]
Relationship of Repeat Testing and Severity of Illness
Because higher illness severity and clinical deterioration may warrant repeat testing, we also explored the association of repeat diagnostic testing for inpatients with severity of illness by using the following variables as measures of severity: length of stay (LOS), transfer to intensive care unit (ICU), or pleural drainage procedure after admission (>2 calendar days after admission). Repeat diagnostic testing was stratified by number of tests.
Statistical Analysis
The categorical demographic characteristics of the pre‐ and postguideline populations were summarized using frequencies and percentages, and compared using 2 tests. Continuous demographics were summarized with medians and interquartile ranges (IQRs) and compared with the Wilcoxon rank sum test. Segmented regression, clustered by hospital, was used to assess trends in monthly resource utilization as well as associated standardized costs before and after guidelines publication. To estimate the impact of the guidelines overall, we compared the observed diagnostic resource use at the end of the study period with expected use projected from trends in the preguidelines period (ie, if there were no new guidelines). Individual interrupted time series were also built for each hospital. From these models, we assessed which hospitals had a significant difference between the rate observed at the end of the study and that estimated from their preguideline trajectory. To assess the relationship between the number of positive improvements at a hospital and hospital characteristics, we used Spearman's correlation and Kruskal‐Wallis tests. All analyses were performed with SAS version 9.3 (SAS Institute, Inc., Cary, NC), and P values <0.05 were considered statistically significant. In accordance with the policies of the Cincinnati Children's Hospital Medical Center Institutional Review Board, this research, using a deidentified dataset, was not considered human subjects research.
RESULTS
There were 275,288 hospital admissions meeting study inclusion criteria of 1 to 18 years of age with a diagnosis of pneumonia from 2008 to 2014. Of these, 54,749 met exclusion criteria (1874 had pleural drainage procedure on day 0 or 1, 51,306 had complex chronic conditions, 1569 were hospitalized with pneumonia in the last 30 days). Characteristics of the remaining 220,539 patients in the final sample are shown in Table 1. The median age was 4 years (IQR, 27 years); a majority of the children were male (53%) and had public insurance (58%). There were 128,855 patients in the preguideline period (January 1, 2008 to July 31, 2011) and 91,684 in the post guideline period (August 1, 2011June 30, 2014).
| Overall | Preguideline | Postguideline | P | |
|---|---|---|---|---|
| ||||
| No. of discharges | 220,539 | 128,855 | 91,684 | |
| Type of encounter | ||||
| ED only | 150,215 (68.1) | 88,790 (68.9) | 61,425 (67) | <0.001 |
| Inpatient | 70,324 (31.9) | 40,065 (31.1) | 30,259 (33) | |
| Age | ||||
| 14 years | 129,360 (58.7) | 77,802 (60.4) | 51,558 (56.2) | <0.001 |
| 59 years | 58,609 (26.6) | 32,708 (25.4) | 25,901 (28.3) | |
| 1018 years | 32,570 (14.8) | 18,345 (14.2) | 14,225 (15.5) | |
| Median [IQR] | 4 [27] | 3 [27] | 4 [27] | <0.001 |
| Gender | ||||
| Male | 116,718 (52.9) | 68,319 (53) | 48,399 (52.8) | 00.285 |
| Female | 103,813 (47.1) | 60,532 (47) | 43,281 (47.2) | |
| Race | ||||
| Non‐Hispanic white | 84,423 (38.3) | 47,327 (36.7) | 37,096 (40.5) | <0.001 |
| Non‐Hispanic black | 60,062 (27.2) | 35,870 (27.8) | 24,192 (26.4) | |
| Hispanic | 51,184 (23.2) | 31,167 (24.2) | 20,017 (21.8) | |
| Asian | 6,444 (2.9) | 3,691 (2.9) | 2,753 (3) | |
| Other | 18,426 (8.4) | 10,800 (8.4) | 7,626 (8.3) | |
| Payer | ||||
| Government | 128,047 (58.1) | 70,742 (54.9) | 57,305 (62.5) | <0.001 |
| Private | 73,338 (33.3) | 44,410 (34.5) | 28,928 (31.6) | |
| Other | 19,154 (8.7) | 13,703 (10.6) | 5,451 (5.9) | |
| Disposition | ||||
| HHS | 684 (0.3) | 411 (0.3) | 273 (0.3) | <0.001 |
| Home | 209,710 (95.1) | 123,236 (95.6) | 86,474 (94.3) | |
| Other | 9,749 (4.4) | 4,962 (3.9) | 4,787 (5.2) | |
| SNF | 396 (0.2) | 246 (0.2) | 150 (0.2) | |
| Season | ||||
| Spring | 60,171 (27.3) | 36,709 (28.5) | 23,462 (25.6) | <0.001 |
| Summer | 29,891 (13.6) | 17,748 (13.8) | 12,143 (13.2) | |
| Fall | 52,161 (23.7) | 28,332 (22) | 23,829 (26) | |
| Winter | 78,316 (35.5) | 46,066 (35.8) | 32,250 (35.2) | |
| LOS | ||||
| 13 days | 204,812 (92.9) | 119,497 (92.7) | 85,315 (93.1) | <0.001 |
| 46 days | 10,454 (4.7) | 6,148 (4.8) | 4,306 (4.7) | |
| 7+ days | 5,273 (2.4) | 3,210 (2.5) | 2,063 (2.3) | |
| Median [IQR] | 1 [11] | 1 [11] | 1 [11] | 0.144 |
| Admitted patients, median [IQR] | 2 [13] | 2 [13] | 2 [13] | <0.001 |
Discharged From the ED
Throughout the study, utilization of CBC, blood cultures, and CRP was <20%, whereas CXR use was >75%. In segmented regression analysis, CRP utilization was relatively stable before the guidelines publication. However, by the end of the study period, the projected estimate of CRP utilization without guidelines (expected) was 2.9% compared with 4.8% with the guidelines (observed) (P < 0.05) (Figure 1). A similar pattern of higher rates of diagnostic utilization after the guidelines compared with projected estimates without the guidelines was also seen in the ED utilization of CBC, blood cultures, and CXR (Figure 1); however, these trends did not achieve statistical significance. Table 2 provides specific values. Using a standard cost of $19.52 for CRP testing, annual costs across all hospitals increased $11,783 for ED evaluation of CAP.
Baseline (%) | Preguideline Trend | Level Change at Guideline | Change in Trend After Guideline | Estimates at End of Study* | |||
|---|---|---|---|---|---|---|---|
Without Guideline (%) | With Guideline (%) | P | |||||
| |||||||
| ED‐only encounters | |||||||
| Blood culture | 14.6 | 0.1 | 0.8 | 0.1 | 5.5 | 8.6 | NS |
| CBC | 19.2 | 0.1 | 0.4 | 0.1 | 10.7 | 14.0 | NS |
| CRP | 5.4 | 0.0 | 0.6 | 0.1 | 2.9 | 4.8 | <0.05 |
| Chest x‐ray | 85.4 | 0.1 | 0.1 | 0.0 | 80.9 | 81.1 | NS |
| Inpatient encounters | |||||||
| Blood culture | 50.6 | 0.0 | 1.7 | 0.2 | 49.2 | 41.4 | <0.05 |
| Repeat blood culture | 6.5 | 0.0 | 1.0 | 0.1 | 8.9 | 5.8 | NS |
| CBC | 65.2 | 0.0 | 3.1 | 0.0 | 65.0 | 62.2 | NS |
| Repeat CBC | 23.4 | 0.0 | 4.2 | 0.0 | 20.8 | 16.0 | NS |
| CRP | 25.7 | 0.0 | 1.1 | 0.0 | 23.8 | 23.5 | NS |
| Repeat CRP | 12.5 | 0.1 | 2.2 | 0.1 | 7.1 | 7.3 | NS |
| Chest x‐ray | 89.4 | 0.1 | 0.7 | 0.0 | 85.4 | 83.9 | NS |
| Repeat chest x‐ray | 25.5 | 0.0 | 2.0 | 0.1 | 24.1 | 17.7 | <0.05 |
Inpatient Encounters
In the segmented regression analysis of children hospitalized with CAP, guideline publication was associated with changes in the monthly use of some diagnostic tests. For example, by the end of the study period, the use of blood culture was 41.4% (observed), whereas the projected estimated use in the absence of the guidelines was 49.2% (expected) (P < 0.05) (Figure 2). Table 2 includes the data for the other tests, CBC, CRP, and CXR, in which similar patterns are noted with lower utilization rates after the guidelines, compared with expected utilization rates without the guidelines; however, these trends did not achieve statistical significance. Evaluating the utilization of repeat testing for inpatients, only repeat CXR achieved statistical significance (P < 0.05), with utilization rates of 17.7% with the guidelines (actual) compared with 24.1% without the guidelines (predicted).
To better understand the use of repeat testing, a comparison of severity outcomesLOS, ICU transfer, and pleural drainage procedureswas performed between patients with no repeat testing (70%) and patients with 1 or more repeat tests (30%). Patients with repeat testing had longer LOS (no repeat testing LOS 1 [IQR, 12]) versus 1 repeat test LOS 3 ([IQR, 24] vs 2+ repeat tests LOS 5 [IQR, 38]), higher rate of ICU transfer (no repeat testing 4.6% vs 1 repeat test 14.6% vs 2+ repeat test 35.6%), and higher rate of pleural drainage (no repeat testing 0% vs 1 repeat test 0.1% vs 2+ repeat test 5.9%] (all P < 0.001).
Using standard costs of $37.57 for blood cultures and $73.28 for CXR, annual costs for children with CAP across all hospitals decreased by $91,512 due to decreased utilization of blood cultures, and by $146,840 due to decreased utilization of CXR.
Hospital‐Level Variation in the Impact of the National Guideline
Figure 3 is a visual representation (heat map) of the impact of the guidelines at the hospital level at the end of the study from the individual interrupted time series. Based on this heat map (Figure 3), there was wide variability between hospitals in the impact of the guideline on each test in different settings (ED or inpatient). By diagnostic testing, 7 hospitals significantly decreased utilization of blood cultures for inpatients, and 5 hospitals significantly decreased utilization for repeat blood cultures and repeat CXR. Correlation between the number of positive improvements at a hospital and region (P = 0.974), number of CAP cases (P = 0.731), or percentage of public insurance (P = 0.241) were all nonsignificant.
DISCUSSION
This study complements previous assessments by evaluating the impact of the 2011 IDSA/PIDS consensus guidelines on the management of children with CAP cared for at US children's hospitals. Prior studies have shown increased use of narrow‐spectrum antibiotics for children with CAP after the publication of these guidelines.[7] The current study focused on diagnostic testing for CAP before and after the publication of the 2011 guidelines. In the ED setting, use of some diagnostic tests (blood culture, CBC, CXR, CRP) was declining prior to guideline publication, but appeared to plateau and/or increase after 2011. Among children admitted with CAP, use of diagnostic testing was relatively stable prior to 2011, and use of these tests (blood culture, CBC, CXR, CRP) declined after guideline publication. Overall, changes in diagnostic resource utilization 3 years after publication were modest, with few changes achieving statistical significance. There was a large variability in the impact of guidelines on test use between hospitals.
For outpatients, including those managed in the ED, the PIDS/IDSA guidelines recommend limited laboratory testing in nontoxic, fully immunized patients. The guidelines discourage the use of diagnostic testing among outpatients because of their low yield (eg, blood culture), and because test results may not impact management (eg, CBC).[6] In the years prior to guideline publication, there was already a declining trend in testing rates, including blood cultures, CBC, and CRP, for patients in the ED. After guideline publication, the rate of blood cultures, CBC, and CRP increased, but only the increase in CRP utilization achieved statistical significance. We would not expect utilization for common diagnostic tests (eg, CBC for outpatients with CAP) to be at or close to 0% because of the complexity of clinical decision making regarding admission that factors in aspects of patient history, exam findings, and underlying risk.[15] ED utilization of blood cultures was <10%, CBC <15%, and CRP <5% after guideline publication, which may represent the lowest testing limit that could be achieved.
CXRs obtained in the ED did not decrease over the entire study period. The rates of CXR use (close to 80%) seen in our study are similar to prior ED studies.[5, 16] Management of children with CAP in the ED might be different than outpatient primary care management because (1) unlike primary care providers, ED providers do not have an established relationship with their patients and do not have the opportunity for follow‐up and serial exams, making them less likely to tolerate diagnostic uncertainty; and (2) ED providers may see sicker patients. However, use of CXR in the ED does represent an opportunity for further study to understand if decreased utilization is feasible without adversely impacting clinical outcomes.
The CAP guidelines provide a strong recommendation to obtain blood culture in moderate to severe pneumonia. Despite this, blood culture utilization declined after guideline publication. Less than 10% of children hospitalized with uncomplicated CAP have positive blood cultures, which calls into question the utility of blood cultures for all admitted patients.[17, 18, 19] The recent EPIC (Epidemiology of Pneumonia in the Community) study showed that a majority of children hospitalized with pneumonia do not have growth of bacteria in culture, but there may be a role for blood cultures in patients with a strong suspicion of complicated CAP or in the patient with moderate to severe disease.[20] In addition to blood cultures, the guidelines also recommend CBC and CXR in moderate to severely ill children. This observed decline in testing in CBC and CXR may be related to individual physician assessments of which patients are moderately to severely ill, as the guidelines do not recommend testing for children with less severe disease. Our exclusion of patients requiring intensive care management or pleural drainage on admission might have selected children with a milder course of illness, although still requiring admission.
The guidelines discourage repeat diagnostic testing among children hospitalized with CAP who are improving. In this study, repeat CXR and CBC occurred in approximately 20% of patients, but repeat blood culture and CRP was much lower. As with initial diagnostic testing for inpatients with CAP, the rates of some repeat testing decreased with the guidelines. However, those with repeat testing had longer LOS and were more likely to require ICU transfer or a pleural drainage procedure compared to children without repeat testing. This suggests that repeat testing is used more often in children with a severe presentation or a worsening clinical course, and not done routinely on hospitalized patients.
The financial impact of decreased testing is modest, because the tests themselves are relatively inexpensive. However, the lack of substantial cost savings should not preclude efforts to continue to improve adherence to the guidelines. Not only is increased testing associated with higher hospitalization rates,[5] potentially yielding higher costs and family stress, increased testing may also lead to patient discomfort and possibly increased radiation exposure through chest radiography.
Many of the diagnostic testing recommendations in the CAP guidelines are based on weak evidence, which may contribute to the lack of substantial adoption. Nevertheless, adherence to guideline recommendations requires sustained effort on the part of individual physicians that should be encouraged through institutional support.[21] Continuous education and clinical decision support, as well as reminders in the electronic medical record, would make guideline recommendations more visible and may help overcome the inertia of previous practice.[15] The hospital‐level heat map (Figure 3) included in this study demonstrates that the impact of the guidelines was variable across sites. Although a few sites had decreased diagnostic testing in many areas with no increased testing in any category, there were several sites that had no improvement in any diagnostic testing category. In addition, hospital‐level factors like size, geography, and insurance status were not associated with number of improvements. To better understand drivers of change at individual hospitals, future studies should evaluate specific strategies utilized by the rapid guideline adopters.
This study is subject to several limitations. The use of ICD‐9 codes to identify patients with CAP may not capture all patients with this diagnosis; however, these codes have been previously validated.[13] Additionally, because patients were identified using ICD‐9 coding assigned at the time of discharge, testing performed in the ED setting may not reflect care for a child with known pneumonia, but rather may reflect testing for a child with fever or other signs of infection. PHIS collects data from freestanding children's hospitals, which care for a majority of children with CAP in the US, but our findings may not be generalizable to other hospitals. In addition, we did not examine drivers of trends within individual institutions. We did not have detailed information to examine whether the PHIS hospitals in our study had actively worked to adopt the CAP guidelines. We were also unable to assess physician's familiarity with guidelines or the level of disagreement with the recommendations. Furthermore, the PHIS database does not permit detailed correlation of diagnostic testing with clinical parameters. In contrast to the diagnostic testing evaluated in this study, which is primarily discouraged by the IDSA/PIDS guidelines, respiratory viral testing for children with CAP is recommended but could not be evaluated, as data on such testing are not readily available in PHIS.
CONCLUSION
Publication of the IDSA/PIDS evidence‐based guidelines for the management of CAP was associated with modest, variable changes in use of diagnostic testing. Further adoption of the CAP guidelines should reduce variation in care and decrease unnecessary resource utilization in the management of CAP. Our study demonstrates that efforts to promote decreased resource utilization should target specific situations (eg, repeat testing for inpatients who are improving). Adherence to guidelines may be improved by the adoption of local practices that integrate and improve daily workflow, like order sets and clinical decision support tools.
Disclosure: Nothing to report.
- , . Eliminating waste in US health care. JAMA. 2012;307(14):1513–1516.
- , , , et al. Choosing wisely in pediatric hospital medicine: five opportunities for improved healthcare value. J Hosp Med. 2013;8(9):479–485.
- , , , et al.; Pediatric Research in Inpatient Settings (PRIS) Network. Prioritization of comparative effectiveness research topics in hospital pediatrics. Arch Pediatr Adolesc Med. 2012;166(12):1155–1164.
- , , , et al. Variability in processes of care and outcomes among children hospitalized with community‐acquired pneumonia. Pediatr Infect Dis J. 2012;31(10):1036–1041.
- , , , , . Variation in emergency department diagnostic testing and disposition outcomes in pneumonia. Pediatrics. 2013;132(2):237–244.
- , , , et al.; Pediatric Infectious Diseases Society and the Infectious Diseases Society of America. The management of community‐acquired pneumonia in infants and children older than 3 months of age: clinical practice guidelines by the Pediatric Infectious Diseases Society and the Infectious Diseases Society of America. Clin Infect Dis. 2011;53(7):e25–e76.
- , , , et al., Impact of Infectious Diseases Society of America/Pediatric Infectious Diseases Society guidelines on treatment of community‐acquired pneumonia in hospitalized children. Clin Infect Dis. 2014;58(6):834–838.
- , , , et al. Antibiotic choice for children hospitalized with pneumonia and adherence to national guidelines. Pediatrics. 2015;136(1):44–52.
- , , , et al. Quality improvement methods increase appropriate antibiotic prescribing for childhood pneumonia. Pediatrics. 2013;131(5):e1623–e1631.
- , , , et al. Improvement methodology increases guideline recommended blood cultures in children with pneumonia. Pediatrics. 2015;135(4):e1052–e1059.
- , , , , , . Impact of a guideline on management of children hospitalized with community‐acquired pneumonia. Pediatrics. 2012;129(3):e597–e604.
- , , , . Effectiveness of antimicrobial guidelines for community‐acquired pneumonia in children. Pediatrics. 2012;129(5):e1326–e1333.
- , , , et al. Identifying pediatric community‐acquired pneumonia hospitalizations: accuracy of administrative billing codes. JAMA Pediatr. 2013;167(9):851–858.
- , , , , . Pediatric complex chronic conditions classification system version 2: updated for ICD‐10 and complex medical technology dependence and transplantation. BMC Pediatr. 2014;14:199.
- , . Establishing superior benchmarks of care in clinical practice: a proposal to drive achievable health care value. JAMA Pediatr. 2015;169(4):301–302.
- , , , . Emergency department management of childhood pneumonia in the United States prior to publication of national guidelines. Acad Emerg Med. 2013;20(3):240–246.
- , , , et al. Prevalence of bacteremia in hospitalized pediatric patients with community‐acquired pneumonia. Pediatr Infect Dis J. 2013;32(7):736–740.
- , , , , . The prevalence of bacteremia in pediatric patients with community‐acquired pneumonia: guidelines to reduce the frequency of obtaining blood cultures. Hosp Pediatr. 2013;3(2):92–96.
- . Do all children hospitalized with community‐acquired pneumonia require blood cultures? Hosp Pediatr. 2013;3(2):177–179.
- , , , et al.; CDC EPIC Study Team. Community‐acquired pneumonia requiring hospitalization among U.S. children. N Engl J Med. 2015;372(9):835–845.
- , , , et al. Influence of hospital guidelines on management of children hospitalized with pneumonia. Pediatrics. 2012;130(5):e823–e830.
© 2015 Society of Hospital Medicine

Hyperkalemia Treatment and Hypoglycemia
Hyperkalemia occurs in as many as 10% of all hospitalized patients,[1] leading to potentially fatal arrhythmias or cardiac arrest that results from ionic imbalance within the resting membrane potential of myocardial tissue.[2] Acute instances may be stabilized with insulin to stimulate intracellular uptake of potassium, but this increases the risk of hypoglycemia.[2] Centers for Medicare and Medicaid Services quality measures require hospitals to minimize hypoglycemic events, particularly serious events with blood glucose (BG) <40 mg/dL,[3] due to an association with an increase in mortality in the hospital setting.[4] Previous research at our tertiary care hospital found that 8.7% of patients had suffered a hypoglycemic event following insulin administration pursuant to acute hyperkalemia treatment, and that patients with a lower body weight are at increased risk of hypoglycemia, particularly severe hypoglycemia (BG <40 mg/dL).[5] Increasing the total dose of dextrose provided around the time of insulin administration is suggested to reduce this concern.[5]
Patients at our institution receive 50 g of dextrose in conjunction with intravenous (IV) insulin for hyperkalemia treatment. To further reduce the potential for hypoglycemia, our institution amended the acute hyperkalemia order set to provide prescribers an alternative dosing strategy to the standard 10 U of IV insulin traditionally used for this purpose. Beginning November 10, 2013, our computer prescriber order entry (CPOE) system automatically prepopulated a dose of 0.1 U/kg of body weight for any patients weighing <95 kg (doses rounded to the nearest whole unit) when the acute hyperkalemia order set was utilized. The maximum dose allowed continued to be 10 U. The revised order set also changed nursing orders to require BG monitoring as frequently as every hour following the administration of insulin and dextrose for the treatment of hyperkalemia.
The purpose of this study is to investigate whether weight‐based insulin dosing (0.1 U/kg) for patients weighing <95 kg, rather than a standard 10‐U insulin dose, resulted in fewer hypoglycemic episodes and patients affected. Secondarily, this study sought to determine the impact of weight‐based insulin dosing on potassium‐lowering effects of therapy and to detect any risk factors for development of hypoglycemia among this patient population.
METHODS
This institutional review boardapproved, single‐center, retrospective chart review examined patients for whom the physician order entry set for hyperkalemia therapy was utilized, including patients who weighed less than 95 kg and received regular insulin via weight‐based dosing (0.1 U/kg of body weight up to a maximum of 10 U) during the period November 10, 2013 to May 31, 2014, versus those who received fixed insulin dosing (10 U regardless of body weight) during the period May 1, 2013 to November 9, 2013. During each of these periods, the CPOE system autopopulated the recommended insulin dose, with the possibility for physician manual dose entry. Data collection was limited to the first use of insulin for hyperkalemia treatment per patient in each period.
Patients weighing <95 kg were the focus of this study because they received <10 U of insulin under the weight‐based dosing strategy. Patients were excluded from the study if they had a body weight >95 kg or no weight recorded, were not administered insulin as ordered, received greater than the CPOE‐specified insulin dose, or had no BG readings recorded within 24 hours of insulin administration. The first 66 patients within each group meeting all inclusion and exclusion criteria were randomly selected for analysis. This recruitment target was developed to provide enough patients for a meaningful analysis of hypoglycemia events based on previous reports from our institution.[5]
Hypoglycemia was defined as a recorded BG level <70 mg/dL within 24 hours after insulin administration; severe hypoglycemia was defined as a recorded BG <40 mg/dL within 24 hours. Individual episodes of hypoglycemia and severe hypoglycemia were recorded for each instance of such event separated by at least 1 hour from the time of the first recorded event. In addition, episodes of hypoglycemia or severe hypoglycemia and number of patients affected were assessed at within 6 hours, 6 to 12 hours, and 12 to 24 hours after insulin administration as separate subsets for statistical analysis.
For the purpose of assessing the potassium‐lowering efficacy of weight‐based versus traditional dosing of insulin, maximum serum potassium levels were examined in the 12‐hour interval before the hyperkalemia order set was implemented and compared with minimum potassium levels in the 12 hours after insulin was administered. A comparison of the treatment groups assessed differences between the mean decrease in serum potassium from baseline, the mean minimum potassium achieved, the number of patients achieving minimum potassium below 5.0 mEq/L, and the number of patients who subsequently received repeat treatment for hyperkalemia within 24 hours of treatment with insulin.
Statistical analysis was conducted utilizing 2 and Fisher exact tests for nominal data and Student t test for continuous data to detect statistically significant differences between the groups. Binomial logistic multivariable analysis using a backward stepwise approach was used to determine factors for development of hypoglycemia, analyzed on a per‐patient basis to prevent characteristics from being over‐represented when events occurred multiple times to a single patient. All analyses were completed by using SPSS version 18 (SPSS Inc., Chicago, IL).
RESULTS
In total, 1734 entries were available for the acute hyperkalemia order set with insulin during the 2 periods investigated. Only 464 patients were eligible for manual chart review once weight‐based exclusions were identified by electronic database, with additional exclusion criteria later extracted from patient charts. Patients in both treatment groups were fairly well balanced, with a slightly lower body weight in the 10‐U insulin group recorded (Table 1). Patients in the weight‐based dosing group received between 4 and 9 U of insulin, depending on body weight.
| Characteristics | 10 U Insulin, n = 66 | 0.1 U/kg Insulin, n = 66 | P Value (2‐Sided) |
|---|---|---|---|
| |||
| Weight, kg | 69.9 (14.2) | 74.2 (12.6) | 0.07 |
| Age, y | 55.7 (15.7) | 61.9 (17.6) | 0.36 |
| Male gender | 37 (56.1%) | 41 (62.1%) | 0.60 |
| Caucasian race | 40 (60.6%) | 37 (56.1%) | 0.55 |
| Serum creatinine, mg/dL | 3.16 (4.38) | 3.04 (4.61) | 0.9 |
| Creatinine clearance <30 mL/min | 41 (62.1%) | 41 (62.1%) | 0.6 |
| Dialysis | 20 (30.3%) | 16 (24.2%) | 0.56 |
| Baseline blood glucose, mg/dL | 166.0 (71.7) | 147.3 (48.0) | 0.08 |
| Received other insulin within 24 hours of hyperkalemia treatment | 30 (45.4%) | 25 (37.9%) | 0.48 |
| Received K+ supplement within 24 hours of hyperkalemia treatment | 9 (13.6%) | 11 (16.7%) | 0.81 |
| Baseline serum K+, mmol/L | 6.1 (0.5) | 6.1 (0.7) | 0.76 |
| Baseline serum K+ >6.0 mmol/L | 41 (62.1%) | 33 (50%) | 0.22 |
| No. of additional treatments for hyperkalemia in addition to insulin/dextrose | 1.5 (0.8) | 1.4 (0.9) | 0.49 |
A reduction in the number of hypoglycemic episodes was detected in the weight‐based dosing group of 56% within 24 hours, from 18 to 8 events (P = 0.05) (Table 2). The number of hypoglycemic events in every subset of time intervals was likewise reduced by at least 50% using weight‐based dosing (from 7 to 3 events within 6 hours, from 5 to 2 events in 612 hours, from 6 to 3 events in 1224 hours). The number of patients who experienced hypoglycemia within 24 hours after receiving insulin also was reduced in the weight‐based dosing group by 46% (P = 0.22).
| Outcomes | 10 U Insulin, n = 66 | 0.1 U/kg Insulin, n = 66 | P Value (2‐Sided) |
|---|---|---|---|
| |||
| Hypoglycemia, <70 mg/dL | |||
| No. of patients | 13 (19.7%) | 7 (10.6%) | 0.22 |
| No. of events total | 18 (27.3%) | 8 (12.1%) | 0.05 |
| No. of events 06 hours | 7 (10.6%) | 3 (4.5%) | 0.32 |
| No. of events 612 hours | 5 (7.6%) | 2 (3.0%) | 0.44 |
| No. of events 1224 hours | 6 (9.1%) | 3 (4.5%) | 0.49 |
| Severe hypoglycemia | |||
| No. of patients | 2 (3.0%) | 1 (1.5%) | >0.99 |
| No. of events total | 2 (3%) | 1 (1.5%) | >0.99 |
| Potassium‐lowering effects | |||
| Minimum K+ after therapy, mmol/L (SD) | 4.9 (0.7) | 4.8 (0.7) | 0.84 |
| Minimum serum K+ < 5.0 mmol/L (%) | 37 (56.1%) | 35 (53.0%) | 0.32 |
| Average K+ decrease, mmol/L (SD) | 1.35 (0.97) | 1.34 (0.94) | 0.94 |
| Repeat treatment given (%) | 24 (36.4%) | 24 (36.4%) | >0.99 |
Potassium lowering was comparable across both dosing strategies in every measure assessed (Table 2). Multivariate analysis revealed that baseline BG <140 mg/dL (adjusted odds ratio: 4.3, 95% confidence interval [CI]: 1.4‐13.7, P = 0.01) and female gender (adjusted odds ratio: 3.2, 95% CI: 1.1‐9.1, P = 0.03) were associated with an increased risk of hypoglycemia. Other factors, including administration of insulin beyond that for hyperkalemia treatment and use of additional hypoglycemic agents, were not associated with the development of hypoglycemia, which is consistent with previous reports.[6]
CONCLUSIONS
Our findings indicate that using a weight‐based approach to insulin dosing when treating hyperkalemia may lead to a reduction in hypoglycemia without sacrificing the efficacy of potassium lowering. Females and patients with glucose values <140 mg/dL were at increased risk of hypoglycemia in this cohort. Based on the results of this research, a weight‐based dosing strategy of 0.1 U/kg IV insulin up to a maximum of 10 U should be considered, with further research desirable to validate these results.
This study was strengthened by the inclusion of all patients regardless of baseline glucose, baseline potassium, administration of other insulins, level of renal impairment, or symptomatic display of hypoglycemia or cardiac dysfunction, thus providing a broad representation of patients treated for acute hyperkalemia. This pilot study was limited in its scope by data collection for only 66 randomized patients per group rather than the entire patient population. In addition, the study utilized patient information from a single site, with few ethnicities represented. Validation of this research using a larger sample size should include greater variation in the patients served. Our inclusion of a hypoglycemia definition up to 24 hours after treatment may also be criticized. However, this is similar to previous reports and allows for a liberal time period for follow‐up glucose monitoring to be recorded.[7]
Because of its small sample size and the low event rate, this study was unable to draw conclusions about the ability of weight‐based insulin dosing to affect severe hypoglycemic events (<40 mg/dL). A study of more than 400 patients would be necessary to find statistically significant differences in the risk of severe hypoglycemia. Furthermore, because we did not examine the results from all patients in this cohort, we cannot conclusively determine the impact of treatment. The retrospective nature of this study limited our ability to capture hypoglycemic episodes during periods in which BG levels were not recorded. Additionally, changes to the post‐treatment glucose monitoring protocol may have also affected the incidence of hypoglycemia in 2 potential ways. First, early and unrecorded interventions may have occurred in patients with a trend toward hypoglycemia. Second, the longer time to follow‐up in the nonweight‐based group may have led to additional hypoglycemic episodes being missed. A prospective trial design could provide more comprehensive information about patient response to weight‐based versus traditional dosing of IV insulin for hyperkalemia. Further investigations on reducing adverse effects of insulin when treating hyperkalemia should focus on female patients and those with lower baseline BG values. Additionally, as newer agents to treat hyperkalemia are developed and tested, the approach to management should be revisited.[8, 9, 10]
Disclosures: Garry S. Tobin, MD, lectures or is on the speakers bureau for Eli Lilly, Jansen, Boehringher Ingelheim, and Novo Nordisk, and performs data safety monitoring for Novo Nordisk. The authors report no other potential conflicts of interest.
- , , , . Hyperkalemia in hospitalized patients: causes, adequacy of treatment, and results of an attempt to improve physician compliance with published therapy guidelines. Arch Intern Med. 1998;158:917–924.
- 2010 American Heart Association guidelines for cardiopulmonary resuscitation and emergency cardiovascular care. Part 12.6: cardiac arrest associated with life‐threatening electrolyte disturbances. Circulation. 2010;122:S829–S861.
- Centers for Medicare 29(2):101–107.
- , , , . Incidence of hypoglycemia following insulin‐based acute stabilization of hyperkalemia treatment. J Hosp Med. 2012;7(3):239–242.
- , , . Hypoglycemia in the treatment of hyperkalemia with insulin in patients with end‐stage renal disease. Clin Kidney J. 2014;7(3):248–250.
- , , , . Prediction and prevention of treatment‐related inpatient hypoglycemia. J Diabetes Sci Technol. 2012;6(2):302–309.
- , , , et al. Effect of sodium zirconium cyclosilicate on potassium lowering for 28 days among outpatients with hyperkalemia: the HARMONIZE randomized clinical trial. JAMA. 2014;312(21):2223–2233.
- , , , et al. Zirconium cyclosilicate in hyperkalemia. N Engl J Med. 2015;372:222–231.
- , , , et al. Patiromer in patients with kidney disease and hyperkalemia receiving RAAS inhibitors. N Engl J Med. 2015;372:211–221.
Hyperkalemia occurs in as many as 10% of all hospitalized patients,[1] leading to potentially fatal arrhythmias or cardiac arrest that results from ionic imbalance within the resting membrane potential of myocardial tissue.[2] Acute instances may be stabilized with insulin to stimulate intracellular uptake of potassium, but this increases the risk of hypoglycemia.[2] Centers for Medicare and Medicaid Services quality measures require hospitals to minimize hypoglycemic events, particularly serious events with blood glucose (BG) <40 mg/dL,[3] due to an association with an increase in mortality in the hospital setting.[4] Previous research at our tertiary care hospital found that 8.7% of patients had suffered a hypoglycemic event following insulin administration pursuant to acute hyperkalemia treatment, and that patients with a lower body weight are at increased risk of hypoglycemia, particularly severe hypoglycemia (BG <40 mg/dL).[5] Increasing the total dose of dextrose provided around the time of insulin administration is suggested to reduce this concern.[5]
Patients at our institution receive 50 g of dextrose in conjunction with intravenous (IV) insulin for hyperkalemia treatment. To further reduce the potential for hypoglycemia, our institution amended the acute hyperkalemia order set to provide prescribers an alternative dosing strategy to the standard 10 U of IV insulin traditionally used for this purpose. Beginning November 10, 2013, our computer prescriber order entry (CPOE) system automatically prepopulated a dose of 0.1 U/kg of body weight for any patients weighing <95 kg (doses rounded to the nearest whole unit) when the acute hyperkalemia order set was utilized. The maximum dose allowed continued to be 10 U. The revised order set also changed nursing orders to require BG monitoring as frequently as every hour following the administration of insulin and dextrose for the treatment of hyperkalemia.
The purpose of this study is to investigate whether weight‐based insulin dosing (0.1 U/kg) for patients weighing <95 kg, rather than a standard 10‐U insulin dose, resulted in fewer hypoglycemic episodes and patients affected. Secondarily, this study sought to determine the impact of weight‐based insulin dosing on potassium‐lowering effects of therapy and to detect any risk factors for development of hypoglycemia among this patient population.
METHODS
This institutional review boardapproved, single‐center, retrospective chart review examined patients for whom the physician order entry set for hyperkalemia therapy was utilized, including patients who weighed less than 95 kg and received regular insulin via weight‐based dosing (0.1 U/kg of body weight up to a maximum of 10 U) during the period November 10, 2013 to May 31, 2014, versus those who received fixed insulin dosing (10 U regardless of body weight) during the period May 1, 2013 to November 9, 2013. During each of these periods, the CPOE system autopopulated the recommended insulin dose, with the possibility for physician manual dose entry. Data collection was limited to the first use of insulin for hyperkalemia treatment per patient in each period.
Patients weighing <95 kg were the focus of this study because they received <10 U of insulin under the weight‐based dosing strategy. Patients were excluded from the study if they had a body weight >95 kg or no weight recorded, were not administered insulin as ordered, received greater than the CPOE‐specified insulin dose, or had no BG readings recorded within 24 hours of insulin administration. The first 66 patients within each group meeting all inclusion and exclusion criteria were randomly selected for analysis. This recruitment target was developed to provide enough patients for a meaningful analysis of hypoglycemia events based on previous reports from our institution.[5]
Hypoglycemia was defined as a recorded BG level <70 mg/dL within 24 hours after insulin administration; severe hypoglycemia was defined as a recorded BG <40 mg/dL within 24 hours. Individual episodes of hypoglycemia and severe hypoglycemia were recorded for each instance of such event separated by at least 1 hour from the time of the first recorded event. In addition, episodes of hypoglycemia or severe hypoglycemia and number of patients affected were assessed at within 6 hours, 6 to 12 hours, and 12 to 24 hours after insulin administration as separate subsets for statistical analysis.
For the purpose of assessing the potassium‐lowering efficacy of weight‐based versus traditional dosing of insulin, maximum serum potassium levels were examined in the 12‐hour interval before the hyperkalemia order set was implemented and compared with minimum potassium levels in the 12 hours after insulin was administered. A comparison of the treatment groups assessed differences between the mean decrease in serum potassium from baseline, the mean minimum potassium achieved, the number of patients achieving minimum potassium below 5.0 mEq/L, and the number of patients who subsequently received repeat treatment for hyperkalemia within 24 hours of treatment with insulin.
Statistical analysis was conducted utilizing 2 and Fisher exact tests for nominal data and Student t test for continuous data to detect statistically significant differences between the groups. Binomial logistic multivariable analysis using a backward stepwise approach was used to determine factors for development of hypoglycemia, analyzed on a per‐patient basis to prevent characteristics from being over‐represented when events occurred multiple times to a single patient. All analyses were completed by using SPSS version 18 (SPSS Inc., Chicago, IL).
RESULTS
In total, 1734 entries were available for the acute hyperkalemia order set with insulin during the 2 periods investigated. Only 464 patients were eligible for manual chart review once weight‐based exclusions were identified by electronic database, with additional exclusion criteria later extracted from patient charts. Patients in both treatment groups were fairly well balanced, with a slightly lower body weight in the 10‐U insulin group recorded (Table 1). Patients in the weight‐based dosing group received between 4 and 9 U of insulin, depending on body weight.
| Characteristics | 10 U Insulin, n = 66 | 0.1 U/kg Insulin, n = 66 | P Value (2‐Sided) |
|---|---|---|---|
| |||
| Weight, kg | 69.9 (14.2) | 74.2 (12.6) | 0.07 |
| Age, y | 55.7 (15.7) | 61.9 (17.6) | 0.36 |
| Male gender | 37 (56.1%) | 41 (62.1%) | 0.60 |
| Caucasian race | 40 (60.6%) | 37 (56.1%) | 0.55 |
| Serum creatinine, mg/dL | 3.16 (4.38) | 3.04 (4.61) | 0.9 |
| Creatinine clearance <30 mL/min | 41 (62.1%) | 41 (62.1%) | 0.6 |
| Dialysis | 20 (30.3%) | 16 (24.2%) | 0.56 |
| Baseline blood glucose, mg/dL | 166.0 (71.7) | 147.3 (48.0) | 0.08 |
| Received other insulin within 24 hours of hyperkalemia treatment | 30 (45.4%) | 25 (37.9%) | 0.48 |
| Received K+ supplement within 24 hours of hyperkalemia treatment | 9 (13.6%) | 11 (16.7%) | 0.81 |
| Baseline serum K+, mmol/L | 6.1 (0.5) | 6.1 (0.7) | 0.76 |
| Baseline serum K+ >6.0 mmol/L | 41 (62.1%) | 33 (50%) | 0.22 |
| No. of additional treatments for hyperkalemia in addition to insulin/dextrose | 1.5 (0.8) | 1.4 (0.9) | 0.49 |
A reduction in the number of hypoglycemic episodes was detected in the weight‐based dosing group of 56% within 24 hours, from 18 to 8 events (P = 0.05) (Table 2). The number of hypoglycemic events in every subset of time intervals was likewise reduced by at least 50% using weight‐based dosing (from 7 to 3 events within 6 hours, from 5 to 2 events in 612 hours, from 6 to 3 events in 1224 hours). The number of patients who experienced hypoglycemia within 24 hours after receiving insulin also was reduced in the weight‐based dosing group by 46% (P = 0.22).
| Outcomes | 10 U Insulin, n = 66 | 0.1 U/kg Insulin, n = 66 | P Value (2‐Sided) |
|---|---|---|---|
| |||
| Hypoglycemia, <70 mg/dL | |||
| No. of patients | 13 (19.7%) | 7 (10.6%) | 0.22 |
| No. of events total | 18 (27.3%) | 8 (12.1%) | 0.05 |
| No. of events 06 hours | 7 (10.6%) | 3 (4.5%) | 0.32 |
| No. of events 612 hours | 5 (7.6%) | 2 (3.0%) | 0.44 |
| No. of events 1224 hours | 6 (9.1%) | 3 (4.5%) | 0.49 |
| Severe hypoglycemia | |||
| No. of patients | 2 (3.0%) | 1 (1.5%) | >0.99 |
| No. of events total | 2 (3%) | 1 (1.5%) | >0.99 |
| Potassium‐lowering effects | |||
| Minimum K+ after therapy, mmol/L (SD) | 4.9 (0.7) | 4.8 (0.7) | 0.84 |
| Minimum serum K+ < 5.0 mmol/L (%) | 37 (56.1%) | 35 (53.0%) | 0.32 |
| Average K+ decrease, mmol/L (SD) | 1.35 (0.97) | 1.34 (0.94) | 0.94 |
| Repeat treatment given (%) | 24 (36.4%) | 24 (36.4%) | >0.99 |
Potassium lowering was comparable across both dosing strategies in every measure assessed (Table 2). Multivariate analysis revealed that baseline BG <140 mg/dL (adjusted odds ratio: 4.3, 95% confidence interval [CI]: 1.4‐13.7, P = 0.01) and female gender (adjusted odds ratio: 3.2, 95% CI: 1.1‐9.1, P = 0.03) were associated with an increased risk of hypoglycemia. Other factors, including administration of insulin beyond that for hyperkalemia treatment and use of additional hypoglycemic agents, were not associated with the development of hypoglycemia, which is consistent with previous reports.[6]
CONCLUSIONS
Our findings indicate that using a weight‐based approach to insulin dosing when treating hyperkalemia may lead to a reduction in hypoglycemia without sacrificing the efficacy of potassium lowering. Females and patients with glucose values <140 mg/dL were at increased risk of hypoglycemia in this cohort. Based on the results of this research, a weight‐based dosing strategy of 0.1 U/kg IV insulin up to a maximum of 10 U should be considered, with further research desirable to validate these results.
This study was strengthened by the inclusion of all patients regardless of baseline glucose, baseline potassium, administration of other insulins, level of renal impairment, or symptomatic display of hypoglycemia or cardiac dysfunction, thus providing a broad representation of patients treated for acute hyperkalemia. This pilot study was limited in its scope by data collection for only 66 randomized patients per group rather than the entire patient population. In addition, the study utilized patient information from a single site, with few ethnicities represented. Validation of this research using a larger sample size should include greater variation in the patients served. Our inclusion of a hypoglycemia definition up to 24 hours after treatment may also be criticized. However, this is similar to previous reports and allows for a liberal time period for follow‐up glucose monitoring to be recorded.[7]
Because of its small sample size and the low event rate, this study was unable to draw conclusions about the ability of weight‐based insulin dosing to affect severe hypoglycemic events (<40 mg/dL). A study of more than 400 patients would be necessary to find statistically significant differences in the risk of severe hypoglycemia. Furthermore, because we did not examine the results from all patients in this cohort, we cannot conclusively determine the impact of treatment. The retrospective nature of this study limited our ability to capture hypoglycemic episodes during periods in which BG levels were not recorded. Additionally, changes to the post‐treatment glucose monitoring protocol may have also affected the incidence of hypoglycemia in 2 potential ways. First, early and unrecorded interventions may have occurred in patients with a trend toward hypoglycemia. Second, the longer time to follow‐up in the nonweight‐based group may have led to additional hypoglycemic episodes being missed. A prospective trial design could provide more comprehensive information about patient response to weight‐based versus traditional dosing of IV insulin for hyperkalemia. Further investigations on reducing adverse effects of insulin when treating hyperkalemia should focus on female patients and those with lower baseline BG values. Additionally, as newer agents to treat hyperkalemia are developed and tested, the approach to management should be revisited.[8, 9, 10]
Disclosures: Garry S. Tobin, MD, lectures or is on the speakers bureau for Eli Lilly, Jansen, Boehringher Ingelheim, and Novo Nordisk, and performs data safety monitoring for Novo Nordisk. The authors report no other potential conflicts of interest.
- , , , . Hyperkalemia in hospitalized patients: causes, adequacy of treatment, and results of an attempt to improve physician compliance with published therapy guidelines. Arch Intern Med. 1998;158:917–924.
- 2010 American Heart Association guidelines for cardiopulmonary resuscitation and emergency cardiovascular care. Part 12.6: cardiac arrest associated with life‐threatening electrolyte disturbances. Circulation. 2010;122:S829–S861.
- Centers for Medicare 29(2):101–107.
- , , , . Incidence of hypoglycemia following insulin‐based acute stabilization of hyperkalemia treatment. J Hosp Med. 2012;7(3):239–242.
- , , . Hypoglycemia in the treatment of hyperkalemia with insulin in patients with end‐stage renal disease. Clin Kidney J. 2014;7(3):248–250.
- , , , . Prediction and prevention of treatment‐related inpatient hypoglycemia. J Diabetes Sci Technol. 2012;6(2):302–309.
- , , , et al. Effect of sodium zirconium cyclosilicate on potassium lowering for 28 days among outpatients with hyperkalemia: the HARMONIZE randomized clinical trial. JAMA. 2014;312(21):2223–2233.
- , , , et al. Zirconium cyclosilicate in hyperkalemia. N Engl J Med. 2015;372:222–231.
- , , , et al. Patiromer in patients with kidney disease and hyperkalemia receiving RAAS inhibitors. N Engl J Med. 2015;372:211–221.
Care Team Identification
Patient‐centered communication is a strategy that is used to promote shared understanding of the plan of care among providers and patients.[1, 2, 3] Caring for hospitalized patients is a collaborative effort that requires seamless patient‐centered communication among a rapidly changing care team to safely progress a patient from admission through discharge. Yet, hospitals continue to struggle with improving the complex and increasingly electronic conversation patterns among care team members and patients to achieve effective patient‐centered communication.[4, 5] When members of the care team operate in this environment, patients often receive conflicting information regarding their plan of care, medications, and test results. Ineffective communication can lead to a suboptimal patient experience, additional costs, medical errors, and preventable adverse events.[6, 7, 8, 9, 10]
A critical first step to improving patient‐centered communication is identifying the care team.[11, 12] Accurate and reliable identification of all care team members is a pressing information need; it is fundamental to efficiently conveying information about the plan of care to those who know the patient the best, must make timely decisions, or will assume care once the patient leaves the hospital.[13] Furthermore, it has implications for engaging patients more meaningfully in their care.[14, 15, 16, 17] Ideally, the process of identifying an individual caring for the patient in a specific role is quickly and reliably determined from the electronic health record, the single source of truth where any provider can quickly identify other team members. This source of truth can be updated manually when individual members assign and remove themselves from the care team, or automatically when accessing the patient's record, writing a note, placing an order, or adding a patient to a coverage list. When providers correctly identify other team members in this way, hospital paging directories and secure messaging tools that link to the electronic health record become more effective at supporting care team communication.[18]
In general, the process of identifying care teams is difficult,[19] and maintaining role assignments in the electronic health record is equally challenging. Vawdrey et al. previously reported that care team lists are inaccurate and cannot be used to reliably identify other members at any given moment.[18] The inability to identify team members often leads to incorrectly routed pages, e‐mail messages, and phone calls.[20] Consequently, the potential to reliably manage the care team and improve electronic communication remains untapped, rendering team collaboration and care coordination less effective.[18, 21, 22]
In recent years, the trend toward restructuring inpatient teamsgeographical localization, structured communication interventions, teamwork training, and interdisciplinary roundswould seem to diminish the need for electronic care team identification, as those efforts have already made a positive impact with regard to interprofessional communication and collaboration, team satisfaction, and adverse events.[23, 24, 25, 26] Nonetheless, interdisciplinary teamwork, though critically important for patient‐centered communication, does not completely obviate the need for accurate and reliable care team identification.[26] Although care teams are statically located on units, the plan of care is dynamic; it evolves when the patient's status changes, when new information becomes available, and when key longitudinal providers (eg, primary care physician, subspecialty consultant) make recommendations. Thus, information conveyed as a team on rounds quickly becomes out of date, requiring additional forms of communication. Furthermore, due to frequent ad hoc coverage among team members, the identity of providers covering the patient at any given moment is often not clear.[27] This is particularly problematic for nonunit‐based providers who try to communicate with unit‐based care team members. These providers, in particular, have valuable knowledge and insight that can aid the primary team in decision making.[28, 29] However, they typically do not participate in rounds, often waste time identifying responsible providers,[20] and may communicate their recommendations directly with the patient without discussing with the primary team. These factors in part explain why geographic localization has shown limited improvement in shared understanding of the plan of care.[23]
From the perspective of patients and caregivers, identification of the providers entering and leaving their room is also challenging; only 11% to 51% of patients identify their providers correctly.[30] This adds to confusion regarding who is responsible for which aspects of the patient's care and can negatively affect the perception of the quality of care received.[31] Use of whiteboards has been shown to improve the proportion of patients who could identify key providers,[32] but these are not reliably updated and generally cannot accommodate all team members. When face cards are used, patients and caregivers report that they are more likely to identify their providers correctly.[14, 33, 34] However, potential confusion may ensue when another provider assumes care of the patient in the same role. Finally, use of technology to display team members at the bedside is typically a feature that patients like and can improve identification of care team members.[14, 15, 16] Yet, patient engagement technologies are not readily available in the hospital setting,[35] and ideally should be linked to the electronic health record, which again must be reliably updated.[11, 12, 15, 16]
If care team identification is so critical for delivering effective patient‐centered communication, why is maintaining role assignment problematic? At the individual level, reasons include discontinuity of the care team due to changing clinical rotations and intrateam coverage, shift‐based schedules, and lack of awareness and underutilization of functionality. Additionally, clinicians may have different ways to maintain lists of patients. At the institutional level, functionality to enforce role assignment when accessing patient records may be disabled (to avoid perceived burdens on clinical staff or nonclinical personnel who require access for administrative functions). Finally, electronic health record vendors currently have no incentive to adopt functionality that supports more effective care coordination across settings.[22]
However, more than technical solutions and policy changes are required; care team identification in the electronic health record requires a change in institutional culture. Maintaining an accurate relationship to each patient requires work without tangible benefitsthe benefits accrue only when everyone else identifies their role on the teama tragedy of the commons. This can be illustrated by our own experience. We conducted a quality improvement initiative (Table 1) as a part of 2 concurrent research initiatives that serve to promote patient‐centered communication:[12] PCORI (Patient‐Centered Outcomes Research Institute Transitions), the goal of which is to improve care transitions within the Partners' Pioneer Accountable Care Organization; and the PROSPECT (Promoting Respect and Ongoing Safety Through Patient‐Centeredness, Engagement, Communication, and Technology) project, an initiative funded by the Gordon and Betty Moore Foundation to eliminate preventable harms in the acute care environment.[29] Our goal was to electronically manage the care team with a high degree of fidelity. We enhanced a home‐grown application, which was developed to improve management of team lists for inpatient providers, accessible from our electronic health record, to facilitate role assignment. Specifically, we leveraged existing care processes (eg, nursing log‐on to the electronic medication administration system) to automatically assign certain providers to the care team at change of shift, added functionality to make it easy to assign a provider to all patients on a list for a defined period of time, and encouraged providers to assign their role by demonstrating benefits including quick access to patient‐specific group e‐mail and secure messaging tools (Table 1, Key Facets). The initiative was well‐received by most disciplines, but uptake was suboptimal. Our research assistants routinely assigned residents and others to the care team because our proactive attempts at advertising and reinforcing use of the application failed to reach a critical mass. Most did not see immediate benefits because it was an added step to their busy day, had other methods of managing team lists, and only saw benefit if everyone else participated. Key facets of our care team identification initiative, successes, and challenges are outlined in Table 1.
| Key Facets | Successes | Challenges |
|---|---|---|
| Linked electronic role assignment to administrative processes and clinical workflows | Leveraged existing processes to identify attending provider by routinely reviewing online schedules Linked role assignment to electronic medication administration system sign‐in process for nurses at the start of their shift |
Difficult to generate buy‐in from administrators and specific clinician groups to incorporate routine use of role assignment functionality into existing and/or new workflows No institutional policy mandating role assignments for members of extended care team |
| Incorporated default functionality to specify length of role assignment (eg, stop date) | Used by trainees (residents, fellows) to automate team list role assignments for a prespecified period of time according to online schedules | Underutilized by subspecialty consultants, many of who were unaware or did not fully appreciate the added value of this functionality Research assistants regularly verified that default role assignments were accurately maintained for trainees |
| Linked role assignment to patient‐specific group e‐mail and messaging tools | Clinicians acknowledged clear efficiency benefits (eg, automated patient identification within messages, correct routing of e‐mails) Used by specific members of the care team tasked with facilitating coordination of care (eg, nurse practitioner trained as discharge advocate for research study) |
Difficult to promote use of patient‐specific messaging, particularly for nonunit‐based providers (eg, consultants, primary care physicians) Required access to an application not typically used for clinical messaging Difficult to change culture of network e‐mail use for clinical messaging |
| Advertised new functionality and demonstrated potential efficiencies for care team communication | Unit‐based clinicians (hospitalists, nurses, housestaff) typically understood benefits when demonstrated and were easier to engage | Some nonunit‐based clinicians (eg, consulting attendings, primary care physicians) did not see benefits and/or were difficult to engage |
| Some nonunit‐based provider groups (eg, social workers, nutritionists, subspecialty fellows) considered the initiative worthwhile, and were open to learning about new functionality to improve communication | Clinicians had several options for managing team lists prior to implementation of new electronic health record | |
| Institutional effort toward implementing new electronic health record detracted from efforts at demonstrating enhanced functionality of existing applications |
There were a few glimmers of hope, however. On several PROSPECT units, we displayed team members on a tablet‐based patient portal so that patients would recognize their providers.[11, 17, 36] Similar to recent work by O'Leary et al.,[14] patients on PROSPECT units were able to correctly identify several care team members, but regularly asked why other providers (eg, consulting fellow) were not listed. Those providers asked the same question, and some eventually learned to assign their role via the application. As part of PROSEPCT, we visited other institutions and learned of an effort to display team members on high‐definition televisions in the patient's room. Several providers, wondering why they were not listed, learned to assign their role and their picture then appeared. Social pressure was the driving force.
Coincidently, we recently implemented a new electronic health record at our institution. Anecdotally, although no formal policy was established, many providers (eg, attendings, first responders, nurses, care coordinators, and other unit‐based providers) appear to be assigning their roles. Other providers (eg, dieticians, physical therapists, residents) also assign their role, but often fail to end role assignments upon completing their rotation or when the patient transfers to another service. Finally, even when actively involved, most subspecialists still do not designate their role. Despite these gaps and inconsistencies, we have made progress toward improving care team identification. The reasons for this progress are straightforward; during required training for the new electronic health record, all inpatient providers were taught to assign their role on the treatment team when assuming care of patients and now have 1 option for managing team lists. However, most providers were not trained to end their role assignments, and many have learned that role assignment is not required to access the patient's record; functionality to enforce this was disabled. Based on lessons learned from our experience,[12] we offer several strategies that hospitalists can employ to improve care team identification in the electronic health record (Table 2).
| Goal | Strategies to Achieve Goal |
|---|---|
| Identify and/or establish reliable processes that administrative staff can use to ensure accurate care team role assignments | Identify databases that serve as the source of truth for provider schedules and routinely access those databases |
| Access resident scheduling application (eg, Amion) that is routinely updated by training program staff | |
| Work with clinical and administrative staff to maintain care team role assignments | |
| Engage affiliated ambulatory practices to ensure patient's primary care physician is updated in the electronic health record | |
| Engage admissions office to improve reliability of attending assignments based on online clinical schedules when patients are admitted | |
| Integrate role assignment into established workflows for specific provider groups when administrative processes not feasible | Link routine care processes to care team role assignment |
| Train nurses, interns, physician assistants to assign role on care team when assuming care of patient at shift change | |
| Train residents, fellows to use default functionality to automatically assign their role on care team at the beginning of a clinical rotation | |
| Demonstrate value of maintaining role assignments in the electronic health record to the unit‐based care team | Emphasize how accurate and reliable care team role assignment can facilitate correct routing of information (eg, test results, discharge summaries) |
| Helps to maintain patient coverage lists (eg, fellows, consultants, social workers) | |
| Facilitates patient‐specific communication (eg, via group email and messaging tools linked to the electronic health record's care team functionality) | |
| Align with concurrent institutional initiatives that enforce or incentivize care team role assignment | Mandate role assignment when writing a note, placing an order, or adding a patient to a coverage list in the electronic health record |
| Provide patients and caregivers the ability to identify the care team via patient portalcreates social pressure for those providers who do not identify themselves on the care team | |
| Incentivize providers to maintain role assignments during patient's hospitalization in order to receive notifications if patients are readmitted | |
| Automate role assignments for all members of the care team whenever possible | Work with clinical informatics/emnformation system staff to determine feasibility of linking online scheduling systems or log‐in process to other systems routinely accessed by specific providers to automatically assign/unassign specific providers at the beginning/end of a shift (eg, nurses automatically assigned to care team when they access the electronic medication administration record system at beginning of shift) |
| Explore availability of default functionality to assign and unassign providers to and from the care team in a specific role by team, service, or unit‐based patient lists | |
| Require a stop time/date for role assignments or set a default if none entered |
In the future, care team identification in the electronic health record can be automated by integrating directly with electronic workflows, online scheduling applications, and provider directories. Hospitals could then leverage care team lists to facilitate patient‐centered communication via secure web‐based and mobile messaging applications configured to simultaneously update all team members (eg, group messaging apps, microblogs).[11, 37, 38] By synchronizing with the electronic health record, role assignments can be automatically updated via these applications, further increasing fidelity of care team identification.[12] Finally, as hospitals implement acute care patient portals, team lists can be leveraged to display all care team members correctly so that patients and caregivers can communicate more easily with providers.[17] The potential ramifications for patient‐centered communication are tremendous.
Disclosures
This work was funded by the Patient‐Centered Outcomes Research Institute and the Gordon and Betty Moore Foundation (GBMF3914). The authors report no conflicts of interest.
- . Patient‐centered communication. Annu Rev Nurs Res. 1999;17:85–104.
- , , , . Facilitating patient‐centered cancer communication: a road map. Patient Educ Couns. 2009;77:319–321.
- , . Patient‐Centered Communication in Cancer Care: Promoting Healing and Reducing Suffering. NIH Publication No. 07–6225. Bethesda, MD: National Cancer Institute; 2007.
- . When conversation is better than computation. J Am Med Inform Assoc. 2000;7:277–286.
- . Communication systems in healthcare. Clin Biochem Rev. 2006;27:89–98.
- , , , et al. The nature of adverse events in hospitalized patients. results of the Harvard Medical Practice Study II. N Engl J Med. 1991;324:377–384.
- , , , et al. A look into the nature and causes of human errors in the intensive care unit. Crit Care Med. 1995;23:294–300.
- , , . Communication failures: an insidious contributor to medical mishaps. Acad Med. 2004;79:186–194.
- , . Interdisciplinary communication: an uncharted source of medical error? J Crit Care. 2006;21:236–242; discussion 242.
- , , . Quantifying the economic impact of communication inefficiencies in U.S. hospitals. J Healthc Manag. 2010;55:265–281; discussion 281–282.
- , , , . Transforming the acute care environment: a web‐based patient‐centered toolkit [abstract]. J Hosp Med. 2014;9(suppl 2):694.
- , , , et al. Creating a culture of patient‐centered care team communication at a large academic medical center [Abstract]. J Hosp Med. 2015;10 (suppl 2). Available at: http://www.shmabstracts.com/abstract/creating‐a‐culture‐of‐patient‐centered‐care‐team‐communication‐at‐a‐large‐academic‐medical‐center. Accessed April 24, 2015.
- , , , , . Perceived information needs and communication difficulties of inpatient physicians and nurses. Proc AMIA Symp. 2001:453–457.
- , , , , , . The effect of tablet computers with a mobile patient portal application on hospitalized patients' knowledge and activation [published online June 15, 2015]. J Am Med Inform Assoc. doi: 10.1093/jamia/ocv058.
- , , , , . Bedside information technology to support patient‐centered care. Int J Med Inform. 2012;81(7):442–451.
- , , , et al. Building and testing a patient‐centric electronic bedside communication center. J Gerontol Nurs. 2013;39:15–19.
- , , , et al. A web‐based, patient‐centered toolkit to engage patients and caregivers in the acute care setting: a preliminary evaluation [published online August 2, 2015]. J Am Med Inform Assoc. doi: 10.1093/jamia/ocv093.
- , , , et al. Awareness of the care team in electronic health records. Appl Clin Inform. 2011;2:395–405.
- , , , , , . Teamwork on inpatient medical units: assessing attitudes and barriers. Qual Saf Health Care. 2010;19:117–121.
- , , , et al. Frequency and clinical importance of pages sent to the wrong physician. Arch Intern Med. 2009;169:1072–1073.
- , . Patient experiences with coordination of care: the benefit of continuity and primary care physician as referral source. J Gen Intern Med. 2009;24:170–177.
- , , , , . Are electronic medical records helpful for care coordination? Experiences of physician practices. J Gen Intern Med. 2010;25:177–185.
- , , , et al. Impact of localizing physicians to hospital units on nurse‐physician communication and agreement on the plan of care. J Gen Intern Med. 2009;24:1223–1227.
- , , , , , . Improving teamwork: impact of structured interdisciplinary rounds on a hospitalist unit. J Hosp Med. 2011;6:88–93.
- , , , et al. Structured interdisciplinary rounds in a medical teaching unit: improving patient safety. Arch Intern Med. 2011;171:678–684.
- , , , ; High Performance Teams and the Hospital of the Future Project Team. Interdisciplinary teamwork in hospitals: a review and practical recommendations for improvement. J Hosp Med. 2012;7:48–54.
- , , . Intrateam coverage is common, intrateam handoffs are not. J Hosp Med. 2014;9:734–736.
- . A primary care physician's ideal transitions of care? Where's the evidence? J Hosp Med. 2013;8:472–477.
- , , , , . Primary care physician communication at hospital discharge reduces medication discrepancies. J Hosp Med. 2013;8:672–677.
- , . Let's “face” it: time to introduce yourself to patients. J Hosp Med. 2014;9:199–200.
- , , . Patient perceptions of coordinated care: the importance of organized communication in hospitals. J Healthc Qual. 1999;21:18–23.
- , , , . Patient whiteboards to improve patient‐centred care in the hospital. Postgrad Med J. 2013;89:604–609.
- , , , , , . Effect of a face sheet tool on medical team provider identification and family satisfaction. J Hosp Med. 2014;9:186–188.
- , , , , , . The impact of facecards on patients' knowledge, satisfaction, trust, and agreement with hospital physicians: a pilot study. J Hosp Med. 2014;9:137–141.
- , , , et al. Patient engagement in the inpatient setting: a systematic review. J Am Med Inform Assoc. 2014;21:742–750.
- PROSPECT: Promoting Respect and Ongoing Safety Through Patient‐centeredness, Engagement, Communication, and Technology. Available at: http://www.partners.org/cird/PROSPECT/Index.htm. Accessed May 3, 2015.
- , , , , , . Smarter hospital communication: secure smartphone text messaging improves provider satisfaction and perception of efficacy, workflow. J Hosp Med. 2014;9:573–578.
- , , , et al. Engaging patients, providers, and institutional stakeholders in developing a patient‐centered microblog. Paper presented at: Proceeding of the American Medical Informatics Association Annual Fall Symposium; November 16–19, 2014; Washington, DC.
Patient‐centered communication is a strategy that is used to promote shared understanding of the plan of care among providers and patients.[1, 2, 3] Caring for hospitalized patients is a collaborative effort that requires seamless patient‐centered communication among a rapidly changing care team to safely progress a patient from admission through discharge. Yet, hospitals continue to struggle with improving the complex and increasingly electronic conversation patterns among care team members and patients to achieve effective patient‐centered communication.[4, 5] When members of the care team operate in this environment, patients often receive conflicting information regarding their plan of care, medications, and test results. Ineffective communication can lead to a suboptimal patient experience, additional costs, medical errors, and preventable adverse events.[6, 7, 8, 9, 10]
A critical first step to improving patient‐centered communication is identifying the care team.[11, 12] Accurate and reliable identification of all care team members is a pressing information need; it is fundamental to efficiently conveying information about the plan of care to those who know the patient the best, must make timely decisions, or will assume care once the patient leaves the hospital.[13] Furthermore, it has implications for engaging patients more meaningfully in their care.[14, 15, 16, 17] Ideally, the process of identifying an individual caring for the patient in a specific role is quickly and reliably determined from the electronic health record, the single source of truth where any provider can quickly identify other team members. This source of truth can be updated manually when individual members assign and remove themselves from the care team, or automatically when accessing the patient's record, writing a note, placing an order, or adding a patient to a coverage list. When providers correctly identify other team members in this way, hospital paging directories and secure messaging tools that link to the electronic health record become more effective at supporting care team communication.[18]
In general, the process of identifying care teams is difficult,[19] and maintaining role assignments in the electronic health record is equally challenging. Vawdrey et al. previously reported that care team lists are inaccurate and cannot be used to reliably identify other members at any given moment.[18] The inability to identify team members often leads to incorrectly routed pages, e‐mail messages, and phone calls.[20] Consequently, the potential to reliably manage the care team and improve electronic communication remains untapped, rendering team collaboration and care coordination less effective.[18, 21, 22]
In recent years, the trend toward restructuring inpatient teamsgeographical localization, structured communication interventions, teamwork training, and interdisciplinary roundswould seem to diminish the need for electronic care team identification, as those efforts have already made a positive impact with regard to interprofessional communication and collaboration, team satisfaction, and adverse events.[23, 24, 25, 26] Nonetheless, interdisciplinary teamwork, though critically important for patient‐centered communication, does not completely obviate the need for accurate and reliable care team identification.[26] Although care teams are statically located on units, the plan of care is dynamic; it evolves when the patient's status changes, when new information becomes available, and when key longitudinal providers (eg, primary care physician, subspecialty consultant) make recommendations. Thus, information conveyed as a team on rounds quickly becomes out of date, requiring additional forms of communication. Furthermore, due to frequent ad hoc coverage among team members, the identity of providers covering the patient at any given moment is often not clear.[27] This is particularly problematic for nonunit‐based providers who try to communicate with unit‐based care team members. These providers, in particular, have valuable knowledge and insight that can aid the primary team in decision making.[28, 29] However, they typically do not participate in rounds, often waste time identifying responsible providers,[20] and may communicate their recommendations directly with the patient without discussing with the primary team. These factors in part explain why geographic localization has shown limited improvement in shared understanding of the plan of care.[23]
From the perspective of patients and caregivers, identification of the providers entering and leaving their room is also challenging; only 11% to 51% of patients identify their providers correctly.[30] This adds to confusion regarding who is responsible for which aspects of the patient's care and can negatively affect the perception of the quality of care received.[31] Use of whiteboards has been shown to improve the proportion of patients who could identify key providers,[32] but these are not reliably updated and generally cannot accommodate all team members. When face cards are used, patients and caregivers report that they are more likely to identify their providers correctly.[14, 33, 34] However, potential confusion may ensue when another provider assumes care of the patient in the same role. Finally, use of technology to display team members at the bedside is typically a feature that patients like and can improve identification of care team members.[14, 15, 16] Yet, patient engagement technologies are not readily available in the hospital setting,[35] and ideally should be linked to the electronic health record, which again must be reliably updated.[11, 12, 15, 16]
If care team identification is so critical for delivering effective patient‐centered communication, why is maintaining role assignment problematic? At the individual level, reasons include discontinuity of the care team due to changing clinical rotations and intrateam coverage, shift‐based schedules, and lack of awareness and underutilization of functionality. Additionally, clinicians may have different ways to maintain lists of patients. At the institutional level, functionality to enforce role assignment when accessing patient records may be disabled (to avoid perceived burdens on clinical staff or nonclinical personnel who require access for administrative functions). Finally, electronic health record vendors currently have no incentive to adopt functionality that supports more effective care coordination across settings.[22]
However, more than technical solutions and policy changes are required; care team identification in the electronic health record requires a change in institutional culture. Maintaining an accurate relationship to each patient requires work without tangible benefitsthe benefits accrue only when everyone else identifies their role on the teama tragedy of the commons. This can be illustrated by our own experience. We conducted a quality improvement initiative (Table 1) as a part of 2 concurrent research initiatives that serve to promote patient‐centered communication:[12] PCORI (Patient‐Centered Outcomes Research Institute Transitions), the goal of which is to improve care transitions within the Partners' Pioneer Accountable Care Organization; and the PROSPECT (Promoting Respect and Ongoing Safety Through Patient‐Centeredness, Engagement, Communication, and Technology) project, an initiative funded by the Gordon and Betty Moore Foundation to eliminate preventable harms in the acute care environment.[29] Our goal was to electronically manage the care team with a high degree of fidelity. We enhanced a home‐grown application, which was developed to improve management of team lists for inpatient providers, accessible from our electronic health record, to facilitate role assignment. Specifically, we leveraged existing care processes (eg, nursing log‐on to the electronic medication administration system) to automatically assign certain providers to the care team at change of shift, added functionality to make it easy to assign a provider to all patients on a list for a defined period of time, and encouraged providers to assign their role by demonstrating benefits including quick access to patient‐specific group e‐mail and secure messaging tools (Table 1, Key Facets). The initiative was well‐received by most disciplines, but uptake was suboptimal. Our research assistants routinely assigned residents and others to the care team because our proactive attempts at advertising and reinforcing use of the application failed to reach a critical mass. Most did not see immediate benefits because it was an added step to their busy day, had other methods of managing team lists, and only saw benefit if everyone else participated. Key facets of our care team identification initiative, successes, and challenges are outlined in Table 1.
| Key Facets | Successes | Challenges |
|---|---|---|
| Linked electronic role assignment to administrative processes and clinical workflows | Leveraged existing processes to identify attending provider by routinely reviewing online schedules Linked role assignment to electronic medication administration system sign‐in process for nurses at the start of their shift |
Difficult to generate buy‐in from administrators and specific clinician groups to incorporate routine use of role assignment functionality into existing and/or new workflows No institutional policy mandating role assignments for members of extended care team |
| Incorporated default functionality to specify length of role assignment (eg, stop date) | Used by trainees (residents, fellows) to automate team list role assignments for a prespecified period of time according to online schedules | Underutilized by subspecialty consultants, many of who were unaware or did not fully appreciate the added value of this functionality Research assistants regularly verified that default role assignments were accurately maintained for trainees |
| Linked role assignment to patient‐specific group e‐mail and messaging tools | Clinicians acknowledged clear efficiency benefits (eg, automated patient identification within messages, correct routing of e‐mails) Used by specific members of the care team tasked with facilitating coordination of care (eg, nurse practitioner trained as discharge advocate for research study) |
Difficult to promote use of patient‐specific messaging, particularly for nonunit‐based providers (eg, consultants, primary care physicians) Required access to an application not typically used for clinical messaging Difficult to change culture of network e‐mail use for clinical messaging |
| Advertised new functionality and demonstrated potential efficiencies for care team communication | Unit‐based clinicians (hospitalists, nurses, housestaff) typically understood benefits when demonstrated and were easier to engage | Some nonunit‐based clinicians (eg, consulting attendings, primary care physicians) did not see benefits and/or were difficult to engage |
| Some nonunit‐based provider groups (eg, social workers, nutritionists, subspecialty fellows) considered the initiative worthwhile, and were open to learning about new functionality to improve communication | Clinicians had several options for managing team lists prior to implementation of new electronic health record | |
| Institutional effort toward implementing new electronic health record detracted from efforts at demonstrating enhanced functionality of existing applications |
There were a few glimmers of hope, however. On several PROSPECT units, we displayed team members on a tablet‐based patient portal so that patients would recognize their providers.[11, 17, 36] Similar to recent work by O'Leary et al.,[14] patients on PROSPECT units were able to correctly identify several care team members, but regularly asked why other providers (eg, consulting fellow) were not listed. Those providers asked the same question, and some eventually learned to assign their role via the application. As part of PROSEPCT, we visited other institutions and learned of an effort to display team members on high‐definition televisions in the patient's room. Several providers, wondering why they were not listed, learned to assign their role and their picture then appeared. Social pressure was the driving force.
Coincidently, we recently implemented a new electronic health record at our institution. Anecdotally, although no formal policy was established, many providers (eg, attendings, first responders, nurses, care coordinators, and other unit‐based providers) appear to be assigning their roles. Other providers (eg, dieticians, physical therapists, residents) also assign their role, but often fail to end role assignments upon completing their rotation or when the patient transfers to another service. Finally, even when actively involved, most subspecialists still do not designate their role. Despite these gaps and inconsistencies, we have made progress toward improving care team identification. The reasons for this progress are straightforward; during required training for the new electronic health record, all inpatient providers were taught to assign their role on the treatment team when assuming care of patients and now have 1 option for managing team lists. However, most providers were not trained to end their role assignments, and many have learned that role assignment is not required to access the patient's record; functionality to enforce this was disabled. Based on lessons learned from our experience,[12] we offer several strategies that hospitalists can employ to improve care team identification in the electronic health record (Table 2).
| Goal | Strategies to Achieve Goal |
|---|---|
| Identify and/or establish reliable processes that administrative staff can use to ensure accurate care team role assignments | Identify databases that serve as the source of truth for provider schedules and routinely access those databases |
| Access resident scheduling application (eg, Amion) that is routinely updated by training program staff | |
| Work with clinical and administrative staff to maintain care team role assignments | |
| Engage affiliated ambulatory practices to ensure patient's primary care physician is updated in the electronic health record | |
| Engage admissions office to improve reliability of attending assignments based on online clinical schedules when patients are admitted | |
| Integrate role assignment into established workflows for specific provider groups when administrative processes not feasible | Link routine care processes to care team role assignment |
| Train nurses, interns, physician assistants to assign role on care team when assuming care of patient at shift change | |
| Train residents, fellows to use default functionality to automatically assign their role on care team at the beginning of a clinical rotation | |
| Demonstrate value of maintaining role assignments in the electronic health record to the unit‐based care team | Emphasize how accurate and reliable care team role assignment can facilitate correct routing of information (eg, test results, discharge summaries) |
| Helps to maintain patient coverage lists (eg, fellows, consultants, social workers) | |
| Facilitates patient‐specific communication (eg, via group email and messaging tools linked to the electronic health record's care team functionality) | |
| Align with concurrent institutional initiatives that enforce or incentivize care team role assignment | Mandate role assignment when writing a note, placing an order, or adding a patient to a coverage list in the electronic health record |
| Provide patients and caregivers the ability to identify the care team via patient portalcreates social pressure for those providers who do not identify themselves on the care team | |
| Incentivize providers to maintain role assignments during patient's hospitalization in order to receive notifications if patients are readmitted | |
| Automate role assignments for all members of the care team whenever possible | Work with clinical informatics/emnformation system staff to determine feasibility of linking online scheduling systems or log‐in process to other systems routinely accessed by specific providers to automatically assign/unassign specific providers at the beginning/end of a shift (eg, nurses automatically assigned to care team when they access the electronic medication administration record system at beginning of shift) |
| Explore availability of default functionality to assign and unassign providers to and from the care team in a specific role by team, service, or unit‐based patient lists | |
| Require a stop time/date for role assignments or set a default if none entered |
In the future, care team identification in the electronic health record can be automated by integrating directly with electronic workflows, online scheduling applications, and provider directories. Hospitals could then leverage care team lists to facilitate patient‐centered communication via secure web‐based and mobile messaging applications configured to simultaneously update all team members (eg, group messaging apps, microblogs).[11, 37, 38] By synchronizing with the electronic health record, role assignments can be automatically updated via these applications, further increasing fidelity of care team identification.[12] Finally, as hospitals implement acute care patient portals, team lists can be leveraged to display all care team members correctly so that patients and caregivers can communicate more easily with providers.[17] The potential ramifications for patient‐centered communication are tremendous.
Disclosures
This work was funded by the Patient‐Centered Outcomes Research Institute and the Gordon and Betty Moore Foundation (GBMF3914). The authors report no conflicts of interest.
- . Patient‐centered communication. Annu Rev Nurs Res. 1999;17:85–104.
- , , , . Facilitating patient‐centered cancer communication: a road map. Patient Educ Couns. 2009;77:319–321.
- , . Patient‐Centered Communication in Cancer Care: Promoting Healing and Reducing Suffering. NIH Publication No. 07–6225. Bethesda, MD: National Cancer Institute; 2007.
- . When conversation is better than computation. J Am Med Inform Assoc. 2000;7:277–286.
- . Communication systems in healthcare. Clin Biochem Rev. 2006;27:89–98.
- , , , et al. The nature of adverse events in hospitalized patients. results of the Harvard Medical Practice Study II. N Engl J Med. 1991;324:377–384.
- , , , et al. A look into the nature and causes of human errors in the intensive care unit. Crit Care Med. 1995;23:294–300.
- , , . Communication failures: an insidious contributor to medical mishaps. Acad Med. 2004;79:186–194.
- , . Interdisciplinary communication: an uncharted source of medical error? J Crit Care. 2006;21:236–242; discussion 242.
- , , . Quantifying the economic impact of communication inefficiencies in U.S. hospitals. J Healthc Manag. 2010;55:265–281; discussion 281–282.
- , , , . Transforming the acute care environment: a web‐based patient‐centered toolkit [abstract]. J Hosp Med. 2014;9(suppl 2):694.
- , , , et al. Creating a culture of patient‐centered care team communication at a large academic medical center [Abstract]. J Hosp Med. 2015;10 (suppl 2). Available at: http://www.shmabstracts.com/abstract/creating‐a‐culture‐of‐patient‐centered‐care‐team‐communication‐at‐a‐large‐academic‐medical‐center. Accessed April 24, 2015.
- , , , , . Perceived information needs and communication difficulties of inpatient physicians and nurses. Proc AMIA Symp. 2001:453–457.
- , , , , , . The effect of tablet computers with a mobile patient portal application on hospitalized patients' knowledge and activation [published online June 15, 2015]. J Am Med Inform Assoc. doi: 10.1093/jamia/ocv058.
- , , , , . Bedside information technology to support patient‐centered care. Int J Med Inform. 2012;81(7):442–451.
- , , , et al. Building and testing a patient‐centric electronic bedside communication center. J Gerontol Nurs. 2013;39:15–19.
- , , , et al. A web‐based, patient‐centered toolkit to engage patients and caregivers in the acute care setting: a preliminary evaluation [published online August 2, 2015]. J Am Med Inform Assoc. doi: 10.1093/jamia/ocv093.
- , , , et al. Awareness of the care team in electronic health records. Appl Clin Inform. 2011;2:395–405.
- , , , , , . Teamwork on inpatient medical units: assessing attitudes and barriers. Qual Saf Health Care. 2010;19:117–121.
- , , , et al. Frequency and clinical importance of pages sent to the wrong physician. Arch Intern Med. 2009;169:1072–1073.
- , . Patient experiences with coordination of care: the benefit of continuity and primary care physician as referral source. J Gen Intern Med. 2009;24:170–177.
- , , , , . Are electronic medical records helpful for care coordination? Experiences of physician practices. J Gen Intern Med. 2010;25:177–185.
- , , , et al. Impact of localizing physicians to hospital units on nurse‐physician communication and agreement on the plan of care. J Gen Intern Med. 2009;24:1223–1227.
- , , , , , . Improving teamwork: impact of structured interdisciplinary rounds on a hospitalist unit. J Hosp Med. 2011;6:88–93.
- , , , et al. Structured interdisciplinary rounds in a medical teaching unit: improving patient safety. Arch Intern Med. 2011;171:678–684.
- , , , ; High Performance Teams and the Hospital of the Future Project Team. Interdisciplinary teamwork in hospitals: a review and practical recommendations for improvement. J Hosp Med. 2012;7:48–54.
- , , . Intrateam coverage is common, intrateam handoffs are not. J Hosp Med. 2014;9:734–736.
- . A primary care physician's ideal transitions of care? Where's the evidence? J Hosp Med. 2013;8:472–477.
- , , , , . Primary care physician communication at hospital discharge reduces medication discrepancies. J Hosp Med. 2013;8:672–677.
- , . Let's “face” it: time to introduce yourself to patients. J Hosp Med. 2014;9:199–200.
- , , . Patient perceptions of coordinated care: the importance of organized communication in hospitals. J Healthc Qual. 1999;21:18–23.
- , , , . Patient whiteboards to improve patient‐centred care in the hospital. Postgrad Med J. 2013;89:604–609.
- , , , , , . Effect of a face sheet tool on medical team provider identification and family satisfaction. J Hosp Med. 2014;9:186–188.
- , , , , , . The impact of facecards on patients' knowledge, satisfaction, trust, and agreement with hospital physicians: a pilot study. J Hosp Med. 2014;9:137–141.
- , , , et al. Patient engagement in the inpatient setting: a systematic review. J Am Med Inform Assoc. 2014;21:742–750.
- PROSPECT: Promoting Respect and Ongoing Safety Through Patient‐centeredness, Engagement, Communication, and Technology. Available at: http://www.partners.org/cird/PROSPECT/Index.htm. Accessed May 3, 2015.
- , , , , , . Smarter hospital communication: secure smartphone text messaging improves provider satisfaction and perception of efficacy, workflow. J Hosp Med. 2014;9:573–578.
- , , , et al. Engaging patients, providers, and institutional stakeholders in developing a patient‐centered microblog. Paper presented at: Proceeding of the American Medical Informatics Association Annual Fall Symposium; November 16–19, 2014; Washington, DC.
Yield of Blood Cultures
Blood cultures are the gold standard test for the diagnosis of bloodstream infections (BSI). Given the high mortality associated with BSI,[1, 2, 3] physicians have a low threshold to obtain blood cultures.[4, 5] Unfortunately, physicians are poor at predicting which hospitalized patients have BSI,[6, 7] and published guidelines do not provide clear indications for the use of blood cultures.[8] As a result, current practice follows a culture if spikes paradigm, whereby inpatient providers often obtain blood cultures in the setting of any fever. This is the most common anticipatory guidance communicated between providers, involving up to 75% of written sign‐out instructions.[9] The result is a low rate of true positive blood cultures (5%10%)[10, 11, 12] with only a slightly lower rate of false positive blood cultures (contaminants).[12, 13, 14] False positive blood cultures often lead to repeat blood cultures, unnecessary antibiotic use, and increased hospital cost and length of stay.[13]
Over the last several years, there has been an increased emphasis on practicing high‐value care by avoiding unnecessary and duplicate testing. In 2012, the American Board of Internal Medicine introduced the Choosing Wisely campaign, with specific initiatives to reduce medical waste and overuse. Given the low yield of blood cultures, guidance on patients in whom blood cultures are most appropriate would be welcome. Studies assessing risk factors for bacteremia have led to the development of multiple stratification systems without overall consensus.[10, 15, 16, 17, 18, 19, 20] Furthermore, much of the current literature on blood culture utilization includes cultures drawn in the emergency department (ED) or intensive care unit setting (ICU).[10, 18, 19, 20] Less is known regarding the rates of positivity and utility for blood cultures drawn on patients hospitalized on an acute care medical ward.
Our study had 3 main objectives: (1) determine the rates of true positive and false positive blood cultures among hospitalized medical patients, (2) determine the ability of physician‐selected indications and patient characteristics to predict BSI, and (3) identify populations in which blood cultures may not be necessary.
PATIENTS AND METHODS
Study Design
We conducted a prospective cohort study of all hospitalized medical patients for whom blood cultures were ordered and received by the microbiology laboratory. This investigation was approved by the Veterans Affairs (VA) Boston Healthcare System internal review board.
Patients and Setting
During a 7‐month period (October 1, 2014April 15, 2015), all blood culture orders were reviewed for indication and result each day (and on Monday for weekend blood cultures) at a large VA teaching hospital (approximately 6200 admissions each year). As part of the electronic medical order, providers selected from among a list of common indications. Options included various clinical signs and diagnoses, and providers could select more than 1 indication. Each blood culture order triggered a phlebotomist to draw 2 separate blood culture sets (each set consisted of 1 aerobic and 1 anaerobic blood culture bottle).
Inclusion criteria included admission to 1 of 5 general medical service teams or 1 of 2 cardiology teams. Given that the study hospital does not have dedicated subspecialty service teams (with the exception of cardiology), all patients with medical diagnoses are cared for on the general medical service.
Predictor and Outcome Variables
Patient characteristics were obtained via chart review. Fever was defined as a single temperature greater than 100.4F within 24 hours prior to a blood culture order. Leukocytosis was defined as a white blood cell count greater than 10,000 within 24 hours of a blood culture order. Patients were considered to have received antibiotics if an order for an antibacterial or antifungal agent was active within 72 hours prior to the blood culture order. Each blood culture order was assigned a working diagnosis that prompted the order. These working diagnoses were identified by chart review as documented under the provider's assessment and plan and were not necessarily the primary diagnosis prompting hospitalization.
Classification of positive blood cultures into true and false positive was determined by consensus among the microbiology and the infectious disease departments after review of clinical and laboratory data, consistent with a previously established practice at the hospital. A true negative culture consisted of any culture that was not a true positive or a false positive. A blood culture order was defined as an electronic entry and included all sets of blood cultures drawn as a result of that order. Consistent with previous literature, a blood culture episode was defined as all blood cultures ordered within a 48‐hour period starting at the time of the first culture.[10] For patients with multiple admissions during the study period, each admission was considered a unique patient.
Statistical Analysis
Rates of true and false positivity of blood cultures were calculated. In addition, positive likelihood ratios (LR+) for true positive blood cultures were calculated using JMP statistical software (SAS Institute, Inc., Cary, NC).
RESULTS
Overall
A total of 576 blood culture orders (467 blood culture episodes) were completed on 363 hospitalized medical patients during the study period. Five hundred forty orders were placed on patients on general medical services and 36 orders on patients on the cardiology services. Four hundred eighty‐seven (85%) orders resulted in 2 sets of cultures being drawn, 87 (15%) resulted in 1 set of cultures, and 2 (0.3%) resulted in 3 sets of cultures. The median time between admission and culture draw was 2 days (range, 072 days), with 57% of cultures drawn during hospital day 0 to 2, 24.5% drawn between hospital day 3 to 7, and 19.4% drawn after hospital day 7. The average age of the patients was 70.4 years, and 94% were men. Additional patient characteristics are shown in Table 1.
| Clinical Characteristic | Total, n = 363 (%) | True Positive Blood Cultures, n = 14 (%) | P Value |
|---|---|---|---|
| |||
| Mean age, y | 70.4 | 73.9 | 0.4 |
| Male sex | 350 (96%) | 14 (100%) | 1 |
| White race | 308 (85%) | 11 (79%) | 0.7 |
| Location prior to admission | |||
| Community | 276 (76%) | 11 (79%) | 1 |
| Hospital | 51 (14%) | 1 (7%) | 0.7 |
| Long‐term care facility | 36 (10%) | 2 (14%) | 0.6 |
| Comorbidities | |||
| Diabetes | 136 (37%) | 5 (36%) | 1 |
| Malignancy | 100 (28%) | 4 (31%) | 1 |
| Alcohol abuse | 89 (25%) | 2 (14%) | 0.5 |
| Cirrhosis | 31 (9%) | 1 (7%) | 1 |
| End‐stage renal disease | 21 (6%) | 1 (7%) | 1 |
| Active drug use* | 16 (4%) | 1 (7%) | 0.5 |
| Catheter | 93 (26%) | 3 (21%) | 0.8 |
| Recent hospitalization | 145 (40%) | 6 (43%) | 1 |
| History of MRSA colonization | 72 (20%) | 5 (36%) | 0.16 |
| Cultures drawn in emergency department | 69 (19%) | 6 (43%) | 0.03 |
The true positive and false positive rates per blood culture order were 3.6% (21/576) and 2.3% (13/576), respectively (Table 2). Similar values were seen per blood cultures episode (3.4% and 2.7%, respectively). The true positive blood culture rates per order and episode were significantly lower than those drawn on emergency room patients during the study period (41/570, 7.2%, P < 0.05).
| Total, n (%) | True Positive, n (%) | False Positive, n (%) | True Negative, n (%) | |
|---|---|---|---|---|
| ||||
| Per patient | 363 | 14 (3.8) | 13 (3.6) | 336 (92.6) |
| Per blood culture episode | 467 | 16 (3.4) | 13 (2.7) | 438 (93.8) |
| Per blood culture order | 576 | 21 (3.6) | 13 (2.3) | 542 (94.1) |
| Rates per blood culture order | ||||
| Physician‐selected indication, n = 530 | ||||
| Fever | 136 (25.6) | 3 (2.2) | 3 (2.2) | 130 (95.6) |
| Fever and additional indication(s) | 118 (22.2) | 5 (4.2) | 3 (2.5) | 110 (93.2) |
| Fever and leukocytosis | 50 (9.4) | 4 (8.0) | 3 (6.0) | 43 (86.0) |
| Leukocytosis | 50 (9.4) | 2 (4.0) | 0 (0) | 48 (96.0) |
| Follow‐up previous positive | 60 (11.3) | 7 (11.7) | 0 (0) | 53 (88.3) |
| Working diagnosis, n = 576 | ||||
| Pneumonia | 101 (17.5) | 0 (0) | 4 (3.9) | 97 (96.0) |
| Bacteremia/endocarditis | 97 (16.8) | 12 (12.3) | 1 (1.0) | 84 (86.6) |
| Urinary tract infection* | 95 (16.4) | 5 (5.3) | 2 (2.1) | 88 (92.6) |
| Other infection | 46 (8.0) | 0 (0) | 0 (0) | 46 (100) |
| Skin and soft‐tissue infection | 39 (6.8) | 1 (2.6) | 0 (0) | 38 (97.4) |
| Neutropenic fever | 28 (4.9) | 0 (0) | 0 (0) | 28 (100) |
| Sepsis | 27 (4.7) | 0 (0) | 0 (0) | 27 (100) |
| Fever | 18 (3.1) | 1 (5.5) | 1 (5.5) | 16 (88.9) |
| Bone and join infection | 15 (2.6) | 1 (6.7) | 0 (0) | 14 (93.3) |
| Postoperative fever | 9 (1.6) | 0 (0) | 0 (0) | 9 (100) |
| Noninfectious diagnosis | 101 (17.5) | 1 (1.0) | 5 (5.0) | 95 (94.1) |
| Antibiotic exposure | ||||
| Yes | 354 (61.5) | 5 (1.4) | 5 (1.4) | 344 (97.1) |
| No | 222 (38.6) | 16 (7.2) | 8 (3.6) | 198 (89.1) |
| Previous documented positive culture via chart review | ||||
| Yes | 155 (26.9) | 9 (5.8) | 2 (1.3) | 144 (92.9) |
| No | 421 (73.1) | 12 (2.9) | 11 (2.6) | 398 (94.5) |
| LR+ (95% CI), True Positive Blood Culture | LR+ (95% CI), False Positive Blood Culture | |
|---|---|---|
| ||
| Physician‐selected indication | ||
| Fever | 0.6 (0.21.7) | 0.9 (0.32.5) |
| Fever and additional indication(s) | 1.1 (0.52.4) | 1.0 (0.42.8) |
| Fever and leukocytosis | 2.2 (0.95.6) | 2.5 (0.97.1) |
| Leukocytosis | 1.1 (0.34.0) | 0.4 (0.05.6) |
| Follow‐up previous positive | 3.4 (1.86.5) | 0.3 (0.04.7) |
| Diagnosis | ||
| Pneumonia | 0.1 (0.01.9) | 1.8 (0.84.1) |
| Bacteremia/endocarditis | 3.7 (2.55.7) | 0.5 (0.13.0) |
| Urinary tract infection | 1.5 (0.73.2) | 0.9 (0.33.4) |
| Noninfectious diagnosis | 0.3 (0.01.8) | 2.3 (1.14.6) |
| Recent antibiotic exposure | ||
| Yes | 0.4 (0.20.8) | 0.6 (0.31.2) |
| No | 2.1 (1.62.7) | 1.6 (1.02.5) |
| No with fever | 2.4 (1.24.9) | 0.8 (0.23.6) |
| No with fever and leukocytosis | 5.6 (1.818.2) | 0.4 (0.12.6) |
| Prior positive cultures | ||
| Yes | 1.6 (1.02.7) | 0.6 (0.22.0) |
For the true positive cultures, gram‐positive organisms were isolated most frequently (14/21, 67%) with Staphylococcus aureus identified in 2/21 (10%) positive cultures and Enterococcus faecalis identified in 7/21 (33%) positive cultures. Gram‐negative organisms were isolated in 6/21 (29%) cultures, and 1/21 (5%) culture grew 2 organisms (Enterococcus faecalis and Nocardia). The majority of false positive cultures isolated 1 or more species of coagulase‐negative Staphylococcus (11/13, 85%).
Predictors of True Bacteremia
The 4 most common working diagnoses prompting a blood culture order were pneumonia, bacteremia/endocarditis, urinary tract infection, and a noninfectious diagnosis (eg, syncope), with each prompting approximately 17% of the total orders (Table 2). Of these, only a primary diagnosis of bacteremia/endocarditis was predictive of a true positive culture, yielding a rate of 12.3% (LR+ 3.7, 95% confidence interval [CI]: 2.5‐5.7). No other diagnosis was predictive of true positivity. A diagnosis of pneumonia yielded no true positive and 4 false positive blood cultures (3.9%), whereas a noninfectious diagnosis yielded only 1 true positive (1.0%) and 5 false positives (5.0%). The positive likelihood ratios for these 2 diagnoses were 0.1 (95% CI: 0.00‐1.9) and 0.3 (95% CI: 0.04‐1.8), respectively.
Indications were selected for 530 of 576 (92%) blood culture orders (Table 2). The most common indication was fever alone (25.6%), followed by fever with an additional indication (22.2%), follow‐up positive blood cultures (11.3%), fever and leukocytosis (9.4%), and leukocytosis alone (9.4%). Only follow‐up positive blood cultures was predictive of a true positive, with a LR+ of 3.4 (95% CI: 1.8‐6.5).
A total of 14 patients (3.9%) had true positive blood cultures. For these patients, 10/14 (71%) had 1 true positive blood culture, 3/14 (21%) had 2 true positive blood cultures, and 1/14 (7%) had 5 true positive blood cultures. The average number of cultures drawn was 4.9. The clinical characteristic most predictive of a true positive blood culture was the absence of recent antibiotic administration. If the blood culture was ordered on a patient not receiving antibiotics (true positivity rate 7.2%, 16/222), the LR+ was 2.1 (95% CI: 1.6‐2.7). In a patient not receiving antibiotics who was also noted to have fever and leukocytosis (true positivity rate 17.6%, 3/17), the LR+ was 5.6 (95% CI: 1.8‐18.2). Conversely, patients receiving antibiotics were rarely found to have true positive blood cultures (true positivity rate 1.4%, 5/354) with a LR+ of 0.4 (95% CI: 0.2‐0.8).
DISCUSSION
In this prospective study, we determined the diagnostic yield of blood cultures ordered on hospitalized medical patients to be low, with just 3.6% of orders identifying a true BSI. This was coupled with a similar false positive rate of 2.3%. Our study found rates of true positive blood cultures much lower in hospitalized medical patients than in rates previously described when ED and ICU patients were included.[11, 16]
Although ordering blood cultures is a routine clinical behavior when there is concern for an infection, a clinician's ability to subjectively predict who has a BSI only improves the likelihood 2‐fold.[6] Despite the availability of multiple scoring systems to aid the clinicians,[10, 21, 22] our study found that over 50% of cultures were ordered in the setting of fever or leukocytosis, potentially demonstrating a triggered response to an event, rather than a decision based on probabilities. This common clinician instinct to culture if spikes is an ineffective practice if not coupled with additional clinical information. In fact, in 1 retrospective study, there was no association between fever spike and blood culture positivity.[23]
Our study suggests that objective and easily obtainable clinical characteristics may be effective in helping determine the probability of blood cultures revealing a BSI. Although more robust prediction models have value, they often require multiple inputs, limiting their utility to the bedside clinician. Stratifying patients by either antibiotic exposure or working diagnosis may provide the most benefit for the hospitalized medical patient. For those on antibiotics, the yield of true positive blood cultures is so low that they are unlikely to provide clinically useful information. In fact, although nearly two‐thirds of cultures were obtained after antibiotic exposure, only 1 (0.2%) of these patients had a culture that provided additional information regarding a BSI. Bacteremia had already been established for the other 4 patients. These results are similar to a prior study, which concluded that physicians should wait 72 hours from time of preantibiotic cultures before considering additional blood cultures given the lack of additional information provided.[24]
The working diagnosis also drives the probability of a positive blood culture. As has been shown with other studies, blood cultures are unlikely to diagnose a BSI for patients being treated for either cellulitis or pneumonia.[25, 26, 27] In our study, the working diagnosis prompting the most blood cultures was pneumonia, with the false positive rate exceeding the true positive rate, a finding consistent with previous literature. This situation may lead to the addition of unnecessary antibiotics while waiting for a positive culture to be confirmed as a false positive (eg, vancomycin for a preliminary culture showing gram‐positive cocci in clusters).
There are a number of limitations to our study. Physician‐chosen indication may not correlate with the actual clinical picture and/or may not represent the full set of variables involved in the clinical decision to order a blood culture. However, the subjective clinical indication and the objective clinical criteria found in the chart provided similar LRs. Our study did not evaluate the potential harm of not ordering a blood culture. We also did not assess the value of a true negative culture particularly in patients with endovascular infections where additional cultures are often required to document clearance of bacteremia. Lastly, our study applies to patients on a hospitalized medical service and was performed at a VA hospital with a specific population of elderly male patients, which may limit the generalizability of our results.
Despite these limitations, this study benefits from its prospective design, along with the fact that >90% of blood culture orders placed included a corresponding indication. This provides insight into physician clinical reasoning at the time the blood culture was ordered. In addition, our ability to calculate likelihood ratios provides bedside physicians with an easy and powerful way of modifying the probability of BSI prior to ordering blood cultures, aiding them in providing high‐value clinical care while potentially reducing testing overuse.
The acceptability of not obtaining blood cultures may vary by clinical experience and by specialty. Physicians must weigh the low true positive rate against the consequences of missing a BSI. Although not a substitute for clinical judgement, the LRs in this study can provide a framework to aid in clinical decision making. For example, assuming a pretest probability of 3.6% (the rate of true positive for our entire cohort), blood cultures may not be equally as compelling in 2 similar patients with fever. The first is not on antibiotics and also has a leukocytosis. The second is being treated for pneumonia and is already on antibiotics. For the first patient, using a LR+ of 5.6 (for the fever and leukocytosis in the absence of antibiotics) modifies the patient's probability of a true positive blood culture to 17.3%. Blood cultures should be ordered. In contrast, for the second patient, using a LR+ of 0.4 (for the presence of antibiotics) decreases the patient's probability of a true positive blood culture to 1.5%. Armed with these data, the bedside clinician can now decide whether this rate of true positivity warrants blood cultures. For some, this rate will be comfortably low. For others, this rate will not assuage them; only the negative culture will. Our data are not meant to make this decision, but may aid in making it a probability‐based decision.
Disclosures
Presented in part at the Infectious Diseases Society of America Annual Meeting in San Diego, California in 2015. This material is the result of work supported in part with resources and the use of facilities at the VA Boston HCS, West Roxbury, MA. Katherine Linsenmeyer, MD, had full access to all of the data in the study and takes responsibility for the integrity of the data and the accuracy of the data analysis. The authors report no conflicts of interest.
- , . Population‐based epidemiology and microbiology of community‐onset bloodstream infections. Clin Microbiol Rev. 2014;27(4):647–664.
- , , , et al. The clinical significance of positive blood cultures in the 1990s: a prospective comprehensive evaluation of the microbiology, epidemiology, and outcome of bacteremia and fungemia in adults. Clin Infect Dis. 1997;24(4):584–602.
- , , , . The clinical significance of positive blood cultures: a comprehensive analysis of 500 episodes of bacteremia and fungemia in adults. II. Clinical observations, with special reference to factors influencing prognosis. Rev Infect Dis. 1983;5(1):54–70.
- , , , et al. Duration of hypotension before initiation of effective antimicrobial therapy is the critical determinant of survival in human septic shock. Crit Care Med. 2006;34(6):1589–1596.
- , , , et al. Epidemiology of sepsis syndrome in 8 academic medical centers. JAMA. 1997;278(3):234–240.
- , , , . Predicting bacteremia in older patients. J Am Geriatr Soc. 1995;43(3):230–235.
- , , , , , . Febrile inpatients: house officers' use of blood cultures. J Gen Intern Med. 1987;2(5):293–297.
- , , , et al. Executive summary: a guide to utilization of the microbiology laboratory for diagnosis of infectious diseases: 2013 recommendations by the Infectious Diseases Society of America (IDSA) and the American Society for Microbiology (ASM)(a). Clin Infect Dis. 2013;57(4):485–488.
- , , , , . What are covering doctors told about their patients? Analysis of sign‐out among internal medicine house staff. Qual Saf Health Care. 2009;18(4):248–255.
- , , , . Predicting bacteremia in hospitalized patients. A prospectively validated model. Ann Intern Med. 1990;113(7):495–500.
- , . Blood cultures. Ann Intern Med. 1987;106(2):246–253.
- , , , et al. Reducing blood culture contamination by a simple informational intervention. J Clin Microbiol. 2010;48(12):4552–4558.
- , , . Contaminant blood cultures and resource utilization. The true consequences of false‐positive results. JAMA. 1991;265(3):365–369.
- . Blood culture contaminants. J Hosp Infect. 2014;87(1):1–10.
- , , , , , . The natural history of the systemic inflammatory response syndrome (SIRS). A prospective study. JAMA. 1995;273(2):117–123.
- , , , et al. Predicting bacteremia in patients with sepsis syndrome. Academic Medical Center Consortium Sepsis Project Working Group. J Infect Dis. 1997;176(6):1538–1551.
- , . The systemic inflammatory response syndrome as a predictor of bacteraemia and outcome from sepsis. QJM. 1996;89(7):515–522.
- , , , , . Who needs a blood culture? A prospectively derived and validated prediction rule. J Emerg Med. 2008;35(3):255–264.
- , , , , , . Factors associated with positive blood cultures in outpatients with suspected bacteremia. Eur J Clin Microbiol Infect Dis. 2011;30(12):1615–1619.
- , , , et al. Two rules for early prediction of bacteremia: testing in a university and a community hospital. J Gen Intern Med. 1996;11(2):98–103.
- , , , . Does this adult patient with suspected bacteremia require blood cultures? JAMA. 2012;308(5):502–511.
- , , , et al. Clinical prediction rules for bacteremia and in‐hospital death based on clinical data at the time of blood withdrawal for culture: an evaluation of their development and use. J Eval Clin Pract. 2006;12(6):692–703.
- , , , et al. Timing of specimen collection for blood cultures from febrile patients with bacteremia. J Clin Microbiol. 2008;46(4):1381–1385.
- , , , . Usefulness of blood culture for hospitalized patients who are receiving antibiotic therapy. Clin Infect Dis. 2001;32(11):1651–1655.
- , , , , . Clinical utility of blood cultures in adult patients with community‐acquired pneumonia without defined underlying risks. Chest. 1995;108(4):932–936.
- . Blood cultures in community‐acquired pneumonia: are we ready to quit? Chest. 2003;123(4):977–978.
- . Blood cultures for community‐acquired pneumonia: piecing together a mosaic for doing less. Am J Respir Crit Care Med. 2004;169(3):327–328.
Blood cultures are the gold standard test for the diagnosis of bloodstream infections (BSI). Given the high mortality associated with BSI,[1, 2, 3] physicians have a low threshold to obtain blood cultures.[4, 5] Unfortunately, physicians are poor at predicting which hospitalized patients have BSI,[6, 7] and published guidelines do not provide clear indications for the use of blood cultures.[8] As a result, current practice follows a culture if spikes paradigm, whereby inpatient providers often obtain blood cultures in the setting of any fever. This is the most common anticipatory guidance communicated between providers, involving up to 75% of written sign‐out instructions.[9] The result is a low rate of true positive blood cultures (5%10%)[10, 11, 12] with only a slightly lower rate of false positive blood cultures (contaminants).[12, 13, 14] False positive blood cultures often lead to repeat blood cultures, unnecessary antibiotic use, and increased hospital cost and length of stay.[13]
Over the last several years, there has been an increased emphasis on practicing high‐value care by avoiding unnecessary and duplicate testing. In 2012, the American Board of Internal Medicine introduced the Choosing Wisely campaign, with specific initiatives to reduce medical waste and overuse. Given the low yield of blood cultures, guidance on patients in whom blood cultures are most appropriate would be welcome. Studies assessing risk factors for bacteremia have led to the development of multiple stratification systems without overall consensus.[10, 15, 16, 17, 18, 19, 20] Furthermore, much of the current literature on blood culture utilization includes cultures drawn in the emergency department (ED) or intensive care unit setting (ICU).[10, 18, 19, 20] Less is known regarding the rates of positivity and utility for blood cultures drawn on patients hospitalized on an acute care medical ward.
Our study had 3 main objectives: (1) determine the rates of true positive and false positive blood cultures among hospitalized medical patients, (2) determine the ability of physician‐selected indications and patient characteristics to predict BSI, and (3) identify populations in which blood cultures may not be necessary.
PATIENTS AND METHODS
Study Design
We conducted a prospective cohort study of all hospitalized medical patients for whom blood cultures were ordered and received by the microbiology laboratory. This investigation was approved by the Veterans Affairs (VA) Boston Healthcare System internal review board.
Patients and Setting
During a 7‐month period (October 1, 2014April 15, 2015), all blood culture orders were reviewed for indication and result each day (and on Monday for weekend blood cultures) at a large VA teaching hospital (approximately 6200 admissions each year). As part of the electronic medical order, providers selected from among a list of common indications. Options included various clinical signs and diagnoses, and providers could select more than 1 indication. Each blood culture order triggered a phlebotomist to draw 2 separate blood culture sets (each set consisted of 1 aerobic and 1 anaerobic blood culture bottle).
Inclusion criteria included admission to 1 of 5 general medical service teams or 1 of 2 cardiology teams. Given that the study hospital does not have dedicated subspecialty service teams (with the exception of cardiology), all patients with medical diagnoses are cared for on the general medical service.
Predictor and Outcome Variables
Patient characteristics were obtained via chart review. Fever was defined as a single temperature greater than 100.4F within 24 hours prior to a blood culture order. Leukocytosis was defined as a white blood cell count greater than 10,000 within 24 hours of a blood culture order. Patients were considered to have received antibiotics if an order for an antibacterial or antifungal agent was active within 72 hours prior to the blood culture order. Each blood culture order was assigned a working diagnosis that prompted the order. These working diagnoses were identified by chart review as documented under the provider's assessment and plan and were not necessarily the primary diagnosis prompting hospitalization.
Classification of positive blood cultures into true and false positive was determined by consensus among the microbiology and the infectious disease departments after review of clinical and laboratory data, consistent with a previously established practice at the hospital. A true negative culture consisted of any culture that was not a true positive or a false positive. A blood culture order was defined as an electronic entry and included all sets of blood cultures drawn as a result of that order. Consistent with previous literature, a blood culture episode was defined as all blood cultures ordered within a 48‐hour period starting at the time of the first culture.[10] For patients with multiple admissions during the study period, each admission was considered a unique patient.
Statistical Analysis
Rates of true and false positivity of blood cultures were calculated. In addition, positive likelihood ratios (LR+) for true positive blood cultures were calculated using JMP statistical software (SAS Institute, Inc., Cary, NC).
RESULTS
Overall
A total of 576 blood culture orders (467 blood culture episodes) were completed on 363 hospitalized medical patients during the study period. Five hundred forty orders were placed on patients on general medical services and 36 orders on patients on the cardiology services. Four hundred eighty‐seven (85%) orders resulted in 2 sets of cultures being drawn, 87 (15%) resulted in 1 set of cultures, and 2 (0.3%) resulted in 3 sets of cultures. The median time between admission and culture draw was 2 days (range, 072 days), with 57% of cultures drawn during hospital day 0 to 2, 24.5% drawn between hospital day 3 to 7, and 19.4% drawn after hospital day 7. The average age of the patients was 70.4 years, and 94% were men. Additional patient characteristics are shown in Table 1.
| Clinical Characteristic | Total, n = 363 (%) | True Positive Blood Cultures, n = 14 (%) | P Value |
|---|---|---|---|
| |||
| Mean age, y | 70.4 | 73.9 | 0.4 |
| Male sex | 350 (96%) | 14 (100%) | 1 |
| White race | 308 (85%) | 11 (79%) | 0.7 |
| Location prior to admission | |||
| Community | 276 (76%) | 11 (79%) | 1 |
| Hospital | 51 (14%) | 1 (7%) | 0.7 |
| Long‐term care facility | 36 (10%) | 2 (14%) | 0.6 |
| Comorbidities | |||
| Diabetes | 136 (37%) | 5 (36%) | 1 |
| Malignancy | 100 (28%) | 4 (31%) | 1 |
| Alcohol abuse | 89 (25%) | 2 (14%) | 0.5 |
| Cirrhosis | 31 (9%) | 1 (7%) | 1 |
| End‐stage renal disease | 21 (6%) | 1 (7%) | 1 |
| Active drug use* | 16 (4%) | 1 (7%) | 0.5 |
| Catheter | 93 (26%) | 3 (21%) | 0.8 |
| Recent hospitalization | 145 (40%) | 6 (43%) | 1 |
| History of MRSA colonization | 72 (20%) | 5 (36%) | 0.16 |
| Cultures drawn in emergency department | 69 (19%) | 6 (43%) | 0.03 |
The true positive and false positive rates per blood culture order were 3.6% (21/576) and 2.3% (13/576), respectively (Table 2). Similar values were seen per blood cultures episode (3.4% and 2.7%, respectively). The true positive blood culture rates per order and episode were significantly lower than those drawn on emergency room patients during the study period (41/570, 7.2%, P < 0.05).
| Total, n (%) | True Positive, n (%) | False Positive, n (%) | True Negative, n (%) | |
|---|---|---|---|---|
| ||||
| Per patient | 363 | 14 (3.8) | 13 (3.6) | 336 (92.6) |
| Per blood culture episode | 467 | 16 (3.4) | 13 (2.7) | 438 (93.8) |
| Per blood culture order | 576 | 21 (3.6) | 13 (2.3) | 542 (94.1) |
| Rates per blood culture order | ||||
| Physician‐selected indication, n = 530 | ||||
| Fever | 136 (25.6) | 3 (2.2) | 3 (2.2) | 130 (95.6) |
| Fever and additional indication(s) | 118 (22.2) | 5 (4.2) | 3 (2.5) | 110 (93.2) |
| Fever and leukocytosis | 50 (9.4) | 4 (8.0) | 3 (6.0) | 43 (86.0) |
| Leukocytosis | 50 (9.4) | 2 (4.0) | 0 (0) | 48 (96.0) |
| Follow‐up previous positive | 60 (11.3) | 7 (11.7) | 0 (0) | 53 (88.3) |
| Working diagnosis, n = 576 | ||||
| Pneumonia | 101 (17.5) | 0 (0) | 4 (3.9) | 97 (96.0) |
| Bacteremia/endocarditis | 97 (16.8) | 12 (12.3) | 1 (1.0) | 84 (86.6) |
| Urinary tract infection* | 95 (16.4) | 5 (5.3) | 2 (2.1) | 88 (92.6) |
| Other infection | 46 (8.0) | 0 (0) | 0 (0) | 46 (100) |
| Skin and soft‐tissue infection | 39 (6.8) | 1 (2.6) | 0 (0) | 38 (97.4) |
| Neutropenic fever | 28 (4.9) | 0 (0) | 0 (0) | 28 (100) |
| Sepsis | 27 (4.7) | 0 (0) | 0 (0) | 27 (100) |
| Fever | 18 (3.1) | 1 (5.5) | 1 (5.5) | 16 (88.9) |
| Bone and join infection | 15 (2.6) | 1 (6.7) | 0 (0) | 14 (93.3) |
| Postoperative fever | 9 (1.6) | 0 (0) | 0 (0) | 9 (100) |
| Noninfectious diagnosis | 101 (17.5) | 1 (1.0) | 5 (5.0) | 95 (94.1) |
| Antibiotic exposure | ||||
| Yes | 354 (61.5) | 5 (1.4) | 5 (1.4) | 344 (97.1) |
| No | 222 (38.6) | 16 (7.2) | 8 (3.6) | 198 (89.1) |
| Previous documented positive culture via chart review | ||||
| Yes | 155 (26.9) | 9 (5.8) | 2 (1.3) | 144 (92.9) |
| No | 421 (73.1) | 12 (2.9) | 11 (2.6) | 398 (94.5) |
| LR+ (95% CI), True Positive Blood Culture | LR+ (95% CI), False Positive Blood Culture | |
|---|---|---|
| ||
| Physician‐selected indication | ||
| Fever | 0.6 (0.21.7) | 0.9 (0.32.5) |
| Fever and additional indication(s) | 1.1 (0.52.4) | 1.0 (0.42.8) |
| Fever and leukocytosis | 2.2 (0.95.6) | 2.5 (0.97.1) |
| Leukocytosis | 1.1 (0.34.0) | 0.4 (0.05.6) |
| Follow‐up previous positive | 3.4 (1.86.5) | 0.3 (0.04.7) |
| Diagnosis | ||
| Pneumonia | 0.1 (0.01.9) | 1.8 (0.84.1) |
| Bacteremia/endocarditis | 3.7 (2.55.7) | 0.5 (0.13.0) |
| Urinary tract infection | 1.5 (0.73.2) | 0.9 (0.33.4) |
| Noninfectious diagnosis | 0.3 (0.01.8) | 2.3 (1.14.6) |
| Recent antibiotic exposure | ||
| Yes | 0.4 (0.20.8) | 0.6 (0.31.2) |
| No | 2.1 (1.62.7) | 1.6 (1.02.5) |
| No with fever | 2.4 (1.24.9) | 0.8 (0.23.6) |
| No with fever and leukocytosis | 5.6 (1.818.2) | 0.4 (0.12.6) |
| Prior positive cultures | ||
| Yes | 1.6 (1.02.7) | 0.6 (0.22.0) |
For the true positive cultures, gram‐positive organisms were isolated most frequently (14/21, 67%) with Staphylococcus aureus identified in 2/21 (10%) positive cultures and Enterococcus faecalis identified in 7/21 (33%) positive cultures. Gram‐negative organisms were isolated in 6/21 (29%) cultures, and 1/21 (5%) culture grew 2 organisms (Enterococcus faecalis and Nocardia). The majority of false positive cultures isolated 1 or more species of coagulase‐negative Staphylococcus (11/13, 85%).
Predictors of True Bacteremia
The 4 most common working diagnoses prompting a blood culture order were pneumonia, bacteremia/endocarditis, urinary tract infection, and a noninfectious diagnosis (eg, syncope), with each prompting approximately 17% of the total orders (Table 2). Of these, only a primary diagnosis of bacteremia/endocarditis was predictive of a true positive culture, yielding a rate of 12.3% (LR+ 3.7, 95% confidence interval [CI]: 2.5‐5.7). No other diagnosis was predictive of true positivity. A diagnosis of pneumonia yielded no true positive and 4 false positive blood cultures (3.9%), whereas a noninfectious diagnosis yielded only 1 true positive (1.0%) and 5 false positives (5.0%). The positive likelihood ratios for these 2 diagnoses were 0.1 (95% CI: 0.00‐1.9) and 0.3 (95% CI: 0.04‐1.8), respectively.
Indications were selected for 530 of 576 (92%) blood culture orders (Table 2). The most common indication was fever alone (25.6%), followed by fever with an additional indication (22.2%), follow‐up positive blood cultures (11.3%), fever and leukocytosis (9.4%), and leukocytosis alone (9.4%). Only follow‐up positive blood cultures was predictive of a true positive, with a LR+ of 3.4 (95% CI: 1.8‐6.5).
A total of 14 patients (3.9%) had true positive blood cultures. For these patients, 10/14 (71%) had 1 true positive blood culture, 3/14 (21%) had 2 true positive blood cultures, and 1/14 (7%) had 5 true positive blood cultures. The average number of cultures drawn was 4.9. The clinical characteristic most predictive of a true positive blood culture was the absence of recent antibiotic administration. If the blood culture was ordered on a patient not receiving antibiotics (true positivity rate 7.2%, 16/222), the LR+ was 2.1 (95% CI: 1.6‐2.7). In a patient not receiving antibiotics who was also noted to have fever and leukocytosis (true positivity rate 17.6%, 3/17), the LR+ was 5.6 (95% CI: 1.8‐18.2). Conversely, patients receiving antibiotics were rarely found to have true positive blood cultures (true positivity rate 1.4%, 5/354) with a LR+ of 0.4 (95% CI: 0.2‐0.8).
DISCUSSION
In this prospective study, we determined the diagnostic yield of blood cultures ordered on hospitalized medical patients to be low, with just 3.6% of orders identifying a true BSI. This was coupled with a similar false positive rate of 2.3%. Our study found rates of true positive blood cultures much lower in hospitalized medical patients than in rates previously described when ED and ICU patients were included.[11, 16]
Although ordering blood cultures is a routine clinical behavior when there is concern for an infection, a clinician's ability to subjectively predict who has a BSI only improves the likelihood 2‐fold.[6] Despite the availability of multiple scoring systems to aid the clinicians,[10, 21, 22] our study found that over 50% of cultures were ordered in the setting of fever or leukocytosis, potentially demonstrating a triggered response to an event, rather than a decision based on probabilities. This common clinician instinct to culture if spikes is an ineffective practice if not coupled with additional clinical information. In fact, in 1 retrospective study, there was no association between fever spike and blood culture positivity.[23]
Our study suggests that objective and easily obtainable clinical characteristics may be effective in helping determine the probability of blood cultures revealing a BSI. Although more robust prediction models have value, they often require multiple inputs, limiting their utility to the bedside clinician. Stratifying patients by either antibiotic exposure or working diagnosis may provide the most benefit for the hospitalized medical patient. For those on antibiotics, the yield of true positive blood cultures is so low that they are unlikely to provide clinically useful information. In fact, although nearly two‐thirds of cultures were obtained after antibiotic exposure, only 1 (0.2%) of these patients had a culture that provided additional information regarding a BSI. Bacteremia had already been established for the other 4 patients. These results are similar to a prior study, which concluded that physicians should wait 72 hours from time of preantibiotic cultures before considering additional blood cultures given the lack of additional information provided.[24]
The working diagnosis also drives the probability of a positive blood culture. As has been shown with other studies, blood cultures are unlikely to diagnose a BSI for patients being treated for either cellulitis or pneumonia.[25, 26, 27] In our study, the working diagnosis prompting the most blood cultures was pneumonia, with the false positive rate exceeding the true positive rate, a finding consistent with previous literature. This situation may lead to the addition of unnecessary antibiotics while waiting for a positive culture to be confirmed as a false positive (eg, vancomycin for a preliminary culture showing gram‐positive cocci in clusters).
There are a number of limitations to our study. Physician‐chosen indication may not correlate with the actual clinical picture and/or may not represent the full set of variables involved in the clinical decision to order a blood culture. However, the subjective clinical indication and the objective clinical criteria found in the chart provided similar LRs. Our study did not evaluate the potential harm of not ordering a blood culture. We also did not assess the value of a true negative culture particularly in patients with endovascular infections where additional cultures are often required to document clearance of bacteremia. Lastly, our study applies to patients on a hospitalized medical service and was performed at a VA hospital with a specific population of elderly male patients, which may limit the generalizability of our results.
Despite these limitations, this study benefits from its prospective design, along with the fact that >90% of blood culture orders placed included a corresponding indication. This provides insight into physician clinical reasoning at the time the blood culture was ordered. In addition, our ability to calculate likelihood ratios provides bedside physicians with an easy and powerful way of modifying the probability of BSI prior to ordering blood cultures, aiding them in providing high‐value clinical care while potentially reducing testing overuse.
The acceptability of not obtaining blood cultures may vary by clinical experience and by specialty. Physicians must weigh the low true positive rate against the consequences of missing a BSI. Although not a substitute for clinical judgement, the LRs in this study can provide a framework to aid in clinical decision making. For example, assuming a pretest probability of 3.6% (the rate of true positive for our entire cohort), blood cultures may not be equally as compelling in 2 similar patients with fever. The first is not on antibiotics and also has a leukocytosis. The second is being treated for pneumonia and is already on antibiotics. For the first patient, using a LR+ of 5.6 (for the fever and leukocytosis in the absence of antibiotics) modifies the patient's probability of a true positive blood culture to 17.3%. Blood cultures should be ordered. In contrast, for the second patient, using a LR+ of 0.4 (for the presence of antibiotics) decreases the patient's probability of a true positive blood culture to 1.5%. Armed with these data, the bedside clinician can now decide whether this rate of true positivity warrants blood cultures. For some, this rate will be comfortably low. For others, this rate will not assuage them; only the negative culture will. Our data are not meant to make this decision, but may aid in making it a probability‐based decision.
Disclosures
Presented in part at the Infectious Diseases Society of America Annual Meeting in San Diego, California in 2015. This material is the result of work supported in part with resources and the use of facilities at the VA Boston HCS, West Roxbury, MA. Katherine Linsenmeyer, MD, had full access to all of the data in the study and takes responsibility for the integrity of the data and the accuracy of the data analysis. The authors report no conflicts of interest.
- , . Population‐based epidemiology and microbiology of community‐onset bloodstream infections. Clin Microbiol Rev. 2014;27(4):647–664.
- , , , et al. The clinical significance of positive blood cultures in the 1990s: a prospective comprehensive evaluation of the microbiology, epidemiology, and outcome of bacteremia and fungemia in adults. Clin Infect Dis. 1997;24(4):584–602.
- , , , . The clinical significance of positive blood cultures: a comprehensive analysis of 500 episodes of bacteremia and fungemia in adults. II. Clinical observations, with special reference to factors influencing prognosis. Rev Infect Dis. 1983;5(1):54–70.
- , , , et al. Duration of hypotension before initiation of effective antimicrobial therapy is the critical determinant of survival in human septic shock. Crit Care Med. 2006;34(6):1589–1596.
- , , , et al. Epidemiology of sepsis syndrome in 8 academic medical centers. JAMA. 1997;278(3):234–240.
- , , , . Predicting bacteremia in older patients. J Am Geriatr Soc. 1995;43(3):230–235.
- , , , , , . Febrile inpatients: house officers' use of blood cultures. J Gen Intern Med. 1987;2(5):293–297.
- , , , et al. Executive summary: a guide to utilization of the microbiology laboratory for diagnosis of infectious diseases: 2013 recommendations by the Infectious Diseases Society of America (IDSA) and the American Society for Microbiology (ASM)(a). Clin Infect Dis. 2013;57(4):485–488.
- , , , , . What are covering doctors told about their patients? Analysis of sign‐out among internal medicine house staff. Qual Saf Health Care. 2009;18(4):248–255.
- , , , . Predicting bacteremia in hospitalized patients. A prospectively validated model. Ann Intern Med. 1990;113(7):495–500.
- , . Blood cultures. Ann Intern Med. 1987;106(2):246–253.
- , , , et al. Reducing blood culture contamination by a simple informational intervention. J Clin Microbiol. 2010;48(12):4552–4558.
- , , . Contaminant blood cultures and resource utilization. The true consequences of false‐positive results. JAMA. 1991;265(3):365–369.
- . Blood culture contaminants. J Hosp Infect. 2014;87(1):1–10.
- , , , , , . The natural history of the systemic inflammatory response syndrome (SIRS). A prospective study. JAMA. 1995;273(2):117–123.
- , , , et al. Predicting bacteremia in patients with sepsis syndrome. Academic Medical Center Consortium Sepsis Project Working Group. J Infect Dis. 1997;176(6):1538–1551.
- , . The systemic inflammatory response syndrome as a predictor of bacteraemia and outcome from sepsis. QJM. 1996;89(7):515–522.
- , , , , . Who needs a blood culture? A prospectively derived and validated prediction rule. J Emerg Med. 2008;35(3):255–264.
- , , , , , . Factors associated with positive blood cultures in outpatients with suspected bacteremia. Eur J Clin Microbiol Infect Dis. 2011;30(12):1615–1619.
- , , , et al. Two rules for early prediction of bacteremia: testing in a university and a community hospital. J Gen Intern Med. 1996;11(2):98–103.
- , , , . Does this adult patient with suspected bacteremia require blood cultures? JAMA. 2012;308(5):502–511.
- , , , et al. Clinical prediction rules for bacteremia and in‐hospital death based on clinical data at the time of blood withdrawal for culture: an evaluation of their development and use. J Eval Clin Pract. 2006;12(6):692–703.
- , , , et al. Timing of specimen collection for blood cultures from febrile patients with bacteremia. J Clin Microbiol. 2008;46(4):1381–1385.
- , , , . Usefulness of blood culture for hospitalized patients who are receiving antibiotic therapy. Clin Infect Dis. 2001;32(11):1651–1655.
- , , , , . Clinical utility of blood cultures in adult patients with community‐acquired pneumonia without defined underlying risks. Chest. 1995;108(4):932–936.
- . Blood cultures in community‐acquired pneumonia: are we ready to quit? Chest. 2003;123(4):977–978.
- . Blood cultures for community‐acquired pneumonia: piecing together a mosaic for doing less. Am J Respir Crit Care Med. 2004;169(3):327–328.
© 2016 Society of Hospital Medicine
EPLI
No matter how complete your insurance portfolio, there is one policy – one you probably never heard of – that you should definitely consider adding to it.
A few years ago, I spoke with a dermatologist in California who experienced every employer’s nightmare: He fired an incompetent employee who promptly sued him for wrongful termination and accused him of sexual harassment to boot. The charges were completely false, and the employee’s transgressions were well documented, but defending the lawsuit, successfully or not, would have been expensive. So the dermatologist’s lawyer persuaded him to settle it for a significant sum of money.

Disasters like that are becoming more common. Plaintiffs’ attorneys know all too well that most small businesses, including medical practices, are not insured against employees’ legal actions, and usually cannot afford to defend them in court.
Fortunately, there is a relatively inexpensive way to protect yourself: Employment Practices Liability Insurance (EPLI) provides protection against many kinds of employee lawsuits not covered by conventional liability insurance. These include wrongful termination, sexual harassment, discrimination, breach of employment contract, negligent hiring or evaluation, failure to promote, wrongful discipline, mismanagement of benefits, and the ever-popular “emotional distress.”
EPLI would have covered the California dermatologist, had he carried it, against his employee’s charges. In fact, there is a better-than-even chance that the plaintiff’s attorney would have dropped the lawsuit entirely once informed that it would be aggressively defended.
Some liability carriers are beginning to cover some employee-related issues in “umbrella” policies, so check your current insurance coverage first. Then, as with all insurance, you should shop around for the best price, and carefully read the policies on your short list. All EPLI policies cover claims against your practice and its owners and employees, but some cover claims against full-time employees only. Try to obtain the broadest coverage possible so that part-time, temporary, and seasonal employees, and if possible, even applicants for employment and former employees, also are covered.
Look for the most comprehensive policy in terms of coverage. Almost every EPLI policy covers the allegations mentioned above, but some offer a more comprehensive list of covered acts, such as invasion of privacy and defamation of character.
Also be aware of precisely what each policy does not cover. Most contain exclusions for punitive damages and court-imposed fines, as well as for criminal acts, fraud, and other clearly illegal conduct. For example, if it can be proved that you fired an employee because he or she refused to falsify insurance claims, any resulting civil suit against you will not be covered by any type of insurance.
Depending on where you practice, it may be necessary to ask an employment lawyer to evaluate your individual EPLI needs. An underwriter cannot anticipate every eventuality for you, particularly if he or she does not live in your area and is not familiar with employment conditions in your community.
Try to get a clause added that permits you to choose your own defense attorney. Better still, pick a specific attorney or firm that you trust, and have that counsel named in an endorsement to the policy. Otherwise, the insurance carrier will select an attorney from its own panel who may not consider your interests a higher priority than those of the insurer itself.
If you must accept the insurer’s choice of counsel, you should find out whether that attorney is experienced in employment law, which is a very specialized area. And, just as with your malpractice policy, you will want to maintain as much control as possible over the settlement of claims. Ideally, no claim should be settled without your expressed permission.
As with any insurance policy you buy, be sure to choose an established carrier with ample experience in the field and solid financial strength. A low premium is no bargain if the carrier is new to EPLI, or goes broke, or decides to cease covering employment practices liability.
Above all, make sure that you can live with the claims definition and exclusions in the policy you choose, and seek advice if you are unsure what your specific needs are before you sign on the dotted line.
Dr. Eastern practices dermatology and dermatologic surgery in Belleville, N.J. He is the author of numerous articles and textbook chapters, and is a longtime monthly columnist for Dermatology News. Write to him at dermnews@frontlinemedcom.com.
No matter how complete your insurance portfolio, there is one policy – one you probably never heard of – that you should definitely consider adding to it.
A few years ago, I spoke with a dermatologist in California who experienced every employer’s nightmare: He fired an incompetent employee who promptly sued him for wrongful termination and accused him of sexual harassment to boot. The charges were completely false, and the employee’s transgressions were well documented, but defending the lawsuit, successfully or not, would have been expensive. So the dermatologist’s lawyer persuaded him to settle it for a significant sum of money.
Disasters like that are becoming more common. Plaintiffs’ attorneys know all too well that most small businesses, including medical practices, are not insured against employees’ legal actions, and usually cannot afford to defend them in court.
Fortunately, there is a relatively inexpensive way to protect yourself: Employment Practices Liability Insurance (EPLI) provides protection against many kinds of employee lawsuits not covered by conventional liability insurance. These include wrongful termination, sexual harassment, discrimination, breach of employment contract, negligent hiring or evaluation, failure to promote, wrongful discipline, mismanagement of benefits, and the ever-popular “emotional distress.”
EPLI would have covered the California dermatologist, had he carried it, against his employee’s charges. In fact, there is a better-than-even chance that the plaintiff’s attorney would have dropped the lawsuit entirely once informed that it would be aggressively defended.
Some liability carriers are beginning to cover some employee-related issues in “umbrella” policies, so check your current insurance coverage first. Then, as with all insurance, you should shop around for the best price, and carefully read the policies on your short list. All EPLI policies cover claims against your practice and its owners and employees, but some cover claims against full-time employees only. Try to obtain the broadest coverage possible so that part-time, temporary, and seasonal employees, and if possible, even applicants for employment and former employees, also are covered.
Look for the most comprehensive policy in terms of coverage. Almost every EPLI policy covers the allegations mentioned above, but some offer a more comprehensive list of covered acts, such as invasion of privacy and defamation of character.
Also be aware of precisely what each policy does not cover. Most contain exclusions for punitive damages and court-imposed fines, as well as for criminal acts, fraud, and other clearly illegal conduct. For example, if it can be proved that you fired an employee because he or she refused to falsify insurance claims, any resulting civil suit against you will not be covered by any type of insurance.
Depending on where you practice, it may be necessary to ask an employment lawyer to evaluate your individual EPLI needs. An underwriter cannot anticipate every eventuality for you, particularly if he or she does not live in your area and is not familiar with employment conditions in your community.
Try to get a clause added that permits you to choose your own defense attorney. Better still, pick a specific attorney or firm that you trust, and have that counsel named in an endorsement to the policy. Otherwise, the insurance carrier will select an attorney from its own panel who may not consider your interests a higher priority than those of the insurer itself.
If you must accept the insurer’s choice of counsel, you should find out whether that attorney is experienced in employment law, which is a very specialized area. And, just as with your malpractice policy, you will want to maintain as much control as possible over the settlement of claims. Ideally, no claim should be settled without your expressed permission.
As with any insurance policy you buy, be sure to choose an established carrier with ample experience in the field and solid financial strength. A low premium is no bargain if the carrier is new to EPLI, or goes broke, or decides to cease covering employment practices liability.
Above all, make sure that you can live with the claims definition and exclusions in the policy you choose, and seek advice if you are unsure what your specific needs are before you sign on the dotted line.
Dr. Eastern practices dermatology and dermatologic surgery in Belleville, N.J. He is the author of numerous articles and textbook chapters, and is a longtime monthly columnist for Dermatology News. Write to him at dermnews@frontlinemedcom.com.

Nocturnists Offer Tips for Tackling Night Shifts
Nocturnists Daniele Olveczky, MD, MS, of Beth Israel Deaconess Medical Center in Boston, and Eric Martin, MD, of the University of Colorado, provide insight and tips for tackling night shifts and avoiding burnout.
The video associated with this article is no longer available on this site. Please view all of our videos on the MDedge YouTube channel

What Is Your Diagnosis? Mycosis Fungoides
The Diagnosis: Mycosis Fungoides
Physical examination revealed erythematous polycyclic and arcuate plaques with fine overlying scale on the right arm and shoulder (Figure 1). Mild wrinkling and telangiectasias were noted on the skin surrounding the lesions. Laboratory tests showed normal values for antinuclear antibodies, anti–Sjögren syndrome–related antigen A, and anti–Sjögren syndrome–related antigen B.

A skin biopsy of a plaque on the right upper arm showed enlarged pleomorphic lymphocytes arranged along the basal layer and in focal collections within the epidermis (Figure 2). Within the dermis were wiry bundles of collagen, a sparse superficial and patchy infiltrate of lymphocytes, and scattered large mononuclear cells (Figure 3). Immunoperoxidase staining revealed large intraepidermal lymphocytes positive for CD4 (Figure 4A) and CD5. Notably, these lymphocytes also stained positive for CD30 (Figure 4B). Staining for CD8, CD1a, CD56, and anaplastic lymphoma kinase was negative, with aberrant loss of CD3. The morphology and pattern of immunoreactivity supported the diagnosis of mycosis fungoides (MF).
Mycosis fungoides is the most common form of cutaneous T-cell lymphoma.1 Its progression is classified in 3 stages: (1) early (patch) stage, (2) plaque stage, and (3) tumor stage. Conclusive diagnosis of early stage MF often is difficult due to its clinical features that are similar to more common benign dermatoses (eg, atopic dermatitis, psoriasis, lichen planus), leading to shortcomings in determining prognosis and selecting an appropriate treatment regimen. With this diagnositic difficulty in mind, guidelines have been created to aid in the diagnosis of early stage MF.2
Clinical features consistent with early stage MF include multiple erythematous, well-demarcated lesions with varying shapes that typically are greater than 5 cm in diameter.2 Lesions usually are flat or thinly elevated and may exhibit slight scaling. As was noted in our patient, poikiloderma of the surrounding skin is fairly specific for early stage MF, as it is not a feature associated with common clinical mimics of MF (eg, atopic dermatitis, psoriasis, lichen planus). The distribution of skin lesions in non–sun-exposed areas is common. The eruption is persistent, though it may wax and wane in severity.2
 |  | |
|
|
Histopathologic examination is necessary to confirm a diagnosis of MF. Typically, early stage MF is marked by enlarged T lymphocytes within the epidermis as well as the papillary and superficial reticular dermis. Cerebriform nuclei are a key finding in the diagnosis of MF. Lymphocytes frequently are arranged linearly along the basal layer of the epidermis. Within the epidermis, clusters of atypical lymphocytes (Pautrier microabscesses) without spongiosis are uncommon but are a characteristic finding of MF if present.1 Papillary dermal fibrosis also may be evident.2
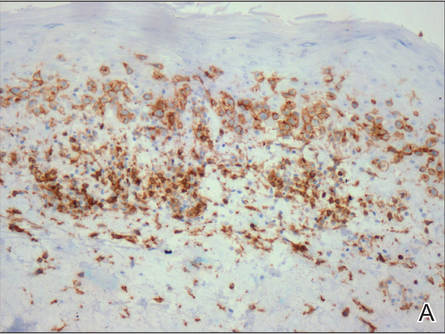 | 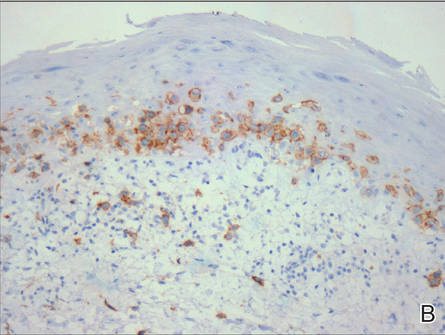 | |
Figure 4. Large intraepidermal lymphocytes were highlighted on CD4 (A) and CD30 immunostaining (B)(original magnification ×200 and ×200). | ||
Immunostaining typically reveals positivity for CD3 and CD4, as well as for lymphocyte antigens CD2 and CD5.1 CD30 positivity in early stage MF rarely has been reported in the literature.3,4 Such cases appear histologically similarly to CD30‒negative cases in other respects. One study showed that the presence of CD30-positive lymphocytes does not alter the clinical course of MF.3 Another study found that, while epidermal CD30-postive lymphocytes had no prognostic relevance, an increased percentage of dermal CD30-positive cells was linked to a higher stage at diagnosis and worse overall prognosis.5 Pathogenesis underlying CD30 positivity in early MF is unknown. It is important to note that CD30-positive cells commonly are seen in lymphomatoid papulosis and anaplastic large cell lymphoma, as well as a variety of nonneoplastic conditions.3,6,7
- Smoller BR. Mycosis fungoides: what do/do not we know? J Cutan Pathol. 2008;35(suppl 2):35-39.
- Pimpinelli N, Olsen EA, Santucci M, et al. Defining early mycosis fungoides. J Am Acad Dermatol. 2005;53:1053-1063.
- Wu H, Telang GH, Lessin SR, et al. Mycosis fungoides with CD30-positive cells in the epidermis. Am J Dermatopathol. 2000;22:212-216.
- Ohtani T, Kikuchi K, Koizumi H, et al. A case of CD30+ large-cell transformation in a patient with unilesional patch-stage mycosis fungoides. Int J Dermatol. 2009;48:623-626.
- Edinger JT, Clark BZ, Pucevich BE, et al. CD30 expression and proliferative fraction in nontransformed mycosis fungoides. Am J Surg Pathol. 2009;33:1860-1868.
- Resnik KS, Kutzner H. Of lymphocytes and cutaneous epithelium: keratoacanthomatous hyperplasia in CD30+ lymphoproliferative disorders and CD30+ cells associated with keratoacanthoma. Am J Dermatopathol. 2010;32:314-315.
- Kempf W. CD30+ lymphoproliferative disorders: histopathology, differential diagnosis, new variants, and simulators. J Cutan Pathol. 2006;33(suppl 1):58-70.
The Diagnosis: Mycosis Fungoides
Physical examination revealed erythematous polycyclic and arcuate plaques with fine overlying scale on the right arm and shoulder (Figure 1). Mild wrinkling and telangiectasias were noted on the skin surrounding the lesions. Laboratory tests showed normal values for antinuclear antibodies, anti–Sjögren syndrome–related antigen A, and anti–Sjögren syndrome–related antigen B.
A skin biopsy of a plaque on the right upper arm showed enlarged pleomorphic lymphocytes arranged along the basal layer and in focal collections within the epidermis (Figure 2). Within the dermis were wiry bundles of collagen, a sparse superficial and patchy infiltrate of lymphocytes, and scattered large mononuclear cells (Figure 3). Immunoperoxidase staining revealed large intraepidermal lymphocytes positive for CD4 (Figure 4A) and CD5. Notably, these lymphocytes also stained positive for CD30 (Figure 4B). Staining for CD8, CD1a, CD56, and anaplastic lymphoma kinase was negative, with aberrant loss of CD3. The morphology and pattern of immunoreactivity supported the diagnosis of mycosis fungoides (MF).
Mycosis fungoides is the most common form of cutaneous T-cell lymphoma.1 Its progression is classified in 3 stages: (1) early (patch) stage, (2) plaque stage, and (3) tumor stage. Conclusive diagnosis of early stage MF often is difficult due to its clinical features that are similar to more common benign dermatoses (eg, atopic dermatitis, psoriasis, lichen planus), leading to shortcomings in determining prognosis and selecting an appropriate treatment regimen. With this diagnositic difficulty in mind, guidelines have been created to aid in the diagnosis of early stage MF.2
Clinical features consistent with early stage MF include multiple erythematous, well-demarcated lesions with varying shapes that typically are greater than 5 cm in diameter.2 Lesions usually are flat or thinly elevated and may exhibit slight scaling. As was noted in our patient, poikiloderma of the surrounding skin is fairly specific for early stage MF, as it is not a feature associated with common clinical mimics of MF (eg, atopic dermatitis, psoriasis, lichen planus). The distribution of skin lesions in non–sun-exposed areas is common. The eruption is persistent, though it may wax and wane in severity.2
| | |
|
|
Histopathologic examination is necessary to confirm a diagnosis of MF. Typically, early stage MF is marked by enlarged T lymphocytes within the epidermis as well as the papillary and superficial reticular dermis. Cerebriform nuclei are a key finding in the diagnosis of MF. Lymphocytes frequently are arranged linearly along the basal layer of the epidermis. Within the epidermis, clusters of atypical lymphocytes (Pautrier microabscesses) without spongiosis are uncommon but are a characteristic finding of MF if present.1 Papillary dermal fibrosis also may be evident.2
| | |
Figure 4. Large intraepidermal lymphocytes were highlighted on CD4 (A) and CD30 immunostaining (B)(original magnification ×200 and ×200). | ||
Immunostaining typically reveals positivity for CD3 and CD4, as well as for lymphocyte antigens CD2 and CD5.1 CD30 positivity in early stage MF rarely has been reported in the literature.3,4 Such cases appear histologically similarly to CD30‒negative cases in other respects. One study showed that the presence of CD30-positive lymphocytes does not alter the clinical course of MF.3 Another study found that, while epidermal CD30-postive lymphocytes had no prognostic relevance, an increased percentage of dermal CD30-positive cells was linked to a higher stage at diagnosis and worse overall prognosis.5 Pathogenesis underlying CD30 positivity in early MF is unknown. It is important to note that CD30-positive cells commonly are seen in lymphomatoid papulosis and anaplastic large cell lymphoma, as well as a variety of nonneoplastic conditions.3,6,7
- Smoller BR. Mycosis fungoides: what do/do not we know? J Cutan Pathol. 2008;35(suppl 2):35-39.
- Pimpinelli N, Olsen EA, Santucci M, et al. Defining early mycosis fungoides. J Am Acad Dermatol. 2005;53:1053-1063.
- Wu H, Telang GH, Lessin SR, et al. Mycosis fungoides with CD30-positive cells in the epidermis. Am J Dermatopathol. 2000;22:212-216.
- Ohtani T, Kikuchi K, Koizumi H, et al. A case of CD30+ large-cell transformation in a patient with unilesional patch-stage mycosis fungoides. Int J Dermatol. 2009;48:623-626.
- Edinger JT, Clark BZ, Pucevich BE, et al. CD30 expression and proliferative fraction in nontransformed mycosis fungoides. Am J Surg Pathol. 2009;33:1860-1868.
- Resnik KS, Kutzner H. Of lymphocytes and cutaneous epithelium: keratoacanthomatous hyperplasia in CD30+ lymphoproliferative disorders and CD30+ cells associated with keratoacanthoma. Am J Dermatopathol. 2010;32:314-315.
- Kempf W. CD30+ lymphoproliferative disorders: histopathology, differential diagnosis, new variants, and simulators. J Cutan Pathol. 2006;33(suppl 1):58-70.
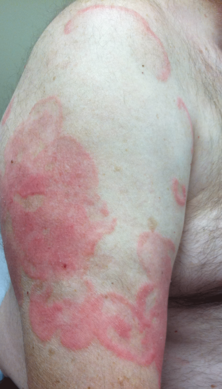
An otherwise healthy 62-year-old man presented for evaluation of multiple scaly erythematous plaques on the right upper arm and shoulder of 10 years’ duration. The patient reported a burning sensation but no exacerbation of the lesions upon sun exposure. He previously had been treated for a presumed clinical diagnosis of erythema annulare centrifugum but experienced only modest improvement with topical corticosteroids and tacrolimus ointment 0.1%. Previous trials of systemic antifungals also yielded minimal benefit.

Capital misadventures
A few years ago I wrote a column about what promised to be an exciting development in blood testing technology. Using the money her parents had set aside for her education, a young woman dropped out of Stanford University at age 19 and started a company that she claimed would be able to offer hundreds of lab tests on just a few drops of blood. Results would be available in just minutes instead of hours or days. At the time I wrote the column, the company had just landed a contract with a large drug store chain with an arrangement that would eventually allow nearly every resident of the United States to be within a few miles of a site that would offer rapid response blood tests with nothing more than a finger prick.
It seemed a little hard to believe, but the prospect of pediatricians being able to make a diagnosis without running the risk of exsanguinating our smallest patients sounded appealing. On the other hand, I worried that a quick and easy technology might encourage some physicians to use a shotgun approach to diagnosing illness rather than a more rational and cost-effective process based on the traditional skills of history taking and physical examination. Some patients who foolishly wanted to know “everything” about themselves might be tempted to ask their physicians to order the whole smorgasbord of tests. “Hey, it’s only a few drops of blood.”
Turns out there were enough people with more money than reservations and the company quickly attracted hundreds of millions of dollars in venture capital. The company, now calling itself Theranos, has been valued at nine billion dollars. But, recently this startup star has encountered some serious bumps in the road to a full-scale launch (“Hot Startup Theranos Has Struggled With Its Blood-Test Technology” by John Carreyrou, The Wall Street Journal, updated Oct. 16, 2015). The Wall Street Journal reported that despite promises, only a few of the 240 tests offered by the company are currently performed using their proprietary microtechnique. In the days following the Journal article, the Food and Drug Administration warned Theranos that their “nanotainer” is considered a new medical device that must first clear the agency’s time consuming and costly vetting process (“Hot Startup Theranos Dials Back Lab Tests at FDA’s Behest” by John Carreyrou, The Wall Street Journal, updated Oct. 16, 2015).
The venture capitalists who had climbed on the Theranos bandwagon tempted by the just-a-few-drops promise may end up seeing their bank accounts hemorrhage. But I don’t think we should be too critical of their investment decision. It was and may still be good idea that has simply run afoul of the details. However, I recently learned about another new business that I don’t consider to have even started with a good idea, but still has managed to attract enough capital to get itself off the ground (“Should Breast Milk Be Nutritionally Analyzed?” by Laura Johannes, The Wall Street Journal, Dec. 28, 2015).
I’m sure you have seen some new mothers who were concerned that their breast milk was not enough for their babies. But how many of them would pay $150 for a start-up kit and then more than $300 to find out the nutritional content of their breast milk? What if it meant pumping and freezing three samples 2 or 3 days apart and then shipping them in a cooler to a lab? What if you told them that neither you nor anyone else could reliably interpret the results because there aren’t any published guidelines for the optimal composition of human breast milk? Even if your practice is packed to the rafters with anxiety-driven, irrational parents, I don’t think you would find many takers. But that doesn’t seem to have bothered the folks who have invested in Happy Vitals, a company in Washington that is offering a service similar to the one I have just described.
You and I might not have invested in a company whose business plan was to offer such a service. But I fear there may be enough health care “providers” practicing without the benefit of an evidence-based education that what I consider a capital misadventure may actually be able to pay back its investors.
Dr. Wilkoff practiced primary care pediatrics in Brunswick, Maine, for nearly 40 years. He has authored several books on behavioral pediatrics including “How to Say No to Your Toddler.”

Subcorneal Hematomas in Excessive Video Game Play
Case Report
A 19-year-old man was admitted to our hospital to begin treatment for acute myeloid leukemia that had been diagnosed 2 days prior. Three days after completing a 10-day regimen of induction chemotherapy, he developed bilateral, well-demarcated erythematous patches on the palmar surfaces of the proximal phalanges of the third, fourth, and fifth fingers (Figure 1) and 2 patches on the right palm. The patient was referred to dermatology for evaluation. He recalled no trauma to these sites although he reported pushing his intravenous pole with the right hand when walking. Of note, he had become neutropenic and thrombocytopenic following chemotherapy

On physical examination, the patches measured 1- to 1.5-cm in diameter and were mildly tender to palpation. The 2 patches on the right palm were much smaller than those on the fingers but were otherwise similar in appearance.
A punch biopsy of the erythematous lesion on the left third digit was performed. Histologic examination revealed extensive epidermal denudation associated with vascular proliferation and congestion as well as hemorrhage and a sparse lymphocytic infiltrate (Figures 2–4). There was no evidence of a leukemic infiltrate, and stains for fungal elements and bacteria were negative. Eccrine ducts appeared normal with no evidence of necrosis or metaplasia. These findings were suggestive of a frictional etiology.

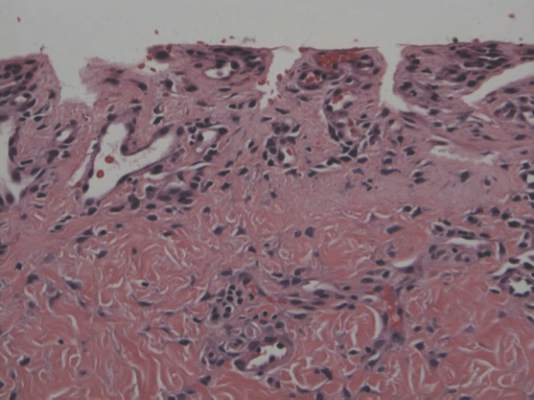

Due to the distribution of the skin lesions on the hands, it was suspected that the source of friction was a video game controller. Although the patient denied playing video games since his admission to the hospital, he reported heavy video game use during the weeks prior to admission. We postulated that the thrombocytopenia the patient developed following chemotherapy along with prior friction injury sustained from heavy video game play led to traumatic subcorneal hemorrhage on the hands at the points of contact with the video game controller (Figure 5). The subcorneal hematomas resolved completely over the next 2 months during which the patient abstained from video game play.

This case demonstrates the importance of obtaining a detailed patient history, as our patient’s history of video game play prior to hospitalization proved to be of major diagnostic importance. Although the location, distribution, and well-demarcated nature of the patient’s lesions suggested an external source of trauma and biopsy definitively ruled out leukemia cutis, Sweet syndrome, and eccrine hidradenitis,1 the final diagnosis of traumatic subcorneal hematomas was only possible with specific knowledge of the patient’s video game controller use.
Comment
History of video game play has been key to the diagnosis of a variety of cutaneous lesions documented in the medical literature. Robertson et al2 attributed a similar case of traumatic subcorneal hematomas of the hands in an otherwise healthy 16-year-old boy to excessive use of a video game controller. Similarly, Kasraee et al3 attributed a case of idiopathic eccrine hidradenitis in an otherwise healthy 12-year-old girl to excessive video game use. In both of these reported cases, bilateral skin lesions on the palms of the hands appeared acutely in a pattern consistent with the points of contact of a video game controller. Excessive video game play has also been associated with unilateral dermatologic lesions on the hands, such as knuckle pads,4 onycholysis,5 friction blisters,6 pressure ulcers,7 and hemorrhagic lesions.5,6,8
Video game–related pathologies are not limited to the skin and have been implicated in a variety of clinical presentations. In 1987, Osterman et al9 published an early account of repetitive strain injury (RSI) related to video game use in which the investigators reported 2 cases of video game–related volar flexor tenosynovitis (or trigger finger), which they termed “joystick digit.” Since that time, video game play has greatly evolved along with the types and nature of RSI cases reported in the medical literature. In 1990, Brasington10 described acute tendinopathy of the extensor pollicis longus tendon caused by excessive video game play, which was termed “Nintendinitis.” This term has since been used in reference to any video game–related RSI and reports have increased over time, likely due to the proliferation of an increasing array of video game systems.5,11-16 In recent years, a number of traumatic injuries including fractures, joint dislocations, head injuries, hemothorax, and lacerations have been attributed to interactive gaming systems.6,11,17-20 In rare cases, video game play also has been associated with enuresis,21 encopresis,22 and epilepsy.23
According to a 2011 report from the Entertainment Software Association, women over the age of 18 years now represent a greater proportion of the video game–playing population than boys aged 17 years and younger.24 This same report also noted that the average video game player is 35 years old; 44% of all players are female; and 27% of Americans over the age of 50 years play video games. This shifting demographic data, including the fact that 80% of American households reportedly play video games, reveals the expanding depth and breadth of the market.24 However, the pediatric population is still a high-volume player demographic. Average time per session peaks between 10 to 12 years of age and then falls through the teenage and adults years.24 Hence, the pediatric population is at high risk for clinical pathology because of the increased repetitive movements associated with video game play. Overall, cognizance of the popularity of video games and related pathologies can be an asset for dermatologists who evaluate pediatric patients.
1. Bolognia J, Jorizzo J, Rapini R, eds. Dermatology. 2nd ed. Edinburgh, Scotland: Elsevier Health Sciences UK; 2007.
2. Robertson SJ, Leonard J, Chamberlain AJ. PlayStation purpura. Australas J Dermatol. 2010;51:220-222.
3. Kasraee B, Masouyé I, Piguet V. PlayStation palmar hidradenitis. Br J Dermatol. 2009;160:892-894.
4. Rushing ME, Sheehan DJ, Davis LS. Video game induced knuckle pad. Pediatr Dermatol. 2006;23:455-457.
5. Bakos RM, Bakos L. Use of dermoscopy to visualize punctate hemorrhages and onycholysis in “playstation thumb.” Arch Dermatol. 2006;142:1664-1665.
6. Wood DJ. The “How!” sign—a central palmar blister induced by overplaying on a Nintendo console. Arch Dis Child. 2001;84:288.
7. Koh TH. Ulcerative “nintendinitis”: a new kind of repetitive strain injury. Med J Aust. 2000;173:671.
8. Bernabeu-Wittel J, Domínguez-Cruz J, Zulueta T, et al. Hemorrhagic parallel-ridge pattern on dermoscopy in “Playstation fingertip.” J Am Acad Dermatol. 2011;65:238-239.
9. Osterman AL, Weinberg P, Miller G. Joystick digit. JAMA. 1987;257:782.
10. Brasington R. Nintendinitis. N Engl J Med. 1990;322:1473-1474.
11. Sparks DA, Coughlin LM, Chase DM. Did too much Wii cause your patient’s injury? J Fam Pract. 2011;60:404-409.
12. Bright DA, Bringhurst DC. Nintendo elbow. West J Med. 1992;156:667-668.
13. Vaidya HJ. Playstation thumb. Lancet. 2004;363:1080.
14. Bonis J. Acute Wiiitis. N Engl J Med. 2007;356:2431-2432.
15. Boehm KM, Pugh A. A new variant of Wiiitis [published online ahead of print June 13, 2008]. J Emerg Med. 2009;36:80.
16. Beddy P, Dunne R, de Blacam C. Achilles wiiitis. AJR Am J Roentgenol. 2009;192:W79.
17. Eley KA. A Wii fracture. N Engl J Med. 2010;362:473-474.
18. Wells JJ. An 8-year-old girl presented to the ER after accidentally being hit by a Wii remote control swung by her brother. J Trauma. 2008;65:1203.
19. Fysh T, Thompson JF. A Wii problem. J R Soc Med. 2009;102:502.
20. George AJ. Musculo-ske Wii tal medicine. Injury. 2012;43:390-391.
21. Schink JC. Nintendo enuresis. Am J Dis Child. 1991;145:1094.
22. Corkery JC. Nintendo power. Am J Dis Child. 1990;144:959.
23. Hart EJ. Nintendo epilepsy. N Engl J Med. 1990;322:1473.
24. Entertainment Software Association. 2015 sales, demographic, and usage data. essential facts about the computer and video game industry. Entertainment Software Association Web site. http://www.theesa.com/wp-content/uploads/2015/04/ESA-Essential-Facts-2015.pdf. Accessed October 16, 2015.
Case Report
A 19-year-old man was admitted to our hospital to begin treatment for acute myeloid leukemia that had been diagnosed 2 days prior. Three days after completing a 10-day regimen of induction chemotherapy, he developed bilateral, well-demarcated erythematous patches on the palmar surfaces of the proximal phalanges of the third, fourth, and fifth fingers (Figure 1) and 2 patches on the right palm. The patient was referred to dermatology for evaluation. He recalled no trauma to these sites although he reported pushing his intravenous pole with the right hand when walking. Of note, he had become neutropenic and thrombocytopenic following chemotherapy
On physical examination, the patches measured 1- to 1.5-cm in diameter and were mildly tender to palpation. The 2 patches on the right palm were much smaller than those on the fingers but were otherwise similar in appearance.
A punch biopsy of the erythematous lesion on the left third digit was performed. Histologic examination revealed extensive epidermal denudation associated with vascular proliferation and congestion as well as hemorrhage and a sparse lymphocytic infiltrate (Figures 2–4). There was no evidence of a leukemic infiltrate, and stains for fungal elements and bacteria were negative. Eccrine ducts appeared normal with no evidence of necrosis or metaplasia. These findings were suggestive of a frictional etiology.
Due to the distribution of the skin lesions on the hands, it was suspected that the source of friction was a video game controller. Although the patient denied playing video games since his admission to the hospital, he reported heavy video game use during the weeks prior to admission. We postulated that the thrombocytopenia the patient developed following chemotherapy along with prior friction injury sustained from heavy video game play led to traumatic subcorneal hemorrhage on the hands at the points of contact with the video game controller (Figure 5). The subcorneal hematomas resolved completely over the next 2 months during which the patient abstained from video game play.
This case demonstrates the importance of obtaining a detailed patient history, as our patient’s history of video game play prior to hospitalization proved to be of major diagnostic importance. Although the location, distribution, and well-demarcated nature of the patient’s lesions suggested an external source of trauma and biopsy definitively ruled out leukemia cutis, Sweet syndrome, and eccrine hidradenitis,1 the final diagnosis of traumatic subcorneal hematomas was only possible with specific knowledge of the patient’s video game controller use.
Comment
History of video game play has been key to the diagnosis of a variety of cutaneous lesions documented in the medical literature. Robertson et al2 attributed a similar case of traumatic subcorneal hematomas of the hands in an otherwise healthy 16-year-old boy to excessive use of a video game controller. Similarly, Kasraee et al3 attributed a case of idiopathic eccrine hidradenitis in an otherwise healthy 12-year-old girl to excessive video game use. In both of these reported cases, bilateral skin lesions on the palms of the hands appeared acutely in a pattern consistent with the points of contact of a video game controller. Excessive video game play has also been associated with unilateral dermatologic lesions on the hands, such as knuckle pads,4 onycholysis,5 friction blisters,6 pressure ulcers,7 and hemorrhagic lesions.5,6,8
Video game–related pathologies are not limited to the skin and have been implicated in a variety of clinical presentations. In 1987, Osterman et al9 published an early account of repetitive strain injury (RSI) related to video game use in which the investigators reported 2 cases of video game–related volar flexor tenosynovitis (or trigger finger), which they termed “joystick digit.” Since that time, video game play has greatly evolved along with the types and nature of RSI cases reported in the medical literature. In 1990, Brasington10 described acute tendinopathy of the extensor pollicis longus tendon caused by excessive video game play, which was termed “Nintendinitis.” This term has since been used in reference to any video game–related RSI and reports have increased over time, likely due to the proliferation of an increasing array of video game systems.5,11-16 In recent years, a number of traumatic injuries including fractures, joint dislocations, head injuries, hemothorax, and lacerations have been attributed to interactive gaming systems.6,11,17-20 In rare cases, video game play also has been associated with enuresis,21 encopresis,22 and epilepsy.23
According to a 2011 report from the Entertainment Software Association, women over the age of 18 years now represent a greater proportion of the video game–playing population than boys aged 17 years and younger.24 This same report also noted that the average video game player is 35 years old; 44% of all players are female; and 27% of Americans over the age of 50 years play video games. This shifting demographic data, including the fact that 80% of American households reportedly play video games, reveals the expanding depth and breadth of the market.24 However, the pediatric population is still a high-volume player demographic. Average time per session peaks between 10 to 12 years of age and then falls through the teenage and adults years.24 Hence, the pediatric population is at high risk for clinical pathology because of the increased repetitive movements associated with video game play. Overall, cognizance of the popularity of video games and related pathologies can be an asset for dermatologists who evaluate pediatric patients.
1. Bolognia J, Jorizzo J, Rapini R, eds. Dermatology. 2nd ed. Edinburgh, Scotland: Elsevier Health Sciences UK; 2007.
2. Robertson SJ, Leonard J, Chamberlain AJ. PlayStation purpura. Australas J Dermatol. 2010;51:220-222.
3. Kasraee B, Masouyé I, Piguet V. PlayStation palmar hidradenitis. Br J Dermatol. 2009;160:892-894.
4. Rushing ME, Sheehan DJ, Davis LS. Video game induced knuckle pad. Pediatr Dermatol. 2006;23:455-457.
5. Bakos RM, Bakos L. Use of dermoscopy to visualize punctate hemorrhages and onycholysis in “playstation thumb.” Arch Dermatol. 2006;142:1664-1665.
6. Wood DJ. The “How!” sign—a central palmar blister induced by overplaying on a Nintendo console. Arch Dis Child. 2001;84:288.
7. Koh TH. Ulcerative “nintendinitis”: a new kind of repetitive strain injury. Med J Aust. 2000;173:671.
8. Bernabeu-Wittel J, Domínguez-Cruz J, Zulueta T, et al. Hemorrhagic parallel-ridge pattern on dermoscopy in “Playstation fingertip.” J Am Acad Dermatol. 2011;65:238-239.
9. Osterman AL, Weinberg P, Miller G. Joystick digit. JAMA. 1987;257:782.
10. Brasington R. Nintendinitis. N Engl J Med. 1990;322:1473-1474.
11. Sparks DA, Coughlin LM, Chase DM. Did too much Wii cause your patient’s injury? J Fam Pract. 2011;60:404-409.
12. Bright DA, Bringhurst DC. Nintendo elbow. West J Med. 1992;156:667-668.
13. Vaidya HJ. Playstation thumb. Lancet. 2004;363:1080.
14. Bonis J. Acute Wiiitis. N Engl J Med. 2007;356:2431-2432.
15. Boehm KM, Pugh A. A new variant of Wiiitis [published online ahead of print June 13, 2008]. J Emerg Med. 2009;36:80.
16. Beddy P, Dunne R, de Blacam C. Achilles wiiitis. AJR Am J Roentgenol. 2009;192:W79.
17. Eley KA. A Wii fracture. N Engl J Med. 2010;362:473-474.
18. Wells JJ. An 8-year-old girl presented to the ER after accidentally being hit by a Wii remote control swung by her brother. J Trauma. 2008;65:1203.
19. Fysh T, Thompson JF. A Wii problem. J R Soc Med. 2009;102:502.
20. George AJ. Musculo-ske Wii tal medicine. Injury. 2012;43:390-391.
21. Schink JC. Nintendo enuresis. Am J Dis Child. 1991;145:1094.
22. Corkery JC. Nintendo power. Am J Dis Child. 1990;144:959.
23. Hart EJ. Nintendo epilepsy. N Engl J Med. 1990;322:1473.
24. Entertainment Software Association. 2015 sales, demographic, and usage data. essential facts about the computer and video game industry. Entertainment Software Association Web site. http://www.theesa.com/wp-content/uploads/2015/04/ESA-Essential-Facts-2015.pdf. Accessed October 16, 2015.
Practice Points
- Video game play has been reported as an etiologic factor in multiple musculoskeletal and dermatologic conditions.
- More than two-thirds of US children aged 2 to 18 years live in a home with a video game system.
- Cognizance of the popularity of video games and related pathologies can be an asset for dermatologists who evaluate pediatric patients.