User login
CMS sepsis measure a challenge to report
Hospitalists can champion sepsis-improvement efforts
In October 2015, the Centers for Medicare & Medicaid Services implemented its first meaningful policy to attempt for addressing sepsis.
The condition – one of the leading causes of mortality among hospitalized patients – afflicts more than a million people each year in the United States, and between 15% and 30% of them die. Sepsis is one of the leading drivers of hospital readmissions, sending more patients back to the hospital than heart failure, pneumonia, and chronic obstructive pulmonary disease.1
However, while providers seem to agree that time to address sepsis is past due, not everyone has embraced the Sepsis CMS Core Measure program, or SEP-1, as the means to best achieve it. This is, in part, because of discrepancies in how sepsis is defined, the burden of reporting, and what some consider to be arbitrary clinical requirements that may not correlate with better patient outcomes.
“Sepsis is indeed a critical public health problem, and it’s appropriate and valuable that Medicare and other policy makers are focusing on sepsis,” said Jeremy Kahn, MD, professor of critical care medicine and health policy and management at the University of Pittsburgh. “This was really the first approach at that … but at 85-pages long, it really is an enormous effort for hospitals to adhere to this measure.”
This is because of the tension between the “intense desire to improve sepsis outcomes” and the “incredible burden” of keeping up with the necessary documentation while also providing quality care, Dr. Kahn said.
In December 2017, Dr. Kahn helped lead a study published in the Journal of Hospital Medicine aimed at trying to understand hospital perceptions of SEP-1. Over the course of 29 interviews with randomly selected hospital quality leaders across the United States, including physicians and nurses, the results came as a surprise.2
“Generally, hospitals were very supportive of the concept, and there was no pushback on the idea that we should be measuring and reporting sepsis quality to CMS,” he said.
However, the research team found that respondents believed the program’s requirements with respect to treatment and documentation were complex and not always linked to patient-centered outcomes. Meeting the SEP-1 bundles consistently required hospitals to dedicate resources that not all may have, especially those in small, rural communities and those serving as urban safety nets.

Some, like emergency medicine physician Annahieta Kalantari, DO (who did not participate in the survey), feel that SEP-1 forces providers to practice “check-box” medicine and undermines successful efforts that don’t necessarily align with the CMS policy.
She arrived at her institution, Aria-Jefferson Health in Philadelphia, before CMS adopted SEP-1; at that time, she took note of the fact that the rate of sepsis mortalities in her hospital was, in her words, not great when compared with that at similar institutions. And then she helped do something about it.
“I thought, ‘We’re a Premier reporting hospital,’ so we did a gap analysis as to why and put together protocols for the hospital to follow with our sepsis patients, including a sepsis alert and a lot of education,” said Dr. Kalantari, associate program director for the emergency medicine residency program at Aria-Jefferson and a former chair of its sepsis management committee. “Before you knew it, mortalities were below benchmark.”
But once SEP-1 began, she said, the hospital was unable to check all of the boxes all of the time.
“We kept track, but we weren’t hitting all the bundles exactly within the periods of time recommended, but our mortalities were still amazing,” she said. “CMS basically picked definitions [for sepsis], and most of us don’t know what they’re basing them on because no one can agree on a definition anyway. Now they’re penalizing hospitals if they don’t hit the check marks in time, but we’d already demonstrated that our mortality and patient care was exceptional.”
She added: “I am extremely dissatisfied, as someone who provides frontline patient care, with how CMS is choosing to measure us.”
Dr. Kalantari wrote a piece in the Western Journal of Emergency Medicine in July 2017 in which she and coauthors outline the issues they take with SEP-1. They lay out the tension among the varied definitions of what sepsis is – and isn’t – and they also illuminate the apparent conflict between what CMS has officially defined and what evidence-based studies conducted since 2001 have suggested.3
In particular, CMS defines severe sepsis as an initial lactate above 2 mmol/L and septic shock as an initial lactate presentation of greater than 4 mmol/L. However, Dr. Kalantari and here coauthors argue in the paper that there is no standard definition of sepsis and that decades of attempts to achieve one have failed to reach consensus among providers. CMS, she said, fails to acknowledge this.
Defining sepsis
In fact, in 2016, another new definition of sepsis emerged by way of a 19-member task-force of experts: The Third International Consensus Definitions for Sepsis and Septic Shock, also called Sepsis-3.4 In March 2017, the Surviving Sepsis Campaign adopted this definition, which defined sepsis as a “life-threatening organ dysfunction caused by a dysregulated host response to infection.”5
“I think the definition has always been a challenging part of sepsis,” said Kencee Graves, MD, a hospitalist at the University of Utah, Salt Lake City. “The definitions came about for research purposes, so … they are not perfectly sensitive nor specific.”
However, Dr. Graves believes SEP-1 is a step in the right direction in that it brings awareness to sepsis and holds providers accountable. Several years ago, she and her colleague Devin Horton, MD, also a hospitalist at the University of Utah, embarked on a massive undertaking to address sepsis in their hospital. It was, at the time, lacking in “sepsis culture,” Dr. Horton said.
“One of the big things that motivated both of us was that we started doing chart review together and – it’s always easier with 20/20 hindsight – we were noticing that residents were missing the signs of sepsis,” Dr. Horton explained. “The clinical criteria would be there, but no one would say the word.” This is important, he said, because sepsis is time critical.
So the pair set out to create a cultural change by sharing data and collecting input from each service and unit, which relied heavily on nursing staff to perpetuate change. They created an early warning system in the medical record and worked with units to achieve flexibility in their criteria.
While the early warning system seemed helpful on the floor, SEP-1 adherence rates changed little in the emergency department. So Dr. Graves and Dr. Horton worked out an ED-specific process map that started at triage and was modeled after myocardial infarction STEMI protocols. From April through December 2016, the ED achieved between 29.5% adherence to the SEP-1 bundles, they said according to CMS abstractor data. After the change, between January and March 2017, the ED saw 52.2% adherence.
Dr. Kalantari would like to see CMS allow hospitals to evaluate and alter their processes more individually, with the required result being lower sepsis mortality. Hospitalists, said Dr. Kahn, are well poised to champion these sepsis improvement efforts.
“Hospitalists are uniquely positioned to lead in this area because they are a visible presence and a link between providers doing multidisciplinary acute care,” he said. “The other thing hospitalists can do is insist on rolling out approaches that are evidence based and not likely to cause harm by leading to over resuscitation, or ensuring patients are receiving central-line insertions only when needed.”
This is currently a moment for hospitals to innovate and provide meaningful feedback to CMS, which, he said, is listening.
“It’s a myth that CMS rolls out policy without listening to the clinical community, but what they want is constructive criticism, not just to hear ‘We’re not ready and we have to push this down the road,’ ” Dr. Kahn said. “The time is now in the era of accountability in health care.”
References
1. Sepsis. National Institute of General Medical Sciences. https://www.nigms.nih.gov/education/pages/factsheet_sepsis.aspx. Updated Sept 2017. Accessed Jan 4, 2018.
2. Barbash I et al. Hospital perceptions of Medicare’s sepsis quality reporting initiative. J Hosp Med. 2017;12;963-8.
3. Kalantari A et al. Sepsis Definitions: The search for gold and what CMS got wrong. West J Emerg Med. 2017 Aug;18(5):951-6.
4. Singer M et. al. The Third International Consensus Definitions for Sepsis and Septic Shock (Sepsis-3). JAMA. 2016 Feb 23;315(8):801-10.
5. Rhodes A et al. Surviving Sepsis Campaign: International Guidelines for Management of Sepsis and Septic Shock: 2016. Intensive Care Med. 2017;43:304.
Hospitalists can champion sepsis-improvement efforts
Hospitalists can champion sepsis-improvement efforts
In October 2015, the Centers for Medicare & Medicaid Services implemented its first meaningful policy to attempt for addressing sepsis.
The condition – one of the leading causes of mortality among hospitalized patients – afflicts more than a million people each year in the United States, and between 15% and 30% of them die. Sepsis is one of the leading drivers of hospital readmissions, sending more patients back to the hospital than heart failure, pneumonia, and chronic obstructive pulmonary disease.1
However, while providers seem to agree that time to address sepsis is past due, not everyone has embraced the Sepsis CMS Core Measure program, or SEP-1, as the means to best achieve it. This is, in part, because of discrepancies in how sepsis is defined, the burden of reporting, and what some consider to be arbitrary clinical requirements that may not correlate with better patient outcomes.
“Sepsis is indeed a critical public health problem, and it’s appropriate and valuable that Medicare and other policy makers are focusing on sepsis,” said Jeremy Kahn, MD, professor of critical care medicine and health policy and management at the University of Pittsburgh. “This was really the first approach at that … but at 85-pages long, it really is an enormous effort for hospitals to adhere to this measure.”
This is because of the tension between the “intense desire to improve sepsis outcomes” and the “incredible burden” of keeping up with the necessary documentation while also providing quality care, Dr. Kahn said.
In December 2017, Dr. Kahn helped lead a study published in the Journal of Hospital Medicine aimed at trying to understand hospital perceptions of SEP-1. Over the course of 29 interviews with randomly selected hospital quality leaders across the United States, including physicians and nurses, the results came as a surprise.2
“Generally, hospitals were very supportive of the concept, and there was no pushback on the idea that we should be measuring and reporting sepsis quality to CMS,” he said.
However, the research team found that respondents believed the program’s requirements with respect to treatment and documentation were complex and not always linked to patient-centered outcomes. Meeting the SEP-1 bundles consistently required hospitals to dedicate resources that not all may have, especially those in small, rural communities and those serving as urban safety nets.
Some, like emergency medicine physician Annahieta Kalantari, DO (who did not participate in the survey), feel that SEP-1 forces providers to practice “check-box” medicine and undermines successful efforts that don’t necessarily align with the CMS policy.
She arrived at her institution, Aria-Jefferson Health in Philadelphia, before CMS adopted SEP-1; at that time, she took note of the fact that the rate of sepsis mortalities in her hospital was, in her words, not great when compared with that at similar institutions. And then she helped do something about it.
“I thought, ‘We’re a Premier reporting hospital,’ so we did a gap analysis as to why and put together protocols for the hospital to follow with our sepsis patients, including a sepsis alert and a lot of education,” said Dr. Kalantari, associate program director for the emergency medicine residency program at Aria-Jefferson and a former chair of its sepsis management committee. “Before you knew it, mortalities were below benchmark.”
But once SEP-1 began, she said, the hospital was unable to check all of the boxes all of the time.
“We kept track, but we weren’t hitting all the bundles exactly within the periods of time recommended, but our mortalities were still amazing,” she said. “CMS basically picked definitions [for sepsis], and most of us don’t know what they’re basing them on because no one can agree on a definition anyway. Now they’re penalizing hospitals if they don’t hit the check marks in time, but we’d already demonstrated that our mortality and patient care was exceptional.”
She added: “I am extremely dissatisfied, as someone who provides frontline patient care, with how CMS is choosing to measure us.”
Dr. Kalantari wrote a piece in the Western Journal of Emergency Medicine in July 2017 in which she and coauthors outline the issues they take with SEP-1. They lay out the tension among the varied definitions of what sepsis is – and isn’t – and they also illuminate the apparent conflict between what CMS has officially defined and what evidence-based studies conducted since 2001 have suggested.3
In particular, CMS defines severe sepsis as an initial lactate above 2 mmol/L and septic shock as an initial lactate presentation of greater than 4 mmol/L. However, Dr. Kalantari and here coauthors argue in the paper that there is no standard definition of sepsis and that decades of attempts to achieve one have failed to reach consensus among providers. CMS, she said, fails to acknowledge this.
Defining sepsis
In fact, in 2016, another new definition of sepsis emerged by way of a 19-member task-force of experts: The Third International Consensus Definitions for Sepsis and Septic Shock, also called Sepsis-3.4 In March 2017, the Surviving Sepsis Campaign adopted this definition, which defined sepsis as a “life-threatening organ dysfunction caused by a dysregulated host response to infection.”5
“I think the definition has always been a challenging part of sepsis,” said Kencee Graves, MD, a hospitalist at the University of Utah, Salt Lake City. “The definitions came about for research purposes, so … they are not perfectly sensitive nor specific.”
However, Dr. Graves believes SEP-1 is a step in the right direction in that it brings awareness to sepsis and holds providers accountable. Several years ago, she and her colleague Devin Horton, MD, also a hospitalist at the University of Utah, embarked on a massive undertaking to address sepsis in their hospital. It was, at the time, lacking in “sepsis culture,” Dr. Horton said.
“One of the big things that motivated both of us was that we started doing chart review together and – it’s always easier with 20/20 hindsight – we were noticing that residents were missing the signs of sepsis,” Dr. Horton explained. “The clinical criteria would be there, but no one would say the word.” This is important, he said, because sepsis is time critical.
So the pair set out to create a cultural change by sharing data and collecting input from each service and unit, which relied heavily on nursing staff to perpetuate change. They created an early warning system in the medical record and worked with units to achieve flexibility in their criteria.
While the early warning system seemed helpful on the floor, SEP-1 adherence rates changed little in the emergency department. So Dr. Graves and Dr. Horton worked out an ED-specific process map that started at triage and was modeled after myocardial infarction STEMI protocols. From April through December 2016, the ED achieved between 29.5% adherence to the SEP-1 bundles, they said according to CMS abstractor data. After the change, between January and March 2017, the ED saw 52.2% adherence.
Dr. Kalantari would like to see CMS allow hospitals to evaluate and alter their processes more individually, with the required result being lower sepsis mortality. Hospitalists, said Dr. Kahn, are well poised to champion these sepsis improvement efforts.
“Hospitalists are uniquely positioned to lead in this area because they are a visible presence and a link between providers doing multidisciplinary acute care,” he said. “The other thing hospitalists can do is insist on rolling out approaches that are evidence based and not likely to cause harm by leading to over resuscitation, or ensuring patients are receiving central-line insertions only when needed.”
This is currently a moment for hospitals to innovate and provide meaningful feedback to CMS, which, he said, is listening.
“It’s a myth that CMS rolls out policy without listening to the clinical community, but what they want is constructive criticism, not just to hear ‘We’re not ready and we have to push this down the road,’ ” Dr. Kahn said. “The time is now in the era of accountability in health care.”
References
1. Sepsis. National Institute of General Medical Sciences. https://www.nigms.nih.gov/education/pages/factsheet_sepsis.aspx. Updated Sept 2017. Accessed Jan 4, 2018.
2. Barbash I et al. Hospital perceptions of Medicare’s sepsis quality reporting initiative. J Hosp Med. 2017;12;963-8.
3. Kalantari A et al. Sepsis Definitions: The search for gold and what CMS got wrong. West J Emerg Med. 2017 Aug;18(5):951-6.
4. Singer M et. al. The Third International Consensus Definitions for Sepsis and Septic Shock (Sepsis-3). JAMA. 2016 Feb 23;315(8):801-10.
5. Rhodes A et al. Surviving Sepsis Campaign: International Guidelines for Management of Sepsis and Septic Shock: 2016. Intensive Care Med. 2017;43:304.
CDC warns of hepatitis A outbreaks in injection drug users
From January 2017 to April 2018, more than 2,500 cases of hepatitis A infection associated with person-to-person transmission were reported to the CDC; of the 1,900 cases where risk factors are known, 68% were related to drug use, homelessness, or both. Various state responses caused a shortage in hepatitis A vaccine during this time, however, because of improvements in controlling outbreaks and an increased vaccine supply, the vaccine has become more available.
Usage of contaminated needles or other injection paraphernalia increase risk of hepatitis A infection, and transience, economic instability, limited health care access, distrust of public officials and public messages, and frequent lack of follow-up contact information in the population who regularly inject drugs make them difficult to reach with preventative services, such as vaccination, use of sterile injection equipment, and case management and contact tracing.
“These challenges make outbreaks among these groups difficult to control,” the CDC said in a statement.
The CDC recommends health departments ensure people who report drug use are vaccinated for hepatitis A, and consider programs to educate at-risk populations, as well as to provide vaccinations in places where at-risk populations may seek treatment. Health care providers should encourage patients who report drug use to be vaccinated for the disease.
For health care professionals, the CDC recommends considering a diagnosis of hepatitis A in any patient with jaundice and clinically compatible symptoms. The agency also recommends one dose of single-antigen hepatitis A vaccine or immune globulin within 2 weeks of exposure for unvaccinated patients who have been exposed to hepatitis A virus.
Find the full Health Advisory on the CDC website.
Malnourished U.S. inpatients often go untreated
WASHINGTON – Hospital staffs often fail to treat .
A retrospective review of more than 150,000 patients admitted during a single year at any center within a large, multicenter U.S. hospital system found that even when patients receive oral nutritional supplementation, there is often a substantial delay to its onset.
The data also suggested potential benefits from treating malnutrition with oral nutritional supplementation (ONS). Patients who received ONS had a 10% relative reduction in their rate of 30-day readmission, compared with malnourished patients who did not receive supplements after adjusting for several baseline demographic and clinical variables, Gerard Mullin, MD, said at the annual Digestive Disease Week. His analysis also showed that every doubling of the time from hospital admission to an order for ONS significantly linked with a 6% rise in hospital length of stay.
The findings “highlight the importance of malnutrition screening on admission, starting a nutrition intervention as soon as malnutrition is confirmed, and treating with appropriate ONS,” said Dr. Mullin, a gastroenterologist at Johns Hopkins Medicine in Baltimore and director of the Celiac Disease Clinic. A standard formulation of Ensure was the ONS routinely used at the Johns Hopkins hospitals
“We’re missing malnutrition,” Dr. Mullin said in an interview. The hospital accreditation standards of the Joint Commission call for assessment of the nutritional status of hospitalized patients within 24 hours of admission (Jt Comm J Qual Patient Saf. 2015 Oct;41[10]:469-73). Screening is “not uniformly done,” and when malnutrition is identified, the finding must usually pass through several layers of a hospital’s medico-bureaucratic process before treatment actually starts, he noted. Plus, there’s often dismissal of the importance of intervention. “It’s important to treat patients with ONS sooner than later,” he said.
Dr. Mullin and his associates studied hospital records for 153,161 people admitted to any of the Baltimore-area hospitals in the Johns Hopkins system during October 2016 through the end of September 2017. The hospital staff routinely assessed nutritional status of patients after admission with a two-question screen based on the Malnutrition Screening Tool (Nutrition. 1999 June;15[6]:458-64): Have you had unplanned weight loss of 10 pounds or more during the past 6 months? Have you had decreased oral intake over the past 5 days? This identified 30,284 (20%) who qualified as possibly malnourished by either criterion. The researchers also retrospectively applied a more detailed screen to the patient records using the criteria set by an international consensus guideline committee in 2010 (J Parenter Enteraal Nutr. 2010 Mar-Apr;34[2]:156-9). This identified 8,713 of the hospitalized patients (6%) as malnourished soon after admission. Despite these numbers a scant 274 patients among these 8,713 (3%) actually received ONS, Dr. Mullin reported. In addition, it took an average of 85 hours from the time of each malnourished patient’s admission to when the ONS order appeared in their record.
Dr. Mullin conceded that both the association his group found between treatment with ONS and a reduced rate of 30-day readmission to any of the hospitals in the Johns Hopkins system, and the association between a delay in the time to the start of ONS and length of stay may have been confounded by factors not accounted for in the adjustments they applied. But he maintained that the links are consistent with results from prior studies, and warrant running prospective, randomized studies to better document the impact of ONS on newly admitted patients identified as malnourished.
“We need more of these types of studies and interventional trials to show that ONS makes a difference,” Dr. Mullin said.
The study was sponsored by Abbott, which markets the oral nutritional supplement Ensure. Dr. Mullin had no additional disclosures.
mzoler@mdedge.com
On Twitter @mitchelzoler
SOURCE: Source: Mullin G et al. DDW 2018 presentation 883.
REPORTING FROM DDW 2018
Key clinical point: Malnourished U.S. hospital inpatients often go untreated.
Major finding: Three percent of patients retrospectively identified as malnourished soon after hospital admission received oral nutritional supplementation.
Study details: Retrospective review of 153,161 patients admitted to a large U.S. hospital network during 2016-2017.
Disclosures: The study was sponsored by Abbott, which markets the oral nutritional supplement Ensure. Dr. Mullin had no additional disclosures.
Source: Mullin G et al. Digestive Disease Week presentation 883.
Education sessions upped COPD patients’ knowledge of their disease
A brief patient-directed education program delivered at the time of hospitalization for an acute exacerbation of chronic obstructive pulmonary disease (AECOPD) improved disease-specific knowledge, according to results of a pilot randomized trial.
Patients who participated in education sessions had a significant improvement in their scores on the Bristol COPD Knowledge Questionnaire (BCKQ), compared with control patients who received no education, study investigators reported in the journal Chest.
“Early education may be a bridge to more active approaches and could provide an important contribution to self-management interventions post-AECOPD,” wrote first author Tania Janaudis-Ferreira, PhD, of the School of Physical and Occupational Therapy, McGill University, Montreal, and her co-authors.
In the study, patients admitted to a community hospital with an AECOPD were randomized to standard care plus brief education or standard care alone. The education consisted of two 30-minute sessions delivered by a physiotherapist, either in the hospital or at home up to 2 weeks after the admission.
Before and after the intervention period, participant knowledge was measured using both the BCKQ and the Lung Information Needs Questionnaire (LINQ).
A total of 31 patients participated, including 15 in the intervention group and 16 in the control group, although 3 patients in the control group did not complete the follow-up testing, investigators said in their report.
The mean change in BCKQ was 8 points for the educational intervention group, and 3.4 for the control group (P = 0.02). That result was in keeping with findings of a previous randomized study noting an 8.3-point change in BCKQ scores for COPD patients who received education in the primary care setting, Dr. Janaudis-Ferreira and co-authors said.
“The change itself is relatively modest, suggesting more frequent sessions might result in greater improvements,” they wrote. For example, they said, an 8-week educational intervention delivered in the context of pulmonary rehabilitation program in one study yielded a mean change of 18.3 points on the BCKQ in the intervention group.
By contrast, the investigators found no significant difference in LINQ score changes between the intervention and control groups (P = .8).
That may indicate that two 30-minute sessions were not sufficient to attend to patients’ learning needs, authors said, though it could also have been an issue with the instrument itself in the setting of this study.
“The majority of the questions in the LINQ ask whether or not a doctor or nurse has explained a specific question to the patient,” authors explained. “Since a physiotherapist delivered the program, had the wording been altered to include physiotherapists or a more general term for healthcare professionals, we may have seen a change in these results.”
Dr. Janaudis-Ferreira and co-authors had no conflicts of interest to disclose. The study was funded by a grant from the Canadian Respiratory Health Professionals, which did not have input in research or manuscript development.
SOURCE: Janaudis-Ferreira T, et al. Chest
FROM CHEST
Key clinical point: Two 30-minute education sessions improved patients’ disease-specific knowledge for an acute exacerbation of COPD.
Major finding: Mean change on the Bristol COPD Knowledge Questionnaire (BCKQ) was 8 points for the educational intervention, and 3.4 for controls.
Study details: A pilot randomized controlled trial of 31 patients admitted to a community hospital.
Disclosures: Authors had no conflicts of interest to disclose. The study was funded by a grant from the Canadian Respiratory Health Professionals, which did not have input in research or manuscript development.
Source: Janaudis-Ferreira T, et al. Chest 2018 Jun 4.
Hospital-acquired conditions drop 8% since 2014, saving 8,000 lives and $3 billion
From 2014 to 2016, the rate of potentially deadly hospital-acquired conditions in the United States dropped by 8% – a change that translated into 350,000 fewer such conditions, 8,000 fewer inpatient deaths, and a national savings of almost $3 billion.
The preliminary new baseline rate for hospital-acquired conditions (HACs) is 90 per 1,000 discharges – down from 98 per 1,000 discharges at the end of 2014, according to the Agency for Healthcare Research and Quality’s new report, “AHRQ National Scorecard on Hospital-Acquired Conditions – Updated Baseline Rates and Preliminary Results 2014-2016.”
The largest improvements occurred in central line–associated bloodstream infections (down 31% from 2014), postoperative venous thromboembolism (21% decline), adverse drug events (15% decline), and pressure ulcers (10% decline). A new category, C. difficile infections, also showed a large decline over 2014 (11%).
These numbers build on earlier successes associated with a national goal set by the Centers for Medicare & Medicaid Services to reduce HACs by 20% by 2019. They should be hailed as proof that attention to prevention strategies can save lives and money, said Seema Verma, CMS administrator.
“Today’s results show that this is a tremendous accomplishment by America’s hospitals in delivering high-quality, affordable healthcare,” Ms. Verma said in a press statement. “CMS is committed to moving the healthcare system to one that improves quality and fosters innovation while reducing administrative burden and lowering costs. This work could not be accomplished without the concerted effort of our many hospital, patient, provider, private, and federal partners – all working together to ensure the best possible care by protecting patients from harm and making care safer.”
The numbers continue to go in the right direction, the report noted. Data reported in late 2016 found a 17% decline in HACs from 2010 to 2014. This equated to 2.1 million HACs, 87,000 fewer deaths, and a savings of $19.9 billion.
Much work remains to be done to achieve the stated 2019 goal, the report noted, but the rewards are great. Reaching the 20% reduction goal would secure a total decrease in the HAC rate from 98 to 78 per 1,000 discharges. This would result in 1.78 million fewer HAC in the years from 2015-2019. That decrease would ultimately save 53,000 lives and $19.1 billion over 5 years.

CDC concerned about multidrug-resistant Shigella
The Centers for Disease Control and Prevention have issued follow-up recommendations for managing and reporting Shigella infections because of concerns about increasing antibiotic resistance and the possibility of treatment failures.
Isolates with no resistance to quinolone antibiotics have ciprofloxacin minimum inhibitory concentration (MIC) values of less than 0.015 mcg/mL. However, the CDC has continued to identify isolates of Shigella that, while still within the susceptible range for the fluoroquinolone antibiotic ciprofloxacin (that is, having MIC values less than 1 mcg/mL), have MIC values for ciprofloxacin of 0.12-1.0 mcg/mL, thus appearing to harbor one or more resistance mechanisms. Furthermore, the CDC has identified an increasing number of isolates that have MIC values for azithromycin exceeding the epidemiologic cutoff value, which suggests some form of acquired resistance.
“CDC is particularly concerned about people who are at high risk for multidrug-resistant Shigella infections and are more likely to require antibiotic treatment, such as men who have sex with men, patients who are homeless, and immunocompromised patients. These patients often have more severe disease, prolonged shedding, and recurrent infections,” the recommendations stated.
More information can be found in the CDC’s Health Alert Network release.
A clinical pathway to standardize use of maintenance IV fluids
Clinical question
Can an evidence-based clinical pathway improve adherence to recent recommendations to use isotonic solutions for maintenance intravenous fluids in hospitalized children?
Background
The traditional teaching regarding composition of maintenance intravenous fluids (IVF) in children has been based on the Holliday-Segar method.1 Since its publication in Pediatrics in 1957, concerns have been raised regarding the risk of iatrogenic hyponatremia caused by giving hypotonic fluids determined by this method,2 especially in patients with an elevated risk of increased antidiuretic hormone (ADH) secretion.3 Multiple recent systematic reviews and meta-analyses have confirmed that isotonic IVF reduces the risk of hyponatremia in hospitalized children.4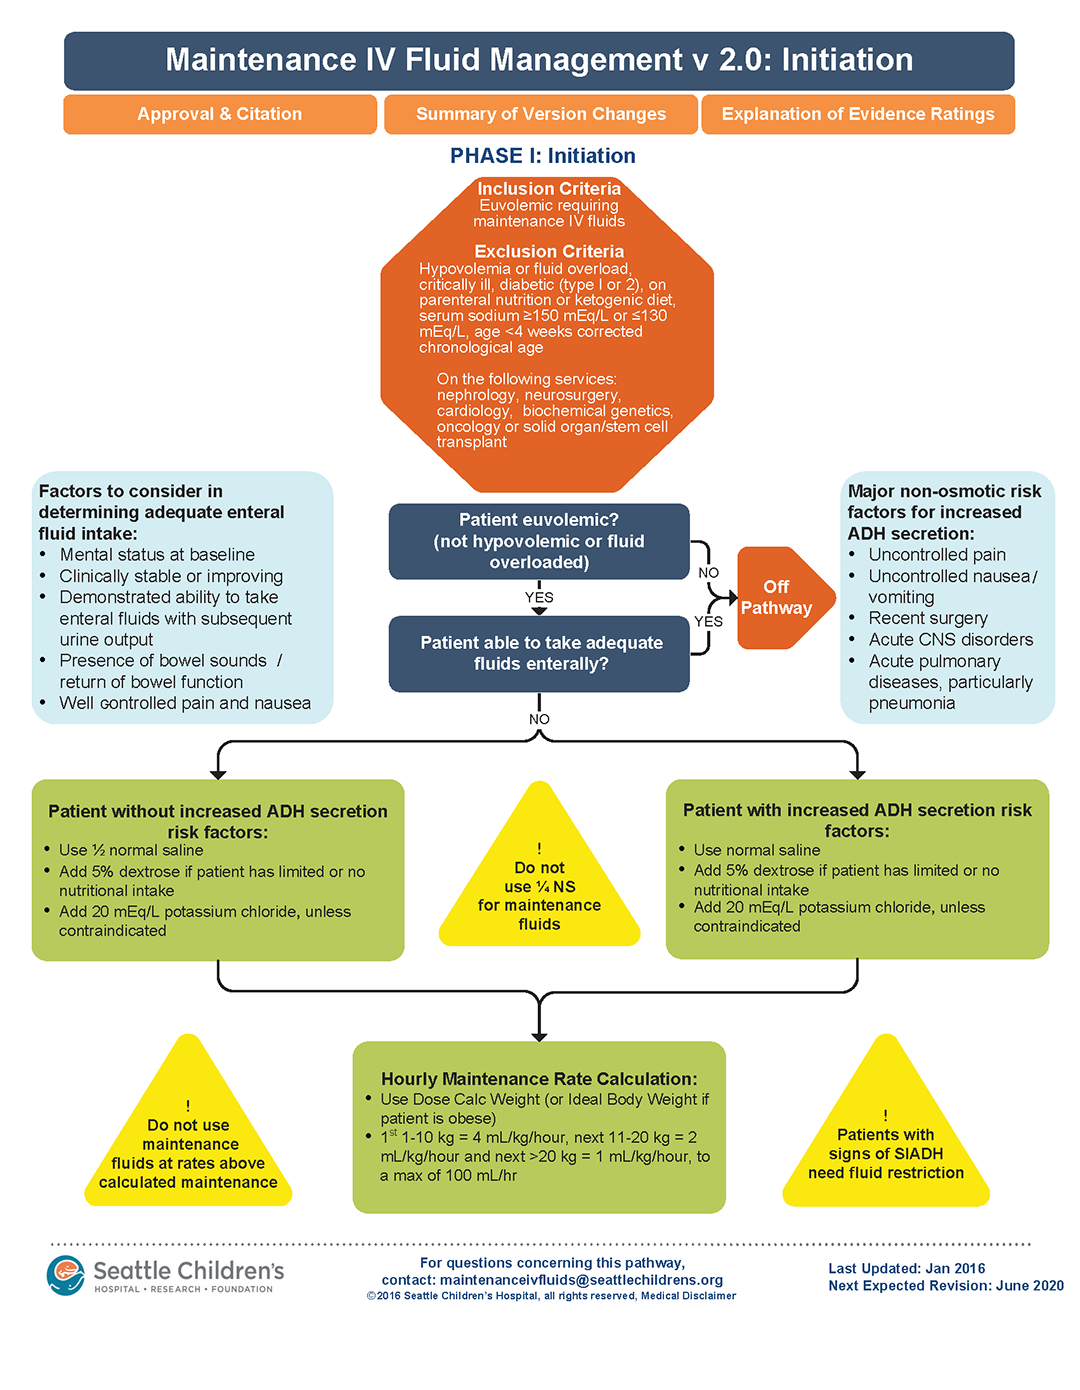
Study design
Interrupted time series analysis before and after pathway implementation.
Setting
370-bed tertiary care free-standing children’s hospital.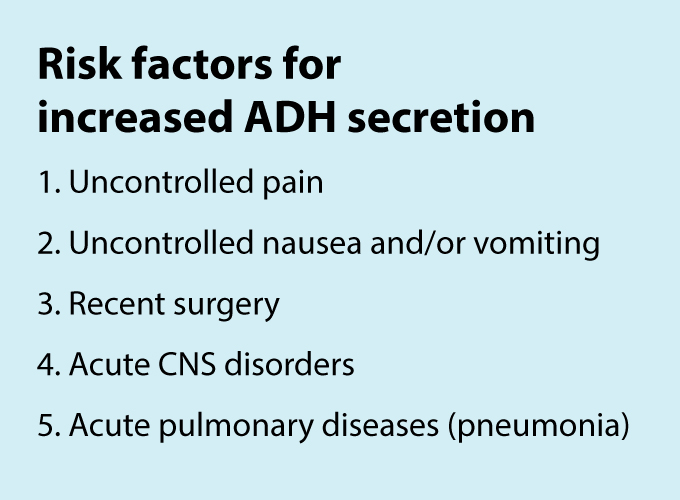
Synopsis
A multidisciplinary team was assembled, comprising physicians and nurses in hospital medicine, general pediatrics, emergency medicine, and nephrology. After a systematic review of the recent literature, a clinical algorithm and web-based training module were developed. Faculty in general pediatrics, hospital medicine, and emergency medicine were required to complete the module, while medical and surgical residents were encouraged but not required to complete the module. A maintenance IVF order set was created and embedded into all order sets previously containing IVF orders and was also available in stand-alone form.
Inclusion criteria (“pathway eligible”) included being euvolemic and requiring IVF. Exclusion criteria included fluid status derangements, critical illness, severe serum sodium abnormalities (serum sodium ≥150 mEq/L or ≤130 mEq/L) use of TPN or ketogenic diet. In the order set, IVF composition was determined based on risk factors for increased ADH secretion. Inclusion of potassium in IVF was also determined by the pathway.
Over the 1-year study period, 11,602 pathway-eligible encounters in 10,287 patients were reviewed. Use of isotonic maintenance IVF increased significantly from 9.3% to 50.6%, while use of hypotonic fluids decreased from 94.2% to 56.6%. Use of potassium-containing IVF increased from 52.9% to 75.3%. Dysnatremia continued to occur due to hypotonic IVF use.
Bottom line
A combined clinical pathway and training module to standardize the composition of IVF is feasible, and results in increased use of isotonic and potassium-containing fluids.
Citation
Rooholamini S, Clifton H, Haaland W, et al. Outcomes of a clinical pathway to standardize use of maintenance intravenous fluids. Hosp Pediatr. 2017 Dec;7(12):703-9.

Dr. Chang is a pediatric hospitalist at Baystate Children’s Hospital in Springfield, Mass., and is the pediatric editor of The Hospitalist.
References
1. Holliday MA et al. The maintenance need for water in parenteral fluid therapy. Pediatrics 1957;19:823-32.
2. Friedman JN et al. Comparison of isotonic and hypotonic intravenous maintenance fluids: a randomized clinical trial. JAMA Pediatr. 2015;169:445-51.
3. Fuchs J et al. Current Issues in Intravenous Fluid Use in Hospitalized Children. Rev Recent Clin Trials. 2017;12:284-9.
4. McNab S et al. Isotonic versus hypotonic solutions for maintenance intravenous fluid administration in children. Cochrane Database. Syst Rev 2014:CD009457.
Clinical question
Can an evidence-based clinical pathway improve adherence to recent recommendations to use isotonic solutions for maintenance intravenous fluids in hospitalized children?
Background
The traditional teaching regarding composition of maintenance intravenous fluids (IVF) in children has been based on the Holliday-Segar method.1 Since its publication in Pediatrics in 1957, concerns have been raised regarding the risk of iatrogenic hyponatremia caused by giving hypotonic fluids determined by this method,2 especially in patients with an elevated risk of increased antidiuretic hormone (ADH) secretion.3 Multiple recent systematic reviews and meta-analyses have confirmed that isotonic IVF reduces the risk of hyponatremia in hospitalized children.4
Study design
Interrupted time series analysis before and after pathway implementation.
Setting
370-bed tertiary care free-standing children’s hospital.
Synopsis
A multidisciplinary team was assembled, comprising physicians and nurses in hospital medicine, general pediatrics, emergency medicine, and nephrology. After a systematic review of the recent literature, a clinical algorithm and web-based training module were developed. Faculty in general pediatrics, hospital medicine, and emergency medicine were required to complete the module, while medical and surgical residents were encouraged but not required to complete the module. A maintenance IVF order set was created and embedded into all order sets previously containing IVF orders and was also available in stand-alone form.
Inclusion criteria (“pathway eligible”) included being euvolemic and requiring IVF. Exclusion criteria included fluid status derangements, critical illness, severe serum sodium abnormalities (serum sodium ≥150 mEq/L or ≤130 mEq/L) use of TPN or ketogenic diet. In the order set, IVF composition was determined based on risk factors for increased ADH secretion. Inclusion of potassium in IVF was also determined by the pathway.
Over the 1-year study period, 11,602 pathway-eligible encounters in 10,287 patients were reviewed. Use of isotonic maintenance IVF increased significantly from 9.3% to 50.6%, while use of hypotonic fluids decreased from 94.2% to 56.6%. Use of potassium-containing IVF increased from 52.9% to 75.3%. Dysnatremia continued to occur due to hypotonic IVF use.
Bottom line
A combined clinical pathway and training module to standardize the composition of IVF is feasible, and results in increased use of isotonic and potassium-containing fluids.
Citation
Rooholamini S, Clifton H, Haaland W, et al. Outcomes of a clinical pathway to standardize use of maintenance intravenous fluids. Hosp Pediatr. 2017 Dec;7(12):703-9.
Dr. Chang is a pediatric hospitalist at Baystate Children’s Hospital in Springfield, Mass., and is the pediatric editor of The Hospitalist.
References
1. Holliday MA et al. The maintenance need for water in parenteral fluid therapy. Pediatrics 1957;19:823-32.
2. Friedman JN et al. Comparison of isotonic and hypotonic intravenous maintenance fluids: a randomized clinical trial. JAMA Pediatr. 2015;169:445-51.
3. Fuchs J et al. Current Issues in Intravenous Fluid Use in Hospitalized Children. Rev Recent Clin Trials. 2017;12:284-9.
4. McNab S et al. Isotonic versus hypotonic solutions for maintenance intravenous fluid administration in children. Cochrane Database. Syst Rev 2014:CD009457.
Trio of blood biomarkers elevated in children with LRTIs
TORONTO – While C-reactive protein, procalcitonin, and proadrenomedullin are associated with development of severe clinical outcomes in children with lower respiratory tract infections, proadrenomedullin is most strongly associated with disease severity, preliminary results from a prospective cohort study showed.
“Despite the fact that pneumonia guidelines call the site of care decision the most important decision in the management of pediatric pneumonia, no validated risk stratification tools exist for pediatric lower respiratory tract infections (LRTI),” lead study author Todd A. Florin, MD, said at the annual Pediatric Academic Societies meeting. “Biomarkers offer an objective means of classifying disease severity and clinical outcomes.”
PCT is a precursor of calcitonin secreted by the thyroid, lung, and intestine in response to bacterial infections. It also has been shown to be associated with adverse outcomes and mortality in adults, with results generally suggesting that it is a stronger predictor of severity than CRP. “There is limited data on the association of CRP or PCT with severe outcomes in children with LRTIs,” Dr. Florin noted. “One recent U.S. study of 532 children did demonstrate an association of elevated PCT with ICU admission, chest drainage, and hospital length of stay in children with [community-acquired pneumonia] CAP.”
ProADM, meanwhile, is a vasodilatory peptide with antimicrobial and anti-inflammatory functions synthesized during severe infections. It has a half-life of several hours and has been shown to be associated with disease severity in adults with LRTI. Recent studies have shown that it has improved prognostication over WBC, CRP, and PCT. “In two small studies of children with pneumonia, proADM levels were significantly elevated in children with complicated pneumonia, compared to those with uncomplicated pneumonia,” Dr. Florin said. “Although all three of these markers demonstrate promise in predicting severe outcomes in adults with LRTIs, very few studies have examined their association with disease severity in pediatric disease. Therefore, the aim of the current analysis was to determine the association between blood biomarkers and disease severity in children who present to the ED with lower respiratory tract infections.”
In a study known as Catalyzing Ambulatory Research in Pneumonia Etiology and Diagnostic Innovations in Emergency Medicine (CARPE DIEM), he and his associates performed a prospective cohort analysis of children with suspected CAP who were admitted to the Cincinnati Children’s Hospital ED between July 2012 and December 2017. They limited the analysis to children aged 3 months to 18 years with signs and symptoms of an LRTI, and all eligible patients were required to have a chest radiograph ordered for suspicion of CAP. They excluded children hospitalized within 14 days prior to the index ED visit, immunodeficient or immunosuppressed children, those with a history of aspiration or aspiration pneumonia, and those who weighed less than 5 kg because of blood drawing maximums. Biomarkers were measured only in children with focal findings on chest x-ray in the ED. The primary outcome was disease severity: mild (defined as discharged home), moderate (defined as hospitalized, but not severe) and severe (defined as having an ICU length of stay of greater than 48 hours, chest drainage, severe sepsis, noninvasive positive pressure ventilation, intubation, vasoactive infusions, or death). Biomarkers were obtained at the time of presentation to the ED, prior to the occurrence of clinical outcomes.
Over a period of 4.5 years, the researchers enrolled 1,142 patients. Of these, 478 had focal findings on chest x-ray and blood obtained. The median age of these 478 children was 4.4 years, 52% were male, and 82% had all three biomarkers performed. Specifically, 456 had CRP and PCT performed, while 358 had proADM performed. “Not every child had every marker performed due to challenges in obtaining sufficient blood for all three biomarkers in some children,” Dr. Florin explained.
Preliminary data that Dr. Florin presented at PAS found that the median CRP, PCT, and proADM did not differ by gender, race, ethnicity, or insurance status. “In addition, there were not significant differences in the distribution of disease severity by biomarker performed, with approximately 27% of patients being classified as mild, 66% as moderate, and 7% as severe,” he said.
The median CRP was 2.4 ng/mL in those with mild disease, 2.5 ng/mL in those with moderate disease, and 6.25 ng/mL in those with severe disease, with the difference between the two subclasses of nonsevere disease and moderate disease and severe disease reaching statistical significance (P = .002). The median PCT was 0.16 ng/mL in those with mild disease, 0.26 ng/mL in those with moderate disease, and 0.49 ng/mL in those with severe disease, with the difference between the two subclasses of nonsevere disease and moderate disease and severe disease reaching statistical significance (P = .047). Meanwhile, the median proADM was 0.53 ng/mL in those with mild disease, 0.59 ng/mL in those with moderate disease, and 0.81 ng/mL in those with severe disease, with the difference between the two subclasses of nonsevere disease and moderate disease and severe disease also reaching statistical significance (P less than .0001).
Next, the researchers performed logistic regression of each biomarker individually and in combination. They found that and had the best ability to discriminate those developing severe vs. nonsevere disease (area under the receiving operating curve of 0.72, vs. 0.67 and 0.60, respectively). When CRP and PCT markers were combined with proADM, they were no longer associated with severe disease, while a strong association with proADM remained significant.
Dr. Florin acknowledged certain limitations of the study, including the fact that requiring collection of blood samples may have resulted in an enrollment bias toward patients receiving phlebotomy or IV line placement in the ED. “In addition, the children in the moderate-severity group are likely more heterogeneous than the other two severity groups,” he said. “Finally, given that this is a single-center study, we had a relatively small number of outcomes for some of the individual severity measures, which may have limited power and precision.”
He concluded his presentation by saying that he is “cautiously optimistic” about the study results. “As is the case in many biomarker studies, I do not anticipate that any single biomarker will be the magic bullet for predicting disease severity in pediatric CAP,” Dr. Florin said. “It will likely be a combination of clinical factors and several biomarkers that will achieve optimal prognostic ability. That said, our results suggest that similar to adult studies, proADM appears to have the strongest association with severe disease, compared with CRP and PCT. Combinations of biomarkers did not perform better than proADM alone. With the advent of rapid point-of-care diagnostics, these markers may have a role in management and site-of-care decisions for children with LRTI.”
The study received funding support from the Gerber Foundation, the National Institute of Allergy and Infectious Diseases, and Cincinnati Children’s Hospital Medical Center. Dr. Florin reported having no financial disclosures.
AT PAS 18
Key clinical point: Blood biomarkers such as C-reactive protein (CRP), procalcitonin (PCT), and proadrenomedullin (proADM) may have a role in management and site-of-care decisions for children with LRTIs.
Major finding: The proADM alone was associated with the largest odds for severe disease (OR 13.1), compared with CRP alone (OR 1.6) and PCT alone (OR 1.4).
Study details: Preliminary results from prospective cohort analysis of 478 children with suspected community-acquired pneumonia who were admitted to the Cincinnati Children’s Hospital ED.
Disclosures: The study received funding support from the Gerber Foundation, the National Institute of Allergy and Infectious Diseases, and Cincinnati Children’s Hospital Medical Center. Dr. Florin reported having no financial disclosures.
Neonatal deaths lower in high-volume hospitals
AUSTIN, TEX. – A first look at the timing of neonatal deaths showed an association with weekend deliveries in one Texas county. However, birth weight and ethnicity attenuated the association, according to a recent study. Higher hospital volumes were associated with lower risk of neonatal deaths.
The retrospective, population-based cohort study, presented during the annual clinical and scientific meeting of the American College of Obstetricians and Gynecologists, used data from birth certificates and infant death certificates in the state of Texas. The investigators, said Elizabeth Restrepo, PhD, chose to examine data from Tarrant County, Tex., which has historically had persistently high infant mortality rates; in 2013, she said, the infant mortality rate in that county was 7.11/1,000 births – the highest in the state for that year.
The first question Dr. Restrepo and her colleagues at Texas Women’s University, Denton, wanted to answer was whether there was an association between the risk of neonatal mortality and the day of the week of the birth. For this and the study’s other research questions, she and her colleagues looked at 2012 data, matching 32,140 birth certificate records with 92 infant death certificates.
The investigators found an independent association between the risk of neonatal death and whether the birth happened on a weekday (Monday at 7:00 a.m. through Friday at 6:59 p.m.), or on a weekend (Friday at 7:00 p.m. through Monday at 6:59 a.m.). However, once birth weight and ethnicity were controlled in the statistical analysis, the association was not statistically significant despite an odds ratio of 1.44 (95% confidence interval, 0.911-2.27; P = .119).
“Births in the 12 hospitals studied appear to have been organized to take place more frequently on the working weekday rather than weekend days,” wrote Dr. Restrepo and her colleagues in the poster accompanying the presentation. Although the study wasn’t designed to answer this particular question, Dr. Restrepo said in discussion during the poster session that planned deliveries, such as inductions and cesarean deliveries, are likely to happen during the week, while the case mix is wider on weekends. Patient characteristics, as well as staffing patterns, may come into play.
The researchers also asked whether birth volume at a given institution increases the odds of neonatal death on weekends. Here, they found a significant inverse relationship between hospital birth volume and neonatal deaths (r = –0.021; P less than .001). With each additional increase of 1% in the weekday birth rate, the odds of neonatal death dropped by approximately 7.4%.
Examining the Tarrant County data further, Dr. Restrepo and her colleagues found that the hospitals with higher birth volumes had a more even distribution of births across the days of the week, with resulting lower concentrations of births during the week (r = –.394; P less than .001).
To classify infant deaths, the investigators included only ICD-10 diagnoses classified as P-codes to capture deaths occurring in the first 28 days after birth, but excluding congenital problems that are incompatible with life or that usually cause early death.
The researchers reported that they had no conflicts of interest; the study was funded by a research enhancement program award from the Texas Women’s University Office of Research and Sponsored Programs.
SOURCE: Restrepo E et al. ACOG 2018, Abstract 22R.
REPORTING FROM ACOG 2018
Key clinical point: Neonatal deaths were lower in hospitals with higher delivery volumes.
Major finding: Higher weekday birth volumes were associated with lower risk of neonatal death (P = .002).
Study details: Retrospective cohort study of 92 neonatal deaths in a single Texas county in 2012.
Disclosures: The study was funded by Texas Women’s University. The authors reported that they had no relevant disclosures.
Source: Restrepo E et al. ACOG 2018, Abstract 22R.
Rethinking preop testing
ORLANDO – Michael Rothberg, MD, a nocturnist who works at Presbyterian Rust Medical Center in Albuquerque, often is torn when asked to routinely perform preoperative tests, such as ECGs, on patients.
On the one hand, Dr. Rothberg knows that for many patients there is almost certainly no benefit to some of the tests. On the other hand, surgeons expect the tests to be performed – so, for the sake of collegiality, patients often have tests ordered that hospitalists suspect are unnecessary.
This was a big part of why Dr. Rothberg decided to come a day early to HM18, held in early April in Orlando, to attend the pre-course “Essentials of Perioperative Medicine and Co-Management for the Hospitalist.” He was looking for expert guidance on which patients need what tests before surgery, and also how to better determine what preoperative tests are a waste of time and money for certain patients, so that he’ll be armed with useful information when he went back to his medical center.
“I can slap something on the surgeon’s desk and say, ‘Here’s why we’re not doing it,’ ” Dr. Rothberg said.
At the HM18 pre-course, experts gave guidance on the benefits of hospitalist involvement in perioperative care and offered points to consider when assessing cardiac and pulmonary risk before surgeries. Hospitalists then broke into groups to brainstorm techniques that could improve their perioperative work.
She noted how surgical safety checklists have been shown to improve morbidity and mortality, as seen with a checklist developed by the World Health Organization and in California, where an enhanced recovery program at 20 hospitals has been successful.
“I think the reason we see changes in each of those … from pre to post when they implement, is because people start to communicate and collaborate,” she said. “I think that’s the secret sauce, and you can take that back home with you.”
Assessing risk

As for preoperative testing, history is replete with examples of tests once considered crucial but that have proven to be unimportant for many patients, including preoperative carotid endarterectomy, preop ECG, preop coronary revasularization, and preop lab work.
“I was always listening for bruits years ago,” Dr. Grant said. “I’ve sort of stopped doing that now. You’ll hear it, you won’t know what to do with it. We used to take care of those things before surgery. We now know that’s not helpful for patients without symptoms.”

Dr. Cohn’s philosophy is to not suggest a delay without firm evidence that it is necessary. “I try not to interfere with surgery unless I feel that there is significant risk,” he said.
In workshop discussions at the HM18 pre-course, hospitalists considered their contributions to preoperative care and ways they might be able to contribute more effectively. Among their ideas were better communication with anesthesiology – regarded as severely lacking by many hospitalists in the session – as well as designating smaller perioperative teams to foster knowledge and greater trust with surgeons.
Aron Mednick, MD, FHM, director of the comanagement service at Tisch Hospital, NYU Langone Medical Center, New York, said his group talked about an “identify, mitigate, propose, and resolve” method – identifying services or conditions with a high rate of preoperative problems, finding data on how to solve them, and proposing ways to get hospitalists involved in the solution.
“We noted that a lot of people experience resistance with getting hospitalists involved in care early,” he said. “So one of the ways to do this is actually to identify problems and start above the surgeon, at the CMO and COO level, and then move down through department chairs and, basically, impose our existence on the care of the patient.”
ORLANDO – Michael Rothberg, MD, a nocturnist who works at Presbyterian Rust Medical Center in Albuquerque, often is torn when asked to routinely perform preoperative tests, such as ECGs, on patients.
On the one hand, Dr. Rothberg knows that for many patients there is almost certainly no benefit to some of the tests. On the other hand, surgeons expect the tests to be performed – so, for the sake of collegiality, patients often have tests ordered that hospitalists suspect are unnecessary.
This was a big part of why Dr. Rothberg decided to come a day early to HM18, held in early April in Orlando, to attend the pre-course “Essentials of Perioperative Medicine and Co-Management for the Hospitalist.” He was looking for expert guidance on which patients need what tests before surgery, and also how to better determine what preoperative tests are a waste of time and money for certain patients, so that he’ll be armed with useful information when he went back to his medical center.
“I can slap something on the surgeon’s desk and say, ‘Here’s why we’re not doing it,’ ” Dr. Rothberg said.
At the HM18 pre-course, experts gave guidance on the benefits of hospitalist involvement in perioperative care and offered points to consider when assessing cardiac and pulmonary risk before surgeries. Hospitalists then broke into groups to brainstorm techniques that could improve their perioperative work.
She noted how surgical safety checklists have been shown to improve morbidity and mortality, as seen with a checklist developed by the World Health Organization and in California, where an enhanced recovery program at 20 hospitals has been successful.
“I think the reason we see changes in each of those … from pre to post when they implement, is because people start to communicate and collaborate,” she said. “I think that’s the secret sauce, and you can take that back home with you.”
Assessing risk
As for preoperative testing, history is replete with examples of tests once considered crucial but that have proven to be unimportant for many patients, including preoperative carotid endarterectomy, preop ECG, preop coronary revasularization, and preop lab work.
“I was always listening for bruits years ago,” Dr. Grant said. “I’ve sort of stopped doing that now. You’ll hear it, you won’t know what to do with it. We used to take care of those things before surgery. We now know that’s not helpful for patients without symptoms.”
Dr. Cohn’s philosophy is to not suggest a delay without firm evidence that it is necessary. “I try not to interfere with surgery unless I feel that there is significant risk,” he said.
In workshop discussions at the HM18 pre-course, hospitalists considered their contributions to preoperative care and ways they might be able to contribute more effectively. Among their ideas were better communication with anesthesiology – regarded as severely lacking by many hospitalists in the session – as well as designating smaller perioperative teams to foster knowledge and greater trust with surgeons.
Aron Mednick, MD, FHM, director of the comanagement service at Tisch Hospital, NYU Langone Medical Center, New York, said his group talked about an “identify, mitigate, propose, and resolve” method – identifying services or conditions with a high rate of preoperative problems, finding data on how to solve them, and proposing ways to get hospitalists involved in the solution.
“We noted that a lot of people experience resistance with getting hospitalists involved in care early,” he said. “So one of the ways to do this is actually to identify problems and start above the surgeon, at the CMO and COO level, and then move down through department chairs and, basically, impose our existence on the care of the patient.”
REPORTING FROM HM18