User login
Heart attacks bring 12 weeks of higher stroke risk
LOS ANGELES – , based on a sample of Medicare beneficiaries.
The period of elevated stroke risk following an MI extends beyond the 30-day window that has traditionally been considered the interval of highest risk, Alexander E. Merkler, MD, said at the International Stroke Conference, sponsored by the American Heart Association.
Beyond 12 weeks after MI discharge, the stroke incidence showed no significant difference compared with people without a recent MI history, said Dr. Merkler, a neurologist at Weill Cornell Medicine in New York.
He calculated these statistically significant elevated risk rates after adjusting for demographic measures, stroke risk factors, and the comorbidities included in the Charlson Comorbidity Index.
These increased stroke rates were independent of periprocedural strokes that might have happened during MI interventions, as the analysis excluded MI patients with a history of a stroke either before or during their MI hospitalization.
To run this analysis, Dr. Merkler and his associates used data collected in a 5% sample of Medicare beneficiaries who were at least 66 years old during 2008-2015. Among these 1.7 million people were 46,182 who were hospitalized for an MI.
Several factors associated with an acute MI likely contribute to an elevated stroke risk, including stasis in the heart and generation of microthrombi, and a possibly systemic proinflammatory state, Dr. Merkler suggested.
Dr. Merkler had no disclosures.
SOURCE: Merkler AE et al., International Stroke Conference abstract 172 (Stroke. 2018 Jan; 49[Suppl 1]:A172).
REPORTING FROM ISC 2018
Key clinical point: A patient’s stroke risk is elevated for 12 weeks following a myocardial infarction.
Major finding: The stroke rate was 2.7-fold, 2.0-fold, and 1.6-fold above background at 4, 8, and 12 weeks after an MI.
Study details: A review of 1.7 million Medicare beneficiaries during 2008-2015.
Disclosures: Dr. Merkler had no disclosures.
Source: Merkler AE et al., International Stroke Conference abstract 172 (Stroke. 2018 Jan;49[Suppl 1]:A172).
CDC: Flu levels highest since pandemic year 2009
according to data from the Centers for Disease Control and Prevention.
That season was dominated by influenza A (H3N2), and the 2017-2018 season seems to be going down that same path. For the week ending Jan. 20, the proportion of outpatient visits for influenza-like illness increased to 6.6%, which is, for the second consecutive week, the highest level reported since October of – you guessed it – 2009, when it hit 7.7%, the CDC said in its weekly flu surveillance report.
The level reported last week, 6.3%, has been revised downward and now stands at an even 6%.
It turns out that 2018 is something of a milestone for the H3N2 virus. The virus first emerged in 1968, so it has reached its 50th anniversary, Dan Jernigan, MD, director of the influenza division at the CDC’s National Center for Immunization and Respiratory Diseases, Atlanta, said on Jan. 26 in a weekly briefing.
H3N2 must not be happy about hitting the big 5-0, however, because the map of influenza-like illness activity looks pretty red and angry. For the week ending Jan. 20, there were 30 states at the highest level of flu activity on the CDC’s 1-10 scale, with another nine in the “high” range at levels 8 and 9.
Dr. Jernigan did suggest that activity may have peaked in some areas of the country, with California among them.
There were seven pediatric deaths reported for the week ending Jan. 20, although six occurred in previous weeks. There have been 37 flu-related deaths among children so far during the 2017-2018 season, the CDC said.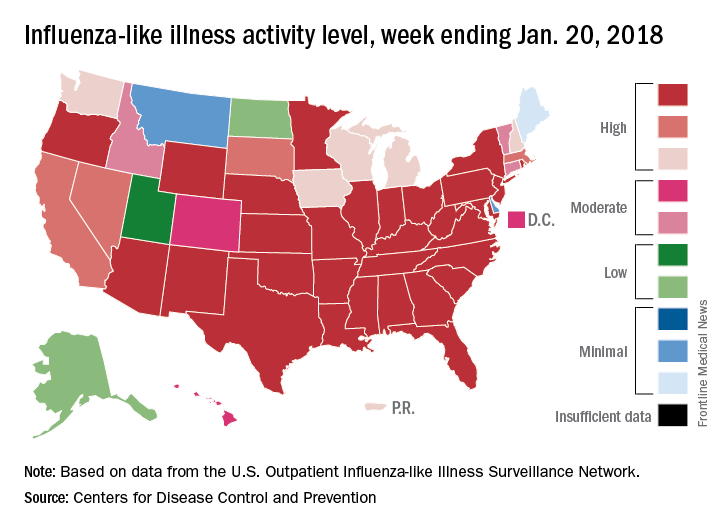
Contrast nephropathy after computed tomography
Clinical question: Do rates of acute kidney injury (AKI), renal replacement therapy (RRT), or mortality differ between adults receiving contrast-enhanced computed tomography (CT) versus those receiving noncontrast CT?
Background: Published estimates regarding the risk of postcontrast complications are highly variable and recent data show that the risk of postcontrast AKI may be lower than previously suggested.
Study design: Systematic review and meta-analysis..
Setting: Noninterventional studies assessing differences in AKI, new RRT, or mortality among adults who received contrast-enhanced CT, compared with those receiving noncontrast CT.
Synopsis: A search among six databases and Google Scholar from inception through 2016 yielded 28 observational studies meeting inclusion criteria that included 107,335 participants. Twenty-six assessed AKI, 13 assessed need for RRT, and 9 assessed all-cause mortality. Compared with noncontrast CT, contrast-enhanced CT was not significantly associated with AKI (odds ratio, 0.94; 95% confidence interval, 0.83-1.07), RRT (OR, 0.83; 95% CI 0.59-1.16), or all-cause mortality (OR, 1.0; 95% CI 0.73-1.36). The overall risk of bias ranged from low to serious among the included studies. Studies were observational in nature, they were conducted in multiple settings (for example, ICU, emergency department), and the baseline characteristics of included patients were highly variable.
Bottom line: This meta-analysis observed no difference in adverse events between patients receiving contrast-enhanced CT versus those receiving noncontrast CT but should be interpreted with caution given the observational nature of the studies and differing characteristics of the included patients and study settings.
Citation: Aycock RD et al. Acute kidney injury after computed tomography: a meta-analysis. Ann Emerg Med. 2017 Aug 12. doi: 10.1016/j.annemergmed.2017.06.041
Dr. Simonetti is a hospitalist at the University of Colorado School of Medicine.
Elderly trauma patients at high risk for post-discharge mortality
LAKE BUENA VISTA, FLA. – Nearly one-quarter of discharge, according to a study presented at the Eastern Association for the Surgery of Trauma Scientific Assembly.
These findings emphasize a need to know more about geriatric patient outcomes, especially as a tide of elderly trauma patients has begun to sweep through trauma centers, according to presenter Ciara Huntington, MD, a surgical resident at the Carolinas Healthcare System, Charlotte, N.C.
Investigators studied 6,285 geriatric patients in the ACS-verified Level 1 trauma registry between 2009 and 2015, and cross-referenced those files with the Social Security Death Index.
Patients were an average of 78.6 years, and the majority were female (57%) and white (85.7%). Average length of stay of was 6.7 days with an average injury severity score of 11, with a median time to death of 225 days.
While 5,780 patients were alive at discharge, 1,519 (24.2%) were dead within 1 year of hospitalization.
In a comparison of geriatric trauma patients against those of similar age in the general population, geriatric patients within the trauma population had a significantly lower life expectancy across all ages.
For trauma patients aged 65-70 years, life expectancy was estimated at 1.52 years, compared with 18.79 years for those in the general population.
Discharge location may have an impact on mortality, according to Dr. Huntington and her colleagues, who found geriatric patients discharged to their homes had a 1-year mortality rate of 13.5%, compared with 22.6% of those discharged to acute inpatient rehab centers, and 53.7% of those sent to skilled nursing facilities.
Another factor may be mechanism of injury, as the 1-year mortality of trauma patients who had fallen (27%) was nearly double the rate of those in motor vehicle crashes (15%).
Falls also were the most common injury, accounting for around 75% of the hospitalizations in the study.
In a question-and-answer session after the presentation, audience members asked about how these findings will help improve palliative care for geriatric trauma patients.
“The goal of this research is to have better predictive models and also to have better conversations” with families about the potential outcomes of trauma in these elderly patients, Dr. Huntington responded. Knowing the risk of 1-year mortality can change “how families can plan to spend time with their loved ones and how to make more appropriate medical decisions by incorporating quantitative data into the conversation.”
Dr. Huntington and her colleagues reported no relevant financial disclosures.
ezimmerman@frontlinemedcom.com
SOURCE: EAST 2018, Abstract #47.
REPORTING FROM EAST 2018
Key clinical point: Short-term mortality rates do not show a full picture of the burden of trauma on elderly patients.
Major finding: While 92% of patients survived to discharge, 24.1% of patients died within 1 year after injury, and 41.9% died within 8 years of injury.
Data source: Study of 6,285 geriatric trauma patients collected from an ACS-verified Level 1 trauma center registry database during 2009-2015.
Disclosures: Presenters reported no relevant financial disclosures.
Source: EAST Scientific Assembly abstract #47.
FDA approves starting dose of roflumilast
The Food and Drug Administration has approved the use of a 250-mcg dose of roflumilast for patients with chronic obstructive pulmonary disease (COPD) for 4 weeks, followed by the use of 500-mcg therapeutic doses, according to a statement from the drug’s marketer, AstraZeneca.
The larger doses of roflumilast (Daliresp) are currently indicated for reducing the risk of COPD exacerbations in patients with severe COPD associated with chronic bronchitis and a history of exacerbations, according to the statement. The selective phosphodiesterase-4 inhibitor, roflumilast, was approved for this use in 500-mcg doses in 2011. The new smaller doses of the drug are being offered to help reduce the rate of treatment discontinuation with use of the higher therapeutic dosing. The 250-mcg doses of roflumilast are not to be used as treatment for COPD.
“As the only once-daily tablet to provide enhanced protection against COPD exacerbations when added to current bronchodilator therapy, this is an important new dosing option to help patients start and stay on treatment. Exacerbations are associated with hospitalizations and an accelerated decline in lung function, and these patients living with COPD need effective treatment options,” Tosh Butt, vice president, respiratory, at AstraZeneca, said in the press release.
The approval of use of the 250-mcg doses was based on data from the OPTIMIZE study (Evaluation of Tolerability and Pharmacokinetics of Roflumilast trial, 250 mcg and 500 mcg, as an add-on to Standard COPD Treatment to Treat Severe COPD), according to the statement.
Over 12 weeks, the percentage of patients stopping treatment was significantly lower in those first given 250 mcg of roflumilast daily for 4 weeks, followed by 500 mcg once a week for 8 weeks (18.4%), compared with those given 500 mcg of roflumilast daily for 12 weeks (24.6%; odds ratio, 0.66; 95% confidence interval, 0.47-0.93; P = .017).
In eight controlled clinical trials, the most common adverse effects were diarrhea, weight loss, nausea, headache, back pain, influenza, insomnia, dizziness, and decreased appetite.
VIDEO: New stroke guideline embraces imaging-guided thrombectomy
LOS ANGELES – When a panel organized by the American Heart Association’s Stroke Council recently revised the group’s guideline for early management of acute ischemic stroke, they were clear on the overarching change they had to make: Incorporate recent evidence collected in two trials that established brain imaging as the way to identify patients eligible for clot removal treatment by thrombectomy, a change in practice that has made this outcome-altering intervention available to more patients.
“The major take-home message [of the new guideline] is the extension of the time window for treating acute ischemic stroke,” said William J. Powers, MD, chair of the guideline group (Stroke. 2018 Jan 24. doi: 10.1161/STR.0000000000000158).
Based on recently reported results from the DAWN (N Engl J Med. 2018;378[1]:11-21) and DEFUSE 3 (N Engl J Med. 2018 Jan 24. doi: 10.1056/NEJMoa1713973) trials “we know that there are patients out to 24 hours from their stroke onset who may benefit” from thrombectomy. “This is a major, major change in how we view care for patients with stroke,” Dr. Powers said in a video interview. “Now there’s much more time. Ideally, we’ll see smaller hospitals develop the ability to do the imaging” that makes it possible to select acute ischemic stroke patients eligible for thrombectomy despite a delay of up to 24 hours from their stroke onset to the time of thrombectomy, said Dr. Powers, professor and chair of neurology at the University of North Carolina, Chapel Hill.
The big priority for the stroke community now that this major change in patient selection was incorporated into a U.S. practice guideline will be acting quickly to implement the steps needed to make this change happen, Dr. Powers and others said.
The new guideline will mean “changes in process and systems of care,” agreed Jeffrey L. Saver, MD, professor of neurology and director of the stroke unit at the University of California, Los Angeles. The imaging called for “will be practical at some primary stroke centers but not others,” he said, although most hospitals certified to provide stroke care as primary stroke centers or acute stroke–ready hospitals have a CT scanner that could provide the basic imaging needed to assess many patients. (CT angiography and perfusion CT are more informative for determining thrombectomy eligibility.) But interpretation of the brain images to distinguish patients eligible for thrombectomy from those who aren’t will likely happen at comprehensive stroke centers that perform thrombectomy or by experts using remote image reading.
Dr. Saver expects that the new guideline will translate most quickly into changes in the imaging and transfer protocols that the Joint Commission may now require from hospitals certified as primary stroke centers or acute stroke-ready hospitals, changes that could be in place sometime later in 2018, he predicted. These are steps “that would really help drive system change.”
Dr. Powers and Dr. Furie had no disclosures. Dr. Saver has received research support and personal fees from Medtronic-Abbott and Neuravia.
EXPERT ANALYSIS FROM ISC 2018

Influenza: All that and MI too
Myocardial infarction admissions were six times more likely to occur in the week after a positive test for influenza than in the year before or the 51 weeks after the infection, according to analysis of a Canadian cohort that links laboratories with administrative databases.
The investigators used this cohort data to define definitions of “risk interval” – the first 7 days after flu detection – and a combined “control interval” – 52 weeks before the flu detection and 51 weeks after the end of the risk interval.
Among the total of 364 hospital admissions for MI in patients with confirmed influenza, 20 occurred during the defined 1-week risk interval (20 admissions/week) and 344 occurred during the control interval (3.3 admissions/week), giving an incidence ratio (IR) of 6.05, Jeffrey C. Kwong, MD, of the University of Toronto and his associates reported in the New England Journal of Medicine.
There was little difference between days 1 and 3 after flu confirmation (IR, 6.3) and days 4-7 (IR, 5.8), but risk dropped off quickly after that, with IRs of 0.6 at days 8-14 and 0.75 at days 15-28. Risk was increased for older adults, those with influenza B infection, and those who had their first MI, the investigators said.
MI incidence also was elevated after infection with noninfluenza respiratory viruses, although to a lesser extent than with influenza, which suggests that “influenza is illustrative of the role that acute respiratory infections have in precipitating acute myocardial infarction,” Dr. Kwong and his associates wrote.
The study was supported by the Canadian Institutes of Health Research, by Public Health Ontario, and by the Institute for Clinical Evaluative Sciences. Dr. Kwong reported grants from Canadian Institutes of Health Research during the conduct of the study, as well as grants from Canadian Institutes of Health Research and University of Toronto.
SOURCE: Kwong JC et al. N Engl J Med. 2018. 378(4):345-53. doi: 10.1056/NEJMoa1702090.
FROM THE NEW ENGLAND JOURNAL OF MEDICINE
Persistent opioid use a risk after surgery in teens and young adults
For a subset of opioid-naive adolescents and young adults who received perioperative opioid scripts, those prescriptions were filled for months after the surgery, raising concerns about long-term risk for substance use disorder.
To get an idea of the teen opioid problem, from 1997 to 2012 for adolescents aged 15-19 years, the incidence of hospitalizations for opioid poisonings per 100,000 teens increased from 3.69 to 10.17, an increase of 176%, according to a study in JAMA Pediatrics (2016;170[12]:1195-201). Adolescents are at a three to five time higher risk for serious medical outcomes when hospitalized with opioid poisoning, such as life-threatening symptoms or death, compared with younger children, according to a study reporting prescription drug exposures among children (Pediatrics. 2017;139[4]:e20163382).
These figures are concerning in part because “a significant association between medical use of prescription opioids alone in adolescence and subsequent nonmedical use of prescription opioids was observed at age 35 years” in a national longitudinal study reported in the journal Pain (2016 Oct;157[10]:2173-8), said Calista M. Harbaugh, MD, of the University of Michigan, Ann Arbor, and her study coauthors.
The study in Pediatrics, which drew from a large national insurance claims database, found some patient characteristics had independent associations with increased risk of persistent opioid use. These included being female or older, as well as having a prior history of substance use disorder, chronic pain, or filling an opioid prescription preoperatively.
Dr. Harbaugh and her collaborators used a large national research database to select opioid-naive patients aged 13-21 years who received 1 of 13 surgical procedures. A total of 88,637 opioid-naive surgical patients were included in the study, with 110,432 control nonsurgical patients. The control group consisted of 3% of the database’s nonsurgical patients who met age and opioid-naivete criteria. Patients in both groups also had to have continuous insurance for the prior 12 months, not have had an opioid prescription filled within the prior year, and not have received any subsequent surgical procedures during the study period.
To be able to compare medication use among patients receiving different types of opioids, the opioid component of all prescriptions was converted to milligrams, and then used to calculate oral morphine equivalents (OMEs) for each prescription.
Although the most common procedures were tonsillectomy and/or adenoidectomy (35.9% of patients), arthroscopic knee repair (25.3%), and appendectomy, (18.6%), these were not the procedures that were most associated with persistent opioid use.
Overall, 7.1% of patients had an initial daily dosage greater than 100 OMEs for their first postoperative prescription. These high opioid doses were likely to be seen in patients undergoing three procedures known to have considerable postoperative pain: pectus repair, posterior arthrodesis, and supracondylar fracture fixation. However, patients undergoing these procedures weren’t more likely to have persistent opioid use than other surgical patients in the study, the researchers said.
Rather, cholecystectomy and colectomy had the highest risk for persistent opioid use, with adjusted odds ratios of 1.13 and 2.33, respectively. Dr. Harbaugh and her collaborators, in discussing the study’s findings, noted that these two conditions involve high levels of preoperative inflammation and are characterized by visceral pain. This scenario, they said, may set these patients up for visceral and central sensitization and present an increased risk for chronic pain.
Dr. Harbaugh and her colleagues called for preoperative screening for risk factors for persistent opioid use, so that at-risk patients can receive closer monitoring and attention. “We are not suggesting that … pain should be underappreciated or undertreated,” or that at-risk patients should not be prescribed opioids.
The investigators said that their work “points toward the multifactorial etiology of postoperative pain and its complex nature in both the short and long term.” They called for more work to “elucidate the mechanism that underlies new persistent opioid use after certain procedures,” as well as more efforts to better understand how best to use multimodal pharmacologic and nonpharmacologic pain control measures in the adolescent and young adult population.
The study was funded by the Michigan Department of Health and Human Services. Dr. Harbaugh reported that she had no relevant financial disclosures. Some of the other investigators received grants from various agencies.
SOURCE: Harbaugh CM et al. Pediatrics 2018 Jan 1;141(1):e20172439
FROM PEDIATRICS
Key clinical point: Especially for females, older teens, and young adults, there’s a risk for persistent postsurgical opioid use.
Major finding: Opioid use persisted for 4.8% of patients undergoing surgery, compared with 0.1% of patients who did not have surgery.
Study details: Retrospective review of claims database including 88,637 adolescent and young adult patients undergoing surgery, and 110,432 controls who did not have surgery.
Disclosures: The study was funded by the Michigan Department of Health and Human Services. Dr. Harbaugh reported that she had no conflicts of interest. Some of the other investigators received grants from various agencies.
Source: Harbaugh CM et al. Pediatrics. 2018 Jan 1;141(1):e20172439
Journal of Hospital Medicine – Jan. 2018
BACKGROUND: Hospital charges and lengths of stay may be greater when adults with chronic conditions are admitted to children’s hospitals. Despite multiple efforts to improve pediatric-adult health care transitions, little guidance exists for transitioning inpatient care.
OBJECTIVE: This study sought to characterize pediatric-adult inpatient care transitions across general pediatric services at U.S. children’s hospitals.
DESIGN and SETTING: National survey of inpatient general pediatric service leaders at U.S. children’s hospitals from January 2016 to July 2016.
MEASUREMENT: Questionnaires assessed institutional characteristics, presence of inpatient transition initiatives (having a specific process and/or leader), and 22 inpatient transition activities. Scales of highly correlated activities were created using exploratory factor analysis. Logistic regression identified associations among institutional characteristics, transition activities, and presence of an inpatient transition initiative.
RESULTS: Of 195 children’s hospitals, 96 responded (49.2% response rate). Transition initiatives were present at 38% of children’s hospitals, more often where there were providers who were trained in both internal medicine and pediatrics or where there were outpatient transition processes. Specific activities were infrequent and varied widely from 2.1% (systems to track youth in transition) to 40.5% (addressing potential insurance problems). Institutions with initiatives more often consistently performed the majority of activities, including using checklists and creating patient-centered transition care plans. Of remaining activities, half involved transition planning, the essential step between readiness and transfer.
CONCLUSION: Relatively few inpatient general pediatric services at U.S. children’s hospitals have leaders or dedicated processes to shepherd transitions to adult-oriented inpatient care. Across institutions, there is wide variability in performance of activities to facilitate this transition. Feasible process and outcome measures are needed.
Also in JHM this month
Characterizing hospitalist practice and perceptions of critical care delivery
AUTHORS: Joseph R. Sweigart, MD, FACP, FHM; David Aymond, MD; Alfred Burger, MD, FACP, SFHM; Andy Kelly, MAS, MS; Nick Marzano, Med; Thomas McIlraith, MD, SFHM; Peter Morris, MD; Mark V. Williams, MD, FACP, MHM; and Eric M. Siegal, MD, SFHM, FCCM
Clinical decision making: Observing the smartphone user an observational study in predicting acute surgical patients’ suitability for discharge
AUTHORS: Richard Hoffmann, MBBS; Simon Harley, MBBS; Samuel Ellison, MBBS; and Peter G. Devitt, MBBS, FRACS
Predicting MDR Gram-negative infection mortality risk
Source control, defined as location and elimination of the source of the infection, was critical for patient survival in the case of multidrug resistant bacterial infection, according to the results of a case-control study of 62 critically ill surgical patients who were assessed between 2011 and 2014.
Researchers examined the characteristics of infected patients surviving to hospital discharge compared with those of nonsurvivors to look for predictive factors. Demographically, patients had an overall mean age of 62 years; 30.6% were women; 69.4% were white. The first culture obtained during a surgical ICU admission that grew a carbapenem-resistant Enterobacteriaceae (CRE), MDR Pseudomonas aeruginosa, or MDR Acinetobacter spp. was defined as the index culture.
“In this study, 33.9% [21/62] of critically ill surgical patients with a culture positive for MDR Gram-negative bacteria died prior to hospital discharge,” according to Andrew S. Jarrell, PharmD, of the Johns Hopkins Hospital, Baltimore, and his colleagues.
With multivariate logistic regression, achievement of source control was the only variable associated with decreased in-hospital mortality (odds ratio 0.04, 95% confidence interval, 0.003-0.52); P = .01).
“Source control status was predictive of in-hospital mortality after controlling for other factors. Specifically, the odds of in-hospital mortality were 97% lower when source control was achieved as compared to when source control was not achieved,” the authors stated (J Crit Care. 2018;43:321-6).
Scenarios in which source control was not applicable (pneumonia and urinary tract infection) were also similarly distributed between survivors and nonsurvivors, they reported.
Other than source control, the only significant risk factors for mortality, as seen in univariate analysis, all occurred prior to index culture. They were: vasopressor use (46.3% of survivors, vs. 76.2% of nonsurvivors, P = .03); mechanical ventilation (63.4% vs. 100%, P = .001); and median ICU length of stay (10 days vs. 18 days, P = .001).
“Achievement of source control stands out as a critical factor for patient survival. Clinicians should take this, along with prior ICU LOS, vasopressor use, and mechanical ventilation status, into consideration when evaluating patient prognosis,” Dr. Jarrell and his colleagues concluded.
The authors reported that they had no conflicts or source of funding.
Source: Jarrell, A.S., et al. J Crit Care. 2018;43:321-6.
FROM THE JOURNAL OF CRITICAL CARE
Key clinical point: Source control was the most important predictor of MDR Gram-negative infection mortality in hospitalized patients.
Major finding: The odds of in-hospital mortality were 97% lower when source control was achieved.
Study details: Case-control study of 62 critically ill surgical patients from 2011 to 2014 who had an MDR infection.
Disclosures: The authors reported that they had no conflicts or source of funding.
Source: Jarrell, A.S., et al. J Crit Care. 2018;43:321-6.