User login
Association Between Proton Pump Inhibitor Exposure and Clostridium difficile Infection in Elderly, Hospitalized Patients
Clostridium difficile infection (CDI) is the result of a Gram-positive bacterium, whose exotoxins are commonly associated with infectious, watery diarrhea.1Clostridium difficile infection is associated with a significant cost burden, and over the past several years, the incidence and severity of CDI have been on the rise.2,3
There are several known risk factors for CDI. The most well-elucidated risk factor is the use of antibiotics, especially fluoroquinolones, clindamycin, broad-spectrum penicillins, and broad-spectrum cephalosporins.4,5 Other risk factors include advancing age, immunosuppression, a high burden of comorbidities, hospitalization, and antineoplastic agent use.6-8 Over the past decade, gastric acid suppression has come under increased scrutiny as a possible risk factor for CDI; specifically, exposure to proton pump inhibitors (PPIs) and histamine 2 receptor antagonists (H2RAs).8-14 With the reported overuse of PPIs, the importance of understanding safety risks associated with these agents is becoming increasingly necessary.15
In 2012, the FDA issued a public safety announcement reporting a possible association between CDI and patients undergoing treatment with PPIs.16 A large meta-analysis by Janarthanan and colleagues in 2012 evaluated 23 studies with nearly 300,000 patients, showing a 1.6-fold increase in CDI in patients exposed to a PPI.8 Another large meta-analysis noted that 39 studies showed a statistically significant association between PPI use and the risk of developing CDI (odds ratio [OR] 1.74) compared with nonusers.17 A recent study by McDonald and colleagues demonstrated patients with continuous PPI use had an elevated risk of CDI recurrence compared with patients not on continuous PPI therapy.18 These large studies did not focus analysis on elderly, hospitalized patients with significant comorbidities. There are several proposed mechanisms for the reported association between PPI use and CDI. The most widely accepted mechanism is that gastric acid suppression disrupts normal gastrointestinal flora and allows for bacterial overgrowth.19-21There are few studies that have evaluated the association between PPI use and CDI in elderly, hospitalized patients. Studies conducted in a similar patient population have demonstrated no association between PPI use and CDI.22,23 Shah and colleagues reported that treatment with gastric acid antisecretory agents does not increase the risk of developing CDI among elderly, hospitalized patients who also had severe disability.23 Lowe and colleagues demonstrated no association between PPI therapy and hospitalization for elderly outpatients with CDI.22 A study was needed to determine the association between PPI use and CDI in hospitalized, elderly patients with a high burden of comorbidities.
Related: Cleaning Up? Microfiber May Be Better
Objectives
The primary objective of this study was to determine whether there is an association between PPI exposure and CDI in elderly, hospitalized patients. The secondary objective was to determine the risk factors for the development of CDI in elderly, hospitalized patients.
Methods
Approval for this study was obtained from the Emory University Institutional Review Board and the VA Research and Development Committee. The study was a single-center, retrospective, medical record review of patients with a CDI polymerase chain reaction (PCR) assay, conducted at the Atlanta VAMC between August 20, 2011, and August 20, 2013.
Two reports for the study period were generated from TheraDoc (Premier Inc., Salt Lake City, UT) medical record software: all patients with a positive CDI PCR assay and all patients with a negative CDI PCR assay. All adult inpatients aged ≥ 18 years with a positive CDI PCR assay and diarrhea were included. Patients with CDI were randomly matched 1:1, based on age, with a control patient from a large sample of eligible CDI negative assays. Any duplicate positive CDI PCR assays were deleted, and only the first positive test was analyzed. Confirmation that PCR assay with liquid stool was being performed per manufacturer recommendations was obtained from microbiology laboratory staff.
Patient-specific data were collected from the VA Computerized Patient Record System (CPRS). Potential covariates for analyses were selected based on previous literature regarding possible associations between PPI and CDI. Data were collected on patient age, gender, PPI exposure, PPI agent, PPI dose, concomitant medications, high-risk antibiotic use, comorbidities (including diabetes, chronic renal failure, liver disease, anemia, coagulopathy, myocardial infarction, chronic heart failure, peripheral vascular disease, chronic obstructive pulmonary disease, hypertension, hypothyroidism, and any alcohol or drug abuse), length of hospital stay, bed location, and first vs recurrent CDI. Proton pump inhibitor exposure was defined as use of any PPI during hospitalization or within 2 months prior to hospitalization. High-risk antibiotics were defined as fluoroquinolones, broad-spectrum penicillins, broad-spectrum cephalosporins, and clindamycin.
Statistical Analysis
Two-sided Wilcoxon rank sum and chi-square tests were used to compare the selected variables between CDI cases and non-CDI controls. A multivariate logistic regression model was fitted to the data using CDI as the outcome and PPI use as the main exposure of interest. The large number of covariates of interest relative to the sample size suggests conditional maximum likelihood methods of estimation.24
Separate models were run using each case-control pair as a separate stratum in the model (125 pairs) as well as pooling similar-age strata to reduce the 125 pairs to 46 pooled sets. However, when comparing the Akaike information criterion (AIC; an objective measure to determine relative quality of multivariate models where a lower AIC value is preferred) between these individual and pooled strata models, the model that controlled for 125 individual case-control strata was overwhelmingly suggested as the better model (AIC, 175 vs 255, respectively).25 Analyses were conducted with SAS 9.2 (SAS Institute Inc., Cary, NC).
Results
A total of 128 patients were positive for CDI during the 2-year study period. Three of these patients were excluded from the study due to outpatient status. The remaining 125 patients were matched 1:1 with patients negative for CDI to yield a total study population of 250 patients.
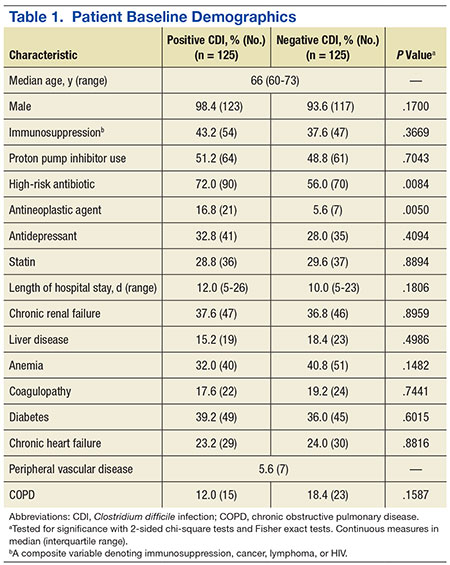
Baseline demographics are shown in Table 1. The majority of patients included were males with a median age of 66 years. Nearly half of all patients in both groups had chronic renal failure, diabetes, or anemia. Comorbidities were numerous but were not significantly different between the positive and negative CDI groups. No significant difference in immunosuppression or PPI use was detected between the 2 groups. However, there were significantly more patients taking a high-risk antibiotic or an antineoplastic agent in the positive CDI group compared with the negative CDI group. The average length of hospital stay averaged 10 to 12 days and did not statistically differ between the 2 groups.
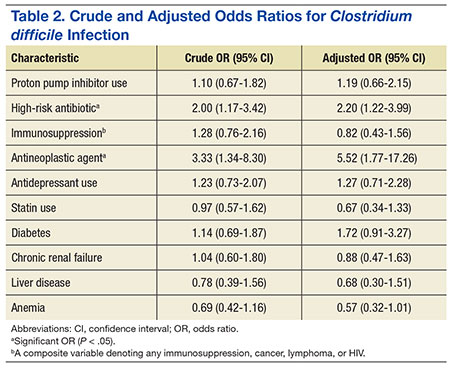
Crude ORs (cORs) and adjusted ORs (aORs) were calculated for the primary and secondary outcome measures (Table 2). There was not a statistically significant association between PPI use and CDI (cOR 1.10, 95% confidence interval [CI] 0.67-1.82; aOR 1.19, 95% CI 0.66-2.15). Other known risk factors were also evaluated for association. A statistically significant association did not exist between CDI and immunosuppression, antidepressant use, statin use, diabetes, chronic renal failure, liver disease, or anemia. However, the statistical analysis did suggest an association between CDI and high-risk antibiotic use (aOR 2.20, 95% CI 1.22-3.99) and antineoplastic agent use (aOR 5.52, 95% CI 1.77-17.26).
A sensitivity analysis was conducted to determine whether there were differing associations with CDI by PPI dose or specific agent. In both sensitivity analyses, there were no statistically significant differences in CDI between patients who took once-daily vs twice-daily PPI dosing or those who took pantoprazole vs omeprazole.
Discussion
The objective of this study was to evaluate the association between PPI use and CDI in an aging, hospitalized population. When adjusted for known risk factors, there was no association between CDI and patients exposed to PPI therapy.
Previous studies evaluating PPI use and CDI have shown conflicting results. Large meta-analyses have shown an increase in CDI in patients exposed to a PPI, whereas other studies have shown no association. In the studies that did not link PPI use and CDI, patients were elderly, hospitalized, and had other CDI risk factors. The patients in this study were hospitalized, with a median age of 66 years. They were significantly immunosuppressed and had a very high burden of comorbidities. A possible explanation for the lack of association between PPI use and CDI is that, in patients with several existing risk factors for CDI, adding a PPI confers no additional effect on CDI risk.
Well-known risk factors, including high-risk antibiotic use and antineoplastic chemotherapy use, were confirmed by this study. Other known risk factors, including immunosuppression and diabetes, were not observed to have an association with CDI in this study. This is perhaps for the same reason that PPI exposure did not show a significant association. In a study published in 2010, Howell and colleagues showed that the risk of CDI increased as acid suppression increased in a dose-dependent fashion.9 There was no association between PPI dose and PPI agent on the primary outcome measure.
About half of all patients in the current study were exposed to PPI therapy, which was a surprisingly high number. Although this study did not evaluate appropriate use of PPI therapy, it exposes the high rate of PPI use at the study site. It is known that PPI use has associated risks, and it is important that physicians continue to be vigilant in their prescribing habits.
Related: The Importance of an Antimicrobial Stewardship Program
Limitations and Future Directions
Several limitations of this study should be noted. A relatively narrow patient population was examined, which limits the generalizability of these findings. However, health care providers treating older, hospitalized patients with a high burden of comorbidities may find the results meaningful. This study was retrospective and included a relatively small sample size, which may limit the ability to detect a statistically significant difference.
Data were not collected on the duration of PPI therapy. A longer duration of therapy has been shown in previous studies to be significantly associated with CDI.26 It is unclear in this patient population whether there would have been an association between PPI duration of treatment and CDI.
Outpatient PPI exposure was determined using CPRS refill history. Patients were considered to have PPI exposure if they filled ≥ 1 prescription for a PPI within 2 months of hospitalization. Using this methodology to determine PPI exposure may not have identified patients who took over-the-counter PPIs or did not report filling a prescription for a PPI from an outside pharmacy, which would have resulted in an underestimation of PPI use in this sample. Furthermore, it is difficult to determine adherence to a prescribed regimen for outpatients.
Pantoprazole and omeprazole are the formulary PPIs at the study site. Conducting research at an institution with a formulary prevents evaluation of other PPIs, including esomeprazole, rabeprazole, dexlansoprazole, and lansoprazole. This is not seen as a significant limitation, as there have not been significant differences in the PPI agent and CDI widely reported in the literature.
Data on H2RA exposure were not collected. Any possible effect of H2RA exposure and CDI cannot be accounted for in this study. It is not likely that H2RA exposure would be associated with an increased risk of CDI in this patient population, as several studies have shown less of an association between CDI and H2RA compared with CDI and PPI use.
Further investigation to evaluate the association between CDI and PPI exposure in an elderly, hospitalized population is needed. Larger studies in these patients that evaluate duration of PPI therapy would be beneficial.
Related: Antidepressants Plus NSAIDs and the Risk of Intracranial Hemorrhage
Conclusion
In an elderly, hospitalized patient population with a high comorbidity burden, this study did not detect a statistically significant association between PPI exposure and CDI. Despite this, providers should continue to consider discontinuation of unnecessary PPI therapy.
Acknowledgements
The authors wish to thank Mehran Salles, PhD, PharmD, for her assistance. Study findings were presented at the 2014 Southeastern Residency Conference in Athens, Georgia, on May 1, 2014.
Author disclosures
The authors report no actual or potential conflicts of interest with regard to this article.
Disclaimer
The opinions expressed herein are those of the authors and do not necessarily reflect those of Federal Practitioner Frontline Medical Communications Inc., the U.S. Government, or any of its agencies. This article may discuss unlabeled or investigational use of certain drugs. Please review complete prescribing information for specific drugs or drug combinations—including indications, contraindications, warnings, and adverse effects—before administering pharmacologic therapy to patients.
1. Poutanen SM, Simor AE. Clostridium difficile-associated diarrhea in adults. CMAJ. 2004;171(1):51-58.
2. Clostridium difficile infection. Centers for Disease Control and Prevention Website. http://www.cdc.gov/HAI/organisms/cdiff/Cdiff_infect.html. Updated February 25, 2015. Accessed October 5, 2015.
3. Song X, Bartlett JG, Speck K, Naegeli A, Carroll K, Perl TM. Rising economic impact of Clostridium difficile-associated disease in adult hospitalized patient population. Infect Control Hosp Epidemiol. 2008;29(9):823-828.
4. Bartlett JG. Narrative review: the new epidemic of Clostridium difficile-associated enteric disease. Ann Intern Med. 2006;145(10):758-764.
5. Baxter R, Ray GT, Fireman BH. Case-control study of antibiotic use and subsequent Clostridium difficile-associated diarrhea in hospitalized patients. Infect Control Hosp Epidemiol. 2008;29(1):44-50.
6. Anand A, Glatt AE. Clostridium difficile infection associated with antineoplastic chemotherapy: a review. Clin Infect Dis. 1993;17(1):109-113.
7. Bignardi GE. Risk factors for Clostridium difficile infection. J Hosp Infect. 1998;40(1):1-15.
8. Janarthanan S, Ditah I, Adler DG, Ehrinpreis MN. Clostridium difficile-associated diarrhea and proton pump inhibitor therapy: a meta-analysis. Am J Gastroenterol. 2012;107(7):1001-1010.
9. Howell MD, Novack V, Grgurich P, et al. Iatrogenic gastric acid suppression and the risk of nosocomial Clostridium difficile infection. Arch Intern Med. 2010;170(9):784-790.
10. Aseeri M, Schroeder T, Kramer J, Zackula R. Gastric acid suppression by proton pump inhibitors as a risk factor for Clostridium difficile-associated diarrhea in hospitalized patients. Am J Gastroenterol. 2008;103(9):2308-2313.
11. Dalton BR, Lye-Maccannell T, Henderson EA, Maccannell DR, Louie TJ. Proton pump inhibitors increase significantly the risk of Clostridium difficile infection in a low-endemicity, non-outbreak hospital setting. Aliment Pharmacol Ther. 2009;29(6):626-634.
12. Dial S, Alrasadi K, Manoukian C, Huang A, Menzies D. Risk of Clostridium difficile diarrhea among hospital inpatients prescribed proton pump inhibitors: cohort and case-control studies. CMAJ. 2004;171(1):33-38.
13. Linsky A, Gupta K, Lawler EV, Fonda JR, Hermos JA. Proton pump inhibitors and risk for recurrent Clostridium difficile infection. Arch Intern Med. 2010;170(9):772-778.
14. Yearsley KA, Gilby LJ, Ramadas AV, Kubiak EM, Fone DL, Allison MC. Proton pump inhibitor therapy is a risk factor for Clostridium difficile-associated diarrhoea. Aliment Pharmacol Ther. 2006;24(4):613-619.
15. Nardino RJ, Vender RJ, Herbert PN. Overuse of acid-suppressive therapy in hospitalized patients. Am J Gastroenterol. 2000;95(11):3118-3122.
16. U.S. Food and Drug Administration. FDA drug safety communication: Clostridium difficile-associated diarrhea can be associated with stomach acid drugs known as proton pump inhibitors (PPIs). http://www.fda.gov/Drugs/DrugSafety/ucm290510.htm. Updated February 15, 2013. Accessed October 5, 2015.
17. Kwok CS, Arthur AK, Anibueze CI, Singh S, Cavallazzi R, Loke YK. Risk of Clostridium difficile infection with acid suppressing drugs and antibiotics: meta-analysis. Am J Gastroenterol. 2012;107(7):1011-1019.
18. McDonald EG, Milligan J, Frenette C, Lee TC. Continuous proton pump inhibitor therapy and the associated risk of recurrent Clostridium difficile infection. JAMA Intern Med. 2015;175(5):784-791.
19. Lewis SJ, Franco S, Young G, O'Keefe SJ. Altered bowel function and duodenal bacterial overgrowth in patients treated with omeprazole. Aliment Pharmacol Ther. 1996;10(4):557-561.
20. Theisen J, Nehra D, Citron D, et al. Suppression of gastric acid secretion in patients with gastroesophageal reflux disease results in gastric bacterial overgrowth and deconjugation of bile acids. J Gastrointest Surg. 2000;4(1):50-54.
21. Williams C, McColl KE. Review article: proton pump inhibitors and bacterial overgrowth. Aliment Pharmacol Ther. 2006;23(1):3-10.
22. Lowe DO, Mamdani MM, Kopp A, Low DE, Juurlink DN. Proton pump inhibitors and hospitalization for Clostridium difficile-associated disease: a population-based study. Clin Infect Dis. 2006;43(10):1272-1276.
23. Shah S, Lewis A, Leopold D, Dunstan F, Woodhouse K. Gastric acid suppression does not promote clostridial diarrhoea in the elderly. QJM. 2000;93(3):175-181.
24. Kleinbaum DG, Klein M. Logistic Regression: A Self-Learning Text. 3rd ed. New York, NY: Springer; 2010.
25. Akaike H. A new look at the statistical model identification. IEEE Transact Autom Contr. 1974;19(6):716-723.
26. Barletta JF, El-Ibiary SY, Davis LE, Nguyen B, Raney CR. Proton pump inhibitors and the risk for hospital-acquired Clostridium difficile infection. Mayo Clin Proc. 2013;88(10):1085-1090.
Clostridium difficile infection (CDI) is the result of a Gram-positive bacterium, whose exotoxins are commonly associated with infectious, watery diarrhea.1Clostridium difficile infection is associated with a significant cost burden, and over the past several years, the incidence and severity of CDI have been on the rise.2,3
There are several known risk factors for CDI. The most well-elucidated risk factor is the use of antibiotics, especially fluoroquinolones, clindamycin, broad-spectrum penicillins, and broad-spectrum cephalosporins.4,5 Other risk factors include advancing age, immunosuppression, a high burden of comorbidities, hospitalization, and antineoplastic agent use.6-8 Over the past decade, gastric acid suppression has come under increased scrutiny as a possible risk factor for CDI; specifically, exposure to proton pump inhibitors (PPIs) and histamine 2 receptor antagonists (H2RAs).8-14 With the reported overuse of PPIs, the importance of understanding safety risks associated with these agents is becoming increasingly necessary.15
In 2012, the FDA issued a public safety announcement reporting a possible association between CDI and patients undergoing treatment with PPIs.16 A large meta-analysis by Janarthanan and colleagues in 2012 evaluated 23 studies with nearly 300,000 patients, showing a 1.6-fold increase in CDI in patients exposed to a PPI.8 Another large meta-analysis noted that 39 studies showed a statistically significant association between PPI use and the risk of developing CDI (odds ratio [OR] 1.74) compared with nonusers.17 A recent study by McDonald and colleagues demonstrated patients with continuous PPI use had an elevated risk of CDI recurrence compared with patients not on continuous PPI therapy.18 These large studies did not focus analysis on elderly, hospitalized patients with significant comorbidities. There are several proposed mechanisms for the reported association between PPI use and CDI. The most widely accepted mechanism is that gastric acid suppression disrupts normal gastrointestinal flora and allows for bacterial overgrowth.19-21There are few studies that have evaluated the association between PPI use and CDI in elderly, hospitalized patients. Studies conducted in a similar patient population have demonstrated no association between PPI use and CDI.22,23 Shah and colleagues reported that treatment with gastric acid antisecretory agents does not increase the risk of developing CDI among elderly, hospitalized patients who also had severe disability.23 Lowe and colleagues demonstrated no association between PPI therapy and hospitalization for elderly outpatients with CDI.22 A study was needed to determine the association between PPI use and CDI in hospitalized, elderly patients with a high burden of comorbidities.
Related: Cleaning Up? Microfiber May Be Better
Objectives
The primary objective of this study was to determine whether there is an association between PPI exposure and CDI in elderly, hospitalized patients. The secondary objective was to determine the risk factors for the development of CDI in elderly, hospitalized patients.
Methods
Approval for this study was obtained from the Emory University Institutional Review Board and the VA Research and Development Committee. The study was a single-center, retrospective, medical record review of patients with a CDI polymerase chain reaction (PCR) assay, conducted at the Atlanta VAMC between August 20, 2011, and August 20, 2013.
Two reports for the study period were generated from TheraDoc (Premier Inc., Salt Lake City, UT) medical record software: all patients with a positive CDI PCR assay and all patients with a negative CDI PCR assay. All adult inpatients aged ≥ 18 years with a positive CDI PCR assay and diarrhea were included. Patients with CDI were randomly matched 1:1, based on age, with a control patient from a large sample of eligible CDI negative assays. Any duplicate positive CDI PCR assays were deleted, and only the first positive test was analyzed. Confirmation that PCR assay with liquid stool was being performed per manufacturer recommendations was obtained from microbiology laboratory staff.
Patient-specific data were collected from the VA Computerized Patient Record System (CPRS). Potential covariates for analyses were selected based on previous literature regarding possible associations between PPI and CDI. Data were collected on patient age, gender, PPI exposure, PPI agent, PPI dose, concomitant medications, high-risk antibiotic use, comorbidities (including diabetes, chronic renal failure, liver disease, anemia, coagulopathy, myocardial infarction, chronic heart failure, peripheral vascular disease, chronic obstructive pulmonary disease, hypertension, hypothyroidism, and any alcohol or drug abuse), length of hospital stay, bed location, and first vs recurrent CDI. Proton pump inhibitor exposure was defined as use of any PPI during hospitalization or within 2 months prior to hospitalization. High-risk antibiotics were defined as fluoroquinolones, broad-spectrum penicillins, broad-spectrum cephalosporins, and clindamycin.
Statistical Analysis
Two-sided Wilcoxon rank sum and chi-square tests were used to compare the selected variables between CDI cases and non-CDI controls. A multivariate logistic regression model was fitted to the data using CDI as the outcome and PPI use as the main exposure of interest. The large number of covariates of interest relative to the sample size suggests conditional maximum likelihood methods of estimation.24
Separate models were run using each case-control pair as a separate stratum in the model (125 pairs) as well as pooling similar-age strata to reduce the 125 pairs to 46 pooled sets. However, when comparing the Akaike information criterion (AIC; an objective measure to determine relative quality of multivariate models where a lower AIC value is preferred) between these individual and pooled strata models, the model that controlled for 125 individual case-control strata was overwhelmingly suggested as the better model (AIC, 175 vs 255, respectively).25 Analyses were conducted with SAS 9.2 (SAS Institute Inc., Cary, NC).
Results
A total of 128 patients were positive for CDI during the 2-year study period. Three of these patients were excluded from the study due to outpatient status. The remaining 125 patients were matched 1:1 with patients negative for CDI to yield a total study population of 250 patients.
Baseline demographics are shown in Table 1. The majority of patients included were males with a median age of 66 years. Nearly half of all patients in both groups had chronic renal failure, diabetes, or anemia. Comorbidities were numerous but were not significantly different between the positive and negative CDI groups. No significant difference in immunosuppression or PPI use was detected between the 2 groups. However, there were significantly more patients taking a high-risk antibiotic or an antineoplastic agent in the positive CDI group compared with the negative CDI group. The average length of hospital stay averaged 10 to 12 days and did not statistically differ between the 2 groups.
Crude ORs (cORs) and adjusted ORs (aORs) were calculated for the primary and secondary outcome measures (Table 2). There was not a statistically significant association between PPI use and CDI (cOR 1.10, 95% confidence interval [CI] 0.67-1.82; aOR 1.19, 95% CI 0.66-2.15). Other known risk factors were also evaluated for association. A statistically significant association did not exist between CDI and immunosuppression, antidepressant use, statin use, diabetes, chronic renal failure, liver disease, or anemia. However, the statistical analysis did suggest an association between CDI and high-risk antibiotic use (aOR 2.20, 95% CI 1.22-3.99) and antineoplastic agent use (aOR 5.52, 95% CI 1.77-17.26).
A sensitivity analysis was conducted to determine whether there were differing associations with CDI by PPI dose or specific agent. In both sensitivity analyses, there were no statistically significant differences in CDI between patients who took once-daily vs twice-daily PPI dosing or those who took pantoprazole vs omeprazole.
Discussion
The objective of this study was to evaluate the association between PPI use and CDI in an aging, hospitalized population. When adjusted for known risk factors, there was no association between CDI and patients exposed to PPI therapy.
Previous studies evaluating PPI use and CDI have shown conflicting results. Large meta-analyses have shown an increase in CDI in patients exposed to a PPI, whereas other studies have shown no association. In the studies that did not link PPI use and CDI, patients were elderly, hospitalized, and had other CDI risk factors. The patients in this study were hospitalized, with a median age of 66 years. They were significantly immunosuppressed and had a very high burden of comorbidities. A possible explanation for the lack of association between PPI use and CDI is that, in patients with several existing risk factors for CDI, adding a PPI confers no additional effect on CDI risk.
Well-known risk factors, including high-risk antibiotic use and antineoplastic chemotherapy use, were confirmed by this study. Other known risk factors, including immunosuppression and diabetes, were not observed to have an association with CDI in this study. This is perhaps for the same reason that PPI exposure did not show a significant association. In a study published in 2010, Howell and colleagues showed that the risk of CDI increased as acid suppression increased in a dose-dependent fashion.9 There was no association between PPI dose and PPI agent on the primary outcome measure.
About half of all patients in the current study were exposed to PPI therapy, which was a surprisingly high number. Although this study did not evaluate appropriate use of PPI therapy, it exposes the high rate of PPI use at the study site. It is known that PPI use has associated risks, and it is important that physicians continue to be vigilant in their prescribing habits.
Related: The Importance of an Antimicrobial Stewardship Program
Limitations and Future Directions
Several limitations of this study should be noted. A relatively narrow patient population was examined, which limits the generalizability of these findings. However, health care providers treating older, hospitalized patients with a high burden of comorbidities may find the results meaningful. This study was retrospective and included a relatively small sample size, which may limit the ability to detect a statistically significant difference.
Data were not collected on the duration of PPI therapy. A longer duration of therapy has been shown in previous studies to be significantly associated with CDI.26 It is unclear in this patient population whether there would have been an association between PPI duration of treatment and CDI.
Outpatient PPI exposure was determined using CPRS refill history. Patients were considered to have PPI exposure if they filled ≥ 1 prescription for a PPI within 2 months of hospitalization. Using this methodology to determine PPI exposure may not have identified patients who took over-the-counter PPIs or did not report filling a prescription for a PPI from an outside pharmacy, which would have resulted in an underestimation of PPI use in this sample. Furthermore, it is difficult to determine adherence to a prescribed regimen for outpatients.
Pantoprazole and omeprazole are the formulary PPIs at the study site. Conducting research at an institution with a formulary prevents evaluation of other PPIs, including esomeprazole, rabeprazole, dexlansoprazole, and lansoprazole. This is not seen as a significant limitation, as there have not been significant differences in the PPI agent and CDI widely reported in the literature.
Data on H2RA exposure were not collected. Any possible effect of H2RA exposure and CDI cannot be accounted for in this study. It is not likely that H2RA exposure would be associated with an increased risk of CDI in this patient population, as several studies have shown less of an association between CDI and H2RA compared with CDI and PPI use.
Further investigation to evaluate the association between CDI and PPI exposure in an elderly, hospitalized population is needed. Larger studies in these patients that evaluate duration of PPI therapy would be beneficial.
Related: Antidepressants Plus NSAIDs and the Risk of Intracranial Hemorrhage
Conclusion
In an elderly, hospitalized patient population with a high comorbidity burden, this study did not detect a statistically significant association between PPI exposure and CDI. Despite this, providers should continue to consider discontinuation of unnecessary PPI therapy.
Acknowledgements
The authors wish to thank Mehran Salles, PhD, PharmD, for her assistance. Study findings were presented at the 2014 Southeastern Residency Conference in Athens, Georgia, on May 1, 2014.
Author disclosures
The authors report no actual or potential conflicts of interest with regard to this article.
Disclaimer
The opinions expressed herein are those of the authors and do not necessarily reflect those of Federal Practitioner Frontline Medical Communications Inc., the U.S. Government, or any of its agencies. This article may discuss unlabeled or investigational use of certain drugs. Please review complete prescribing information for specific drugs or drug combinations—including indications, contraindications, warnings, and adverse effects—before administering pharmacologic therapy to patients.
1. Poutanen SM, Simor AE. Clostridium difficile-associated diarrhea in adults. CMAJ. 2004;171(1):51-58.
2. Clostridium difficile infection. Centers for Disease Control and Prevention Website. http://www.cdc.gov/HAI/organisms/cdiff/Cdiff_infect.html. Updated February 25, 2015. Accessed October 5, 2015.
3. Song X, Bartlett JG, Speck K, Naegeli A, Carroll K, Perl TM. Rising economic impact of Clostridium difficile-associated disease in adult hospitalized patient population. Infect Control Hosp Epidemiol. 2008;29(9):823-828.
4. Bartlett JG. Narrative review: the new epidemic of Clostridium difficile-associated enteric disease. Ann Intern Med. 2006;145(10):758-764.
5. Baxter R, Ray GT, Fireman BH. Case-control study of antibiotic use and subsequent Clostridium difficile-associated diarrhea in hospitalized patients. Infect Control Hosp Epidemiol. 2008;29(1):44-50.
6. Anand A, Glatt AE. Clostridium difficile infection associated with antineoplastic chemotherapy: a review. Clin Infect Dis. 1993;17(1):109-113.
7. Bignardi GE. Risk factors for Clostridium difficile infection. J Hosp Infect. 1998;40(1):1-15.
8. Janarthanan S, Ditah I, Adler DG, Ehrinpreis MN. Clostridium difficile-associated diarrhea and proton pump inhibitor therapy: a meta-analysis. Am J Gastroenterol. 2012;107(7):1001-1010.
9. Howell MD, Novack V, Grgurich P, et al. Iatrogenic gastric acid suppression and the risk of nosocomial Clostridium difficile infection. Arch Intern Med. 2010;170(9):784-790.
10. Aseeri M, Schroeder T, Kramer J, Zackula R. Gastric acid suppression by proton pump inhibitors as a risk factor for Clostridium difficile-associated diarrhea in hospitalized patients. Am J Gastroenterol. 2008;103(9):2308-2313.
11. Dalton BR, Lye-Maccannell T, Henderson EA, Maccannell DR, Louie TJ. Proton pump inhibitors increase significantly the risk of Clostridium difficile infection in a low-endemicity, non-outbreak hospital setting. Aliment Pharmacol Ther. 2009;29(6):626-634.
12. Dial S, Alrasadi K, Manoukian C, Huang A, Menzies D. Risk of Clostridium difficile diarrhea among hospital inpatients prescribed proton pump inhibitors: cohort and case-control studies. CMAJ. 2004;171(1):33-38.
13. Linsky A, Gupta K, Lawler EV, Fonda JR, Hermos JA. Proton pump inhibitors and risk for recurrent Clostridium difficile infection. Arch Intern Med. 2010;170(9):772-778.
14. Yearsley KA, Gilby LJ, Ramadas AV, Kubiak EM, Fone DL, Allison MC. Proton pump inhibitor therapy is a risk factor for Clostridium difficile-associated diarrhoea. Aliment Pharmacol Ther. 2006;24(4):613-619.
15. Nardino RJ, Vender RJ, Herbert PN. Overuse of acid-suppressive therapy in hospitalized patients. Am J Gastroenterol. 2000;95(11):3118-3122.
16. U.S. Food and Drug Administration. FDA drug safety communication: Clostridium difficile-associated diarrhea can be associated with stomach acid drugs known as proton pump inhibitors (PPIs). http://www.fda.gov/Drugs/DrugSafety/ucm290510.htm. Updated February 15, 2013. Accessed October 5, 2015.
17. Kwok CS, Arthur AK, Anibueze CI, Singh S, Cavallazzi R, Loke YK. Risk of Clostridium difficile infection with acid suppressing drugs and antibiotics: meta-analysis. Am J Gastroenterol. 2012;107(7):1011-1019.
18. McDonald EG, Milligan J, Frenette C, Lee TC. Continuous proton pump inhibitor therapy and the associated risk of recurrent Clostridium difficile infection. JAMA Intern Med. 2015;175(5):784-791.
19. Lewis SJ, Franco S, Young G, O'Keefe SJ. Altered bowel function and duodenal bacterial overgrowth in patients treated with omeprazole. Aliment Pharmacol Ther. 1996;10(4):557-561.
20. Theisen J, Nehra D, Citron D, et al. Suppression of gastric acid secretion in patients with gastroesophageal reflux disease results in gastric bacterial overgrowth and deconjugation of bile acids. J Gastrointest Surg. 2000;4(1):50-54.
21. Williams C, McColl KE. Review article: proton pump inhibitors and bacterial overgrowth. Aliment Pharmacol Ther. 2006;23(1):3-10.
22. Lowe DO, Mamdani MM, Kopp A, Low DE, Juurlink DN. Proton pump inhibitors and hospitalization for Clostridium difficile-associated disease: a population-based study. Clin Infect Dis. 2006;43(10):1272-1276.
23. Shah S, Lewis A, Leopold D, Dunstan F, Woodhouse K. Gastric acid suppression does not promote clostridial diarrhoea in the elderly. QJM. 2000;93(3):175-181.
24. Kleinbaum DG, Klein M. Logistic Regression: A Self-Learning Text. 3rd ed. New York, NY: Springer; 2010.
25. Akaike H. A new look at the statistical model identification. IEEE Transact Autom Contr. 1974;19(6):716-723.
26. Barletta JF, El-Ibiary SY, Davis LE, Nguyen B, Raney CR. Proton pump inhibitors and the risk for hospital-acquired Clostridium difficile infection. Mayo Clin Proc. 2013;88(10):1085-1090.
Evaluating Sorafenib in Veterans With Advanced Hepatocellular Carcinoma
In 2015, more than 35,660 new cases of liver cancer and 24,550 liver cancer-related deaths are expected to occur in the U.S. About 80% of these cases will consist of hepatocellular carcinoma, (HCC).1 The incidence of HCC varies throughout the world: Incidence is as low as 5 in 100,000 individuals in North America and ranges up to > 20 in 100,000 individuals in sub-Saharan Africa and Eastern Asia.2 Nearly half of all cases of HCC are associated with hepatitis B virus (HBV), and another 25% are associated with hepatitis C virus (HCV). Other risk factors for developing HCC include alcoholic liver disease, nonalcoholic steatohepatitis, flatoxin-contaminated food, diabetes, and obesity.3
Therapeutic options for advanced HCC are limited. The FDA approved sorafenib in 2008 for the treatment of unresectable HCC.4 According to the American Association for the Study of Liver Diseases (AASLD) and the Barcelona Clinic Liver Cancer (BCLC) staging system, patients with Stage C liver cancer may undergo a trial of sorafenib.4 National Comprehensive Cancer Network (NCCN) clinical guidelines for hepatobiliary cancers reserve sorafenib for patients with inoperable tumors, metastatic disease, or extensive liver tumor burden.5 Sorafenib is shown to inhibit multiple intracellular and cell surface kinases. Several of these kinases are thought to be involved in tumor cell signaling, angiogenesis, and apoptosis.4 In the Sorafenib HCC Assessment Randomized Protocol (SHARP) trial, median overall survival (OS) was 10.7 months in the sorafenib group and 7.9 months in the placebo group.6 The predicted survival rates at 1 year were 44% in the sorafenib group and 33% in the placebo group.6The economic impact of oral chemotherapy on health care cannot be discounted. At about $50,000 to $100,000 per quality- adjusted life-year, the incremental cost-effectiveness ratio (ICER) of sorafenib over placebo was $62,473 per quality-adjusted life-year in 2007.7The purpose of this retrospective chart review was to evaluate sorafenib for efficacy and safety in a veteran population. Veterans have poorer health and more medical conditions compared with nonveterans.8 Furthermore, in the VHA, about 170,000 veterans have HCV.9 The rate of progression from HCV to HCC is about 3% to 5% annually. More than half of those diagnosed with HCC are late stage, and unfortunately, the 5-year OS rate for patients with liver cancer is 9% and 4% for those patients who are diagnosed at regional and distant stages of the disease.1 As the practice of oncology grows, it is necessary for pharmacists to be involved in the selection of chemotherapeutic agents in order to provide optimal pharmaceutical care.10
Related: VIDEO: NAFLD increasingly causing U.S. hepatocellular carcinoma
Methods
A retrospective chart review was conducted to identify patients who were prescribed sorafenib from November 1, 2007, to September 30, 2011, at the VA Greater Los Angeles Healthcare System (VAGLAHS). Inclusion criteria included patients who had a diagnosis of advanced HCC, who were initiated and managed by a VAGLAHS provider and who were eligible for a 1-year safety evaluation period. The study was approved by the VAGLAHS institutional review board.
Baseline demographic, clinical, laboratory, and medication data were collected. Demographic, clinical, laboratory, and medication data were obtained from CPRS (Computerized Patient Record System) and VistA (Veterans Health Information Systems and Technology Architecture). Data were collected on secured servers and saved on encrypted files. The master list was destroyed once the records control schedule was finalized. No identifiers were collected on the data collection sheet.
Standard practice at VAGLAHS is to monitor European Cooperative Oncology Group Performance Status (ECOG-PS), Child-Pugh class, and alpha-fetoprotein (AFP) at initiation and every 3 months and to obtain laboratory data at initiation and every month before each medication refill. Patients were seen in the Oncology Clinic periodically at the provider’s discretion. The time of drug discontinuation and the reason for drug discontinuation were recorded. Time of death at any point was collected to measure OS.
It was determined that a total sample size of 42 patients would be insufficient to achieve 80% power to demonstrate any hypothesized effects. However, the Fisher exact test was used to calculate P values for simple comparison. Patient demographics and clinical characteristics were reported as total numbers and frequencies when applicable. Survival rate was measured from the time of sorafenib initiation to 1 year after therapy initiation. Overall survival was measured from the time of sorafenib initiation to time of death. Duration of therapy was measured from the time of sorafenib initiation to time of discontinuation, either by provider or by patient.
Results
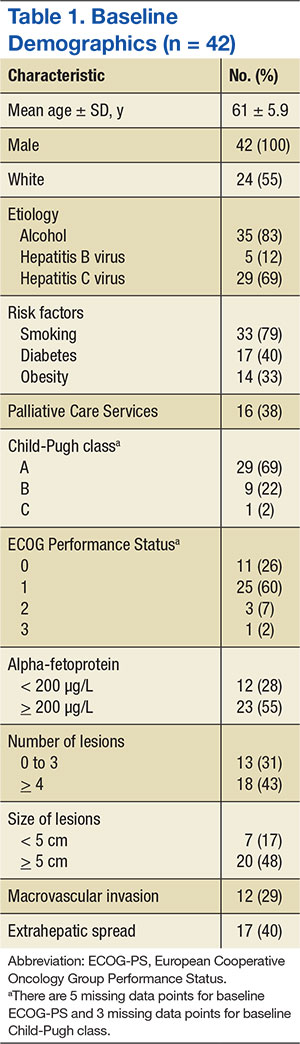
There were 83 patients who were prescribed sorafenib between November 1, 2007, and September 30, 2011. Of the 83 patients, 27 patients were ineligible for a 1-year follow-up period, 9 patients were diagnosed with non-HCC, 3 were initiated or managed by providers outside the institution, and 2 were not started on therapy. In all, 42 patients met inclusion criteria and had received at least 1 dose of sorafenib. The primary etiologies for HCC were history of alcohol abuse, HCV, and HBV. The primary risk factors were obesity, smoking, and diabetes. Many patients presented with multiple etiologies and risk factors. Ten patients (23.8%) had moderate-to-severe hepatic impairment (Child-Pugh class B or C). Baseline characteristics of these patients are listed in Table 1.
Efficacy
The median OS was 5.9 months and ranged from 21 days to 60 months. There were 17 patients who survived at the 1-year follow-up, including 1 patient who survived 363 days after treatment initiation, yielding an OS rate of 40.5%. Table 2 presents 1-year survival rates with respect to select baseline data. Baseline factors found to be negligible were age, smoking, alcohol abuse, obesity, presence of HCV, medication possession ratio (MPR), prior treatment, macrovascular invasion, and AFP. Neither initial dose regimen, final dose regimen achieved, or average dose correlated with the survival rate at the 1-year follow-up.
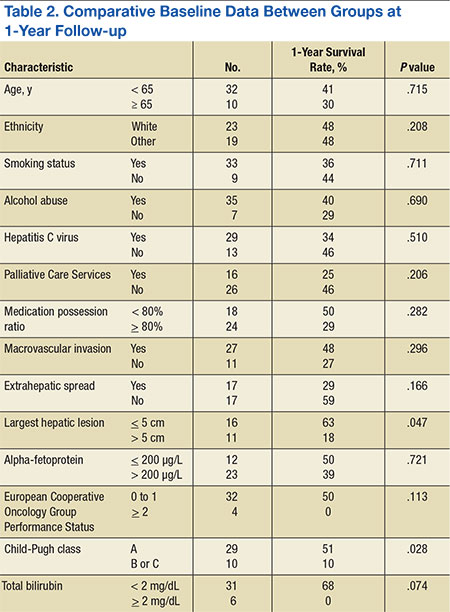
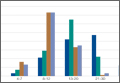
Factors possibly associated with a higher probability of survival were baseline ECOG-PS score and baseline Child-Pugh class (Table 2). Patients with an ECOG-PS score of 0 or 1 had a higher survival rate at 1 year than did patients with an ECOG-PS score of ≥ 2 (50% vs 0%, respectively; P = .113). Patients with Child-Pugh class B or C had a lower survival rate at 1 year than did patients with Child-Pugh class A (51% vs 10%, respectively; P = .028). Other indicators were size of largest hepatic lesion ≤ 5 cm, total bilirubin ≤ 2 mg/dL, concurrent treatment, almost exclusively embolization, and treatment after sorafenib discontinuation, such as another oral chemotherapeutic agent or embolization.
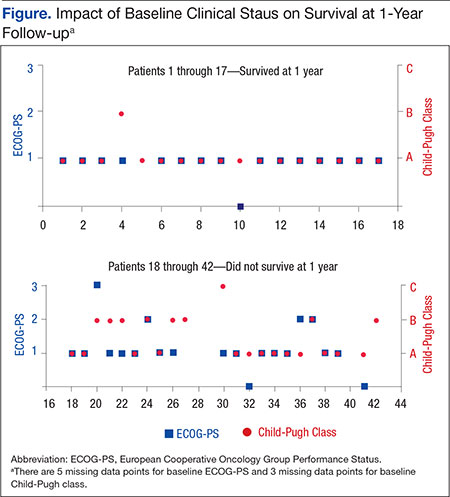
The 17 patients who survived at 1 year were reviewed to see if they shared characteristics that indicated a higher probability of survival. The figure shows the baseline ECOG-PS score and the Child-Pugh class the patients who did and did not survive at the 1-year follow-up. In the first group, all patient possessed an ECOG-PS score of 0 or 1, and only 1 patient presented with Child-Pugh class B or C. In contrast, in the group who did not survive at the 1-year follow-up, there were 4 patients with ECOG-PS scores of > 1 and 9 patients who presented with Child-Pugh class B or C. The mean AFP level of this group was < 200 µg/mL, and only 4 patients were followed by Palliative Care Services. The average normalized MPR of this group was 71.9% compared with 85.3% for those who did not survive at the 1-year follow-up.
In patients who experienced at least 1 adverse event (AE), 16 survived, whereas only 1 who did not experience an AE survived (45.7% vs 14.3%, respectively; P = .210). Thirteen patients who experienced ≥ 3 AEs survived at 1 year; and only 3 patients who reported < 3 AEs survived at 1 year (61.9% vs 14.0%, respectively; P = .011). However, when the number of AEs was normalized to duration of treatment per patient, the median frequency of AEs for all patients was 0.61 AEs per month treated. The difference in survival rates grew smaller and less significant between patients who had a frequency of AEs lower than the median compared with those with a higher ratio (52.4% vs 28.6%, respectively; P = .208). Patients affected by AEs in the first 30 days and 90 days of treatment had a survival rate at the 1-year follow-up of 42.4% and 30.2%, respectively. Patients who experienced dermatologic AEs had a higher survival rate than those who did not have dermatologic AEs (60.0% vs 29.6%, respectively; P = .099). This correlation was not found with 2 other classes of AEs, gastrointestinal (50.0% vs 27.8%; P = .208) or neurologic (64.0% vs 41.2%; P = .209).
The median overall time to discontinuation was 3.4 months. The main reasons cited for discontinuing sorafenib at 1 year included symptomatic progression (52.4%), radiographic progression (23.8%), severe AEs (16.7%), and mild-to-moderate AEs (11.9%). There was overlap, as 15 patients discontinued treatment for multiple reasons. For the 22 patients who discontinued medication due to symptomatic progression at 1 year, the median time to discontinuation was 3.8 months. For the 10 patients who discontinued medication due to radiographic progression at 1 year, median time to discontinuation was 5.6 months. Seven patients (16.7%) were still on therapy at 1 year.The study considered the impact of potential dose adjustments on survival rate and safety. The authors compared patients’ prescribed dose with the recommended dose based on the package insert and monthly laboratory values if recorded. The prescribed dose was recorded as appropriate dose, below dose, above dose, or indeterminate due to the lack of current laboratory values. Patients who survived at the 1-year follow-up had a composition of 26%, 21%, 10%, and 43%, respectively. These results were similar to those of patients who did not survive at the 1-year follow-up, 29%, 12%, 30%, and 29%, respectively.
Based on medication refill history and VA acquisition cost, the total prescription drug cost of treating 42 patients with sorafenib was $388,370.40. The total number of days survived for these patients was 16,607 days, which equates to $8,535.87 per year lived.
Safety
Of the 42 patients, 35 patients experienced ≥ 1 AE for a total of 122 AEs reported. The median number of AEs per patient was 2.5. The median time to the first AE was 21 days and ranged from 3 to 244 days. In the first 30 days of treatment, 23 patients (54.7%) reported 47 AEs (39.5%). In the first 90 days of treatment, 33 patients (78.6%) reported 88 AEs (73.9%). Common AEs in both instances were diarrhea, fatigue, erythematous plantar-palmar rash, and nausea (Table 3).
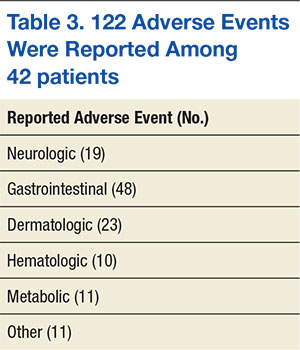
The predominant classes of AEs were GI (39.3%), dermatologic (18.9%), and neurologic (15.6%). Erythematous palmar-plantar rash, also known as hand-foot syndrome, has been noted as a potential dose-limiting sorafenib AE if the rash is recurrent or severe. One patient experienced recurrent grade-2 rashes, and sorafenib was immediately discontinued after an attempt to lower the dose. There were 8 patients who reported serious AEs, and 5 were hospitalized. One patient continued therapy despite GI hemorrhage. The other 4 patients discontinued therapy on hospitalization and were seen for intracranial hemorrhage, GI perforation, acute renal failure, and acute liver failure. In the first 3 cases, sorafenib could not be ruled out as the primary cause of death. None of these patients presented with comorbidities, such as hypertension, which predisposed them to AEs.
Overall, 38 patients ended therapy at the recommended regimen of 400 mg twice daily, and the average total daily dose was 619 mg, just below 80% of the recommended daily dose. Reasons for not achieving 400 mg twice daily included slow titration, AEs, and dose adjustments for compromised renal and hepatic function such as dialysis. Patients who had an ECOG-PS score of 0 or 1 or Child-Pugh class A reported ≥ 3 AEs, but when normalized to duration of treatment, no difference was observed. No correlations were found for average dose, creatinine clearance, aspartate aminotransferase, platelets, total bilirubin, or weight and number or frequency of AEs.
In regard to potential dose adjustments, the doses (400 mg twice daily, 600 mg daily [400 mg + 200 mg in 2 doses], 200 mg twice daily, and 200 mg daily) did not correlate well with AEs. Patients who had < 3 AEs presented with the breakdown 23%, 16%, 22%, and 38%, similar to patients who had ≥ 3 AEs—30%, 19%, 14%, and 37%. Likewise, patients who had a frequency of AEs lower than the median presented with the breakdown 22%, 22%, 15%, and 40% compared with patients who had more AEs than the median—37%, 9%, 23%, and 31%.
Related: Hepatocellular Carcinoma: To Biopsy or Not?
Discussion
Sorafenib is the only oral oncology medication approved by the FDA for treatment of unresectable HCC.3 Prior to sorafenib, the AASLD recommendation was supportive care for patients presenting with BCLC-Stage C liver cancer. However, guidelines changed when SHARP showed that sorafenib provided a survival benefit with a tolerable AE profile. The survival benefit of sorafenib has been replicated in a few large, multicenter trials. In Asia, Cheng and colleagues saw improved median OS of 6.5 months for sorafenib compared with 4.2 months with placebo, and in Italy, Iavarone and colleagues showed a median OS of 10.5 months without a placebo comparator.11,12
In the veteran population for this study, the OS rate of 40.5% was similar to the rate reported in the SHARP study, although the patients’ median OS fell short of the time described in SHARP and other trials. The medical complexities involved in treating veterans may explain this difference. The veteran population is heterogeneous with diverse ethnic backgrounds, several comorbidities, and varying degrees of organ dysfunction. The authors compared survival rates of different subgroups to test the hypothesis that the probability of survival while on therapy should not depend on demographics or medical history. However, in this study, patients with minimal impact from HCC, such as mild hepatic impairment and high-functional status, demonstrated higher survival rates at 1-year follow-up than did those without significant compromise.Although the high prevalence of HCV and alcohol abuse in the veteran population has resulted in a high incidence of hepatic dysfunction, this study suggests that these factors are independent of survival if liver function or integrity has not been compromised.9
Some researchers have hypothesized that clinical toxicities from tyrosine kinase inhibitors may correlate with survival.13 The authors noticed that the presentation of dermatologic AEs may reflect improved survival. In this study, patients who experienced ≥ 1 AE and ≥ 3 AEs had survival rates at the 1-year follow-up of 45.7% and 61.9%, respectively. Moreover, patients affected by AEs in the first 90 days of treatment had a survival rate at the 1-year follow-up of 42.4%.
Caution is advised when drawing conclusions from the number of AEs or when they appear, because this may falsely favor correlation. Patients who survive longer have additional time to report an AE. Therefore, the authors also looked at the ratio of AEs over time per patient to consider the number of AEs per duration of treatment and saw that there was little difference in survival rate in this regard. When considering patients affected by AEs only in the first 30 days of treatment, the survival rate at the 1-year follow-up fell to 30.2%.
A more likely factor for the survival of the 17 patients who were alive at the 1-year follow-up was their overall health relative to the rest of the study group. Overall health may indicate survival independent of sorafenib. The group of 17 who survived at the 1-year follow-up reflected a population that was different from the rest of the study population. The subset was generally healthier with better ECOG-PS scores and Child-Pugh classes, was not followed by Palliative Care Services, and had a mean AFP level under the threshold for diagnosis of HCC in patients who present with hepatic lesions and elevated AFP.14 This subset’s MPR, a surrogate marker for adherence, was less than the accepted threshold in clinical practice for oral medications.15Evaluating the patient’s dose regimen was expected to reveal a relationship between dosing and clinical outcomes, such as low survival rates with low doses or more AEs with high doses. However, the authors were not able to establish this link. In fact, the median time to discontinuation of 3.4 months for the study group, or duration of treatment, was much shorter than the median OS of 5.9 months.
These findings were consistent with Cabibbo and colleagues, who conducted a meta-analysis of survival rates for untreated patients and found that impaired performance status and Child-Pugh class B or C were independently associated with shorter survival.16 The SHARP study and Cheng and colleagues also attempted to exclude patients who were not Child-Pugh class A in their studies, which suggests a negligible correlation between sorafenib and survival time and a close relationship between baseline clinical status and survival.
The authors determined that prior treatment, including locoregional therapy, was not a factor in predicting survival. This observation is confirmed by the results of a phase 3 study that looked at sorafenib as adjuvant treatment for patients who had no detectable disease after surgical resection or local ablation.17 The trial did not meet its primary endpoint of improved recurrence-free survival. However, the authors observed in this study that 4 patients who underwent resection of the liver before sorafenib had a mean OS of 2.9 years. One patient, who was alive at the time of the study conclusion, received only 22 days of sorafenib treatment and survived for 4.9 years after sorafenib discontinuation. Patients who received concurrent or postsorafenib treatment had higher survival rates.
The cost of treatment in this study was found to be $8,535.87 per year lived. Although formal quality of life assessments were not captured, medication was discontinued at the first sign of disease progression or AE as determined by the provider or patient. When the cost of treatment was adjusted to account for median OS time and VA drug acquisition costs, estimated at average wholesale price minus 40%, the cost of treatment was within the threshold of $50,000-$100,000 per quality-adjusted life-year.7,18Of the 42 patients in this study, 28.6% discontinued therapy due to AEs, compared with 32% observed in the SHARP study. Common GI, dermatologic, and CNS AEs were comparable between the 2 studies. Serious AEs included intracranial hemorrhage, GI hemorrhage, GI perforation, acute liver failure, and acute renal failure; 3 of these events led to death. About 12% of patients experienced bleeding, regardless of severity, compared with the 18% seen in SHARP, despite no prior history of hemorrhage or GI perforation.5 The authors did not find any clinical factors at baseline that predisposed patients to AEs. It was also difficult to distinguish between drug-related AEs and general disease progression.
Although the authors did not find a relationship between dose or dose adjustments and the number or frequency of AEs, there were serious adverse outcomes in this study that were also rare complications observed in SHARP. The decision to start sorafenib should not be taken lightly.
Related: Diagnostic Dilemma of Hepatocellular Carcinoma Presenting as Hepatic Angiomyolipoma
Limitations
This retrospective review had several limitations. In SHARP and other large, multicenter trials, patients were continued on therapy until they experienced both symptomatic and radiographic progression. In this study, patients were discontinued at the first sign of progression, either symptomatic or radiographic or both. Had all patients remained on therapy until symptomatic and radiographic signs of progression were observed, there could have been a better correlation between duration of treatment and OS, symptomatic progression, or radiographic progression. The authors acknowledge, however, that there is diminishing benefit of administering chemotherapy when there are known and potentially serious AEs.
The data for this study were limited due to a small sample size, and it was not powered to evaluate for statistically significant characteristics between the patients who survived at the 1-year follow-up and the patients who did not survive at the 1-year follow-up. This information would be useful to identify potential prognostic factors and guide providers in sorafenib management. Finally, a long-term safety profile could not be established, as patients were evaluated for a 1-year period.
Ultimately, HCC is a multifactorial disease, and it is difficult to account for all potential confounding factors. Additional research, including studies comparing sunitinib or a control group to sorafenib, may provide further insight.
Conclusions
In light of these results, the authors believe that sorafenib may be considered for veterans with unresectable HCC and who are contraindicated for alternative treatments. One-year survival rates were similar to those seen in previous studies. However, there was no clear association between the duration of treatment and OS, and although the medication was well tolerated, there were also serious AEs. It is prudent to continually assess the need for therapy throughout the treatment period.
Pharmacists have a critical role in care for oncology patients, from the integration of certified clinical pharmacist practitioners into hematology-oncology clinics to patient monitoring through oral oncology pharmacy programs.19,20 These programs have been shown to improve patient outcomes and decrease overall health care use and may benefit the veteran population.
In this study, a veteran population achieved a survival rate at the 1-year follow-up similar to that found in SHARP: 40.5% vs 44%. However, OS was markedly shorter: 5.9 months vs 10.7 months. Patients with minimal impact from HCC, such as mild hepatic impairment and high functional status, demonstrated higher survival rates at the 1-year follow-up than did those with significant compromise. Thirty-five patients experienced ≥1 AE, most observed within the first 90 days of treatment, and for 3 patients, sorafenib could not be ruled out as the cause of death.
Sorafenib remains a viable therapeutic option for veterans with advanced HCC. However, it is uncertain how much benefit sorafenib affords to the veteran population, especially with the associated risks.
Author disclosures
The authors report no actual or potential conflicts of interest with regard to this article.
Disclaimer
The opinions expressed herein are those of the authors and do not necessarily reflect those of Federal Practitioner, Frontline Medical Communications Inc., the U.S. Government, or any of its agencies. This article may discuss unlabeled or investigational use of certain drugs. Please review the complete prescribing information for specific drugs or drug combinations—including indications, contraindications, warnings, and adverse effects—before administering pharmacologic therapy to patients.
1. American Cancer Society. Cancer Facts & Figures 2015. Atlanta, GA: American Cancer Society; 2015.
2. El-Serag HB. Epidemiology of viral hepatitis and hepatocellular carcinoma. Gastroenterology. 2012;142(6):1264-1273.
3. Sanyal AJ, Yoon SK, Lencioni R. The etiology of hepatocellular carcinoma and consequences for treatment. Oncologist. 2010;15(suppl 4):14-22.
4. Nexavar [package insert]. Emeryville, CA: Bayer HealthCare Pharmaceuticals, Inc; 2009.
5. National Comprehensive Cancer Network. NCCN clinical practice guidelines in oncology: hepatobiliary cancers. Version 2. 2015. National Comprehensive Cancer Network Website. http://www.nccn.org/professionals/physician_gls/pdf/hepatobiliary.pdf. Accessed October 13, 2015.
6. Llovet JM, Ricci S, Mazzaferro V, et al; SHARP Investigators Study Group. Sorafenib in advanced hepatocellular carcinoma. N Engl J Med. 2008;359(4):378-390.
7. Carr BI, Carroll S, Muszbek N, Gondek K. Economic evaluation of sorafenib in unresectable hepatocellular carcinoma. J Gastroenterol Hepatol. 2010;25(11):1739-1746.
8. Agha Z, Lofgren RP, VanRuiswyk JV, Layde PM. Are patients at Veterans Affairs medical centers sicker? A comparative analysis of health status and medical resource use. Arch Intern Med. 2000;160(21):3252-3257.
9. U.S. Department of Veterans Affairs, Veterans Health Administration. National Viral Hepatitis Program. VHA Directive 1300.01. U.S. Department of Veterans Affairs Website. http://www1.va.gov/vhapublications/ViewPublication.asp?pub_ID=1586. Updated February 22, 2013. Accessed October 13, 2015.
10. Patterson CJ. Best practices in specialty pharmacy management. J Manag Care Pharm. 2013;19(1):42-48.
11. Cheng AL, Kang YK, Chen Z, et al. Efficacy and safety of sorafenib in patients in the Asia-Pacific region with advanced hepatocellular carcinoma: a phase III randomised, double-blind, placebo-controlled trial. Lancet Oncol. 2009;10(1):25-34.
12. Iavarone M, Cabibbo G, Piscaglia F, et al; SOFIA (SOraFenib Italian Assessment) study group. Field-practice study of sorafenib therapy for hepatocellular carcinoma: a prospective multicenter study in Italy. Hepatology. 2011;54(6):2055-2063.
13. Di Fiore F, Rigal O, Ménager C, Michel P, Pfister C. Severe clinical toxicities are correlated with survival in patients with advanced renal cell carcinoma treated with sunitinib and sorafenib. Br J Cancer. 2011;105(12):1811-1813.
14. Bruix J, Sherman M; American Association for the Study of Liver Diseases. Management of hepatocellular carcinoma: an update. Hepatology. 2011;53(3):1020-1022.
15. Blandford L, Dans PE, Ober JD, Wheelock C. Analyzing variations in medication compliance related to individual drug, drug class, and prescribing physician. J Managed Care Pharm. 1999;5(1):47-51.
16. Cabibbo G, Enea M, Attanasio M, Bruix J, Craxì A, Cammà C. A meta-analysis of survival rates of untreated patients in randomized clinical trials of hepatocellular carcinoma. Hepatology. 2010;51(4):1274-1283.
17. Bayer HealthCare. Sorafenib as Adjuvant Treatment in the Prevention of Recurrence of Hepatocellular Carcinoma (STORM). ClinicalTrials.gov Website. https://clinicaltrials.gov/ct2/show/NCT00692770. Updated May 28, 2015. Accessed October 21, 2015.
18. Academy of Managed Care Pharmacy. AMCP Guide to Pharmaceutical Payment Methods, 2009 Update (Version 2.0). J Manag Care Pharm. 2009;15(suppl 6-a):S3-S57.
19. Valgus JM, Faso A, Gregory KM, et al. Integration of a clinical pharmacist into the hematology-oncology clinics at an academic medical center. Am J Health Syst Pharm. 2011;68(7):613-619.
20. Tschida SJ, Aslam S, Lal LS, et al. Outcomes of a specialty pharmacy program for oral oncology medications. Am J Pharm Benefits. 2012;4(4):165-174.
In 2015, more than 35,660 new cases of liver cancer and 24,550 liver cancer-related deaths are expected to occur in the U.S. About 80% of these cases will consist of hepatocellular carcinoma, (HCC).1 The incidence of HCC varies throughout the world: Incidence is as low as 5 in 100,000 individuals in North America and ranges up to > 20 in 100,000 individuals in sub-Saharan Africa and Eastern Asia.2 Nearly half of all cases of HCC are associated with hepatitis B virus (HBV), and another 25% are associated with hepatitis C virus (HCV). Other risk factors for developing HCC include alcoholic liver disease, nonalcoholic steatohepatitis, flatoxin-contaminated food, diabetes, and obesity.3
Therapeutic options for advanced HCC are limited. The FDA approved sorafenib in 2008 for the treatment of unresectable HCC.4 According to the American Association for the Study of Liver Diseases (AASLD) and the Barcelona Clinic Liver Cancer (BCLC) staging system, patients with Stage C liver cancer may undergo a trial of sorafenib.4 National Comprehensive Cancer Network (NCCN) clinical guidelines for hepatobiliary cancers reserve sorafenib for patients with inoperable tumors, metastatic disease, or extensive liver tumor burden.5 Sorafenib is shown to inhibit multiple intracellular and cell surface kinases. Several of these kinases are thought to be involved in tumor cell signaling, angiogenesis, and apoptosis.4 In the Sorafenib HCC Assessment Randomized Protocol (SHARP) trial, median overall survival (OS) was 10.7 months in the sorafenib group and 7.9 months in the placebo group.6 The predicted survival rates at 1 year were 44% in the sorafenib group and 33% in the placebo group.6The economic impact of oral chemotherapy on health care cannot be discounted. At about $50,000 to $100,000 per quality- adjusted life-year, the incremental cost-effectiveness ratio (ICER) of sorafenib over placebo was $62,473 per quality-adjusted life-year in 2007.7The purpose of this retrospective chart review was to evaluate sorafenib for efficacy and safety in a veteran population. Veterans have poorer health and more medical conditions compared with nonveterans.8 Furthermore, in the VHA, about 170,000 veterans have HCV.9 The rate of progression from HCV to HCC is about 3% to 5% annually. More than half of those diagnosed with HCC are late stage, and unfortunately, the 5-year OS rate for patients with liver cancer is 9% and 4% for those patients who are diagnosed at regional and distant stages of the disease.1 As the practice of oncology grows, it is necessary for pharmacists to be involved in the selection of chemotherapeutic agents in order to provide optimal pharmaceutical care.10
Related: VIDEO: NAFLD increasingly causing U.S. hepatocellular carcinoma
Methods
A retrospective chart review was conducted to identify patients who were prescribed sorafenib from November 1, 2007, to September 30, 2011, at the VA Greater Los Angeles Healthcare System (VAGLAHS). Inclusion criteria included patients who had a diagnosis of advanced HCC, who were initiated and managed by a VAGLAHS provider and who were eligible for a 1-year safety evaluation period. The study was approved by the VAGLAHS institutional review board.
Baseline demographic, clinical, laboratory, and medication data were collected. Demographic, clinical, laboratory, and medication data were obtained from CPRS (Computerized Patient Record System) and VistA (Veterans Health Information Systems and Technology Architecture). Data were collected on secured servers and saved on encrypted files. The master list was destroyed once the records control schedule was finalized. No identifiers were collected on the data collection sheet.
Standard practice at VAGLAHS is to monitor European Cooperative Oncology Group Performance Status (ECOG-PS), Child-Pugh class, and alpha-fetoprotein (AFP) at initiation and every 3 months and to obtain laboratory data at initiation and every month before each medication refill. Patients were seen in the Oncology Clinic periodically at the provider’s discretion. The time of drug discontinuation and the reason for drug discontinuation were recorded. Time of death at any point was collected to measure OS.
It was determined that a total sample size of 42 patients would be insufficient to achieve 80% power to demonstrate any hypothesized effects. However, the Fisher exact test was used to calculate P values for simple comparison. Patient demographics and clinical characteristics were reported as total numbers and frequencies when applicable. Survival rate was measured from the time of sorafenib initiation to 1 year after therapy initiation. Overall survival was measured from the time of sorafenib initiation to time of death. Duration of therapy was measured from the time of sorafenib initiation to time of discontinuation, either by provider or by patient.
Results
There were 83 patients who were prescribed sorafenib between November 1, 2007, and September 30, 2011. Of the 83 patients, 27 patients were ineligible for a 1-year follow-up period, 9 patients were diagnosed with non-HCC, 3 were initiated or managed by providers outside the institution, and 2 were not started on therapy. In all, 42 patients met inclusion criteria and had received at least 1 dose of sorafenib. The primary etiologies for HCC were history of alcohol abuse, HCV, and HBV. The primary risk factors were obesity, smoking, and diabetes. Many patients presented with multiple etiologies and risk factors. Ten patients (23.8%) had moderate-to-severe hepatic impairment (Child-Pugh class B or C). Baseline characteristics of these patients are listed in Table 1.
Efficacy
The median OS was 5.9 months and ranged from 21 days to 60 months. There were 17 patients who survived at the 1-year follow-up, including 1 patient who survived 363 days after treatment initiation, yielding an OS rate of 40.5%. Table 2 presents 1-year survival rates with respect to select baseline data. Baseline factors found to be negligible were age, smoking, alcohol abuse, obesity, presence of HCV, medication possession ratio (MPR), prior treatment, macrovascular invasion, and AFP. Neither initial dose regimen, final dose regimen achieved, or average dose correlated with the survival rate at the 1-year follow-up.
Factors possibly associated with a higher probability of survival were baseline ECOG-PS score and baseline Child-Pugh class (Table 2). Patients with an ECOG-PS score of 0 or 1 had a higher survival rate at 1 year than did patients with an ECOG-PS score of ≥ 2 (50% vs 0%, respectively; P = .113). Patients with Child-Pugh class B or C had a lower survival rate at 1 year than did patients with Child-Pugh class A (51% vs 10%, respectively; P = .028). Other indicators were size of largest hepatic lesion ≤ 5 cm, total bilirubin ≤ 2 mg/dL, concurrent treatment, almost exclusively embolization, and treatment after sorafenib discontinuation, such as another oral chemotherapeutic agent or embolization.
The 17 patients who survived at 1 year were reviewed to see if they shared characteristics that indicated a higher probability of survival. The figure shows the baseline ECOG-PS score and the Child-Pugh class the patients who did and did not survive at the 1-year follow-up. In the first group, all patient possessed an ECOG-PS score of 0 or 1, and only 1 patient presented with Child-Pugh class B or C. In contrast, in the group who did not survive at the 1-year follow-up, there were 4 patients with ECOG-PS scores of > 1 and 9 patients who presented with Child-Pugh class B or C. The mean AFP level of this group was < 200 µg/mL, and only 4 patients were followed by Palliative Care Services. The average normalized MPR of this group was 71.9% compared with 85.3% for those who did not survive at the 1-year follow-up.
In patients who experienced at least 1 adverse event (AE), 16 survived, whereas only 1 who did not experience an AE survived (45.7% vs 14.3%, respectively; P = .210). Thirteen patients who experienced ≥ 3 AEs survived at 1 year; and only 3 patients who reported < 3 AEs survived at 1 year (61.9% vs 14.0%, respectively; P = .011). However, when the number of AEs was normalized to duration of treatment per patient, the median frequency of AEs for all patients was 0.61 AEs per month treated. The difference in survival rates grew smaller and less significant between patients who had a frequency of AEs lower than the median compared with those with a higher ratio (52.4% vs 28.6%, respectively; P = .208). Patients affected by AEs in the first 30 days and 90 days of treatment had a survival rate at the 1-year follow-up of 42.4% and 30.2%, respectively. Patients who experienced dermatologic AEs had a higher survival rate than those who did not have dermatologic AEs (60.0% vs 29.6%, respectively; P = .099). This correlation was not found with 2 other classes of AEs, gastrointestinal (50.0% vs 27.8%; P = .208) or neurologic (64.0% vs 41.2%; P = .209).
The median overall time to discontinuation was 3.4 months. The main reasons cited for discontinuing sorafenib at 1 year included symptomatic progression (52.4%), radiographic progression (23.8%), severe AEs (16.7%), and mild-to-moderate AEs (11.9%). There was overlap, as 15 patients discontinued treatment for multiple reasons. For the 22 patients who discontinued medication due to symptomatic progression at 1 year, the median time to discontinuation was 3.8 months. For the 10 patients who discontinued medication due to radiographic progression at 1 year, median time to discontinuation was 5.6 months. Seven patients (16.7%) were still on therapy at 1 year.The study considered the impact of potential dose adjustments on survival rate and safety. The authors compared patients’ prescribed dose with the recommended dose based on the package insert and monthly laboratory values if recorded. The prescribed dose was recorded as appropriate dose, below dose, above dose, or indeterminate due to the lack of current laboratory values. Patients who survived at the 1-year follow-up had a composition of 26%, 21%, 10%, and 43%, respectively. These results were similar to those of patients who did not survive at the 1-year follow-up, 29%, 12%, 30%, and 29%, respectively.
Based on medication refill history and VA acquisition cost, the total prescription drug cost of treating 42 patients with sorafenib was $388,370.40. The total number of days survived for these patients was 16,607 days, which equates to $8,535.87 per year lived.
Safety
Of the 42 patients, 35 patients experienced ≥ 1 AE for a total of 122 AEs reported. The median number of AEs per patient was 2.5. The median time to the first AE was 21 days and ranged from 3 to 244 days. In the first 30 days of treatment, 23 patients (54.7%) reported 47 AEs (39.5%). In the first 90 days of treatment, 33 patients (78.6%) reported 88 AEs (73.9%). Common AEs in both instances were diarrhea, fatigue, erythematous plantar-palmar rash, and nausea (Table 3).
The predominant classes of AEs were GI (39.3%), dermatologic (18.9%), and neurologic (15.6%). Erythematous palmar-plantar rash, also known as hand-foot syndrome, has been noted as a potential dose-limiting sorafenib AE if the rash is recurrent or severe. One patient experienced recurrent grade-2 rashes, and sorafenib was immediately discontinued after an attempt to lower the dose. There were 8 patients who reported serious AEs, and 5 were hospitalized. One patient continued therapy despite GI hemorrhage. The other 4 patients discontinued therapy on hospitalization and were seen for intracranial hemorrhage, GI perforation, acute renal failure, and acute liver failure. In the first 3 cases, sorafenib could not be ruled out as the primary cause of death. None of these patients presented with comorbidities, such as hypertension, which predisposed them to AEs.
Overall, 38 patients ended therapy at the recommended regimen of 400 mg twice daily, and the average total daily dose was 619 mg, just below 80% of the recommended daily dose. Reasons for not achieving 400 mg twice daily included slow titration, AEs, and dose adjustments for compromised renal and hepatic function such as dialysis. Patients who had an ECOG-PS score of 0 or 1 or Child-Pugh class A reported ≥ 3 AEs, but when normalized to duration of treatment, no difference was observed. No correlations were found for average dose, creatinine clearance, aspartate aminotransferase, platelets, total bilirubin, or weight and number or frequency of AEs.
In regard to potential dose adjustments, the doses (400 mg twice daily, 600 mg daily [400 mg + 200 mg in 2 doses], 200 mg twice daily, and 200 mg daily) did not correlate well with AEs. Patients who had < 3 AEs presented with the breakdown 23%, 16%, 22%, and 38%, similar to patients who had ≥ 3 AEs—30%, 19%, 14%, and 37%. Likewise, patients who had a frequency of AEs lower than the median presented with the breakdown 22%, 22%, 15%, and 40% compared with patients who had more AEs than the median—37%, 9%, 23%, and 31%.
Related: Hepatocellular Carcinoma: To Biopsy or Not?
Discussion
Sorafenib is the only oral oncology medication approved by the FDA for treatment of unresectable HCC.3 Prior to sorafenib, the AASLD recommendation was supportive care for patients presenting with BCLC-Stage C liver cancer. However, guidelines changed when SHARP showed that sorafenib provided a survival benefit with a tolerable AE profile. The survival benefit of sorafenib has been replicated in a few large, multicenter trials. In Asia, Cheng and colleagues saw improved median OS of 6.5 months for sorafenib compared with 4.2 months with placebo, and in Italy, Iavarone and colleagues showed a median OS of 10.5 months without a placebo comparator.11,12
In the veteran population for this study, the OS rate of 40.5% was similar to the rate reported in the SHARP study, although the patients’ median OS fell short of the time described in SHARP and other trials. The medical complexities involved in treating veterans may explain this difference. The veteran population is heterogeneous with diverse ethnic backgrounds, several comorbidities, and varying degrees of organ dysfunction. The authors compared survival rates of different subgroups to test the hypothesis that the probability of survival while on therapy should not depend on demographics or medical history. However, in this study, patients with minimal impact from HCC, such as mild hepatic impairment and high-functional status, demonstrated higher survival rates at 1-year follow-up than did those without significant compromise.Although the high prevalence of HCV and alcohol abuse in the veteran population has resulted in a high incidence of hepatic dysfunction, this study suggests that these factors are independent of survival if liver function or integrity has not been compromised.9
Some researchers have hypothesized that clinical toxicities from tyrosine kinase inhibitors may correlate with survival.13 The authors noticed that the presentation of dermatologic AEs may reflect improved survival. In this study, patients who experienced ≥ 1 AE and ≥ 3 AEs had survival rates at the 1-year follow-up of 45.7% and 61.9%, respectively. Moreover, patients affected by AEs in the first 90 days of treatment had a survival rate at the 1-year follow-up of 42.4%.
Caution is advised when drawing conclusions from the number of AEs or when they appear, because this may falsely favor correlation. Patients who survive longer have additional time to report an AE. Therefore, the authors also looked at the ratio of AEs over time per patient to consider the number of AEs per duration of treatment and saw that there was little difference in survival rate in this regard. When considering patients affected by AEs only in the first 30 days of treatment, the survival rate at the 1-year follow-up fell to 30.2%.
A more likely factor for the survival of the 17 patients who were alive at the 1-year follow-up was their overall health relative to the rest of the study group. Overall health may indicate survival independent of sorafenib. The group of 17 who survived at the 1-year follow-up reflected a population that was different from the rest of the study population. The subset was generally healthier with better ECOG-PS scores and Child-Pugh classes, was not followed by Palliative Care Services, and had a mean AFP level under the threshold for diagnosis of HCC in patients who present with hepatic lesions and elevated AFP.14 This subset’s MPR, a surrogate marker for adherence, was less than the accepted threshold in clinical practice for oral medications.15Evaluating the patient’s dose regimen was expected to reveal a relationship between dosing and clinical outcomes, such as low survival rates with low doses or more AEs with high doses. However, the authors were not able to establish this link. In fact, the median time to discontinuation of 3.4 months for the study group, or duration of treatment, was much shorter than the median OS of 5.9 months.
These findings were consistent with Cabibbo and colleagues, who conducted a meta-analysis of survival rates for untreated patients and found that impaired performance status and Child-Pugh class B or C were independently associated with shorter survival.16 The SHARP study and Cheng and colleagues also attempted to exclude patients who were not Child-Pugh class A in their studies, which suggests a negligible correlation between sorafenib and survival time and a close relationship between baseline clinical status and survival.
The authors determined that prior treatment, including locoregional therapy, was not a factor in predicting survival. This observation is confirmed by the results of a phase 3 study that looked at sorafenib as adjuvant treatment for patients who had no detectable disease after surgical resection or local ablation.17 The trial did not meet its primary endpoint of improved recurrence-free survival. However, the authors observed in this study that 4 patients who underwent resection of the liver before sorafenib had a mean OS of 2.9 years. One patient, who was alive at the time of the study conclusion, received only 22 days of sorafenib treatment and survived for 4.9 years after sorafenib discontinuation. Patients who received concurrent or postsorafenib treatment had higher survival rates.
The cost of treatment in this study was found to be $8,535.87 per year lived. Although formal quality of life assessments were not captured, medication was discontinued at the first sign of disease progression or AE as determined by the provider or patient. When the cost of treatment was adjusted to account for median OS time and VA drug acquisition costs, estimated at average wholesale price minus 40%, the cost of treatment was within the threshold of $50,000-$100,000 per quality-adjusted life-year.7,18Of the 42 patients in this study, 28.6% discontinued therapy due to AEs, compared with 32% observed in the SHARP study. Common GI, dermatologic, and CNS AEs were comparable between the 2 studies. Serious AEs included intracranial hemorrhage, GI hemorrhage, GI perforation, acute liver failure, and acute renal failure; 3 of these events led to death. About 12% of patients experienced bleeding, regardless of severity, compared with the 18% seen in SHARP, despite no prior history of hemorrhage or GI perforation.5 The authors did not find any clinical factors at baseline that predisposed patients to AEs. It was also difficult to distinguish between drug-related AEs and general disease progression.
Although the authors did not find a relationship between dose or dose adjustments and the number or frequency of AEs, there were serious adverse outcomes in this study that were also rare complications observed in SHARP. The decision to start sorafenib should not be taken lightly.
Related: Diagnostic Dilemma of Hepatocellular Carcinoma Presenting as Hepatic Angiomyolipoma
Limitations
This retrospective review had several limitations. In SHARP and other large, multicenter trials, patients were continued on therapy until they experienced both symptomatic and radiographic progression. In this study, patients were discontinued at the first sign of progression, either symptomatic or radiographic or both. Had all patients remained on therapy until symptomatic and radiographic signs of progression were observed, there could have been a better correlation between duration of treatment and OS, symptomatic progression, or radiographic progression. The authors acknowledge, however, that there is diminishing benefit of administering chemotherapy when there are known and potentially serious AEs.
The data for this study were limited due to a small sample size, and it was not powered to evaluate for statistically significant characteristics between the patients who survived at the 1-year follow-up and the patients who did not survive at the 1-year follow-up. This information would be useful to identify potential prognostic factors and guide providers in sorafenib management. Finally, a long-term safety profile could not be established, as patients were evaluated for a 1-year period.
Ultimately, HCC is a multifactorial disease, and it is difficult to account for all potential confounding factors. Additional research, including studies comparing sunitinib or a control group to sorafenib, may provide further insight.
Conclusions
In light of these results, the authors believe that sorafenib may be considered for veterans with unresectable HCC and who are contraindicated for alternative treatments. One-year survival rates were similar to those seen in previous studies. However, there was no clear association between the duration of treatment and OS, and although the medication was well tolerated, there were also serious AEs. It is prudent to continually assess the need for therapy throughout the treatment period.
Pharmacists have a critical role in care for oncology patients, from the integration of certified clinical pharmacist practitioners into hematology-oncology clinics to patient monitoring through oral oncology pharmacy programs.19,20 These programs have been shown to improve patient outcomes and decrease overall health care use and may benefit the veteran population.
In this study, a veteran population achieved a survival rate at the 1-year follow-up similar to that found in SHARP: 40.5% vs 44%. However, OS was markedly shorter: 5.9 months vs 10.7 months. Patients with minimal impact from HCC, such as mild hepatic impairment and high functional status, demonstrated higher survival rates at the 1-year follow-up than did those with significant compromise. Thirty-five patients experienced ≥1 AE, most observed within the first 90 days of treatment, and for 3 patients, sorafenib could not be ruled out as the cause of death.
Sorafenib remains a viable therapeutic option for veterans with advanced HCC. However, it is uncertain how much benefit sorafenib affords to the veteran population, especially with the associated risks.
Author disclosures
The authors report no actual or potential conflicts of interest with regard to this article.
Disclaimer
The opinions expressed herein are those of the authors and do not necessarily reflect those of Federal Practitioner, Frontline Medical Communications Inc., the U.S. Government, or any of its agencies. This article may discuss unlabeled or investigational use of certain drugs. Please review the complete prescribing information for specific drugs or drug combinations—including indications, contraindications, warnings, and adverse effects—before administering pharmacologic therapy to patients.
1. American Cancer Society. Cancer Facts & Figures 2015. Atlanta, GA: American Cancer Society; 2015.
2. El-Serag HB. Epidemiology of viral hepatitis and hepatocellular carcinoma. Gastroenterology. 2012;142(6):1264-1273.
3. Sanyal AJ, Yoon SK, Lencioni R. The etiology of hepatocellular carcinoma and consequences for treatment. Oncologist. 2010;15(suppl 4):14-22.
4. Nexavar [package insert]. Emeryville, CA: Bayer HealthCare Pharmaceuticals, Inc; 2009.
5. National Comprehensive Cancer Network. NCCN clinical practice guidelines in oncology: hepatobiliary cancers. Version 2. 2015. National Comprehensive Cancer Network Website. http://www.nccn.org/professionals/physician_gls/pdf/hepatobiliary.pdf. Accessed October 13, 2015.
6. Llovet JM, Ricci S, Mazzaferro V, et al; SHARP Investigators Study Group. Sorafenib in advanced hepatocellular carcinoma. N Engl J Med. 2008;359(4):378-390.
7. Carr BI, Carroll S, Muszbek N, Gondek K. Economic evaluation of sorafenib in unresectable hepatocellular carcinoma. J Gastroenterol Hepatol. 2010;25(11):1739-1746.
8. Agha Z, Lofgren RP, VanRuiswyk JV, Layde PM. Are patients at Veterans Affairs medical centers sicker? A comparative analysis of health status and medical resource use. Arch Intern Med. 2000;160(21):3252-3257.
9. U.S. Department of Veterans Affairs, Veterans Health Administration. National Viral Hepatitis Program. VHA Directive 1300.01. U.S. Department of Veterans Affairs Website. http://www1.va.gov/vhapublications/ViewPublication.asp?pub_ID=1586. Updated February 22, 2013. Accessed October 13, 2015.
10. Patterson CJ. Best practices in specialty pharmacy management. J Manag Care Pharm. 2013;19(1):42-48.
11. Cheng AL, Kang YK, Chen Z, et al. Efficacy and safety of sorafenib in patients in the Asia-Pacific region with advanced hepatocellular carcinoma: a phase III randomised, double-blind, placebo-controlled trial. Lancet Oncol. 2009;10(1):25-34.
12. Iavarone M, Cabibbo G, Piscaglia F, et al; SOFIA (SOraFenib Italian Assessment) study group. Field-practice study of sorafenib therapy for hepatocellular carcinoma: a prospective multicenter study in Italy. Hepatology. 2011;54(6):2055-2063.
13. Di Fiore F, Rigal O, Ménager C, Michel P, Pfister C. Severe clinical toxicities are correlated with survival in patients with advanced renal cell carcinoma treated with sunitinib and sorafenib. Br J Cancer. 2011;105(12):1811-1813.
14. Bruix J, Sherman M; American Association for the Study of Liver Diseases. Management of hepatocellular carcinoma: an update. Hepatology. 2011;53(3):1020-1022.
15. Blandford L, Dans PE, Ober JD, Wheelock C. Analyzing variations in medication compliance related to individual drug, drug class, and prescribing physician. J Managed Care Pharm. 1999;5(1):47-51.
16. Cabibbo G, Enea M, Attanasio M, Bruix J, Craxì A, Cammà C. A meta-analysis of survival rates of untreated patients in randomized clinical trials of hepatocellular carcinoma. Hepatology. 2010;51(4):1274-1283.
17. Bayer HealthCare. Sorafenib as Adjuvant Treatment in the Prevention of Recurrence of Hepatocellular Carcinoma (STORM). ClinicalTrials.gov Website. https://clinicaltrials.gov/ct2/show/NCT00692770. Updated May 28, 2015. Accessed October 21, 2015.
18. Academy of Managed Care Pharmacy. AMCP Guide to Pharmaceutical Payment Methods, 2009 Update (Version 2.0). J Manag Care Pharm. 2009;15(suppl 6-a):S3-S57.
19. Valgus JM, Faso A, Gregory KM, et al. Integration of a clinical pharmacist into the hematology-oncology clinics at an academic medical center. Am J Health Syst Pharm. 2011;68(7):613-619.
20. Tschida SJ, Aslam S, Lal LS, et al. Outcomes of a specialty pharmacy program for oral oncology medications. Am J Pharm Benefits. 2012;4(4):165-174.
Idiopathic Intracranial Hypertension in Pregnancy
A 27-year-old white woman presented to the clinic with headaches and decreased vision through her reading glasses while performing near tasks. Her medical history was significant for herpes simplex, hyperlipidemia, and migraine headaches with aura. Her migraines began following an earlier motor vehicle accident, and her most recent magnetic resonance imaging (MRI) showed no abnormalities. Her current medications included prophylactic acyclovir for herpes and acetaminophen and caffeine tablets as needed for headache. She reported no other trauma or surgery and no known allergies. The patient’s best-corrected Snellen visual acuities in both eyes were 20/20 (distance) and 20/30 (near).
Preliminary testing, including pupils, extraocular motilities, confrontation fields, and color vision, were all within normal limits. Her slit-lamp examination was unremarkable. A dilated fundus examination revealed crowded, elevated discs without vessel obscuration, hemorrhage, hyperemia, or drusen (Figure 1). The fundus examination was otherwise unremarkable. Optical coherence tomography of the optic nerves showed increased nerve fiber layer thickness in both eyes (Figure 2). Her blood pressure (BP) at this visit was 106/77 mm/Hg.
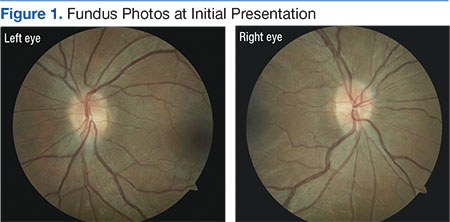
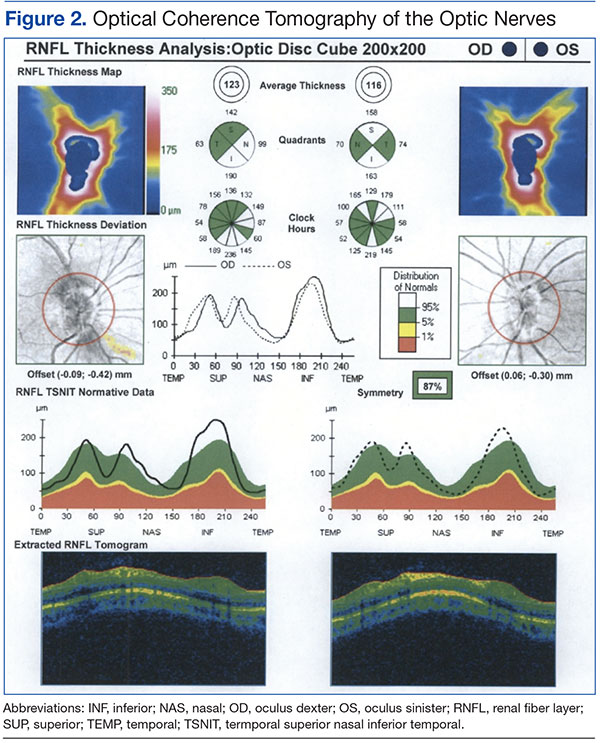
The diagnosis based on these findings was bilateral optic nerve elevation with long-standing migraine headaches. The plan was for the patient to return to the clinic for repeat visual field testing and B-scan ultrasonography to rule out buried optic nerve head drusen.
Two months later, the patient presented to the clinic 19 weeks pregnant and reported that her headaches had increased in frequency, but she had no diplopia. All preliminary testing, including visual acuities, pupil reaction, color vision, and slit-lamp examination remained normal. Fundus examination showed the patient’s nerves were unchanged in appearance from the initial presentation. Visual fields revealed an enlarged blind spot in the right eye and paracentral defects in the left eye. The B-scan testing was negative for optic nerve drusen. Due to the increased frequency of headaches, pregnancy, and suspicious optic nerves, an urgent consult was placed to neurology.
At the neurology appointment 1 month later, the patient was diagnosed with migraine headache syndrome and idiopathic intracranial hypertension (IIH). The neurologist believed her headaches might have been resulting from analgesic rebound. He suggested that the patient discontinue or decrease use of oral butalbital, acetaminophen and caffeine tablets, and other forms of caffeine. It was decided that divalproxen sodium and verapamil were not feasible due to pregnancy. The neurologist started her on oral acetazolamide 500 mg twice daily.
The patient returned to her obstetrician 1 month later for a routine follow-up; the headaches had worsened and were now accompanied by nausea and vomiting twice daily on average. Her medications still included acetaminophen and caffeine tablets, although it had been recommended she discontinue them, prochlorperazine, and acetazolamide. Due to the worsening of her symptoms and visual fields (eFigure 1), the obstetrician recommended that the patient deliver by cesarean section at 38 to 39 weeks.
(eFigure 1.Visual Fields at Follow-up 1 and 2)
Right eye
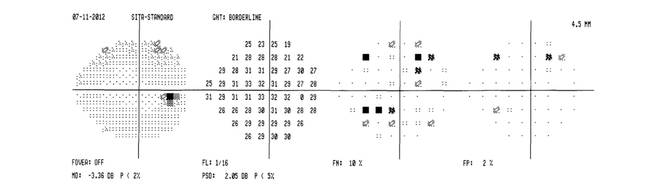
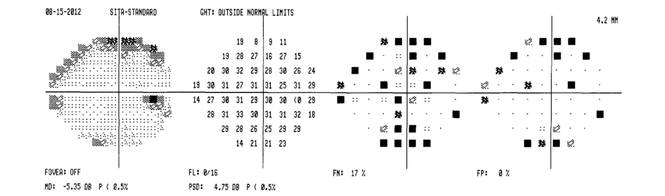
Left Eye
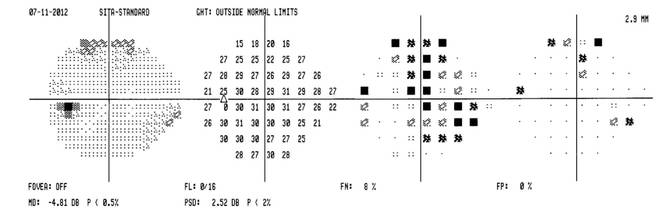
Following an uncomplicated cesarean delivery at 38 weeks, the patient returned to the clinic for visual field testing. Humphrey visual fields were full in the right eye and showed some scattered central depressions in the left. Both eyes were significantly improved from previous fields (eFigure 2) . The patient had discontinued acetazolamide and reported minor tension headaches she believed were due to lack of sleep but stated that she was no longer having migraines. There was no papilledema noted on fundus examination, and Snellen distance visual acuity measured 20/20 in both eyes. An MRI had been performed after delivery and was negative for intracranial hemorrhage, mass, or hydrocephalus).
(eFigure 2. Visual Fields Postpartum)
Right eye
Left eye
Three months later, the patient returned for her yearly comprehensive examination. At that visit, she reported a decrease in frequency of the migraine headaches. Optical coherence tomography was performed and showed a significant decrease in optic nerve head swelling.
Related: Diabetes on the Rise Among Other Pregnancy Problems
Clinical Picture
Idiopathic intracranial hypertension presents clinically with signs and symptoms of increased intracranial pressure (ICP). Headache is the most common symptom, usually presenting as daily and pulsatile.1 Nausea may be associated with the headache, although vomiting is rare, and the headache may awaken the patient. The headache may remain after resolution of elevated ICP (Table).2
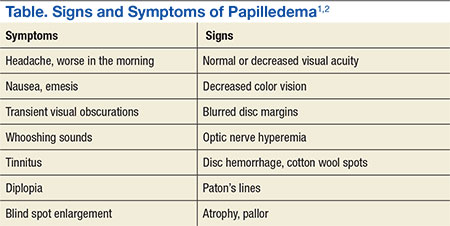
Papilledema is the most common sign of IIH.1,2 Visual loss associated with papilledema is generally mild at first but progressive. Transient blur lasts usually 30 seconds and may be monocular or binocular.1 The cause is thought to be related to transient ischemia of the optic nerve.1 Vision loss is typically reversible with resolution of optic nerve swelling, but 25% of patients may develop optic atrophy, which results in permanent vision loss.2 Common patterns of visual abnormalities include enlargement of the physiologic blind spot, inferonasal and arcuate defects, and eventually severe peripheral constriction.1,2 It is imperative that all patients with IIH have visual field testing performed.
About one-third of patients with IIH experience diplopia. This binocular, horizontal diplopia is caused by a sixth nerve palsy in 10% to 20% of patients.1 Cranial nerves II, VI, and VII make a 90-degree bend and seem to be prone to damage at the site of the bend.1
Pulse-synchronous tinnitus is common in IIH as well.2,3 This generally occurs unilaterally and may be eliminated by jugular compression or the head turning to the ipsilateral side.1,3 The sound is caused by the transmission of an increase in the vascular pulse due to high pressure on the cerebrospinal fluid (CSF).1,3
Idiopathic intracranial hypertension most typically presents in obese women of childbearing age.1-3 An increasing degree of obesity is generally associated with an increased risk of vision loss.1,2 Men seem to have worse acuity and visual fields at presentation than do women.2 Men are less likely to report headaches than are women and, therefore, have double the likelihood of severe vision loss.2 Hence, closer monitoring and more aggressive intervention is recommended for men due to their lesser tendency for headaches.2 Black patients also demonstrate more aggressive disease and, therefore, require closer monitoring and early aggressive intervention.1,2
Papilledema is the most common sign of IIH and may be caused by several processes. In this case, most were ruled out given the patient’s normal visual acuities, pupillary reaction, color vision testing, BP measurement, and B-scan imaging. The patient’s systemic history was negative for thyroid-related disease, diabetes, hypertension, autoimmune disease, or infection. She had no family history of vision loss or hereditary ocular conditions. The most recent MRI was negative for any long-standing space-occupying lesion or hydrocephalus.
Pathophysiology
Several mechanisms leading to increased ICP have been proposed. These include increased brain water content, excess CSF production, reduced CSF absorption, and increased cerebral venous pressure.2,3 There is also a suspicion of the role of sex hormones in IIH due to its high predilection for females.2
The role of vitamin A metabolism has also been studied in IIH.1 Retinol levels are elevated in the CSF of patients with IIH. Patients may ingest an abnormally large amount of vitamin A, metabolize it abnormally, or be sensitive to its effects.2,4 The function of adipose tissue as an actively secreting endocrine tissue may play a role in IIH due to its release of adipose tissue-derived retinol binding protein.2 Other adipose-produced cytokines include leptin, which has been implicated in IIH due to its elevated levels found in the CSF of patients with IIH.2
Stenosis of the cerebral sinuses is another proposed mechanism of IIH.1-3 Cerebrospinal fluid exits the cranium into the venous sinuses via the arachnoid villi.2 An obstruction in these sinuses may impair CSF outflow and result in intracranial hypertension. Microthrombosis caused by hypercoaguable disorders may result in increased cerebral venous pressure and impaired CSF absorption as well.2,4
Some medications have been found in association with IIH. These include tetracycline, cyclosporine, lithium, nalidixic acid, nitrofurantoin, oral contraceptives, levonorgestrel, danaxol, and tamoxifen.1-4 Tetracycline seems to have the strongest association with IIH and should be discontinued in those patients where the association is very likely to be the causative factor.2 The link to oral contraceptives may occur simply due to their association with young women most at risk for IIH.1-3
Related:Young Man With Headache, Confusion, and Hearing Loss
Management
The goals of treatment with IIH are to preserve vision and relieve symptoms, particularly headache. The general recommendation is that pregnant women with IIH should be managed and treated the same as any other patient with IIH. However, imaging and some drug contraindications exist between these 2 groups.
The diagnostic test for IIH is a lumbar puncture, which is also the most effective treatment.1-3,5 Lumbar puncture should be performed in the relaxed lateral decubitus position without sedation.1-3 The opening pressure should be measured and is the most clinically significant diagnostic tool for diagnosis of IIH. Opening pressures of > 250 mm H2O are diagnostic of IIH.1-3,5
Weight loss is an essential part of treatment in obese patients with IIH.1-3 A low-calorie, low-salt diet with mild fluid restriction seems to reverse the symptoms of IIH. A 5% to 10% reduction in body weight may reduce symptoms and signs of IIH.2
Carbonic anhydrase inhibitors (CAIs), such as acetalzolamide, have a multifactorial role in IIH.4 They are usually prescribed in 1 to 2 grams over several doses and function by decreasing CSF production.1 Carbonic anhydrase inhibitors also are known to change the taste of foods and may, therefore, aid in weight loss.1,2 Patients prescribed CAIs commonly experience a tingling in their fingers, toes, and perioral region, an indication that the medication is working.1,2 A rare but serious adverse effect (AE) is aplastic anemia, which generally occurs in the first 6 months of treatment in elderly patients.1 The use of CAIs in pregnancy is controversial, and although rare complications are reported, it is considered a class C drug.5
In patients with rapidly progressive vision loss but with minimal headache, optic nerve sheath fenestration (ONSF) is the surgical treatment of choice.2,3,6 In this procedure, a window or series of slits are created behind the globe in the optic nerve sheath.1 About 50% of patients achieve adequate headache control with ONSF, especially for frontal headaches.1,2
For patients with vision loss, papilledema, and headache that do not respond to medical therapy, a CSF diversion procedure is the preferred treatment. Cerebrospinal fluid diversion with ventriculoperitoneal or lumboperitoneal shunts may prevent progressive loss of vision.1,4,6 However, variable response rates and shunt failure requiring subsequent revisions are common and may occur in as many as half of patients undergoing these procedures.1
Increased intracranial venous pressure due to stenosis of the venous sinuses has been thought to be a possible cause of IIH. Stenting of the transverse venous sinus stenosis has been shown to reduce cerebral venous pressure, reduce ICP, and improve symptoms in patients with IIH.1-3 It is unclear whether elevations in ICP cause transverse sinus stenosis or whether transverse sinus stenosis causes increased ICP.2 Regardless, stents have a high rate of complications, including subdural hemorrhage, venous sinus perforation, in-stent thrombosis, and recurrent stenosis proximal to the stent.2
Steroids have been used to treat IIH in the past, although their mechanism of action remains unclear.2 There may be recurrence of papilledema if they are tapered too quickly. Due to their association with long-term AEs, including weight gain, they should be avoided.2
Management in Pregnancy
Several studies agree that vision loss occurs in the same frequency in pregnant and nonpregnant patients with IIH.4,7 Idiopathic intracranial hypertension can occur in any trimester in pregnancy. It has been found that patients have the same spontaneous abortion rate and visual outcomes as the general population.6-8 It has also been concluded that treatment should be the same in both patient populations with slight variability in the use of acetazolamide.4,6,7
The use of dilating drops during pregnancy is controversial. Although there have been no teratogenic effects reported with use of topical anesthetics and dilating drops, all drugs should be avoided during the first trimester.7-10 Guidelines have been established by the American Congress of Obstetricians and Gynecologists for X-ray examination and exposure during pregnancy. It has been determined that exposure from a single diagnostic X-ray procedure does not result in harmful fetal effects.11 Magnetic resonance imaging is not associated with any known adverse fetal effects and is a better imaging option during pregnancy, because it is not associated with the use of ionizing radiation.11
The use of CAIs in the first trimester is controversial.4,7 Some believe it should be avoided because it is a Pregnancy Category C drug. However, a single case of sacrococcygeal teratoma has been reported in humans; therefore, some believe this is not a strong basis for withholding the medication in patients with the potential risk for severe vision loss.4,7 In this case, a consult to the patient’s obstetrician was made, and the use of acetazolamide had no effect on the health of the baby.
In pregnant women with IIH with progressive vision loss, failed treatment, or nonadherence, surgery may be necessary. Optic nerve sheath fenestration is preferred due to lower morbidity and mortality compared with shunting procedures.1,2,4,6 The growing fetus may be affected by the peritoneal end of the shunt.4
Related: 49-Year-Old Woman With a Broken Heart
Conclusions
Vision loss associated with IIH can be severe and permanent if left untreated. The best treatments and often the most effective involve weight loss and lumbar puncture. Acetazolamide has been a proven effective treatment in some patients, but some debate exists over the safety of its use during pregnancy. This patient did not have any AEs from its use; however, it did not prove valuable in her treatment. Studies often disagree on the use of acetazolamide in pregnancy; however, all agree that proper patient counseling on potential AEs and management by an obstetrician are important. With proper management, pregnant women with IIH have had outcomes similar to those of the general population.
Author disclosures
The authors report no actual or potential conflicts of interest with regard to this article.
Disclaimer
The opinions expressed herein are those of the authors and do not necessarily reflect those of Federal Practitioner, Frontline Medical Communications Inc., the U.S. Government, or any of its agencies. This article may discuss unlabeled or investigational use of certain drugs. Please review the complete prescribing information for specific drugs or drug combinations—including indications, contraindications, warnings, and adverse effects—before administering pharmacologic therapy to patients.
1. Wall M. Idiopathic intracranial hypertension. Neurol Clin. 2010;28(3):593-617.
2. Bruce BB, Biousee V, Newman NJ. Update on idiopathic intracranial hypertension. Am J Ophthalmol. 2011;152(2):163-169.
3. Fields JD, Javendani PP, Falardeau J, et al. Dural venous sinus angioplasty and stenting for the treatment of idiopathic intracranial hypertension. J Neurointerv Surg. 2013;5(1):62-68.
4. Evans RW, Lee AG. Idiopathic intracranial hypertension in pregnancy. Headache. 2010;50(9):1513-1515.
5. Friedman DI, Jacobson DM. Diagnostic criteria for idiopathic intracranial hypertension. Neurology. 2002;59(10):1492-1495.
6. Martínez-Varea A, Diago-Almela VJ, Abad-Carrascosa A, Perales-Marín A. Progressive visual loss in a pregnant woman with idiopathic intracranial hypertension. Eur J Obstet Gynecol Reprod Biol. 2012;163(1):117-122.
7. Falardeau J, Lobb B, Golden S, Maxfield SD, Tanne E. The use of acetazolamide during pregnancy in intracranial hypertension patients. J Neuroophthalmol. 2013;33(1):9-12.
8. Dinn RB, Harris A, Marcus PS. Ocular changes in pregnancy. Obstet Gynecol Surg. 2003;58(2):137-144.
9. Shultz KL, Birnbaum AD, Goldstein DA. Ocular disease in pregnancy. Curr Opin Ophthalmol. 2005;16(5):308-314.
10. Chung CY, Kwok AKH, Chung KL. Use of ophthalmic medications during pregnancy. Hong Kong Med J. 2004;10(3):191-195.
11. American Congress of Obstetricians and Gynecologists. Committee Opinion. Guidelines for diagnostic imaging during pregnancy. American Congress of Obstetricians and Gynecologists Website. http://www.acog.org/-/media/Committee-Opinions/Committee-on-Obstetric-Practice/co299.pdf. Published 2004. Accessed October 9, 2015.
A 27-year-old white woman presented to the clinic with headaches and decreased vision through her reading glasses while performing near tasks. Her medical history was significant for herpes simplex, hyperlipidemia, and migraine headaches with aura. Her migraines began following an earlier motor vehicle accident, and her most recent magnetic resonance imaging (MRI) showed no abnormalities. Her current medications included prophylactic acyclovir for herpes and acetaminophen and caffeine tablets as needed for headache. She reported no other trauma or surgery and no known allergies. The patient’s best-corrected Snellen visual acuities in both eyes were 20/20 (distance) and 20/30 (near).
Preliminary testing, including pupils, extraocular motilities, confrontation fields, and color vision, were all within normal limits. Her slit-lamp examination was unremarkable. A dilated fundus examination revealed crowded, elevated discs without vessel obscuration, hemorrhage, hyperemia, or drusen (Figure 1). The fundus examination was otherwise unremarkable. Optical coherence tomography of the optic nerves showed increased nerve fiber layer thickness in both eyes (Figure 2). Her blood pressure (BP) at this visit was 106/77 mm/Hg.
The diagnosis based on these findings was bilateral optic nerve elevation with long-standing migraine headaches. The plan was for the patient to return to the clinic for repeat visual field testing and B-scan ultrasonography to rule out buried optic nerve head drusen.
Two months later, the patient presented to the clinic 19 weeks pregnant and reported that her headaches had increased in frequency, but she had no diplopia. All preliminary testing, including visual acuities, pupil reaction, color vision, and slit-lamp examination remained normal. Fundus examination showed the patient’s nerves were unchanged in appearance from the initial presentation. Visual fields revealed an enlarged blind spot in the right eye and paracentral defects in the left eye. The B-scan testing was negative for optic nerve drusen. Due to the increased frequency of headaches, pregnancy, and suspicious optic nerves, an urgent consult was placed to neurology.
At the neurology appointment 1 month later, the patient was diagnosed with migraine headache syndrome and idiopathic intracranial hypertension (IIH). The neurologist believed her headaches might have been resulting from analgesic rebound. He suggested that the patient discontinue or decrease use of oral butalbital, acetaminophen and caffeine tablets, and other forms of caffeine. It was decided that divalproxen sodium and verapamil were not feasible due to pregnancy. The neurologist started her on oral acetazolamide 500 mg twice daily.
The patient returned to her obstetrician 1 month later for a routine follow-up; the headaches had worsened and were now accompanied by nausea and vomiting twice daily on average. Her medications still included acetaminophen and caffeine tablets, although it had been recommended she discontinue them, prochlorperazine, and acetazolamide. Due to the worsening of her symptoms and visual fields (eFigure 1), the obstetrician recommended that the patient deliver by cesarean section at 38 to 39 weeks.
(eFigure 1.Visual Fields at Follow-up 1 and 2)
Right eye
Left Eye
Following an uncomplicated cesarean delivery at 38 weeks, the patient returned to the clinic for visual field testing. Humphrey visual fields were full in the right eye and showed some scattered central depressions in the left. Both eyes were significantly improved from previous fields (eFigure 2) . The patient had discontinued acetazolamide and reported minor tension headaches she believed were due to lack of sleep but stated that she was no longer having migraines. There was no papilledema noted on fundus examination, and Snellen distance visual acuity measured 20/20 in both eyes. An MRI had been performed after delivery and was negative for intracranial hemorrhage, mass, or hydrocephalus).
(eFigure 2. Visual Fields Postpartum)
Right eye
Left eye
Three months later, the patient returned for her yearly comprehensive examination. At that visit, she reported a decrease in frequency of the migraine headaches. Optical coherence tomography was performed and showed a significant decrease in optic nerve head swelling.
Related: Diabetes on the Rise Among Other Pregnancy Problems
Clinical Picture
Idiopathic intracranial hypertension presents clinically with signs and symptoms of increased intracranial pressure (ICP). Headache is the most common symptom, usually presenting as daily and pulsatile.1 Nausea may be associated with the headache, although vomiting is rare, and the headache may awaken the patient. The headache may remain after resolution of elevated ICP (Table).2
Papilledema is the most common sign of IIH.1,2 Visual loss associated with papilledema is generally mild at first but progressive. Transient blur lasts usually 30 seconds and may be monocular or binocular.1 The cause is thought to be related to transient ischemia of the optic nerve.1 Vision loss is typically reversible with resolution of optic nerve swelling, but 25% of patients may develop optic atrophy, which results in permanent vision loss.2 Common patterns of visual abnormalities include enlargement of the physiologic blind spot, inferonasal and arcuate defects, and eventually severe peripheral constriction.1,2 It is imperative that all patients with IIH have visual field testing performed.
About one-third of patients with IIH experience diplopia. This binocular, horizontal diplopia is caused by a sixth nerve palsy in 10% to 20% of patients.1 Cranial nerves II, VI, and VII make a 90-degree bend and seem to be prone to damage at the site of the bend.1
Pulse-synchronous tinnitus is common in IIH as well.2,3 This generally occurs unilaterally and may be eliminated by jugular compression or the head turning to the ipsilateral side.1,3 The sound is caused by the transmission of an increase in the vascular pulse due to high pressure on the cerebrospinal fluid (CSF).1,3
Idiopathic intracranial hypertension most typically presents in obese women of childbearing age.1-3 An increasing degree of obesity is generally associated with an increased risk of vision loss.1,2 Men seem to have worse acuity and visual fields at presentation than do women.2 Men are less likely to report headaches than are women and, therefore, have double the likelihood of severe vision loss.2 Hence, closer monitoring and more aggressive intervention is recommended for men due to their lesser tendency for headaches.2 Black patients also demonstrate more aggressive disease and, therefore, require closer monitoring and early aggressive intervention.1,2
Papilledema is the most common sign of IIH and may be caused by several processes. In this case, most were ruled out given the patient’s normal visual acuities, pupillary reaction, color vision testing, BP measurement, and B-scan imaging. The patient’s systemic history was negative for thyroid-related disease, diabetes, hypertension, autoimmune disease, or infection. She had no family history of vision loss or hereditary ocular conditions. The most recent MRI was negative for any long-standing space-occupying lesion or hydrocephalus.
Pathophysiology
Several mechanisms leading to increased ICP have been proposed. These include increased brain water content, excess CSF production, reduced CSF absorption, and increased cerebral venous pressure.2,3 There is also a suspicion of the role of sex hormones in IIH due to its high predilection for females.2
The role of vitamin A metabolism has also been studied in IIH.1 Retinol levels are elevated in the CSF of patients with IIH. Patients may ingest an abnormally large amount of vitamin A, metabolize it abnormally, or be sensitive to its effects.2,4 The function of adipose tissue as an actively secreting endocrine tissue may play a role in IIH due to its release of adipose tissue-derived retinol binding protein.2 Other adipose-produced cytokines include leptin, which has been implicated in IIH due to its elevated levels found in the CSF of patients with IIH.2
Stenosis of the cerebral sinuses is another proposed mechanism of IIH.1-3 Cerebrospinal fluid exits the cranium into the venous sinuses via the arachnoid villi.2 An obstruction in these sinuses may impair CSF outflow and result in intracranial hypertension. Microthrombosis caused by hypercoaguable disorders may result in increased cerebral venous pressure and impaired CSF absorption as well.2,4
Some medications have been found in association with IIH. These include tetracycline, cyclosporine, lithium, nalidixic acid, nitrofurantoin, oral contraceptives, levonorgestrel, danaxol, and tamoxifen.1-4 Tetracycline seems to have the strongest association with IIH and should be discontinued in those patients where the association is very likely to be the causative factor.2 The link to oral contraceptives may occur simply due to their association with young women most at risk for IIH.1-3
Related:Young Man With Headache, Confusion, and Hearing Loss
Management
The goals of treatment with IIH are to preserve vision and relieve symptoms, particularly headache. The general recommendation is that pregnant women with IIH should be managed and treated the same as any other patient with IIH. However, imaging and some drug contraindications exist between these 2 groups.
The diagnostic test for IIH is a lumbar puncture, which is also the most effective treatment.1-3,5 Lumbar puncture should be performed in the relaxed lateral decubitus position without sedation.1-3 The opening pressure should be measured and is the most clinically significant diagnostic tool for diagnosis of IIH. Opening pressures of > 250 mm H2O are diagnostic of IIH.1-3,5
Weight loss is an essential part of treatment in obese patients with IIH.1-3 A low-calorie, low-salt diet with mild fluid restriction seems to reverse the symptoms of IIH. A 5% to 10% reduction in body weight may reduce symptoms and signs of IIH.2
Carbonic anhydrase inhibitors (CAIs), such as acetalzolamide, have a multifactorial role in IIH.4 They are usually prescribed in 1 to 2 grams over several doses and function by decreasing CSF production.1 Carbonic anhydrase inhibitors also are known to change the taste of foods and may, therefore, aid in weight loss.1,2 Patients prescribed CAIs commonly experience a tingling in their fingers, toes, and perioral region, an indication that the medication is working.1,2 A rare but serious adverse effect (AE) is aplastic anemia, which generally occurs in the first 6 months of treatment in elderly patients.1 The use of CAIs in pregnancy is controversial, and although rare complications are reported, it is considered a class C drug.5
In patients with rapidly progressive vision loss but with minimal headache, optic nerve sheath fenestration (ONSF) is the surgical treatment of choice.2,3,6 In this procedure, a window or series of slits are created behind the globe in the optic nerve sheath.1 About 50% of patients achieve adequate headache control with ONSF, especially for frontal headaches.1,2
For patients with vision loss, papilledema, and headache that do not respond to medical therapy, a CSF diversion procedure is the preferred treatment. Cerebrospinal fluid diversion with ventriculoperitoneal or lumboperitoneal shunts may prevent progressive loss of vision.1,4,6 However, variable response rates and shunt failure requiring subsequent revisions are common and may occur in as many as half of patients undergoing these procedures.1
Increased intracranial venous pressure due to stenosis of the venous sinuses has been thought to be a possible cause of IIH. Stenting of the transverse venous sinus stenosis has been shown to reduce cerebral venous pressure, reduce ICP, and improve symptoms in patients with IIH.1-3 It is unclear whether elevations in ICP cause transverse sinus stenosis or whether transverse sinus stenosis causes increased ICP.2 Regardless, stents have a high rate of complications, including subdural hemorrhage, venous sinus perforation, in-stent thrombosis, and recurrent stenosis proximal to the stent.2
Steroids have been used to treat IIH in the past, although their mechanism of action remains unclear.2 There may be recurrence of papilledema if they are tapered too quickly. Due to their association with long-term AEs, including weight gain, they should be avoided.2
Management in Pregnancy
Several studies agree that vision loss occurs in the same frequency in pregnant and nonpregnant patients with IIH.4,7 Idiopathic intracranial hypertension can occur in any trimester in pregnancy. It has been found that patients have the same spontaneous abortion rate and visual outcomes as the general population.6-8 It has also been concluded that treatment should be the same in both patient populations with slight variability in the use of acetazolamide.4,6,7
The use of dilating drops during pregnancy is controversial. Although there have been no teratogenic effects reported with use of topical anesthetics and dilating drops, all drugs should be avoided during the first trimester.7-10 Guidelines have been established by the American Congress of Obstetricians and Gynecologists for X-ray examination and exposure during pregnancy. It has been determined that exposure from a single diagnostic X-ray procedure does not result in harmful fetal effects.11 Magnetic resonance imaging is not associated with any known adverse fetal effects and is a better imaging option during pregnancy, because it is not associated with the use of ionizing radiation.11
The use of CAIs in the first trimester is controversial.4,7 Some believe it should be avoided because it is a Pregnancy Category C drug. However, a single case of sacrococcygeal teratoma has been reported in humans; therefore, some believe this is not a strong basis for withholding the medication in patients with the potential risk for severe vision loss.4,7 In this case, a consult to the patient’s obstetrician was made, and the use of acetazolamide had no effect on the health of the baby.
In pregnant women with IIH with progressive vision loss, failed treatment, or nonadherence, surgery may be necessary. Optic nerve sheath fenestration is preferred due to lower morbidity and mortality compared with shunting procedures.1,2,4,6 The growing fetus may be affected by the peritoneal end of the shunt.4
Related: 49-Year-Old Woman With a Broken Heart
Conclusions
Vision loss associated with IIH can be severe and permanent if left untreated. The best treatments and often the most effective involve weight loss and lumbar puncture. Acetazolamide has been a proven effective treatment in some patients, but some debate exists over the safety of its use during pregnancy. This patient did not have any AEs from its use; however, it did not prove valuable in her treatment. Studies often disagree on the use of acetazolamide in pregnancy; however, all agree that proper patient counseling on potential AEs and management by an obstetrician are important. With proper management, pregnant women with IIH have had outcomes similar to those of the general population.
Author disclosures
The authors report no actual or potential conflicts of interest with regard to this article.
Disclaimer
The opinions expressed herein are those of the authors and do not necessarily reflect those of Federal Practitioner, Frontline Medical Communications Inc., the U.S. Government, or any of its agencies. This article may discuss unlabeled or investigational use of certain drugs. Please review the complete prescribing information for specific drugs or drug combinations—including indications, contraindications, warnings, and adverse effects—before administering pharmacologic therapy to patients.
1. Wall M. Idiopathic intracranial hypertension. Neurol Clin. 2010;28(3):593-617.
2. Bruce BB, Biousee V, Newman NJ. Update on idiopathic intracranial hypertension. Am J Ophthalmol. 2011;152(2):163-169.
3. Fields JD, Javendani PP, Falardeau J, et al. Dural venous sinus angioplasty and stenting for the treatment of idiopathic intracranial hypertension. J Neurointerv Surg. 2013;5(1):62-68.
4. Evans RW, Lee AG. Idiopathic intracranial hypertension in pregnancy. Headache. 2010;50(9):1513-1515.
5. Friedman DI, Jacobson DM. Diagnostic criteria for idiopathic intracranial hypertension. Neurology. 2002;59(10):1492-1495.
6. Martínez-Varea A, Diago-Almela VJ, Abad-Carrascosa A, Perales-Marín A. Progressive visual loss in a pregnant woman with idiopathic intracranial hypertension. Eur J Obstet Gynecol Reprod Biol. 2012;163(1):117-122.
7. Falardeau J, Lobb B, Golden S, Maxfield SD, Tanne E. The use of acetazolamide during pregnancy in intracranial hypertension patients. J Neuroophthalmol. 2013;33(1):9-12.
8. Dinn RB, Harris A, Marcus PS. Ocular changes in pregnancy. Obstet Gynecol Surg. 2003;58(2):137-144.
9. Shultz KL, Birnbaum AD, Goldstein DA. Ocular disease in pregnancy. Curr Opin Ophthalmol. 2005;16(5):308-314.
10. Chung CY, Kwok AKH, Chung KL. Use of ophthalmic medications during pregnancy. Hong Kong Med J. 2004;10(3):191-195.
11. American Congress of Obstetricians and Gynecologists. Committee Opinion. Guidelines for diagnostic imaging during pregnancy. American Congress of Obstetricians and Gynecologists Website. http://www.acog.org/-/media/Committee-Opinions/Committee-on-Obstetric-Practice/co299.pdf. Published 2004. Accessed October 9, 2015.
Efficacy of Patient Aligned Care Team Pharmacist Services in Reaching Diabetes and Hyperlipidemia Treatment Goals
According to the CDC, diabetes mellitus (DM) and hyperlipidemia have been distinguished as major contributors to death and disability among adults within the U.S. Although these diseases may often escape a directly malignant etiology, the complications of these metabolic disorders are correlated with long-term disability. Uncontrolled diabetes contributes to 5 major complications in U.S. adults, including myocardial infarction, cerebral vascular accident, lower extremity amputation, renal failure, and hyperglycemic crisis. Hyperlipidemia is another major risk factor listed for advancing heart disease and ischemic stroke. Medical and preventive care are effective means for declining complication rates, but these chronic diseases continue to increase in frequency.1,2
The prevalence of DM and hyperlipidemia among U.S. veterans is uniquely higher than that of the general population. About 9.3% of the U.S. population has been diagnosed with diabetes compared with almost 25% of veterans receiving care through the VHA.3,4 According to the 2012 National Ambulatory Medical Care Survey, 15.2% of patients receiving nonfederal care had a hyperlipidemia diagnosis compared with > 20% of the U.S. veteran population.5,6
Patient-Centered Care
A key initiative of the VHA Office of Patient Care Services in providing coordinated health care is the patient aligned care team (PACT). The PACT model seeks to provide communicative patient-centered care and involves primary care providers (PCPs) as well as other clinical and nonclinical affiliates.7 These team members often include a PCP, a registered and licensed practical nurse, a dietitian, a social worker, clerical support, and a clinical pharmacy specialist (CPS). Each professional uses his or her unique specialty to provide evidence-based care to the veteran. Clinical pharmacy specialist integration into the PACT model is one way to provide greater continuity of care for patients and more comprehensive treatment of chronic diseases. Given the need for regular medication titration, these patients may require a greater allocation of time and resources than PCPs can feasibly give. For this reason, CPSs were integrated into PACTs to allow for focused management of chronic conditions.
Most PACT CPSs at the VA Illiana Health Care System (VAIHCS) have advanced residency training and/or board certification, making them proficient in patient communication, drug knowledge, pharmacology, and therapeutics. Within the VHA, CPSs practice as midlevel providers with a scope of practice. This scope grants them the ability to clinically assess drug therapy, order and evaluate laboratory data, prescribe pertinent medications to treat the disease within the scope, and order consults with other professionals of the PACT team.8
Research Studies
Several studies have revealed that pharmacist-driven outpatient interventions for patients with dyslipidemia have significantly reduced low-density lipoprotein cholesterol (LDL-C).9-14 Mazzolini and colleagues found that VHA pharmacist intervention produced a mean LDL-C reduction of 24.5 mg/dL and increased the percentage of patients reaching their LDL-C goal from 36.8% to 64.3%.9 Similarly, at another VHA facility, telephone interventions with patients were also effective in reducing veterans’ LDL-C levels. Fabbio and colleagues found a mean LDL-C reduction of 44.3 mg/dL when performing retrospective chart reviews of pharmacist interventions.10 Other pharmacist-driven LDL-C outcomes were also positive compared with that of usual care by PCPs, showing mean LDL-C reductions of 10.7 mg/dL and 10.4 mg/dL.11,12 All these studies showed positive impacts on outcomes for patients with dyslipidemia. Additionally, these types of interventions have been shown to maintain both patient and PCP satisfaction.15
Clinical pharmacist interventions in the primary care setting have shown positive impacts in DM control with hemoglobin A1c (A1c) reductions by as much as 1.3% to 3.4%.16-19 The highest A1c reductions were evident when pharmacists had the ability to prescribe medications or work in a collaborative practice model with PCPs.16-18 Independent practice and the ability to prescribe medications have been shown to have more impact than recommendations to physicians alone. Recommendation letters from pharmacists did not produce a significant reduction of A1c in one physician group compared with another physician group not receiving DM management recommendations.20Given the increased prevalence of chronic diseases in the veteran population and the literature to support the value of CPSs as provider extenders, the focus of this analysis was to determine the potential benefit of CPS services to the PACT.
The primary objectives of this analysis were to determine the true impact of PACT CPSs on LDL-C and A1c in the veterans enrolled in VAIHCS Disease State Management (DSM) clinics. If positive impacts were revealed, this study would support expansion of CPS services to include additional staff and the management of additional diseases.
Related: Experiences of Veterans With Diabetes From Shared Medical Appointments
Methods
This analysis was a retrospective chart review approved by the VA Illiana Publication and Presentation Committee as a quality improvement (QI) project. Data were collected through the VistA electronic medical record. Subject data were analyzed in a multicenter fashion. A total of 5 sites within VAIHCS were included for review. The study subjects acted as their own controls and were distributed proportionally by volume of DSM visits at each VAIHCS location.
The primary objectives of this QI analysis were to determine the efficacy of PACT CPSs in reducing LDL-C and/or A1c levels in veterans enrolled in VAIHCS DSM clinics. The primary endpoints of this study were change from baseline LDL-C to first LDL-C drawn between 6 and 9 months and change from baseline A1c to first A1c drawn between 9 and 12 months after enrollment in DSM clinics.
The secondary objectives of this QI analysis were to determine the efficacy of PACT CPSs in improving high-density lipoprotein cholesterol (HDL-C), triglycerides (TGs), and total cholesterol (TC) levels in veterans enrolled in DSM clinics. The secondary hyperlipidemia endpoints were the change from baseline HDL-C, TG, and TC to first blood work results and percentage of patients who achieved National Cholesterol Education Program Adult Treatment Panel III (NCEP-ATP III) LDL-C goal between 6 and 9 months after clinic enrollment.21 The secondary DM endpoint was the percentage of patients who achieved the recommended American Diabetes Association A1c goal between 9 and 12 months after enrollment. Mean percentage reduction of primary and relevant secondary endpoints were determined for each study subject.
Subjects selected for inclusion within this analysis were U.S. veterans aged 18 to 75 years who were enrolled in DSM clinics for hyperlipidemia or type 2 DM (T2DM) between September 1, 2011, and September 1, 2013. These subjects did not meet VA performance measures for hyperlipidemia or T2DM at baseline. The key focus of these measures was to include disease prevention and management of diagnosed disease by clinical practice guideline standards. To be included in the analysis, subjects were required to attend DSM clinic appointments for a minimum of 3 months for hyperlipidemia or 6 months for T2DM.
Subjects were excluded from this study if they were nonadherent to clinic visits (defined as missing > 50% of their appointments), were discharged from the clinic due to nonadherence to drug therapy and/or lifestyle interventions, met LDL-C or A1c goals prior to the laboratory collection interval, or had a baseline LDL-C of < 110 mg/dL or baseline A1c of < 8%. Subjects were also excluded if they failed to receive any antihyperlipidemic or antidiabetic agents through the course of their enrollment. Statistics were derived by averaging the percentage change of laboratory parameters per subject. The time frame used was from baseline to the time of primary and secondary endpoint collection. Due to the QI nature of this analysis, power was not targeted for attainment. A randomized sample of 49 subjects was pulled from the population for complete analysis, which was determined by using a random number generator and analyzing corresponding alphabetized patient charts.
Related:Diabetes Patient-Centered Medical Home Approach
Results
Two hundred ninety-five charts were reviewed to yield 49 subjects eligible for the analysis (Figure 1). One subject was eligible for both hyperlipidemia and T2DM. The primary reasons for exclusion were consults for DSM services not related to T2DM or hyperlipidemia (49.4%) and inadequate time of enrollment (30.2%). Less than 10% of exclusions were due to baseline LDL-C < 110 mg/dL or A1c < 8%, unavailable blood work within the collection interval, nonadherence to clinic visits or medications, or other reasons.
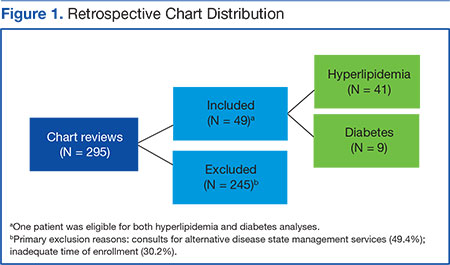
Hyperlipidemia
Means and ranges for LDL-C, TG, and TC were all significantly reduced from baseline (Figure 2). The primary endpoint for hyperlipidemia included a 25.1% reduction in mean LDL-C (95% CI, 0.173-0.327). Secondary endpoints included a 12.9% reduction in mean TG from baseline (95% CI, 0.017-0.241) and a 22.5% reduction in mean TC from baseline (95% CI, 0.174-0.276). A 2.1% increase in mean HDL-C was considered nonsignificant (95% CI, -0.082 to -0.042). The percentage of subjects meeting LDL-C goal between 6 and 9 months after enrollment was 36.7% (Table 1).
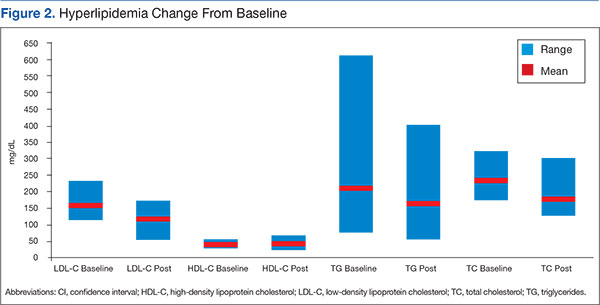
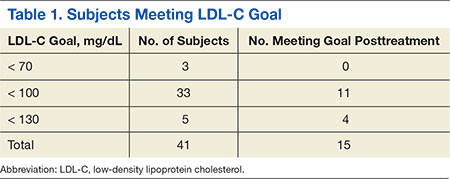
Twenty-six subjects (63.4%) did not reach their LDL-C goal between 6 and 9 months after clinic enrollment. Of these subjects, an additional analysis was performed to determine potential contributing factors. Eleven of these subjects received moderate- to high-intensity statin therapy, 2 received low-intensity statin therapy, and 3 (without documented statin intolerance) received no statin therapy. Seven subjects had statin intolerance documented in their charts at baseline or during treatment in DSM clinics. Three subjects had documented nonadherence. Subjects receiving no statin therapy due to intolerance or other reasons were prescribed fibrates, cholestyramine, psyllium, or therapeutic lifestyle changes.
Diabetes
Mean A1c and A1c range resulted in a significant reduction from baseline (Figure 3). The primary endpoint for T2DM included a 3.1% reduction in mean A1c (95% CI, 1.45-5.52). The percentage meeting A1c goal between 9 and 12 months after enrollment was 44.4% (Table 2).
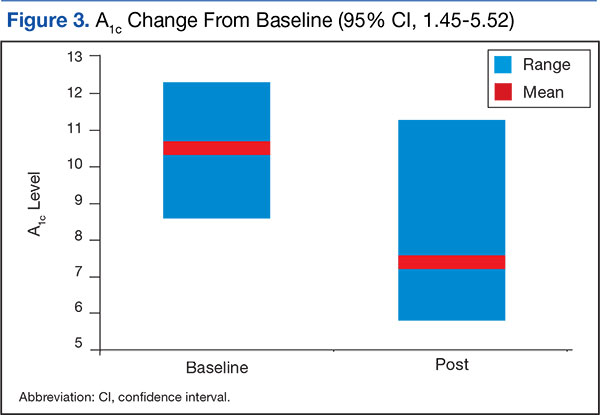
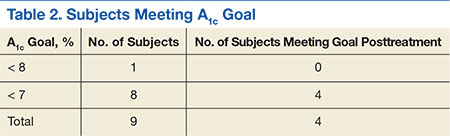
Discussion
The results of this analysis suggest a positive impact of CPSs on the care of veterans within VAIHCS, consistent with previous literature. The strengths of this study include a true measure of pharmacist intervention via an extended length of enrollment and regular CPS follow-up visits. Additionally, this was a multicenter design across numerous sites within VAIHCS. The variety of sites showed the impact of differing prescribing practice or consulting habits among CPSs and their associated PACT providers. Subjects were analyzed only if they received a prescription for antihyperlipidemic or antidiabetic medications. This exclusion allowed the analysis to focus on CPS medication adjustment skills.
Related: The Clinical Impact of Electronic Consultation in Diabetes Care
Limitations
This analysis is limited by its retrospective design and the reliance on chart reviews to collect data. As a retrospective analysis, a direct causality between CPS intervention and change in endpoints cannot be determined. Retrospective chart reviews are also subject to both bias and influence from confounding variables due to inability to establish blinding. One confounding variable not assessed was the impact of ancillary PACT members on subject outcomes. Therapeutic lifestyle changes implemented by registered dietitians could have confounded A1c and lipid profile improvements throughout the course of the analysis.
A specific limitation for hyperlipidemia included an early exclusion for meeting LDL-C goal before 3 months. After the completion of several chart reviews, it was determined that many of these patients required rapid or minimal medication adjustment to meet their therapeutic goals. The major limitation for T2DM included a small sample size. This limitation was partially due to the establishment of hyperlipidemia services before T2DM services within VAIHCS DSM clinics. Due to earlier establishment, hyperlipidemia management was better recognized, and consults for this disease were more prevalent. Sample size was also limited for T2DM due to the nature of the chart review and the original data attainment. The review of both diseases was limited due to some subjects not acquiring laboratory values within the predefined collection periods. In some cases, useful data outside the collection interval could not be used.
Although CPSs produced significant reductions in LDL-C, TG, and TC, their ability to provide more impactful results was likely limited due to enrollment for statin intolerance. Some studies indicated the incidence of statin intolerance to be about 5% to 10% of the general population.22 However, in this analysis, 17.1% of patients who did not meet LDL-C goal had some history of or current statin intolerance. Despite this high degree of intolerance, CPS management was still able to effectively improve lipid profiles but to a less significant degree.
A final point to consider is the design of the analysis before the release of the American College of Cardiology/American Heart Association (ACC/AHA) 2013 cholesterol guidelines.23 Target LDL-C reduction is no longer considered the most appropriate management technique for reducing the risk of atherosclerotic cardiovascular disease (ASCVD). However, the hyperlipidemia endpoints in this analysis were directly related to NCEP-ATP III recommendations. The current guidelines focus on the intensity of statin therapy for patients with ASCVD or elevated risk for ASCVD. With the release of this new guideline, a poststudy analysis was completed to apply the new information to previous practice in VAIHCS DSM clinics. Many subjects were already meeting their statin intensity goal without further intervention. In fact, 46.3% of subjects were meeting their goal at the time of primary endpoint collection. Between the release of the new clinical guideline and February 2014, another 14.6% of subjects had changed therapy and were meeting their statin-intensity goal, with or without pharmacist intervention. Another 17.1% of patients had statin intolerance that may have limited their ability to reach their statin-intensity goal. The remaining 22% of subjects (without statin intolerance) did not have any adjustments in hyperlipidemia profiles since the release of the updated guideline; these patients were scheduled to be contacted as a result of this analysis. Further review of patients meeting LDL-C goal at primary endpoint collection would also be beneficial to ensure appropriate management per current ACC/AHA 2013 guidelines.
Conclusion
Pharmacists were able to produce significant improvements in LDL-C and A1c profiles despite the confounding factors mentioned previously. With further analysis, VAIHCS may demonstrate efficacy in other CPS services and have greater potential to expand its services.
Author disclosures
The authors report no actual or potential conflicts of interest with regard to this article.
Disclaimer
This quality improvement analysis was performed to improve patient care at the VAIHCS, Danville, IL. It was reviewed by the VHA education department, privacy officer, information security officer, and VAIHCS leadership and was determined to meet guidelines for nonresearch, which is exempt from IRB review. As a quality improvement project, these data are not generalizable.
The opinions expressed herein are those of the authors and do not necessarily reflect those of Federal Practitioner, Frontline Medical Communications Inc., the U.S. Government, or any of its agencies. This article may discuss unlabeled or investigational use of certain drugs. Please review the complete prescribing information for specific drugs or drug combinations—including indications, contraindications, warnings, and adverse effects—before administering pharmacologic therapy to patients.
1. Centers for Disease Control and Prevention. Diabetes report card, 2014. Atlanta, GA: Centers for Disease Control and Prevention, U.S. Department of Health and Human Services; 2014. www .cdc.gov/diabetes/pdfs/library/diabetesreport card2014.pdf. Accessed August 25, 2015.
2. Fryar CD, Chen T-C, Li X. Prevalence of uncontrolled risk factors for cardiovascular disease: United States, 1999-2010. National Center for Health Statistics Data Brief, No. 103. National Center for Health Statistics, Centers for Disease Control and Prevention, U.S. Department of Health and Human Services Website. http://www.cdc.gov /nchs/data/databriefs/db103.htm. Updated August 3, 2012. Accessed August 10, 2015.
3. American Diabetes Association. Statistics about diabetes. American Diabetes Association Website. http://www.diabetes.org/diabetes-basics/statistics. Updated May 18, 2015. Accessed August 10, 2015.
4. U.S. Department of Veterans Affairs. Close to 25% of VA patients have diabetes. U.S. Department of Veterans Affairs Website. http://www.va.gov/health /NewsFeatures/20111115a.asp. Updated April 17, 2015. Accessed August 11, 2015.
5. Centers for Disease Control and Prevention. National ambulatory medical care survey: 2012 summary tables. Centers for Disease Control and Prevention Website. http://www.cdc.gov/nchs /data/ahcd/namcs_summary/2012_namcs_web _tables.pdf. Accessed August 25, 2015.
6. Utilization of Veterans Affairs Medical Care Services by United States Veterans. New York, NY: Pfizer Inc; 2003.
7. U.S. Department of Veterans Affairs. Primary care services. U.S. Department of Veterans Affairs Website. http://www.va.gov/primarycare/pcmh. Updated May 13, 2015. Accessed August 11, 2015.
8. U.S. Department of Veterans Affairs. Clinical Pharmacy Services. VHA Handbook 1108.11. http://www.va.gov/vhapublications/ViewPublication .asp?pub_ID=3120. Accessed August 25, 2015.
9. Mazzolini TA, Irons BK, Schell EC, Seifert CF. Lipid levels and use of lipid-lowering drugs for patients in pharmacist-managed lipid clinics versus usual care in 2 VA medical centers. J Manag Care Pharm. 2005;11(9):763-771.
10. Fabbio KL, Bradley M, Chrymko M. Evaluation of a pharmacist-managed telephone lipid clinic at a Veterans Affairs Medical Center. Ann Pharmacother. 2010;44(1):50-56.
11. Charrois TL, Zolezzi M, Koshman SL, et al. A systematic review of the evidence for pharmacist care of patients with dyslipidemia. Pharmacother. 2012;32(3):222-233.
12. Smith MC, Boldt AS, Walston CM, Zillich AJ. Effectiveness of a pharmacy care management program for veterans with dyslipidemia. Pharmacother. 2013;33(7):736-743.
13. Till LT, Voris JC, Horst JB. Assessment of clinical pharmacist management of lipid-lowering therapy in a primary care setting. J Manag Care Pharm. 2003;9(3):269-273.
14. Machado M, Nassor N, Bajcar JM, Guzzo GC, Einarson TR. Sensitivity of patient outcomes to pharmacist interventions. Part III: systematic review and meta-analysis in hyperlipidemia management. Ann Pharmacother. 2008;42(9):1195-1207.
15. Collins C, Kramer A, O’Day ME, Low MB. Evaluation of patient and provider satisfaction with a pharmacist-managed lipid clinic in a Veterans Affairs medical center. Am J Health Syst Pharm. 2006;63(18):1723-1727.
16. American Association of Diabetes Educators. The scope and standards for the practice of diabetes education by pharmacists. American Association of Diabetes Educators Website. http://www .diabeteseducator.org/docs/default-source/legacy -docs/_resources/pdf/PharmDScopeStandards.pdf. Updated 2011. Accessed August 11, 2015.
17. Wubben DP, Vivian EM. Effects of pharmacist outpatient interventions on adults with diabetes mellitus: a systematic review. Pharmacother. 2008;28(4):421-436.
18. Armor BL, Britton ML, Dennis VC, Letassy NA. A review of pharmacist contributions to diabetes care in the United States. J Pharm Pract. 2010;23(3):250-264.
19. Jarab AS, Alqudah SG, Mukattash TL, Shattat G, Al-Qirim T. Randomized controlled trial of clinical pharmacy management of patients with type 2 diabetes in an outpatient diabetes clinic in Jordan. J Manag Care Pharm. 2012;18(7):516-526.
20. Kirwin JL, Cunningham RJ, Sequist TD. Pharmacist recommendations to improve the quality of diabetes care: a randomized controlled trial. J Manag Care Pharm. 2010;16(2):104-113.
21. Expert Panel on Detection, Evaluation, and Treatment of High Blood Cholesterol in Adults. Executive Summary of the Third Report of the National Cholesterol Education Program (NCEP) Expert Panel on Detection, Evaluation, and Treatment of High Blood Cholesterol in Adults (Adult Treatment Panel III). JAMA. 2001;285(19):2486-2497.
22. Kennedy SP, Barnas GP, Schmidt MJ, Glisczinski MS, Paniagua AC. Efficacy and tolerability of once-weekly rosuvastatin in patients with previous statin intolerance. J Clin Lipidol. 2011;5(4):308-315.
23. Stone NJ, Robinson JG, Lichtenstein AH, et al; American College of Cardiology/American Heart Association Task Force on Practice Guidelines. 2013 ACC/AHA guideline on the treatment of blood cholesterol to reduce atherosclerotic cardiovascular risk in adults: a report of the American College of Cardiology/American Heart Association Task Force on Practice Guidelines. J Am Coll Cardiol. 2014;63(25, pt B):2889-2934.
According to the CDC, diabetes mellitus (DM) and hyperlipidemia have been distinguished as major contributors to death and disability among adults within the U.S. Although these diseases may often escape a directly malignant etiology, the complications of these metabolic disorders are correlated with long-term disability. Uncontrolled diabetes contributes to 5 major complications in U.S. adults, including myocardial infarction, cerebral vascular accident, lower extremity amputation, renal failure, and hyperglycemic crisis. Hyperlipidemia is another major risk factor listed for advancing heart disease and ischemic stroke. Medical and preventive care are effective means for declining complication rates, but these chronic diseases continue to increase in frequency.1,2
The prevalence of DM and hyperlipidemia among U.S. veterans is uniquely higher than that of the general population. About 9.3% of the U.S. population has been diagnosed with diabetes compared with almost 25% of veterans receiving care through the VHA.3,4 According to the 2012 National Ambulatory Medical Care Survey, 15.2% of patients receiving nonfederal care had a hyperlipidemia diagnosis compared with > 20% of the U.S. veteran population.5,6
Patient-Centered Care
A key initiative of the VHA Office of Patient Care Services in providing coordinated health care is the patient aligned care team (PACT). The PACT model seeks to provide communicative patient-centered care and involves primary care providers (PCPs) as well as other clinical and nonclinical affiliates.7 These team members often include a PCP, a registered and licensed practical nurse, a dietitian, a social worker, clerical support, and a clinical pharmacy specialist (CPS). Each professional uses his or her unique specialty to provide evidence-based care to the veteran. Clinical pharmacy specialist integration into the PACT model is one way to provide greater continuity of care for patients and more comprehensive treatment of chronic diseases. Given the need for regular medication titration, these patients may require a greater allocation of time and resources than PCPs can feasibly give. For this reason, CPSs were integrated into PACTs to allow for focused management of chronic conditions.
Most PACT CPSs at the VA Illiana Health Care System (VAIHCS) have advanced residency training and/or board certification, making them proficient in patient communication, drug knowledge, pharmacology, and therapeutics. Within the VHA, CPSs practice as midlevel providers with a scope of practice. This scope grants them the ability to clinically assess drug therapy, order and evaluate laboratory data, prescribe pertinent medications to treat the disease within the scope, and order consults with other professionals of the PACT team.8
Research Studies
Several studies have revealed that pharmacist-driven outpatient interventions for patients with dyslipidemia have significantly reduced low-density lipoprotein cholesterol (LDL-C).9-14 Mazzolini and colleagues found that VHA pharmacist intervention produced a mean LDL-C reduction of 24.5 mg/dL and increased the percentage of patients reaching their LDL-C goal from 36.8% to 64.3%.9 Similarly, at another VHA facility, telephone interventions with patients were also effective in reducing veterans’ LDL-C levels. Fabbio and colleagues found a mean LDL-C reduction of 44.3 mg/dL when performing retrospective chart reviews of pharmacist interventions.10 Other pharmacist-driven LDL-C outcomes were also positive compared with that of usual care by PCPs, showing mean LDL-C reductions of 10.7 mg/dL and 10.4 mg/dL.11,12 All these studies showed positive impacts on outcomes for patients with dyslipidemia. Additionally, these types of interventions have been shown to maintain both patient and PCP satisfaction.15
Clinical pharmacist interventions in the primary care setting have shown positive impacts in DM control with hemoglobin A1c (A1c) reductions by as much as 1.3% to 3.4%.16-19 The highest A1c reductions were evident when pharmacists had the ability to prescribe medications or work in a collaborative practice model with PCPs.16-18 Independent practice and the ability to prescribe medications have been shown to have more impact than recommendations to physicians alone. Recommendation letters from pharmacists did not produce a significant reduction of A1c in one physician group compared with another physician group not receiving DM management recommendations.20Given the increased prevalence of chronic diseases in the veteran population and the literature to support the value of CPSs as provider extenders, the focus of this analysis was to determine the potential benefit of CPS services to the PACT.
The primary objectives of this analysis were to determine the true impact of PACT CPSs on LDL-C and A1c in the veterans enrolled in VAIHCS Disease State Management (DSM) clinics. If positive impacts were revealed, this study would support expansion of CPS services to include additional staff and the management of additional diseases.
Related: Experiences of Veterans With Diabetes From Shared Medical Appointments
Methods
This analysis was a retrospective chart review approved by the VA Illiana Publication and Presentation Committee as a quality improvement (QI) project. Data were collected through the VistA electronic medical record. Subject data were analyzed in a multicenter fashion. A total of 5 sites within VAIHCS were included for review. The study subjects acted as their own controls and were distributed proportionally by volume of DSM visits at each VAIHCS location.
The primary objectives of this QI analysis were to determine the efficacy of PACT CPSs in reducing LDL-C and/or A1c levels in veterans enrolled in VAIHCS DSM clinics. The primary endpoints of this study were change from baseline LDL-C to first LDL-C drawn between 6 and 9 months and change from baseline A1c to first A1c drawn between 9 and 12 months after enrollment in DSM clinics.
The secondary objectives of this QI analysis were to determine the efficacy of PACT CPSs in improving high-density lipoprotein cholesterol (HDL-C), triglycerides (TGs), and total cholesterol (TC) levels in veterans enrolled in DSM clinics. The secondary hyperlipidemia endpoints were the change from baseline HDL-C, TG, and TC to first blood work results and percentage of patients who achieved National Cholesterol Education Program Adult Treatment Panel III (NCEP-ATP III) LDL-C goal between 6 and 9 months after clinic enrollment.21 The secondary DM endpoint was the percentage of patients who achieved the recommended American Diabetes Association A1c goal between 9 and 12 months after enrollment. Mean percentage reduction of primary and relevant secondary endpoints were determined for each study subject.
Subjects selected for inclusion within this analysis were U.S. veterans aged 18 to 75 years who were enrolled in DSM clinics for hyperlipidemia or type 2 DM (T2DM) between September 1, 2011, and September 1, 2013. These subjects did not meet VA performance measures for hyperlipidemia or T2DM at baseline. The key focus of these measures was to include disease prevention and management of diagnosed disease by clinical practice guideline standards. To be included in the analysis, subjects were required to attend DSM clinic appointments for a minimum of 3 months for hyperlipidemia or 6 months for T2DM.
Subjects were excluded from this study if they were nonadherent to clinic visits (defined as missing > 50% of their appointments), were discharged from the clinic due to nonadherence to drug therapy and/or lifestyle interventions, met LDL-C or A1c goals prior to the laboratory collection interval, or had a baseline LDL-C of < 110 mg/dL or baseline A1c of < 8%. Subjects were also excluded if they failed to receive any antihyperlipidemic or antidiabetic agents through the course of their enrollment. Statistics were derived by averaging the percentage change of laboratory parameters per subject. The time frame used was from baseline to the time of primary and secondary endpoint collection. Due to the QI nature of this analysis, power was not targeted for attainment. A randomized sample of 49 subjects was pulled from the population for complete analysis, which was determined by using a random number generator and analyzing corresponding alphabetized patient charts.
Related:Diabetes Patient-Centered Medical Home Approach
Results
Two hundred ninety-five charts were reviewed to yield 49 subjects eligible for the analysis (Figure 1). One subject was eligible for both hyperlipidemia and T2DM. The primary reasons for exclusion were consults for DSM services not related to T2DM or hyperlipidemia (49.4%) and inadequate time of enrollment (30.2%). Less than 10% of exclusions were due to baseline LDL-C < 110 mg/dL or A1c < 8%, unavailable blood work within the collection interval, nonadherence to clinic visits or medications, or other reasons.
Hyperlipidemia
Means and ranges for LDL-C, TG, and TC were all significantly reduced from baseline (Figure 2). The primary endpoint for hyperlipidemia included a 25.1% reduction in mean LDL-C (95% CI, 0.173-0.327). Secondary endpoints included a 12.9% reduction in mean TG from baseline (95% CI, 0.017-0.241) and a 22.5% reduction in mean TC from baseline (95% CI, 0.174-0.276). A 2.1% increase in mean HDL-C was considered nonsignificant (95% CI, -0.082 to -0.042). The percentage of subjects meeting LDL-C goal between 6 and 9 months after enrollment was 36.7% (Table 1).
Twenty-six subjects (63.4%) did not reach their LDL-C goal between 6 and 9 months after clinic enrollment. Of these subjects, an additional analysis was performed to determine potential contributing factors. Eleven of these subjects received moderate- to high-intensity statin therapy, 2 received low-intensity statin therapy, and 3 (without documented statin intolerance) received no statin therapy. Seven subjects had statin intolerance documented in their charts at baseline or during treatment in DSM clinics. Three subjects had documented nonadherence. Subjects receiving no statin therapy due to intolerance or other reasons were prescribed fibrates, cholestyramine, psyllium, or therapeutic lifestyle changes.
Diabetes
Mean A1c and A1c range resulted in a significant reduction from baseline (Figure 3). The primary endpoint for T2DM included a 3.1% reduction in mean A1c (95% CI, 1.45-5.52). The percentage meeting A1c goal between 9 and 12 months after enrollment was 44.4% (Table 2).
Discussion
The results of this analysis suggest a positive impact of CPSs on the care of veterans within VAIHCS, consistent with previous literature. The strengths of this study include a true measure of pharmacist intervention via an extended length of enrollment and regular CPS follow-up visits. Additionally, this was a multicenter design across numerous sites within VAIHCS. The variety of sites showed the impact of differing prescribing practice or consulting habits among CPSs and their associated PACT providers. Subjects were analyzed only if they received a prescription for antihyperlipidemic or antidiabetic medications. This exclusion allowed the analysis to focus on CPS medication adjustment skills.
Related: The Clinical Impact of Electronic Consultation in Diabetes Care
Limitations
This analysis is limited by its retrospective design and the reliance on chart reviews to collect data. As a retrospective analysis, a direct causality between CPS intervention and change in endpoints cannot be determined. Retrospective chart reviews are also subject to both bias and influence from confounding variables due to inability to establish blinding. One confounding variable not assessed was the impact of ancillary PACT members on subject outcomes. Therapeutic lifestyle changes implemented by registered dietitians could have confounded A1c and lipid profile improvements throughout the course of the analysis.
A specific limitation for hyperlipidemia included an early exclusion for meeting LDL-C goal before 3 months. After the completion of several chart reviews, it was determined that many of these patients required rapid or minimal medication adjustment to meet their therapeutic goals. The major limitation for T2DM included a small sample size. This limitation was partially due to the establishment of hyperlipidemia services before T2DM services within VAIHCS DSM clinics. Due to earlier establishment, hyperlipidemia management was better recognized, and consults for this disease were more prevalent. Sample size was also limited for T2DM due to the nature of the chart review and the original data attainment. The review of both diseases was limited due to some subjects not acquiring laboratory values within the predefined collection periods. In some cases, useful data outside the collection interval could not be used.
Although CPSs produced significant reductions in LDL-C, TG, and TC, their ability to provide more impactful results was likely limited due to enrollment for statin intolerance. Some studies indicated the incidence of statin intolerance to be about 5% to 10% of the general population.22 However, in this analysis, 17.1% of patients who did not meet LDL-C goal had some history of or current statin intolerance. Despite this high degree of intolerance, CPS management was still able to effectively improve lipid profiles but to a less significant degree.
A final point to consider is the design of the analysis before the release of the American College of Cardiology/American Heart Association (ACC/AHA) 2013 cholesterol guidelines.23 Target LDL-C reduction is no longer considered the most appropriate management technique for reducing the risk of atherosclerotic cardiovascular disease (ASCVD). However, the hyperlipidemia endpoints in this analysis were directly related to NCEP-ATP III recommendations. The current guidelines focus on the intensity of statin therapy for patients with ASCVD or elevated risk for ASCVD. With the release of this new guideline, a poststudy analysis was completed to apply the new information to previous practice in VAIHCS DSM clinics. Many subjects were already meeting their statin intensity goal without further intervention. In fact, 46.3% of subjects were meeting their goal at the time of primary endpoint collection. Between the release of the new clinical guideline and February 2014, another 14.6% of subjects had changed therapy and were meeting their statin-intensity goal, with or without pharmacist intervention. Another 17.1% of patients had statin intolerance that may have limited their ability to reach their statin-intensity goal. The remaining 22% of subjects (without statin intolerance) did not have any adjustments in hyperlipidemia profiles since the release of the updated guideline; these patients were scheduled to be contacted as a result of this analysis. Further review of patients meeting LDL-C goal at primary endpoint collection would also be beneficial to ensure appropriate management per current ACC/AHA 2013 guidelines.
Conclusion
Pharmacists were able to produce significant improvements in LDL-C and A1c profiles despite the confounding factors mentioned previously. With further analysis, VAIHCS may demonstrate efficacy in other CPS services and have greater potential to expand its services.
Author disclosures
The authors report no actual or potential conflicts of interest with regard to this article.
Disclaimer
This quality improvement analysis was performed to improve patient care at the VAIHCS, Danville, IL. It was reviewed by the VHA education department, privacy officer, information security officer, and VAIHCS leadership and was determined to meet guidelines for nonresearch, which is exempt from IRB review. As a quality improvement project, these data are not generalizable.
The opinions expressed herein are those of the authors and do not necessarily reflect those of Federal Practitioner, Frontline Medical Communications Inc., the U.S. Government, or any of its agencies. This article may discuss unlabeled or investigational use of certain drugs. Please review the complete prescribing information for specific drugs or drug combinations—including indications, contraindications, warnings, and adverse effects—before administering pharmacologic therapy to patients.
1. Centers for Disease Control and Prevention. Diabetes report card, 2014. Atlanta, GA: Centers for Disease Control and Prevention, U.S. Department of Health and Human Services; 2014. www .cdc.gov/diabetes/pdfs/library/diabetesreport card2014.pdf. Accessed August 25, 2015.
2. Fryar CD, Chen T-C, Li X. Prevalence of uncontrolled risk factors for cardiovascular disease: United States, 1999-2010. National Center for Health Statistics Data Brief, No. 103. National Center for Health Statistics, Centers for Disease Control and Prevention, U.S. Department of Health and Human Services Website. http://www.cdc.gov /nchs/data/databriefs/db103.htm. Updated August 3, 2012. Accessed August 10, 2015.
3. American Diabetes Association. Statistics about diabetes. American Diabetes Association Website. http://www.diabetes.org/diabetes-basics/statistics. Updated May 18, 2015. Accessed August 10, 2015.
4. U.S. Department of Veterans Affairs. Close to 25% of VA patients have diabetes. U.S. Department of Veterans Affairs Website. http://www.va.gov/health /NewsFeatures/20111115a.asp. Updated April 17, 2015. Accessed August 11, 2015.
5. Centers for Disease Control and Prevention. National ambulatory medical care survey: 2012 summary tables. Centers for Disease Control and Prevention Website. http://www.cdc.gov/nchs /data/ahcd/namcs_summary/2012_namcs_web _tables.pdf. Accessed August 25, 2015.
6. Utilization of Veterans Affairs Medical Care Services by United States Veterans. New York, NY: Pfizer Inc; 2003.
7. U.S. Department of Veterans Affairs. Primary care services. U.S. Department of Veterans Affairs Website. http://www.va.gov/primarycare/pcmh. Updated May 13, 2015. Accessed August 11, 2015.
8. U.S. Department of Veterans Affairs. Clinical Pharmacy Services. VHA Handbook 1108.11. http://www.va.gov/vhapublications/ViewPublication .asp?pub_ID=3120. Accessed August 25, 2015.
9. Mazzolini TA, Irons BK, Schell EC, Seifert CF. Lipid levels and use of lipid-lowering drugs for patients in pharmacist-managed lipid clinics versus usual care in 2 VA medical centers. J Manag Care Pharm. 2005;11(9):763-771.
10. Fabbio KL, Bradley M, Chrymko M. Evaluation of a pharmacist-managed telephone lipid clinic at a Veterans Affairs Medical Center. Ann Pharmacother. 2010;44(1):50-56.
11. Charrois TL, Zolezzi M, Koshman SL, et al. A systematic review of the evidence for pharmacist care of patients with dyslipidemia. Pharmacother. 2012;32(3):222-233.
12. Smith MC, Boldt AS, Walston CM, Zillich AJ. Effectiveness of a pharmacy care management program for veterans with dyslipidemia. Pharmacother. 2013;33(7):736-743.
13. Till LT, Voris JC, Horst JB. Assessment of clinical pharmacist management of lipid-lowering therapy in a primary care setting. J Manag Care Pharm. 2003;9(3):269-273.
14. Machado M, Nassor N, Bajcar JM, Guzzo GC, Einarson TR. Sensitivity of patient outcomes to pharmacist interventions. Part III: systematic review and meta-analysis in hyperlipidemia management. Ann Pharmacother. 2008;42(9):1195-1207.
15. Collins C, Kramer A, O’Day ME, Low MB. Evaluation of patient and provider satisfaction with a pharmacist-managed lipid clinic in a Veterans Affairs medical center. Am J Health Syst Pharm. 2006;63(18):1723-1727.
16. American Association of Diabetes Educators. The scope and standards for the practice of diabetes education by pharmacists. American Association of Diabetes Educators Website. http://www .diabeteseducator.org/docs/default-source/legacy -docs/_resources/pdf/PharmDScopeStandards.pdf. Updated 2011. Accessed August 11, 2015.
17. Wubben DP, Vivian EM. Effects of pharmacist outpatient interventions on adults with diabetes mellitus: a systematic review. Pharmacother. 2008;28(4):421-436.
18. Armor BL, Britton ML, Dennis VC, Letassy NA. A review of pharmacist contributions to diabetes care in the United States. J Pharm Pract. 2010;23(3):250-264.
19. Jarab AS, Alqudah SG, Mukattash TL, Shattat G, Al-Qirim T. Randomized controlled trial of clinical pharmacy management of patients with type 2 diabetes in an outpatient diabetes clinic in Jordan. J Manag Care Pharm. 2012;18(7):516-526.
20. Kirwin JL, Cunningham RJ, Sequist TD. Pharmacist recommendations to improve the quality of diabetes care: a randomized controlled trial. J Manag Care Pharm. 2010;16(2):104-113.
21. Expert Panel on Detection, Evaluation, and Treatment of High Blood Cholesterol in Adults. Executive Summary of the Third Report of the National Cholesterol Education Program (NCEP) Expert Panel on Detection, Evaluation, and Treatment of High Blood Cholesterol in Adults (Adult Treatment Panel III). JAMA. 2001;285(19):2486-2497.
22. Kennedy SP, Barnas GP, Schmidt MJ, Glisczinski MS, Paniagua AC. Efficacy and tolerability of once-weekly rosuvastatin in patients with previous statin intolerance. J Clin Lipidol. 2011;5(4):308-315.
23. Stone NJ, Robinson JG, Lichtenstein AH, et al; American College of Cardiology/American Heart Association Task Force on Practice Guidelines. 2013 ACC/AHA guideline on the treatment of blood cholesterol to reduce atherosclerotic cardiovascular risk in adults: a report of the American College of Cardiology/American Heart Association Task Force on Practice Guidelines. J Am Coll Cardiol. 2014;63(25, pt B):2889-2934.
Assessment of High Staphylococcus aureus MIC and Poor Patient Outcomes
Staphylococcus aureus (S aureus) is a common cause of infection within the hospital and in the community.1 Treatment is based on the organism’s susceptibility to methicillin and is referred to as either MRSA (methicillin-resistant S aureus) or MSSA (methicillin-susceptible S aureus). As antibiotic resistance has evolved, patients with S aureus (especially MRSA) infections have become more difficult to treat. Susceptibility testing guides treatment of these infections and determines the minimum inhibitory concentration (MIC) for each antibiotic. A MIC is the minimum concentration of an antibiotic that will inhibit the visible growth of the organism after incubation.
Related: Experts Debate Infection Control Merits of ‘Bare Beneath the Elbows’
Vancomycin has remained the mainstay for treatment of patients with MRSA infections. An increasing number of infections with high documented MICs to vancomycin are raising concern that resistance may be developing. Clinical controversy exists within the infectious disease community as to whether vancomycin is less effective against S aureus infections with a vancomycin MIC of ≥ 2 µg/mL, contributing to poor patient outcomes.2
The Clinical and Laboratory Standards Institute (CLSI) lowered the breakpoint for vancomycin in 2006 from > 4 µg/mL to > 2 µg/mL.3 Breakpoints delineate MIC values that are considered susceptible, nonsusceptible, or resistant to an antibiotic. The CLSI breakpoint change points to an increase in vancomycin resistance and supports the need for further discussion and insight.
A 2012 meta-analysis was conducted to determine whether an association exists between S aureus infections with vancomycin MIC values ≥ 2 µg/mL and the effectiveness of the therapy.2 Twenty-two studies were included with a primary outcome of 30-day mortality. A review of MRSA data revealed a statistically significant association between high vancomycin MICs (≥ 1.5 µg/mL) and increased mortality (P < .01), regardless of the source of infection. When limiting the data to Etest (bioMérieux, Marcy L’Etoile, France) MIC testing for MRSA bloodstream infections (BSIs), a vancomycin MIC ≥ 1.5 µg/mL was not associated with increased mortality (P = .08). Comparing data for MIC ≥ 2 µg/mL and ≤ 1.5 µg/mL, found that MICs ≥ 2 µg/mL were associated with increased mortality (P < .01). Analysis of the 11 studies that included data on treatment failure concluded that S aureus infections with a vancomycin MIC ≥ 1.5 µg/mL were associated with an increased risk of treatment failure in both MSSA and MRSA infections (P < .01) and that treatment failure was more likely in MRSA BSIs than in non-BSIs (P < .01).Evidence to support a possible correlation between high S aureus vancomycin MICs and poor patient outcomes came from a 2013 meta-analysis.3 The specific aim of this study was to examine the correlations between vancomycin MIC, patient mortality, and treatment failure. A MIC ≥ 1.5 µg/mL and ≥ 1.0 µg/mL were used to classify MICs as high when determined by Etest and broth microdilution (BMD), respectively. Analysis revealed an association between high vancomycin MICs and increased risk of treatment failure (relative risk [RR] 1.40, 95% confidence interval [CI] 1.15-1.71) and overall mortality (RR 1.42, 95% CI 1.08-1.87). Similarly, a sensitivity analysis on S aureus BSIs with high vancomycin MICs revealed an increased risk of mortality (RR 1.46, 95% CI 1.06-2.01) and treatment failure (RR 1.37, 95% CI 1.09-1.73).
Related: The Importance of an Antimicrobial Stewardship Program
The most recent meta-analysis (published in 2014) included patients with S aureus bacteremia and evaluated the association of high S aureus vancomycin MIC with an increased risk of mortality.4 A high MIC was defined as ≥ 1.5 µg/mL by Etest and ≥ 2.0 µg/mL by BMD. The analysis of 38 studies found a nonstatistically significant difference in mortality risk (P = .43). Further analysis was performed to determine whether the vancomycin MIC cutoff plays a role in increased mortality. No statistically significant difference in mortality was found when using a vancomycin MIC ≥ 1.5 µg/mL, ≥ 2.0 µg/mL, ≥ 4.0 µg/mL, or ≥ 8.0 µg/mL. The authors argued that their differing conclusions from other meta-analyses may be due to the inclusion of only bacteremias rather than all infection types, and although there was not a statistically significant difference, increased risk of mortality could not be excluded.
Related: Results Mixed in Hospital Efforts to Tackle Antimicrobial Resistance
Although conclusions of published meta-analyses differ, the results highlight the necessity of using clinical judgment in treating patients with S aureus infections with high MIC values and to consider the primary source and severity of infection. A confounding factor to direct comparison of the literature is the variations based on the method of MIC determination and testing (Etest vs BMD).
Additionally, all 3 studies addressed the importance of considering clinical patient factors that may lead to poorer prognosis as well as the difficultly in achieving necessary vancomycin levels with limited toxicity. The risk of increased mortality in patients with high vancomycin MICs cannot be ruled out at this time. Therefore, additional patient factors as well as the potential toxicities that may result from vancomycin therapy should be considered when using vancomycin in treating patients with S aureus infections.
Additional Note
An earlier version of this article appeared in the Pharmacy Related Newsletter: The Capsule, of the William S. Middleton Memorial Veterans Hospital.
Author disclosures
The authors report no actual or potential conflicts of interest with regard to this article.
Disclaimer
The opinions expressed herein are those of the authors and do not necessarily reflect those of Federal Practitioner, Frontline Medical Communications Inc., the U.S. Government, or any of its agencies. This article may discuss unlabeled or investigational use of certain drugs. Please review complete prescribing information for specific drugs or drug combinations—including indications, contraindications, warnings, and adverse effects—before administering pharmacologic therapy to patients.
1. Martin JH, Norris R, Barras M, et al. Therapeutic monitoring of vancomycin in adult patients: a consensus review of the American Society of Health-System Pharmacists, the Infectious Diseases Society of America, and the Society of Infectious Diseases Pharmacists. Clin Biochem Rev. 2010;31(1):21-24.
2. van Hal SJ, Lodise TP, Paterson DL. The clinical significance of vancomycin minimum inhibitory concentration in Staphylococcus aureus infections: a systematic review and meta-analysis. Clin Infect Dis. 2012;54(6):755-771.
3. Jacob JT, DiazGranados CA. High vancomycin minimum inhibitory concentration and clinical outcomes in adults with methicillin-resistant Staphylococcus aureus infections: a meta-analysis. Int J Infect Dis. 2013;17(2):e93-e100.
4. Kalil AC, Van Schooneveld TC, Fey PD, Rupp ME. Association between vancomycin minimum inhibitory concentration and mortality among patients with Staphylococcus aureus bloodstream infections: a systematic review and meta-analysis. JAMA. 2014;312(15):1552-1564.
Staphylococcus aureus (S aureus) is a common cause of infection within the hospital and in the community.1 Treatment is based on the organism’s susceptibility to methicillin and is referred to as either MRSA (methicillin-resistant S aureus) or MSSA (methicillin-susceptible S aureus). As antibiotic resistance has evolved, patients with S aureus (especially MRSA) infections have become more difficult to treat. Susceptibility testing guides treatment of these infections and determines the minimum inhibitory concentration (MIC) for each antibiotic. A MIC is the minimum concentration of an antibiotic that will inhibit the visible growth of the organism after incubation.
Related: Experts Debate Infection Control Merits of ‘Bare Beneath the Elbows’
Vancomycin has remained the mainstay for treatment of patients with MRSA infections. An increasing number of infections with high documented MICs to vancomycin are raising concern that resistance may be developing. Clinical controversy exists within the infectious disease community as to whether vancomycin is less effective against S aureus infections with a vancomycin MIC of ≥ 2 µg/mL, contributing to poor patient outcomes.2
The Clinical and Laboratory Standards Institute (CLSI) lowered the breakpoint for vancomycin in 2006 from > 4 µg/mL to > 2 µg/mL.3 Breakpoints delineate MIC values that are considered susceptible, nonsusceptible, or resistant to an antibiotic. The CLSI breakpoint change points to an increase in vancomycin resistance and supports the need for further discussion and insight.
A 2012 meta-analysis was conducted to determine whether an association exists between S aureus infections with vancomycin MIC values ≥ 2 µg/mL and the effectiveness of the therapy.2 Twenty-two studies were included with a primary outcome of 30-day mortality. A review of MRSA data revealed a statistically significant association between high vancomycin MICs (≥ 1.5 µg/mL) and increased mortality (P < .01), regardless of the source of infection. When limiting the data to Etest (bioMérieux, Marcy L’Etoile, France) MIC testing for MRSA bloodstream infections (BSIs), a vancomycin MIC ≥ 1.5 µg/mL was not associated with increased mortality (P = .08). Comparing data for MIC ≥ 2 µg/mL and ≤ 1.5 µg/mL, found that MICs ≥ 2 µg/mL were associated with increased mortality (P < .01). Analysis of the 11 studies that included data on treatment failure concluded that S aureus infections with a vancomycin MIC ≥ 1.5 µg/mL were associated with an increased risk of treatment failure in both MSSA and MRSA infections (P < .01) and that treatment failure was more likely in MRSA BSIs than in non-BSIs (P < .01).Evidence to support a possible correlation between high S aureus vancomycin MICs and poor patient outcomes came from a 2013 meta-analysis.3 The specific aim of this study was to examine the correlations between vancomycin MIC, patient mortality, and treatment failure. A MIC ≥ 1.5 µg/mL and ≥ 1.0 µg/mL were used to classify MICs as high when determined by Etest and broth microdilution (BMD), respectively. Analysis revealed an association between high vancomycin MICs and increased risk of treatment failure (relative risk [RR] 1.40, 95% confidence interval [CI] 1.15-1.71) and overall mortality (RR 1.42, 95% CI 1.08-1.87). Similarly, a sensitivity analysis on S aureus BSIs with high vancomycin MICs revealed an increased risk of mortality (RR 1.46, 95% CI 1.06-2.01) and treatment failure (RR 1.37, 95% CI 1.09-1.73).
Related: The Importance of an Antimicrobial Stewardship Program
The most recent meta-analysis (published in 2014) included patients with S aureus bacteremia and evaluated the association of high S aureus vancomycin MIC with an increased risk of mortality.4 A high MIC was defined as ≥ 1.5 µg/mL by Etest and ≥ 2.0 µg/mL by BMD. The analysis of 38 studies found a nonstatistically significant difference in mortality risk (P = .43). Further analysis was performed to determine whether the vancomycin MIC cutoff plays a role in increased mortality. No statistically significant difference in mortality was found when using a vancomycin MIC ≥ 1.5 µg/mL, ≥ 2.0 µg/mL, ≥ 4.0 µg/mL, or ≥ 8.0 µg/mL. The authors argued that their differing conclusions from other meta-analyses may be due to the inclusion of only bacteremias rather than all infection types, and although there was not a statistically significant difference, increased risk of mortality could not be excluded.
Related: Results Mixed in Hospital Efforts to Tackle Antimicrobial Resistance
Although conclusions of published meta-analyses differ, the results highlight the necessity of using clinical judgment in treating patients with S aureus infections with high MIC values and to consider the primary source and severity of infection. A confounding factor to direct comparison of the literature is the variations based on the method of MIC determination and testing (Etest vs BMD).
Additionally, all 3 studies addressed the importance of considering clinical patient factors that may lead to poorer prognosis as well as the difficultly in achieving necessary vancomycin levels with limited toxicity. The risk of increased mortality in patients with high vancomycin MICs cannot be ruled out at this time. Therefore, additional patient factors as well as the potential toxicities that may result from vancomycin therapy should be considered when using vancomycin in treating patients with S aureus infections.
Additional Note
An earlier version of this article appeared in the Pharmacy Related Newsletter: The Capsule, of the William S. Middleton Memorial Veterans Hospital.
Author disclosures
The authors report no actual or potential conflicts of interest with regard to this article.
Disclaimer
The opinions expressed herein are those of the authors and do not necessarily reflect those of Federal Practitioner, Frontline Medical Communications Inc., the U.S. Government, or any of its agencies. This article may discuss unlabeled or investigational use of certain drugs. Please review complete prescribing information for specific drugs or drug combinations—including indications, contraindications, warnings, and adverse effects—before administering pharmacologic therapy to patients.
1. Martin JH, Norris R, Barras M, et al. Therapeutic monitoring of vancomycin in adult patients: a consensus review of the American Society of Health-System Pharmacists, the Infectious Diseases Society of America, and the Society of Infectious Diseases Pharmacists. Clin Biochem Rev. 2010;31(1):21-24.
2. van Hal SJ, Lodise TP, Paterson DL. The clinical significance of vancomycin minimum inhibitory concentration in Staphylococcus aureus infections: a systematic review and meta-analysis. Clin Infect Dis. 2012;54(6):755-771.
3. Jacob JT, DiazGranados CA. High vancomycin minimum inhibitory concentration and clinical outcomes in adults with methicillin-resistant Staphylococcus aureus infections: a meta-analysis. Int J Infect Dis. 2013;17(2):e93-e100.
4. Kalil AC, Van Schooneveld TC, Fey PD, Rupp ME. Association between vancomycin minimum inhibitory concentration and mortality among patients with Staphylococcus aureus bloodstream infections: a systematic review and meta-analysis. JAMA. 2014;312(15):1552-1564.
Antihypertensive Therapy and BP Control
Current recommendations for blood pressure (BP) control focus on chronic management of ambulatory patients; however, treatment guidelines for hospitalized patients who have acute increases in BP or simply uncontrolled BP lack clarity regarding appropriate therapeutic options and short‐term treatment goals.[1, 2] For patients with a history of hypertension, management in the hospital setting typically involves continuation of home therapies. In the inpatient setting, uncontrolled hypertension can be categorized as hypertensive emergency, hypertensive urgency, or asymptomatic poor BP control.[3] Asymptomatic BP elevations occur when the BP is not at goal (but not inordinately high) and the patient has no signs of new or worsening end‐organ damage.[4, 5, 6]
Published data have not demonstrated that aggressive treatment of asymptomatic hypertension in the inpatient setting improves short‐ or long‐term outcomes; however, such aggressive treatment may be associated with iatrogenic adverse effects.[5, 7, 8] Despite the lack of evidence of patient benefit, there is a tendency to treat hospitalized patients with asymptomatic BP elevations aggressively by prescribing IV antihypertensive agents on an as‐needed basis.[9] Intravenous hydralazine and labetalol are frequently used, although these agents are not recommended as initial therapy in consensus recommendations for asymptomatic uncontrolled hypertension in either the inpatient or outpatient setting.[10]
We therefore undertook the present study to determine the type and frequency of ordered and administered episodic intravenous (IV) antihypertensive drug therapy, the BP thresholds triggering such administration, and subsequent in‐hospital clinical outcomes after administration of IV antihypertensive drugs. Accordingly, we evaluated a series of hospitalized patients, in noncritical care settings with no evidence of new or worsening target‐organ injury, who were treated with episodic (either as needed or 1 time only) IV antihypertensive therapy.
METHODS
This study is a retrospective review. Between November 1, 2010 and January 31, 2011 we reviewed the charts of all patients who had at least 1 dose of IV hydralazine, enalaprilat, labetalol, or metoprolol ordered, regardless of previous oral antihypertensive treatment or hypertension diagnosis. Other IV antihypertensive agents were not evaluated in this study, as they are only available in critical care units at our institution. This study took place at an 806‐bed urban hospital that utilizes 100% computer prescriber order entry and bar code technology to document medication administration. The institutional review boards of the Detroit Medical Center and Wayne State University, Detroit, Michigan approved this study.
Patient Identification
Patients were identified through a list of all 1‐time‐only and as‐needed orders for IV hydralazine, enalaprilat, labetolol, or metoprolol. The list was generated daily through the hospital electronic medical record system (Cerner Powerchart, North Kansas City, MO). Patients were excluded if they were younger than 18 or older than 89 years of age, admitted to the intensive care or coronary care unit, were receiving nothing by mouth, pregnant, received a renal transplant in the past 3 months, or if there was any clinical manifestation of new or worsening target‐organ injury consistent with the diagnosis of hypertensive emergency.
Data Collection
The following data were collected for all patients: basic demographic information including factors that have been specifically associated with differences in hypertension risk (ie, age, sex, race, weight, and renal function), antihypertensive regimen (if any) prior to admission, changes to oral antihypertensive therapy during admission, order for sodium‐restricted diet, baseline and discharge laboratory values and vital signs. In addition, the details of their antihypertensive therapy order and administration were collected, including prescriber type (attending, resident, or physician extender), service of prescriber, criteria for use, and date and time of drug administration categorized by shift (morning shift, 7 am to 3 pm; afternoon shift, 3 pm to 11 pm; and night shift, 11 pm to 7 am). To analyze the outcomes of administering episodic IV antihypertensive therapy, the following data were collected: changes in average BP within 30 minutes to 6 hours after drug administration and occurrence of antihypertensive therapy‐related adverse events, including any interventions required after administration and adjustments to oral antihypertensive therapy during admission or upon discharge. In cases where BP data were not available (either just prior to or within 6 hours following administration of an IV antihypertensive), the data were not included in the analysis. To determine whether an antihypertensive drug regimen had been intensified, a therapeutic intensity score (TIS) was calculated for the oral antihypertensive regimen on admission and again at discharge. The antihypertensive TIS was calculated by dividing the total daily dose of each antihypertensive medication by the maximum US Food and Drug Administrationapproved daily dose.[11]
Adverse Outcomes Definition
We defined an adverse outcome as a 25% decrease in systolic or diastolic BP within 6 hours and/or intervention to treat symptoms of hypotension. This definition is consistent with Seventh Report of the Joint National Committee on the Prevention, Detection, Evaluation, and Treatment of High Blood Pressure (JNC 7) recommendations to assure safety when lowering BP in the setting of hypertensive emergency.[6] Although the patients in this study were not experiencing hypertensive emergency, this definition is supported by reports of negative sequelae from overzealous lowering of BP,[12, 13, 14] and it reflects criteria used in other trials.[10] Hypotension was deemed to have occurred if any of the following were documented: as IV fluid administration; scheduled BP medication held (at either the nurses discretion or per physician order); change in level of care; change in mental status; or transient ischemic attack, stroke, or chest pain within 30 minutes to 6 hours after administration. Heart rate changes were also considered to be adverse outcomes, including tachycardia (heart rate >100 beats per minute [bpm] or increase 20 bpm from baseline) or bradycardia (heart rate <50 bpm).
Analysis
Descriptive statistics were performed for all variables. Continuous data were summarized using means and standard deviations. Categorical variables were summarized as counts and percentages. Paired t tests were used to contrast changes from baseline for continuous variables pre‐ and post‐BP, and heart rate changes were evaluated only for the first episode of IV antihypertensive drug administration in patients receiving multiple doses of antihypertensive medication to avoid the bias created by repeated or clustered measures in a given patient. 2 tests were used to test differences in categorical variables. All statistical testing was considered significant when 2‐tailed P values were <0.05. Analyses were generated using SAS software version 9.4 (SAS Institute Inc., Cary, NC).
RESULTS
Patients
During the study period, there were 6133 inpatient adult admissions. Of 495 patients who had at least 1 order for IV hydralazine, enalaprilat, labetolol, or metoprolol, 246 were included in the analysis after applying the exclusion criteria (Figure 1). Patients were divided into 2 groups. One group had an order for an IV antihypertensive that was not administered (n = 74), and the other had an order for an IV antihypertensive and received at least 1 dose (n = 172). The demographic characteristics of the 2 groups are compared in Table 1. Patients who had their chronic oral antihypertensive regimens intensified after receiving IV antihypertensive medications were more often African American, leaner, more intensively treated, and had higher baseline BP.
| Did Not Receive IV Antihypertensive (n = 74) | Did Receive IV Antihypertensive (n = 172) | P | |
|---|---|---|---|
| |||
| Age, y | 61.6 13.9 | 60.6 13.7 | |
| Male sex | 51% | 47% | |
| African American | 74% | 87% | 0.008 |
| Weight, kg | 94.6 33.2 | 88.5 27.7 | |
| Admit systolic BP | 148 23 | 163 32 | <0.0001 |
| Admit diastolic BP | 82 13 | 87 18 | 0.009 |
| Admit heart rate | 87 18 | 82 20 | 0.069 |
| Admit TIS | 0.84 0.72 | 1.08 0.88 | 0.026 |
| Baseline SCr | 1.78 2.00 | 2.74 3.30 | 0.006 |
| Baseline AST | 26.5 12.5 | 65 126.2 | 0.046 |
| Low‐sodium diet order | 65% | 83% | 0.002 |
| Ordering service | |||
| Cardiology | 14% | 19% | |
| Internal medicine | 49% | 47% | |
| Nephrology | 0% | 6% | |
| Other services | 37% | 28% | |
| Prescriber type | |||
| Resident | 30% | 49% | |
| Physician extender | 53% | 35% | |
| Attending | 17% | 16% | |
| 1‐time‐only order | 5% | 19% | |
| As‐needed order | 95% | 81% | |

Prescribing Patterns
Medical residents prescribed nearly half (49%) of the orders for episodic IV antihypertensives. Attending physicians were responsible for 16% of episodic antihypertensive orders and physician extenders (physician's assistants and nurse practitioners) for 35%. A total of 321 orders were prescribed for the 246 patients in the study. Hydralazine was the preferred antihypertensive agent (80.1%), with IV ‐blockers prescribed less frequently (labetalol 15.6% and metoprolol 4.4%). There were no orders for IV enalaprilat. BP parameters were included in 181 (56%) of the episodic IV antihypertensive orders. Of the IV antihypertensive orders containing criteria, 153 (84.5%) had systolic BP threshold for administration <180 mm Hg (Table 2).
| BP Criteria for Administration of IV Antihypertensive Contained in Order, mm Hg | Did Not Receive IV Antihypertensive, n (%), n = 71* | Did Receive IV Antihypertensive, n (%), n = 133* |
|---|---|---|
| ||
| SBP >120 | 2 (2.8) | 1 (0.7) |
| SBP >130 | 2 (2.8) | 9 (6.8) |
| SBP >140 | 2 (2.8) | 5 (3.8) |
| SBP >150 | 4 (5.6) | 8 (6) |
| SBP >160 | 27 (38) | 58 (43.7) |
| SBP >170 | 26 (36.6) | 29 (21.8) |
| SBP >180 | 8 (11.4) | 18 (13.5) |
| SBP >200 | 4 (3) | |
| DBP >100 | 1 (0.7) | |
Drug Administration and Short‐term Data
Table 2 indicates the BP criteria specified in the episodic IV antihypertensive orders. For the 74 patients who did not receive an episodic IV antihypertensive agent, despite having an order, the nurses caring for the patients determined that their BPs never met the criteria for administration of the IV antihypertensive agent. The remainder of the results apply only to the 172 patients who actually received episodic IV antihypertensive therapy. Two of these patients did not have BP data available and were not included in the short‐term BP analysis. Almost half (48%) of the patients received 1 dose of episodic IV antihypertensive, 26% received 2 doses, and 11% received 3 doses. One patient received 10 doses. Hydralazine significantly lowered BP, whereas metoprolol did not (Figure 2).
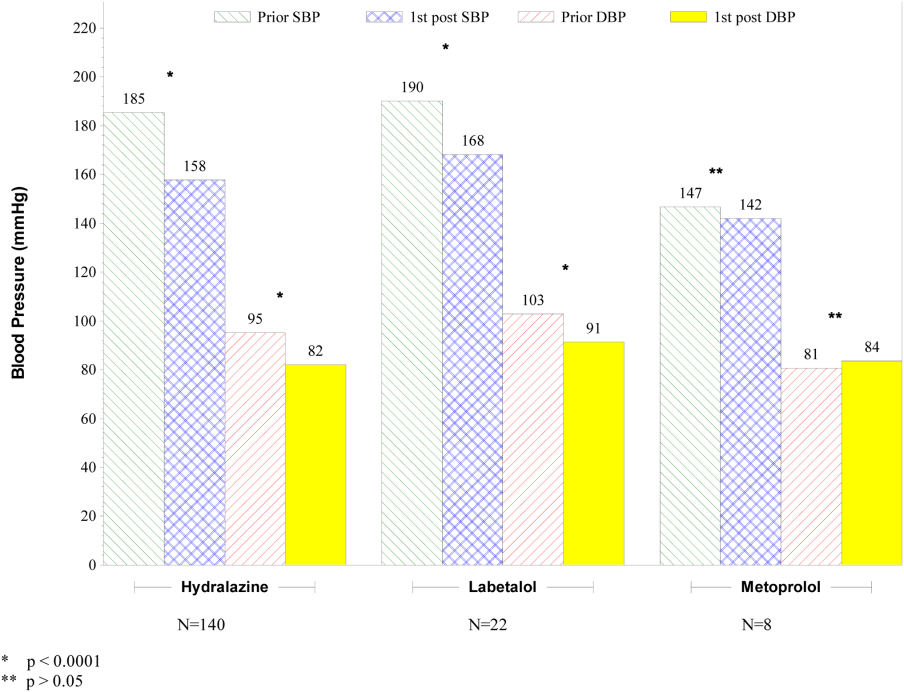
The number of IV antihypertensive doses (for which BP data are available) administered during the night shift (n = 75) was numerically higher than the morning (n = 54) and the afternoon (n = 41) shifts. The mean BPs that triggered administration of IV antihypertensives did not differ among shifts (night shift 183/93, morning shift 184/99, afternoon shift 182/97).
Changes to Oral Antihypertensive Regimen After Administration of IV Antihypertensive Drugs
After administration of an episodic IV antihypertensive, the inpatient oral medication regimen was intensified in only 89 patients (52%). The BP reduction from admission to discharge in patients who had their inpatient oral medication regimen adjusted versus those who did not have an inpatient oral regimen adjustment after receiving IV antihypertensive medication is shown in Figure 3. Patients with intensification of their oral medications had a greater reduction in systolic BP from admission to discharge, compared to patients who received episodic IV antihypertensives but had no subsequent change to their inpatient oral antihypertensive regimen (Figure 3).
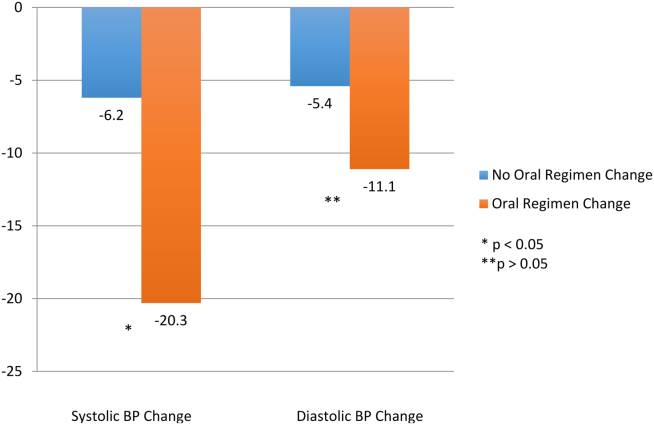
Adverse Events
Fifty‐six patients (32.6%) demonstrated BP reductions of more than 25% within 6 hours of antihypertensive administration. Of these patients, 2 received IV fluids, and 6 (3.5%) had a scheduled oral BP medication held. Of the patients who received IV hydralazine, 13 (4.4%) had an increase in heart rate >20 bpm, with 7 having a heart rate >100 bpm. One patient who received labetolol experienced bradycardia. No patient required a higher level of care (transfer to an intensive care unit) because of hemodynamic instability. In addition, no patient experienced a change in mental status, transient ischemic attack, stroke, or chest pain within 30 minutes to 6 hours after administration.
DISCUSSION
The overwhelming majority of administrations of costly episodic IV antihypertensive drugs among this low‐risk population were in patients with modest BP elevations who may have merited no more, at most, than intensification of their oral antihypertensive drug regimen or observation. Such administration was infrequently followed by intensification of the oral antihypertensive drug regimen, and a significant number of patients experienced a potentially adverse clinical event. Excessive reduction of BP resulting in withholding of oral agents or administering IV fluids (as seen in 8 patients) is clinically relevant, especially in a setting where rapid lowering of BP with IV antihypertensives have no proven clinical benefit. There were differences between patients who did and did not received IV antihypertensive drug therapy, as those receiving therapy were higher‐risk patients. Of the patients initially evaluated for inclusion in this analysis, approximately half had a clear indication for IV antihypertensive therapy and were not included in this analysis. It should also be noted that one‐third of the patients included in the study did not subsequently receive an IV antihypertensive agent.
Recently updated hypertensive guidelines do not address the treatment of hypertensive urgency and emergency, whereas the JNC 7 addressed hypertensive urgency but did not provide a specific BP definition or goals because of concerns about overly aggressive management of severe asymptomatic hypertension.[2, 6] For patients with chronically elevated BP, its rapid reduction, even to levels that remain in the frankly hypertensive range, can be associated with negative clinical sequelae, attributable to decreased target organ perfusion causing clinically manifest ischemia.[3] Accordingly, there have been reports of ischemic events related to unwarranted and overzealous BP lowering.[12, 13, 14] In such patients, resistance vessel remodeling causes a rightward shift of the entire pressure/flow auto regulatory curve in critical arterial beds (eg, cerebral, coronary, and renal). Higher systemic pressure is necessary to maintain adequate perfusion in the target organ, at least over the short‐term. Thus, rapid, aggressive BP reduction can result in the aforementioned negative sequelae because remodeled resistance arterioles are not capable of vasodilating enough to ensure adequate blood flow when systemic pressure falls precipitously.
The patients in this study had no evidence of new or worsening pressure‐related end‐organ damage; therefore, there appeared to be no medical justification for emergent BP lowering via the IV route (a very small minority may have had BP high enough to have justified being diagnosed with hypertensive urgency in which fast‐acting oral therapy would be used). Despite the paucity of data to support this practice, it does, however, appear to be relatively common.[9] The high prevalence of IV hydralazine use in this inpatient study is consistent with the retrospective study reported by Weder and Erickson at the University of Michigan.[9]
Even among those with hypertensive urgencies, oral medication is the preferred route (assuming the patient can eat and swallow without difficulty and does not manifest an altered sensorium). Furthermore, the risks associated with overzealous BP lowering can be devastating. The likelihood of target‐organ ischemia (eg, angina pectoris, myocardial infarction, azotemia, stroke, transient ischemic attack) is most strongly correlated to the rapidity of the BP reduction, even to levels within the hypertensive range, in patients with persistent poor BP control.[4, 15, 16] Thus, the justification for considering a >25% drop in systolic BP within 6 hours of the administration of the IV antihypertensive agent as a potential adverse event, especially because there was only a very small immediate risk for adverse cardiovascular sequelae at the BP levels triggering administration of IV antihypertensive drug therapy.
Although we found that residents and physician assistants prescribed most IV antihypertensives, the practice of prescribing IV antihypertensive therapy appears to be common among all prescriber types. A recent survey assessing the attitudes and practices of resident physicians regarding hypertension in the inpatient setting found that 44% of respondents would treat acute asymptomatic, moderately elevated BP (182/100 mm Hg) with either an oral or intravenous agent.[17]
In addition to there being no proven clinical benefit in this setting, the use of unnecessary IV antihypertensives is associated with unnecessary risks and excess cost. Another report of IV hydralazine in asymptomatic patients found that 17 of 94 patients experienced an adverse effect after administration.[18] Not only is the drug acquisition cost for IV antihypertensives greater than their oral counterparts, often by a factor of 10 to 100, the intravenous route requires additional care to monitor their effects, adding to the human resource expense. Finally, the onset of action of intravenous agents is generally more rapid, which increases the risk of inducing hypotension and therefore target‐organ ischemia.
This study does, however, have limitations. This is a single‐center study, so the findings may not be generalizable to different hospital settings. The findings of this study depend on the accuracy and completeness of the medical record as recorded during routine clinical care; therefore, errors and omissions of data input and documentation may affect the quality of the data. Omissions and errors in the medication history can affect inpatient management as well as appropriateness of discharge medications. BP values before and after administration of an IV antihypertensive were not always available, limiting some of the short‐term outcomes data that were available. The impact of acuity of illness and concomitant disease states of patients were not assessed, which could also affect outcomes. The outcomes measured in this investigation were all short‐term outcomes and did not include important clinical outcomes (long‐term BP control, rehospitalization rates, or patient morbidity or mortality).
We speculate that the practice of episodic IV antihypertensive therapy has developed out of convenience for the practitioner and is likely commonplace across the country.[17] Healthcare systems should examine practices locally and address them as appropriate. To assist in promoting evidence‐based practice that is safe, prudent, and clinically appropriate, we propose that national BP organizations and consensus development groups consider placing priority on developing recommendations for inpatient hypertension treatment algorithms beyond those for hypertensive emergencies. In many cases, adjustments to a patient's oral regimen or observation of the patient are the only interventions that are needed. In addition, appropriate coordination of ambulatory follow‐up care upon discharge is prudent. Finally, individual healthcare systems might need to identify formal programs to modify institutional behavior of both medical and nursing staff to eliminate or limit this practice that is not supported by clinical evidence and potentially places the patient at risk.
CONCLUSIONS
Our study found that the practice of prescribing episodic IV antihypertensive agents at our institution occurred across all prescriber types. Hydralazine was the most frequently ordered agent. The majority of orders containing systolic BP criteria for administration of an episodic IV antihypertensive agent were well below the BP level associated with immediate or near‐immediate cardiovascular risk. Administration of episodic IV antihypertensive agents, without subsequent intensification of the patient's chronic oral antihypertensive regimen was nearly as likely to occur as subsequent intensification of the oral regimen in our study. The absence of evidence‐based guidelines, combined with the results of this evaluation, provide a rationale for implementing hospital‐ and health systembased policies limiting the use of episodic IV antihypertensive agents in asymptomatic patients with uncontrolled BP in noncritical care settings in the absence of new or worsening target‐organ injury.
Disclosure: Nothing to report.
- , , , et al. Treatment of hypertension in the prevention and management of ischemic heart disease: a scientific statement from the American Heart Association Council for High Blood Pressure Research and the Councils on Clinical Cardiology and Epidemiology and Prevention. Circulation. 2007;115(21):2761–2788.
- , , , et al. 2014 evidence‐based guideline for the management of high blood pressure in adults: report from the panel members appointed to the Eighth Joint National Committee (JNC 8). JAMA. 2014;311(5):507–520.
- , . Hypertensive crises: challenges and management. Chest. 2007;131(6):1949–1962.
- , . Severely increased blood pressure in the emergency department. Ann Emerg Med. 2003;41(4):513–529.
- , , , , ; American College of Emergency Physicians Clinical Policies Subcommittee on Asymptomatic Hypertension in the ED. Clinical policy: critical issues in the evaluation and management of adult patients with asymptomatic hypertension in the emergency department. Ann Emerg Med.2006;47(3):237–249.
- , , , et al. The seventh report of the Joint National Committee on Prevention, Detection, Evaluation, and Treatment of High Blood Pressure: the JNC 7 report. JAMA. 2003;289(19):2560–2572.
- , . Best Evidence on management of asymptomatic hypertension in ED patients. J Emerg Nurs. 2011;37(2):174–178.
- , , , et al. A novel pathway for the management of hypertension for hospitalized patients. Crit Pathw Cardiol. 2007;6(4):150–160.
- , . Treatment of hypertension in the inpatient setting: use of intravenous labetalol and hydralazine. J Clin Hypertens (Greenwich). 2010;12(1):29–33.
- , , , et al. Patterns of antihypertensive treatment in patients with acute severe hypertension from a nonneurologic cause: Studying the Treatment of Acute Hypertension (STAT) registry. Pharmacotherapy. 2010;30(11):1087–1096.
- , , , , . Does earlier attainment of blood pressure goal translate into fewer cardiovascular events? Curr Hypertens Rep. 2008;10(5):398–404.
- . Symptomatic hypotension induced by nifedipine in the acute treatment of severe hypertension. Arch Intern Med. 1987;147(3):556–558.
- , , . Rapid reduction of severe asymptomatic hypertension. A prospective, controlled trial. Arch Intern Med. 1989;149(10):2186–2189.
- , , . Nifedipine‐associated myocardial ischemia or infarction in the treatment of hypertensive urgencies. Ann Intern Med. 1987;107(2):185–186.
- , , , , . Stroke precipitated by moderate blood pressure reduction. J Emerg Med. 2000;9(4):339–346.
- , , , . Adverse events associated with aggressive treatment of increased blood pressure. Int J Clin Prac. 2004;58(5):517–519.
- , , , et al. Attitudes and practices of resident physicians regarding hypertension in the inpatient setting. J Clin Hypertens. 2010;12(9):698–705.
- , , , . Intravenous hydralazine for blood pressure management in the hospitalized patient: its use is often unjustified. J Am Soc Hypertens. 2011;5(6):473–477.
Current recommendations for blood pressure (BP) control focus on chronic management of ambulatory patients; however, treatment guidelines for hospitalized patients who have acute increases in BP or simply uncontrolled BP lack clarity regarding appropriate therapeutic options and short‐term treatment goals.[1, 2] For patients with a history of hypertension, management in the hospital setting typically involves continuation of home therapies. In the inpatient setting, uncontrolled hypertension can be categorized as hypertensive emergency, hypertensive urgency, or asymptomatic poor BP control.[3] Asymptomatic BP elevations occur when the BP is not at goal (but not inordinately high) and the patient has no signs of new or worsening end‐organ damage.[4, 5, 6]
Published data have not demonstrated that aggressive treatment of asymptomatic hypertension in the inpatient setting improves short‐ or long‐term outcomes; however, such aggressive treatment may be associated with iatrogenic adverse effects.[5, 7, 8] Despite the lack of evidence of patient benefit, there is a tendency to treat hospitalized patients with asymptomatic BP elevations aggressively by prescribing IV antihypertensive agents on an as‐needed basis.[9] Intravenous hydralazine and labetalol are frequently used, although these agents are not recommended as initial therapy in consensus recommendations for asymptomatic uncontrolled hypertension in either the inpatient or outpatient setting.[10]
We therefore undertook the present study to determine the type and frequency of ordered and administered episodic intravenous (IV) antihypertensive drug therapy, the BP thresholds triggering such administration, and subsequent in‐hospital clinical outcomes after administration of IV antihypertensive drugs. Accordingly, we evaluated a series of hospitalized patients, in noncritical care settings with no evidence of new or worsening target‐organ injury, who were treated with episodic (either as needed or 1 time only) IV antihypertensive therapy.
METHODS
This study is a retrospective review. Between November 1, 2010 and January 31, 2011 we reviewed the charts of all patients who had at least 1 dose of IV hydralazine, enalaprilat, labetalol, or metoprolol ordered, regardless of previous oral antihypertensive treatment or hypertension diagnosis. Other IV antihypertensive agents were not evaluated in this study, as they are only available in critical care units at our institution. This study took place at an 806‐bed urban hospital that utilizes 100% computer prescriber order entry and bar code technology to document medication administration. The institutional review boards of the Detroit Medical Center and Wayne State University, Detroit, Michigan approved this study.
Patient Identification
Patients were identified through a list of all 1‐time‐only and as‐needed orders for IV hydralazine, enalaprilat, labetolol, or metoprolol. The list was generated daily through the hospital electronic medical record system (Cerner Powerchart, North Kansas City, MO). Patients were excluded if they were younger than 18 or older than 89 years of age, admitted to the intensive care or coronary care unit, were receiving nothing by mouth, pregnant, received a renal transplant in the past 3 months, or if there was any clinical manifestation of new or worsening target‐organ injury consistent with the diagnosis of hypertensive emergency.
Data Collection
The following data were collected for all patients: basic demographic information including factors that have been specifically associated with differences in hypertension risk (ie, age, sex, race, weight, and renal function), antihypertensive regimen (if any) prior to admission, changes to oral antihypertensive therapy during admission, order for sodium‐restricted diet, baseline and discharge laboratory values and vital signs. In addition, the details of their antihypertensive therapy order and administration were collected, including prescriber type (attending, resident, or physician extender), service of prescriber, criteria for use, and date and time of drug administration categorized by shift (morning shift, 7 am to 3 pm; afternoon shift, 3 pm to 11 pm; and night shift, 11 pm to 7 am). To analyze the outcomes of administering episodic IV antihypertensive therapy, the following data were collected: changes in average BP within 30 minutes to 6 hours after drug administration and occurrence of antihypertensive therapy‐related adverse events, including any interventions required after administration and adjustments to oral antihypertensive therapy during admission or upon discharge. In cases where BP data were not available (either just prior to or within 6 hours following administration of an IV antihypertensive), the data were not included in the analysis. To determine whether an antihypertensive drug regimen had been intensified, a therapeutic intensity score (TIS) was calculated for the oral antihypertensive regimen on admission and again at discharge. The antihypertensive TIS was calculated by dividing the total daily dose of each antihypertensive medication by the maximum US Food and Drug Administrationapproved daily dose.[11]
Adverse Outcomes Definition
We defined an adverse outcome as a 25% decrease in systolic or diastolic BP within 6 hours and/or intervention to treat symptoms of hypotension. This definition is consistent with Seventh Report of the Joint National Committee on the Prevention, Detection, Evaluation, and Treatment of High Blood Pressure (JNC 7) recommendations to assure safety when lowering BP in the setting of hypertensive emergency.[6] Although the patients in this study were not experiencing hypertensive emergency, this definition is supported by reports of negative sequelae from overzealous lowering of BP,[12, 13, 14] and it reflects criteria used in other trials.[10] Hypotension was deemed to have occurred if any of the following were documented: as IV fluid administration; scheduled BP medication held (at either the nurses discretion or per physician order); change in level of care; change in mental status; or transient ischemic attack, stroke, or chest pain within 30 minutes to 6 hours after administration. Heart rate changes were also considered to be adverse outcomes, including tachycardia (heart rate >100 beats per minute [bpm] or increase 20 bpm from baseline) or bradycardia (heart rate <50 bpm).
Analysis
Descriptive statistics were performed for all variables. Continuous data were summarized using means and standard deviations. Categorical variables were summarized as counts and percentages. Paired t tests were used to contrast changes from baseline for continuous variables pre‐ and post‐BP, and heart rate changes were evaluated only for the first episode of IV antihypertensive drug administration in patients receiving multiple doses of antihypertensive medication to avoid the bias created by repeated or clustered measures in a given patient. 2 tests were used to test differences in categorical variables. All statistical testing was considered significant when 2‐tailed P values were <0.05. Analyses were generated using SAS software version 9.4 (SAS Institute Inc., Cary, NC).
RESULTS
Patients
During the study period, there were 6133 inpatient adult admissions. Of 495 patients who had at least 1 order for IV hydralazine, enalaprilat, labetolol, or metoprolol, 246 were included in the analysis after applying the exclusion criteria (Figure 1). Patients were divided into 2 groups. One group had an order for an IV antihypertensive that was not administered (n = 74), and the other had an order for an IV antihypertensive and received at least 1 dose (n = 172). The demographic characteristics of the 2 groups are compared in Table 1. Patients who had their chronic oral antihypertensive regimens intensified after receiving IV antihypertensive medications were more often African American, leaner, more intensively treated, and had higher baseline BP.
| Did Not Receive IV Antihypertensive (n = 74) | Did Receive IV Antihypertensive (n = 172) | P | |
|---|---|---|---|
| |||
| Age, y | 61.6 13.9 | 60.6 13.7 | |
| Male sex | 51% | 47% | |
| African American | 74% | 87% | 0.008 |
| Weight, kg | 94.6 33.2 | 88.5 27.7 | |
| Admit systolic BP | 148 23 | 163 32 | <0.0001 |
| Admit diastolic BP | 82 13 | 87 18 | 0.009 |
| Admit heart rate | 87 18 | 82 20 | 0.069 |
| Admit TIS | 0.84 0.72 | 1.08 0.88 | 0.026 |
| Baseline SCr | 1.78 2.00 | 2.74 3.30 | 0.006 |
| Baseline AST | 26.5 12.5 | 65 126.2 | 0.046 |
| Low‐sodium diet order | 65% | 83% | 0.002 |
| Ordering service | |||
| Cardiology | 14% | 19% | |
| Internal medicine | 49% | 47% | |
| Nephrology | 0% | 6% | |
| Other services | 37% | 28% | |
| Prescriber type | |||
| Resident | 30% | 49% | |
| Physician extender | 53% | 35% | |
| Attending | 17% | 16% | |
| 1‐time‐only order | 5% | 19% | |
| As‐needed order | 95% | 81% | |
Prescribing Patterns
Medical residents prescribed nearly half (49%) of the orders for episodic IV antihypertensives. Attending physicians were responsible for 16% of episodic antihypertensive orders and physician extenders (physician's assistants and nurse practitioners) for 35%. A total of 321 orders were prescribed for the 246 patients in the study. Hydralazine was the preferred antihypertensive agent (80.1%), with IV ‐blockers prescribed less frequently (labetalol 15.6% and metoprolol 4.4%). There were no orders for IV enalaprilat. BP parameters were included in 181 (56%) of the episodic IV antihypertensive orders. Of the IV antihypertensive orders containing criteria, 153 (84.5%) had systolic BP threshold for administration <180 mm Hg (Table 2).
| BP Criteria for Administration of IV Antihypertensive Contained in Order, mm Hg | Did Not Receive IV Antihypertensive, n (%), n = 71* | Did Receive IV Antihypertensive, n (%), n = 133* |
|---|---|---|
| ||
| SBP >120 | 2 (2.8) | 1 (0.7) |
| SBP >130 | 2 (2.8) | 9 (6.8) |
| SBP >140 | 2 (2.8) | 5 (3.8) |
| SBP >150 | 4 (5.6) | 8 (6) |
| SBP >160 | 27 (38) | 58 (43.7) |
| SBP >170 | 26 (36.6) | 29 (21.8) |
| SBP >180 | 8 (11.4) | 18 (13.5) |
| SBP >200 | 4 (3) | |
| DBP >100 | 1 (0.7) | |
Drug Administration and Short‐term Data
Table 2 indicates the BP criteria specified in the episodic IV antihypertensive orders. For the 74 patients who did not receive an episodic IV antihypertensive agent, despite having an order, the nurses caring for the patients determined that their BPs never met the criteria for administration of the IV antihypertensive agent. The remainder of the results apply only to the 172 patients who actually received episodic IV antihypertensive therapy. Two of these patients did not have BP data available and were not included in the short‐term BP analysis. Almost half (48%) of the patients received 1 dose of episodic IV antihypertensive, 26% received 2 doses, and 11% received 3 doses. One patient received 10 doses. Hydralazine significantly lowered BP, whereas metoprolol did not (Figure 2).
The number of IV antihypertensive doses (for which BP data are available) administered during the night shift (n = 75) was numerically higher than the morning (n = 54) and the afternoon (n = 41) shifts. The mean BPs that triggered administration of IV antihypertensives did not differ among shifts (night shift 183/93, morning shift 184/99, afternoon shift 182/97).
Changes to Oral Antihypertensive Regimen After Administration of IV Antihypertensive Drugs
After administration of an episodic IV antihypertensive, the inpatient oral medication regimen was intensified in only 89 patients (52%). The BP reduction from admission to discharge in patients who had their inpatient oral medication regimen adjusted versus those who did not have an inpatient oral regimen adjustment after receiving IV antihypertensive medication is shown in Figure 3. Patients with intensification of their oral medications had a greater reduction in systolic BP from admission to discharge, compared to patients who received episodic IV antihypertensives but had no subsequent change to their inpatient oral antihypertensive regimen (Figure 3).
Adverse Events
Fifty‐six patients (32.6%) demonstrated BP reductions of more than 25% within 6 hours of antihypertensive administration. Of these patients, 2 received IV fluids, and 6 (3.5%) had a scheduled oral BP medication held. Of the patients who received IV hydralazine, 13 (4.4%) had an increase in heart rate >20 bpm, with 7 having a heart rate >100 bpm. One patient who received labetolol experienced bradycardia. No patient required a higher level of care (transfer to an intensive care unit) because of hemodynamic instability. In addition, no patient experienced a change in mental status, transient ischemic attack, stroke, or chest pain within 30 minutes to 6 hours after administration.
DISCUSSION
The overwhelming majority of administrations of costly episodic IV antihypertensive drugs among this low‐risk population were in patients with modest BP elevations who may have merited no more, at most, than intensification of their oral antihypertensive drug regimen or observation. Such administration was infrequently followed by intensification of the oral antihypertensive drug regimen, and a significant number of patients experienced a potentially adverse clinical event. Excessive reduction of BP resulting in withholding of oral agents or administering IV fluids (as seen in 8 patients) is clinically relevant, especially in a setting where rapid lowering of BP with IV antihypertensives have no proven clinical benefit. There were differences between patients who did and did not received IV antihypertensive drug therapy, as those receiving therapy were higher‐risk patients. Of the patients initially evaluated for inclusion in this analysis, approximately half had a clear indication for IV antihypertensive therapy and were not included in this analysis. It should also be noted that one‐third of the patients included in the study did not subsequently receive an IV antihypertensive agent.
Recently updated hypertensive guidelines do not address the treatment of hypertensive urgency and emergency, whereas the JNC 7 addressed hypertensive urgency but did not provide a specific BP definition or goals because of concerns about overly aggressive management of severe asymptomatic hypertension.[2, 6] For patients with chronically elevated BP, its rapid reduction, even to levels that remain in the frankly hypertensive range, can be associated with negative clinical sequelae, attributable to decreased target organ perfusion causing clinically manifest ischemia.[3] Accordingly, there have been reports of ischemic events related to unwarranted and overzealous BP lowering.[12, 13, 14] In such patients, resistance vessel remodeling causes a rightward shift of the entire pressure/flow auto regulatory curve in critical arterial beds (eg, cerebral, coronary, and renal). Higher systemic pressure is necessary to maintain adequate perfusion in the target organ, at least over the short‐term. Thus, rapid, aggressive BP reduction can result in the aforementioned negative sequelae because remodeled resistance arterioles are not capable of vasodilating enough to ensure adequate blood flow when systemic pressure falls precipitously.
The patients in this study had no evidence of new or worsening pressure‐related end‐organ damage; therefore, there appeared to be no medical justification for emergent BP lowering via the IV route (a very small minority may have had BP high enough to have justified being diagnosed with hypertensive urgency in which fast‐acting oral therapy would be used). Despite the paucity of data to support this practice, it does, however, appear to be relatively common.[9] The high prevalence of IV hydralazine use in this inpatient study is consistent with the retrospective study reported by Weder and Erickson at the University of Michigan.[9]
Even among those with hypertensive urgencies, oral medication is the preferred route (assuming the patient can eat and swallow without difficulty and does not manifest an altered sensorium). Furthermore, the risks associated with overzealous BP lowering can be devastating. The likelihood of target‐organ ischemia (eg, angina pectoris, myocardial infarction, azotemia, stroke, transient ischemic attack) is most strongly correlated to the rapidity of the BP reduction, even to levels within the hypertensive range, in patients with persistent poor BP control.[4, 15, 16] Thus, the justification for considering a >25% drop in systolic BP within 6 hours of the administration of the IV antihypertensive agent as a potential adverse event, especially because there was only a very small immediate risk for adverse cardiovascular sequelae at the BP levels triggering administration of IV antihypertensive drug therapy.
Although we found that residents and physician assistants prescribed most IV antihypertensives, the practice of prescribing IV antihypertensive therapy appears to be common among all prescriber types. A recent survey assessing the attitudes and practices of resident physicians regarding hypertension in the inpatient setting found that 44% of respondents would treat acute asymptomatic, moderately elevated BP (182/100 mm Hg) with either an oral or intravenous agent.[17]
In addition to there being no proven clinical benefit in this setting, the use of unnecessary IV antihypertensives is associated with unnecessary risks and excess cost. Another report of IV hydralazine in asymptomatic patients found that 17 of 94 patients experienced an adverse effect after administration.[18] Not only is the drug acquisition cost for IV antihypertensives greater than their oral counterparts, often by a factor of 10 to 100, the intravenous route requires additional care to monitor their effects, adding to the human resource expense. Finally, the onset of action of intravenous agents is generally more rapid, which increases the risk of inducing hypotension and therefore target‐organ ischemia.
This study does, however, have limitations. This is a single‐center study, so the findings may not be generalizable to different hospital settings. The findings of this study depend on the accuracy and completeness of the medical record as recorded during routine clinical care; therefore, errors and omissions of data input and documentation may affect the quality of the data. Omissions and errors in the medication history can affect inpatient management as well as appropriateness of discharge medications. BP values before and after administration of an IV antihypertensive were not always available, limiting some of the short‐term outcomes data that were available. The impact of acuity of illness and concomitant disease states of patients were not assessed, which could also affect outcomes. The outcomes measured in this investigation were all short‐term outcomes and did not include important clinical outcomes (long‐term BP control, rehospitalization rates, or patient morbidity or mortality).
We speculate that the practice of episodic IV antihypertensive therapy has developed out of convenience for the practitioner and is likely commonplace across the country.[17] Healthcare systems should examine practices locally and address them as appropriate. To assist in promoting evidence‐based practice that is safe, prudent, and clinically appropriate, we propose that national BP organizations and consensus development groups consider placing priority on developing recommendations for inpatient hypertension treatment algorithms beyond those for hypertensive emergencies. In many cases, adjustments to a patient's oral regimen or observation of the patient are the only interventions that are needed. In addition, appropriate coordination of ambulatory follow‐up care upon discharge is prudent. Finally, individual healthcare systems might need to identify formal programs to modify institutional behavior of both medical and nursing staff to eliminate or limit this practice that is not supported by clinical evidence and potentially places the patient at risk.
CONCLUSIONS
Our study found that the practice of prescribing episodic IV antihypertensive agents at our institution occurred across all prescriber types. Hydralazine was the most frequently ordered agent. The majority of orders containing systolic BP criteria for administration of an episodic IV antihypertensive agent were well below the BP level associated with immediate or near‐immediate cardiovascular risk. Administration of episodic IV antihypertensive agents, without subsequent intensification of the patient's chronic oral antihypertensive regimen was nearly as likely to occur as subsequent intensification of the oral regimen in our study. The absence of evidence‐based guidelines, combined with the results of this evaluation, provide a rationale for implementing hospital‐ and health systembased policies limiting the use of episodic IV antihypertensive agents in asymptomatic patients with uncontrolled BP in noncritical care settings in the absence of new or worsening target‐organ injury.
Disclosure: Nothing to report.
- , , , et al. Treatment of hypertension in the prevention and management of ischemic heart disease: a scientific statement from the American Heart Association Council for High Blood Pressure Research and the Councils on Clinical Cardiology and Epidemiology and Prevention. Circulation. 2007;115(21):2761–2788.
- , , , et al. 2014 evidence‐based guideline for the management of high blood pressure in adults: report from the panel members appointed to the Eighth Joint National Committee (JNC 8). JAMA. 2014;311(5):507–520.
- , . Hypertensive crises: challenges and management. Chest. 2007;131(6):1949–1962.
- , . Severely increased blood pressure in the emergency department. Ann Emerg Med. 2003;41(4):513–529.
- , , , , ; American College of Emergency Physicians Clinical Policies Subcommittee on Asymptomatic Hypertension in the ED. Clinical policy: critical issues in the evaluation and management of adult patients with asymptomatic hypertension in the emergency department. Ann Emerg Med.2006;47(3):237–249.
- , , , et al. The seventh report of the Joint National Committee on Prevention, Detection, Evaluation, and Treatment of High Blood Pressure: the JNC 7 report. JAMA. 2003;289(19):2560–2572.
- , . Best Evidence on management of asymptomatic hypertension in ED patients. J Emerg Nurs. 2011;37(2):174–178.
- , , , et al. A novel pathway for the management of hypertension for hospitalized patients. Crit Pathw Cardiol. 2007;6(4):150–160.
- , . Treatment of hypertension in the inpatient setting: use of intravenous labetalol and hydralazine. J Clin Hypertens (Greenwich). 2010;12(1):29–33.
- , , , et al. Patterns of antihypertensive treatment in patients with acute severe hypertension from a nonneurologic cause: Studying the Treatment of Acute Hypertension (STAT) registry. Pharmacotherapy. 2010;30(11):1087–1096.
- , , , , . Does earlier attainment of blood pressure goal translate into fewer cardiovascular events? Curr Hypertens Rep. 2008;10(5):398–404.
- . Symptomatic hypotension induced by nifedipine in the acute treatment of severe hypertension. Arch Intern Med. 1987;147(3):556–558.
- , , . Rapid reduction of severe asymptomatic hypertension. A prospective, controlled trial. Arch Intern Med. 1989;149(10):2186–2189.
- , , . Nifedipine‐associated myocardial ischemia or infarction in the treatment of hypertensive urgencies. Ann Intern Med. 1987;107(2):185–186.
- , , , , . Stroke precipitated by moderate blood pressure reduction. J Emerg Med. 2000;9(4):339–346.
- , , , . Adverse events associated with aggressive treatment of increased blood pressure. Int J Clin Prac. 2004;58(5):517–519.
- , , , et al. Attitudes and practices of resident physicians regarding hypertension in the inpatient setting. J Clin Hypertens. 2010;12(9):698–705.
- , , , . Intravenous hydralazine for blood pressure management in the hospitalized patient: its use is often unjustified. J Am Soc Hypertens. 2011;5(6):473–477.
© 2015 Society of Hospital Medicine
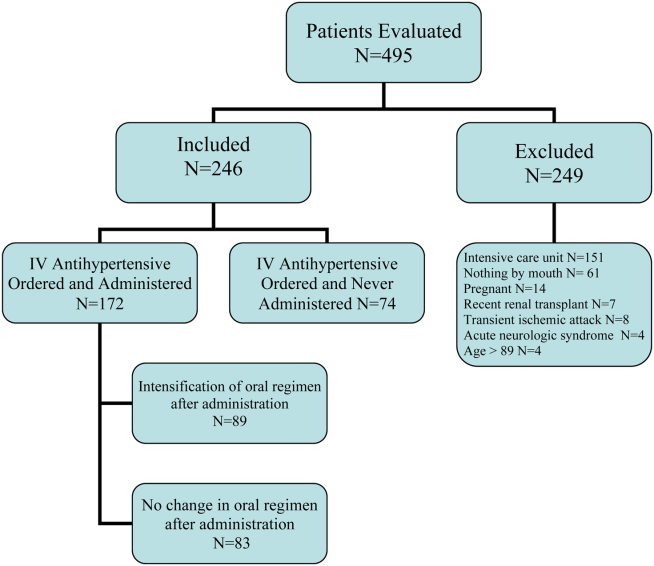
Appropriateness of Antibiotics for UTIs
After pneumonia, urinary tract infection (UTI) is the second most commonly diagnosed infection leading to hospitalization.[1] However, a large proportion of those admitted with a diagnosis of UTI do not meet diagnostic criteria and receive inappropriate antibiotic therapy.[2, 3] Because antibiotic treatment often begins in the emergency department (ED), we conducted a study to determine the rate of initiation of inappropriate antibiotic treatment for UTIs in the ED and the rate of continuation of inappropriate antibiotics after admission to the hospital.
METHODS
We retrospectively identified all patients admitted from the ED of Johns Hopkins Bayview Medical Center, a tertiary, acute care hospital during 4 nonconsecutive weeks in the winter of 2012 to 2013. We reviewed ED and hospital records of all patients with positive urinalyses who initiated antibiotic treatment in the ED for a diagnosis of UTI. A positive urinalysis was defined as the presence of more than 5 leukocytes per high‐power field, leukocyte esterase, or nitrites. In the ED, approximately two‐thirds of urinalyses were ordered via order sets, and the majority of patients were evaluated by nurse practitioners and physician assistants.
In the absence of specific guidelines for the treatment of UTIs in the ED, criteria for this study were based on the Centers for Disease Control and Prevention (CDC) surveillance definitions,[4] the Infectious Diseases Society of America guidelines for asymptomatic bacteriuria,[5] and the Society for Healthcare Epidemiology of America (SHEA) criteria for diagnosing and treating UTIs in long‐term care facilities.[6, 7] We defined initiation of antibiotic treatment in the ED for a potential UTI as appropriate only if the patient had a positive urinalysis and 1 or more of the following: (1) fever (temperature >38C), (2) a urinary symptom or sign (urgency, frequency, dysuria, suprapubic tenderness, or costovertebral angle pain or tenderness), (3) an indication for treating asymptomatic bacteriuria (pregnancy or a planned invasive urologic procedure), or (4) altered mental status in the presence of a chronic urinary catheter.[6, 7] Continuation of antibiotics was considered inappropriate if 1 or more doses were given after admission to patients who did not meet the above criteria for appropriate initiation of antibiotics (regardless of urine culture results). For patients who met the above criteria, continuation was considered inappropriate if the urine culture grew no organisms or only grew nonpathogenic urogenital flora and the patient received antibiotics for 3 or more days.
Urine culture results were reported as positive if >104 organisms per milliliter grew on semiquantitative culture. The following were considered potential uropathogens: enteric gram‐negative rods (GNRs), nonlactose fermenting GNRs, Corynebacterium urealyticum, yeast, group B streptococci, Enterococcus spp., Staphylococcus aureus, Staphylococcus saprophyticus, Staphylococcus lugdunensis, and Aerococcus urinae. More than 2 potential uropathogens were reported as mixed fecal flora. The following were considered to be nonpathogenic urogenital flora: coagulase‐negative staphylococci not designated as potential uropathogens, Lactobacillus spp, urease‐negative Corynebacterium, viridans group streptococci, and Gardnerella vaginalis. Specimens with mixed fecal flora and specimens with 1 to 2 uropathogens were grouped together as containing a potential uropathogen. Cultures that grew no organisms or only nonpathogenic urogenital flora were labeled as containing no uropathogen.
RESULTS
Of 1163 patients admitted to the hospital from the ED, 138 began antibiotic therapy for either a presumed UTI (94 patients) or another infection (44) (Figure 1). Non‐UTI infections included pneumonia (23), skin and soft tissue infection (9), intra‐abdominal infection (8), and other (4).
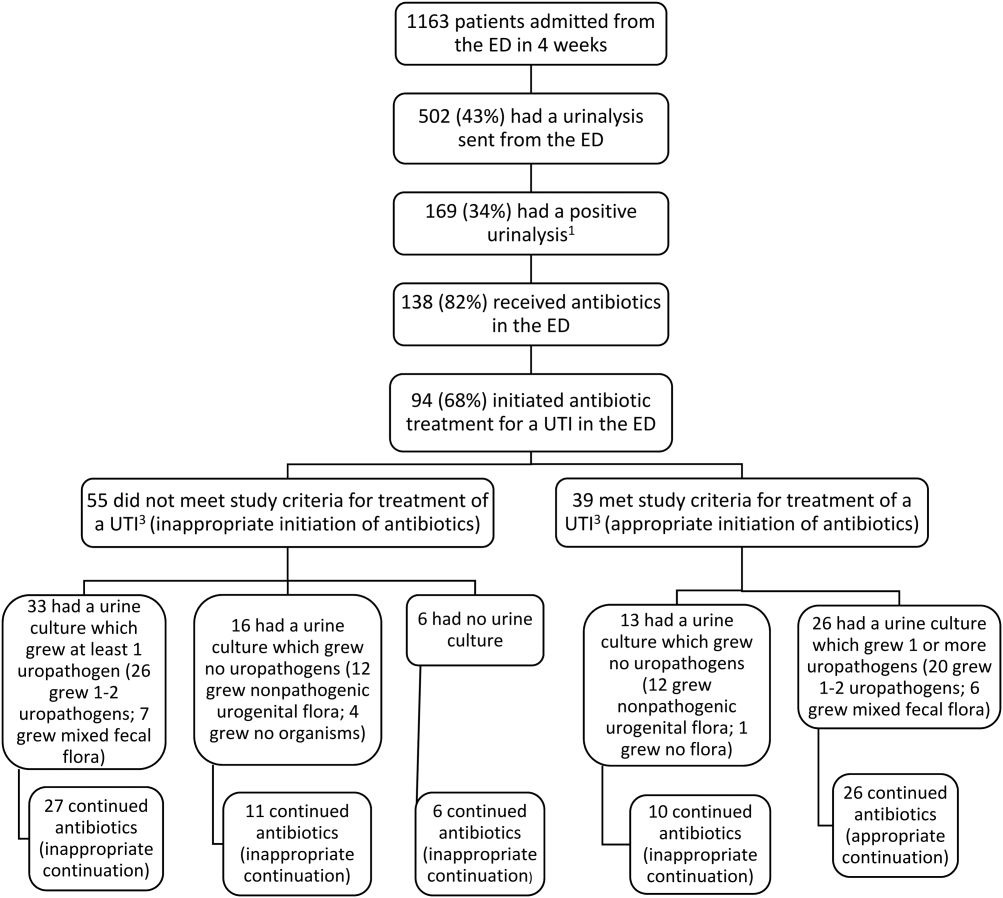
For the 94 patients treated for a UTI in the ED, the mean age was 67 years, and 77% were women. Ten had a chronic urinary catheter, and 13 came from a long‐term care facility. Eighty of these patients continued antibiotics after admission.
According to study criteria, 55 of the 94 patients (59%) who initiated treatment for a UTI in the ED had no indication to do so. These 55 patients had a variety of admitting diagnoses other than UTI (Table 1); 25% were admitted with altered mental status. Forty‐four of these 55 (80%) continued antibiotics (inappropriately) after admission, including 11 patients whose urine cultures grew no uropathogens.
| Admission Diagnosis | No. of Patients With Diagnosis (%) | Mean Age, y | No. of Women (%) | No. of Patients Continuing Antibiotics After Admission (%) |
|---|---|---|---|---|
| ||||
| Altered mental status* | 14 (25) | 76 | 11 (79) | 14 (100) |
| Syncope or near syncope | 7 (13) | 72 | 6 (86) | 5 (71) |
| Other neurologic conditions | 6 (11) | 64 | 5 (83) | 6 (100) |
| Mechanical falls | 6 (11) | 85 | 5 (83) | 4 (67) |
| Gastrointestinal conditions | 8 (15) | 53 | 6 (75) | 3 (38) |
| Psychiatric conditions | 3 (5) | 32 | 4 (100) | 4 (100) |
| Other | 11 (20) | 72 | 9 (79) | 9 (79) |
| All patients | 55 (100) | 69 | 46 (84) | 45 (82) |
Of the 39 patients with an indication to initiate treatment for a possible UTI, 13 had urine cultures (taken before antibiotics were administered) that grew no uropathogens, yet 10 of these patients continued antibiotics inappropriately after admission (Figure 1).
In summary, initiation of antibiotics in the ED was inappropriate for 55 of 94 patients (59% [95% confidence interval {CI}, 48%‐69%]), and continuation after admission was inappropriate for 54 of 80 patients (68% [95% CI, 57%‐78%]).
DISCUSSION
According to study criteria, the majority of patients treated for a UTI in the ED before admission initiated antibiotic treatment inappropriately in the ED and continued antibiotics inappropriately after admission. Our findings suggest several points where intervention could interrupt this chain of events.
Reducing the number of urinalyses ordered in the ED could reduce inappropriate treatment.[8] In this study, 43% of patients admitted from the ED had urinalyses, many obtained via order sets before evaluation by a clinician. Although triage order sets improve ED throughput,[9] they also produce extraneous results that may lead to unnecessary interventions. We suggest removing urinalyses from order sets for conditions for which a UTI is unlikely to contribute.
In this study altered mental status was a common diagnosis among patients categorized as receiving inappropriate antibiotics in the ED. All patients with altered mental status continued antibiotic treatment after admission. According to the study definition (and CDC and SHEA criteria[4, 6, 7]), bacteriuria and altered mental status without additional criteria (urinary symptoms or signs, fever, or an indwelling urinary catheter) are insufficient for the diagnosis of a symptomatic UTI. Since the study was conducted, the CDC surveillance definition for UTIs in long‐term care has been updated and now includes the new onset of confusion in catheterized individuals only if leukocytosis is also present.[10] Because patients at the greatest risk of developing altered mental statusthe frail elderlyalso have high rates of asymptomatic bacteriuria (up to 40%50% in nursing home residents[5]), the 2 conditions co‐occur frequently by chance alone. Although it is common to attribute altered mental status in a patient with pyuria or bacteriuria to a UTI, there are no convincing data to support a causal relationship for patients who are otherwise asymptomatic.[11] An alternative approach for stable patients is careful observation while withholding antibiotics and looking for other causes of altered mental status.[11]
Inappropriate treatment may also stem from misunderstanding the significance of asymptomatic pyuria and bacteriuria, common findings in certain populations. The only evidence‐based indications for treatment of asymptomatic bacteriuria are pregnancy and planned invasive urinary tract procedures.[5] For several other populations, strong randomized trials show no benefit.[5]
Obtaining a good specimen for urinalysis and culture is often problematic. In this study, 37 of 88 cultures (42%) grew mixed fecal or nonpathogenic urogenital flora and appeared to be contaminated. Reporting techniques can be influential.[12] Microbiology reports could state that mixed urogenital flora and mixed fecal flora often represent contamination.
Human factors may also contribute to the inappropriate continuation of antibiotic therapy started in the ED. Hospital providers may not question a diagnosis made by another provider, especially if no alternative diagnosis emerges. Coincidental improvement with antimicrobial treatment may be mistaken as evidence of efficacy. Clinicians may be reluctant to tell a patient or family that the initial diagnosis and treatment plan were incorrect.
This study has several limitations. First, this review was retrospective. Omission of undocumented symptoms could lead to an overestimation of inappropriate antibiotic treatment. Alternatively, several factors could lead to an underestimation: patients treated for a UTI in the ED were identified only among those with positive urinalyses; cultures with mixed fecal flora were accepted as containing a potential uropathogen in spite of the high likelihood of contamination. Also, the study definition of appropriate antibiotic treatment was less stringent than guidelines on which it was based. The generalizability is limited by the single‐center design, and results may not apply to centers with different staffing in their EDs or less utilization of order sets. Finally, the study definition was derived from guidelines that were not developed specifically for use in the ED.
In conclusion, we found a high rate of inappropriate antibiotic administration for UTIs that began in the ED and continued after admission. Overall, providers in the ED should aim not to detect or treat asymptomatic pyuria, and clinicians in the hospital should reevaluate the need for antibiotic treatment started in the ED. Specific guidelines should be developed and validated to direct diagnosis and treatment of UTIs in the ED and hospital.
Disclosures: The information in this article was presented in part at the Society of Hospital Medicine annual meeting on March 2427, 2014. No financial support was provided, and no conflicts of interest exist for any author.
- , , , , , . Infectious disease hospitalizations in the United States. Clin Infect Dis. 2009;49:1025–1035.
- , . Reducing antibiotic overuse: a call for a national performance measure for not treating asymptomatic bacteriuria. Clin Infect Dis. 2007;45:1335–1337.
- , , , , . Importance of urinary tract infection to antibiotic use among hospitalized patients. Infect Control Hosp Epidemiol. 2009;30:193–195.
- Centers for Disease Control and Prevention. CDC/NHSN surveillance definition of healthcare‐associated infection and criteria for specific types of infections in the acute care setting. 2013. Available at: http://www.cdc.gov/nhsn/pdfs/pscmanual/17pscnosinfdef_current.pdf. Accessed August 2014.
- , , , et al. Infectious Diseases Society of America guidelines for the diagnosis and treatment of asymptomatic bacteriuria in adults. Clin Infect Dis. 2005;40(5):643–654.
- , , , et al. Development of minimum criteria for the initiation of antibiotics in residents of long‐term–care facilities: results of a consensus conference. Infect Control Hosp Epidemiol. 2001;22:120–124.
- , , , et al. Effect of a multifaceted intervention on number of antimicrobial prescriptions for suspected urinary tract infections in residents of nursing homes: cluster randomised controlled trial. BMJ. 2005;331(7518):669.
- , , . Urinalysis orders among patients admitted to the general medicine service. JAMA Intern Med. 2015;175(10):1711–1713.
- , , , , . The effect of triage diagnostic standing orders on emergency department treatment time. Ann Emerg Med. 2011;57:89–99.
- Centers for Disease Control and Prevention. Urinary tract infection (UTI) event for long‐term care facilities. Available at: http://www.cdc.gov/nhsn/PDFs/LTC/LTCF‐UTI‐protocol_FINAL_8‐24‐2012.pdf. Accessed September 2015.
- , , , . Bacteriuria in patients who become delirious. Am J Med. 2014;127:255–257.
- , , , et al. Reducing antimicrobial therapy for asymptomatic bacteriuria among noncatheterized inpatients: a proof‐of‐concept study. Clin Infect Dis. 2014;58:980–983.
After pneumonia, urinary tract infection (UTI) is the second most commonly diagnosed infection leading to hospitalization.[1] However, a large proportion of those admitted with a diagnosis of UTI do not meet diagnostic criteria and receive inappropriate antibiotic therapy.[2, 3] Because antibiotic treatment often begins in the emergency department (ED), we conducted a study to determine the rate of initiation of inappropriate antibiotic treatment for UTIs in the ED and the rate of continuation of inappropriate antibiotics after admission to the hospital.
METHODS
We retrospectively identified all patients admitted from the ED of Johns Hopkins Bayview Medical Center, a tertiary, acute care hospital during 4 nonconsecutive weeks in the winter of 2012 to 2013. We reviewed ED and hospital records of all patients with positive urinalyses who initiated antibiotic treatment in the ED for a diagnosis of UTI. A positive urinalysis was defined as the presence of more than 5 leukocytes per high‐power field, leukocyte esterase, or nitrites. In the ED, approximately two‐thirds of urinalyses were ordered via order sets, and the majority of patients were evaluated by nurse practitioners and physician assistants.
In the absence of specific guidelines for the treatment of UTIs in the ED, criteria for this study were based on the Centers for Disease Control and Prevention (CDC) surveillance definitions,[4] the Infectious Diseases Society of America guidelines for asymptomatic bacteriuria,[5] and the Society for Healthcare Epidemiology of America (SHEA) criteria for diagnosing and treating UTIs in long‐term care facilities.[6, 7] We defined initiation of antibiotic treatment in the ED for a potential UTI as appropriate only if the patient had a positive urinalysis and 1 or more of the following: (1) fever (temperature >38C), (2) a urinary symptom or sign (urgency, frequency, dysuria, suprapubic tenderness, or costovertebral angle pain or tenderness), (3) an indication for treating asymptomatic bacteriuria (pregnancy or a planned invasive urologic procedure), or (4) altered mental status in the presence of a chronic urinary catheter.[6, 7] Continuation of antibiotics was considered inappropriate if 1 or more doses were given after admission to patients who did not meet the above criteria for appropriate initiation of antibiotics (regardless of urine culture results). For patients who met the above criteria, continuation was considered inappropriate if the urine culture grew no organisms or only grew nonpathogenic urogenital flora and the patient received antibiotics for 3 or more days.
Urine culture results were reported as positive if >104 organisms per milliliter grew on semiquantitative culture. The following were considered potential uropathogens: enteric gram‐negative rods (GNRs), nonlactose fermenting GNRs, Corynebacterium urealyticum, yeast, group B streptococci, Enterococcus spp., Staphylococcus aureus, Staphylococcus saprophyticus, Staphylococcus lugdunensis, and Aerococcus urinae. More than 2 potential uropathogens were reported as mixed fecal flora. The following were considered to be nonpathogenic urogenital flora: coagulase‐negative staphylococci not designated as potential uropathogens, Lactobacillus spp, urease‐negative Corynebacterium, viridans group streptococci, and Gardnerella vaginalis. Specimens with mixed fecal flora and specimens with 1 to 2 uropathogens were grouped together as containing a potential uropathogen. Cultures that grew no organisms or only nonpathogenic urogenital flora were labeled as containing no uropathogen.
RESULTS
Of 1163 patients admitted to the hospital from the ED, 138 began antibiotic therapy for either a presumed UTI (94 patients) or another infection (44) (Figure 1). Non‐UTI infections included pneumonia (23), skin and soft tissue infection (9), intra‐abdominal infection (8), and other (4).
For the 94 patients treated for a UTI in the ED, the mean age was 67 years, and 77% were women. Ten had a chronic urinary catheter, and 13 came from a long‐term care facility. Eighty of these patients continued antibiotics after admission.
According to study criteria, 55 of the 94 patients (59%) who initiated treatment for a UTI in the ED had no indication to do so. These 55 patients had a variety of admitting diagnoses other than UTI (Table 1); 25% were admitted with altered mental status. Forty‐four of these 55 (80%) continued antibiotics (inappropriately) after admission, including 11 patients whose urine cultures grew no uropathogens.
| Admission Diagnosis | No. of Patients With Diagnosis (%) | Mean Age, y | No. of Women (%) | No. of Patients Continuing Antibiotics After Admission (%) |
|---|---|---|---|---|
| ||||
| Altered mental status* | 14 (25) | 76 | 11 (79) | 14 (100) |
| Syncope or near syncope | 7 (13) | 72 | 6 (86) | 5 (71) |
| Other neurologic conditions | 6 (11) | 64 | 5 (83) | 6 (100) |
| Mechanical falls | 6 (11) | 85 | 5 (83) | 4 (67) |
| Gastrointestinal conditions | 8 (15) | 53 | 6 (75) | 3 (38) |
| Psychiatric conditions | 3 (5) | 32 | 4 (100) | 4 (100) |
| Other | 11 (20) | 72 | 9 (79) | 9 (79) |
| All patients | 55 (100) | 69 | 46 (84) | 45 (82) |
Of the 39 patients with an indication to initiate treatment for a possible UTI, 13 had urine cultures (taken before antibiotics were administered) that grew no uropathogens, yet 10 of these patients continued antibiotics inappropriately after admission (Figure 1).
In summary, initiation of antibiotics in the ED was inappropriate for 55 of 94 patients (59% [95% confidence interval {CI}, 48%‐69%]), and continuation after admission was inappropriate for 54 of 80 patients (68% [95% CI, 57%‐78%]).
DISCUSSION
According to study criteria, the majority of patients treated for a UTI in the ED before admission initiated antibiotic treatment inappropriately in the ED and continued antibiotics inappropriately after admission. Our findings suggest several points where intervention could interrupt this chain of events.
Reducing the number of urinalyses ordered in the ED could reduce inappropriate treatment.[8] In this study, 43% of patients admitted from the ED had urinalyses, many obtained via order sets before evaluation by a clinician. Although triage order sets improve ED throughput,[9] they also produce extraneous results that may lead to unnecessary interventions. We suggest removing urinalyses from order sets for conditions for which a UTI is unlikely to contribute.
In this study altered mental status was a common diagnosis among patients categorized as receiving inappropriate antibiotics in the ED. All patients with altered mental status continued antibiotic treatment after admission. According to the study definition (and CDC and SHEA criteria[4, 6, 7]), bacteriuria and altered mental status without additional criteria (urinary symptoms or signs, fever, or an indwelling urinary catheter) are insufficient for the diagnosis of a symptomatic UTI. Since the study was conducted, the CDC surveillance definition for UTIs in long‐term care has been updated and now includes the new onset of confusion in catheterized individuals only if leukocytosis is also present.[10] Because patients at the greatest risk of developing altered mental statusthe frail elderlyalso have high rates of asymptomatic bacteriuria (up to 40%50% in nursing home residents[5]), the 2 conditions co‐occur frequently by chance alone. Although it is common to attribute altered mental status in a patient with pyuria or bacteriuria to a UTI, there are no convincing data to support a causal relationship for patients who are otherwise asymptomatic.[11] An alternative approach for stable patients is careful observation while withholding antibiotics and looking for other causes of altered mental status.[11]
Inappropriate treatment may also stem from misunderstanding the significance of asymptomatic pyuria and bacteriuria, common findings in certain populations. The only evidence‐based indications for treatment of asymptomatic bacteriuria are pregnancy and planned invasive urinary tract procedures.[5] For several other populations, strong randomized trials show no benefit.[5]
Obtaining a good specimen for urinalysis and culture is often problematic. In this study, 37 of 88 cultures (42%) grew mixed fecal or nonpathogenic urogenital flora and appeared to be contaminated. Reporting techniques can be influential.[12] Microbiology reports could state that mixed urogenital flora and mixed fecal flora often represent contamination.
Human factors may also contribute to the inappropriate continuation of antibiotic therapy started in the ED. Hospital providers may not question a diagnosis made by another provider, especially if no alternative diagnosis emerges. Coincidental improvement with antimicrobial treatment may be mistaken as evidence of efficacy. Clinicians may be reluctant to tell a patient or family that the initial diagnosis and treatment plan were incorrect.
This study has several limitations. First, this review was retrospective. Omission of undocumented symptoms could lead to an overestimation of inappropriate antibiotic treatment. Alternatively, several factors could lead to an underestimation: patients treated for a UTI in the ED were identified only among those with positive urinalyses; cultures with mixed fecal flora were accepted as containing a potential uropathogen in spite of the high likelihood of contamination. Also, the study definition of appropriate antibiotic treatment was less stringent than guidelines on which it was based. The generalizability is limited by the single‐center design, and results may not apply to centers with different staffing in their EDs or less utilization of order sets. Finally, the study definition was derived from guidelines that were not developed specifically for use in the ED.
In conclusion, we found a high rate of inappropriate antibiotic administration for UTIs that began in the ED and continued after admission. Overall, providers in the ED should aim not to detect or treat asymptomatic pyuria, and clinicians in the hospital should reevaluate the need for antibiotic treatment started in the ED. Specific guidelines should be developed and validated to direct diagnosis and treatment of UTIs in the ED and hospital.
Disclosures: The information in this article was presented in part at the Society of Hospital Medicine annual meeting on March 2427, 2014. No financial support was provided, and no conflicts of interest exist for any author.
- , , , , , . Infectious disease hospitalizations in the United States. Clin Infect Dis. 2009;49:1025–1035.
- , . Reducing antibiotic overuse: a call for a national performance measure for not treating asymptomatic bacteriuria. Clin Infect Dis. 2007;45:1335–1337.
- , , , , . Importance of urinary tract infection to antibiotic use among hospitalized patients. Infect Control Hosp Epidemiol. 2009;30:193–195.
- Centers for Disease Control and Prevention. CDC/NHSN surveillance definition of healthcare‐associated infection and criteria for specific types of infections in the acute care setting. 2013. Available at: http://www.cdc.gov/nhsn/pdfs/pscmanual/17pscnosinfdef_current.pdf. Accessed August 2014.
- , , , et al. Infectious Diseases Society of America guidelines for the diagnosis and treatment of asymptomatic bacteriuria in adults. Clin Infect Dis. 2005;40(5):643–654.
- , , , et al. Development of minimum criteria for the initiation of antibiotics in residents of long‐term–care facilities: results of a consensus conference. Infect Control Hosp Epidemiol. 2001;22:120–124.
- , , , et al. Effect of a multifaceted intervention on number of antimicrobial prescriptions for suspected urinary tract infections in residents of nursing homes: cluster randomised controlled trial. BMJ. 2005;331(7518):669.
- , , . Urinalysis orders among patients admitted to the general medicine service. JAMA Intern Med. 2015;175(10):1711–1713.
- , , , , . The effect of triage diagnostic standing orders on emergency department treatment time. Ann Emerg Med. 2011;57:89–99.
- Centers for Disease Control and Prevention. Urinary tract infection (UTI) event for long‐term care facilities. Available at: http://www.cdc.gov/nhsn/PDFs/LTC/LTCF‐UTI‐protocol_FINAL_8‐24‐2012.pdf. Accessed September 2015.
- , , , . Bacteriuria in patients who become delirious. Am J Med. 2014;127:255–257.
- , , , et al. Reducing antimicrobial therapy for asymptomatic bacteriuria among noncatheterized inpatients: a proof‐of‐concept study. Clin Infect Dis. 2014;58:980–983.
© 2015 Society of Hospital Medicine

EHR use and patient satisfaction: What we learned
ABSTRACT
Purpose Few studies have quantitatively examined the degree to which the use of the computer affects patients’ satisfaction with the clinician and the quality of the visit. We conducted a study to examine this association.
Methods Twenty-three clinicians (21 internal medicine physicians, 2 nurse practitioners) were recruited from 4 Veteran Affairs Medical Center (VAMC) clinics located in San Diego, Calif. Five to 6 patients for most clinicians (one patient each for 2 of the clinicians) were recruited to participate in a study of patient-physician communication. The clinicians’ computer use and the patient-clinician interactions in the exam room were captured in real time via video recordings of the interactions and the computer screen, and through the use of the Morae usability testing software system, which recorded clinician clicks and scrolls on the computer. After the visit, patients were asked to complete a satisfaction survey.
Results The final sample consisted of 126 consultations. Total patient satisfaction (beta=0.014; P=.027) and patient satisfaction with patient-centered communication (beta=0.02; P=.02) were significantly associated with higher clinician “gaze time” at the patient. A higher percentage of gaze time during a visit (controlling for the length of the visit) was significantly associated with greater satisfaction with patient-centered communication (beta=0.628; P=.033).
Conclusions Higher clinician gaze time at the patient predicted greater patient satisfaction. This suggests that clinicians would be well served to refine their multitasking skills so that they communicate in a patient-centered manner while performing necessary computer-related tasks. These findings also have important implications for clinical training with respect to using an electronic health record (EHR) system in ways that do not impede the one-on-one conversation between clinician and patient.
Primary care physicians’ use of electronic health record (EHR) systems has markedly increased in recent years. For example, a 2008 study of more than 1000 randomly selected practicing physicians in Massachusetts found that 33% utilized an EHR.1 Many physicians believe that EHR systems are beneficial to patient care,2 and several studies have supported this perception, showing clear benefits of EHR use. A study of one component of EHR systems—computerized physician order entry (CPOE)—found that CPOEs resulted in a >50% decrease in serious medication errors.3 Other errors have declined with the use of EHR systems, as well; Virapongse et al1 found a trend towards fewer paid malpractice claims against physicians who used an EHR compared to those physicians using paper charting.
EHR systems may also improve efficiency. In a study of a health maintenance organization (HMO) model, initiating an EHR system improved efficiency by decreasing office visits.4 Widespread adoption of EHR systems could save an estimated $81 billion annually through reductions in errors and adverse events, and improved preventive care and chronic disease management.5 In a survey of approximately 300 patients who had been evaluated at a family medicine clinic for hypertension, high blood pressure without hypertension, or hyperlipidemia, 75% indicated that they felt EHRs had a positive impact on their care.6
However, some clinicians are concerned about the possible negative impact of EHR systems on health care. One major concern is that EHR systems might increase physician workload7 and the amount of time spent using a computer during patient visits. A study that examined physician EHR use found that while time spent on certain tasks, such as prescription writing and lab ordering, was reduced, there was an overall increase in time spent on computer tasks related to charting, preventive care, and chronic disease management.8 Baron et al9 also found an increase in time spent using the EHR during each clinic session in one private practice setting.
Physicians are also concerned that EHR systems might interfere with the patient-physician interaction (eg, maintaining eye contact, paying attention to patients’ concerns) by directing the physician’s attention away from the patient and toward the computer.10 In one study, this concern increased after physicians started utilizing a new EHR system.11 Although a survey of inpatients indicated that residents engaged in greater patient-physician communication after an EHR was implemented,12 a separate study conducted in an outpatient setting found physicians spent less time looking at patients after converting from a paper-based system to an EHR system.13
Very few studies have quantitatively examined the association of patient satisfaction with clinician EHR usage. The goal of this study was to examine the correlation of patient satisfaction with actual EHR usage in an ambulatory setting. The data reported in this paper are part of a larger study aimed at understanding EHR use in a VAMC.
METHODS

Study design and sample
The study participants were clinicians in 4 VAMC community clinics located in San Diego, Calif. Twenty-three clinicians (21 general internal medicine physicians and 2 nurse practitioners) were enrolled in the study. Most clinicians identified 5 to 6 patients from their practices to participate in the study (2 participants identified only one patient each). All patients were visiting their clinician for either an acute visit or a follow-up visit.
Although there were slight variations in clinic room size and shape, all rooms were equipped with a compact desk against a wall, a rolling desk chair, a desktop computer with keyboard and mouse, and a second, fixed chair placed diagonal to the physician’s chair. Two rooms had dual monitors. There was a standard examination table in all examination rooms.
The clinicians’ computer use and the patient-clinician interactions in the exam room were captured in real time via video recordings of the interactions and the computer screen. A usability testing software system (Morae) was used to record clinicians’ computer activities, including mouse clicks and scrolls on the computer. The Computerized Patient Records System (CPRS) was the EHR used by all clinicians in this study.
At the end of the visit, patients were asked to complete a satisfaction survey with questions in 3 domains: the physician’s engagement in patient-centered communication, the physician’s clinical skills, and the physician’s interpersonal skills.
Data analysis
Descriptive statistics were used to document patient characteristics, the clinicians’ EHR usage (total number of mouse clicks and scrolls during the visit) and interaction with the patient (gaze time at EHR vs at patient and companion), and to summarize patient satisfaction with the visit. To account for clinician cluster effect, a linear mixed effects model was used to assess the associations between patient satisfaction with the clinician and 2 variables: the amount of clinician time spent viewing or using the computer and the clinician time spent interacting with the patient.
We also assessed the above associations by controlling for visit length. Visit lengths not significant at P<.10 were reported as unadjusted analyses.
All analyses were performed using R statistical software, with a P value of <.05 interpreted as statistically significant.
RESULTS
Satisfaction surveys and video and Morae data were collected for 126 individual patient office visits to the 23 participating physicians and nurses. A majority of the patients who participated in the study were older (mean: 60.5 years; standard deviation [SD]=13.4 years), male as expected in a VA setting (96.8%), Caucasian (65.1%), and had at least some college education (81.7%, TABLE 1).
Patients rated their satisfaction in 3 domains—patient-centered communication, physician clinical skills, and physician interpersonal skills—using a 1 to 5 scale (1=least satisfied, 5=most satisfied). Patients in this study were highly satisfied with their physician or nurse in all 3 domains and overall (TABLE 2), with an average satisfaction score of 4.52 ± 0.51 for patient-centered communication, 4.71 ± 0.56 for physician clinical skills, 4.86 ± 0.32 for physician interpersonal skills, and 4.64 ± 0.38 for total satisfaction.
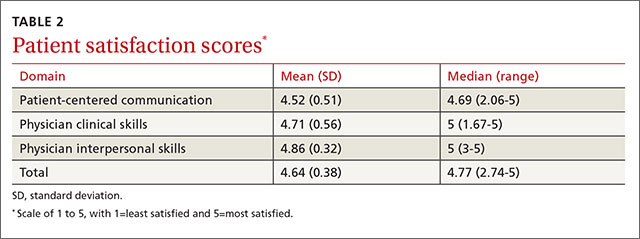
The physicians and nurses used their EHR system extensively during the visits as delineated by the number of clicks and scrolls on the computer. The average number of clicks and scrolls was 192, with a maximum of 685 clicks and scrolls during one visit. The average visit lasted 30.7 minutes, and on average the clinician spent 12.7 minutes (SD: 8.22 minutes), or an average of about 39.4% of total visit time, viewing or working on the EHR; an average of 10.8 minutes (SD: 5.63 minutes), or an average of about 36.3% of total visit time, was spent interacting with the patient (TABLE 3).
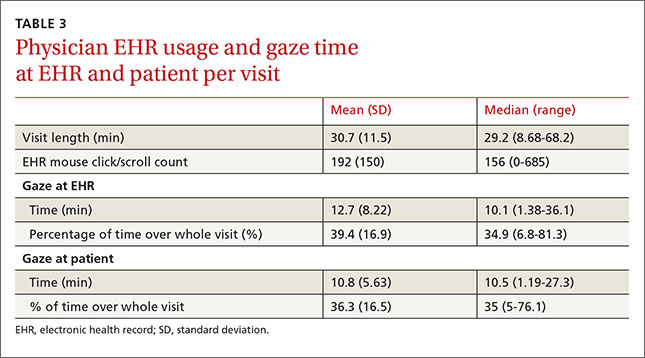
Without adjusting for visit length, patient satisfaction with the clinicians’ patientcentered communication (beta=0.02; P=.02) and total satisfaction (beta=0.014; P=.027) were significantly associated with clinicians’ gaze time at the patient; more clinician gaze time at the patient resulted in greater patient satisfaction (TABLE 4). Adding visit length to the above models had no significant effect (P>.10); therefore, we did not include it in the models.
Patient satisfaction with clinicians’ interpersonal skills was positively associated with gaze time at the patient (beta=0.013, P =.017) without adjusting for visit length. Since the normal assumption of residuals was not plausible based on a normal probability plot, we also assessed the association by dichotomizing the score (5=very satisfied vs <5=not very satisfied) and this significance disappeared. This association was not significant while controlling for visit length.
The percentage of gaze time at the patient (the fraction of patient gaze time over the entire visit) was not significantly associated with patient-centered communication (beta=0.483, P=.12, TABLE 4) when not adjusted for visit length. After adjusting for visit length (P=.052), the association became significant (beta=0.628, P=.033); thus, the higher percentage of time the clinician spent interacting with the patient, the more satisfied the patient was.
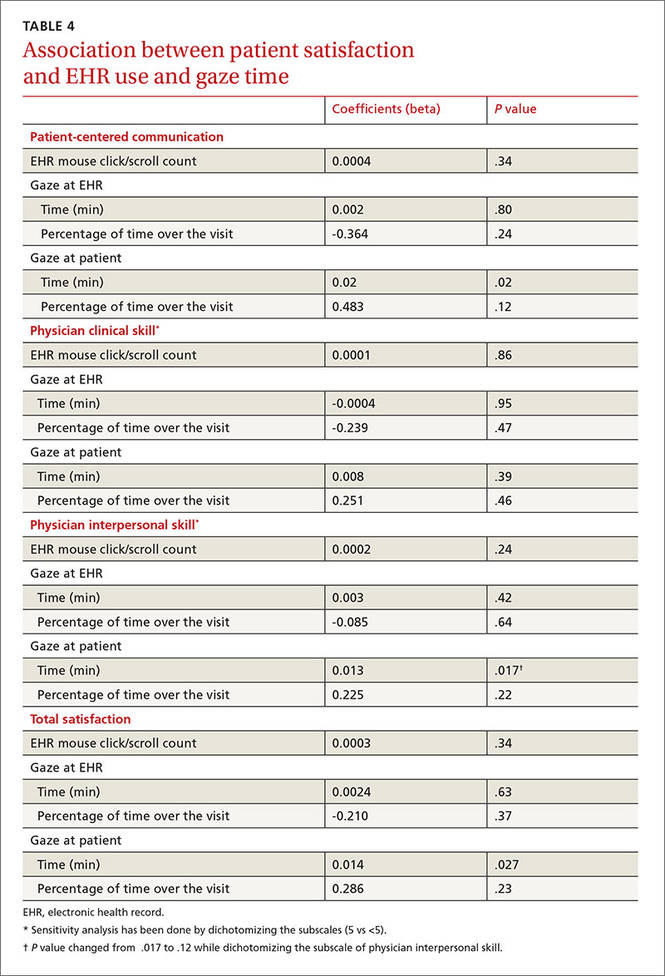
DISCUSSION
In this study, patients were highly satisfied with their clinicians despite often high usage of the EHR. Gadd and Penrod11 reported that patients perceived no impact on communication or eye contact with the clinician despite the initiation of an EHR system in 6 large academic medical practices. Another study demonstrated no significant differences in patient satisfaction with their physicians when comparing patients whose physicians used a paper charting system with those who used an EHR system.14
The fact that patients demonstrated high levels of satisfaction with patient-clinician communication even for clinicians with high EHR usage is somewhat surprising. However, Hsu et al15 found patients’ satisfaction with their clinicians’ communication about medical issues and familiarity with them increased 7 months after implementing an EHR system. In a different study that analyzed videotaped interactions between patients and 5 physicians, the patients found it disturbing not knowing what their doctor was doing when he or she worked on the computer, and preferred being able to see the computer screen.16 This study suggests that it’s advisable for clinicians to describe what they are doing when they use the computer, so that patients better understand how this time spent inputting data actually benefits them.
EHRs can be time-consuming. Physicians and nurses in our study interacted with the EHR a great deal during the office visit, as evidenced by the large average number of clicks and scrolls. This finding confirms clinicians’ perceptions of the amount of work the EHR system requires. For example, in a semi-structured interview of physicians regarding their use of a VA EHR system,10 one respondent noted that the reminders in the EHR required hundreds of clicks.
In our study, the average number of clicks and scrolls during the visit was 192, with some clinicians registering hundreds more. In fact, concerns about the time involved in the use of the EHR and about the adequacy of data collection may lead some clinicians who currently don’t have an EHR system to be reluctant to integrate one into their practices.17
Makoul et al18 found that compared with physicians who used a paper chart, physicians who used an EHR system were more active in clarifying information from the patient and encouraging patient questions during visits, although the study found a trend toward less active roles in more patient-centered communication when using an EHR system. This latter finding is similar to the concerns raised in our study.
Clinical and communication skills are factors, too. One study found that compared to patients who were cared for by more experienced physicians, patients seen by residents using EHRs were more likely to feel that the physician spent less time talking with them and examining them; they were also more likely to report that the visit felt less personal.19 Another study found that clinicians with poor baseline communication skills had more difficulties interacting with patients when an EHR system was introduced than those who had better baseline communication skills.20
Training needed to improve communication during EHR use. Research has shown that when used properly and thoughtfully, EHR use can result in greater patient engagement.21 But, as noted above, there are challenges, suggesting a need for training clinicians to more successfully use an EHR system while simultaneously communicating with their patients.
Study limitations. This study was conducted at a single site, using a single EHR system deployed in the VA clinics. We cannot generalize our findings to other sites or types of clinic systems. Other EHR systems may have different functionalities, which may affect the time required to provide the same type of medical care.
In addition, the study involved only 23 physicians and nurses in a single health system. Other clinicians may have patterns different from those we studied, although a wide range of patterns was seen among the participants, as demonstrated by the large variation in the number of clicks and scrolls. Another limitation is that study patients were not randomly selected, but rather referred by the provider, and the visits were not blinded to either the provider or patient. This may cause some selection bias.
In this study of VA clinicians’ EHR use, patients expressed satisfaction with the clinicians’ clinical skills and patient-centered communication when the clinician spent more time and a greater percentage of the visit engaging the patient. EHR systems need to be designed in a clinician-friendly manner that allows for increased time during the interaction for face-to-face communication between the clinician and the patient, and to ease the workload of EHR documentation. In the meantime, clinicians should be trained in how to expedite their use of the EHR during the clinical visit as well as outside of the exam room in order to improve their patients’ satisfaction.
CORRESPONDENCE
Neil J. Farber, MD, University of California, San Diego, 8939 Villa La Jolla Drive, La Jolla, CA 92037; nfarber@ucsd.edu.
1. Virapongse A, Bates DW, Shi P, et al. Electronic health records and malpractice claims in office practice. Arch Intern Med. 2008;168:2362-2367.
2. DesRoches CM, Campbell EG, Rao SR, et al. Electronic health records in ambulatory care—a national survey of physicians. N Engl J Med. 2008;359:50-60.
3. Bates DW, Leape LL, Cullen DJ, et al. Effect of computerized physician order entry and a team intervention on prevention of serious medication errors. JAMA. 1998;280:1311-1316.
4. Chen C, Garrido T, Chock D, et al. The Kaiser Permanente Electronic Health Record: transforming and streamlining modalities of care. Health Aff (Millwood). 2009;28:323-333.
5. Hillestad R, Bigelow J, Bower A, et al. Can electronic medical record systems transform health care? Potential health benefits, savings, and costs. Health Aff (Millwood). 2005;24:1103-1117.
6. Garrison GM, Bernard ME, Rasmussen NH. 21st-century health care: the effect of computer use by physicians on patient satisfaction at a family medicine clinic. Fam Med. 2002;34:362-368.
7. Likourezos A, Chalfin DB, Murphy DG, et al. Physician and nurse satisfaction with an Electronic Medical Record system. J Emerg Med. 2004;27:419-424.
8. Howard J, Clark EC, Friedman A, et al. Electronic health record impact on work burden in small, unaffiliated, community-based primary care practices. J Gen Intern Med. 2013;28:107-113.
9. Baron RJ. What’s keeping us so busy in primary care? A snapshot from one practice. N Engl J Med. 2010;362:1632-1636.
10. Bonner LM, Simons CE, Parker LE, et al. ‘To take care of the patients’: Qualitative analysis of Veterans Health Administration personnel experiences with a clinical informatics system. Implement Sci. 2010;5:63.
11. Gadd CS, Penrod LE. Dichotomy between physicians’ and patients’ attitudes regarding EMR use during outpatient encounters. Proc AMIA Symp. 2000:275-279.
12. Migdal CW, Namavar AA, Mosley VN, et al. Impact of electronic health records on the patient experience in a hospital setting. J Hosp Med. 2014;9:627-633.
13. Asan O, D Smith P, Montague E. More screen time, less face time - implications for EHR design. J Eval Clin Pract. 2014;20:896-901.
14. Legler JD, Oates R. Patients’ reactions to physician use of a computerized medical record system during clinical encounters. J Fam Pract. 1993;37:241-244.
15. Hsu J, Huang J, Fung V, et al. Health information technology and physician-patient interactions: impact of computers on communication during outpatient primary care visits. J Am Med Inform Assoc. 2005;12:474-480.
16. Als AB. The desk-top computer as a magic box: patterns of behaviour connected with the desk-top computer; GPs’ and patients’ perceptions. Fam Pract. 1997;14:17-23.
17. Bates DW. Physicians and ambulatory electronic health records. Health Aff (Millwood). 2005;24:1180-1189.
18. Makoul G, Curry RH, Tang PC. The use of electronic medical records: communication patterns in outpatient encounters. J Am Med Inform Assoc. 2001;8:610-615.
19. Rouf E, Whittle J, Lu N, et al. Computers in the exam room: differences in physician-patient interaction may be due to physician experience. J Gen Intern Med. 2007;22:43-48.
20. Frankel R, Altschuler A, George S, et al. Effects of exam-room computing on clinician-patient communication: a longitudinal qualitative study. J Gen Intern Med. 2005;20:677-682.
21. Asan O, Young HN, Chewning B, et al. How physician electronic health record screen sharing affects patient and doctor nonverbal communication in primary care. Patient Educ Couns. 2015;98:310-316.
ABSTRACT
Purpose Few studies have quantitatively examined the degree to which the use of the computer affects patients’ satisfaction with the clinician and the quality of the visit. We conducted a study to examine this association.
Methods Twenty-three clinicians (21 internal medicine physicians, 2 nurse practitioners) were recruited from 4 Veteran Affairs Medical Center (VAMC) clinics located in San Diego, Calif. Five to 6 patients for most clinicians (one patient each for 2 of the clinicians) were recruited to participate in a study of patient-physician communication. The clinicians’ computer use and the patient-clinician interactions in the exam room were captured in real time via video recordings of the interactions and the computer screen, and through the use of the Morae usability testing software system, which recorded clinician clicks and scrolls on the computer. After the visit, patients were asked to complete a satisfaction survey.
Results The final sample consisted of 126 consultations. Total patient satisfaction (beta=0.014; P=.027) and patient satisfaction with patient-centered communication (beta=0.02; P=.02) were significantly associated with higher clinician “gaze time” at the patient. A higher percentage of gaze time during a visit (controlling for the length of the visit) was significantly associated with greater satisfaction with patient-centered communication (beta=0.628; P=.033).
Conclusions Higher clinician gaze time at the patient predicted greater patient satisfaction. This suggests that clinicians would be well served to refine their multitasking skills so that they communicate in a patient-centered manner while performing necessary computer-related tasks. These findings also have important implications for clinical training with respect to using an electronic health record (EHR) system in ways that do not impede the one-on-one conversation between clinician and patient.
Primary care physicians’ use of electronic health record (EHR) systems has markedly increased in recent years. For example, a 2008 study of more than 1000 randomly selected practicing physicians in Massachusetts found that 33% utilized an EHR.1 Many physicians believe that EHR systems are beneficial to patient care,2 and several studies have supported this perception, showing clear benefits of EHR use. A study of one component of EHR systems—computerized physician order entry (CPOE)—found that CPOEs resulted in a >50% decrease in serious medication errors.3 Other errors have declined with the use of EHR systems, as well; Virapongse et al1 found a trend towards fewer paid malpractice claims against physicians who used an EHR compared to those physicians using paper charting.
EHR systems may also improve efficiency. In a study of a health maintenance organization (HMO) model, initiating an EHR system improved efficiency by decreasing office visits.4 Widespread adoption of EHR systems could save an estimated $81 billion annually through reductions in errors and adverse events, and improved preventive care and chronic disease management.5 In a survey of approximately 300 patients who had been evaluated at a family medicine clinic for hypertension, high blood pressure without hypertension, or hyperlipidemia, 75% indicated that they felt EHRs had a positive impact on their care.6
However, some clinicians are concerned about the possible negative impact of EHR systems on health care. One major concern is that EHR systems might increase physician workload7 and the amount of time spent using a computer during patient visits. A study that examined physician EHR use found that while time spent on certain tasks, such as prescription writing and lab ordering, was reduced, there was an overall increase in time spent on computer tasks related to charting, preventive care, and chronic disease management.8 Baron et al9 also found an increase in time spent using the EHR during each clinic session in one private practice setting.
Physicians are also concerned that EHR systems might interfere with the patient-physician interaction (eg, maintaining eye contact, paying attention to patients’ concerns) by directing the physician’s attention away from the patient and toward the computer.10 In one study, this concern increased after physicians started utilizing a new EHR system.11 Although a survey of inpatients indicated that residents engaged in greater patient-physician communication after an EHR was implemented,12 a separate study conducted in an outpatient setting found physicians spent less time looking at patients after converting from a paper-based system to an EHR system.13
Very few studies have quantitatively examined the association of patient satisfaction with clinician EHR usage. The goal of this study was to examine the correlation of patient satisfaction with actual EHR usage in an ambulatory setting. The data reported in this paper are part of a larger study aimed at understanding EHR use in a VAMC.
METHODS
Study design and sample
The study participants were clinicians in 4 VAMC community clinics located in San Diego, Calif. Twenty-three clinicians (21 general internal medicine physicians and 2 nurse practitioners) were enrolled in the study. Most clinicians identified 5 to 6 patients from their practices to participate in the study (2 participants identified only one patient each). All patients were visiting their clinician for either an acute visit or a follow-up visit.
Although there were slight variations in clinic room size and shape, all rooms were equipped with a compact desk against a wall, a rolling desk chair, a desktop computer with keyboard and mouse, and a second, fixed chair placed diagonal to the physician’s chair. Two rooms had dual monitors. There was a standard examination table in all examination rooms.
The clinicians’ computer use and the patient-clinician interactions in the exam room were captured in real time via video recordings of the interactions and the computer screen. A usability testing software system (Morae) was used to record clinicians’ computer activities, including mouse clicks and scrolls on the computer. The Computerized Patient Records System (CPRS) was the EHR used by all clinicians in this study.
At the end of the visit, patients were asked to complete a satisfaction survey with questions in 3 domains: the physician’s engagement in patient-centered communication, the physician’s clinical skills, and the physician’s interpersonal skills.
Data analysis
Descriptive statistics were used to document patient characteristics, the clinicians’ EHR usage (total number of mouse clicks and scrolls during the visit) and interaction with the patient (gaze time at EHR vs at patient and companion), and to summarize patient satisfaction with the visit. To account for clinician cluster effect, a linear mixed effects model was used to assess the associations between patient satisfaction with the clinician and 2 variables: the amount of clinician time spent viewing or using the computer and the clinician time spent interacting with the patient.
We also assessed the above associations by controlling for visit length. Visit lengths not significant at P<.10 were reported as unadjusted analyses.
All analyses were performed using R statistical software, with a P value of <.05 interpreted as statistically significant.
RESULTS
Satisfaction surveys and video and Morae data were collected for 126 individual patient office visits to the 23 participating physicians and nurses. A majority of the patients who participated in the study were older (mean: 60.5 years; standard deviation [SD]=13.4 years), male as expected in a VA setting (96.8%), Caucasian (65.1%), and had at least some college education (81.7%, TABLE 1).
Patients rated their satisfaction in 3 domains—patient-centered communication, physician clinical skills, and physician interpersonal skills—using a 1 to 5 scale (1=least satisfied, 5=most satisfied). Patients in this study were highly satisfied with their physician or nurse in all 3 domains and overall (TABLE 2), with an average satisfaction score of 4.52 ± 0.51 for patient-centered communication, 4.71 ± 0.56 for physician clinical skills, 4.86 ± 0.32 for physician interpersonal skills, and 4.64 ± 0.38 for total satisfaction.
The physicians and nurses used their EHR system extensively during the visits as delineated by the number of clicks and scrolls on the computer. The average number of clicks and scrolls was 192, with a maximum of 685 clicks and scrolls during one visit. The average visit lasted 30.7 minutes, and on average the clinician spent 12.7 minutes (SD: 8.22 minutes), or an average of about 39.4% of total visit time, viewing or working on the EHR; an average of 10.8 minutes (SD: 5.63 minutes), or an average of about 36.3% of total visit time, was spent interacting with the patient (TABLE 3).
Without adjusting for visit length, patient satisfaction with the clinicians’ patientcentered communication (beta=0.02; P=.02) and total satisfaction (beta=0.014; P=.027) were significantly associated with clinicians’ gaze time at the patient; more clinician gaze time at the patient resulted in greater patient satisfaction (TABLE 4). Adding visit length to the above models had no significant effect (P>.10); therefore, we did not include it in the models.
Patient satisfaction with clinicians’ interpersonal skills was positively associated with gaze time at the patient (beta=0.013, P =.017) without adjusting for visit length. Since the normal assumption of residuals was not plausible based on a normal probability plot, we also assessed the association by dichotomizing the score (5=very satisfied vs <5=not very satisfied) and this significance disappeared. This association was not significant while controlling for visit length.
The percentage of gaze time at the patient (the fraction of patient gaze time over the entire visit) was not significantly associated with patient-centered communication (beta=0.483, P=.12, TABLE 4) when not adjusted for visit length. After adjusting for visit length (P=.052), the association became significant (beta=0.628, P=.033); thus, the higher percentage of time the clinician spent interacting with the patient, the more satisfied the patient was.
DISCUSSION
In this study, patients were highly satisfied with their clinicians despite often high usage of the EHR. Gadd and Penrod11 reported that patients perceived no impact on communication or eye contact with the clinician despite the initiation of an EHR system in 6 large academic medical practices. Another study demonstrated no significant differences in patient satisfaction with their physicians when comparing patients whose physicians used a paper charting system with those who used an EHR system.14
The fact that patients demonstrated high levels of satisfaction with patient-clinician communication even for clinicians with high EHR usage is somewhat surprising. However, Hsu et al15 found patients’ satisfaction with their clinicians’ communication about medical issues and familiarity with them increased 7 months after implementing an EHR system. In a different study that analyzed videotaped interactions between patients and 5 physicians, the patients found it disturbing not knowing what their doctor was doing when he or she worked on the computer, and preferred being able to see the computer screen.16 This study suggests that it’s advisable for clinicians to describe what they are doing when they use the computer, so that patients better understand how this time spent inputting data actually benefits them.
EHRs can be time-consuming. Physicians and nurses in our study interacted with the EHR a great deal during the office visit, as evidenced by the large average number of clicks and scrolls. This finding confirms clinicians’ perceptions of the amount of work the EHR system requires. For example, in a semi-structured interview of physicians regarding their use of a VA EHR system,10 one respondent noted that the reminders in the EHR required hundreds of clicks.
In our study, the average number of clicks and scrolls during the visit was 192, with some clinicians registering hundreds more. In fact, concerns about the time involved in the use of the EHR and about the adequacy of data collection may lead some clinicians who currently don’t have an EHR system to be reluctant to integrate one into their practices.17
Makoul et al18 found that compared with physicians who used a paper chart, physicians who used an EHR system were more active in clarifying information from the patient and encouraging patient questions during visits, although the study found a trend toward less active roles in more patient-centered communication when using an EHR system. This latter finding is similar to the concerns raised in our study.
Clinical and communication skills are factors, too. One study found that compared to patients who were cared for by more experienced physicians, patients seen by residents using EHRs were more likely to feel that the physician spent less time talking with them and examining them; they were also more likely to report that the visit felt less personal.19 Another study found that clinicians with poor baseline communication skills had more difficulties interacting with patients when an EHR system was introduced than those who had better baseline communication skills.20
Training needed to improve communication during EHR use. Research has shown that when used properly and thoughtfully, EHR use can result in greater patient engagement.21 But, as noted above, there are challenges, suggesting a need for training clinicians to more successfully use an EHR system while simultaneously communicating with their patients.
Study limitations. This study was conducted at a single site, using a single EHR system deployed in the VA clinics. We cannot generalize our findings to other sites or types of clinic systems. Other EHR systems may have different functionalities, which may affect the time required to provide the same type of medical care.
In addition, the study involved only 23 physicians and nurses in a single health system. Other clinicians may have patterns different from those we studied, although a wide range of patterns was seen among the participants, as demonstrated by the large variation in the number of clicks and scrolls. Another limitation is that study patients were not randomly selected, but rather referred by the provider, and the visits were not blinded to either the provider or patient. This may cause some selection bias.
In this study of VA clinicians’ EHR use, patients expressed satisfaction with the clinicians’ clinical skills and patient-centered communication when the clinician spent more time and a greater percentage of the visit engaging the patient. EHR systems need to be designed in a clinician-friendly manner that allows for increased time during the interaction for face-to-face communication between the clinician and the patient, and to ease the workload of EHR documentation. In the meantime, clinicians should be trained in how to expedite their use of the EHR during the clinical visit as well as outside of the exam room in order to improve their patients’ satisfaction.
CORRESPONDENCE
Neil J. Farber, MD, University of California, San Diego, 8939 Villa La Jolla Drive, La Jolla, CA 92037; nfarber@ucsd.edu.
1. Virapongse A, Bates DW, Shi P, et al. Electronic health records and malpractice claims in office practice. Arch Intern Med. 2008;168:2362-2367.
2. DesRoches CM, Campbell EG, Rao SR, et al. Electronic health records in ambulatory care—a national survey of physicians. N Engl J Med. 2008;359:50-60.
3. Bates DW, Leape LL, Cullen DJ, et al. Effect of computerized physician order entry and a team intervention on prevention of serious medication errors. JAMA. 1998;280:1311-1316.
4. Chen C, Garrido T, Chock D, et al. The Kaiser Permanente Electronic Health Record: transforming and streamlining modalities of care. Health Aff (Millwood). 2009;28:323-333.
5. Hillestad R, Bigelow J, Bower A, et al. Can electronic medical record systems transform health care? Potential health benefits, savings, and costs. Health Aff (Millwood). 2005;24:1103-1117.
6. Garrison GM, Bernard ME, Rasmussen NH. 21st-century health care: the effect of computer use by physicians on patient satisfaction at a family medicine clinic. Fam Med. 2002;34:362-368.
7. Likourezos A, Chalfin DB, Murphy DG, et al. Physician and nurse satisfaction with an Electronic Medical Record system. J Emerg Med. 2004;27:419-424.
8. Howard J, Clark EC, Friedman A, et al. Electronic health record impact on work burden in small, unaffiliated, community-based primary care practices. J Gen Intern Med. 2013;28:107-113.
9. Baron RJ. What’s keeping us so busy in primary care? A snapshot from one practice. N Engl J Med. 2010;362:1632-1636.
10. Bonner LM, Simons CE, Parker LE, et al. ‘To take care of the patients’: Qualitative analysis of Veterans Health Administration personnel experiences with a clinical informatics system. Implement Sci. 2010;5:63.
11. Gadd CS, Penrod LE. Dichotomy between physicians’ and patients’ attitudes regarding EMR use during outpatient encounters. Proc AMIA Symp. 2000:275-279.
12. Migdal CW, Namavar AA, Mosley VN, et al. Impact of electronic health records on the patient experience in a hospital setting. J Hosp Med. 2014;9:627-633.
13. Asan O, D Smith P, Montague E. More screen time, less face time - implications for EHR design. J Eval Clin Pract. 2014;20:896-901.
14. Legler JD, Oates R. Patients’ reactions to physician use of a computerized medical record system during clinical encounters. J Fam Pract. 1993;37:241-244.
15. Hsu J, Huang J, Fung V, et al. Health information technology and physician-patient interactions: impact of computers on communication during outpatient primary care visits. J Am Med Inform Assoc. 2005;12:474-480.
16. Als AB. The desk-top computer as a magic box: patterns of behaviour connected with the desk-top computer; GPs’ and patients’ perceptions. Fam Pract. 1997;14:17-23.
17. Bates DW. Physicians and ambulatory electronic health records. Health Aff (Millwood). 2005;24:1180-1189.
18. Makoul G, Curry RH, Tang PC. The use of electronic medical records: communication patterns in outpatient encounters. J Am Med Inform Assoc. 2001;8:610-615.
19. Rouf E, Whittle J, Lu N, et al. Computers in the exam room: differences in physician-patient interaction may be due to physician experience. J Gen Intern Med. 2007;22:43-48.
20. Frankel R, Altschuler A, George S, et al. Effects of exam-room computing on clinician-patient communication: a longitudinal qualitative study. J Gen Intern Med. 2005;20:677-682.
21. Asan O, Young HN, Chewning B, et al. How physician electronic health record screen sharing affects patient and doctor nonverbal communication in primary care. Patient Educ Couns. 2015;98:310-316.

Medicaid Insurance Is Associated With Larger Curves in Patients Who Require Scoliosis Surgery
Rising health care costs have led many health insurers to limit benefits, which may be a problem for children in need of specialty care. Uninsured children have poorer access to specialty care than insured children. Children with public health coverage have better access to specialty care than uninsured children but inferior access compared with privately insured children.1,2 It is well documented that children with government insurance have limited access to orthopedic care for fractures, ligamentous knee injuries, and other injuries.1,3-5 Adolescent idiopathic scoliosis (AIS) differs from many other conditions managed by pediatric orthopedists, as it may be progressive, with management becoming increasingly more complex as the curve magnitude increases.6 The ability to access care earlier in the disease process may allow for earlier nonoperative interventions, such as bracing. For patients who require spinal fusion, earlier diagnosis and referral to a specialist could potentially result in shorter fusions and preserve distal motion segments. The ability to access the health care system in a timely fashion would therefore be of utmost importance for patients with scoliosis.
The literature on AIS is lacking in studies focused on care access based on insurance coverage and the potential impact that this may have on curve progression.7-9 We conducted a study to determine whether there is a difference between patients with and without private insurance who present to a busy urban pediatric orthopedic practice for management of scoliosis that eventually resulted in surgical treatment.
Materials and Methods
After obtaining institutional review board approval for this study, we retrospectively reviewed the medical records of patients (age, 10-18 years) who underwent posterior spinal fusion (PSF) for newly diagnosed AIS between 2008 and 2012. We excluded patients treated with growing spine instrumentation (growing rods), patients younger than 10 years or older than 18 years at presentation, and patients without adequate radiographs or clinical data, including insurance status. To focus on newly diagnosed scoliosis, we also excluded patients who had been seen for second opinions or whose scoliosis had been managed elsewhere in the past. Patients with syndromic, neuromuscular, or congenital scoliosis were also excluded.
Medical records were checked to ascertain time from initial evaluation to decision for surgery, time from recommendation for surgery until actual procedure, and insurance status. Distance traveled was figured from patients’ home addresses. Cobb angles were calculated from initial preoperative and final preoperative posteroanterior (PA) radiographs. Curves as seen on PA, lateral, and maximal effort, supine bending thoracic and lumbar radiographs from the initial preoperative visit were classified using the system of Lenke and colleagues.10 Hospital records were queried to determine number of levels fused at surgery, number of implants placed, and length of stay. Patients were evaluated without prior screening of insurance status and without prior consultation with referring physicians. Surgical procedures were scheduled on a first-come, first-served basis without preference for insurance status.
Results
We identified 135 consecutive patients with newly diagnosed AIS treated with PSF by our group between January 2008 and December 2012 (Table 1). Sixty-one percent had private insurance; 39% had Medicaid. There was no difference in age or ASA (American Society of Anesthesiologists) score between groups. Mean (SD) Cobb angle at initial presentation was 47.5° (14.3°) (range, 18.0°-86.0°) for the private insurance group and 57.2° (15.7°) (range, 23.0°-95.0°) for the Medicaid group (P < .0001). At time of surgery, mean (SD) Cobb angles were 54.6° (11.7°) and 60.6° (13.9°) for the private insurance and Medicaid groups, respectively (P = .008). There was no difference in curve types (Lenke and colleagues10 classification) between groups (Table 2, P = .83). Medicaid patients traveled a shorter mean (SD) distance for care, 56.3 (57.0) miles, versus 73.7 (66.7) miles (P = .05). There was no statistical difference (P = .14) in mean (SD) surgical wait time from surgery recommendation to actual surgery, 103.1 (62.4) days and 128.8 (137.5) days for the private insurance and Medicaid groups, respectively. The difference between patient groups in mean (SD) number of levels fused did not reach statistical significance (P = .16), 10.3 (2.2) levels for the Medicaid group and 9.7 (2.3) levels for the private insurance group. Mean (SD) estimated blood loss was higher for Medicaid patients, 445.7 (415.9) mL versus 335.1 (271.5) mL (P = .06), though there was no difference in use of posterior column osteotomies between groups. There was no difference (P = .11) in mean (SD) length of hospital stay between Medicaid patients, 2.6 (0.8) days, and private insurance patients, 2.4 (0.5) days.
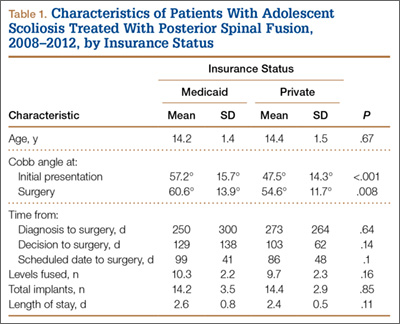
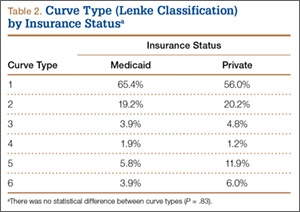
Discussion
According to an extensive body of literature, patients with government insurance have limited access to specialty care.1,11,12 Medicaid-insured children in need of orthopedic care are no exception. Sabharwal and colleagues13 examined a database of pediatric fracture cases and found that 52% of the privately insured patients and 22% of the publicly insured patients received orthopedic care (P = .013).13 When Pierce and colleagues14 called 42 orthopedic practices regarding a fictitious 14-year-old patient with an anterior cruciate ligament tear, 38 offered an appointment within 2 weeks to a privately insured patient, and 6 offered such an appointment to a publicly insured patient. Skaggs and colleagues4 surveyed 230 orthopedic practices nationally and found that Medicaid-insured children had limited access to orthopedic care; 41 practices (18%) would not see a child with Medicaid under any circumstances. Using a fictitious case of a 10-year-old boy with a forearm fracture, Iobst and colleagues3 tried making an appointment at 100 orthopedic offices. Eight gave an appointment within 1 week to a Medicaid-insured patient, and 36 gave an appointment to a privately insured patient.3
There are few data regarding insurance status and scoliosis care in children. Spinal deformity differs from simple fractures and ligamentous injuries, as timely care may result in a less invasive treatment (bracing) if the curvature is caught early. Goldstein and colleagues9 recently evaluated 642 patients who presented for scoliosis evaluation over a 10-year period. There was no difference in curve magnitudes between patients with and without Medicaid insurance. Thirty-two percent of these patients were evaluated for a second opinion, and the authors chose not to subdivide patients on the basis of curve severity and treatment needed, noting only no difference between groups. There was no discussion of the potential difference between patients with and without private insurance with respect to surgically versus nonsurgically treated curves. We wanted to focus specifically on patients who required surgical intervention, as our experience has been that many patients with government insurance present with either very mild scoliosis (10°) or very large curves that were not identified because of lack of primary care access or inadequate school screening. Although summing these 2 groups would result in a similar average, they would represent a different cohort than patients with curves along a bell curve. Furthermore, it is the group of patients who would require surgical intervention that is so critical to identify early in order to intervene.
Our data suggest a difference in presenting curves between patients with and without private insurance. The approximately 10° difference between patient groups in this study could potentially represent the difference between bracing and surgery. Furthermore, Miyanji and colleagues6 evaluated the relationship between Cobb angle and health care consumption and correlated larger curve magnitudes with more levels fused, longer surgeries, and higher rates of transfusion. Specifically, every 10° increase in curve magnitude resulted in 7.8 more minutes of operative time, 0.3 extra levels fused, and 1.5 times increased risk for requiring a blood transfusion.
Cho and Egorova15 recently evaluated insurance status with respect to surgical outcomes using a national inpatient database and found that 42.4% of surgeries for AIS in children with Medicaid had fusions involving 9 or more levels, whereas only 33.6% of privately insured patients had fusions of 9 or more levels. There was no difference in osteotomy or reoperation for pseudarthrosis between groups, but there was a slightly higher rate of infectious (1.1% vs 0.6%) and hemorrhagic (2.5% vs 1.7%) complications in the Medicaid group. Hospital stay was longer in patients with Medicaid, though complications were not different between groups.
The mean difference in the magnitude of the curves treated in our study was not more than 10° between patients with and without Medicaid, perhaps explaining the lack of a statistically significant difference in number of levels fused between groups. Although the groups were similar with respect to the percentage requiring posterior column spinal osteotomies, we noted a difference in estimated blood loss between groups, likely explained by the fact that a junior surgeon was added just before initiation of the study period, potentially skewing the estimated blood loss as this surgeon gained experience. Payer status has been correlated to length of hospital stay in children with scoliosis. Vitale and colleagues8 reviewed the effect of payer status on surgical outcomes in 3606 scoliosis patients from a statewide database in California and concluded that, compared with patients having all other payment sources, Medicaid patients had higher odds for complications and longer hospital stay. Our hospital has adopted a highly coordinated care pathway that allows for discharge on postoperative day 2, likely explaining the lack of any difference in postoperative stay.16
The disparity in curve magnitudes among patients with and without private insurance is striking and probably multifactorial. Very likely, the combination of schools with limited screening programs within urban or rural school systems,17 restricted access to pediatricians,18,19 and longer waits to see orthopedic specialists20 all contribute to this disparity. It should be noted that school screening is mandatory in our state. This discrepancy may be related to a previously established tendency in minority populations toward waiting longer to seek care and refusing surgical recommendations, though we were unable to query socioeconomic factors such as race and household income.21,22 It is clearly important to increase access to care for underinsured patients with scoliosis. A comprehensive approach, including providing better education in the schools, establishing communication with referring primary care providers, and increasing access through more physicians or physician extenders, is likely needed. Orthopedists should perhaps treat scoliosis evaluation with the same sense of urgency given to minor fractures, and primary care providers should try to ensure that appropriate referrals for scoliosis are made. Also curious was the shorter travel distance for Medicaid patients versus private insurance patients in this study. We hypothesize this is related to our urban location and its large Medicaid population.
Our study had several limitations. Our electronic medical records (EMR) system does not store data related to the time a patient calls for an initial appointment, limiting our ability to determine how long patients waited for their initial consultation. Furthermore, the decision to undergo surgery is multifactorial and cannot be simplified into time from initial recommendation to surgery, as some patients delay surgery because of school or other obligations. These data should be reasonably consistent over time, as patients seen in the early spring in both groups may delay surgery until the summer, and those diagnosed in June may prefer earlier surgery.
Summary
Children with AIS are at risk for curve progression. Therefore, delays in providing timely care may result in worsening scoliosis. Compared with private insurance patients, Medicaid patients presented with larger curve magnitudes. Further study is needed to better delineate ways to improve care access for patients with scoliosis in communities with larger Medicaid populations.
1. Skaggs DL. Less access to care for children with Medicaid. Orthopedics. 2003;26(12):1184, 1186.
2. Skinner AC, Mayer ML. Effects of insurance status on children’s access to specialty care: a systematic review of the literature. BMC Health Serv Res. 2007;7:194.
3. Iobst C, King W, Baitner A, Tidwell M, Swirsky S, Skaggs DL. Access to care for children with fractures. J Pediatr Orthop. 2010;30(3):244-247.
4. Skaggs DL, Lehmann CL, Rice C, et al. Access to orthopaedic care for children with Medicaid versus private insurance: results of a national survey. J Pediatr Orthop. 2006;26(3):400-404.
5. Skaggs DL, Oda JE, Lerman L, et al. Insurance status and delay in orthotic treatment in children. J Pediatr Orthop. 2007;27(1):94-97.
6. Miyanji F, Slobogean GP, Samdani AF, et al. Is larger scoliosis curve magnitude associated with increased perioperative health-care resource utilization? A multicenter analysis of 325 adolescent idiopathic scoliosis curves. J Bone Joint Surg Am. 2012;94(9):809-813.
7. Nuno M, Drazin DG, Acosta FL Jr. Differences in treatments and outcomes for idiopathic scoliosis patients treated in the United States from 1998 to 2007: impact of socioeconomic variables and ethnicity. Spine J. 2013;13(2):116-123.
8. Vitale MA, Arons RR, Hyman JE, Skaggs DL, Roye DP, Vitale MG. The contribution of hospital volume, payer status, and other factors on the surgical outcomes of scoliosis patients: a review of 3,606 cases in the state of California. J Pediatr Orthop. 2005;25(3):393-399.
9. Goldstein RY, Joiner ER, Skaggs DL. Insurance status does not predict curve magnitude in adolescent idiopathic scoliosis at first presentation to an orthopaedic surgeon. J Pediatr Orthop. 2015;35(1):39-42.
10. Lenke LG, Betz RR, Harms J, et al. Adolescent idiopathic scoliosis: a new classification to determine extent of spinal arthrodesis. J Bone Joint Surg Am. 2001;83(8):1169-1181.
11. Alosh H, Riley LH 3rd, Skolasky RL. Insurance status, geography, race, and ethnicity as predictors of anterior cervical spine surgery rates and in-hospital mortality: an examination of United States trends from 1992 to 2005. Spine. 2009;34(18):1956-1962.
12. Newacheck PW, Hughes DC, Hung YY, Wong S, Stoddard JJ. The unmet health needs of America’s children. Pediatrics. 2000;105(4 pt 2):989-997.
13. Sabharwal S, Zhao C, McClemens E, Kaufmann A. Pediatric orthopaedic patients presenting to a university emergency department after visiting another emergency department: demographics and health insurance status. J Pediatr Orthop. 2007;27(6):690-694.
14. Pierce TR, Mehlman CT, Tamai J, Skaggs DL. Access to care for the adolescent anterior cruciate ligament patient with Medicaid versus private insurance. J Pediatr Orthop. 2012;32(3):245-248.
15. Cho SK, Egorova NN. The association between insurance status and complications, length of stay, and costs for pediatric idiopathic scoliosis. Spine. 2015;40(4):247-256.
16. Fletcher ND, Shourbaji N, Mitchell PM, Oswald TS, Devito DP, Bruce RW Jr. Clinical and economic implications of early discharge following posterior spinal fusion for adolescent idiopathic scoliosis. J Child Orthop. 2014;8(3):257-263.
17. Kasper MJ, Robbins L, Root L, Peterson MG, Allegrante JP. A musculoskeletal outreach screening, treatment, and education program for urban minority children. Arthritis Care Res. 1993;6(3):126-133.
18. Berman S, Dolins J, Tang SF, Yudkowsky B. Factors that influence the willingness of private primary care pediatricians to accept more Medicaid patients. Pediatrics. 2002;110(2 pt 1):239-248.
19. Sommers BD. Protecting low-income children’s access to care: are physician visits associated with reduced patient dropout from Medicaid and the Children’s Health Insurance Program? Pediatrics. 2006;118(1):e36-e42.
20. Bisgaier J, Polsky D, Rhodes KV. Academic medical centers and equity in specialty care access for children. Arch Pediatr Adolesc Med. 2012;166(4):304-310.
21. Sedlis SP, Fisher VJ, Tice D, Esposito R, Madmon L, Steinberg EH. Racial differences in performance of invasive cardiac procedures in a Department of Veterans Affairs medical center. J Clin Epidemiol. 1997;50(8):899-901.
22. Mitchell JB, McCormack LA. Time trends in late-stage diagnosis of cervical cancer. Differences by race/ethnicity and income. Med Care. 1997;35(12):1220-1224.
Rising health care costs have led many health insurers to limit benefits, which may be a problem for children in need of specialty care. Uninsured children have poorer access to specialty care than insured children. Children with public health coverage have better access to specialty care than uninsured children but inferior access compared with privately insured children.1,2 It is well documented that children with government insurance have limited access to orthopedic care for fractures, ligamentous knee injuries, and other injuries.1,3-5 Adolescent idiopathic scoliosis (AIS) differs from many other conditions managed by pediatric orthopedists, as it may be progressive, with management becoming increasingly more complex as the curve magnitude increases.6 The ability to access care earlier in the disease process may allow for earlier nonoperative interventions, such as bracing. For patients who require spinal fusion, earlier diagnosis and referral to a specialist could potentially result in shorter fusions and preserve distal motion segments. The ability to access the health care system in a timely fashion would therefore be of utmost importance for patients with scoliosis.
The literature on AIS is lacking in studies focused on care access based on insurance coverage and the potential impact that this may have on curve progression.7-9 We conducted a study to determine whether there is a difference between patients with and without private insurance who present to a busy urban pediatric orthopedic practice for management of scoliosis that eventually resulted in surgical treatment.
Materials and Methods
After obtaining institutional review board approval for this study, we retrospectively reviewed the medical records of patients (age, 10-18 years) who underwent posterior spinal fusion (PSF) for newly diagnosed AIS between 2008 and 2012. We excluded patients treated with growing spine instrumentation (growing rods), patients younger than 10 years or older than 18 years at presentation, and patients without adequate radiographs or clinical data, including insurance status. To focus on newly diagnosed scoliosis, we also excluded patients who had been seen for second opinions or whose scoliosis had been managed elsewhere in the past. Patients with syndromic, neuromuscular, or congenital scoliosis were also excluded.
Medical records were checked to ascertain time from initial evaluation to decision for surgery, time from recommendation for surgery until actual procedure, and insurance status. Distance traveled was figured from patients’ home addresses. Cobb angles were calculated from initial preoperative and final preoperative posteroanterior (PA) radiographs. Curves as seen on PA, lateral, and maximal effort, supine bending thoracic and lumbar radiographs from the initial preoperative visit were classified using the system of Lenke and colleagues.10 Hospital records were queried to determine number of levels fused at surgery, number of implants placed, and length of stay. Patients were evaluated without prior screening of insurance status and without prior consultation with referring physicians. Surgical procedures were scheduled on a first-come, first-served basis without preference for insurance status.
Results
We identified 135 consecutive patients with newly diagnosed AIS treated with PSF by our group between January 2008 and December 2012 (Table 1). Sixty-one percent had private insurance; 39% had Medicaid. There was no difference in age or ASA (American Society of Anesthesiologists) score between groups. Mean (SD) Cobb angle at initial presentation was 47.5° (14.3°) (range, 18.0°-86.0°) for the private insurance group and 57.2° (15.7°) (range, 23.0°-95.0°) for the Medicaid group (P < .0001). At time of surgery, mean (SD) Cobb angles were 54.6° (11.7°) and 60.6° (13.9°) for the private insurance and Medicaid groups, respectively (P = .008). There was no difference in curve types (Lenke and colleagues10 classification) between groups (Table 2, P = .83). Medicaid patients traveled a shorter mean (SD) distance for care, 56.3 (57.0) miles, versus 73.7 (66.7) miles (P = .05). There was no statistical difference (P = .14) in mean (SD) surgical wait time from surgery recommendation to actual surgery, 103.1 (62.4) days and 128.8 (137.5) days for the private insurance and Medicaid groups, respectively. The difference between patient groups in mean (SD) number of levels fused did not reach statistical significance (P = .16), 10.3 (2.2) levels for the Medicaid group and 9.7 (2.3) levels for the private insurance group. Mean (SD) estimated blood loss was higher for Medicaid patients, 445.7 (415.9) mL versus 335.1 (271.5) mL (P = .06), though there was no difference in use of posterior column osteotomies between groups. There was no difference (P = .11) in mean (SD) length of hospital stay between Medicaid patients, 2.6 (0.8) days, and private insurance patients, 2.4 (0.5) days.
Discussion
According to an extensive body of literature, patients with government insurance have limited access to specialty care.1,11,12 Medicaid-insured children in need of orthopedic care are no exception. Sabharwal and colleagues13 examined a database of pediatric fracture cases and found that 52% of the privately insured patients and 22% of the publicly insured patients received orthopedic care (P = .013).13 When Pierce and colleagues14 called 42 orthopedic practices regarding a fictitious 14-year-old patient with an anterior cruciate ligament tear, 38 offered an appointment within 2 weeks to a privately insured patient, and 6 offered such an appointment to a publicly insured patient. Skaggs and colleagues4 surveyed 230 orthopedic practices nationally and found that Medicaid-insured children had limited access to orthopedic care; 41 practices (18%) would not see a child with Medicaid under any circumstances. Using a fictitious case of a 10-year-old boy with a forearm fracture, Iobst and colleagues3 tried making an appointment at 100 orthopedic offices. Eight gave an appointment within 1 week to a Medicaid-insured patient, and 36 gave an appointment to a privately insured patient.3
There are few data regarding insurance status and scoliosis care in children. Spinal deformity differs from simple fractures and ligamentous injuries, as timely care may result in a less invasive treatment (bracing) if the curvature is caught early. Goldstein and colleagues9 recently evaluated 642 patients who presented for scoliosis evaluation over a 10-year period. There was no difference in curve magnitudes between patients with and without Medicaid insurance. Thirty-two percent of these patients were evaluated for a second opinion, and the authors chose not to subdivide patients on the basis of curve severity and treatment needed, noting only no difference between groups. There was no discussion of the potential difference between patients with and without private insurance with respect to surgically versus nonsurgically treated curves. We wanted to focus specifically on patients who required surgical intervention, as our experience has been that many patients with government insurance present with either very mild scoliosis (10°) or very large curves that were not identified because of lack of primary care access or inadequate school screening. Although summing these 2 groups would result in a similar average, they would represent a different cohort than patients with curves along a bell curve. Furthermore, it is the group of patients who would require surgical intervention that is so critical to identify early in order to intervene.
Our data suggest a difference in presenting curves between patients with and without private insurance. The approximately 10° difference between patient groups in this study could potentially represent the difference between bracing and surgery. Furthermore, Miyanji and colleagues6 evaluated the relationship between Cobb angle and health care consumption and correlated larger curve magnitudes with more levels fused, longer surgeries, and higher rates of transfusion. Specifically, every 10° increase in curve magnitude resulted in 7.8 more minutes of operative time, 0.3 extra levels fused, and 1.5 times increased risk for requiring a blood transfusion.
Cho and Egorova15 recently evaluated insurance status with respect to surgical outcomes using a national inpatient database and found that 42.4% of surgeries for AIS in children with Medicaid had fusions involving 9 or more levels, whereas only 33.6% of privately insured patients had fusions of 9 or more levels. There was no difference in osteotomy or reoperation for pseudarthrosis between groups, but there was a slightly higher rate of infectious (1.1% vs 0.6%) and hemorrhagic (2.5% vs 1.7%) complications in the Medicaid group. Hospital stay was longer in patients with Medicaid, though complications were not different between groups.
The mean difference in the magnitude of the curves treated in our study was not more than 10° between patients with and without Medicaid, perhaps explaining the lack of a statistically significant difference in number of levels fused between groups. Although the groups were similar with respect to the percentage requiring posterior column spinal osteotomies, we noted a difference in estimated blood loss between groups, likely explained by the fact that a junior surgeon was added just before initiation of the study period, potentially skewing the estimated blood loss as this surgeon gained experience. Payer status has been correlated to length of hospital stay in children with scoliosis. Vitale and colleagues8 reviewed the effect of payer status on surgical outcomes in 3606 scoliosis patients from a statewide database in California and concluded that, compared with patients having all other payment sources, Medicaid patients had higher odds for complications and longer hospital stay. Our hospital has adopted a highly coordinated care pathway that allows for discharge on postoperative day 2, likely explaining the lack of any difference in postoperative stay.16
The disparity in curve magnitudes among patients with and without private insurance is striking and probably multifactorial. Very likely, the combination of schools with limited screening programs within urban or rural school systems,17 restricted access to pediatricians,18,19 and longer waits to see orthopedic specialists20 all contribute to this disparity. It should be noted that school screening is mandatory in our state. This discrepancy may be related to a previously established tendency in minority populations toward waiting longer to seek care and refusing surgical recommendations, though we were unable to query socioeconomic factors such as race and household income.21,22 It is clearly important to increase access to care for underinsured patients with scoliosis. A comprehensive approach, including providing better education in the schools, establishing communication with referring primary care providers, and increasing access through more physicians or physician extenders, is likely needed. Orthopedists should perhaps treat scoliosis evaluation with the same sense of urgency given to minor fractures, and primary care providers should try to ensure that appropriate referrals for scoliosis are made. Also curious was the shorter travel distance for Medicaid patients versus private insurance patients in this study. We hypothesize this is related to our urban location and its large Medicaid population.
Our study had several limitations. Our electronic medical records (EMR) system does not store data related to the time a patient calls for an initial appointment, limiting our ability to determine how long patients waited for their initial consultation. Furthermore, the decision to undergo surgery is multifactorial and cannot be simplified into time from initial recommendation to surgery, as some patients delay surgery because of school or other obligations. These data should be reasonably consistent over time, as patients seen in the early spring in both groups may delay surgery until the summer, and those diagnosed in June may prefer earlier surgery.
Summary
Children with AIS are at risk for curve progression. Therefore, delays in providing timely care may result in worsening scoliosis. Compared with private insurance patients, Medicaid patients presented with larger curve magnitudes. Further study is needed to better delineate ways to improve care access for patients with scoliosis in communities with larger Medicaid populations.
1. Skaggs DL. Less access to care for children with Medicaid. Orthopedics. 2003;26(12):1184, 1186.
2. Skinner AC, Mayer ML. Effects of insurance status on children’s access to specialty care: a systematic review of the literature. BMC Health Serv Res. 2007;7:194.
3. Iobst C, King W, Baitner A, Tidwell M, Swirsky S, Skaggs DL. Access to care for children with fractures. J Pediatr Orthop. 2010;30(3):244-247.
4. Skaggs DL, Lehmann CL, Rice C, et al. Access to orthopaedic care for children with Medicaid versus private insurance: results of a national survey. J Pediatr Orthop. 2006;26(3):400-404.
5. Skaggs DL, Oda JE, Lerman L, et al. Insurance status and delay in orthotic treatment in children. J Pediatr Orthop. 2007;27(1):94-97.
6. Miyanji F, Slobogean GP, Samdani AF, et al. Is larger scoliosis curve magnitude associated with increased perioperative health-care resource utilization? A multicenter analysis of 325 adolescent idiopathic scoliosis curves. J Bone Joint Surg Am. 2012;94(9):809-813.
7. Nuno M, Drazin DG, Acosta FL Jr. Differences in treatments and outcomes for idiopathic scoliosis patients treated in the United States from 1998 to 2007: impact of socioeconomic variables and ethnicity. Spine J. 2013;13(2):116-123.
8. Vitale MA, Arons RR, Hyman JE, Skaggs DL, Roye DP, Vitale MG. The contribution of hospital volume, payer status, and other factors on the surgical outcomes of scoliosis patients: a review of 3,606 cases in the state of California. J Pediatr Orthop. 2005;25(3):393-399.
9. Goldstein RY, Joiner ER, Skaggs DL. Insurance status does not predict curve magnitude in adolescent idiopathic scoliosis at first presentation to an orthopaedic surgeon. J Pediatr Orthop. 2015;35(1):39-42.
10. Lenke LG, Betz RR, Harms J, et al. Adolescent idiopathic scoliosis: a new classification to determine extent of spinal arthrodesis. J Bone Joint Surg Am. 2001;83(8):1169-1181.
11. Alosh H, Riley LH 3rd, Skolasky RL. Insurance status, geography, race, and ethnicity as predictors of anterior cervical spine surgery rates and in-hospital mortality: an examination of United States trends from 1992 to 2005. Spine. 2009;34(18):1956-1962.
12. Newacheck PW, Hughes DC, Hung YY, Wong S, Stoddard JJ. The unmet health needs of America’s children. Pediatrics. 2000;105(4 pt 2):989-997.
13. Sabharwal S, Zhao C, McClemens E, Kaufmann A. Pediatric orthopaedic patients presenting to a university emergency department after visiting another emergency department: demographics and health insurance status. J Pediatr Orthop. 2007;27(6):690-694.
14. Pierce TR, Mehlman CT, Tamai J, Skaggs DL. Access to care for the adolescent anterior cruciate ligament patient with Medicaid versus private insurance. J Pediatr Orthop. 2012;32(3):245-248.
15. Cho SK, Egorova NN. The association between insurance status and complications, length of stay, and costs for pediatric idiopathic scoliosis. Spine. 2015;40(4):247-256.
16. Fletcher ND, Shourbaji N, Mitchell PM, Oswald TS, Devito DP, Bruce RW Jr. Clinical and economic implications of early discharge following posterior spinal fusion for adolescent idiopathic scoliosis. J Child Orthop. 2014;8(3):257-263.
17. Kasper MJ, Robbins L, Root L, Peterson MG, Allegrante JP. A musculoskeletal outreach screening, treatment, and education program for urban minority children. Arthritis Care Res. 1993;6(3):126-133.
18. Berman S, Dolins J, Tang SF, Yudkowsky B. Factors that influence the willingness of private primary care pediatricians to accept more Medicaid patients. Pediatrics. 2002;110(2 pt 1):239-248.
19. Sommers BD. Protecting low-income children’s access to care: are physician visits associated with reduced patient dropout from Medicaid and the Children’s Health Insurance Program? Pediatrics. 2006;118(1):e36-e42.
20. Bisgaier J, Polsky D, Rhodes KV. Academic medical centers and equity in specialty care access for children. Arch Pediatr Adolesc Med. 2012;166(4):304-310.
21. Sedlis SP, Fisher VJ, Tice D, Esposito R, Madmon L, Steinberg EH. Racial differences in performance of invasive cardiac procedures in a Department of Veterans Affairs medical center. J Clin Epidemiol. 1997;50(8):899-901.
22. Mitchell JB, McCormack LA. Time trends in late-stage diagnosis of cervical cancer. Differences by race/ethnicity and income. Med Care. 1997;35(12):1220-1224.
Is the Orthopedic Fellowship Interview Process Broken? A Survey of Program Directors and Residents
Over the past several decades, an increasing number of orthopedic surgery residents have pursued fellowship training.1 This inclination parallels market trends toward subspecialization.2-5 In 1984, 83% of orthopedics job announcements were for general orthopedists. Twenty-five years later, almost 70% of orthopedic opportunities were for fellowship-trained surgeons.6 Further, between 1990 and 2006, the proportion of practicing orthopedic generalists decreased from 44% to 29%.3 In 2007, the American Academy of Orthopaedic Surgery (AAOS) reported 90% of graduating residents were planning to pursue fellowship training.7 Reasons for the explosion in subspecialty training are plentiful and well documented.2-5 Subspecialty positions now dominate the job market, further reinforcing incentives for residents to pursue fellowship training.
The past several decades have seen numerous changes in the orthopedic fellowship interview process. Early on, it was largely unregulated, dependent on personal and professional connections, and flush with the classic “exploding offer” (residents were given a fellowship offer that expired within hours or days). In the 1980s, as the number of fellowship applications surged, the Accreditation Council for Graduate Medical Education (ACGME) pushed for a more regulated process.8 To further standardize the system, the American Orthopaedic Association (AOA), the AAOS, and several other specialty organizations created the Orthopaedic Fellowship Match Program Initiative in 2008.9 Currently, all orthopedic specialties are represented in either the San Francisco Match Program or National Residency Match Program.
As the system currently stands, postgraduate year 4 (PGY-4) residents are required to interview across the country to secure postgraduate training. This process necessitates residents’ absence from their program, reducing educational opportunities and placing potential continuity-of-care constraints on the residency program. Despite the growing competitiveness for fellowship positions, the increasing number of fellowships available, the rising educational debt of residents, and the limitations of the 80-hour work week, the impact of the interview process on both residents and residency programs has received minimal attention.
We conducted a study to elucidate the impact of the fellowship interview process on residents and residency programs. We hypothesized the time and financial costs for fellowship interviews would be substantial.
Materials and Methods
We obtained institutional review board (IRB) approval for this study. Then, in April 2014, we sent 2 mixed-response questionnaires to orthopedic surgery residency directors and residents. There were 8 items on the director questionnaire and 11 on the resident questionnaire. The surveys were designed to determine the impact of the fellowship interview process on residents and residency programs with respect to finances, time, education, and continuity of care. Each survey had at least 1 free-response question, providing the opportunity to recommend changes to the interview process. The surveys were reviewed and approved by our IRB.
An email was sent to 155 orthopedic surgery program directors or their secretaries. The email asked that the director complete the director questionnaire and that the resident questionnaire be forwarded to senior-level residents, PGY-4s and PGY-5s, who had completed the fellowship interview process. Forty-five (29%) of the 155 directors responded, as did 129 (estimated 9.5%) of an estimated 1354 potential PGY-4s and PGY-5s.10
The Survey Monkey surveys could be completed over a 3-week period. All responses were anonymous. Using Survey Monkey, we aggregated individual responses into predefined clusters before performing statistical analysis. Descriptive statistics were generated with Microsoft Excel.
Results
Survey respondents represented all the orthopedic subspecialties (Table). Seventy-eight percent of residents applied to at least 13 programs (average, 19) (Figure 1). Ninety-two percent received at least 8 interview offers (average, 14). Eighty-three percent attended 8 or more interviews (average, 11). Seventy-one percent of all interviews were granted when requested, and 79% of all interviews were attended when offered.
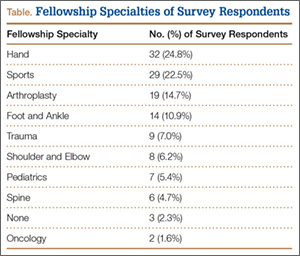
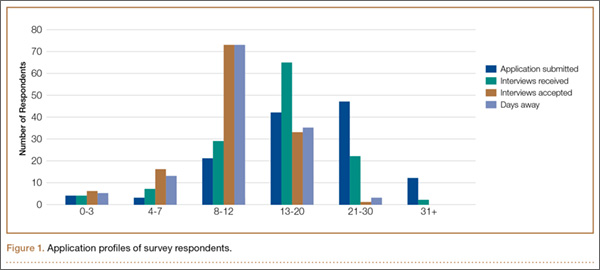
Residents spent an average of $5875 (range, $500-$12,000+) on the fellowship interview process (Figure 2). The highest percentage of respondents, 39.5%, selected an average expense between $4000 and $6000. Forty-nine percent of residents borrowed money (from credit cards, additional loans, family members) to pay their expenses.
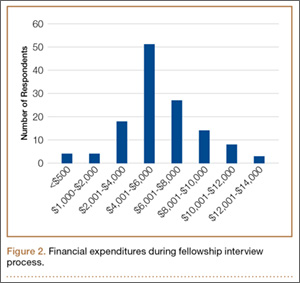
Average number of days away from residency programs was 11, with 86% of residents missing more than 8 days (Figure 1). About one-third of residents reported being away from their home program for almost 2 weeks during the interview season. Further, 74% of residents wanted changes made to the fellowship application process.
Thirty-seven (82%) of the 45 program directors were from academic programs, the other 8 from community-based programs. Average number of residents in programs per year was 4 (73% of the programs had 4-6 residents per year). Respondents rated the disruption caused by residents’ interview absences from 1 (least disruptive) to 10 (most disruptive) (Figure 3); the average rating was over 7 (high level of disruption). Although 9% of directors thought the process caused little or no disruption (rating, 1-3), 62% thought it extremely disruptive (rating, 8-10).
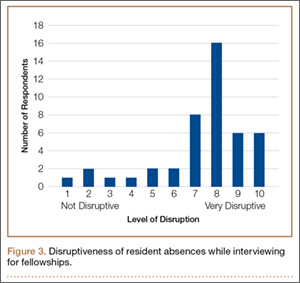
Thirty-one (69%) of the 45 directors agreed that the fellowship interview process should undergo fundamental change. Asked about possible solutions to current complaints, 60% of the directors agreed that interviews should be conducted in a central location. Of the directors who thought fundamental change was needed, 59% indicated AAOS and other specialty societies together should lead the change in the fellowship interview process.
Both residents and program directors were given the opportunity to write in suggestions regarding how to improve the fellowship interview process. Suggestions were made by 85 (66%) of the 129 residents and 24 (53%) of the 45 directors (Appendix).
Discussion
Graduating residents are entering a health care environment in which they must be financially conscious because of increasing education debt and decreasing reimbursement prospects.3 Nevertheless, an overwhelming majority of residents delay entering practice to pursue fellowship training—an estimated opportunity cost of $350,000.3 Minimal attention has been given to the potential costs of the fellowship interview process.
Our study results highlight that time away from residency training, financial costs associated with the fellowship interview process, and disruption of the residency program are substantial. On average, residents applied to 19 programs, received 14 interview offers, attended 11 interviews, were away from residency training 11 days, and spent $5875 on travel. The great majority of both residents and program directors wanted changes in the current paradigm governing the orthopedic fellowship interview process.
It is reasonable to think that the number of days residents spend away on interviews would reduce the time available for education and patient care. Although unknown, it is plausible that residents of programs outside major metropolitan centers and residents who apply to more competitive fellowships may be forced to spend even more time away from training. Outside the focus of this study are the impact that residents’ absence might have on their education and the impact of this absence on the people who do the residents’ work while they are away.
Mean fellowship expense was similar to that reported by residents pursuing a pediatric general surgery fellowship ($6974) or a plastic surgery fellowship ($6100).11,12 Unfortunately, we were unable to determine if average cost is influenced by choice of fellowship specialty or location of residency program. Regardless, fellowship cost may impose an additional financial burden on residents. According to the Association of American Medical Colleges (AAMC), the median salary for PGY-4 residents was $56,380 in 2013. Therefore, on average, the fellowship process consumes more than 10% of a resident’s pretax salary. For perspective, this equates to more than $40,000 for a practicing orthopedic surgeon with a median salary of $413,000.13 With an average medical student graduate debt of $175,000 and continuing decreases in reimbursement, further financial hardships to newly graduating residents cannot be understated.5,11,12
Almost 70% of program directors thought the fellowship process significantly disrupted their program. Reasons given for this disruption mainly involved residents’ time away from the program and the resulting strains placed on maintaining adequate coverage for patient care. The overall disruption score of 7.4 out of 10 was consistent with the great majority thinking that the fellowship process negatively affects their residency program. Altering the fellowship interview process may provide unintended benefits to programs and program directors.
Both program directors and residents communicated that change is needed, but there was little consensus regarding how to effect change and who should lead. This lack of consensus highlights how important it is for the various orthopedic leadership committees to actively and collectively participate in discussions about redefining the system. It has been proposed that it would be ideal for the AOA to lead the change, as the AOA consists of a representative cohort of academic orthopedists and leaders across the spectrum of all fellowship specialties.14 Given the abundant concern of both residents and program directors, we find it prudent to issue a call to arms of sorts to the AAOS and the individual orthopedic subspecialty societies to work together on a common goal that would benefit residents, programs, and subspecialties within orthopedics.
In trying to understand the challenges that residents, program directors, and programs face, as well as the inherent complexity of the current system, we incorporated respondents’ write-in comments into suggested ways of improving the fellowship interview process. These comments had broad perspectives but overall were consistent with the survey results (Appendix).
Technology
Health care is continually finding new ways to take advantage of technological advances. This is occurring with the fellowship interview schema. Numerous disciplines are using videoconferencing platforms (eg, Skype) to conduct interviews. This practice is becoming more commonplace in the business sector. In a recent survey, more than 60% of human resource managers reported conducting video interviews.15 Two independent residency programs have used video interviews with mixed success.16,17
Another technological change requested by residents is the creation and updating of fellowship web pages with standardized information. Such a service may prove useful to residents researching a program and may even lead to limiting the number of programs residents apply to, as they may be able to dial in on exactly what distinguishes one program from another before traveling for an interview. A recent study of orthopedic sports medicine fellowship programs found that most of these programs lacked pertinent information on their websites.18 Important information regarding case logs from current and former fellows; number of faculty, residents, and fellows; and schedules and facilities of interview sites are a few of the online data points that may help residents differentiate particular programs.19,20 Questions like these are often asked at interviews and site visits. Having accurate information easily available online may reduce or eliminate the need to travel to a site for such information. Standardizing information would also increase transparency among available fellowships. Although not specifically mentioned, organizational software that improves the productivity of the process may help limit the large number of programs applied to, the interviews offered and attended, the days away, and the financial costs without reducing the match rate.
Timing and Location
The issue of timing—with respect to geographical or meteorological concerns—was another recurring theme among respondents. Numerous respondents indicated that certain programs located in geographic proximity tried to minimize travel by offering interviews around the same time. This coordination potentially minimizes travel expenses and time away from the residency program by allowing residents to interview at multiple locations during a single trip per region. The sports medicine fellowship process was identified as a good example of aligning interviews based on geography. Several respondents suggested an option that also reflects the practice of nonsurgical fellowships—delaying the interview season to bypass potential weather concerns. Winter 2013–2014 saw the most flight delays or cancellations in more than a decade; about 50% of all flights scheduled between December and February were delayed or canceled.21 Beyond the additional factor of more time away or missing an interview because of the weather are safety concerns related to the weather. One resident reported having a motor vehicle accident while traveling to an interview in poor weather conditions (Appendix).
National Meetings
Each orthopedic subspecialty has numerous national meetings. Many programs offer applicants the opportunity to interview at these meetings. One respondent mentioned that the annual meeting of the Orthopaedic Trauma Association offers trauma applicants the opportunity to interview with multiple programs. It might be beneficial to endorse this practice on a larger scale to help reduce travel and time away. We recognize that visiting individual programs is an important aspect of the match process, but doing so on a targeted level may make more sense, increasing financial efficiency and reducing time away from programs.
Proposed Solution
A combined proposed solution that can be implemented without a radical overhaul or significant investments might involve moving the interview season to early spring, switching to a 2-tiered system with a centralized first round of interview screening coinciding with subspecialty national meetings or the AAOS annual meeting, and standardizing online information for all orthopedic fellowship programs. A 2-tiered interview process would allow programs and candidates to obtain exposure to a significant number of programs in the first round without incurring significant costs and then would impose a cap on the number of programs to visit. This would level the playing field between candidates with more time and money and candidates who are more constrained in their training environment and finances. A stopgap or adjunct to residents or fellowship programs unable to attend a centralized meeting would be to combine technological tools, such as Internet-based videoconferencing (Skype), before site visits by residents. After this first round of introductions and interviews, residents could then decide on a limited number of programs to formally visit, attend, and ultimately rank. This proposed system would still be able to function within the confines of the match, and it would benefit from the protections offered to residents and programs. Although capping the number of interviews attended by residents clearly can lower costs across the board, we recognize the difficulty of enforcing such a requirement. These potential changes to the system are not exhaustive, and we hope this work will serve as a springboard to further discussion.
Our study had several inherent weaknesses. Our data came from survey responses, which reflect the perspectives only of the responding residents and program directors. Unfortunately, a small number of orthopedic residents responded to this survey, so there was a potential for bias. However, we think the central themes discovered in this survey are only echoes of the concerns of the larger population of residents and program directors. Our hope in designing such a study was to bring to light some of the discrepancies in the fellowship interview process, the goal being to stimulate interest among the orthopedic leadership representing future orthopedic surgeons. More study is needed to clarify if these issues are reflective of a larger segment of residents and program directors. In addition, action may be needed to fully elucidate the intricate interworking of the fellowship process in order to maximize the interest of the orthopedic surgeons who are seeking fellowship training. Another study limitation was the potential for recall bias in the more senior PGY-5 residents, who were further from the interview process than PGY-4 respondents were. Because of the need for anonymity with the surveys, we could not link some findings (eg, program impact, cost, time away) to individual programs or different specialty fellowships. Although it appears there is a desire for a more cost-effective system, given the financial pressures on medical students and residents, the desire to match increases costs because students are likely to attend more interviews than actually needed. Our proposed solution does not take into account residents’ behavior with respect to the current match system. For example, the prevailing thought is that interviewing at more programs increases the likelihood of matching into a desired subspecialty. Despite these study limitations, we think our results identified important points for discussion, investigation, and potential action by orthopedic leadership.
Conclusion
The challenge of critiquing and improving the orthopedic fellowship process requires the same courageous leadership that was recommended almost a decade ago.14 In this study, we tried to elucidate the impact of the PGY-4 fellowship interview process with respect to residents and residency programs. Our results highlight that time away from residency training, financial costs associated with the fellowship interview process, and disruption of the residency program are substantial and that both residents and program directors want changes made. Leadership needs to further investigate alternatives to the current process to lessen the impact on all parties in this important process.
1. Simon MA. Evolution of the present status of orthopaedic surgery fellowships. J Bone Joint Surg Am. 1998;80(12):1826-1829.
2. Brunworth LS, Chintalapani SR, Gray RR, Cardoso R, Owens PW. Resident selection of hand surgery fellowships: a survey of the 2011, 2012, and 2013 hand fellowship graduates. Hand. 2013;8(2):164-171.
3. Gaskill T, Cook C, Nunley J, Mather RC. The financial impact of orthopaedic fellowship training. J Bone Joint Surg Am. 2009;91(7):1814-1821.
4. Sarmiento A. Additional thoughts on orthopedic residency and fellowships. Orthopedics. 2010;33(10):712-713.
5. Griffin SM, Stoneback JW. Navigating the Orthopaedic Trauma Fellowship Match from a candidate’s perspective. J Orthop Trauma. 2011;25(suppl 3):S101-S103.
6. Morrell NT, Mercer DM, Moneim MS. Trends in the orthopedic job market and the importance of fellowship subspecialty training. Orthopedics. 2012;35(4):e555-e560.
7. Iorio R, Robb WJ, Healy WL, et al. Orthopaedic surgeon workforce and volume assessment for total hip and knee replacement in the United States: preparing for an epidemic. J Bone Joint Surg Am. 2008;90(7):1598-1605.
8. Emery SE, Guss D, Kuremsky MA, Hamlin BR, Herndon JH, Rubash HE. Resident education versus fellowship training—conflict or synergy? AOA critical issues. J Bone Joint Surg Am. 2012;94(21):e159.
9. Harner CD, Ranawat AS, Niederle M, et al. AOA symposium. Current state of fellowship hiring: is a universal match necessary? Is it possible? J Bone Joint Surg Am. 2008;90(6):1375-1384.
10. Ranawat A, Nunley RM, Genuario JW, Sharan AD, Mehta S; Washington Health Policy Fellows. Current state of the fellowship hiring process: Are we in 1957 or 2007? AAOS Now. 2007;1(8).
11. Little DC, Yoder SM, Grikscheit TC, et al. Cost considerations and applicant characteristics for the Pediatric Surgery Match. J Pediatr Surg. 2005;40(1):69-73.
12. Claiborne JR, Crantford JC, Swett KR, David LR. The Plastic Surgery Match: predicting success and improving the process. Ann Plast Surg. 2013;70(6):698-703.
13. Kane L, Peckham C. Medscape Physician Compensation Report 2014. http://www.medscape.com/features/slideshow/compensation/2014/public/overview. Published April 15, 2014. Accessed September 26, 2015.
14. Swiontkowski MF. A simple formula for continued improvement in orthopaedic surgery postgraduate training: courageous leadership. J Bone Joint Surg Am. 2008;90(6):1175.
15. Survey: six in 10 companies conduct video job interviews [news release]. http://www.prnewswire.com/news-releases/survey-six-in-10-companies-conduct-video-job-interviews-167973406.html. Published August 30, 2012. Accessed September 26, 2015.
16. Kerfoot BP, Asher KP, McCullough DL. Financial and educational costs of the residency interview process for urology applicants. Urology. 2008;71(6):990-994.
17. Edje L, Miller C, Kiefer J, Oram D. Using Skype as an alternative for residency selection interviews. J Grad Med Educ. 2013;5(3):503-505.
18. Mulcahey MK, Gosselin MM, Fadale PD. Evaluation of the content and accessibility of web sites for accredited orthopaedic sports medicine fellowships. J Bone Joint Surg Am. 2013;95(12):e85.
19. Gaeta TJ, Birkhahn RH, Lamont D, Banga N, Bove JJ. Aspects of residency programs’ web sites important to student applicants. Acad Emerg Med. 2005;12(1):89-92.
20. Mahler SA, Wagner MJ, Church A, Sokolosky M, Cline DM. Importance of residency program web sites to emergency medicine applicants. J Emerg Med. 2009;36(1):83-88.
21. Davies A. Winter’s toll: 1 million flights cancelled or delayed, costing travelers $5.3 billion. Business Insider. http://www.businessinsider.com/winter-flights-cancelled-delayed-cost-2014-3. Published March 3, 2014. Accessed September 26, 2015.
Over the past several decades, an increasing number of orthopedic surgery residents have pursued fellowship training.1 This inclination parallels market trends toward subspecialization.2-5 In 1984, 83% of orthopedics job announcements were for general orthopedists. Twenty-five years later, almost 70% of orthopedic opportunities were for fellowship-trained surgeons.6 Further, between 1990 and 2006, the proportion of practicing orthopedic generalists decreased from 44% to 29%.3 In 2007, the American Academy of Orthopaedic Surgery (AAOS) reported 90% of graduating residents were planning to pursue fellowship training.7 Reasons for the explosion in subspecialty training are plentiful and well documented.2-5 Subspecialty positions now dominate the job market, further reinforcing incentives for residents to pursue fellowship training.
The past several decades have seen numerous changes in the orthopedic fellowship interview process. Early on, it was largely unregulated, dependent on personal and professional connections, and flush with the classic “exploding offer” (residents were given a fellowship offer that expired within hours or days). In the 1980s, as the number of fellowship applications surged, the Accreditation Council for Graduate Medical Education (ACGME) pushed for a more regulated process.8 To further standardize the system, the American Orthopaedic Association (AOA), the AAOS, and several other specialty organizations created the Orthopaedic Fellowship Match Program Initiative in 2008.9 Currently, all orthopedic specialties are represented in either the San Francisco Match Program or National Residency Match Program.
As the system currently stands, postgraduate year 4 (PGY-4) residents are required to interview across the country to secure postgraduate training. This process necessitates residents’ absence from their program, reducing educational opportunities and placing potential continuity-of-care constraints on the residency program. Despite the growing competitiveness for fellowship positions, the increasing number of fellowships available, the rising educational debt of residents, and the limitations of the 80-hour work week, the impact of the interview process on both residents and residency programs has received minimal attention.
We conducted a study to elucidate the impact of the fellowship interview process on residents and residency programs. We hypothesized the time and financial costs for fellowship interviews would be substantial.
Materials and Methods
We obtained institutional review board (IRB) approval for this study. Then, in April 2014, we sent 2 mixed-response questionnaires to orthopedic surgery residency directors and residents. There were 8 items on the director questionnaire and 11 on the resident questionnaire. The surveys were designed to determine the impact of the fellowship interview process on residents and residency programs with respect to finances, time, education, and continuity of care. Each survey had at least 1 free-response question, providing the opportunity to recommend changes to the interview process. The surveys were reviewed and approved by our IRB.
An email was sent to 155 orthopedic surgery program directors or their secretaries. The email asked that the director complete the director questionnaire and that the resident questionnaire be forwarded to senior-level residents, PGY-4s and PGY-5s, who had completed the fellowship interview process. Forty-five (29%) of the 155 directors responded, as did 129 (estimated 9.5%) of an estimated 1354 potential PGY-4s and PGY-5s.10
The Survey Monkey surveys could be completed over a 3-week period. All responses were anonymous. Using Survey Monkey, we aggregated individual responses into predefined clusters before performing statistical analysis. Descriptive statistics were generated with Microsoft Excel.
Results
Survey respondents represented all the orthopedic subspecialties (Table). Seventy-eight percent of residents applied to at least 13 programs (average, 19) (Figure 1). Ninety-two percent received at least 8 interview offers (average, 14). Eighty-three percent attended 8 or more interviews (average, 11). Seventy-one percent of all interviews were granted when requested, and 79% of all interviews were attended when offered.
Residents spent an average of $5875 (range, $500-$12,000+) on the fellowship interview process (Figure 2). The highest percentage of respondents, 39.5%, selected an average expense between $4000 and $6000. Forty-nine percent of residents borrowed money (from credit cards, additional loans, family members) to pay their expenses.
Average number of days away from residency programs was 11, with 86% of residents missing more than 8 days (Figure 1). About one-third of residents reported being away from their home program for almost 2 weeks during the interview season. Further, 74% of residents wanted changes made to the fellowship application process.
Thirty-seven (82%) of the 45 program directors were from academic programs, the other 8 from community-based programs. Average number of residents in programs per year was 4 (73% of the programs had 4-6 residents per year). Respondents rated the disruption caused by residents’ interview absences from 1 (least disruptive) to 10 (most disruptive) (Figure 3); the average rating was over 7 (high level of disruption). Although 9% of directors thought the process caused little or no disruption (rating, 1-3), 62% thought it extremely disruptive (rating, 8-10).
Thirty-one (69%) of the 45 directors agreed that the fellowship interview process should undergo fundamental change. Asked about possible solutions to current complaints, 60% of the directors agreed that interviews should be conducted in a central location. Of the directors who thought fundamental change was needed, 59% indicated AAOS and other specialty societies together should lead the change in the fellowship interview process.
Both residents and program directors were given the opportunity to write in suggestions regarding how to improve the fellowship interview process. Suggestions were made by 85 (66%) of the 129 residents and 24 (53%) of the 45 directors (Appendix).
Discussion
Graduating residents are entering a health care environment in which they must be financially conscious because of increasing education debt and decreasing reimbursement prospects.3 Nevertheless, an overwhelming majority of residents delay entering practice to pursue fellowship training—an estimated opportunity cost of $350,000.3 Minimal attention has been given to the potential costs of the fellowship interview process.
Our study results highlight that time away from residency training, financial costs associated with the fellowship interview process, and disruption of the residency program are substantial. On average, residents applied to 19 programs, received 14 interview offers, attended 11 interviews, were away from residency training 11 days, and spent $5875 on travel. The great majority of both residents and program directors wanted changes in the current paradigm governing the orthopedic fellowship interview process.
It is reasonable to think that the number of days residents spend away on interviews would reduce the time available for education and patient care. Although unknown, it is plausible that residents of programs outside major metropolitan centers and residents who apply to more competitive fellowships may be forced to spend even more time away from training. Outside the focus of this study are the impact that residents’ absence might have on their education and the impact of this absence on the people who do the residents’ work while they are away.
Mean fellowship expense was similar to that reported by residents pursuing a pediatric general surgery fellowship ($6974) or a plastic surgery fellowship ($6100).11,12 Unfortunately, we were unable to determine if average cost is influenced by choice of fellowship specialty or location of residency program. Regardless, fellowship cost may impose an additional financial burden on residents. According to the Association of American Medical Colleges (AAMC), the median salary for PGY-4 residents was $56,380 in 2013. Therefore, on average, the fellowship process consumes more than 10% of a resident’s pretax salary. For perspective, this equates to more than $40,000 for a practicing orthopedic surgeon with a median salary of $413,000.13 With an average medical student graduate debt of $175,000 and continuing decreases in reimbursement, further financial hardships to newly graduating residents cannot be understated.5,11,12
Almost 70% of program directors thought the fellowship process significantly disrupted their program. Reasons given for this disruption mainly involved residents’ time away from the program and the resulting strains placed on maintaining adequate coverage for patient care. The overall disruption score of 7.4 out of 10 was consistent with the great majority thinking that the fellowship process negatively affects their residency program. Altering the fellowship interview process may provide unintended benefits to programs and program directors.
Both program directors and residents communicated that change is needed, but there was little consensus regarding how to effect change and who should lead. This lack of consensus highlights how important it is for the various orthopedic leadership committees to actively and collectively participate in discussions about redefining the system. It has been proposed that it would be ideal for the AOA to lead the change, as the AOA consists of a representative cohort of academic orthopedists and leaders across the spectrum of all fellowship specialties.14 Given the abundant concern of both residents and program directors, we find it prudent to issue a call to arms of sorts to the AAOS and the individual orthopedic subspecialty societies to work together on a common goal that would benefit residents, programs, and subspecialties within orthopedics.
In trying to understand the challenges that residents, program directors, and programs face, as well as the inherent complexity of the current system, we incorporated respondents’ write-in comments into suggested ways of improving the fellowship interview process. These comments had broad perspectives but overall were consistent with the survey results (Appendix).
Technology
Health care is continually finding new ways to take advantage of technological advances. This is occurring with the fellowship interview schema. Numerous disciplines are using videoconferencing platforms (eg, Skype) to conduct interviews. This practice is becoming more commonplace in the business sector. In a recent survey, more than 60% of human resource managers reported conducting video interviews.15 Two independent residency programs have used video interviews with mixed success.16,17
Another technological change requested by residents is the creation and updating of fellowship web pages with standardized information. Such a service may prove useful to residents researching a program and may even lead to limiting the number of programs residents apply to, as they may be able to dial in on exactly what distinguishes one program from another before traveling for an interview. A recent study of orthopedic sports medicine fellowship programs found that most of these programs lacked pertinent information on their websites.18 Important information regarding case logs from current and former fellows; number of faculty, residents, and fellows; and schedules and facilities of interview sites are a few of the online data points that may help residents differentiate particular programs.19,20 Questions like these are often asked at interviews and site visits. Having accurate information easily available online may reduce or eliminate the need to travel to a site for such information. Standardizing information would also increase transparency among available fellowships. Although not specifically mentioned, organizational software that improves the productivity of the process may help limit the large number of programs applied to, the interviews offered and attended, the days away, and the financial costs without reducing the match rate.
Timing and Location
The issue of timing—with respect to geographical or meteorological concerns—was another recurring theme among respondents. Numerous respondents indicated that certain programs located in geographic proximity tried to minimize travel by offering interviews around the same time. This coordination potentially minimizes travel expenses and time away from the residency program by allowing residents to interview at multiple locations during a single trip per region. The sports medicine fellowship process was identified as a good example of aligning interviews based on geography. Several respondents suggested an option that also reflects the practice of nonsurgical fellowships—delaying the interview season to bypass potential weather concerns. Winter 2013–2014 saw the most flight delays or cancellations in more than a decade; about 50% of all flights scheduled between December and February were delayed or canceled.21 Beyond the additional factor of more time away or missing an interview because of the weather are safety concerns related to the weather. One resident reported having a motor vehicle accident while traveling to an interview in poor weather conditions (Appendix).
National Meetings
Each orthopedic subspecialty has numerous national meetings. Many programs offer applicants the opportunity to interview at these meetings. One respondent mentioned that the annual meeting of the Orthopaedic Trauma Association offers trauma applicants the opportunity to interview with multiple programs. It might be beneficial to endorse this practice on a larger scale to help reduce travel and time away. We recognize that visiting individual programs is an important aspect of the match process, but doing so on a targeted level may make more sense, increasing financial efficiency and reducing time away from programs.
Proposed Solution
A combined proposed solution that can be implemented without a radical overhaul or significant investments might involve moving the interview season to early spring, switching to a 2-tiered system with a centralized first round of interview screening coinciding with subspecialty national meetings or the AAOS annual meeting, and standardizing online information for all orthopedic fellowship programs. A 2-tiered interview process would allow programs and candidates to obtain exposure to a significant number of programs in the first round without incurring significant costs and then would impose a cap on the number of programs to visit. This would level the playing field between candidates with more time and money and candidates who are more constrained in their training environment and finances. A stopgap or adjunct to residents or fellowship programs unable to attend a centralized meeting would be to combine technological tools, such as Internet-based videoconferencing (Skype), before site visits by residents. After this first round of introductions and interviews, residents could then decide on a limited number of programs to formally visit, attend, and ultimately rank. This proposed system would still be able to function within the confines of the match, and it would benefit from the protections offered to residents and programs. Although capping the number of interviews attended by residents clearly can lower costs across the board, we recognize the difficulty of enforcing such a requirement. These potential changes to the system are not exhaustive, and we hope this work will serve as a springboard to further discussion.
Our study had several inherent weaknesses. Our data came from survey responses, which reflect the perspectives only of the responding residents and program directors. Unfortunately, a small number of orthopedic residents responded to this survey, so there was a potential for bias. However, we think the central themes discovered in this survey are only echoes of the concerns of the larger population of residents and program directors. Our hope in designing such a study was to bring to light some of the discrepancies in the fellowship interview process, the goal being to stimulate interest among the orthopedic leadership representing future orthopedic surgeons. More study is needed to clarify if these issues are reflective of a larger segment of residents and program directors. In addition, action may be needed to fully elucidate the intricate interworking of the fellowship process in order to maximize the interest of the orthopedic surgeons who are seeking fellowship training. Another study limitation was the potential for recall bias in the more senior PGY-5 residents, who were further from the interview process than PGY-4 respondents were. Because of the need for anonymity with the surveys, we could not link some findings (eg, program impact, cost, time away) to individual programs or different specialty fellowships. Although it appears there is a desire for a more cost-effective system, given the financial pressures on medical students and residents, the desire to match increases costs because students are likely to attend more interviews than actually needed. Our proposed solution does not take into account residents’ behavior with respect to the current match system. For example, the prevailing thought is that interviewing at more programs increases the likelihood of matching into a desired subspecialty. Despite these study limitations, we think our results identified important points for discussion, investigation, and potential action by orthopedic leadership.
Conclusion
The challenge of critiquing and improving the orthopedic fellowship process requires the same courageous leadership that was recommended almost a decade ago.14 In this study, we tried to elucidate the impact of the PGY-4 fellowship interview process with respect to residents and residency programs. Our results highlight that time away from residency training, financial costs associated with the fellowship interview process, and disruption of the residency program are substantial and that both residents and program directors want changes made. Leadership needs to further investigate alternatives to the current process to lessen the impact on all parties in this important process.
1. Simon MA. Evolution of the present status of orthopaedic surgery fellowships. J Bone Joint Surg Am. 1998;80(12):1826-1829.
2. Brunworth LS, Chintalapani SR, Gray RR, Cardoso R, Owens PW. Resident selection of hand surgery fellowships: a survey of the 2011, 2012, and 2013 hand fellowship graduates. Hand. 2013;8(2):164-171.
3. Gaskill T, Cook C, Nunley J, Mather RC. The financial impact of orthopaedic fellowship training. J Bone Joint Surg Am. 2009;91(7):1814-1821.
4. Sarmiento A. Additional thoughts on orthopedic residency and fellowships. Orthopedics. 2010;33(10):712-713.
5. Griffin SM, Stoneback JW. Navigating the Orthopaedic Trauma Fellowship Match from a candidate’s perspective. J Orthop Trauma. 2011;25(suppl 3):S101-S103.
6. Morrell NT, Mercer DM, Moneim MS. Trends in the orthopedic job market and the importance of fellowship subspecialty training. Orthopedics. 2012;35(4):e555-e560.
7. Iorio R, Robb WJ, Healy WL, et al. Orthopaedic surgeon workforce and volume assessment for total hip and knee replacement in the United States: preparing for an epidemic. J Bone Joint Surg Am. 2008;90(7):1598-1605.
8. Emery SE, Guss D, Kuremsky MA, Hamlin BR, Herndon JH, Rubash HE. Resident education versus fellowship training—conflict or synergy? AOA critical issues. J Bone Joint Surg Am. 2012;94(21):e159.
9. Harner CD, Ranawat AS, Niederle M, et al. AOA symposium. Current state of fellowship hiring: is a universal match necessary? Is it possible? J Bone Joint Surg Am. 2008;90(6):1375-1384.
10. Ranawat A, Nunley RM, Genuario JW, Sharan AD, Mehta S; Washington Health Policy Fellows. Current state of the fellowship hiring process: Are we in 1957 or 2007? AAOS Now. 2007;1(8).
11. Little DC, Yoder SM, Grikscheit TC, et al. Cost considerations and applicant characteristics for the Pediatric Surgery Match. J Pediatr Surg. 2005;40(1):69-73.
12. Claiborne JR, Crantford JC, Swett KR, David LR. The Plastic Surgery Match: predicting success and improving the process. Ann Plast Surg. 2013;70(6):698-703.
13. Kane L, Peckham C. Medscape Physician Compensation Report 2014. http://www.medscape.com/features/slideshow/compensation/2014/public/overview. Published April 15, 2014. Accessed September 26, 2015.
14. Swiontkowski MF. A simple formula for continued improvement in orthopaedic surgery postgraduate training: courageous leadership. J Bone Joint Surg Am. 2008;90(6):1175.
15. Survey: six in 10 companies conduct video job interviews [news release]. http://www.prnewswire.com/news-releases/survey-six-in-10-companies-conduct-video-job-interviews-167973406.html. Published August 30, 2012. Accessed September 26, 2015.
16. Kerfoot BP, Asher KP, McCullough DL. Financial and educational costs of the residency interview process for urology applicants. Urology. 2008;71(6):990-994.
17. Edje L, Miller C, Kiefer J, Oram D. Using Skype as an alternative for residency selection interviews. J Grad Med Educ. 2013;5(3):503-505.
18. Mulcahey MK, Gosselin MM, Fadale PD. Evaluation of the content and accessibility of web sites for accredited orthopaedic sports medicine fellowships. J Bone Joint Surg Am. 2013;95(12):e85.
19. Gaeta TJ, Birkhahn RH, Lamont D, Banga N, Bove JJ. Aspects of residency programs’ web sites important to student applicants. Acad Emerg Med. 2005;12(1):89-92.
20. Mahler SA, Wagner MJ, Church A, Sokolosky M, Cline DM. Importance of residency program web sites to emergency medicine applicants. J Emerg Med. 2009;36(1):83-88.
21. Davies A. Winter’s toll: 1 million flights cancelled or delayed, costing travelers $5.3 billion. Business Insider. http://www.businessinsider.com/winter-flights-cancelled-delayed-cost-2014-3. Published March 3, 2014. Accessed September 26, 2015.