User login
Assessment of Glucagon-like Peptide-1 Receptor Agonists in Veterans TakingBasal/Bolus Insulin Regimens
In 2019, diabetes mellitus (DM) was the seventh leading cause of death in the United States, and currently, about 11% of the American population has a DM diagnosis.1 Most have a diagnosis of type 2 diabetes (T2DM), which has a strong genetic predisposition, and the risk of developing T2DM increases with age, obesity, and lack of physical activity.1,2 Nearly one-quarter of veterans have a diagnosis of DM, and DM is the leading cause of comorbidities, such as blindness, end-stage renal disease, and amputation for patients receiving care from the Veterans Health Administration (VHA).2 The elevated incidence of DM in the veteran population is attributed to a variety of factors, including exposure to herbicides, such as Agent Orange, advanced age, increased risk of obesity, and limited access to high-quality food.3
After diagnosis, both the American Diabetes Association (ADA) and the American Association of Clinical Endocrinologists and American College of Endocrinology (AACE/ACE) emphasize the appropriate use of lifestyle management and pharmacologic therapy for DM care. The use of pharmacologic agents (oral medications, insulin, or noninsulin injectables) is often determined by efficacy, cost, potential adverse effects (AEs), and patient factors and comorbidities.4,5
The initial recommendation for pharmacologic treatment for T2DM differs slightly between expert guidelines. The ADA and AACE/ACE recommend any of the following as initial monotherapy, listed in order to represent a hierarchy of usage: metformin, glucagon-like peptide-1 receptor agonists (GLP-1 RAs), sodium-glucose cotransporter 2 (SGLT-2) inhibitors, or dipeptidyl peptidase-4 (DPP-4) inhibitors, with the first 3 agents carrying the strongest recommendations.4,5 For patients with established atherosclerotic cardiovascular disease (CVD), chronic kidney disease, or heart failure, it is recommended to start a long-acting GLP-1 RA or SGLT-2 inhibitor. For patients with T2DM and hemoglobin A1c (HbA1c) between 7.5% and 9.0% at diagnosis, the AACE/ACE recommend initiation of dual therapy using metformin alongside another first-line agent and recommend the addition of another antidiabetic agent if glycemic goals are not met after regular follow-up. AACE/ACE recommend the consideration of insulin therapy in symptomatic patients with HbA1c > 9.0%.5 In contrast, the ADA recommends metformin as first-line therapy for all patients with T2DM and recommends dual therapy using metformin and another preferred agent (selection based on comorbidities) when HbA1c is 1.5% to 2% above target. The ADA recommends the consideration of insulin with HbA1c > 10% or with evidence of ongoing catabolism or symptoms of hyperglycemia.4 There are several reasons why insulin may be initiated prior to GLP-1 RAs, including profound hyperglycemia at time of diagnosis or implementation of insulin agents prior to commercial availability of GLP-1 RA.
GLP-1 RAs are analogs of the hormone incretin, which increases glucose-dependent insulin secretion, decreases postprandial glucagon secretion, increases satiety, and slows gastric emptying.6,7 When used in combination with noninsulin agents, GLP-1 RAs have demonstrated HbA1c reductions of 0.5% to 1.5%.8 The use of GLP-1 RAs with basal insulin also has been studied extensively.6,8-10 When the combination of GLP-1 RAs and basal insulin was compared with basal/bolus insulin regimens, the use of the GLP-1 RAs resulted in lower HbA1c levels and lower incidence of hypoglycemia.6,9 Data have demonstrated the complementary mechanisms of using basal insulin and GLP 1 RAs in decreasing HbA1c levels, insulin requirements, and weight compared with using basal insulin monotherapy and basal/bolus combinations.6,9-13 Moreover, 3 GLP-1 RA medications currently on the market (liraglutide, dulaglutide, and semaglutide) have displayed cardiovascular and renal benefits, further supporting the use of these medications.2,5
Despite these benefits, GLP-1 RAs may have bothersome AEs and are associated with a high cost.6 In addition, some studies have found that as the length of therapy increases, the positive effects of these agents may diminish.9,11 In one study, which looked at the impact of the addition of exenatide to patients taking basal or basal/bolus insulin regimens, mean changes in weight were −2.4 kg at 0 to 6 months, −4.3 kg at 6 to 12 months, −6.2 kg at 12 to 18 months, and −5.5 kg at 18 to 27 months. After 18 months, an increase in weight was observed, but the increase remained lower than baseline.11 Another study, conducted over 12 months, found no significant decrease in weight or total daily dose (TDD) of insulin when exenatide or liraglutide were added to various insulin regimens (basal or basal/bolus).13 To date, minimal published data exist regarding the addition of newer GLP-1 RAs and the long-term use of these agents beyond 12 months in patients taking basal/bolus insulin regimens. The primary goal of this study was to evaluate the effect of adding GLP-1 RAs to basal/bolus insulin regimens over a 24-month period.
Methods
This study was a retrospective, electronic health record review of all patients on basal and bolus insulin regimens who received additional therapy with a GLP-1 RA at Veteran Health Indiana in Indianapolis from September 1, 2015, to June 30, 2019. Patients meeting inclusion criteria served as their own control. The primary outcome was change in HbA1c at 3, 6, 12, 18, and 24 months after initiation of the GLP-1 RA. Secondary outcomes included change in weight and TDD of insulin at 3, 6, 12, 18, and 24 months after the initiation of the GLP-1 RAs and incidence of patient-reported or laboratory-confirmed hypoglycemia and other AEs.
Patients were included if they were aged ≥ 18 years with a diagnosis of T2DM, had concomitant prescriptions for both a basal insulin (glargine, detemir, or NPH) and a bolus insulin (aspart, lispro, or regular) before receiving add-on therapy with a GLP-1 RA (exenatide, liraglutide, albiglutide, lixisenatide, dulaglutide, or semaglutide) from September 1, 2015, to June 30, 2019, and had baseline and subsequent Hb A1c measurements available in the electronic health record. Patients were excluded if they had a diagnosis of T1DM, were followed by an outside clinician for DM care, or if the GLP-1 RA was discontinued before subsequent HbA1c measurement. The study protocol was approved by the Research and Development Office of Veteran Health Indiana, and the project was deemed exempt from review by the Indiana University Institutional Review Board due to the retrospective nature of the study.
Data analysis was performed using Excel. Change from baseline for each interval was computed, and 1 sample t tests (2-tailed) compared change from baseline to no change. Due to the disparity in the number of patients with data available at each of the time intervals, a mean plot was presented for each group of patients within each interval, allowing mean changes in individual groups to be observed over time.
Results
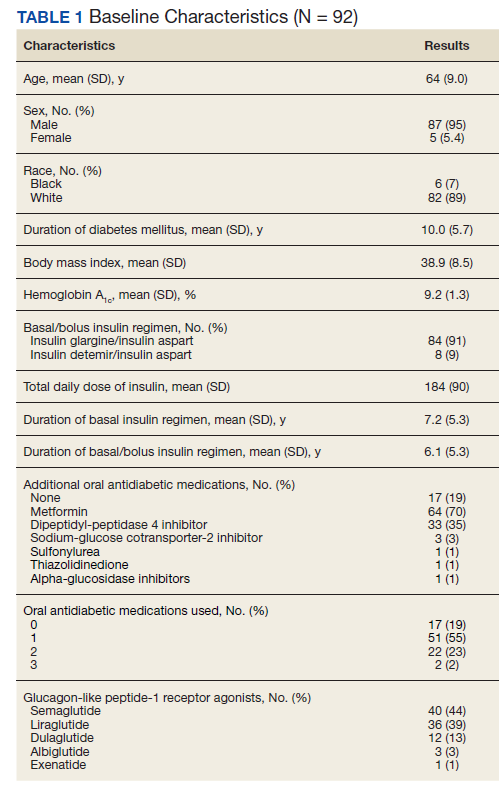
One hundred twenty-three subjects met inclusion criteria; 16 patients were excluded due to GLP-1 RA discontinuation before follow-up measurement of HbA1c; 14 were excluded due to patients being managed by a clinician outside of the facility; 1 patient was excluded for lack of documentation regarding baseline and subsequent insulin doses. Ninety-two patient charts were reviewed. Participants had a mean age of 64 years, 95% were male, and 89% were White. Mean baseline Hb A1c was 9.2%, mean body mass index was 38.9, and the mean TDD of insulin was 184 units. Mean duration of DM was 10 years, and mean use of basal/bolus insulin regimen was 6.1 years. Most participants (91%) used an insulin regimen containing insulin glargine and insulin aspart; the remaining participants used insulin detemir and insulin aspart. Semaglutide and liraglutide were the most commonly used GLP-1 RAs (44% and 39%, respectively) (Table 1).
![]()
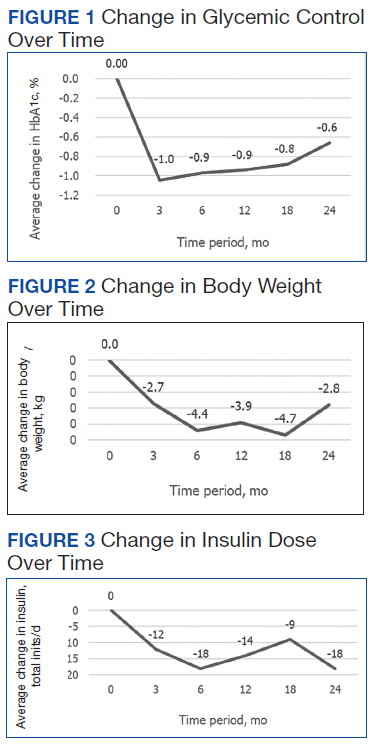
Since some patients switched between GLP-1 RAs throughout the study and there was variation in timing of laboratory and clinic follow-up, a different number of patient charts were available for review at each period (Table 2). Glycemic control was significantly improved at all time points when compared with baseline, but over time the benefit declined. The mean change in HbA1c was −1.1% (95% CI, −1.3 to −0.8; P < .001) at 3 months; −1.0% (95% CI, −1.3 to −0.7; P < .001) at 6 months; −0.9% (95% CI, −1.3 to −0.6; P < .001) at 12 months; −0.9% (95% CI −1.4 to −0.3; P = .002) at 18 months; and −0.7% (95% CI, −1.4 to 0.1; P = .07) at 24 months (Figure 1). Mean weight decreased from baseline −2.7 kg (95% CI, −3.7 to −1.6; P < .001); −4.4 kg (95% CI −5.7 to −3.2; P < .001) at 6 months; −3.9 kg (95% CI −6.0 to −1.9; P < .001) at 12 months; −4.7 kg (95% CI −6.7 to −2.6; P < .001) at 18 months; and −2.8 kg (95% CI, −5.9 to 0.3; P = .07) at 24 months (Figure 2). Mean TDD decreased at 3 months −12 units (95% CI, −19 to −5; P < .001); −18 units (95% CI, −27 to −9; P < .001) at 6 months; −14 units (95% CI, −24 to −5; P = .004) at 12 months; −9 units (95% CI, −21 to 3; P = .15) at 18 months; and −18 units (95% CI, −43 to 5 units; P = .12) at 24 months (Figure 3). The most common AEs were hypoglycemia (30%), diarrhea (11%), nausea (4%), and abdominal pain (3%).
Discussion
Adding a GLP-1 RA to basal/bolus insulin regimens was associated with a statistically significant decrease in HbA1c at each time point through 18 months. The greatest improvement in glycemic control from baseline was seen at 3 months, with improvements in HbA1c diminishing at each subsequent period. The study also demonstrated a significant decrease in weight at each time point through 18 months. The greatest decrease in weight was observed at both 6 and 12 months. Statistically significant decreases in TDD were observed at 3, 6, and 12 months. Insulin changes after 12 months were not found to be statistically significant.
Few studies have previously evaluated the use of GLP-1 RAs in patients with T2DM who are already taking basal/bolus insulin regimens. Gyorffy and colleagues reported significant improvements in glycemic control at 3 and 6 months in a sample of 54 patients taking basal/bolus insulin when liraglutide or exenatide was added, although statistical significance was not found at the final 12-month time point.13 That study also found a significant decrease in weight at 6 months; however there was not a significant reduction in weight at both 3 and 12 months of GLP-1 RA therapy. There was not a significant decrease in TDD at any of the collected time points. Nonetheless, Gyorffy and colleagues concluded that reduction in TDD leveled off after 12 months, which is consistent with this study’s findings. The small size of the study may have limited the ability to detect statistical significance; however, this study was conducted in a population that was racially diverse and included a higher proportion of women, though average age was similar.13
Yoon and colleagues reported weight loss through 18 months, then saw weight increase, though weights did remain lover than baseline. The study also showed no significant change in TDD of insulin after 12 months of concomitant exenatide and insulin therapy.11 Although these results mirror the outcomes observed in this study, Yoon and colleagues did not differentiate results between basal and basal/bolus insulin groups.11 Seino and colleagues observed no significant change in weight after 36 weeks of GLP-1 RA therapy in Japanese patients when used with basal and basal/bolus insulin regimens. Despite the consideration that the population in the study was not overweight (mean body mass index was 25.6), the results of these studies support the idea that effects of GLP-1 RAs on weight and TDD may diminish over time.14
Within the VHA, GLP-1 RAs are nonformulary medications. Patients must meet certain criteria in order to be approved for these agents, which may include diagnosis of CVD, renal disease, or failure to reach glycemic control with the use of oral agents or insulin. Therefore, participants of this study represent a particular subset of VHA patients, many of whom may have been selected for consideration due to long-standing or uncontrolled T2DM and failure of previous therapies. The baseline demographics support this idea, given poor glycemic control at baseline and high insulin requirements. Once approved for GLP-1 RA therapy, semaglutide is currently the preferred agent within the VHA, with other agents being available for select considerations. It should be noted that albiglutide, which was the primary agent selected for some of the patients included in this study, was removed from the market in 2017 for economic considerations.15 In the case for these patients, a conversion to a formulary-preferred GLP-1 RA was made.
Most of the patients included in this study (70%) were maintained on metformin from baseline throughout the study period. Fifty-seven percent of patients were taking TDD of insulin > 150 units. Considering the significant cost of concentrated insulins, the addition of GLP-1 RAs to standard insulin may prove to be beneficial from a cost standpoint. Additional research in this area may be warranted to establish more data regarding this potential benefit of GLP-1 RAs as add-on therapy.
Many adverse drug reactions were reported at different periods; however, most of these were associated with the gastrointestinal system, which is consistent with current literature, drug labeling, and the mechanism of action.16 Hypoglycemia occurred in about one-third of the participants; however, it should be noted that alone, GLP-1 RAs are not associated with a high risk of hypoglycemia. Previous studies have found that GLP-1 RA monotherapy is associated with hypoglycemia in 1.6% to 12.6% of patients.17,18 More likely, the combination of basal/bolus insulin and the GLP-1 RA’s effect on increasing insulin sensitivity through weight loss, improving glucose-dependent insulin secretion, or by decreasing appetite and therefore decreasing carbohydrate intake contributed to the hypoglycemia prevalence.
Limitations and Strengths
Limitations of this study include a small patient population and a gradual reduction in available data as time periods progressed, making even smaller sample sizes for subsequent time periods. A majority of participants were older males of White race. This could have limited the determination of statistical significance and applicability of the results to other patient populations. Another potential limitation was the retrospective nature of the study design, which may have limited reporting of hypoglycemia and other AEs based on the documentation of the clinician.
Strengths included the length of study duration and the diversity of GLP-1 RAs used by participants, as the impact of many of these agents has not yet been assessed in the literature. In addition, the retrospective nature of the study allows for a more realistic representation of patient adherence, education, and motivation, which are likely different from those of patients included in prospective clinical trials.
There are no clear guidelines dictating the optimal duration of concomitant GLP-1 RA and insulin therapy; however, our study suggests that there may be continued benefits past short-term use. Also our study suggests that patients with T2DM treated with basal/bolus insulin regimens may glean additional benefit from adding GLP-1 RAs; however, further randomized, controlled studies are warranted, particularly in poorly controlled patients requiring even more aggressive treatment regimens, such as concentrated insulins.
Conclusions
In our study, adding GLP-1 RA to basal/bolus insulin was associated with a significant decrease in HbA1c from baseline through 18 months. An overall decrease in weight and TDD of insulin was observed through 24 months, but the change in weight was not significant past 18 months, and the change in insulin requirement was not significant past 12 months. Hypoglycemia was observed in almost one-third of patients, and gastrointestinal symptoms were the most common AE observed as a result adding GLP-1 RAs. More studies are needed to better evaluate the durability and cost benefit of GLP-1 RAs, especially in patients with high insulin requirements.
Acknowledgments
This material is the result of work supported with resources and facilities at Veteran Health Indiana in Indianapolis. Study data were collected and managed using REDCap electronic data capture tools hosted at Veteran Health Indiana. The authors also acknowledge George Eckert for his assistance with data analysis.
1. American Diabetes Association. Statistics about diabetes. Accessed August 9, 2022. http://www.diabetes.org/diabetes-basics/statistics
2. US Department of Veterans Affairs, Veterans Health Administration, Office of Research and Development. VA research on: diabetes. Updated January 15, 2021. Accessed August 9, 2022. https://www.research.va.gov/topics/diabetes.cfm
3. Federal Practitioner. Federal Health Care Data Trends 2017, Diabetes mellitus. Accessed August 9, 2022. https://www.fedprac-digital.com/federalpractitioner/data_trends_2017?pg=20#pg20
4. American Diabetes Association Professional Practice Committee. 9. Pharmacologic approaches to glycemic treatment: Standards of Medical Care in Diabetes—2022. Diabetes Care. 2022;45(suppl 1):S125-S143. doi:10.2337/dc22-S009
5. Garber AJ, Abrahamson MJ, Barzilay JI, et al. Consensus statement by the American Association of Clinical Endocrinologists and American College of Endocrinology on the comprehensive type 2 diabetes management algorithm – 2019 executive summary. Endocr Pract. 2019;25(1):69-100. doi:10.4158/CS-2018-0535
6. St Onge E, Miller S, Clements E, Celauro L, Barnes K. The role of glucagon-like peptide-1 receptor agonists in the treatment of type 2 diabetes. J Transl Int Med. 2017;5(2):79-89. Published 2017 Jun 30. doi:10.1515/jtim-2017-0015
7. Almandoz JP, Lingvay I, Morales J, Campos C. Switching between glucagon-like peptide-1 receptor agonists: rationale and practical guidance. Clin Diabetes. 2020;38(4):390-402. doi:10.2337/cd19-0100
8. Davies ML, Pham DQ, Drab SR. GLP1-RA add-on therapy in patients with type 2 diabetes currently on a bolus containing insulin regimen. Pharmacotherapy. 2016;36(8):893-905. doi:10.1002/phar.1792
9. Rosenstock J, Guerci B, Hanefeld M, et al. Prandial options to advance basal insulin glargine therapy: testing lixisenatide plus basal insulin versus insulin glulisine either as basal-plus or basal-bolus in type 2 diabetes: the GetGoal Duo-2 Trial Investigators. Diabetes Care. 2016;39(8):1318-1328. doi:10.2337/dc16-0014
10. Levin PA, Mersey JH, Zhou S, Bromberger LA. Clinical outcomes using long-term combination therapy with insulin glargine and exenatide in patients with type 2 diabetes mellitus. Endocr Pract. 2012;18(1):17-25. doi:10.4158/EP11097.OR
11. Yoon NM, Cavaghan MK, Brunelle RL, Roach P. Exenatide added to insulin therapy: a retrospective review of clinical practice over two years in an academic endocrinology outpatient setting. Clin Ther. 2009;31(7):1511-1523. doi:10.1016/j.clinthera.2009.07.021
12. Weissman PN, Carr MC, Ye J, et al. HARMONY 4: randomised clinical trial comparing once-weekly albiglutide and insulin glargine in patients with type 2 diabetes inadequately controlled with metformin with or without sulfonylurea. Diabetologia. 2014;57(12):2475-2484. doi:10.1007/s00125-014-3360-3
13. Gyorffy JB, Keithler AN, Wardian JL, Zarzabal LA, Rittel A, True MW. The impact of GLP-1 receptor agonists on patients with diabetes on insulin therapy. Endocr Pract. 2019;25(9):935-942. doi:10.4158/EP-2019-0023
14. Seino Y, Kaneko S, Fukuda S, et al. Combination therapy with liraglutide and insulin in Japanese patients with type 2 diabetes: a 36-week, randomized, double-blind, parallel-group trial. J Diabetes Investig. 2016;7(4):565-573. doi:10.1111/jdi.12457
15. Optum. Tanzeum (albiglutide)–drug discontinuation. Published 2017. Accessed August 15, 2022. https://professionals.optumrx.com/content/dam/optum3/professional-optumrx/news/rxnews/drug-recalls-shortages/drugwithdrawal_tanzeum_2017-0801.pdf
16. Chun JH, Butts A. Long-acting GLP-1RAs: an overview of efficacy, safety, and their role in type 2 diabetes management. JAAPA. 2020;33(8):3-18. doi:10.1097/01.JAA.0000669456.13763.bd
17. Ozempic semaglutide injection. Prescribing information. Novo Nordisk; 2022. Accessed August 9, 2022. https://www.novo-pi.com/ozempic.pdf
18. Victoza liraglutide injection. Prescribing information. Novo Nordisk; 2021. Accessed August 9, 2022. https://www.novo-pi.com/victoza.pdf
In 2019, diabetes mellitus (DM) was the seventh leading cause of death in the United States, and currently, about 11% of the American population has a DM diagnosis.1 Most have a diagnosis of type 2 diabetes (T2DM), which has a strong genetic predisposition, and the risk of developing T2DM increases with age, obesity, and lack of physical activity.1,2 Nearly one-quarter of veterans have a diagnosis of DM, and DM is the leading cause of comorbidities, such as blindness, end-stage renal disease, and amputation for patients receiving care from the Veterans Health Administration (VHA).2 The elevated incidence of DM in the veteran population is attributed to a variety of factors, including exposure to herbicides, such as Agent Orange, advanced age, increased risk of obesity, and limited access to high-quality food.3
After diagnosis, both the American Diabetes Association (ADA) and the American Association of Clinical Endocrinologists and American College of Endocrinology (AACE/ACE) emphasize the appropriate use of lifestyle management and pharmacologic therapy for DM care. The use of pharmacologic agents (oral medications, insulin, or noninsulin injectables) is often determined by efficacy, cost, potential adverse effects (AEs), and patient factors and comorbidities.4,5
The initial recommendation for pharmacologic treatment for T2DM differs slightly between expert guidelines. The ADA and AACE/ACE recommend any of the following as initial monotherapy, listed in order to represent a hierarchy of usage: metformin, glucagon-like peptide-1 receptor agonists (GLP-1 RAs), sodium-glucose cotransporter 2 (SGLT-2) inhibitors, or dipeptidyl peptidase-4 (DPP-4) inhibitors, with the first 3 agents carrying the strongest recommendations.4,5 For patients with established atherosclerotic cardiovascular disease (CVD), chronic kidney disease, or heart failure, it is recommended to start a long-acting GLP-1 RA or SGLT-2 inhibitor. For patients with T2DM and hemoglobin A1c (HbA1c) between 7.5% and 9.0% at diagnosis, the AACE/ACE recommend initiation of dual therapy using metformin alongside another first-line agent and recommend the addition of another antidiabetic agent if glycemic goals are not met after regular follow-up. AACE/ACE recommend the consideration of insulin therapy in symptomatic patients with HbA1c > 9.0%.5 In contrast, the ADA recommends metformin as first-line therapy for all patients with T2DM and recommends dual therapy using metformin and another preferred agent (selection based on comorbidities) when HbA1c is 1.5% to 2% above target. The ADA recommends the consideration of insulin with HbA1c > 10% or with evidence of ongoing catabolism or symptoms of hyperglycemia.4 There are several reasons why insulin may be initiated prior to GLP-1 RAs, including profound hyperglycemia at time of diagnosis or implementation of insulin agents prior to commercial availability of GLP-1 RA.
GLP-1 RAs are analogs of the hormone incretin, which increases glucose-dependent insulin secretion, decreases postprandial glucagon secretion, increases satiety, and slows gastric emptying.6,7 When used in combination with noninsulin agents, GLP-1 RAs have demonstrated HbA1c reductions of 0.5% to 1.5%.8 The use of GLP-1 RAs with basal insulin also has been studied extensively.6,8-10 When the combination of GLP-1 RAs and basal insulin was compared with basal/bolus insulin regimens, the use of the GLP-1 RAs resulted in lower HbA1c levels and lower incidence of hypoglycemia.6,9 Data have demonstrated the complementary mechanisms of using basal insulin and GLP 1 RAs in decreasing HbA1c levels, insulin requirements, and weight compared with using basal insulin monotherapy and basal/bolus combinations.6,9-13 Moreover, 3 GLP-1 RA medications currently on the market (liraglutide, dulaglutide, and semaglutide) have displayed cardiovascular and renal benefits, further supporting the use of these medications.2,5
Despite these benefits, GLP-1 RAs may have bothersome AEs and are associated with a high cost.6 In addition, some studies have found that as the length of therapy increases, the positive effects of these agents may diminish.9,11 In one study, which looked at the impact of the addition of exenatide to patients taking basal or basal/bolus insulin regimens, mean changes in weight were −2.4 kg at 0 to 6 months, −4.3 kg at 6 to 12 months, −6.2 kg at 12 to 18 months, and −5.5 kg at 18 to 27 months. After 18 months, an increase in weight was observed, but the increase remained lower than baseline.11 Another study, conducted over 12 months, found no significant decrease in weight or total daily dose (TDD) of insulin when exenatide or liraglutide were added to various insulin regimens (basal or basal/bolus).13 To date, minimal published data exist regarding the addition of newer GLP-1 RAs and the long-term use of these agents beyond 12 months in patients taking basal/bolus insulin regimens. The primary goal of this study was to evaluate the effect of adding GLP-1 RAs to basal/bolus insulin regimens over a 24-month period.
Methods
This study was a retrospective, electronic health record review of all patients on basal and bolus insulin regimens who received additional therapy with a GLP-1 RA at Veteran Health Indiana in Indianapolis from September 1, 2015, to June 30, 2019. Patients meeting inclusion criteria served as their own control. The primary outcome was change in HbA1c at 3, 6, 12, 18, and 24 months after initiation of the GLP-1 RA. Secondary outcomes included change in weight and TDD of insulin at 3, 6, 12, 18, and 24 months after the initiation of the GLP-1 RAs and incidence of patient-reported or laboratory-confirmed hypoglycemia and other AEs.
Patients were included if they were aged ≥ 18 years with a diagnosis of T2DM, had concomitant prescriptions for both a basal insulin (glargine, detemir, or NPH) and a bolus insulin (aspart, lispro, or regular) before receiving add-on therapy with a GLP-1 RA (exenatide, liraglutide, albiglutide, lixisenatide, dulaglutide, or semaglutide) from September 1, 2015, to June 30, 2019, and had baseline and subsequent Hb A1c measurements available in the electronic health record. Patients were excluded if they had a diagnosis of T1DM, were followed by an outside clinician for DM care, or if the GLP-1 RA was discontinued before subsequent HbA1c measurement. The study protocol was approved by the Research and Development Office of Veteran Health Indiana, and the project was deemed exempt from review by the Indiana University Institutional Review Board due to the retrospective nature of the study.
Data analysis was performed using Excel. Change from baseline for each interval was computed, and 1 sample t tests (2-tailed) compared change from baseline to no change. Due to the disparity in the number of patients with data available at each of the time intervals, a mean plot was presented for each group of patients within each interval, allowing mean changes in individual groups to be observed over time.
Results
One hundred twenty-three subjects met inclusion criteria; 16 patients were excluded due to GLP-1 RA discontinuation before follow-up measurement of HbA1c; 14 were excluded due to patients being managed by a clinician outside of the facility; 1 patient was excluded for lack of documentation regarding baseline and subsequent insulin doses. Ninety-two patient charts were reviewed. Participants had a mean age of 64 years, 95% were male, and 89% were White. Mean baseline Hb A1c was 9.2%, mean body mass index was 38.9, and the mean TDD of insulin was 184 units. Mean duration of DM was 10 years, and mean use of basal/bolus insulin regimen was 6.1 years. Most participants (91%) used an insulin regimen containing insulin glargine and insulin aspart; the remaining participants used insulin detemir and insulin aspart. Semaglutide and liraglutide were the most commonly used GLP-1 RAs (44% and 39%, respectively) (Table 1).
![]()
Since some patients switched between GLP-1 RAs throughout the study and there was variation in timing of laboratory and clinic follow-up, a different number of patient charts were available for review at each period (Table 2). Glycemic control was significantly improved at all time points when compared with baseline, but over time the benefit declined. The mean change in HbA1c was −1.1% (95% CI, −1.3 to −0.8; P < .001) at 3 months; −1.0% (95% CI, −1.3 to −0.7; P < .001) at 6 months; −0.9% (95% CI, −1.3 to −0.6; P < .001) at 12 months; −0.9% (95% CI −1.4 to −0.3; P = .002) at 18 months; and −0.7% (95% CI, −1.4 to 0.1; P = .07) at 24 months (Figure 1). Mean weight decreased from baseline −2.7 kg (95% CI, −3.7 to −1.6; P < .001); −4.4 kg (95% CI −5.7 to −3.2; P < .001) at 6 months; −3.9 kg (95% CI −6.0 to −1.9; P < .001) at 12 months; −4.7 kg (95% CI −6.7 to −2.6; P < .001) at 18 months; and −2.8 kg (95% CI, −5.9 to 0.3; P = .07) at 24 months (Figure 2). Mean TDD decreased at 3 months −12 units (95% CI, −19 to −5; P < .001); −18 units (95% CI, −27 to −9; P < .001) at 6 months; −14 units (95% CI, −24 to −5; P = .004) at 12 months; −9 units (95% CI, −21 to 3; P = .15) at 18 months; and −18 units (95% CI, −43 to 5 units; P = .12) at 24 months (Figure 3). The most common AEs were hypoglycemia (30%), diarrhea (11%), nausea (4%), and abdominal pain (3%).
Discussion
Adding a GLP-1 RA to basal/bolus insulin regimens was associated with a statistically significant decrease in HbA1c at each time point through 18 months. The greatest improvement in glycemic control from baseline was seen at 3 months, with improvements in HbA1c diminishing at each subsequent period. The study also demonstrated a significant decrease in weight at each time point through 18 months. The greatest decrease in weight was observed at both 6 and 12 months. Statistically significant decreases in TDD were observed at 3, 6, and 12 months. Insulin changes after 12 months were not found to be statistically significant.
Few studies have previously evaluated the use of GLP-1 RAs in patients with T2DM who are already taking basal/bolus insulin regimens. Gyorffy and colleagues reported significant improvements in glycemic control at 3 and 6 months in a sample of 54 patients taking basal/bolus insulin when liraglutide or exenatide was added, although statistical significance was not found at the final 12-month time point.13 That study also found a significant decrease in weight at 6 months; however there was not a significant reduction in weight at both 3 and 12 months of GLP-1 RA therapy. There was not a significant decrease in TDD at any of the collected time points. Nonetheless, Gyorffy and colleagues concluded that reduction in TDD leveled off after 12 months, which is consistent with this study’s findings. The small size of the study may have limited the ability to detect statistical significance; however, this study was conducted in a population that was racially diverse and included a higher proportion of women, though average age was similar.13
Yoon and colleagues reported weight loss through 18 months, then saw weight increase, though weights did remain lover than baseline. The study also showed no significant change in TDD of insulin after 12 months of concomitant exenatide and insulin therapy.11 Although these results mirror the outcomes observed in this study, Yoon and colleagues did not differentiate results between basal and basal/bolus insulin groups.11 Seino and colleagues observed no significant change in weight after 36 weeks of GLP-1 RA therapy in Japanese patients when used with basal and basal/bolus insulin regimens. Despite the consideration that the population in the study was not overweight (mean body mass index was 25.6), the results of these studies support the idea that effects of GLP-1 RAs on weight and TDD may diminish over time.14
Within the VHA, GLP-1 RAs are nonformulary medications. Patients must meet certain criteria in order to be approved for these agents, which may include diagnosis of CVD, renal disease, or failure to reach glycemic control with the use of oral agents or insulin. Therefore, participants of this study represent a particular subset of VHA patients, many of whom may have been selected for consideration due to long-standing or uncontrolled T2DM and failure of previous therapies. The baseline demographics support this idea, given poor glycemic control at baseline and high insulin requirements. Once approved for GLP-1 RA therapy, semaglutide is currently the preferred agent within the VHA, with other agents being available for select considerations. It should be noted that albiglutide, which was the primary agent selected for some of the patients included in this study, was removed from the market in 2017 for economic considerations.15 In the case for these patients, a conversion to a formulary-preferred GLP-1 RA was made.
Most of the patients included in this study (70%) were maintained on metformin from baseline throughout the study period. Fifty-seven percent of patients were taking TDD of insulin > 150 units. Considering the significant cost of concentrated insulins, the addition of GLP-1 RAs to standard insulin may prove to be beneficial from a cost standpoint. Additional research in this area may be warranted to establish more data regarding this potential benefit of GLP-1 RAs as add-on therapy.
Many adverse drug reactions were reported at different periods; however, most of these were associated with the gastrointestinal system, which is consistent with current literature, drug labeling, and the mechanism of action.16 Hypoglycemia occurred in about one-third of the participants; however, it should be noted that alone, GLP-1 RAs are not associated with a high risk of hypoglycemia. Previous studies have found that GLP-1 RA monotherapy is associated with hypoglycemia in 1.6% to 12.6% of patients.17,18 More likely, the combination of basal/bolus insulin and the GLP-1 RA’s effect on increasing insulin sensitivity through weight loss, improving glucose-dependent insulin secretion, or by decreasing appetite and therefore decreasing carbohydrate intake contributed to the hypoglycemia prevalence.
Limitations and Strengths
Limitations of this study include a small patient population and a gradual reduction in available data as time periods progressed, making even smaller sample sizes for subsequent time periods. A majority of participants were older males of White race. This could have limited the determination of statistical significance and applicability of the results to other patient populations. Another potential limitation was the retrospective nature of the study design, which may have limited reporting of hypoglycemia and other AEs based on the documentation of the clinician.
Strengths included the length of study duration and the diversity of GLP-1 RAs used by participants, as the impact of many of these agents has not yet been assessed in the literature. In addition, the retrospective nature of the study allows for a more realistic representation of patient adherence, education, and motivation, which are likely different from those of patients included in prospective clinical trials.
There are no clear guidelines dictating the optimal duration of concomitant GLP-1 RA and insulin therapy; however, our study suggests that there may be continued benefits past short-term use. Also our study suggests that patients with T2DM treated with basal/bolus insulin regimens may glean additional benefit from adding GLP-1 RAs; however, further randomized, controlled studies are warranted, particularly in poorly controlled patients requiring even more aggressive treatment regimens, such as concentrated insulins.
Conclusions
In our study, adding GLP-1 RA to basal/bolus insulin was associated with a significant decrease in HbA1c from baseline through 18 months. An overall decrease in weight and TDD of insulin was observed through 24 months, but the change in weight was not significant past 18 months, and the change in insulin requirement was not significant past 12 months. Hypoglycemia was observed in almost one-third of patients, and gastrointestinal symptoms were the most common AE observed as a result adding GLP-1 RAs. More studies are needed to better evaluate the durability and cost benefit of GLP-1 RAs, especially in patients with high insulin requirements.
Acknowledgments
This material is the result of work supported with resources and facilities at Veteran Health Indiana in Indianapolis. Study data were collected and managed using REDCap electronic data capture tools hosted at Veteran Health Indiana. The authors also acknowledge George Eckert for his assistance with data analysis.
1. American Diabetes Association. Statistics about diabetes. Accessed August 9, 2022. http://www.diabetes.org/diabetes-basics/statistics
2. US Department of Veterans Affairs, Veterans Health Administration, Office of Research and Development. VA research on: diabetes. Updated January 15, 2021. Accessed August 9, 2022. https://www.research.va.gov/topics/diabetes.cfm
3. Federal Practitioner. Federal Health Care Data Trends 2017, Diabetes mellitus. Accessed August 9, 2022. https://www.fedprac-digital.com/federalpractitioner/data_trends_2017?pg=20#pg20
4. American Diabetes Association Professional Practice Committee. 9. Pharmacologic approaches to glycemic treatment: Standards of Medical Care in Diabetes—2022. Diabetes Care. 2022;45(suppl 1):S125-S143. doi:10.2337/dc22-S009
5. Garber AJ, Abrahamson MJ, Barzilay JI, et al. Consensus statement by the American Association of Clinical Endocrinologists and American College of Endocrinology on the comprehensive type 2 diabetes management algorithm – 2019 executive summary. Endocr Pract. 2019;25(1):69-100. doi:10.4158/CS-2018-0535
6. St Onge E, Miller S, Clements E, Celauro L, Barnes K. The role of glucagon-like peptide-1 receptor agonists in the treatment of type 2 diabetes. J Transl Int Med. 2017;5(2):79-89. Published 2017 Jun 30. doi:10.1515/jtim-2017-0015
7. Almandoz JP, Lingvay I, Morales J, Campos C. Switching between glucagon-like peptide-1 receptor agonists: rationale and practical guidance. Clin Diabetes. 2020;38(4):390-402. doi:10.2337/cd19-0100
8. Davies ML, Pham DQ, Drab SR. GLP1-RA add-on therapy in patients with type 2 diabetes currently on a bolus containing insulin regimen. Pharmacotherapy. 2016;36(8):893-905. doi:10.1002/phar.1792
9. Rosenstock J, Guerci B, Hanefeld M, et al. Prandial options to advance basal insulin glargine therapy: testing lixisenatide plus basal insulin versus insulin glulisine either as basal-plus or basal-bolus in type 2 diabetes: the GetGoal Duo-2 Trial Investigators. Diabetes Care. 2016;39(8):1318-1328. doi:10.2337/dc16-0014
10. Levin PA, Mersey JH, Zhou S, Bromberger LA. Clinical outcomes using long-term combination therapy with insulin glargine and exenatide in patients with type 2 diabetes mellitus. Endocr Pract. 2012;18(1):17-25. doi:10.4158/EP11097.OR
11. Yoon NM, Cavaghan MK, Brunelle RL, Roach P. Exenatide added to insulin therapy: a retrospective review of clinical practice over two years in an academic endocrinology outpatient setting. Clin Ther. 2009;31(7):1511-1523. doi:10.1016/j.clinthera.2009.07.021
12. Weissman PN, Carr MC, Ye J, et al. HARMONY 4: randomised clinical trial comparing once-weekly albiglutide and insulin glargine in patients with type 2 diabetes inadequately controlled with metformin with or without sulfonylurea. Diabetologia. 2014;57(12):2475-2484. doi:10.1007/s00125-014-3360-3
13. Gyorffy JB, Keithler AN, Wardian JL, Zarzabal LA, Rittel A, True MW. The impact of GLP-1 receptor agonists on patients with diabetes on insulin therapy. Endocr Pract. 2019;25(9):935-942. doi:10.4158/EP-2019-0023
14. Seino Y, Kaneko S, Fukuda S, et al. Combination therapy with liraglutide and insulin in Japanese patients with type 2 diabetes: a 36-week, randomized, double-blind, parallel-group trial. J Diabetes Investig. 2016;7(4):565-573. doi:10.1111/jdi.12457
15. Optum. Tanzeum (albiglutide)–drug discontinuation. Published 2017. Accessed August 15, 2022. https://professionals.optumrx.com/content/dam/optum3/professional-optumrx/news/rxnews/drug-recalls-shortages/drugwithdrawal_tanzeum_2017-0801.pdf
16. Chun JH, Butts A. Long-acting GLP-1RAs: an overview of efficacy, safety, and their role in type 2 diabetes management. JAAPA. 2020;33(8):3-18. doi:10.1097/01.JAA.0000669456.13763.bd
17. Ozempic semaglutide injection. Prescribing information. Novo Nordisk; 2022. Accessed August 9, 2022. https://www.novo-pi.com/ozempic.pdf
18. Victoza liraglutide injection. Prescribing information. Novo Nordisk; 2021. Accessed August 9, 2022. https://www.novo-pi.com/victoza.pdf
Optimizing Narrowband UVB Phototherapy: Is It More Challenging for Your Older Patients?
Even with recent pharmacologic treatment advances, narrowband UVB (NB-UVB) phototherapy remains a versatile, safe, and efficacious adjunctive or exclusive treatment for multiple dermatologic conditions, including psoriasis and atopic dermatitis.
In a prior study, Matthews et al13 reported that 96% (50/52) of patients older than 65 years achieved medium to high levels of clearance with NB-UVB phototherapy. Nonetheless, 2 other findings in this study related to the number of treatments required to achieve clearance (ie, clearance rates) and erythema rates prompted further investigation. The first finding was higher-than-expected clearance rates. Older adults had a clearance rate with a mean of 33 treatments compared to prior studies featuring mean clearance rates of 20 to 28 treatments.7,8,14-16 This finding resembled a study in the United Kingdom17 with a median clearance rate in older adults of 30 treatments. In contrast, the median clearance rate from a study in Turkey18 was 42 treatments in older adults. We hypothesized that more photosensitizing medications used in older vs younger adults prompted more dose adjustments with NB-UVB phototherapy to avoid burning (ie, erythema) at baseline and throughout the treatment course. These dose adjustments may have increased the overall clearance rates. If true, we predicted that younger adults treated with the same protocol would have cleared more quickly, either because of age-related differences or because they likely had fewer comorbidities and therefore fewer medications.
The second finding from Matthews et al13 that warranted further investigation was a higher erythema rate compared to the older adult study from the United Kingdom.17 We hypothesized that potentially greater use of photosensitizing medications in the United States could explain the higher erythema rates. Although medication-induced photosensitivity is less likely with NB-UVB phototherapy than with UVA, certain medications can cause UVB photosensitivity, including thiazides, quinidine, calcium channel antagonists, phenothiazines, and nonsteroidal anti-inflammatory drugs.8,19,20 Therefore, photosensitizing medication use either at baseline or during a course of NB-UVB phototherapy could increase the risk for erythema. Age-related skin changes also have been considered as a
This retrospective study aimed to determine if NB-UVB phototherapy is equally effective in both older and younger adults treated with the same protocol; to examine the association between the use of photosensitizing medications and clearance rates in both older and younger adults; and to examine the association between the use of photosensitizing medications and erythema rates in older vs younger adults.
Methods
Study Design and Patients—This retrospective cohort study used billing records to identify patients who received NB-UVB phototherapy at 3 different clinical sites within a large US health care system in Washington (Group Health Cooperative, now Kaiser Permanente Washington), serving more than 600,000 patients between January 1, 2012, and December 31, 2016. The institutional review board of Kaiser Permanente Washington Health Research Institute approved this study (IRB 1498087-4). Younger adults were classified as those 64 years or younger and older adults as those 65 years and older at the start of their phototherapy regimen. A power analysis determined that the optimal sample size for this study was 250 patients.
Individuals were excluded if they had fewer than 6 phototherapy treatments; a diagnosis of vitiligo, photosensitivity dermatitis, morphea, or pityriasis rubra pilaris; and/or treatment of the hands or feet only.
Phototherapy Protocol—Using a 48-lamp NB-UVB unit, trained phototherapy nurses provided all treatments following standardized treatment protocols13 based on previously published phototherapy guidelines.24 Nurses determined each patient’s disease clearance level using a 3-point clearance scale (high, medium, low).13 Each patient’s starting dose was determined based on the estimated MED for their skin phototype.
Statistical Analysis—Data were analyzed using Stata statistical software (StataCorp LLC). Univariate analyses were used to examine the data and identify outliers, bad values, and missing data, as well as to calculate descriptive statistics. Pearson χ2 and Fisher exact statistics were used to calculate differences in categorical variables. Linear multivariate regression models and logistic multivariate models were used to examine statistical relationships between variables. Statistical significance was defined as P≤.05.
Results
Patient Characteristics—Medical records were reviewed for 172 patients who received phototherapy between 2012 and 2016. Patients ranged in age from 23 to 91 years, with 102 patients 64 years and younger and 70 patients 65 years and older. Tables 1 and 2 outline the patient characteristics and conditions treated.

Phototherapy Effectiveness—

Photosensitizing Medications, Clearance Levels, and Clearance Rates—

Frequency of Treatments and Clearance Rates—Older adults more consistently completed the recommended frequency of treatments—3 times weekly—compared to younger adults (74.3% vs 58.5%). However, all patients who completed 3 treatments per week required a similar number of treatments to clear (older adults, mean [SD]: 35.7 [21.6]; younger adults, mean [SD]: 34.7 [19.0]; P=.85). Among patients completing 2 or fewer treatments per week, older adults required a mean (SD) of only 31 (9.0) treatments to clear vs 41.5 (21.3) treatments to clear for younger adults, but the difference was not statistically significant (P=.08). However, even those with suboptimal frequency ultimately achieved similar clearance levels.


Photosensitizing Medications and Erythema Rates—

Overall, phototherapy nurses adjusted the starting dose according to the phototype-based protocol an average of 69% of the time for patients on medications with photosensitivity listed as a potential side effect. However, the frequency depended significantly on the clinic (clinic A, 24%; clinic B, 92%; clinic C, 87%)(P≤.001). Nurses across all clinics consistently decreased the treatment dose when patients reported starting new photosensitizing medications. Patients with adjusted starting doses had slightly but not significantly higher clearance rates compared to those without (mean, 37.8 vs 35.5; t(104)=0.58; P=.56).

Comment
Impact of Photosensitizing Medications on Clearance—Photosensitizing medications and treatment frequency were 2 factors that might explain the slower clearance rates in younger adults. In this study, both groups of patients used similar numbers of photosensitizing medications, but more older adults were taking 3 or more medications (Table 3). We found no statistically significant relationship between taking photosensitizing medications and either the clearance rates or the level of clearance achieved in either age group.
Impact of Treatment Frequency—Weekly treatment frequency also was examined. One prior study demonstrated that treatments 3 times weekly led to a faster clearance time and higher clearance levels compared with twice-weekly treatment.7 When patients completed treatments twice weekly, it took an average of 1.5 times more days to clear, which impacted cost and clinical resource availability. The patients ranged in age from 17 to 80 years, but outcomes in older patients were not described separately.7 Interestingly, our study seemed to find a difference between age groups when the impact of treatment frequency was examined. Older adults completed nearly 4 fewer mean treatments to clear when treating less often, with more than 80% achieving high levels of clearance, whereas the younger adults required almost 7 more treatments to clear when they came in less frequently, with approximately 80% achieving a high level of clearance. As a result, our study found that in both age groups, slowing the treatment frequency extended the treatment time to clearance—more for the younger adults than the older adults—but did not significantly change the percentage of individuals reaching full clearance in either group.
Erythema Rates—There was no association between photosensitizing medications and erythema rates except when patients were taking at least 3 medications. Most medications that listed photosensitivity as a possible side effect did not specify their relevant range of UV radiation; therefore, all such medications were examined during this analysis. Prior research has shown UVB range photosensitizing medications include thiazides, quinidine, calcium channel antagonists, phenothiazines, and nonsteroidal anti-inflammatory drugs.19 A sensitivity analysis that focused only on these medications found no association between them and any particular grade of erythema. However, patients taking 3 or more of any medications listing photosensitivity as a side effect had an increased risk for grade 2 erythema.
Erythema rates in this study were consistent with a 2013 systematic review that reported 57% of patients with asymptomatic grade 1 erythema.25 In the 2 other comparative older adult studies, erythema rates varied widely: 35% in a study from Turkey18compared to only1.89% in a study from the United Kingdom.17
The starting dose for NB-UVB may drive erythema rates. The current study’s protocols were based on an estimated MED that is subjectively determined by the dermatology provider’s assessment of the patient’s skin sensitivity via examination and questions to the patient about their response to environmental sun exposure (ie, burning and tanning)26 and is frequently used to determine the starting dose and subsequent dose escalation. Certain medications have been found to increase photosensitivity and erythema,20 which can change an individual’s MED. If photosensitizing medications are started prior to or during a course of NB-UVB without a pretreatment MED, they might increase the risk for erythema. This study did not identify specific erythema-inducing medications but did find that taking 3 or more photosensitizing medications was associated with increased episodes of grade 2 erythema. Similarly, Harrop et al8 found that patients who were taking photosensitizing medications were more likely to have grade 2 or higher erythema, despite baseline MED testing, which is an established safety mechanism to reduce the risk and severity of erythema.14,20,27 The authors of a recent study of older adults in Taiwan specifically recommended MED testing due to the unpredictable influence of polypharmacy on MED calculations in this population.28 Therefore, this study’s use of an estimated MED in older adults may have influenced the starting dose as well as the incidence and severity of erythemic events. Age-related skin changes likely are ruled out as a consideration for mild erythema by the similarity of grade 1 erythema rates in both older and younger adults. Other studies have identified differences between the age groups, where older patients experienced more intense erythema in the late phase of UVB treatments.22,23 This phenomenon could increase the risk for a grade 2 erythema, which may correspond with this study’s findings.
Other potential causes of erythema were ruled out during our study, including erythema related to missed treatments and shielding mishaps. Other factors, however, may impact the level of sensitivity each patient has to phototherapy, including genetics, epigenetics, and cumulative sun damage. With NB-UVB, near-erythemogenic doses are optimal to achieve effective treatments but require a delicate balance to achieve, which may be more problematic for older adults, especially those taking several medications.
Study Limitations—Our study design made it difficult to draw conclusions about rarer dermatologic conditions. Some patients received treatments over years that were not included in the study period. Finally, power calculations suggested that our actual sample size was too small, with approximately one-third of the required sample missing.
Practical Implications—The goals of phototherapy are to achieve a high level of disease clearance with the fewest number of treatments possible and minimal side effects.
The extra staff training and patient monitoring required for MED testing likely is to add value and preserve resources if faster clearance rates could be achieved and may warrant further investigation. Phototherapy centers require standardized treatment protocols, diligent well-trained staff, and program monitoring to ensure consistent care to all patients. This study highlighted the ongoing opportunity for health care organizations to conduct evidence-based practice inquiries to continually optimize care for their patients.
- Fernández-Guarino M, Aboin-Gonzalez S, Barchino L, et al. Treatment of moderate and severe adult chronic atopic dermatitis with narrow-band UVB and the combination of narrow-band UVB/UVA phototherapy. Dermatol Ther. 2016;29:19-23.
- Foerster J, Boswell K, West J, et al. Narrowband UVB treatment is highly effective and causes a strong reduction in the use of steroid and other creams in psoriasis patients in clinical practice. PLoS One. 2017;12:e0181813.
- Gambichler T, Breuckmann F, Boms S, et al. Narrowband UVB phototherapy in skin conditions beyond psoriasis. J Am Acad Dermatol. 2005;52:660-670.
- Ryu HH, Choe YS, Jo S, et al. Remission period in psoriasis after multiple cycles of narrowband ultraviolet B phototherapy. J Dermatol. 2014;41:622-627.
- Schneider LA, Hinrichs R, Scharffetter-Kochanek K. Phototherapy and photochemotherapy. Clin Dermatol. 2008;26:464-476.
- Tintle S, Shemer A, Suárez-Fariñas M, et al. Reversal of atopic dermatitis with narrow-band UVB phototherapy and biomarkers for therapeutic response. J Allergy Clin Immunol. 2011;128:583-593.e581-584.
- Cameron H, Dawe RS, Yule S, et al. A randomized, observer-blinded trial of twice vs. three times weekly narrowband ultraviolet B phototherapy for chronic plaque psoriasis. Br J Dermatol. 2002;147:973-978.
- Harrop G, Dawe RS, Ibbotson S. Are photosensitizing medications associated with increased risk of important erythemal reactions during ultraviolet B phototherapy? Br J Dermatol. 2018;179:1184-1185.
- Torres AE, Lyons AB, Hamzavi IH, et al. Role of phototherapy in the era of biologics. J Am Acad Dermatol. 2021;84:479-485.
- Bukvic´ć Mokos Z, Jovic´ A, Cˇeovic´ R, et al. Therapeutic challenges in the mature patient. Clin Dermatol. 2018;36:128-139.
- Di Lernia V, Goldust M. An overview of the efficacy and safety of systemic treatments for psoriasis in the elderly. Expert Opin Biol Ther. 2018;18:897-903.
- Oliveira C, Torres T. More than skin deep: the systemic nature of atopic dermatitis. Eur J Dermatol. 2019;29:250-258.
- Matthews S, Pike K, Chien A. Phototherapy: safe and effective for challenging skin conditions in older adults. Cutis. 2021;108:E15-E21.
- Rodríguez-Granados MT, Estany-Gestal A, Pousa-Martínez M, et al. Is it useful to calculate minimal erythema dose before narrowband UV-B phototherapy? Actas Dermosifiliogr. 2017;108:852-858.
- Parlak N, Kundakci N, Parlak A, et al. Narrowband ultraviolet B phototherapy starting and incremental dose in patients with psoriasis: comparison of percentage dose and fixed dose protocols. Photodermatol Photoimmunol Photomed. 2015;31:90-97.
- Kleinpenning MM, Smits T, Boezeman J, et al. Narrowband ultraviolet B therapy in psoriasis: randomized double-blind comparison of high-dose and low-dose irradiation regimens. Br J Dermatol. 2009;161:1351-1356.
- Powell JB, Gach JE. Phototherapy in the elderly. Clin Exp Dermatol. 2015;40:605-610.
- Bulur I, Erdogan HK, Aksu AE, et al. The efficacy and safety of phototherapy in geriatric patients: a retrospective study. An Bras Dermatol. 2018;93:33-38.
- Dawe RS, Ibbotson SH. Drug-induced photosensitivity. Dermatol Clin. 2014;32:363-368, ix.
- Cameron H, Dawe RS. Photosensitizing drugs may lower the narrow-band ultraviolet B (TL-01) minimal erythema dose. Br J Dermatol. 2000;142:389-390.
- Elmets CA, Lim HW, Stoff B, et al. Joint American Academy of Dermatology-National Psoriasis Foundation guidelines of care for the management and treatment of psoriasis with phototherapy. J Am Acad Dermatol. 2019;81:775-804.
- Gloor M, Scherotzke A. Age dependence of ultraviolet light-induced erythema following narrow-band UVB exposure. Photodermatol Photoimmunol Photomed. 2002;18:121-126.
- Cox NH, Diffey BL, Farr PM. The relationship between chronological age and the erythemal response to ultraviolet B radiation. Br J Dermatol. 1992;126:315-319.
- Morrison W. Phototherapy and Photochemotherapy for Skin Disease. 2nd ed. Informa Healthcare; 2005.
- Almutawa F, Alnomair N, Wang Y, et al. Systematic review of UV-based therapy for psoriasis. Am J Clin Dermatol. 2013;14:87-109.
- Trakatelli M, Bylaite-Bucinskiene M, Correia O, et al. Clinical assessment of skin phototypes: watch your words! Eur J Dermatol. 2017;27:615-619.
- Kwon IH, Kwon HH, Na SJ, et al. Could colorimetric method replace the individual minimal erythemal dose (MED) measurements in determining the initial dose of narrow-band UVB treatment for psoriasis patients with skin phototype III-V? J Eur Acad Dermatol Venereol. 2013;27:494-498.
- Chen WA, Chang CM. The minimal erythema dose of narrowband ultraviolet B in elderly Taiwanese [published online September 1, 2021]. Photodermatol Photoimmunol Photomed. doi:10.1111/phpp.12730
Even with recent pharmacologic treatment advances, narrowband UVB (NB-UVB) phototherapy remains a versatile, safe, and efficacious adjunctive or exclusive treatment for multiple dermatologic conditions, including psoriasis and atopic dermatitis.
In a prior study, Matthews et al13 reported that 96% (50/52) of patients older than 65 years achieved medium to high levels of clearance with NB-UVB phototherapy. Nonetheless, 2 other findings in this study related to the number of treatments required to achieve clearance (ie, clearance rates) and erythema rates prompted further investigation. The first finding was higher-than-expected clearance rates. Older adults had a clearance rate with a mean of 33 treatments compared to prior studies featuring mean clearance rates of 20 to 28 treatments.7,8,14-16 This finding resembled a study in the United Kingdom17 with a median clearance rate in older adults of 30 treatments. In contrast, the median clearance rate from a study in Turkey18 was 42 treatments in older adults. We hypothesized that more photosensitizing medications used in older vs younger adults prompted more dose adjustments with NB-UVB phototherapy to avoid burning (ie, erythema) at baseline and throughout the treatment course. These dose adjustments may have increased the overall clearance rates. If true, we predicted that younger adults treated with the same protocol would have cleared more quickly, either because of age-related differences or because they likely had fewer comorbidities and therefore fewer medications.
The second finding from Matthews et al13 that warranted further investigation was a higher erythema rate compared to the older adult study from the United Kingdom.17 We hypothesized that potentially greater use of photosensitizing medications in the United States could explain the higher erythema rates. Although medication-induced photosensitivity is less likely with NB-UVB phototherapy than with UVA, certain medications can cause UVB photosensitivity, including thiazides, quinidine, calcium channel antagonists, phenothiazines, and nonsteroidal anti-inflammatory drugs.8,19,20 Therefore, photosensitizing medication use either at baseline or during a course of NB-UVB phototherapy could increase the risk for erythema. Age-related skin changes also have been considered as a
This retrospective study aimed to determine if NB-UVB phototherapy is equally effective in both older and younger adults treated with the same protocol; to examine the association between the use of photosensitizing medications and clearance rates in both older and younger adults; and to examine the association between the use of photosensitizing medications and erythema rates in older vs younger adults.
Methods
Study Design and Patients—This retrospective cohort study used billing records to identify patients who received NB-UVB phototherapy at 3 different clinical sites within a large US health care system in Washington (Group Health Cooperative, now Kaiser Permanente Washington), serving more than 600,000 patients between January 1, 2012, and December 31, 2016. The institutional review board of Kaiser Permanente Washington Health Research Institute approved this study (IRB 1498087-4). Younger adults were classified as those 64 years or younger and older adults as those 65 years and older at the start of their phototherapy regimen. A power analysis determined that the optimal sample size for this study was 250 patients.
Individuals were excluded if they had fewer than 6 phototherapy treatments; a diagnosis of vitiligo, photosensitivity dermatitis, morphea, or pityriasis rubra pilaris; and/or treatment of the hands or feet only.
Phototherapy Protocol—Using a 48-lamp NB-UVB unit, trained phototherapy nurses provided all treatments following standardized treatment protocols13 based on previously published phototherapy guidelines.24 Nurses determined each patient’s disease clearance level using a 3-point clearance scale (high, medium, low).13 Each patient’s starting dose was determined based on the estimated MED for their skin phototype.
Statistical Analysis—Data were analyzed using Stata statistical software (StataCorp LLC). Univariate analyses were used to examine the data and identify outliers, bad values, and missing data, as well as to calculate descriptive statistics. Pearson χ2 and Fisher exact statistics were used to calculate differences in categorical variables. Linear multivariate regression models and logistic multivariate models were used to examine statistical relationships between variables. Statistical significance was defined as P≤.05.
Results
Patient Characteristics—Medical records were reviewed for 172 patients who received phototherapy between 2012 and 2016. Patients ranged in age from 23 to 91 years, with 102 patients 64 years and younger and 70 patients 65 years and older. Tables 1 and 2 outline the patient characteristics and conditions treated.
Phototherapy Effectiveness—
Photosensitizing Medications, Clearance Levels, and Clearance Rates—
Frequency of Treatments and Clearance Rates—Older adults more consistently completed the recommended frequency of treatments—3 times weekly—compared to younger adults (74.3% vs 58.5%). However, all patients who completed 3 treatments per week required a similar number of treatments to clear (older adults, mean [SD]: 35.7 [21.6]; younger adults, mean [SD]: 34.7 [19.0]; P=.85). Among patients completing 2 or fewer treatments per week, older adults required a mean (SD) of only 31 (9.0) treatments to clear vs 41.5 (21.3) treatments to clear for younger adults, but the difference was not statistically significant (P=.08). However, even those with suboptimal frequency ultimately achieved similar clearance levels.
Photosensitizing Medications and Erythema Rates—
Overall, phototherapy nurses adjusted the starting dose according to the phototype-based protocol an average of 69% of the time for patients on medications with photosensitivity listed as a potential side effect. However, the frequency depended significantly on the clinic (clinic A, 24%; clinic B, 92%; clinic C, 87%)(P≤.001). Nurses across all clinics consistently decreased the treatment dose when patients reported starting new photosensitizing medications. Patients with adjusted starting doses had slightly but not significantly higher clearance rates compared to those without (mean, 37.8 vs 35.5; t(104)=0.58; P=.56).
Comment
Impact of Photosensitizing Medications on Clearance—Photosensitizing medications and treatment frequency were 2 factors that might explain the slower clearance rates in younger adults. In this study, both groups of patients used similar numbers of photosensitizing medications, but more older adults were taking 3 or more medications (Table 3). We found no statistically significant relationship between taking photosensitizing medications and either the clearance rates or the level of clearance achieved in either age group.
Impact of Treatment Frequency—Weekly treatment frequency also was examined. One prior study demonstrated that treatments 3 times weekly led to a faster clearance time and higher clearance levels compared with twice-weekly treatment.7 When patients completed treatments twice weekly, it took an average of 1.5 times more days to clear, which impacted cost and clinical resource availability. The patients ranged in age from 17 to 80 years, but outcomes in older patients were not described separately.7 Interestingly, our study seemed to find a difference between age groups when the impact of treatment frequency was examined. Older adults completed nearly 4 fewer mean treatments to clear when treating less often, with more than 80% achieving high levels of clearance, whereas the younger adults required almost 7 more treatments to clear when they came in less frequently, with approximately 80% achieving a high level of clearance. As a result, our study found that in both age groups, slowing the treatment frequency extended the treatment time to clearance—more for the younger adults than the older adults—but did not significantly change the percentage of individuals reaching full clearance in either group.
Erythema Rates—There was no association between photosensitizing medications and erythema rates except when patients were taking at least 3 medications. Most medications that listed photosensitivity as a possible side effect did not specify their relevant range of UV radiation; therefore, all such medications were examined during this analysis. Prior research has shown UVB range photosensitizing medications include thiazides, quinidine, calcium channel antagonists, phenothiazines, and nonsteroidal anti-inflammatory drugs.19 A sensitivity analysis that focused only on these medications found no association between them and any particular grade of erythema. However, patients taking 3 or more of any medications listing photosensitivity as a side effect had an increased risk for grade 2 erythema.
Erythema rates in this study were consistent with a 2013 systematic review that reported 57% of patients with asymptomatic grade 1 erythema.25 In the 2 other comparative older adult studies, erythema rates varied widely: 35% in a study from Turkey18compared to only1.89% in a study from the United Kingdom.17
The starting dose for NB-UVB may drive erythema rates. The current study’s protocols were based on an estimated MED that is subjectively determined by the dermatology provider’s assessment of the patient’s skin sensitivity via examination and questions to the patient about their response to environmental sun exposure (ie, burning and tanning)26 and is frequently used to determine the starting dose and subsequent dose escalation. Certain medications have been found to increase photosensitivity and erythema,20 which can change an individual’s MED. If photosensitizing medications are started prior to or during a course of NB-UVB without a pretreatment MED, they might increase the risk for erythema. This study did not identify specific erythema-inducing medications but did find that taking 3 or more photosensitizing medications was associated with increased episodes of grade 2 erythema. Similarly, Harrop et al8 found that patients who were taking photosensitizing medications were more likely to have grade 2 or higher erythema, despite baseline MED testing, which is an established safety mechanism to reduce the risk and severity of erythema.14,20,27 The authors of a recent study of older adults in Taiwan specifically recommended MED testing due to the unpredictable influence of polypharmacy on MED calculations in this population.28 Therefore, this study’s use of an estimated MED in older adults may have influenced the starting dose as well as the incidence and severity of erythemic events. Age-related skin changes likely are ruled out as a consideration for mild erythema by the similarity of grade 1 erythema rates in both older and younger adults. Other studies have identified differences between the age groups, where older patients experienced more intense erythema in the late phase of UVB treatments.22,23 This phenomenon could increase the risk for a grade 2 erythema, which may correspond with this study’s findings.
Other potential causes of erythema were ruled out during our study, including erythema related to missed treatments and shielding mishaps. Other factors, however, may impact the level of sensitivity each patient has to phototherapy, including genetics, epigenetics, and cumulative sun damage. With NB-UVB, near-erythemogenic doses are optimal to achieve effective treatments but require a delicate balance to achieve, which may be more problematic for older adults, especially those taking several medications.
Study Limitations—Our study design made it difficult to draw conclusions about rarer dermatologic conditions. Some patients received treatments over years that were not included in the study period. Finally, power calculations suggested that our actual sample size was too small, with approximately one-third of the required sample missing.
Practical Implications—The goals of phototherapy are to achieve a high level of disease clearance with the fewest number of treatments possible and minimal side effects.
The extra staff training and patient monitoring required for MED testing likely is to add value and preserve resources if faster clearance rates could be achieved and may warrant further investigation. Phototherapy centers require standardized treatment protocols, diligent well-trained staff, and program monitoring to ensure consistent care to all patients. This study highlighted the ongoing opportunity for health care organizations to conduct evidence-based practice inquiries to continually optimize care for their patients.
- Fernández-Guarino M, Aboin-Gonzalez S, Barchino L, et al. Treatment of moderate and severe adult chronic atopic dermatitis with narrow-band UVB and the combination of narrow-band UVB/UVA phototherapy. Dermatol Ther. 2016;29:19-23.
- Foerster J, Boswell K, West J, et al. Narrowband UVB treatment is highly effective and causes a strong reduction in the use of steroid and other creams in psoriasis patients in clinical practice. PLoS One. 2017;12:e0181813.
- Gambichler T, Breuckmann F, Boms S, et al. Narrowband UVB phototherapy in skin conditions beyond psoriasis. J Am Acad Dermatol. 2005;52:660-670.
- Ryu HH, Choe YS, Jo S, et al. Remission period in psoriasis after multiple cycles of narrowband ultraviolet B phototherapy. J Dermatol. 2014;41:622-627.
- Schneider LA, Hinrichs R, Scharffetter-Kochanek K. Phototherapy and photochemotherapy. Clin Dermatol. 2008;26:464-476.
- Tintle S, Shemer A, Suárez-Fariñas M, et al. Reversal of atopic dermatitis with narrow-band UVB phototherapy and biomarkers for therapeutic response. J Allergy Clin Immunol. 2011;128:583-593.e581-584.
- Cameron H, Dawe RS, Yule S, et al. A randomized, observer-blinded trial of twice vs. three times weekly narrowband ultraviolet B phototherapy for chronic plaque psoriasis. Br J Dermatol. 2002;147:973-978.
- Harrop G, Dawe RS, Ibbotson S. Are photosensitizing medications associated with increased risk of important erythemal reactions during ultraviolet B phototherapy? Br J Dermatol. 2018;179:1184-1185.
- Torres AE, Lyons AB, Hamzavi IH, et al. Role of phototherapy in the era of biologics. J Am Acad Dermatol. 2021;84:479-485.
- Bukvic´ć Mokos Z, Jovic´ A, Cˇeovic´ R, et al. Therapeutic challenges in the mature patient. Clin Dermatol. 2018;36:128-139.
- Di Lernia V, Goldust M. An overview of the efficacy and safety of systemic treatments for psoriasis in the elderly. Expert Opin Biol Ther. 2018;18:897-903.
- Oliveira C, Torres T. More than skin deep: the systemic nature of atopic dermatitis. Eur J Dermatol. 2019;29:250-258.
- Matthews S, Pike K, Chien A. Phototherapy: safe and effective for challenging skin conditions in older adults. Cutis. 2021;108:E15-E21.
- Rodríguez-Granados MT, Estany-Gestal A, Pousa-Martínez M, et al. Is it useful to calculate minimal erythema dose before narrowband UV-B phototherapy? Actas Dermosifiliogr. 2017;108:852-858.
- Parlak N, Kundakci N, Parlak A, et al. Narrowband ultraviolet B phototherapy starting and incremental dose in patients with psoriasis: comparison of percentage dose and fixed dose protocols. Photodermatol Photoimmunol Photomed. 2015;31:90-97.
- Kleinpenning MM, Smits T, Boezeman J, et al. Narrowband ultraviolet B therapy in psoriasis: randomized double-blind comparison of high-dose and low-dose irradiation regimens. Br J Dermatol. 2009;161:1351-1356.
- Powell JB, Gach JE. Phototherapy in the elderly. Clin Exp Dermatol. 2015;40:605-610.
- Bulur I, Erdogan HK, Aksu AE, et al. The efficacy and safety of phototherapy in geriatric patients: a retrospective study. An Bras Dermatol. 2018;93:33-38.
- Dawe RS, Ibbotson SH. Drug-induced photosensitivity. Dermatol Clin. 2014;32:363-368, ix.
- Cameron H, Dawe RS. Photosensitizing drugs may lower the narrow-band ultraviolet B (TL-01) minimal erythema dose. Br J Dermatol. 2000;142:389-390.
- Elmets CA, Lim HW, Stoff B, et al. Joint American Academy of Dermatology-National Psoriasis Foundation guidelines of care for the management and treatment of psoriasis with phototherapy. J Am Acad Dermatol. 2019;81:775-804.
- Gloor M, Scherotzke A. Age dependence of ultraviolet light-induced erythema following narrow-band UVB exposure. Photodermatol Photoimmunol Photomed. 2002;18:121-126.
- Cox NH, Diffey BL, Farr PM. The relationship between chronological age and the erythemal response to ultraviolet B radiation. Br J Dermatol. 1992;126:315-319.
- Morrison W. Phototherapy and Photochemotherapy for Skin Disease. 2nd ed. Informa Healthcare; 2005.
- Almutawa F, Alnomair N, Wang Y, et al. Systematic review of UV-based therapy for psoriasis. Am J Clin Dermatol. 2013;14:87-109.
- Trakatelli M, Bylaite-Bucinskiene M, Correia O, et al. Clinical assessment of skin phototypes: watch your words! Eur J Dermatol. 2017;27:615-619.
- Kwon IH, Kwon HH, Na SJ, et al. Could colorimetric method replace the individual minimal erythemal dose (MED) measurements in determining the initial dose of narrow-band UVB treatment for psoriasis patients with skin phototype III-V? J Eur Acad Dermatol Venereol. 2013;27:494-498.
- Chen WA, Chang CM. The minimal erythema dose of narrowband ultraviolet B in elderly Taiwanese [published online September 1, 2021]. Photodermatol Photoimmunol Photomed. doi:10.1111/phpp.12730
Practice Points
- Narrowband UVB (NB-UVB) phototherapy remains a safe and efficacious nonpharmacologic treatment for dermatologic conditions in older and younger adults.
- Compared to younger adults, older adults using the same protocols need similar or even fewer treatments to achieve high levels of clearance.
- Individuals taking 3 or more photosensitizing medications, regardless of age, may be at higher risk for substantial erythema with NB-UVB phototherapy.
- Phototherapy program monitoring is important to ensure quality care and investigate opportunities for care optimization.
Reporting Coronary Artery Calcium on Low-Dose Computed Tomography Impacts Statin Management in a Lung Cancer Screening Population
Cigarette smoking is an independent risk factor for lung cancer and atherosclerotic cardiovascular disease (ASCVD).1-3 The National Lung Screening Trial (NLST) demonstrated both lung cancer mortality reduction with the use of surveillance low-dose computed tomography (LDCT) and ASCVD as the most common cause of death among smokers.4,5 ASCVD remains the leading cause of death in the lung cancer screening (LCS) population.2,3 After publication of the NLST results, the US Preventive Services Task Force (USPSTF) established LCS eligibility among smokers and the Center for Medicare and Medicaid Services approved payment for annual LDCT in this group.1,6,7
Recently LDCT has been proposed as an adjunct diagnostic tool for detecting coronary artery calcium (CAC), which is independently associated with ASCVD and mortality.8-13 CAC scores have been recommended by the 2019 American College of Cardiology/American Heart Association cholesterol treatment guidelines and shown to be cost-effective in guiding statin therapy for patients with borderline to intermediate ASCVD risk.14-16 While CAC is conventionally quantified using electrocardiogram (ECG)-gated CT, these scans are not routinely performed in clinical practice because preventive CAC screening is neither recommended by the USPSTF nor covered by most insurance providers.17,18 LDCT, conversely, is reimbursable and a well-validated ASCVD risk predictor.18,19
In this study, we aimed to determine the validity of LDCT in identifying CAC among the military LCS population and whether it would impact statin recommendations based on 10-year ASCVD risk.
Methods
Participants were recruited from a retrospective cohort of 563 Military Health System (MHS) beneficiaries who received LCS with LDCT at Naval Medical Center Portsmouth (NMCP) in Virginia between January 1, 2019, and December 31, 2020. The 2013 USPSTF LCS guidelines were followed as the 2021 guidelines had not been published before the start of the study; thus, eligible participants included adults aged 55 to 80 years with at least a 30-pack-year smoking history and currently smoked or had quit within 15 years from the date of study consent.6,7
Between November 2020 and May 2021, study investigators screened 287 patient records and recruited 190 participants by telephone, starting with individuals who had the most recent LDCT and working backward until reaching the predetermined 170 subjects who had undergone in-office consents before ECG-gated CT scans. Since LDCT was not obtained simultaneously with the ECG-gated CT, participants were required to complete their gated CT within 24 months of their last LDCT. Of the 190 subjects initially recruited, those who were ineligible for LCS (n = 4), had a history of angioplasty, stent, or bypass revascularization procedure (n = 4), did not complete their ECG-gated CT within the specified time frame (n = 8), or withdrew from the study (n = 4) were excluded. While gated CT scans were scored for CAC in the present time, LDCT (previously only read for general lung pathology) was not scored until after participant consent. Patients were peripherally followed, via health record reviews, for 3 months after their gated CT to document any additional imaging ordered by their primary care practitioners. The study was approved by the NMCP Institutional Review Board.
Coronary Artery Calcification Scoring
We performed CT scans using Siemens SOMATOM Flash, a second-generation dual-source scanner; and GE LightSpeed VCT, a single-source, 64-slice scanner. A step-and-shoot prospective trigger technique was used, and contiguous axial images were reconstructed at 2.5-mm or 3-mm intervals for CAC quantification using the Agatston method.20 ECG-gated CT scans were electrocardiographically triggered at mid-diastole (70% of the R-R interval). Radiation dose reduction techniques involved adjustments of the mA according to body mass index and iterative reconstruction. LDCT scans were performed without ECG gating. We reconstructed contiguous axial images at 1-mm intervals for evaluation of the lung parenchyma. Similar dose-reduction techniques were used, to limit radiation exposure for each LDCT scan to < 1.5 mSv, per established guidelines.21 CAC on LDCT was also scored using the Agatston method. CAC was scored on the 2 scan types by different blinded reviewers.
Covariates
We reviewed outpatient health records to obtain participants’ age, sex, medical history, statin use, smoking status (current or former), and pack-years. International Classification of Diseases, Tenth Revision codes within medical encounters were used to document prevalent hypertension, hyperlipidemia, and diabetes mellitus. Participants’ most recent low-density lipoprotein value (within 24 months of ECG-gated CT) was recorded and 10-year ASCVD risk scores were calculated using the pooled cohorts equation.
Statistical Analysis
A power analysis performed before study initiation determined that a prospective sample size of 170 would be sufficient to provide strength of correlation between CAC scores calculated from ECG-gated CT and LDCT and achieve a statistical power of at least 80%. The Wilcoxon rank sum and Fisher exact tests were used to evaluate differences in continuous and categorical CAC scores, respectively. Given skewed distributions, Spearman rank correlations and Kendall W coefficient of concordance were respectively used to evaluate correlation and concordance of CAC scores between the 2 scan types. κ statistics were used to rate agreement between categorical CAC scores. Bland-Altman analysis was performed to determine the bias and limits of agreement between ECG-gated CT and LDCT.22 For categorical CAC score analysis, participants were categorized into 5 groups according to standard Agatston score cut-off points. We defined the 5 categories of CAC for both scan types based on previous analysis from Rumberger and colleagues: CAC = 0 (absent), CAC = 1-10 (minimal), CAC = 11-100 (mild), CAC = 101-400 (moderate), CAC > 400 (severe).23 Of note, LDCT reports at NMCP include a visual CAC score using these qualitative descriptors that were available to LDCT reviewers. Analyses were conducted using SAS version 9.4 and Microsoft Excel; P values < .05 were considered statistically significant.
Results
The 170 participants had a mean (SD) age of 62.1 (4.6) years and were 70.6% male (Table 1). Hyperlipidemia was the most prevalent cardiac risk factor with almost 70% of participants on a statin. There was no incidence of ischemic ASCVD during follow-up, although 1 participant was later diagnosed with lung cancer after evaluation of suspicious pulmonary findings on ECG-gated CT. CAC was identified on both scan types in 126 participants; however, LDCT was discordant with gated CT in identifying CAC in 24 subjects (P < .001).
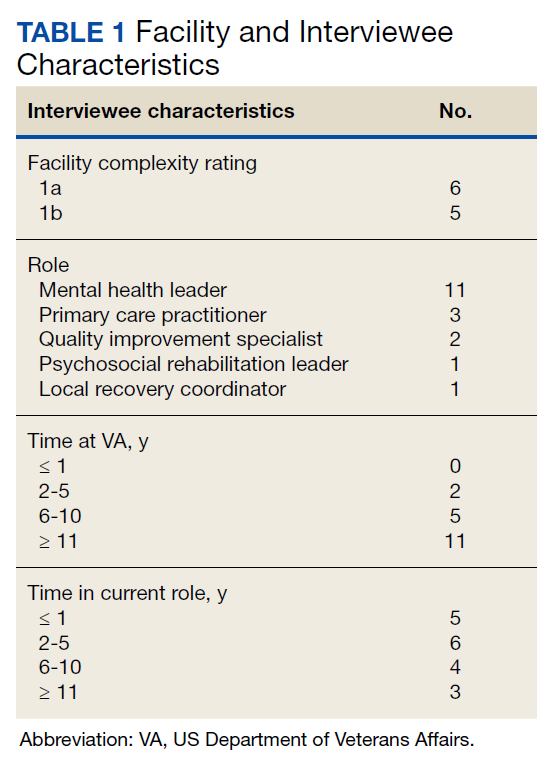
The correlation between CAC scores on ECG-gated CT and LDCT was 0.945 (P < .001) and the concordance was 0.643, indicating moderate agreement between CAC scores on the 2 different scans (Figure 1). Median CAC scores were significantly higher on ECG-gated CT when compared with LDCT (107.5 vs 48.1 Agatston units, respectively; P < .05). Table 2 shows the CAC score characteristics for both scan types. The κ statistic for agreement between categorical CAC scores on ECG-gated CT compared with LDCT was 0.49 (SEκ= 0.05; 95% CI, -0.73-1.71), and the weighted κ statistic was 0.71, indicating moderate to substantial agreement between the 2 scans using the specified cutoff points. The Bland-Altman analysis presented a mean bias of 111.45 Agatston units, with limits of agreement between -268.64 and 491.54, as shown in Figure 2, suggesting that CAC scores on ECG-gated CT were, on average, about 111 units higher than those on LDCT. Finally, there were 24 participants with CAC seen on ECG-gated CT but none identified on LDCT (P < .001); of this cohort 20 were already on a statin, and of the remaining 4 individuals, 1 met statin criteria based on a > 20% ASCVD risk score alone (regardless of CAC score), 1 with an intermediate risk score met statin criteria based on CAC score reporting, 1 did not meet criteria due to a low-risk score, and the last had no reportable ASCVD risk score.
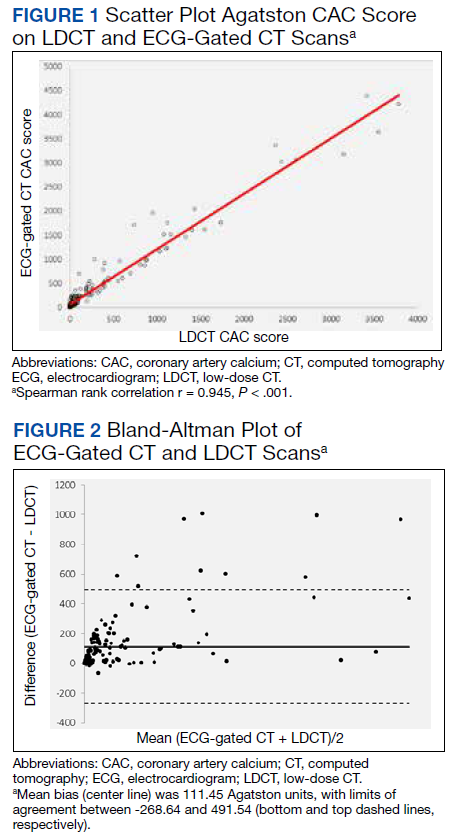
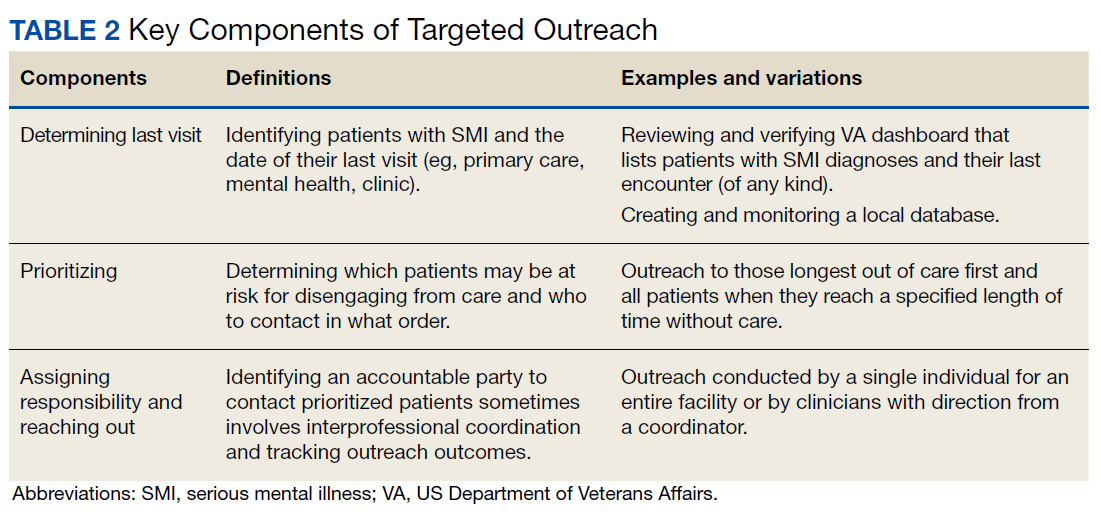
In the study, there were 80 participants with reportable borderline to intermediate 10-year ASCVD risk scores (5% ≤ 10-year ASCVD risk < 20%), 49 of which were taking a statin. Of the remaining 31 participants not on a statin, 19 met statin criteria after CAC was identified on ECG-gated CT (of these 18 also had CAC identified on LDCT). Subsequently, the number of participants who met statin criteria after additional CAC reporting (on ECG-gated CT and LDCT) was statistically significant (P < .001 and P < .05, respectively). Of the 49 participants on a statin, only 1 individual no longer met statin criteria due to a CAC score < 1 on gated CT.
Discussion
In this study population of recruited MHS beneficiaries, there was a strong correlation and moderate to substantial agreement between CAC scores calculated from LDCT and conventional ECG-gated CT. The number of nonstatin participants who met statin criteria and would have benefited from additional CAC score reporting was statistically significant as compared to their statin counterparts who no longer met the criteria.
CAC screening using nongated CT has become an increasingly available and consistently reproducible means for stratifying ASCVD risk and guiding statin therapy in individuals with equivocal ASCVD risk scores.24-26 As has been demonstrated in previous studies, our study additionally highlights the effective use of LDCT in not only identifying CAC, but also in beneficially impacting statin decisions in the high-risk smoking population.24-26 Our results also showed LDCT missed CAC in participants, the majority of which were already on a statin, and only 1 nonstatin individual benefited from additional CAC reporting. CAC scoring on LDCT should be an adjunct, not a substitute, for ASCVD risk stratification to help guide statin management.25,27
Our results may provide cost considerate implications for preventive CAC screening. While TRICARE covers the cost of ECG-gated CT for MHS beneficiaries, the same is not true of most nonmilitary insurance providers. Concerns about cancer risk from radiation exposure may also lead to hesitation about receiving additional CTs in the smoking population. Since the LCS population already receives annual LDCT, these scans can also be used for CAC scoring to help primary care professionals risk stratify their patients, as has been previously shown.28-31 Clinicians should consider implementing CAC scoring with annual LDCT scans, which would curtail further risks and expenses from CAC-specified scans.
Although CAC is scored visually and routinely reported in the body of LDCT reports at our facility, this is not a universal practice and was performed in only 44% of subjects with known CAC by a previous study.32 In 2007, there were 600,000 CAC scoring scans and > 9 million routine chest CTs performed in the United States.33 Based on our results and the growing consensus in the existing literature, CAC scoring on nongated CT is not only valid and reliable, but also can estimate ASCVD risk and subsequent mortality.34-36 Routine chest CTs remain an available resource for providing additional ASCVD risk stratification.
As we demonstrated, median CAC scores on LDCT were on average significantly lower than those from gated CT. This could be due to slice thickness variability between the GE and Siemens scanners or CAC progression between the time of the retrospective LDCT and prospective ECG-gated CT. Aside from this potential limitation, LDCT has been shown to have a high level of agreement with gated CT in predicting CAC, both visually and by the Agatston technique.37-39 Our results further support previous recommendations of utilizing CAC score categories when determining ASCVD risk from LDCT and that establishing scoring cutoff points warrants further development for potential standardization.37-39 Readers should be mindful that LDCT may still be less sensitive and underestimate low CAC levels and that ECG-gated CT may occasionally be more optimal in determining ASCVD risk when considering the negative predictive value of CAC.40
Limitations
Our study cohort was composed of MHS beneficiaries. Compared with the general population, these individuals may have greater access to care and be more likely to receive statins after preventive screenings. Additional studies may be required to assess CAC-associated statin eligibility among the general population. As discussed previously LDCT was not performed concomitantly with the ECG-gated CT. Although there was moderate to substantial CAC agreement between the 2 scan types, the timing difference could have led to absolute differences in CAC scores across both scan types and impacted the ability to detect low-level CAC on LDCT. CAC values should be interpreted based on the respective scan type.
Conclusions
LDCT is a reliable diagnostic alternative to ECG-gated CT in predicting CAC. CAC scores from LDCT are highly correlated and concordant with those from gated CT and can help guide statin management in individuals with intermediate ASCVD risk. The proposed duality of LDCT to assess ASCVD risk in addition to lung cancer can reduce the need for unnecessary scans while optimizing preventive clinical care. While coronary calcium and elevated CAC scores can facilitate clinical decision making to initiate statin therapy for intermediate-risk patients, physicians must still determine whether additional cardiac testing is warranted to avoid unnecessary procedures and health care costs. Smokers undergoing annual LDCT may benefit from standardized CAC scoring to help further stratify ASCVD risk while limiting the expense and radiation of additional scans.
Acknowledgments
The authors thank Ms. Lorie Gower for her contributions to the study.
1. Leigh A, McEvoy JW, Garg P, et al. Coronary artery calcium scores and atherosclerotic cardiovascular disease risk stratification in smokers. JACC Cardiovasc Imaging. 2019;12(5):852-861. doi:10.1016/j.jcmg.2017.12.017
2. Lu MT, Onuma OK, Massaro JM, D’Agostino RB Sr, O’Donnell CJ, Hoffmann U. Lung cancer screening eligibility in the community: cardiovascular risk factors, coronary artery calcification, and cardiovascular events. Circulation. 2016;134(12):897-899. doi:10.1161/CIRCULATIONAHA.116.023957
3. Tailor TD, Chiles C, Yeboah J, et al. Cardiovascular risk in the lung cancer screening population: a multicenter study evaluating the association between coronary artery calcification and preventive statin prescription. J Am Coll Radiol. 2021;18(9):1258-1266. doi:10.1016/j.jacr.2021.01.015
4. National Lung Screening Trial Research Team, Church TR, Black WC, et al. Results of initial low-dose computed tomographic screening for lung cancer. N Engl J Med. 2013;368(21):1980-1991. doi:10.1056/NEJMoa1209120
5. Mozaffarian D, Benjamin EJ, Go AS, et al. Heart disease and stroke statistics—2015 update: a report from the American Heart Association. Circulation. 2015;131(4):e29-e322. doi:10.1161/CIR.0000000000000152
6. Moyer VA; U.S. Preventive Services Task Force. Screening for lung cancer: U.S. Preventive Services Task Force recommendation statement. Ann Intern Med. 2014;160(5):330-338. doi:10.7326/M13-2771
7. US Preventive Services Task Force, Krist AH, Davidson KW, et al. Screening for lung cancer: US Preventive Services Task Force Recommendation Statement. JAMA. 2021;325(10):962-970. doi:10.1001/jama.2021.1117
8. Arcadi T, Maffei E, Sverzellati N, et al. Coronary artery calcium score on low-dose computed tomography for lung cancer screening. World J Radiol. 2014;6(6):381-387. doi:10.4329/wjr.v6.i6.381
9. Kim SM, Chung MJ, Lee KS, Choe YH, Yi CA, Choe BK. Coronary calcium screening using low-dose lung cancer screening: effectiveness of MDCT with retrospective reconstruction. AJR Am J Roentgenol. 2008;190(4):917-922. doi:10.2214/AJR.07.2979
10. Ruparel M, Quaife SL, Dickson JL, et al. Evaluation of cardiovascular risk in a lung cancer screening cohort. Thorax. 2019;74(12):1140-1146. doi:10.1136/thoraxjnl-2018-212812
11. Jacobs PC, Gondrie MJ, van der Graaf Y, et al. Coronary artery calcium can predict all-cause mortality and cardiovascular events on low-dose CT screening for lung cancer. AJR Am J Roentgenol. 2012;198(3):505-511. doi:10.2214/AJR.10.5577
12. Fan L, Fan K. Lung cancer screening CT-based coronary artery calcification in predicting cardiovascular events: A systematic review and meta-analysis. Medicine (Baltimore). 2018;97(20):e10461. doi:10.1097/MD.0000000000010461
13. Greenland P, Blaha MJ, Budoff MJ, Erbel R, Watson KE. Coronary calcium score and cardiovascular risk. J Am Coll Cardiol. 2018;72(4):434-447. doi:10.1016/j.jacc.2018.05.027
14. Arnett DK, Blumenthal RS, Albert MA, et al. 2019 ACC/AHA Guideline on the Primary Prevention of Cardiovascular Disease: Executive Summary: A Report of the American College of Cardiology/American Heart Association Task Force on Clinical Practice Guidelines. Circulation. 2019;140(11):e563-e595. doi:10.1161/CIR.0000000000000677
15. Pletcher MJ, Pignone M, Earnshaw S, et al. Using the coronary artery calcium score to guide statin therapy: a cost-effectiveness analysis. Circ Cardiovasc Qual Outcomes. 2014;7(2):276-284. doi:10.1161/CIRCOUTCOMES.113.000799
16. Hong JC, Blankstein R, Shaw LJ, et al. Implications of coronary artery calcium testing for treatment decisions among statin candidates according to the ACC/AHA Cholesterol Management Guidelines: a cost-effectiveness analysis. JACC Cardiovasc Imaging. 2017;10(8):938-952. doi:10.1016/j.jcmg.2017.04.014
17. US Preventive Services Task Force, Curry SJ, Krist AH, et al. Risk assessment for cardiovascular disease with nontraditional risk factors: US Preventive Services Task Force Recommendation Statement. JAMA. 2018;320(3):272-280. doi:10.1001/jama.2018.8359
18. Hughes-Austin JM, Dominguez A 3rd, Allison MA, et al. Relationship of coronary calcium on standard chest CT scans with mortality. JACC Cardiovasc Imaging. 2016;9(2):152-159. doi:10.1016/j.jcmg.2015.06.030
19. Haller C, Vandehei A, Fisher R, et al. Incidence and implication of coronary artery calcium on non-gated chest computed tomography scans: a large observational cohort. Cureus. 2019;11(11):e6218. Published 2019 Nov 22. doi:10.7759/cureus.6218
20. Agatston AS, Janowitz WR, Hildner FJ, Zusmer NR, Viamonte M Jr, Detrano R. Quantification of coronary artery calcium using ultrafast computed tomography. J Am Coll Cardiol. 1990;15(4):827-832. doi:10.1016/0735-1097(90)90282-t
21. Aberle D, Berg C, Black W, et al. The National Lung Screening Trial: overview and study design. Radiology. 2011;258(1):243-53. doi:10.1148/radiol.10091808
22. Bland JM, Altman DG. Measuring agreement in method comparison studies. Stat Methods Med Res. 1999;8(2):135-160. doi:10.1177/096228029900800204
23. Rumberger JA, Brundage BH, Rader DJ, Kondos G. Electron beam computed tomographic coronary calcium scanning: a review and guidelines for use in asymptomatic persons. Mayo Clin Proc. 1999;74(3):243-252. doi:10.4065/74.3.243
24. Douthit NT, Wyatt N, Schwartz B. Clinical impact of reporting coronary artery calcium scores of non-gated chest computed tomography on statin management. Cureus. 2021;13(5):e14856. Published 2021 May 5. doi:10.7759/cureus.14856
25. Miedema MD, Dardari ZA, Kianoush S, et al. Statin eligibility, coronary artery calcium, and subsequent cardiovascular events according to the 2016 United States Preventive Services Task Force (USPSTF) Statin Guidelines: MESA (Multi-Ethnic Study of Atherosclerosis). J Am Heart Assoc. 2018;7(12):e008920. Published 2018 Jun 13. doi:10.1161/JAHA.118.008920
26. Fisher R, Vandehei A, Haller C, et al. Reporting the presence of coronary artery calcium in the final impression of non-gated CT chest scans increases the appropriate utilization of statins. Cureus. 2020;12(9):e10579. Published 2020 Sep 21. doi:10.7759/cureus.10579
27. Blaha MJ, Budoff MJ, DeFilippis AP, et al. Associations between C-reactive protein, coronary artery calcium, and cardiovascular events: implications for the JUPITER population from MESA, a population-based cohort study. Lancet. 2011;378(9792):684-692. doi:10.1016/S0140-6736(11)60784-8
28. Waheed S, Pollack S, Roth M, Reichek N, Guerci A, Cao JJ. Collective impact of conventional cardiovascular risk factors and coronary calcium score on clinical outcomes with or without statin therapy: the St Francis Heart Study. Atherosclerosis. 2016;255:193-199. doi:10.1016/j.atherosclerosis.2016.09.060
29. Mahabadi AA, Möhlenkamp S, Lehmann N, et al. CAC score improves coronary and CV risk assessment above statin indication by ESC and AHA/ACC Primary Prevention Guidelines. JACC Cardiovasc Imaging. 2017;10(2):143-153. doi:10.1016/j.jcmg.2016.03.022
30. Blaha MJ, Cainzos-Achirica M, Greenland P, et al. Role of coronary artery calcium score of zero and other negative risk markers for cardiovascular disease: the Multi-Ethnic Study of Atherosclerosis (MESA). Circulation. 2016;133(9):849-858. doi:10.1161/CIRCULATIONAHA.115.018524
31. Hoffmann U, Massaro JM, D’Agostino RB Sr, Kathiresan S, Fox CS, O’Donnell CJ. Cardiovascular event prediction and risk reclassification by coronary, aortic, and valvular calcification in the Framingham Heart Study. J Am Heart Assoc. 2016;5(2):e003144. Published 2016 Feb 22. doi:10.1161/JAHA.115.003144
32. Williams KA Sr, Kim JT, Holohan KM. Frequency of unrecognized, unreported, or underreported coronary artery and cardiovascular calcification on noncardiac chest CT. J Cardiovasc Comput Tomogr. 2013;7(3):167-172. doi:10.1016/j.jcct.2013.05.003

33. Berrington de González A, Mahesh M, Kim KP, et al. Projected cancer risks from computed tomographic scans performed in the United States in 2007. Arch Intern Med. 2009;169(22):2071-2077. doi:10.1001/archinternmed.2009.440
34. Azour L, Kadoch MA, Ward TJ, Eber CD, Jacobi AH. Estimation of cardiovascular risk on routine chest CT: Ordinal coronary artery calcium scoring as an accurate predictor of Agatston score ranges. J Cardiovasc Comput Tomogr. 2017;11(1):8-15. doi:10.1016/j.jcct.2016.10.001
35. Waltz J, Kocher M, Kahn J, Dirr M, Burt JR. The future of concurrent automated coronary artery calcium scoring on screening low-dose computed tomography. Cureus. 2020;12(6):e8574. Published 2020 Jun 12. doi:10.7759/cureus.8574
36. Huang YL, Wu FZ, Wang YC, et al. Reliable categorisation of visual scoring of coronary artery calcification on low-dose CT for lung cancer screening: validation with the standard Agatston score. Eur Radiol. 2013;23(5):1226-1233. doi:10.1007/s00330-012-2726-5
37. Kim YK, Sung YM, Cho SH, Park YN, Choi HY. Reliability analysis of visual ranking of coronary artery calcification on low-dose CT of the thorax for lung cancer screening: comparison with ECG-gated calcium scoring CT. Int J Cardiovasc Imaging. 2014;30 Suppl 2:81-87. doi:10.1007/s10554-014-0507-8
38. Xia C, Vonder M, Pelgrim GJ, et al. High-pitch dual-source CT for coronary artery calcium scoring: A head-to-head comparison of non-triggered chest versus triggered cardiac acquisition. J Cardiovasc Comput Tomogr. 2021;15(1):65-72. doi:10.1016/j.jcct.2020.04.013
39. Hutt A, Duhamel A, Deken V, et al. Coronary calcium screening with dual-source CT: reliability of ungated, high-pitch chest CT in comparison with dedicated calcium-scoring CT. Eur Radiol. 2016;26(6):1521-1528. doi:10.1007/s00330-015-3978-7
40. Blaha MJ, Budoff MJ, Tota-Maharaj R, et al. Improving the CAC score by addition of regional measures of calcium distribution: Multi-Ethnic Study of Atherosclerosis. JACC Cardiovasc Imaging. 2016;9(12):1407-1416. doi:10.1016/j.jcmg.2016.03.001
Cigarette smoking is an independent risk factor for lung cancer and atherosclerotic cardiovascular disease (ASCVD).1-3 The National Lung Screening Trial (NLST) demonstrated both lung cancer mortality reduction with the use of surveillance low-dose computed tomography (LDCT) and ASCVD as the most common cause of death among smokers.4,5 ASCVD remains the leading cause of death in the lung cancer screening (LCS) population.2,3 After publication of the NLST results, the US Preventive Services Task Force (USPSTF) established LCS eligibility among smokers and the Center for Medicare and Medicaid Services approved payment for annual LDCT in this group.1,6,7
Recently LDCT has been proposed as an adjunct diagnostic tool for detecting coronary artery calcium (CAC), which is independently associated with ASCVD and mortality.8-13 CAC scores have been recommended by the 2019 American College of Cardiology/American Heart Association cholesterol treatment guidelines and shown to be cost-effective in guiding statin therapy for patients with borderline to intermediate ASCVD risk.14-16 While CAC is conventionally quantified using electrocardiogram (ECG)-gated CT, these scans are not routinely performed in clinical practice because preventive CAC screening is neither recommended by the USPSTF nor covered by most insurance providers.17,18 LDCT, conversely, is reimbursable and a well-validated ASCVD risk predictor.18,19
In this study, we aimed to determine the validity of LDCT in identifying CAC among the military LCS population and whether it would impact statin recommendations based on 10-year ASCVD risk.
Methods
Participants were recruited from a retrospective cohort of 563 Military Health System (MHS) beneficiaries who received LCS with LDCT at Naval Medical Center Portsmouth (NMCP) in Virginia between January 1, 2019, and December 31, 2020. The 2013 USPSTF LCS guidelines were followed as the 2021 guidelines had not been published before the start of the study; thus, eligible participants included adults aged 55 to 80 years with at least a 30-pack-year smoking history and currently smoked or had quit within 15 years from the date of study consent.6,7
Between November 2020 and May 2021, study investigators screened 287 patient records and recruited 190 participants by telephone, starting with individuals who had the most recent LDCT and working backward until reaching the predetermined 170 subjects who had undergone in-office consents before ECG-gated CT scans. Since LDCT was not obtained simultaneously with the ECG-gated CT, participants were required to complete their gated CT within 24 months of their last LDCT. Of the 190 subjects initially recruited, those who were ineligible for LCS (n = 4), had a history of angioplasty, stent, or bypass revascularization procedure (n = 4), did not complete their ECG-gated CT within the specified time frame (n = 8), or withdrew from the study (n = 4) were excluded. While gated CT scans were scored for CAC in the present time, LDCT (previously only read for general lung pathology) was not scored until after participant consent. Patients were peripherally followed, via health record reviews, for 3 months after their gated CT to document any additional imaging ordered by their primary care practitioners. The study was approved by the NMCP Institutional Review Board.
Coronary Artery Calcification Scoring
We performed CT scans using Siemens SOMATOM Flash, a second-generation dual-source scanner; and GE LightSpeed VCT, a single-source, 64-slice scanner. A step-and-shoot prospective trigger technique was used, and contiguous axial images were reconstructed at 2.5-mm or 3-mm intervals for CAC quantification using the Agatston method.20 ECG-gated CT scans were electrocardiographically triggered at mid-diastole (70% of the R-R interval). Radiation dose reduction techniques involved adjustments of the mA according to body mass index and iterative reconstruction. LDCT scans were performed without ECG gating. We reconstructed contiguous axial images at 1-mm intervals for evaluation of the lung parenchyma. Similar dose-reduction techniques were used, to limit radiation exposure for each LDCT scan to < 1.5 mSv, per established guidelines.21 CAC on LDCT was also scored using the Agatston method. CAC was scored on the 2 scan types by different blinded reviewers.
Covariates
We reviewed outpatient health records to obtain participants’ age, sex, medical history, statin use, smoking status (current or former), and pack-years. International Classification of Diseases, Tenth Revision codes within medical encounters were used to document prevalent hypertension, hyperlipidemia, and diabetes mellitus. Participants’ most recent low-density lipoprotein value (within 24 months of ECG-gated CT) was recorded and 10-year ASCVD risk scores were calculated using the pooled cohorts equation.
Statistical Analysis
A power analysis performed before study initiation determined that a prospective sample size of 170 would be sufficient to provide strength of correlation between CAC scores calculated from ECG-gated CT and LDCT and achieve a statistical power of at least 80%. The Wilcoxon rank sum and Fisher exact tests were used to evaluate differences in continuous and categorical CAC scores, respectively. Given skewed distributions, Spearman rank correlations and Kendall W coefficient of concordance were respectively used to evaluate correlation and concordance of CAC scores between the 2 scan types. κ statistics were used to rate agreement between categorical CAC scores. Bland-Altman analysis was performed to determine the bias and limits of agreement between ECG-gated CT and LDCT.22 For categorical CAC score analysis, participants were categorized into 5 groups according to standard Agatston score cut-off points. We defined the 5 categories of CAC for both scan types based on previous analysis from Rumberger and colleagues: CAC = 0 (absent), CAC = 1-10 (minimal), CAC = 11-100 (mild), CAC = 101-400 (moderate), CAC > 400 (severe).23 Of note, LDCT reports at NMCP include a visual CAC score using these qualitative descriptors that were available to LDCT reviewers. Analyses were conducted using SAS version 9.4 and Microsoft Excel; P values < .05 were considered statistically significant.
Results
The 170 participants had a mean (SD) age of 62.1 (4.6) years and were 70.6% male (Table 1). Hyperlipidemia was the most prevalent cardiac risk factor with almost 70% of participants on a statin. There was no incidence of ischemic ASCVD during follow-up, although 1 participant was later diagnosed with lung cancer after evaluation of suspicious pulmonary findings on ECG-gated CT. CAC was identified on both scan types in 126 participants; however, LDCT was discordant with gated CT in identifying CAC in 24 subjects (P < .001).
The correlation between CAC scores on ECG-gated CT and LDCT was 0.945 (P < .001) and the concordance was 0.643, indicating moderate agreement between CAC scores on the 2 different scans (Figure 1). Median CAC scores were significantly higher on ECG-gated CT when compared with LDCT (107.5 vs 48.1 Agatston units, respectively; P < .05). Table 2 shows the CAC score characteristics for both scan types. The κ statistic for agreement between categorical CAC scores on ECG-gated CT compared with LDCT was 0.49 (SEκ= 0.05; 95% CI, -0.73-1.71), and the weighted κ statistic was 0.71, indicating moderate to substantial agreement between the 2 scans using the specified cutoff points. The Bland-Altman analysis presented a mean bias of 111.45 Agatston units, with limits of agreement between -268.64 and 491.54, as shown in Figure 2, suggesting that CAC scores on ECG-gated CT were, on average, about 111 units higher than those on LDCT. Finally, there were 24 participants with CAC seen on ECG-gated CT but none identified on LDCT (P < .001); of this cohort 20 were already on a statin, and of the remaining 4 individuals, 1 met statin criteria based on a > 20% ASCVD risk score alone (regardless of CAC score), 1 with an intermediate risk score met statin criteria based on CAC score reporting, 1 did not meet criteria due to a low-risk score, and the last had no reportable ASCVD risk score.
In the study, there were 80 participants with reportable borderline to intermediate 10-year ASCVD risk scores (5% ≤ 10-year ASCVD risk < 20%), 49 of which were taking a statin. Of the remaining 31 participants not on a statin, 19 met statin criteria after CAC was identified on ECG-gated CT (of these 18 also had CAC identified on LDCT). Subsequently, the number of participants who met statin criteria after additional CAC reporting (on ECG-gated CT and LDCT) was statistically significant (P < .001 and P < .05, respectively). Of the 49 participants on a statin, only 1 individual no longer met statin criteria due to a CAC score < 1 on gated CT.
Discussion
In this study population of recruited MHS beneficiaries, there was a strong correlation and moderate to substantial agreement between CAC scores calculated from LDCT and conventional ECG-gated CT. The number of nonstatin participants who met statin criteria and would have benefited from additional CAC score reporting was statistically significant as compared to their statin counterparts who no longer met the criteria.
CAC screening using nongated CT has become an increasingly available and consistently reproducible means for stratifying ASCVD risk and guiding statin therapy in individuals with equivocal ASCVD risk scores.24-26 As has been demonstrated in previous studies, our study additionally highlights the effective use of LDCT in not only identifying CAC, but also in beneficially impacting statin decisions in the high-risk smoking population.24-26 Our results also showed LDCT missed CAC in participants, the majority of which were already on a statin, and only 1 nonstatin individual benefited from additional CAC reporting. CAC scoring on LDCT should be an adjunct, not a substitute, for ASCVD risk stratification to help guide statin management.25,27
Our results may provide cost considerate implications for preventive CAC screening. While TRICARE covers the cost of ECG-gated CT for MHS beneficiaries, the same is not true of most nonmilitary insurance providers. Concerns about cancer risk from radiation exposure may also lead to hesitation about receiving additional CTs in the smoking population. Since the LCS population already receives annual LDCT, these scans can also be used for CAC scoring to help primary care professionals risk stratify their patients, as has been previously shown.28-31 Clinicians should consider implementing CAC scoring with annual LDCT scans, which would curtail further risks and expenses from CAC-specified scans.
Although CAC is scored visually and routinely reported in the body of LDCT reports at our facility, this is not a universal practice and was performed in only 44% of subjects with known CAC by a previous study.32 In 2007, there were 600,000 CAC scoring scans and > 9 million routine chest CTs performed in the United States.33 Based on our results and the growing consensus in the existing literature, CAC scoring on nongated CT is not only valid and reliable, but also can estimate ASCVD risk and subsequent mortality.34-36 Routine chest CTs remain an available resource for providing additional ASCVD risk stratification.
As we demonstrated, median CAC scores on LDCT were on average significantly lower than those from gated CT. This could be due to slice thickness variability between the GE and Siemens scanners or CAC progression between the time of the retrospective LDCT and prospective ECG-gated CT. Aside from this potential limitation, LDCT has been shown to have a high level of agreement with gated CT in predicting CAC, both visually and by the Agatston technique.37-39 Our results further support previous recommendations of utilizing CAC score categories when determining ASCVD risk from LDCT and that establishing scoring cutoff points warrants further development for potential standardization.37-39 Readers should be mindful that LDCT may still be less sensitive and underestimate low CAC levels and that ECG-gated CT may occasionally be more optimal in determining ASCVD risk when considering the negative predictive value of CAC.40
Limitations
Our study cohort was composed of MHS beneficiaries. Compared with the general population, these individuals may have greater access to care and be more likely to receive statins after preventive screenings. Additional studies may be required to assess CAC-associated statin eligibility among the general population. As discussed previously LDCT was not performed concomitantly with the ECG-gated CT. Although there was moderate to substantial CAC agreement between the 2 scan types, the timing difference could have led to absolute differences in CAC scores across both scan types and impacted the ability to detect low-level CAC on LDCT. CAC values should be interpreted based on the respective scan type.
Conclusions
LDCT is a reliable diagnostic alternative to ECG-gated CT in predicting CAC. CAC scores from LDCT are highly correlated and concordant with those from gated CT and can help guide statin management in individuals with intermediate ASCVD risk. The proposed duality of LDCT to assess ASCVD risk in addition to lung cancer can reduce the need for unnecessary scans while optimizing preventive clinical care. While coronary calcium and elevated CAC scores can facilitate clinical decision making to initiate statin therapy for intermediate-risk patients, physicians must still determine whether additional cardiac testing is warranted to avoid unnecessary procedures and health care costs. Smokers undergoing annual LDCT may benefit from standardized CAC scoring to help further stratify ASCVD risk while limiting the expense and radiation of additional scans.
Acknowledgments
The authors thank Ms. Lorie Gower for her contributions to the study.
1. Leigh A, McEvoy JW, Garg P, et al. Coronary artery calcium scores and atherosclerotic cardiovascular disease risk stratification in smokers. JACC Cardiovasc Imaging. 2019;12(5):852-861. doi:10.1016/j.jcmg.2017.12.017
2. Lu MT, Onuma OK, Massaro JM, D’Agostino RB Sr, O’Donnell CJ, Hoffmann U. Lung cancer screening eligibility in the community: cardiovascular risk factors, coronary artery calcification, and cardiovascular events. Circulation. 2016;134(12):897-899. doi:10.1161/CIRCULATIONAHA.116.023957
3. Tailor TD, Chiles C, Yeboah J, et al. Cardiovascular risk in the lung cancer screening population: a multicenter study evaluating the association between coronary artery calcification and preventive statin prescription. J Am Coll Radiol. 2021;18(9):1258-1266. doi:10.1016/j.jacr.2021.01.015
4. National Lung Screening Trial Research Team, Church TR, Black WC, et al. Results of initial low-dose computed tomographic screening for lung cancer. N Engl J Med. 2013;368(21):1980-1991. doi:10.1056/NEJMoa1209120
5. Mozaffarian D, Benjamin EJ, Go AS, et al. Heart disease and stroke statistics—2015 update: a report from the American Heart Association. Circulation. 2015;131(4):e29-e322. doi:10.1161/CIR.0000000000000152
6. Moyer VA; U.S. Preventive Services Task Force. Screening for lung cancer: U.S. Preventive Services Task Force recommendation statement. Ann Intern Med. 2014;160(5):330-338. doi:10.7326/M13-2771
7. US Preventive Services Task Force, Krist AH, Davidson KW, et al. Screening for lung cancer: US Preventive Services Task Force Recommendation Statement. JAMA. 2021;325(10):962-970. doi:10.1001/jama.2021.1117
8. Arcadi T, Maffei E, Sverzellati N, et al. Coronary artery calcium score on low-dose computed tomography for lung cancer screening. World J Radiol. 2014;6(6):381-387. doi:10.4329/wjr.v6.i6.381
9. Kim SM, Chung MJ, Lee KS, Choe YH, Yi CA, Choe BK. Coronary calcium screening using low-dose lung cancer screening: effectiveness of MDCT with retrospective reconstruction. AJR Am J Roentgenol. 2008;190(4):917-922. doi:10.2214/AJR.07.2979
10. Ruparel M, Quaife SL, Dickson JL, et al. Evaluation of cardiovascular risk in a lung cancer screening cohort. Thorax. 2019;74(12):1140-1146. doi:10.1136/thoraxjnl-2018-212812
11. Jacobs PC, Gondrie MJ, van der Graaf Y, et al. Coronary artery calcium can predict all-cause mortality and cardiovascular events on low-dose CT screening for lung cancer. AJR Am J Roentgenol. 2012;198(3):505-511. doi:10.2214/AJR.10.5577
12. Fan L, Fan K. Lung cancer screening CT-based coronary artery calcification in predicting cardiovascular events: A systematic review and meta-analysis. Medicine (Baltimore). 2018;97(20):e10461. doi:10.1097/MD.0000000000010461
13. Greenland P, Blaha MJ, Budoff MJ, Erbel R, Watson KE. Coronary calcium score and cardiovascular risk. J Am Coll Cardiol. 2018;72(4):434-447. doi:10.1016/j.jacc.2018.05.027
14. Arnett DK, Blumenthal RS, Albert MA, et al. 2019 ACC/AHA Guideline on the Primary Prevention of Cardiovascular Disease: Executive Summary: A Report of the American College of Cardiology/American Heart Association Task Force on Clinical Practice Guidelines. Circulation. 2019;140(11):e563-e595. doi:10.1161/CIR.0000000000000677
15. Pletcher MJ, Pignone M, Earnshaw S, et al. Using the coronary artery calcium score to guide statin therapy: a cost-effectiveness analysis. Circ Cardiovasc Qual Outcomes. 2014;7(2):276-284. doi:10.1161/CIRCOUTCOMES.113.000799
16. Hong JC, Blankstein R, Shaw LJ, et al. Implications of coronary artery calcium testing for treatment decisions among statin candidates according to the ACC/AHA Cholesterol Management Guidelines: a cost-effectiveness analysis. JACC Cardiovasc Imaging. 2017;10(8):938-952. doi:10.1016/j.jcmg.2017.04.014
17. US Preventive Services Task Force, Curry SJ, Krist AH, et al. Risk assessment for cardiovascular disease with nontraditional risk factors: US Preventive Services Task Force Recommendation Statement. JAMA. 2018;320(3):272-280. doi:10.1001/jama.2018.8359
18. Hughes-Austin JM, Dominguez A 3rd, Allison MA, et al. Relationship of coronary calcium on standard chest CT scans with mortality. JACC Cardiovasc Imaging. 2016;9(2):152-159. doi:10.1016/j.jcmg.2015.06.030
19. Haller C, Vandehei A, Fisher R, et al. Incidence and implication of coronary artery calcium on non-gated chest computed tomography scans: a large observational cohort. Cureus. 2019;11(11):e6218. Published 2019 Nov 22. doi:10.7759/cureus.6218
20. Agatston AS, Janowitz WR, Hildner FJ, Zusmer NR, Viamonte M Jr, Detrano R. Quantification of coronary artery calcium using ultrafast computed tomography. J Am Coll Cardiol. 1990;15(4):827-832. doi:10.1016/0735-1097(90)90282-t
21. Aberle D, Berg C, Black W, et al. The National Lung Screening Trial: overview and study design. Radiology. 2011;258(1):243-53. doi:10.1148/radiol.10091808
22. Bland JM, Altman DG. Measuring agreement in method comparison studies. Stat Methods Med Res. 1999;8(2):135-160. doi:10.1177/096228029900800204
23. Rumberger JA, Brundage BH, Rader DJ, Kondos G. Electron beam computed tomographic coronary calcium scanning: a review and guidelines for use in asymptomatic persons. Mayo Clin Proc. 1999;74(3):243-252. doi:10.4065/74.3.243
24. Douthit NT, Wyatt N, Schwartz B. Clinical impact of reporting coronary artery calcium scores of non-gated chest computed tomography on statin management. Cureus. 2021;13(5):e14856. Published 2021 May 5. doi:10.7759/cureus.14856
25. Miedema MD, Dardari ZA, Kianoush S, et al. Statin eligibility, coronary artery calcium, and subsequent cardiovascular events according to the 2016 United States Preventive Services Task Force (USPSTF) Statin Guidelines: MESA (Multi-Ethnic Study of Atherosclerosis). J Am Heart Assoc. 2018;7(12):e008920. Published 2018 Jun 13. doi:10.1161/JAHA.118.008920
26. Fisher R, Vandehei A, Haller C, et al. Reporting the presence of coronary artery calcium in the final impression of non-gated CT chest scans increases the appropriate utilization of statins. Cureus. 2020;12(9):e10579. Published 2020 Sep 21. doi:10.7759/cureus.10579
27. Blaha MJ, Budoff MJ, DeFilippis AP, et al. Associations between C-reactive protein, coronary artery calcium, and cardiovascular events: implications for the JUPITER population from MESA, a population-based cohort study. Lancet. 2011;378(9792):684-692. doi:10.1016/S0140-6736(11)60784-8
28. Waheed S, Pollack S, Roth M, Reichek N, Guerci A, Cao JJ. Collective impact of conventional cardiovascular risk factors and coronary calcium score on clinical outcomes with or without statin therapy: the St Francis Heart Study. Atherosclerosis. 2016;255:193-199. doi:10.1016/j.atherosclerosis.2016.09.060
29. Mahabadi AA, Möhlenkamp S, Lehmann N, et al. CAC score improves coronary and CV risk assessment above statin indication by ESC and AHA/ACC Primary Prevention Guidelines. JACC Cardiovasc Imaging. 2017;10(2):143-153. doi:10.1016/j.jcmg.2016.03.022
30. Blaha MJ, Cainzos-Achirica M, Greenland P, et al. Role of coronary artery calcium score of zero and other negative risk markers for cardiovascular disease: the Multi-Ethnic Study of Atherosclerosis (MESA). Circulation. 2016;133(9):849-858. doi:10.1161/CIRCULATIONAHA.115.018524
31. Hoffmann U, Massaro JM, D’Agostino RB Sr, Kathiresan S, Fox CS, O’Donnell CJ. Cardiovascular event prediction and risk reclassification by coronary, aortic, and valvular calcification in the Framingham Heart Study. J Am Heart Assoc. 2016;5(2):e003144. Published 2016 Feb 22. doi:10.1161/JAHA.115.003144
32. Williams KA Sr, Kim JT, Holohan KM. Frequency of unrecognized, unreported, or underreported coronary artery and cardiovascular calcification on noncardiac chest CT. J Cardiovasc Comput Tomogr. 2013;7(3):167-172. doi:10.1016/j.jcct.2013.05.003
33. Berrington de González A, Mahesh M, Kim KP, et al. Projected cancer risks from computed tomographic scans performed in the United States in 2007. Arch Intern Med. 2009;169(22):2071-2077. doi:10.1001/archinternmed.2009.440
34. Azour L, Kadoch MA, Ward TJ, Eber CD, Jacobi AH. Estimation of cardiovascular risk on routine chest CT: Ordinal coronary artery calcium scoring as an accurate predictor of Agatston score ranges. J Cardiovasc Comput Tomogr. 2017;11(1):8-15. doi:10.1016/j.jcct.2016.10.001
35. Waltz J, Kocher M, Kahn J, Dirr M, Burt JR. The future of concurrent automated coronary artery calcium scoring on screening low-dose computed tomography. Cureus. 2020;12(6):e8574. Published 2020 Jun 12. doi:10.7759/cureus.8574
36. Huang YL, Wu FZ, Wang YC, et al. Reliable categorisation of visual scoring of coronary artery calcification on low-dose CT for lung cancer screening: validation with the standard Agatston score. Eur Radiol. 2013;23(5):1226-1233. doi:10.1007/s00330-012-2726-5
37. Kim YK, Sung YM, Cho SH, Park YN, Choi HY. Reliability analysis of visual ranking of coronary artery calcification on low-dose CT of the thorax for lung cancer screening: comparison with ECG-gated calcium scoring CT. Int J Cardiovasc Imaging. 2014;30 Suppl 2:81-87. doi:10.1007/s10554-014-0507-8
38. Xia C, Vonder M, Pelgrim GJ, et al. High-pitch dual-source CT for coronary artery calcium scoring: A head-to-head comparison of non-triggered chest versus triggered cardiac acquisition. J Cardiovasc Comput Tomogr. 2021;15(1):65-72. doi:10.1016/j.jcct.2020.04.013
39. Hutt A, Duhamel A, Deken V, et al. Coronary calcium screening with dual-source CT: reliability of ungated, high-pitch chest CT in comparison with dedicated calcium-scoring CT. Eur Radiol. 2016;26(6):1521-1528. doi:10.1007/s00330-015-3978-7
40. Blaha MJ, Budoff MJ, Tota-Maharaj R, et al. Improving the CAC score by addition of regional measures of calcium distribution: Multi-Ethnic Study of Atherosclerosis. JACC Cardiovasc Imaging. 2016;9(12):1407-1416. doi:10.1016/j.jcmg.2016.03.001
Engaging Veterans With Serious Mental Illness in Primary Care
People with serious mental illness (SMI) are at substantial risk for premature mortality, dying on average 10 to 20 years earlier than others.1 The reasons for this disparity are complex; however, the high prevalence of chronic disease and physical comorbidities in the SMI population have been identified as prominent factors.2 Engagement and reengagement in care, including primary care for medical comorbidities, can mitigate these mortality risks.2-4 Among veterans with SMI lost to follow-up care for more than 12 months, those not successfully reengaged in care were more likely to die compared with those reengaged in care.2,3
Given this evidence, health care systems, including the US Department of Veterans Affairs (VA), have looked to better engage these patients in care. These efforts have included mental health population health management, colocation of mental health with primary care, designation of primary care teams specializing in SMI, and integration of mental health and primary care services for patients experiencing homelessness.5-8
As part of a national approach to encourage locally driven quality improvement (QI), the VA compiles performance metrics for each facility, across a gamut of care settings, conditions, and veteran populations.9 Quarterly facility report cards, with longitudinal data and cross-facility comparisons, enable facilities to identify targets for QI and track improvement progress. One metric reports on the proportion of enrolled veterans with SMI who have primary care engagement, defined as having an assigned primary care practitioner (PCP) and a primary care visit in the prior 12 months.
In support of a QI initiative at the VA Greater Los Angeles Healthcare System (VAGLAHS), we sought to describe promising practices being utilized by VA facilities with higher levels of primary care engagement among their veterans with SMI populations.
Methods
We conducted semistructured telephone interviews with a purposeful sample of key informants at VA facilities with high levels of engagement in primary care among veterans with SMI. All project components were conducted by an interdisciplinary team, which included a medical anthropologist (JM), a mental health physician (PR), an internal medicine physician (KC), and other health services researchers (JB, AG). Because the primary objective of the project was QI, this project was designated as nonresearch by the VAGLAHS Institutional Review Board.
The VA Facility Complexity Model classifies facilities into 5 tiers: 1a (most complex), 1b, 1c, 2, and 3 (least complex), based on patient care volume, patient risk, complexity of clinical programs, and size of research and teaching programs. We sampled informants at VA facilities with complexity ratings of 1a or 1b with better than median scores for primary care engagement of veterans with SMI based on report cards from January 2019 to March 2019. To increase the likelihood of identifying lessons that can generalize to the VAGLAHS with its large population of veterans experiencing homelessness, we selected facilities serving populations consisting of more than 1000 veterans experiencing homelessness.
At each selected facility, we first aimed to interview mental health leaders responsible for quality measurement and improvement identified from a national VA database. We then used snowball sampling to identify other informants at these VA facilities who were knowledgeable about relevant processes. Potential interviewees were contacted via email.
Interviews
The interview guide was developed by the interdisciplinary team and based on published literature about strategies for engaging patients with SMI in care. Interview guide questions focused on local practice arrangements, panel management, population health practices, and quality measurement and improvement efforts for engaging veterans with SMI in primary care (Appendix). Interviews were conducted by telephone, from May 2019 through July 2019, by experienced qualitative interviewers (JM, JB). Interviewees were assured confidentiality of their responses.
Interview audio recordings were used to generate detailed notes (AG). Structured summaries were prepared from these notes, using a template based on the interview guide. We organized these summaries into matrices for analysis, grouping summarized points by interview domains to facilitate comparison across interviews.10-11 Our team reviewed and discussed the matrices, and iteratively identified and defined themes to identify the common engagement approaches and the nature of the connections between mental health and primary care. To ensure rigor, findings were checked by the senior qualitative lead (JM).
Results
The median SMI engagement score—defined as the proportion of veterans with SMI who have had a primary care visit in the prior 12 months and who have an assigned PCP—was 75.6% across 1a and 1b VA facilities. We identified 16 VA facilities that had a median or higher score and more than 1000 enrolled veterans experiencing homelessness. From these16 facilities, we emailed 31 potential interviewees, 14 of whom were identified from a VA database and 17 referred by other interviewees. In total, we interviewed 18 key informants across 11 (69%) facilities, including chiefs of psychology and mental health services, PCPs with mental health expertise, QI specialists, a psychosocial rehabilitation leader, and a local recovery coordinator, who helps veterans with SMI access recovery-oriented services. Characteristics of the facilities and interviewees are shown in Table 1. Interviews lasted a mean 35 (range, 26-50) minutes.

Engagement Approaches
The strategies used to engage veterans with SMI were heterogenous, with no single strategy common across all facilities. However, we identified 2 categories of engagement approaches: targeted outreach and routine practices.
Targeted outreach strategies included deliberate, systematic approaches to reach veterans with SMI outside of regularly scheduled visits. These strategies were designed to be proactive, often prioritizing veterans at risk of disengaging from care. Designated VA care team members identified and reached out to veterans well before 12 months had passed since their prior visit (the VA definition of disengagement from care); visits included any care at VA, including, but not exclusively, primary care. Table 2 describes the key components of targeted outreach strategies: (1) identifying veterans’ last visit; (2) prioritizing which veterans to outreach to; and (3) assigning responsibility and reaching out. A key defining feature of targeted outreach is that veterans were identified and prioritized for outreach independent from any visits with mental health or other VA services.

In identifying veterans at risk for disengagement, a designated employee in mental health or primary care (eg, local recovery coordinator) reviewed a VA dashboard or locally developed report that identified veterans who have not engaged in care for several months. This process was repeated regularly. The designated employee either contacted those veterans directly or coordinated with other clinicians and support staff. When possible, a clinician or nurse with an existing relationship with the veteran would call them. If no such relationship existed, an administrative staff member made a cold call, sometimes accompanied by mailed outreach materials.
Routine practices were business-as-usual activities embedded in regular clinical workflows that facilitated engagement or reengagement of veterans with SMI in care. Of note, and in contrast to targeted outreach, these activities were tied to veteran visits with mental health practitioners. These practices were typically described as being at least as important as targeted outreach efforts. For example, during mental health visits, clinicians routinely checked the VA electronic health record to assess whether veterans had an assigned primary care team. If not, they would contact the primary care service to refer the patient for a primary care visit and assignment. If the patient already had a primary care team assigned, the mental health practitioner checked for recent primary care visits. If none were evident, the mental health practitioner might email the assigned PCP or contact them via instant message.
At some facilities, mental health support staff were able to directly schedule primary care appointments, which was identified as an important enabling factor in promoting mental health patient engagement in primary care. Some interviewees seemed to take for granted the idea that mental health practitioners would help engage patients in primary care—suggesting that these practices had perhaps become a cultural norm within their facility. However, some interviewees identified clear strategies for making these practices a consistent part of care—for example, by designing a protocol for initial mental health assessments to include a routine check for primary care engagement.
Mental Health/Primary Care Connections
Interviewees characterized the nature of the connections between mental health and primary care at their facilities. Nearly all interviewees described that their medical centers had extensive ties, formal and informal, between mental health and primary care.
Formal ties may include the reverse integration care model, in which primary care services are embedded in mental health settings. Interviewees at sites with programs based on this model noted that these programs enabled warm hand-offs from mental health to primary care and suggested that it can foster integration between primary care and mental health care for patients with SMI. However, the size, scope, and structure of these programs varied, sometimes serving a small proportion of a facility’s population of SMI patients. Other examples of formal ties included written agreements, establishing frequent, regular meetings between mental health and primary care leadership and front-line staff, and giving mental health clerks the ability to directly schedule primary care appointments.
Informal ties between mental health and primary care included communication and personal working relationships between mental health and PCPs, facilitated by mental health and primary care leaders working together in workgroups and other administrative activities. Some participants described a history of collaboration between mental health and primary care leaders yielding productive and trusting working relationships. Some interviewees described frequent direct communication between individual mental health practitioners and PCPs—either face-to-face or via secure messaging.
Discussion
VA facilities with high levels of primary care engagement among veterans with SMI used extensive engagement strategies, including a diverse array of targeted outreach and routine practices. In both approaches, intentional organizational structural and process decisions, as well as formal and informal ties between mental health and primary care, established and supported them. In addition, organizational cultural factors were especially relevant to routine practice strategies.
To enable targeted outreach, a bevy of organizational resources, both local and national were required. Large accountable care organizations and integrated delivery systems, like the VA, are often better able to create dashboards and other informational resources for population health management compared with smaller, less integrated health care systems. Though these resources are difficult to create in fragmented systems, comparable tools have been explored by multiple state health departments.12 Our findings suggest that these data tools, though resource intensive to develop, may enable facilities to be more methodical and reliable in conducting outreach to vulnerable patients.
In contrast to targeted outreach, routine practices depend less on population health management resources and more on cultural norms. Such norms are notoriously difficult to change, but intentional structural decisions like embedding primary care engagement in mental health protocols may signal that primary care engagement is an important and legitimate consideration for mental health care.13
We identified extensive and heterogenous connections between mental health and primary care in our sample of VA facilities with high engagement of patients with SMI in primary care. A growing body of literature on relational coordination studies the factors that contribute to organizational siloing and mechanisms for breaking down those silos so work can be coordinated across boundaries (eg, the organizational boundary between mental health and primary care).14 Coordinating care across these boundaries, through good relational coordination practices has been shown to improve outcomes in health care and other sectors. Notably, VA facilities in our sample had several of the defining characteristics of good relational coordination: relationships between mental health and primary care that include shared goals, shared knowledge, and mutual respect, all reinforced by frequent communication structured around problem solving.15 The relational coordination literature also offers a way to identify evidence-based interventions for facilitating relational coordination in places where it is lacking, for example, with information systems, boundary-spanning individuals, facility design, and formal conflict resolution.15 Future work might explore how relational coordination can be further used to optimize mental health and primary care connections to keep veterans with SMI engaged in care.
Our approach of interviewing informants in higher-performing facilities draws heavily on the idea of positive deviance, which holds that information on what works in health care is available from organizations that already are demonstrating “consistently exceptional performance.”16 This approach works best when high performance and organizational characteristics are observable for a large number of facilities, and when high-performing facilities are willing to share their strategies. These features allow investigators to identify promising practices and hypotheses that can then be empirically tested and compared. Such testing, including assessing for unintended consequences, is needed for the approaches we identified. Research is also needed to assess for factors that would promote the implementation of effective strategies.
Limitations
As a QI project seeking to identify promising practices, our interviews were limited to 18 key informants across 11 VA facilities with high engagement of care among veterans with SMI. No inferences can be made that these practices are directly related to this high level of engagement, nor the differential impact of different practices. Future work is needed to assess for these relationships. We also did not interview veterans to understand their perspectives on these strategies, which is an additional important topic for future work. In addition, these interviews were performed before the start of the COVID-19 pandemic. Further work is needed to understand how these strategies may have been modified in response to changes in practice. The shift to care from in-person to virtual services may have impacted both clinical interactions with veterans, as well as between clinicians.
Conclusions
Interviews with key informants demonstrate that while engaging and retaining veterans with SMI in primary care is vital, it also requires intentional and potentially resource-intensive practices, including targeted outreach and routine engagement strategies embedded into mental health visits. These promising practices can provide valuable insights for both VA and community health care systems providing care to patients with SMI.
Acknowledgments
We thank Gracielle J. Tan, MD for administrative assistance in preparing this manuscript.
1. Liu NH, Daumit GL, Dua T, et al. Excess mortality in persons with severe mental disorders: a multilevel intervention framework and priorities for clinical practice, policy and research agendas. World Psychiatry. 2017;16(1):30-40. doi:10.1002/wps.20384
2. Bowersox NW, Kilbourne AM, Abraham KM, et al. Cause-specific mortality among veterans with serious mental illness lost to follow-up. Gen Hosp Psychiatry. 2012;34(6):651-653. doi:10.1016/j.genhosppsych.2012.05.014
3. Davis CL, Kilbourne AM, Blow FC, et al. Reduced mortality among Department of Veterans Affairs patients with schizophrenia or bipolar disorder lost to follow-up and engaged in active outreach to return for care. Am J Public Health. 2012;102(suppl 1):S74-S79. doi:10.2105/AJPH.2011.300502
4. Copeland LA, Zeber JE, Wang CP, et al. Patterns of primary care and mortality among patients with schizophrenia or diabetes: a cluster analysis approach to the retrospective study of healthcare utilization. BMC Health Serv Res. 2009;9:127. doi:10.1186/1472-6963-9-127
5. Abraham KM, Mach J, Visnic S, McCarthy JF. Enhancing treatment reengagement for veterans with serious mental illness: evaluating the effectiveness of SMI re-engage. Psychiatr Serv. 2018;69(8):887-895. doi:10.1176/appi.ps.201700407
6. Ward MC, Druss BG. Reverse integration initiatives for individuals with serious mental illness. Focus (Am Psychiatr Publ). 2017;15(3):271-278. doi:10.1176/appi.focus.20170011
7. Chang ET, Vinzon M, Cohen AN, Young AS. Effective models urgently needed to improve physical care for people with serious mental illnesses. Health Serv Insights. 2019;12:1178632919837628. Published 2019 Apr 2. doi:10.1177/1178632919837628
8. Gabrielian S, Gordon AJ, Gelberg L, et al. Primary care medical services for homeless veterans. Fed Pract. 2014;31(10):10-19.
9. Lemke S, Boden MT, Kearney LK, et al. Measurement-based management of mental health quality and access in VHA: SAIL mental health domain. Psychol Serv. 2017;14(1):1-12. doi:10.1037/ser0000097
10. Averill JB. Matrix analysis as a complementary analytic strategy in qualitative inquiry. Qual Health Res. 2002;12(6):855-866. doi:10.1177/104973230201200611
11. Zuchowski JL, Chrystal JG, Hamilton AB, et al. Coordinating care across health care systems for Veterans with gynecologic malignancies: a qualitative analysis. Med Care. 2017;55(suppl 1):S53-S60. doi:10.1097/MLR.0000000000000737
12. Daumit GL, Stone EM, Kennedy-Hendricks A, Choksy S, Marsteller JA, McGinty EE. Care coordination and population health management strategies and challenges in a behavioral health home model. Med Care. 2019;57(1):79-84. doi:10.1097/MLR.0000000000001023
13. Parmelli E, Flodgren G, Beyer F, et al. The effectiveness of strategies to change organisational culture to improve healthcare performance: a systematic review. Implement Sci. 2011;6(33):1-8. doi:10.1186/1748-5908-6-33
14. Bolton R, Logan C, Gittell JH. Revisiting relational coordination: a systematic review. J Appl Behav Sci. 2021;57(3):290-322. doi:10.1177/0021886321991597
15. Gittell JH, Godfrey M, Thistlethwaite J. Interprofessional collaborative practice and relational coordination: improving healthcare through relationships. J Interprof Care. 2013;27(3):210-13. doi:10.3109/13561820.2012.730564
16. Bradley EH, Curry LA, Ramanadhan S, Rowe L, Nembhard IM, Krumholz HM. Research in action: using positive deviance to improve quality of health care. Implement Sci. 2009;4:25. Published 2009 May 8. doi:10.1186/1748-5908-4-25
People with serious mental illness (SMI) are at substantial risk for premature mortality, dying on average 10 to 20 years earlier than others.1 The reasons for this disparity are complex; however, the high prevalence of chronic disease and physical comorbidities in the SMI population have been identified as prominent factors.2 Engagement and reengagement in care, including primary care for medical comorbidities, can mitigate these mortality risks.2-4 Among veterans with SMI lost to follow-up care for more than 12 months, those not successfully reengaged in care were more likely to die compared with those reengaged in care.2,3
Given this evidence, health care systems, including the US Department of Veterans Affairs (VA), have looked to better engage these patients in care. These efforts have included mental health population health management, colocation of mental health with primary care, designation of primary care teams specializing in SMI, and integration of mental health and primary care services for patients experiencing homelessness.5-8
As part of a national approach to encourage locally driven quality improvement (QI), the VA compiles performance metrics for each facility, across a gamut of care settings, conditions, and veteran populations.9 Quarterly facility report cards, with longitudinal data and cross-facility comparisons, enable facilities to identify targets for QI and track improvement progress. One metric reports on the proportion of enrolled veterans with SMI who have primary care engagement, defined as having an assigned primary care practitioner (PCP) and a primary care visit in the prior 12 months.
In support of a QI initiative at the VA Greater Los Angeles Healthcare System (VAGLAHS), we sought to describe promising practices being utilized by VA facilities with higher levels of primary care engagement among their veterans with SMI populations.
Methods
We conducted semistructured telephone interviews with a purposeful sample of key informants at VA facilities with high levels of engagement in primary care among veterans with SMI. All project components were conducted by an interdisciplinary team, which included a medical anthropologist (JM), a mental health physician (PR), an internal medicine physician (KC), and other health services researchers (JB, AG). Because the primary objective of the project was QI, this project was designated as nonresearch by the VAGLAHS Institutional Review Board.
The VA Facility Complexity Model classifies facilities into 5 tiers: 1a (most complex), 1b, 1c, 2, and 3 (least complex), based on patient care volume, patient risk, complexity of clinical programs, and size of research and teaching programs. We sampled informants at VA facilities with complexity ratings of 1a or 1b with better than median scores for primary care engagement of veterans with SMI based on report cards from January 2019 to March 2019. To increase the likelihood of identifying lessons that can generalize to the VAGLAHS with its large population of veterans experiencing homelessness, we selected facilities serving populations consisting of more than 1000 veterans experiencing homelessness.
At each selected facility, we first aimed to interview mental health leaders responsible for quality measurement and improvement identified from a national VA database. We then used snowball sampling to identify other informants at these VA facilities who were knowledgeable about relevant processes. Potential interviewees were contacted via email.
Interviews
The interview guide was developed by the interdisciplinary team and based on published literature about strategies for engaging patients with SMI in care. Interview guide questions focused on local practice arrangements, panel management, population health practices, and quality measurement and improvement efforts for engaging veterans with SMI in primary care (Appendix). Interviews were conducted by telephone, from May 2019 through July 2019, by experienced qualitative interviewers (JM, JB). Interviewees were assured confidentiality of their responses.
Interview audio recordings were used to generate detailed notes (AG). Structured summaries were prepared from these notes, using a template based on the interview guide. We organized these summaries into matrices for analysis, grouping summarized points by interview domains to facilitate comparison across interviews.10-11 Our team reviewed and discussed the matrices, and iteratively identified and defined themes to identify the common engagement approaches and the nature of the connections between mental health and primary care. To ensure rigor, findings were checked by the senior qualitative lead (JM).
Results
The median SMI engagement score—defined as the proportion of veterans with SMI who have had a primary care visit in the prior 12 months and who have an assigned PCP—was 75.6% across 1a and 1b VA facilities. We identified 16 VA facilities that had a median or higher score and more than 1000 enrolled veterans experiencing homelessness. From these16 facilities, we emailed 31 potential interviewees, 14 of whom were identified from a VA database and 17 referred by other interviewees. In total, we interviewed 18 key informants across 11 (69%) facilities, including chiefs of psychology and mental health services, PCPs with mental health expertise, QI specialists, a psychosocial rehabilitation leader, and a local recovery coordinator, who helps veterans with SMI access recovery-oriented services. Characteristics of the facilities and interviewees are shown in Table 1. Interviews lasted a mean 35 (range, 26-50) minutes.
Engagement Approaches
The strategies used to engage veterans with SMI were heterogenous, with no single strategy common across all facilities. However, we identified 2 categories of engagement approaches: targeted outreach and routine practices.
Targeted outreach strategies included deliberate, systematic approaches to reach veterans with SMI outside of regularly scheduled visits. These strategies were designed to be proactive, often prioritizing veterans at risk of disengaging from care. Designated VA care team members identified and reached out to veterans well before 12 months had passed since their prior visit (the VA definition of disengagement from care); visits included any care at VA, including, but not exclusively, primary care. Table 2 describes the key components of targeted outreach strategies: (1) identifying veterans’ last visit; (2) prioritizing which veterans to outreach to; and (3) assigning responsibility and reaching out. A key defining feature of targeted outreach is that veterans were identified and prioritized for outreach independent from any visits with mental health or other VA services.
In identifying veterans at risk for disengagement, a designated employee in mental health or primary care (eg, local recovery coordinator) reviewed a VA dashboard or locally developed report that identified veterans who have not engaged in care for several months. This process was repeated regularly. The designated employee either contacted those veterans directly or coordinated with other clinicians and support staff. When possible, a clinician or nurse with an existing relationship with the veteran would call them. If no such relationship existed, an administrative staff member made a cold call, sometimes accompanied by mailed outreach materials.
Routine practices were business-as-usual activities embedded in regular clinical workflows that facilitated engagement or reengagement of veterans with SMI in care. Of note, and in contrast to targeted outreach, these activities were tied to veteran visits with mental health practitioners. These practices were typically described as being at least as important as targeted outreach efforts. For example, during mental health visits, clinicians routinely checked the VA electronic health record to assess whether veterans had an assigned primary care team. If not, they would contact the primary care service to refer the patient for a primary care visit and assignment. If the patient already had a primary care team assigned, the mental health practitioner checked for recent primary care visits. If none were evident, the mental health practitioner might email the assigned PCP or contact them via instant message.
At some facilities, mental health support staff were able to directly schedule primary care appointments, which was identified as an important enabling factor in promoting mental health patient engagement in primary care. Some interviewees seemed to take for granted the idea that mental health practitioners would help engage patients in primary care—suggesting that these practices had perhaps become a cultural norm within their facility. However, some interviewees identified clear strategies for making these practices a consistent part of care—for example, by designing a protocol for initial mental health assessments to include a routine check for primary care engagement.
Mental Health/Primary Care Connections
Interviewees characterized the nature of the connections between mental health and primary care at their facilities. Nearly all interviewees described that their medical centers had extensive ties, formal and informal, between mental health and primary care.
Formal ties may include the reverse integration care model, in which primary care services are embedded in mental health settings. Interviewees at sites with programs based on this model noted that these programs enabled warm hand-offs from mental health to primary care and suggested that it can foster integration between primary care and mental health care for patients with SMI. However, the size, scope, and structure of these programs varied, sometimes serving a small proportion of a facility’s population of SMI patients. Other examples of formal ties included written agreements, establishing frequent, regular meetings between mental health and primary care leadership and front-line staff, and giving mental health clerks the ability to directly schedule primary care appointments.
Informal ties between mental health and primary care included communication and personal working relationships between mental health and PCPs, facilitated by mental health and primary care leaders working together in workgroups and other administrative activities. Some participants described a history of collaboration between mental health and primary care leaders yielding productive and trusting working relationships. Some interviewees described frequent direct communication between individual mental health practitioners and PCPs—either face-to-face or via secure messaging.
Discussion
VA facilities with high levels of primary care engagement among veterans with SMI used extensive engagement strategies, including a diverse array of targeted outreach and routine practices. In both approaches, intentional organizational structural and process decisions, as well as formal and informal ties between mental health and primary care, established and supported them. In addition, organizational cultural factors were especially relevant to routine practice strategies.
To enable targeted outreach, a bevy of organizational resources, both local and national were required. Large accountable care organizations and integrated delivery systems, like the VA, are often better able to create dashboards and other informational resources for population health management compared with smaller, less integrated health care systems. Though these resources are difficult to create in fragmented systems, comparable tools have been explored by multiple state health departments.12 Our findings suggest that these data tools, though resource intensive to develop, may enable facilities to be more methodical and reliable in conducting outreach to vulnerable patients.
In contrast to targeted outreach, routine practices depend less on population health management resources and more on cultural norms. Such norms are notoriously difficult to change, but intentional structural decisions like embedding primary care engagement in mental health protocols may signal that primary care engagement is an important and legitimate consideration for mental health care.13
We identified extensive and heterogenous connections between mental health and primary care in our sample of VA facilities with high engagement of patients with SMI in primary care. A growing body of literature on relational coordination studies the factors that contribute to organizational siloing and mechanisms for breaking down those silos so work can be coordinated across boundaries (eg, the organizational boundary between mental health and primary care).14 Coordinating care across these boundaries, through good relational coordination practices has been shown to improve outcomes in health care and other sectors. Notably, VA facilities in our sample had several of the defining characteristics of good relational coordination: relationships between mental health and primary care that include shared goals, shared knowledge, and mutual respect, all reinforced by frequent communication structured around problem solving.15 The relational coordination literature also offers a way to identify evidence-based interventions for facilitating relational coordination in places where it is lacking, for example, with information systems, boundary-spanning individuals, facility design, and formal conflict resolution.15 Future work might explore how relational coordination can be further used to optimize mental health and primary care connections to keep veterans with SMI engaged in care.
Our approach of interviewing informants in higher-performing facilities draws heavily on the idea of positive deviance, which holds that information on what works in health care is available from organizations that already are demonstrating “consistently exceptional performance.”16 This approach works best when high performance and organizational characteristics are observable for a large number of facilities, and when high-performing facilities are willing to share their strategies. These features allow investigators to identify promising practices and hypotheses that can then be empirically tested and compared. Such testing, including assessing for unintended consequences, is needed for the approaches we identified. Research is also needed to assess for factors that would promote the implementation of effective strategies.
Limitations
As a QI project seeking to identify promising practices, our interviews were limited to 18 key informants across 11 VA facilities with high engagement of care among veterans with SMI. No inferences can be made that these practices are directly related to this high level of engagement, nor the differential impact of different practices. Future work is needed to assess for these relationships. We also did not interview veterans to understand their perspectives on these strategies, which is an additional important topic for future work. In addition, these interviews were performed before the start of the COVID-19 pandemic. Further work is needed to understand how these strategies may have been modified in response to changes in practice. The shift to care from in-person to virtual services may have impacted both clinical interactions with veterans, as well as between clinicians.
Conclusions
Interviews with key informants demonstrate that while engaging and retaining veterans with SMI in primary care is vital, it also requires intentional and potentially resource-intensive practices, including targeted outreach and routine engagement strategies embedded into mental health visits. These promising practices can provide valuable insights for both VA and community health care systems providing care to patients with SMI.
Acknowledgments
We thank Gracielle J. Tan, MD for administrative assistance in preparing this manuscript.
1. Liu NH, Daumit GL, Dua T, et al. Excess mortality in persons with severe mental disorders: a multilevel intervention framework and priorities for clinical practice, policy and research agendas. World Psychiatry. 2017;16(1):30-40. doi:10.1002/wps.20384
2. Bowersox NW, Kilbourne AM, Abraham KM, et al. Cause-specific mortality among veterans with serious mental illness lost to follow-up. Gen Hosp Psychiatry. 2012;34(6):651-653. doi:10.1016/j.genhosppsych.2012.05.014
3. Davis CL, Kilbourne AM, Blow FC, et al. Reduced mortality among Department of Veterans Affairs patients with schizophrenia or bipolar disorder lost to follow-up and engaged in active outreach to return for care. Am J Public Health. 2012;102(suppl 1):S74-S79. doi:10.2105/AJPH.2011.300502
4. Copeland LA, Zeber JE, Wang CP, et al. Patterns of primary care and mortality among patients with schizophrenia or diabetes: a cluster analysis approach to the retrospective study of healthcare utilization. BMC Health Serv Res. 2009;9:127. doi:10.1186/1472-6963-9-127
5. Abraham KM, Mach J, Visnic S, McCarthy JF. Enhancing treatment reengagement for veterans with serious mental illness: evaluating the effectiveness of SMI re-engage. Psychiatr Serv. 2018;69(8):887-895. doi:10.1176/appi.ps.201700407
6. Ward MC, Druss BG. Reverse integration initiatives for individuals with serious mental illness. Focus (Am Psychiatr Publ). 2017;15(3):271-278. doi:10.1176/appi.focus.20170011
7. Chang ET, Vinzon M, Cohen AN, Young AS. Effective models urgently needed to improve physical care for people with serious mental illnesses. Health Serv Insights. 2019;12:1178632919837628. Published 2019 Apr 2. doi:10.1177/1178632919837628
8. Gabrielian S, Gordon AJ, Gelberg L, et al. Primary care medical services for homeless veterans. Fed Pract. 2014;31(10):10-19.
9. Lemke S, Boden MT, Kearney LK, et al. Measurement-based management of mental health quality and access in VHA: SAIL mental health domain. Psychol Serv. 2017;14(1):1-12. doi:10.1037/ser0000097
10. Averill JB. Matrix analysis as a complementary analytic strategy in qualitative inquiry. Qual Health Res. 2002;12(6):855-866. doi:10.1177/104973230201200611
11. Zuchowski JL, Chrystal JG, Hamilton AB, et al. Coordinating care across health care systems for Veterans with gynecologic malignancies: a qualitative analysis. Med Care. 2017;55(suppl 1):S53-S60. doi:10.1097/MLR.0000000000000737
12. Daumit GL, Stone EM, Kennedy-Hendricks A, Choksy S, Marsteller JA, McGinty EE. Care coordination and population health management strategies and challenges in a behavioral health home model. Med Care. 2019;57(1):79-84. doi:10.1097/MLR.0000000000001023
13. Parmelli E, Flodgren G, Beyer F, et al. The effectiveness of strategies to change organisational culture to improve healthcare performance: a systematic review. Implement Sci. 2011;6(33):1-8. doi:10.1186/1748-5908-6-33
14. Bolton R, Logan C, Gittell JH. Revisiting relational coordination: a systematic review. J Appl Behav Sci. 2021;57(3):290-322. doi:10.1177/0021886321991597
15. Gittell JH, Godfrey M, Thistlethwaite J. Interprofessional collaborative practice and relational coordination: improving healthcare through relationships. J Interprof Care. 2013;27(3):210-13. doi:10.3109/13561820.2012.730564
16. Bradley EH, Curry LA, Ramanadhan S, Rowe L, Nembhard IM, Krumholz HM. Research in action: using positive deviance to improve quality of health care. Implement Sci. 2009;4:25. Published 2009 May 8. doi:10.1186/1748-5908-4-25
Association of BRAF V600E Status of Incident Melanoma and Risk for a Second Primary Malignancy: A Population-Based Study
The incidence of cutaneous melanoma in the United States has increased in the last 30 years, with the American Cancer Society estimating that 99,780 new melanomas will be diagnosed and 7650 melanoma-related deaths will occur in 2022.1 Patients with melanoma have an increased risk for developing a second primary melanoma or other malignancy, such as salivary gland, small intestine, breast, prostate, renal, or thyroid cancer, but most commonly nonmelanoma skin cancer.2,3 The incidence rate of melanoma among residents of Olmsted County, Minnesota, from 1970 through 2009 has already been described for various age groups4-7; however, the incidence of a second primary malignancy, including melanoma, within these incident cohorts remains unknown.
Mutations in the BRAF oncogene occur in approximately 50% of melanomas.8,9
Although the BRAF mutation event in melanoma is sporadic and should not necessarily affect the development of an unrelated malignancy, we hypothesized that the exposures that may have predisposed a particular individual to a BRAF-mutated melanoma also may have a higher chance of predisposing that individual to the development of another primary malignancy. In this population-based study, we aimed to determine whether the specific melanoma feature of mutant BRAF V600E expression was associated with the development of a second primary malignancy.
Methods
This study was approved by the institutional review boards of the Mayo Clinic and Olmsted Medical Center (both in Rochester, Minnesota). The reporting of this study is compliant with the Strengthening the Reporting of Observational Studies in Epidemiology statement.15
Patient Selection and BRAF Assessment—The Rochester Epidemiology Project (REP) links comprehensive health care records for virtually all residents of Olmsted County, Minnesota, across different medical providers. The REP provides an index of diagnostic and therapeutic procedures, tracks timelines and outcomes of individuals and their medical conditions, and is ideal for population-based studies.
We obtained a list of all residents of Olmsted County aged 18 to 60 years who had a melanoma diagnosed according to the International Classification of Diseases, Ninth Revision, from January 1, 1970, through December 30, 2009; these cohorts have been analyzed previously.4-7 Of the 638 individuals identified, 380 had a melanoma tissue block on file at Mayo Clinic with enough tumor present in available tissue blocks for BRAF assessment. All specimens were reviewed by a board-certified dermatopathologist (J.S.L.) to confirm the diagnosis of melanoma. Tissue blocks were recut, and formalin-fixed, paraffin-embedded tissue sections were stained for BRAF V600E (Spring Bioscience Corporation). BRAF-stained specimens and the associated hematoxylin and eosin−stained slides were reviewed. Melanocyte cytoplasmic staining for BRAF was graded as negative if no staining was evident. BRAF was graded as positive if focal or partial staining was observed (<50% of tumor or low BRAF expression) or if diffuse staining was evident (>50% of tumor or high BRAF expression).
Using resources of the REP, we confirmed patients’ residency status in Olmsted County at the time of diagnosis of the incident melanoma. Patients who denied access to their medical records for research purposes were excluded. We used the complete record of each patient to confirm the date of diagnosis of the incident melanoma. Baseline characteristics of patients and their incident melanomas (eg, anatomic site and pathologic stage according to the American Joint Committee on Cancer classification) were obtained. When only the Clark level was included in the dermatopathology report, the corresponding Breslow thickness was extrapolated from the Clark level,18 and the pathologic stage according to the American Joint Committee on Cancer classification (7th edition) was determined.
For our study, specific diagnostic codes—International Classification of Diseases, Ninth and Tenth Revisions; Hospital International Classification of Diseases Adaptation19; and Berkson16—were applied across individual records to identify all second primary malignancies using the resources of the REP. The diagnosis date, morphology, and anatomic location of second primary malignancies were confirmed from examination of the clinical records.
Statistical Analysis—Baseline characteristics were compared by BRAF V600E expression using Wilcoxon rank sum and χ2 tests. The rate of developing a second primary malignancy at 5, 10, 15, and 20 years after the incident malignant melanoma was estimated with the Kaplan-Meier method. The duration of follow-up was calculated from the incident melanoma date to the second primary malignancy date or the last follow-up date. Patients with a history of the malignancy of interest, except skin cancers, before the incident melanoma date were excluded because it was not possible to distinguish between recurrence of a prior malignancy and a second primary malignancy. Associations of BRAF V600E expression with the development of a second primary malignancy were evaluated with Cox proportional hazards regression models and summarized with hazard ratios (HRs) and 95% CIs; all associations were adjusted for potential confounders such as age at the incident melanoma, year of the incident melanoma, and sex.
Results

Cumulative Incidence of Second Primary Melanoma—Of 133 patients with positive BRAF V600E expression, we identified 14 (10.5%), 1 (0.8%), and 1 (0.8%) who had 1, 2, and 4 subsequent melanomas, respectively. Of the 247 patients with negative BRAF V600E expression, we identified 15 (6%), 4 (1.6%), 2 (0.8%), and 1 (0.4%) patients who had 1, 2, 3, and 4 subsequent melanomas, respectively; BRAF V600E expression was not associated with the number of subsequent melanomas (P=.37; Wilcoxon rank sum test). The cumulative incidences of developing a second primary melanoma (n=38 among the 380 patients studied) at 5, 10, 15, and 20 years after the incident melanoma were 5.3%, 7.6%, 8.1%, and 14.6%, respectively.
Cumulative Incidence of All Second Primary Malignancies—Of the 380 patients studied, 60 (16%) had at least 1 malignancy diagnosed before the incident melanoma. Of the remaining 320 patients, 104 later had at least 1 malignancy develop, including a second primary melanoma, at a median (IQR) of 8.0 (2.7–16.2) years after the incident melanoma; the 104 patients with at least 1 subsequent malignancy included 40 with BRAF-positive and 64 with BRAF-negative melanomas. The cumulative incidences of developing at least 1 malignancy of any kind at 5, 10, 15, and 20 years after the incident melanoma were 15.0%, 20.5%, 31.2%, and 47.0%, respectively. Table 2 shows the number of patients with at least 1 second primary malignancy after the incident melanoma stratified by BRAF status.

BRAF V600E Expression and Association With Second Primary Malignancy—The eTable shows the associations of mutant BRAF V600E expression status with the development of a new primary malignancy. Malignancies affecting fewer than 10 patients were excluded from the analysis because there were too few events to support the Cox model. Positive BRAF V600E expression was associated with subsequent development of BCCs (HR, 2.32; 95% CI, 1.35-3.99; P=.002) and the development of all combined second primary malignancies excluding melanoma (HR, 1.65; 95% CI, 1.06-2.56; P=.03). However, BRAF V600E status was no longer a significant factor when all second primary malignancies, including second melanomas, were considered (P=.06). Table 3 shows the 5-, 10-, 15-, and 20-year cumulative incidences of all second primary malignancies according to mutant BRAF status.


Comment
Association of BRAF V600E Expression With Second Primary Malignancies—BRAF V600E expression of an incident melanoma was associated with the development of all combined second primary malignancies excluding melanoma; however, this association was not statistically significant when second primary melanomas were included. A possible explanation is that individuals with more than 1 primary melanoma possess additional genetic risk—CDKN2A or CDKN4 gene mutations or MC1R variation—that outweighed the effect of BRAF expression in the statistical analysis.

The 5- and 10-year cumulative incidences of all second primary malignancies excluding second primary melanoma were similar between BRAF-positive and BRAF-negative melanoma, but the 15- and 20-year cumulative incidences were greater for the BRAF-positive cohort. This could reflect the association of BRAF expression with BCCs and the increased likelihood of their occurrence with cumulative sun exposure and advancing age. BRAF expression was associated with the development of BCCs, but the reason for this association was unclear. BRAF-mutated melanoma occurs more frequently on sun-protected sites,20 whereas sporadic BCC generally occurs on sun-exposed sites. However, BRAF-mutated melanoma is associated with high levels of ambient UV exposure early in life, particularly birth through 20 years of age,21 and we speculate that such early UV exposure influences the later development of BCCs.
Development of BRAF-Mutated Cancers—It currently is not understood why the same somatic mutation can cause different types of cancer. A recent translational research study showed that in mice models, precursor cells of the pancreas and bile duct responded differently when exposed to PIK3CA and KRAS oncogenes, and tumorigenesis is influenced by specific cooperating genetic events in the tissue microenvironment. Future research investigating these molecular interactions may lead to better understanding of cancer pathogenesis and direct the design of new targeted therapies.22,23
Regarding environmental influences on the development of BRAF-mutated cancers, we found 1 population-based study that identified an association between high iodine content of drinking water and the prevalence of T1799A BRAF papillary thyroid carcinoma in 5 regions in China.24 Another study identified an increased risk for colorectal cancer and nonmelanoma skin cancer in the first-degree relatives of index patients with BRAF V600E colorectal cancer.25 Two studies by institutions in China and Sweden reported the frequency of BRAF mutations in cohorts of patients with melanoma.26,27
Additional studies investigating a possible association between BRAF-mutated melanoma and other cancers with larger numbers of participants than in our study may become more feasible in the future with increased routine genetic testing of biopsied cancers.
Study Limitations—Limitations of this retrospective epidemiologic study include the possibility of ascertainment bias during data collection. We did not account for known risk factors for cancer (eg, excessive sun exposure, smoking).
The main clinical implications from this study are that we do not have enough evidence to recommend BRAF testing for all incident melanomas, and BRAF-mutated melanomas cannot be associated with increased risk for developing other forms of cancer, with the possible exception of BCCs
Conclusion
Physicians should be aware of the risk for a second primary malignancy after an incident melanoma, and we emphasize the importance of long-term cancer surveillance.
Acknowledgment—We thank Ms. Jayne H. Feind (Rochester, Minnesota) for assistance with study coordination.
- American Cancer Society. Key statistics for melanoma skin cancer. Updated January 12, 2022. Accessed August 15, 2022.https://www.cancer.org/cancer/melanoma-skin-cancer/about/key-statistics.html
- American Cancer Society. Second Cancers After Melanoma Skin Cancer. Accessed August 19, 2022. https://www.cancer.org/cancer/melanoma-skin-cancer/after-treatment/second-cancers.html
- Spanogle JP, Clarke CA, Aroner S, et al. Risk of second primary malignancies following cutaneous melanoma diagnosis: a population-based study. J Am Acad Dermatol. 2010;62:757-767.
- Olazagasti Lourido JM, Ma JE, Lohse CM, et al. Increasing incidence of melanoma in the elderly: an epidemiological study in Olmsted County, Minnesota. Mayo Clin Proc. 2016;91:1555-1562.
- Reed KB, Brewer JD, Lohse CM, et al. Increasing incidence of melanoma among young adults: an epidemiological study in Olmsted County, Minnesota. Mayo Clin Proc. 2012;87:328-334.
- Lowe GC, Brewer JD, Peters MS, et al. Incidence of melanoma in the pediatric population: a population-based study in Olmsted County, Minnesota. Pediatr Derm. 2015;32:618-620.
- Lowe GC, Saavedra A, Reed KB, et al. Increasing incidence of melanoma among middle-aged adults: an epidemiologic study in Olmsted County, Minnesota. Mayo Clin Proc. 2014;89:52-59.
- Ascierto PA, Kirkwood JM, Grob JJ, et al. The role of BRAF V600 mutation in melanoma [editorial]. J Transl Med. 2012;10:85.
- Davies H, Bignell GR, Cox C, et al. Mutations of the BRAF gene in human cancer. Nature. 2002;417:949-954.
- Miller AJ, Mihm MC Jr. Melanoma. N Engl J Med. 2006;355:51-65.
- Tiacci E, Trifonov V, Schiavoni G, et al. BRAF mutations in hairy-cell leukemia. N Engl J Med. 2011;364:2305-2315.
- Xing M. BRAF mutation in thyroid cancer. Endocr Relat Cancer. 2005;12:245-262.
- Moreau S, Saiag P, Aegerter P, et al. Prognostic value of BRAF(V600) mutations in melanoma patients after resection of metastatic lymph nodes. Ann Surg Oncol. 2012;19:4314-4321.
- Flaherty KT, Robert C, Hersey P, et al. Improved survival with MEK inhibition in BRAF-mutated melanoma. N Engl J Med. 2012;367:107-114.
- von Elm E, Altman DG, Egger M, et al. The Strengthening the Reporting of Observational Studies in Epidemiology (STROBE) statement: guidelines for reporting observational studies. J Clin Epidemiol. 2008;61:344-349.
- Rocca WA, Yawn BP, St Sauver JL, et al. History of the Rochester Epidemiology Project: half a century of medical records linkage in a US population. Mayo Clin Proc. 2012;87:1202-1213.
- St. Sauver JL, Grossardt BR, Yawn BP, et al. Data resource profile: the Rochester Epidemiology Project (REP) medical records-linkage system. Int J Epidemiol. 2012;41:1614-1624.
- National Cancer Institute. Staging: melanoma of the skin, vulva, penis and scrotum staging. Accessed August 15, 2022. https://training.seer.cancer.gov/melanoma/abstract-code-stage/staging.html
- Pakhomov SV, Buntrock JD, Chute CG. Automating the assignment of diagnosis codes to patient encounters using example-based and machine learning techniques. J Am Med Inform Assoc. 2006;13:516-525.
- Curtin JA, Fridlyand J, Kageshita T, et al. Distinct sets of genetic alterations in melanoma. N Engl J Med. 2005;353:2135-2147.
- Thomas NE, Edmiston SN, Alexander A, et al. Number of nevi and early-life ambient UV exposure are associated with BRAF-mutant melanoma. Cancer Epidemiol Biomarkers Prev. 2007;16:991-997.
- German Cancer Research Center. Why identical mutations cause different types of cancer. July 19, 2021. Accessed August 15, 2022. https://www.dkfz.de/en/presse/pressemitteilungen/2021/dkfz-pm-21-41-Why-identical-mutations-cause-different-types-of-cancer.php
- Falcomatà C, Bärthel S, Ulrich A, et al. Genetic screens identify a context-specific PI3K/p27Kip1 node driving extrahepatic biliary cancer. Cancer Discov. 2021;11:3158-3177.
- Guan H, Ji M, Bao R, et al. Association of high iodine intake with the T1799A BRAF mutation in papillary thyroid cancer. J Clin Endocrinol Metab. 2009;94:1612-1617.
- Wish TA, Hyde AJ, Parfrey PS, et al. Increased cancer predisposition in family members of colorectal cancer patients harboring the p.V600E BRAF mutation: a population-based study. Cancer Epidemiol Biomarkers Prev. 2010;19:1831-1839.
- Zebary A, Omholt K, Vassilaki I, et al. KIT, NRAS, BRAF and PTEN mutations in a sample of Swedish patients with acral lentiginous melanoma. J Dermatol Sci. 2013;72:284-289.
- Si L, Kong Y, Xu X, et al. Prevalence of BRAF V600E mutation in Chinese melanoma patients: large scale analysis of BRAF and NRAS mutations in a 432-case cohort. Eur J Cancer. 2012;48:94-100.
- Safaee Ardekani G, Jafarnejad SM, Khosravi S, et al. Disease progression and patient survival are significantly influenced by BRAF protein expression in primary melanoma. Br J Dermatol. 2013;169:320-328.
The incidence of cutaneous melanoma in the United States has increased in the last 30 years, with the American Cancer Society estimating that 99,780 new melanomas will be diagnosed and 7650 melanoma-related deaths will occur in 2022.1 Patients with melanoma have an increased risk for developing a second primary melanoma or other malignancy, such as salivary gland, small intestine, breast, prostate, renal, or thyroid cancer, but most commonly nonmelanoma skin cancer.2,3 The incidence rate of melanoma among residents of Olmsted County, Minnesota, from 1970 through 2009 has already been described for various age groups4-7; however, the incidence of a second primary malignancy, including melanoma, within these incident cohorts remains unknown.
Mutations in the BRAF oncogene occur in approximately 50% of melanomas.8,9
Although the BRAF mutation event in melanoma is sporadic and should not necessarily affect the development of an unrelated malignancy, we hypothesized that the exposures that may have predisposed a particular individual to a BRAF-mutated melanoma also may have a higher chance of predisposing that individual to the development of another primary malignancy. In this population-based study, we aimed to determine whether the specific melanoma feature of mutant BRAF V600E expression was associated with the development of a second primary malignancy.
Methods
This study was approved by the institutional review boards of the Mayo Clinic and Olmsted Medical Center (both in Rochester, Minnesota). The reporting of this study is compliant with the Strengthening the Reporting of Observational Studies in Epidemiology statement.15
Patient Selection and BRAF Assessment—The Rochester Epidemiology Project (REP) links comprehensive health care records for virtually all residents of Olmsted County, Minnesota, across different medical providers. The REP provides an index of diagnostic and therapeutic procedures, tracks timelines and outcomes of individuals and their medical conditions, and is ideal for population-based studies.
We obtained a list of all residents of Olmsted County aged 18 to 60 years who had a melanoma diagnosed according to the International Classification of Diseases, Ninth Revision, from January 1, 1970, through December 30, 2009; these cohorts have been analyzed previously.4-7 Of the 638 individuals identified, 380 had a melanoma tissue block on file at Mayo Clinic with enough tumor present in available tissue blocks for BRAF assessment. All specimens were reviewed by a board-certified dermatopathologist (J.S.L.) to confirm the diagnosis of melanoma. Tissue blocks were recut, and formalin-fixed, paraffin-embedded tissue sections were stained for BRAF V600E (Spring Bioscience Corporation). BRAF-stained specimens and the associated hematoxylin and eosin−stained slides were reviewed. Melanocyte cytoplasmic staining for BRAF was graded as negative if no staining was evident. BRAF was graded as positive if focal or partial staining was observed (<50% of tumor or low BRAF expression) or if diffuse staining was evident (>50% of tumor or high BRAF expression).
Using resources of the REP, we confirmed patients’ residency status in Olmsted County at the time of diagnosis of the incident melanoma. Patients who denied access to their medical records for research purposes were excluded. We used the complete record of each patient to confirm the date of diagnosis of the incident melanoma. Baseline characteristics of patients and their incident melanomas (eg, anatomic site and pathologic stage according to the American Joint Committee on Cancer classification) were obtained. When only the Clark level was included in the dermatopathology report, the corresponding Breslow thickness was extrapolated from the Clark level,18 and the pathologic stage according to the American Joint Committee on Cancer classification (7th edition) was determined.
For our study, specific diagnostic codes—International Classification of Diseases, Ninth and Tenth Revisions; Hospital International Classification of Diseases Adaptation19; and Berkson16—were applied across individual records to identify all second primary malignancies using the resources of the REP. The diagnosis date, morphology, and anatomic location of second primary malignancies were confirmed from examination of the clinical records.
Statistical Analysis—Baseline characteristics were compared by BRAF V600E expression using Wilcoxon rank sum and χ2 tests. The rate of developing a second primary malignancy at 5, 10, 15, and 20 years after the incident malignant melanoma was estimated with the Kaplan-Meier method. The duration of follow-up was calculated from the incident melanoma date to the second primary malignancy date or the last follow-up date. Patients with a history of the malignancy of interest, except skin cancers, before the incident melanoma date were excluded because it was not possible to distinguish between recurrence of a prior malignancy and a second primary malignancy. Associations of BRAF V600E expression with the development of a second primary malignancy were evaluated with Cox proportional hazards regression models and summarized with hazard ratios (HRs) and 95% CIs; all associations were adjusted for potential confounders such as age at the incident melanoma, year of the incident melanoma, and sex.
Results
Cumulative Incidence of Second Primary Melanoma—Of 133 patients with positive BRAF V600E expression, we identified 14 (10.5%), 1 (0.8%), and 1 (0.8%) who had 1, 2, and 4 subsequent melanomas, respectively. Of the 247 patients with negative BRAF V600E expression, we identified 15 (6%), 4 (1.6%), 2 (0.8%), and 1 (0.4%) patients who had 1, 2, 3, and 4 subsequent melanomas, respectively; BRAF V600E expression was not associated with the number of subsequent melanomas (P=.37; Wilcoxon rank sum test). The cumulative incidences of developing a second primary melanoma (n=38 among the 380 patients studied) at 5, 10, 15, and 20 years after the incident melanoma were 5.3%, 7.6%, 8.1%, and 14.6%, respectively.
Cumulative Incidence of All Second Primary Malignancies—Of the 380 patients studied, 60 (16%) had at least 1 malignancy diagnosed before the incident melanoma. Of the remaining 320 patients, 104 later had at least 1 malignancy develop, including a second primary melanoma, at a median (IQR) of 8.0 (2.7–16.2) years after the incident melanoma; the 104 patients with at least 1 subsequent malignancy included 40 with BRAF-positive and 64 with BRAF-negative melanomas. The cumulative incidences of developing at least 1 malignancy of any kind at 5, 10, 15, and 20 years after the incident melanoma were 15.0%, 20.5%, 31.2%, and 47.0%, respectively. Table 2 shows the number of patients with at least 1 second primary malignancy after the incident melanoma stratified by BRAF status.
BRAF V600E Expression and Association With Second Primary Malignancy—The eTable shows the associations of mutant BRAF V600E expression status with the development of a new primary malignancy. Malignancies affecting fewer than 10 patients were excluded from the analysis because there were too few events to support the Cox model. Positive BRAF V600E expression was associated with subsequent development of BCCs (HR, 2.32; 95% CI, 1.35-3.99; P=.002) and the development of all combined second primary malignancies excluding melanoma (HR, 1.65; 95% CI, 1.06-2.56; P=.03). However, BRAF V600E status was no longer a significant factor when all second primary malignancies, including second melanomas, were considered (P=.06). Table 3 shows the 5-, 10-, 15-, and 20-year cumulative incidences of all second primary malignancies according to mutant BRAF status.
Comment
Association of BRAF V600E Expression With Second Primary Malignancies—BRAF V600E expression of an incident melanoma was associated with the development of all combined second primary malignancies excluding melanoma; however, this association was not statistically significant when second primary melanomas were included. A possible explanation is that individuals with more than 1 primary melanoma possess additional genetic risk—CDKN2A or CDKN4 gene mutations or MC1R variation—that outweighed the effect of BRAF expression in the statistical analysis.
The 5- and 10-year cumulative incidences of all second primary malignancies excluding second primary melanoma were similar between BRAF-positive and BRAF-negative melanoma, but the 15- and 20-year cumulative incidences were greater for the BRAF-positive cohort. This could reflect the association of BRAF expression with BCCs and the increased likelihood of their occurrence with cumulative sun exposure and advancing age. BRAF expression was associated with the development of BCCs, but the reason for this association was unclear. BRAF-mutated melanoma occurs more frequently on sun-protected sites,20 whereas sporadic BCC generally occurs on sun-exposed sites. However, BRAF-mutated melanoma is associated with high levels of ambient UV exposure early in life, particularly birth through 20 years of age,21 and we speculate that such early UV exposure influences the later development of BCCs.
Development of BRAF-Mutated Cancers—It currently is not understood why the same somatic mutation can cause different types of cancer. A recent translational research study showed that in mice models, precursor cells of the pancreas and bile duct responded differently when exposed to PIK3CA and KRAS oncogenes, and tumorigenesis is influenced by specific cooperating genetic events in the tissue microenvironment. Future research investigating these molecular interactions may lead to better understanding of cancer pathogenesis and direct the design of new targeted therapies.22,23
Regarding environmental influences on the development of BRAF-mutated cancers, we found 1 population-based study that identified an association between high iodine content of drinking water and the prevalence of T1799A BRAF papillary thyroid carcinoma in 5 regions in China.24 Another study identified an increased risk for colorectal cancer and nonmelanoma skin cancer in the first-degree relatives of index patients with BRAF V600E colorectal cancer.25 Two studies by institutions in China and Sweden reported the frequency of BRAF mutations in cohorts of patients with melanoma.26,27
Additional studies investigating a possible association between BRAF-mutated melanoma and other cancers with larger numbers of participants than in our study may become more feasible in the future with increased routine genetic testing of biopsied cancers.
Study Limitations—Limitations of this retrospective epidemiologic study include the possibility of ascertainment bias during data collection. We did not account for known risk factors for cancer (eg, excessive sun exposure, smoking).
The main clinical implications from this study are that we do not have enough evidence to recommend BRAF testing for all incident melanomas, and BRAF-mutated melanomas cannot be associated with increased risk for developing other forms of cancer, with the possible exception of BCCs
Conclusion
Physicians should be aware of the risk for a second primary malignancy after an incident melanoma, and we emphasize the importance of long-term cancer surveillance.
Acknowledgment—We thank Ms. Jayne H. Feind (Rochester, Minnesota) for assistance with study coordination.
- American Cancer Society. Key statistics for melanoma skin cancer. Updated January 12, 2022. Accessed August 15, 2022.https://www.cancer.org/cancer/melanoma-skin-cancer/about/key-statistics.html
- American Cancer Society. Second Cancers After Melanoma Skin Cancer. Accessed August 19, 2022. https://www.cancer.org/cancer/melanoma-skin-cancer/after-treatment/second-cancers.html
- Spanogle JP, Clarke CA, Aroner S, et al. Risk of second primary malignancies following cutaneous melanoma diagnosis: a population-based study. J Am Acad Dermatol. 2010;62:757-767.
- Olazagasti Lourido JM, Ma JE, Lohse CM, et al. Increasing incidence of melanoma in the elderly: an epidemiological study in Olmsted County, Minnesota. Mayo Clin Proc. 2016;91:1555-1562.
- Reed KB, Brewer JD, Lohse CM, et al. Increasing incidence of melanoma among young adults: an epidemiological study in Olmsted County, Minnesota. Mayo Clin Proc. 2012;87:328-334.
- Lowe GC, Brewer JD, Peters MS, et al. Incidence of melanoma in the pediatric population: a population-based study in Olmsted County, Minnesota. Pediatr Derm. 2015;32:618-620.
- Lowe GC, Saavedra A, Reed KB, et al. Increasing incidence of melanoma among middle-aged adults: an epidemiologic study in Olmsted County, Minnesota. Mayo Clin Proc. 2014;89:52-59.
- Ascierto PA, Kirkwood JM, Grob JJ, et al. The role of BRAF V600 mutation in melanoma [editorial]. J Transl Med. 2012;10:85.
- Davies H, Bignell GR, Cox C, et al. Mutations of the BRAF gene in human cancer. Nature. 2002;417:949-954.
- Miller AJ, Mihm MC Jr. Melanoma. N Engl J Med. 2006;355:51-65.
- Tiacci E, Trifonov V, Schiavoni G, et al. BRAF mutations in hairy-cell leukemia. N Engl J Med. 2011;364:2305-2315.
- Xing M. BRAF mutation in thyroid cancer. Endocr Relat Cancer. 2005;12:245-262.
- Moreau S, Saiag P, Aegerter P, et al. Prognostic value of BRAF(V600) mutations in melanoma patients after resection of metastatic lymph nodes. Ann Surg Oncol. 2012;19:4314-4321.
- Flaherty KT, Robert C, Hersey P, et al. Improved survival with MEK inhibition in BRAF-mutated melanoma. N Engl J Med. 2012;367:107-114.
- von Elm E, Altman DG, Egger M, et al. The Strengthening the Reporting of Observational Studies in Epidemiology (STROBE) statement: guidelines for reporting observational studies. J Clin Epidemiol. 2008;61:344-349.
- Rocca WA, Yawn BP, St Sauver JL, et al. History of the Rochester Epidemiology Project: half a century of medical records linkage in a US population. Mayo Clin Proc. 2012;87:1202-1213.
- St. Sauver JL, Grossardt BR, Yawn BP, et al. Data resource profile: the Rochester Epidemiology Project (REP) medical records-linkage system. Int J Epidemiol. 2012;41:1614-1624.
- National Cancer Institute. Staging: melanoma of the skin, vulva, penis and scrotum staging. Accessed August 15, 2022. https://training.seer.cancer.gov/melanoma/abstract-code-stage/staging.html
- Pakhomov SV, Buntrock JD, Chute CG. Automating the assignment of diagnosis codes to patient encounters using example-based and machine learning techniques. J Am Med Inform Assoc. 2006;13:516-525.
- Curtin JA, Fridlyand J, Kageshita T, et al. Distinct sets of genetic alterations in melanoma. N Engl J Med. 2005;353:2135-2147.
- Thomas NE, Edmiston SN, Alexander A, et al. Number of nevi and early-life ambient UV exposure are associated with BRAF-mutant melanoma. Cancer Epidemiol Biomarkers Prev. 2007;16:991-997.
- German Cancer Research Center. Why identical mutations cause different types of cancer. July 19, 2021. Accessed August 15, 2022. https://www.dkfz.de/en/presse/pressemitteilungen/2021/dkfz-pm-21-41-Why-identical-mutations-cause-different-types-of-cancer.php
- Falcomatà C, Bärthel S, Ulrich A, et al. Genetic screens identify a context-specific PI3K/p27Kip1 node driving extrahepatic biliary cancer. Cancer Discov. 2021;11:3158-3177.
- Guan H, Ji M, Bao R, et al. Association of high iodine intake with the T1799A BRAF mutation in papillary thyroid cancer. J Clin Endocrinol Metab. 2009;94:1612-1617.
- Wish TA, Hyde AJ, Parfrey PS, et al. Increased cancer predisposition in family members of colorectal cancer patients harboring the p.V600E BRAF mutation: a population-based study. Cancer Epidemiol Biomarkers Prev. 2010;19:1831-1839.
- Zebary A, Omholt K, Vassilaki I, et al. KIT, NRAS, BRAF and PTEN mutations in a sample of Swedish patients with acral lentiginous melanoma. J Dermatol Sci. 2013;72:284-289.
- Si L, Kong Y, Xu X, et al. Prevalence of BRAF V600E mutation in Chinese melanoma patients: large scale analysis of BRAF and NRAS mutations in a 432-case cohort. Eur J Cancer. 2012;48:94-100.
- Safaee Ardekani G, Jafarnejad SM, Khosravi S, et al. Disease progression and patient survival are significantly influenced by BRAF protein expression in primary melanoma. Br J Dermatol. 2013;169:320-328.
Practice Points
- Dermatologists should be aware of the long-term risk of second primary malignancies after an incident melanoma.
- BRAF mutations occur in melanomas and several other cancers. Our study found that melanoma BRAF V600E expression is associated with an increased risk for basal cell carcinomas.
Gender and Patient Satisfaction in a Veterans Health Administration Outpatient Chemotherapy Unit
Gender differences in patient satisfaction with medical care have been evaluated in multiple settings; however, studies specific to the unique population of women veterans with cancer are lacking. Women are reported to value privacy, psychosocial support, and communication to a higher degree compared with men.1 Factors affecting satisfaction include the following: discomfort in sharing treatment rooms with the opposite gender, a desire for privacy with treatment and restroom use, anatomic or illness differences, and a personal history of abuse.2-4 Regrettably, up to 1 in 3 women in the United States are victims of sexual trauma in their lifetimes, and up to 1 in 4 women in the military are victims of military sexual trauma. Incidence in both settings is suspected to be higher due to underreporting.5,6
Chemotherapy treatment units are often uniquely designed as an open space, with several patients sharing a treatment area. The design reduces isolation and facilitates quick nurse-patient access during potentially toxic treatments known to have frequent adverse effects. Data suggest that nursing staff prefer open models to facilitate quick patient assessments and interventions as needed; however, patients and families prefer private treatment rooms, especially among women patients or those receiving longer infusions.7
The Veterans Health Administration (VHA) patient population is male predominant, comprised only of 10% female patients.8 Although the proportion of female patients in the VHA is expected to rise annually to about 16% by 2043, the low percentage of female veterans will persist for the foreseeable future.8 This low percentage of female veterans is reflected in the Veterans Affairs Portland Health Care System (VAPHCS) cancer patient population and in the use of the chemotherapy infusion unit, which is used for the ambulatory treatment of veterans undergoing cancer therapy.
The VHA has previously explored gender differences in health care, such as with cardiovascular disease, transgender care, and access to mental health.9-11 However, to the best of our knowledge, no analysis has explored gender differences within the outpatient cancer treatment experience. Patient satisfaction with outpatient cancer care may be magnified in the VHA setting due to the uniquely unequal gender populations, shared treatment space design, and high incidence of sexual abuse among women veterans. Given this, we aimed to identify gender-related preferences in outpatient cancer care in our chemotherapy infusion unit.
In our study, we used the terms male and female to reflect statistical data from the literature or labeled data from the electronic health record (EHR); whereas the terms men and women were used to describe and encompass the cultural implications and context of gender.12
Methods
This study was designated as a quality improvement (QI) project by the VAPHCS research office and Institutional Review Board in accordance with VHA policies.
The VAPHCS outpatient chemotherapy infusion unit is designed with 6 rooms for chemotherapy administration. One room is a large open space with 6 chairs for patients. The other rooms are smaller with glass dividers between the rooms, and 3 chairs inside each for patients. There are 2 private bathrooms, each gender neutral. Direct patient care is provided by physicians, nurse practitioners (NPs), infusion unit nurses, and nurse coordinators. Men represent the majority of hematology and oncology physicians (13 of 20 total: 5 women fellow physicians and 2 women attending physicians), and 2 of 4 NPs. Women represent 10 of 12 infusion unit and cancer coordinator nurses. We used the VHA Computerized Patient Record System (CPRS) EHR, to create a list of veterans treated at the VAPHCS outpatient chemotherapy infusion unit for a 2-year period (January 1, 2018, to December 31, 2020).
Male and female patient lists were first generated based on CPRS categorization. We identified all female veterans treated in the ambulatory infusion unit during the study period. Male patients were then chosen at random, recording the most recent names for each year until a matched number per year compared with the female cohort was reached. Patients were recorded only once even though they had multiple infusion unit visits. Patients were excluded who were deceased, on hospice care, lost to follow-up, could not be reached by phone, refused to take the survey, had undeliverable email addresses, or lacked internet or email access.
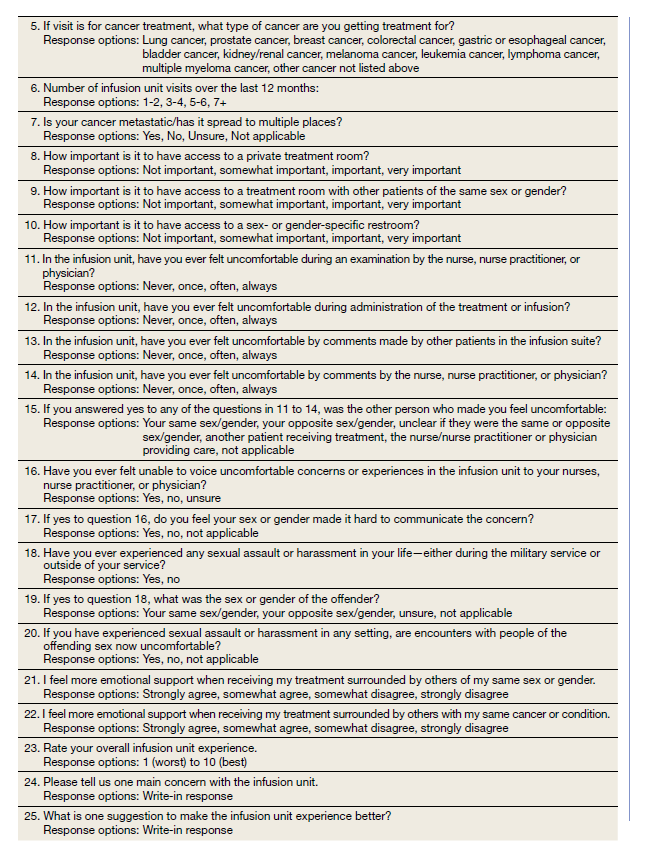
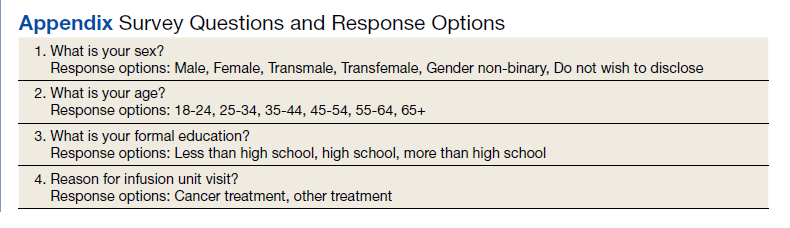
After filing the appropriate request through the VAPHCS Institutional Review Board committee in January 2021, patient records were reviewed for demographics data, contact information, and infusion treatment history. The survey was then conducted over a 2-week period during January and February 2021. Each patient was invited by phone to complete a 25-question anonymous online survey. The survey questions were created from patient-relayed experiences, then modeled into survey questions in a format similar to other patient satisfaction questionnaires described in cancer care and gender differences.2,13,14 The survey included self-identification of gender and was multiple choice for all except 2 questions, which allowed an open-ended response (Appendix). Only 1 answer per question was permitted. Only 1 survey link was sent to each veteran who gave permission for the survey. To protect anonymity for the small patient population, we excluded those identifying as gender nonbinary or transgender.
Statistical Analysis
Patient, disease, and treatment features are separated by male and female cohorts to reflect information from the EHR (Table 1). Survey percentages were calculated to reflect the affirmative response of the question asked (Table 2). Questions with answer options of not important, minimally important, important, or very important were calculated to reflect the sum of any importance in both cohorts. Questions with answer options of never, once, often, or every time were calculated to reflect any occurrence (sum of once, often, or every time) in both patient groups. Questions with answer options of strongly agree, somewhat agree, somewhat disagree, and strongly disagree were calculated to reflect any agreement (somewhat agree and strongly agree summed together) for both groups. Comparisons between cohorts were then conducted using a Fisher exact test. A Welch t test was used to calculate the significance of the continuous variable and overall ranking of the infusion unit experience between groups.
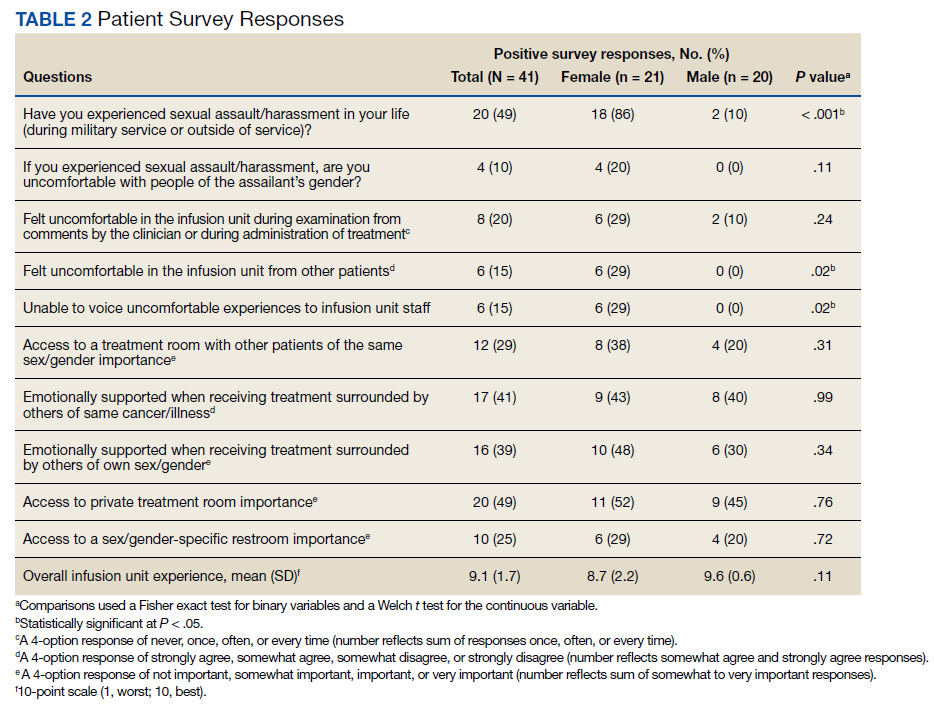
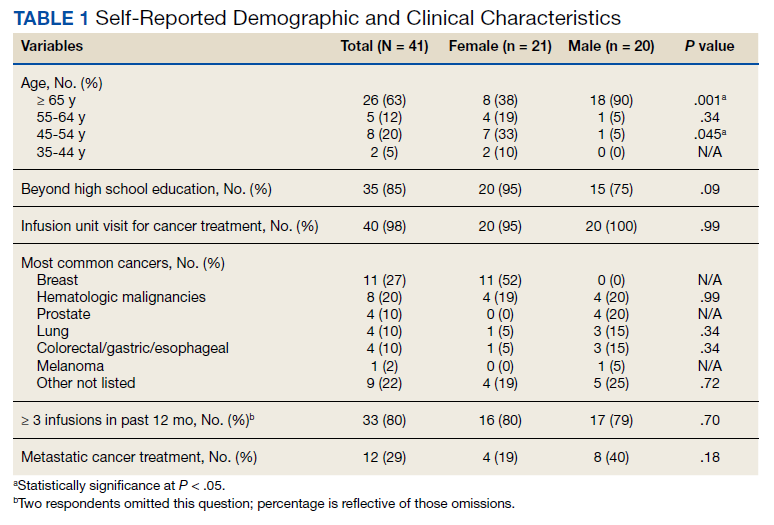
Results
In 2020, 414 individual patients were treated at the VAPAHCS outpatient infusion unit. Of these, 23 (5.6%) were female, and 18 agreed to take the survey. After deceased and duplicate names from 2020 were removed, another 14 eligible 2019 female patients were invited and 6 agreed to participate; 6 eligible 2018 female patients were invited and 4 agreed to take the survey (Figure). Thirty female veterans were sent a survey link and 21 (70%) responses were collected. Twenty-one male 2020 patients were contacted and 18 agreed to take the survey. After removing duplicate names and deceased individuals, 17 of 21 eligible 2019 male patients and 4 of 6 eligible 2018 patients agreed to take the survey. Five additional male veterans declined the online-based survey method. In total, 39 male veterans were reached who agreed to have the survey link emailed, and 20 (51%) total responses were collected.
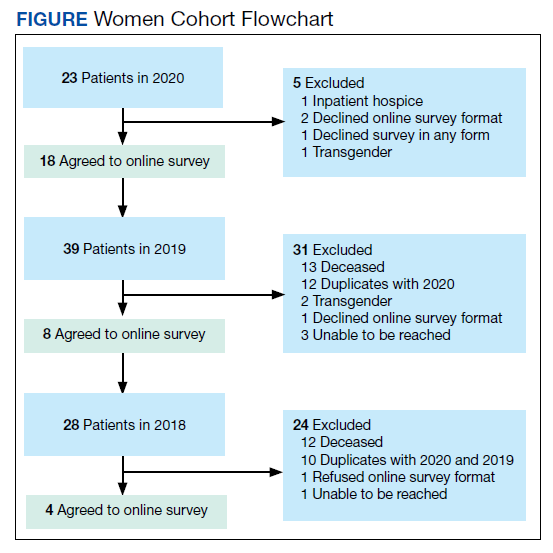
Most respondents answered all questions in the survey. The most frequently skipped questions included 3 questions that were contingent on a yes answer to a prior question, and 2 openended questions asking for a write-in response. Percentages for female and male respondents were adjusted for number of responses when applicable.
Thirteen (62%) female patients were aged < 65 years, while 18 (90%) of male patients were aged ≥ 65 years. Education beyond high school was reported in 20 female and 15 male respondents. Almost all treatment administered in the infusion unit was for cancer-directed treatment, with only 1 reporting a noncancer treatment (IV iron). The most common malignancy among female patients was breast cancer (n = 11, 52%); for male patients prostate cancer (n = 4, 20%) and hematologic malignancy (n = 4, 20%) were most common. Four (19%) female and 8 (40%) male respondents reported having a metastatic diagnosis. Overall patient satisfaction ranked high with an average score of 9.1 on a 10-point scale. The mean (SD) satisfaction score for female respondents was 1 point lower than that for men: 8.7 (2.2) vs 9.6 (0.6) in men (P = .11).
Eighteen (86%) women reported a history of sexual abuse or harassment compared with 2 (10%) men (P < .001). The sexual abuse assailant was a different gender for 17 of 18 female respondents and of the same gender for both male respondents. Of those with sexual abuse history, 4 women reported feeling uncomfortable around their assailant’s gender vs no men (P = .11), but this difference was not statistically significant. Six women (29%) and 2 (10%) men reported feeling uncomfortable during clinical examinations from comments made by the clinician or during treatment administration (P = .24). Six (29%) women and no men reported that they “felt uncomfortable in the infusion unit by other patients” (P = .02). Six (29%) women and no men reported feeling unable to “voice uncomfortable experiences” to the infusion unit clinician (P = .02).
Ten (48%) women and 6 (30%) men reported emotional support when receiving treatments provided by staff of the same gender (P = .34). Eight (38%) women and 4 (20%) men noted that access to treatment with the same gender was important (P = .31). Six (29%) women and 4 (20%) men indicated that access to a sex or gender-specific restroom was important (P = .72). No gender preferences were identified in the survey questions regarding importance of private treatment room access and level of emotional support when receiving treatment with others of the same malignancy. These relationships were not statistically significant.
In addition, 2 open-ended questions were asked. Seventeen women and 14 men responded. Contact the corresponding author for more information on the questions and responses.
Discussion
Overall patient satisfaction was high among the men and women veterans with cancer who received treatment in our outpatient infusion unit; however, notable gender differences existed. Three items in the survey revealed statistically significant differences in the patient experience between men and women veterans: history of sexual abuse or harassment, uncomfortable feelings among other patients, and discomfort in relaying uncomfortable feelings to a clinician. Other items in the survey did not reach statistical significance; however, we have included discussion of the findings as they may highlight important trends and be of clinical significance.
We suspect differences among genders in patient satisfaction to be related to the high incidence of sexual abuse or harassment history reported by women, much higher at 86% than the one-third to one-fourth incidence rates estimated by the existing literature for civilian or military sexual abuse in women.5,6 These high sexual abuse or harassment rates are present in a majority of women who receive cancer-directed treatment toward a gender-specific breast malignancy, surrounded predominantly among men in a shared treatment space. Together, these factors are likely key reasons behind the differences in satisfaction observed. This sentiment is expressed in our cohort, where one-fifth of women with a sexual abuse or harassment history continue to remain uncomfortable around men, and 29% of women reporting some uncomfortable feelings during their treatment experience compared with none of the men. Additionally, 6 (29%) women vs no men felt uncomfortable in reporting an uncomfortable experience with a clinician; this represents a significant barrier in providing care for these patients.
A key gender preference among women included access to shared treatment rooms with other women and that sharing a treatment space with other women resulted in feeling more emotional support during treatments. Access to gender-specific restrooms was also preferred by women more than men. Key findings in both genders were that about half of men and women valued access to a private treatment room and would derive more emotional support when surrounded by others with the same cancer.
Prior studies on gender and patient satisfaction in general medical care and cancer care have found women value privacy more than men.1-3 Wessels and colleagues performed an analysis of 386 patients with cancer in Europe and found gender to be the strongest influence in patient preferences within cancer care. Specifically, the highest statically significant association in care preferences among women included privacy, support/counseling/rehabilitation access, and decreased wait times.2 These findings were most pronounced in those with breast cancer compared with other malignancy type and highlights that malignancy type and gender predominance impact care satisfaction.
Traditionally a shared treatment space design has been used in outpatient chemotherapy units, similar to the design of the VAPHCS. However, recent data report on the patient preference for a private treatment space, which was especially prominent among women and those receiving longer infusions.7 In another study that evaluated 225 patients with cancer preferences in sharing a treatment space with those of a different sexual orientation or gender identify, differences were found. Both men and women had a similar level of comfort in sharing a treatment room with someone of a different sexual orientation; however, more women reported discomfort in sharing a treatment space with a transgender woman compared with men who felt more comfortable sharing a space with a transgender man.4 We noted a gender preference may be present to explain the difference. Within our cohort, women valued access to treatment with other women and derived more emotional support when with other women; however, we did not inquire about feelings in sharing a treatment space among transgender individuals or differing sexual orientation.
Gender differences for privacy and in shared room preferences may result from the lasting impacts of prior sexual abuse or harassment. A history of sexual abuse negatively impacts later medical care access and use.15 Those veterans who experienced sexual abuse/harrassment reported higher feelings of lack of control, vulnerability, depression, and pursued less medical care.15,16 Within cancer care, these feelings are most pronounced among women with gender-specific malignancies, such as gynecologic cancers or breast cancer. Treatment, screening, and physical examinations by clinicians who are of the same gender as the sexual abuse/harassment assailant can recreate traumatic feelings.15,16
A majority of women (n = 18, 86%) in our cohort reported a history of sexual abuse or harassment and breast malignancy was the most common cancer among women. However women represent just 5.6% of the VAPHCS infusion unit treatment population. This combination of factors may explain the reasons for women veterans’ preference for privacy during treatments, access to gender-specific restrooms, and feeling more emotional support when surrounded by other women. Strategies to help patients with a history of abuse have been described and include discussions from the clinician asking about abuse history, allowing time for the patient to express fears with an examination or test, and training on how to deliver sensitive care for those with trauma.17,18
Quality Improvement
Project In the VAPHCS infusion unit, several low-cost interventions have been undertaken as a result of our survey findings. We presented our survey data to the VAPHCS Cancer Committee, accredited through the national American College of Surgeons Commission on Cancer. The committee awarded support for a yearlong QI project, including a formal framework of quarterly multidisciplinary meetings to discuss project updates, challenges, and resources. The QI project centers on education to raise awareness of survey results as well as specific interventions for improvement.
Education efforts have been applied through multiple department-wide emails, in-person education to our chemotherapy unit staff, abstract submission to national oncology conferences, and grand rounds department presentations at VAPHCS and at other VHA-affiliated university programs. Additionally, education to clinicians with specific contact information for psychology and women’s health to support mental health, trauma, and sexual abuse histories has been given to each clinician who cares for veterans in the chemotherapy unit.
We also have implemented a mandatory cancer care navigation consultation for all women veterans who have a new cancer or infusion need. The cancer care navigator has received specialized training in sensitive history-taking and provides women veterans with a direct number to reach the cancer care navigation nurse. Cancer care navigation also provides a continuum of support and referral access for psychosocial needs as indicated between infusion or health care visits. Our hope is that these resources may help offset the sentiment reflected in our cohort of women feeling unable to voice concerns to a clinician.
Other interventions underway include offering designated scheduling time each week to women so they can receive infusions in an area with other women. This may help mitigate the finding that women veterans felt more uncomfortable around other patients during infusion treatments compared with how men felt in the chemotherapy unit. We also have implemented gender-specific restrooms labeled with a sign on each bathroom door so men and women can have access to a designated restroom. Offering private or semiprivate treatment rooms is currently limited by space and capacity; however, these may offer the greatest opportunity to improve patient satisfaction, especially among women veterans. Working with the support of the VAPHCS Cancer Committee, we aim to reevaluate the impact of the education and QI efforts on gender differences and patient satisfaction at completion of the 1-year award.
Limitations
Limitations to our study include the overall small sample size. This is due to the combination of the low number of women treated at VAPHCS and many with advanced cancer who, unfortunately, have a limited overall survival and hinders accrual of a larger sample size. Other limitations included age as a possible confounder in our findings, with women representing a younger demographic compared with men. We did not collect responses on duration of infusion time, which also may impact overall satisfaction and patient experience. We also acknowledge that biologic male or female sex may not correspond to a specific individual’s gender. Use of CPRS to obtain a matched number of male and female patients through random selection relied on labeled data from the EHR. This potentially may have excluded male patients who identify as another gender that would have been captured on the anonymous survey.
Last, we restricted survey responses to online only, which excluded a small percentage who declined this approach.
Conclusions
Our findings may have broad applications to other VHA facilities and other cancer-directed treatment centers where the patient demographic and open shared infusion unit design may be similar. The study also may serve as a model of survey design and implementation from which other centers may consider improving patient satisfaction. We hope these survey results and interventions can provide insight and be used to improve patient satisfaction among all cancer patients at infusion units serving veterans and nonveterans.
Acknowledgments
We are very thankful to our cancer patients who took the time to take the survey. We also are very grateful to the VHA infusion unit nurses, staff, nurse practitioners, and physicians who have embraced this project and welcomed any changes that may positively impact treatment of veterans. Also, thank you to Tia Kohs for statistical support and Sophie West for gender discussions. Last, we specifically thank Barbara, for her pursuit of better care for women and for all veterans.
1. Clarke SA, Booth L, Velikova G, Hewison J. Social support: gender differences in cancer patients in the United Kingdom. Cancer Nurs. 2006;29(1):66-72. doi:10.1097/00002820-200601000-00012
2. Wessels H, de Graeff A, Wynia K, et al. Gender-related needs and preferences in cancer care indicate the need for an individualized approach to cancer patients. Oncologist. 2010;15(6):648-655. doi:10.1634/theoncologist.2009-0337
3. Hartigan SM, Bonnet K, Chisholm L, et al. Why do women not use the bathroom? Women’s attitudes and beliefs on using public restrooms. Int J Environ Res Public Health. 2020;17(6):2053. doi:10.3390/ijerph17062053
4. Alexander K, Walters CB, Banerjee SC. Oncology patients’ preferences regarding sexual orientation and gender identity (SOGI) disclosure and room sharing sharing. Patient Educ Couns. 2020;103(5):1041-1048. doi:10.1016/j.pec.2019.12.006
5. Centers for Disease Control and Prevention. Facts about sexual violence. Updated July 5, 2022. Accessed July 13, 2022. https://www.cdc.gov/injury/features /sexual-violence/index.html
6. US Department of Veterans Affairs. Military sexual trauma. Updated May 16, 2022. Accessed July 13, 2022. https:// www.mentalhealth.va.gov/mentalhealth/msthome/index.asp
7. Wang Z, Pukszta M. Private Rooms, Semi-open areas, or open areas for chemotherapy care: perspectives of cancer patients, families, and nursing staff. HERD. 2018;11(3):94- 108. doi:10.1177/1937586718758445
8. US Department of Veterans Affairs, National Center for Veterans Analysis and Statistics. Women veterans report: the past, present, and future of women veterans. Accessed July 13, 2022. https://www.va.gov/vetdata /docs/specialreports/women_veterans_2015_final.pdf
9. Driscoll MA, Higgins DM, Seng EK, et al. Trauma, social support, family conflict, and chronic pain in recent service veterans: does gender matter? Pain Med. 2015;16(6):1101- 1111. doi:10.1111/pme.12744
10. Fox AB, Meyer EC, Vogt D. Attitudes about the VA healthcare setting, mental illness, and mental health treatment and their relationship with VA mental health service use among female and male OEF/OIF veterans. Psychol Serv. 2015;12(1):49-58. doi:10.1037/a0038269
11. Virani SS, Woodard LD, Ramsey DJ, et al. Gender disparities in evidence-based statin therapy in patients with cardiovascular disease. Am J Cardiol. 2015;115(1):21-26. doi:10.1016/j.amjcard.2014.09.041
12. Tseng J. Sex, gender, and why the differences matter. Virtual Mentor. 2008;10(7):427-428. doi:10.1001/virtualmentor.2008.10.7.fred1-0807
13. Booij JC, Zegers M, Evers PMPJ, Hendricks M, Delnoij DMJ, Rademakers JJDJM. Improving cancer patient care: development of a generic cancer consumer quality index questionnaire for cancer patients. BMC Cancer. 2013;13(203). doi:10.1186/1471-2407-13-203
14. Meropol NJ, Egleston BL, Buzaglo JS, et al. Cancer patient preferences for quality and length of life. Cancer. 2008;113(12):3459-3466. doi:10.1002/cncr.23968 1
5. Schnur JB, Dillon MJ, Goldsmith RE, Montgomery GH. Cancer treatment experiences among survivors of childhood sexual abuse: a qualitative investigation of triggers and reactions to cumulative trauma. Palliat Support Care. 2018;16(6):767-776. doi:10.1017/S147895151700075X
16. Cadman L, Waller J, Ashdown-Barr L, Szarewski A. Barriers to cervical screening in women who have experienced sexual abuse: an exploratory study. J Fam Plann Reprod Health Care. 2012;38(4):214-220. doi:10.1136/jfprhc-2012-100378
17. Kelly S. The effects of childhood sexual abuse on women’s lives and their attitudes to cervical screening. J Fam Plann Reprod Health Care. 2012;38(4):212-213. doi:10.1136/jfprhc-2012-100418
18. McCloskey LA, Lichter E, Williams C, Gerber M, Wittenberg E, Ganz M. Assessing intimate partner violence in health care settings leads to women’s receipt of interventions and improved health. Public Health Rep. 2006;121(4):435-444. doi:10.1177/003335490612100412
Gender differences in patient satisfaction with medical care have been evaluated in multiple settings; however, studies specific to the unique population of women veterans with cancer are lacking. Women are reported to value privacy, psychosocial support, and communication to a higher degree compared with men.1 Factors affecting satisfaction include the following: discomfort in sharing treatment rooms with the opposite gender, a desire for privacy with treatment and restroom use, anatomic or illness differences, and a personal history of abuse.2-4 Regrettably, up to 1 in 3 women in the United States are victims of sexual trauma in their lifetimes, and up to 1 in 4 women in the military are victims of military sexual trauma. Incidence in both settings is suspected to be higher due to underreporting.5,6
Chemotherapy treatment units are often uniquely designed as an open space, with several patients sharing a treatment area. The design reduces isolation and facilitates quick nurse-patient access during potentially toxic treatments known to have frequent adverse effects. Data suggest that nursing staff prefer open models to facilitate quick patient assessments and interventions as needed; however, patients and families prefer private treatment rooms, especially among women patients or those receiving longer infusions.7
The Veterans Health Administration (VHA) patient population is male predominant, comprised only of 10% female patients.8 Although the proportion of female patients in the VHA is expected to rise annually to about 16% by 2043, the low percentage of female veterans will persist for the foreseeable future.8 This low percentage of female veterans is reflected in the Veterans Affairs Portland Health Care System (VAPHCS) cancer patient population and in the use of the chemotherapy infusion unit, which is used for the ambulatory treatment of veterans undergoing cancer therapy.
The VHA has previously explored gender differences in health care, such as with cardiovascular disease, transgender care, and access to mental health.9-11 However, to the best of our knowledge, no analysis has explored gender differences within the outpatient cancer treatment experience. Patient satisfaction with outpatient cancer care may be magnified in the VHA setting due to the uniquely unequal gender populations, shared treatment space design, and high incidence of sexual abuse among women veterans. Given this, we aimed to identify gender-related preferences in outpatient cancer care in our chemotherapy infusion unit.
In our study, we used the terms male and female to reflect statistical data from the literature or labeled data from the electronic health record (EHR); whereas the terms men and women were used to describe and encompass the cultural implications and context of gender.12
Methods
This study was designated as a quality improvement (QI) project by the VAPHCS research office and Institutional Review Board in accordance with VHA policies.
The VAPHCS outpatient chemotherapy infusion unit is designed with 6 rooms for chemotherapy administration. One room is a large open space with 6 chairs for patients. The other rooms are smaller with glass dividers between the rooms, and 3 chairs inside each for patients. There are 2 private bathrooms, each gender neutral. Direct patient care is provided by physicians, nurse practitioners (NPs), infusion unit nurses, and nurse coordinators. Men represent the majority of hematology and oncology physicians (13 of 20 total: 5 women fellow physicians and 2 women attending physicians), and 2 of 4 NPs. Women represent 10 of 12 infusion unit and cancer coordinator nurses. We used the VHA Computerized Patient Record System (CPRS) EHR, to create a list of veterans treated at the VAPHCS outpatient chemotherapy infusion unit for a 2-year period (January 1, 2018, to December 31, 2020).
Male and female patient lists were first generated based on CPRS categorization. We identified all female veterans treated in the ambulatory infusion unit during the study period. Male patients were then chosen at random, recording the most recent names for each year until a matched number per year compared with the female cohort was reached. Patients were recorded only once even though they had multiple infusion unit visits. Patients were excluded who were deceased, on hospice care, lost to follow-up, could not be reached by phone, refused to take the survey, had undeliverable email addresses, or lacked internet or email access.
After filing the appropriate request through the VAPHCS Institutional Review Board committee in January 2021, patient records were reviewed for demographics data, contact information, and infusion treatment history. The survey was then conducted over a 2-week period during January and February 2021. Each patient was invited by phone to complete a 25-question anonymous online survey. The survey questions were created from patient-relayed experiences, then modeled into survey questions in a format similar to other patient satisfaction questionnaires described in cancer care and gender differences.2,13,14 The survey included self-identification of gender and was multiple choice for all except 2 questions, which allowed an open-ended response (Appendix). Only 1 answer per question was permitted. Only 1 survey link was sent to each veteran who gave permission for the survey. To protect anonymity for the small patient population, we excluded those identifying as gender nonbinary or transgender.
Statistical Analysis
Patient, disease, and treatment features are separated by male and female cohorts to reflect information from the EHR (Table 1). Survey percentages were calculated to reflect the affirmative response of the question asked (Table 2). Questions with answer options of not important, minimally important, important, or very important were calculated to reflect the sum of any importance in both cohorts. Questions with answer options of never, once, often, or every time were calculated to reflect any occurrence (sum of once, often, or every time) in both patient groups. Questions with answer options of strongly agree, somewhat agree, somewhat disagree, and strongly disagree were calculated to reflect any agreement (somewhat agree and strongly agree summed together) for both groups. Comparisons between cohorts were then conducted using a Fisher exact test. A Welch t test was used to calculate the significance of the continuous variable and overall ranking of the infusion unit experience between groups.
Results
In 2020, 414 individual patients were treated at the VAPAHCS outpatient infusion unit. Of these, 23 (5.6%) were female, and 18 agreed to take the survey. After deceased and duplicate names from 2020 were removed, another 14 eligible 2019 female patients were invited and 6 agreed to participate; 6 eligible 2018 female patients were invited and 4 agreed to take the survey (Figure). Thirty female veterans were sent a survey link and 21 (70%) responses were collected. Twenty-one male 2020 patients were contacted and 18 agreed to take the survey. After removing duplicate names and deceased individuals, 17 of 21 eligible 2019 male patients and 4 of 6 eligible 2018 patients agreed to take the survey. Five additional male veterans declined the online-based survey method. In total, 39 male veterans were reached who agreed to have the survey link emailed, and 20 (51%) total responses were collected.
Most respondents answered all questions in the survey. The most frequently skipped questions included 3 questions that were contingent on a yes answer to a prior question, and 2 openended questions asking for a write-in response. Percentages for female and male respondents were adjusted for number of responses when applicable.
Thirteen (62%) female patients were aged < 65 years, while 18 (90%) of male patients were aged ≥ 65 years. Education beyond high school was reported in 20 female and 15 male respondents. Almost all treatment administered in the infusion unit was for cancer-directed treatment, with only 1 reporting a noncancer treatment (IV iron). The most common malignancy among female patients was breast cancer (n = 11, 52%); for male patients prostate cancer (n = 4, 20%) and hematologic malignancy (n = 4, 20%) were most common. Four (19%) female and 8 (40%) male respondents reported having a metastatic diagnosis. Overall patient satisfaction ranked high with an average score of 9.1 on a 10-point scale. The mean (SD) satisfaction score for female respondents was 1 point lower than that for men: 8.7 (2.2) vs 9.6 (0.6) in men (P = .11).
Eighteen (86%) women reported a history of sexual abuse or harassment compared with 2 (10%) men (P < .001). The sexual abuse assailant was a different gender for 17 of 18 female respondents and of the same gender for both male respondents. Of those with sexual abuse history, 4 women reported feeling uncomfortable around their assailant’s gender vs no men (P = .11), but this difference was not statistically significant. Six women (29%) and 2 (10%) men reported feeling uncomfortable during clinical examinations from comments made by the clinician or during treatment administration (P = .24). Six (29%) women and no men reported that they “felt uncomfortable in the infusion unit by other patients” (P = .02). Six (29%) women and no men reported feeling unable to “voice uncomfortable experiences” to the infusion unit clinician (P = .02).
Ten (48%) women and 6 (30%) men reported emotional support when receiving treatments provided by staff of the same gender (P = .34). Eight (38%) women and 4 (20%) men noted that access to treatment with the same gender was important (P = .31). Six (29%) women and 4 (20%) men indicated that access to a sex or gender-specific restroom was important (P = .72). No gender preferences were identified in the survey questions regarding importance of private treatment room access and level of emotional support when receiving treatment with others of the same malignancy. These relationships were not statistically significant.
In addition, 2 open-ended questions were asked. Seventeen women and 14 men responded. Contact the corresponding author for more information on the questions and responses.
Discussion
Overall patient satisfaction was high among the men and women veterans with cancer who received treatment in our outpatient infusion unit; however, notable gender differences existed. Three items in the survey revealed statistically significant differences in the patient experience between men and women veterans: history of sexual abuse or harassment, uncomfortable feelings among other patients, and discomfort in relaying uncomfortable feelings to a clinician. Other items in the survey did not reach statistical significance; however, we have included discussion of the findings as they may highlight important trends and be of clinical significance.
We suspect differences among genders in patient satisfaction to be related to the high incidence of sexual abuse or harassment history reported by women, much higher at 86% than the one-third to one-fourth incidence rates estimated by the existing literature for civilian or military sexual abuse in women.5,6 These high sexual abuse or harassment rates are present in a majority of women who receive cancer-directed treatment toward a gender-specific breast malignancy, surrounded predominantly among men in a shared treatment space. Together, these factors are likely key reasons behind the differences in satisfaction observed. This sentiment is expressed in our cohort, where one-fifth of women with a sexual abuse or harassment history continue to remain uncomfortable around men, and 29% of women reporting some uncomfortable feelings during their treatment experience compared with none of the men. Additionally, 6 (29%) women vs no men felt uncomfortable in reporting an uncomfortable experience with a clinician; this represents a significant barrier in providing care for these patients.
A key gender preference among women included access to shared treatment rooms with other women and that sharing a treatment space with other women resulted in feeling more emotional support during treatments. Access to gender-specific restrooms was also preferred by women more than men. Key findings in both genders were that about half of men and women valued access to a private treatment room and would derive more emotional support when surrounded by others with the same cancer.
Prior studies on gender and patient satisfaction in general medical care and cancer care have found women value privacy more than men.1-3 Wessels and colleagues performed an analysis of 386 patients with cancer in Europe and found gender to be the strongest influence in patient preferences within cancer care. Specifically, the highest statically significant association in care preferences among women included privacy, support/counseling/rehabilitation access, and decreased wait times.2 These findings were most pronounced in those with breast cancer compared with other malignancy type and highlights that malignancy type and gender predominance impact care satisfaction.
Traditionally a shared treatment space design has been used in outpatient chemotherapy units, similar to the design of the VAPHCS. However, recent data report on the patient preference for a private treatment space, which was especially prominent among women and those receiving longer infusions.7 In another study that evaluated 225 patients with cancer preferences in sharing a treatment space with those of a different sexual orientation or gender identify, differences were found. Both men and women had a similar level of comfort in sharing a treatment room with someone of a different sexual orientation; however, more women reported discomfort in sharing a treatment space with a transgender woman compared with men who felt more comfortable sharing a space with a transgender man.4 We noted a gender preference may be present to explain the difference. Within our cohort, women valued access to treatment with other women and derived more emotional support when with other women; however, we did not inquire about feelings in sharing a treatment space among transgender individuals or differing sexual orientation.
Gender differences for privacy and in shared room preferences may result from the lasting impacts of prior sexual abuse or harassment. A history of sexual abuse negatively impacts later medical care access and use.15 Those veterans who experienced sexual abuse/harrassment reported higher feelings of lack of control, vulnerability, depression, and pursued less medical care.15,16 Within cancer care, these feelings are most pronounced among women with gender-specific malignancies, such as gynecologic cancers or breast cancer. Treatment, screening, and physical examinations by clinicians who are of the same gender as the sexual abuse/harassment assailant can recreate traumatic feelings.15,16
A majority of women (n = 18, 86%) in our cohort reported a history of sexual abuse or harassment and breast malignancy was the most common cancer among women. However women represent just 5.6% of the VAPHCS infusion unit treatment population. This combination of factors may explain the reasons for women veterans’ preference for privacy during treatments, access to gender-specific restrooms, and feeling more emotional support when surrounded by other women. Strategies to help patients with a history of abuse have been described and include discussions from the clinician asking about abuse history, allowing time for the patient to express fears with an examination or test, and training on how to deliver sensitive care for those with trauma.17,18
Quality Improvement
Project In the VAPHCS infusion unit, several low-cost interventions have been undertaken as a result of our survey findings. We presented our survey data to the VAPHCS Cancer Committee, accredited through the national American College of Surgeons Commission on Cancer. The committee awarded support for a yearlong QI project, including a formal framework of quarterly multidisciplinary meetings to discuss project updates, challenges, and resources. The QI project centers on education to raise awareness of survey results as well as specific interventions for improvement.
Education efforts have been applied through multiple department-wide emails, in-person education to our chemotherapy unit staff, abstract submission to national oncology conferences, and grand rounds department presentations at VAPHCS and at other VHA-affiliated university programs. Additionally, education to clinicians with specific contact information for psychology and women’s health to support mental health, trauma, and sexual abuse histories has been given to each clinician who cares for veterans in the chemotherapy unit.
We also have implemented a mandatory cancer care navigation consultation for all women veterans who have a new cancer or infusion need. The cancer care navigator has received specialized training in sensitive history-taking and provides women veterans with a direct number to reach the cancer care navigation nurse. Cancer care navigation also provides a continuum of support and referral access for psychosocial needs as indicated between infusion or health care visits. Our hope is that these resources may help offset the sentiment reflected in our cohort of women feeling unable to voice concerns to a clinician.
Other interventions underway include offering designated scheduling time each week to women so they can receive infusions in an area with other women. This may help mitigate the finding that women veterans felt more uncomfortable around other patients during infusion treatments compared with how men felt in the chemotherapy unit. We also have implemented gender-specific restrooms labeled with a sign on each bathroom door so men and women can have access to a designated restroom. Offering private or semiprivate treatment rooms is currently limited by space and capacity; however, these may offer the greatest opportunity to improve patient satisfaction, especially among women veterans. Working with the support of the VAPHCS Cancer Committee, we aim to reevaluate the impact of the education and QI efforts on gender differences and patient satisfaction at completion of the 1-year award.
Limitations
Limitations to our study include the overall small sample size. This is due to the combination of the low number of women treated at VAPHCS and many with advanced cancer who, unfortunately, have a limited overall survival and hinders accrual of a larger sample size. Other limitations included age as a possible confounder in our findings, with women representing a younger demographic compared with men. We did not collect responses on duration of infusion time, which also may impact overall satisfaction and patient experience. We also acknowledge that biologic male or female sex may not correspond to a specific individual’s gender. Use of CPRS to obtain a matched number of male and female patients through random selection relied on labeled data from the EHR. This potentially may have excluded male patients who identify as another gender that would have been captured on the anonymous survey.
Last, we restricted survey responses to online only, which excluded a small percentage who declined this approach.
Conclusions
Our findings may have broad applications to other VHA facilities and other cancer-directed treatment centers where the patient demographic and open shared infusion unit design may be similar. The study also may serve as a model of survey design and implementation from which other centers may consider improving patient satisfaction. We hope these survey results and interventions can provide insight and be used to improve patient satisfaction among all cancer patients at infusion units serving veterans and nonveterans.
Acknowledgments
We are very thankful to our cancer patients who took the time to take the survey. We also are very grateful to the VHA infusion unit nurses, staff, nurse practitioners, and physicians who have embraced this project and welcomed any changes that may positively impact treatment of veterans. Also, thank you to Tia Kohs for statistical support and Sophie West for gender discussions. Last, we specifically thank Barbara, for her pursuit of better care for women and for all veterans.
1. Clarke SA, Booth L, Velikova G, Hewison J. Social support: gender differences in cancer patients in the United Kingdom. Cancer Nurs. 2006;29(1):66-72. doi:10.1097/00002820-200601000-00012
2. Wessels H, de Graeff A, Wynia K, et al. Gender-related needs and preferences in cancer care indicate the need for an individualized approach to cancer patients. Oncologist. 2010;15(6):648-655. doi:10.1634/theoncologist.2009-0337
3. Hartigan SM, Bonnet K, Chisholm L, et al. Why do women not use the bathroom? Women’s attitudes and beliefs on using public restrooms. Int J Environ Res Public Health. 2020;17(6):2053. doi:10.3390/ijerph17062053
4. Alexander K, Walters CB, Banerjee SC. Oncology patients’ preferences regarding sexual orientation and gender identity (SOGI) disclosure and room sharing sharing. Patient Educ Couns. 2020;103(5):1041-1048. doi:10.1016/j.pec.2019.12.006
5. Centers for Disease Control and Prevention. Facts about sexual violence. Updated July 5, 2022. Accessed July 13, 2022. https://www.cdc.gov/injury/features /sexual-violence/index.html
6. US Department of Veterans Affairs. Military sexual trauma. Updated May 16, 2022. Accessed July 13, 2022. https:// www.mentalhealth.va.gov/mentalhealth/msthome/index.asp
7. Wang Z, Pukszta M. Private Rooms, Semi-open areas, or open areas for chemotherapy care: perspectives of cancer patients, families, and nursing staff. HERD. 2018;11(3):94- 108. doi:10.1177/1937586718758445
8. US Department of Veterans Affairs, National Center for Veterans Analysis and Statistics. Women veterans report: the past, present, and future of women veterans. Accessed July 13, 2022. https://www.va.gov/vetdata /docs/specialreports/women_veterans_2015_final.pdf
9. Driscoll MA, Higgins DM, Seng EK, et al. Trauma, social support, family conflict, and chronic pain in recent service veterans: does gender matter? Pain Med. 2015;16(6):1101- 1111. doi:10.1111/pme.12744
10. Fox AB, Meyer EC, Vogt D. Attitudes about the VA healthcare setting, mental illness, and mental health treatment and their relationship with VA mental health service use among female and male OEF/OIF veterans. Psychol Serv. 2015;12(1):49-58. doi:10.1037/a0038269
11. Virani SS, Woodard LD, Ramsey DJ, et al. Gender disparities in evidence-based statin therapy in patients with cardiovascular disease. Am J Cardiol. 2015;115(1):21-26. doi:10.1016/j.amjcard.2014.09.041
12. Tseng J. Sex, gender, and why the differences matter. Virtual Mentor. 2008;10(7):427-428. doi:10.1001/virtualmentor.2008.10.7.fred1-0807
13. Booij JC, Zegers M, Evers PMPJ, Hendricks M, Delnoij DMJ, Rademakers JJDJM. Improving cancer patient care: development of a generic cancer consumer quality index questionnaire for cancer patients. BMC Cancer. 2013;13(203). doi:10.1186/1471-2407-13-203
14. Meropol NJ, Egleston BL, Buzaglo JS, et al. Cancer patient preferences for quality and length of life. Cancer. 2008;113(12):3459-3466. doi:10.1002/cncr.23968 1
5. Schnur JB, Dillon MJ, Goldsmith RE, Montgomery GH. Cancer treatment experiences among survivors of childhood sexual abuse: a qualitative investigation of triggers and reactions to cumulative trauma. Palliat Support Care. 2018;16(6):767-776. doi:10.1017/S147895151700075X
16. Cadman L, Waller J, Ashdown-Barr L, Szarewski A. Barriers to cervical screening in women who have experienced sexual abuse: an exploratory study. J Fam Plann Reprod Health Care. 2012;38(4):214-220. doi:10.1136/jfprhc-2012-100378
17. Kelly S. The effects of childhood sexual abuse on women’s lives and their attitudes to cervical screening. J Fam Plann Reprod Health Care. 2012;38(4):212-213. doi:10.1136/jfprhc-2012-100418
18. McCloskey LA, Lichter E, Williams C, Gerber M, Wittenberg E, Ganz M. Assessing intimate partner violence in health care settings leads to women’s receipt of interventions and improved health. Public Health Rep. 2006;121(4):435-444. doi:10.1177/003335490612100412
The Effect of Race on Outcomes in Veterans With Hepatocellular Carcinoma at a Single Center
Hepatocellular carcinoma (HCC) is the sixth most common and third most deadly malignancy worldwide, carrying a mean survival rate without treatment of 6 to 20 months depending on stage.1 Fifty-seven percent of patients with liver cancer are diagnosed with regional or distant metastatic disease that carries 5-year relative survival rates of 10.7% and 3.1%, respectively.2 HCC arises most commonly from liver cirrhosis due to chronic hepatocyte injury, which may be mediated by viral hepatitis, alcoholism, and metabolic disease. Other less common causes include autoimmune disease, exposure to environmental hazards, and certain genetic diseases, such as α-1 antitrypsin deficiency and Wilson disease.
Multiple staging systems for HCC exist that incorporate some variation of the following features: size and invasion of the tumor, distant metastases, and liver function. Stage-directed treatments for HCC include ablation, embolization, resection, transplant, and systemic therapy, such as tyrosine kinase inhibitors, immunotherapies, and monoclonal antibodies. In addition to tumor/node/metastasis (TNM) staging, α-fetoprotein (AFP) is a diagnostic marker with prognostic value in HCC with higher levels correlating to higher tumor burden and a worse prognosis. With treatment, the 5-year survival rate for early stage HCC ranges from 60% to 80% but decreases significantly with higher stages.1 HCC screening in at-risk populations has accounted for > 40% of diagnoses since the practice became widely adopted, and earlier recognition has led to an improvement in survival even when adjusting for lead time bias.3
Systemic therapy for advanced disease continues to improve. Sorafenib remained the standard first-line systemic therapy since it was introduced in 2008.4 First-line therapy improved with immunotherapies. The phase 3 IMBrave150 trial comparing atezolizumab plus bevacizumab to sorafenib showed a median overall survival (OS) > 19 months with 7.7% of patients achieving a complete response.5 HIMALAYA, another phase 3 trial set for publication later this year, also reported promising results when a priming dose of the CTLA-4 inhibitor tremelimumab followed by durvalumab was compared with sorafenib.6
There has been a rise in incidence of HCC in the United States across all races and ethnicities, though Black, Hispanic, and Asian patients remain disproportionately affected. Subsequently, identifying causative biologic, socioeconomic, and cultural factors, as well as implicit bias in health care continues to be a topic of great interest.7-9 Using Surveillance, Epidemiology, and End Results (SEER) data, a number of large studies have found that Black patients with HCC were more likely to present with an advanced stage, less likely to receive curative intent treatment, and had significantly reduced survival compared with that of White patients.1,7-9 An analysis of 1117 patients by Rich and colleagues noted a 34% increased risk of death for Black patients with HCC compared with that of White patients, and other studies have shown about a 50% reduction in rate of liver transplantation for Black patients.10-12 Our study aimed to investigate potential disparities in incidence, etiology, AFP level at diagnosis, and outcomes of HCC in Black and White veterans managed at the Memphis Veterans Affairs Medical Center (VAMC) in Tennessee.
Methods
A single center retrospective chart review was conducted at the Memphis VAMC using the Computerized Patient Record System (CPRS) and the International Statistical Classification of Diseases, Tenth Revision (ICD-10) code C22.0 for HCC. Initial results were manually refined by prespecified criteria. Patients were included if they were diagnosed with HCC and received HCC treatment at the Memphis VAMC. Patients were excluded if HCC was not diagnosed histologically or clinically by imaging characteristics and AFP level, if the patient’s primary treatment was not provided at the Memphis VAMC, if they were lost to follow-up, or if race was not specified as either Black or White.
The following patient variables were examined: age, sex, comorbidities (alcohol or substance use disorder, cirrhosis, HIV), tumor stage, AFP, method of diagnosis, first-line treatments, systemic treatment, surgical options offered, and mortality. Staging was based on the American Joint Committee on Cancer TNM staging for HCC.13 Surgical options were recorded as resection or transplant. Patients who were offered treatment but lost to follow-up were excluded from the analysis.
Data Analysis
Our primary endpoint was identifying differences in OS among Memphis VAMC patients with HCC related to race. Kaplan-Meier analysis was used to investigate differences in OS and cumulative hazard ratio (HR) for death. Cox regression multivariate analysis further evaluated discrepancies among investigated patient variables, including age, race, alcohol, tobacco, or illicit drug use, HIV coinfection, and cirrhosis. Treatment factors were further defined by first-line treatment, systemic therapy, surgical resection, and transplant. χ2 analysis was used to investigate differences in treatment modalities.
Results
We identified 227 veterans, 95 Black and 132 White, between 2009 and 2021 meeting criteria for primary HCC treated at the Memphis VAMC. This study did not show a significant difference in OS between White and Black veterans (P = .24). Kaplan-Meier assessment showed OS was 1247 days (41 months) for Black veterans compared with 1032 days (34 months) for White veterans (Figure; Table 1).
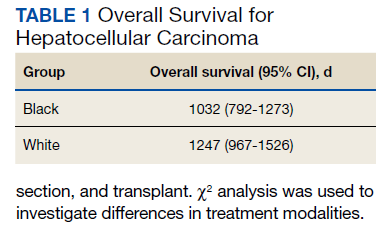
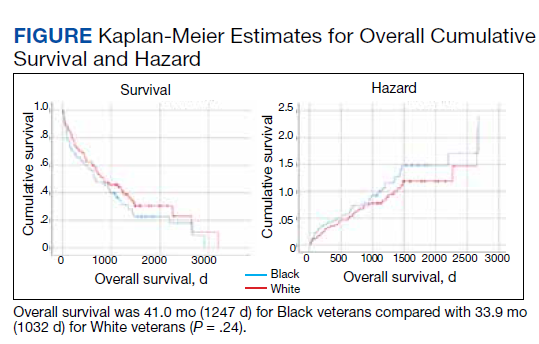
Additionally, no significant difference was found between veterans for age or stage at diagnosis when stratified by race. The mean age of diagnosis for both groups was 65 years (P = .09). The mean TNM staging was 1.7 for White veterans vs 1.8 for Black veterans (P = .57). There was a significant increase in the AFP level at diagnosis for Black veterans (P = .001) (Table 2).
The most common initial treatment for both groups was transarterial chemoembolization and radiofrequency ablation with 68% of White and 64% of Black veterans receiving this therapy. There was no significant difference between who received systemic therapy.
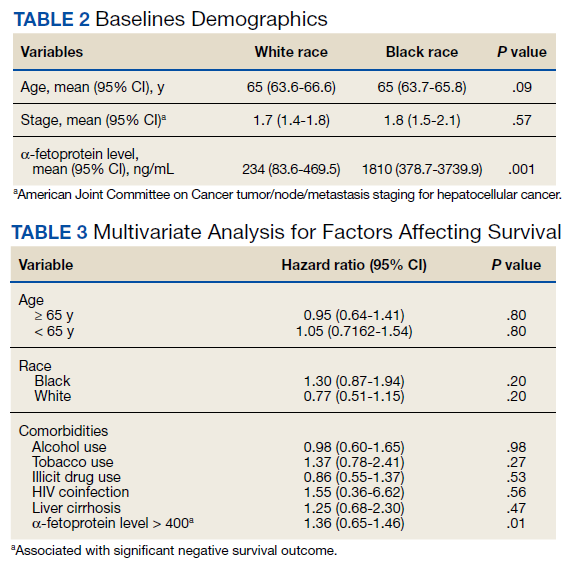
However, we found significant differences by race for some forms of treatment. In our analysis, significant differences existed between those who did not receive any form of treatment as well as who received surgical resection and transplant. Among Black veterans, 11.6% received no treatment vs 6.1% for White veterans (P = .001). Only 2.1% of Black veterans underwent surgical resection vs 8.3% of White veterans (P = .046). Similarly, 13 (9.8%) White veterans vs 3 (3.2%) Black veterans received orthotopic liver transplantation (P = .052) in our cohort (eAppendix available at doi:10.12788/fp.0304). We found no differences in patient characteristics affecting OS, including alcohol use, tobacco use, illicit drug use, HIV coinfection, or liver cirrhosis (Table 3).
Discussion
In this retrospective analysis, Black veterans with HCC did not experience a statistically significant decrease in OS compared with that of White veterans despite some differences in therapy offered. Other studies have found that surgery was less frequently recommended to Black patients across multiple cancer types, and in most cases this carried a negative impact on OS.8,10,11,14,15 A number of other studies have demonstrated a greater percentage of Black patients receiving no treatment, although these studies are often based on SEER data, which captures only cancer-directed surgery and no other methods of treatment. Inequities in patient factors like insurance and socioeconomic status as well as willingness to receive certain treatments are often cited as major influences in health care disparities, but systemic and clinician factors like hospital volume, clinician expertise, specialist availability, and implicit racial bias all affect outcomes.16 One benefit of our study was that CPRS provided a centralized recording of all treatments received. Interestingly, the treatment discrepancy in our study was not attributable to a statistically significant difference in tumor stage at presentation. There should be no misconception that US Department of Veterans Affairs patients are less affected by socioeconomic inequities, though still this suggests clinician and systemic factors were significant drivers behind our findings.
This study did not intend to determine differences in incidence of HCC by race, although many studies have shown an age-adjusted incidence of HCC among Black and Hispanic patients up to twice that of White patients.1,8-10 Notably, the rate of orthotopic liver transplantation in this study was low regardless of race compared with that of other larger studies of patients with HCC.12,15 Discrepancies in HCC care among White and Black patients have been suggested to stem from a variety of influences, including access to early diagnosis and treatment of hepatitis C virus, comorbid conditions, as well as complex socioeconomic factors. It also has been shown that oncologists’ implicit racial bias has a negative impact on patients’ perceived quality of communication, their confidence in the recommended treatment, and the understood difficulty of the treatment by the patient and should be considered as a contributor to health disparities.17,18
Studies evaluating survival in HCC using SEER data generally stratify disease by localized, regional, or distant metastasis. For our study, TNM staging provided a more accurate assessment of the disease and reduced the chances that broader staging definitions could obscure differences in treatment choices. Future studies could be improved by stratifying patients by variables impacting treatment choice, such as Child-Pugh score or Barcelona Clinic Liver Cancer staging. Our study demonstrated a statistically significant difference in AFP level between White and Black veterans. This has been observed in prior studies as well, and while no specific cause has been identified, it suggests differences in tumor biologic features across different races. In addition, we found that an elevated AFP level at the time of diagnosis (defined as > 400) correlates with a worsened OS (HR, 1.36; P = .01).
Limitations
This study has several limitations, notably the number of veterans eligible for analysis at a single institution. A larger cohort would be needed to evaluate for statistically significant differences in outcomes by race. Additionally, our study did not account for therapy that was offered to but not pursued by the patient, and this would be useful to determine whether patient or practitioner factors were the more significant influence on the type of therapy received.
Conclusions
This study demonstrated a statistically significant difference in the rate of resection and liver transplantation between White and Black veterans at a single institution, although no difference in OS was observed. This discrepancy was not explained by differences in tumor staging. Additional, larger studies will be useful in clarifying the biologic, cultural, and socioeconomic drivers in HCC treatment and mortality.
Acknowledgments
The authors thank Lorri Reaves, Memphis Veterans Affairs Medical Center, Department of Hepatology.
1. Altekruse SF, McGlynn KA, Reichman ME. Hepatocellular carcinoma incidence, mortality, and survival trends in the United States from 1975 to 2005. J Clin Oncol. 2009;27(9):1485-1491. doi:10.1200/JCO.2008.20.7753
2. Howlader N, Noone AM, Krapcho M, et al (eds). SEER Cancer Statistics Review, 1975-2012, National Cancer Institute. Accessed July 8, 2022. https://seer.cancer.gov/archive/csr/1975_2012/results_merged/sect_14_liver_bile.pdf#page=8
3. Singal AG, Mittal S, Yerokun OA, et al. Hepatocellular carcinoma screening associated with early tumor detection and improved survival among patients with cirrhosis in the US. Am J Med. 2017;130(9):1099-1106.e1. doi:10.1016/j.amjmed.2017.01.021
4. Llovet JM, Ricci S, Mazzaferro V, et al. Sorafenib in advanced hepatocellular carcinoma. N Engl J Med. 2008;359(4):378-390. doi:10.1056/NEJMoa0708857
5. Finn RS, Qin S, Ikeda M, et al. Atezolizumab plus bevacizumab in unresectable hepatocellular carcinoma. N Engl J Med. 2020;382(20):1894-1905. doi:10.1056/NEJMoa1915745
6. Abou-Alfa GK, Chan SL, Kudo M, et al. Phase 3 randomized, open-label, multicenter study of tremelimumab (T) and durvalumab (D) as first-line therapy in patients (pts) with unresectable hepatocellular carcinoma (uHCC): HIMALAYA. J Clin Oncol. 2022;40(suppl 4):379. doi:10.1200/JCO.2022.40.4_suppl.379
7. Franco RA, Fan Y, Jarosek S, Bae S, Galbraith J. Racial and geographic disparities in hepatocellular carcinoma outcomes. Am J Prev Med. 2018;55(5)(suppl 1):S40-S48. doi:10.1016/j.amepre.2018.05.030
8. Ha J, Yan M, Aguilar M, et al. Race/ethnicity-specific disparities in hepatocellular carcinoma stage at diagnosis and its impact on receipt of curative therapies. J Clin Gastroenterol. 2016;50(5):423-430. doi:10.1097/MCG.0000000000000448
9. Wong R, Corley DA. Racial and ethnic variations in hepatocellular carcinoma incidence within the United States. Am J Med. 2008;121(6):525-531. doi:10.1016/j.amjmed.2008.03.005
10. Rich NE, Hester C, Odewole M, et al. Racial and ethnic differences in presentation and outcomes of hepatocellular carcinoma. Clin Gastroenterol Hepatol. 2019;17(3):551-559.e1. doi:10.1016/j.cgh.2018.05.039
11. Peters NA, Javed AA, He J, Wolfgang CL, Weiss MJ. Association of socioeconomics, surgical therapy, and survival of early stage hepatocellular carcinoma. J Surg Res. 2017;210:253-260. doi:10.1016/j.jss.2016.11.042
12. Wong RJ, Devaki P, Nguyen L, Cheung R, Nguyen MH. Ethnic disparities and liver transplantation rates in hepatocellular carcinoma patients in the recent era: results from the Surveillance, Epidemiology, and End Results registry. Liver Transpl. 2014;20(5):528-535. doi:10.1002/lt.23820
13. Minagawa M, Ikai I, Matsuyama Y, Yamaoka Y, Makuuchi M. Staging of hepatocellular carcinoma: assessment of the Japanese TNM and AJCC/UICC TNM systems in a cohort of 13,772 patients in Japan. Ann Surg. 2007;245(6):909-922. doi:10.1097/01.sla.0000254368.65878.da.
14. Harrison LE, Reichman T, Koneru B, et al. Racial discrepancies in the outcome of patients with hepatocellular carcinoma. Arch Surg. 2004;139(9):992-996. doi:10.1001/archsurg.139.9.992
15. Sloane D, Chen H, Howell C. Racial disparity in primary hepatocellular carcinoma: tumor stage at presentation, surgical treatment and survival. J Natl Med Assoc. 2006;98(12):1934-1939.
16. Haider AH, Scott VK, Rehman KA, et al. Racial disparities in surgical care and outcomes in the United States: a comprehensive review of patient, provider, and systemic factors. J Am Coll Surg. 2013;216(3):482-92.e12. doi:10.1016/j.jamcollsurg.2012.11.014
17. Cooper LA, Roter DL, Carson KA, et al. The associations of clinicians’ implicit attitudes about race with medical visit communication and patient ratings of interpersonal care. Am J Public Health. 2012;102(5):979-987. doi:10.2105/AJPH.2011.300558
18. Penner LA, Dovidio JF, Gonzalez R, et al. The effects of oncologist implicit racial bias in racially discordant oncology interactions. J Clin Oncol. 2016;34(24):2874-2880. doi:10.1200/JCO.2015.66.3658
Hepatocellular carcinoma (HCC) is the sixth most common and third most deadly malignancy worldwide, carrying a mean survival rate without treatment of 6 to 20 months depending on stage.1 Fifty-seven percent of patients with liver cancer are diagnosed with regional or distant metastatic disease that carries 5-year relative survival rates of 10.7% and 3.1%, respectively.2 HCC arises most commonly from liver cirrhosis due to chronic hepatocyte injury, which may be mediated by viral hepatitis, alcoholism, and metabolic disease. Other less common causes include autoimmune disease, exposure to environmental hazards, and certain genetic diseases, such as α-1 antitrypsin deficiency and Wilson disease.
Multiple staging systems for HCC exist that incorporate some variation of the following features: size and invasion of the tumor, distant metastases, and liver function. Stage-directed treatments for HCC include ablation, embolization, resection, transplant, and systemic therapy, such as tyrosine kinase inhibitors, immunotherapies, and monoclonal antibodies. In addition to tumor/node/metastasis (TNM) staging, α-fetoprotein (AFP) is a diagnostic marker with prognostic value in HCC with higher levels correlating to higher tumor burden and a worse prognosis. With treatment, the 5-year survival rate for early stage HCC ranges from 60% to 80% but decreases significantly with higher stages.1 HCC screening in at-risk populations has accounted for > 40% of diagnoses since the practice became widely adopted, and earlier recognition has led to an improvement in survival even when adjusting for lead time bias.3
Systemic therapy for advanced disease continues to improve. Sorafenib remained the standard first-line systemic therapy since it was introduced in 2008.4 First-line therapy improved with immunotherapies. The phase 3 IMBrave150 trial comparing atezolizumab plus bevacizumab to sorafenib showed a median overall survival (OS) > 19 months with 7.7% of patients achieving a complete response.5 HIMALAYA, another phase 3 trial set for publication later this year, also reported promising results when a priming dose of the CTLA-4 inhibitor tremelimumab followed by durvalumab was compared with sorafenib.6
There has been a rise in incidence of HCC in the United States across all races and ethnicities, though Black, Hispanic, and Asian patients remain disproportionately affected. Subsequently, identifying causative biologic, socioeconomic, and cultural factors, as well as implicit bias in health care continues to be a topic of great interest.7-9 Using Surveillance, Epidemiology, and End Results (SEER) data, a number of large studies have found that Black patients with HCC were more likely to present with an advanced stage, less likely to receive curative intent treatment, and had significantly reduced survival compared with that of White patients.1,7-9 An analysis of 1117 patients by Rich and colleagues noted a 34% increased risk of death for Black patients with HCC compared with that of White patients, and other studies have shown about a 50% reduction in rate of liver transplantation for Black patients.10-12 Our study aimed to investigate potential disparities in incidence, etiology, AFP level at diagnosis, and outcomes of HCC in Black and White veterans managed at the Memphis Veterans Affairs Medical Center (VAMC) in Tennessee.
Methods
A single center retrospective chart review was conducted at the Memphis VAMC using the Computerized Patient Record System (CPRS) and the International Statistical Classification of Diseases, Tenth Revision (ICD-10) code C22.0 for HCC. Initial results were manually refined by prespecified criteria. Patients were included if they were diagnosed with HCC and received HCC treatment at the Memphis VAMC. Patients were excluded if HCC was not diagnosed histologically or clinically by imaging characteristics and AFP level, if the patient’s primary treatment was not provided at the Memphis VAMC, if they were lost to follow-up, or if race was not specified as either Black or White.
The following patient variables were examined: age, sex, comorbidities (alcohol or substance use disorder, cirrhosis, HIV), tumor stage, AFP, method of diagnosis, first-line treatments, systemic treatment, surgical options offered, and mortality. Staging was based on the American Joint Committee on Cancer TNM staging for HCC.13 Surgical options were recorded as resection or transplant. Patients who were offered treatment but lost to follow-up were excluded from the analysis.
Data Analysis
Our primary endpoint was identifying differences in OS among Memphis VAMC patients with HCC related to race. Kaplan-Meier analysis was used to investigate differences in OS and cumulative hazard ratio (HR) for death. Cox regression multivariate analysis further evaluated discrepancies among investigated patient variables, including age, race, alcohol, tobacco, or illicit drug use, HIV coinfection, and cirrhosis. Treatment factors were further defined by first-line treatment, systemic therapy, surgical resection, and transplant. χ2 analysis was used to investigate differences in treatment modalities.
Results
We identified 227 veterans, 95 Black and 132 White, between 2009 and 2021 meeting criteria for primary HCC treated at the Memphis VAMC. This study did not show a significant difference in OS between White and Black veterans (P = .24). Kaplan-Meier assessment showed OS was 1247 days (41 months) for Black veterans compared with 1032 days (34 months) for White veterans (Figure; Table 1).
Additionally, no significant difference was found between veterans for age or stage at diagnosis when stratified by race. The mean age of diagnosis for both groups was 65 years (P = .09). The mean TNM staging was 1.7 for White veterans vs 1.8 for Black veterans (P = .57). There was a significant increase in the AFP level at diagnosis for Black veterans (P = .001) (Table 2).
The most common initial treatment for both groups was transarterial chemoembolization and radiofrequency ablation with 68% of White and 64% of Black veterans receiving this therapy. There was no significant difference between who received systemic therapy.
However, we found significant differences by race for some forms of treatment. In our analysis, significant differences existed between those who did not receive any form of treatment as well as who received surgical resection and transplant. Among Black veterans, 11.6% received no treatment vs 6.1% for White veterans (P = .001). Only 2.1% of Black veterans underwent surgical resection vs 8.3% of White veterans (P = .046). Similarly, 13 (9.8%) White veterans vs 3 (3.2%) Black veterans received orthotopic liver transplantation (P = .052) in our cohort (eAppendix available at doi:10.12788/fp.0304). We found no differences in patient characteristics affecting OS, including alcohol use, tobacco use, illicit drug use, HIV coinfection, or liver cirrhosis (Table 3).
Discussion
In this retrospective analysis, Black veterans with HCC did not experience a statistically significant decrease in OS compared with that of White veterans despite some differences in therapy offered. Other studies have found that surgery was less frequently recommended to Black patients across multiple cancer types, and in most cases this carried a negative impact on OS.8,10,11,14,15 A number of other studies have demonstrated a greater percentage of Black patients receiving no treatment, although these studies are often based on SEER data, which captures only cancer-directed surgery and no other methods of treatment. Inequities in patient factors like insurance and socioeconomic status as well as willingness to receive certain treatments are often cited as major influences in health care disparities, but systemic and clinician factors like hospital volume, clinician expertise, specialist availability, and implicit racial bias all affect outcomes.16 One benefit of our study was that CPRS provided a centralized recording of all treatments received. Interestingly, the treatment discrepancy in our study was not attributable to a statistically significant difference in tumor stage at presentation. There should be no misconception that US Department of Veterans Affairs patients are less affected by socioeconomic inequities, though still this suggests clinician and systemic factors were significant drivers behind our findings.
This study did not intend to determine differences in incidence of HCC by race, although many studies have shown an age-adjusted incidence of HCC among Black and Hispanic patients up to twice that of White patients.1,8-10 Notably, the rate of orthotopic liver transplantation in this study was low regardless of race compared with that of other larger studies of patients with HCC.12,15 Discrepancies in HCC care among White and Black patients have been suggested to stem from a variety of influences, including access to early diagnosis and treatment of hepatitis C virus, comorbid conditions, as well as complex socioeconomic factors. It also has been shown that oncologists’ implicit racial bias has a negative impact on patients’ perceived quality of communication, their confidence in the recommended treatment, and the understood difficulty of the treatment by the patient and should be considered as a contributor to health disparities.17,18
Studies evaluating survival in HCC using SEER data generally stratify disease by localized, regional, or distant metastasis. For our study, TNM staging provided a more accurate assessment of the disease and reduced the chances that broader staging definitions could obscure differences in treatment choices. Future studies could be improved by stratifying patients by variables impacting treatment choice, such as Child-Pugh score or Barcelona Clinic Liver Cancer staging. Our study demonstrated a statistically significant difference in AFP level between White and Black veterans. This has been observed in prior studies as well, and while no specific cause has been identified, it suggests differences in tumor biologic features across different races. In addition, we found that an elevated AFP level at the time of diagnosis (defined as > 400) correlates with a worsened OS (HR, 1.36; P = .01).
Limitations
This study has several limitations, notably the number of veterans eligible for analysis at a single institution. A larger cohort would be needed to evaluate for statistically significant differences in outcomes by race. Additionally, our study did not account for therapy that was offered to but not pursued by the patient, and this would be useful to determine whether patient or practitioner factors were the more significant influence on the type of therapy received.
Conclusions
This study demonstrated a statistically significant difference in the rate of resection and liver transplantation between White and Black veterans at a single institution, although no difference in OS was observed. This discrepancy was not explained by differences in tumor staging. Additional, larger studies will be useful in clarifying the biologic, cultural, and socioeconomic drivers in HCC treatment and mortality.
Acknowledgments
The authors thank Lorri Reaves, Memphis Veterans Affairs Medical Center, Department of Hepatology.
1. Altekruse SF, McGlynn KA, Reichman ME. Hepatocellular carcinoma incidence, mortality, and survival trends in the United States from 1975 to 2005. J Clin Oncol. 2009;27(9):1485-1491. doi:10.1200/JCO.2008.20.7753
2. Howlader N, Noone AM, Krapcho M, et al (eds). SEER Cancer Statistics Review, 1975-2012, National Cancer Institute. Accessed July 8, 2022. https://seer.cancer.gov/archive/csr/1975_2012/results_merged/sect_14_liver_bile.pdf#page=8
3. Singal AG, Mittal S, Yerokun OA, et al. Hepatocellular carcinoma screening associated with early tumor detection and improved survival among patients with cirrhosis in the US. Am J Med. 2017;130(9):1099-1106.e1. doi:10.1016/j.amjmed.2017.01.021
4. Llovet JM, Ricci S, Mazzaferro V, et al. Sorafenib in advanced hepatocellular carcinoma. N Engl J Med. 2008;359(4):378-390. doi:10.1056/NEJMoa0708857
5. Finn RS, Qin S, Ikeda M, et al. Atezolizumab plus bevacizumab in unresectable hepatocellular carcinoma. N Engl J Med. 2020;382(20):1894-1905. doi:10.1056/NEJMoa1915745
6. Abou-Alfa GK, Chan SL, Kudo M, et al. Phase 3 randomized, open-label, multicenter study of tremelimumab (T) and durvalumab (D) as first-line therapy in patients (pts) with unresectable hepatocellular carcinoma (uHCC): HIMALAYA. J Clin Oncol. 2022;40(suppl 4):379. doi:10.1200/JCO.2022.40.4_suppl.379
7. Franco RA, Fan Y, Jarosek S, Bae S, Galbraith J. Racial and geographic disparities in hepatocellular carcinoma outcomes. Am J Prev Med. 2018;55(5)(suppl 1):S40-S48. doi:10.1016/j.amepre.2018.05.030
8. Ha J, Yan M, Aguilar M, et al. Race/ethnicity-specific disparities in hepatocellular carcinoma stage at diagnosis and its impact on receipt of curative therapies. J Clin Gastroenterol. 2016;50(5):423-430. doi:10.1097/MCG.0000000000000448
9. Wong R, Corley DA. Racial and ethnic variations in hepatocellular carcinoma incidence within the United States. Am J Med. 2008;121(6):525-531. doi:10.1016/j.amjmed.2008.03.005
10. Rich NE, Hester C, Odewole M, et al. Racial and ethnic differences in presentation and outcomes of hepatocellular carcinoma. Clin Gastroenterol Hepatol. 2019;17(3):551-559.e1. doi:10.1016/j.cgh.2018.05.039
11. Peters NA, Javed AA, He J, Wolfgang CL, Weiss MJ. Association of socioeconomics, surgical therapy, and survival of early stage hepatocellular carcinoma. J Surg Res. 2017;210:253-260. doi:10.1016/j.jss.2016.11.042
12. Wong RJ, Devaki P, Nguyen L, Cheung R, Nguyen MH. Ethnic disparities and liver transplantation rates in hepatocellular carcinoma patients in the recent era: results from the Surveillance, Epidemiology, and End Results registry. Liver Transpl. 2014;20(5):528-535. doi:10.1002/lt.23820
13. Minagawa M, Ikai I, Matsuyama Y, Yamaoka Y, Makuuchi M. Staging of hepatocellular carcinoma: assessment of the Japanese TNM and AJCC/UICC TNM systems in a cohort of 13,772 patients in Japan. Ann Surg. 2007;245(6):909-922. doi:10.1097/01.sla.0000254368.65878.da.
14. Harrison LE, Reichman T, Koneru B, et al. Racial discrepancies in the outcome of patients with hepatocellular carcinoma. Arch Surg. 2004;139(9):992-996. doi:10.1001/archsurg.139.9.992
15. Sloane D, Chen H, Howell C. Racial disparity in primary hepatocellular carcinoma: tumor stage at presentation, surgical treatment and survival. J Natl Med Assoc. 2006;98(12):1934-1939.
16. Haider AH, Scott VK, Rehman KA, et al. Racial disparities in surgical care and outcomes in the United States: a comprehensive review of patient, provider, and systemic factors. J Am Coll Surg. 2013;216(3):482-92.e12. doi:10.1016/j.jamcollsurg.2012.11.014
17. Cooper LA, Roter DL, Carson KA, et al. The associations of clinicians’ implicit attitudes about race with medical visit communication and patient ratings of interpersonal care. Am J Public Health. 2012;102(5):979-987. doi:10.2105/AJPH.2011.300558
18. Penner LA, Dovidio JF, Gonzalez R, et al. The effects of oncologist implicit racial bias in racially discordant oncology interactions. J Clin Oncol. 2016;34(24):2874-2880. doi:10.1200/JCO.2015.66.3658
Value of a Pharmacy-Adjudicated Community Care Prior Authorization Drug Request Service
Veterans’ access to medical care was expanded outside of US Department of Veterans Affairs (VA) facilities with the inception of the 2014 Veterans Access, Choice, and Accountability Act (Choice Act).1 This legislation aimed to remove barriers some veterans were experiencing, specifically access to health care. In subsequent years, approximately 17% of veterans receiving care from the VA did so under the Choice Act.2 The Choice Act positively impacted medical care access for veterans but presented new challenges for VA pharmacies processing community care (CC) prescriptions, including limited access to outside health records, lack of interface between CC prescribers and the VA order entry system, and limited awareness of the VA national formulary.3,4 These factors made it difficult for VA pharmacies to assess prescriptions for clinical appropriateness, evaluate patient safety parameters, and manage expenditures.
In 2019, the Maintaining Internal Systems and Strengthening Integrated Outside Networks (MISSION) Act, which expanded CC support and better defined which veterans are able to receive care outside the VA, updated the Choice Act.4,5 However, VA pharmacies faced challenges in managing pharmacy drug costs and ensuring clinical appropriateness of prescription drug therapy. As a result, VA pharmacy departments have adjusted how they allocate workload, time, and funds.5
Pharmacists improve clinical outcomes and reduce health care costs by decreasing medication errors, unnecessary prescribing, and adverse drug events.6-12 Pharmacist-driven formulary management through evaluation of prior authorization drug requests (PADRs) has shown economic value.13,14 VA pharmacy review of community care PADRs is important because outside health care professionals (HCPs) might not be familiar with the VA formulary. This could lead to high volume of PADRs that do not meet criteria and could result in increased potential for medication misuse, adverse drug events, medication errors, and cost to the health system. It is imperative that CC orders are evaluated as critically as traditional orders.
The value of a centralized CC pharmacy team has not been assessed in the literature. The primary objective of this study was to assess the direct cost savings achieved through a centralized CC PADR process. Secondary objectives were to characterize the CC PADRs submitted to the site, including approval rate, reason for nonapproval, which medications were requested and by whom, and to compare CC prescriptions with other high-complexity (1a) VA facilities.
Community Care Pharmacy
VA health systems are stratified according to complexity, which reflects size, patient population, and services offered. This study was conducted at the Durham Veterans Affairs Health Care System (DVAHCS), North Carolina, a high-complexity, 251-bed, tertiary care referral, teaching, and research system. DVAHCS provides general and specialty medical, surgical, inpatient psychiatric, and ambulatory services, and serves as a major referral center.
DVAHCS created a centralized pharmacy team for processing CC prescriptions and managing customer service. This team’s goal is to increase CC prescription processing efficiency and transparency, ensure accountability of the health care team, and promote veteran-centric customer service. The pharmacy team includes a pharmacist program manager and a dedicated CC pharmacist with administrative support from a health benefits assistant and 4 pharmacy technicians. The CC pharmacy team assesses every new prescription to ensure the veteran is authorized to receive care in the community. Once eligibility is verified, a pharmacy technician or pharmacist evaluates the prescription to ensure it contains all required information, then contacts the prescriber for any missing data. If clinically appropriate, the pharmacist processes the prescription.
In 2020, the CC pharmacy team implemented a new process for reviewing and documenting CC prescriptions that require a PADR. The closed national VA formulary is set up so that all nonformulary medications and some formulary medications, including those that are restricted because of safety and/or cost, require a PADR.15 After a CC pharmacy technician confirms a veteran’s eligibility, the technician assesses whether the requested medication requires submitting a PADR to the VA internal electronic health record. The PADR is then adjudicated by a formulary management pharmacist, CC program manager, or CC pharmacist who reviews health records to determine whether the CC prescription meets VA medication use policy requirements.
If additional information is needed or an alternate medication is suggested, the pharmacist comments back on the PADR and a CC pharmacy technician contacts the prescriber. The PADR is canceled administratively then resubmitted once all information is obtained. While waiting for a response from the prescriber, the CC pharmacy technician contacts that veteran to give an update on the prescription status, as appropriate. Once there is sufficient information to adjudicate the PADR, the outcome is documented, and if approved, the order is processed.
Methods
The DVAHCS Institutional Review Board approved this retrospective review of CC PADRs submitted from June 1, 2020, through November 30, 2020. CC PADRs were excluded if they were duplicates or were reactivated administratively but had an initial submission date before the study period. Local data were collected for nonapproved CC PADRs including drug requested, dosage and directions, medication specialty, alternative drug recommended, drug acquisition cost, PADR submission date, PADR completion date, PADR nonapproval rationale, and documented time spent per PADR. Additional data was obtained for CC prescriptions at all 42 high-complexity VA facilities from the VA national CC prescription database for the study time interval and included total PADRs, PADR approval status, total CC prescription cost, and total CC fills.
Direct cost savings were calculated by assessing the cost of requested therapy that was not approved minus the cost of recommended therapy and cost to review all PADRs, as described by Britt and colleagues.13 The cost of the requested and recommended therapy was calculated based on VA drug acquisition cost at time of data collection and multiplied by the expected duration of therapy up to 1 year. For each CC prescription, duration of therapy was based on the duration limit in the prescription or annualized if no duration limit was documented. Cost of PADR review was calculated based on the total time pharmacists and pharmacy technicians documented for each step of the review process for a representative sample of 100 nonapproved PADRs and then multiplied by the salary plus benefits of an entry-level pharmacist and pharmacy technician.16 The eAppendix describes specific equations used for determining direct cost savings. Descriptive statistics were used to evaluate study results.
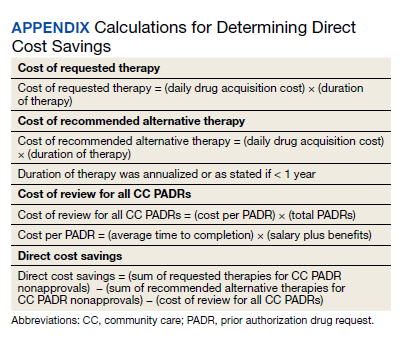
Results
During the 6-month study period, 611 CC PADRs were submitted to the pharmacy and 526 met inclusion criteria (Figure 1). Of those, 243 (46.2%) were approved and 283 (53.8%) were not approved. The cost of requested therapies for nonapproved CC PADRs totaled $584,565.48 and the cost of all recommended therapies was $57,473.59. The mean time per CC PADR was 24 minutes; 16 minutes for pharmacists and 8 minutes for pharmacy technicians. Given an hourly wage (plus benefits) of $67.25 for a pharmacist and $25.53 for a pharmacy technician, the total cost of review per CC PADR was $21.33. After subtracting the costs of all recommended therapies and review of all included CC PADRs, the process generated $515,872.31 in direct cost savings. After factoring in administrative lag time, such as HCP communication, an average of 8 calendar days was needed to complete a nonapproved PADR.
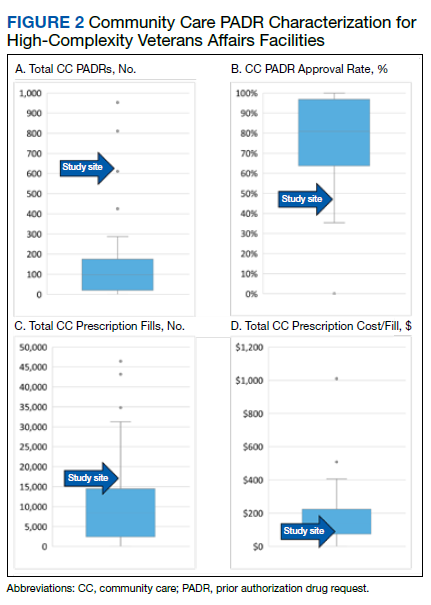
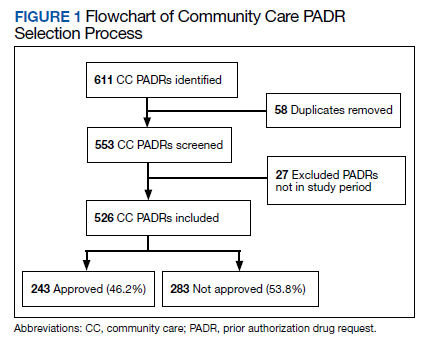
The most common rationale for PADR nonapproval was that the formulary alternative was not exhausted. Ondansetron orally disintegrating tablets was the most commonly nonapproved medication and azelastine was the most commonly approved medication. Dulaglutide was the most expensive nonapproved and tafamidis was the most expensive approved PADR (Table 1). Gastroenterology, endocrinology, and neurology were the top specialties for nonapproved PADRs while neurology, pulmonology, and endocrinology were the top specialties for approved PADRs (Table 2).
Several high-complexity VA facilities had no reported data; we used the median for the analysis to account for these outliers (Figure 2). The median (IQR) adjudicated CC PADRs for all facilities was 97 (20-175), median (IQR) CC PADR approval rate was 80.9% (63.7%-96.8%), median (IQR) total CC prescriptions was 8440 (2464-14,466), and median (IQR) cost per fill was $136.05 ($76.27-$221.28).
Discussion
This study demonstrated direct cost savings of $515,872.31 over 6 months with theadjudication of CC PADRs by a centralized CC pharmacy team. This could result in > $1,000,000 of cost savings per fiscal year.
The CC PADRs observed at DVAHCS had a 46.2% approval rate; almost one-half the approval rate of 84.1% of all PADRs submitted to the study site by VA HCPs captured by Britt and colleagues.13 Results from this study showed that coordination of care for nonapproved CC PADRs between the VA pharmacy and non-VA prescriber took an average of 8 calendar days. The noted CC PADR approval rate and administrative burden might be because of lack of familiarity of non-VA providers regarding the VA national formulary. The National VA Pharmacy Benefits Management determines the formulary using cost-effectiveness criteria that considers the medical literature and VA-specific contract pricing and prepares extensive guidance for restricted medications via relevant criteria for use.15 HCPs outside the VA might not know this information is available online. Because gastroenterology, endocrinology, and neurology specialty medications were among the most frequently nonapproved PADRs, VA formulary education could begin with CC HCPs in these practice areas.
This study showed that the CC PADR process was not solely driven by cost, but also included patient safety. Nonapproval rationale for some requests included submission without an indication, submission by a prescriber that did not have the authority to prescribe a type of medication, or contraindication based on patient-specific factors.
Compared with other VA high-complexity facilities, DVAHCS was among the top health care systems for total volume of CC prescriptions (n = 16,096) and among the lowest for cost/fill ($75.74). Similarly, DVAHCS was among the top sites for total adjudicated CC PADRs within the 6-month study period (n = 611) and the lowest approval rate (44.2%). This study shows that despite high volumes of overall CC prescriptions and CC PADRs, it is possible to maintain a low overall CC prescription cost/fill compared with other similarly complex sites across the country. Wide variance in reported results exists across high-complexity VA facilities because some sites had low to no CC fills and/or CC PADRs. This is likely a result of administrative differences when handling CC prescriptions and presents an opportunity to standardize this process nationally.
Limitations
CC PADRs were assessed during the COVID-19 pandemic, which might have resulted in lower-than-normal CC prescription and PADR volumes, therefore underestimating the potential for direct cost savings. Entry-level salary was used to demonstrate cost savings potential from the perspective of a newly hired CC team; however, the cost savings might have been less if the actual salaries of site personnel were higher. National contract pricing data were gathered at the time of data collection and might have been different than at the time of PADR submission. Chronic medication prescriptions were annualized, which could overestimate cost savings if the medication was discontinued or changed to an alternative therapy within that time period.
The study’s exclusion criteria could only be applied locally and did not include data received from the VA CC prescription database. This can be seen by the discrepancy in CC PADR approval rates from the local and national data (46.2% vs 44.2%, respectively) and CC PADR volume. High-complexity VA facility data were captured without assessing the CC prescription process at each site. As a result, definitive conclusions cannot be made regarding the impact of a centralized CC pharmacy team compared with other facilities.
Conclusions
Adjudication of CC PADRs by a centralized CC pharmacy team over a 6-month period provided > $500,000 in direct cost savings to a VA health care system. Considering the CC PADR approval rate seen in this study, the VA could allocate resources to educate CC providers about the VA formulary to increase the PADR approval rate and reduce administrative burden for VA pharmacies and prescribers. Future research should evaluate CC prescription handling practices at other VA facilities to compare the effectiveness among varying approaches and develop recommendations for a nationally standardized process.
Acknowledgments
Concept and design (AJJ, JNB, RBB, LAM, MD, MGH); acquisition of data (AJJ, MGH); analysis and interpretation of data (AJJ, JNB, RBB, LAM, MD, MGH); drafting of the manuscript (AJJ); critical revision of the manuscript for important intellectual content (AJJ, JNB, RBB, LAM, MD, MGH); statistical analysis (AJJ); administrative, technical, or logistic support (LAM, MGH); and supervision (MGH).
1. Gellad WF, Cunningham FE, Good CB, et al. Pharmacy use in the first year of the Veterans Choice Program: a mixed-methods evaluation. Med Care. 2017(7 suppl 1);55:S26. doi:10.1097/MLR.0000000000000661
2. Mattocks KM, Yehia B. Evaluating the veterans choice program: lessons for developing a high-performing integrated network. Med Care. 2017(7 suppl 1);55:S1-S3. doi:10.1097/MLR.0000000000000743.
3. Mattocks KM, Mengeling M, Sadler A, Baldor R, Bastian L. The Veterans Choice Act: a qualitative examination of rapid policy implementation in the Department of Veterans Affairs. Med Care. 2017;55(7 suppl 1):S71-S75. doi:10.1097/MLR.0000000000000667
4. US Department of Veterans Affairs, Veterans Health Administration. VHA Directive 1108.08: VHA formulary management process. November 2, 2016. Accessed June 9, 2022. https://www.va.gov/vhapublications/ViewPublication.asp?pub_ID=3291
5. Massarweh NN, Itani KMF, Morris MS. The VA MISSION act and the future of veterans’ access to quality health care. JAMA. 2020;324:343-344. doi:10.1001/jama.2020.4505
6. Jourdan JP, Muzard A, Goyer I, et al. Impact of pharmacist interventions on clinical outcome and cost avoidance in a university teaching hospital. Int J Clin Pharm. 2018;40(6):1474-1481. doi:10.1007/s11096-018-0733-6
7. Lee AJ, Boro MS, Knapp KK, Meier JL, Korman NE. Clinical and economic outcomes of pharmacist recommendations in a Veterans Affairs medical center. Am J Health Syst Pharm. 2002;59(21):2070-2077. doi:10.1093/ajhp/59.21.2070
8. Dalton K, Byrne S. Role of the pharmacist in reducing healthcare costs: current insights. Integr Pharm Res Pract. 2017;6:37-46. doi:10.2147/IPRP.S108047
9. De Rijdt T, Willems L, Simoens S. Economic effects of clinical pharmacy interventions: a literature review. Am J Health Syst Pharm. 2008;65(12):1161-1172. doi:10.2146/ajhp070506
10. Perez A, Doloresco F, Hoffman J, et al. Economic evaluation of clinical pharmacy services: 2001-2005. Pharmacotherapy. 2009;29(1):128. doi:10.1592/phco.29.1.128
11. Nesbit TW, Shermock KM, Bobek MB, et al. Implementation and pharmacoeconomic analysis of a clinical staff pharmacist practice model. Am J Health Syst Pharm. 2001;58(9):784-790. doi:10.1093/ajhp/58.9.784
12. Yang S, Britt RB, Hashem MG, Brown JN. Outcomes of pharmacy-led hepatitis C direct-acting antiviral utilization management at a Veterans Affairs medical center. J Manag Care Pharm. 2017;23(3):364-369. doi:10.18553/jmcp.2017.23.3.364
13. Britt RB, Hashem MG, Bryan WE III, Kothapalli R, Brown JN. Economic outcomes associated with a pharmacist-adjudicated formulary consult service in a Veterans Affairs medical center. J Manag Care Pharm. 2016;22(9):1051-1061. doi:10.18553/jmcp.2016.22.9.1051
14. Jacob S, Britt RB, Bryan WE, Hashem MG, Hale JC, Brown JN. Economic outcomes associated with safety interventions by a pharmacist-adjudicated prior authorization consult service. J Manag Care Pharm. 2019;25(3):411-416. doi:10.18553/jmcp.2019.25.3.411
15. Aspinall SL, Sales MM, Good CB, et al. Pharmacy benefits management in the Veterans Health Administration revisited: a decade of advancements, 2004-2014. J Manag Care Spec Pharm. 2016;22(9):1058-1063. doi:10.18553/jmcp.2016.22.9.1058
16. US Department of Veterans Affairs, Office of the Chief Human Capital Officer. Title 38 Pay Schedules. Updated January 26, 2022. Accessed June 9, 2022. https://www.va.gov/ohrm/pay
Veterans’ access to medical care was expanded outside of US Department of Veterans Affairs (VA) facilities with the inception of the 2014 Veterans Access, Choice, and Accountability Act (Choice Act).1 This legislation aimed to remove barriers some veterans were experiencing, specifically access to health care. In subsequent years, approximately 17% of veterans receiving care from the VA did so under the Choice Act.2 The Choice Act positively impacted medical care access for veterans but presented new challenges for VA pharmacies processing community care (CC) prescriptions, including limited access to outside health records, lack of interface between CC prescribers and the VA order entry system, and limited awareness of the VA national formulary.3,4 These factors made it difficult for VA pharmacies to assess prescriptions for clinical appropriateness, evaluate patient safety parameters, and manage expenditures.
In 2019, the Maintaining Internal Systems and Strengthening Integrated Outside Networks (MISSION) Act, which expanded CC support and better defined which veterans are able to receive care outside the VA, updated the Choice Act.4,5 However, VA pharmacies faced challenges in managing pharmacy drug costs and ensuring clinical appropriateness of prescription drug therapy. As a result, VA pharmacy departments have adjusted how they allocate workload, time, and funds.5
Pharmacists improve clinical outcomes and reduce health care costs by decreasing medication errors, unnecessary prescribing, and adverse drug events.6-12 Pharmacist-driven formulary management through evaluation of prior authorization drug requests (PADRs) has shown economic value.13,14 VA pharmacy review of community care PADRs is important because outside health care professionals (HCPs) might not be familiar with the VA formulary. This could lead to high volume of PADRs that do not meet criteria and could result in increased potential for medication misuse, adverse drug events, medication errors, and cost to the health system. It is imperative that CC orders are evaluated as critically as traditional orders.
The value of a centralized CC pharmacy team has not been assessed in the literature. The primary objective of this study was to assess the direct cost savings achieved through a centralized CC PADR process. Secondary objectives were to characterize the CC PADRs submitted to the site, including approval rate, reason for nonapproval, which medications were requested and by whom, and to compare CC prescriptions with other high-complexity (1a) VA facilities.
Community Care Pharmacy
VA health systems are stratified according to complexity, which reflects size, patient population, and services offered. This study was conducted at the Durham Veterans Affairs Health Care System (DVAHCS), North Carolina, a high-complexity, 251-bed, tertiary care referral, teaching, and research system. DVAHCS provides general and specialty medical, surgical, inpatient psychiatric, and ambulatory services, and serves as a major referral center.
DVAHCS created a centralized pharmacy team for processing CC prescriptions and managing customer service. This team’s goal is to increase CC prescription processing efficiency and transparency, ensure accountability of the health care team, and promote veteran-centric customer service. The pharmacy team includes a pharmacist program manager and a dedicated CC pharmacist with administrative support from a health benefits assistant and 4 pharmacy technicians. The CC pharmacy team assesses every new prescription to ensure the veteran is authorized to receive care in the community. Once eligibility is verified, a pharmacy technician or pharmacist evaluates the prescription to ensure it contains all required information, then contacts the prescriber for any missing data. If clinically appropriate, the pharmacist processes the prescription.
In 2020, the CC pharmacy team implemented a new process for reviewing and documenting CC prescriptions that require a PADR. The closed national VA formulary is set up so that all nonformulary medications and some formulary medications, including those that are restricted because of safety and/or cost, require a PADR.15 After a CC pharmacy technician confirms a veteran’s eligibility, the technician assesses whether the requested medication requires submitting a PADR to the VA internal electronic health record. The PADR is then adjudicated by a formulary management pharmacist, CC program manager, or CC pharmacist who reviews health records to determine whether the CC prescription meets VA medication use policy requirements.
If additional information is needed or an alternate medication is suggested, the pharmacist comments back on the PADR and a CC pharmacy technician contacts the prescriber. The PADR is canceled administratively then resubmitted once all information is obtained. While waiting for a response from the prescriber, the CC pharmacy technician contacts that veteran to give an update on the prescription status, as appropriate. Once there is sufficient information to adjudicate the PADR, the outcome is documented, and if approved, the order is processed.
Methods
The DVAHCS Institutional Review Board approved this retrospective review of CC PADRs submitted from June 1, 2020, through November 30, 2020. CC PADRs were excluded if they were duplicates or were reactivated administratively but had an initial submission date before the study period. Local data were collected for nonapproved CC PADRs including drug requested, dosage and directions, medication specialty, alternative drug recommended, drug acquisition cost, PADR submission date, PADR completion date, PADR nonapproval rationale, and documented time spent per PADR. Additional data was obtained for CC prescriptions at all 42 high-complexity VA facilities from the VA national CC prescription database for the study time interval and included total PADRs, PADR approval status, total CC prescription cost, and total CC fills.
Direct cost savings were calculated by assessing the cost of requested therapy that was not approved minus the cost of recommended therapy and cost to review all PADRs, as described by Britt and colleagues.13 The cost of the requested and recommended therapy was calculated based on VA drug acquisition cost at time of data collection and multiplied by the expected duration of therapy up to 1 year. For each CC prescription, duration of therapy was based on the duration limit in the prescription or annualized if no duration limit was documented. Cost of PADR review was calculated based on the total time pharmacists and pharmacy technicians documented for each step of the review process for a representative sample of 100 nonapproved PADRs and then multiplied by the salary plus benefits of an entry-level pharmacist and pharmacy technician.16 The eAppendix describes specific equations used for determining direct cost savings. Descriptive statistics were used to evaluate study results.
Results
During the 6-month study period, 611 CC PADRs were submitted to the pharmacy and 526 met inclusion criteria (Figure 1). Of those, 243 (46.2%) were approved and 283 (53.8%) were not approved. The cost of requested therapies for nonapproved CC PADRs totaled $584,565.48 and the cost of all recommended therapies was $57,473.59. The mean time per CC PADR was 24 minutes; 16 minutes for pharmacists and 8 minutes for pharmacy technicians. Given an hourly wage (plus benefits) of $67.25 for a pharmacist and $25.53 for a pharmacy technician, the total cost of review per CC PADR was $21.33. After subtracting the costs of all recommended therapies and review of all included CC PADRs, the process generated $515,872.31 in direct cost savings. After factoring in administrative lag time, such as HCP communication, an average of 8 calendar days was needed to complete a nonapproved PADR.
The most common rationale for PADR nonapproval was that the formulary alternative was not exhausted. Ondansetron orally disintegrating tablets was the most commonly nonapproved medication and azelastine was the most commonly approved medication. Dulaglutide was the most expensive nonapproved and tafamidis was the most expensive approved PADR (Table 1). Gastroenterology, endocrinology, and neurology were the top specialties for nonapproved PADRs while neurology, pulmonology, and endocrinology were the top specialties for approved PADRs (Table 2).
Several high-complexity VA facilities had no reported data; we used the median for the analysis to account for these outliers (Figure 2). The median (IQR) adjudicated CC PADRs for all facilities was 97 (20-175), median (IQR) CC PADR approval rate was 80.9% (63.7%-96.8%), median (IQR) total CC prescriptions was 8440 (2464-14,466), and median (IQR) cost per fill was $136.05 ($76.27-$221.28).
Discussion
This study demonstrated direct cost savings of $515,872.31 over 6 months with theadjudication of CC PADRs by a centralized CC pharmacy team. This could result in > $1,000,000 of cost savings per fiscal year.
The CC PADRs observed at DVAHCS had a 46.2% approval rate; almost one-half the approval rate of 84.1% of all PADRs submitted to the study site by VA HCPs captured by Britt and colleagues.13 Results from this study showed that coordination of care for nonapproved CC PADRs between the VA pharmacy and non-VA prescriber took an average of 8 calendar days. The noted CC PADR approval rate and administrative burden might be because of lack of familiarity of non-VA providers regarding the VA national formulary. The National VA Pharmacy Benefits Management determines the formulary using cost-effectiveness criteria that considers the medical literature and VA-specific contract pricing and prepares extensive guidance for restricted medications via relevant criteria for use.15 HCPs outside the VA might not know this information is available online. Because gastroenterology, endocrinology, and neurology specialty medications were among the most frequently nonapproved PADRs, VA formulary education could begin with CC HCPs in these practice areas.
This study showed that the CC PADR process was not solely driven by cost, but also included patient safety. Nonapproval rationale for some requests included submission without an indication, submission by a prescriber that did not have the authority to prescribe a type of medication, or contraindication based on patient-specific factors.
Compared with other VA high-complexity facilities, DVAHCS was among the top health care systems for total volume of CC prescriptions (n = 16,096) and among the lowest for cost/fill ($75.74). Similarly, DVAHCS was among the top sites for total adjudicated CC PADRs within the 6-month study period (n = 611) and the lowest approval rate (44.2%). This study shows that despite high volumes of overall CC prescriptions and CC PADRs, it is possible to maintain a low overall CC prescription cost/fill compared with other similarly complex sites across the country. Wide variance in reported results exists across high-complexity VA facilities because some sites had low to no CC fills and/or CC PADRs. This is likely a result of administrative differences when handling CC prescriptions and presents an opportunity to standardize this process nationally.
Limitations
CC PADRs were assessed during the COVID-19 pandemic, which might have resulted in lower-than-normal CC prescription and PADR volumes, therefore underestimating the potential for direct cost savings. Entry-level salary was used to demonstrate cost savings potential from the perspective of a newly hired CC team; however, the cost savings might have been less if the actual salaries of site personnel were higher. National contract pricing data were gathered at the time of data collection and might have been different than at the time of PADR submission. Chronic medication prescriptions were annualized, which could overestimate cost savings if the medication was discontinued or changed to an alternative therapy within that time period.
The study’s exclusion criteria could only be applied locally and did not include data received from the VA CC prescription database. This can be seen by the discrepancy in CC PADR approval rates from the local and national data (46.2% vs 44.2%, respectively) and CC PADR volume. High-complexity VA facility data were captured without assessing the CC prescription process at each site. As a result, definitive conclusions cannot be made regarding the impact of a centralized CC pharmacy team compared with other facilities.
Conclusions
Adjudication of CC PADRs by a centralized CC pharmacy team over a 6-month period provided > $500,000 in direct cost savings to a VA health care system. Considering the CC PADR approval rate seen in this study, the VA could allocate resources to educate CC providers about the VA formulary to increase the PADR approval rate and reduce administrative burden for VA pharmacies and prescribers. Future research should evaluate CC prescription handling practices at other VA facilities to compare the effectiveness among varying approaches and develop recommendations for a nationally standardized process.
Acknowledgments
Concept and design (AJJ, JNB, RBB, LAM, MD, MGH); acquisition of data (AJJ, MGH); analysis and interpretation of data (AJJ, JNB, RBB, LAM, MD, MGH); drafting of the manuscript (AJJ); critical revision of the manuscript for important intellectual content (AJJ, JNB, RBB, LAM, MD, MGH); statistical analysis (AJJ); administrative, technical, or logistic support (LAM, MGH); and supervision (MGH).
1. Gellad WF, Cunningham FE, Good CB, et al. Pharmacy use in the first year of the Veterans Choice Program: a mixed-methods evaluation. Med Care. 2017(7 suppl 1);55:S26. doi:10.1097/MLR.0000000000000661
2. Mattocks KM, Yehia B. Evaluating the veterans choice program: lessons for developing a high-performing integrated network. Med Care. 2017(7 suppl 1);55:S1-S3. doi:10.1097/MLR.0000000000000743.
3. Mattocks KM, Mengeling M, Sadler A, Baldor R, Bastian L. The Veterans Choice Act: a qualitative examination of rapid policy implementation in the Department of Veterans Affairs. Med Care. 2017;55(7 suppl 1):S71-S75. doi:10.1097/MLR.0000000000000667
4. US Department of Veterans Affairs, Veterans Health Administration. VHA Directive 1108.08: VHA formulary management process. November 2, 2016. Accessed June 9, 2022. https://www.va.gov/vhapublications/ViewPublication.asp?pub_ID=3291
5. Massarweh NN, Itani KMF, Morris MS. The VA MISSION act and the future of veterans’ access to quality health care. JAMA. 2020;324:343-344. doi:10.1001/jama.2020.4505
6. Jourdan JP, Muzard A, Goyer I, et al. Impact of pharmacist interventions on clinical outcome and cost avoidance in a university teaching hospital. Int J Clin Pharm. 2018;40(6):1474-1481. doi:10.1007/s11096-018-0733-6
7. Lee AJ, Boro MS, Knapp KK, Meier JL, Korman NE. Clinical and economic outcomes of pharmacist recommendations in a Veterans Affairs medical center. Am J Health Syst Pharm. 2002;59(21):2070-2077. doi:10.1093/ajhp/59.21.2070
8. Dalton K, Byrne S. Role of the pharmacist in reducing healthcare costs: current insights. Integr Pharm Res Pract. 2017;6:37-46. doi:10.2147/IPRP.S108047
9. De Rijdt T, Willems L, Simoens S. Economic effects of clinical pharmacy interventions: a literature review. Am J Health Syst Pharm. 2008;65(12):1161-1172. doi:10.2146/ajhp070506
10. Perez A, Doloresco F, Hoffman J, et al. Economic evaluation of clinical pharmacy services: 2001-2005. Pharmacotherapy. 2009;29(1):128. doi:10.1592/phco.29.1.128
11. Nesbit TW, Shermock KM, Bobek MB, et al. Implementation and pharmacoeconomic analysis of a clinical staff pharmacist practice model. Am J Health Syst Pharm. 2001;58(9):784-790. doi:10.1093/ajhp/58.9.784
12. Yang S, Britt RB, Hashem MG, Brown JN. Outcomes of pharmacy-led hepatitis C direct-acting antiviral utilization management at a Veterans Affairs medical center. J Manag Care Pharm. 2017;23(3):364-369. doi:10.18553/jmcp.2017.23.3.364
13. Britt RB, Hashem MG, Bryan WE III, Kothapalli R, Brown JN. Economic outcomes associated with a pharmacist-adjudicated formulary consult service in a Veterans Affairs medical center. J Manag Care Pharm. 2016;22(9):1051-1061. doi:10.18553/jmcp.2016.22.9.1051
14. Jacob S, Britt RB, Bryan WE, Hashem MG, Hale JC, Brown JN. Economic outcomes associated with safety interventions by a pharmacist-adjudicated prior authorization consult service. J Manag Care Pharm. 2019;25(3):411-416. doi:10.18553/jmcp.2019.25.3.411
15. Aspinall SL, Sales MM, Good CB, et al. Pharmacy benefits management in the Veterans Health Administration revisited: a decade of advancements, 2004-2014. J Manag Care Spec Pharm. 2016;22(9):1058-1063. doi:10.18553/jmcp.2016.22.9.1058
16. US Department of Veterans Affairs, Office of the Chief Human Capital Officer. Title 38 Pay Schedules. Updated January 26, 2022. Accessed June 9, 2022. https://www.va.gov/ohrm/pay
Impact of Race on Outcomes of High-Risk Patients With Prostate Cancer Treated With Moderately Hypofractionated Radiotherapy in an Equal Access Setting
Although moderately hypofractionated radiotherapy (MHRT) is an accepted treatment for localized prostate cancer, its adaptation remains limited in the United States.1,2 MHRT theoretically exploits α/β ratio differences between the prostate (1.5 Gy), bladder (5-10 Gy), and rectum (3 Gy), thereby reducing late treatment-related adverse effects compared with those of conventional fractionation at biologically equivalent doses.3-8 Multiple randomized noninferiority trials have demonstrated equivalent outcomes between MHRT and conventional fraction with no appreciable increase in patient-reported toxicity.9-14 Although these studies have led to the acceptance of MHRT as a standard treatment, the majority of these trials involve individuals with low- and intermediate-risk disease.
There are less phase 3 data addressing MHRT for high-risk prostate cancer (HRPC).10,12,14-17 Only 2 studies examined predominately high-risk populations, accounting for 83 and 292 patients, respectively.15,16 Additional phase 3 trials with small proportions of high-risk patients (n = 126, 12%; n = 53, 35%) offer limited additional information regarding clinical outcomes and toxicity rates specific to high-risk disease.10-12 Numerous phase 1 and 2 studies report various field designs and fractionation plans for MHRT in the context of high-risk disease, although the applicability of these data to off-trial populations remains limited.18-20
Furthermore, African American individuals are underrepresented in the trials establishing the role of MHRT despite higher rates of prostate cancer incidence, more advanced disease stage at diagnosis, and higher rates of prostate cancer–specific survival (PCSS) when compared with White patients.21 Racial disparities across patients with prostate cancer and their management are multifactorial across health care literacy, education level, access to care (including transportation issues), and issues of adherence and distrust.22-25 Correlation of patient race to prostate cancer outcomes varies greatly across health care systems, with the US Department of Veterans Affairs (VA) equal access system providing robust mental health services and transportation services for some patients, while demonstrating similar rates of stage-adjusted PCSS between African American and White patients across a broad range of treatment modalities.26-28 Given the paucity of data exploring outcomes following MHRT for African American patients with HRPC, the present analysis provides long-term clinical outcomes and toxicity profiles for an off-trial majority African American population with HRPC treated with MHRT within the VA.
Methods
Records were retrospectively reviewed under an institutional review board–approved protocol for all patients with HRPC treated with definitive MHRT at the Durham Veterans Affairs Healthcare System in North Carolina between November 2008 and August 2018. Exclusion criteria included < 12 months of follow-up or elective nodal irradiation. Demographic variables obtained included age at diagnosis, race, clinical T stage, pre-MHRT prostate-specific antigen (PSA), Gleason grade group at diagnosis, favorable vs unfavorable high-risk disease, pre-MHRT international prostate symptom score (IPSS), and pre-MHRT urinary medication usage (yes/no).29
Concurrent androgen deprivation therapy (ADT) was initiated 6 to 8 weeks before MHRT unless medically contraindicated per the discretion of the treating radiation oncologist. Patients generally received 18 to 24 months of ADT, with those with favorable HRPC (ie, T1c disease with either Gleason 4+4 and PSA < 10 mg/mL or Gleason 3+3 and PSA > 20 ng/mL) receiving 6 months after 2015.29 Patients were simulated supine in either standard or custom immobilization with a full bladder and empty rectum. MHRT fractionation plans included 70 Gy at 2.5 Gy per fraction and 60 Gy at 3 Gy per fraction. Radiotherapy targets included the prostate and seminal vesicles without elective nodal coverage per institutional practice. Treatments were delivered following image guidance, either prostate matching with cone beam computed tomography or fiducial matching with kilo voltage imaging. All patients received intensity-modulated radiotherapy. For plans delivering 70 Gy at 2.5 Gy per fraction, constraints included bladder V (volume receiving) 70 < 10 cc, V65 ≤ 15%, V40 ≤ 35%, rectum V70 < 10 cc, V65 ≤ 10%, V40 ≤ 35%, femoral heads maximum point dose ≤ 40 Gy, penile bulb mean dose ≤ 50 Gy, and small bowel V40 ≤ 1%. For plans delivering 60 Gy at 3 Gy per fraction, constraints included rectum V57 ≤ 15%, V46 ≤ 30%, V37 ≤ 50%, bladder V60 ≤ 5%, V46 ≤ 30%, V37 ≤ 50%, and femoral heads V43 ≤ 5%.
Gastrointestinal (GI) and genitourinary (GU) toxicities were graded using Common Terminology Criteria for Adverse Events (CTCAE), version 5.0, with acute toxicity defined as on-treatment < 3 months following completion of MHRT. Late toxicity was defined as ≥ 3 months following completion of MHRT. Individuals were seen in follow-up at 6 weeks and 3 months with PSA and testosterone after MHRT completion, then every 6 to 12 months for 5 years and annually thereafter. Each follow-up visit included history, physical examination, IPSS, and CTCAE grading for GI and GU toxicity.
The Wilcoxon rank sum test and χ2 test were used to compare differences in demographic data, dosimetric parameters, and frequency of toxicity events with respect to patient race. Clinical endpoints including biochemical recurrence-free survival (BRFS; defined by Phoenix criteria as 2.0 above PSA nadir), distant metastases-free survival (DMFS), PCSS, and overall survival (OS) were estimated from time of radiotherapy completion by the Kaplan-Meier method and compared between African American and White race by log-rank testing.30 Late GI and GU toxicity-free survival were estimated by Kaplan-Meier plots and compared between African American and White patients by the log-rank test. Statistical analysis was performed using SAS 9.4.
Results
We identified 143 patients with HRPC treated with definitive MHRT between November 2008 and August 2018 (Table 1). Mean age was 65 years (range, 36-80 years); 57% were African American men. Eighty percent of individuals had unfavorable high-risk disease. Median (IQR) PSA was 14.4 (7.8-28.6). Twenty-six percent had grade group 1-3 disease, 47% had grade group 4 disease, and 27% had grade group 5 disease. African American patients had significantly lower pre-MHRT IPSS scores than White patients (mean IPSS, 11 vs 14, respectively; P = .02) despite similar rates of preradiotherapy urinary medication usage (66% and 66%, respectively).
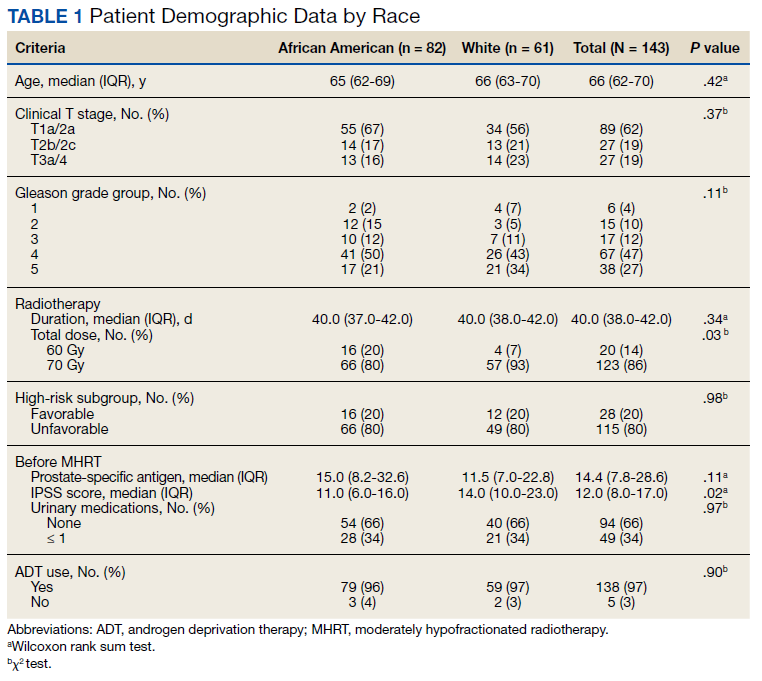
Eighty-six percent received 70 Gy over 28 fractions, with institutional protocol shifting to 60 Gy over 20 fractions (14%) in June 2017. The median (IQR) duration of radiotherapy was 39 (38-42) days, with 97% of individuals undergoing ADT for a median (IQR) duration of 24 (24-36) months. The median follow-up time was 38 months, with 57 (40%) patients followed for at least 60 months.
Grade 3 GI and GU acute toxicity events were observed in 1% and 4% of all individuals, respectively (Table 2). No acute GI or GU grade 4+ events were observed. No significant differences in acute GU or GI toxicity were observed between African American and White patients.
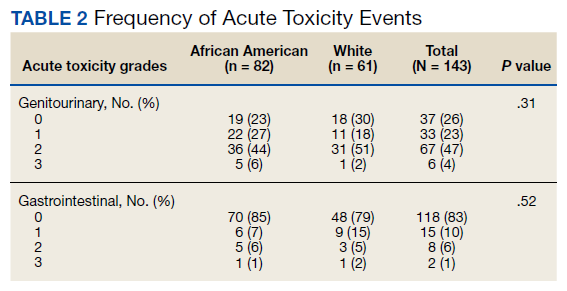
No significant differences between African American and White patients were observed for late grade 2+ GI (P = .19) or GU (P = .55) toxicity. Late grade 2+ GI toxicity was observed in 17 (12%) patients overall (Figure 1A). One grade 3 and 1 grade 4 late GI event were observed following MHRT completion: The latter involved hospitalization for bleeding secondary to radiation proctitis in the context of cirrhosis predating MHRT. Late grade 2+ GU toxicity was observed in 80 (56%) patients, with late grade 2 events steadily increasing over time (Figure 1B). Nine late grade 3 GU toxicity events were observed at a median of 13 months following completion of MHRT, 2 of which occurred more than 24 months after MHRT completion. No late grade 4 or 5 GU events were observed. IPSS values both before MHRT and at time of last follow-up were available for 65 (40%) patients, with a median (IQR) IPSS of 10 (6-16) before MHRT and 12 (8-16) at last follow-up at a median (IQR) interval of 36 months (26-76) from radiation completion.
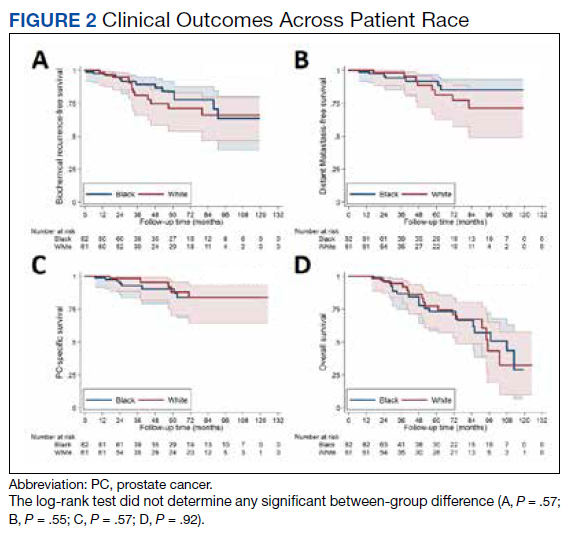
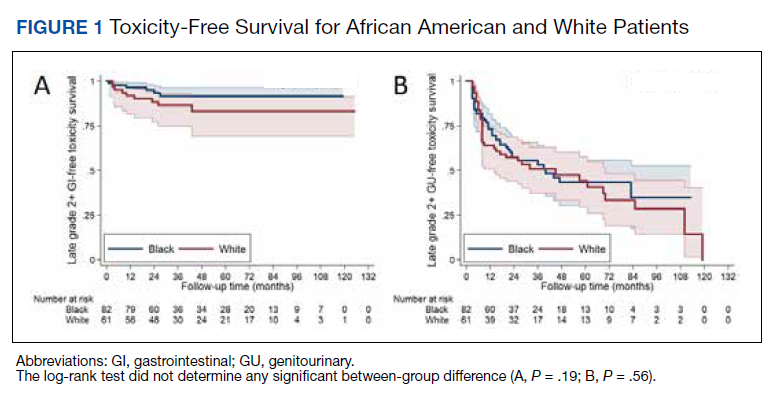
No significant differences were observed between African American and White patients with respect to BRFS, DMFS, PCSS, or OS (Figure 2). Overall, 21 of 143 (15%) patients experienced biochemical recurrence: 5-year BRFS was 77% (95% CI, 67%-85%) for all patients, 83% (95% CI, 70%-91%) for African American patients, and 71% (95% CI, 53%-82%) for White patients. Five-year DMFS was 87% (95% CI, 77%-92%) for all individuals, 91% (95% CI, 80%-96%) for African American patients, and 81% (95% CI, 62%-91%) for White patients. Five-year PCSS was 89% (95% CI, 80%-94%) for all patients, with 5-year PCSS rates of 90% (95% CI, 79%-95%) for African American patients and 87% (95% CI, 70%-95%) for White patients. Five-year OS was 75% overall (95% CI, 64%-82%), with 5-year OS rates of 73% (95% CI, 58%-83%) for African American patients and 77% (95% CI, 60%-87%) for White patients.
Discussion
In this study, we reported acute and late GI and GU toxicity rates as well as clinical outcomes for a majority African American population with predominately unfavorable HRPC treated with MHRT in an equal access health care environment. We found that MHRT was well tolerated with high rates of biochemical control, PCSS, and OS. Additionally, outcomes were not significantly different across patient race. To our knowledge, this is the first report of MHRT for HRPC in a majority African American population.
We found that MHRT was an effective treatment for patients with HRPC, in particular those with unfavorable high-risk disease. While prior prospective and randomized studies have investigated the use of MHRT, our series was larger than most and had a predominately unfavorable high-risk population.12,15-17 Our biochemical and PCSS rates compare favorably with those of HRPC trial populations, particularly given the high proportion of unfavorable high-risk disease.12,15,16 Despite similar rates of biochemical control, OS was lower in the present cohort than in HRPC trial populations, even with a younger median age at diagnosis. The similarly high rates of non–HRPC-related death across race may reflect differences in baseline comorbidities compared with trial populations as well as reported differences between individuals in the VA and the private sector.31 This suggests that MHRT can be an effective treatment for patients with unfavorable HRPC.
We did not find any differences in outcomes between African American and White individuals with HRPC treated with MHRT. Furthermore, our study demonstrates long-term rates of BRFS and PCSS in a majority African American population with predominately unfavorable HRPC that are comparable with those of prior randomized MHRT studies in high-risk, predominately White populations.12,15,16 Prior reports have found that African American men with HRPC may be at increased risk for inferior clinical outcomes due to a number of socioeconomic, biologic, and cultural mediators.26,27,32 Such individuals may disproportionally benefit from shorter treatment courses that improve access to radiotherapy, a well-documented disparity for African American men with localized prostate cancer.33-36 The VA is an ideal system for studying racial disparities within prostate cancer, as accessibility of mental health and transportation services, income, and insurance status are not barriers to preventative or acute care.37 Our results are concordant with those previously seen for African American patients with prostate cancer seen in the VA, which similarly demonstrate equal outcomes with those of other races.28,36 Incorporation of the earlier mentioned VA services into oncologic care across other health care systems could better characterize determinants of racial disparities in prostate cancer, including the prognostic significance of shortening treatment duration and number of patient visits via MHRT.
Despite widespread acceptance in prostate cancer radiotherapy guidelines, routine use of MHRT seems limited across all stages of localized prostate cancer.1,2 Late toxicity is a frequently noted concern regarding MHRT use. Higher rates of late grade 2+ GI toxicity were observed in the hypofractionation arm of the HYPRO trial.17 While RTOG 0415 did not include patients with HRPC, significantly higher rates of physician-reported (but not patient-reported) late grade 2+ GI and GU toxicity were observed using the same MHRT fractionation regimen used for the majority of individuals in our cohort.9 In our study, the steady increase in late grade 2 GU toxicity is consistent with what is seen following conventionally fractionated radiotherapy and is likely multifactorial.38 The mean IPSS difference of 2/35 from pre-MHRT baseline to the time of last follow-up suggests minimal quality of life decline. The relatively stable IPSSs over time alongside the > 50% prevalence of late grade 2 GU toxicity per CTCAE grading seems consistent with the discrepancy noted in RTOG 0415 between increased physician-reported late toxicity and favorable patient-reported quality of life scores.9 Moreover, significant variance exists in toxicity grading across scoring systems, revised editions of CTCAE, and physician-specific toxicity classification, particularly with regard to the use of adrenergic receptor blocker medications. In light of these factors, the high rate of late grade 2 GU toxicity in our study should be interpreted in the context of largely stable post-MHRT IPSSs and favorable rates of late GI grade 2+ and late GU grade 3+ toxicity.
Limitations
This study has several inherent limitations. While the size of the current HRPC cohort is notably larger than similar populations within the majority of phase 3 MHRT trials, these data derive from a single VA hospital. It is unclear whether these outcomes would be representative in a similar high-risk population receiving care outside of the VA equal access system. Follow-up data beyond 5 years was available for less than half of patients, partially due to nonprostate cancer–related mortality at a higher rate than observed in HRPC trial populations.12,15,16 Furthermore, all GI toxicity events were exclusively physician reported, and GU toxicity reporting was limited in the off-trial setting with not all patients routinely completing IPSS questionnaires following MHRT completion. However, all patients were treated similarly, and radiation quality was verified over the treatment period with mandated accreditation, frequent standardized output checks, and systematic treatment review.39
Conclusions
Patients with HRPC treated with MHRT in an equal access, off-trial setting demonstrated favorable rates of biochemical control with acceptable rates of acute and late GI and GU toxicities. Clinical outcomes, including biochemical control, were not significantly different between African American and White patients, which may reflect equal access to care within the VA irrespective of income and insurance status. Incorporating VA services, such as access to primary care, mental health services, and transportation across other health care systems may aid in characterizing and mitigating racial and gender disparities in oncologic care.
Acknowledgments
Portions of this work were presented at the November 2020 ASTRO conference. 40
1. Stokes WA, Kavanagh BD, Raben D, Pugh TJ. Implementation of hypofractionated prostate radiation therapy in the United States: a National Cancer Database analysis. Pract Radiat Oncol. 2017;7:270-278. doi:10.1016/j.prro.2017.03.011
2. Jaworski L, Dominello MM, Heimburger DK, et al. Contemporary practice patterns for intact and post-operative prostate cancer: results from a statewide collaborative. Int J Radiat Oncol Biol Phys. 2019;105(1):E282. doi:10.1016/j.ijrobp.2019.06.1915
3. Miralbell R, Roberts SA, Zubizarreta E, Hendry JH. Dose-fractionation sensitivity of prostate cancer deduced from radiotherapy outcomes of 5,969 patients in seven international institutional datasets: α/β = 1.4 (0.9-2.2) Gy. Int J Radiat Oncol Biol Phys. 2012;82(1):e17-e24. doi:10.1016/j.ijrobp.2010.10.075
4. Tree AC, Khoo VS, van As NJ, Partridge M. Is biochemical relapse-free survival after profoundly hypofractionated radiotherapy consistent with current radiobiological models? Clin Oncol (R Coll Radiol). 2014;26(4):216-229. doi:10.1016/j.clon.2014.01.008
5. Brenner DJ. Fractionation and late rectal toxicity. Int J Radiat Oncol Biol Phys. 2004;60(4):1013-1015. doi:10.1016/j.ijrobp.2004.04.014
6. Tucker SL, Thames HD, Michalski JM, et al. Estimation of α/β for late rectal toxicity based on RTOG 94-06. Int J Radiat Oncol Biol Phys. 2011;81(2):600-605. doi:10.1016/j.ijrobp.2010.11.080
7. Dasu A, Toma-Dasu I. Prostate alpha/beta revisited—an analysis of clinical results from 14 168 patients. Acta Oncol. 2012;51(8):963-974. doi:10.3109/0284186X.2012.719635 start
8. Proust-Lima C, Taylor JMG, Sécher S, et al. Confirmation of a Low α/β ratio for prostate cancer treated by external beam radiation therapy alone using a post-treatment repeated-measures model for PSA dynamics. Int J Radiat Oncol Biol Phys. 2011;79(1):195-201. doi:10.1016/j.ijrobp.2009.10.008
9. Lee WR, Dignam JJ, Amin MB, et al. Randomized phase III noninferiority study comparing two radiotherapy fractionation schedules in patients with low-risk prostate cancer. J Clin Oncol. 2016;34(20): 2325-2332. doi:10.1200/JCO.2016.67.0448
10. Dearnaley D, Syndikus I, Mossop H, et al. Conventional versus hypofractionated high-dose intensity-modulated radiotherapy for prostate cancer: 5-year outcomes of the randomised, non-inferiority, phase 3 CHHiP trial. Lancet Oncol. 2016;17(8):1047-1060. doi:10.1016/S1470-2045(16)30102-4
11. Catton CN, Lukka H, Gu C-S, et al. Randomized trial of a hypofractionated radiation regimen for the treatment of localized prostate cancer. J Clin Oncol. 2017;35(17):1884-1890. doi:10.1200/JCO.2016.71.7397
12. Pollack A, Walker G, Horwitz EM, et al. Randomized trial of hypofractionated external-beam radiotherapy for prostate cancer. J Clin Oncol. 2013;31(31):3860-3868. doi:10.1200/JCO.2013.51.1972
13. Hoffman KE, Voong KR, Levy LB, et al. Randomized trial of hypofractionated, dose-escalated, intensity-modulated radiation therapy (IMRT) versus conventionally fractionated IMRT for localized prostate cancer. J Clin Oncol. 2018;36(29):2943-2949. doi:10.1200/JCO.2018.77.9868
14. Wilkins A, Mossop H, Syndikus I, et al. Hypofractionated radiotherapy versus conventionally fractionated radiotherapy for patients with intermediate-risk localised prostate cancer: 2-year patient-reported outcomes of the randomised, non-inferiority, phase 3 CHHiP trial. Lancet Oncol. 2015;16(16):1605-1616. doi:10.1016/S1470-2045(15)00280-6
15. Incrocci L, Wortel RC, Alemayehu WG, et al. Hypofractionated versus conventionally fractionated radiotherapy for patients with localised prostate cancer (HYPRO): final efficacy results from a randomised, multicentre, open-label, phase 3 trial. Lancet Oncol. 2016;17(8):1061-1069. doi.10.1016/S1470-2045(16)30070-5
16. Arcangeli G, Saracino B, Arcangeli S, et al. Moderate hypofractionation in high-risk, organ-confined prostate cancer: final results of a phase III randomized trial. J Clin Oncol. 2017;35(17):1891-1897. doi:10.1200/JCO.2016.70.4189
17. Aluwini S, Pos F, Schimmel E, et al. Hypofractionated versus conventionally fractionated radiotherapy for patients with prostate cancer (HYPRO): late toxicity results from a randomised, non-inferiority, phase 3 trial. Lancet Oncol. 2016;17(4):464-474. doi:10.1016/S1470-2045(15)00567-7
18. Pervez N, Small C, MacKenzie M, et al. Acute toxicity in high-risk prostate cancer patients treated with androgen suppression and hypofractionated intensity-modulated radiotherapy. Int J Radiat Oncol Biol Phys. 2010;76(1):57-64. doi:10.1016/j.ijrobp.2009.01.048
19. Magli A, Moretti E, Tullio A, Giannarini G. Hypofractionated simultaneous integrated boost (IMRT- cancer: results of a prospective phase II trial SIB) with pelvic nodal irradiation and concurrent androgen deprivation therapy for high-risk prostate cancer: results of a prospective phase II trial. Prostate Cancer Prostatic Dis. 2018;21(2):269-276. doi:10.1038/s41391-018-0034-0
20. Di Muzio NG, Fodor A, Noris Chiorda B, et al. Moderate hypofractionation with simultaneous integrated boost in prostate cancer: long-term results of a phase I–II study. Clin Oncol (R Coll Radiol). 2016;28(8):490-500. doi:10.1016/j.clon.2016.02.005
21. DeSantis CE, Miller KD, Goding Sauer A, Jemal A, Siegel RL. Cancer statistics for African Americans, 2019. CA Cancer J Clin. 2019;69(3):21-233. doi:10.3322/caac.21555
22. Wolf MS, Knight SJ, Lyons EA, et al. Literacy, race, and PSA level among low-income men newly diagnosed with prostate cancer. Urology. 2006(1);68:89-93. doi:10.1016/j.urology.2006.01.064
23. Rebbeck TR. Prostate cancer disparities by race and ethnicity: from nucleotide to neighborhood. Cold Spring Harb Perspect Med. 2018;8(9):a030387. doi:10.1101/cshperspect.a030387
24. Guidry JJ, Aday LA, Zhang D, Winn RJ. Transportation as a barrier to cancer treatment. Cancer Pract. 1997;5(6):361-366.
25. Friedman DB, Corwin SJ, Dominick GM, Rose ID. African American men’s understanding and perceptions about prostate cancer: why multiple dimensions of health literacy are important in cancer communication. J Community Health. 2009;34(5):449-460. doi:10.1007/s10900-009-9167-3
26. Connell PP, Ignacio L, Haraf D, et al. Equivalent racial outcome after conformal radiotherapy for prostate cancer: a single departmental experience. J Clin Oncol. 2001;19(1):54-61. doi:10.1200/JCO.2001.19.1.54
27. Dess RT, Hartman HE, Mahal BA, et al. Association of black race with prostate cancer-specific and other-cause mortality. JAMA Oncol. 2019;5(1):975-983. doi:10.1200/JCO.2001.19.1.54
28. McKay RR, Sarkar RR, Kumar A, et al. Outcomes of Black men with prostate cancer treated with radiation therapy in the Veterans Health Administration. Cancer. 2021;127(3):403-411. doi:10.1002/cncr.33224
29. Muralidhar V, Chen M-H, Reznor G, et al. Definition and validation of “favorable high-risk prostate cancer”: implications for personalizing treatment of radiation-managed patients. Int J Radiat Oncol Biol Phys. 2015;93(4):828-835. doi:10.1016/j.ijrobp.2015.07.2281
30. Roach M 3rd, Hanks G, Thames H Jr, et al. Defining biochemical failure following radiotherapy with or without hormonal therapy in men with clinically localized prostate cancer: recommendations of the RTOG-ASTRO Phoenix Consensus Conference. Int J Radiat Oncol Biol Phys. 2006;65(4):965-974. doi:10.1016/j.ijrobp.2006.04.029
31. Freeman VL, Durazo-Arvizu R, Arozullah AM, Keys LC. Determinants of mortality following a diagnosis of prostate cancer in Veterans Affairs and private sector health care systems. Am J Public Health. 2003;93(100):1706-1712. doi:10.2105/ajph.93.10.1706
32. Ward E, Jemal A, Cokkinides V, et al. Cancer disparities by race/ethnicity and socioeconomic status. CA Cancer J Clin. 2004;54(2):78-93. doi:10.3322/canjclin.54.2.78
33. Zemplenyi AT, Kaló Z, Kovacs G, et al. Cost-effectiveness analysis of intensity-modulated radiation therapy with normal and hypofractionated schemes for the treatment of localised prostate cancer. Eur J Cancer Care. 2018;27(1):e12430. doi:10.1111/ecc.12430
34. Klabunde CN, Potosky AL, Harlan LC, Kramer BS. Trends and black/white differences in treatment for nonmetastatic prostate cancer. Med Care. 1998;36(9):1337-1348. doi:10.1097/00005650-199809000-00006
35. Harlan L, Brawley O, Pommerenke F, Wali P, Kramer B. Geographic, age, and racial variation in the treatment of local/regional carcinoma of the prostate. J Clin Oncol. 1995;13(1):93-100. doi:10.1200/JCO.1995.13.1.93
36. Riviere P, Luterstein E, Kumar A, et al. Racial equity among African-American and non-Hispanic white men diagnosed with prostate cancer in the veterans affairs healthcare system. Int J Radiat Oncol Biol Phys. 2019;105:E305.
37. Peterson K, Anderson J, Boundy E, Ferguson L, McCleery E, Waldrip K. Mortality disparities in racial/ethnic minority groups in the Veterans Health Administration: an evidence review and map. Am J Public Health. 2018;108(3):e1-e11. doi:10.2105/AJPH.2017.304246
38. Zietman AL, DeSilvio ML, Slater JD, et al. Comparison of conventional-dose vs high-dose conformal radiation therapy in clinically localized adenocarcinoma of the prostate: a randomized controlled trial. JAMA. 2005;294(10):1233-1239. doi:10.1001/jama.294.10.1233
39. Hagan M, Kapoor R, Michalski J, et al. VA-Radiation Oncology Quality Surveillance program. Int J Radiat Oncol Biol Phys. 2020;106(3):639-647. doi.10.1016/j.ijrobp.2019.08.064
40. Carpenter DJ, Natesan D, Floyd W, et al. Long-term experience in an equal access health care system using moderately hypofractionated radiotherapy for high risk prostate cancer in a predominately African American population with unfavorable disease. Int J Radiat Oncol Biol Phys. 2020;108(3):E417. https://www.redjournal.org/article/S0360-3016(20)33923-7/fulltext
Although moderately hypofractionated radiotherapy (MHRT) is an accepted treatment for localized prostate cancer, its adaptation remains limited in the United States.1,2 MHRT theoretically exploits α/β ratio differences between the prostate (1.5 Gy), bladder (5-10 Gy), and rectum (3 Gy), thereby reducing late treatment-related adverse effects compared with those of conventional fractionation at biologically equivalent doses.3-8 Multiple randomized noninferiority trials have demonstrated equivalent outcomes between MHRT and conventional fraction with no appreciable increase in patient-reported toxicity.9-14 Although these studies have led to the acceptance of MHRT as a standard treatment, the majority of these trials involve individuals with low- and intermediate-risk disease.
There are less phase 3 data addressing MHRT for high-risk prostate cancer (HRPC).10,12,14-17 Only 2 studies examined predominately high-risk populations, accounting for 83 and 292 patients, respectively.15,16 Additional phase 3 trials with small proportions of high-risk patients (n = 126, 12%; n = 53, 35%) offer limited additional information regarding clinical outcomes and toxicity rates specific to high-risk disease.10-12 Numerous phase 1 and 2 studies report various field designs and fractionation plans for MHRT in the context of high-risk disease, although the applicability of these data to off-trial populations remains limited.18-20
Furthermore, African American individuals are underrepresented in the trials establishing the role of MHRT despite higher rates of prostate cancer incidence, more advanced disease stage at diagnosis, and higher rates of prostate cancer–specific survival (PCSS) when compared with White patients.21 Racial disparities across patients with prostate cancer and their management are multifactorial across health care literacy, education level, access to care (including transportation issues), and issues of adherence and distrust.22-25 Correlation of patient race to prostate cancer outcomes varies greatly across health care systems, with the US Department of Veterans Affairs (VA) equal access system providing robust mental health services and transportation services for some patients, while demonstrating similar rates of stage-adjusted PCSS between African American and White patients across a broad range of treatment modalities.26-28 Given the paucity of data exploring outcomes following MHRT for African American patients with HRPC, the present analysis provides long-term clinical outcomes and toxicity profiles for an off-trial majority African American population with HRPC treated with MHRT within the VA.
Methods
Records were retrospectively reviewed under an institutional review board–approved protocol for all patients with HRPC treated with definitive MHRT at the Durham Veterans Affairs Healthcare System in North Carolina between November 2008 and August 2018. Exclusion criteria included < 12 months of follow-up or elective nodal irradiation. Demographic variables obtained included age at diagnosis, race, clinical T stage, pre-MHRT prostate-specific antigen (PSA), Gleason grade group at diagnosis, favorable vs unfavorable high-risk disease, pre-MHRT international prostate symptom score (IPSS), and pre-MHRT urinary medication usage (yes/no).29
Concurrent androgen deprivation therapy (ADT) was initiated 6 to 8 weeks before MHRT unless medically contraindicated per the discretion of the treating radiation oncologist. Patients generally received 18 to 24 months of ADT, with those with favorable HRPC (ie, T1c disease with either Gleason 4+4 and PSA < 10 mg/mL or Gleason 3+3 and PSA > 20 ng/mL) receiving 6 months after 2015.29 Patients were simulated supine in either standard or custom immobilization with a full bladder and empty rectum. MHRT fractionation plans included 70 Gy at 2.5 Gy per fraction and 60 Gy at 3 Gy per fraction. Radiotherapy targets included the prostate and seminal vesicles without elective nodal coverage per institutional practice. Treatments were delivered following image guidance, either prostate matching with cone beam computed tomography or fiducial matching with kilo voltage imaging. All patients received intensity-modulated radiotherapy. For plans delivering 70 Gy at 2.5 Gy per fraction, constraints included bladder V (volume receiving) 70 < 10 cc, V65 ≤ 15%, V40 ≤ 35%, rectum V70 < 10 cc, V65 ≤ 10%, V40 ≤ 35%, femoral heads maximum point dose ≤ 40 Gy, penile bulb mean dose ≤ 50 Gy, and small bowel V40 ≤ 1%. For plans delivering 60 Gy at 3 Gy per fraction, constraints included rectum V57 ≤ 15%, V46 ≤ 30%, V37 ≤ 50%, bladder V60 ≤ 5%, V46 ≤ 30%, V37 ≤ 50%, and femoral heads V43 ≤ 5%.
Gastrointestinal (GI) and genitourinary (GU) toxicities were graded using Common Terminology Criteria for Adverse Events (CTCAE), version 5.0, with acute toxicity defined as on-treatment < 3 months following completion of MHRT. Late toxicity was defined as ≥ 3 months following completion of MHRT. Individuals were seen in follow-up at 6 weeks and 3 months with PSA and testosterone after MHRT completion, then every 6 to 12 months for 5 years and annually thereafter. Each follow-up visit included history, physical examination, IPSS, and CTCAE grading for GI and GU toxicity.
The Wilcoxon rank sum test and χ2 test were used to compare differences in demographic data, dosimetric parameters, and frequency of toxicity events with respect to patient race. Clinical endpoints including biochemical recurrence-free survival (BRFS; defined by Phoenix criteria as 2.0 above PSA nadir), distant metastases-free survival (DMFS), PCSS, and overall survival (OS) were estimated from time of radiotherapy completion by the Kaplan-Meier method and compared between African American and White race by log-rank testing.30 Late GI and GU toxicity-free survival were estimated by Kaplan-Meier plots and compared between African American and White patients by the log-rank test. Statistical analysis was performed using SAS 9.4.
Results
We identified 143 patients with HRPC treated with definitive MHRT between November 2008 and August 2018 (Table 1). Mean age was 65 years (range, 36-80 years); 57% were African American men. Eighty percent of individuals had unfavorable high-risk disease. Median (IQR) PSA was 14.4 (7.8-28.6). Twenty-six percent had grade group 1-3 disease, 47% had grade group 4 disease, and 27% had grade group 5 disease. African American patients had significantly lower pre-MHRT IPSS scores than White patients (mean IPSS, 11 vs 14, respectively; P = .02) despite similar rates of preradiotherapy urinary medication usage (66% and 66%, respectively).
Eighty-six percent received 70 Gy over 28 fractions, with institutional protocol shifting to 60 Gy over 20 fractions (14%) in June 2017. The median (IQR) duration of radiotherapy was 39 (38-42) days, with 97% of individuals undergoing ADT for a median (IQR) duration of 24 (24-36) months. The median follow-up time was 38 months, with 57 (40%) patients followed for at least 60 months.
Grade 3 GI and GU acute toxicity events were observed in 1% and 4% of all individuals, respectively (Table 2). No acute GI or GU grade 4+ events were observed. No significant differences in acute GU or GI toxicity were observed between African American and White patients.
No significant differences between African American and White patients were observed for late grade 2+ GI (P = .19) or GU (P = .55) toxicity. Late grade 2+ GI toxicity was observed in 17 (12%) patients overall (Figure 1A). One grade 3 and 1 grade 4 late GI event were observed following MHRT completion: The latter involved hospitalization for bleeding secondary to radiation proctitis in the context of cirrhosis predating MHRT. Late grade 2+ GU toxicity was observed in 80 (56%) patients, with late grade 2 events steadily increasing over time (Figure 1B). Nine late grade 3 GU toxicity events were observed at a median of 13 months following completion of MHRT, 2 of which occurred more than 24 months after MHRT completion. No late grade 4 or 5 GU events were observed. IPSS values both before MHRT and at time of last follow-up were available for 65 (40%) patients, with a median (IQR) IPSS of 10 (6-16) before MHRT and 12 (8-16) at last follow-up at a median (IQR) interval of 36 months (26-76) from radiation completion.
No significant differences were observed between African American and White patients with respect to BRFS, DMFS, PCSS, or OS (Figure 2). Overall, 21 of 143 (15%) patients experienced biochemical recurrence: 5-year BRFS was 77% (95% CI, 67%-85%) for all patients, 83% (95% CI, 70%-91%) for African American patients, and 71% (95% CI, 53%-82%) for White patients. Five-year DMFS was 87% (95% CI, 77%-92%) for all individuals, 91% (95% CI, 80%-96%) for African American patients, and 81% (95% CI, 62%-91%) for White patients. Five-year PCSS was 89% (95% CI, 80%-94%) for all patients, with 5-year PCSS rates of 90% (95% CI, 79%-95%) for African American patients and 87% (95% CI, 70%-95%) for White patients. Five-year OS was 75% overall (95% CI, 64%-82%), with 5-year OS rates of 73% (95% CI, 58%-83%) for African American patients and 77% (95% CI, 60%-87%) for White patients.
Discussion
In this study, we reported acute and late GI and GU toxicity rates as well as clinical outcomes for a majority African American population with predominately unfavorable HRPC treated with MHRT in an equal access health care environment. We found that MHRT was well tolerated with high rates of biochemical control, PCSS, and OS. Additionally, outcomes were not significantly different across patient race. To our knowledge, this is the first report of MHRT for HRPC in a majority African American population.
We found that MHRT was an effective treatment for patients with HRPC, in particular those with unfavorable high-risk disease. While prior prospective and randomized studies have investigated the use of MHRT, our series was larger than most and had a predominately unfavorable high-risk population.12,15-17 Our biochemical and PCSS rates compare favorably with those of HRPC trial populations, particularly given the high proportion of unfavorable high-risk disease.12,15,16 Despite similar rates of biochemical control, OS was lower in the present cohort than in HRPC trial populations, even with a younger median age at diagnosis. The similarly high rates of non–HRPC-related death across race may reflect differences in baseline comorbidities compared with trial populations as well as reported differences between individuals in the VA and the private sector.31 This suggests that MHRT can be an effective treatment for patients with unfavorable HRPC.
We did not find any differences in outcomes between African American and White individuals with HRPC treated with MHRT. Furthermore, our study demonstrates long-term rates of BRFS and PCSS in a majority African American population with predominately unfavorable HRPC that are comparable with those of prior randomized MHRT studies in high-risk, predominately White populations.12,15,16 Prior reports have found that African American men with HRPC may be at increased risk for inferior clinical outcomes due to a number of socioeconomic, biologic, and cultural mediators.26,27,32 Such individuals may disproportionally benefit from shorter treatment courses that improve access to radiotherapy, a well-documented disparity for African American men with localized prostate cancer.33-36 The VA is an ideal system for studying racial disparities within prostate cancer, as accessibility of mental health and transportation services, income, and insurance status are not barriers to preventative or acute care.37 Our results are concordant with those previously seen for African American patients with prostate cancer seen in the VA, which similarly demonstrate equal outcomes with those of other races.28,36 Incorporation of the earlier mentioned VA services into oncologic care across other health care systems could better characterize determinants of racial disparities in prostate cancer, including the prognostic significance of shortening treatment duration and number of patient visits via MHRT.
Despite widespread acceptance in prostate cancer radiotherapy guidelines, routine use of MHRT seems limited across all stages of localized prostate cancer.1,2 Late toxicity is a frequently noted concern regarding MHRT use. Higher rates of late grade 2+ GI toxicity were observed in the hypofractionation arm of the HYPRO trial.17 While RTOG 0415 did not include patients with HRPC, significantly higher rates of physician-reported (but not patient-reported) late grade 2+ GI and GU toxicity were observed using the same MHRT fractionation regimen used for the majority of individuals in our cohort.9 In our study, the steady increase in late grade 2 GU toxicity is consistent with what is seen following conventionally fractionated radiotherapy and is likely multifactorial.38 The mean IPSS difference of 2/35 from pre-MHRT baseline to the time of last follow-up suggests minimal quality of life decline. The relatively stable IPSSs over time alongside the > 50% prevalence of late grade 2 GU toxicity per CTCAE grading seems consistent with the discrepancy noted in RTOG 0415 between increased physician-reported late toxicity and favorable patient-reported quality of life scores.9 Moreover, significant variance exists in toxicity grading across scoring systems, revised editions of CTCAE, and physician-specific toxicity classification, particularly with regard to the use of adrenergic receptor blocker medications. In light of these factors, the high rate of late grade 2 GU toxicity in our study should be interpreted in the context of largely stable post-MHRT IPSSs and favorable rates of late GI grade 2+ and late GU grade 3+ toxicity.
Limitations
This study has several inherent limitations. While the size of the current HRPC cohort is notably larger than similar populations within the majority of phase 3 MHRT trials, these data derive from a single VA hospital. It is unclear whether these outcomes would be representative in a similar high-risk population receiving care outside of the VA equal access system. Follow-up data beyond 5 years was available for less than half of patients, partially due to nonprostate cancer–related mortality at a higher rate than observed in HRPC trial populations.12,15,16 Furthermore, all GI toxicity events were exclusively physician reported, and GU toxicity reporting was limited in the off-trial setting with not all patients routinely completing IPSS questionnaires following MHRT completion. However, all patients were treated similarly, and radiation quality was verified over the treatment period with mandated accreditation, frequent standardized output checks, and systematic treatment review.39
Conclusions
Patients with HRPC treated with MHRT in an equal access, off-trial setting demonstrated favorable rates of biochemical control with acceptable rates of acute and late GI and GU toxicities. Clinical outcomes, including biochemical control, were not significantly different between African American and White patients, which may reflect equal access to care within the VA irrespective of income and insurance status. Incorporating VA services, such as access to primary care, mental health services, and transportation across other health care systems may aid in characterizing and mitigating racial and gender disparities in oncologic care.
Acknowledgments
Portions of this work were presented at the November 2020 ASTRO conference. 40
1. Stokes WA, Kavanagh BD, Raben D, Pugh TJ. Implementation of hypofractionated prostate radiation therapy in the United States: a National Cancer Database analysis. Pract Radiat Oncol. 2017;7:270-278. doi:10.1016/j.prro.2017.03.011
2. Jaworski L, Dominello MM, Heimburger DK, et al. Contemporary practice patterns for intact and post-operative prostate cancer: results from a statewide collaborative. Int J Radiat Oncol Biol Phys. 2019;105(1):E282. doi:10.1016/j.ijrobp.2019.06.1915
3. Miralbell R, Roberts SA, Zubizarreta E, Hendry JH. Dose-fractionation sensitivity of prostate cancer deduced from radiotherapy outcomes of 5,969 patients in seven international institutional datasets: α/β = 1.4 (0.9-2.2) Gy. Int J Radiat Oncol Biol Phys. 2012;82(1):e17-e24. doi:10.1016/j.ijrobp.2010.10.075
4. Tree AC, Khoo VS, van As NJ, Partridge M. Is biochemical relapse-free survival after profoundly hypofractionated radiotherapy consistent with current radiobiological models? Clin Oncol (R Coll Radiol). 2014;26(4):216-229. doi:10.1016/j.clon.2014.01.008
5. Brenner DJ. Fractionation and late rectal toxicity. Int J Radiat Oncol Biol Phys. 2004;60(4):1013-1015. doi:10.1016/j.ijrobp.2004.04.014
6. Tucker SL, Thames HD, Michalski JM, et al. Estimation of α/β for late rectal toxicity based on RTOG 94-06. Int J Radiat Oncol Biol Phys. 2011;81(2):600-605. doi:10.1016/j.ijrobp.2010.11.080
7. Dasu A, Toma-Dasu I. Prostate alpha/beta revisited—an analysis of clinical results from 14 168 patients. Acta Oncol. 2012;51(8):963-974. doi:10.3109/0284186X.2012.719635 start
8. Proust-Lima C, Taylor JMG, Sécher S, et al. Confirmation of a Low α/β ratio for prostate cancer treated by external beam radiation therapy alone using a post-treatment repeated-measures model for PSA dynamics. Int J Radiat Oncol Biol Phys. 2011;79(1):195-201. doi:10.1016/j.ijrobp.2009.10.008
9. Lee WR, Dignam JJ, Amin MB, et al. Randomized phase III noninferiority study comparing two radiotherapy fractionation schedules in patients with low-risk prostate cancer. J Clin Oncol. 2016;34(20): 2325-2332. doi:10.1200/JCO.2016.67.0448
10. Dearnaley D, Syndikus I, Mossop H, et al. Conventional versus hypofractionated high-dose intensity-modulated radiotherapy for prostate cancer: 5-year outcomes of the randomised, non-inferiority, phase 3 CHHiP trial. Lancet Oncol. 2016;17(8):1047-1060. doi:10.1016/S1470-2045(16)30102-4
11. Catton CN, Lukka H, Gu C-S, et al. Randomized trial of a hypofractionated radiation regimen for the treatment of localized prostate cancer. J Clin Oncol. 2017;35(17):1884-1890. doi:10.1200/JCO.2016.71.7397
12. Pollack A, Walker G, Horwitz EM, et al. Randomized trial of hypofractionated external-beam radiotherapy for prostate cancer. J Clin Oncol. 2013;31(31):3860-3868. doi:10.1200/JCO.2013.51.1972
13. Hoffman KE, Voong KR, Levy LB, et al. Randomized trial of hypofractionated, dose-escalated, intensity-modulated radiation therapy (IMRT) versus conventionally fractionated IMRT for localized prostate cancer. J Clin Oncol. 2018;36(29):2943-2949. doi:10.1200/JCO.2018.77.9868
14. Wilkins A, Mossop H, Syndikus I, et al. Hypofractionated radiotherapy versus conventionally fractionated radiotherapy for patients with intermediate-risk localised prostate cancer: 2-year patient-reported outcomes of the randomised, non-inferiority, phase 3 CHHiP trial. Lancet Oncol. 2015;16(16):1605-1616. doi:10.1016/S1470-2045(15)00280-6
15. Incrocci L, Wortel RC, Alemayehu WG, et al. Hypofractionated versus conventionally fractionated radiotherapy for patients with localised prostate cancer (HYPRO): final efficacy results from a randomised, multicentre, open-label, phase 3 trial. Lancet Oncol. 2016;17(8):1061-1069. doi.10.1016/S1470-2045(16)30070-5
16. Arcangeli G, Saracino B, Arcangeli S, et al. Moderate hypofractionation in high-risk, organ-confined prostate cancer: final results of a phase III randomized trial. J Clin Oncol. 2017;35(17):1891-1897. doi:10.1200/JCO.2016.70.4189
17. Aluwini S, Pos F, Schimmel E, et al. Hypofractionated versus conventionally fractionated radiotherapy for patients with prostate cancer (HYPRO): late toxicity results from a randomised, non-inferiority, phase 3 trial. Lancet Oncol. 2016;17(4):464-474. doi:10.1016/S1470-2045(15)00567-7
18. Pervez N, Small C, MacKenzie M, et al. Acute toxicity in high-risk prostate cancer patients treated with androgen suppression and hypofractionated intensity-modulated radiotherapy. Int J Radiat Oncol Biol Phys. 2010;76(1):57-64. doi:10.1016/j.ijrobp.2009.01.048
19. Magli A, Moretti E, Tullio A, Giannarini G. Hypofractionated simultaneous integrated boost (IMRT- cancer: results of a prospective phase II trial SIB) with pelvic nodal irradiation and concurrent androgen deprivation therapy for high-risk prostate cancer: results of a prospective phase II trial. Prostate Cancer Prostatic Dis. 2018;21(2):269-276. doi:10.1038/s41391-018-0034-0
20. Di Muzio NG, Fodor A, Noris Chiorda B, et al. Moderate hypofractionation with simultaneous integrated boost in prostate cancer: long-term results of a phase I–II study. Clin Oncol (R Coll Radiol). 2016;28(8):490-500. doi:10.1016/j.clon.2016.02.005
21. DeSantis CE, Miller KD, Goding Sauer A, Jemal A, Siegel RL. Cancer statistics for African Americans, 2019. CA Cancer J Clin. 2019;69(3):21-233. doi:10.3322/caac.21555
22. Wolf MS, Knight SJ, Lyons EA, et al. Literacy, race, and PSA level among low-income men newly diagnosed with prostate cancer. Urology. 2006(1);68:89-93. doi:10.1016/j.urology.2006.01.064
23. Rebbeck TR. Prostate cancer disparities by race and ethnicity: from nucleotide to neighborhood. Cold Spring Harb Perspect Med. 2018;8(9):a030387. doi:10.1101/cshperspect.a030387
24. Guidry JJ, Aday LA, Zhang D, Winn RJ. Transportation as a barrier to cancer treatment. Cancer Pract. 1997;5(6):361-366.
25. Friedman DB, Corwin SJ, Dominick GM, Rose ID. African American men’s understanding and perceptions about prostate cancer: why multiple dimensions of health literacy are important in cancer communication. J Community Health. 2009;34(5):449-460. doi:10.1007/s10900-009-9167-3
26. Connell PP, Ignacio L, Haraf D, et al. Equivalent racial outcome after conformal radiotherapy for prostate cancer: a single departmental experience. J Clin Oncol. 2001;19(1):54-61. doi:10.1200/JCO.2001.19.1.54
27. Dess RT, Hartman HE, Mahal BA, et al. Association of black race with prostate cancer-specific and other-cause mortality. JAMA Oncol. 2019;5(1):975-983. doi:10.1200/JCO.2001.19.1.54
28. McKay RR, Sarkar RR, Kumar A, et al. Outcomes of Black men with prostate cancer treated with radiation therapy in the Veterans Health Administration. Cancer. 2021;127(3):403-411. doi:10.1002/cncr.33224
29. Muralidhar V, Chen M-H, Reznor G, et al. Definition and validation of “favorable high-risk prostate cancer”: implications for personalizing treatment of radiation-managed patients. Int J Radiat Oncol Biol Phys. 2015;93(4):828-835. doi:10.1016/j.ijrobp.2015.07.2281
30. Roach M 3rd, Hanks G, Thames H Jr, et al. Defining biochemical failure following radiotherapy with or without hormonal therapy in men with clinically localized prostate cancer: recommendations of the RTOG-ASTRO Phoenix Consensus Conference. Int J Radiat Oncol Biol Phys. 2006;65(4):965-974. doi:10.1016/j.ijrobp.2006.04.029
31. Freeman VL, Durazo-Arvizu R, Arozullah AM, Keys LC. Determinants of mortality following a diagnosis of prostate cancer in Veterans Affairs and private sector health care systems. Am J Public Health. 2003;93(100):1706-1712. doi:10.2105/ajph.93.10.1706
32. Ward E, Jemal A, Cokkinides V, et al. Cancer disparities by race/ethnicity and socioeconomic status. CA Cancer J Clin. 2004;54(2):78-93. doi:10.3322/canjclin.54.2.78
33. Zemplenyi AT, Kaló Z, Kovacs G, et al. Cost-effectiveness analysis of intensity-modulated radiation therapy with normal and hypofractionated schemes for the treatment of localised prostate cancer. Eur J Cancer Care. 2018;27(1):e12430. doi:10.1111/ecc.12430
34. Klabunde CN, Potosky AL, Harlan LC, Kramer BS. Trends and black/white differences in treatment for nonmetastatic prostate cancer. Med Care. 1998;36(9):1337-1348. doi:10.1097/00005650-199809000-00006
35. Harlan L, Brawley O, Pommerenke F, Wali P, Kramer B. Geographic, age, and racial variation in the treatment of local/regional carcinoma of the prostate. J Clin Oncol. 1995;13(1):93-100. doi:10.1200/JCO.1995.13.1.93
36. Riviere P, Luterstein E, Kumar A, et al. Racial equity among African-American and non-Hispanic white men diagnosed with prostate cancer in the veterans affairs healthcare system. Int J Radiat Oncol Biol Phys. 2019;105:E305.
37. Peterson K, Anderson J, Boundy E, Ferguson L, McCleery E, Waldrip K. Mortality disparities in racial/ethnic minority groups in the Veterans Health Administration: an evidence review and map. Am J Public Health. 2018;108(3):e1-e11. doi:10.2105/AJPH.2017.304246
38. Zietman AL, DeSilvio ML, Slater JD, et al. Comparison of conventional-dose vs high-dose conformal radiation therapy in clinically localized adenocarcinoma of the prostate: a randomized controlled trial. JAMA. 2005;294(10):1233-1239. doi:10.1001/jama.294.10.1233
39. Hagan M, Kapoor R, Michalski J, et al. VA-Radiation Oncology Quality Surveillance program. Int J Radiat Oncol Biol Phys. 2020;106(3):639-647. doi.10.1016/j.ijrobp.2019.08.064
40. Carpenter DJ, Natesan D, Floyd W, et al. Long-term experience in an equal access health care system using moderately hypofractionated radiotherapy for high risk prostate cancer in a predominately African American population with unfavorable disease. Int J Radiat Oncol Biol Phys. 2020;108(3):E417. https://www.redjournal.org/article/S0360-3016(20)33923-7/fulltext
Racial Disparities in the Diagnosis of Psoriasis
To the Editor:
Psoriasis affects 2% to 3% of the US population and is one of the more commonly diagnosed dermatologic conditions.1-3 Experts agree that common cutaneous diseases such as psoriasis present differently in patients with skin of color (SOC) compared to non-SOC patients.3,4 Despite the prevalence of psoriasis, data on these morphologic differences are limited.3-5 We performed a retrospective chart review comparing characteristics of psoriasis in SOC and non-SOC patients.
Through a search of electronic health records, we identified patients with an International Classification of Diseases, 10th Revision, diagnosis of psoriasis who were 18 years or older and were evaluated in the dermatology department between August 2015 and June 2020 at University Medical Center, an academic institution in New Orleans, Louisiana. Photographs and descriptions of lesions from these patients were reviewed. Patient data collected included age, sex, psoriasis classification, insurance status, self-identified race and ethnicity, location of lesion(s), biopsy, final diagnosis, and average number of visits or days required for accurate diagnosis. Self-identified SOC race and ethnicity categories included Black or African American, Hispanic, Asian, American Indian and Alaskan Native, Native Hawaiian and Other Pacific Islander, and “other.”
All analyses were conducted using R-4.0.1 statistics software. Categorical variables were compared in SOC and non-SOC groups using Fisher exact tests. Continuous covariates were conducted using a Wilcoxon rank sum test.
In total, we reviewed 557 charts. Four patients who declined to identify their race or ethnicity were excluded, yielding 286 SOC and 267 non-SOC patients (N=553). A total of 276 patients (131 SOC; 145 non-SOC) with a prior diagnosis of psoriasis were excluded in the days to diagnosis analysis. Twenty patients (15, SOC; 5, non-SOC) were given a diagnosis of a disease other than psoriasis when evaluated in the dermatology department.
Distributions between racial groups differed for insurance status, sex, psoriasis classification, biopsy status, and days between first dermatology visit and diagnosis. Skin of color patients had significantly longer days between initial presentation to dermatology and final diagnosis vs non-SOC patients (180.11 and 60.27 days, respectively; P=.001). Skin of color patients had a higher rate of palmoplantar psoriasis and severe plaque psoriasis (ie, >10% body surface area involvement) at presentation.

Several multivariable regression analyses were performed. Skin of color patients had significantly higher odds of biopsy compared to non-SOC patients (adjusted odds ratio [95% CI]=4 [2.05-7.82]; P<.001)(Figure 1). There were no significant predictors for severe plaque psoriasis involving more than 10% body surface area. Skin of color patients had a significantly longer time to diagnosis than non-SOC patients (P=.006)(Figure 2). On average, patients with SOC waited 3.23 times longer for a diagnosis than their non-SOC counterparts (95% CI, 1.42-7.36).

Our data reveal striking racial disparities in psoriasis care. Worse outcomes for patients with SOC compared to non-SOC patients may result from physicians’ inadequate familiarity with diverse presentations of psoriasis, including more frequent involvement of special body sites in SOC. Other likely contributing factors that we did not evaluate include socioeconomic barriers to health care, lack of physician diversity, missed appointments, and a paucity of literature on the topic of differentiating morphologies of psoriasis in SOC and non-SOC patients. Our study did not examine the effects of sex, tobacco use, or prior or current therapy, and it excluded pediatric patients.
To improve dermatologic outcomes for our increasingly diverse patient population, more studies must be undertaken to elucidate and document disparities in care for SOC populations.
- Gelfand JM, Stern RS, Nijsten T, et al. The prevalence of psoriasis in African Americans: results from a population-based study. J Am Acad Dermatol. 2005;52:23-26. doi:10.1016/j.jaad.2004.07.045
- Stern RS, Nijsten T, Feldman SR, et al. Psoriasis is common, carries a substantial burden even when not extensive, and is associated with widespread treatment dissatisfaction. J Investig Dermatol Symp Proc. 2004;9:136-139. doi:10.1046/j.1087-0024.2003.09102.x
- Davis SA, Narahari S, Feldman SR, et al. Top dermatologic conditions in patients of color: an analysis of nationally representative data. J Drugs Dermatol. 2012;11:466-473.
- Alexis AF, Blackcloud P. Psoriasis in skin of color: epidemiology, genetics, clinical presentation, and treatment nuances. J Clin Aesthet Dermatol. 2014;7:16-24.
- Kaufman BP, Alexis AF. Psoriasis in skin of color: insights into the epidemiology, clinical presentation, genetics, quality-of-life impact, and treatment of psoriasis in non-white racial/ethnic groups. Am J Clin Dermatol. 2018;19:405-423. doi:10.1007/s40257-017-0332-7
To the Editor:
Psoriasis affects 2% to 3% of the US population and is one of the more commonly diagnosed dermatologic conditions.1-3 Experts agree that common cutaneous diseases such as psoriasis present differently in patients with skin of color (SOC) compared to non-SOC patients.3,4 Despite the prevalence of psoriasis, data on these morphologic differences are limited.3-5 We performed a retrospective chart review comparing characteristics of psoriasis in SOC and non-SOC patients.
Through a search of electronic health records, we identified patients with an International Classification of Diseases, 10th Revision, diagnosis of psoriasis who were 18 years or older and were evaluated in the dermatology department between August 2015 and June 2020 at University Medical Center, an academic institution in New Orleans, Louisiana. Photographs and descriptions of lesions from these patients were reviewed. Patient data collected included age, sex, psoriasis classification, insurance status, self-identified race and ethnicity, location of lesion(s), biopsy, final diagnosis, and average number of visits or days required for accurate diagnosis. Self-identified SOC race and ethnicity categories included Black or African American, Hispanic, Asian, American Indian and Alaskan Native, Native Hawaiian and Other Pacific Islander, and “other.”
All analyses were conducted using R-4.0.1 statistics software. Categorical variables were compared in SOC and non-SOC groups using Fisher exact tests. Continuous covariates were conducted using a Wilcoxon rank sum test.
In total, we reviewed 557 charts. Four patients who declined to identify their race or ethnicity were excluded, yielding 286 SOC and 267 non-SOC patients (N=553). A total of 276 patients (131 SOC; 145 non-SOC) with a prior diagnosis of psoriasis were excluded in the days to diagnosis analysis. Twenty patients (15, SOC; 5, non-SOC) were given a diagnosis of a disease other than psoriasis when evaluated in the dermatology department.
Distributions between racial groups differed for insurance status, sex, psoriasis classification, biopsy status, and days between first dermatology visit and diagnosis. Skin of color patients had significantly longer days between initial presentation to dermatology and final diagnosis vs non-SOC patients (180.11 and 60.27 days, respectively; P=.001). Skin of color patients had a higher rate of palmoplantar psoriasis and severe plaque psoriasis (ie, >10% body surface area involvement) at presentation.
Several multivariable regression analyses were performed. Skin of color patients had significantly higher odds of biopsy compared to non-SOC patients (adjusted odds ratio [95% CI]=4 [2.05-7.82]; P<.001)(Figure 1). There were no significant predictors for severe plaque psoriasis involving more than 10% body surface area. Skin of color patients had a significantly longer time to diagnosis than non-SOC patients (P=.006)(Figure 2). On average, patients with SOC waited 3.23 times longer for a diagnosis than their non-SOC counterparts (95% CI, 1.42-7.36).
Our data reveal striking racial disparities in psoriasis care. Worse outcomes for patients with SOC compared to non-SOC patients may result from physicians’ inadequate familiarity with diverse presentations of psoriasis, including more frequent involvement of special body sites in SOC. Other likely contributing factors that we did not evaluate include socioeconomic barriers to health care, lack of physician diversity, missed appointments, and a paucity of literature on the topic of differentiating morphologies of psoriasis in SOC and non-SOC patients. Our study did not examine the effects of sex, tobacco use, or prior or current therapy, and it excluded pediatric patients.
To improve dermatologic outcomes for our increasingly diverse patient population, more studies must be undertaken to elucidate and document disparities in care for SOC populations.
- Gelfand JM, Stern RS, Nijsten T, et al. The prevalence of psoriasis in African Americans: results from a population-based study. J Am Acad Dermatol. 2005;52:23-26. doi:10.1016/j.jaad.2004.07.045
- Stern RS, Nijsten T, Feldman SR, et al. Psoriasis is common, carries a substantial burden even when not extensive, and is associated with widespread treatment dissatisfaction. J Investig Dermatol Symp Proc. 2004;9:136-139. doi:10.1046/j.1087-0024.2003.09102.x
- Davis SA, Narahari S, Feldman SR, et al. Top dermatologic conditions in patients of color: an analysis of nationally representative data. J Drugs Dermatol. 2012;11:466-473.
- Alexis AF, Blackcloud P. Psoriasis in skin of color: epidemiology, genetics, clinical presentation, and treatment nuances. J Clin Aesthet Dermatol. 2014;7:16-24.
- Kaufman BP, Alexis AF. Psoriasis in skin of color: insights into the epidemiology, clinical presentation, genetics, quality-of-life impact, and treatment of psoriasis in non-white racial/ethnic groups. Am J Clin Dermatol. 2018;19:405-423. doi:10.1007/s40257-017-0332-7
Practice Points
- Skin of color (SOC) patients can wait 3 times longer to receive a diagnosis of psoriasis than non-SOC patients.
- Patients with SOC more often present with severe forms of psoriasis and are more likely to have palmoplantar psoriasis.
- Skin of color patients can be 4 times as likely to require a biopsy to confirm psoriasis diagnosis compared to non-SOC patients.