User login
The Burden of Guardianship: A Matched Cohort Study
A central tenet of modern medicine is that patients must provide fully informed consent to receive or refuse medical care offered by their clinical teams.1–4 If a patient is unable to make and communicate a choice or clearly indicate an understanding of the information presented, then he or she is considered to lack the capacity to make medical decisions and the medical team must seek consent from the patient’s surrogate decision-maker.2-7 Every U.S. state recognizes a patient’s healthcare proxy (HCP) and a court-appointed guardian as a legally recognized surrogate.8,9 Most of the states also have statutes or regulations establishing a hierarchy of legally recognized surrogate decision-makers in the absence of a HCP or a court-appointed guardian, such as spouses, adult children, parents, siblings, and grandparents.8,10 In states that do not have such a statute, hospitals develop their own institutional policies for surrogate decision-making.
However, there are important limitations on the authority of these surrogate decision-makers.10 For instance, patients may not have a family member or a friend to serve as a surrogate decision-maker, often family members cannot override a patient’s objection, even when that patient lacks decision-making capacity, and certain decisions require a guardian or a HCP.8-10 In these circumstances, the hospital must petition a court to appoint a guardian as a legally recognized surrogate decision-maker. This can be an involved family member, if one exists, or an independent, typically volunteer, guardian.11 The process of guardian appointment is complex7,11 and can range from a few days to more than a month, largely dependent on court dates and finding a volunteer guardian. Much of the process occurs during the patient’s hospital stay. This prolongation of hospitalization would be expected to increase health care costs and iatrogenic complications,12–14 but data quantifying these for patients requiring guardianship are lacking. The goal of this study was to describe the characteristics of patients who undergo the process of guardianship and measure the associated burdens. These burdens include the financial costs to the medical system, the prolonged length of stay beyond medical necessity, and the costs to the patient in the form of hospital-acquired complications. Investigating the burden of guardianship is an important first step in uncovering opportunities to improve the process. We hypothesized that patients requiring guardianship would have lengths of stay and healthcare costs that were at least as large as those for patients whose conditions required similar durations of hospitalization prior to medical clearance, in part due to iatrogenic complications that would accrue while awaiting guardian appointment.
METHODS
Setting
We conducted a retrospective matched cohort study of adult inpatients at Beth Israel Deaconess Medical Center (BIDMC), a 651-bed academic, tertiary care facility in Boston, MA. The study was approved by the BIDMC Institutional Review Board as a nonhuman subject research consistent with hospital operations.
Population
For this matched cohort study, we identified case patients as those hospitalized for any reason for whom guardianship proceedings were initiated and obtained; only the first hospitalization during which the guardianship was pursued was used. Cases were identified by obtaining the data of all patients for whom the BIDMC general counsel completed the process of guardianship between October 2014 and September 2015. At BIDMC, all the guardianship proceedings are referred to the general counsel.
To determine the postclearance experience for referred patients compared with that for other patients with similar lengths of stay up to those of the referred patients’ point of clearance, we identified up to three matched controls for each case (Supplemental Figure 1). Medical clearance was defined as the date when the patient was medically stable to be discharged from the hospital, and it was determined in an iterative manner. We identified controls as hospitalized patients admitted for any cause and matched to the cases requiring guardianship on discharging service and length of stay prior to clearance. Specifically, we identified patients on the same service as the case whose length of stay was at least as long as the length of stay of the case patient until medical clearance, as defined below. We then determined the total and the excess length of stay, defined as the duration beyond clearance for each case referred for guardianship; for controls, the ‘excess’ length of stay was the number of hospitalized days beyond the corresponding time that a matched case had been provided clearance. To account for seasonal influences and the training level of house officers, we selected the three controls whose discharge date was closest (before or after) to the discharge date of their matched case.
From legal team files, we identified 61 patients hospitalized at BIDMC for whom new guardianship was pursued to completion. Of these 61 patients, 10 could not be matched to an appropriate control and were included in descriptive analyses but not in comparisons with controls.
Covariates and Outcomes
We collected the details regarding age, gender, primary language, highest level of education, marital status, insurance status, race, date of admission, date of discharge, discharge disposition, principal diagnosis, case mix index (CMI), and discharging service from our administrative and billing data. Outcomes of interest included length of stay and total hospital charges that were collected from the same databases. We used hospital charges, rather than payments, to ensure uniformity across payers.
Chart Review
Unique to cases, a team of two medical residents (JP, RP) and a hospitalist (DR) determined the date of medical clearance and hospital-associated complications by a chart review. The date of medical clearance was then used to calculate excess length of stay, ie, the duration of stay beyond the date of medical clearance, by subtracting the time to medical clearance from the total inpatient length of stay.
We developed a novel algorithm to determine the date of medical clearance consistently (Figure 1). We first determined whether the discharge summary indicated a clear date of medical readiness for discharge. If the discharge summary was unclear, then a case management or a social work note was used. The date of medical clearance determined by the case management or the social work note was then confirmed with clinical data. The date was confirmed if there were no significant laboratory orders and major medication changes or procedures for 24 h from the date identified. If notes were also inconclusive, then the medical clearance was determined by a review of provider order entry. Medical readiness for discharge was then defined as the first day when there were no laboratory orders for 48 h and no significant medication changes, imaging studies, or microbiologic orders.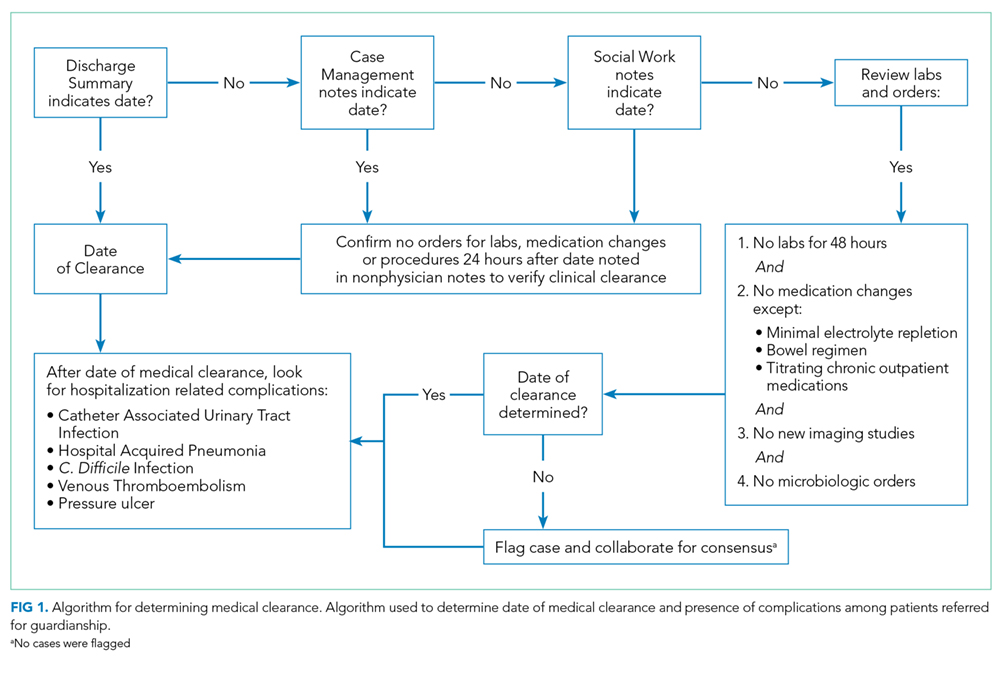
Hospital-acquired complications were determined to be related to the guardianship process if they occurred after the date of medical stability but prior to discharge. We did not investigate hospital-acquired complications among controls. Hospital-acquired complications were defined as follows:
- Catheter-associated urinary tract infection (CAUTI): active Foley catheter order and positive urine culture that resulted in antibiotic administration.
- Hospital-acquired pneumonia (HAP): chest X-ray or computed tomography (CT) scan showing a consolidation that resulted in antibiotic administration.
- Venous thromboembolism (VTE): positive venous ultrasound or CT angiography of the chest for deep venous thrombosis (DVT) or pulmonary embolism (PE).
- Decubitus ulcer: new wound care consultation for sacral decubitus ulceration.
- Clostridium difficile (C. diff) infection: positive stool polymerase chain reaction that resulted in antibiotic administration.
The algorithm for identifying the date of clearance and the presence of complications was piloted independently by three investigators (RP, JP, DR) using a single chart review and was redesigned until a consensus was obtained. The same three investigators then independently reviewed three additional charts, including all notes, laboratory results, imaging results, and orders, with complete agreement for both date of clearance and presence of complications. Two investigators (RP, JP) then individually reviewed the remaining 57 charts. Of these, 10 were selected a priori for review by both investigators for interrater reliability, with a mean difference of 0.5 days in the estimated time to clearance and complete concordance in complications. In addition, a third investigator (DR) independently reread 5 of the 57 reviewed charts, with complete concordance in both time to clearance and presence of complications with the original readings.
Statistical Analysis
SAS 9.3 was used for all analyses (SAS Institute Inc., Cary, NC, USA).
We first examined the demographic and clinical characteristics of all 61 patients who underwent guardianship proceedings. Second, we described the primary outcomes of interest–length of stay, costs, and likelihood of complications–in this series of patients with associated 95% confidence intervals.
Third, we examined the associations between guardianship and length of stay and healthcare costs using generalized estimating equations with clustering by matched set and compound symmetry. For length of stay, we specifically assessed excess length of stay (the matching variable) to avoid immortal time bias; we also examined the total length of stay. For all regression analyses, we adjusted for the following covariates: age, gender, education, marital status, race/ethnicity, CMI, insurance status, discharging service, and principal diagnosis. To maximize normality of residuals, costs were log-transformed; length of stay beyond clearance was log-transformed after addition of 1. For both outcomes, we back-transformed the regression coefficients and presented percent change between case and control patients. All reported tests are two-sided.
RESULTS
A total of 61 guardianship cases and 118 controls were included in the analysis.
General Characteristics
The characteristics of all cases prior to matching are included in Table 1. The department of internal medicine discharged the largest proportion of cases, followed by neurosurgery and neurology departments. More than 65% of cases were insured by Medicare or Medicaid. Three-quarters of cases were discharged from the hospital to another medical facility, with about half discharged to a skilled nursing facility (SNF) or a rehabilitation center and one-quarter to a long-term acute care hospital (LTACH).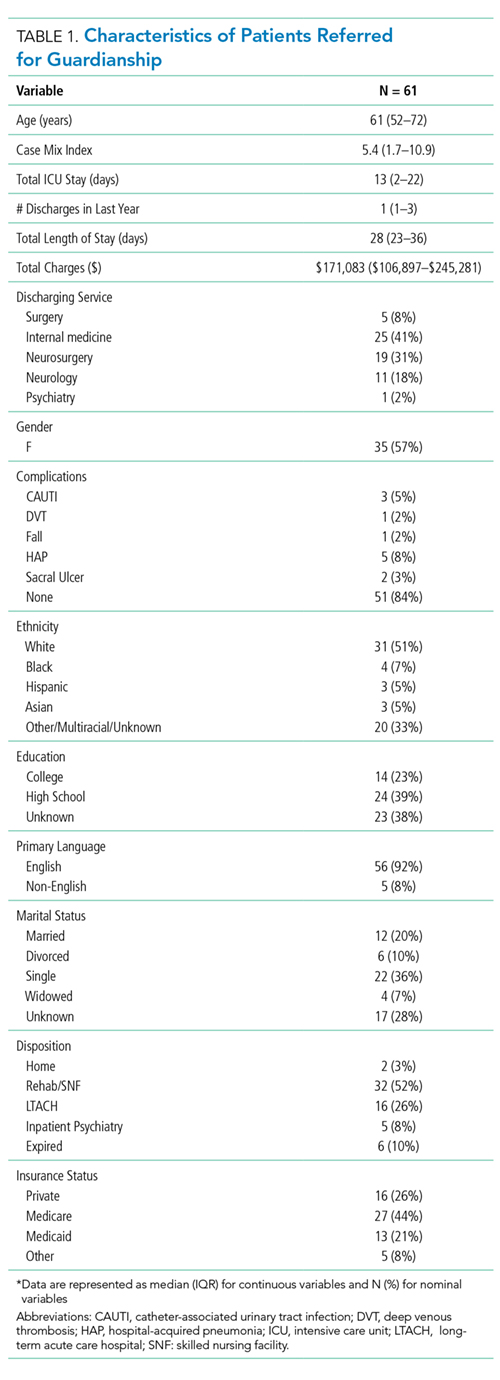
The median length of stay for patients requiring guardianship was 28 (range, 23-36) days, and the median total charges were $171,083 ($106,897-$245,281), with a total cost approximating $10.9 million for these patients. Regarding hospital-acquired complications, 10 (16%; 95% confidence interval, 8%–28%) unique cases suffered from a complication, with HAP being the most frequently (n = 5) occurring complication.
Comparison with Matched Controls
No statistically significant differences were observed between cases and controls in terms of age, primary language, highest level of education, ethnicity, insurance status, or discharging service as shown in Table 2; discharging service was a matched variable and comparable by design. However, cases tended to be less likely to be married and had a higher CMI.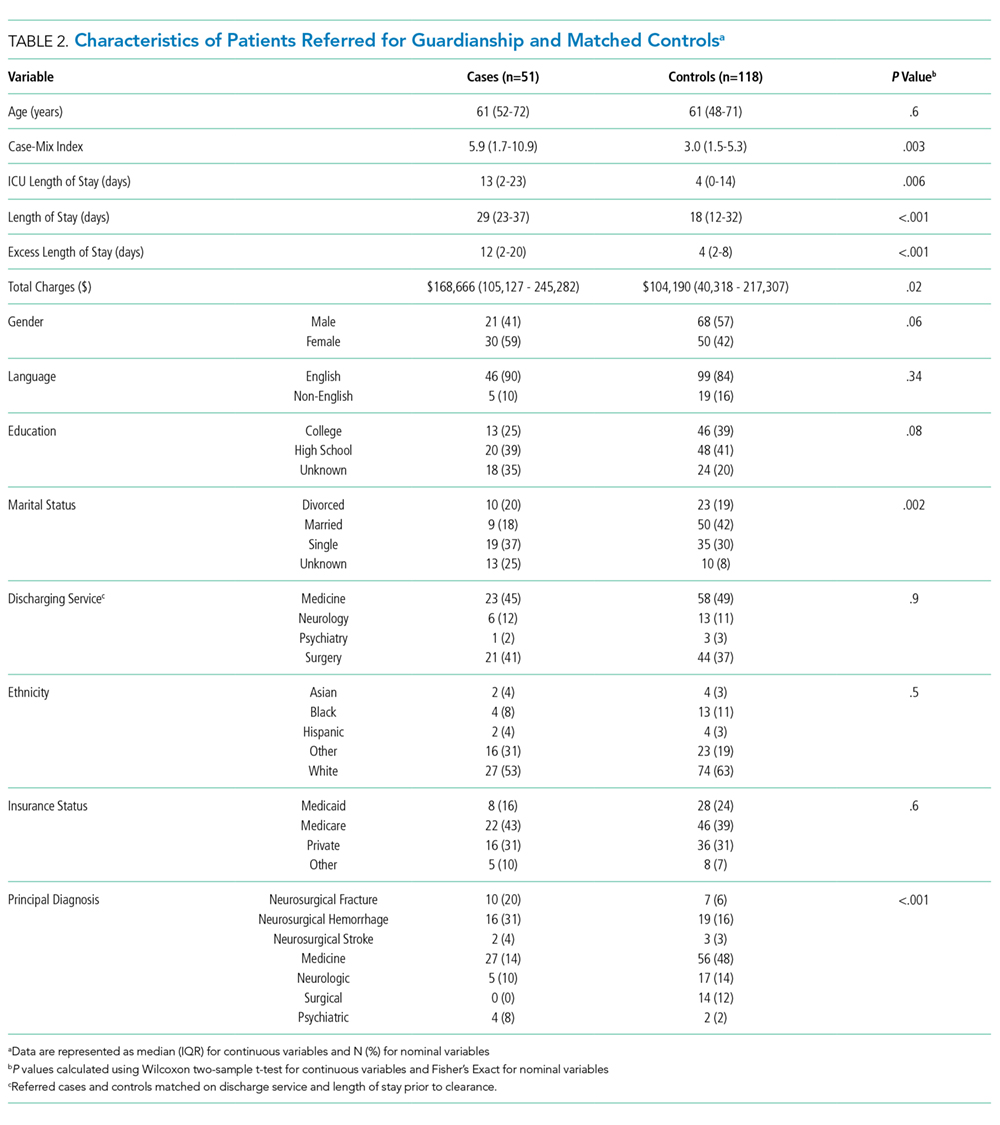
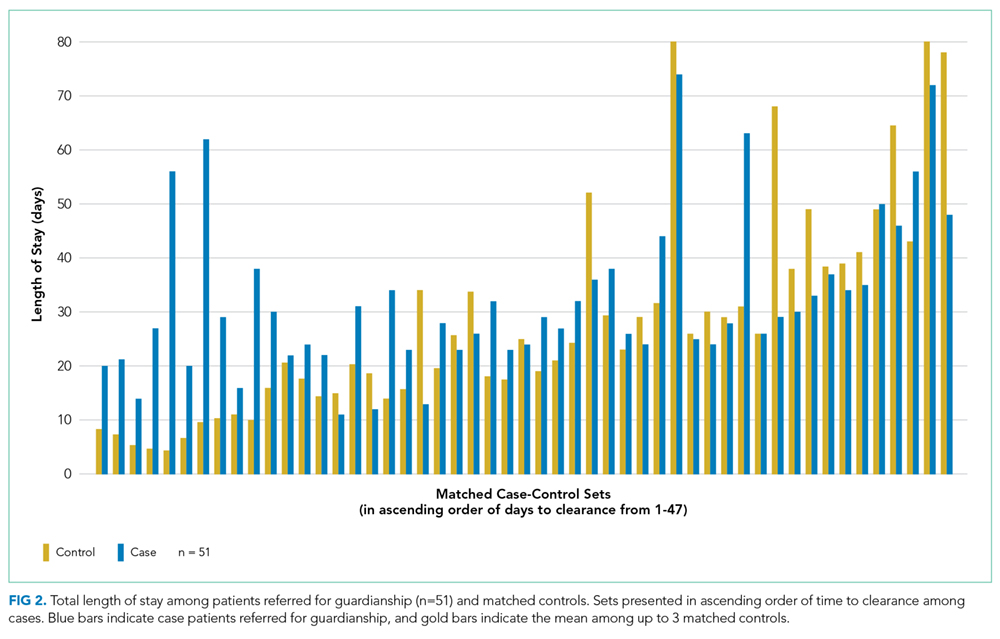
When compared with control patients in terms of similar services who stayed for at least as long as their duration to clearance, the cases had significantly longer lengths of stay compared to those of controls (29 total days compared to 18 days, P < .001; Figure 2). In addition, cases incurred significantly higher median total charges ($168,666) compared to those of controls ($104,190; P = .02).
After accounting for potential confounders, including age, gender, language, education, marital status, discharging service, ethnicity, insurance status, CMI, and principal diagnosis, guardianship was associated with 58% higher excess length of stay (P = .04, 95% CI [2%-145%]). Furthermore, guardianship was associated with 23% higher total charges (P = .02, 95% CI [4%-46%]) and 37% longer total length of stay (P = .002, 95% CI [12%-67%]).
DISCUSSION
To our knowledge, this is among the first studies to investigate healthcare costs and harm to the patient in the form of hospital-associated complications as a result of guardianship proceedings. Other studies15,16 have also demonstrated excessive length of stay attributed to nonclinical factors such as guardianship, though they did not quantify the excess stay or compare guardianship cases with a matched control. One study17 demonstrated total charges of $150,000 per patient requiring guardianship, which are similar to our results. However, Chen et al. also observed an average of 27.8 medically unnecessary days, which are 16 more days than those in our study sample. This may reflect the difference in how excess days were determined, namely, statistical process control analysis in the previous study compared with a manual chart review in our study. To our knowledge, no other study has compared guardianship cases with matched controls to compare their experiences to patients with similarly prolonged stays prior to clearance.
After matching by service and the length of stay until medical clearance in each guardianship case, the subsequent length of stay was higher among cases than among controls, even after adjustment for differences in CMI and diagnosis. This suggests that the process of obtaining guardianship results in a particularly prolonged length of stay, which is presumably attributable to factors other than medical complexity or ongoing illness.
It is probable that at least two interrelated mechanisms are responsible for the particularly high costs and the long stay of patients who require guardianship. First, the process of obtaining guardianship is itself protracted in several cases, necessitating long-term admissions well beyond the point of medical stability. Second, our results suggest that longer hospital stays are apt to grow further in a feed-forward cycle due to hospital-acquired complications that develop after the date of medical clearance. Indeed, in our series, 16% of patients sustained a complication that is readily attributable to hospital care after their date of clearance, and these types of complications are likely to lengthen the stay even further.
We compared cases referred for guardianship to control patients on the same services, at similar time points, whose length of stay was at least as long as the point of medical clearance as their corresponding case patient. Because cases were hospitalized with active medical needs to at least the point of clearance, we anticipated that costs might well be lower among cases, who had no medical necessity for hospitalization at the point of clearance, compared with controls who remained hospitalized presumably for active medical needs. Counter to this hypothesis, and accounting for potentially confounding variables, undergoing a guardianship proceeding was associated with nearly 25% higher costs of patient care. This may ultimately represent a substantial burden on the healthcare system. For example, in just 1 year in our hospital, the total hospital charges reached almost $11 million for the 61 patients who underwent guardianship proceedings. Considering that 65% of the patients requiring guardianship had Medicaid or Medicare coverage, there are significant financial implications for the hospital systems and to the public.
Limitations of our study relate to its retrospective nature at a single center. Investigating guardianship cases at a single center and with a small sample size of 61 patients limits generalizability. Nevertheless, we still had enough power to detect significant differences compared with matched controls, and this study remains the largest investigation into the cost associated with guardianship to date and the only study comparing guardianship cases with matched controls. Furthermore, we did not complete chart reviews of controls, which limits direct comparisons of complications and precluded our matching on variables that required detailed review.
The retrospective design may include confounders unaccounted for in our statistical design, though we attempted to match cases with controls to account for some of these potential differences and included a broad set of covariates that included measures of comorbidity and diagnosis. To this point, we included only CMI and principal diagnosis as the measures of severity, and adjustment for CMI, which includes features of the index hospitalization itself, may represent overadjustment. However, this type of overadjustment would tend to bias toward the null hypothesis.
Investigators only completed chart reviews for cases, which limits our ability to contrast the rate of hospital-associated complications for cases with that of controls. However, the rates of CAUTI and HAP complications among our cases were notably higher than national inpatient estimates, ie, 5% and 8% compared to 0.2%18 and 0.5%-1%,19 respectively. Furthermore, we demonstrated higher total costs and total lengths of stay among guardianship patients, analyses for which the attributed date of clearance for controls was not required, and the rate of complications among the case patients was sizable despite their being formally medically cleared. In other words, regardless of whether a complication rate of 16% is “typical” for inpatients hospitalized for these durations, this suggests that persistent hospitalization after clearance does not carry a benign prognosis.
In addition, to estimate healthcare costs, we relied on total hospital charges, which are readily available and reflect, at least in part, payer costs but do not reflect true costs to the medical center. Nonetheless, charges approximately reflect costs–with some variation across cost centers–and hence provide a useful metric for comparing cases and controls. To provide context, for academic medical centers such as ours, costs are typically about half of charges.
Finally, each state has different statutes for surrogate decision-making. The results of this study reflect the Massachusetts’ experience, with no public guardianship program or hierarchy statute. That being said, while this presumably causes the need for more guardianships in Massachusetts, the mechanisms for guardianship are broadly similar nationwide and are likely to result in excessive length of stay and cost similar to those in our population, as demonstrated in studies from other states.7,15–17
Implications
At a time where medical systems are searching for opportunities to reduce the length of stay, prevent unnecessary hospitalization, and improve the quality of care, reevaluating the guardianship process is ripe with opportunity. In this single academic center, the process of guardianship was associated with 58% excess length of stay and 23% higher total hospital charges. Furthermore, one in six patients requiring guardianship suffered from hospital-associated complications.
This matched cohort study adds quantitative data demonstrating substantial burdens to the healthcare system as a result of the guardianship process and can be used as an impetus for hospital administration and legal systems to expedite the process. Potential improvements include increasing HCP form completions (which would eliminate the need to pursue guardianship for most of such patients), identifying patients who lack a legally recognized surrogate decision-maker earlier in their hospital stay (ideally upon admission), and providing resources to assist clinical teams in the completion of affidavits necessary to support the appointment of a guardian, so that paperwork can be filed with courts sooner. Further research that provides more generalizable prospective data could potentially improve the guardianship process and reduce its burden on hospitals and patients even further.
Acknowledgments
The authors express their tremendous thanks to Gail Piatkowski for her invaluable assistance in collecting administrative and billing data.
Disclosures
The authors report no conflicts of interest. The authors alone are responsible for the content and writing of the article
1. O’Neill O. Autonomy and Trust in Bioethics. Cambridge: Cambridge University Press; 2002. PubMed
2. Beauchamp T, Childress J. Principles of Biomedical Ethics. 7th ed. New York: Oxford University Press; 2013.
3. McMurray RJ, Clarke OW, Barrasso JA, et al. Decisions near the end of life. J Am Med Assoc. 1992;267(16):2229-2233.
4. American Medical Association. AMA Principles of Medical Ethics: Chapter 2 - Opinions on Consent, Communication and Decision Making.; 2016.
5. Arnold RM, Kellum J. Moral justifications for surrogate decision making in the intensive care unit: Implications and limitations. Crit Care Med. 2003;31(Supplement):S347-S353. PubMed
6. Karp N, Wood E. Incapacitated and Alone: Healthcare Decision Making for Unbefriended Older People. Am Bar Assoc Hum Rights. 2003;31(2).
7. Bandy RJ, Helft PR, Bandy RW, Torke AM. Medical decision-making during the guardianship process for incapacitated, hospitalized adults: a descriptive cohort study. J Gen Intern Med. 2010;25(10):1003-1008. PubMed
8. Wynn S. Decisions by surrogates: an overview of surrogate consent laws in the United States. Bifocal. 2014;36(1):10-14.
9. Massachusetts General Laws. Chapter 201D: Health Care Proxies. https://malegislature.gov/Laws/GeneralLaws/PartII/TitleII/Chapter201D. Published 2017. Accessed March 31, 2017.
10. American Bar Association Commision on Law and Aging. Default Surrogate Consent Statutes. Am Bar Assoc. 2016:1-17.
11. Massachusetts General Laws. Chapter 190B: Massachusetts Probate Code. https://malegislature.gov/Laws/GeneralLaws/PartII/TitleII/Chapter190B. Published 2017. Accessed March 31, 2017.
12. Rosman M, Rachminov O, Segal O, Segal G. Prolonged patients’ in-hospital waiting period after discharge eligibility is associated with increased risk of infection, morbidity and mortality: a retrospective cohort analysis. BMC Health Serv Res. 2015;15:246. PubMed
13. Majeed MU, Williams DT, Pollock R, et al. Delay in discharge and its impact on unnecessary hospital bed occupancy. 2012. PubMed
14. Nobili A, Licata G, Salerno F, et al. Polypharmacy, length of hospital stay, and in-hospital mortality among elderly patients in internal medicine wards. The REPOSI study. Eur J Clin Pharmacol. 2011;67(5):507-519. PubMed
15. Chen JJ, Finn CT, Homa K, St Onge KP, Caller TA. Discharge delays for patients requiring in-hospital guardianship: A Cohort Analysis. J Healthc Qual. 2016;38(4):235-242. PubMed
16. Chen JJ, Kwon A, Stevens Y, Finn CT. Barriers beyond clinical control affecting timely hospital discharge for a patient requiring guardianship. Psychosomatics. 2015;56(2):206-209. PubMed
17. Chen JJ, Blanchard MA, Finn CT, et al. A clinical pathway for guardianship at dartmouth-hitchcock medical center. Jt Comm J Qual Patient Saf. 2014;40(9):389-397. PubMed
18. McEachern R, Campbell Jr GD. Hospital-Acquired Pneumonia: Epidemiology, Etiology, and Treatment. Infect Dis Clin North Am. 1998;12(3):761-779. PubMed
19. Zimlichman E, Henderson D, Tamir O, et al. Health care–associated infections. JAMA Intern Med. 2013;173(22):2039. PubMed
A central tenet of modern medicine is that patients must provide fully informed consent to receive or refuse medical care offered by their clinical teams.1–4 If a patient is unable to make and communicate a choice or clearly indicate an understanding of the information presented, then he or she is considered to lack the capacity to make medical decisions and the medical team must seek consent from the patient’s surrogate decision-maker.2-7 Every U.S. state recognizes a patient’s healthcare proxy (HCP) and a court-appointed guardian as a legally recognized surrogate.8,9 Most of the states also have statutes or regulations establishing a hierarchy of legally recognized surrogate decision-makers in the absence of a HCP or a court-appointed guardian, such as spouses, adult children, parents, siblings, and grandparents.8,10 In states that do not have such a statute, hospitals develop their own institutional policies for surrogate decision-making.
However, there are important limitations on the authority of these surrogate decision-makers.10 For instance, patients may not have a family member or a friend to serve as a surrogate decision-maker, often family members cannot override a patient’s objection, even when that patient lacks decision-making capacity, and certain decisions require a guardian or a HCP.8-10 In these circumstances, the hospital must petition a court to appoint a guardian as a legally recognized surrogate decision-maker. This can be an involved family member, if one exists, or an independent, typically volunteer, guardian.11 The process of guardian appointment is complex7,11 and can range from a few days to more than a month, largely dependent on court dates and finding a volunteer guardian. Much of the process occurs during the patient’s hospital stay. This prolongation of hospitalization would be expected to increase health care costs and iatrogenic complications,12–14 but data quantifying these for patients requiring guardianship are lacking. The goal of this study was to describe the characteristics of patients who undergo the process of guardianship and measure the associated burdens. These burdens include the financial costs to the medical system, the prolonged length of stay beyond medical necessity, and the costs to the patient in the form of hospital-acquired complications. Investigating the burden of guardianship is an important first step in uncovering opportunities to improve the process. We hypothesized that patients requiring guardianship would have lengths of stay and healthcare costs that were at least as large as those for patients whose conditions required similar durations of hospitalization prior to medical clearance, in part due to iatrogenic complications that would accrue while awaiting guardian appointment.
METHODS
Setting
We conducted a retrospective matched cohort study of adult inpatients at Beth Israel Deaconess Medical Center (BIDMC), a 651-bed academic, tertiary care facility in Boston, MA. The study was approved by the BIDMC Institutional Review Board as a nonhuman subject research consistent with hospital operations.
Population
For this matched cohort study, we identified case patients as those hospitalized for any reason for whom guardianship proceedings were initiated and obtained; only the first hospitalization during which the guardianship was pursued was used. Cases were identified by obtaining the data of all patients for whom the BIDMC general counsel completed the process of guardianship between October 2014 and September 2015. At BIDMC, all the guardianship proceedings are referred to the general counsel.
To determine the postclearance experience for referred patients compared with that for other patients with similar lengths of stay up to those of the referred patients’ point of clearance, we identified up to three matched controls for each case (Supplemental Figure 1). Medical clearance was defined as the date when the patient was medically stable to be discharged from the hospital, and it was determined in an iterative manner. We identified controls as hospitalized patients admitted for any cause and matched to the cases requiring guardianship on discharging service and length of stay prior to clearance. Specifically, we identified patients on the same service as the case whose length of stay was at least as long as the length of stay of the case patient until medical clearance, as defined below. We then determined the total and the excess length of stay, defined as the duration beyond clearance for each case referred for guardianship; for controls, the ‘excess’ length of stay was the number of hospitalized days beyond the corresponding time that a matched case had been provided clearance. To account for seasonal influences and the training level of house officers, we selected the three controls whose discharge date was closest (before or after) to the discharge date of their matched case.
From legal team files, we identified 61 patients hospitalized at BIDMC for whom new guardianship was pursued to completion. Of these 61 patients, 10 could not be matched to an appropriate control and were included in descriptive analyses but not in comparisons with controls.
Covariates and Outcomes
We collected the details regarding age, gender, primary language, highest level of education, marital status, insurance status, race, date of admission, date of discharge, discharge disposition, principal diagnosis, case mix index (CMI), and discharging service from our administrative and billing data. Outcomes of interest included length of stay and total hospital charges that were collected from the same databases. We used hospital charges, rather than payments, to ensure uniformity across payers.
Chart Review
Unique to cases, a team of two medical residents (JP, RP) and a hospitalist (DR) determined the date of medical clearance and hospital-associated complications by a chart review. The date of medical clearance was then used to calculate excess length of stay, ie, the duration of stay beyond the date of medical clearance, by subtracting the time to medical clearance from the total inpatient length of stay.
We developed a novel algorithm to determine the date of medical clearance consistently (Figure 1). We first determined whether the discharge summary indicated a clear date of medical readiness for discharge. If the discharge summary was unclear, then a case management or a social work note was used. The date of medical clearance determined by the case management or the social work note was then confirmed with clinical data. The date was confirmed if there were no significant laboratory orders and major medication changes or procedures for 24 h from the date identified. If notes were also inconclusive, then the medical clearance was determined by a review of provider order entry. Medical readiness for discharge was then defined as the first day when there were no laboratory orders for 48 h and no significant medication changes, imaging studies, or microbiologic orders.
Hospital-acquired complications were determined to be related to the guardianship process if they occurred after the date of medical stability but prior to discharge. We did not investigate hospital-acquired complications among controls. Hospital-acquired complications were defined as follows:
- Catheter-associated urinary tract infection (CAUTI): active Foley catheter order and positive urine culture that resulted in antibiotic administration.
- Hospital-acquired pneumonia (HAP): chest X-ray or computed tomography (CT) scan showing a consolidation that resulted in antibiotic administration.
- Venous thromboembolism (VTE): positive venous ultrasound or CT angiography of the chest for deep venous thrombosis (DVT) or pulmonary embolism (PE).
- Decubitus ulcer: new wound care consultation for sacral decubitus ulceration.
- Clostridium difficile (C. diff) infection: positive stool polymerase chain reaction that resulted in antibiotic administration.
The algorithm for identifying the date of clearance and the presence of complications was piloted independently by three investigators (RP, JP, DR) using a single chart review and was redesigned until a consensus was obtained. The same three investigators then independently reviewed three additional charts, including all notes, laboratory results, imaging results, and orders, with complete agreement for both date of clearance and presence of complications. Two investigators (RP, JP) then individually reviewed the remaining 57 charts. Of these, 10 were selected a priori for review by both investigators for interrater reliability, with a mean difference of 0.5 days in the estimated time to clearance and complete concordance in complications. In addition, a third investigator (DR) independently reread 5 of the 57 reviewed charts, with complete concordance in both time to clearance and presence of complications with the original readings.
Statistical Analysis
SAS 9.3 was used for all analyses (SAS Institute Inc., Cary, NC, USA).
We first examined the demographic and clinical characteristics of all 61 patients who underwent guardianship proceedings. Second, we described the primary outcomes of interest–length of stay, costs, and likelihood of complications–in this series of patients with associated 95% confidence intervals.
Third, we examined the associations between guardianship and length of stay and healthcare costs using generalized estimating equations with clustering by matched set and compound symmetry. For length of stay, we specifically assessed excess length of stay (the matching variable) to avoid immortal time bias; we also examined the total length of stay. For all regression analyses, we adjusted for the following covariates: age, gender, education, marital status, race/ethnicity, CMI, insurance status, discharging service, and principal diagnosis. To maximize normality of residuals, costs were log-transformed; length of stay beyond clearance was log-transformed after addition of 1. For both outcomes, we back-transformed the regression coefficients and presented percent change between case and control patients. All reported tests are two-sided.
RESULTS
A total of 61 guardianship cases and 118 controls were included in the analysis.
General Characteristics
The characteristics of all cases prior to matching are included in Table 1. The department of internal medicine discharged the largest proportion of cases, followed by neurosurgery and neurology departments. More than 65% of cases were insured by Medicare or Medicaid. Three-quarters of cases were discharged from the hospital to another medical facility, with about half discharged to a skilled nursing facility (SNF) or a rehabilitation center and one-quarter to a long-term acute care hospital (LTACH).
The median length of stay for patients requiring guardianship was 28 (range, 23-36) days, and the median total charges were $171,083 ($106,897-$245,281), with a total cost approximating $10.9 million for these patients. Regarding hospital-acquired complications, 10 (16%; 95% confidence interval, 8%–28%) unique cases suffered from a complication, with HAP being the most frequently (n = 5) occurring complication.
Comparison with Matched Controls
No statistically significant differences were observed between cases and controls in terms of age, primary language, highest level of education, ethnicity, insurance status, or discharging service as shown in Table 2; discharging service was a matched variable and comparable by design. However, cases tended to be less likely to be married and had a higher CMI.
When compared with control patients in terms of similar services who stayed for at least as long as their duration to clearance, the cases had significantly longer lengths of stay compared to those of controls (29 total days compared to 18 days, P < .001; Figure 2). In addition, cases incurred significantly higher median total charges ($168,666) compared to those of controls ($104,190; P = .02).
After accounting for potential confounders, including age, gender, language, education, marital status, discharging service, ethnicity, insurance status, CMI, and principal diagnosis, guardianship was associated with 58% higher excess length of stay (P = .04, 95% CI [2%-145%]). Furthermore, guardianship was associated with 23% higher total charges (P = .02, 95% CI [4%-46%]) and 37% longer total length of stay (P = .002, 95% CI [12%-67%]).
DISCUSSION
To our knowledge, this is among the first studies to investigate healthcare costs and harm to the patient in the form of hospital-associated complications as a result of guardianship proceedings. Other studies15,16 have also demonstrated excessive length of stay attributed to nonclinical factors such as guardianship, though they did not quantify the excess stay or compare guardianship cases with a matched control. One study17 demonstrated total charges of $150,000 per patient requiring guardianship, which are similar to our results. However, Chen et al. also observed an average of 27.8 medically unnecessary days, which are 16 more days than those in our study sample. This may reflect the difference in how excess days were determined, namely, statistical process control analysis in the previous study compared with a manual chart review in our study. To our knowledge, no other study has compared guardianship cases with matched controls to compare their experiences to patients with similarly prolonged stays prior to clearance.
After matching by service and the length of stay until medical clearance in each guardianship case, the subsequent length of stay was higher among cases than among controls, even after adjustment for differences in CMI and diagnosis. This suggests that the process of obtaining guardianship results in a particularly prolonged length of stay, which is presumably attributable to factors other than medical complexity or ongoing illness.
It is probable that at least two interrelated mechanisms are responsible for the particularly high costs and the long stay of patients who require guardianship. First, the process of obtaining guardianship is itself protracted in several cases, necessitating long-term admissions well beyond the point of medical stability. Second, our results suggest that longer hospital stays are apt to grow further in a feed-forward cycle due to hospital-acquired complications that develop after the date of medical clearance. Indeed, in our series, 16% of patients sustained a complication that is readily attributable to hospital care after their date of clearance, and these types of complications are likely to lengthen the stay even further.
We compared cases referred for guardianship to control patients on the same services, at similar time points, whose length of stay was at least as long as the point of medical clearance as their corresponding case patient. Because cases were hospitalized with active medical needs to at least the point of clearance, we anticipated that costs might well be lower among cases, who had no medical necessity for hospitalization at the point of clearance, compared with controls who remained hospitalized presumably for active medical needs. Counter to this hypothesis, and accounting for potentially confounding variables, undergoing a guardianship proceeding was associated with nearly 25% higher costs of patient care. This may ultimately represent a substantial burden on the healthcare system. For example, in just 1 year in our hospital, the total hospital charges reached almost $11 million for the 61 patients who underwent guardianship proceedings. Considering that 65% of the patients requiring guardianship had Medicaid or Medicare coverage, there are significant financial implications for the hospital systems and to the public.
Limitations of our study relate to its retrospective nature at a single center. Investigating guardianship cases at a single center and with a small sample size of 61 patients limits generalizability. Nevertheless, we still had enough power to detect significant differences compared with matched controls, and this study remains the largest investigation into the cost associated with guardianship to date and the only study comparing guardianship cases with matched controls. Furthermore, we did not complete chart reviews of controls, which limits direct comparisons of complications and precluded our matching on variables that required detailed review.
The retrospective design may include confounders unaccounted for in our statistical design, though we attempted to match cases with controls to account for some of these potential differences and included a broad set of covariates that included measures of comorbidity and diagnosis. To this point, we included only CMI and principal diagnosis as the measures of severity, and adjustment for CMI, which includes features of the index hospitalization itself, may represent overadjustment. However, this type of overadjustment would tend to bias toward the null hypothesis.
Investigators only completed chart reviews for cases, which limits our ability to contrast the rate of hospital-associated complications for cases with that of controls. However, the rates of CAUTI and HAP complications among our cases were notably higher than national inpatient estimates, ie, 5% and 8% compared to 0.2%18 and 0.5%-1%,19 respectively. Furthermore, we demonstrated higher total costs and total lengths of stay among guardianship patients, analyses for which the attributed date of clearance for controls was not required, and the rate of complications among the case patients was sizable despite their being formally medically cleared. In other words, regardless of whether a complication rate of 16% is “typical” for inpatients hospitalized for these durations, this suggests that persistent hospitalization after clearance does not carry a benign prognosis.
In addition, to estimate healthcare costs, we relied on total hospital charges, which are readily available and reflect, at least in part, payer costs but do not reflect true costs to the medical center. Nonetheless, charges approximately reflect costs–with some variation across cost centers–and hence provide a useful metric for comparing cases and controls. To provide context, for academic medical centers such as ours, costs are typically about half of charges.
Finally, each state has different statutes for surrogate decision-making. The results of this study reflect the Massachusetts’ experience, with no public guardianship program or hierarchy statute. That being said, while this presumably causes the need for more guardianships in Massachusetts, the mechanisms for guardianship are broadly similar nationwide and are likely to result in excessive length of stay and cost similar to those in our population, as demonstrated in studies from other states.7,15–17
Implications
At a time where medical systems are searching for opportunities to reduce the length of stay, prevent unnecessary hospitalization, and improve the quality of care, reevaluating the guardianship process is ripe with opportunity. In this single academic center, the process of guardianship was associated with 58% excess length of stay and 23% higher total hospital charges. Furthermore, one in six patients requiring guardianship suffered from hospital-associated complications.
This matched cohort study adds quantitative data demonstrating substantial burdens to the healthcare system as a result of the guardianship process and can be used as an impetus for hospital administration and legal systems to expedite the process. Potential improvements include increasing HCP form completions (which would eliminate the need to pursue guardianship for most of such patients), identifying patients who lack a legally recognized surrogate decision-maker earlier in their hospital stay (ideally upon admission), and providing resources to assist clinical teams in the completion of affidavits necessary to support the appointment of a guardian, so that paperwork can be filed with courts sooner. Further research that provides more generalizable prospective data could potentially improve the guardianship process and reduce its burden on hospitals and patients even further.
Acknowledgments
The authors express their tremendous thanks to Gail Piatkowski for her invaluable assistance in collecting administrative and billing data.
Disclosures
The authors report no conflicts of interest. The authors alone are responsible for the content and writing of the article
1. O’Neill O. Autonomy and Trust in Bioethics. Cambridge: Cambridge University Press; 2002. PubMed
2. Beauchamp T, Childress J. Principles of Biomedical Ethics. 7th ed. New York: Oxford University Press; 2013.
3. McMurray RJ, Clarke OW, Barrasso JA, et al. Decisions near the end of life. J Am Med Assoc. 1992;267(16):2229-2233.
4. American Medical Association. AMA Principles of Medical Ethics: Chapter 2 - Opinions on Consent, Communication and Decision Making.; 2016.
5. Arnold RM, Kellum J. Moral justifications for surrogate decision making in the intensive care unit: Implications and limitations. Crit Care Med. 2003;31(Supplement):S347-S353. PubMed
6. Karp N, Wood E. Incapacitated and Alone: Healthcare Decision Making for Unbefriended Older People. Am Bar Assoc Hum Rights. 2003;31(2).
7. Bandy RJ, Helft PR, Bandy RW, Torke AM. Medical decision-making during the guardianship process for incapacitated, hospitalized adults: a descriptive cohort study. J Gen Intern Med. 2010;25(10):1003-1008. PubMed
8. Wynn S. Decisions by surrogates: an overview of surrogate consent laws in the United States. Bifocal. 2014;36(1):10-14.
9. Massachusetts General Laws. Chapter 201D: Health Care Proxies. https://malegislature.gov/Laws/GeneralLaws/PartII/TitleII/Chapter201D. Published 2017. Accessed March 31, 2017.
10. American Bar Association Commision on Law and Aging. Default Surrogate Consent Statutes. Am Bar Assoc. 2016:1-17.
11. Massachusetts General Laws. Chapter 190B: Massachusetts Probate Code. https://malegislature.gov/Laws/GeneralLaws/PartII/TitleII/Chapter190B. Published 2017. Accessed March 31, 2017.
12. Rosman M, Rachminov O, Segal O, Segal G. Prolonged patients’ in-hospital waiting period after discharge eligibility is associated with increased risk of infection, morbidity and mortality: a retrospective cohort analysis. BMC Health Serv Res. 2015;15:246. PubMed
13. Majeed MU, Williams DT, Pollock R, et al. Delay in discharge and its impact on unnecessary hospital bed occupancy. 2012. PubMed
14. Nobili A, Licata G, Salerno F, et al. Polypharmacy, length of hospital stay, and in-hospital mortality among elderly patients in internal medicine wards. The REPOSI study. Eur J Clin Pharmacol. 2011;67(5):507-519. PubMed
15. Chen JJ, Finn CT, Homa K, St Onge KP, Caller TA. Discharge delays for patients requiring in-hospital guardianship: A Cohort Analysis. J Healthc Qual. 2016;38(4):235-242. PubMed
16. Chen JJ, Kwon A, Stevens Y, Finn CT. Barriers beyond clinical control affecting timely hospital discharge for a patient requiring guardianship. Psychosomatics. 2015;56(2):206-209. PubMed
17. Chen JJ, Blanchard MA, Finn CT, et al. A clinical pathway for guardianship at dartmouth-hitchcock medical center. Jt Comm J Qual Patient Saf. 2014;40(9):389-397. PubMed
18. McEachern R, Campbell Jr GD. Hospital-Acquired Pneumonia: Epidemiology, Etiology, and Treatment. Infect Dis Clin North Am. 1998;12(3):761-779. PubMed
19. Zimlichman E, Henderson D, Tamir O, et al. Health care–associated infections. JAMA Intern Med. 2013;173(22):2039. PubMed
© 2018 Society of Hospital Medicine
Development of Hospitalization Resource Intensity Scores for Kids (H-RISK) and Comparison across Pediatric Populations
Hospitals are increasingly assessed comparatively in terms of costs and quality for benchmarking purposes. These comparisons can be used by patients and families to determine where to seek care, to report compliance and grant certifications by oversight organizations (eg, Leapfrog, Magnet, Joint Commission), and by payers, to determine reimbursement models and/or to assess financial penalty or bonuses for underperforming or overperforming hospitals. As these efforts can cause substantial reputational and financial consequences for hospitals, these metrics must be contextualized within the population of patients that each hospital serves.
In adult Medicare patient populations, methods have been developed to assess the relative severity of a hospital’s full complement of patients.1,2 These methods assume a relationship between severity and hospital resource intensity (ie, cost) and typically assume the form of relative weights (RWs), which are developed for clinically similar groups of patients (eg, Medicare Diagnosis Related Groups; MS-DRG) from a reference population. A RW for each MS-DRG is calculated as the average cost of patients within the group divided by the average cost for all patients in the reference population. These weights are then applied to a hospital’s discharges over a specific time period and averaged to obtain a hospital-level case-mix index (CMI). A value of 1 indicates that a hospital serves a mix of patients with similar severity (or resource intensity) to that of an “average” hospital discharge in the reference population, whereas a value of 1.2 indicates that a hospital serves a population of patients with 20% more severity than that of an “average” hospital discharge. Since 1983, the Centers for Medicare and Medicaid Services (CMS) has used RWs in their inpatient prospective payment system.3
Similar pediatric methods are less developed and necessitate special consideration as the use of existing weights may be inappropriate for a pediatric population. First, MS-DRGs were developed primarily for the Medicare population and lack sufficient granularity for pediatric populations, specifically newborns. Second, a severity stratification which incorporates important patient characteristics, such as age in pediatrics, does not exist in the MS-DRG system . Finally, although the reference populations that are used to develop MS-DRG weights do not explicitly exclude children, children typically account for approximately 15% of hospitalizations (6% excluding neonatal/maternal) and possibly feature different utilization patterns than adults with similar conditions. Thus, weights developed from a combined pediatric/adult reference population primarily reflect an adult population.
With valid pediatric RWs, stakeholders can assess a hospital’s severity mix of patients in a comparable fashion and contextualize outcome metrics. Additionally, these same weights can be used to estimate expected costs for hospitalizations or for risk adjusting various outcomes at the discharge- or hospital-level. Thus, we sought to develop hospitalization resource intensity scores for kids (H-RISK) using pediatric-specific weights and compare hospital-level CMIs across various hospital types and locations as an example of the application of this novel methodology.
METHODS
Dataset
Data for this analysis were obtained from the 2012 Healthcare Cost and Utilization Project (HCUP) Kids’ Inpatient Database (KID).4 KID is the largest publicly available all-payer inpatient administrative database in the United States and is sponsored by the Agency for Healthcare Research and Quality as part of the HCUP. The 2012 KID included a sample of approximately 3.2 million discharge records of children <21 years old from 44 states and 4,179 community, nonrehabilitation hospitals weighted for national estimates.
Hospital discharge costs were estimated from charges using cost-to-charge ratios (CCR) provided by HCUP as a supplement to the 2012 KID.5 Cost estimates associated with a specific discharge were estimated by multiplying the total charges reported in the data by the appropriate hospital-specific CCR and then adjusted for price factors beyond a hospital’s control using the area wage index also provided by HCUP as a supplement.
H-RISK and Case-Mix Index Calculations
We calculated H-RISK as pediatric-specific RWs based on version 30 of 3M’s All Patient Refined DRG (APR-DRG; 3M Health Information Systems, Salt Lake City, Utah) system as a measure of resource intensity. The APR-DRG system classifies hospital discharges into over 300 base DRGs based on demographic, diagnostic, and therapeutic characteristics. Each APR-DRG is further sub-divided into 4 subclasses of severity of illness (SOI; eg, minor, moderate, major, and extreme) to indicate the intensity of resource utilization during hospitalization. However, SOI levels for differing APR-DRGs are not comparable.
For every APR-DRG SOI combinations available in the 2012 KID, calculation of RW was based on the ratio of the mean cost for patients assigned to a particular APR-DRG SOI compared with the mean cost for all patients in the database. Inpatient costs less than $0.50 were set to missing and removed from analysis. Mortalities and discharges with missing CCR and wage index values were also excluded from analysis. We required that estimates for RWs be based on a reasonable set of data (ie, 10 or more discharges) for each APR-DRG SOI, and that estimates across the 4 SOI levels within an APR-DRG be monotonically nondecreasing (ie, as SOI level increases, weights must either be the same or increasing). Winsorized means were used as point estimates for mean cost in both the numerator and denominator of RW computation. Winsorizing refers to an analytic transformation by which the influence of outliers (eg, values beyond a certain threshold) is mitigated by replacing the value of outliers with the value of the threshold. We used the 5th and 95th percentiles as thresholds for Winsorizing our point estimates.
Winsorized point estimates failing to meet the minimum sample size of 10 or nondecreasing monotonicity requirement were modified by one of the two following methods:
- Cost data were modeled using a generalized linear model assuming an exponential distribution. Covariates in the model included APR-DRG and SOI within APR-DRG as a continuous variable. Where applicable, Winsorized estimates of the mean were replaced with modeled estimates.
- Data from an APR-DRG SOI in question were combined with other SOIs within the same APR-DRG with the closest Winsorized mean value. Once data were combined, a common Winsorized value was re-computed and values across SOIs were checked to ensure that nondecreasing monotonicity was maintained. In some APR-DRGs with sparse data, this involved combining pairs of severity levels; in others, it involved combining three or four severity levels together.
For APR-DRGs in which no discharges at any SOI were recorded in the 2012 KID, we used the Winsorized mean of all encounters with a common major diagnostic category (MDC) as the missing APR-DRG as point estimate for all 4 SOI levels.
To calculate the CMI for a set of discharges (eg, discharges at a hospital in a year), RWs were assigned to each discharge based on APR-DRG SOI designation. Consequently, all discharges from a specific APR-DRG SOI were assigned the same RW. Once RWs were assigned, CMI was calculated as the mean RW across all discharges. To compare hospital types based on acute-care hospital stays which are usually considered with the realm of pediatric care, we excluded RWs for normal newborns, defined as APR-DRG 626 (neonate birthweight of 2000–2499 g, normal newborn or neonate with other problems) and 640 (neonate birthweight >2499 g, normal newborn or neonate with other problems), and maternal hospitalizations, defined as APR-DRG 540 (cesarean delivery) and 560 (vaginal delivery), from our CMI calculations.
Statistical Methodology
Categorical variables were summarized using frequencies and percentages; continuous variables were summarized using medians and interquartile ranges. Differences between hospital
types (eg, rural, urban nonteaching, urban teaching, and
free-standing) were assessed using a Chi-square test for association for categorical variables. Differences in continuous variables including comparisons of neonatal (MDC 15) and nonneonatal discharges, and medical versus procedural discharges as defined by the APR-DRG grouper were assessed using a Kruskal–Wallis test. All analyses were performed using SAS, Version 9.4 (SAS Institute, Cary, North Carolina); P values <.05 were considered statistically significant.
This study was considered nonhuman subjects research by the Institutional Review Board of Vanderbilt University Medical Center.
RESULTS
Patient Population
Table 1 summarizes the patient characteristics for all 4 hospital types. All comparisons of patient characteristics across the four hospital types are significant (P < .001). Of the 6,675,222 weighted discharges in HCUP KID 2012, almost two-thirds were less than one year old (4,269,984). Three-quarters of those infant discharges (3,733,760) were in-hospital births. The South was the Census region with the most number of discharges (38.8%), and over half of discharges (53.2%) included patients who lived in metro areas with more than 1 million residents. Patients disproportionately originated from lower-income areas with 30.9% living in zip codes with median incomes in the first quartile.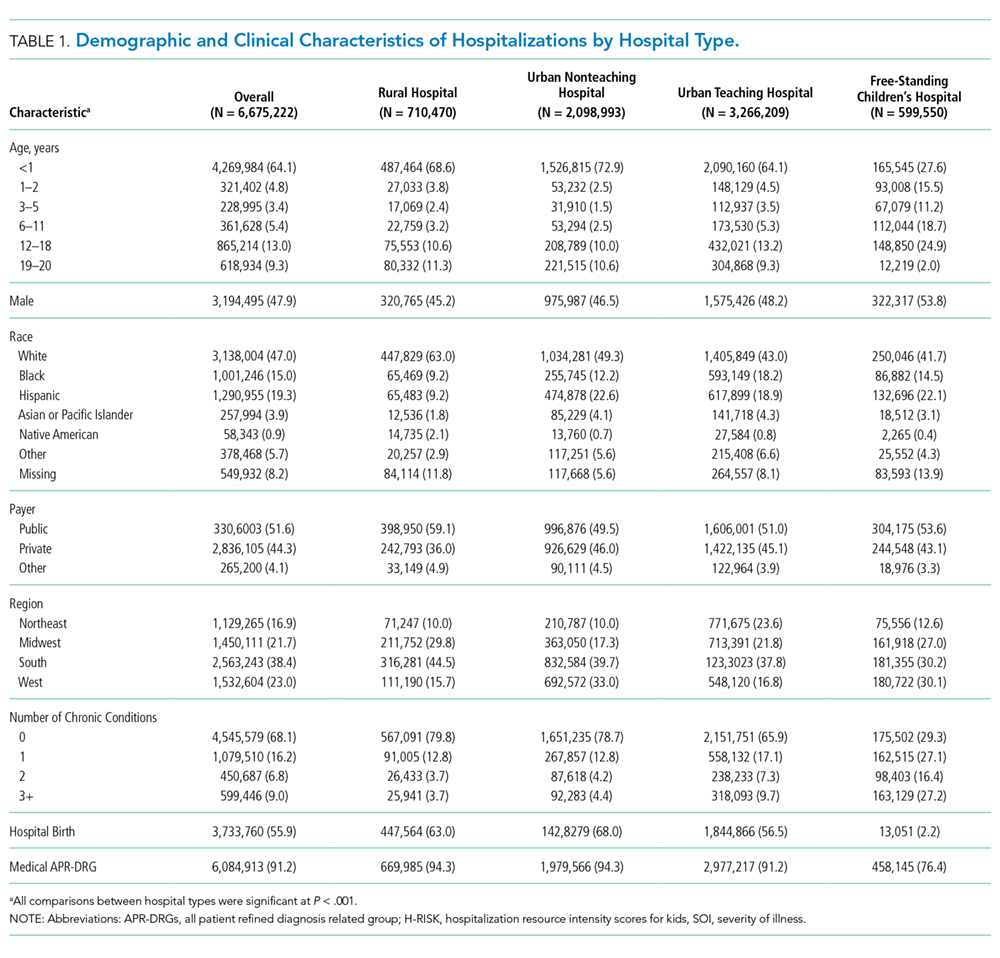
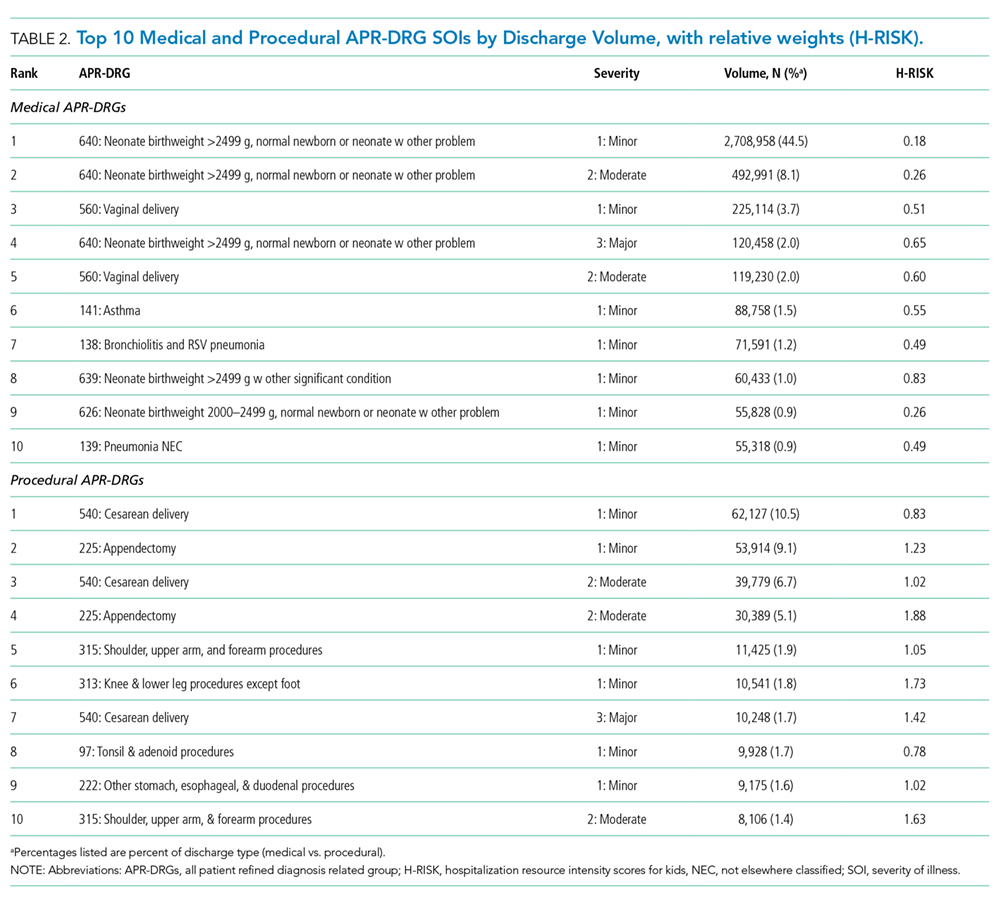
H-RISK Generation
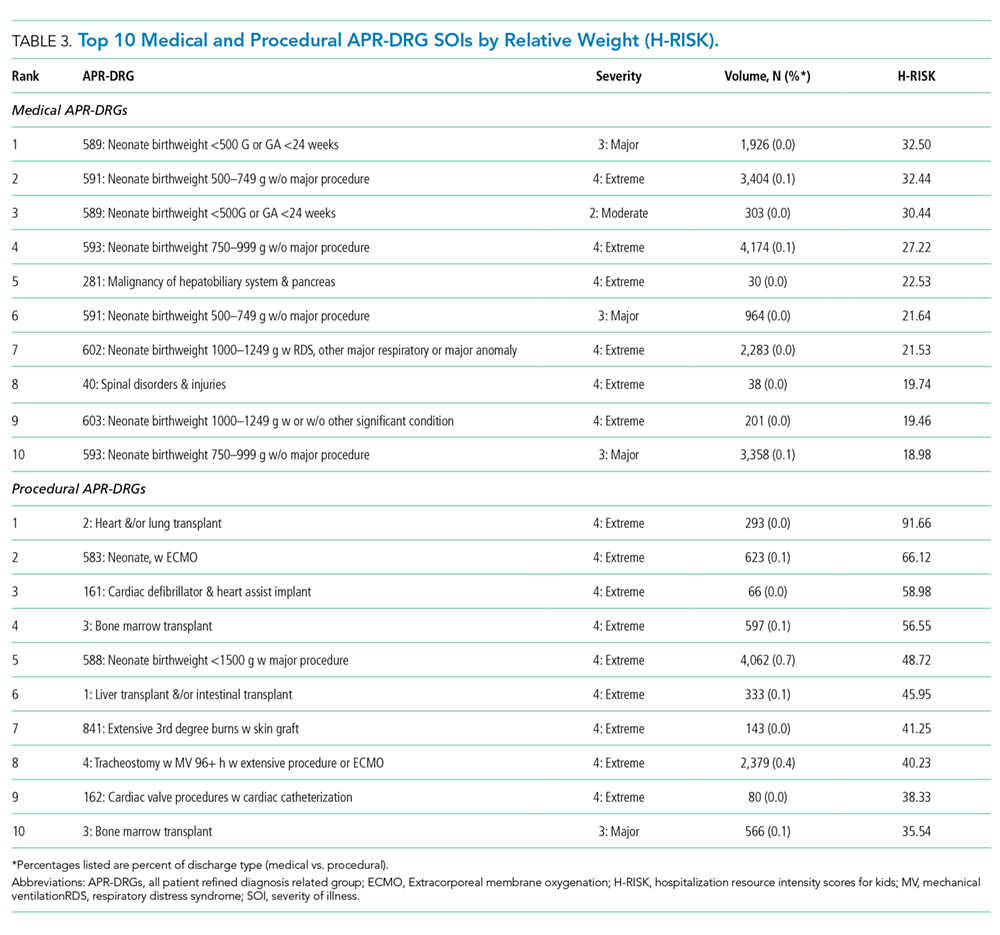
The weighted Winsorized mean cost of all discharges was $6,135 per discharge. The majority of cost-based H-RISK were higher than 1, with 1,038 (82.5%) of APR-DRG SOIs incurring an estimated cost higher than $6,135. Solid organ and bone marrow transplantations represented 4 of the 10 highest cost-based RWs for procedural APR-DRG SOIs (Table 3). Neonatal APR-DRG SOIs accounted for 8 of the 10 highest medical RWs. A list of all APR-DRG SOIs and H-RISK can be found in Appendix A.
Hospital-Level Case-Mix Index for Acute Hospitalizations
After excluding normal newborn and maternal hospitalizations, median CMI of the 3117 hospitals with at least 20 unweighted discharges was 1.0 (interquartile range [IQR]: 0.8, 1.7). CMI varied significantly across hospital types (P < .001). Free-standing children’s hospitals exhibited the highest cost-based CMI (median: 2.7, IQR: 2.2–3.1), followed by urban teaching hospitals (median: 1.8, IQR: 1.3–2.6), urban nonteaching hospitals (median: 1.1, IQR: 0.9–1.5), and rural hospitals (median: 0.9, IQR: 0.7–0.9).
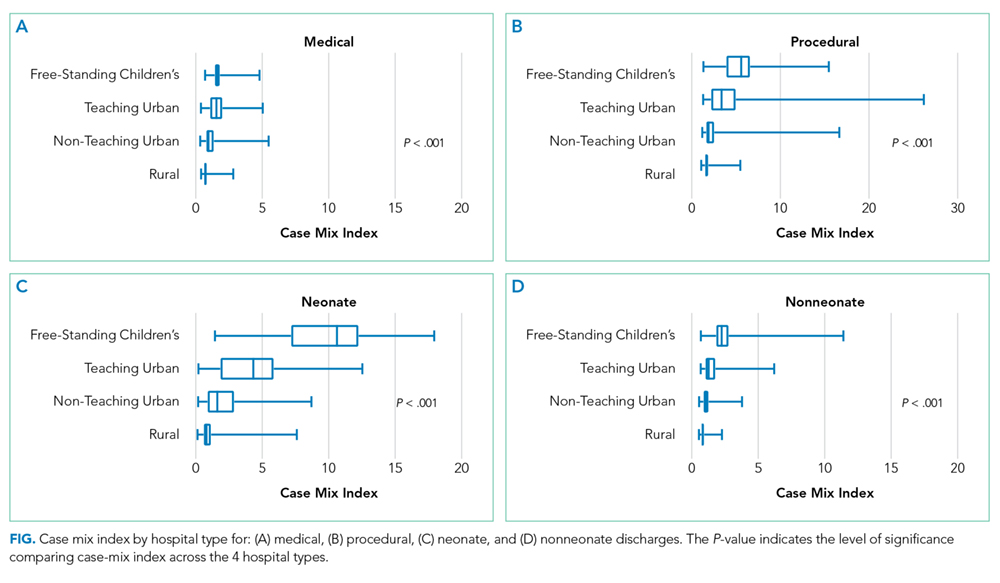
DISCUSSION
Currently, no widely available measures can compare the relative intensity of hospital care specific for inpatient pediatric populations. To meet this important need, we have developed a methodology to determine valid pediatric RWs (H-RISK) which can be used to estimate the intensity of care for applications across entire hospital patient populations and specific subpopulations. H-RISK allow calculation of CMIs for risk adjustment of various outcomes at the discharge- or hospital-level and for comparisons among hospitals and populations. Using this methodology, we demonstrated that the CMI for free-standing children’s hospitals was significantly higher than those of rural, urban, nonteaching and urban teaching hospitals for all discharges and medical or procedural subgroups.
CMS has used RWs based on DRGs since the inception of the prospective payment system in 1983. The sequence of DRGs used by CMS has purposely focused on older adult Medicare population, and CMS itself recommends applying Medicare-focused DRGs (MS-DRGs being the current iteration) only for the >65 year population.6 Nevertheless, many payers, both government and commercial, utilize MS-DRGs and their RWs for payment purposes when reimbursing children’s hospitals. The validity of using weights developed using this grouper in hospitals treating large numbers of pediatric patients and childhood illnesses has been called into question, particularly when such weights are used in reimbursement of children’s hospitals.7
Several factors contribute to the validity of a model for developing RWs. First, the system used to describe patient hospitalizations and illnesses should be appropriate to the population in question. As described above, the original DRG system and its subsequent iterations were designed to describe hospitalizations for adults >65 years of age.8, 9 Over the years, CMS DRGs incorporated rudimentary categories for neonatal and obstetrical hospitalizations. Still, the current MS-DRGs lack sufficient focus on common inpatient pediatric conditions to adequately describe pediatric hospitalizations, particularly those in free-standing children’s hospitals delivering tertiary and quaternary care. Thus, a more appropriate classification schema for developing RWs specific for pediatric hospitalization should include patients across the entire age spectrum. APR-DRGs represent one such classification system.
Once an appropriate patient classification system is selected, then the population of hospitalized patients to be used as the reference group becomes important. For a system targeting a pediatric inpatient population, a hospital discharge database representing a broad sample of pediatric hospitalizations offers the best basis for developing a system of weights applicable to different types of hospitals providing care for children. For this purpose, we selected the 2012 KID database, a nationally representative dataset containing data on newborn and pediatric discharges from the majority of states within the US. This choice assured that the RWs developed were based on and applicable to pediatric hospitalizations across the entire spectrum of SOI and resource intensity.
A number of measures of hospital performance and quality have been developed and are used by various entities, including individual hospitals, CMS, Leapfrog, Magnet, Joint Commission, and payers, for purposes ranging from benchmarking for improvement to payment models to reimbursement penalties. However, SOI of a hospital’s patient population influences not only the intensity of care that a hospital provides but also presents a potential impact on process and outcome measures. Thus, fair and appropriate measures must consider differences in SOI when comparing hospital performances. Using the weights derived in this paper, these adjustments can be possibly made at either the discharge- or hospital-level, depending on the application, and may include comparisons by hospital location, ownership, payer mix, or socioeconomic strata.
It is also common for hospitals to quantitatively express the uniqueness of services that they deliver to payers or the general public. A hospital-level CMI (derived as the average discharge weight for patients within a hospital) is one way that hospitals may differentiate themselves. This can be accomplished by considering the ratio of one hospital’s CMI to another hospital’s (or an average of a group of hospitals) as an expression of the relative intensity of services. For example, if hospital x has a CMI of 2.3, and hospital y has a CMI of 1.4, the population of children hospitalized at hospital x was 64.3% (1–2.3/1.4) more resource intensive than the children seen at hospital y.
This study should be considered in terms of several limitations. We used costs as the basis for determining intensity of service. Thus, the difference in cost structure among children’s hospitals and between children’s hospitals and other hospital types in the KID could have affected the final calculated weights. Also, the RWs calculated in this study rely on hospital discharge data. Thus, complications which were not “present on admission” and occurred during a hospitalization could have reflected poor quality of care yet still increase resource intensity as measured by total costs. Future studies should examine the potential impact of using present-on-admission diagnoses only for the APR-DRG grouping on the values of RWs. Significant variation may have existed among hospitals in resource utilization, and some hospitals may have exhibited significant overutilization of resources for the same conditions. However, as we used Winsorized means, the impact of potential outliers should have been reduced. Some APR-DRG-SOI combinations were seen mainly at children’s hospitals. Thus, cost structure and resource utilization practices of this subset of hospitals would have been the only contributors to weights for these patients. Given that the 2012 KID contained a broad representation of pediatric hospitalizations, with age 0–20 years, newborns accounted for the majority of total cases in the database. While providing a full range of pediatric weights, inclusion of these patients lowered the overall average RW. For this reason, we excluded normal newborn categories and maternal categories from analysis of CMI across hospital types and focused on acute-care hospitalizations. Lastly, as with any study relying on administrative data, there is always the possibility of coding errors or data entry errors in the reference dataset.
CONCLUSIONS
H-RISK can be used to risk adjust measures to account for severity differences across populations. These weights can also be averaged across hospitals’ patient populations to compare relative resource intensities of the patients served.
Disclosures
The authors have nothing to disclose.
1. Pettengill J, Vertrees J. Reliability and Validity in Hospital Case-Mix Measurement. Health Care Financ Rev. 1982; 4(2): 101-128. PubMed
2. Centers for Medicare & Medicaid Services. Details for title: Case Mix Index. https://www.cms.gov/Medicare/Medicare-Fee-for-Service-Payment/AcuteInpatientPPS/Acute-Inpatient-Files-for-Download-Items/CMS022630.html#. Accessed August 30, 2017.
3. Iglehart JK. Medicare begins prospective payment of hospitals. N. Engl. J. Med 1983; 308(23): 1428-1432. PubMed
4. Healthcare Cost Utilization Project. Overview of the Kids’ Inpatient Database (KID). 2017; https://www.hcup-us.ahrq.gov/kidoverview.jsp. Accessed August 30, 2017.
5. Healthcare Cost Utilization Project. Cost-to-Charge Ratio Files: 2012 Kids’ Inpatient Database (KID) User Guide. 2014; https://www.hcup-us.ahrq.gov/db/state/CCR2012KIDUserGuide.pdf. Accessed August 30, 2017.
6. Centers for Medicare & Medicaid Services. Medicare Program; Changes to the Hospital Inpatient Prospective Payment Systems and Fiscal Year 2005 Rates; Final Rule. Federal Register. 2004;69(154):48,939. PubMed
7. Muldoon JH. Structure and performance of different DRG classification systems for neonatal medicine. Pediatrics. 1999; 103(1 Suppl E): 302-318. PubMed
8. Averill R, Goldfield N, Muldoon J, Steinbeck B, Grant T. A Closer Look at All Patient Refined DRGs. J AHIMA. 2002; 73(1): 46-50. PubMed
9. Centers for Medicare & Medicaid Services. Design and development of the Diagnosis Related Group (DRG). https://www.cms.gov/ICD10Manual/version34-fullcode-cms/fullcode_cms/Design_and_development_of_the_Diagnosis_Related_Group_(DRGs)_PBL-038.pdf. Accessed December 6, 2017.
Hospitals are increasingly assessed comparatively in terms of costs and quality for benchmarking purposes. These comparisons can be used by patients and families to determine where to seek care, to report compliance and grant certifications by oversight organizations (eg, Leapfrog, Magnet, Joint Commission), and by payers, to determine reimbursement models and/or to assess financial penalty or bonuses for underperforming or overperforming hospitals. As these efforts can cause substantial reputational and financial consequences for hospitals, these metrics must be contextualized within the population of patients that each hospital serves.
In adult Medicare patient populations, methods have been developed to assess the relative severity of a hospital’s full complement of patients.1,2 These methods assume a relationship between severity and hospital resource intensity (ie, cost) and typically assume the form of relative weights (RWs), which are developed for clinically similar groups of patients (eg, Medicare Diagnosis Related Groups; MS-DRG) from a reference population. A RW for each MS-DRG is calculated as the average cost of patients within the group divided by the average cost for all patients in the reference population. These weights are then applied to a hospital’s discharges over a specific time period and averaged to obtain a hospital-level case-mix index (CMI). A value of 1 indicates that a hospital serves a mix of patients with similar severity (or resource intensity) to that of an “average” hospital discharge in the reference population, whereas a value of 1.2 indicates that a hospital serves a population of patients with 20% more severity than that of an “average” hospital discharge. Since 1983, the Centers for Medicare and Medicaid Services (CMS) has used RWs in their inpatient prospective payment system.3
Similar pediatric methods are less developed and necessitate special consideration as the use of existing weights may be inappropriate for a pediatric population. First, MS-DRGs were developed primarily for the Medicare population and lack sufficient granularity for pediatric populations, specifically newborns. Second, a severity stratification which incorporates important patient characteristics, such as age in pediatrics, does not exist in the MS-DRG system . Finally, although the reference populations that are used to develop MS-DRG weights do not explicitly exclude children, children typically account for approximately 15% of hospitalizations (6% excluding neonatal/maternal) and possibly feature different utilization patterns than adults with similar conditions. Thus, weights developed from a combined pediatric/adult reference population primarily reflect an adult population.
With valid pediatric RWs, stakeholders can assess a hospital’s severity mix of patients in a comparable fashion and contextualize outcome metrics. Additionally, these same weights can be used to estimate expected costs for hospitalizations or for risk adjusting various outcomes at the discharge- or hospital-level. Thus, we sought to develop hospitalization resource intensity scores for kids (H-RISK) using pediatric-specific weights and compare hospital-level CMIs across various hospital types and locations as an example of the application of this novel methodology.
METHODS
Dataset
Data for this analysis were obtained from the 2012 Healthcare Cost and Utilization Project (HCUP) Kids’ Inpatient Database (KID).4 KID is the largest publicly available all-payer inpatient administrative database in the United States and is sponsored by the Agency for Healthcare Research and Quality as part of the HCUP. The 2012 KID included a sample of approximately 3.2 million discharge records of children <21 years old from 44 states and 4,179 community, nonrehabilitation hospitals weighted for national estimates.
Hospital discharge costs were estimated from charges using cost-to-charge ratios (CCR) provided by HCUP as a supplement to the 2012 KID.5 Cost estimates associated with a specific discharge were estimated by multiplying the total charges reported in the data by the appropriate hospital-specific CCR and then adjusted for price factors beyond a hospital’s control using the area wage index also provided by HCUP as a supplement.
H-RISK and Case-Mix Index Calculations
We calculated H-RISK as pediatric-specific RWs based on version 30 of 3M’s All Patient Refined DRG (APR-DRG; 3M Health Information Systems, Salt Lake City, Utah) system as a measure of resource intensity. The APR-DRG system classifies hospital discharges into over 300 base DRGs based on demographic, diagnostic, and therapeutic characteristics. Each APR-DRG is further sub-divided into 4 subclasses of severity of illness (SOI; eg, minor, moderate, major, and extreme) to indicate the intensity of resource utilization during hospitalization. However, SOI levels for differing APR-DRGs are not comparable.
For every APR-DRG SOI combinations available in the 2012 KID, calculation of RW was based on the ratio of the mean cost for patients assigned to a particular APR-DRG SOI compared with the mean cost for all patients in the database. Inpatient costs less than $0.50 were set to missing and removed from analysis. Mortalities and discharges with missing CCR and wage index values were also excluded from analysis. We required that estimates for RWs be based on a reasonable set of data (ie, 10 or more discharges) for each APR-DRG SOI, and that estimates across the 4 SOI levels within an APR-DRG be monotonically nondecreasing (ie, as SOI level increases, weights must either be the same or increasing). Winsorized means were used as point estimates for mean cost in both the numerator and denominator of RW computation. Winsorizing refers to an analytic transformation by which the influence of outliers (eg, values beyond a certain threshold) is mitigated by replacing the value of outliers with the value of the threshold. We used the 5th and 95th percentiles as thresholds for Winsorizing our point estimates.
Winsorized point estimates failing to meet the minimum sample size of 10 or nondecreasing monotonicity requirement were modified by one of the two following methods:
- Cost data were modeled using a generalized linear model assuming an exponential distribution. Covariates in the model included APR-DRG and SOI within APR-DRG as a continuous variable. Where applicable, Winsorized estimates of the mean were replaced with modeled estimates.
- Data from an APR-DRG SOI in question were combined with other SOIs within the same APR-DRG with the closest Winsorized mean value. Once data were combined, a common Winsorized value was re-computed and values across SOIs were checked to ensure that nondecreasing monotonicity was maintained. In some APR-DRGs with sparse data, this involved combining pairs of severity levels; in others, it involved combining three or four severity levels together.
For APR-DRGs in which no discharges at any SOI were recorded in the 2012 KID, we used the Winsorized mean of all encounters with a common major diagnostic category (MDC) as the missing APR-DRG as point estimate for all 4 SOI levels.
To calculate the CMI for a set of discharges (eg, discharges at a hospital in a year), RWs were assigned to each discharge based on APR-DRG SOI designation. Consequently, all discharges from a specific APR-DRG SOI were assigned the same RW. Once RWs were assigned, CMI was calculated as the mean RW across all discharges. To compare hospital types based on acute-care hospital stays which are usually considered with the realm of pediatric care, we excluded RWs for normal newborns, defined as APR-DRG 626 (neonate birthweight of 2000–2499 g, normal newborn or neonate with other problems) and 640 (neonate birthweight >2499 g, normal newborn or neonate with other problems), and maternal hospitalizations, defined as APR-DRG 540 (cesarean delivery) and 560 (vaginal delivery), from our CMI calculations.
Statistical Methodology
Categorical variables were summarized using frequencies and percentages; continuous variables were summarized using medians and interquartile ranges. Differences between hospital
types (eg, rural, urban nonteaching, urban teaching, and
free-standing) were assessed using a Chi-square test for association for categorical variables. Differences in continuous variables including comparisons of neonatal (MDC 15) and nonneonatal discharges, and medical versus procedural discharges as defined by the APR-DRG grouper were assessed using a Kruskal–Wallis test. All analyses were performed using SAS, Version 9.4 (SAS Institute, Cary, North Carolina); P values <.05 were considered statistically significant.
This study was considered nonhuman subjects research by the Institutional Review Board of Vanderbilt University Medical Center.
RESULTS
Patient Population
Table 1 summarizes the patient characteristics for all 4 hospital types. All comparisons of patient characteristics across the four hospital types are significant (P < .001). Of the 6,675,222 weighted discharges in HCUP KID 2012, almost two-thirds were less than one year old (4,269,984). Three-quarters of those infant discharges (3,733,760) were in-hospital births. The South was the Census region with the most number of discharges (38.8%), and over half of discharges (53.2%) included patients who lived in metro areas with more than 1 million residents. Patients disproportionately originated from lower-income areas with 30.9% living in zip codes with median incomes in the first quartile.
H-RISK Generation
The weighted Winsorized mean cost of all discharges was $6,135 per discharge. The majority of cost-based H-RISK were higher than 1, with 1,038 (82.5%) of APR-DRG SOIs incurring an estimated cost higher than $6,135. Solid organ and bone marrow transplantations represented 4 of the 10 highest cost-based RWs for procedural APR-DRG SOIs (Table 3). Neonatal APR-DRG SOIs accounted for 8 of the 10 highest medical RWs. A list of all APR-DRG SOIs and H-RISK can be found in Appendix A.
Hospital-Level Case-Mix Index for Acute Hospitalizations
After excluding normal newborn and maternal hospitalizations, median CMI of the 3117 hospitals with at least 20 unweighted discharges was 1.0 (interquartile range [IQR]: 0.8, 1.7). CMI varied significantly across hospital types (P < .001). Free-standing children’s hospitals exhibited the highest cost-based CMI (median: 2.7, IQR: 2.2–3.1), followed by urban teaching hospitals (median: 1.8, IQR: 1.3–2.6), urban nonteaching hospitals (median: 1.1, IQR: 0.9–1.5), and rural hospitals (median: 0.9, IQR: 0.7–0.9).
DISCUSSION
Currently, no widely available measures can compare the relative intensity of hospital care specific for inpatient pediatric populations. To meet this important need, we have developed a methodology to determine valid pediatric RWs (H-RISK) which can be used to estimate the intensity of care for applications across entire hospital patient populations and specific subpopulations. H-RISK allow calculation of CMIs for risk adjustment of various outcomes at the discharge- or hospital-level and for comparisons among hospitals and populations. Using this methodology, we demonstrated that the CMI for free-standing children’s hospitals was significantly higher than those of rural, urban, nonteaching and urban teaching hospitals for all discharges and medical or procedural subgroups.
CMS has used RWs based on DRGs since the inception of the prospective payment system in 1983. The sequence of DRGs used by CMS has purposely focused on older adult Medicare population, and CMS itself recommends applying Medicare-focused DRGs (MS-DRGs being the current iteration) only for the >65 year population.6 Nevertheless, many payers, both government and commercial, utilize MS-DRGs and their RWs for payment purposes when reimbursing children’s hospitals. The validity of using weights developed using this grouper in hospitals treating large numbers of pediatric patients and childhood illnesses has been called into question, particularly when such weights are used in reimbursement of children’s hospitals.7
Several factors contribute to the validity of a model for developing RWs. First, the system used to describe patient hospitalizations and illnesses should be appropriate to the population in question. As described above, the original DRG system and its subsequent iterations were designed to describe hospitalizations for adults >65 years of age.8, 9 Over the years, CMS DRGs incorporated rudimentary categories for neonatal and obstetrical hospitalizations. Still, the current MS-DRGs lack sufficient focus on common inpatient pediatric conditions to adequately describe pediatric hospitalizations, particularly those in free-standing children’s hospitals delivering tertiary and quaternary care. Thus, a more appropriate classification schema for developing RWs specific for pediatric hospitalization should include patients across the entire age spectrum. APR-DRGs represent one such classification system.
Once an appropriate patient classification system is selected, then the population of hospitalized patients to be used as the reference group becomes important. For a system targeting a pediatric inpatient population, a hospital discharge database representing a broad sample of pediatric hospitalizations offers the best basis for developing a system of weights applicable to different types of hospitals providing care for children. For this purpose, we selected the 2012 KID database, a nationally representative dataset containing data on newborn and pediatric discharges from the majority of states within the US. This choice assured that the RWs developed were based on and applicable to pediatric hospitalizations across the entire spectrum of SOI and resource intensity.
A number of measures of hospital performance and quality have been developed and are used by various entities, including individual hospitals, CMS, Leapfrog, Magnet, Joint Commission, and payers, for purposes ranging from benchmarking for improvement to payment models to reimbursement penalties. However, SOI of a hospital’s patient population influences not only the intensity of care that a hospital provides but also presents a potential impact on process and outcome measures. Thus, fair and appropriate measures must consider differences in SOI when comparing hospital performances. Using the weights derived in this paper, these adjustments can be possibly made at either the discharge- or hospital-level, depending on the application, and may include comparisons by hospital location, ownership, payer mix, or socioeconomic strata.
It is also common for hospitals to quantitatively express the uniqueness of services that they deliver to payers or the general public. A hospital-level CMI (derived as the average discharge weight for patients within a hospital) is one way that hospitals may differentiate themselves. This can be accomplished by considering the ratio of one hospital’s CMI to another hospital’s (or an average of a group of hospitals) as an expression of the relative intensity of services. For example, if hospital x has a CMI of 2.3, and hospital y has a CMI of 1.4, the population of children hospitalized at hospital x was 64.3% (1–2.3/1.4) more resource intensive than the children seen at hospital y.
This study should be considered in terms of several limitations. We used costs as the basis for determining intensity of service. Thus, the difference in cost structure among children’s hospitals and between children’s hospitals and other hospital types in the KID could have affected the final calculated weights. Also, the RWs calculated in this study rely on hospital discharge data. Thus, complications which were not “present on admission” and occurred during a hospitalization could have reflected poor quality of care yet still increase resource intensity as measured by total costs. Future studies should examine the potential impact of using present-on-admission diagnoses only for the APR-DRG grouping on the values of RWs. Significant variation may have existed among hospitals in resource utilization, and some hospitals may have exhibited significant overutilization of resources for the same conditions. However, as we used Winsorized means, the impact of potential outliers should have been reduced. Some APR-DRG-SOI combinations were seen mainly at children’s hospitals. Thus, cost structure and resource utilization practices of this subset of hospitals would have been the only contributors to weights for these patients. Given that the 2012 KID contained a broad representation of pediatric hospitalizations, with age 0–20 years, newborns accounted for the majority of total cases in the database. While providing a full range of pediatric weights, inclusion of these patients lowered the overall average RW. For this reason, we excluded normal newborn categories and maternal categories from analysis of CMI across hospital types and focused on acute-care hospitalizations. Lastly, as with any study relying on administrative data, there is always the possibility of coding errors or data entry errors in the reference dataset.
CONCLUSIONS
H-RISK can be used to risk adjust measures to account for severity differences across populations. These weights can also be averaged across hospitals’ patient populations to compare relative resource intensities of the patients served.
Disclosures
The authors have nothing to disclose.
1. Pettengill J, Vertrees J. Reliability and Validity in Hospital Case-Mix Measurement. Health Care Financ Rev. 1982; 4(2): 101-128. PubMed
2. Centers for Medicare & Medicaid Services. Details for title: Case Mix Index. https://www.cms.gov/Medicare/Medicare-Fee-for-Service-Payment/AcuteInpatientPPS/Acute-Inpatient-Files-for-Download-Items/CMS022630.html#. Accessed August 30, 2017.
3. Iglehart JK. Medicare begins prospective payment of hospitals. N. Engl. J. Med 1983; 308(23): 1428-1432. PubMed
4. Healthcare Cost Utilization Project. Overview of the Kids’ Inpatient Database (KID). 2017; https://www.hcup-us.ahrq.gov/kidoverview.jsp. Accessed August 30, 2017.
5. Healthcare Cost Utilization Project. Cost-to-Charge Ratio Files: 2012 Kids’ Inpatient Database (KID) User Guide. 2014; https://www.hcup-us.ahrq.gov/db/state/CCR2012KIDUserGuide.pdf. Accessed August 30, 2017.
6. Centers for Medicare & Medicaid Services. Medicare Program; Changes to the Hospital Inpatient Prospective Payment Systems and Fiscal Year 2005 Rates; Final Rule. Federal Register. 2004;69(154):48,939. PubMed
7. Muldoon JH. Structure and performance of different DRG classification systems for neonatal medicine. Pediatrics. 1999; 103(1 Suppl E): 302-318. PubMed
8. Averill R, Goldfield N, Muldoon J, Steinbeck B, Grant T. A Closer Look at All Patient Refined DRGs. J AHIMA. 2002; 73(1): 46-50. PubMed
9. Centers for Medicare & Medicaid Services. Design and development of the Diagnosis Related Group (DRG). https://www.cms.gov/ICD10Manual/version34-fullcode-cms/fullcode_cms/Design_and_development_of_the_Diagnosis_Related_Group_(DRGs)_PBL-038.pdf. Accessed December 6, 2017.
© 2018 Society of Hospital Medicine
A Matter of Urgency: Reducing Clinical Text Message Interruptions During Educational Sessions
On general medical wards, effective interprofessional communication is essential for high-quality patient care. Hospitals increasingly adopt secure text-messaging systems for healthcare team members to communicate with physicians in lieu of paging.1-3 Text messages facilitate bidirectional communication4,5 and increase perceived efficiency6-8 and are thus preferred over paging by nurses and trainees. However, this novel technology unintentionally causes high volumes of interruptions.9,10 Compared to paging, sending text messages and calling smartphones are more convenient and encourage communication of issues in real time, regardless of urgency.11 Interrupting messages are often perceived as nonurgent by physicians.6,12 In particular, 73%-93% of pages or messages sent to physicians are found to be nonurgent.13-17
Pages, text messages, or calls not only interrupt day-to-day tasks on the ward6,7,10,11,17,18 but also educational sessions,18-21 which are essential to the clinical teaching unit (CTU). Interruptions reduce learning and retention22 and are disruptive to the medical learning climate.18-20,23
Internal medicine CTUs at our large urban academic hospital network utilize a smartphone-based text messaging tool for interdisciplinary communication. Nonurgent interruptions are frequent during educational seminars, which occur at our institution between 8 AM and 9 AM and 12 PM and 1 PM on weekdays.10,11,19 In a preliminary analysis at one hospital site, an average of three text messages (range 1-11), 2 calls (range 0-8), and 3 emails (range 0-13) interrupted each educational session. Physicians and nurses can disagree on the urgency of messages or calls for the purposes of patient care and workflow.6,11,12,24 Nurses have expressed a desire for guidance regarding what constitutes an urgent clinical communication.6
This project aimed to reduce nonurgent text message interruptions during educational rounds. We hypothesized that improved decision support around clinical prioritization and reminders about educational hours could reduce unnecessary interruptions.
METHODS
This study was approved by the institution’s Research Ethics Board and conducted across 8 general medical CTU teams at an academic hospital network (Sites 1 and 2). Each CTU team provides 24-hour coverage of approximately 20–28 patients. The most responsible resident from each team carries an institution-provided smartphone, which receives secure texts, phone calls, and emails from nurses, social workers, physiotherapists, speech language pathologists, dieticians, pharmacists, and other physicians. Close collaboration with the platform developer permitted changes to be made to the system when needed. Prior to our interventions, a nurse could send a text message as either an “immediate interrupt” or a “delayed interrupt” message. Messages sent via the “delayed interrupt” option would be added to a queue and would eventually lead to an interrupting message if not replied to after a defined period. Direct phone calls were reserved for especially urgent or emergent communications.
Meetings were held with physicians and nursing managers at Site 1 (August 2014) and Site 2 (January 2015) to establish consensus on the communication process and determine clinical scenarios, regardless of time of day, that warrant a phone call, an “immediate interrupt” text, or a “delayed interrupt” text. In March 2015, resident feedback led to the addition of a third option to the sender interface. This option allowed messages to be sent as “For Your Information (FYI)” only, which would not lead to an interruption. “FYI” messages (for example, to notify that an ambulance had been booked for a patient), were instead placed in an electronic message board that could be viewed by the resident through the application. This change relied upon interdisciplinary trust and a commitment from residents to ensure that “FYI” messages were reviewed regularly.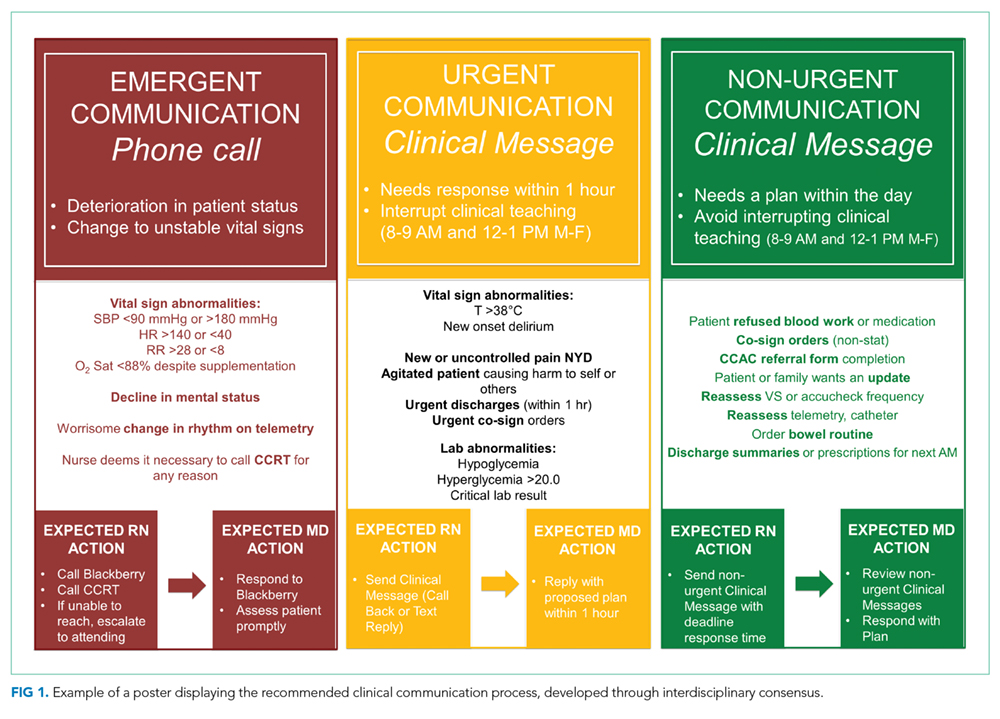
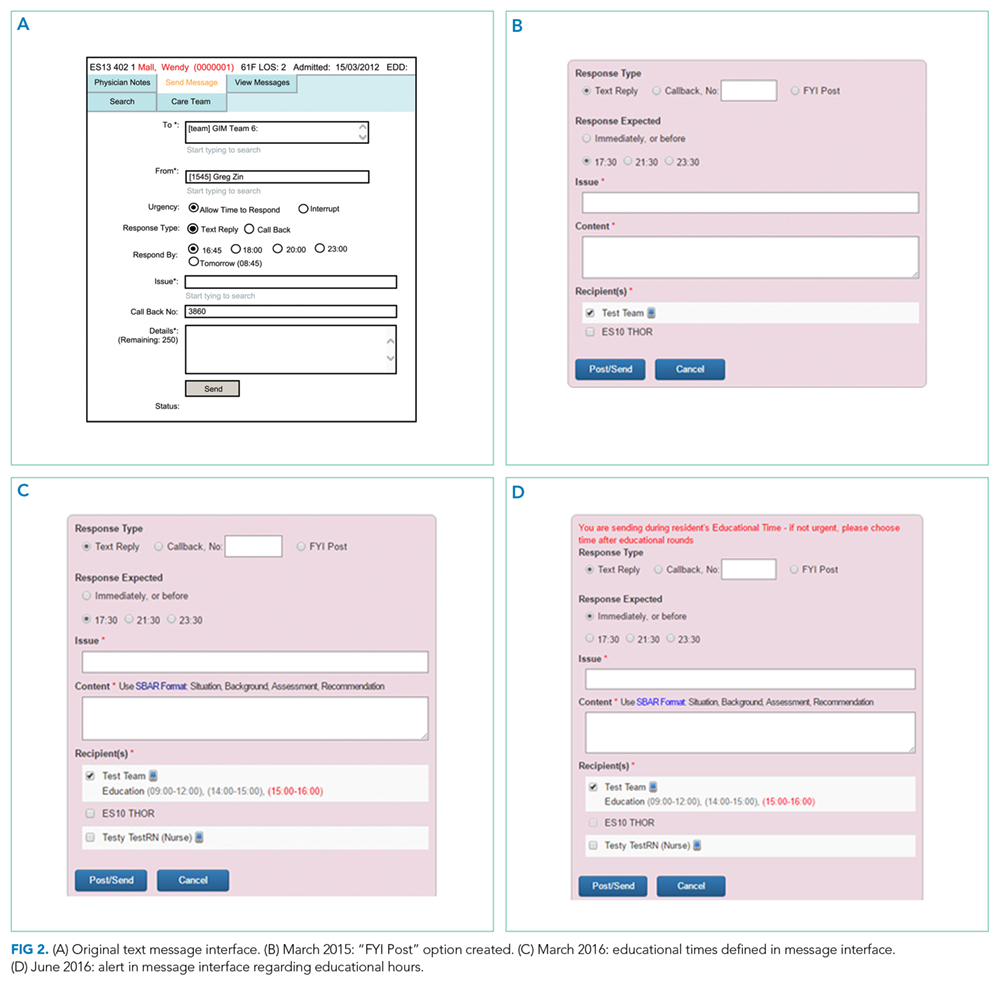
Statistical process control charts (u charts) assessed the frequency of each type of educational interruption (text, call, or email) per team on a monthly basis. The total educational interruptions per month were divided by the number of educational hours per month to account for variation in educational hours each month (for example, during holidays when educational rounds do not take place). If call logs or email data were unavailable for individual teams or time periods, then the denominator was adjusted to reflect the number of teams and educational hours in the sample for that month.
Two 4-week samples of interrupting text messages received by the 8 teams during educational hours were deidentified, analyzed, and compared in terms of content and urgency. A preintervention sample (November 17 to December 14, 2014) was compared to a postintervention sample (November 14 to December 11, 2016). Messages from the 2014 and 2016 samples were randomized, deidentified for date and time, and analyzed for urgency by 3 independent adjudicators (2 senior residents and 1 staff physician) to avoid biasing the postintervention analysis toward improvement. Messages were classified as “urgent” if the adjudicator felt a response or action was required within 1 hour. Messages not meeting these criteria were classified as “nonurgent” or “indeterminate” if the urgency of the message could not be assessed because it required further context. Fleiss kappa statistic evaluated agreement among adjudicators. Individual urgency designations were compared for each message, and discrepant rankings were addressed through repeated joint assessments. Disagreements were resolved through discussion and comparison against communication guidelines. In addition, messages reporting a “critical lab,” requiring physician notification as per institutional policy, were reclassified as “urgent.” The proportion of “nonurgent” messages sent during educational hours was compared between baseline and post-intervention periods using the Chi-square test.
“FYI” messages sent from November 14 to December 11, 2016 were audited using the same adjudication process to determine if “FYI” designations were appropriate and did not contain urgent patient care communications.
RESULTS
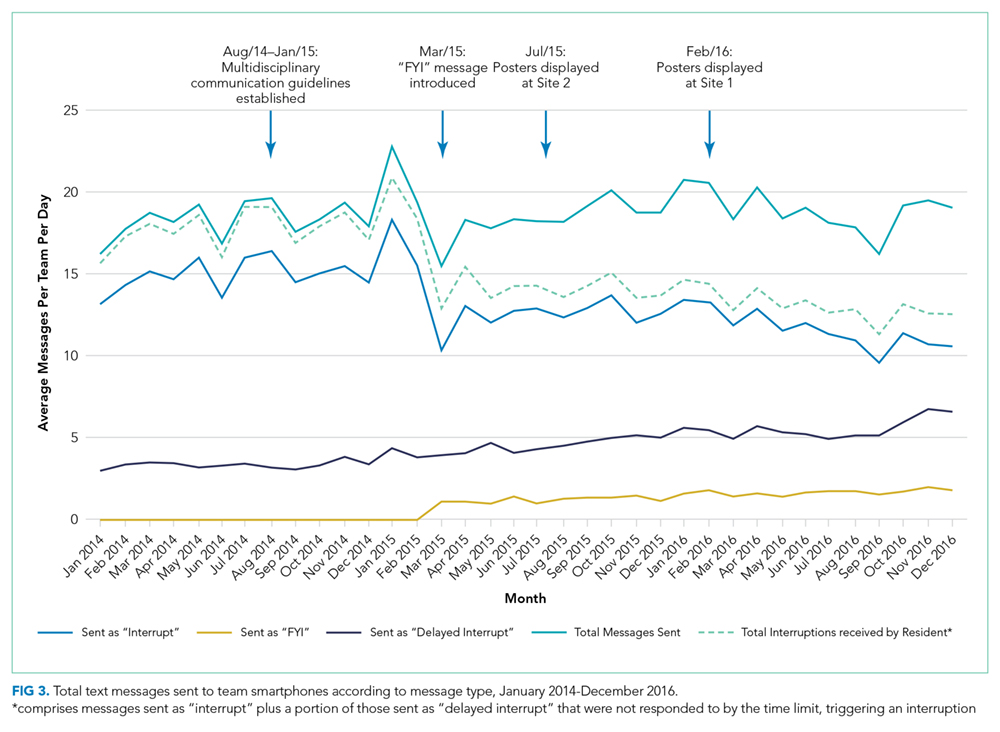

Incoming phone call logs were available from April 2015 to December 2016, with a mean of 0.62 (95% CI, 0.56 to 0.67) calls per team per educational hour, which did not change over the study period (Supplementary Figure 2). The overall number of calls to team smartphones also did not change during the measurement period. Incoming email data were available from October 2014 to December 2016, with a mean of 0.94 (95% CI, 0.88 to 1.0) emails per team per educational hour, which did not change over the study period (Supplementary Figure 3). Internal medicine service discharges, “Code Blue” announcements, and Critical Care Outreach Team consultations remained stable over the measurement period.
Independent ranking of the combined 4-week samples of educational text interruptions from 2014 and 2016 revealed an initial 3-way agreement on 257/455 (56%) messages (Fleiss Kappa 0.298, fair agreement), which increased to 405/455 (89%) messages after the first joint assessment and reached full consensus after a third joint assessment that included classifying all messages that communicated institution-defined “critical lab” values as “urgent.”
Overall, 71 (16%) messages were classified as “urgent,” 346 (76%) as “nonurgent,” and 38 (8%) as “indeterminate.” After unblinding of the message date and time, 273 text messages were received during the baseline measurement period (November 17 to December 14, 2014) and 182 messages were received during the equivalent time period 2 years later (November 14 to December 11, 2016), consistent with the reduced volume of educational interruptions observed (Figure 4). A total of 426 (94%) messages were sent by nurses, and the remaining ones were sent by pharmacists (n = 20), ward clerks (n = 3), social workers (n = 4), speech language pathologist (n = 1), or device administrator (n = 1).
The proportion of “nonurgent” messages decreased from 223/273 (82%) in 2014 to 123/182 (68%) in 2016 (P ≤ .01). Although the absolute number of urgent messages remained similar (33 in 2014 and 38 in 2016), the proportion of “urgent” messages increased from 12% to 21% of the total messages received (P = .02). Seventeen (6%) messages had indeterminate frequency in 2014 compared to 21 (11.5%) in 2016 (NS).
An audit of consecutive “FYI” messages (November 14-December 11, 2016) revealed an initial agreement in 384/431 (89%), reaching full consensus after repeated joint assessments. A total of 406 (94%) “FYI” messages were appropriately sent, while 10 (2%) represented urgent communications that should have been sent as interruptions. In 15 (4%) cases, the appropriateness of the message was indeterminate.
DISCUSSION
Sequential interventions over a 36-month period were associated with reduced nonurgent text message interruptions during educational hours. A clinical communication process was formally defined to accurately match message urgency with communication modality. A “noninterrupt” option allowed nonurgent text messages to be posted to an electronic message board, rather than causing real-time interruption, thereby reducing the overall volume of interrupting text messages. Modifying the interface to alert potential senders to protected educational hours was associated with reductions in educational interruptions. Through a blinded analysis of the text message content between 2014 and 2016, we determined that nonurgent educational interruptions were significantly reduced, and the number of urgent communications remained constant. Reduced nonurgent interruptions have the potential to improve the learning climate on the medical teaching unit during protected educational hours.
At baseline, 82% of the sampled text messages sent during educational hours across both sites were considered nonurgent. The estimated proportion of urgent messages varies in the literature (5%-34%)13-18 possibly due to center-specific methods of defining and measuring urgent messages. For example, different assessor training backgrounds, different numbers of assessors, and varying institutional policies are described.13-17 We considered an urgent message to require a response or action within 1 hour or to represent an established “critical lab value” as per the institution. The high proportion of nonurgent interruptions found in this study and other works demonstrates the widespread nature of this problem within inpatient hospital settings; this phenomenon could potentially lead to unintended consequences on efficiency and medical education.
Few other initiatives have aimed to reduce interruptions to medical trainees during educational sessions. At one center, replacing numeric pagers with alphanumeric pagers decreased the need to return pages during educational sessions but did not decrease the overall number of pages.21 Another center implemented an inbox tool that reduced daytime nonurgent numeric pages.15 Similar to our center’s previous experience,11 the total number of communications increased with the creation of the inbox tool.15 Unexpectedly, the introduction of an “FYI” option for senders in March 2015 did not increase the total number of messages.
Increasing use of text messages for communication between physicians and allied health professions has resulted in higher volumes of interruptions compared with conventional paging.6,7,9 Excessive interruptions create a “crisis mode” work climate,10 which could compromise patient safety25-27 and hamper trainees’ attainment of educational objectives.18-20,23 During educational sessions, audible text, phone call, and email interruptions disrupt all learners in addition to the resident receiving the message. The creation of the “FYI” message option in March 2015 was associated with reduced overall daily interruptions, which may improve efficiency in residents’ clinical duties17,18 and minimize multi-tasking that could lead to errors.28 However, adding a real-time notification during educational hours (March 2016, modified June 2016) exerted the greatest impact specifically on educational interruptions. Engaging physicians in the creation and ongoing modification of instant-messaging interfaces can help customize technology to meet the needs of users.15,29 Our work provides a strategy for improving communication between nurses and physicians in a teaching hospital setting, by achieving consensus on levels of urgency of different messages, providing a non-interrupting message option, and providing nurses with real-time information about educational hours.
Potential unintended consequences of the interventions require consideration. Discouraging interruptions may have reduced urgent patient care communications but were mitigated by enabling senders to ignore/override interruption warnings. We did not observe an increase in the number of overall calls to team devices, “Code Blues,” or critical care team consultations. However, we found that a very small (2%) but important group of “FYI” messages should have been sent as urgent interrupting messages, thereby underscoring the necessity for continuous feedback to senders on the clinical communication process.
Our study has limitations. Although educational interruptions can cause fragmented learning at our institution,19 the impact of reduced interruptions on the quality of educational sessions can only be inferred because we did not formally assess resident or staff physician perceptions on this outcome during the interventions. Moreover, we were unable to quantify interruptions received through personal smartphones, a frequent method of physician-physician communication.30 Phone calls are the most intrusive of interruptions but were not the focus of interventions. Future work must consider documenting perceived appropriateness of calls in real time, similar to previous studies assessing paging urgency.13,14,18 Biased ranking of message urgency was minimized by utilizing 3 independent adjudicators blinded to message date throughout the adjudication process and by applying established communication guidelines where available. Nevertheless, retrospective assessment of message urgency could be limited by a lack of clinical context, which may have been more apparent to the original sender and the recipient. Finally, at our center, a close relationship with the communication platform programmer made sequential modifications possible, while other institutions may have limited ability to make such changes. A different approach may be useful in some cases, such as modifying academic teaching times to limit interruptions.23
In a large academic center, a high number of interrupting smartphone messages cause unnecessary distractions and reduce learning during educational hours. “Nonurgent” educational interruptions were reduced through successive improvement cycles, and ultimately by modifying the program interface to alert senders of educational hours. Further reduction in interruptions and sustainability may be achieved by studying phone call interruptions and by formalizing audit and feedback of sender’s adherence to standardized clinical communication methods.
ACKNOWLEDGMENT
Dr. Wu is supported by an award from the Mak Pak Chiu and Mak-Soo Lai Hing Chair in General Internal Medicine, University of Toronto. The authors would like to acknowledge Jason Uppal for his ongoing contribution to the improvement of clinical text message communications at our institution.
Disclosures
The authors have nothing to disclose.
1. Wu R, Lo V, Morra D, et al. A smartphone-enabled communication system to improve hospital communication: usage and perceptions of medical trainees and nurses on general internal medicine wards. J Hosp Med. 2015;10(2):83-89. PubMed
2. Smith CN, Quan SD, Morra D, et al. Understanding interprofessional communication: a content analysis of email communications between doctors and nurses. Appl Clin Inform. 2012;3(1):38-51. PubMed
3. Frizzell JD, Ahmed B. Text messaging versus paging: new technology for the next generation. J Am Coll Cardiol. 2014;64(24):2703-2705. PubMed
4. Wu RC, Morra D, Quan S, et al. The use of smartphones for clinical communication on internal medicine wards. J Hosp Med. 2010;5(9):553-559. PubMed
5. Ighani F, Kapoor KG, Gibran SK, et al. A comparison of two-way text versus conventional paging systems in an academic ophthalmology department. J Med Syst. 2010;34(4):677-684. PubMed
6. Wu R, Rossos P, Quan S, et al. An evaluation of the use of smartphones to communicate between clinicians: a mixed-methods study. J Med Internet Res. 2011;13(3):e59. PubMed
7. Wu RC, Lo V, Morra D, et al. The intended and unintended consequences of communication systems on general internal medicine inpatient care delivery: a prospective observational case study of five teaching hospitals. J Am Med Inform Assoc. 2013;20(4):766-777. PubMed
8. Patel N, Siegler JE, Stromberg N, Ravitz N, Hanson CW. Perfect storm of inpatient communication needs and an innovative solution utilizing smartphones and secured messaging. Appl Clin Inform. 2016;7(3):777-789. PubMed
9. Aungst TD, Belliveau P. Leveraging mobile smart devices to improve interprofessional communications in inpatient practice setting: A literature review. J Interprof Care. 2015;29(6):570-578. PubMed
10. Vaisman A, Wu RC. Analysis of Smartphone Interruptions on Academic General Internal Medicine Wards. Frequent Interruptions may cause a ‘Crisis Mode’ Work Climate. Appl Clin Inform. 2017;8(1):1-11. PubMed
11. Quan SD, Wu RC, Rossos PG, et al. It’s not about pager replacement: an in-depth look at the interprofessional nature of communication in healthcare. J Hosp Med. 2013;8(3):137-143. PubMed
12. Quan SD, Morra D, Lau FY, et al. Perceptions of urgency: defining the gap between what physicians and nurses perceive to be an urgent issue. Int J Med Inform. 2013;82(5):378-386. PubMed
13. Katz MH, Schroeder SA. The sounds of the hospital. Paging patterns in three teaching hospitals. N Engl J Med. 1988;319(24):1585-1589. PubMed
14. Patel R, Reilly K, Old A, Naden G, Child S. Appropriate use of pagers in a New Zealand tertiary hospital. N Z Med J. 2006;119(1231):U1912. PubMed
15. Ferguson A, Aaronson B, Anuradhika A. Inbox messaging: an effective tool for minimizing non-urgent paging related interruptions in hospital medicine provider workflow. BMJ Qual Improv Rep. 2016;5(1):u215856.w7316. PubMed
16. Luxenberg A, Chan B, Khanna R, Sarkar U. Efficiency and interpretability of text paging communication for medical inpatients: A mixed-methods analysis. JAMA Intern Med. 2017;177(8):1218-1220. PubMed
17. Ly T, Korb-Wells CS, Sumpton D, Russo RR, Barnsley L. Nature and impact of interruptions on clinical workflow of medical residents in the inpatient setting. J Grad Med Educ. 2013;5(2):232-237. PubMed
18. Blum NJ, Lieu TA. Interrupted care. The effects of paging on pediatric resident activities. Am J Dis Child. 1992;146(7):806-808. PubMed
19. Wu RC, Tzanetos K, Morra D, Quan S, Lo V, Wong BM. Educational impact of using smartphones for clinical communication on general medicine: more global, less local. J Hosp Med. 2013;8(7):365-372. PubMed
20. Katz-Sidlow RJ, Ludwig A, Miller S, Sidlow R. Smartphone use during inpatient attending rounds: prevalence, patterns and potential for distraction. J Hosp Med. 2012;7(8):595-599. PubMed
21. Wong BM, Quan S, Shadowitz S, Etchells E. Implementation and evaluation of an alpha-numeric paging system on a resident inpatient teaching service. J Hosp Med. 2009;4(8):E34-E40. PubMed
22. Conard MA MR. Interest level improves learning but does not moderate the effects of interruptions: An experiment using simultaneous multitasking. Learn Individ Differ. 2014;30:112-117.
23. Zastoupil L, McIntosh A, Sopfe J, et al. Positive impact of transition from noon conference to academic half day in a pediatric residency program. Acad Pediatr. 2017;17(4):436-442. PubMed
24. Lo V, Wu RC, Morra D, Lee L, Reeves S. The use of smartphones in general and internal medicine units: a boon or a bane to the promotion of interprofessional collaboration? J Interprof Care. 2012;26(4):276-282. PubMed
25. Patterson ME, Bogart MS, Starr KR. Associations between perceived crisis mode work climate and poor information exchange within hospitals. J Hosp Med. 2015;10(3):152-159. PubMed
26. Laxmisan A, Hakimzada F, Sayan OR, Green RA, Zhang J, Patel VL. The multitasking clinician: decision-making and cognitive demand during and after team handoffs in emergency care. Int J Med Inform. 2007;76(11-12):801-811. PubMed
27. Westbrook JI, Woods A, Rob MI, Dunsmuir WT, Day RO. Association of interruptions with an increased risk and severity of medication administration errors. Arch Intern Med. 2010;170(8):683-690. PubMed
28. Collins S, Currie L, Patel V, Bakken S, Cimino JJ. Multitasking by clinicians in the context of CPOE and CIS use. Stud Health Technol Inform. 2007;129(Pt 2):958-962. PubMed
29. Huang ME. It is from mars and physicians from venus: Bridging the gap. PM R. 2017;9(5S):S19-S25. PubMed
30. Tran K, Morra D, Lo V, Quan S, Wu R. The use of smartphones on General Internal Medicine wards: A mixed methods study. Appl Clin Inform. 2014;5(3):814-823. PubMed
On general medical wards, effective interprofessional communication is essential for high-quality patient care. Hospitals increasingly adopt secure text-messaging systems for healthcare team members to communicate with physicians in lieu of paging.1-3 Text messages facilitate bidirectional communication4,5 and increase perceived efficiency6-8 and are thus preferred over paging by nurses and trainees. However, this novel technology unintentionally causes high volumes of interruptions.9,10 Compared to paging, sending text messages and calling smartphones are more convenient and encourage communication of issues in real time, regardless of urgency.11 Interrupting messages are often perceived as nonurgent by physicians.6,12 In particular, 73%-93% of pages or messages sent to physicians are found to be nonurgent.13-17
Pages, text messages, or calls not only interrupt day-to-day tasks on the ward6,7,10,11,17,18 but also educational sessions,18-21 which are essential to the clinical teaching unit (CTU). Interruptions reduce learning and retention22 and are disruptive to the medical learning climate.18-20,23
Internal medicine CTUs at our large urban academic hospital network utilize a smartphone-based text messaging tool for interdisciplinary communication. Nonurgent interruptions are frequent during educational seminars, which occur at our institution between 8 AM and 9 AM and 12 PM and 1 PM on weekdays.10,11,19 In a preliminary analysis at one hospital site, an average of three text messages (range 1-11), 2 calls (range 0-8), and 3 emails (range 0-13) interrupted each educational session. Physicians and nurses can disagree on the urgency of messages or calls for the purposes of patient care and workflow.6,11,12,24 Nurses have expressed a desire for guidance regarding what constitutes an urgent clinical communication.6
This project aimed to reduce nonurgent text message interruptions during educational rounds. We hypothesized that improved decision support around clinical prioritization and reminders about educational hours could reduce unnecessary interruptions.
METHODS
This study was approved by the institution’s Research Ethics Board and conducted across 8 general medical CTU teams at an academic hospital network (Sites 1 and 2). Each CTU team provides 24-hour coverage of approximately 20–28 patients. The most responsible resident from each team carries an institution-provided smartphone, which receives secure texts, phone calls, and emails from nurses, social workers, physiotherapists, speech language pathologists, dieticians, pharmacists, and other physicians. Close collaboration with the platform developer permitted changes to be made to the system when needed. Prior to our interventions, a nurse could send a text message as either an “immediate interrupt” or a “delayed interrupt” message. Messages sent via the “delayed interrupt” option would be added to a queue and would eventually lead to an interrupting message if not replied to after a defined period. Direct phone calls were reserved for especially urgent or emergent communications.
Meetings were held with physicians and nursing managers at Site 1 (August 2014) and Site 2 (January 2015) to establish consensus on the communication process and determine clinical scenarios, regardless of time of day, that warrant a phone call, an “immediate interrupt” text, or a “delayed interrupt” text. In March 2015, resident feedback led to the addition of a third option to the sender interface. This option allowed messages to be sent as “For Your Information (FYI)” only, which would not lead to an interruption. “FYI” messages (for example, to notify that an ambulance had been booked for a patient), were instead placed in an electronic message board that could be viewed by the resident through the application. This change relied upon interdisciplinary trust and a commitment from residents to ensure that “FYI” messages were reviewed regularly.
Statistical process control charts (u charts) assessed the frequency of each type of educational interruption (text, call, or email) per team on a monthly basis. The total educational interruptions per month were divided by the number of educational hours per month to account for variation in educational hours each month (for example, during holidays when educational rounds do not take place). If call logs or email data were unavailable for individual teams or time periods, then the denominator was adjusted to reflect the number of teams and educational hours in the sample for that month.
Two 4-week samples of interrupting text messages received by the 8 teams during educational hours were deidentified, analyzed, and compared in terms of content and urgency. A preintervention sample (November 17 to December 14, 2014) was compared to a postintervention sample (November 14 to December 11, 2016). Messages from the 2014 and 2016 samples were randomized, deidentified for date and time, and analyzed for urgency by 3 independent adjudicators (2 senior residents and 1 staff physician) to avoid biasing the postintervention analysis toward improvement. Messages were classified as “urgent” if the adjudicator felt a response or action was required within 1 hour. Messages not meeting these criteria were classified as “nonurgent” or “indeterminate” if the urgency of the message could not be assessed because it required further context. Fleiss kappa statistic evaluated agreement among adjudicators. Individual urgency designations were compared for each message, and discrepant rankings were addressed through repeated joint assessments. Disagreements were resolved through discussion and comparison against communication guidelines. In addition, messages reporting a “critical lab,” requiring physician notification as per institutional policy, were reclassified as “urgent.” The proportion of “nonurgent” messages sent during educational hours was compared between baseline and post-intervention periods using the Chi-square test.
“FYI” messages sent from November 14 to December 11, 2016 were audited using the same adjudication process to determine if “FYI” designations were appropriate and did not contain urgent patient care communications.
RESULTS
Incoming phone call logs were available from April 2015 to December 2016, with a mean of 0.62 (95% CI, 0.56 to 0.67) calls per team per educational hour, which did not change over the study period (Supplementary Figure 2). The overall number of calls to team smartphones also did not change during the measurement period. Incoming email data were available from October 2014 to December 2016, with a mean of 0.94 (95% CI, 0.88 to 1.0) emails per team per educational hour, which did not change over the study period (Supplementary Figure 3). Internal medicine service discharges, “Code Blue” announcements, and Critical Care Outreach Team consultations remained stable over the measurement period.
Independent ranking of the combined 4-week samples of educational text interruptions from 2014 and 2016 revealed an initial 3-way agreement on 257/455 (56%) messages (Fleiss Kappa 0.298, fair agreement), which increased to 405/455 (89%) messages after the first joint assessment and reached full consensus after a third joint assessment that included classifying all messages that communicated institution-defined “critical lab” values as “urgent.”
Overall, 71 (16%) messages were classified as “urgent,” 346 (76%) as “nonurgent,” and 38 (8%) as “indeterminate.” After unblinding of the message date and time, 273 text messages were received during the baseline measurement period (November 17 to December 14, 2014) and 182 messages were received during the equivalent time period 2 years later (November 14 to December 11, 2016), consistent with the reduced volume of educational interruptions observed (Figure 4). A total of 426 (94%) messages were sent by nurses, and the remaining ones were sent by pharmacists (n = 20), ward clerks (n = 3), social workers (n = 4), speech language pathologist (n = 1), or device administrator (n = 1).
The proportion of “nonurgent” messages decreased from 223/273 (82%) in 2014 to 123/182 (68%) in 2016 (P ≤ .01). Although the absolute number of urgent messages remained similar (33 in 2014 and 38 in 2016), the proportion of “urgent” messages increased from 12% to 21% of the total messages received (P = .02). Seventeen (6%) messages had indeterminate frequency in 2014 compared to 21 (11.5%) in 2016 (NS).
An audit of consecutive “FYI” messages (November 14-December 11, 2016) revealed an initial agreement in 384/431 (89%), reaching full consensus after repeated joint assessments. A total of 406 (94%) “FYI” messages were appropriately sent, while 10 (2%) represented urgent communications that should have been sent as interruptions. In 15 (4%) cases, the appropriateness of the message was indeterminate.
DISCUSSION
Sequential interventions over a 36-month period were associated with reduced nonurgent text message interruptions during educational hours. A clinical communication process was formally defined to accurately match message urgency with communication modality. A “noninterrupt” option allowed nonurgent text messages to be posted to an electronic message board, rather than causing real-time interruption, thereby reducing the overall volume of interrupting text messages. Modifying the interface to alert potential senders to protected educational hours was associated with reductions in educational interruptions. Through a blinded analysis of the text message content between 2014 and 2016, we determined that nonurgent educational interruptions were significantly reduced, and the number of urgent communications remained constant. Reduced nonurgent interruptions have the potential to improve the learning climate on the medical teaching unit during protected educational hours.
At baseline, 82% of the sampled text messages sent during educational hours across both sites were considered nonurgent. The estimated proportion of urgent messages varies in the literature (5%-34%)13-18 possibly due to center-specific methods of defining and measuring urgent messages. For example, different assessor training backgrounds, different numbers of assessors, and varying institutional policies are described.13-17 We considered an urgent message to require a response or action within 1 hour or to represent an established “critical lab value” as per the institution. The high proportion of nonurgent interruptions found in this study and other works demonstrates the widespread nature of this problem within inpatient hospital settings; this phenomenon could potentially lead to unintended consequences on efficiency and medical education.
Few other initiatives have aimed to reduce interruptions to medical trainees during educational sessions. At one center, replacing numeric pagers with alphanumeric pagers decreased the need to return pages during educational sessions but did not decrease the overall number of pages.21 Another center implemented an inbox tool that reduced daytime nonurgent numeric pages.15 Similar to our center’s previous experience,11 the total number of communications increased with the creation of the inbox tool.15 Unexpectedly, the introduction of an “FYI” option for senders in March 2015 did not increase the total number of messages.
Increasing use of text messages for communication between physicians and allied health professions has resulted in higher volumes of interruptions compared with conventional paging.6,7,9 Excessive interruptions create a “crisis mode” work climate,10 which could compromise patient safety25-27 and hamper trainees’ attainment of educational objectives.18-20,23 During educational sessions, audible text, phone call, and email interruptions disrupt all learners in addition to the resident receiving the message. The creation of the “FYI” message option in March 2015 was associated with reduced overall daily interruptions, which may improve efficiency in residents’ clinical duties17,18 and minimize multi-tasking that could lead to errors.28 However, adding a real-time notification during educational hours (March 2016, modified June 2016) exerted the greatest impact specifically on educational interruptions. Engaging physicians in the creation and ongoing modification of instant-messaging interfaces can help customize technology to meet the needs of users.15,29 Our work provides a strategy for improving communication between nurses and physicians in a teaching hospital setting, by achieving consensus on levels of urgency of different messages, providing a non-interrupting message option, and providing nurses with real-time information about educational hours.
Potential unintended consequences of the interventions require consideration. Discouraging interruptions may have reduced urgent patient care communications but were mitigated by enabling senders to ignore/override interruption warnings. We did not observe an increase in the number of overall calls to team devices, “Code Blues,” or critical care team consultations. However, we found that a very small (2%) but important group of “FYI” messages should have been sent as urgent interrupting messages, thereby underscoring the necessity for continuous feedback to senders on the clinical communication process.
Our study has limitations. Although educational interruptions can cause fragmented learning at our institution,19 the impact of reduced interruptions on the quality of educational sessions can only be inferred because we did not formally assess resident or staff physician perceptions on this outcome during the interventions. Moreover, we were unable to quantify interruptions received through personal smartphones, a frequent method of physician-physician communication.30 Phone calls are the most intrusive of interruptions but were not the focus of interventions. Future work must consider documenting perceived appropriateness of calls in real time, similar to previous studies assessing paging urgency.13,14,18 Biased ranking of message urgency was minimized by utilizing 3 independent adjudicators blinded to message date throughout the adjudication process and by applying established communication guidelines where available. Nevertheless, retrospective assessment of message urgency could be limited by a lack of clinical context, which may have been more apparent to the original sender and the recipient. Finally, at our center, a close relationship with the communication platform programmer made sequential modifications possible, while other institutions may have limited ability to make such changes. A different approach may be useful in some cases, such as modifying academic teaching times to limit interruptions.23
In a large academic center, a high number of interrupting smartphone messages cause unnecessary distractions and reduce learning during educational hours. “Nonurgent” educational interruptions were reduced through successive improvement cycles, and ultimately by modifying the program interface to alert senders of educational hours. Further reduction in interruptions and sustainability may be achieved by studying phone call interruptions and by formalizing audit and feedback of sender’s adherence to standardized clinical communication methods.
ACKNOWLEDGMENT
Dr. Wu is supported by an award from the Mak Pak Chiu and Mak-Soo Lai Hing Chair in General Internal Medicine, University of Toronto. The authors would like to acknowledge Jason Uppal for his ongoing contribution to the improvement of clinical text message communications at our institution.
Disclosures
The authors have nothing to disclose.
1. Wu R, Lo V, Morra D, et al. A smartphone-enabled communication system to improve hospital communication: usage and perceptions of medical trainees and nurses on general internal medicine wards. J Hosp Med. 2015;10(2):83-89. PubMed
2. Smith CN, Quan SD, Morra D, et al. Understanding interprofessional communication: a content analysis of email communications between doctors and nurses. Appl Clin Inform. 2012;3(1):38-51. PubMed
3. Frizzell JD, Ahmed B. Text messaging versus paging: new technology for the next generation. J Am Coll Cardiol. 2014;64(24):2703-2705. PubMed
4. Wu RC, Morra D, Quan S, et al. The use of smartphones for clinical communication on internal medicine wards. J Hosp Med. 2010;5(9):553-559. PubMed
5. Ighani F, Kapoor KG, Gibran SK, et al. A comparison of two-way text versus conventional paging systems in an academic ophthalmology department. J Med Syst. 2010;34(4):677-684. PubMed
6. Wu R, Rossos P, Quan S, et al. An evaluation of the use of smartphones to communicate between clinicians: a mixed-methods study. J Med Internet Res. 2011;13(3):e59. PubMed
7. Wu RC, Lo V, Morra D, et al. The intended and unintended consequences of communication systems on general internal medicine inpatient care delivery: a prospective observational case study of five teaching hospitals. J Am Med Inform Assoc. 2013;20(4):766-777. PubMed
8. Patel N, Siegler JE, Stromberg N, Ravitz N, Hanson CW. Perfect storm of inpatient communication needs and an innovative solution utilizing smartphones and secured messaging. Appl Clin Inform. 2016;7(3):777-789. PubMed
9. Aungst TD, Belliveau P. Leveraging mobile smart devices to improve interprofessional communications in inpatient practice setting: A literature review. J Interprof Care. 2015;29(6):570-578. PubMed
10. Vaisman A, Wu RC. Analysis of Smartphone Interruptions on Academic General Internal Medicine Wards. Frequent Interruptions may cause a ‘Crisis Mode’ Work Climate. Appl Clin Inform. 2017;8(1):1-11. PubMed
11. Quan SD, Wu RC, Rossos PG, et al. It’s not about pager replacement: an in-depth look at the interprofessional nature of communication in healthcare. J Hosp Med. 2013;8(3):137-143. PubMed
12. Quan SD, Morra D, Lau FY, et al. Perceptions of urgency: defining the gap between what physicians and nurses perceive to be an urgent issue. Int J Med Inform. 2013;82(5):378-386. PubMed
13. Katz MH, Schroeder SA. The sounds of the hospital. Paging patterns in three teaching hospitals. N Engl J Med. 1988;319(24):1585-1589. PubMed
14. Patel R, Reilly K, Old A, Naden G, Child S. Appropriate use of pagers in a New Zealand tertiary hospital. N Z Med J. 2006;119(1231):U1912. PubMed
15. Ferguson A, Aaronson B, Anuradhika A. Inbox messaging: an effective tool for minimizing non-urgent paging related interruptions in hospital medicine provider workflow. BMJ Qual Improv Rep. 2016;5(1):u215856.w7316. PubMed
16. Luxenberg A, Chan B, Khanna R, Sarkar U. Efficiency and interpretability of text paging communication for medical inpatients: A mixed-methods analysis. JAMA Intern Med. 2017;177(8):1218-1220. PubMed
17. Ly T, Korb-Wells CS, Sumpton D, Russo RR, Barnsley L. Nature and impact of interruptions on clinical workflow of medical residents in the inpatient setting. J Grad Med Educ. 2013;5(2):232-237. PubMed
18. Blum NJ, Lieu TA. Interrupted care. The effects of paging on pediatric resident activities. Am J Dis Child. 1992;146(7):806-808. PubMed
19. Wu RC, Tzanetos K, Morra D, Quan S, Lo V, Wong BM. Educational impact of using smartphones for clinical communication on general medicine: more global, less local. J Hosp Med. 2013;8(7):365-372. PubMed
20. Katz-Sidlow RJ, Ludwig A, Miller S, Sidlow R. Smartphone use during inpatient attending rounds: prevalence, patterns and potential for distraction. J Hosp Med. 2012;7(8):595-599. PubMed
21. Wong BM, Quan S, Shadowitz S, Etchells E. Implementation and evaluation of an alpha-numeric paging system on a resident inpatient teaching service. J Hosp Med. 2009;4(8):E34-E40. PubMed
22. Conard MA MR. Interest level improves learning but does not moderate the effects of interruptions: An experiment using simultaneous multitasking. Learn Individ Differ. 2014;30:112-117.
23. Zastoupil L, McIntosh A, Sopfe J, et al. Positive impact of transition from noon conference to academic half day in a pediatric residency program. Acad Pediatr. 2017;17(4):436-442. PubMed
24. Lo V, Wu RC, Morra D, Lee L, Reeves S. The use of smartphones in general and internal medicine units: a boon or a bane to the promotion of interprofessional collaboration? J Interprof Care. 2012;26(4):276-282. PubMed
25. Patterson ME, Bogart MS, Starr KR. Associations between perceived crisis mode work climate and poor information exchange within hospitals. J Hosp Med. 2015;10(3):152-159. PubMed
26. Laxmisan A, Hakimzada F, Sayan OR, Green RA, Zhang J, Patel VL. The multitasking clinician: decision-making and cognitive demand during and after team handoffs in emergency care. Int J Med Inform. 2007;76(11-12):801-811. PubMed
27. Westbrook JI, Woods A, Rob MI, Dunsmuir WT, Day RO. Association of interruptions with an increased risk and severity of medication administration errors. Arch Intern Med. 2010;170(8):683-690. PubMed
28. Collins S, Currie L, Patel V, Bakken S, Cimino JJ. Multitasking by clinicians in the context of CPOE and CIS use. Stud Health Technol Inform. 2007;129(Pt 2):958-962. PubMed
29. Huang ME. It is from mars and physicians from venus: Bridging the gap. PM R. 2017;9(5S):S19-S25. PubMed
30. Tran K, Morra D, Lo V, Quan S, Wu R. The use of smartphones on General Internal Medicine wards: A mixed methods study. Appl Clin Inform. 2014;5(3):814-823. PubMed
© 2018 Society of Hospital Medicine
Case Series Evaluating the Operative and Nonoperative Treatment of Scapular Fractures
ABSTRACT
The injury parameters and patient characteristics that affect function after scapular fracture are poorly defined. We performed a retrospective review of 594 adult patients with a minimum 12-month follow-up after scapular fracture. Functional outcomes were prospectively assessed using the American Shoulder and Elbow Surgeons (ASES) survey in 153 patients after a mean of 62 months of follow-up. The population was 78% male, and 88% had injuries caused by a high-energy event. Only 4.6% had injuries isolated to the scapula. All fractures healed primarily and the mean ASES score was 79.3, indicating minimal functional impairment. However, 7 patients (4.6%) reported severe functional deficits. Fifteen patients (9.8%) underwent open reduction and internal fixation. These patients had a better mean ASES score than those who were treated nonoperatively (92.1 vs 77.9, P = .03). When fracture types were analyzed individually, there was an advantage to surgery in fractures involving the glenoid (96.0 vs 75.7, P < .05). Concomitant chest wall injury or the presence of adjacent fractures did not affect functional outcomes. Smokers had a worse mean score (73.3 vs 84.5, P = .01), as did patients with a history of alcohol abuse (70.3 vs 83.9, P < .05). In conclusion, mean ASES scores indicated good function overall. Patients with a history of tobacco use or alcohol abuse had worse outcome scores.
Continue to: Scapular fractures occur frequently due to high-energy trauma...
Scapular fractures occur frequently due to high-energy trauma, with concomitant injuries seen in approximately 90% of cases.1-4 As a result, treatment is often surrounded by other difficult medical decisions, and factors affecting outcomes can be multifaceted. The gaps in our understanding of long-term outcomes with current treatment modalities have recently come to light, especially when it comes to determining indications for surgery.
Specifically, there is very little literature on radiographic healing and long-term shoulder function in larger samples of scapular fractures; additionally, there is evidence that some patients do not experience full functional recovery.3,5-7 Studies assessing return of function in patients treated nonoperatively have shown decreased mobility and persistence of pain.7 Some of these findings could be due to variability in surgical indications.2,4 While the majority of fractures are treated nonoperatively, the decision to operate has recently been one of debate. Prior literature has suggested highly variable measurements of angulation and extra-articular displacement at which surgery is recommended.1 For example, indications for surgery measured by the medial displacement of extra-articular fractures range from >10 mm to >20 mm;8-11 similarly, the displacement of intra-articular fractures meriting surgery ranges from >2 mm to >5 mm, depending on the author.12-16
The current debate over surgical indications for less severe scapular fractures, as well as the potential for chronic pain and stiffness calls for a thorough examination of factors affecting functional outcomes. The purpose of this study is to determine which patient factors, fracture patterns, and treatment modalities were associated with differences in healing and return of shoulder function. We hypothesized that certain aspects of the patient’s social history (tobacco, alcohol) as well as concomitant chest wall injuries may be associated with poor outcome scores and lower levels of function. We further hypothesized that glenoid fractures would affect function more than body fractures, and we did not expect to see a significant difference in outcomes between operative and nonoperative treatment.
MATERIALS AND METHODS
This study was approved by the Institutional Review Board. A registry at our level 1 trauma center was queried to identify 663 skeletally mature patients with scapular fractures between 1999 and 2011. Forty-eight patients had died prior to the study, and 21 patients had insufficient radiography and/or clinical follow-up (Figure 1). To be included, patients were required to have at least 1 year of follow-up to assess healing. Data on patient demographics, fracture classification, etiology of injury, concomitant injuries (clavicle fractures, rib fractures, pulmonary injuries), comorbidities, alcohol use, and tobacco use were collected retrospectively for the remaining 594 patients. Patients were then prospectively contacted via telephone and mail, employing 3 Internet search engines as needed, in an attempt to obtain current contact information. Three patients declined to participate, and 438 were not reachable after multiple attempts. Outcome scores for the remaining 153 patients were determined with the Modified American Shoulder and Elbow Surgeons (ASES) Shoulder Form.17 Scores were measured out of 100, with 0 to 30 representing maximally impaired, 31 to 60 representing moderately impaired, and 61 to 100 representing minimally impaired shoulder function.18 Due to the retrospective identification of the patients, no pre-injury shoulder function scores were collected. Given that many patients were unreachable, or reachable but not living in close proximity to the hospital, patients did not routinely return for re-evaluation for this study.
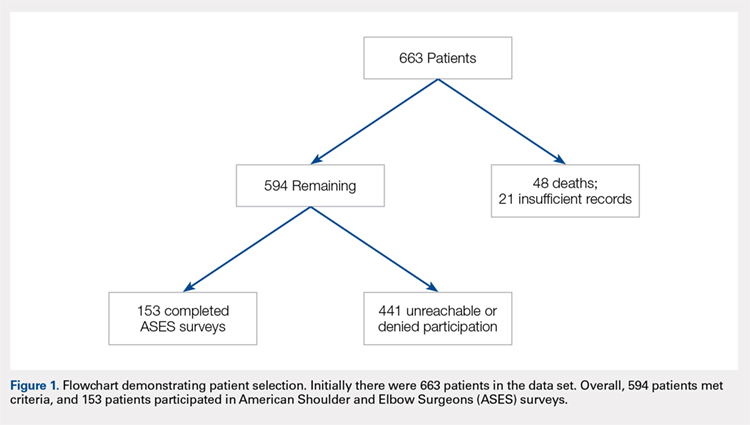
Nonoperative management consisted of sling immobilization for comfort for up to 2 weeks, during which time Codman’s exercises and elbow, forearm, wrist, and hand motion were encouraged. Active and passive shoulder mobility without restriction were also recommended progressively as tolerated. Strengthening and unrestricted lifting activities were allowed after approximately 8 to 10 weeks following the injury. Decision for surgery was at the surgeon’s discretion. Surgical indications included articular displacement and severely displaced glenoid neck fractures. Open reduction and internal fixation was performed by 1 of 4 fellowship-trained surgeons. Concomitant surgical procedures were not undertaken in the same setting. Postoperative activity consisted of sling immobilization for comfort for up to 6 weeks, during which time active and passive shoulder mobility without restriction were also recommended progressively as tolerated. Strengthening and unrestricted lifting activities were allowed after approximately 12 weeks following surgery. We considered fractures as healed if either X-rays showed healing progression to complete union or early X-rays showing signs of healing with subsequent follow-up visits indicating clinical healing (absence of pain, absence of shoulder dysfunction).
Continue to: STATISTICAL ANALYSIS...
STATISTICAL ANALYSIS
Statistical analysis was undertaken with GraphPad software. Associations were tested between positive predictive variables and functional outcomes. Variables included gender, mechanism, fracture classification, patient comorbidities, social factors, associated injuries, and type of treatment. A Mann-Whitney rank test was used to test for associations between nonparametric variables, including patient age. In all cases, P < .05 was considered significant.
RESULTS
Complete clinical and radiographic data were available for 594 patients. This included 462 men and 132 women, with a mean age of 42.8 years (range, 15-92 years). Twenty-four patients (4.0%) sustained bilateral fractures, and 31 fractures (5.0%) were open. All fractures healed primarily. A total of 153 patients completed the ASES questionnaire at a mean of 62 months after injury (Table 1). This group was similar to the entire population with respect to age, gender, and type of treatment. In all, 135 patients had been injured by a high-energy mechanism (88%), and the fracture pattern as per the Arbeitsgemeinschaft für Osteosynthesefragen/Orthopaedic Trauma Association (AO/OTA) classification consisted of 14A (no glenoid involvement) (n = 139; 91%) and 14B/C (glenoid involvement) (n = 14; 9.2%).19 The mean ASES score for our entire sample was 79.3 (minimally functionally impaired). In all, 117 patients (76%) reported minimal functional deficit (ASES, 61-100), 29 (19%) reported moderate functional deficit (ASES, 31-60), and only 7 (4.6%) reported maximum functional deficit (ASES, 0-30). Gender and age were not associated with functional outcome scores.
Table 1. Patient Demographics and Etiology of Scapula Fractures.
| n |
Gender |
|
Men | 119 (77.8%) |
Women | 34 (22.2%) |
Mechanism |
|
Motorcycle crash | 48 (31.4%) |
Motor vehicle collision | 38 (24.8%) |
Fall from stand | 14 (9.2%) |
Fall from height | 13 (8.5%) |
Pedestrian vs vehicle | 11 (7.2%) |
Crush | 7 (4.5%) |
Gunshot | 5 (3.3%) |
Other | 17 (11.1%) |
Fracture Pattern |
|
14A | 139 (88.2%) |
14B/C | 14 (11.8%) |
Fifteen patients (9.8%) were treated surgically. They had a higher mean ASES score vs non-surgically treated patients (92.1 vs 77.9; P = .03) (Table 2). However, when patients were divided into 14A and 14B/C fracture patterns, there was only a significant advantage in outcome scores for operative vs nonoperative care in the 14B/C classification (96.0 vs 75.7; P < .05); meanwhile, surgery for scapular body fractures (14A) was not associated with better outcome scores (90.2 vs 78.3; P = .14). Unfortunately, assessment of these comparisons within classification groups resulted in underpowered analyses for these small groups.
Table 2. Number of ASES Surveys Completed and Mean ASES Score for Each Treatment Type and Fracture Classification
| n | Mean ASES | Standard Error |
Surgical (total) | 15 | 92.1a | 3.5 |
Surgical 14A | 10 | 90.2 | 4.9 |
Surgical 14B/C | 5 | 96.0a | 3.2 |
Non-surgical (total) | 138 | 77.9a | 2.1 |
Nonsurgical. 14A | 129 | 78.3 | 2.2 |
Nonsurgical 14B/C | 9 | 75.7a | 6.5 |
aP < 0.05.
Abbreviation: ASES, American Shoulder and Elbow Surgeons.
Table 3 shows the ASES scores for patients with various types of associated chest and shoulder injuries. Only 7 patients (4.6%) had injuries isolated to the scapula. Thirty-three patients (22%) had associated clavicle fractures, and 102 patients (67%) sustained concomitant chest wall injuries, including rib fractures (n = 88) and pulmonary injuries (n = 71). Patients with associated chest wall injuries did not have worse mean ASES scores than those without chest wall injuries (80.9 vs 78.2; P = .49). Additionally, patients who had concomitant clavicle fractures did not report worse scores than those who did not (83.2 vs 78.6; P = .46).
Table 3. Concomitant Injuries and Mean American Shoulder and Elbow Surgeons (ASES) Scores
| n | Mean ASES | Standard Error |
Clavicle fracture | 33 (21.6%) | 83.2 | 3.6 |
No clavicle fracture | 120 (78.4%) | 78.6 | 2.2 |
Chest wall injury | 102 (66.7%) | 80.9 | 2.1 |
Rib fracture | 31 (20.3%) | 82.4 | 3.6 |
Lung Injury | 14 (9.2%) | 80.8 | 5.5 |
Rib Fracture + Lung Injury | 57 (37.3%) | 80.2 | 3.0 |
No chest wall injury | 51 (33.3%) | 78.2 | 3.8 |
Isolated scapula fracture | 7 (4.6%) | 92.4 | 6.5 |
The majority of patients were self-reported smokers (54%) and alcohol drinkers (64%) (Table 4). Aspects of social history were associated with differences in functional outcome scores. Non-smokers had a higher mean ASES score than both current smokers (84.5 vs 72.8; P = .02) and patients with any lifetime history of smoking (84.5 vs 73.3; P = .01) (Figure 2). There was no significant difference in shoulder function scores between patients identified as non-drinkers and those who reported consuming alcohol at moderate levels (83.9 vs 78.9; P = .26); however, patients who had a documented history of alcohol abuse had lower mean ASES scores than those who reported being non-drinkers (70.3 vs 83.9; P < .05).
Table 4. Substance Use and Functional Outcome Scores
| n | Mean ASES | Standard Error |
Non-smoker | 57 (46.3%) | 84.5a | 2.9 |
History of smoking | 66 (53.7%) | 73.3a | 3.0 |
Smoker | 45 (36.6%) | 72.8a | 3.8 |
Former | 21 (17.1%) | 74.6 | 5.1 |
No alcohol consumption | 46 (36.2%) | 83.9a | 3.1 |
Moderate alcohol use | 65 (51.2%) | 78.9 | 2.9 |
Alcohol abuse | 16 (12.6%) | 70.3a | 7.3 |
aP < 0.05.
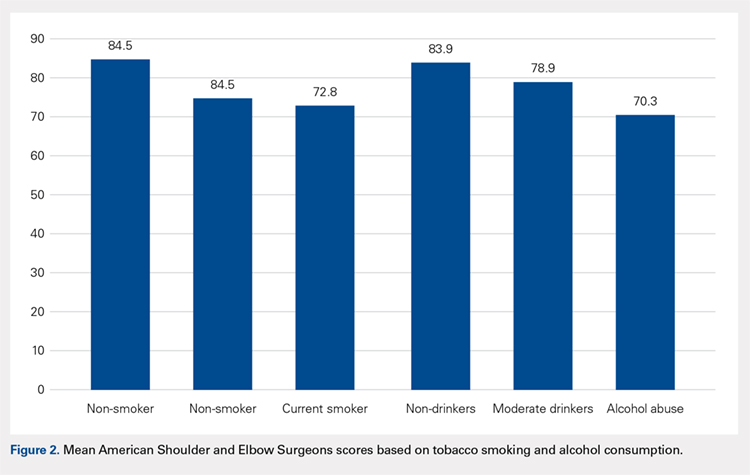
Continue to: DISCUSSION...
DISCUSSION
Patients with scapular fractures often require a complex set of treatment decisions due to high rates of concomitant injuries.2,20-22 A lack of large studies on long-term scapular function, as well as evidence that some patients treated conservatively for scapular fractures experience functional deficit and pain, inspired us to investigate the recovery process after scapular fractures through radiographs and the ASES survey.7 Further, we attempted to identify any factors that may be associated with poor functional results. Our review of long-term outcomes after scapular fractures demonstrates that they not only heal well but also have a good functional outcome in most cases. Over 95% had acceptable ASES scores, with both 14A and 14B/C having similar return of function. While both operatively and nonoperatively treated patients had scores indicating minimal functional impairment, those treated surgically had better scores overall. Surprisingly, concomitant injuries, including chest wall injuries, did not portend a worse shoulder outcome in our patients. The factors that were associated with worse outcome were tobacco use and alcohol abuse.
Beyond these findings, we attempted to comment on surgical indications, which have been highly debated.2,3 For example, the medial displacement at which studies suggest extra-articular fractures merit surgery ranges from >10 mm to >20 mm;8-11 similarly, the indication for surgery based on displacement of intra-articular fractures ranges from >2 mm to >5 mm, depending on the author.12-16 Glenoid articular fractures or neck fractures are other potential indications for operative treatment. In fact, a review of 520 scapular fractures from multiple studies found that 80% of those with glenoid involvement were treated operatively, while only 52% of those with exclusive acromion and/or coracoid involvement, and 1% of those with exclusive scapular body involvement were treated operatively.5 Some reports indicate that 14B/C fractures, especially those that are displaced or complex, show good functional outcomes and low complication rates after fixation.5,23 In this study, articular fractures of the glenoid were treated operatively more often than extra-articular fractures. We attempted to determine the impact of surgical care on functional outcomes according to fracture type, but we were limited by the small number of surgical patients when reviewing the 14A and 14B/C groups. As a whole, surgical patients had better outcomes than non-surgical patients. We believe this difference is clinically relevant and suggests a potential group of patients who may benefit from fixation. Further investigation is needed to better characterize these injuries and to develop specific recommendations.
This study yielded interesting results related to substance abuse. It has previously been shown that tobacco smoking and alcohol abuse have both been associated with poor bone health.24 Studies have suggested that exposure to nicotine and other chemical components in cigarettes can lead to delayed healing, higher rates of nonunion, and decreased mechanical strength of bone.25-29 Additionally, alcohol abuse has been associated with decreased bone mass and poor bone formation.24,30,31 Although we did not measure bone density or quantitate time of healing, this study provides added insight in that the healed fractures of smokers and patients with a history of alcohol abuse showed lower levels of shoulder function, as measured by ASES scores after similar initial injuries and similar follow-up periods. These results suggest that chemical, social, or a combination of these factors affect muscular recovery, other aspects of post-fracture recovery, and/or levels of baseline physical or mental impairment beyond those detailed in previous studies of bone health and substance abuse. For example, return to work was a scored category in the ASES survey that we used to asses the return of shoulder function, and several studies have shown that factors such as education level, coping abilities, and baseline functioning (cognitive, social, and physical) all have a significant impact on rates of return to work, independently of injury type.6,32-35 It is possible, then, that other aspects of the ASES survey are affected by factors that may be more prevalent in populations engaging in substance abuse. From both perspectives, these data highlight the importance of addressing tobacco use and alcohol abuse as a part of caring for all trauma patients, including those with scapular fractures, regardless of their high rates of radiographic healing. They also provide insight for prognosticating and setting patient expectations after scapular fractures.
Continue to: This study addressed the relationship between...
This study addressed the relationship between concomitant chest wall injuries and recovery of shoulder function after scapular fracture. Previous studies have suggested that concomitant chest wall injuries, such as rib fractures, cause more pain and may adversely impact the return of function in patients who have sustained scapular body fractures.1 These results, however, occurred in the setting of a much shorter follow-up, in which Disability of Arm, Shoulder, and Hand (DASH) surveys were distributed 6 months post-injury, 12 months post-injury, and once at last follow-up (<3 years). At our significantly later average follow-up, chest wall injuries did not portend a worse return of shoulder function, in contrast to our hypothesis. Our lack of findings of a worse return of function in patients with chest wall injuries, in light of previous literature, suggests that this association could become less distinct as the initial injury becomes more remote and has had more time to heal. Farther out from injury, patients seem to function similarly, regardless of chest wall injury history.
This study was limited by several factors. First, the surgically treated group was considerably smaller than the nonoperative group, which made drawing statistically significant comparisons between them challenging. Although there were no apparent differences between the group who completed ASES surveys and those who did not, only collecting ASES data on 153 of the 663 patients introduces a possible selection bias in this analysis. Additionally, due to the retrospective nature of this study, we were not able to ascertain the specific surgical indications used by individual surgeons. Again, the nature of this study also made it implausible to separate fractures beyond the simple 14A vs 14B/C classification. For example, we did not routinely have access to computed tomography scans to provide exact measurements of displacement, angulation, or step-off; therefore, we were unable to compare our fracture parameters to those mentioned in studies with more specific surgical indications. We also did not have information regarding pre-existing shoulder dysfunction, which could negatively affect ASES scores. Finally, accurate measures of certain social history factors can be difficult to achieve; smoking, alcohol consumption, and alcohol abuse may be subject to underreporting.
CONCLUSION
We assessed parameters that may affect return of shoulder function after scapular fracture. Our results indicate that both 14A and 14B/C fractures have similarly high rates of healing and minimal functional impairment. Patients treated operatively typically had better shoulder functional outcomes. Current or past tobacco use or alcohol abuse was associated with worse functional outcome scores. This could suggest chemical, social, or a combination of these factors affecting muscular recovery and/or greater levels of baseline functional impairment. Finally, concomitant chest wall injuries may not negatively affect shoulder outcome, contrasting with data from previous studies on the more immediate post-injury period.
1. Dimitroulias A, Molinero KG, Krenk DE, Muffly MT, Altman DT, Altman GT. Outcomes of nonoperatively treated displaced scapular body fractures. Clin Orthop Relat Res. 2011;469(5):1459-1465. doi:10.1007/s11999-010-1670-4.
2. Voleti PB, Namdari S, Mehta S. Fractures of the scapula. Adv Orthop. 2012;2012:903850. doi:10.1155/2012/903850.
3. Cole PA, Gauger EM, Schroder LK. Management of scapular fractures. J Am Acad Orthop Surg. 2012;20(3):130-141. doi:10.5435/JAAOS-20-03-130.
4. Salimi J, Khaji A, Karbakhsh M, Saadat S, Eftekhar B. Scapular fracture: lower severity and mortality. Sao Paulo Med J. 2008;126(3):186-189. doi:10.1590/S1516-31802008000300009.
5. Anavian J, Gauger EM, Schroder LK, Wijdicks CA, Cole PA. Surgical and functional outcomes After operative management of complex and displaced intra-articular glenoid fractures. J Bone Joint Surg Am. 2012;94(7):645-653. doi:10.2106/JBJS.J.00896.
6. Brenneman FD, Redelmeier DA, Boulanger BR, McLellan BA, Culhane JP. Long-term outcomes in blunt trauma: who goes back to work? J Trauma. 1997;42(5):778-781. doi:10.1097/00005373-199705000-00004.
7. Schofer MD, Sehrt AC, Timmesfeld N, Störmer S, Kortmann HR. Fractures of the scapula: long-term results after conservative treatment. Arch Orthop Trauma Surg. 2009;129(11):1511-1519. doi:10.1007/s00402-009-0855-3.
8. Ada JR, Miller ME. Scapular fractures - analysis of 113 cases. Clin Orthop Relat Res. 1991:174-180.
9. Herrera DA, Anavian J, Tarkin IS, Armitage BA, Schroder LK, Cole PA. Delayed operative management of fractures of the scapula. J Bone Joint Surg Br. 2009;91(5):619-626. doi:10.1302/0301-620X.91B5.22158.
10. Jones CB, Sietsema DL. Analysis of operative versus nonoperative treatment of displaced scapular fractures. Clin Orthop Relat Res. 2011;469(12):3379-3389. doi:10.1007/s11999-011-2016-6.
11. Khallaf F, Mikami A, Al-Akkad M. The use of surgery in displaced scapular neck fractures. Med Princ Pract. 2006;15(6):443-448. doi:10.1159/000095491.
12. Adam FF. Surgical treatment of displaced fractures of the glenoid cavity. Int Orthop. 2002;26(3):150-153. doi:10.1007/s00264-002-0342-8.
13. Kavanagh BF, Bradway JK, Cofield RH. Open reduction and internal fixation of displaced intraarticular fractures of the glenoid fossa. J Bone Joint Surg Am. 1993;75(4):479-484.
14. Leung KS, Lam TP, Poon KM. Operative treatment of displaced intra-articular glenoid fractures. Injury. 1993;24(5):324-328. doi:10.1016/0020-1383(93)90056-C.
15. Mayo KA, Benirschke SK, Mast JW. Displaced fractures of the glenoid fossa. Results of open reduction and internal fixation. Clin Orthop Relat Res. 1998:122-130. doi:10.1097/00003086-199802000-00015.
16. Schandelmaier P, Blauth M, Schneider C, Krettek C. Fractures of the glenoid treated by operation. A 5-to 23-year follow-up of 22 cases. J Bone Joint Surg Br. 2002;84(2):173-177. doi:10.1302/0301-620X.84B2.12357.
17. Beaton D, Richards RR. Assessing the reliability and responsiveness of 5 shoulder questionnaires. J Shoulder Elbow Surg. 1998;7(6):565-572. doi:10.1016/S1058-2746(98)90002-7.
18. Michener LA, McClure PW, Sennett BJ. American shoulder and elbow surgeons standardized shoulder assessment form patient self-report section: reliability, validity, and responsiveness. J Shoulder Elbow Surg. 2002;11(6):587-594. doi:10.1067/mse.2002.127096.
19. Marsh JL, Slongo TF, Agel J, et al. Fracture and dislocation classification compendium-2007 - Orthopedic Trauma Association classification. Orthop Trauma. 2007;21:S1-S133.
20. Armstrong CP, Van der Spuy J. The fractured scapula: importance and management based on a series of 62 patients. Injury. 1984;15(5):324-329. doi:10.1016/0020-1383(84)90056-1.
21. McGahan JP, Rab GT, Dublin A. Fractures of the scapula. J Trauma. 1980;20(10):880-883. doi:10.1097/00005373-198010000-00011.
22. Thompson DA, Flynn TC, Miller PW, Fischer RP. The significance of scapular fractures. J Trauma. 1985;25(10):974-977. doi:10.1097/00005373-198510000-00008.
23. Zlowodzki M, Bhandari M, Zelle BA, Kregor PJ, Cole PA. Treatment of scapula fractures: systematic review of 520 fractures in 22 case series. J Orthop Trauma. 2006;20(3):230-233. doi:10.1097/00005131-200603000-00013.
24. Fini M, Giavaresi G, Salamanna F, et al. Harmful lifestyles on orthopedic implantation surgery: a descriptive review on alcohol and tobacco use. J Bone Miner Metab. 2011;29(6):633-644. doi:10.1007/s00774-011-0309-1.
25. Donigan JA, Fredericks DC, Nepola JV, Smucker JD. The effect of transdermal nicotine on fracture healing in a rabbit model. J Orthop Trauma. 2012;26(12):724-727. doi:10.1097/BOT.0b013e318270466f.
26. Harvey EJ, Agel J, Selznick HS, Chapman JR, Henley MB. Deleterious effect of smoking on healing of open tibia-shaft fractures. Am J Orthop. 2002;31(9):518-521.
27. Hernigou J, Schuind F. Smoking as a predictor of negative outcome in diaphyseal fracture healing. Int Orthop. 2013;37(5):883-887. doi:10.1007/s00264-013-1809-5.
28. Hoogendoorn JM, van der Werken C. The adverse effects of smoking on healing of open tibial fractures. Ned Tijdschr Geneeskd. 2002;146(35):1640-1644.
29. Kyrö A, Usenius JP, Aarnio M, Kunnamo I, Avikainen V. Are smokers a risk group for delayed healing of tibial shaft fractures? Ann Chir Gynaecol. 1993;82(4):254-262.
30. Farley JR, Fitzsimmons R, Taylor AK, Jorch UM, Lau KH. Direct effects of ethanol on bone resorption and formation in vitro. Arch Biochem Biophys. 1985;238(1):305-314. doi:10.1016/0003-9861(85)90169-9.
31. Turner RT. Skeletal response to alcohol. Alcoholism Clin Exp Res. 2000;24(11):1693-1701. doi:10.1111/j.1530-0277.2000.tb01971.x.
32. MacKenzie EJ, Morris JA, Jurkovich GJ, et al. Return to work following injury: the role of economic, social, and job-related factors. Am J Public Health. 1998;88(11):1630-1637. doi:10.2105/AJPH.88.11.1630.
33. Schnyder U, Moergeli H, Klaghofer R, Sensky T, Buchi S. Does patient cognition predict time off from work after life-threatening accidents? Am J Psychiatry. 2003;160(11):2025-2031. doi:10.1176/appi.ajp.160.11.2025.
34. Soberg HL, Finset A, Bautz-Holter E, Sandvik L, Roise O. Return to work after severe multiple injuries: A multidimensional approach on status 1 and 2 years postinjury. J Trauma. 2007;62(2):471-481. doi:10.1097/TA.0b013e31802e95f4.
35. Soberg HL, Roise O, Bautz-Holter E, Finset A. Returning to work after severe multiple injuries: multidimensional functioning and the trajectory from injury to work at 5 years. J Trauma. 2011;71(2):425-434. doi:10.1097/TA.0b013e3181eff54f.
ABSTRACT
The injury parameters and patient characteristics that affect function after scapular fracture are poorly defined. We performed a retrospective review of 594 adult patients with a minimum 12-month follow-up after scapular fracture. Functional outcomes were prospectively assessed using the American Shoulder and Elbow Surgeons (ASES) survey in 153 patients after a mean of 62 months of follow-up. The population was 78% male, and 88% had injuries caused by a high-energy event. Only 4.6% had injuries isolated to the scapula. All fractures healed primarily and the mean ASES score was 79.3, indicating minimal functional impairment. However, 7 patients (4.6%) reported severe functional deficits. Fifteen patients (9.8%) underwent open reduction and internal fixation. These patients had a better mean ASES score than those who were treated nonoperatively (92.1 vs 77.9, P = .03). When fracture types were analyzed individually, there was an advantage to surgery in fractures involving the glenoid (96.0 vs 75.7, P < .05). Concomitant chest wall injury or the presence of adjacent fractures did not affect functional outcomes. Smokers had a worse mean score (73.3 vs 84.5, P = .01), as did patients with a history of alcohol abuse (70.3 vs 83.9, P < .05). In conclusion, mean ASES scores indicated good function overall. Patients with a history of tobacco use or alcohol abuse had worse outcome scores.
Continue to: Scapular fractures occur frequently due to high-energy trauma...
Scapular fractures occur frequently due to high-energy trauma, with concomitant injuries seen in approximately 90% of cases.1-4 As a result, treatment is often surrounded by other difficult medical decisions, and factors affecting outcomes can be multifaceted. The gaps in our understanding of long-term outcomes with current treatment modalities have recently come to light, especially when it comes to determining indications for surgery.
Specifically, there is very little literature on radiographic healing and long-term shoulder function in larger samples of scapular fractures; additionally, there is evidence that some patients do not experience full functional recovery.3,5-7 Studies assessing return of function in patients treated nonoperatively have shown decreased mobility and persistence of pain.7 Some of these findings could be due to variability in surgical indications.2,4 While the majority of fractures are treated nonoperatively, the decision to operate has recently been one of debate. Prior literature has suggested highly variable measurements of angulation and extra-articular displacement at which surgery is recommended.1 For example, indications for surgery measured by the medial displacement of extra-articular fractures range from >10 mm to >20 mm;8-11 similarly, the displacement of intra-articular fractures meriting surgery ranges from >2 mm to >5 mm, depending on the author.12-16
The current debate over surgical indications for less severe scapular fractures, as well as the potential for chronic pain and stiffness calls for a thorough examination of factors affecting functional outcomes. The purpose of this study is to determine which patient factors, fracture patterns, and treatment modalities were associated with differences in healing and return of shoulder function. We hypothesized that certain aspects of the patient’s social history (tobacco, alcohol) as well as concomitant chest wall injuries may be associated with poor outcome scores and lower levels of function. We further hypothesized that glenoid fractures would affect function more than body fractures, and we did not expect to see a significant difference in outcomes between operative and nonoperative treatment.
MATERIALS AND METHODS
This study was approved by the Institutional Review Board. A registry at our level 1 trauma center was queried to identify 663 skeletally mature patients with scapular fractures between 1999 and 2011. Forty-eight patients had died prior to the study, and 21 patients had insufficient radiography and/or clinical follow-up (Figure 1). To be included, patients were required to have at least 1 year of follow-up to assess healing. Data on patient demographics, fracture classification, etiology of injury, concomitant injuries (clavicle fractures, rib fractures, pulmonary injuries), comorbidities, alcohol use, and tobacco use were collected retrospectively for the remaining 594 patients. Patients were then prospectively contacted via telephone and mail, employing 3 Internet search engines as needed, in an attempt to obtain current contact information. Three patients declined to participate, and 438 were not reachable after multiple attempts. Outcome scores for the remaining 153 patients were determined with the Modified American Shoulder and Elbow Surgeons (ASES) Shoulder Form.17 Scores were measured out of 100, with 0 to 30 representing maximally impaired, 31 to 60 representing moderately impaired, and 61 to 100 representing minimally impaired shoulder function.18 Due to the retrospective identification of the patients, no pre-injury shoulder function scores were collected. Given that many patients were unreachable, or reachable but not living in close proximity to the hospital, patients did not routinely return for re-evaluation for this study.
Nonoperative management consisted of sling immobilization for comfort for up to 2 weeks, during which time Codman’s exercises and elbow, forearm, wrist, and hand motion were encouraged. Active and passive shoulder mobility without restriction were also recommended progressively as tolerated. Strengthening and unrestricted lifting activities were allowed after approximately 8 to 10 weeks following the injury. Decision for surgery was at the surgeon’s discretion. Surgical indications included articular displacement and severely displaced glenoid neck fractures. Open reduction and internal fixation was performed by 1 of 4 fellowship-trained surgeons. Concomitant surgical procedures were not undertaken in the same setting. Postoperative activity consisted of sling immobilization for comfort for up to 6 weeks, during which time active and passive shoulder mobility without restriction were also recommended progressively as tolerated. Strengthening and unrestricted lifting activities were allowed after approximately 12 weeks following surgery. We considered fractures as healed if either X-rays showed healing progression to complete union or early X-rays showing signs of healing with subsequent follow-up visits indicating clinical healing (absence of pain, absence of shoulder dysfunction).
Continue to: STATISTICAL ANALYSIS...
STATISTICAL ANALYSIS
Statistical analysis was undertaken with GraphPad software. Associations were tested between positive predictive variables and functional outcomes. Variables included gender, mechanism, fracture classification, patient comorbidities, social factors, associated injuries, and type of treatment. A Mann-Whitney rank test was used to test for associations between nonparametric variables, including patient age. In all cases, P < .05 was considered significant.
RESULTS
Complete clinical and radiographic data were available for 594 patients. This included 462 men and 132 women, with a mean age of 42.8 years (range, 15-92 years). Twenty-four patients (4.0%) sustained bilateral fractures, and 31 fractures (5.0%) were open. All fractures healed primarily. A total of 153 patients completed the ASES questionnaire at a mean of 62 months after injury (Table 1). This group was similar to the entire population with respect to age, gender, and type of treatment. In all, 135 patients had been injured by a high-energy mechanism (88%), and the fracture pattern as per the Arbeitsgemeinschaft für Osteosynthesefragen/Orthopaedic Trauma Association (AO/OTA) classification consisted of 14A (no glenoid involvement) (n = 139; 91%) and 14B/C (glenoid involvement) (n = 14; 9.2%).19 The mean ASES score for our entire sample was 79.3 (minimally functionally impaired). In all, 117 patients (76%) reported minimal functional deficit (ASES, 61-100), 29 (19%) reported moderate functional deficit (ASES, 31-60), and only 7 (4.6%) reported maximum functional deficit (ASES, 0-30). Gender and age were not associated with functional outcome scores.
Table 1. Patient Demographics and Etiology of Scapula Fractures.
| n |
Gender |
|
Men | 119 (77.8%) |
Women | 34 (22.2%) |
Mechanism |
|
Motorcycle crash | 48 (31.4%) |
Motor vehicle collision | 38 (24.8%) |
Fall from stand | 14 (9.2%) |
Fall from height | 13 (8.5%) |
Pedestrian vs vehicle | 11 (7.2%) |
Crush | 7 (4.5%) |
Gunshot | 5 (3.3%) |
Other | 17 (11.1%) |
Fracture Pattern |
|
14A | 139 (88.2%) |
14B/C | 14 (11.8%) |
Fifteen patients (9.8%) were treated surgically. They had a higher mean ASES score vs non-surgically treated patients (92.1 vs 77.9; P = .03) (Table 2). However, when patients were divided into 14A and 14B/C fracture patterns, there was only a significant advantage in outcome scores for operative vs nonoperative care in the 14B/C classification (96.0 vs 75.7; P < .05); meanwhile, surgery for scapular body fractures (14A) was not associated with better outcome scores (90.2 vs 78.3; P = .14). Unfortunately, assessment of these comparisons within classification groups resulted in underpowered analyses for these small groups.
Table 2. Number of ASES Surveys Completed and Mean ASES Score for Each Treatment Type and Fracture Classification
| n | Mean ASES | Standard Error |
Surgical (total) | 15 | 92.1a | 3.5 |
Surgical 14A | 10 | 90.2 | 4.9 |
Surgical 14B/C | 5 | 96.0a | 3.2 |
Non-surgical (total) | 138 | 77.9a | 2.1 |
Nonsurgical. 14A | 129 | 78.3 | 2.2 |
Nonsurgical 14B/C | 9 | 75.7a | 6.5 |
aP < 0.05.
Abbreviation: ASES, American Shoulder and Elbow Surgeons.
Table 3 shows the ASES scores for patients with various types of associated chest and shoulder injuries. Only 7 patients (4.6%) had injuries isolated to the scapula. Thirty-three patients (22%) had associated clavicle fractures, and 102 patients (67%) sustained concomitant chest wall injuries, including rib fractures (n = 88) and pulmonary injuries (n = 71). Patients with associated chest wall injuries did not have worse mean ASES scores than those without chest wall injuries (80.9 vs 78.2; P = .49). Additionally, patients who had concomitant clavicle fractures did not report worse scores than those who did not (83.2 vs 78.6; P = .46).
Table 3. Concomitant Injuries and Mean American Shoulder and Elbow Surgeons (ASES) Scores
| n | Mean ASES | Standard Error |
Clavicle fracture | 33 (21.6%) | 83.2 | 3.6 |
No clavicle fracture | 120 (78.4%) | 78.6 | 2.2 |
Chest wall injury | 102 (66.7%) | 80.9 | 2.1 |
Rib fracture | 31 (20.3%) | 82.4 | 3.6 |
Lung Injury | 14 (9.2%) | 80.8 | 5.5 |
Rib Fracture + Lung Injury | 57 (37.3%) | 80.2 | 3.0 |
No chest wall injury | 51 (33.3%) | 78.2 | 3.8 |
Isolated scapula fracture | 7 (4.6%) | 92.4 | 6.5 |
The majority of patients were self-reported smokers (54%) and alcohol drinkers (64%) (Table 4). Aspects of social history were associated with differences in functional outcome scores. Non-smokers had a higher mean ASES score than both current smokers (84.5 vs 72.8; P = .02) and patients with any lifetime history of smoking (84.5 vs 73.3; P = .01) (Figure 2). There was no significant difference in shoulder function scores between patients identified as non-drinkers and those who reported consuming alcohol at moderate levels (83.9 vs 78.9; P = .26); however, patients who had a documented history of alcohol abuse had lower mean ASES scores than those who reported being non-drinkers (70.3 vs 83.9; P < .05).
Table 4. Substance Use and Functional Outcome Scores
| n | Mean ASES | Standard Error |
Non-smoker | 57 (46.3%) | 84.5a | 2.9 |
History of smoking | 66 (53.7%) | 73.3a | 3.0 |
Smoker | 45 (36.6%) | 72.8a | 3.8 |
Former | 21 (17.1%) | 74.6 | 5.1 |
No alcohol consumption | 46 (36.2%) | 83.9a | 3.1 |
Moderate alcohol use | 65 (51.2%) | 78.9 | 2.9 |
Alcohol abuse | 16 (12.6%) | 70.3a | 7.3 |
aP < 0.05.
Continue to: DISCUSSION...
DISCUSSION
Patients with scapular fractures often require a complex set of treatment decisions due to high rates of concomitant injuries.2,20-22 A lack of large studies on long-term scapular function, as well as evidence that some patients treated conservatively for scapular fractures experience functional deficit and pain, inspired us to investigate the recovery process after scapular fractures through radiographs and the ASES survey.7 Further, we attempted to identify any factors that may be associated with poor functional results. Our review of long-term outcomes after scapular fractures demonstrates that they not only heal well but also have a good functional outcome in most cases. Over 95% had acceptable ASES scores, with both 14A and 14B/C having similar return of function. While both operatively and nonoperatively treated patients had scores indicating minimal functional impairment, those treated surgically had better scores overall. Surprisingly, concomitant injuries, including chest wall injuries, did not portend a worse shoulder outcome in our patients. The factors that were associated with worse outcome were tobacco use and alcohol abuse.
Beyond these findings, we attempted to comment on surgical indications, which have been highly debated.2,3 For example, the medial displacement at which studies suggest extra-articular fractures merit surgery ranges from >10 mm to >20 mm;8-11 similarly, the indication for surgery based on displacement of intra-articular fractures ranges from >2 mm to >5 mm, depending on the author.12-16 Glenoid articular fractures or neck fractures are other potential indications for operative treatment. In fact, a review of 520 scapular fractures from multiple studies found that 80% of those with glenoid involvement were treated operatively, while only 52% of those with exclusive acromion and/or coracoid involvement, and 1% of those with exclusive scapular body involvement were treated operatively.5 Some reports indicate that 14B/C fractures, especially those that are displaced or complex, show good functional outcomes and low complication rates after fixation.5,23 In this study, articular fractures of the glenoid were treated operatively more often than extra-articular fractures. We attempted to determine the impact of surgical care on functional outcomes according to fracture type, but we were limited by the small number of surgical patients when reviewing the 14A and 14B/C groups. As a whole, surgical patients had better outcomes than non-surgical patients. We believe this difference is clinically relevant and suggests a potential group of patients who may benefit from fixation. Further investigation is needed to better characterize these injuries and to develop specific recommendations.
This study yielded interesting results related to substance abuse. It has previously been shown that tobacco smoking and alcohol abuse have both been associated with poor bone health.24 Studies have suggested that exposure to nicotine and other chemical components in cigarettes can lead to delayed healing, higher rates of nonunion, and decreased mechanical strength of bone.25-29 Additionally, alcohol abuse has been associated with decreased bone mass and poor bone formation.24,30,31 Although we did not measure bone density or quantitate time of healing, this study provides added insight in that the healed fractures of smokers and patients with a history of alcohol abuse showed lower levels of shoulder function, as measured by ASES scores after similar initial injuries and similar follow-up periods. These results suggest that chemical, social, or a combination of these factors affect muscular recovery, other aspects of post-fracture recovery, and/or levels of baseline physical or mental impairment beyond those detailed in previous studies of bone health and substance abuse. For example, return to work was a scored category in the ASES survey that we used to asses the return of shoulder function, and several studies have shown that factors such as education level, coping abilities, and baseline functioning (cognitive, social, and physical) all have a significant impact on rates of return to work, independently of injury type.6,32-35 It is possible, then, that other aspects of the ASES survey are affected by factors that may be more prevalent in populations engaging in substance abuse. From both perspectives, these data highlight the importance of addressing tobacco use and alcohol abuse as a part of caring for all trauma patients, including those with scapular fractures, regardless of their high rates of radiographic healing. They also provide insight for prognosticating and setting patient expectations after scapular fractures.
Continue to: This study addressed the relationship between...
This study addressed the relationship between concomitant chest wall injuries and recovery of shoulder function after scapular fracture. Previous studies have suggested that concomitant chest wall injuries, such as rib fractures, cause more pain and may adversely impact the return of function in patients who have sustained scapular body fractures.1 These results, however, occurred in the setting of a much shorter follow-up, in which Disability of Arm, Shoulder, and Hand (DASH) surveys were distributed 6 months post-injury, 12 months post-injury, and once at last follow-up (<3 years). At our significantly later average follow-up, chest wall injuries did not portend a worse return of shoulder function, in contrast to our hypothesis. Our lack of findings of a worse return of function in patients with chest wall injuries, in light of previous literature, suggests that this association could become less distinct as the initial injury becomes more remote and has had more time to heal. Farther out from injury, patients seem to function similarly, regardless of chest wall injury history.
This study was limited by several factors. First, the surgically treated group was considerably smaller than the nonoperative group, which made drawing statistically significant comparisons between them challenging. Although there were no apparent differences between the group who completed ASES surveys and those who did not, only collecting ASES data on 153 of the 663 patients introduces a possible selection bias in this analysis. Additionally, due to the retrospective nature of this study, we were not able to ascertain the specific surgical indications used by individual surgeons. Again, the nature of this study also made it implausible to separate fractures beyond the simple 14A vs 14B/C classification. For example, we did not routinely have access to computed tomography scans to provide exact measurements of displacement, angulation, or step-off; therefore, we were unable to compare our fracture parameters to those mentioned in studies with more specific surgical indications. We also did not have information regarding pre-existing shoulder dysfunction, which could negatively affect ASES scores. Finally, accurate measures of certain social history factors can be difficult to achieve; smoking, alcohol consumption, and alcohol abuse may be subject to underreporting.
CONCLUSION
We assessed parameters that may affect return of shoulder function after scapular fracture. Our results indicate that both 14A and 14B/C fractures have similarly high rates of healing and minimal functional impairment. Patients treated operatively typically had better shoulder functional outcomes. Current or past tobacco use or alcohol abuse was associated with worse functional outcome scores. This could suggest chemical, social, or a combination of these factors affecting muscular recovery and/or greater levels of baseline functional impairment. Finally, concomitant chest wall injuries may not negatively affect shoulder outcome, contrasting with data from previous studies on the more immediate post-injury period.
1. Dimitroulias A, Molinero KG, Krenk DE, Muffly MT, Altman DT, Altman GT. Outcomes of nonoperatively treated displaced scapular body fractures. Clin Orthop Relat Res. 2011;469(5):1459-1465. doi:10.1007/s11999-010-1670-4.
2. Voleti PB, Namdari S, Mehta S. Fractures of the scapula. Adv Orthop. 2012;2012:903850. doi:10.1155/2012/903850.
3. Cole PA, Gauger EM, Schroder LK. Management of scapular fractures. J Am Acad Orthop Surg. 2012;20(3):130-141. doi:10.5435/JAAOS-20-03-130.
4. Salimi J, Khaji A, Karbakhsh M, Saadat S, Eftekhar B. Scapular fracture: lower severity and mortality. Sao Paulo Med J. 2008;126(3):186-189. doi:10.1590/S1516-31802008000300009.
5. Anavian J, Gauger EM, Schroder LK, Wijdicks CA, Cole PA. Surgical and functional outcomes After operative management of complex and displaced intra-articular glenoid fractures. J Bone Joint Surg Am. 2012;94(7):645-653. doi:10.2106/JBJS.J.00896.
6. Brenneman FD, Redelmeier DA, Boulanger BR, McLellan BA, Culhane JP. Long-term outcomes in blunt trauma: who goes back to work? J Trauma. 1997;42(5):778-781. doi:10.1097/00005373-199705000-00004.
7. Schofer MD, Sehrt AC, Timmesfeld N, Störmer S, Kortmann HR. Fractures of the scapula: long-term results after conservative treatment. Arch Orthop Trauma Surg. 2009;129(11):1511-1519. doi:10.1007/s00402-009-0855-3.
8. Ada JR, Miller ME. Scapular fractures - analysis of 113 cases. Clin Orthop Relat Res. 1991:174-180.
9. Herrera DA, Anavian J, Tarkin IS, Armitage BA, Schroder LK, Cole PA. Delayed operative management of fractures of the scapula. J Bone Joint Surg Br. 2009;91(5):619-626. doi:10.1302/0301-620X.91B5.22158.
10. Jones CB, Sietsema DL. Analysis of operative versus nonoperative treatment of displaced scapular fractures. Clin Orthop Relat Res. 2011;469(12):3379-3389. doi:10.1007/s11999-011-2016-6.
11. Khallaf F, Mikami A, Al-Akkad M. The use of surgery in displaced scapular neck fractures. Med Princ Pract. 2006;15(6):443-448. doi:10.1159/000095491.
12. Adam FF. Surgical treatment of displaced fractures of the glenoid cavity. Int Orthop. 2002;26(3):150-153. doi:10.1007/s00264-002-0342-8.
13. Kavanagh BF, Bradway JK, Cofield RH. Open reduction and internal fixation of displaced intraarticular fractures of the glenoid fossa. J Bone Joint Surg Am. 1993;75(4):479-484.
14. Leung KS, Lam TP, Poon KM. Operative treatment of displaced intra-articular glenoid fractures. Injury. 1993;24(5):324-328. doi:10.1016/0020-1383(93)90056-C.
15. Mayo KA, Benirschke SK, Mast JW. Displaced fractures of the glenoid fossa. Results of open reduction and internal fixation. Clin Orthop Relat Res. 1998:122-130. doi:10.1097/00003086-199802000-00015.
16. Schandelmaier P, Blauth M, Schneider C, Krettek C. Fractures of the glenoid treated by operation. A 5-to 23-year follow-up of 22 cases. J Bone Joint Surg Br. 2002;84(2):173-177. doi:10.1302/0301-620X.84B2.12357.
17. Beaton D, Richards RR. Assessing the reliability and responsiveness of 5 shoulder questionnaires. J Shoulder Elbow Surg. 1998;7(6):565-572. doi:10.1016/S1058-2746(98)90002-7.
18. Michener LA, McClure PW, Sennett BJ. American shoulder and elbow surgeons standardized shoulder assessment form patient self-report section: reliability, validity, and responsiveness. J Shoulder Elbow Surg. 2002;11(6):587-594. doi:10.1067/mse.2002.127096.
19. Marsh JL, Slongo TF, Agel J, et al. Fracture and dislocation classification compendium-2007 - Orthopedic Trauma Association classification. Orthop Trauma. 2007;21:S1-S133.
20. Armstrong CP, Van der Spuy J. The fractured scapula: importance and management based on a series of 62 patients. Injury. 1984;15(5):324-329. doi:10.1016/0020-1383(84)90056-1.
21. McGahan JP, Rab GT, Dublin A. Fractures of the scapula. J Trauma. 1980;20(10):880-883. doi:10.1097/00005373-198010000-00011.
22. Thompson DA, Flynn TC, Miller PW, Fischer RP. The significance of scapular fractures. J Trauma. 1985;25(10):974-977. doi:10.1097/00005373-198510000-00008.
23. Zlowodzki M, Bhandari M, Zelle BA, Kregor PJ, Cole PA. Treatment of scapula fractures: systematic review of 520 fractures in 22 case series. J Orthop Trauma. 2006;20(3):230-233. doi:10.1097/00005131-200603000-00013.
24. Fini M, Giavaresi G, Salamanna F, et al. Harmful lifestyles on orthopedic implantation surgery: a descriptive review on alcohol and tobacco use. J Bone Miner Metab. 2011;29(6):633-644. doi:10.1007/s00774-011-0309-1.
25. Donigan JA, Fredericks DC, Nepola JV, Smucker JD. The effect of transdermal nicotine on fracture healing in a rabbit model. J Orthop Trauma. 2012;26(12):724-727. doi:10.1097/BOT.0b013e318270466f.
26. Harvey EJ, Agel J, Selznick HS, Chapman JR, Henley MB. Deleterious effect of smoking on healing of open tibia-shaft fractures. Am J Orthop. 2002;31(9):518-521.
27. Hernigou J, Schuind F. Smoking as a predictor of negative outcome in diaphyseal fracture healing. Int Orthop. 2013;37(5):883-887. doi:10.1007/s00264-013-1809-5.
28. Hoogendoorn JM, van der Werken C. The adverse effects of smoking on healing of open tibial fractures. Ned Tijdschr Geneeskd. 2002;146(35):1640-1644.
29. Kyrö A, Usenius JP, Aarnio M, Kunnamo I, Avikainen V. Are smokers a risk group for delayed healing of tibial shaft fractures? Ann Chir Gynaecol. 1993;82(4):254-262.
30. Farley JR, Fitzsimmons R, Taylor AK, Jorch UM, Lau KH. Direct effects of ethanol on bone resorption and formation in vitro. Arch Biochem Biophys. 1985;238(1):305-314. doi:10.1016/0003-9861(85)90169-9.
31. Turner RT. Skeletal response to alcohol. Alcoholism Clin Exp Res. 2000;24(11):1693-1701. doi:10.1111/j.1530-0277.2000.tb01971.x.
32. MacKenzie EJ, Morris JA, Jurkovich GJ, et al. Return to work following injury: the role of economic, social, and job-related factors. Am J Public Health. 1998;88(11):1630-1637. doi:10.2105/AJPH.88.11.1630.
33. Schnyder U, Moergeli H, Klaghofer R, Sensky T, Buchi S. Does patient cognition predict time off from work after life-threatening accidents? Am J Psychiatry. 2003;160(11):2025-2031. doi:10.1176/appi.ajp.160.11.2025.
34. Soberg HL, Finset A, Bautz-Holter E, Sandvik L, Roise O. Return to work after severe multiple injuries: A multidimensional approach on status 1 and 2 years postinjury. J Trauma. 2007;62(2):471-481. doi:10.1097/TA.0b013e31802e95f4.
35. Soberg HL, Roise O, Bautz-Holter E, Finset A. Returning to work after severe multiple injuries: multidimensional functioning and the trajectory from injury to work at 5 years. J Trauma. 2011;71(2):425-434. doi:10.1097/TA.0b013e3181eff54f.
TAKE-HOME POINTS
- The majority of patients with scapula fractures are multiply-injured.
- Despite being multiply-injured, most heal with minimal functional shoulder impairment.
- While concomitant injuries do not appear to affect shoulder function scores, tobacco use and alcohol abuse are associated with worse outcomes after scapula fractures.
- Most scapula fractures can be treated successfully without surgery.
- Although patients had higher average function scores after open reduction and internal fixation, further research should be done to define indications for fixation.
Epidemiology of Existing Extensor Mechanism Pathology in Primary Anterior Cruciate Ligament Ruptures in an Active-Duty Population
ABSTRACT
The purpose of this study is to determine the prevalence of potential graft-influencing pathologies of the extensor mechanism of the knee in patients presenting with a primary anterior cruciate ligament (ACL) rupture.
We performed a retrospective review of the plain radiographs and magnetic resonance imaging (MRI) of all active-duty patients presenting with a primary ACL rupture at our institution between July 2006 and February 2009. Imaging was reviewed to determine the presence of a multipartite patella, unresolved Osgood-Schlatter’s disease, and/or radiographic evidence suggestive of patella tendinopathy.
A total of 197 patients were reviewed, including 27 females and 170 males. One patient (0.5%) had a bipartite patella and 4 patients (2%) had free-floating ossicles about the tibial tuberosity consistent with unresolved Osgood-Schlatter’s disease. A total of 15 patients (7.6%) showed MRI evidence suggestive of patella tendinopathy.
This study revealed 20 patients out of 197 (10.1%) who presented with existing extensor mechanism pathologies in radiologic studies. While preoperative imaging is routinely used to confirm clinical suspicion of ACL rupture or identify associated injuries, this study shows that it can also identify existing extensor mechanism pathologies that could ultimately influence the use of an extensor mechanism graft.
Continue to: Anterior cruciate ligament (ACL) reconstruction...
Anterior cruciate ligament (ACL) reconstruction is an extremely common procedure; in fact, an estimated 60,000 to 175,000 ACL reconstructions are performed annually in the United States.1,2 One of the most widely debated aspects of ACL reconstruction is the choice of graft. Grafts are broadly categorized into allografts and autografts. The autograft selections for ACL reconstruction include patellar bone-tendon-bone (pBTB), combined semitendinosus and gracilis hamstrings (HS), free quadriceps tendon (QT)without accompanying bone block, and quadriceps tendon-bone (qTB). Allograft choices predominantly include pBTB and HS, as well as the tibialis anterior and Achilles tendons. The pBTB autograft is traditionally considered the reference standard for ACL reconstruction.3 Recent advances in allograft processing, along with improved fixation techniques and devices, have improved results following the use of soft-tissue autografts and both bony and soft tissue allografts.4 Thus, the optimal graft choice for ACL reconstruction has become controversial in light of several studies demonstrating no significant, long-term difference in clinical and/or functional outcomes based on graft selection.5-7
Given the lack of a clear gold standard in graft selection, multiple patient factors, such as age, activity demands, and patient preference, should be taken into account when considering the choice of graft. In addition, intrinsic factors that could potentially weaken an autograft should be considered. Several extensor mechanism pathological findings that are easily visualized on either plain radiographs or magnetic resonance imaging (MRI) could potentially affect graft selection. Findings such as a multipartite patella, free ossicles about the tibial tuberosity consistent with Osgood-Schlatter’s disease, and proximal patella tendon thickening suggestive of patellar tendinopathy are easily identifiable on preoperative imaging and could exert adverse effects on pBTB, QT, and qTB autografts. The purpose of this study is to identify the prevalence of these pre-existing conditions in active-duty military patients presenting with acute ACL tears.
METHODS
A retrospective review was conducted on all active-duty patients who underwent primary ACL reconstruction at our institution from July 2006 to February 2009. A systematic review of all plain radiographs and MRIs was performed on a calibrated picture archiving and communication system workstation. Imaging review was conducted by 2 of the authors. Pertinent findings included a multipartite patella, free ossicles within the patella tendon, and hypertrophy of the proximal aspect of the patella tendon. Assessment for multipartite patella and unresolved Osgood-Schlatter's disease was made using plain radiographs with MRI for confirmation. Measurements of the patella tendon were performed on the short tau inversion recovery and T2-weighted sagittal MRI images at the point of maximal tendon width. A width of ≥7 mm was considered suggestive of patella tendinopathy based on prior studies.8-10 The prevalence of each finding was then determined based on the total number of patients.
Continue to: RESULTS...
RESULTS
A total of 197 active-duty patients, including 27 females (13.7%) and 170 males (86.3%), underwent primary ACL reconstruction during the study time period. A total of 93 right knees and 104 left knees were evaluated. The average age at presentation was 29 years (range, 19-45 years).
Of the 197 patients, only 1 was found to have a multipartite patella (prevalence, 0.5%). This 37-year-old male patient showed a right bipartite patella located in the superior-lateral aspect (Figure 1).
Four patients had free ossicles within the inferior patellar tendon consistent with unresolved Osgood-Schlatter’s disease (prevalence, 2.0%) (Figure 2). All 4 patients were male, which is consistent with the higher incidence of Osgood-Schlatter’s disease in males than in females. The average age of these patients was 27.5 years (range, 22-33 years).
The most common extensor mechanism pathology present on preoperative imaging was proximal patella tendon thickening suggestive of patella tendinopathy. Thickening of the proximal portion of the patellar tendon was present in 15 of the 197 MRIs (prevalence, 7.6%) (Figure 3). The average width of this thickening was 8.49 mm (7.17-10.17 mm), and the average age of patients with radiographic evidence of patellar tendinopathy was 29.9 years (range, 20-43 years). Gender distribution was predominantly male (14 males, 1 female). Details of all extensor mechanism pathologies found are provided in the Table.
Table. Identified Extensor Mechanism Pathology
| Male | Female | Total |
Patients | 170 | 27 | 197 |
Multipartite Patella | 1 | 0 | 1 |
Osgood-Schlatter’s Disease | 4 | 0 | 4 |
Patella Tendinopathy | 14 | 1 | 15 |
|
| 20/97 (10.10%) |
|
DISCUSSION
When considering ACL reconstruction, determination of the graft type is one of the most important decisions to be made, perhaps second only to the decision to perform the surgery itself. Recent multiple, well-designed studies comparing differences among grafts have shown equivalent long-term results, leading to the lack of a universally accepted gold standard.5-7 Thus, both autograft and allograft ACL surgeries are routinely performed in the United States. Surgeons typically take into account factors such as patient age and physical demands, along with their own preferences and/or experience, when considering graft selection. A paucity of research concerning existing pathological conditions that could also influence preoperative decision-making has been observed; most reports consist only of expert opinion.11-13 Our goal is to determine the prevalence of several conditions that could potentially affect an autograft harvested from the extensor mechanism.
This study revealed an overall prevalence of 10.1% of existing extensor mechanism pathology in patients sustaining an acute ACL tear and presenting for ACL reconstruction. Only 1 (0.5%) showed evidence of a multipartite patella, which is below the reported prevalence of 0.2% to 6%.14 The presence of a multipartite patella could potentially have the most deleterious effect on a qTB autograft. Although not as commonly used as HS, QT, or pBTB autografts, some surgeons prefer a qTB autograft because of its increased surface area, bony fixation, and reported decreased donor site pain.15 A multipartite patella could complicate harvesting, disrupt the bone block, or lead to an unstable segment of the patella. These effects are of great concern since the most common location of a bipartite patella is superior-lateral and the quadriceps tendon has been shown to asymmetrically insert laterally.16 While these potential adverse effects have not been specifically studied, the availability of comparable options makes the use of a qTB autograft in the setting of a bipartite patella questionable.
Four patients (2%) revealed evidence of ossicles within the inferior patellar tendon consistent with unresolved Osgood-Schlatter’s disease. Osgood-Schlatter’s disease has been reported to occur in up to 21% of active adolescents and is historically considered a self-resolving process.17 Recent papers have reported persistent symptoms in up to 10% of patients, with a small percentage experiencing persistent free ossicles within their patella tendon on MRI.18,19 The presence of such ossicles raises concern about the integrity of the patellar tendon and questions its use as an autograft when present. This concern was published in a report with the surgeon opting to utilize an alternate graft due to the presence of unresolved Osgood-Schlatter’s disease.13
Fifteen patients (7.6%) demonstrated radiographic evidence suggestive of patella tendinopathy based on the thickness of the proximal patella tendon. Patella tendinopathy is the most common tendinopathy in skeletally mature athletes and one of the most common athletic injuries of the knee, with a reported career prevalence of 22%.20 It is described as an overuse injury due to the cumulative effect of micro trauma without an adequate healing interval. While it remains a clinical diagnosis, patellar tendinopathy often shows radiographic findings best assessed on sagittal MRIs. In general, the normal patella tendon appears as a homogenous low-intensity structure and is of uniform thickness. A tendon affected with tendinopathy typically demonstrates a focal increase in signal on T2-weighted sequences just distal to the tendon origin on the inferior pole of the patella. In addition, the patella tendon will usually demonstrate thickening, primarily in the proximal medial and posterior fibers. Patella marrow changes and indistinct tendon margins can also be present. The sensitivity and specificity of diagnosing patellar tendinopathy on MRI are 78% and 86%, respectively.20 We derived our criteria for MRI evidence suggestive of patella tendinopathy from studies by El-Khoury and colleagues,8 Johnson and colleagues,9 and Popp and colleagues.10 In a 1992 study, El-Khoury and colleagues8 compared MRI findings between a group of patients with a clinical diagnosis of patella tendonitis and a control group without knee complaints. The authors found that the average proximal patella tendon diameter in the control group was 3.7 mm while the average proximal patella tendon diameter in the patella tendinopathy group was 10.9 mm; no patella tendons in the control group were >7 mm.8 In a 1996 study, Johnson and colleagues9 determined that the most reliable MRI finding for patients with patellar tendonitis is significant thickening of the proximal patella tendon seen on the sagittal view. The average thickness in symptomatic patients was 8.5 mm (range, 5-15 mm). The average thickness in the control group was 5.5 mm. None of the control patients had a proximal tendon thickness >7 mm.9 Finally, Popp and colleagues10 reviewed the MRI of 11 knees of patients who underwent surgical débridement of chronic patellar tendonitis and reported an average proximal patella tendon thickness of 12 mm (range, 9-16 mm). We therefore used a proximal patella tendon thickness of >7 mm on the sagittal view as a radiographic finding suggestive of patella tendinopathy. No data regarding symptoms of anterior knee pain were available among our patients. Histological studies of patients with patella tendonitis have shown evidence of chronic inflammation, fibrinoid necrosis, mucoid degeneration, and synovial proliferation within the patella tendon insertion.21 Although no controlled data showing that patella tendons with a history of tendonitis are more prone to failure than those without such history when used as an autograft for ACL reconstruction, the idea of utilizing a diseased tendon for a graft is not ideal. Some surgeons question their patients regarding a history of anterior knee pain and will not use a pBTB autograft in a patient with a positive history.22
Continue to: The goal of this study is to obtain epidemiological evidence...
The goal of this study is to obtain epidemiological evidence of the prevalence of existing extensor mechanism pathologies in patients with acute ACL ruptures and determine how these pathologies may relate to the choice of graft. Out of 197 patients studied, over 10% presented with radiographic evidence of pathologies that could influence the choice of graft. This prevalence is certainly significant enough for surgeons to consider including a radiographic evaluation of the extensor mechanism in their standard ACL rupture work-up.
This study presents obvious limitations. While we report the prevalence of some extensor mechanism pathologies, no definitive evidence that recommends against the use of these autografts from these affected individuals has yet been published. In addition, our diagnosis of patella tendinopathy is based solely on MRI findings with no information regarding clinical symptoms. This limitation is a weakness as several additional studies have questioned the validity of a 7 mm proximal patella tendon thickness.23,24 Furthermore, no studies demonstrating the inferior strength of autografts with the co-existing findings described in our work have yet been performed.
CONCLUSION
We found that 10% of active-duty patients presenting for ACL reconstruction demonstrated radiographic evidence of an extensor mechanism pathology that could affect the harvesting of or integrity of select autografts. Given the recent trend of functionally equivocal results in ACL reconstructions utilizing a variety of grafts, this information could and should influence surgical recommendations for graft utilization to obtain optimal surgical results.
1. Lyman S, Koulouvaris P, Sherman S, Do H, Mandl LA, Marx RG. Epidemiology of anterior cruciate ligament reconstruction: trends, readmissions, and subsequent knee surgery. J Bone Joint Surg Am. 2009;91(10):2321-2328. doi:10.2106/JBJS.H.00539.
2. Spindler KP, Wright RW. Clinical practice. Anterior cruciate ligament tear. N Engl J Med. 2008;359(20):2135-2142. doi:10.1056/NEJMcp0804745.
3. Fu FH, Bennett CH, Lattermann CL, Ma CB. Current trends in anterior cruciate ligament reconstruction. Part 1: Biology and biomechanics of reconstruction. Am J Sports Med. 1999;27(6):821-830. doi:10.1177/03635465990270062501.
4. Mariscalco MW, Magnussen RA, Mehta D, Hewett TE, Flanigan DC, Kaeding CC. Autograft Versus nonirradiated allograft tissue for anterior cruciate ligament reconstruction: A systematic review. Am J Sports Med. 2014;42(2):492-499. doi:10.1177/0363546513497566.
5. Shaieb MD, Kan DM, Chang SK, Marumoto JM, Richardson AB. A prospective randomized comparison of patellar tendon versus semitendinosus and gracilis tendon autografts for anterior cruciate ligament reconstruction. Am J Sports Med. 2002;30(2):214-220. doi:10.1177/03635465020300021201.
6. Poehling GG, Curl WW, Lee CA, et al. Analysis of outcomes of anterior cruciate ligament repair with 5-year follow-up: Allograft versus allograft. Arthroscopy. 2005;21(7):774-785. doi:10.1016/j.arthro.2005.04.112.
7. Krych AJ, Jackson JD, Hoskin TL, Dahm DL. A meta-analysis of patellar tendon autograft versus patellar tendon allograft in anterior cruciate ligament reconstruction. Arthroscopy. 2008;24(3):292-298. doi:10.1016/j.arthro.2007.08.029.
8. El-Khoury GY, Wira RL, Berbaum KS, Pope TL, Monu JUV. MR imaging of patellar tendinitis. Radiology. 1992;184(3):849-854. doi:10.1148/radiology.184.3.1509078.
9. Johnson DP, Wakeley CJ, Watt I. Magnetic resonance imaging of patellar tendonitis. J Bone Joint Surg Br. 1996;78(3):452-457. doi:10.1302/0301-620X.78B3.0780452.
10. Popp JE, Yu JS, Kaeding CC. Recalcitrant patellar tendinitis. Magnetic resonance imaging, histologic evaluation, and surgical treatment. Am J Sports Med. 1997;25(2):218-222. doi:10.1177/036354659702500214.
11. Provencher MT, Ryu JH, Gaston T, Dewing CB. Technique: bone-patellar tendon-bone autograft ACL reconstruction in the young, active patient. J Knee Surg. 2011;24(2):83-92. doi:10.1055/s-0031-1280875.
12. Fu F, Cohen S. Current Concepts in ACL Reconstruction. Thorofare: SLACK Incorporated; 2008.
13. Cosgarea AJ, Weng MS, Andrews M. Osgood Schlatter’s disease complicating anterior cruciate ligament reconstruction. Arthroscopy. 1993;9(6):700-703. doi:10.1016/S0749-8063(05)80511-0.
14. Weckström M, Parviainen M, Pihlajamäki HK. Excision of painful bipartite patella: good long-term outcome in young adults. Clin Orthop Relat Res. 2008;466(11):2848-2855. doi:10.1007/s11999-008-0367-4.
15. Fulkerson JP, Langeland R. An alternative cruciate reconstruction graft: the central quadriceps tendon. Arthroscopy. 1995;11(2):252-254. doi:10.1016/0749-8063(95)90078-0.
16. Scully WF, Wilson DJ, Arrington ED. “Central” quadriceps tendon harvest with patellar bone plug: surgical technique revisited. Arthrosc Tech. 2013;2(4):e427-e432.
17. Kujala UM, Kvist M, Heinonen O. Osgood-Schlatter’s disease in adolescent athletes. Retrospective study of incidence and duration. Am J Sports Med. 1985;13(4):236-241. doi:10.1177/036354658501300404.
18. Pihlajamäki HK, Visuri TI. Long-term outcome after surgical treatment of unresolved Osgood-Schlatter disease in young men: surgical technique. J Bone Joint Surg Am. 2010;92(suppl 1 Pt 2):258-264. doi:10.2106/JBJS.J.00450.
19. Weiss JM, Jordan SS, Andersen JS, Lee BM, Kocher M. Surgical treatment of unresolved Osgood-Schlatter disease: ossicle resection with tibial tubercleplasty. J Pediatr Orthop. 2007;27(7):844-847. doi:10.1097/BPO.0b013e318155849b.
20. Lian OB, Engebretsen L, Bahr R. Prevalence of jumper’s knee Among elite athletes from different sports: a cross-sectional study. Am J Sports Med. 2005;33(4):561-567. doi:10.1177/0363546504270454.
21. O’Keeffe SA, Hogan BA, Eustace SJ, Kavanagh EC. Overuse injuries of the knee. Magn Reson Imaging Clin N Am. 2009;17(4):725-739, vii. doi:10.1016/j.mric.2009.06.010.
22. Martens M, Wouters P, Burssens A, Mulier JC. Patellar tendinitis: pathology and results of treatment. Acta Orthop Scand. 1982;53(3):445-450. doi:10.3109/17453678208992239.
23. Shalaby M, Almekinders LC. Patellar tendinitis: the significance of magnetic resonance imaging findings. Am J Sports Med. 1999;27(3):345-349. doi:10.1177/03635465990270031301.
24. Reiff DB, Heenan SD, Heron CW. MRI appearances of the asymptomatic patellar tendon on gradient echo imaging. Skeletal Radiol. 1995;24(2):123-126. doi:10.1007/BF00198074.
ABSTRACT
The purpose of this study is to determine the prevalence of potential graft-influencing pathologies of the extensor mechanism of the knee in patients presenting with a primary anterior cruciate ligament (ACL) rupture.
We performed a retrospective review of the plain radiographs and magnetic resonance imaging (MRI) of all active-duty patients presenting with a primary ACL rupture at our institution between July 2006 and February 2009. Imaging was reviewed to determine the presence of a multipartite patella, unresolved Osgood-Schlatter’s disease, and/or radiographic evidence suggestive of patella tendinopathy.
A total of 197 patients were reviewed, including 27 females and 170 males. One patient (0.5%) had a bipartite patella and 4 patients (2%) had free-floating ossicles about the tibial tuberosity consistent with unresolved Osgood-Schlatter’s disease. A total of 15 patients (7.6%) showed MRI evidence suggestive of patella tendinopathy.
This study revealed 20 patients out of 197 (10.1%) who presented with existing extensor mechanism pathologies in radiologic studies. While preoperative imaging is routinely used to confirm clinical suspicion of ACL rupture or identify associated injuries, this study shows that it can also identify existing extensor mechanism pathologies that could ultimately influence the use of an extensor mechanism graft.
Continue to: Anterior cruciate ligament (ACL) reconstruction...
Anterior cruciate ligament (ACL) reconstruction is an extremely common procedure; in fact, an estimated 60,000 to 175,000 ACL reconstructions are performed annually in the United States.1,2 One of the most widely debated aspects of ACL reconstruction is the choice of graft. Grafts are broadly categorized into allografts and autografts. The autograft selections for ACL reconstruction include patellar bone-tendon-bone (pBTB), combined semitendinosus and gracilis hamstrings (HS), free quadriceps tendon (QT)without accompanying bone block, and quadriceps tendon-bone (qTB). Allograft choices predominantly include pBTB and HS, as well as the tibialis anterior and Achilles tendons. The pBTB autograft is traditionally considered the reference standard for ACL reconstruction.3 Recent advances in allograft processing, along with improved fixation techniques and devices, have improved results following the use of soft-tissue autografts and both bony and soft tissue allografts.4 Thus, the optimal graft choice for ACL reconstruction has become controversial in light of several studies demonstrating no significant, long-term difference in clinical and/or functional outcomes based on graft selection.5-7
Given the lack of a clear gold standard in graft selection, multiple patient factors, such as age, activity demands, and patient preference, should be taken into account when considering the choice of graft. In addition, intrinsic factors that could potentially weaken an autograft should be considered. Several extensor mechanism pathological findings that are easily visualized on either plain radiographs or magnetic resonance imaging (MRI) could potentially affect graft selection. Findings such as a multipartite patella, free ossicles about the tibial tuberosity consistent with Osgood-Schlatter’s disease, and proximal patella tendon thickening suggestive of patellar tendinopathy are easily identifiable on preoperative imaging and could exert adverse effects on pBTB, QT, and qTB autografts. The purpose of this study is to identify the prevalence of these pre-existing conditions in active-duty military patients presenting with acute ACL tears.
METHODS
A retrospective review was conducted on all active-duty patients who underwent primary ACL reconstruction at our institution from July 2006 to February 2009. A systematic review of all plain radiographs and MRIs was performed on a calibrated picture archiving and communication system workstation. Imaging review was conducted by 2 of the authors. Pertinent findings included a multipartite patella, free ossicles within the patella tendon, and hypertrophy of the proximal aspect of the patella tendon. Assessment for multipartite patella and unresolved Osgood-Schlatter's disease was made using plain radiographs with MRI for confirmation. Measurements of the patella tendon were performed on the short tau inversion recovery and T2-weighted sagittal MRI images at the point of maximal tendon width. A width of ≥7 mm was considered suggestive of patella tendinopathy based on prior studies.8-10 The prevalence of each finding was then determined based on the total number of patients.
Continue to: RESULTS...
RESULTS
A total of 197 active-duty patients, including 27 females (13.7%) and 170 males (86.3%), underwent primary ACL reconstruction during the study time period. A total of 93 right knees and 104 left knees were evaluated. The average age at presentation was 29 years (range, 19-45 years).
Of the 197 patients, only 1 was found to have a multipartite patella (prevalence, 0.5%). This 37-year-old male patient showed a right bipartite patella located in the superior-lateral aspect (Figure 1).
Four patients had free ossicles within the inferior patellar tendon consistent with unresolved Osgood-Schlatter’s disease (prevalence, 2.0%) (Figure 2). All 4 patients were male, which is consistent with the higher incidence of Osgood-Schlatter’s disease in males than in females. The average age of these patients was 27.5 years (range, 22-33 years).
The most common extensor mechanism pathology present on preoperative imaging was proximal patella tendon thickening suggestive of patella tendinopathy. Thickening of the proximal portion of the patellar tendon was present in 15 of the 197 MRIs (prevalence, 7.6%) (Figure 3). The average width of this thickening was 8.49 mm (7.17-10.17 mm), and the average age of patients with radiographic evidence of patellar tendinopathy was 29.9 years (range, 20-43 years). Gender distribution was predominantly male (14 males, 1 female). Details of all extensor mechanism pathologies found are provided in the Table.
Table. Identified Extensor Mechanism Pathology
| Male | Female | Total |
Patients | 170 | 27 | 197 |
Multipartite Patella | 1 | 0 | 1 |
Osgood-Schlatter’s Disease | 4 | 0 | 4 |
Patella Tendinopathy | 14 | 1 | 15 |
|
| 20/97 (10.10%) |
|
DISCUSSION
When considering ACL reconstruction, determination of the graft type is one of the most important decisions to be made, perhaps second only to the decision to perform the surgery itself. Recent multiple, well-designed studies comparing differences among grafts have shown equivalent long-term results, leading to the lack of a universally accepted gold standard.5-7 Thus, both autograft and allograft ACL surgeries are routinely performed in the United States. Surgeons typically take into account factors such as patient age and physical demands, along with their own preferences and/or experience, when considering graft selection. A paucity of research concerning existing pathological conditions that could also influence preoperative decision-making has been observed; most reports consist only of expert opinion.11-13 Our goal is to determine the prevalence of several conditions that could potentially affect an autograft harvested from the extensor mechanism.
This study revealed an overall prevalence of 10.1% of existing extensor mechanism pathology in patients sustaining an acute ACL tear and presenting for ACL reconstruction. Only 1 (0.5%) showed evidence of a multipartite patella, which is below the reported prevalence of 0.2% to 6%.14 The presence of a multipartite patella could potentially have the most deleterious effect on a qTB autograft. Although not as commonly used as HS, QT, or pBTB autografts, some surgeons prefer a qTB autograft because of its increased surface area, bony fixation, and reported decreased donor site pain.15 A multipartite patella could complicate harvesting, disrupt the bone block, or lead to an unstable segment of the patella. These effects are of great concern since the most common location of a bipartite patella is superior-lateral and the quadriceps tendon has been shown to asymmetrically insert laterally.16 While these potential adverse effects have not been specifically studied, the availability of comparable options makes the use of a qTB autograft in the setting of a bipartite patella questionable.
Four patients (2%) revealed evidence of ossicles within the inferior patellar tendon consistent with unresolved Osgood-Schlatter’s disease. Osgood-Schlatter’s disease has been reported to occur in up to 21% of active adolescents and is historically considered a self-resolving process.17 Recent papers have reported persistent symptoms in up to 10% of patients, with a small percentage experiencing persistent free ossicles within their patella tendon on MRI.18,19 The presence of such ossicles raises concern about the integrity of the patellar tendon and questions its use as an autograft when present. This concern was published in a report with the surgeon opting to utilize an alternate graft due to the presence of unresolved Osgood-Schlatter’s disease.13
Fifteen patients (7.6%) demonstrated radiographic evidence suggestive of patella tendinopathy based on the thickness of the proximal patella tendon. Patella tendinopathy is the most common tendinopathy in skeletally mature athletes and one of the most common athletic injuries of the knee, with a reported career prevalence of 22%.20 It is described as an overuse injury due to the cumulative effect of micro trauma without an adequate healing interval. While it remains a clinical diagnosis, patellar tendinopathy often shows radiographic findings best assessed on sagittal MRIs. In general, the normal patella tendon appears as a homogenous low-intensity structure and is of uniform thickness. A tendon affected with tendinopathy typically demonstrates a focal increase in signal on T2-weighted sequences just distal to the tendon origin on the inferior pole of the patella. In addition, the patella tendon will usually demonstrate thickening, primarily in the proximal medial and posterior fibers. Patella marrow changes and indistinct tendon margins can also be present. The sensitivity and specificity of diagnosing patellar tendinopathy on MRI are 78% and 86%, respectively.20 We derived our criteria for MRI evidence suggestive of patella tendinopathy from studies by El-Khoury and colleagues,8 Johnson and colleagues,9 and Popp and colleagues.10 In a 1992 study, El-Khoury and colleagues8 compared MRI findings between a group of patients with a clinical diagnosis of patella tendonitis and a control group without knee complaints. The authors found that the average proximal patella tendon diameter in the control group was 3.7 mm while the average proximal patella tendon diameter in the patella tendinopathy group was 10.9 mm; no patella tendons in the control group were >7 mm.8 In a 1996 study, Johnson and colleagues9 determined that the most reliable MRI finding for patients with patellar tendonitis is significant thickening of the proximal patella tendon seen on the sagittal view. The average thickness in symptomatic patients was 8.5 mm (range, 5-15 mm). The average thickness in the control group was 5.5 mm. None of the control patients had a proximal tendon thickness >7 mm.9 Finally, Popp and colleagues10 reviewed the MRI of 11 knees of patients who underwent surgical débridement of chronic patellar tendonitis and reported an average proximal patella tendon thickness of 12 mm (range, 9-16 mm). We therefore used a proximal patella tendon thickness of >7 mm on the sagittal view as a radiographic finding suggestive of patella tendinopathy. No data regarding symptoms of anterior knee pain were available among our patients. Histological studies of patients with patella tendonitis have shown evidence of chronic inflammation, fibrinoid necrosis, mucoid degeneration, and synovial proliferation within the patella tendon insertion.21 Although no controlled data showing that patella tendons with a history of tendonitis are more prone to failure than those without such history when used as an autograft for ACL reconstruction, the idea of utilizing a diseased tendon for a graft is not ideal. Some surgeons question their patients regarding a history of anterior knee pain and will not use a pBTB autograft in a patient with a positive history.22
Continue to: The goal of this study is to obtain epidemiological evidence...
The goal of this study is to obtain epidemiological evidence of the prevalence of existing extensor mechanism pathologies in patients with acute ACL ruptures and determine how these pathologies may relate to the choice of graft. Out of 197 patients studied, over 10% presented with radiographic evidence of pathologies that could influence the choice of graft. This prevalence is certainly significant enough for surgeons to consider including a radiographic evaluation of the extensor mechanism in their standard ACL rupture work-up.
This study presents obvious limitations. While we report the prevalence of some extensor mechanism pathologies, no definitive evidence that recommends against the use of these autografts from these affected individuals has yet been published. In addition, our diagnosis of patella tendinopathy is based solely on MRI findings with no information regarding clinical symptoms. This limitation is a weakness as several additional studies have questioned the validity of a 7 mm proximal patella tendon thickness.23,24 Furthermore, no studies demonstrating the inferior strength of autografts with the co-existing findings described in our work have yet been performed.
CONCLUSION
We found that 10% of active-duty patients presenting for ACL reconstruction demonstrated radiographic evidence of an extensor mechanism pathology that could affect the harvesting of or integrity of select autografts. Given the recent trend of functionally equivocal results in ACL reconstructions utilizing a variety of grafts, this information could and should influence surgical recommendations for graft utilization to obtain optimal surgical results.
1. Lyman S, Koulouvaris P, Sherman S, Do H, Mandl LA, Marx RG. Epidemiology of anterior cruciate ligament reconstruction: trends, readmissions, and subsequent knee surgery. J Bone Joint Surg Am. 2009;91(10):2321-2328. doi:10.2106/JBJS.H.00539.
2. Spindler KP, Wright RW. Clinical practice. Anterior cruciate ligament tear. N Engl J Med. 2008;359(20):2135-2142. doi:10.1056/NEJMcp0804745.
3. Fu FH, Bennett CH, Lattermann CL, Ma CB. Current trends in anterior cruciate ligament reconstruction. Part 1: Biology and biomechanics of reconstruction. Am J Sports Med. 1999;27(6):821-830. doi:10.1177/03635465990270062501.
4. Mariscalco MW, Magnussen RA, Mehta D, Hewett TE, Flanigan DC, Kaeding CC. Autograft Versus nonirradiated allograft tissue for anterior cruciate ligament reconstruction: A systematic review. Am J Sports Med. 2014;42(2):492-499. doi:10.1177/0363546513497566.
5. Shaieb MD, Kan DM, Chang SK, Marumoto JM, Richardson AB. A prospective randomized comparison of patellar tendon versus semitendinosus and gracilis tendon autografts for anterior cruciate ligament reconstruction. Am J Sports Med. 2002;30(2):214-220. doi:10.1177/03635465020300021201.
6. Poehling GG, Curl WW, Lee CA, et al. Analysis of outcomes of anterior cruciate ligament repair with 5-year follow-up: Allograft versus allograft. Arthroscopy. 2005;21(7):774-785. doi:10.1016/j.arthro.2005.04.112.
7. Krych AJ, Jackson JD, Hoskin TL, Dahm DL. A meta-analysis of patellar tendon autograft versus patellar tendon allograft in anterior cruciate ligament reconstruction. Arthroscopy. 2008;24(3):292-298. doi:10.1016/j.arthro.2007.08.029.
8. El-Khoury GY, Wira RL, Berbaum KS, Pope TL, Monu JUV. MR imaging of patellar tendinitis. Radiology. 1992;184(3):849-854. doi:10.1148/radiology.184.3.1509078.
9. Johnson DP, Wakeley CJ, Watt I. Magnetic resonance imaging of patellar tendonitis. J Bone Joint Surg Br. 1996;78(3):452-457. doi:10.1302/0301-620X.78B3.0780452.
10. Popp JE, Yu JS, Kaeding CC. Recalcitrant patellar tendinitis. Magnetic resonance imaging, histologic evaluation, and surgical treatment. Am J Sports Med. 1997;25(2):218-222. doi:10.1177/036354659702500214.
11. Provencher MT, Ryu JH, Gaston T, Dewing CB. Technique: bone-patellar tendon-bone autograft ACL reconstruction in the young, active patient. J Knee Surg. 2011;24(2):83-92. doi:10.1055/s-0031-1280875.
12. Fu F, Cohen S. Current Concepts in ACL Reconstruction. Thorofare: SLACK Incorporated; 2008.
13. Cosgarea AJ, Weng MS, Andrews M. Osgood Schlatter’s disease complicating anterior cruciate ligament reconstruction. Arthroscopy. 1993;9(6):700-703. doi:10.1016/S0749-8063(05)80511-0.
14. Weckström M, Parviainen M, Pihlajamäki HK. Excision of painful bipartite patella: good long-term outcome in young adults. Clin Orthop Relat Res. 2008;466(11):2848-2855. doi:10.1007/s11999-008-0367-4.
15. Fulkerson JP, Langeland R. An alternative cruciate reconstruction graft: the central quadriceps tendon. Arthroscopy. 1995;11(2):252-254. doi:10.1016/0749-8063(95)90078-0.
16. Scully WF, Wilson DJ, Arrington ED. “Central” quadriceps tendon harvest with patellar bone plug: surgical technique revisited. Arthrosc Tech. 2013;2(4):e427-e432.
17. Kujala UM, Kvist M, Heinonen O. Osgood-Schlatter’s disease in adolescent athletes. Retrospective study of incidence and duration. Am J Sports Med. 1985;13(4):236-241. doi:10.1177/036354658501300404.
18. Pihlajamäki HK, Visuri TI. Long-term outcome after surgical treatment of unresolved Osgood-Schlatter disease in young men: surgical technique. J Bone Joint Surg Am. 2010;92(suppl 1 Pt 2):258-264. doi:10.2106/JBJS.J.00450.
19. Weiss JM, Jordan SS, Andersen JS, Lee BM, Kocher M. Surgical treatment of unresolved Osgood-Schlatter disease: ossicle resection with tibial tubercleplasty. J Pediatr Orthop. 2007;27(7):844-847. doi:10.1097/BPO.0b013e318155849b.
20. Lian OB, Engebretsen L, Bahr R. Prevalence of jumper’s knee Among elite athletes from different sports: a cross-sectional study. Am J Sports Med. 2005;33(4):561-567. doi:10.1177/0363546504270454.
21. O’Keeffe SA, Hogan BA, Eustace SJ, Kavanagh EC. Overuse injuries of the knee. Magn Reson Imaging Clin N Am. 2009;17(4):725-739, vii. doi:10.1016/j.mric.2009.06.010.
22. Martens M, Wouters P, Burssens A, Mulier JC. Patellar tendinitis: pathology and results of treatment. Acta Orthop Scand. 1982;53(3):445-450. doi:10.3109/17453678208992239.
23. Shalaby M, Almekinders LC. Patellar tendinitis: the significance of magnetic resonance imaging findings. Am J Sports Med. 1999;27(3):345-349. doi:10.1177/03635465990270031301.
24. Reiff DB, Heenan SD, Heron CW. MRI appearances of the asymptomatic patellar tendon on gradient echo imaging. Skeletal Radiol. 1995;24(2):123-126. doi:10.1007/BF00198074.
TAKE-HOME POINTS
- Extensor mechanism pathology is a common finding in patients with ACL injuries.
- Extensor mechanism pathology such as a multipartite patella, unresolved Osgood-Schlatter’s disease, and patella tendinopathy are easily identifiable on standard imaging.
- It is unknown what type of effect, if any, these pathologies may have on graft strength.
- The bone-patella tendon-bone and quadriceps autograft are the most likely to be affected.
- Surgeons should take into account existing extensor mechanism pathology when considering individual patient graft selection for ACL reconstruction.
Topical Corticosteroids for Treatment-Resistant Atopic Dermatitis
Atopic dermatitis (AD) is most often treated with mid-potency topical corticosteroids.1,2 Although this option is effective, not all patients respond to treatment, and those who do may lose efficacy over time, a phenomenon known as tachyphylaxis. The pathophysiology of tachyphylaxis to topical corticosteroids has been ascribed to loss of corticosteroid receptor function,3 but the evidence is weak.3,4 Patients with severe treatment-resistant AD improve when treated with mid-potency topical steroids in an inpatient setting; therefore, treatment resistance to topical corticosteroids may be largely due to poor adherence.5
Patients with treatment-resistant AD generally improve when treated with topical corticosteroids under conditions designed to promote treatment adherence, but this improvement often is reported for study groups, not individual patients. Focusing on group data may not give a clear picture of what is happening at the individual level. In this study, we evaluated changes at an individual level to determine how frequently AD patients who were previously treated with topical corticosteroids unsuccessfully would respond to desoximetasone spray 0.25% under conditions designed to promote good adherence over a 7-day period.
Methods
This open-label, randomized, single-center clinical study included 12 patients with AD who were previously unsuccessfully treated with topical corticosteroids in the Department of Dermatology at Wake Forest Baptist Medical Center (Winston-Salem, North Carolina)(Table 1). The study was approved by the local institutional review board.
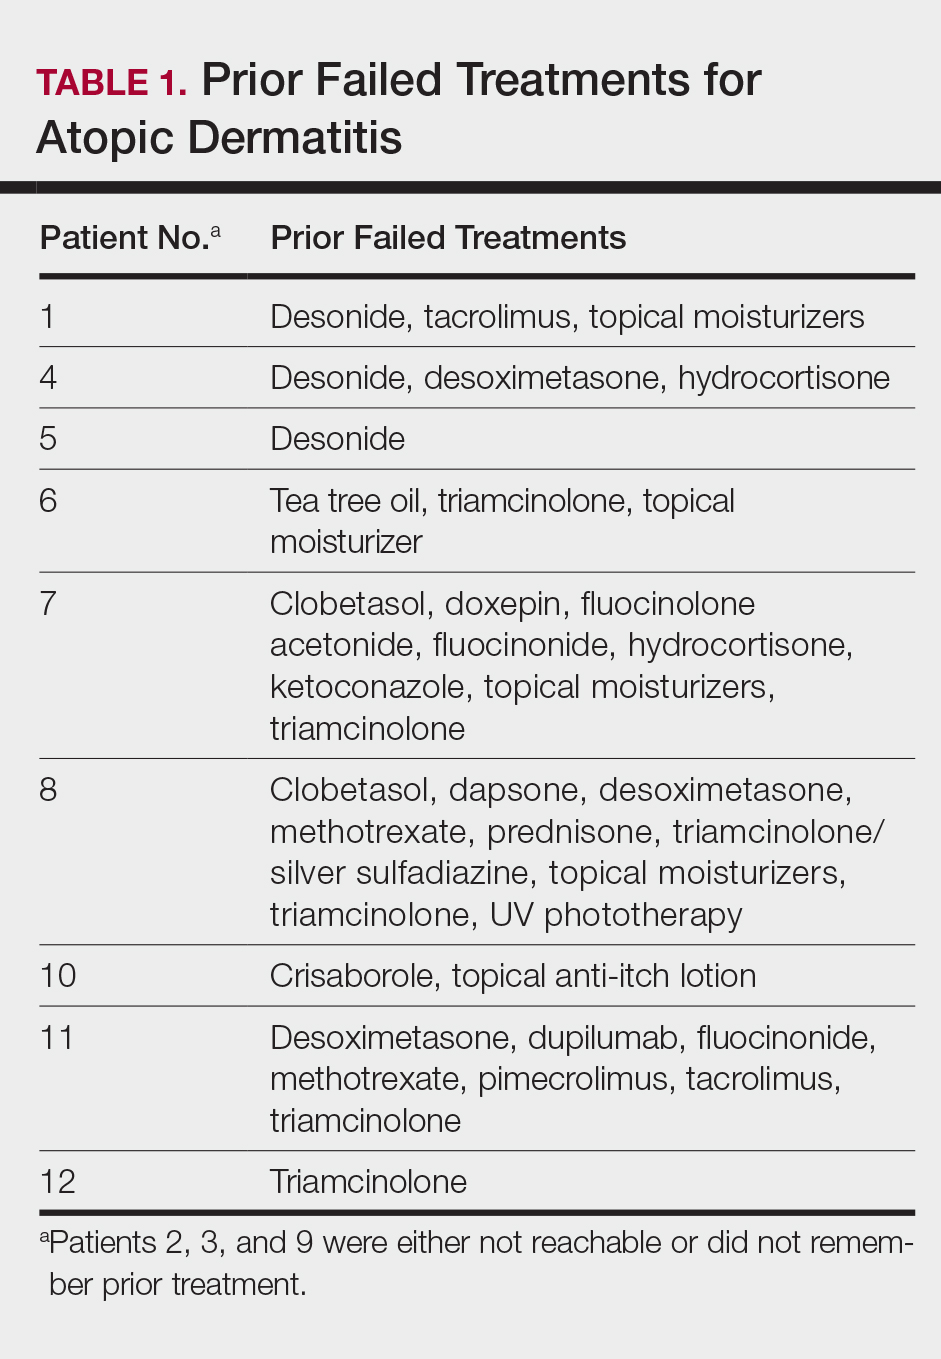
Inclusion criteria included men and women 18 years or older at baseline who had AD that was considered amenable to therapy with topical corticosteroids by the clinician and were able to comply with the study protocol (Figure). Written informed consent also was obtained from each patient. Women who were pregnant, breastfeeding, or unwilling to practice birth control during participation in the study were excluded. Other exclusion criteria included presence of a condition that in the opinion of the investigator would compromise the safety of the patient or quality of data as well as patients with no access to a telephone throughout the day. Patients diagnosed with conditions affecting adherence to treatment (eg, dementia, Alzheimer disease), those with a history of allergy or sensitivity to corticosteroids, and those with a history of drug hypersensitivity were excluded from the study.
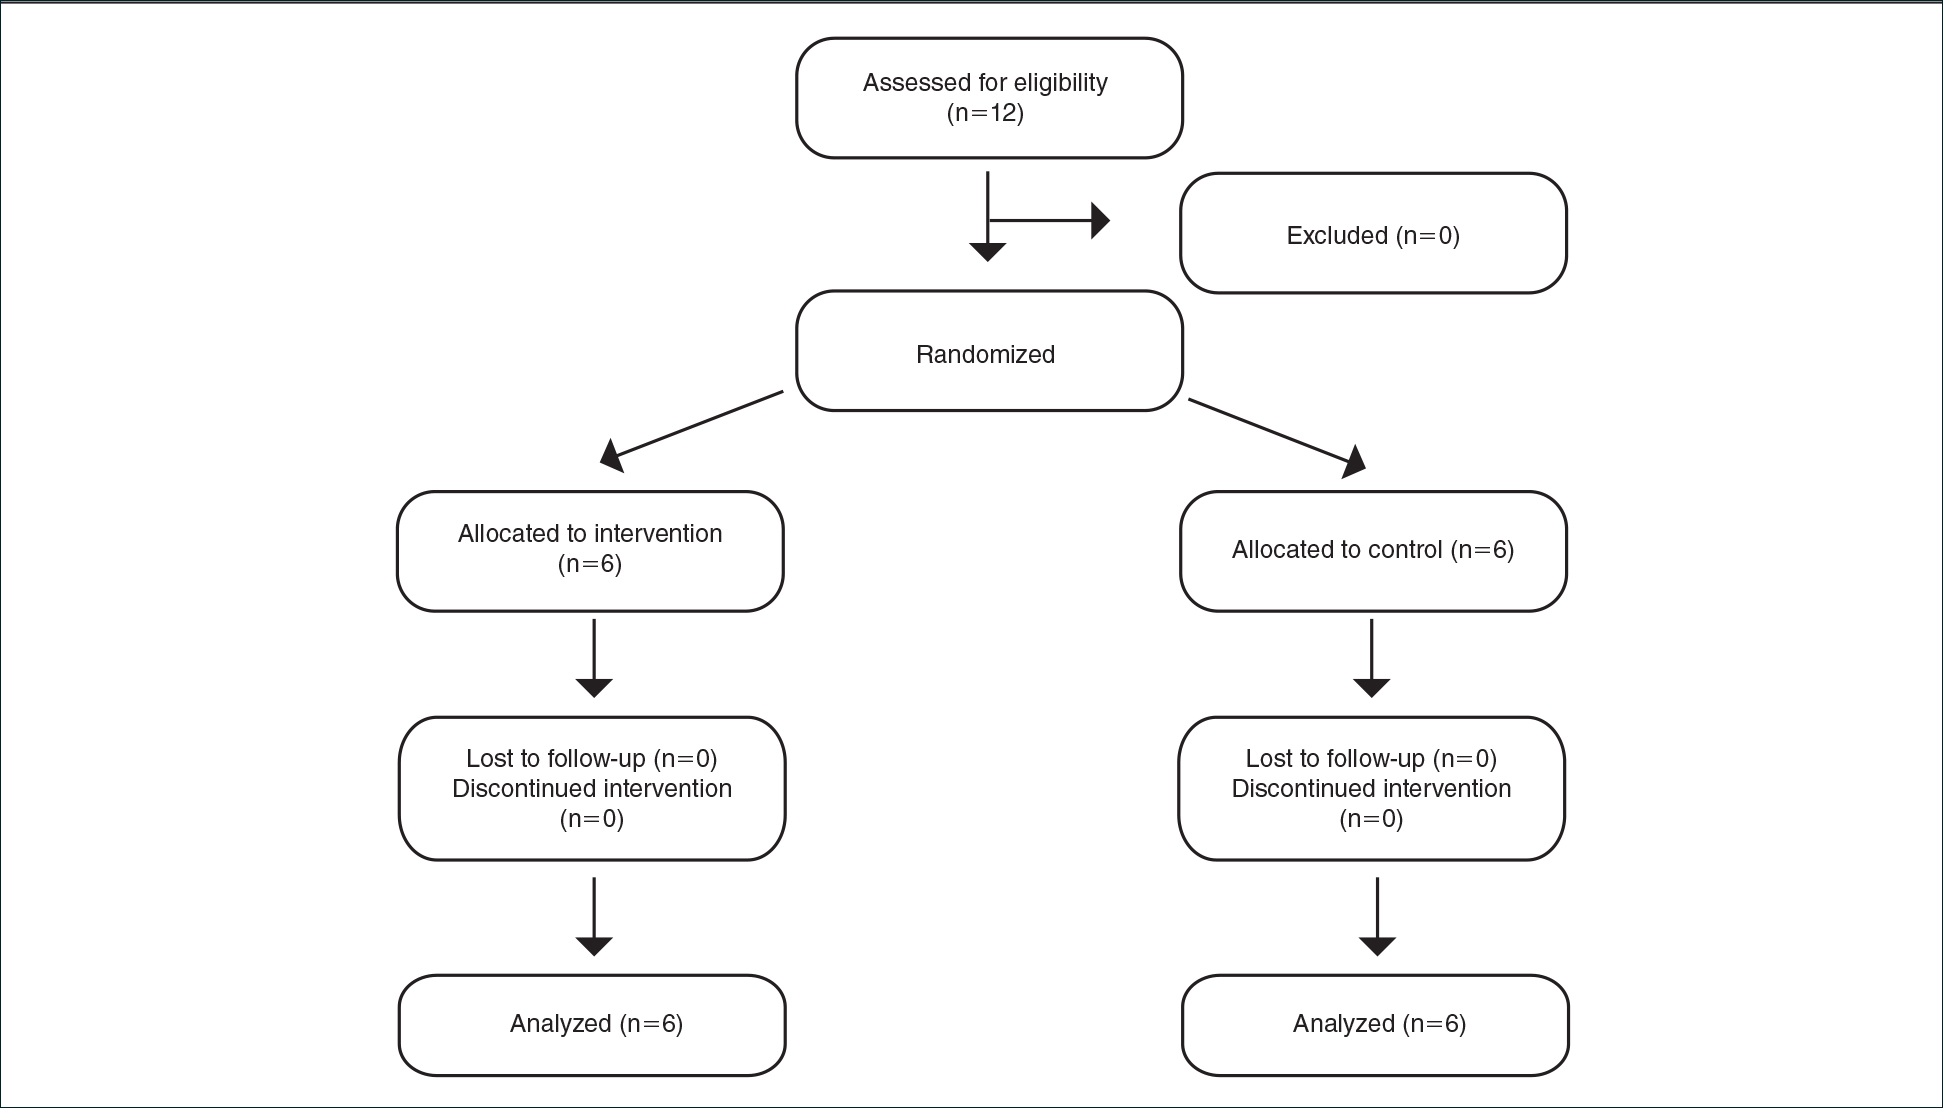
All 12 patients were treated with desoximetasone spray 0.25% for 7 days. Patients were instructed not to use other AD medications during the study period. At baseline, patients were randomized to receive either twice-daily telephone calls to discuss treatment adherence (intervention group) or no telephone calls (control) during the study period. Patients in both the intervention and control groups returned for evaluation on days 3 and 7. During these visits, disease severity was evaluated using the pruritus visual analog scale, Eczema Area and Severity Index (EASI), total lesion severity scale (TLSS), and investigator global assessment (IGA). Descriptive statistics were used to report the outcomes for each patient.
Results
Twelve AD patients who were previously unsuccessfully treated with topical corticosteroids were recruited for the study. Six patients were randomized to the intervention group and 6 were randomized to the control group. Fifty percent of patients were black, 50% were women, and the average age was 50.4 years. All 12 patients completed the study.
At the end of the study, most patients showed improvement in all evaluation parameters (eFigure). All 12 patients showed improvement in pruritus visual analog scores; 83.3% (10/12) showed improved EASI scores, 75.0% (9/12) showed improved TLSS scores, and 58.3% (7/12) showed improved IGA scores (Tables 2–5). Patients who received telephone calls in the intervention group showed greater improvement compared to those in the control group, except for pruritus; the mean reduction in pruritus was 76.9% in the intervention group versus 87.0% in the control group. The mean improvement in EASI score was 46.9% in the intervention group versus 21.1% in the control group. The mean improvement in TLSS score was 38.3% in the intervention group versus 9.7% in the control group. The mean improvement in IGA score was 45.8% in the intervention group versus 4.2% in the control group. Only one patient in the control group (patient 8) showed lower EASI, TLSS, and IGA scores at baseline.
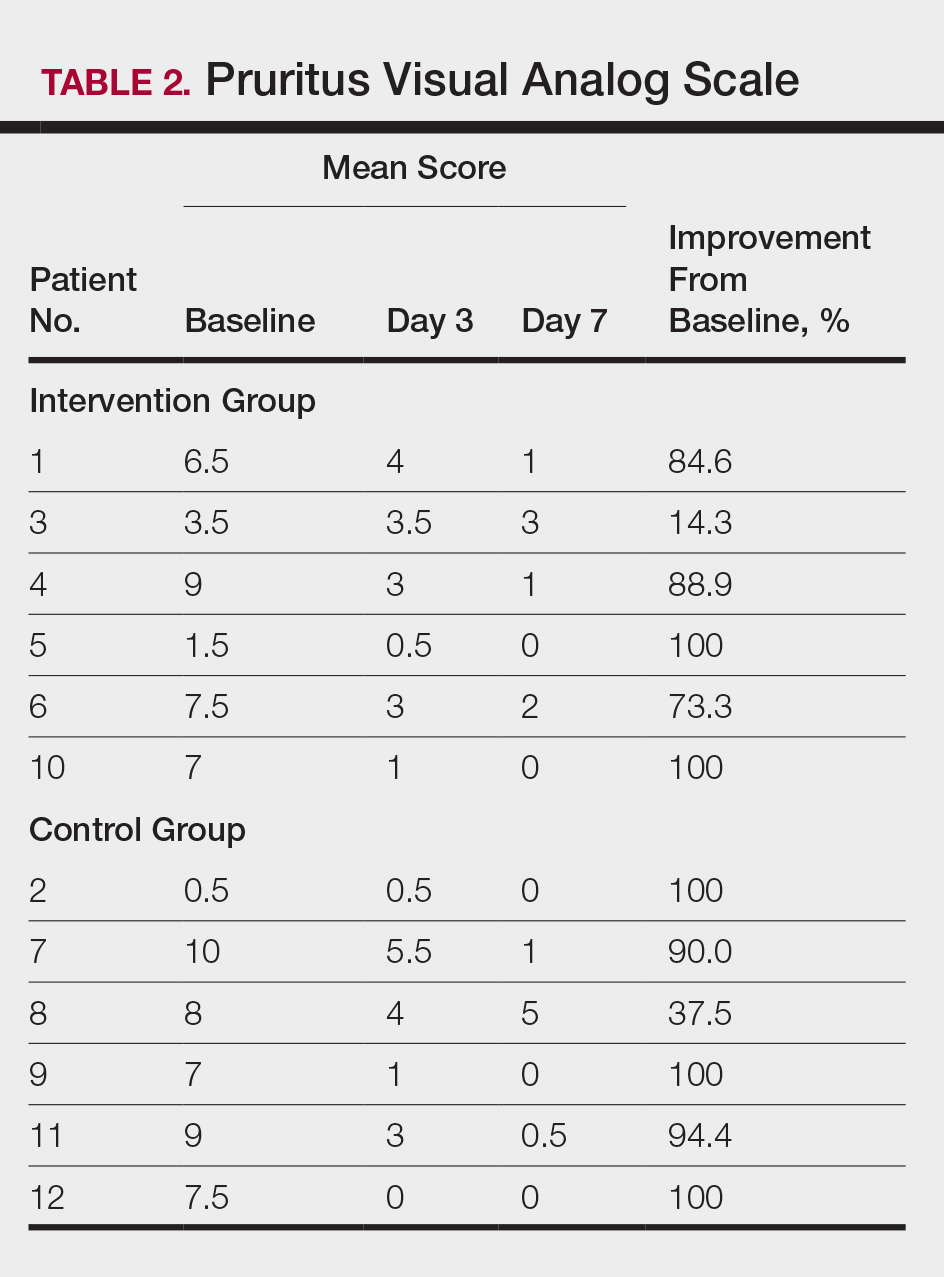
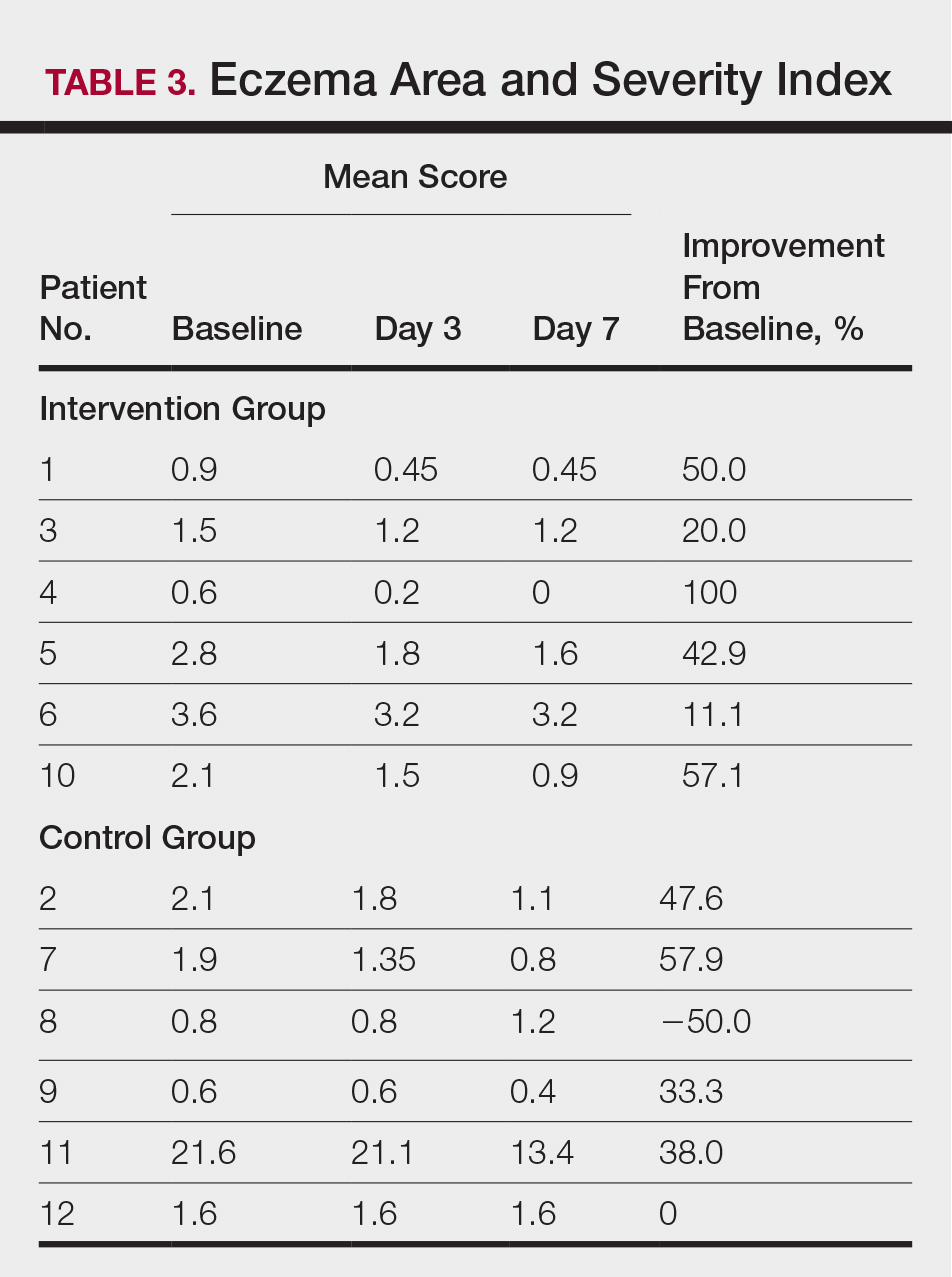
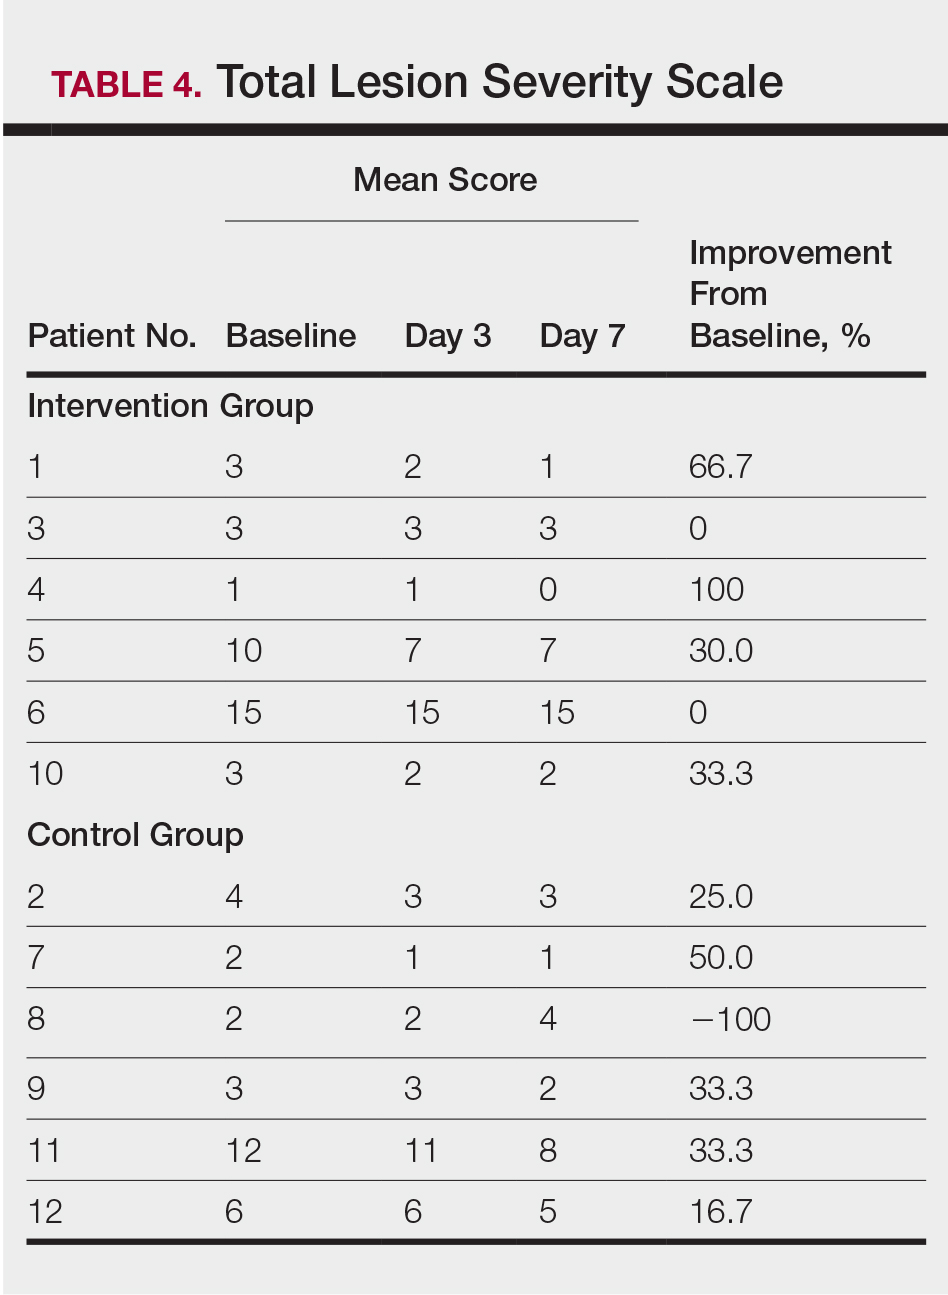
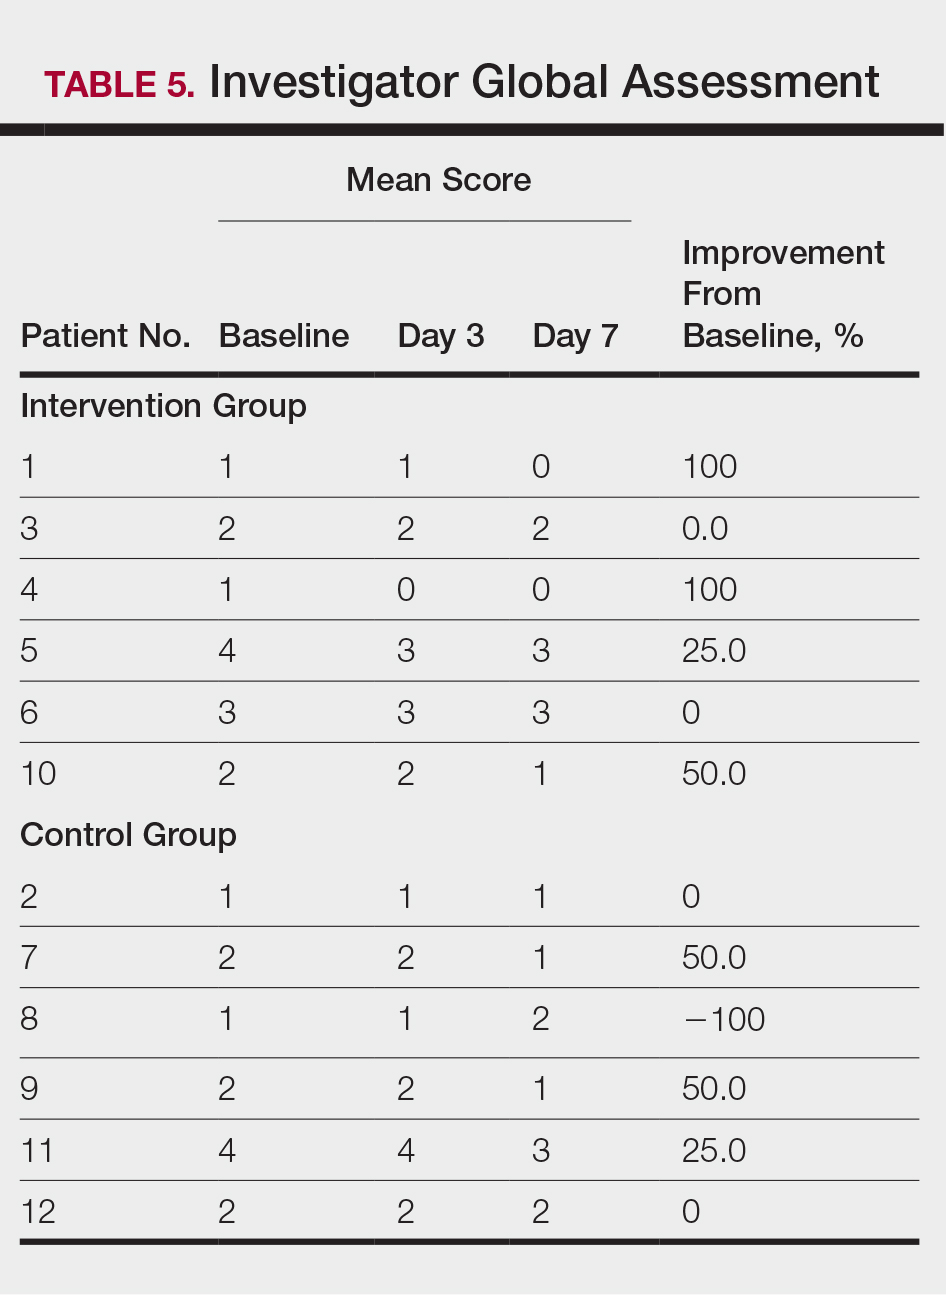
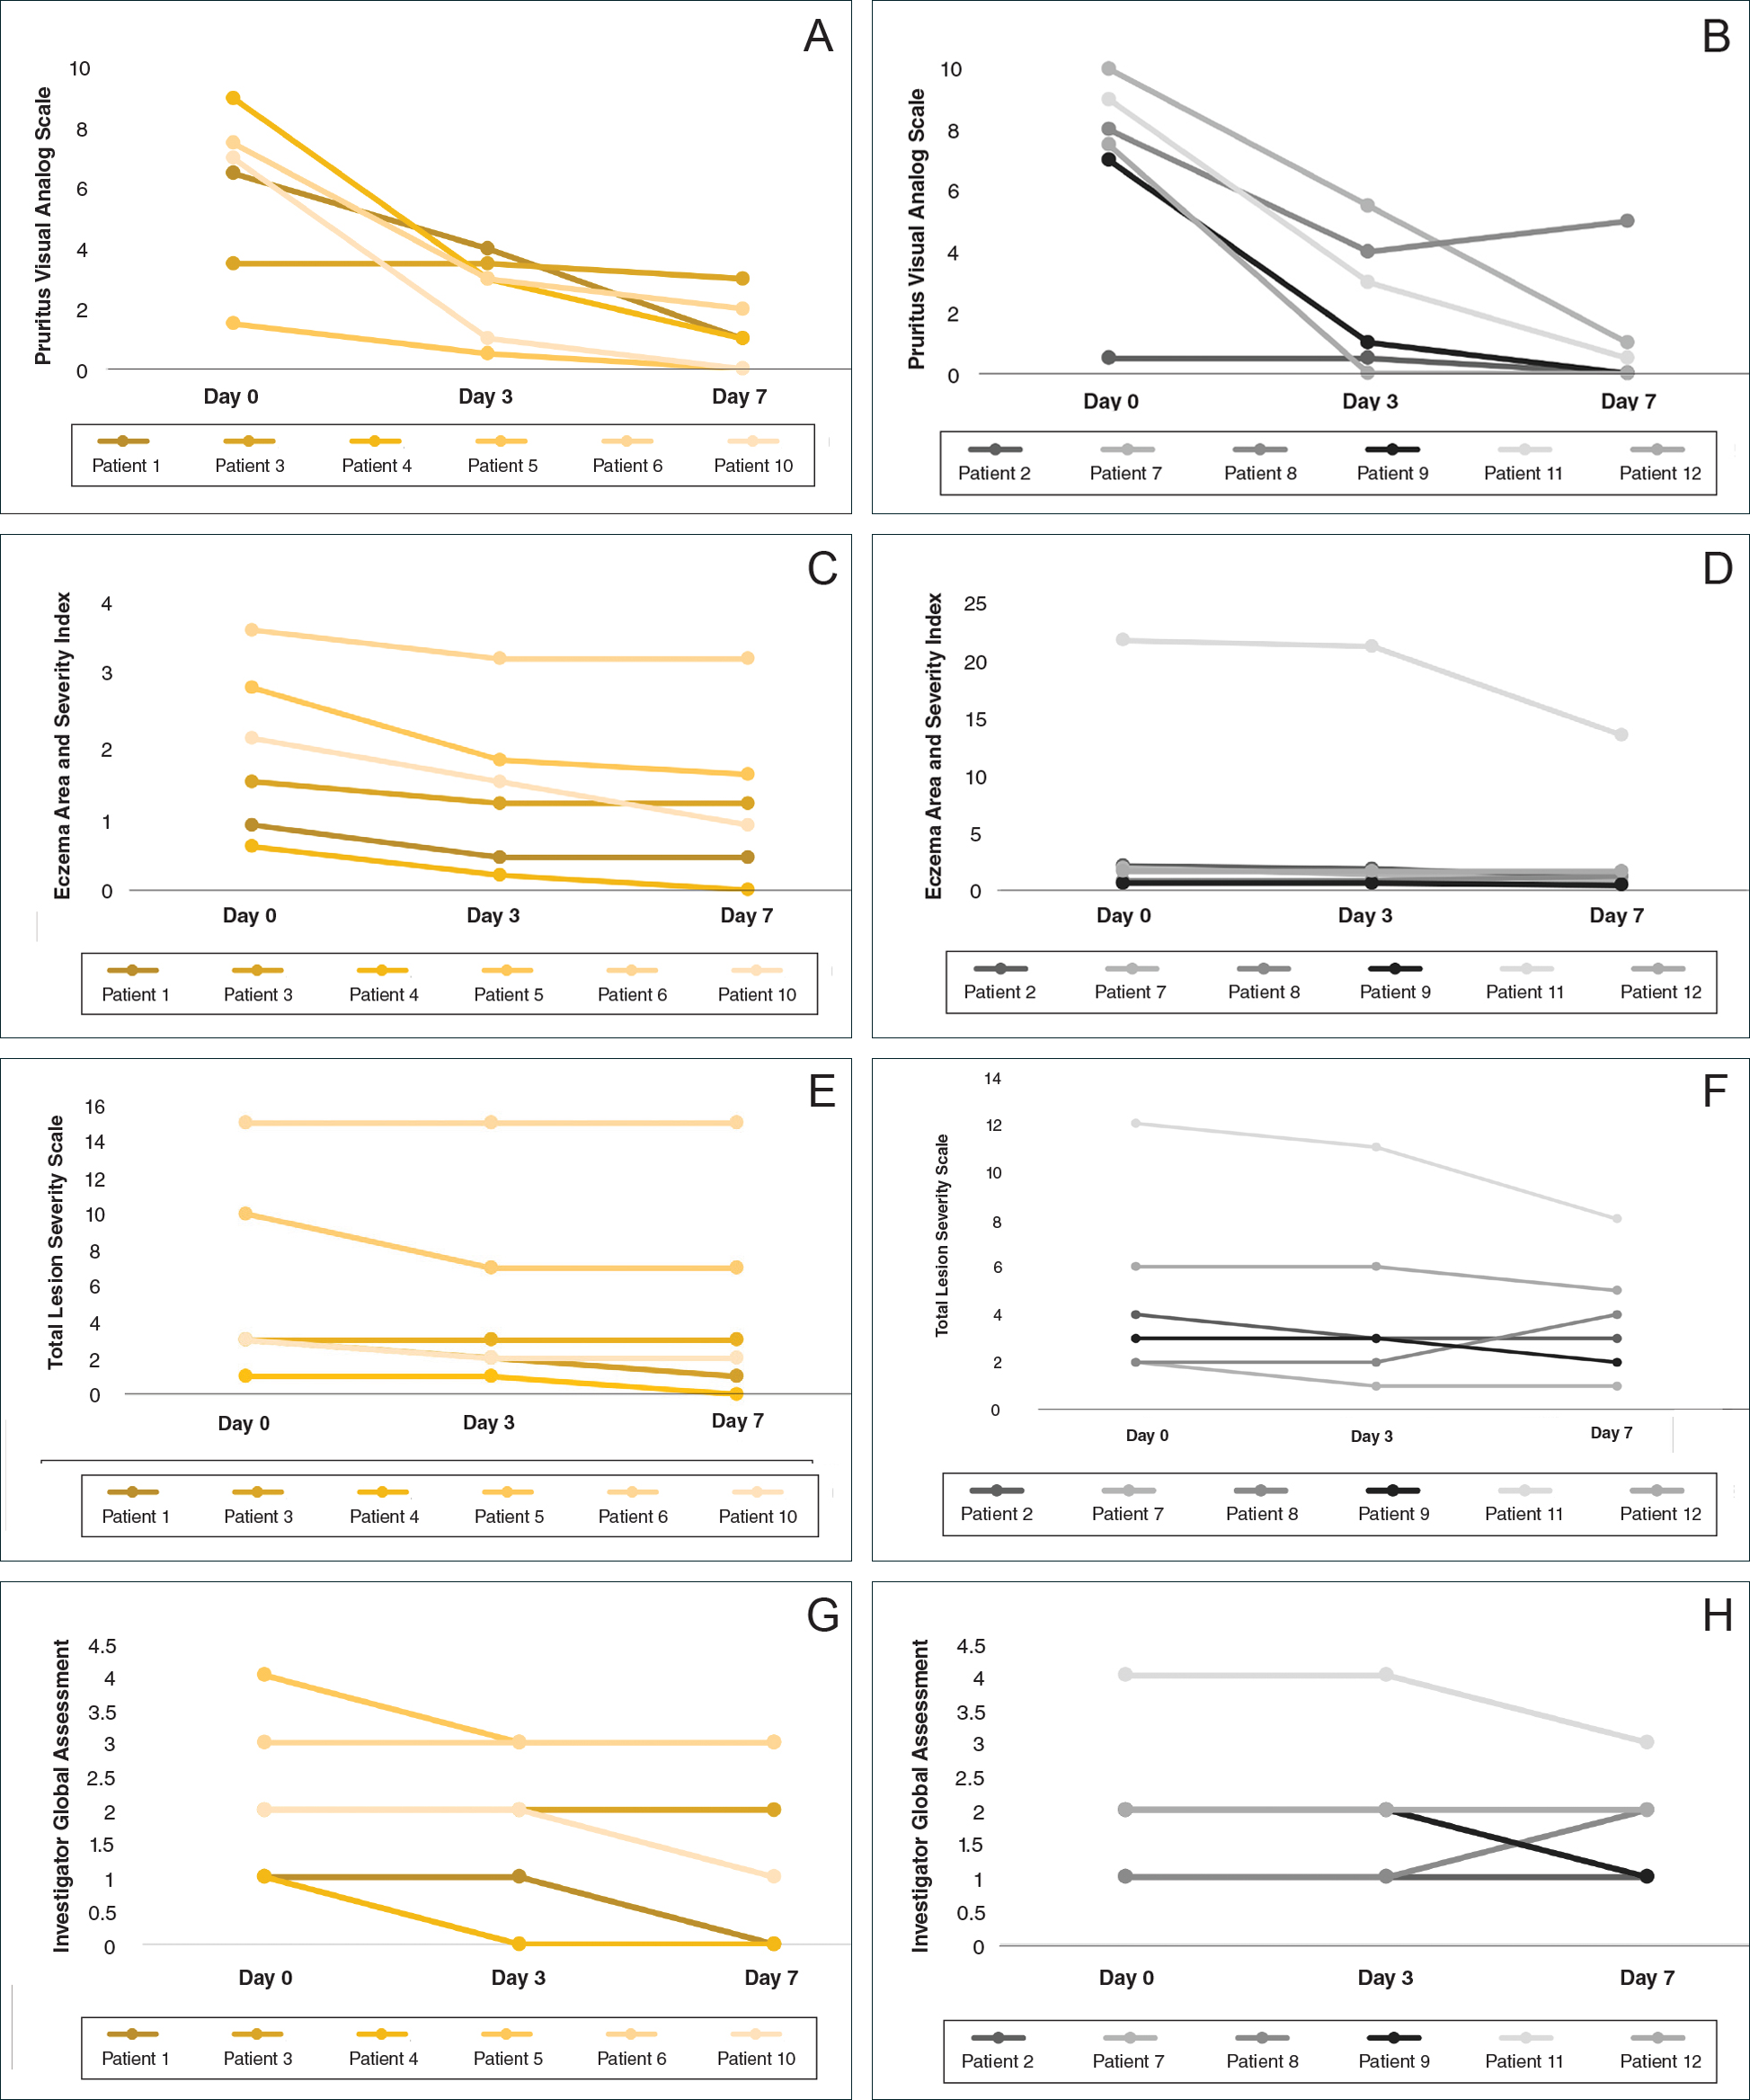
Comment
Although topical corticosteroids are the mainstay for treatment of AD, many patients report treatment resistance after a period of a few doses or longer.6-9 There is strong evidence demonstrating rapid corticosteroid receptor downregulation in tissues after corticosteroid therapy, which is the accepted mechanism for tachyphylaxis, but the timing of this effect does not match up with clinical experiences. The physiologic significance of corticosteroid agonist-induced receptor downregulation is unknown and may not have any considerable effect on corticosteroid efficacy.3 A systematic review by Taheri et al3 on the development of resistance to topical corticosteroids proposed 2 theories for the underlying pathogenesis of tachyphylaxis: (1) long-term patient nonadherence, and (2) the initial maximal response during the first few weeks of therapy eventually plateaus. Because corticosteroids may plateau after a certain number of doses, natural disease flare-ups during this period may give the wrong impression of tachyphylaxis.10 The treatment “resistance” reported by the patients in our study may have been due to this plateau effect or to poor adherence.
Our finding that nearly all patients had rapid improvement of AD with the topical corticosteroid is not definitive proof but supports the notion that tachyphylaxis is largely mediated by poor adherence to treatment. Patients rapidly improved over the short study period. The short duration of treatment and multiple visits over the study period were designed to help ensure patient adherence. Rapid improvement in AD when topical corticosteroids are used should be expected, as AD patients have rapid improvement with application of topical corticosteroids in inpatient settings.11,12
Poor adherence to topical medication is common. In a Danish study, 99 of 322 patients (31%) did not redeem their AD prescriptions.13 In a single-center, 5-day, prospective study evaluating the use of fluocinonide cream 0.1% for treatment of children and adults with AD, the median percentage of prescribed doses taken was 40%, according to objective electronic monitors, even though patients reported 100% adherence in their medication diaries.Better adherence was seen on day 1 of treatment in which 66.6% (6/9) of patients adhered to their treatment strategy versus day 5 in which only 11.1% (1/9) of patients used their medication.1
Topical corticosteroids are safe and efficacious if used appropriately; however, patients commonly express fear and anxiety about using them. Topical corticosteroid phobia may stem from a misconception that these products carry the same adverse effects as their oral and systemic counterparts, which may be perpetuated by the media.1 Of 200 dermatology patients surveyed, 72.5% expressed concern about using topical corticosteroids on themselves or their children’s skin, and 24% of these patients stated they were noncompliant with their medication because of these worries. Almost 50% of patients requested prescriptions for corticosteroid-sparing medications such as tacrolimus.1 Patient education is important to help ensure treatment adherence. Other factors that can affect treatment adherence include forgetfulness; the chronic nature of AD; the need for ongoing application of topical treatments; prohibitive costs of some topical agents; and complexities in coordinating school, work, and family plans with the treatment regimen.2
We attempted to ensure good treatment adherence in our study by calling the patients in the intervention group twice daily. The mean improvement in EASI, TLSS, and IGA scores was higher in the intervention group versus the control group, which suggests that patient reminders have at least some benefit. Because AD treatment resistance appears more closely tied to nonadherence rather than loss of medication efficacy, it seems prudent to focus on interventions that would improve treatment adherence; however, such interventions generally are not well tested. Recommended interventions have included educating patients about the side effects of topical corticosteroids, avoiding use of medical jargon, and taking patient vehicle preference into account when prescribing treatments.8 Patients should be scheduled for a return visit within 1 to 2 weeks, as early return visits can augment treatment adherence.14 At the return visit, there can be a more detailed discussion of long-term management and side effects.8
Limitations of our study included a small sample size and brief treatment duration. Even though the patients had previously reported treatment failure with topical corticosteroids, all demonstrated improvement in only 1 week with a potent topical corticosteroid. The treatment resistance that initially was reported likely was due to poor adherence, but it is possible for AD patients to be resistant to treatment with topical corticosteroids due to allergic contact dermatitis. Patients could theoretically be allergic to components of the vehicle used in topical corticosteroids, which could aggravate their dermatitis; however, this effect seems unlikely in our patient population, as all the patients in our study showed improvement following treatment. Another study limitation was that adherence was not measured. The frequent follow-up visits were designed to encourage treatment adherence, but adherence was not specifically assessed. Although patients were encouraged to only use the desoximetasone spray during the study, it is not known whether patients used other products.
Conclusion
Some AD patients exhibit apparent decreased efficacy of topical corticosteroids over time, but this tachyphylaxis phenomenon is more likely due to poor treatment adherence than to loss of corticosteroid responsiveness. In our study, AD patients who reported treatment failure with topical corticosteroids improved rapidly with topical corticosteroids under conditions designed to promote good adherence to treatment. The majority of patients improved in all 4 parameters used for evaluating disease severity, with 100% of patients reporting improvement in pruritus. Intervention to improve treatment adherence may lead to better health outcomes. When AD appears resistant to topical corticosteroids, addressing adherence issues may be critical.
- Patel NU, D’Ambra V, Feldman SR. Increasing adherence with topical agents for atopic dermatitis. Am J Clin Dermatol. 2017;18:323-332.
- Mooney E, Rademaker M, Dailey R, et al. Adverse effects of topical corticosteroids in paediatric eczema: Australasian consensus statement. Australas J Dermatol. 2015;56:241-251.
- Taheri A, Cantrell J, Feldman SR. Tachyphylaxis to topical glucocorticoids; what is the evidence? Dermatol Online J. 2013;19:18954.
- Miller JJ, Roling D, Margolis D, et al. Failure to demonstrate therapeutic tachyphylaxis to topically applied steroids in patients with psoriasis. J Am Acad Dermatol. 1999;41:546-549.
- Smith SD, Harris V, Lee A, et al. General practitioners knowledge about use of topical corticosteroids in paediatric atopic dermatitis in Australia. Aust Fam Physician. 2017;46:335-340.
- Sathishkumar D, Moss C. Topical therapy in atopic dermatitis in children. Indian J Dermatol. 2016;61:656-661.
- Reitamo S, Remitz A. Topical agents for atopic dermatitis. In: Bieber T, ed. Advances in the Management of Atopic Dermatitis. London, United Kingdom: Future Medicine Ltd; 2013:62-72.
- Krejci-Manwaring J, Tusa MG, Carroll C, et al. Stealth monitoring of adherence to topical medication: adherence is very poor in children with atopic dermatitis. J Am Acad Dermatol. 2007;56:211-216.
- Fukaya M. Cortisol homeostasis in the epidermis is influenced by topical corticosteroids in patients with atopic dermatitis. Indian J Dermatol. 2017;62:440.
- Mehta AB, Nadkarni NJ, Patil SP, et al. Topical corticosteroids in dermatology. Indian J Dermatol Venereol Leprol. 2016;82:371-378.
- van der Schaft J, Keijzer WW, Sanders KJ, et al. Is there an additional value of inpatient treatment for patients with atopic dermatitis? Acta Derm Venereol. 2016;96:797-801.
- Dabade TS, Davis DM, Wetter DA, et al. Wet dressing therapy in conjunction with topical corticosteroids is effective for rapid control of severe pediatric atopic dermatitis: experience with 218 patients over 30 years at Mayo Clinic. J Am Acad Dermatol. 2011;67:100-106.
- Storm A, Andersen SE, Benfeldt E, et al. One in 3 prescriptions are never redeemed: primary nonadherence in an outpatient clinic. J Am Acad Dermatol. 2008;59:27-33.
- Sagransky MJ, Yentzer BA, Williams LL, et al. A randomized controlled pilot study of the effects of an extra office visit on adherence and outcomes in atopic dermatitis. Arch Dermatol. 2010;146:1428-1430.
Atopic dermatitis (AD) is most often treated with mid-potency topical corticosteroids.1,2 Although this option is effective, not all patients respond to treatment, and those who do may lose efficacy over time, a phenomenon known as tachyphylaxis. The pathophysiology of tachyphylaxis to topical corticosteroids has been ascribed to loss of corticosteroid receptor function,3 but the evidence is weak.3,4 Patients with severe treatment-resistant AD improve when treated with mid-potency topical steroids in an inpatient setting; therefore, treatment resistance to topical corticosteroids may be largely due to poor adherence.5
Patients with treatment-resistant AD generally improve when treated with topical corticosteroids under conditions designed to promote treatment adherence, but this improvement often is reported for study groups, not individual patients. Focusing on group data may not give a clear picture of what is happening at the individual level. In this study, we evaluated changes at an individual level to determine how frequently AD patients who were previously treated with topical corticosteroids unsuccessfully would respond to desoximetasone spray 0.25% under conditions designed to promote good adherence over a 7-day period.
Methods
This open-label, randomized, single-center clinical study included 12 patients with AD who were previously unsuccessfully treated with topical corticosteroids in the Department of Dermatology at Wake Forest Baptist Medical Center (Winston-Salem, North Carolina)(Table 1). The study was approved by the local institutional review board.
Inclusion criteria included men and women 18 years or older at baseline who had AD that was considered amenable to therapy with topical corticosteroids by the clinician and were able to comply with the study protocol (Figure). Written informed consent also was obtained from each patient. Women who were pregnant, breastfeeding, or unwilling to practice birth control during participation in the study were excluded. Other exclusion criteria included presence of a condition that in the opinion of the investigator would compromise the safety of the patient or quality of data as well as patients with no access to a telephone throughout the day. Patients diagnosed with conditions affecting adherence to treatment (eg, dementia, Alzheimer disease), those with a history of allergy or sensitivity to corticosteroids, and those with a history of drug hypersensitivity were excluded from the study.
All 12 patients were treated with desoximetasone spray 0.25% for 7 days. Patients were instructed not to use other AD medications during the study period. At baseline, patients were randomized to receive either twice-daily telephone calls to discuss treatment adherence (intervention group) or no telephone calls (control) during the study period. Patients in both the intervention and control groups returned for evaluation on days 3 and 7. During these visits, disease severity was evaluated using the pruritus visual analog scale, Eczema Area and Severity Index (EASI), total lesion severity scale (TLSS), and investigator global assessment (IGA). Descriptive statistics were used to report the outcomes for each patient.
Results
Twelve AD patients who were previously unsuccessfully treated with topical corticosteroids were recruited for the study. Six patients were randomized to the intervention group and 6 were randomized to the control group. Fifty percent of patients were black, 50% were women, and the average age was 50.4 years. All 12 patients completed the study.
At the end of the study, most patients showed improvement in all evaluation parameters (eFigure). All 12 patients showed improvement in pruritus visual analog scores; 83.3% (10/12) showed improved EASI scores, 75.0% (9/12) showed improved TLSS scores, and 58.3% (7/12) showed improved IGA scores (Tables 2–5). Patients who received telephone calls in the intervention group showed greater improvement compared to those in the control group, except for pruritus; the mean reduction in pruritus was 76.9% in the intervention group versus 87.0% in the control group. The mean improvement in EASI score was 46.9% in the intervention group versus 21.1% in the control group. The mean improvement in TLSS score was 38.3% in the intervention group versus 9.7% in the control group. The mean improvement in IGA score was 45.8% in the intervention group versus 4.2% in the control group. Only one patient in the control group (patient 8) showed lower EASI, TLSS, and IGA scores at baseline.
Comment
Although topical corticosteroids are the mainstay for treatment of AD, many patients report treatment resistance after a period of a few doses or longer.6-9 There is strong evidence demonstrating rapid corticosteroid receptor downregulation in tissues after corticosteroid therapy, which is the accepted mechanism for tachyphylaxis, but the timing of this effect does not match up with clinical experiences. The physiologic significance of corticosteroid agonist-induced receptor downregulation is unknown and may not have any considerable effect on corticosteroid efficacy.3 A systematic review by Taheri et al3 on the development of resistance to topical corticosteroids proposed 2 theories for the underlying pathogenesis of tachyphylaxis: (1) long-term patient nonadherence, and (2) the initial maximal response during the first few weeks of therapy eventually plateaus. Because corticosteroids may plateau after a certain number of doses, natural disease flare-ups during this period may give the wrong impression of tachyphylaxis.10 The treatment “resistance” reported by the patients in our study may have been due to this plateau effect or to poor adherence.
Our finding that nearly all patients had rapid improvement of AD with the topical corticosteroid is not definitive proof but supports the notion that tachyphylaxis is largely mediated by poor adherence to treatment. Patients rapidly improved over the short study period. The short duration of treatment and multiple visits over the study period were designed to help ensure patient adherence. Rapid improvement in AD when topical corticosteroids are used should be expected, as AD patients have rapid improvement with application of topical corticosteroids in inpatient settings.11,12
Poor adherence to topical medication is common. In a Danish study, 99 of 322 patients (31%) did not redeem their AD prescriptions.13 In a single-center, 5-day, prospective study evaluating the use of fluocinonide cream 0.1% for treatment of children and adults with AD, the median percentage of prescribed doses taken was 40%, according to objective electronic monitors, even though patients reported 100% adherence in their medication diaries.Better adherence was seen on day 1 of treatment in which 66.6% (6/9) of patients adhered to their treatment strategy versus day 5 in which only 11.1% (1/9) of patients used their medication.1
Topical corticosteroids are safe and efficacious if used appropriately; however, patients commonly express fear and anxiety about using them. Topical corticosteroid phobia may stem from a misconception that these products carry the same adverse effects as their oral and systemic counterparts, which may be perpetuated by the media.1 Of 200 dermatology patients surveyed, 72.5% expressed concern about using topical corticosteroids on themselves or their children’s skin, and 24% of these patients stated they were noncompliant with their medication because of these worries. Almost 50% of patients requested prescriptions for corticosteroid-sparing medications such as tacrolimus.1 Patient education is important to help ensure treatment adherence. Other factors that can affect treatment adherence include forgetfulness; the chronic nature of AD; the need for ongoing application of topical treatments; prohibitive costs of some topical agents; and complexities in coordinating school, work, and family plans with the treatment regimen.2
We attempted to ensure good treatment adherence in our study by calling the patients in the intervention group twice daily. The mean improvement in EASI, TLSS, and IGA scores was higher in the intervention group versus the control group, which suggests that patient reminders have at least some benefit. Because AD treatment resistance appears more closely tied to nonadherence rather than loss of medication efficacy, it seems prudent to focus on interventions that would improve treatment adherence; however, such interventions generally are not well tested. Recommended interventions have included educating patients about the side effects of topical corticosteroids, avoiding use of medical jargon, and taking patient vehicle preference into account when prescribing treatments.8 Patients should be scheduled for a return visit within 1 to 2 weeks, as early return visits can augment treatment adherence.14 At the return visit, there can be a more detailed discussion of long-term management and side effects.8
Limitations of our study included a small sample size and brief treatment duration. Even though the patients had previously reported treatment failure with topical corticosteroids, all demonstrated improvement in only 1 week with a potent topical corticosteroid. The treatment resistance that initially was reported likely was due to poor adherence, but it is possible for AD patients to be resistant to treatment with topical corticosteroids due to allergic contact dermatitis. Patients could theoretically be allergic to components of the vehicle used in topical corticosteroids, which could aggravate their dermatitis; however, this effect seems unlikely in our patient population, as all the patients in our study showed improvement following treatment. Another study limitation was that adherence was not measured. The frequent follow-up visits were designed to encourage treatment adherence, but adherence was not specifically assessed. Although patients were encouraged to only use the desoximetasone spray during the study, it is not known whether patients used other products.
Conclusion
Some AD patients exhibit apparent decreased efficacy of topical corticosteroids over time, but this tachyphylaxis phenomenon is more likely due to poor treatment adherence than to loss of corticosteroid responsiveness. In our study, AD patients who reported treatment failure with topical corticosteroids improved rapidly with topical corticosteroids under conditions designed to promote good adherence to treatment. The majority of patients improved in all 4 parameters used for evaluating disease severity, with 100% of patients reporting improvement in pruritus. Intervention to improve treatment adherence may lead to better health outcomes. When AD appears resistant to topical corticosteroids, addressing adherence issues may be critical.
- Patel NU, D’Ambra V, Feldman SR. Increasing adherence with topical agents for atopic dermatitis. Am J Clin Dermatol. 2017;18:323-332.
- Mooney E, Rademaker M, Dailey R, et al. Adverse effects of topical corticosteroids in paediatric eczema: Australasian consensus statement. Australas J Dermatol. 2015;56:241-251.
- Taheri A, Cantrell J, Feldman SR. Tachyphylaxis to topical glucocorticoids; what is the evidence? Dermatol Online J. 2013;19:18954.
- Miller JJ, Roling D, Margolis D, et al. Failure to demonstrate therapeutic tachyphylaxis to topically applied steroids in patients with psoriasis. J Am Acad Dermatol. 1999;41:546-549.
- Smith SD, Harris V, Lee A, et al. General practitioners knowledge about use of topical corticosteroids in paediatric atopic dermatitis in Australia. Aust Fam Physician. 2017;46:335-340.
- Sathishkumar D, Moss C. Topical therapy in atopic dermatitis in children. Indian J Dermatol. 2016;61:656-661.
- Reitamo S, Remitz A. Topical agents for atopic dermatitis. In: Bieber T, ed. Advances in the Management of Atopic Dermatitis. London, United Kingdom: Future Medicine Ltd; 2013:62-72.
- Krejci-Manwaring J, Tusa MG, Carroll C, et al. Stealth monitoring of adherence to topical medication: adherence is very poor in children with atopic dermatitis. J Am Acad Dermatol. 2007;56:211-216.
- Fukaya M. Cortisol homeostasis in the epidermis is influenced by topical corticosteroids in patients with atopic dermatitis. Indian J Dermatol. 2017;62:440.
- Mehta AB, Nadkarni NJ, Patil SP, et al. Topical corticosteroids in dermatology. Indian J Dermatol Venereol Leprol. 2016;82:371-378.
- van der Schaft J, Keijzer WW, Sanders KJ, et al. Is there an additional value of inpatient treatment for patients with atopic dermatitis? Acta Derm Venereol. 2016;96:797-801.
- Dabade TS, Davis DM, Wetter DA, et al. Wet dressing therapy in conjunction with topical corticosteroids is effective for rapid control of severe pediatric atopic dermatitis: experience with 218 patients over 30 years at Mayo Clinic. J Am Acad Dermatol. 2011;67:100-106.
- Storm A, Andersen SE, Benfeldt E, et al. One in 3 prescriptions are never redeemed: primary nonadherence in an outpatient clinic. J Am Acad Dermatol. 2008;59:27-33.
- Sagransky MJ, Yentzer BA, Williams LL, et al. A randomized controlled pilot study of the effects of an extra office visit on adherence and outcomes in atopic dermatitis. Arch Dermatol. 2010;146:1428-1430.
Practice Points
- Mid-potency corticosteroids are the first-line treatment of atopic dermatitis (AD).
- Atopic dermatitis may fail to respond to topical corticosteroids initially or lose response over time, a phenomenon known as tachyphylaxis.
- Nonadherence to medication is the most likely cause of treatment resistance in patients with AD.
Molluscum Contagiosum Virus Infection Can Trigger Atopic Dermatitis Disease Onset or Flare
Molluscum contagiosum virus (MCV) is a common pediatric viral infection of the skin and/or mucous membranes.1 It has been noted in increasingly younger patient populations, ranging from congenital cases resulting from perinatal/vertical transmission to transmission from cobathing and pool usage.2,3
An association between MCV infection and atopic dermatitis (AD) has been reported to be caused by a predisposition to prolonged and severe cutaneous viral infections.4 However, the exact nature of the relationship between MCV and AD is unknown.
The purpose of this study was to identify pediatric patients with AD onset or flare of AD triggered by MCV infection as well as to characterize the setting under which MCV may trigger AD onset or flares in children.
Methods
Medical records for 50 children with prior or current MCV infection who presented sequentially to an outpatient pediatric dermatology practice over a 1-month period were identified. Institutional review board approval was obtained.
Results
The age range of the 50 patients with MCV infection was 1 to 13 years, with an average age of 3.6 years at the onset of infection (reported by parents/guardians) and 4.5 years at presentation to the pediatric dermatology office (Table 1).
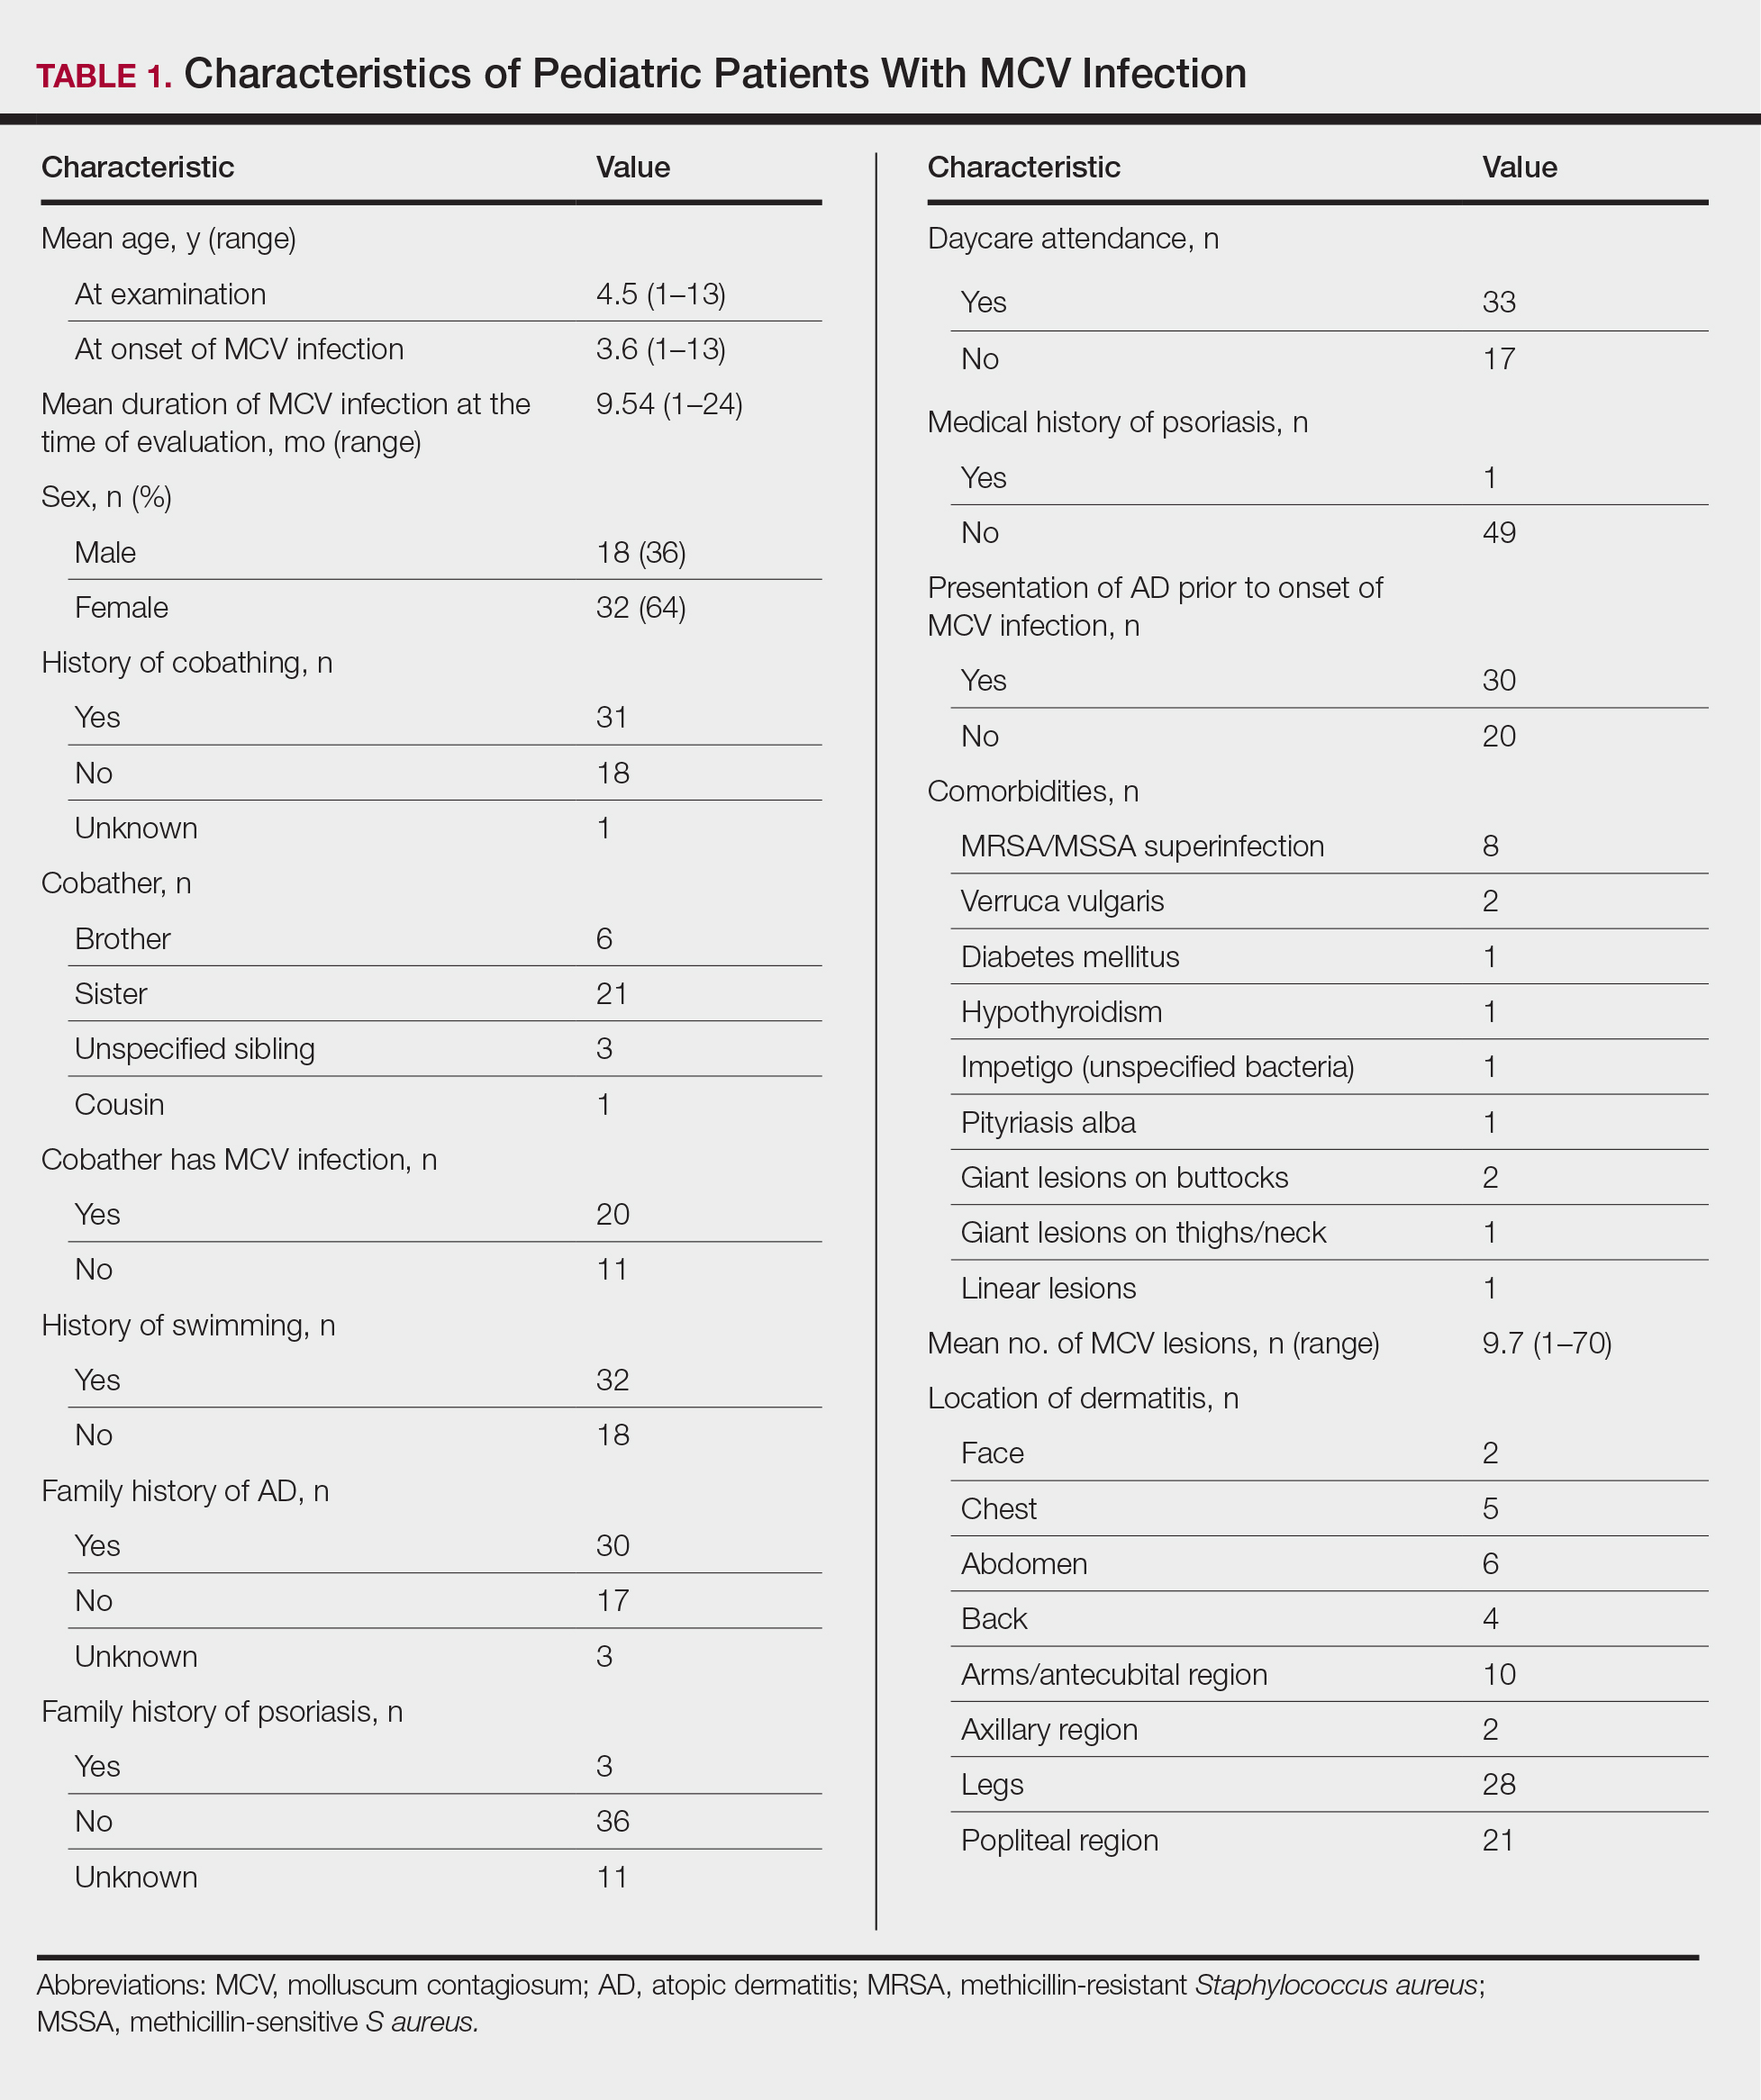
The role of cobathing is unknown; however, 62% (31/50) of patients previously or currently cobathed at home, suggesting it may be a risk factor for MCV infection. An association of MCV lesions in the popliteal region trended toward being more likely with cobathing, but the association was not statistically significant.
Children with AD onset triggered by MCV infection statistically were more likely to have flexural localization of MCV and AD lesions and were statistically more likely to have a family history of AD (P<.04)(Table 2). Children with AD flares triggered by MCV infection were more likely to have MCV and AD lesions of the popliteal region and legs (P<.05)(Figure) and family history of AD (P<.04)(Table 3). Location of MCV lesions on the upper and lower extremities, buttocks, and genitalia were more likely to be associated with presence of any dermatitis than facial and/or truncal lesions (P<.05). Treatment of the MCV infection did not appear to impact the course of AD when present, but prospective interventions would be needed to assess this issue.
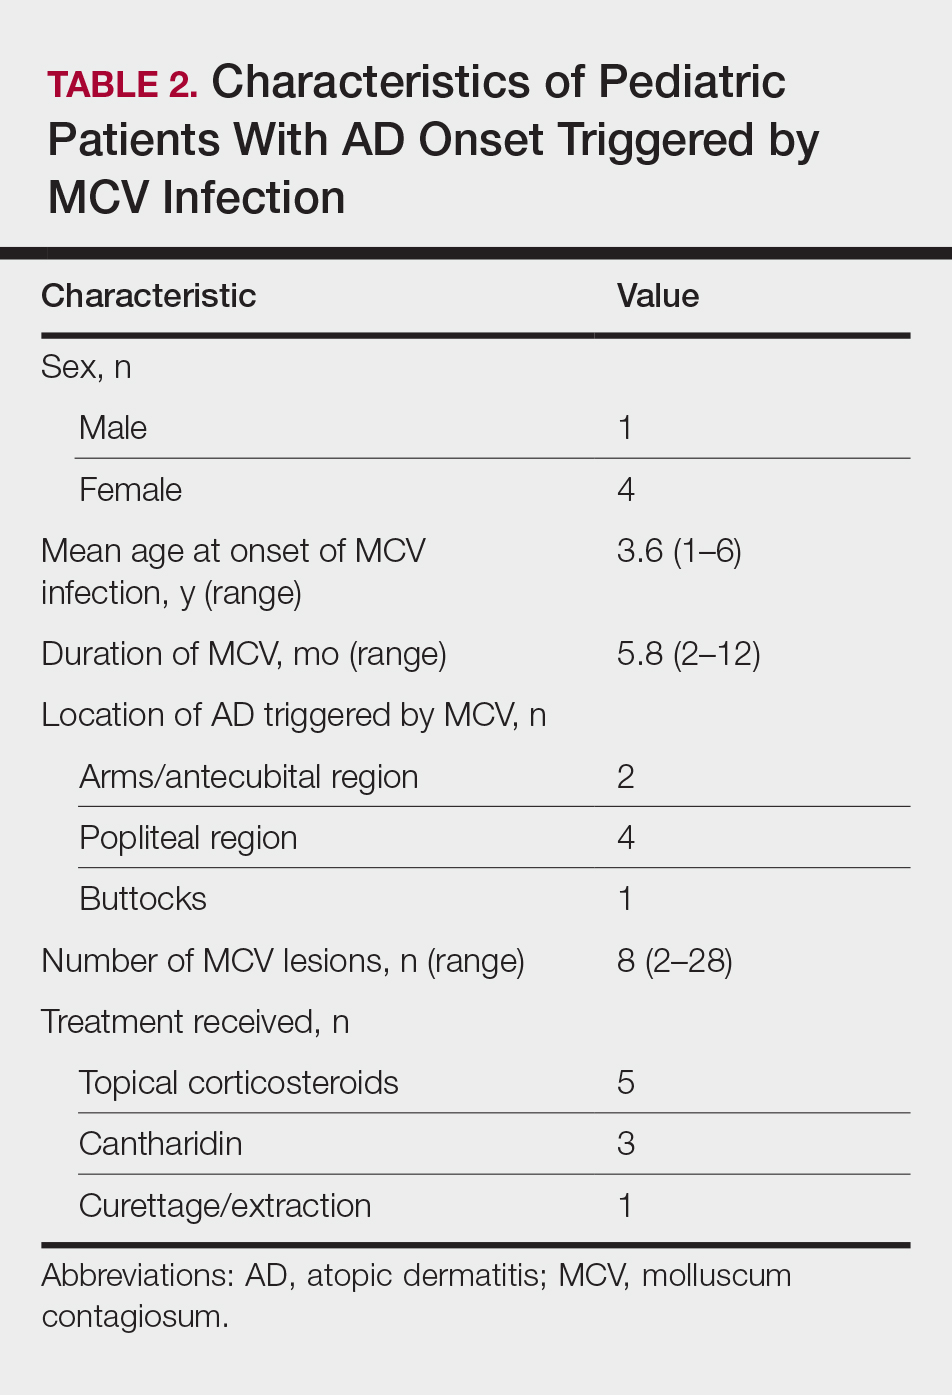
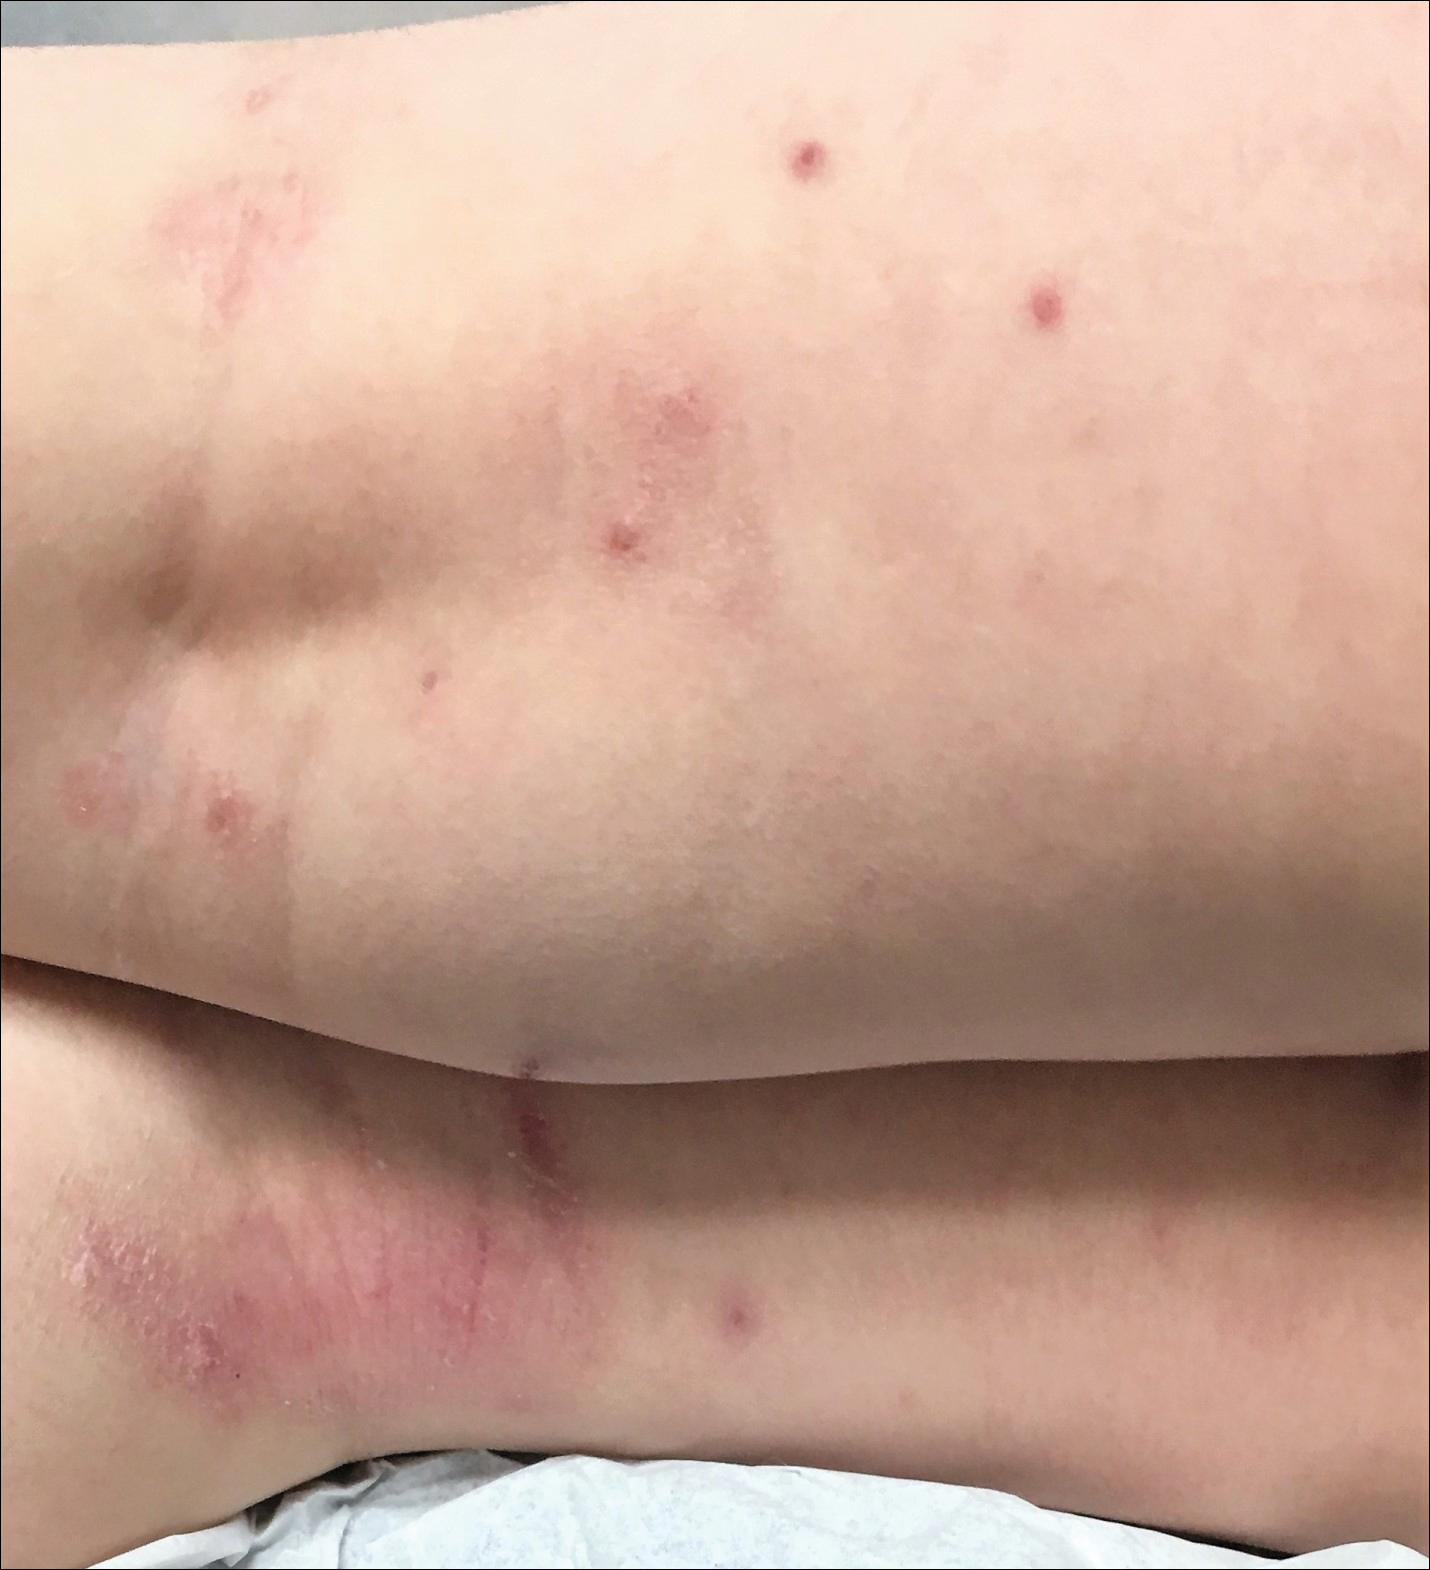
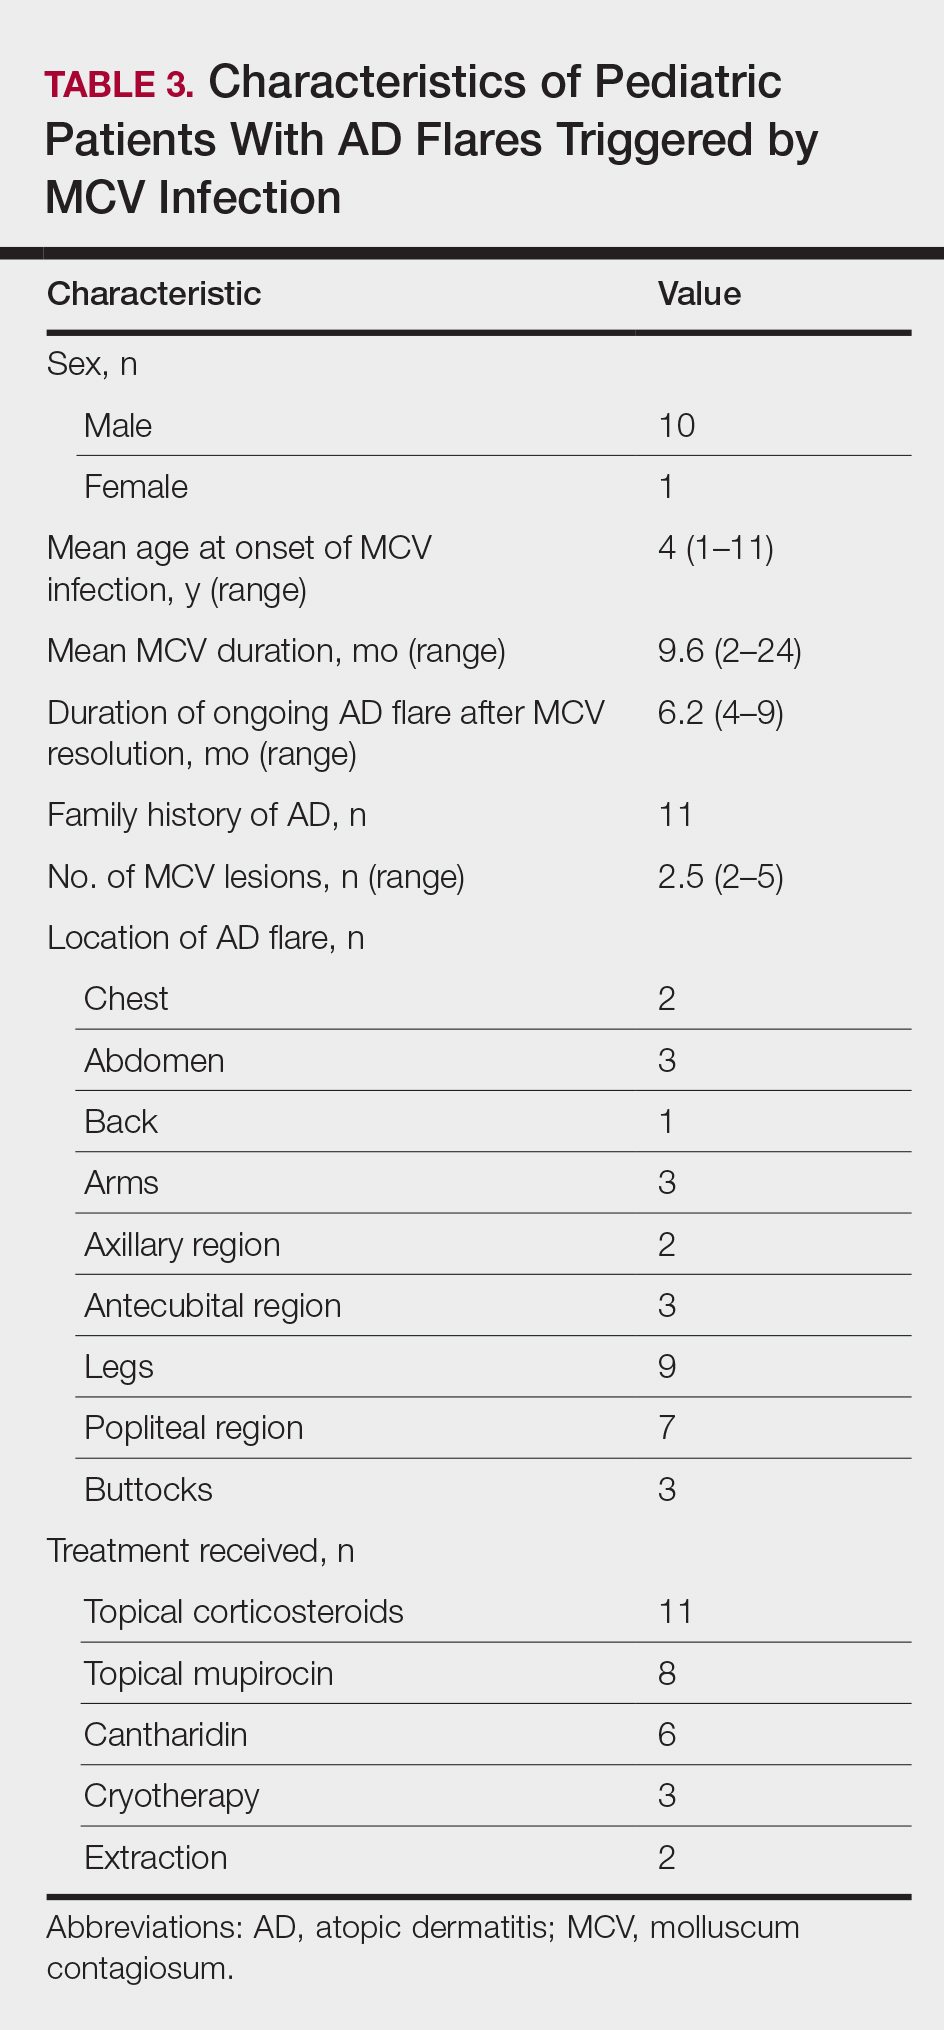
Superinfection with methicillin-resistant and methicillin-sensitive Staphylococcus aureus as well as atypical giant lesions of the intertriginous neck, inner thighs, and buttocks also were noted, but AD was uncommon in these cases. Given the limited number of cases, statistical significance could not be assessed.
Comment
Cutaneous infections with Malassezia have been postulated to trigger AD in infancy,1 while systemic viral infections such as varicella-zoster virus may be protective against AD when acquired in younger children.7 It appears that MCV infection in young children (eg, 3 years or younger) with specific localization to the flexural areas has the potential to trigger AD in susceptible hosts. Larger studies are needed to chart the long-term disease course of AD in these children. Due to the small size of this study, it is unclear if the rise of MCV infections since the 1980s has contributed to increased AD.8 Susceptible children appear to have a family history of AD and localization of MCV lesions on the legs, buttocks, and antecubital region. Atopic dermatitis risk appears to be highest when MCV lesions are localized to intertriginous or flexural locations.
In addition to triggering the onset of AD, MCV infection also can trigger persistent flaring of AD, especially in the popliteal region and legs. Atopic dermatitis flares can occur at any age, but they appear to cluster in preschoolers and typically are not prevented by AD or MCV treatments; however, randomized trials are needed to identify if early intervention of MCV has a preventive benefit on AD onset or flares, and longer-term observation is needed to identify true disease course modification. Reduction of the number of MCV lesions previously has been demonstrated with institution of topical corticosteroid therapy.6 Therefore, institution of atopic skin care generally is advisable in the setting of MCV infection. Future studies should address the potential use of interventions to prevent the triggering of AD onset or flares in the setting of MCV infection in children.5
- Brown J, Janniger CK, Schwartz RA, et al. Childhood molluscum contagiosum. Int J Dermatol. 2006;45:93-99.
- Connell CO, Oranje A, Van Gysel D, et al. Congenital molluscum contagiosum: report of four cases and review of the literature. Pediatr Dermatol. 2008;25:553-556.
- Luke JD, Silverberg NB. Vertically transmitted molluscum contagiosum infection. Pediatrics. 2010;125:E423-E425.
- Olsen JR, Piguet V, Gallacher J, et al. Molluscum contagiosum and associations with atopic eczema in children: a retrospective longitudinal study in primary care. Br J Gen Pract. 2016;66:E53-E58.
- Basdag H, Rainer BM, Cohen BA. Molluscum contagiosum: to treat or not to treat? experience with 170 children in an outpatient clinic setting in the northeastern United States. Pediatr Dermatol. 2015;32:353-357.
- Berger EM, Orlow SJ, Patel RR, et al. Experience with molluscum contagiosum and associated inflammatory reactions in a pediatric dermatology practice: the bump that rashes. Arch Dermatol. 2012;148:1257-1264.
- Silverberg JI, Norowitz KB, Kleiman E, et al. Association between varicella zoster virus infection and atopic dermatitis in early and late childhood: a case-control study. J Allergy Clin Immunol. 2010;126:300-305.
- Oriel JD. The increase in molluscum contagiosum. Br Med J (Clin Res Ed). 1987;294:74.
Molluscum contagiosum virus (MCV) is a common pediatric viral infection of the skin and/or mucous membranes.1 It has been noted in increasingly younger patient populations, ranging from congenital cases resulting from perinatal/vertical transmission to transmission from cobathing and pool usage.2,3
An association between MCV infection and atopic dermatitis (AD) has been reported to be caused by a predisposition to prolonged and severe cutaneous viral infections.4 However, the exact nature of the relationship between MCV and AD is unknown.
The purpose of this study was to identify pediatric patients with AD onset or flare of AD triggered by MCV infection as well as to characterize the setting under which MCV may trigger AD onset or flares in children.
Methods
Medical records for 50 children with prior or current MCV infection who presented sequentially to an outpatient pediatric dermatology practice over a 1-month period were identified. Institutional review board approval was obtained.
Results
The age range of the 50 patients with MCV infection was 1 to 13 years, with an average age of 3.6 years at the onset of infection (reported by parents/guardians) and 4.5 years at presentation to the pediatric dermatology office (Table 1).
The role of cobathing is unknown; however, 62% (31/50) of patients previously or currently cobathed at home, suggesting it may be a risk factor for MCV infection. An association of MCV lesions in the popliteal region trended toward being more likely with cobathing, but the association was not statistically significant.
Children with AD onset triggered by MCV infection statistically were more likely to have flexural localization of MCV and AD lesions and were statistically more likely to have a family history of AD (P<.04)(Table 2). Children with AD flares triggered by MCV infection were more likely to have MCV and AD lesions of the popliteal region and legs (P<.05)(Figure) and family history of AD (P<.04)(Table 3). Location of MCV lesions on the upper and lower extremities, buttocks, and genitalia were more likely to be associated with presence of any dermatitis than facial and/or truncal lesions (P<.05). Treatment of the MCV infection did not appear to impact the course of AD when present, but prospective interventions would be needed to assess this issue.
Superinfection with methicillin-resistant and methicillin-sensitive Staphylococcus aureus as well as atypical giant lesions of the intertriginous neck, inner thighs, and buttocks also were noted, but AD was uncommon in these cases. Given the limited number of cases, statistical significance could not be assessed.
Comment
Cutaneous infections with Malassezia have been postulated to trigger AD in infancy,1 while systemic viral infections such as varicella-zoster virus may be protective against AD when acquired in younger children.7 It appears that MCV infection in young children (eg, 3 years or younger) with specific localization to the flexural areas has the potential to trigger AD in susceptible hosts. Larger studies are needed to chart the long-term disease course of AD in these children. Due to the small size of this study, it is unclear if the rise of MCV infections since the 1980s has contributed to increased AD.8 Susceptible children appear to have a family history of AD and localization of MCV lesions on the legs, buttocks, and antecubital region. Atopic dermatitis risk appears to be highest when MCV lesions are localized to intertriginous or flexural locations.
In addition to triggering the onset of AD, MCV infection also can trigger persistent flaring of AD, especially in the popliteal region and legs. Atopic dermatitis flares can occur at any age, but they appear to cluster in preschoolers and typically are not prevented by AD or MCV treatments; however, randomized trials are needed to identify if early intervention of MCV has a preventive benefit on AD onset or flares, and longer-term observation is needed to identify true disease course modification. Reduction of the number of MCV lesions previously has been demonstrated with institution of topical corticosteroid therapy.6 Therefore, institution of atopic skin care generally is advisable in the setting of MCV infection. Future studies should address the potential use of interventions to prevent the triggering of AD onset or flares in the setting of MCV infection in children.5
- Brown J, Janniger CK, Schwartz RA, et al. Childhood molluscum contagiosum. Int J Dermatol. 2006;45:93-99.
- Connell CO, Oranje A, Van Gysel D, et al. Congenital molluscum contagiosum: report of four cases and review of the literature. Pediatr Dermatol. 2008;25:553-556.
- Luke JD, Silverberg NB. Vertically transmitted molluscum contagiosum infection. Pediatrics. 2010;125:E423-E425.
- Olsen JR, Piguet V, Gallacher J, et al. Molluscum contagiosum and associations with atopic eczema in children: a retrospective longitudinal study in primary care. Br J Gen Pract. 2016;66:E53-E58.
- Basdag H, Rainer BM, Cohen BA. Molluscum contagiosum: to treat or not to treat? experience with 170 children in an outpatient clinic setting in the northeastern United States. Pediatr Dermatol. 2015;32:353-357.
- Berger EM, Orlow SJ, Patel RR, et al. Experience with molluscum contagiosum and associated inflammatory reactions in a pediatric dermatology practice: the bump that rashes. Arch Dermatol. 2012;148:1257-1264.
- Silverberg JI, Norowitz KB, Kleiman E, et al. Association between varicella zoster virus infection and atopic dermatitis in early and late childhood: a case-control study. J Allergy Clin Immunol. 2010;126:300-305.
- Oriel JD. The increase in molluscum contagiosum. Br Med J (Clin Res Ed). 1987;294:74.
Practice Points
- Molluscum contagiosum virus (MCV) infection appears to aggravate atopic dermatitis (AD) symptoms in a subset of pediatric patients.
- In susceptible children, the first onset of AD symptoms can occur during the course of MCV infection.
Headless Compression Screw Fixation of Vertical Medial Malleolus Fractures is Superior to Unicortical Screw Fixation
ABSTRACT
This study is the first biomechanical research of headless compression screws for fixation of vertical shear fractures of the medial malleolus, a promising alternative that potentially offers several advantages for fixation.
Vertical shear fractures were simulated by osteotomies in 20 synthetic distal tibiae. Models were randomly assigned to fixation with either 2 parallel cancellous screws or 2 parallel Acutrak 2 headless compression screws (Acumed). Specimens were subjected to offset axial loading to simulate supination-adduction loading and tracked using high-resolution video.
The headless compression screw construct was significantly stiffer (P < .0001) (360 ± 131 N/mm) than the partially threaded cancellous screws (180 ± 48 N/mm) and demonstrated a significantly increased (P < .0001) mean load to clinical failure (719 ± 91 N vs 343 ± 83 N). When specimens were displaced to 6 mm and allowed to relax, the headless compression screw constructs demonstrated an elastic recoil and were reduced to the pretesting fragment alignment, whereas the parallel cancellous screw constructs remained displaced.
Along with the headless design that may decrease soft tissue irritation, the increased stiffness and elastic recoil of the headless compression screw construct offers improved fixation of medial malleolus vertical shear fractures over the traditional methods.
Continue to: Headless compressions screws...
Headless compressions screws are cannulated tapered titanium screws with variable thread pitch angle, allowing a fully threaded screw to apply compression along its entire length. These screws have been most commonly used for scaphoid fractures1 but have also been studied in fractures of small bones, such as capitellum, midfoot, and talar neck,2-4 and arthrodesis in the foot, ankle, and hand.5-7 Headless compression screws have been found to produce equivalent fragment compression to partially threaded cancellous screws while allowing less fragment displacement.8,9 The lack of a head may decrease soft tissue irritation compared with the partially threaded cancellous screws. Finally, headless compression screws are independent of cortical integrity, as the entire length of the screw features a wide thread diameter to capture cancellous bone in the proximal fragment, unlike partially threaded cancellous screws, which only possess a thread purchase in the distal fragment and depend on an intact cortex.
Vertical shear fractures of the medial malleolus occur through the supination-adduction of the talus exerted onto the articular surface of the medial malleolus.10 Optimal fixation of these fractures must be sufficient to maintain stable anatomic reduction of the ankle joint articular surface, allowing early range of motion, maintaining congruency of the ankle joint, and decreasing the risk of future post-traumatic arthritis to maximize functional outcome.11
A wide variety of techniques are available for fixation of these fractures, including various configurations of cortical screws, cancellous screws, tension bands, and antiglide plates. Clinically, 2 parallel 4.0-mm partially threaded cancellous screws are most often used. Limited evidence indicates that headless compression screws may be a viable option for fixation of medial malleolus fractures. One case reports the use of a headless compression screw for a horizontal medial malleolar fracture,12 and a small retrospective case series that used headless compression screws for all medial malleolar fractures showed satisfactory outcomes, a high union rate, and low patient-reported pain.13
We evaluate the stiffness, force to 2-mm displacement of the joint surface, and elastic properties of these 2 different constructs in vertical medial malleolar fractures in synthetic distal tibiae. We hypothesize that the parallel headless compression screw fixation will be stiffer and require more force to 2-mm displacement than parallel unicortical cancellous screw fixation.
MATERIALS AND METHODS
Identical vertical osteotomies (17.5 mm) were made from the medial border of the medial malleolus using a custom jig in 20 left 4th-generation composite synthetic distal tibiae (Sawbones, Pacific Research Labs; Model No. 3401) to simulate an Orthopaedic Trauma Association type 44-A2.3 fracture. The tibiae were then cut 18 cm from the tibial plafond and randomized to 2 fixation groups (n = 10 specimens for each group): parallel unicortical screw fixation or parallel unicortical headless compression screw fixation (Figures 1A-1D). Custom polymethylmethacrylate jigs were used to reproducibly drill identical holes with a 3.2-mm drill for the parallel unicortical screw construct and the drill bits provided by the Acutrak 2 Headless Compression Screw System (Acumed). The parallel unicortical screw construct consisted of 2 parallel 4.0-mm-diameter, 40-mm partially threaded cancellous screws (Depuy Synthes), and the headless compression fixation construct consisted of 2 parallel 4.7-mm-diameter, 45-mm titanium Acutrak 2 screws parallel to each other in the transverse plane. The Acutrak screws were placed per manufacturer instructions by first drilling with the Acutrak 2-4.7 Long Drill bit (Acumed), followed by the Acutrak 2-4.7 Profile Drill bit for the near cortex.
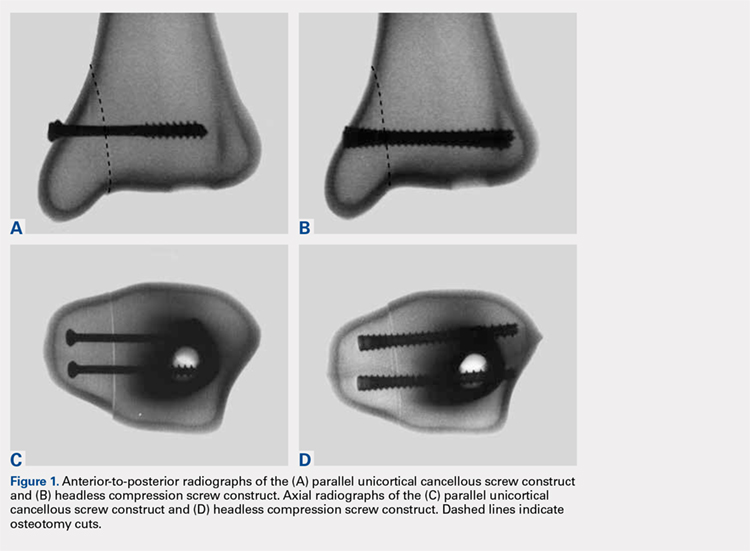
Continue to: Specimens...
Specimens were fixed to the base of a servohydraulic testing machine (Model 809, MTS Systems Corporation) with an axial-torsional load transducer (Model No. 662.20-01; Axial capacity of 250 kg, torsional capacity 2.88 kg-m; MTS Systems Corporation). The specimens were set in a vice tilted at 17° in the coronal plane to allow the MTS crosshead to apply an offset axial load simulating supination-adduction loading, which has been described previously (Figure 2).14,15 Load was applied to the inferolateral articular surface of the medial malleolus at 1 mm/s to a crosshead displacement of 6 mm and then cycled back to 0 mm. Load and axial displacement were measured at 60 Hz. The markers on the distal tibia and medial malleolus fracture fragment were tracked using high-resolution video (Fastcam PCI, Photron USA Inc). The motion of the video markers was determined using digitization and motion analysis software (Motus 9, Vicon).
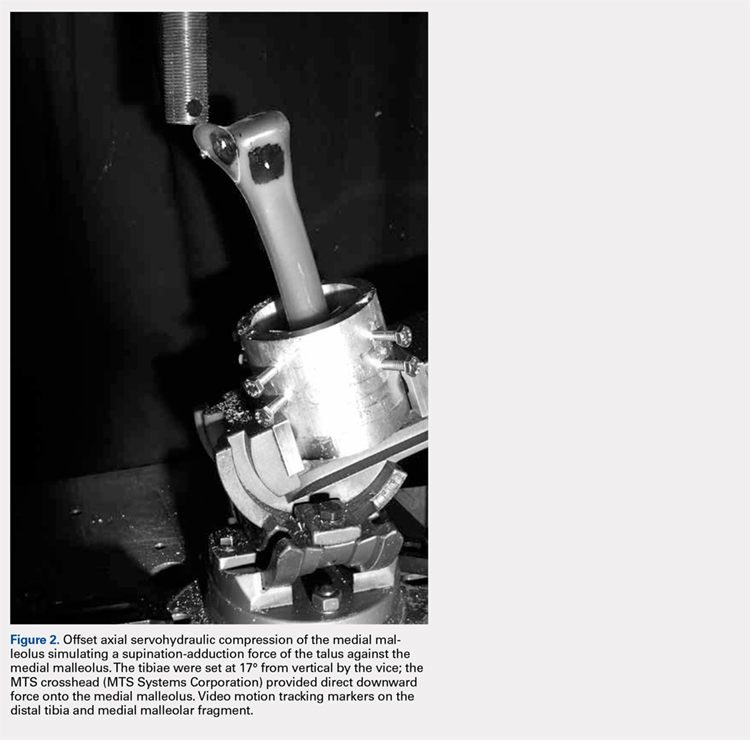
Stiffness was calculated as the slope of the linear portion of the load-displacement curve over a range of 0.5 to 2.0 mm (Figure 3) and reported as mean (standard deviation). The force at 2 mm of fragment displacement was defined as a clinical failure.16,17 Student’s t test was used to determine the difference in construct stiffness and force for 2 mm displacement of the 2 groups. Significance was defined as P < .05. Institutional Review Board approval was not required for this study.
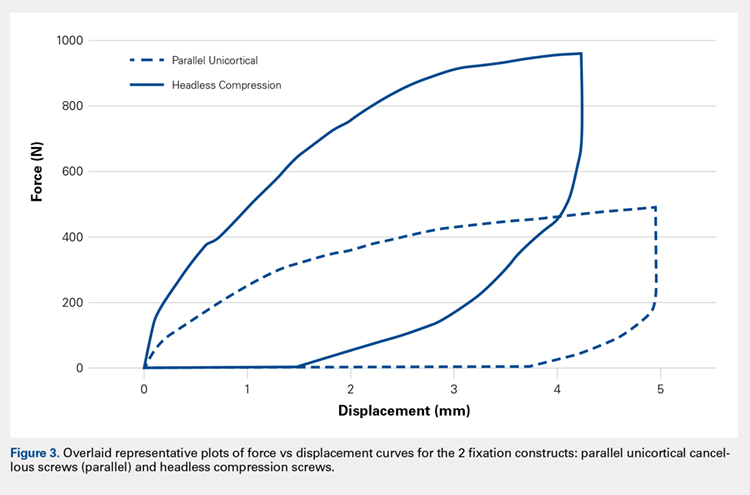
RESULTS
With offset axial testing to simulate supination-adduction force along with video motion analysis, the mean stiffness (± standard deviation) measured 180 ± 48 N/mm for the parallel unicortical screw fixation construct and 360 ± 131 N/mm for the headless compression screw fixation construct (Figure 4A). The headless compression screw fixation construct was over 2 times stiffer than the parallel unicortical construct during initial displacement of the fracture, indicating a statistically significant difference (P < .0001).
The mean force for 2 mm of fracture displacement, defined as clinical failure, reached 342 ± 83 N for the parallel unicortical screw fixation construct and 719 ± 91 N for the headless compression screw fixation construct (Figure 4B). The headless compression screw fixation construct resisted displacement significantly more (P = .0001) than the parallel unicortical screw construct, presenting a 100% increase.
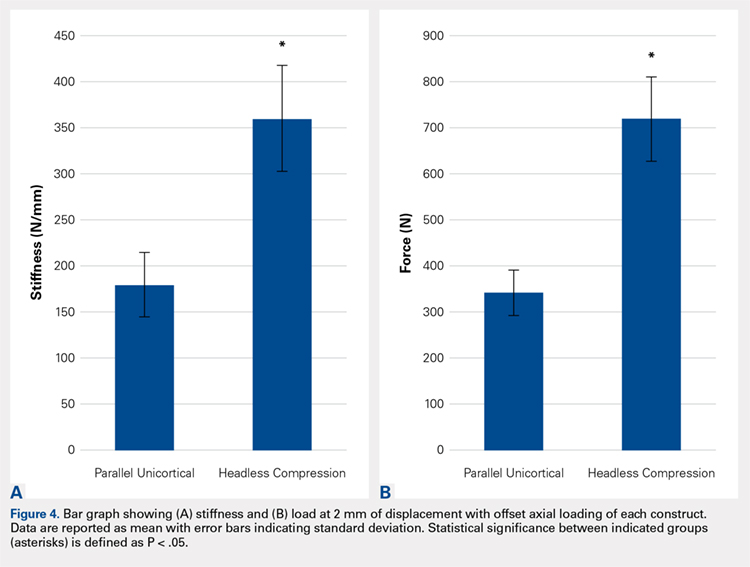
Upon cycling of the servohydraulic testing machine back to 0-mm displacement, the parallel unicortical construct demonstrated no elastic recoil, remaining displaced at 4 mm, whereas the headless compression screw construct rebounded to almost 0-mm displacement, which is well below the clinical definition of fixation failure of 2 mm (Figure 5).
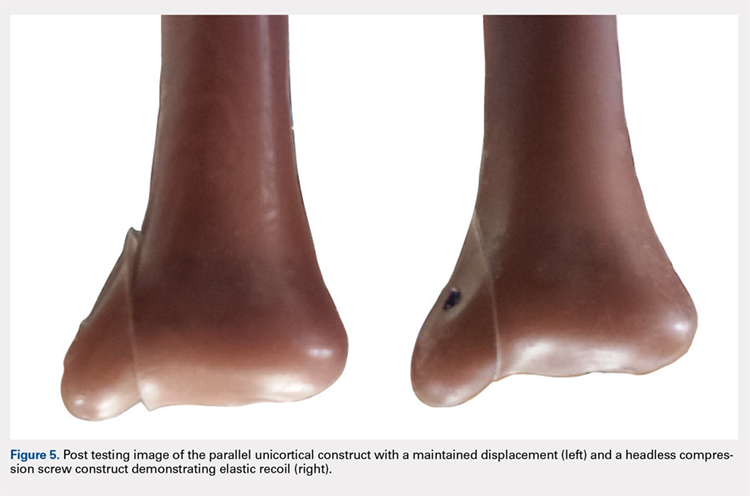
Continue to: Discussion...
DISCUSSION
When subjected to offset axial load, we observed that the headless compression screw construct exhibited significantly increased stiffness and load to 2 mm of displacement compared with a parallel unicortical screw construct. The headless compression screw also demonstrated elastic recoil to almost 0 mm of displacement, which is well below the 2-mm displacement.
We made reproducible fractures and fixation methods in synthetic distal tibiae, which feature less variability in size and quality than the cadaveric bone. Offset axial loading, rather than direct axial loading previously described by Amanatullah and colleagues,18 is the most physiologically relevant mode of force application to simulate the loading of the tauls onto the medial malleolus in the supination-adduction mechanism of injury.
The limitations of this study include the use of synthetic rather than cadaveric bone. Fourth-generation sawbones have been validated as possessing similar biomechanical properties as real bone.7,19 These results may also be inapplicable to osteoporotic bone, which would be significantly less dense than sawbones. This study is also an artificial situation designed to only test construct stiffness and load to clinical failure in a single mode of stress, offset axial loading and neglects other possible modes of force. This testing setup also disregards the structures surrounding the medial malleolus and tibia, including the talus, fibula, or soft tissue attachments, including the deltoid ligament and flexor retinaculum. These results are only relevant immediately after fixation and before bone healing occurs. We also tested the load to clinical failure rather than cyclic loading. Our testing more closely modeled a single traumatic force rather than the considerably smaller stresses that would be repeatedly exerted on the construct over several weeks after fixation in a clinical situation. This research is also not a clinical outcome study, rather, it suggests that headless compression screws are a viable, stronger, and possibly superior method for the initial fixation of vertical medial malleolar fractures.
As the load is offset axial, the larger thread purchase of the headless compression screws may lead to increased pullout strength, possibly increasing headless compression screw construct stiffness. Also, the variable diameter of headless compression screw, which reaches up to 4.7 mm, would increase the stiffness of the construct compared with the diameter of the cancellous screws. The elasticity of the headless compression construct may be because screws are made of titanium rather than stainless steel. Such property and given that the screws are cannulated rather than solid may also play a role, although several studies have shown variable results for cannulated vs solid screws of the same diameter.20,21 The elastic section modulus of both screws would have to be calculated to determine their exact effect on fixation.
CONCLUSION
The headless compression screw construct was found to be stiffer and features a higher load to clinical failure than a parallel unicortical cancellous screw construct for fixation of vertical medial malleolus fractures. Although significantly increased cost occurs with this construct, the headless design may decrease soft tissue irritation, and the elastic recoil of the construct after displacement may decrease clinical failure rates of this fixation method. This condition would eliminate the need for revision surgeries and thus be a cost effective alternative overall.
This paper will be judged for the Resident Writer’s Award.
- Fowler JR, Ilyas AM. Headless compression screw fixation of scaphoid fractures. Hand Clin. 2010;26(3):351-361, vi. doi:10.1016/j.hcl.2010.04.005.
- Karakasli A, Hapa O, Erduran M, Dincer C, Cecen B, Havitcioglu H. Mechanical comparison of headless screw fixation and locking plate fixation for talar neck fractures. J Foot Ankle Surg. 2015;54(5):905-909. doi:10.1053/j.jfas.2015.04.002.
- Elkowitz SJ, Polatsch DB, Egol KA, Kummer FJ, Koval KJ. Capitellum fractures: a biomechanical evaluation of three fixation methods. J Orthop Trauma. 2002;16(7):503-506. doi:10.1097/00005131-200208000-00009.
- Zhang H, Min L, Wang GL, et al. Primary open reduction and internal fixation with headless compression screws in the treatment of Chinese patients with acute Lisfranc joint injuries. J Trauma Acute Care Surg. 2012;72(5):1380-1385. doi:10.1097/TA.0b013e318246eabc.
- Lucas KJ, Morris RP, Buford WL Jr, Panchbhavi VK. Biomechanical comparison of first metatarsophalangeal joint arthrodeses using triple-threaded headless screws versus partially threaded lag screws. Foot Ankle Surg. 2014;20(2):144-148. doi:10.1016/j.fas.2014.02.009.
- Iwamoto T, Matsumura N, Sato K, Momohara S, Toyama Y, Nakamura T. An obliquely placed headless compression screw for distal interphalangeal joint arthrodesis. J Hand Surg. 2013;38(12):2360-2364. doi:10.1016/j.jhsa.2013.09.026.
- Odutola AA, Sheridan BD, Kelly AJ. Headless compression screw fixation prevents symptomatic metalwork in arthroscopic ankle arthrodesis. Foot Ankle Surg. 2012;18(2):111-113. doi:10.1016/j.fas.2011.03.013.
- Capelle JH, Couch CG, Wells KM, et al. Fixation strength of anteriorly inserted headless screws for talar neck fractures. Foot Ankle Int. 2013;34(7):1012-1016. doi:10.1177/1071100713479586.
- Wheeler DL, McLoughlin SW. Biomechanical assessment of compression screws. Clin Orthop Relat Res. 1998;350(350):237-245. doi:10.1097/00003086-199805000-00032.
- Rockwood CA, Green DP, Bucholz RW. Rockwood and Green's Fractures in Adults. 7th ed. Philadelphia, PA: Wolters Kluwer Health/Lippincott Williams & Wilkins; 2010.
- Simanski CJ, Maegele MG, Lefering R, et al. Functional treatment and early weightbearing after an ankle fracture: a prospective study. J Orthop Trauma. 2006;20(2):108-114. doi:10.1097/01.bot.0000197701.96954.8c.
- Reimer H, Kreibich M, Oettinger W. Extended uses for the Herbert/Whipple screw: six case reports out of 35 illustrating technique. J Orthop Trauma. 1996;10(1):7-14. doi:10.1097/00005131-199601000-00002.
- Barnes H, Cannada LK, Watson JT. A clinical evaluation of alternative fixation techniques for medial malleolus fractures. Injury. 2014;45(9):1365-1367. doi:10.1016/j.injury.2014.05.031.
- Dumigan RM, Bronson DG, Early JS. Analysis of fixation methods for vertical shear fractures of the medial malleolus. J Orthop Trauma. 2006;20(10):687-691. doi:10.1097/01.bot.0000247075.17548.3a.
- Toolan BC, Koval KJ, Kummer FJ, Sanders R, Zuckerman JD. Vertical shear fractures of the medial malleolus: a biomechanical study of five internal fixation techniques. Foot Ankle Int. 1994;15(9):483-489. doi:10.1177/107110079401500905.
- Ramsey PL, Hamilton W. Changes in tibiotalar area of contact caused by lateral talar shift. J Bone Joint Surg Am. 1976;58(3):356-357. doi:10.2106/00004623-197658030-00010.
- Thordarson DB, Motamed S, Hedman T, Ebramzadeh E, Bakshian S. The effect of fibular malreduction on contact pressures in an ankle fracture malunion model. J Bone Joint Surg Am. 1997;79(12):1809-1815. doi:10.2106/00004623-199712000-00006.
- Amanatullah DF, Khan SN, Curtiss S, Wolinsky PR. Effect of divergent screw fixation in vertical medial malleolus fractures. J Trauma Acute Care Surg. 2012;72(3):751-754. doi:10.1097/TA.0b013e31823b8b9f.
- Heiner AD. Structural properties of fourth-generation composite femurs and tibias. J Biomech. 2008;41(15):3282-3284. doi:10.1016/j.jbiomech.2008.08.013.
- Brown GA, McCarthy T, Bourgeault CA, Callahan DJ. Mechanical performance of standard and cannulated 4.0-mm cancellous bone screws. J Orthop Res. 2000;18(2):307-312. doi:10.1002/jor.1100180220.
- Merk BR, Stern SH, Cordes S, Lautenschlager EP. A fatigue life analysis of small fragment screws. J Orthop Trauma. 2001;15(7):494-499. doi:10.1097/00005131-200109000-00006.
ABSTRACT
This study is the first biomechanical research of headless compression screws for fixation of vertical shear fractures of the medial malleolus, a promising alternative that potentially offers several advantages for fixation.
Vertical shear fractures were simulated by osteotomies in 20 synthetic distal tibiae. Models were randomly assigned to fixation with either 2 parallel cancellous screws or 2 parallel Acutrak 2 headless compression screws (Acumed). Specimens were subjected to offset axial loading to simulate supination-adduction loading and tracked using high-resolution video.
The headless compression screw construct was significantly stiffer (P < .0001) (360 ± 131 N/mm) than the partially threaded cancellous screws (180 ± 48 N/mm) and demonstrated a significantly increased (P < .0001) mean load to clinical failure (719 ± 91 N vs 343 ± 83 N). When specimens were displaced to 6 mm and allowed to relax, the headless compression screw constructs demonstrated an elastic recoil and were reduced to the pretesting fragment alignment, whereas the parallel cancellous screw constructs remained displaced.
Along with the headless design that may decrease soft tissue irritation, the increased stiffness and elastic recoil of the headless compression screw construct offers improved fixation of medial malleolus vertical shear fractures over the traditional methods.
Continue to: Headless compressions screws...
Headless compressions screws are cannulated tapered titanium screws with variable thread pitch angle, allowing a fully threaded screw to apply compression along its entire length. These screws have been most commonly used for scaphoid fractures1 but have also been studied in fractures of small bones, such as capitellum, midfoot, and talar neck,2-4 and arthrodesis in the foot, ankle, and hand.5-7 Headless compression screws have been found to produce equivalent fragment compression to partially threaded cancellous screws while allowing less fragment displacement.8,9 The lack of a head may decrease soft tissue irritation compared with the partially threaded cancellous screws. Finally, headless compression screws are independent of cortical integrity, as the entire length of the screw features a wide thread diameter to capture cancellous bone in the proximal fragment, unlike partially threaded cancellous screws, which only possess a thread purchase in the distal fragment and depend on an intact cortex.
Vertical shear fractures of the medial malleolus occur through the supination-adduction of the talus exerted onto the articular surface of the medial malleolus.10 Optimal fixation of these fractures must be sufficient to maintain stable anatomic reduction of the ankle joint articular surface, allowing early range of motion, maintaining congruency of the ankle joint, and decreasing the risk of future post-traumatic arthritis to maximize functional outcome.11
A wide variety of techniques are available for fixation of these fractures, including various configurations of cortical screws, cancellous screws, tension bands, and antiglide plates. Clinically, 2 parallel 4.0-mm partially threaded cancellous screws are most often used. Limited evidence indicates that headless compression screws may be a viable option for fixation of medial malleolus fractures. One case reports the use of a headless compression screw for a horizontal medial malleolar fracture,12 and a small retrospective case series that used headless compression screws for all medial malleolar fractures showed satisfactory outcomes, a high union rate, and low patient-reported pain.13
We evaluate the stiffness, force to 2-mm displacement of the joint surface, and elastic properties of these 2 different constructs in vertical medial malleolar fractures in synthetic distal tibiae. We hypothesize that the parallel headless compression screw fixation will be stiffer and require more force to 2-mm displacement than parallel unicortical cancellous screw fixation.
MATERIALS AND METHODS
Identical vertical osteotomies (17.5 mm) were made from the medial border of the medial malleolus using a custom jig in 20 left 4th-generation composite synthetic distal tibiae (Sawbones, Pacific Research Labs; Model No. 3401) to simulate an Orthopaedic Trauma Association type 44-A2.3 fracture. The tibiae were then cut 18 cm from the tibial plafond and randomized to 2 fixation groups (n = 10 specimens for each group): parallel unicortical screw fixation or parallel unicortical headless compression screw fixation (Figures 1A-1D). Custom polymethylmethacrylate jigs were used to reproducibly drill identical holes with a 3.2-mm drill for the parallel unicortical screw construct and the drill bits provided by the Acutrak 2 Headless Compression Screw System (Acumed). The parallel unicortical screw construct consisted of 2 parallel 4.0-mm-diameter, 40-mm partially threaded cancellous screws (Depuy Synthes), and the headless compression fixation construct consisted of 2 parallel 4.7-mm-diameter, 45-mm titanium Acutrak 2 screws parallel to each other in the transverse plane. The Acutrak screws were placed per manufacturer instructions by first drilling with the Acutrak 2-4.7 Long Drill bit (Acumed), followed by the Acutrak 2-4.7 Profile Drill bit for the near cortex.
Continue to: Specimens...
Specimens were fixed to the base of a servohydraulic testing machine (Model 809, MTS Systems Corporation) with an axial-torsional load transducer (Model No. 662.20-01; Axial capacity of 250 kg, torsional capacity 2.88 kg-m; MTS Systems Corporation). The specimens were set in a vice tilted at 17° in the coronal plane to allow the MTS crosshead to apply an offset axial load simulating supination-adduction loading, which has been described previously (Figure 2).14,15 Load was applied to the inferolateral articular surface of the medial malleolus at 1 mm/s to a crosshead displacement of 6 mm and then cycled back to 0 mm. Load and axial displacement were measured at 60 Hz. The markers on the distal tibia and medial malleolus fracture fragment were tracked using high-resolution video (Fastcam PCI, Photron USA Inc). The motion of the video markers was determined using digitization and motion analysis software (Motus 9, Vicon).
Stiffness was calculated as the slope of the linear portion of the load-displacement curve over a range of 0.5 to 2.0 mm (Figure 3) and reported as mean (standard deviation). The force at 2 mm of fragment displacement was defined as a clinical failure.16,17 Student’s t test was used to determine the difference in construct stiffness and force for 2 mm displacement of the 2 groups. Significance was defined as P < .05. Institutional Review Board approval was not required for this study.
RESULTS
With offset axial testing to simulate supination-adduction force along with video motion analysis, the mean stiffness (± standard deviation) measured 180 ± 48 N/mm for the parallel unicortical screw fixation construct and 360 ± 131 N/mm for the headless compression screw fixation construct (Figure 4A). The headless compression screw fixation construct was over 2 times stiffer than the parallel unicortical construct during initial displacement of the fracture, indicating a statistically significant difference (P < .0001).
The mean force for 2 mm of fracture displacement, defined as clinical failure, reached 342 ± 83 N for the parallel unicortical screw fixation construct and 719 ± 91 N for the headless compression screw fixation construct (Figure 4B). The headless compression screw fixation construct resisted displacement significantly more (P = .0001) than the parallel unicortical screw construct, presenting a 100% increase.
Upon cycling of the servohydraulic testing machine back to 0-mm displacement, the parallel unicortical construct demonstrated no elastic recoil, remaining displaced at 4 mm, whereas the headless compression screw construct rebounded to almost 0-mm displacement, which is well below the clinical definition of fixation failure of 2 mm (Figure 5).
Continue to: Discussion...
DISCUSSION
When subjected to offset axial load, we observed that the headless compression screw construct exhibited significantly increased stiffness and load to 2 mm of displacement compared with a parallel unicortical screw construct. The headless compression screw also demonstrated elastic recoil to almost 0 mm of displacement, which is well below the 2-mm displacement.
We made reproducible fractures and fixation methods in synthetic distal tibiae, which feature less variability in size and quality than the cadaveric bone. Offset axial loading, rather than direct axial loading previously described by Amanatullah and colleagues,18 is the most physiologically relevant mode of force application to simulate the loading of the tauls onto the medial malleolus in the supination-adduction mechanism of injury.
The limitations of this study include the use of synthetic rather than cadaveric bone. Fourth-generation sawbones have been validated as possessing similar biomechanical properties as real bone.7,19 These results may also be inapplicable to osteoporotic bone, which would be significantly less dense than sawbones. This study is also an artificial situation designed to only test construct stiffness and load to clinical failure in a single mode of stress, offset axial loading and neglects other possible modes of force. This testing setup also disregards the structures surrounding the medial malleolus and tibia, including the talus, fibula, or soft tissue attachments, including the deltoid ligament and flexor retinaculum. These results are only relevant immediately after fixation and before bone healing occurs. We also tested the load to clinical failure rather than cyclic loading. Our testing more closely modeled a single traumatic force rather than the considerably smaller stresses that would be repeatedly exerted on the construct over several weeks after fixation in a clinical situation. This research is also not a clinical outcome study, rather, it suggests that headless compression screws are a viable, stronger, and possibly superior method for the initial fixation of vertical medial malleolar fractures.
As the load is offset axial, the larger thread purchase of the headless compression screws may lead to increased pullout strength, possibly increasing headless compression screw construct stiffness. Also, the variable diameter of headless compression screw, which reaches up to 4.7 mm, would increase the stiffness of the construct compared with the diameter of the cancellous screws. The elasticity of the headless compression construct may be because screws are made of titanium rather than stainless steel. Such property and given that the screws are cannulated rather than solid may also play a role, although several studies have shown variable results for cannulated vs solid screws of the same diameter.20,21 The elastic section modulus of both screws would have to be calculated to determine their exact effect on fixation.
CONCLUSION
The headless compression screw construct was found to be stiffer and features a higher load to clinical failure than a parallel unicortical cancellous screw construct for fixation of vertical medial malleolus fractures. Although significantly increased cost occurs with this construct, the headless design may decrease soft tissue irritation, and the elastic recoil of the construct after displacement may decrease clinical failure rates of this fixation method. This condition would eliminate the need for revision surgeries and thus be a cost effective alternative overall.
This paper will be judged for the Resident Writer’s Award.
- Fowler JR, Ilyas AM. Headless compression screw fixation of scaphoid fractures. Hand Clin. 2010;26(3):351-361, vi. doi:10.1016/j.hcl.2010.04.005.
- Karakasli A, Hapa O, Erduran M, Dincer C, Cecen B, Havitcioglu H. Mechanical comparison of headless screw fixation and locking plate fixation for talar neck fractures. J Foot Ankle Surg. 2015;54(5):905-909. doi:10.1053/j.jfas.2015.04.002.
- Elkowitz SJ, Polatsch DB, Egol KA, Kummer FJ, Koval KJ. Capitellum fractures: a biomechanical evaluation of three fixation methods. J Orthop Trauma. 2002;16(7):503-506. doi:10.1097/00005131-200208000-00009.
- Zhang H, Min L, Wang GL, et al. Primary open reduction and internal fixation with headless compression screws in the treatment of Chinese patients with acute Lisfranc joint injuries. J Trauma Acute Care Surg. 2012;72(5):1380-1385. doi:10.1097/TA.0b013e318246eabc.
- Lucas KJ, Morris RP, Buford WL Jr, Panchbhavi VK. Biomechanical comparison of first metatarsophalangeal joint arthrodeses using triple-threaded headless screws versus partially threaded lag screws. Foot Ankle Surg. 2014;20(2):144-148. doi:10.1016/j.fas.2014.02.009.
- Iwamoto T, Matsumura N, Sato K, Momohara S, Toyama Y, Nakamura T. An obliquely placed headless compression screw for distal interphalangeal joint arthrodesis. J Hand Surg. 2013;38(12):2360-2364. doi:10.1016/j.jhsa.2013.09.026.
- Odutola AA, Sheridan BD, Kelly AJ. Headless compression screw fixation prevents symptomatic metalwork in arthroscopic ankle arthrodesis. Foot Ankle Surg. 2012;18(2):111-113. doi:10.1016/j.fas.2011.03.013.
- Capelle JH, Couch CG, Wells KM, et al. Fixation strength of anteriorly inserted headless screws for talar neck fractures. Foot Ankle Int. 2013;34(7):1012-1016. doi:10.1177/1071100713479586.
- Wheeler DL, McLoughlin SW. Biomechanical assessment of compression screws. Clin Orthop Relat Res. 1998;350(350):237-245. doi:10.1097/00003086-199805000-00032.
- Rockwood CA, Green DP, Bucholz RW. Rockwood and Green's Fractures in Adults. 7th ed. Philadelphia, PA: Wolters Kluwer Health/Lippincott Williams & Wilkins; 2010.
- Simanski CJ, Maegele MG, Lefering R, et al. Functional treatment and early weightbearing after an ankle fracture: a prospective study. J Orthop Trauma. 2006;20(2):108-114. doi:10.1097/01.bot.0000197701.96954.8c.
- Reimer H, Kreibich M, Oettinger W. Extended uses for the Herbert/Whipple screw: six case reports out of 35 illustrating technique. J Orthop Trauma. 1996;10(1):7-14. doi:10.1097/00005131-199601000-00002.
- Barnes H, Cannada LK, Watson JT. A clinical evaluation of alternative fixation techniques for medial malleolus fractures. Injury. 2014;45(9):1365-1367. doi:10.1016/j.injury.2014.05.031.
- Dumigan RM, Bronson DG, Early JS. Analysis of fixation methods for vertical shear fractures of the medial malleolus. J Orthop Trauma. 2006;20(10):687-691. doi:10.1097/01.bot.0000247075.17548.3a.
- Toolan BC, Koval KJ, Kummer FJ, Sanders R, Zuckerman JD. Vertical shear fractures of the medial malleolus: a biomechanical study of five internal fixation techniques. Foot Ankle Int. 1994;15(9):483-489. doi:10.1177/107110079401500905.
- Ramsey PL, Hamilton W. Changes in tibiotalar area of contact caused by lateral talar shift. J Bone Joint Surg Am. 1976;58(3):356-357. doi:10.2106/00004623-197658030-00010.
- Thordarson DB, Motamed S, Hedman T, Ebramzadeh E, Bakshian S. The effect of fibular malreduction on contact pressures in an ankle fracture malunion model. J Bone Joint Surg Am. 1997;79(12):1809-1815. doi:10.2106/00004623-199712000-00006.
- Amanatullah DF, Khan SN, Curtiss S, Wolinsky PR. Effect of divergent screw fixation in vertical medial malleolus fractures. J Trauma Acute Care Surg. 2012;72(3):751-754. doi:10.1097/TA.0b013e31823b8b9f.
- Heiner AD. Structural properties of fourth-generation composite femurs and tibias. J Biomech. 2008;41(15):3282-3284. doi:10.1016/j.jbiomech.2008.08.013.
- Brown GA, McCarthy T, Bourgeault CA, Callahan DJ. Mechanical performance of standard and cannulated 4.0-mm cancellous bone screws. J Orthop Res. 2000;18(2):307-312. doi:10.1002/jor.1100180220.
- Merk BR, Stern SH, Cordes S, Lautenschlager EP. A fatigue life analysis of small fragment screws. J Orthop Trauma. 2001;15(7):494-499. doi:10.1097/00005131-200109000-00006.
TAKE-HOME POINTS
- Optimal fixation of vertical sheer ankle fractures is unknown.
- Headless compression screws are stiffer than cancellous screws in offset axial load.
- Headless compression screws have a higher load to failure than cancellous screws.
- Headless compression screws may offer a soft tissue friendly fixation of method for vertical sheer ankle fractures.
- These findings may not apply when subject to cyclic loads or in osteoporotic bone.
Having prescription drug coverage is associated with improved myeloma outcomes
Medicare beneficiaries with myeloma who have prescription drug coverage have shown both decreased used of classic cytotoxic chemotherapy and better survival, according to new research.

The findings suggested that prescription drug coverage brings better access to all existing treatment options.
“In this analysis of Medicare beneficiaries with myeloma, the receipt of therapy and survival differed according to prescription drug coverage status,” Adam Olszewski, MD, of the Lifespan Cancer Institute at Rhode Island Hospital in Providence, R.I., and his colleagues noted in the study. “Patients with PDP [prescription drug plan coverage through Medicare Part D] or OCC [other credible prescription drug coverage] more often received active myeloma care, compared to those without coverage,” they wrote in Journal of Clinical Oncology.
The researchers looked at 9,755 patients diagnosed with myeloma during 2006-2011 and examined what was used to treat the myeloma as a first line treatment. The cohort included 1,460 patients with no prescription drug coverage, 3,283 with PDP coverage, 3,607 with OCC, and 1,405 dual eligibility for Medicare and Medicaid coverage.
The study found that, compared with beneficiaries with no coverage, Medicare beneficiaries with PDP coverage “were 14% less likely to be treated with parenteral chemotherapy and 38% less likely to receive classic cytotoxic agents.” Additionally, among the cohort of beneficiaries that were without drug coverage prior to the diagnosis of myeloma, 41% actively obtained coverage, but even then, their survival was “significantly worse, compared with the beneficiaries who had coverage at diagnosis.”
Beneficiaries classified as having other credible coverage were 3% more likely to receive active myeloma care than were those without coverage, but the use of parenteral regimens did not differ between those groups.
Researchers noted that overall survival was 10% higher at 1 year and 6% higher at 3 years for beneficiaries with PDP coverage or OCC than it was for those without coverage, but they added that the analysis required cautious interpretation “as it is confounded by multiple baseline factors and mediated by the quality of cancer treatment. ... We could not discern whether worse survival in the group without coverage was a result of not receiving therapy at all, an inability to access IMiDs [immunomodulatory drugs], or poor control of other medical issues.”
However, a comparison with the control group “strongly suggest[s] that patients with myeloma without prescription drug coverage may not have received the most effective first-line therapy,” Dr. Olszewski and his colleagues added. “Survival for PDP and OCC groups remained identical, which supports the notion that having any prescription drug coverage contributed to optimal treatment and outcomes.”
The study was limited by the fact that unobserved clinical differences between beneficiaries with or without prescription drug coverage could have accounted for differences in mortality and that the comparison of treatments was restricted to parenteral regimens because IMiDs were observed to have been administered only for PDP enrollees.
Dr. Olszewski and study coauthor Amy Davidoff, PhD, of Yale University, New Haven, Conn., disclosed acting in consulting or advisory roles and receiving research funding from several pharmaceutical companies that develop cancer treatments.
SOURCE: Olszewski A et al. J Clin Oncol. 2018 Aug 16. doi: 10.1200/JCO.2018.77.8894.
Medicare beneficiaries with myeloma who have prescription drug coverage have shown both decreased used of classic cytotoxic chemotherapy and better survival, according to new research.
The findings suggested that prescription drug coverage brings better access to all existing treatment options.
“In this analysis of Medicare beneficiaries with myeloma, the receipt of therapy and survival differed according to prescription drug coverage status,” Adam Olszewski, MD, of the Lifespan Cancer Institute at Rhode Island Hospital in Providence, R.I., and his colleagues noted in the study. “Patients with PDP [prescription drug plan coverage through Medicare Part D] or OCC [other credible prescription drug coverage] more often received active myeloma care, compared to those without coverage,” they wrote in Journal of Clinical Oncology.
The researchers looked at 9,755 patients diagnosed with myeloma during 2006-2011 and examined what was used to treat the myeloma as a first line treatment. The cohort included 1,460 patients with no prescription drug coverage, 3,283 with PDP coverage, 3,607 with OCC, and 1,405 dual eligibility for Medicare and Medicaid coverage.
The study found that, compared with beneficiaries with no coverage, Medicare beneficiaries with PDP coverage “were 14% less likely to be treated with parenteral chemotherapy and 38% less likely to receive classic cytotoxic agents.” Additionally, among the cohort of beneficiaries that were without drug coverage prior to the diagnosis of myeloma, 41% actively obtained coverage, but even then, their survival was “significantly worse, compared with the beneficiaries who had coverage at diagnosis.”
Beneficiaries classified as having other credible coverage were 3% more likely to receive active myeloma care than were those without coverage, but the use of parenteral regimens did not differ between those groups.
Researchers noted that overall survival was 10% higher at 1 year and 6% higher at 3 years for beneficiaries with PDP coverage or OCC than it was for those without coverage, but they added that the analysis required cautious interpretation “as it is confounded by multiple baseline factors and mediated by the quality of cancer treatment. ... We could not discern whether worse survival in the group without coverage was a result of not receiving therapy at all, an inability to access IMiDs [immunomodulatory drugs], or poor control of other medical issues.”
However, a comparison with the control group “strongly suggest[s] that patients with myeloma without prescription drug coverage may not have received the most effective first-line therapy,” Dr. Olszewski and his colleagues added. “Survival for PDP and OCC groups remained identical, which supports the notion that having any prescription drug coverage contributed to optimal treatment and outcomes.”
The study was limited by the fact that unobserved clinical differences between beneficiaries with or without prescription drug coverage could have accounted for differences in mortality and that the comparison of treatments was restricted to parenteral regimens because IMiDs were observed to have been administered only for PDP enrollees.
Dr. Olszewski and study coauthor Amy Davidoff, PhD, of Yale University, New Haven, Conn., disclosed acting in consulting or advisory roles and receiving research funding from several pharmaceutical companies that develop cancer treatments.
SOURCE: Olszewski A et al. J Clin Oncol. 2018 Aug 16. doi: 10.1200/JCO.2018.77.8894.
FROM THE JOURNAL OF CLINICAL ONCOLOGY
Key clinical point: Prescription drug coverage is related to better outcomes for Medicare patients with myeloma.
Major finding: Compared with patients without coverage, patients with prescription drug plan coverage through Medicare Part D were 14% less likely to receive parenteral chemotherapy and 38% less likely to receive classic cytotoxic agents.
Study details: Observational study using SEER-Medicare data for 9,755 beneficiaries diagnosed with myeloma during 2006-2011.
Disclosures: The study was supported by scholar awards from the American Cancer Society and the American Society of Hematology and by a grant from the National Institute of General Medical Sciences. Report authors Dr. Olszewski and one coauthor disclosed receiving research funding and other financial compensation from several pharmaceutical companies that develop cancer treatments.
Source: Olszewski A et al. J Clin Oncol. 2018 Aug 16. doi: 10.1200/JCO.2018.77.8894
Innovations Lead to More Targeted Prostate Cancer Treatments (FULL)
The main treatment for prostate cancer—the third leading cause of cancer death in American men—often is “watchful waiting.” But what happens before, during, and after that waiting period has changed tremendously in recent years. Innovative and improved methods and drugs allow for a more precise diagnosis, better risk stratification, targeted treatment options, and longer survival.
Innovations in diagnosis include a revised histologic grading system, which was incorporated into the 2016 World Health Organization classification of tumors. The new grading system ranks prostate cancer on a 1-to-5 scale, making it more discriminating, as validated in a study of more than 25,000 men.
The use of new prognostic biomarkers has advanced risk stratification. According to a recent review, biopsy guided by ultrasound misses between 21% and 28% of prostate cancers and undergrades between 14% and 17%.1 But new serum-, tissue-, and image-based biomarkers may help identify potential false negatives. The prostate cancer antigen 3 test, for example, has an 88% negative predictive value for subsequent biopsy. Molecular biomarkers also can predict clinical progression, risk of adverse pathology, and metastatic risk.
Fortunately, biopsy guided by ultrasound is getting more precise. Advances in magnetic resonance imaging (MRI) now allow for “targeted biopsies.” The enhanced MRI has 89% sensitivity and 73% specificity for identifying prostate cancer. According to one study of 1,003 men, targeted prostate biopsy using MRI-ultrasound fusion identified 30% more cases of Gleason score ≥ 4 + 3 than did systematic prostate biopsy.1 Updates in positron emission tomography are garnering interest for improved staging because this technology allows for better detection of local recurrence, regional lymph node metastases, and distant metastases.
Once a prostate cancer diagnosis has been confirmed, the decision of what to do next may be watchful waiting (treating symptoms palliatively), but recent research suggests that active surveillance that includes regular prostate-specific antigen testing, physical examinations, and prostate biopsies may be a better choice, particularly for men with less aggressive cancer. One study of 1,298 men with mostly very low-risk disease followed for up to 60 months found metastasis in only 5; only 2 died. The Prostate Testing for Cancer and Treatment (ProtecT) trial found that the number of deaths in the active monitoring group did not differ significantly from those in the surgery or radiation groups.
What should be the contemporary standard of care? Androgen deprivation therapy (ADT) is still the go-to treatment for men with metastatic prostate cancer. Although ADT has been associated with toxicity, a meta-analysis found continuous ADT was better than intermittent in terms of disease progression and survival.1
Other research has focused on which types of prostate cancer respond best to specific therapies. Molecular subtyping (already available in bladder and breast cancer) is gaining popularity. Prostate cancer was thought to derive from glandular luminal cells, but recent evidence supports the idea that basal cells play a role as well. Researchers who analyzed nearly 4,000 samples suggest that luminal B tumors respond better to postoperative ADT than do nonluminal B cancers. These findings suggest that “personalized” ADT treatment may be possible.2
Several drugs have been shown to improve survival: Among them, docetaxel, abiraterone acetate, enzalutamide, and cabazitaxel. In the STAMPEDE trial, men with locally advanced or metastatic prostate cancer who received ADT plus abiraterone and prednisolone had significantly higher rates of overall and failure-free survival.3
Docetaxel, which can extend survival by 10 to 13 months compared with standard ADT, is taking on a bigger role for its ability to delay progression and recurrence while being well tolerated. Options for men whose cancer does not respond to ADT include abiraterone and enzalutamide. Both act on the androgen axis to slow progression and improve survival.
More than 30% of patients treated with radical prostatectomy will have recurrent cancer as will 50% of those treated with salvage radiation therapy. Bicalutamide has shown extremely promising action against recurrent cancer. In one study, the cumulative incidence of metastatic prostate cancer at 12 years was 14.5% in the bicalutamide group, compared with 23.0% in the placebo group.4
But while that study was going on, it was superseded by injectable gonadotropin-releasing hormone agonists as first-choice hormonal therapy with radiation. However, the researchers say that does not
Multimodal therapy and precision medicine are becoming bywords in prostate cancer treatment. Drugs on the horizon likely will be tailored to tumor molecular biology, with genetic information used to specifically guide diagnosis and treatment. Prostate cancer may still be a slow killer, but immunotherapies (like sipuleucel-T, the first FDA-approved cancer vaccine), hormonal therapies, and bone-targeting agents enable men with prostate cancer to not only live longer but also with a better quality of life.
Click here to read the digital edition.
1. Litwin MS, Tan HJ. The diagnosis and treatment of prostate cancer: a review. JAMA. 2017;317(24):2532-2542.
2. Zhao SG, Chang SL, Erho N, et al. Associations of luminal and basal subtyping of prostate cancer with prognosis and response to androgen deprivation therapy. JAMA Oncol. 2017. [Epub ahead of print.]
3. James ND, de Bono JS, Spears MR, et al; for the STAMPEDE Investigators. Abiraterone for prostate cancer not previously treated with hormone therapy. N Engl J Med. 2017. [Epub ahead of print.]
4. Shipley WU, Seiferheld W, Lukka HR, et al; NRG Oncology RTOG. Radiation with or without antiandrogen therapy in recurrent prostate cancer. N Engl J Med. 2017;376(5):417-428.
The main treatment for prostate cancer—the third leading cause of cancer death in American men—often is “watchful waiting.” But what happens before, during, and after that waiting period has changed tremendously in recent years. Innovative and improved methods and drugs allow for a more precise diagnosis, better risk stratification, targeted treatment options, and longer survival.
Innovations in diagnosis include a revised histologic grading system, which was incorporated into the 2016 World Health Organization classification of tumors. The new grading system ranks prostate cancer on a 1-to-5 scale, making it more discriminating, as validated in a study of more than 25,000 men.
The use of new prognostic biomarkers has advanced risk stratification. According to a recent review, biopsy guided by ultrasound misses between 21% and 28% of prostate cancers and undergrades between 14% and 17%.1 But new serum-, tissue-, and image-based biomarkers may help identify potential false negatives. The prostate cancer antigen 3 test, for example, has an 88% negative predictive value for subsequent biopsy. Molecular biomarkers also can predict clinical progression, risk of adverse pathology, and metastatic risk.
Fortunately, biopsy guided by ultrasound is getting more precise. Advances in magnetic resonance imaging (MRI) now allow for “targeted biopsies.” The enhanced MRI has 89% sensitivity and 73% specificity for identifying prostate cancer. According to one study of 1,003 men, targeted prostate biopsy using MRI-ultrasound fusion identified 30% more cases of Gleason score ≥ 4 + 3 than did systematic prostate biopsy.1 Updates in positron emission tomography are garnering interest for improved staging because this technology allows for better detection of local recurrence, regional lymph node metastases, and distant metastases.
Once a prostate cancer diagnosis has been confirmed, the decision of what to do next may be watchful waiting (treating symptoms palliatively), but recent research suggests that active surveillance that includes regular prostate-specific antigen testing, physical examinations, and prostate biopsies may be a better choice, particularly for men with less aggressive cancer. One study of 1,298 men with mostly very low-risk disease followed for up to 60 months found metastasis in only 5; only 2 died. The Prostate Testing for Cancer and Treatment (ProtecT) trial found that the number of deaths in the active monitoring group did not differ significantly from those in the surgery or radiation groups.
What should be the contemporary standard of care? Androgen deprivation therapy (ADT) is still the go-to treatment for men with metastatic prostate cancer. Although ADT has been associated with toxicity, a meta-analysis found continuous ADT was better than intermittent in terms of disease progression and survival.1
Other research has focused on which types of prostate cancer respond best to specific therapies. Molecular subtyping (already available in bladder and breast cancer) is gaining popularity. Prostate cancer was thought to derive from glandular luminal cells, but recent evidence supports the idea that basal cells play a role as well. Researchers who analyzed nearly 4,000 samples suggest that luminal B tumors respond better to postoperative ADT than do nonluminal B cancers. These findings suggest that “personalized” ADT treatment may be possible.2
Several drugs have been shown to improve survival: Among them, docetaxel, abiraterone acetate, enzalutamide, and cabazitaxel. In the STAMPEDE trial, men with locally advanced or metastatic prostate cancer who received ADT plus abiraterone and prednisolone had significantly higher rates of overall and failure-free survival.3
Docetaxel, which can extend survival by 10 to 13 months compared with standard ADT, is taking on a bigger role for its ability to delay progression and recurrence while being well tolerated. Options for men whose cancer does not respond to ADT include abiraterone and enzalutamide. Both act on the androgen axis to slow progression and improve survival.
More than 30% of patients treated with radical prostatectomy will have recurrent cancer as will 50% of those treated with salvage radiation therapy. Bicalutamide has shown extremely promising action against recurrent cancer. In one study, the cumulative incidence of metastatic prostate cancer at 12 years was 14.5% in the bicalutamide group, compared with 23.0% in the placebo group.4
But while that study was going on, it was superseded by injectable gonadotropin-releasing hormone agonists as first-choice hormonal therapy with radiation. However, the researchers say that does not
Multimodal therapy and precision medicine are becoming bywords in prostate cancer treatment. Drugs on the horizon likely will be tailored to tumor molecular biology, with genetic information used to specifically guide diagnosis and treatment. Prostate cancer may still be a slow killer, but immunotherapies (like sipuleucel-T, the first FDA-approved cancer vaccine), hormonal therapies, and bone-targeting agents enable men with prostate cancer to not only live longer but also with a better quality of life.
Click here to read the digital edition.
1. Litwin MS, Tan HJ. The diagnosis and treatment of prostate cancer: a review. JAMA. 2017;317(24):2532-2542.
2. Zhao SG, Chang SL, Erho N, et al. Associations of luminal and basal subtyping of prostate cancer with prognosis and response to androgen deprivation therapy. JAMA Oncol. 2017. [Epub ahead of print.]
3. James ND, de Bono JS, Spears MR, et al; for the STAMPEDE Investigators. Abiraterone for prostate cancer not previously treated with hormone therapy. N Engl J Med. 2017. [Epub ahead of print.]
4. Shipley WU, Seiferheld W, Lukka HR, et al; NRG Oncology RTOG. Radiation with or without antiandrogen therapy in recurrent prostate cancer. N Engl J Med. 2017;376(5):417-428.