User login
ACC looks to build inclusive, bully-free cardiology workplaces
The American College of Cardiology has issued a new health policy statement directed at eliminating the bias, discrimination, bullying, and harassment that hamstrings the delivery of quality cardiovascular care.
“We pay a lot of attention, of course, to our patients and patient care issues but our ability to care optimally for patients is limited if the workforce is handicapped in any way,” said Pamela S. Douglas, MD, of Duke University, Durham, N.C., who cochaired the writing committee.
The document is the second in the ACC’s diversity inclusion initiative, following the 2019 report on equal compensation and opportunity in cardiology, but the foundation for the work actually started 5 years ago, she told this news organization.
“Unfortunately, COVID and other world events have created a climate in the United States where people don’t treat each other terribly well,” Dr. Douglas said. “It’s divisive and confrontational often, when it should be collaborative. So this document, at this time, was serendipitous but wonderful timing.”
The 2022 ACC Health Policy Statement on Building Respect, Civility, and Inclusion in the Cardiovascular Workforce was published online March 17 in the Journal of the American College of Cardiology.
The 63-page document provides 12 principles for building a better workplace, starting with the belief that civil behavior and respect are inherent in its core values of teamwork, collaboration, and professionalism.
The ACC calls on all organizations and individuals involved in providing cardiovascular care, education, or research to recognize the “ubiquity” of uncivil behavior and the continuum of bias, discrimination, bullying, and harassment (BDBH) that characterize it.
Some of the recommendations they offer to eliminate these behaviors include:
- Creating institutional policies and resources to ensure hiring decisions, evaluations, and departmental/program/center reviews are objective.
- Including assessments of personal behaviors related to respect and civility in performance reviews.
- Establishing confidential, fair, and transparent mechanisms for reporting and investigating individuals and/or departments suspected of BDBH.
- Adopting longitudinal metrics and accurate data collection to track progress and inform future policy and interventions.
- Encouraging independent evaluation of institutional culture and efforts to reduce BDBH.
- Celebrating those who promote and achieve excellence in reducing BDBH.
Patients behaving badly
What’s new, especially since the COVID-19 pandemic, is the number of patients who themselves engage in disrespectful and uncivil behavior, observed Dr. Douglas.
“As physicians, it was the patient’s always right. So you work to do backflips to accommodate the patient,” she said. “But when the patient says: I don’t want to be treated by anybody that comes from outside the United States, that’s not our society anymore. And that has to be addressed and dealt with.”
The policy statement features a suite of online tools and resources including 15 case examples and 30 sample policies from institutions that have been anonymized and some provide an action framework for addressing this type of patient behavior, Dr. Douglas said. An individual, for example, can ask the patient why they made the remark, explaining that the provider is qualified and someone they’d like to have care for their own family. If it was a trainee on the receiving end, it’s fair for them to go back to their supervisor, mentor, or training director.
“They should back you up and explain to the patient that it’s not who we are at this hospital and that they’re happy to provide care, but they are part of the hospital and need to obey the rules and environment in this hospital,” she said.
Writing committee cochair Michael J. Mack, MD, of Baylor Scott & White Health, Plano, Tex., told tthis news organization that “one of the concepts that I hadn’t heard before that resonated with me was the term ‘upstander’ – that you can’t just be a bystander and watch this happen and do nothing. If you’re witness to this in the workplace, if it’s gender bias or racial bias, you need to get involved and reach out to that individual and see what you can do to help and be a reporter of it.”
But it’s all too costly
Financial constraints are often cited as a reason not to focus on bias, discrimination, bullying, and harassment in the workplace or to shelve initiatives, but it’s a false argument, say Dr. Mack and Dr. Douglas.

“One of the case examples is a cardiology practice that is suffering a decline in finances, and the board makes the recommendation that the efforts at diversity and civil workplaces need to be the first to go,” Dr. Mack explained. “And the point that’s being made in this is you can’t afford not to do it because it ends up being more costly to the business in the long run.”
Part of that cost is associated with losing valuable employees that were contributing but left because there wasn’t a culture of respectfulness and positivity in their workplace. While that’s always been a risk, it’s become a particularly compelling issue because of the workforce shortages present 3 years on in the pandemic, he said.
“There’s a new reexamination to be sure that we have a positive work environment that people want to come to work at every day,” he said. “I run our Research Institute, and normally we have a 5% vacancy rate, and our unfilled-position rate is 25% right now.”
Health care is delivered as a team today, but if a member feels disrespected, or worse – harassed, bullied, or discriminated against – they’re not going to contribute at the top of their game, Dr. Douglas said.
“It’s very well documented that bad behavior exists and that it has negative consequences for patient care for institutions, who are at great risk legally and regulatory wise,” she said. “And the document makes that clear that that risk is increasing.”
Dr. Douglas pointed out that the Joint Commission now requires good behavior in institutions that it accredits and that the Accreditation Council for Graduate Medical Education requires education around professionalism and evidence that their trainees are treated as professionals.
Funding agencies like the National Institutes of Health have also jumped into this space, recently establishing a hotline to report harassment, discrimination, and bullying perpetrated by an NIH-funded investigator, and giving institutions 30 days to investigate.
“In the last 2 years they have defunded, taken away the grants of 75 investigators, compared to zero in the 5 years before that,” Dr. Douglas said. “So I think, even though the bad behavior may be escalating, the consequences are escalating too.”
The new “2022 ACC Health Policy Statement on Building Respect, Civility, and Inclusion in the Cardiovascular Workplace” will be discussed in a session at the ACC 2022 Scientific Sessions on April 2 at 4:15 p.m. ET.
A version of this article first appeared on Medscape.com.
The American College of Cardiology has issued a new health policy statement directed at eliminating the bias, discrimination, bullying, and harassment that hamstrings the delivery of quality cardiovascular care.
“We pay a lot of attention, of course, to our patients and patient care issues but our ability to care optimally for patients is limited if the workforce is handicapped in any way,” said Pamela S. Douglas, MD, of Duke University, Durham, N.C., who cochaired the writing committee.
The document is the second in the ACC’s diversity inclusion initiative, following the 2019 report on equal compensation and opportunity in cardiology, but the foundation for the work actually started 5 years ago, she told this news organization.
“Unfortunately, COVID and other world events have created a climate in the United States where people don’t treat each other terribly well,” Dr. Douglas said. “It’s divisive and confrontational often, when it should be collaborative. So this document, at this time, was serendipitous but wonderful timing.”
The 2022 ACC Health Policy Statement on Building Respect, Civility, and Inclusion in the Cardiovascular Workforce was published online March 17 in the Journal of the American College of Cardiology.
The 63-page document provides 12 principles for building a better workplace, starting with the belief that civil behavior and respect are inherent in its core values of teamwork, collaboration, and professionalism.
The ACC calls on all organizations and individuals involved in providing cardiovascular care, education, or research to recognize the “ubiquity” of uncivil behavior and the continuum of bias, discrimination, bullying, and harassment (BDBH) that characterize it.
Some of the recommendations they offer to eliminate these behaviors include:
- Creating institutional policies and resources to ensure hiring decisions, evaluations, and departmental/program/center reviews are objective.
- Including assessments of personal behaviors related to respect and civility in performance reviews.
- Establishing confidential, fair, and transparent mechanisms for reporting and investigating individuals and/or departments suspected of BDBH.
- Adopting longitudinal metrics and accurate data collection to track progress and inform future policy and interventions.
- Encouraging independent evaluation of institutional culture and efforts to reduce BDBH.
- Celebrating those who promote and achieve excellence in reducing BDBH.
Patients behaving badly
What’s new, especially since the COVID-19 pandemic, is the number of patients who themselves engage in disrespectful and uncivil behavior, observed Dr. Douglas.
“As physicians, it was the patient’s always right. So you work to do backflips to accommodate the patient,” she said. “But when the patient says: I don’t want to be treated by anybody that comes from outside the United States, that’s not our society anymore. And that has to be addressed and dealt with.”
The policy statement features a suite of online tools and resources including 15 case examples and 30 sample policies from institutions that have been anonymized and some provide an action framework for addressing this type of patient behavior, Dr. Douglas said. An individual, for example, can ask the patient why they made the remark, explaining that the provider is qualified and someone they’d like to have care for their own family. If it was a trainee on the receiving end, it’s fair for them to go back to their supervisor, mentor, or training director.
“They should back you up and explain to the patient that it’s not who we are at this hospital and that they’re happy to provide care, but they are part of the hospital and need to obey the rules and environment in this hospital,” she said.
Writing committee cochair Michael J. Mack, MD, of Baylor Scott & White Health, Plano, Tex., told tthis news organization that “one of the concepts that I hadn’t heard before that resonated with me was the term ‘upstander’ – that you can’t just be a bystander and watch this happen and do nothing. If you’re witness to this in the workplace, if it’s gender bias or racial bias, you need to get involved and reach out to that individual and see what you can do to help and be a reporter of it.”
But it’s all too costly
Financial constraints are often cited as a reason not to focus on bias, discrimination, bullying, and harassment in the workplace or to shelve initiatives, but it’s a false argument, say Dr. Mack and Dr. Douglas.
“One of the case examples is a cardiology practice that is suffering a decline in finances, and the board makes the recommendation that the efforts at diversity and civil workplaces need to be the first to go,” Dr. Mack explained. “And the point that’s being made in this is you can’t afford not to do it because it ends up being more costly to the business in the long run.”
Part of that cost is associated with losing valuable employees that were contributing but left because there wasn’t a culture of respectfulness and positivity in their workplace. While that’s always been a risk, it’s become a particularly compelling issue because of the workforce shortages present 3 years on in the pandemic, he said.
“There’s a new reexamination to be sure that we have a positive work environment that people want to come to work at every day,” he said. “I run our Research Institute, and normally we have a 5% vacancy rate, and our unfilled-position rate is 25% right now.”
Health care is delivered as a team today, but if a member feels disrespected, or worse – harassed, bullied, or discriminated against – they’re not going to contribute at the top of their game, Dr. Douglas said.
“It’s very well documented that bad behavior exists and that it has negative consequences for patient care for institutions, who are at great risk legally and regulatory wise,” she said. “And the document makes that clear that that risk is increasing.”
Dr. Douglas pointed out that the Joint Commission now requires good behavior in institutions that it accredits and that the Accreditation Council for Graduate Medical Education requires education around professionalism and evidence that their trainees are treated as professionals.
Funding agencies like the National Institutes of Health have also jumped into this space, recently establishing a hotline to report harassment, discrimination, and bullying perpetrated by an NIH-funded investigator, and giving institutions 30 days to investigate.
“In the last 2 years they have defunded, taken away the grants of 75 investigators, compared to zero in the 5 years before that,” Dr. Douglas said. “So I think, even though the bad behavior may be escalating, the consequences are escalating too.”
The new “2022 ACC Health Policy Statement on Building Respect, Civility, and Inclusion in the Cardiovascular Workplace” will be discussed in a session at the ACC 2022 Scientific Sessions on April 2 at 4:15 p.m. ET.
A version of this article first appeared on Medscape.com.
FROM JACC
Racial disparities seen in pediatric postoperative mortality rates
Among Black and White children, higher socioeconomic status (SES) was associated with lower pediatric postoperative mortality, according to a cohort study published in JAMA Network Open. However, this association was not equitable when comparing Black and White children.
The results showed that postoperative mortality rates were significantly higher in Black children in the highest income category, compared with White children in the same category.
“[We] assessed whether increasing family SES is associated with lower pediatric postoperative mortality and, if so, whether this association is equitable among Black and White children,” Brittany L. Willer, MD, of Nationwide Children’s Hospital in Columbus, Ohio, and colleagues wrote.
The researchers retrospectively analyzed data from 51 pediatric tertiary care hospitals apart of the Children’s Hospital Association Pediatric Health Information System. The cohort included children younger than 18 years who underwent inpatient surgical procedures between January 2004 and December 2020.
The exposures of interest were race and parental income quartile; the primary endpoint was risk-adjusted in-hospital mortality rates by race and parental income quartile.
Results
The study cohort included 1,378,111 participants, including 248,464 (18.0%) Black and 1,129,647 (82.0%) White children, respectively.
The overall mortality rate was 1.2%, and rates decreased as income quartile increased (1.4% in quartile 1 [lowest income]; 1.3% in quartile 2; 1.0% in quartile 3; and 0.9% in quartile 4 [highest income]; P < .001).
Among participants in the three lowest income quartiles, Black children had 33% greater odds of postoperative death versus White children (adjusted odds ratio, 1.33; 95% confidence interval, 1.27-1.39; P < .001). This difference persisted in children in the highest income quartile (aOR, 1.39; 95% CI, 1.25-1.54; P < .001).
In addition, postoperative mortality rates in Black children in the highest income quartile (1.30%; 95% CI, 1.19%-1.42%) were similar to those of White children in the lowest income quartile (1.20%; 95% CI, 1.16%-1.25%).
“These findings suggest that increasing family SES did not provide equitable advantage to Black, compared with White children, and interventions that target socioeconomic inequities alone may not fully address persistent racial disparities in pediatric postoperative mortality,” wrote Dr. Willer and colleagues. “A multifaceted approach that includes dismantling of socioeconomic barriers, equitable availability of comprehensive pediatric surgical care, and personalized care for children of all races is needed.”
The researchers acknowledged that a potential limitation of the study was the use of zip code–level median household income as a proxy for family SES.
A perspective
In an interview, Timothy Joos, MD, a Seattle internist and pediatrician in private practice, said “there is a fair dose of racism and classism inside all of us – recognizing and coming to terms with it are steps toward improving equity issues.
“As providers, we have to remind ourselves to give our most prompt and thorough care to the patients with the most acute and severe illnesses,” Dr. Joos said. “As organizations, we have to pursue feedback from all our clients, but with special outreach to those that are used to not having their voices heard.”
No funding sources were reported. The authors reported no relevant disclosures. Dr. Joos is a member of the Pediatric News editorial advisory board but had no other disclosures.
FROM JAMA NETWORK OPEN
Access without a portal
I don’t have a patient portal. Probably never will.
This isn’t an attempt at “information blocking,” or intentional noncompliance, or a rebellious streak against the CURES act.
It’s practical: I can’t afford it.
I’m a small one-doc practice. My overhead is high, my profit margin is razor thin. In the sudden spike of COVID-19– and war-related inflation, my gas and office supply costs have gone up, but I’m in a field where I can’t raise my own prices to compensate. The restaurants and grocery stores near me can, but I can’t because of the way insurance works.
With that background, I don’t have the money to set up a patient portal for people to be able to get their notes, test results, anything.
This isn’t to say that I withhold things from patients. If they want a copy of my note, or their MRI report, or whatever, they’re welcome to it. I’m happy to fax it to them, or put it in the mail, or have them come by and pick it up.
I have no desire to keep information from patients. I actually try to stay on top of it, calling them with test results within 24 hours of receiving them and arranging follow-ups quickly when needed.
That’s one of the pluses of my dinky practice – I generally know my patients and can make decisions quickly on the next step once results come in. They don’t get tossed in a box to be reviewed in a few days. I take pride in staying on top of things – isn’t that how we all want to be treated when we’re on the other side of the desk?
Politicians like to say how much America depends on small businesses and how important we are to the economy. They love to do photo ops at a newly opened ice cream place or small barbecue joint. But if you’re a doctor in a small practice, you often get treated the same way the Mega-Med Group (“287 doctors! 19 specialties! 37 offices! No waiting!”) is treated. They can afford to have a digital portal, so why can’t you?
Or not doing my best to care for them.
Like Avis, I may not be No. 1, but I sure try harder.
Dr. Block has a solo neurology practice in Scottsdale, Ariz.
Third-party vendor physicians more likely to prescribe antibiotics during acute care telehealth visits
Third-party vendor physicians appear to be more much more likely than their system-employed counterparts to prescribe antibiotics during acute care telehealth visits for acute respiratory infection (ARI), according to a study in the Journal of Telemedicine and Telecare.
As health systems expand their direct-to-consumer (DTC) virtual care, the quality of that care seems to vary, write the authors. Patients with ARI symptoms make up about one-third of virtual visits. Prescribing practice is a commonly cited measure of care quality for ARI, which is usually viral and rarely benefits from antibiotics.
“When providing care through telehealth, hospital-affiliated emergency physicians practiced better antibiotic stewardship than vendor-supplied, non–hospital-affiliated physicians,” lead study author Kathleen Li, MD, MS, a clinical lecturer in the department of emergency medicine at the University of Michigan, Ann Arbor, told this news organization.
“We had a sense that a difference existed, but the magnitude of the difference was larger than expected,” she said.
Dr. Li and her colleagues retrospectively analyzed on-demand telehealth visits available to health system employees and dependents of a large urban academic health system from March 2018, when the service began, through July 2019.
All 16 affiliated physicians providing ARI care were board-certified in emergency medicine, compared with 2 (8%) of the 25 unaffiliated (vendor-employed) physicians. Most unaffiliated physicians were known to be board-certified in family medicine, internal medicine, or pediatrics.
Unaffiliated physicians were not given access to the health system’s electronic medical record. Instead, all their patient histories, exams, assessments, plans, impressions, and discharge instructions were scanned into the electronic medical record system by other staff the next day.
Unaffiliated doctors were more than twice as likely to prescribe antibiotics
The researchers extracted data on all 257 virtual ARI visits from the electronic health record system, including prescriptions and medication therapeutic class. They performed multivariable logistic regression, adjusting for patient age and time of visit (weekday vs. weekend; day vs. overnight).
Antibiotic prescription rates were similar between weekday and weekend visits, and between day and night visits. Regardless of provider status, older patients were more likely to be prescribed antibiotics (P = .01).
Overall, affiliated physicians prescribed antibiotics during 18% of visits, whereas vendor physicians prescribed antibiotics during 37% of visits. After adjustments, the odds were 2.3 times higher that a patient in a telehealth visit with a vendor provider would be prescribed antibiotics (95% confidence interval, 1.1-4.5).
The predicted antibiotic prescribing rate for ARI was 19% (95% confidence interval, 13%-25%) for affiliated providers vs. 35% (95% CI, 22%-47%) for unaffiliated providers, an average marginal effect of 15% (95% CI, 2%-29%). The difference was even greater (average marginal effect 20%, 95% CI, 4%-35%) when children and patients over 65 were excluded.
Consistent, high-quality care and antibiotic stewardship are needed in all settings
Three experts who were not involved in the study commented on the study.
Joshua W. Elder, MD, MPH, MHS, medical director of Telehealth Express Care (direct-to-consumer telemedicine) at UC Davis Health in Sacramento, Calif., said, “An important unanswered question is how factors such as communication (policy and procedures, practice guidelines), connection (electronic health records), and reimbursement and incentives that health system and vendor-based providers received impacted this outcome.
“As the volume of virtual practices grows, most health systems will need to create a hybrid between health-system-employed and vendor-and/or-payer-supplied physicians,” he added. “Finding ways to create similar quality and outcomes will be essential in the evolving digital health infrastructure being developed.”
Charles Teixeira, DO, an infectious disease specialist at the Medical University of South Carolina in Charleston, said that this study highlighted the need to consistently provide high-quality, evidence-based care regardless of the encounter setting.
“It was important to compare the prescribing practices for commonly used medications, especially those as important as antibiotics,” he added. “Overprescribing antibiotics can have a progressive, long-term effect on a community and increase the risk for patients to develop multidrug-resistant bacteria.”
Jeffrey A. Linder, MD, MPH, the chief of general internal medicine and geriatrics in the department of medicine at Northwestern University in Chicago, commended the authors for investigating the quality of telehealth.
“The major limitation,” he found, “is that the investigators lumped all ARI visits – including those that are potentially antibiotic appropriate (e.g., otitis media, pharyngitis, sinusitis), those that are non–antibiotic appropriate (e.g., bronchitis, influenza, laryngitis, URI, viral syndrome), and those that are nonspecific symptoms (e.g., cough, congestion, fever, sore throat) – into the same category.”
No clinical information was collected or presented that would enable the reader to tell if these two groups of physicians were evaluating different patient populations or even if they just diagnosed patients differently,” he added.
“Our study did not delve into why we saw the difference,” Dr. Li explained. “Exploring potential reasons further will have important implications for how to optimally deliver care via telehealth.”
All authors and independent experts have disclosed no relevant financial relationships. The study received no financial support.
A version of this article first appeared on Medscape.com.
FROM JOURNAL OF TELEMEDICINE AND TELECARE
‘It’s about transparency’: Indiana law prohibits misleading medical titles
While several health care professionals can perform some of the same functions as physicians, at the end of the day, they are not MDs or DOs, nor do they have the education and training to earn the right to present themselves to patients as such. That’s the reasoning behind Senate Bill 239, recently signed into law by Indiana Gov. Eric J. Holcomb.
“It’s about transparency. Health care professionals at every level should be proud of their profession and want to help patients make an informed choice when seeking out options for treatment,” Carrie Davis, MD, a Bloomington, Ind.–based dermatologist and member of the Indiana State Medical Association’s commission on legislation, told this news organization. “When this law goes into effect, a patient will be able to seek that treatment with confidence knowing they can trust the education, training, and license of the health care expert they’ve chosen to see.”
such as anesthesiologist, cardiologist, dermatologist, and others by professionals who have not graduated from medical school and completed the necessary training to adopt the physician title. It also prohibits health care professionals from using deceptive or misleading advertising that misrepresents or falsely describes their profession, education, or skills.
“Using the medical term ‘anesthesiologist’ for nurse anesthetists, confuses patients who deserve to be fully informed of their health care provider’s qualifications,” Randall M. Clark, MD, president of the American Society of Anesthesiologists (ASA), said in a statement. “This new law affirms the most fundamental right of patients to know the qualifications of their health care professional.”
What’s in a title?
The problem stretches far beyond professional turf battles, as patients are often confused about the differences between various types of health care providers, according to the American Medical Association’s Truth in Advertising Campaign. Often, patients mistakenly believe they are meeting with medical doctors or doctors of osteopathic medicine when they are not.
Seung Sim, MD, an Indiana anesthesiologist and the immediate past president of the Indiana Society of Anesthesiologists, said in an interview that every member of the medical team plays an important role in high-quality patient care, but among that team, education and training differs.
“The threat to patient safety comes by nonphysicians marketing themselves in a way that is confusing to patients, and misleading, making the patient believe they’re seeing a physician when they’re not,” said Dr. Sim. “That patient deserves to know who is providing their health care and what level of education and training they have, so the patient can make the best decision for their treatment.”
Medical groups speak out
Several professional medical groups have voiced their opposition to medical title misappropriation.
Perhaps most notably, the ASA has been spearheading efforts that prohibit medical professionals to identify as physicians for several years. In 2019, the ASA authored Resolution 228, which calls on the AMA to oppose and work with state medical societies to prevent the misappropriation of medical specialties’ titles.
The resolution, which was adopted by the AMA in June 2019, also reaffirms support of the Scope of Practice Partnership’s Truth in Advertising Campaign to ensure patients receive accurate information about who is providing their care.
In addition, in 2021, the ASA condemned the decision by the American Association of Nurse Anesthetists to change its name to the American Association of Nurse Anesthesiology (AANA) – pointing out that the term “nurse anesthesiologist” could confuse patients and create discord in the care setting, ultimately risking patient safety.
While the ASA and other professional groups support team-based models of care, they are quick to point out that health care professionals need to know their place in the lineup.
A statement from the American Osteopathic Association (AOA), for instance, points out that only DOs and MDs can be licensed to practice medicine – and, therefore, “physician-led” should not mean “physician-optional.” In fact, only professionals who have earned the right to practice medicine through completion of medical school and accredited residency/fellowship training and who have achieved board certification in their chosen specialty/subspecialty should take the helm of these multidisciplinary teams, according to the AOA.
The AANA cast the controversy in a completely different light, characterizing its name change as part of a rebranding effort to advance the science of nurse anesthesiology and advocate for certified registered nurse anesthetists. In 2021, the AANA asserted: “The notion of being pushed by the American Society of Anesthesiologists that rebranding and changing the name of the AANA will somehow mislead or harm patients or create discord among providers is absurd at best and false and inflammatory fearmongering at worst.”
A version of this article first appeared on Medscape.com.
Aiming for System Improvement While Transitioning to the New Normal
As we transition out of the Omicron surge, the lessons we’ve learned from the prior surges carry forward and add to our knowledge foundation. Medical journals have published numerous research and perspectives manuscripts on all aspects of COVID-19 over the past 2 years, adding much-needed knowledge to our clinical practice during the pandemic. However, the story does not stop there, as the pandemic has impacted the usual, non-COVID-19 clinical care we provide. The value-based health care delivery model accounts for both COVID-19 clinical care and the usual care we provide our patients every day. Clinicians, administrators, and health care workers will need to know how to balance both worlds in the years to come.
In this issue of JCOM, the work of balancing the demands of COVID-19 care with those of system improvement continues. Two original research articles address the former, with Liesching et al1 reporting data on improving clinical outcomes of patients with COVID-19 through acute care oxygen therapies, and Ali et al2 explaining the impact of COVID-19 on STEMI care delivery models. Liesching et al’s study showed that patients admitted for COVID-19 after the first surge were more likely to receive high-flow nasal cannula and had better outcomes, while Ali et al showed that patients with STEMI yet again experienced worse outcomes during the first wave.
On the system improvement front, Cusick et al3 report on a quality improvement (QI) project that addressed acute disease management of heparin-induced thrombocytopenia (HIT) during hospitalization, Sosa et al4 discuss efforts to improve comorbidity capture at their institution, and Uche et al5 present the results of a nonpharmacologic initiative to improve management of chronic pain among veterans. Cusick et al’s QI project showed that a HIT testing strategy could be safely implemented through an evidence-based process to nudge resource utilization using specific management pathways. While capturing and measuring the complexity of diseases and comorbidities can be challenging, accurate capture is essential, as patient acuity has implications for reimbursement and quality comparisons for hospitals and physicians; Sosa et al describe a series of initiatives implemented at their institution that improved comorbidity capture. Furthermore, Uche et al report on a 10-week complementary and integrative health program for veterans with noncancer chronic pain that reduced pain intensity and improved quality of life for its participants. These QI reports show that, though the health care landscape has changed over the past 2 years, the aim remains the same: to provide the best care for patients regardless of the diagnosis, location, or time.
Conducting QI projects during the COVID-19 pandemic has been difficult, especially in terms of implementing consistent processes and management pathways while contending with staff and supply shortages. The pandemic, however, has highlighted the importance of continuing QI efforts, specifically around infectious disease prevention and good clinical practices. Moreover, the recent continuous learning and implementation around COVID-19 patient care has been a significant achievement, as clinicians and administrators worked continuously to understand and improve processes, create a supporting culture, and redesign care delivery on the fly. The management of both COVID-19 care and our usual care QI efforts should incorporate the lessons learned from the pandemic and leverage system redesign for future steps. As we’ve seen, survival in COVID-19 improved dramatically since the beginning of the pandemic, as clinical trials became more adaptive and efficient and system upgrades like telemedicine and digital technologies in the public health response led to major advancements. The work to improve the care provided in the clinic and at the bedside will continue through one collective approach in the new normal.
Corresponding author: Ebrahim Barkoudah, MD, MPH, Department of Medicine Brigham and Women’s Hospital, Boston, MA; ebarkoudah@bwh.harvard.edu
1. Liesching TN, Lei Y. Oxygen therapies and clinical outcomes for patients hospitalized with covid-19: first surge vs second surge. J Clin Outcomes Manag. 2022;29(2):58-64. doi:10.12788/jcom.0086
2. Ali SH, Hyer S, Davis K, Murrow JR. Acute STEMI during the COVID-19 pandemic at Piedmont Athens Regional: incidence, clinical characteristics, and outcomes. J Clin Outcomes Manag. 2022;29(2):65-71. doi:10.12788/jcom.0085
3. Cusick A, Hanigan S, Bashaw L, et al. A practical and cost-effective approach to the diagnosis of heparin-induced thrombocytopenia: a single-center quality improvement study. J Clin Outcomes Manag. 2022;29(2):72-77.
4. Sosa MA, Ferreira T, Gershengorn H, et al. Improving hospital metrics through the implementation of a comorbidity capture tool and other quality initiatives. J Clin Outcomes Manag. 2022;29(2):80-87. doi:10.12788/jcom.00885. Uche JU, Jamison M, Waugh S. Evaluation of the Empower Veterans Program for military veterans with chronic pain. J Clin Outcomes Manag. 2022;29(2):88-95. doi:10.12788/jcom.0089
As we transition out of the Omicron surge, the lessons we’ve learned from the prior surges carry forward and add to our knowledge foundation. Medical journals have published numerous research and perspectives manuscripts on all aspects of COVID-19 over the past 2 years, adding much-needed knowledge to our clinical practice during the pandemic. However, the story does not stop there, as the pandemic has impacted the usual, non-COVID-19 clinical care we provide. The value-based health care delivery model accounts for both COVID-19 clinical care and the usual care we provide our patients every day. Clinicians, administrators, and health care workers will need to know how to balance both worlds in the years to come.
In this issue of JCOM, the work of balancing the demands of COVID-19 care with those of system improvement continues. Two original research articles address the former, with Liesching et al1 reporting data on improving clinical outcomes of patients with COVID-19 through acute care oxygen therapies, and Ali et al2 explaining the impact of COVID-19 on STEMI care delivery models. Liesching et al’s study showed that patients admitted for COVID-19 after the first surge were more likely to receive high-flow nasal cannula and had better outcomes, while Ali et al showed that patients with STEMI yet again experienced worse outcomes during the first wave.
On the system improvement front, Cusick et al3 report on a quality improvement (QI) project that addressed acute disease management of heparin-induced thrombocytopenia (HIT) during hospitalization, Sosa et al4 discuss efforts to improve comorbidity capture at their institution, and Uche et al5 present the results of a nonpharmacologic initiative to improve management of chronic pain among veterans. Cusick et al’s QI project showed that a HIT testing strategy could be safely implemented through an evidence-based process to nudge resource utilization using specific management pathways. While capturing and measuring the complexity of diseases and comorbidities can be challenging, accurate capture is essential, as patient acuity has implications for reimbursement and quality comparisons for hospitals and physicians; Sosa et al describe a series of initiatives implemented at their institution that improved comorbidity capture. Furthermore, Uche et al report on a 10-week complementary and integrative health program for veterans with noncancer chronic pain that reduced pain intensity and improved quality of life for its participants. These QI reports show that, though the health care landscape has changed over the past 2 years, the aim remains the same: to provide the best care for patients regardless of the diagnosis, location, or time.
Conducting QI projects during the COVID-19 pandemic has been difficult, especially in terms of implementing consistent processes and management pathways while contending with staff and supply shortages. The pandemic, however, has highlighted the importance of continuing QI efforts, specifically around infectious disease prevention and good clinical practices. Moreover, the recent continuous learning and implementation around COVID-19 patient care has been a significant achievement, as clinicians and administrators worked continuously to understand and improve processes, create a supporting culture, and redesign care delivery on the fly. The management of both COVID-19 care and our usual care QI efforts should incorporate the lessons learned from the pandemic and leverage system redesign for future steps. As we’ve seen, survival in COVID-19 improved dramatically since the beginning of the pandemic, as clinical trials became more adaptive and efficient and system upgrades like telemedicine and digital technologies in the public health response led to major advancements. The work to improve the care provided in the clinic and at the bedside will continue through one collective approach in the new normal.
Corresponding author: Ebrahim Barkoudah, MD, MPH, Department of Medicine Brigham and Women’s Hospital, Boston, MA; ebarkoudah@bwh.harvard.edu
1. Liesching TN, Lei Y. Oxygen therapies and clinical outcomes for patients hospitalized with covid-19: first surge vs second surge. J Clin Outcomes Manag. 2022;29(2):58-64. doi:10.12788/jcom.0086
2. Ali SH, Hyer S, Davis K, Murrow JR. Acute STEMI during the COVID-19 pandemic at Piedmont Athens Regional: incidence, clinical characteristics, and outcomes. J Clin Outcomes Manag. 2022;29(2):65-71. doi:10.12788/jcom.0085
3. Cusick A, Hanigan S, Bashaw L, et al. A practical and cost-effective approach to the diagnosis of heparin-induced thrombocytopenia: a single-center quality improvement study. J Clin Outcomes Manag. 2022;29(2):72-77.
4. Sosa MA, Ferreira T, Gershengorn H, et al. Improving hospital metrics through the implementation of a comorbidity capture tool and other quality initiatives. J Clin Outcomes Manag. 2022;29(2):80-87. doi:10.12788/jcom.00885. Uche JU, Jamison M, Waugh S. Evaluation of the Empower Veterans Program for military veterans with chronic pain. J Clin Outcomes Manag. 2022;29(2):88-95. doi:10.12788/jcom.0089
Evaluation of the Empower Veterans Program for Military Veterans With Chronic Pain
From Neurology/Chronic Pain Management Services, Department of Veterans Affairs (VA) Maryland Health Care System, Baltimore VA Medical Center, Baltimore, MD (Dr. Uche), and School of Nursing, Washburn University, Topeka, KS (Drs. Jamison and Waugh).
Abstract
Objective: The purpose of this quality improvement project was to abstract and analyze previously collected data from veterans with high-impact chronic pain who attended the Empower Veterans Program (EVP) offered by a Veterans Administration facility in the northeastern United States.
Methods: This quality improvement project used data collected from veterans with chronic pain who completed the veterans health care facility’s EVP between August 2017 and August 2019. Pre- and post-intervention data on pain intensity, pain interference, quality of life, and pain catastrophizing were compared using paired t-tests.
Results: Although data were abstracted from 115 patients, the final sample included
Conclusion: Veterans with chronic high-impact noncancer pain who completed the EVP had reduced pain intensity, pain interference, pain catastrophizing as well as improved quality of life and satisfaction with their health.
Keywords: musculoskeletal pain, Veterans Affairs, complementary and integrative health, acceptance and commitment therapy, mind-body therapies, whole health, multidisciplinary pain management.
More than 100 million American adults suffer from chronic pain; costs associated with managing chronic pain are approximately $635 billion
One such program is the Empower Veterans Program (EVP). Originally developed at the Atlanta Veterans Affairs Health Care System, the EVP is a CIH modality based on the biopsychosocial model of pain developed by psychiatrist George Engel in 1977.3 The biopsychosocial model of pain recognizes that pain is a complex, multidimensional, biopsychosocial experience. Under this model, the mind and body work in unison as interconnected entities. Because the model acknowledges biological, psychological, and social components of pain and illness,4 treatment focuses on all aspects of a person’s health, life, and relationships.
The EVP fits into the VHA Pain Management Stepped Care Model and is an adjunctive complement for that model.5-7 The EVP complements care at the first step, where patient/family provide self-care and where care is provided by patient-aligned primary care teams, at the second step, which includes secondary consultation with multidisciplinary pain medicine specialty teams and other specialists, and at the third step, with the addition of tertiary interdisciplinary pain centers.
The VA Maryland Health Care System (VAMHCS) implemented the EVP as part of a quality improvement project for the management of chronic pain. The objectives of the program were to reduce pain intensity, pain catastrophizing, and pain interference, as well as improve functionality and quality of life among veterans with chronic high-impact noncancer pain. More than 2 years after the program was implemented, collected data had not been analyzed. The purpose of this quality improvement project was to abstract and analyze the previously collected data from veterans with high-impact chronic pain who attended an EVP offered by the VAMHCS. The results of the data analysis were used to inform decisions regarding the future of the program.
Methods
This quality improvement project used the Plan-Do-Study-Act (PDSA) process.8 The first 2 phases of the PDSA cycle (Plan and Do) were completed by a team of VA employees from the VAMHCS, who donated their time to establish and implement the program at the project site. This team consisted of psychologists, a physical therapist, a social worker, and a chaplain, and included support from medical administrative staff. This team planned and implemented the EVP at the VA facility based on the model developed at the Atlanta VA Health Care System. During the “Do” phase, the team collected data on pain intensity, pain interference, quality of life, and pain negative cognition (catastrophizing) before the intervention and post intervention. They also collected data on program outcome (patient treatment satisfaction) post intervention. Because these employees did not have time to retrieve and analyze the data, they welcomed the opportunity to have the data analyzed by the investigators during the Study phase of the PDSA cycle. Based on the results of the analysis, recommendations for program changes were made during the Act phase of the cycle.
Intervention
The EVP was developed as a 10-week (30 hours) interdisciplinary CIH approach that coached veterans with chronic pain to live fuller lives based on their individual values and what matters to them. EVP is the “What Else” management modality for the 5% of veterans with high-impact chronic pain.9 The EVP provided functional restoration through its components of whole health, mindfulness training, coaching calls, acceptance and commitment therapy, and mindful movement. It used the Wheel of Health with the 4 key components of me, self-care, professional care, and community.10,11
Veterans who had a diagnosis of chronic nonmalignant pain for 3 months or more and who agreed to participate in the EVP at this facility attended 3-hour classes every Tuesday with a cohort of 8 to 12 peers and engaged in one-on-one coaching with interdisciplinary team members. During the class sessions, veterans were coached to understand and accept their pain and commit to maintaining function despite their pain. Mindful movement by the physical therapist emphasized the pivotal place of exercise in pain management. The therapist used the mantra “Motion is Lotion.”9 The guiding principle of the EVP was that small incremental changes can have a big impact on the individual’s whole life. Emphasis was placed on increasing self-efficacy and mindful awareness for veterans with high-impact pain by giving them “Skills before Pills.”9
Outcome Measures
Outcome measures included the Numerical Pain Rating Scale (NPRS), the Multidimensional Pain Inventory (MPI), the World Health Organization Quality of Life assessment (WHOQOL-BREF), the Pain Catastrophizing Scale (PCS), and the Pain Treatment Satisfaction Scale (PTSS). Cronbach alpha coefficients were calculated to assess internal consistency reliability of these measures in the sample of veterans who completed the EVP.
NPRS. The NPRS is ubiquitous as a screening tool in many health care environments and its use is mandated by the VA health care system.12 The choice of the NPRS as the tool for pain screening in the VA health care system was based on a large body of research that supports the reliability and validity of the NPRS as a single index of pain intensity or severity. Studies suggest that the NPRS is valid for use in the assessment of acute, cancer, or chronic nonmalignant pain and in varied clinical settings.13 The NPRS has 4 items, each on a scale of 0 to 10. For the purpose of this project, only 3 items were used. The 3 items assessed the worst pain, usual pain, and the current pain (right now). The higher the score, the higher the pain intensity. Cronbach alpha coefficients on the NPRS obtained from the current sample of veterans were 0.85 on both pre- and postintervention assessments.
MPI. The MPI is an easily accessible, reliable, and valid self-report questionnaire that measures the impact of pain on an individual’s life, quality of social support, and general activity.14 This instrument is a short version of the West Haven-Yale MPI.15 The MPI contains 9 items rated on a scale from 0 to 6. The higher the score, the greater pain interference a person is experiencing. The MPI produces reliable, valid information for diagnostic purposes and for therapy outcome studies.16 The MPI had a Cronbach alpha of 0.90 on pre-intervention and 0.92 on postintervention assessments in the current sample.
WHOQOL-BREF. The WHOQOL-BREF is a measure of quality of life and is an abbreviated version of the WHOQOL-100. Quality of life is defined by the World Health Organization17 “as an individuals’ perception of their position in life in the context of the culture and value systems in which they live and in relation to their goals, expectations, standards and concerns.” The WHOQOL-BREF contains 26 items. The first 2 items were examined separately; the first item asks individuals to rate their overall quality of life and the second asks individuals how satisfied they are with their health. The remaining 24 items were used to calculate the following 4 domain scores: physical health, psychological health, social relationship, and environment.18 Each item is measured on a scale of 1 to 5. Higher scores denote higher or better quality of life. Domain scores have demonstrated good reliability and validity.19-21 Cronbach alpha coefficients for the domain subscales ranged from 0.63 to 0.84 in the current sample, with the lowest alphas for the 3-item Social Relationships Domain.
PCS. The PCS is a widely used measure of catastrophic thinking related to pain. Catastrophizing has been conceived by Sullivan and colleagues as “an exaggerated negative mental set brought to bear during actual or anticipated painful experience.”22 The PCS provides a total score and scores for the following subscales: rumination, magnification, and helplessness.23 It has been used in a variety of chronic pain populations and has demonstrated good reliability and validity in clinical as well as nonclinical samples.24-26 The PCS has 13 items rated on a scale of 0 to 4. Higher scores mean greater negative pain cognition (catastrophizing). In the current sample, the PCS total scale had a Cronbach alpha coefficient of 0.95 and 0.94 on the 2 assessments. The coefficients for the subscales ranged from 0.81 to 0.90.
PTSS. The PTSS is a 5-item tool that measures patient satisfaction with pain treatment. It includes items that address overall satisfaction, staff warmth, staff skill level, ease of scheduling appointments, and recommendation of the program to other veterans. It was derived from the post-treatment version of The Pain Outcome Questionnaire-VA and has demonstrated reliability and validity.27 The questions are scaled from 0 to 10. High scores on the PTSS denote high patient satisfaction with the EVP. The Cronbach alpha coefficient on the PTSS obtained from the current sample was 0.80.
Data Gathering and Analysis
Prior to starting the Study phase, Washburn University’s Institutional Review Board (IRB) and the VA IRB approved the project. The VA IRB, through its affiliate, gave a Not Human Research Determination and granted a waiver of informed consent and the Health Insurance Portability and Accountability Act authorization. The VA facility’s Research and Development department also approved the quality improvement project.
Once these approvals were obtained, the Study phase began with the abstraction of retrospective data obtained from veterans who participated in the VA health care facility’s EVP between
Veterans who completed the program were compared to veterans who did not complete the program on age, gender, and baseline measures. The investigators used independent samples t-tests to compare completers and noncompleters on age, pain intensity, pain interference, quality of life, and pain catastrophizing. They used the chi-square test of independence to analyze the association between gender and program completion.
Data were included in the pre- and postintervention analysis if the veteran completed the NPRS, MPI, WHOQOL-BREF, and PCS pre and post intervention. This became an important eligibility requirement as some of the tools/measures were changed towards the end of the review period in 2019. Pre- and postintervention data on pain intensity, pain interference, quality of life, pain catastrophizing, and patient satisfaction were compared using paired samples t-test at .004 level of significance based on the Bonferroni correction.28 Data on patient satisfaction with pain treatment were collected at program completion (week 8 or 10) and were analyzed using descriptive statistics.
Effect sizes (Cohen’s d) were calculated to determine the substantive significance or magnitude of the mean differences in scores. Effect sizes (expressed as absolute values of Cohen’s d) were calculated as the mean difference divided by the standard deviation. Values of 0.2 were considered a small effect size, 0.5 a medium effect size, and 0.8 a large effect size.29
Results
Data were abstracted for 115 veterans who started the EVP. Of these, 48 left the program, leaving 67 veterans (58%) who completed the program. Completers and noncompleters were similar in age, gender, and baseline measures (Table 1). Fifty-three (79%) completers and 35 (73%) noncompleters were male. A chi-square test of independence showed no significant association between gender and program completion (χ21 [N = 115] = .595, P = .440).
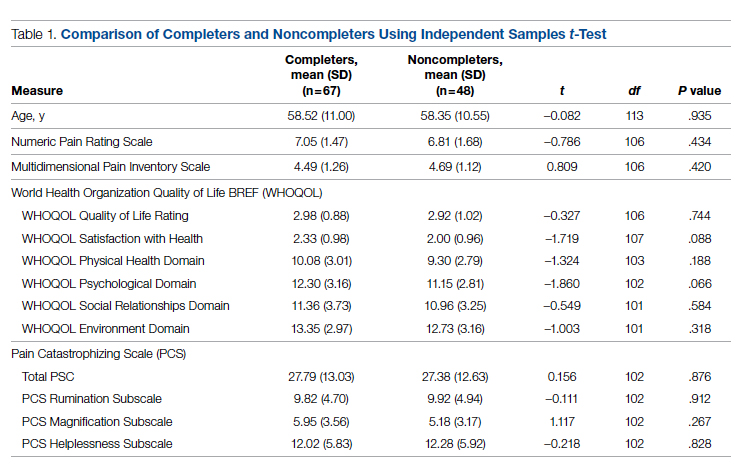
Comparison of pre-and postintervention mean scale scores resulted in statistically significant
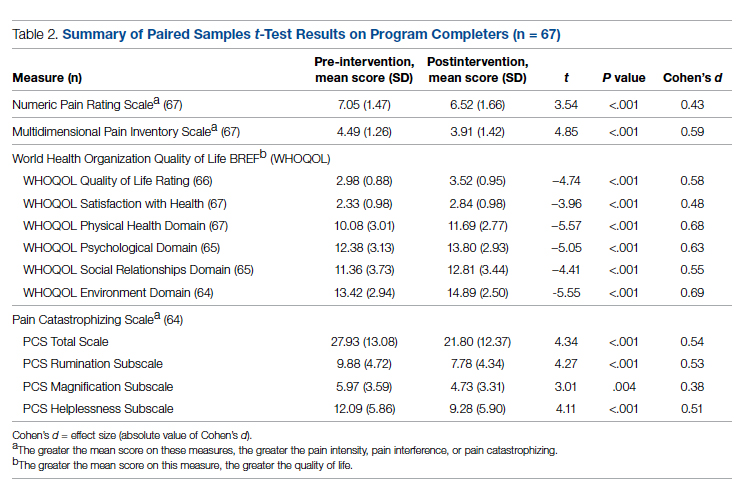
Analysis of data obtained using the PTSS yielded high mean scores for items that focused on patient satisfaction with treatment (Table 3). Scaled statistics yielded a mean (SD) of 46.95 (4.40). These results denoted overall patient satisfaction with the EVP.
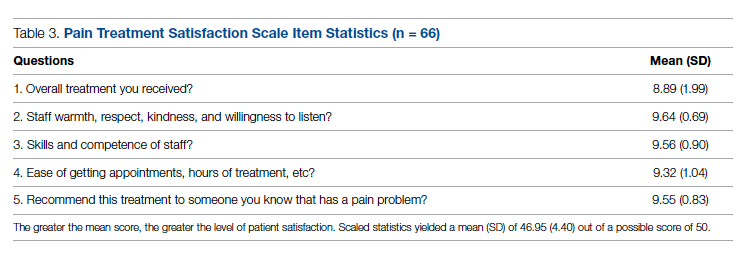
Discussion
The purpose of this quality improvement project was to abstract and analyze previously collected data from veterans with high-impact chronic pain who attended the EVP. Comparison of pre-intervention and postintervention data obtained from 67 veterans who completed the program revealed improvements in pain intensity, pain interference, negative cognition (catastrophizing), and quality of life. The differences were statistically significant and clinically meaningful, with medium and large effect sizes. In addition, veterans reported high satisfaction with the EVP.
The EVP includes CIH approaches that have demonstrated effectiveness among veterans and other populations with chronic pain. A wealth of studies, for example, support the effectiveness of CIH approaches among veterans.30-34 Other studies focus on specific CIH approaches that are components of the EVP. Evidence supports, for example, the efficacy of mindfulness-based stress reduction,35-39 acceptance and commitment therapy,40-43 brief peer support intervention,44 and interdisciplinary biopsychosocial rehabilitation.45,46
While empirical evidence supports components of the EVP, only one study focused on the outcomes of the Atlanta VA EVP among veterans with chronic pain. Results of a qualitative study conducted by Penney and Haro47 described the experience of veterans with the EVP. Those veterans reported adopting new self-care or lifestyle practices for pain management and health, accepting pain, being better able to adjust and set boundaries, feeling more in control, participating in life, and changing their medication use.
The mean baseline scores from the current sample were similar to samples of patients with chronic pain in other studies (NPRS,48 MPI,48 and PCS48-51). After converting scores on the WHOQOL-BREF from those that ranged from 4 to 20 to those that ranged from 0 to 100,18 the scores from the current sample were similar to those of other studies of patients with chronic pain.48,52,53Several strengths of the project should be noted. Data were collected using well established measurement tools that had previously demonstrated reliability and validity. All the tools used in data collection demonstrated good internal consistency reliabilities in the current sample of veterans. Weaknesses of the project include the use of a convenience sample of veterans and small sample size. Data were not available on the number of veterans who were offered participation or on how many veterans declined enrollment. The sample of veterans who chose to participate in the EVP may or may not have been representative of the population of veterans with high-impact chronic pain. As a pre- and postintervention design with no comparison group, the results are subject to multiple threats to internal validity, including the Hawthorne effect, maturation in the form of healing, and attrition. Reasons for leaving the program had not been recorded, so the investigators had no way of knowing factors that may have contributed to attrition. Also, data on when veterans left the program were unavailable. Research is needed with a control group to reduce the effect of confounding variables on the outcome measures. This project used data collected at a single VA facility, which limits its generalizability.
While completers and noncompleters of the EVP were similar on age, gender, and baseline measures, there may have been unidentified characteristics that influenced program completion. The investigators noticed the presence of more missing data among noncompleters compared to completers on the pre-intervention PCS; thus, noncompleters may have scored lower than completers on this instrument simply because there were more individual items that were unanswered/missing among this group of noncompleters.
Data were analyzed using a limited number of outcome measures that had previously been collected. Other outcome measures might include whether EVP participants reduced their use of medications, clinical resources, and personnel. Future projects, for example, could determine whether the EVP is effective in reducing opioid analgesic medication use and decreasing primary care and emergency department visits. Cost-benefit analyses could be completed to determine whether EVP is associated with financial savings.
Because no follow-up assessments were made to determine whether improvements were maintained over time, the project focus was limited to an evaluation of the short-term changes in the outcome measures. Future projects could include a follow-up assessment of the veterans 1- or 2-years post completion of the EVP.
Data for the project were collected prior to the COVID-19 pandemic, when the EVP was implemented through face-to-face meetings with participants and their peers. It is not clear how changes to the delivery of the program (such as offering it through telehealth) might impact veterans’ satisfaction with the program, willingness to complete it, and other variables of interest.
The results of this project were made available to stakeholders with recommendations for program expansion both at the current location and at other VA facilities, including the recommendation to hire additional personnel that would implement the program. As the VA network of facilities expand the EVP program and adapt it for telehealth delivery, the investigators recommended a similar analysis of data be performed following telehealth delivery. If delivery through telehealth is shown to improve outcome measures, the EVP could provide pain management treatment options for patients challenged by transportation barriers, including rural veterans.
Conclusion
This quality improvement project provided evidence of improvement in measures of pain severity, pain interference, negative cognition (catastrophizing), quality of life, and patient treatment satisfaction among veterans with chronic high-impact pain. Findings have been well received by the northeastern VA as well as the Veterans Integrated Systems Network 5. The results of the analyses were used to inform decisions regarding the future of the program.
Disclaimer: This material is the result of work supported with resources and the use of facilities at the VA Maryland Health Care System, Baltimore, Maryland. The views expressed are those of the authors and do not necessarily represent the views of the Department of Veterans Affairs or the United States Government.
Acknowledgments: The authors thank Dr. Arianna Perra, the recent past coordinator of the Empower Veterans Program (EVP), who provided initial insights and support that motivated the decision to evaluate the program. We also thank the veterans and VA EVP clinicians who contributed data for the evaluation, and Dr. Michael Saenger (Director, TelePain-EVP: EVP) and Dr. Robert Lavin for their ongoing support, care, and concern for veteran patients. We also thank Dr. Beverly Bradley and the neurology service administrative team for their guidance in the process of obtaining necessary VA approvals for this project.
Corresponding author: Jessica U. Uche, DNP, CRNP-Family; jessica.uche@va.gov
doi:10.12788/jcom.0089
1. Institute of Medicine (US) Committee on Advancing Pain Research, Care, and Education. Relieving Pain in America: A Blueprint for Transforming Prevention, Care, Education, and Research. The National Academies Press (US); 2011.
2. Bastian LA, Heapy A, Becker WC, et al. Understanding pain and pain treatment for veterans: responding to the federal pain research strategy. Pain Med. 2018;19(suppl_1); S1-S4. doi:10.1093/pm/pny1433
3. Engle GL. The need for a new medical model: a challenge for biomedicine. Science. 1977;196(4286):129-136. doi:10.1126/science.847460
4. Bevers K, Watts L, Kishino ND, et al. The biopsychosocial model of the assessment, prevention, and treatment of chronic pain. US Neurology. 2016;12(2):98-104. doi:10.17925/USN.2016.12.02.98
5. Bair MJ, Ang D, Wu J, et al. Evaluation of stepped care for chronic pain (ESCAPE) in veterans of the Iraq and Afghanistan conflicts: A randomized clinical trial. JAMA Intern Med. 2015;175(5):682-689. doi:10.1001/jamainternmed.2015.97
6. Veterans Health Administration. Pain Management. VHA Directive 2009-053. Washington, DC: Department of Veterans Affairs; 2009.https://www.va.gov/painmanagement/docs/vha09paindirective.pdf
7. Moore BA, Anderson D, Dorflinger L, et al. Stepped care model for pain management and quality of pain care in long-term opioid therapy. J Rehabil Res Dev. 2016;53(1):137-146. doi:10.1682/JRRD.2014.10.0254
8. Institute for Healthcare Improvement. How to improve. Accessed March 14, 2022. http://www.ihi.org/resources/Pages/HowtoImprove/default.aspx
9. Saenger M. Empower Veterans Program. APA PCSS-O Webinars. Evidence CAM LBP 2016.
10. Gaudet T, Kligler B. Whole health in the whole system of the Veterans Administration: How will we know we have reached this future state? J Altern Complement Med. 2019;25(S1):S7-S11. doi:10.1089/acm.2018.29061.gau
11. Veterans Health Administration. Whole health: Circle of health. Updated April 1, 2021. Accessed March 14, 2022. https://www.va.gov/WHOLEHEALTH/circle-of-health/index.asp
12. Krebs EE, Carey TS, Weinberger M. Accuracy of the pain numeric rating scale as a screening test in primary care. J Gen Intern Med. 2007;22(10):1453-1458. doi:10.1007/s11606-007-0321-2
13. Veterans Health Administration. Pain as the 5th vital sign toolkit. October 2000, revised edition. Geriatrics and Extended Care Strategic Healthcare Group, National Pain Management Coordinating Committee. https://www.va.gov/PAINMANAGEMENT/docs/Pain_As_the_5th_Vital_Sign_Toolkit.pdf
14. McKillop JM, Nielson WR. Improving the usefulness of the Multidimensional Pain Inventory. Pain Res Manag. 2011;16(4):239-244. doi:10.1155/2011/873424
15. Kerns RD, Turk DC, Rudy TE. The West Haven-Yale Multidimensional Pain Inventory (WHYMPI). Pain.1985;23(4):345-356. doi:10.1016/0304-3959(85)90004-1
16. Verra ML, Angst F, Staal JB, et al. Reliability of the multidimensional pain inventory and stability of the MPI classification system in chronic back pain. BMC Musculoskelet Disord. 2012;13:155. doi:10.1186/1471-2474-13-155
17. Development of the World Health Organization WHOQOL-BREF quality of life assessment. The WHOQOL Group. Psychol Med. 1998;28(3):551-558. doi:10.1017/s0033291798006667
18. World Health Organization. Division of Mental Health. WHOQOL-BREF: introduction, administration, scoring and generic version of the assessment: field trial version, December 1996. Accessed March 14, 2022. https://apps.who.int/iris/handle/10665/63529
19. Guay S, Fortin C, Fikretoglu D, et al. Validation of the WHOQOL-BREF in a sample of male treatment-seeking veterans. Mil Psychol. 2015;27(2):85-92. doi:10.1037/mil0000065
20. Skevington S, Lotfy M, O’Connell K, WHOQOL Group. The World Health Organization’s WHOQOL-BREF quality of life assessment: Psychometric properties and results of the international field trial. A Report from the WHOQOL Group. Qual Life Res. 2004;13(2):299-310. doi:10.1023/B:QURE.0000018486.91360.00
21. Stratton KJ, Bender MC, Cameron JJ, Pickett TC. Development and evaluation of a behavioral pain management treatment program in a Veterans Affairs Medical Center. Mil Med. 2015;180(3):263-268. doi:10.7205/MILMED-D-14-00281.
22. Sullivan MJ, Thorn B, Haythornthwaite JA, et al. Theoretical perspectives on the relation between catastrophizing and pain. Clin J Pain. 2001;17(1):52-64. doi:10.1097/00002508-200103000-00008
23. Sullivan JL. The Pain Catastrophizing Scale: User manual. Accessed March 14, 2022. https://studylib.net/doc/8330191/the-pain-catastrophizing-scale---dr.-michael-sullivan
24. Darnall BD, Sturgeon JA, Cook KF, et al. Development and validation of a daily pain catastrophizing scale. J Pain. 2017;18(9):1139-1149. doi:10.1016/j.jpain.2017.05.003
25. Osman A, Barrios FX, Kopper BA, et al. Factor structure, reliability, and validity of the Pain Catastrophizing Scale. J Behav Med. 1997;20(6):589-605. doi:10.1023/a:1025570508954
26. Sullivan MJL, Bishop S, Pivik J. The Pain Catastrophizing Scale: development and validation. Psychol Assessment. 1995;7(4):524-532. doi:10.1037/1040-3590.7.4.524
27. Walker R, Clark M, Gironda R. Psychometric characteristics of the Pain Treatment Satisfaction Scale. J Pain. 2015;6(3Suppl.):S76.
28. Emerson RW. Bonferroni correction and type I error. J Vis Impair Blind. 2020;114(1):77-78. doi:10.1177/0145482X20901378
29. Cohen J. Statistical power analysis for the behavioral sciences. 2nd ed. Routledge; 1988. doi:10.4324/9780203771587
30. Craner JR, Lake ES, Bancroft KA, George LL. Treatment outcomes and mechanisms for an ACT-based 10-week interdisciplinary chronic pain rehabilitation program. Pain Pract. 2020;20(1):44-54. doi:10.1111/papr.12824
31. Han L, Goulet JL, Skanderson M, et al. Evaluation of complementary and integrative health approaches among US veterans with musculoskeletal pain using propensity score methods. Pain Med. 2019;20(1):90-102. doi:10.1093/pm/pny027
32. Herman PM, Yuan AH, Cefalu MS, et al. The use of complementary and integrative health approaches for chronic musculoskeletal pain in younger US veterans: an economic evaluation. PLoS One. 2019;14(6):e0217831. doi:10.1371/journal.pone.0217831
33. National Academies of Sciences, Engineering, and Medicine; Health and Medicine Division; Board on Global Health; Board on Health Sciences Policy; Global Forum on Innovation in Health Professional Education; Forum on Neuroscience and Nervous System Disorders; Stroud C, Posey Norris SM, Bain L, eds. The Role of Nonpharmacological Approaches to Pain Management: Proceedings of a Workshop. National Academies Press (US); April 12, 2019.
34. Richmond H, Hall AM, Copsey B, et al. The effectiveness of cognitive behavioural treatment for non-specific low back pain: a systematic review and meta-analysis. PLoS One. 2015;10(8):e0134192. doi:10.1371/journal.pone.0134192

35. Kearney DJ, Simpson TL, Malte CA, et al. Mindfulness-based stress reduction in addition to usual care is associated with improvements in pain, fatigue, and cognitive failures among veterans with Gulf War illness. Am J Med. 2016;129(2):204-214. doi:10.1016/j.amjmed.2015.09.015
36. Khoo E, Small R, Cheng W, et al. Comparative evaluation of group-based mindfulness-based stress reduction and cognitive behavioral therapy for the treatment and management of chronic pain: a systematic review and network meta-analysis. Evid Based Ment Health. 2019;22(1):26-35. doi:10.1136/ebmental-2018-300062
37. Khusid MA, Vythilingam M. The emerging role of mindfulness meditation as effective self-management strategy, Part 2: clinical implications for chronic pain, substance misuse, and insomnia. Mil Med. 2016;181(9):969-975. doi:10.7205/MILMED-D-14-00678
38. la Cour P, Petersen M. Effects of mindfulness meditation on chronic pain: A randomized controlled trial. Pain Med. 2015;16(4):641-652. doi:10.1111/pme.12605
39. Zou L, Zhang Y, Yang L, et al. Are mindful exercises safe and beneficial for treating chronic lower back pain? A systematic review and meta-analysis of randomized controlled trials. J Clin Med. 2019;8(5):628. doi:10.3390/jcm8050628
40. Hughes LS, Clark J, Colclough JA, et al. Acceptance and commitment therapy (ACT) for chronic pain: a systematic review and meta-analyses. Clin J Pain. 2017;33(6):552-568. doi:10.1097/AJP.0000000000000425
41. Kemani MK, Olsson GL, Lekander M, et al. Efficacy and cost-effectiveness of acceptance and commitment therapy and applied relaxation for longstanding pain: a randomized controlled trial. Clin J Pain. 2015;31(11):1004-1016. doi:10.1097/AJP.0000000000000203
42. Scott W, Daly A, Yu L, McCracken LM. Treatment of chronic pain for adults 65 and over: analyses of outcomes and changes in psychological flexibility following interdisciplinary acceptance and commitment therapy (ACT). Pain Med. 2017;18(2):252. doi:10.1093/pm/pnw073
43. Veehof MM, Trompetter HR, Bohlmeijer ET, Schreurs KMG. Acceptance- and mindfulness-based interventions for the treatment of chronic pain: a meta-analytic review. Cogn Behav Ther. 2016;45(1):5-31. doi:10.1080/16506073.2015.1098724
44. Matthias MS, McGuire AB, Kukla M, et al. A brief peer support intervention for veterans with chronic musculoskeletal pain: a pilot study of feasibility and effectiveness. Pain Med. 2015;16(1):81-87. doi:10.1111/pme.12571
45. Anamkath NS, Palyo SA, Jacobs SC, et al. An interdisciplinary pain rehabilitation program for veterans with chronic pain: description and initial evaluation of outcomes. Pain Res Manag. 2018;2018(3941682):1-9. doi:10.1155/2018/3941682
46. Kamper SJ, Apeldoorn AT, Chiarotto A, et al. Multidisciplinary biopsychosocial rehabilitation for chronic low back pain. Cochrane Database Syst Rev. 2014;9: CD000963. doi:10.1002/14651858.CD000963.pub3
47. Penney LS, Haro E. Qualitative evaluation of an interdisciplinary chronic pain intervention: Outcomes and barriers and facilitators to ongoing pain management. J Pain Res. 2019;12:865-878. doi:10.2147/JPR.S185652
48. Murphy JL, Cordova MJ, Dedert EA. Cognitive behavioral therapy for chronic pain in veterans; Evidence for clinical effectiveness in a model program. Psychol Serv. 2022;19(1):95-102. doi:10.1037/ser0000506
49. Katz L, Patterson L, Zacharias R. Evaluation of an interdisciplinary chronic pain program and predictors of readiness for change. Can J Pain. 2019;3(1):70-78. doi:10.1080/24740527.2019.1582296
50. Majumder SMM, Ahmed S, Shazzad N, et al. Translation, cross-cultural adaptation and validation of the Pain Catastrophizing Scale (PCS) into Bengali I patients with chronic non-malignant musculoskeletal pain. Int J Rheum Dis. 2020;23:1481-1487. doi:10.1111/1756-185X.13954
51. Margiotta F, Hannigan A, Imran A, et al. Pain, perceived injustice, and pain catastrophizing in chronic pain patients in Ireland. Pain Pract. 2016;17(5):663-668. doi:10.1111/papr.12
52. Bras M, Milunovic V, Boban M, et al. Quality of live in Croatian Homeland war (1991-1995) veterans who suffer from post-traumatic stress disorder and chronic pain. Health Qual Life Out. 2011;9:56. doi:10.1186/1477-7525-9-56
53. Liu C-H, Kung Y-Y, Lin C-L, et al. Therapeutic efficacy and the impact of the “dose” effect of acupuncture to treat sciatica: A randomized controlled pilot study. J Pain Res. 2019;12:3511-3520. doi:10.2147/JPR.S210672
From Neurology/Chronic Pain Management Services, Department of Veterans Affairs (VA) Maryland Health Care System, Baltimore VA Medical Center, Baltimore, MD (Dr. Uche), and School of Nursing, Washburn University, Topeka, KS (Drs. Jamison and Waugh).
Abstract
Objective: The purpose of this quality improvement project was to abstract and analyze previously collected data from veterans with high-impact chronic pain who attended the Empower Veterans Program (EVP) offered by a Veterans Administration facility in the northeastern United States.
Methods: This quality improvement project used data collected from veterans with chronic pain who completed the veterans health care facility’s EVP between August 2017 and August 2019. Pre- and post-intervention data on pain intensity, pain interference, quality of life, and pain catastrophizing were compared using paired t-tests.
Results: Although data were abstracted from 115 patients, the final sample included
Conclusion: Veterans with chronic high-impact noncancer pain who completed the EVP had reduced pain intensity, pain interference, pain catastrophizing as well as improved quality of life and satisfaction with their health.
Keywords: musculoskeletal pain, Veterans Affairs, complementary and integrative health, acceptance and commitment therapy, mind-body therapies, whole health, multidisciplinary pain management.
More than 100 million American adults suffer from chronic pain; costs associated with managing chronic pain are approximately $635 billion
One such program is the Empower Veterans Program (EVP). Originally developed at the Atlanta Veterans Affairs Health Care System, the EVP is a CIH modality based on the biopsychosocial model of pain developed by psychiatrist George Engel in 1977.3 The biopsychosocial model of pain recognizes that pain is a complex, multidimensional, biopsychosocial experience. Under this model, the mind and body work in unison as interconnected entities. Because the model acknowledges biological, psychological, and social components of pain and illness,4 treatment focuses on all aspects of a person’s health, life, and relationships.
The EVP fits into the VHA Pain Management Stepped Care Model and is an adjunctive complement for that model.5-7 The EVP complements care at the first step, where patient/family provide self-care and where care is provided by patient-aligned primary care teams, at the second step, which includes secondary consultation with multidisciplinary pain medicine specialty teams and other specialists, and at the third step, with the addition of tertiary interdisciplinary pain centers.
The VA Maryland Health Care System (VAMHCS) implemented the EVP as part of a quality improvement project for the management of chronic pain. The objectives of the program were to reduce pain intensity, pain catastrophizing, and pain interference, as well as improve functionality and quality of life among veterans with chronic high-impact noncancer pain. More than 2 years after the program was implemented, collected data had not been analyzed. The purpose of this quality improvement project was to abstract and analyze the previously collected data from veterans with high-impact chronic pain who attended an EVP offered by the VAMHCS. The results of the data analysis were used to inform decisions regarding the future of the program.
Methods
This quality improvement project used the Plan-Do-Study-Act (PDSA) process.8 The first 2 phases of the PDSA cycle (Plan and Do) were completed by a team of VA employees from the VAMHCS, who donated their time to establish and implement the program at the project site. This team consisted of psychologists, a physical therapist, a social worker, and a chaplain, and included support from medical administrative staff. This team planned and implemented the EVP at the VA facility based on the model developed at the Atlanta VA Health Care System. During the “Do” phase, the team collected data on pain intensity, pain interference, quality of life, and pain negative cognition (catastrophizing) before the intervention and post intervention. They also collected data on program outcome (patient treatment satisfaction) post intervention. Because these employees did not have time to retrieve and analyze the data, they welcomed the opportunity to have the data analyzed by the investigators during the Study phase of the PDSA cycle. Based on the results of the analysis, recommendations for program changes were made during the Act phase of the cycle.
Intervention
The EVP was developed as a 10-week (30 hours) interdisciplinary CIH approach that coached veterans with chronic pain to live fuller lives based on their individual values and what matters to them. EVP is the “What Else” management modality for the 5% of veterans with high-impact chronic pain.9 The EVP provided functional restoration through its components of whole health, mindfulness training, coaching calls, acceptance and commitment therapy, and mindful movement. It used the Wheel of Health with the 4 key components of me, self-care, professional care, and community.10,11
Veterans who had a diagnosis of chronic nonmalignant pain for 3 months or more and who agreed to participate in the EVP at this facility attended 3-hour classes every Tuesday with a cohort of 8 to 12 peers and engaged in one-on-one coaching with interdisciplinary team members. During the class sessions, veterans were coached to understand and accept their pain and commit to maintaining function despite their pain. Mindful movement by the physical therapist emphasized the pivotal place of exercise in pain management. The therapist used the mantra “Motion is Lotion.”9 The guiding principle of the EVP was that small incremental changes can have a big impact on the individual’s whole life. Emphasis was placed on increasing self-efficacy and mindful awareness for veterans with high-impact pain by giving them “Skills before Pills.”9
Outcome Measures
Outcome measures included the Numerical Pain Rating Scale (NPRS), the Multidimensional Pain Inventory (MPI), the World Health Organization Quality of Life assessment (WHOQOL-BREF), the Pain Catastrophizing Scale (PCS), and the Pain Treatment Satisfaction Scale (PTSS). Cronbach alpha coefficients were calculated to assess internal consistency reliability of these measures in the sample of veterans who completed the EVP.
NPRS. The NPRS is ubiquitous as a screening tool in many health care environments and its use is mandated by the VA health care system.12 The choice of the NPRS as the tool for pain screening in the VA health care system was based on a large body of research that supports the reliability and validity of the NPRS as a single index of pain intensity or severity. Studies suggest that the NPRS is valid for use in the assessment of acute, cancer, or chronic nonmalignant pain and in varied clinical settings.13 The NPRS has 4 items, each on a scale of 0 to 10. For the purpose of this project, only 3 items were used. The 3 items assessed the worst pain, usual pain, and the current pain (right now). The higher the score, the higher the pain intensity. Cronbach alpha coefficients on the NPRS obtained from the current sample of veterans were 0.85 on both pre- and postintervention assessments.
MPI. The MPI is an easily accessible, reliable, and valid self-report questionnaire that measures the impact of pain on an individual’s life, quality of social support, and general activity.14 This instrument is a short version of the West Haven-Yale MPI.15 The MPI contains 9 items rated on a scale from 0 to 6. The higher the score, the greater pain interference a person is experiencing. The MPI produces reliable, valid information for diagnostic purposes and for therapy outcome studies.16 The MPI had a Cronbach alpha of 0.90 on pre-intervention and 0.92 on postintervention assessments in the current sample.
WHOQOL-BREF. The WHOQOL-BREF is a measure of quality of life and is an abbreviated version of the WHOQOL-100. Quality of life is defined by the World Health Organization17 “as an individuals’ perception of their position in life in the context of the culture and value systems in which they live and in relation to their goals, expectations, standards and concerns.” The WHOQOL-BREF contains 26 items. The first 2 items were examined separately; the first item asks individuals to rate their overall quality of life and the second asks individuals how satisfied they are with their health. The remaining 24 items were used to calculate the following 4 domain scores: physical health, psychological health, social relationship, and environment.18 Each item is measured on a scale of 1 to 5. Higher scores denote higher or better quality of life. Domain scores have demonstrated good reliability and validity.19-21 Cronbach alpha coefficients for the domain subscales ranged from 0.63 to 0.84 in the current sample, with the lowest alphas for the 3-item Social Relationships Domain.
PCS. The PCS is a widely used measure of catastrophic thinking related to pain. Catastrophizing has been conceived by Sullivan and colleagues as “an exaggerated negative mental set brought to bear during actual or anticipated painful experience.”22 The PCS provides a total score and scores for the following subscales: rumination, magnification, and helplessness.23 It has been used in a variety of chronic pain populations and has demonstrated good reliability and validity in clinical as well as nonclinical samples.24-26 The PCS has 13 items rated on a scale of 0 to 4. Higher scores mean greater negative pain cognition (catastrophizing). In the current sample, the PCS total scale had a Cronbach alpha coefficient of 0.95 and 0.94 on the 2 assessments. The coefficients for the subscales ranged from 0.81 to 0.90.
PTSS. The PTSS is a 5-item tool that measures patient satisfaction with pain treatment. It includes items that address overall satisfaction, staff warmth, staff skill level, ease of scheduling appointments, and recommendation of the program to other veterans. It was derived from the post-treatment version of The Pain Outcome Questionnaire-VA and has demonstrated reliability and validity.27 The questions are scaled from 0 to 10. High scores on the PTSS denote high patient satisfaction with the EVP. The Cronbach alpha coefficient on the PTSS obtained from the current sample was 0.80.
Data Gathering and Analysis
Prior to starting the Study phase, Washburn University’s Institutional Review Board (IRB) and the VA IRB approved the project. The VA IRB, through its affiliate, gave a Not Human Research Determination and granted a waiver of informed consent and the Health Insurance Portability and Accountability Act authorization. The VA facility’s Research and Development department also approved the quality improvement project.
Once these approvals were obtained, the Study phase began with the abstraction of retrospective data obtained from veterans who participated in the VA health care facility’s EVP between
Veterans who completed the program were compared to veterans who did not complete the program on age, gender, and baseline measures. The investigators used independent samples t-tests to compare completers and noncompleters on age, pain intensity, pain interference, quality of life, and pain catastrophizing. They used the chi-square test of independence to analyze the association between gender and program completion.
Data were included in the pre- and postintervention analysis if the veteran completed the NPRS, MPI, WHOQOL-BREF, and PCS pre and post intervention. This became an important eligibility requirement as some of the tools/measures were changed towards the end of the review period in 2019. Pre- and postintervention data on pain intensity, pain interference, quality of life, pain catastrophizing, and patient satisfaction were compared using paired samples t-test at .004 level of significance based on the Bonferroni correction.28 Data on patient satisfaction with pain treatment were collected at program completion (week 8 or 10) and were analyzed using descriptive statistics.
Effect sizes (Cohen’s d) were calculated to determine the substantive significance or magnitude of the mean differences in scores. Effect sizes (expressed as absolute values of Cohen’s d) were calculated as the mean difference divided by the standard deviation. Values of 0.2 were considered a small effect size, 0.5 a medium effect size, and 0.8 a large effect size.29
Results
Data were abstracted for 115 veterans who started the EVP. Of these, 48 left the program, leaving 67 veterans (58%) who completed the program. Completers and noncompleters were similar in age, gender, and baseline measures (Table 1). Fifty-three (79%) completers and 35 (73%) noncompleters were male. A chi-square test of independence showed no significant association between gender and program completion (χ21 [N = 115] = .595, P = .440).
Comparison of pre-and postintervention mean scale scores resulted in statistically significant
Analysis of data obtained using the PTSS yielded high mean scores for items that focused on patient satisfaction with treatment (Table 3). Scaled statistics yielded a mean (SD) of 46.95 (4.40). These results denoted overall patient satisfaction with the EVP.
Discussion
The purpose of this quality improvement project was to abstract and analyze previously collected data from veterans with high-impact chronic pain who attended the EVP. Comparison of pre-intervention and postintervention data obtained from 67 veterans who completed the program revealed improvements in pain intensity, pain interference, negative cognition (catastrophizing), and quality of life. The differences were statistically significant and clinically meaningful, with medium and large effect sizes. In addition, veterans reported high satisfaction with the EVP.
The EVP includes CIH approaches that have demonstrated effectiveness among veterans and other populations with chronic pain. A wealth of studies, for example, support the effectiveness of CIH approaches among veterans.30-34 Other studies focus on specific CIH approaches that are components of the EVP. Evidence supports, for example, the efficacy of mindfulness-based stress reduction,35-39 acceptance and commitment therapy,40-43 brief peer support intervention,44 and interdisciplinary biopsychosocial rehabilitation.45,46
While empirical evidence supports components of the EVP, only one study focused on the outcomes of the Atlanta VA EVP among veterans with chronic pain. Results of a qualitative study conducted by Penney and Haro47 described the experience of veterans with the EVP. Those veterans reported adopting new self-care or lifestyle practices for pain management and health, accepting pain, being better able to adjust and set boundaries, feeling more in control, participating in life, and changing their medication use.
The mean baseline scores from the current sample were similar to samples of patients with chronic pain in other studies (NPRS,48 MPI,48 and PCS48-51). After converting scores on the WHOQOL-BREF from those that ranged from 4 to 20 to those that ranged from 0 to 100,18 the scores from the current sample were similar to those of other studies of patients with chronic pain.48,52,53Several strengths of the project should be noted. Data were collected using well established measurement tools that had previously demonstrated reliability and validity. All the tools used in data collection demonstrated good internal consistency reliabilities in the current sample of veterans. Weaknesses of the project include the use of a convenience sample of veterans and small sample size. Data were not available on the number of veterans who were offered participation or on how many veterans declined enrollment. The sample of veterans who chose to participate in the EVP may or may not have been representative of the population of veterans with high-impact chronic pain. As a pre- and postintervention design with no comparison group, the results are subject to multiple threats to internal validity, including the Hawthorne effect, maturation in the form of healing, and attrition. Reasons for leaving the program had not been recorded, so the investigators had no way of knowing factors that may have contributed to attrition. Also, data on when veterans left the program were unavailable. Research is needed with a control group to reduce the effect of confounding variables on the outcome measures. This project used data collected at a single VA facility, which limits its generalizability.
While completers and noncompleters of the EVP were similar on age, gender, and baseline measures, there may have been unidentified characteristics that influenced program completion. The investigators noticed the presence of more missing data among noncompleters compared to completers on the pre-intervention PCS; thus, noncompleters may have scored lower than completers on this instrument simply because there were more individual items that were unanswered/missing among this group of noncompleters.
Data were analyzed using a limited number of outcome measures that had previously been collected. Other outcome measures might include whether EVP participants reduced their use of medications, clinical resources, and personnel. Future projects, for example, could determine whether the EVP is effective in reducing opioid analgesic medication use and decreasing primary care and emergency department visits. Cost-benefit analyses could be completed to determine whether EVP is associated with financial savings.
Because no follow-up assessments were made to determine whether improvements were maintained over time, the project focus was limited to an evaluation of the short-term changes in the outcome measures. Future projects could include a follow-up assessment of the veterans 1- or 2-years post completion of the EVP.
Data for the project were collected prior to the COVID-19 pandemic, when the EVP was implemented through face-to-face meetings with participants and their peers. It is not clear how changes to the delivery of the program (such as offering it through telehealth) might impact veterans’ satisfaction with the program, willingness to complete it, and other variables of interest.
The results of this project were made available to stakeholders with recommendations for program expansion both at the current location and at other VA facilities, including the recommendation to hire additional personnel that would implement the program. As the VA network of facilities expand the EVP program and adapt it for telehealth delivery, the investigators recommended a similar analysis of data be performed following telehealth delivery. If delivery through telehealth is shown to improve outcome measures, the EVP could provide pain management treatment options for patients challenged by transportation barriers, including rural veterans.
Conclusion
This quality improvement project provided evidence of improvement in measures of pain severity, pain interference, negative cognition (catastrophizing), quality of life, and patient treatment satisfaction among veterans with chronic high-impact pain. Findings have been well received by the northeastern VA as well as the Veterans Integrated Systems Network 5. The results of the analyses were used to inform decisions regarding the future of the program.
Disclaimer: This material is the result of work supported with resources and the use of facilities at the VA Maryland Health Care System, Baltimore, Maryland. The views expressed are those of the authors and do not necessarily represent the views of the Department of Veterans Affairs or the United States Government.
Acknowledgments: The authors thank Dr. Arianna Perra, the recent past coordinator of the Empower Veterans Program (EVP), who provided initial insights and support that motivated the decision to evaluate the program. We also thank the veterans and VA EVP clinicians who contributed data for the evaluation, and Dr. Michael Saenger (Director, TelePain-EVP: EVP) and Dr. Robert Lavin for their ongoing support, care, and concern for veteran patients. We also thank Dr. Beverly Bradley and the neurology service administrative team for their guidance in the process of obtaining necessary VA approvals for this project.
Corresponding author: Jessica U. Uche, DNP, CRNP-Family; jessica.uche@va.gov
doi:10.12788/jcom.0089
1. Institute of Medicine (US) Committee on Advancing Pain Research, Care, and Education. Relieving Pain in America: A Blueprint for Transforming Prevention, Care, Education, and Research. The National Academies Press (US); 2011.
2. Bastian LA, Heapy A, Becker WC, et al. Understanding pain and pain treatment for veterans: responding to the federal pain research strategy. Pain Med. 2018;19(suppl_1); S1-S4. doi:10.1093/pm/pny1433
3. Engle GL. The need for a new medical model: a challenge for biomedicine. Science. 1977;196(4286):129-136. doi:10.1126/science.847460
4. Bevers K, Watts L, Kishino ND, et al. The biopsychosocial model of the assessment, prevention, and treatment of chronic pain. US Neurology. 2016;12(2):98-104. doi:10.17925/USN.2016.12.02.98
5. Bair MJ, Ang D, Wu J, et al. Evaluation of stepped care for chronic pain (ESCAPE) in veterans of the Iraq and Afghanistan conflicts: A randomized clinical trial. JAMA Intern Med. 2015;175(5):682-689. doi:10.1001/jamainternmed.2015.97
6. Veterans Health Administration. Pain Management. VHA Directive 2009-053. Washington, DC: Department of Veterans Affairs; 2009.https://www.va.gov/painmanagement/docs/vha09paindirective.pdf
7. Moore BA, Anderson D, Dorflinger L, et al. Stepped care model for pain management and quality of pain care in long-term opioid therapy. J Rehabil Res Dev. 2016;53(1):137-146. doi:10.1682/JRRD.2014.10.0254
8. Institute for Healthcare Improvement. How to improve. Accessed March 14, 2022. http://www.ihi.org/resources/Pages/HowtoImprove/default.aspx
9. Saenger M. Empower Veterans Program. APA PCSS-O Webinars. Evidence CAM LBP 2016.
10. Gaudet T, Kligler B. Whole health in the whole system of the Veterans Administration: How will we know we have reached this future state? J Altern Complement Med. 2019;25(S1):S7-S11. doi:10.1089/acm.2018.29061.gau
11. Veterans Health Administration. Whole health: Circle of health. Updated April 1, 2021. Accessed March 14, 2022. https://www.va.gov/WHOLEHEALTH/circle-of-health/index.asp
12. Krebs EE, Carey TS, Weinberger M. Accuracy of the pain numeric rating scale as a screening test in primary care. J Gen Intern Med. 2007;22(10):1453-1458. doi:10.1007/s11606-007-0321-2
13. Veterans Health Administration. Pain as the 5th vital sign toolkit. October 2000, revised edition. Geriatrics and Extended Care Strategic Healthcare Group, National Pain Management Coordinating Committee. https://www.va.gov/PAINMANAGEMENT/docs/Pain_As_the_5th_Vital_Sign_Toolkit.pdf
14. McKillop JM, Nielson WR. Improving the usefulness of the Multidimensional Pain Inventory. Pain Res Manag. 2011;16(4):239-244. doi:10.1155/2011/873424
15. Kerns RD, Turk DC, Rudy TE. The West Haven-Yale Multidimensional Pain Inventory (WHYMPI). Pain.1985;23(4):345-356. doi:10.1016/0304-3959(85)90004-1
16. Verra ML, Angst F, Staal JB, et al. Reliability of the multidimensional pain inventory and stability of the MPI classification system in chronic back pain. BMC Musculoskelet Disord. 2012;13:155. doi:10.1186/1471-2474-13-155
17. Development of the World Health Organization WHOQOL-BREF quality of life assessment. The WHOQOL Group. Psychol Med. 1998;28(3):551-558. doi:10.1017/s0033291798006667
18. World Health Organization. Division of Mental Health. WHOQOL-BREF: introduction, administration, scoring and generic version of the assessment: field trial version, December 1996. Accessed March 14, 2022. https://apps.who.int/iris/handle/10665/63529
19. Guay S, Fortin C, Fikretoglu D, et al. Validation of the WHOQOL-BREF in a sample of male treatment-seeking veterans. Mil Psychol. 2015;27(2):85-92. doi:10.1037/mil0000065
20. Skevington S, Lotfy M, O’Connell K, WHOQOL Group. The World Health Organization’s WHOQOL-BREF quality of life assessment: Psychometric properties and results of the international field trial. A Report from the WHOQOL Group. Qual Life Res. 2004;13(2):299-310. doi:10.1023/B:QURE.0000018486.91360.00
21. Stratton KJ, Bender MC, Cameron JJ, Pickett TC. Development and evaluation of a behavioral pain management treatment program in a Veterans Affairs Medical Center. Mil Med. 2015;180(3):263-268. doi:10.7205/MILMED-D-14-00281.
22. Sullivan MJ, Thorn B, Haythornthwaite JA, et al. Theoretical perspectives on the relation between catastrophizing and pain. Clin J Pain. 2001;17(1):52-64. doi:10.1097/00002508-200103000-00008
23. Sullivan JL. The Pain Catastrophizing Scale: User manual. Accessed March 14, 2022. https://studylib.net/doc/8330191/the-pain-catastrophizing-scale---dr.-michael-sullivan
24. Darnall BD, Sturgeon JA, Cook KF, et al. Development and validation of a daily pain catastrophizing scale. J Pain. 2017;18(9):1139-1149. doi:10.1016/j.jpain.2017.05.003
25. Osman A, Barrios FX, Kopper BA, et al. Factor structure, reliability, and validity of the Pain Catastrophizing Scale. J Behav Med. 1997;20(6):589-605. doi:10.1023/a:1025570508954
26. Sullivan MJL, Bishop S, Pivik J. The Pain Catastrophizing Scale: development and validation. Psychol Assessment. 1995;7(4):524-532. doi:10.1037/1040-3590.7.4.524
27. Walker R, Clark M, Gironda R. Psychometric characteristics of the Pain Treatment Satisfaction Scale. J Pain. 2015;6(3Suppl.):S76.
28. Emerson RW. Bonferroni correction and type I error. J Vis Impair Blind. 2020;114(1):77-78. doi:10.1177/0145482X20901378
29. Cohen J. Statistical power analysis for the behavioral sciences. 2nd ed. Routledge; 1988. doi:10.4324/9780203771587
30. Craner JR, Lake ES, Bancroft KA, George LL. Treatment outcomes and mechanisms for an ACT-based 10-week interdisciplinary chronic pain rehabilitation program. Pain Pract. 2020;20(1):44-54. doi:10.1111/papr.12824
31. Han L, Goulet JL, Skanderson M, et al. Evaluation of complementary and integrative health approaches among US veterans with musculoskeletal pain using propensity score methods. Pain Med. 2019;20(1):90-102. doi:10.1093/pm/pny027
32. Herman PM, Yuan AH, Cefalu MS, et al. The use of complementary and integrative health approaches for chronic musculoskeletal pain in younger US veterans: an economic evaluation. PLoS One. 2019;14(6):e0217831. doi:10.1371/journal.pone.0217831
33. National Academies of Sciences, Engineering, and Medicine; Health and Medicine Division; Board on Global Health; Board on Health Sciences Policy; Global Forum on Innovation in Health Professional Education; Forum on Neuroscience and Nervous System Disorders; Stroud C, Posey Norris SM, Bain L, eds. The Role of Nonpharmacological Approaches to Pain Management: Proceedings of a Workshop. National Academies Press (US); April 12, 2019.
34. Richmond H, Hall AM, Copsey B, et al. The effectiveness of cognitive behavioural treatment for non-specific low back pain: a systematic review and meta-analysis. PLoS One. 2015;10(8):e0134192. doi:10.1371/journal.pone.0134192
35. Kearney DJ, Simpson TL, Malte CA, et al. Mindfulness-based stress reduction in addition to usual care is associated with improvements in pain, fatigue, and cognitive failures among veterans with Gulf War illness. Am J Med. 2016;129(2):204-214. doi:10.1016/j.amjmed.2015.09.015
36. Khoo E, Small R, Cheng W, et al. Comparative evaluation of group-based mindfulness-based stress reduction and cognitive behavioral therapy for the treatment and management of chronic pain: a systematic review and network meta-analysis. Evid Based Ment Health. 2019;22(1):26-35. doi:10.1136/ebmental-2018-300062
37. Khusid MA, Vythilingam M. The emerging role of mindfulness meditation as effective self-management strategy, Part 2: clinical implications for chronic pain, substance misuse, and insomnia. Mil Med. 2016;181(9):969-975. doi:10.7205/MILMED-D-14-00678
38. la Cour P, Petersen M. Effects of mindfulness meditation on chronic pain: A randomized controlled trial. Pain Med. 2015;16(4):641-652. doi:10.1111/pme.12605
39. Zou L, Zhang Y, Yang L, et al. Are mindful exercises safe and beneficial for treating chronic lower back pain? A systematic review and meta-analysis of randomized controlled trials. J Clin Med. 2019;8(5):628. doi:10.3390/jcm8050628
40. Hughes LS, Clark J, Colclough JA, et al. Acceptance and commitment therapy (ACT) for chronic pain: a systematic review and meta-analyses. Clin J Pain. 2017;33(6):552-568. doi:10.1097/AJP.0000000000000425
41. Kemani MK, Olsson GL, Lekander M, et al. Efficacy and cost-effectiveness of acceptance and commitment therapy and applied relaxation for longstanding pain: a randomized controlled trial. Clin J Pain. 2015;31(11):1004-1016. doi:10.1097/AJP.0000000000000203
42. Scott W, Daly A, Yu L, McCracken LM. Treatment of chronic pain for adults 65 and over: analyses of outcomes and changes in psychological flexibility following interdisciplinary acceptance and commitment therapy (ACT). Pain Med. 2017;18(2):252. doi:10.1093/pm/pnw073
43. Veehof MM, Trompetter HR, Bohlmeijer ET, Schreurs KMG. Acceptance- and mindfulness-based interventions for the treatment of chronic pain: a meta-analytic review. Cogn Behav Ther. 2016;45(1):5-31. doi:10.1080/16506073.2015.1098724
44. Matthias MS, McGuire AB, Kukla M, et al. A brief peer support intervention for veterans with chronic musculoskeletal pain: a pilot study of feasibility and effectiveness. Pain Med. 2015;16(1):81-87. doi:10.1111/pme.12571
45. Anamkath NS, Palyo SA, Jacobs SC, et al. An interdisciplinary pain rehabilitation program for veterans with chronic pain: description and initial evaluation of outcomes. Pain Res Manag. 2018;2018(3941682):1-9. doi:10.1155/2018/3941682
46. Kamper SJ, Apeldoorn AT, Chiarotto A, et al. Multidisciplinary biopsychosocial rehabilitation for chronic low back pain. Cochrane Database Syst Rev. 2014;9: CD000963. doi:10.1002/14651858.CD000963.pub3
47. Penney LS, Haro E. Qualitative evaluation of an interdisciplinary chronic pain intervention: Outcomes and barriers and facilitators to ongoing pain management. J Pain Res. 2019;12:865-878. doi:10.2147/JPR.S185652
48. Murphy JL, Cordova MJ, Dedert EA. Cognitive behavioral therapy for chronic pain in veterans; Evidence for clinical effectiveness in a model program. Psychol Serv. 2022;19(1):95-102. doi:10.1037/ser0000506
49. Katz L, Patterson L, Zacharias R. Evaluation of an interdisciplinary chronic pain program and predictors of readiness for change. Can J Pain. 2019;3(1):70-78. doi:10.1080/24740527.2019.1582296
50. Majumder SMM, Ahmed S, Shazzad N, et al. Translation, cross-cultural adaptation and validation of the Pain Catastrophizing Scale (PCS) into Bengali I patients with chronic non-malignant musculoskeletal pain. Int J Rheum Dis. 2020;23:1481-1487. doi:10.1111/1756-185X.13954
51. Margiotta F, Hannigan A, Imran A, et al. Pain, perceived injustice, and pain catastrophizing in chronic pain patients in Ireland. Pain Pract. 2016;17(5):663-668. doi:10.1111/papr.12
52. Bras M, Milunovic V, Boban M, et al. Quality of live in Croatian Homeland war (1991-1995) veterans who suffer from post-traumatic stress disorder and chronic pain. Health Qual Life Out. 2011;9:56. doi:10.1186/1477-7525-9-56
53. Liu C-H, Kung Y-Y, Lin C-L, et al. Therapeutic efficacy and the impact of the “dose” effect of acupuncture to treat sciatica: A randomized controlled pilot study. J Pain Res. 2019;12:3511-3520. doi:10.2147/JPR.S210672
Improving Hospital Metrics Through the Implementation of a Comorbidity Capture Tool and Other Quality Initiatives
From the University of Miami Miller School of Medicine (Drs. Sosa, Ferreira, Gershengorn, Soto, Parekh, and Suarez), and the Quality Department of the University of Miami Hospital and Clinics (Estin Kelly, Ameena Shrestha, Julianne Burgos, and Sandeep Devabhaktuni), Miami, FL.
Abstract
Background: Case mix index (CMI) and expected mortality are determined based on comorbidities. Improving documentation and coding can impact performance indicators. During and prior to 2018, our patient acuity was under-represented, with low expected mortality and CMI. Those metrics motivated our quality team to develop the quality initiatives reported here.
Objectives: We sought to assess the impact of quality initiatives on number of comorbidities, diagnoses, CMI, and expected mortality at the University of Miami Health System.
Design: We conducted an observational study of a series of quality initiatives: (1) education of clinical documentation specialists (CDS) to capture comorbidities (10/2019); (2) facilitating the process for physician query response (2/2020); (3) implementation of computer logic to capture electrolyte disturbances and renal dysfunction (8/2020); (4) development of a tool to capture Elixhauser comorbidities (11/2020); and (5) provider education and electronic health record reviews by the quality team.
Setting and participants: All admissions during 2019 and 2020 at University of Miami Health System. The health system includes 2 academic inpatient facilities, a 560-bed tertiary hospital, and a 40-bed cancer facility. Our hospital is 1 of the 11 PPS-Exempt Cancer Hospitals and is the South Florida’s only NCI-Designated Cancer Center.
Conclusion:
Keywords: PS/QI, coding, case mix index, comorbidities, mortality.
Adoption of comprehensive electronic health record (EHR) systems by US hospitals, defined as an EHR capable of meeting all core meaningful-use metrics including evaluation and tracking of quality metrics, has been steadily increasing.3,4 Many institutions have looked to EHR system transitions as an inflection point to expand clinical documentation improvement (CDI) efforts. Over the past several years, our institution, an academic medical center, has endeavored to fully transition to a comprehensive EHR system (Epic from Epic Systems Corporation). Part of the purpose of this transition was to help study and improve outcomes, reduce readmissions, improve quality of care, and meet performance indicators.
Prior to 2019, our hospital’s patient acuity was low, with a CMI consistently below 2, ranging from 1.81 to 1.99, and an expected mortality consistently below 1.9%, ranging from 1.65% to 1.85%. Our concern that these values underestimated the real severity of illness of our patient population prompted the development of a quality improvement plan. In this report, we describe the processes we undertook to improve documentation and coding of comorbid illness, and report on the impact of these initiatives on performance indicators. We hypothesized that our initiatives would have a significant impact on our ability to capture patient complexity, and thus impact our CMI and expected mortality.
Methods
In the fall of 2019, we embarked on a multifaceted quality improvement project aimed at improving comorbidity capture for patients hospitalized at our institution. The health system includes 2 academic inpatient facilities, a 560-bed tertiary hospital and a 40-bed cancer facility. Since September 2017, we have used Epic as our EHR. In August 2019, we started working with Vizient Clinical Data Base5 to allow benchmarking with peer institutions. We assessed the impact of this initiative with a pre/post study design.
Quality Initiatives
This quality improvement project consisted of a series of 5 targeted interventions coupled with continuous monitoring and education.
1. Comorbidity coding. In October 2019, we met with the clinical documentation specialists (CDS) and the coding team to educate them on the value of coding all comorbidities that have an impact on
2. Physician query. In October 2019, we modified the process for physician query response, allowing physicians to answer queries in the EHR through a reply tool incorporated into the query and accept answers in the body of the Epic message as an active part of the EHR.
3. EHR logic. In August 2020, we developed an EHR smart logic to automatically capture fluid and electrolyte disturbances and renal dysfunction, based on the most recent laboratory values. The logic automatically populated potentially appropriate diagnoses in the assessment and plan of provider notes, which require provider acknowledgment and which providers are able to modify
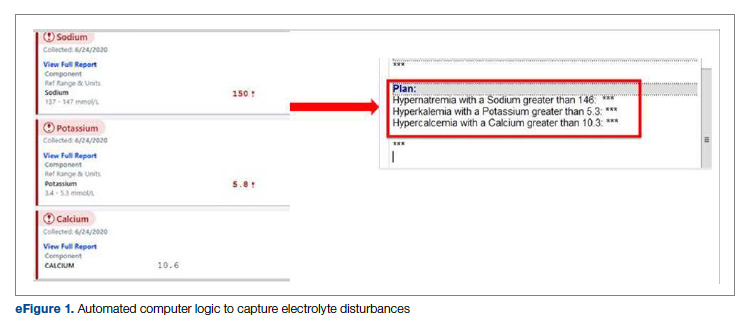
4. Comorbidity capture tool. In November 2020, we developed a standardized tool to allow providers to easily capture Elixhauser comorbidities (eFigure 2). The Elixhauser index is a method for measuring comorbidities based on International Classification of Diseases, Ninth Revision, Clinical Modification and International Classification of Disease, Tenth Revision diagnosis codes found in administrative data1-6 and is used by US News & World Report and Vizient to assess comorbidity burden. Our tool automatically captures diagnoses recorded in previous documentation and allows providers to easily provide the management plan for each; this information is automatically pulled into the provider note.
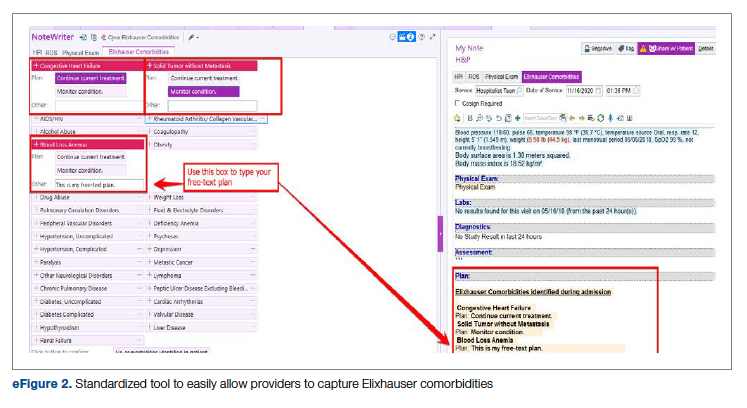
The development of this tool used an existing functionality within the Epic EHR called SmartForms, SmartData Elements, and SmartLinks. The only cost of tool development was the time invested—124 hours inclusive of 4 hours of staff education. Specifically, a panel of experts (including physicians of different specialties, an analyst, and representatives from the quality office) met weekly for 30 minutes per week over 5 weeks to agree on specific clinical criteria and guide the EHR build analyst. Individual panel members confirmed and validated design requirements (in 15 hours over 5 weeks). Our senior clinical analyst II dedicated 80 hours to actual build time, 15 hours to design time, and 25 hours to tailor the function to our institution’s workflow. This tool was introduced in November 2020; completion was optional at the time of hospital admission but mandatory at discharge to ensure compliance.
5. Quality team
Assessment of Quality Initiatives’ Impact
Data on the number of comorbidities and performance indicators were obtained retrospectively. The data included all hospital admissions from 2019 and 2020 divided into 2 periods: pre-intervention from January 1, 2019 through September 30, 2019, and intervention from October 1, 2019 through December 31, 2020. The primary outcome of this observational study was the rate of comorbidity capture during the intervention period. Comorbidity capture was assessed using the Vizient Clinical Data Base (CDB) health care performance tool.5 Vizient CDB uses the Agency for Healthcare Research and Quality Elixhauser index, which includes 29 of the initial 31 comorbidities described by Elixhauser,6 as it combines hypertension with and without complications into one. We secondarily aimed to examine the impact of the quality improvement initiatives on several institutional-level performance indicators, including total number of diagnoses, comorbidities or complications (CC), major comorbidities or complications (MCC), CMI, and expected mortality.
Case mix index is the average Medicare Severity-DRG (MS-DRG) weighted across all hospital discharges (appropriate to their discharge date). The expected mortality represents the average expected number of deaths based on diagnosed conditions, age, and gender within the same time frame, and it is based on coded diagnosis; we obtained the mortality index by dividing the observed mortality by the expected mortality. The Vizient CDB Mortality Risk Adjustment Model was used to assign an expected mortality (0%-100%) to each case based on factors such as demographics, admission type, diagnoses, and procedures.
Standard statistics were used to measure the outcomes. We used Excel to compare pre-intervention and intervention period characteristics and outcomes, using t-testing for continuous variables and Chi-square testing for categorial outcomes. P values <0.05 were considered statistically significant.
The study was reviewed by the institutional review board (IRB) of our institution (IRB ID: 20210070). The IRB determined that the proposed activity was not research involving human subjects, as defined by the Department of Health and Human Services and US Food and Drug Administration regulations, and that IRB review and approval by the organization were not required.
Results
The health system had a total of 33 066 admissions during the study period—13 689 pre-intervention (January 1, 2019 through September 30, 2019) and 19,377 during the intervention period (October 1, 2019 to December 31, 2020). Demographics were similar among the pre-intervention and intervention periods: mean age was 60 years and 61 years, 52% and 51% of patients were male, 72% and 71% were White, and 20% and 19% were Black, respectively (Table 1).
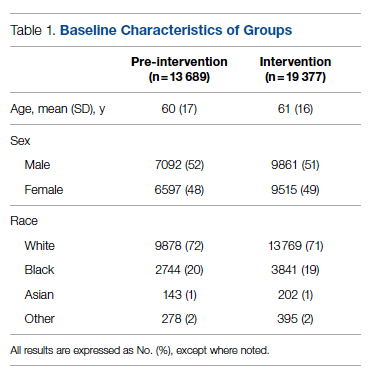
The multifaceted intervention resulted in a significant improvement in the primary outcome: mean comorbidity capture increased from 2.5 (SD, 1.7) before the intervention to 3.1 (SD, 2.0) during the intervention (P < .00001). Secondary outcomes also improved. The mean number of secondary diagnoses for admissions increased from 11.3 (SD, 7.3) prior to the intervention to 18.5 (SD, 10.4) (P < .00001) during the intervention period. The mean CMI increased from 2.1 (SD, 1.9) to 2.4 (SD, 2.2) post intervention (P < .00001), an increase during the intervention period of 14%. The expected mortality increased from 1.8% (SD, 6.1%) to 3.1% (SD, 9.2%) after the intervention (P < .00001) (Table 2).
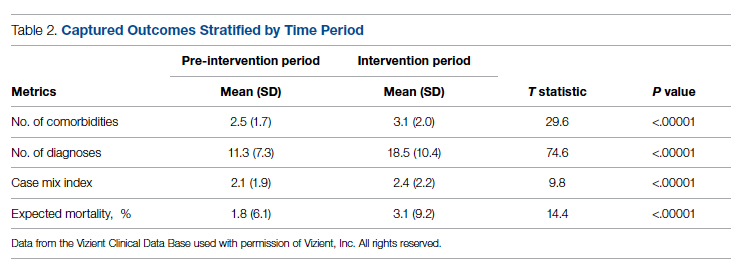
There was an overall observed improvement in percentage of discharges with documented CC and MCC for both surgical and medical specialties. Both CC and MCC increased for surgical specialties, from 54.4% to 68.5%, and for medical specialties, from 68.9% to 76.4%. (Figure 1). The diagnoses that were captured more consistently included deficiency anemia, obesity, diabetes with complications, fluid and electrolyte disorders and renal failure, hypertension, weight loss, depression, and hypothyroidism (Figure 2).
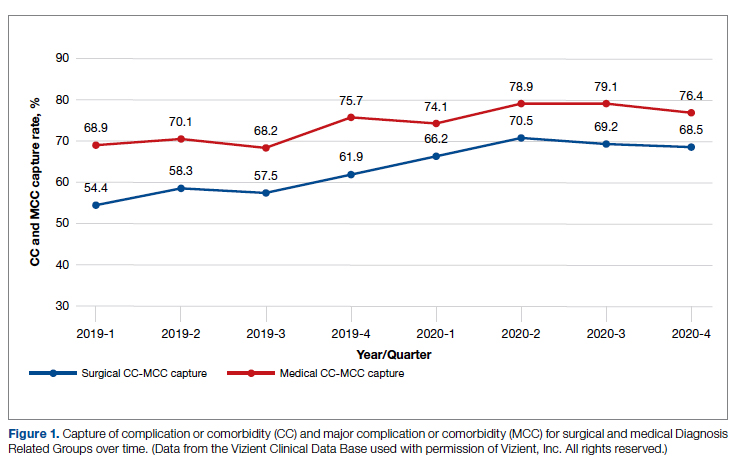
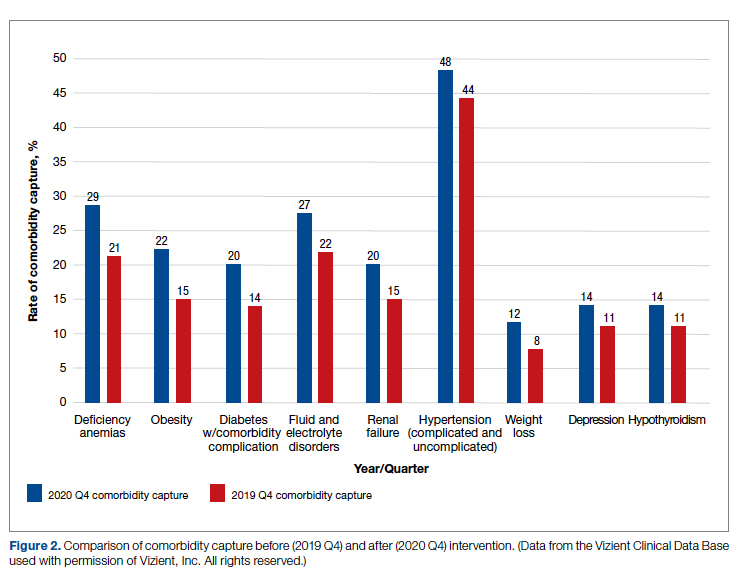
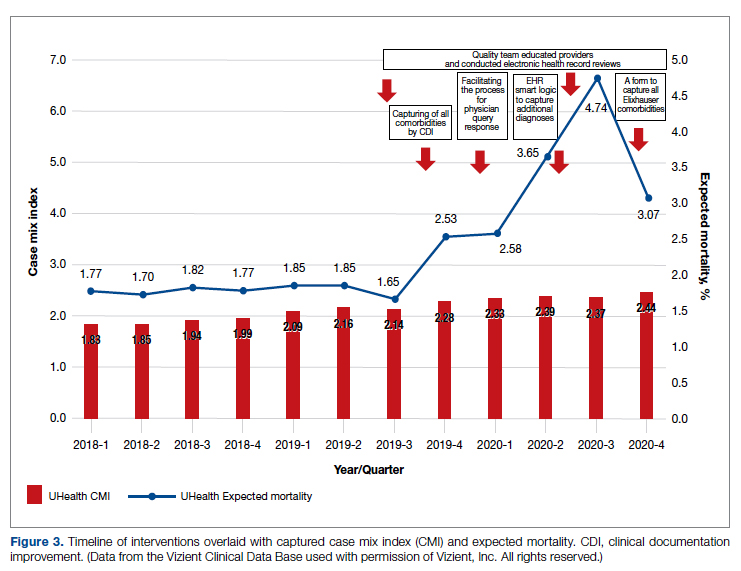
During the 9-month pre-intervention period (January 1 through September 30, 2019), there were 2795 queries, with an agreed volume of 1823; the agreement rate was 65% and the average provider turnaround time was 12.53 days. In the 15-month postintervention period, there were 10 216 queries, with an agreed volume of 6802 at 66%. We created a policy to encourage responses no later than 10 days after the query, and our average turnaround time decreased by more than 50% to 5.86 days. The average number of monthly queries increased by 55%, from an average of 311 monthly queries in the pre-intervention period to an average of 681 per month in the postintervention period. The more common queries that had an impact on CMI included sepsis, antineoplastic chemotherapy–induced pancytopenia, acute posthemorrhagic anemia, malnutrition, hyponatremia, and metabolic encephalopathy.
Discussion
The need for accurate documentation by physicians has been recognized for many years.7
With the growing complexity of the documentation and coding process, it is difficult for clinicians to keep up with the terminology required by the Centers for Medicare and Medicaid Services (CMS). Several different methods to improve documentation have been proposed. Prior interventions to standardize documentation templates in the trauma service have shown improvement in CMI.8 An educational program on coding for internal medicine that included a lecture series and creation of a laminated pocket card listing common CMS diagnoses, CC, and MCC has been implemented, with an improvement in the capture rate of CC and MCC from 42% to 48% and an impact on expected mortality.9 This program resulted in a 30% decrease in the median quarterly mortality index and an increase in CMI from 1.27 to 1.36.
Our results show that there was an increase in comorbidities documentation of admitted patients after all interventions were implemented, more accurately reflecting the complexity of our patient population in a tertiary care academic medical center. Our CMI increased by 14% during the intervention period. The estimated CMI dollar impact increased by 75% from the pre-intervention period (adjusted for PPS-exempt hospital). The hospital-expected mortality increased from 1.77 to 3.07 (peak at 4.74 during third quarter of 2020) during the implementation period, which is a key driver of quality rankings for national outcomes reporting services such as US News & World Report.
There was increased physician satisfaction as a result of the change of functionality of the query response system, and no additional monetary provider incentive for complete documentation was allocated, apart from education and 1:1 support that improved physician engagement. Our next steps include the implementation of an advanced program to concurrently and automatically capture and nudge providers to respond and complete their documentation in real time.
Limitations
The limitations of our study include those inherent to a retrospective review and are associative and observational in nature. Although we used expected mortality and CMI as a surrogate for patient acuity for comparison, there was no way to control for actual changes in patient acuity that contributed to the increase in CMI, although we believe that the population we served and the services provided and their structure did not change significantly during the intervention period. Additionally, the observed increase in CMI during the implementation period may be a result of described variabilities in CMI and would be better studied over a longer period. Also, during the year of our interventions, 2020, we were affected by the COVID-19 pandemic. Patients with COVID-19 are known to carry a lower-than-expected mortality, and that could have had a negative impact on our results. In fact, we did observe a decrease in our expected mortality during the last quarter of 2020, which correlated with one of our regional peaks for COVID-19, and that could be a confounding factor. While the described intervention process is potentially applicable to multiple EHR systems, the exact form to capture the Elixhauser comorbidities was built into the Epic EHR, limiting external applicability of this tool to other EHR software.
Conclusion
A continuous comprehensive series of interventions substantially increased our patient acuity scores. The increased scores have implications for reimbursement and quality comparisons for hospitals and physicians. Our institution can now be stratified more accurately with our peers and other hospitals. Accurate medical record documentation has become increasingly important, but also increasingly complex. Leveraging the EHR through quality initiatives that facilitate the workflow for providers can have an impact on documentation, coding, and ultimately risk-adjusted outcomes data that influence institutional reputation.
Corresponding author: Marie Anne Sosa, MD; 1120 NW 14th St., Suite 809, Miami, FL, 33134; mxs2157@med.miami.edu
Disclosures: None reported.
doi:10.12788/jcom.0088
1. Elixhauser A, Steiner C, Harris DR, Coffey RM. Comorbidity measures for use with administrative data. Med Care. 1998;36(1):8-27. doi:10.1097/00005650-199801000-00004.
2. Sehgal AR. The role of reputation in U.S. News & World Report’s rankings of the top 50 American hospitals. Ann Intern Med. 2010;152(8):521-525. doi:10.7326/0003-4819-152-8-201004200-00009
3. Jha AK, DesRoches CM, Campbell EG, et al. Use of electronic health records in U.S. hospitals. N Engl J Med. 2009;360(16):1628-1638. doi:10.1056/NEJMsa0900592.
4. Adler-Milstein J, DesRoches CM, Kralovec, et al. Electronic health record adoption in US hospitals: progress continues, but challenges persist. Health Aff (Millwood). 2015;34(12):2174-2180. doi:10.1377/hlthaff.2015.0992
5. Vizient Clinical Data Base/Resource ManagerTM. Irving, TX: Vizient, Inc.; 2019. Accessed March 10, 2022. https://www.vizientinc.com
6. Moore BJ, White S, Washington R, Coenen N, Elixhauser A. Identifying increased risk of readmission and in-hospital mortality using hospital administrative data: the AHRQ Elixhauser Comorbidity Index. Med Care. 2017;55(7):698-705. doi:10.1097/MLR.0000000000000735
7. Payne T. Improving clinical documentation in an EMR world. Healthc Financ Manage. 2010;64(2):70-74.
8. Barnes SL, Waterman M, Macintyre D, Coughenour J, Kessel J. Impact of standardized trauma documentation to the hospital’s bottom line. Surgery. 2010;148(4):793-797. doi:10.1016/j.surg.2010.07.040
9. Spellberg B, Harrington D, Black S, Sue D, Stringer W, Witt M. Capturing the diagnosis: an internal medicine education program to improve documentation. Am J Med. 2013;126(8):739-743.e1. doi:10.1016/j.amjmed.2012.11.035
From the University of Miami Miller School of Medicine (Drs. Sosa, Ferreira, Gershengorn, Soto, Parekh, and Suarez), and the Quality Department of the University of Miami Hospital and Clinics (Estin Kelly, Ameena Shrestha, Julianne Burgos, and Sandeep Devabhaktuni), Miami, FL.
Abstract
Background: Case mix index (CMI) and expected mortality are determined based on comorbidities. Improving documentation and coding can impact performance indicators. During and prior to 2018, our patient acuity was under-represented, with low expected mortality and CMI. Those metrics motivated our quality team to develop the quality initiatives reported here.
Objectives: We sought to assess the impact of quality initiatives on number of comorbidities, diagnoses, CMI, and expected mortality at the University of Miami Health System.
Design: We conducted an observational study of a series of quality initiatives: (1) education of clinical documentation specialists (CDS) to capture comorbidities (10/2019); (2) facilitating the process for physician query response (2/2020); (3) implementation of computer logic to capture electrolyte disturbances and renal dysfunction (8/2020); (4) development of a tool to capture Elixhauser comorbidities (11/2020); and (5) provider education and electronic health record reviews by the quality team.
Setting and participants: All admissions during 2019 and 2020 at University of Miami Health System. The health system includes 2 academic inpatient facilities, a 560-bed tertiary hospital, and a 40-bed cancer facility. Our hospital is 1 of the 11 PPS-Exempt Cancer Hospitals and is the South Florida’s only NCI-Designated Cancer Center.
Conclusion:
Keywords: PS/QI, coding, case mix index, comorbidities, mortality.
Adoption of comprehensive electronic health record (EHR) systems by US hospitals, defined as an EHR capable of meeting all core meaningful-use metrics including evaluation and tracking of quality metrics, has been steadily increasing.3,4 Many institutions have looked to EHR system transitions as an inflection point to expand clinical documentation improvement (CDI) efforts. Over the past several years, our institution, an academic medical center, has endeavored to fully transition to a comprehensive EHR system (Epic from Epic Systems Corporation). Part of the purpose of this transition was to help study and improve outcomes, reduce readmissions, improve quality of care, and meet performance indicators.
Prior to 2019, our hospital’s patient acuity was low, with a CMI consistently below 2, ranging from 1.81 to 1.99, and an expected mortality consistently below 1.9%, ranging from 1.65% to 1.85%. Our concern that these values underestimated the real severity of illness of our patient population prompted the development of a quality improvement plan. In this report, we describe the processes we undertook to improve documentation and coding of comorbid illness, and report on the impact of these initiatives on performance indicators. We hypothesized that our initiatives would have a significant impact on our ability to capture patient complexity, and thus impact our CMI and expected mortality.
Methods
In the fall of 2019, we embarked on a multifaceted quality improvement project aimed at improving comorbidity capture for patients hospitalized at our institution. The health system includes 2 academic inpatient facilities, a 560-bed tertiary hospital and a 40-bed cancer facility. Since September 2017, we have used Epic as our EHR. In August 2019, we started working with Vizient Clinical Data Base5 to allow benchmarking with peer institutions. We assessed the impact of this initiative with a pre/post study design.
Quality Initiatives
This quality improvement project consisted of a series of 5 targeted interventions coupled with continuous monitoring and education.
1. Comorbidity coding. In October 2019, we met with the clinical documentation specialists (CDS) and the coding team to educate them on the value of coding all comorbidities that have an impact on
2. Physician query. In October 2019, we modified the process for physician query response, allowing physicians to answer queries in the EHR through a reply tool incorporated into the query and accept answers in the body of the Epic message as an active part of the EHR.
3. EHR logic. In August 2020, we developed an EHR smart logic to automatically capture fluid and electrolyte disturbances and renal dysfunction, based on the most recent laboratory values. The logic automatically populated potentially appropriate diagnoses in the assessment and plan of provider notes, which require provider acknowledgment and which providers are able to modify
4. Comorbidity capture tool. In November 2020, we developed a standardized tool to allow providers to easily capture Elixhauser comorbidities (eFigure 2). The Elixhauser index is a method for measuring comorbidities based on International Classification of Diseases, Ninth Revision, Clinical Modification and International Classification of Disease, Tenth Revision diagnosis codes found in administrative data1-6 and is used by US News & World Report and Vizient to assess comorbidity burden. Our tool automatically captures diagnoses recorded in previous documentation and allows providers to easily provide the management plan for each; this information is automatically pulled into the provider note.
The development of this tool used an existing functionality within the Epic EHR called SmartForms, SmartData Elements, and SmartLinks. The only cost of tool development was the time invested—124 hours inclusive of 4 hours of staff education. Specifically, a panel of experts (including physicians of different specialties, an analyst, and representatives from the quality office) met weekly for 30 minutes per week over 5 weeks to agree on specific clinical criteria and guide the EHR build analyst. Individual panel members confirmed and validated design requirements (in 15 hours over 5 weeks). Our senior clinical analyst II dedicated 80 hours to actual build time, 15 hours to design time, and 25 hours to tailor the function to our institution’s workflow. This tool was introduced in November 2020; completion was optional at the time of hospital admission but mandatory at discharge to ensure compliance.
5. Quality team
Assessment of Quality Initiatives’ Impact
Data on the number of comorbidities and performance indicators were obtained retrospectively. The data included all hospital admissions from 2019 and 2020 divided into 2 periods: pre-intervention from January 1, 2019 through September 30, 2019, and intervention from October 1, 2019 through December 31, 2020. The primary outcome of this observational study was the rate of comorbidity capture during the intervention period. Comorbidity capture was assessed using the Vizient Clinical Data Base (CDB) health care performance tool.5 Vizient CDB uses the Agency for Healthcare Research and Quality Elixhauser index, which includes 29 of the initial 31 comorbidities described by Elixhauser,6 as it combines hypertension with and without complications into one. We secondarily aimed to examine the impact of the quality improvement initiatives on several institutional-level performance indicators, including total number of diagnoses, comorbidities or complications (CC), major comorbidities or complications (MCC), CMI, and expected mortality.
Case mix index is the average Medicare Severity-DRG (MS-DRG) weighted across all hospital discharges (appropriate to their discharge date). The expected mortality represents the average expected number of deaths based on diagnosed conditions, age, and gender within the same time frame, and it is based on coded diagnosis; we obtained the mortality index by dividing the observed mortality by the expected mortality. The Vizient CDB Mortality Risk Adjustment Model was used to assign an expected mortality (0%-100%) to each case based on factors such as demographics, admission type, diagnoses, and procedures.
Standard statistics were used to measure the outcomes. We used Excel to compare pre-intervention and intervention period characteristics and outcomes, using t-testing for continuous variables and Chi-square testing for categorial outcomes. P values <0.05 were considered statistically significant.
The study was reviewed by the institutional review board (IRB) of our institution (IRB ID: 20210070). The IRB determined that the proposed activity was not research involving human subjects, as defined by the Department of Health and Human Services and US Food and Drug Administration regulations, and that IRB review and approval by the organization were not required.
Results
The health system had a total of 33 066 admissions during the study period—13 689 pre-intervention (January 1, 2019 through September 30, 2019) and 19,377 during the intervention period (October 1, 2019 to December 31, 2020). Demographics were similar among the pre-intervention and intervention periods: mean age was 60 years and 61 years, 52% and 51% of patients were male, 72% and 71% were White, and 20% and 19% were Black, respectively (Table 1).
The multifaceted intervention resulted in a significant improvement in the primary outcome: mean comorbidity capture increased from 2.5 (SD, 1.7) before the intervention to 3.1 (SD, 2.0) during the intervention (P < .00001). Secondary outcomes also improved. The mean number of secondary diagnoses for admissions increased from 11.3 (SD, 7.3) prior to the intervention to 18.5 (SD, 10.4) (P < .00001) during the intervention period. The mean CMI increased from 2.1 (SD, 1.9) to 2.4 (SD, 2.2) post intervention (P < .00001), an increase during the intervention period of 14%. The expected mortality increased from 1.8% (SD, 6.1%) to 3.1% (SD, 9.2%) after the intervention (P < .00001) (Table 2).
There was an overall observed improvement in percentage of discharges with documented CC and MCC for both surgical and medical specialties. Both CC and MCC increased for surgical specialties, from 54.4% to 68.5%, and for medical specialties, from 68.9% to 76.4%. (Figure 1). The diagnoses that were captured more consistently included deficiency anemia, obesity, diabetes with complications, fluid and electrolyte disorders and renal failure, hypertension, weight loss, depression, and hypothyroidism (Figure 2).
During the 9-month pre-intervention period (January 1 through September 30, 2019), there were 2795 queries, with an agreed volume of 1823; the agreement rate was 65% and the average provider turnaround time was 12.53 days. In the 15-month postintervention period, there were 10 216 queries, with an agreed volume of 6802 at 66%. We created a policy to encourage responses no later than 10 days after the query, and our average turnaround time decreased by more than 50% to 5.86 days. The average number of monthly queries increased by 55%, from an average of 311 monthly queries in the pre-intervention period to an average of 681 per month in the postintervention period. The more common queries that had an impact on CMI included sepsis, antineoplastic chemotherapy–induced pancytopenia, acute posthemorrhagic anemia, malnutrition, hyponatremia, and metabolic encephalopathy.
Discussion
The need for accurate documentation by physicians has been recognized for many years.7
With the growing complexity of the documentation and coding process, it is difficult for clinicians to keep up with the terminology required by the Centers for Medicare and Medicaid Services (CMS). Several different methods to improve documentation have been proposed. Prior interventions to standardize documentation templates in the trauma service have shown improvement in CMI.8 An educational program on coding for internal medicine that included a lecture series and creation of a laminated pocket card listing common CMS diagnoses, CC, and MCC has been implemented, with an improvement in the capture rate of CC and MCC from 42% to 48% and an impact on expected mortality.9 This program resulted in a 30% decrease in the median quarterly mortality index and an increase in CMI from 1.27 to 1.36.
Our results show that there was an increase in comorbidities documentation of admitted patients after all interventions were implemented, more accurately reflecting the complexity of our patient population in a tertiary care academic medical center. Our CMI increased by 14% during the intervention period. The estimated CMI dollar impact increased by 75% from the pre-intervention period (adjusted for PPS-exempt hospital). The hospital-expected mortality increased from 1.77 to 3.07 (peak at 4.74 during third quarter of 2020) during the implementation period, which is a key driver of quality rankings for national outcomes reporting services such as US News & World Report.
There was increased physician satisfaction as a result of the change of functionality of the query response system, and no additional monetary provider incentive for complete documentation was allocated, apart from education and 1:1 support that improved physician engagement. Our next steps include the implementation of an advanced program to concurrently and automatically capture and nudge providers to respond and complete their documentation in real time.
Limitations
The limitations of our study include those inherent to a retrospective review and are associative and observational in nature. Although we used expected mortality and CMI as a surrogate for patient acuity for comparison, there was no way to control for actual changes in patient acuity that contributed to the increase in CMI, although we believe that the population we served and the services provided and their structure did not change significantly during the intervention period. Additionally, the observed increase in CMI during the implementation period may be a result of described variabilities in CMI and would be better studied over a longer period. Also, during the year of our interventions, 2020, we were affected by the COVID-19 pandemic. Patients with COVID-19 are known to carry a lower-than-expected mortality, and that could have had a negative impact on our results. In fact, we did observe a decrease in our expected mortality during the last quarter of 2020, which correlated with one of our regional peaks for COVID-19, and that could be a confounding factor. While the described intervention process is potentially applicable to multiple EHR systems, the exact form to capture the Elixhauser comorbidities was built into the Epic EHR, limiting external applicability of this tool to other EHR software.
Conclusion
A continuous comprehensive series of interventions substantially increased our patient acuity scores. The increased scores have implications for reimbursement and quality comparisons for hospitals and physicians. Our institution can now be stratified more accurately with our peers and other hospitals. Accurate medical record documentation has become increasingly important, but also increasingly complex. Leveraging the EHR through quality initiatives that facilitate the workflow for providers can have an impact on documentation, coding, and ultimately risk-adjusted outcomes data that influence institutional reputation.
Corresponding author: Marie Anne Sosa, MD; 1120 NW 14th St., Suite 809, Miami, FL, 33134; mxs2157@med.miami.edu
Disclosures: None reported.
doi:10.12788/jcom.0088
1. Elixhauser A, Steiner C, Harris DR, Coffey RM. Comorbidity measures for use with administrative data. Med Care. 1998;36(1):8-27. doi:10.1097/00005650-199801000-00004.
2. Sehgal AR. The role of reputation in U.S. News & World Report’s rankings of the top 50 American hospitals. Ann Intern Med. 2010;152(8):521-525. doi:10.7326/0003-4819-152-8-201004200-00009
3. Jha AK, DesRoches CM, Campbell EG, et al. Use of electronic health records in U.S. hospitals. N Engl J Med. 2009;360(16):1628-1638. doi:10.1056/NEJMsa0900592.
4. Adler-Milstein J, DesRoches CM, Kralovec, et al. Electronic health record adoption in US hospitals: progress continues, but challenges persist. Health Aff (Millwood). 2015;34(12):2174-2180. doi:10.1377/hlthaff.2015.0992
5. Vizient Clinical Data Base/Resource ManagerTM. Irving, TX: Vizient, Inc.; 2019. Accessed March 10, 2022. https://www.vizientinc.com
6. Moore BJ, White S, Washington R, Coenen N, Elixhauser A. Identifying increased risk of readmission and in-hospital mortality using hospital administrative data: the AHRQ Elixhauser Comorbidity Index. Med Care. 2017;55(7):698-705. doi:10.1097/MLR.0000000000000735
7. Payne T. Improving clinical documentation in an EMR world. Healthc Financ Manage. 2010;64(2):70-74.
8. Barnes SL, Waterman M, Macintyre D, Coughenour J, Kessel J. Impact of standardized trauma documentation to the hospital’s bottom line. Surgery. 2010;148(4):793-797. doi:10.1016/j.surg.2010.07.040
9. Spellberg B, Harrington D, Black S, Sue D, Stringer W, Witt M. Capturing the diagnosis: an internal medicine education program to improve documentation. Am J Med. 2013;126(8):739-743.e1. doi:10.1016/j.amjmed.2012.11.035
A Practical and Cost-Effective Approach to the Diagnosis of Heparin-Induced Thrombocytopenia: A Single-Center Quality Improvement Study
From the Veterans Affairs Ann Arbor Healthcare System Medicine Service (Dr. Cusick), University of Michigan College of Pharmacy, Clinical Pharmacy Service, Michigan Medicine (Dr. Hanigan), Department of Internal Medicine Clinical Experience and Quality, Michigan Medicine (Linda Bashaw), Department of Internal Medicine, University of Michigan Medical School, Ann Arbor, MI (Dr. Heidemann), and the Operational Excellence Department, Sparrow Health System, Lansing, MI (Matthew Johnson).
Abstract
Background: Diagnosis of heparin-induced thrombocytopenia (HIT) requires completion of an enzyme-linked immunosorbent assay (ELISA)–based heparin-platelet factor 4 (PF4) antibody test. If this test is negative, HIT is excluded. If positive, a serotonin-release assay (SRA) test is indicated. The SRA is expensive and sometimes inappropriately ordered despite negative PF4 results, leading to unnecessary treatment with argatroban while awaiting SRA results.
Objectives: The primary objectives of this project were to reduce unnecessary SRA testing and argatroban utilization in patients with suspected HIT.
Methods: The authors implemented an intervention at a tertiary care academic hospital in November 2017 targeting patients hospitalized with suspected HIT. The intervention was controlled at the level of the laboratory and prevented ordering of SRA tests in the absence of a positive PF4 test. The number of SRA tests performed and argatroban bags administered were identified retrospectively via chart review before the intervention (January 2016 to November 2017) and post intervention (December 2017 to March 2020). Associated costs were calculated based on institutional SRA testing cost as well as the average wholesale price of argatroban.
Results: SRA testing decreased from an average of 3.7 SRA results per 1000 admissions before the intervention to an average of 0.6 results per 1000 admissions post intervention. The number of 50-mL argatroban bags used per 1000 admissions decreased from 18.8 prior to the intervention to 14.3 post intervention. Total estimated cost savings per 1000 admissions was $2361.20.
Conclusion: An evidence-based testing strategy for HIT can be effectively implemented at the level of the laboratory. This approach led to reductions in SRA testing and argatroban utilization with resultant cost savings.
Keywords: HIT, argatroban, anticoagulation, serotonin-release assay.
Thrombocytopenia is a common finding in hospitalized patients.1,2 Heparin-induced thrombocytopenia (HIT) is one of the many potential causes of thrombocytopenia in hospitalized patients and occurs when antibodies to the heparin-platelet factor 4 (PF4) complex develop after heparin exposure. This triggers a cascade of events, leading to platelet activation, platelet consumption, and thrombosis. While HIT is relatively rare, occurring in 0.3% to 0.5% of critically ill patients, many patients will be tested to rule out this potentially life-threatening cause of thrombocytopenia.3
The diagnosis of HIT utilizes a combination of both clinical suspicion and laboratory testing.4 The 4T score (Table) was developed to evaluate the clinical probability of HIT and involves assessing the degree and timing of thrombocytopenia, the presence or absence of thrombosis, and other potential causes of the thrombocytopenia.5 The 4T score is designed to be utilized to identify patients who require laboratory testing for HIT; however, it has low inter-rater agreement in patients undergoing evaluation for HIT,6 and, in our experience, completion of this scoring is time-consuming.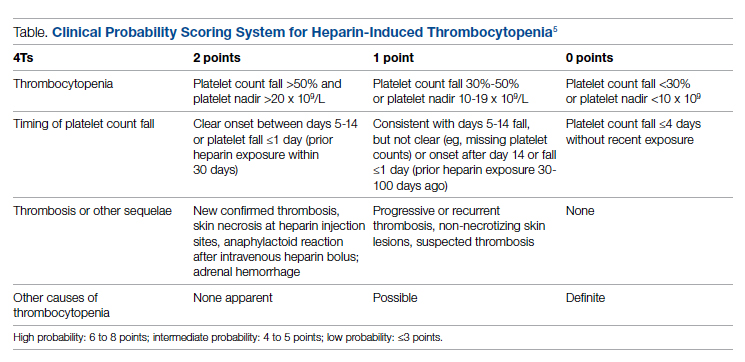
The enzyme-linked immunosorbent assay (ELISA) is a commonly used laboratory test to diagnose HIT that detects antibodies to the heparin-PF4 complex utilizing optical density (OD) units. When using an OD cutoff of 0.400, ELISA PF4 (PF4) tests have a sensitivity of 99.6%, but poor specificity at 69.3%.7 When the PF4 antibody test is positive with an OD ≥0.400, then a functional test is used to determine whether the antibodies detected will activate platelets. The serotonin-release assay (SRA) is a functional test that measures 14C-labeled serotonin release from donor platelets when mixed with patient serum or plasma containing HIT antibodies. In the correct clinical context, a positive ELISA PF4 antibody test along with a positive SRA is diagnostic of HIT.8
The process of diagnosing HIT in a timely and cost-effective manner is dependent on the clinician’s experience in diagnosing HIT as well as access to the laboratory testing necessary to confirm the diagnosis. PF4 antibody tests are time-consuming and not always available daily and/or are not available onsite. The SRA requires access to donor platelets and specialized radioactivity counting equipment, making it available only at particular centers.
The treatment of HIT is more straightforward and involves stopping all heparin products and starting a nonheparin anticoagulant. The direct thrombin inhibitor argatroban is one of the standard nonheparin anticoagulants used in patients with suspected HIT.4 While it is expensive, its short half-life and lack of renal clearance make it ideal for treatment of hospitalized patients with suspected HIT, many of whom need frequent procedures and/or have renal disease.
At our academic tertiary care center, we performed a retrospective analysis that showed inappropriate ordering of diagnostic HIT testing as well as unnecessary use of argatroban even when there was low suspicion for HIT based on laboratory findings. The aim of our project was to reduce unnecessary HIT testing and argatroban utilization without overburdening providers or interfering with established workflows.
Methods
Setting
The University of Michigan (UM) hospital is a 1000-bed tertiary care center in Ann Arbor, Michigan. The UM guidelines reflect evidence-based guidelines for the diagnosis and treatment of HIT.4 In 2016 the UM guidelines for laboratory testing included sending the PF4 antibody test first when there was clinical suspicion of HIT. The SRA was to be sent separately only when the PF4 returned positive (OD ≥ 0.400). Standard guidelines at UM also included switching patients with suspected HIT from heparin to a nonheparin anticoagulant and stopping all heparin products while awaiting the SRA results. The direct thrombin inhibitor argatroban is utilized at UM and monitored with anti-IIa levels. University of Michigan Hospital utilizes the Immucor PF4 IgG ELISA for detecting heparin-associated antibodies.9 In 2016, this PF4 test was performed in the UM onsite laboratory Monday through Friday. At UM the SRA is performed off site, with a turnaround time of 3 to 5 business days.
Baseline Data
We retrospectively reviewed PF4 and SRA testing as well as argatroban usage from December 2016 to May 2017. Despite the institutional guidelines, providers were sending PF4 and SRA simultaneously as soon as HIT was suspected; 62% of PF4 tests were ordered simultaneously with the SRA, but only 8% of these PF4 tests were positive with an OD ≥0.400. Of those patients with negative PF4 testing, argatroban was continued until the SRA returned negative, leading to many days of unnecessary argatroban usage. An informal survey of the anticoagulation pharmacists revealed that many recommended discontinuing argatroban when the PF4 test was negative, but providers routinely did not feel comfortable with this approach. This suggested many providers misunderstood the performance characteristics of the PF4 test.
Intervention
Our team consisted of hematology and internal medicine faculty, pharmacists, coagulation laboratory personnel, and quality improvement specialists. We designed and implemented an intervention in November 2017 focused on controlling the ordering of the SRA test. We chose to focus on this step due to the excellent sensitivity of the PF4 test with a cutoff of OD <0.400 and the significant expense of the SRA test. Under direction of the Coagulation Laboratory Director, a standard operating procedure was developed where the coagulation laboratory personnel did not send out the SRA until a positive PF4 test (OD ≥ 0.400) was reported. If the PF4 was negative, the SRA was canceled and the ordering provider received notification of the cancelled test via the electronic medical record, accompanied by education about HIT testing (Figure 1). In addition, the lab increased the availability of PF4 testing from 5 days to 7 days a week so there were no delays in tests ordered on Fridays or weekends.
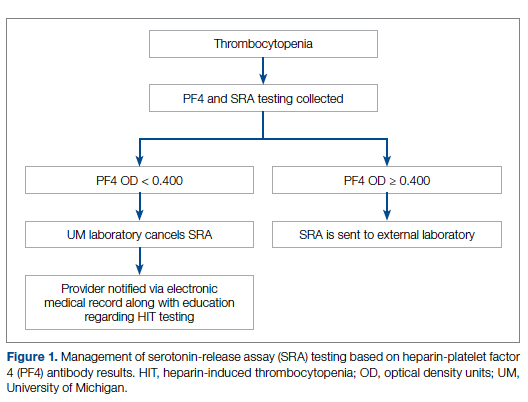
Outcomes
Our primary goals were to decrease both SRA testing and argatroban use. Secondarily, we examined the cost-effectiveness of this intervention. We hypothesized that controlling the SRA testing at the laboratory level would decrease both SRA testing and argatroban use.
Data Collection
Pre- and postintervention data were collected retrospectively. Pre-intervention data were from January 2016 through November 2017, and postintervention data were from December 2017 through March 2020. The number of SRA tests performed were identified retrospectively via review of electronic ordering records. All patients who had a hospital admission after January 1, 2016, were included. These patients were filtered to include only those who had a result for an SRA test. In order to calculate cost-savings, we identified both the number of SRA tests ordered retrospectively as well as patients who had both an SRA resulted and had been administered argatroban. Cost-savings were calculated based on our institutional cost of $357 per SRA test.
At our institution, argatroban is supplied in 50-mL bags; therefore, we utilized the number of bags to identify argatroban usage. Savings were calculated using the average wholesale price (AWP) of $292.50 per 50-mL bag. The amounts billed or collected for the SRA testing or argatroban treatment were not collected. Costs were estimated using only direct costs to the institution. Safety data were not collected. As the intent of our project was a quality improvement activity, this project did not require institutional review board regulation per our institutional guidance.
Results
During the pre-intervention period, the average number of admissions (adults and children) at UM was 5863 per month. Post intervention there was an average of 5842 admissions per month. A total of 1192 PF4 tests were ordered before the intervention and 1148 were ordered post intervention. Prior to the intervention, 481 SRA tests were completed, while post intervention 105 were completed. Serotonin-release testing decreased from an average of 3.7 SRA results per 1000 admissions during the pre-intervention period to an average of 0.6 per 1000 admissions post intervention (Figure 2). Cost-savings were $1045 per 1000 admissions.
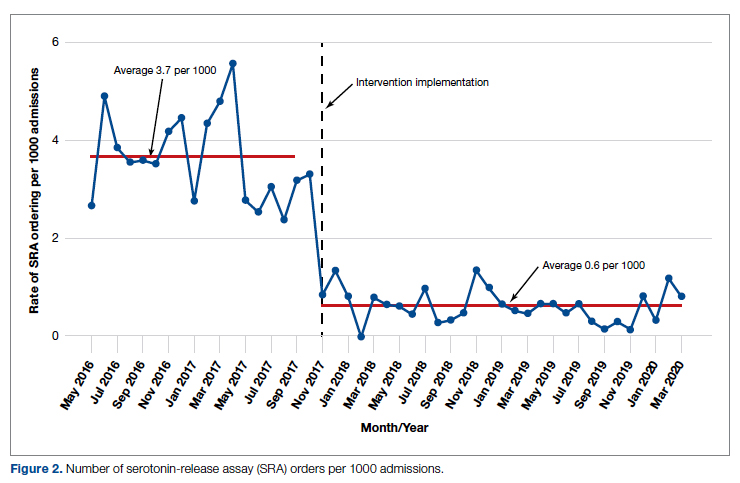
During the pre-intervention period, 2539 bags of argatroban were used, while 2337 bags were used post intervention. The number of 50-mL argatroban bags used per 1000 admissions decreased from 18.8 before the intervention to 14.3 post intervention. Cost-savings were $1316.20 per 1000 admissions. Figure 3 illustrates the monthly argatroban utilization per 1000 admissions during each quarter from January 2016 through March 2020.
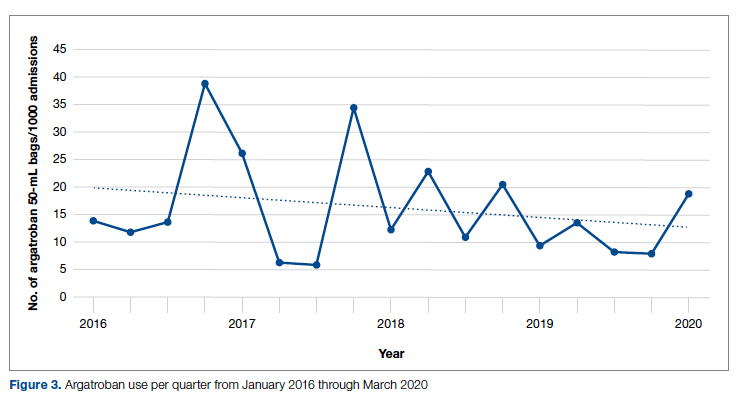
Discussion
We designed and implemented an evidence-based strategy for HIT at our academic institution which led to a decrease in unnecessary SRA testing and argatroban utilization, with associated cost savings. By focusing on a single point of intervention at the laboratory level where SRA tests were held and canceled if the PF4 test was negative, we helped offload the decision-making from the provider while simultaneously providing just-in-time education to the provider. This intervention was designed with input from multiple stakeholders, including physicians, quality improvement specialists, pharmacists, and coagulation laboratory personnel.
Serotonin-release testing dramatically decreased post intervention even though a similar number of PF4 tests were performed before and after the intervention. This suggests that the decrease in SRA testing was a direct consequence of our intervention. Post intervention the number of completed SRA tests was 9% of the number of PF4 tests sent. This is consistent with our baseline pre-intervention data showing that only 8% of all PF4 tests sent were positive.
While the absolute number of argatroban bags utilized did not dramatically decrease after the intervention, the quarterly rate did, particularly after 2018. Given that argatroban data were only drawn from patients with a concurrent SRA test, this decrease is clearly from decreased usage in patients with suspected HIT. We suspect the decrease occurred because argatroban was not being continued while awaiting an SRA test in patients with a negative PF4 test. Decreasing the utilization of argatroban not only saved money but also reduced days of exposure to argatroban. While we do not have data regarding adverse events related to argatroban prior to the intervention, it is logical to conclude that reducing unnecessary exposure to argatroban reduces the risk of adverse events related to bleeding. Future studies would ideally address specific safety outcome metrics such as adverse events, bleeding risk, or missed diagnoses of HIT.
Our institutional guidelines for the diagnosis of HIT are evidence-based and helpful but are rarely followed by busy inpatient providers. Controlling the utilization of the SRA at the laboratory level had several advantages. First, removing SRA decision-making from providers who are not experts in the diagnosis of HIT guaranteed adherence to evidence-based guidelines. Second, pharmacists could safely recommend discontinuing argatroban when the PF4 test was negative as there was no SRA pending. Third, with cancellation at the laboratory level there was no need to further burden providers with yet another alert in the electronic health record. Fourth, just-in-time education was provided to the providers with justification for why the SRA test was canceled. Last, ruling out HIT within 24 hours with the PF4 test alone allowed providers to evaluate patients for other causes of thrombocytopenia much earlier than the 3 to 5 business days before the SRA results returned.
A limitation of this study is that it was conducted at a single center. Our approach is also limited by the lack of universal applicability. At our institution we are fortunate to have PF4 testing available in our coagulation laboratory 7 days a week. In addition, the coagulation laboratory controls sending the SRA to the reference laboratory. The specific intervention of controlling the SRA testing is therefore applicable only to institutions similar to ours; however, the concept of removing control of specialized testing from the provider is not unique. Inpatient thrombophilia testing has been a successful target of this approach.11-13 While electronic alerts and education of individual providers can also be effective initially, the effectiveness of these interventions has been repeatedly shown to wane over time.14-16
Conclusion
At our institution we were able to implement practical, evidence-based testing for HIT by implementing control over SRA testing at the level of the laboratory. This approach led to decreased argatroban utilization and cost savings.
Corresponding author: Alice Cusick, MD; LTC Charles S Kettles VA Medical Center, 2215 Fuller Road, Ann Arbor, MI 48105; mccoyag@med.umich.edu
Disclosures: None reported.
doi: 10.12788/jcom.0087
1. Fountain E, Arepally GM. Thrombocytopenia in hospitalized non-ICU patients. Blood. 2015;126(23):1060. doi:10.1182/blood.v126.23.1060.1060
2. Hui P, Cook DJ, Lim W, Fraser GA, Arnold DM. The frequency and clinical significance of thrombocytopenia complicating critical illness: a systematic review. Chest. 2011;139(2):271-278. doi:10.1378/chest.10-2243
3. Warkentin TE. Heparin-induced thrombocytopenia. Curr Opin Crit Care. 2015;21(6):576-585. doi:10.1097/MCC.0000000000000259
4. Cuker A, Arepally GM, Chong BH, et al. American Society of Hematology 2018 guidelines for management of venous thromboembolism: heparin-induced thrombocytopenia. Blood Adv. 2018;2(22):3360-3392. doi:10.1182/bloodadvances.2018024489
5. Cuker A, Gimotty PA, Crowther MA, Warkentin TE. Predictive value of the 4Ts scoring system for heparin-induced thrombocytopenia: a systematic review and meta-analysis. Blood. 2012;120(20):4160-4167. doi:10.1182/blood-2012-07-443051
6. Northam KA, Parker WF, Chen S-L, et al. Evaluation of 4Ts score inter-rater agreement in patients undergoing evaluation for heparin-induced thrombocytopenia. Blood Coagul Fibrinolysis. 2021;32(5):328-334. doi:10.1097/MBC.0000000000001042
7. Raschke RA, Curry SC, Warkentin TE, Gerkin RD. Improving clinical interpretation of the anti-platelet factor 4/heparin enzyme-linked immunosorbent assay for the diagnosis of heparin-induced thrombocytopenia through the use of receiver operating characteristic analysis, stratum-specific likelihood ratios, and Bayes theorem. Chest. 2013;144(4):1269-1275. doi:10.1378/chest.12-2712
8. Warkentin TE, Arnold DM, Nazi I, Kelton JG. The platelet serotonin-release assay. Am J Hematol. 2015;90(6):564-572. doi:10.1002/ajh.24006
9. Use IFOR, Contents TOF. LIFECODES ® PF4 IgG assay:1-9.
10. Ancker JS, Edwards A, Nosal S, Hauser D, Mauer E, Kaushal R. Effects of workload, work complexity, and repeated alerts on alert fatigue in a clinical decision support system. BMC Med Inform Decis Mak. 2017;17(1):1-9. doi:10.1186/s12911-017-0430-8
11. O’Connor N, Carter-Johnson R. Effective screening of pathology tests controls costs: thrombophilia testing. J Clin Pathol. 2006;59(5):556. doi:10.1136/jcp.2005.030700
12. Lim MY, Greenberg CS. Inpatient thrombophilia testing: Impact of healthcare system technology and targeted clinician education on changing practice patterns. Vasc Med (United Kingdom). 2018;23(1):78-79. doi:10.1177/1358863X17742509
13. Cox JL, Shunkwiler SM, Koepsell SA. Requirement for a pathologist’s second signature limits inappropriate inpatient thrombophilia testing. Lab Med. 2017;48(4):367-371. doi:10.1093/labmed/lmx040
14. Kwang H, Mou E, Richman I, et al. Thrombophilia testing in the inpatient setting: impact of an educational intervention. BMC Med Inform Decis Mak. 2019;19(1):167. doi:10.1186/s12911-019-0889-6
15. Shah T, Patel-Teague S, Kroupa L, Meyer AND, Singh H. Impact of a national QI programme on reducing electronic health record notifications to clinicians. BMJ Qual Saf. 2019;28(1):10-14. doi:10.1136/bmjqs-2017-007447
16. Singh H, Spitzmueller C, Petersen NJ, Sawhney MK, Sittig DF. Information overload and missed test results in electronic health record-based settings. JAMA Intern Med. 2013;173(8):702-704. doi:10.1001/2013.jamainternmed.61
From the Veterans Affairs Ann Arbor Healthcare System Medicine Service (Dr. Cusick), University of Michigan College of Pharmacy, Clinical Pharmacy Service, Michigan Medicine (Dr. Hanigan), Department of Internal Medicine Clinical Experience and Quality, Michigan Medicine (Linda Bashaw), Department of Internal Medicine, University of Michigan Medical School, Ann Arbor, MI (Dr. Heidemann), and the Operational Excellence Department, Sparrow Health System, Lansing, MI (Matthew Johnson).
Abstract
Background: Diagnosis of heparin-induced thrombocytopenia (HIT) requires completion of an enzyme-linked immunosorbent assay (ELISA)–based heparin-platelet factor 4 (PF4) antibody test. If this test is negative, HIT is excluded. If positive, a serotonin-release assay (SRA) test is indicated. The SRA is expensive and sometimes inappropriately ordered despite negative PF4 results, leading to unnecessary treatment with argatroban while awaiting SRA results.
Objectives: The primary objectives of this project were to reduce unnecessary SRA testing and argatroban utilization in patients with suspected HIT.
Methods: The authors implemented an intervention at a tertiary care academic hospital in November 2017 targeting patients hospitalized with suspected HIT. The intervention was controlled at the level of the laboratory and prevented ordering of SRA tests in the absence of a positive PF4 test. The number of SRA tests performed and argatroban bags administered were identified retrospectively via chart review before the intervention (January 2016 to November 2017) and post intervention (December 2017 to March 2020). Associated costs were calculated based on institutional SRA testing cost as well as the average wholesale price of argatroban.
Results: SRA testing decreased from an average of 3.7 SRA results per 1000 admissions before the intervention to an average of 0.6 results per 1000 admissions post intervention. The number of 50-mL argatroban bags used per 1000 admissions decreased from 18.8 prior to the intervention to 14.3 post intervention. Total estimated cost savings per 1000 admissions was $2361.20.
Conclusion: An evidence-based testing strategy for HIT can be effectively implemented at the level of the laboratory. This approach led to reductions in SRA testing and argatroban utilization with resultant cost savings.
Keywords: HIT, argatroban, anticoagulation, serotonin-release assay.
Thrombocytopenia is a common finding in hospitalized patients.1,2 Heparin-induced thrombocytopenia (HIT) is one of the many potential causes of thrombocytopenia in hospitalized patients and occurs when antibodies to the heparin-platelet factor 4 (PF4) complex develop after heparin exposure. This triggers a cascade of events, leading to platelet activation, platelet consumption, and thrombosis. While HIT is relatively rare, occurring in 0.3% to 0.5% of critically ill patients, many patients will be tested to rule out this potentially life-threatening cause of thrombocytopenia.3
The diagnosis of HIT utilizes a combination of both clinical suspicion and laboratory testing.4 The 4T score (Table) was developed to evaluate the clinical probability of HIT and involves assessing the degree and timing of thrombocytopenia, the presence or absence of thrombosis, and other potential causes of the thrombocytopenia.5 The 4T score is designed to be utilized to identify patients who require laboratory testing for HIT; however, it has low inter-rater agreement in patients undergoing evaluation for HIT,6 and, in our experience, completion of this scoring is time-consuming.
The enzyme-linked immunosorbent assay (ELISA) is a commonly used laboratory test to diagnose HIT that detects antibodies to the heparin-PF4 complex utilizing optical density (OD) units. When using an OD cutoff of 0.400, ELISA PF4 (PF4) tests have a sensitivity of 99.6%, but poor specificity at 69.3%.7 When the PF4 antibody test is positive with an OD ≥0.400, then a functional test is used to determine whether the antibodies detected will activate platelets. The serotonin-release assay (SRA) is a functional test that measures 14C-labeled serotonin release from donor platelets when mixed with patient serum or plasma containing HIT antibodies. In the correct clinical context, a positive ELISA PF4 antibody test along with a positive SRA is diagnostic of HIT.8
The process of diagnosing HIT in a timely and cost-effective manner is dependent on the clinician’s experience in diagnosing HIT as well as access to the laboratory testing necessary to confirm the diagnosis. PF4 antibody tests are time-consuming and not always available daily and/or are not available onsite. The SRA requires access to donor platelets and specialized radioactivity counting equipment, making it available only at particular centers.
The treatment of HIT is more straightforward and involves stopping all heparin products and starting a nonheparin anticoagulant. The direct thrombin inhibitor argatroban is one of the standard nonheparin anticoagulants used in patients with suspected HIT.4 While it is expensive, its short half-life and lack of renal clearance make it ideal for treatment of hospitalized patients with suspected HIT, many of whom need frequent procedures and/or have renal disease.
At our academic tertiary care center, we performed a retrospective analysis that showed inappropriate ordering of diagnostic HIT testing as well as unnecessary use of argatroban even when there was low suspicion for HIT based on laboratory findings. The aim of our project was to reduce unnecessary HIT testing and argatroban utilization without overburdening providers or interfering with established workflows.
Methods
Setting
The University of Michigan (UM) hospital is a 1000-bed tertiary care center in Ann Arbor, Michigan. The UM guidelines reflect evidence-based guidelines for the diagnosis and treatment of HIT.4 In 2016 the UM guidelines for laboratory testing included sending the PF4 antibody test first when there was clinical suspicion of HIT. The SRA was to be sent separately only when the PF4 returned positive (OD ≥ 0.400). Standard guidelines at UM also included switching patients with suspected HIT from heparin to a nonheparin anticoagulant and stopping all heparin products while awaiting the SRA results. The direct thrombin inhibitor argatroban is utilized at UM and monitored with anti-IIa levels. University of Michigan Hospital utilizes the Immucor PF4 IgG ELISA for detecting heparin-associated antibodies.9 In 2016, this PF4 test was performed in the UM onsite laboratory Monday through Friday. At UM the SRA is performed off site, with a turnaround time of 3 to 5 business days.
Baseline Data
We retrospectively reviewed PF4 and SRA testing as well as argatroban usage from December 2016 to May 2017. Despite the institutional guidelines, providers were sending PF4 and SRA simultaneously as soon as HIT was suspected; 62% of PF4 tests were ordered simultaneously with the SRA, but only 8% of these PF4 tests were positive with an OD ≥0.400. Of those patients with negative PF4 testing, argatroban was continued until the SRA returned negative, leading to many days of unnecessary argatroban usage. An informal survey of the anticoagulation pharmacists revealed that many recommended discontinuing argatroban when the PF4 test was negative, but providers routinely did not feel comfortable with this approach. This suggested many providers misunderstood the performance characteristics of the PF4 test.
Intervention
Our team consisted of hematology and internal medicine faculty, pharmacists, coagulation laboratory personnel, and quality improvement specialists. We designed and implemented an intervention in November 2017 focused on controlling the ordering of the SRA test. We chose to focus on this step due to the excellent sensitivity of the PF4 test with a cutoff of OD <0.400 and the significant expense of the SRA test. Under direction of the Coagulation Laboratory Director, a standard operating procedure was developed where the coagulation laboratory personnel did not send out the SRA until a positive PF4 test (OD ≥ 0.400) was reported. If the PF4 was negative, the SRA was canceled and the ordering provider received notification of the cancelled test via the electronic medical record, accompanied by education about HIT testing (Figure 1). In addition, the lab increased the availability of PF4 testing from 5 days to 7 days a week so there were no delays in tests ordered on Fridays or weekends.
Outcomes
Our primary goals were to decrease both SRA testing and argatroban use. Secondarily, we examined the cost-effectiveness of this intervention. We hypothesized that controlling the SRA testing at the laboratory level would decrease both SRA testing and argatroban use.
Data Collection
Pre- and postintervention data were collected retrospectively. Pre-intervention data were from January 2016 through November 2017, and postintervention data were from December 2017 through March 2020. The number of SRA tests performed were identified retrospectively via review of electronic ordering records. All patients who had a hospital admission after January 1, 2016, were included. These patients were filtered to include only those who had a result for an SRA test. In order to calculate cost-savings, we identified both the number of SRA tests ordered retrospectively as well as patients who had both an SRA resulted and had been administered argatroban. Cost-savings were calculated based on our institutional cost of $357 per SRA test.
At our institution, argatroban is supplied in 50-mL bags; therefore, we utilized the number of bags to identify argatroban usage. Savings were calculated using the average wholesale price (AWP) of $292.50 per 50-mL bag. The amounts billed or collected for the SRA testing or argatroban treatment were not collected. Costs were estimated using only direct costs to the institution. Safety data were not collected. As the intent of our project was a quality improvement activity, this project did not require institutional review board regulation per our institutional guidance.
Results
During the pre-intervention period, the average number of admissions (adults and children) at UM was 5863 per month. Post intervention there was an average of 5842 admissions per month. A total of 1192 PF4 tests were ordered before the intervention and 1148 were ordered post intervention. Prior to the intervention, 481 SRA tests were completed, while post intervention 105 were completed. Serotonin-release testing decreased from an average of 3.7 SRA results per 1000 admissions during the pre-intervention period to an average of 0.6 per 1000 admissions post intervention (Figure 2). Cost-savings were $1045 per 1000 admissions.
During the pre-intervention period, 2539 bags of argatroban were used, while 2337 bags were used post intervention. The number of 50-mL argatroban bags used per 1000 admissions decreased from 18.8 before the intervention to 14.3 post intervention. Cost-savings were $1316.20 per 1000 admissions. Figure 3 illustrates the monthly argatroban utilization per 1000 admissions during each quarter from January 2016 through March 2020.
Discussion
We designed and implemented an evidence-based strategy for HIT at our academic institution which led to a decrease in unnecessary SRA testing and argatroban utilization, with associated cost savings. By focusing on a single point of intervention at the laboratory level where SRA tests were held and canceled if the PF4 test was negative, we helped offload the decision-making from the provider while simultaneously providing just-in-time education to the provider. This intervention was designed with input from multiple stakeholders, including physicians, quality improvement specialists, pharmacists, and coagulation laboratory personnel.
Serotonin-release testing dramatically decreased post intervention even though a similar number of PF4 tests were performed before and after the intervention. This suggests that the decrease in SRA testing was a direct consequence of our intervention. Post intervention the number of completed SRA tests was 9% of the number of PF4 tests sent. This is consistent with our baseline pre-intervention data showing that only 8% of all PF4 tests sent were positive.
While the absolute number of argatroban bags utilized did not dramatically decrease after the intervention, the quarterly rate did, particularly after 2018. Given that argatroban data were only drawn from patients with a concurrent SRA test, this decrease is clearly from decreased usage in patients with suspected HIT. We suspect the decrease occurred because argatroban was not being continued while awaiting an SRA test in patients with a negative PF4 test. Decreasing the utilization of argatroban not only saved money but also reduced days of exposure to argatroban. While we do not have data regarding adverse events related to argatroban prior to the intervention, it is logical to conclude that reducing unnecessary exposure to argatroban reduces the risk of adverse events related to bleeding. Future studies would ideally address specific safety outcome metrics such as adverse events, bleeding risk, or missed diagnoses of HIT.
Our institutional guidelines for the diagnosis of HIT are evidence-based and helpful but are rarely followed by busy inpatient providers. Controlling the utilization of the SRA at the laboratory level had several advantages. First, removing SRA decision-making from providers who are not experts in the diagnosis of HIT guaranteed adherence to evidence-based guidelines. Second, pharmacists could safely recommend discontinuing argatroban when the PF4 test was negative as there was no SRA pending. Third, with cancellation at the laboratory level there was no need to further burden providers with yet another alert in the electronic health record. Fourth, just-in-time education was provided to the providers with justification for why the SRA test was canceled. Last, ruling out HIT within 24 hours with the PF4 test alone allowed providers to evaluate patients for other causes of thrombocytopenia much earlier than the 3 to 5 business days before the SRA results returned.
A limitation of this study is that it was conducted at a single center. Our approach is also limited by the lack of universal applicability. At our institution we are fortunate to have PF4 testing available in our coagulation laboratory 7 days a week. In addition, the coagulation laboratory controls sending the SRA to the reference laboratory. The specific intervention of controlling the SRA testing is therefore applicable only to institutions similar to ours; however, the concept of removing control of specialized testing from the provider is not unique. Inpatient thrombophilia testing has been a successful target of this approach.11-13 While electronic alerts and education of individual providers can also be effective initially, the effectiveness of these interventions has been repeatedly shown to wane over time.14-16
Conclusion
At our institution we were able to implement practical, evidence-based testing for HIT by implementing control over SRA testing at the level of the laboratory. This approach led to decreased argatroban utilization and cost savings.
Corresponding author: Alice Cusick, MD; LTC Charles S Kettles VA Medical Center, 2215 Fuller Road, Ann Arbor, MI 48105; mccoyag@med.umich.edu
Disclosures: None reported.
doi: 10.12788/jcom.0087
1. Fountain E, Arepally GM. Thrombocytopenia in hospitalized non-ICU patients. Blood. 2015;126(23):1060. doi:10.1182/blood.v126.23.1060.1060
2. Hui P, Cook DJ, Lim W, Fraser GA, Arnold DM. The frequency and clinical significance of thrombocytopenia complicating critical illness: a systematic review. Chest. 2011;139(2):271-278. doi:10.1378/chest.10-2243
3. Warkentin TE. Heparin-induced thrombocytopenia. Curr Opin Crit Care. 2015;21(6):576-585. doi:10.1097/MCC.0000000000000259
4. Cuker A, Arepally GM, Chong BH, et al. American Society of Hematology 2018 guidelines for management of venous thromboembolism: heparin-induced thrombocytopenia. Blood Adv. 2018;2(22):3360-3392. doi:10.1182/bloodadvances.2018024489
5. Cuker A, Gimotty PA, Crowther MA, Warkentin TE. Predictive value of the 4Ts scoring system for heparin-induced thrombocytopenia: a systematic review and meta-analysis. Blood. 2012;120(20):4160-4167. doi:10.1182/blood-2012-07-443051
6. Northam KA, Parker WF, Chen S-L, et al. Evaluation of 4Ts score inter-rater agreement in patients undergoing evaluation for heparin-induced thrombocytopenia. Blood Coagul Fibrinolysis. 2021;32(5):328-334. doi:10.1097/MBC.0000000000001042
7. Raschke RA, Curry SC, Warkentin TE, Gerkin RD. Improving clinical interpretation of the anti-platelet factor 4/heparin enzyme-linked immunosorbent assay for the diagnosis of heparin-induced thrombocytopenia through the use of receiver operating characteristic analysis, stratum-specific likelihood ratios, and Bayes theorem. Chest. 2013;144(4):1269-1275. doi:10.1378/chest.12-2712
8. Warkentin TE, Arnold DM, Nazi I, Kelton JG. The platelet serotonin-release assay. Am J Hematol. 2015;90(6):564-572. doi:10.1002/ajh.24006
9. Use IFOR, Contents TOF. LIFECODES ® PF4 IgG assay:1-9.
10. Ancker JS, Edwards A, Nosal S, Hauser D, Mauer E, Kaushal R. Effects of workload, work complexity, and repeated alerts on alert fatigue in a clinical decision support system. BMC Med Inform Decis Mak. 2017;17(1):1-9. doi:10.1186/s12911-017-0430-8
11. O’Connor N, Carter-Johnson R. Effective screening of pathology tests controls costs: thrombophilia testing. J Clin Pathol. 2006;59(5):556. doi:10.1136/jcp.2005.030700
12. Lim MY, Greenberg CS. Inpatient thrombophilia testing: Impact of healthcare system technology and targeted clinician education on changing practice patterns. Vasc Med (United Kingdom). 2018;23(1):78-79. doi:10.1177/1358863X17742509
13. Cox JL, Shunkwiler SM, Koepsell SA. Requirement for a pathologist’s second signature limits inappropriate inpatient thrombophilia testing. Lab Med. 2017;48(4):367-371. doi:10.1093/labmed/lmx040
14. Kwang H, Mou E, Richman I, et al. Thrombophilia testing in the inpatient setting: impact of an educational intervention. BMC Med Inform Decis Mak. 2019;19(1):167. doi:10.1186/s12911-019-0889-6
15. Shah T, Patel-Teague S, Kroupa L, Meyer AND, Singh H. Impact of a national QI programme on reducing electronic health record notifications to clinicians. BMJ Qual Saf. 2019;28(1):10-14. doi:10.1136/bmjqs-2017-007447
16. Singh H, Spitzmueller C, Petersen NJ, Sawhney MK, Sittig DF. Information overload and missed test results in electronic health record-based settings. JAMA Intern Med. 2013;173(8):702-704. doi:10.1001/2013.jamainternmed.61
Using a Real-Time Prediction Algorithm to Improve Sleep in the Hospital
Study Overview
Objective: This study evaluated whether a clinical-decision-support (CDS) tool that utilizes a real-time algorithm incorporating patient vital sign data can identify hospitalized patients who can forgo overnight vital sign checks and thus reduce delirium incidence.
Design: This was a parallel randomized clinical trial of adult inpatients admitted to the general medical service of a tertiary care academic medical center in the United States. The trial intervention consisted of a CDS notification in the electronic health record (EHR) that informed the physician if a patient had a high likelihood of nighttime vital signs within the reference ranges based on a logistic regression model of real-time patient data input. This notification provided the physician an opportunity to discontinue nighttime vital sign checks, dismiss the notification for 1 hour, or dismiss the notification until the next day.
Setting and participants: This clinical trial was conducted at the University of California, San Francisco Medical Center from March 11 to November 24, 2019. Participants included physicians who served on the primary team (eg, attending, resident) of 1699 patients on the general medical service who were outside of the intensive care unit (ICU). The hospital encounters were randomized (allocation ratio of 1:1) to sleep promotion vitals CDS (SPV CDS) intervention or usual care.
Main outcome and measures: The primary outcome was delirium as determined by bedside nurse assessment using the Nursing Delirium Screening Scale (Nu-DESC) recorded once per nursing shift. The Nu-DESC is a standardized delirium screening tool that defines delirium with a score ≥2. Secondary outcomes included sleep opportunity (ie, EHR-based sleep metrics that reflected the maximum time between iatrogenic interruptions, such as nighttime vital sign checks) and patient satisfaction (ie, patient satisfaction measured by standardized Hospital Consumer Assessment of Healthcare Providers and Systems [HCAHPS] survey). Potential balancing outcomes were assessed to ensure that reduced vital sign checks were not causing harms; these included ICU transfers, rapid response calls, and code blue alarms. All analyses were conducted on the basis of intention-to-treat.
Main results: A total of 3025 inpatient encounters were screened and 1930 encounters were randomized (966 SPV CDS intervention; 964 usual care). The randomized encounters consisted of 1699 patients; demographic factors between the 2 trial arms were similar. Specifically, the intervention arm included 566 men (59%) and mean (SD) age was 53 (15) years. The incidence of delirium was similar between the intervention and usual care arms: 108 (11%) vs 123 (13%) (P = .32). Compared to the usual care arm, the intervention arm had a higher mean (SD) number of sleep opportunity hours per night (4.95 [1.45] vs 4.57 [1.30], P < .001) and fewer nighttime vital sign checks (0.97 [0.95] vs 1.41 [0.86], P < .001). The post-discharge HCAHPS survey measuring patient satisfaction was completed by only 5% of patients (53 intervention, 49 usual care), and survey results were similar between the 2 arms (P = .86). In addition, safety outcomes including ICU transfers (49 [5%] vs 47 [5%], P = .92), rapid response calls (68 [7%] vs 55 [6%], P = .27), and code blue alarms (2 [0.2%] vs 9 [0.9%], P = .07) were similar between the study arms.
Conclusion: In this randomized clinical trial, a CDS tool utilizing a real-time prediction algorithm embedded in EHR did not reduce the incidence of delirium in hospitalized patients. However, this SPV CDS intervention helped physicians identify clinically stable patients who can forgo routine nighttime vital sign checks and facilitated greater opportunity for patients to sleep. These findings suggest that augmenting physician judgment using a real-time prediction algorithm can help to improve sleep opportunity without an accompanying increased risk of clinical decompensation during acute care.
Commentary
High-quality sleep is fundamental to health and well-being. Sleep deprivation and disorders are associated with many adverse health outcomes, including increased risks for obesity, diabetes, hypertension, myocardial infarction, and depression.1 In hospitalized patients who are acutely ill, restorative sleep is critical to facilitating recovery. However, poor sleep is exceedingly common in hospitalized patients and is associated with deleterious outcomes, such as high blood pressure, hyperglycemia, and delirium.2,3 Moreover, some of these adverse sleep-induced cardiometabolic outcomes, as well as sleep disruption itself, may persist after hospital discharge.4 Factors that precipitate interrupted sleep during hospitalization include iatrogenic causes such as frequent vital sign checks, nighttime procedures or early morning blood draws, and environmental factors such as loud ambient noise.3 Thus, a potential intervention to improve sleep quality in the hospital is to reduce nighttime interruptions such as frequent vital sign checks.
In the current study, Najafi and colleagues conducted a randomized trial to evaluate whether a CDS tool embedded in EHR, powered by a real-time prediction algorithm of patient data, can be utilized to identify patients in whom vital sign checks can be safely discontinued at nighttime. The authors found a modest but statistically significant reduction in the number of nighttime vital sign checks in patients who underwent the SPV CDS intervention, and a corresponding higher sleep opportunity per night in those who received the intervention. Importantly, this reduction in nighttime vital sign checks did not cause a higher risk of clinical decompensation as measured by ICU transfers, rapid response calls, or code blue alarms. Thus, the results demonstrated the feasibility of using a real-time, patient data-driven CDS tool to augment physician judgment in managing sleep disruption, an important hospital-associated stressor and a common hazard of hospitalization in older patients.
Delirium is a common clinical problem in hospitalized older patients that is associated with prolonged hospitalization, functional and cognitive decline, institutionalization, death, and increased health care costs.5 Despite a potential benefit of SPV CDS intervention in reducing vital sign checks and increasing sleep opportunity, this intervention did not reduce the incidence of delirium in hospitalized patients. This finding is not surprising given that delirium has a multifactorial etiology (eg, metabolic derangements, infections, medication side effects and drug toxicity, hospital environment). A small modification in nighttime vital sign checks and sleep opportunity may have limited impact on optimizing sleep quality and does not address other risk factors for delirium. As such, a multicomponent nonpharmacologic approach that includes sleep enhancement, early mobilization, feeding assistance, fluid repletion, infection prevention, and other interventions should guide delirium prevention in the hospital setting. The SPV CDS intervention may play a role in the delivery of a multifaceted, nonpharmacologic delirium prevention intervention in high-risk individuals.
Sleep disruption is one of the multiple hazards of hospitalization frequently experience by hospitalized older patients. Other hazards, or hospital-associated stressors, include mobility restriction (eg, physical restraints such as urinary catheters and intravenous lines, bed elevation and rails), malnourishment and dehydration (eg, frequent use of no-food-by-mouth order, lack of easy access to hydration), and pain (eg, poor pain control). Extended exposures to these stressors may lead to a maladaptive state called allostatic overload that transiently increases vulnerability to post-hospitalization adverse events, including emergency department use, hospital readmission, or death (ie, post-hospital syndrome).6 Thus, the optimization of sleep during hospitalization in vulnerable patients may have benefits that extend beyond delirium prevention. It is perceivable that a CDS tool embedded in EHR, powered by a real-time prediction algorithm of patient data, may be applied to reduce some of these hazards of hospitalization in addition to improving sleep opportunity.
Applications for Clinical Practice
Findings from the current study indicate that a CDS tool embedded in EHR that utilizes a real-time prediction algorithm of patient data may help to safely improve sleep opportunity in hospitalized patients. The participants in the current study were relatively young (53 [15] years). Given that age is a risk factor for delirium, the effects of this intervention on delirium prevention in the most susceptible population (ie, those over the age of 65) remain unknown and further investigation is warranted. Additional studies are needed to determine whether this approach yields similar results in geriatric patients and improves clinical outcomes.
—Fred Ko, MD
1. Institute of Medicine (US) Committee on Sleep Medicine and Research. Sleep Disorders and Sleep Deprivation: An Unmet Public Health Problem. Colten HR, Altevogt BM, editors. National Academies Press (US); 2006.
2. Pilkington S. Causes and consequences of sleep deprivation in hospitalised patients. Nurs Stand. 2013;27(49):350-342. doi:10.7748/ns2013.08.27.49.35.e7649
3. Stewart NH, Arora VM. Sleep in hospitalized older adults. Sleep Med Clin. 2018;13(1):127-135. doi:10.1016/j.jsmc.2017.09.012
4. Altman MT, Knauert MP, Pisani MA. Sleep disturbance after hospitalization and critical illness: a systematic review. Ann Am Thorac Soc. 2017;14(9):1457-1468. doi:10.1513/AnnalsATS.201702-148SR
5. Oh ES, Fong TG, Hshieh TT, Inouye SK. Delirium in older persons: advances in diagnosis and treatment. JAMA. 2017;318(12):1161-1174. doi:10.1001/jama.2017.12067
6. Goldwater DS, Dharmarajan K, McEwan BS, Krumholz HM. Is posthospital syndrome a result of hospitalization-induced allostatic overload? J Hosp Med. 2018;13(5). doi:10.12788/jhm.2986
Study Overview
Objective: This study evaluated whether a clinical-decision-support (CDS) tool that utilizes a real-time algorithm incorporating patient vital sign data can identify hospitalized patients who can forgo overnight vital sign checks and thus reduce delirium incidence.
Design: This was a parallel randomized clinical trial of adult inpatients admitted to the general medical service of a tertiary care academic medical center in the United States. The trial intervention consisted of a CDS notification in the electronic health record (EHR) that informed the physician if a patient had a high likelihood of nighttime vital signs within the reference ranges based on a logistic regression model of real-time patient data input. This notification provided the physician an opportunity to discontinue nighttime vital sign checks, dismiss the notification for 1 hour, or dismiss the notification until the next day.
Setting and participants: This clinical trial was conducted at the University of California, San Francisco Medical Center from March 11 to November 24, 2019. Participants included physicians who served on the primary team (eg, attending, resident) of 1699 patients on the general medical service who were outside of the intensive care unit (ICU). The hospital encounters were randomized (allocation ratio of 1:1) to sleep promotion vitals CDS (SPV CDS) intervention or usual care.
Main outcome and measures: The primary outcome was delirium as determined by bedside nurse assessment using the Nursing Delirium Screening Scale (Nu-DESC) recorded once per nursing shift. The Nu-DESC is a standardized delirium screening tool that defines delirium with a score ≥2. Secondary outcomes included sleep opportunity (ie, EHR-based sleep metrics that reflected the maximum time between iatrogenic interruptions, such as nighttime vital sign checks) and patient satisfaction (ie, patient satisfaction measured by standardized Hospital Consumer Assessment of Healthcare Providers and Systems [HCAHPS] survey). Potential balancing outcomes were assessed to ensure that reduced vital sign checks were not causing harms; these included ICU transfers, rapid response calls, and code blue alarms. All analyses were conducted on the basis of intention-to-treat.
Main results: A total of 3025 inpatient encounters were screened and 1930 encounters were randomized (966 SPV CDS intervention; 964 usual care). The randomized encounters consisted of 1699 patients; demographic factors between the 2 trial arms were similar. Specifically, the intervention arm included 566 men (59%) and mean (SD) age was 53 (15) years. The incidence of delirium was similar between the intervention and usual care arms: 108 (11%) vs 123 (13%) (P = .32). Compared to the usual care arm, the intervention arm had a higher mean (SD) number of sleep opportunity hours per night (4.95 [1.45] vs 4.57 [1.30], P < .001) and fewer nighttime vital sign checks (0.97 [0.95] vs 1.41 [0.86], P < .001). The post-discharge HCAHPS survey measuring patient satisfaction was completed by only 5% of patients (53 intervention, 49 usual care), and survey results were similar between the 2 arms (P = .86). In addition, safety outcomes including ICU transfers (49 [5%] vs 47 [5%], P = .92), rapid response calls (68 [7%] vs 55 [6%], P = .27), and code blue alarms (2 [0.2%] vs 9 [0.9%], P = .07) were similar between the study arms.
Conclusion: In this randomized clinical trial, a CDS tool utilizing a real-time prediction algorithm embedded in EHR did not reduce the incidence of delirium in hospitalized patients. However, this SPV CDS intervention helped physicians identify clinically stable patients who can forgo routine nighttime vital sign checks and facilitated greater opportunity for patients to sleep. These findings suggest that augmenting physician judgment using a real-time prediction algorithm can help to improve sleep opportunity without an accompanying increased risk of clinical decompensation during acute care.
Commentary
High-quality sleep is fundamental to health and well-being. Sleep deprivation and disorders are associated with many adverse health outcomes, including increased risks for obesity, diabetes, hypertension, myocardial infarction, and depression.1 In hospitalized patients who are acutely ill, restorative sleep is critical to facilitating recovery. However, poor sleep is exceedingly common in hospitalized patients and is associated with deleterious outcomes, such as high blood pressure, hyperglycemia, and delirium.2,3 Moreover, some of these adverse sleep-induced cardiometabolic outcomes, as well as sleep disruption itself, may persist after hospital discharge.4 Factors that precipitate interrupted sleep during hospitalization include iatrogenic causes such as frequent vital sign checks, nighttime procedures or early morning blood draws, and environmental factors such as loud ambient noise.3 Thus, a potential intervention to improve sleep quality in the hospital is to reduce nighttime interruptions such as frequent vital sign checks.
In the current study, Najafi and colleagues conducted a randomized trial to evaluate whether a CDS tool embedded in EHR, powered by a real-time prediction algorithm of patient data, can be utilized to identify patients in whom vital sign checks can be safely discontinued at nighttime. The authors found a modest but statistically significant reduction in the number of nighttime vital sign checks in patients who underwent the SPV CDS intervention, and a corresponding higher sleep opportunity per night in those who received the intervention. Importantly, this reduction in nighttime vital sign checks did not cause a higher risk of clinical decompensation as measured by ICU transfers, rapid response calls, or code blue alarms. Thus, the results demonstrated the feasibility of using a real-time, patient data-driven CDS tool to augment physician judgment in managing sleep disruption, an important hospital-associated stressor and a common hazard of hospitalization in older patients.
Delirium is a common clinical problem in hospitalized older patients that is associated with prolonged hospitalization, functional and cognitive decline, institutionalization, death, and increased health care costs.5 Despite a potential benefit of SPV CDS intervention in reducing vital sign checks and increasing sleep opportunity, this intervention did not reduce the incidence of delirium in hospitalized patients. This finding is not surprising given that delirium has a multifactorial etiology (eg, metabolic derangements, infections, medication side effects and drug toxicity, hospital environment). A small modification in nighttime vital sign checks and sleep opportunity may have limited impact on optimizing sleep quality and does not address other risk factors for delirium. As such, a multicomponent nonpharmacologic approach that includes sleep enhancement, early mobilization, feeding assistance, fluid repletion, infection prevention, and other interventions should guide delirium prevention in the hospital setting. The SPV CDS intervention may play a role in the delivery of a multifaceted, nonpharmacologic delirium prevention intervention in high-risk individuals.
Sleep disruption is one of the multiple hazards of hospitalization frequently experience by hospitalized older patients. Other hazards, or hospital-associated stressors, include mobility restriction (eg, physical restraints such as urinary catheters and intravenous lines, bed elevation and rails), malnourishment and dehydration (eg, frequent use of no-food-by-mouth order, lack of easy access to hydration), and pain (eg, poor pain control). Extended exposures to these stressors may lead to a maladaptive state called allostatic overload that transiently increases vulnerability to post-hospitalization adverse events, including emergency department use, hospital readmission, or death (ie, post-hospital syndrome).6 Thus, the optimization of sleep during hospitalization in vulnerable patients may have benefits that extend beyond delirium prevention. It is perceivable that a CDS tool embedded in EHR, powered by a real-time prediction algorithm of patient data, may be applied to reduce some of these hazards of hospitalization in addition to improving sleep opportunity.
Applications for Clinical Practice
Findings from the current study indicate that a CDS tool embedded in EHR that utilizes a real-time prediction algorithm of patient data may help to safely improve sleep opportunity in hospitalized patients. The participants in the current study were relatively young (53 [15] years). Given that age is a risk factor for delirium, the effects of this intervention on delirium prevention in the most susceptible population (ie, those over the age of 65) remain unknown and further investigation is warranted. Additional studies are needed to determine whether this approach yields similar results in geriatric patients and improves clinical outcomes.
—Fred Ko, MD
1. Institute of Medicine (US) Committee on Sleep Medicine and Research. Sleep Disorders and Sleep Deprivation: An Unmet Public Health Problem. Colten HR, Altevogt BM, editors. National Academies Press (US); 2006.
2. Pilkington S. Causes and consequences of sleep deprivation in hospitalised patients. Nurs Stand. 2013;27(49):350-342. doi:10.7748/ns2013.08.27.49.35.e7649
3. Stewart NH, Arora VM. Sleep in hospitalized older adults. Sleep Med Clin. 2018;13(1):127-135. doi:10.1016/j.jsmc.2017.09.012
4. Altman MT, Knauert MP, Pisani MA. Sleep disturbance after hospitalization and critical illness: a systematic review. Ann Am Thorac Soc. 2017;14(9):1457-1468. doi:10.1513/AnnalsATS.201702-148SR
5. Oh ES, Fong TG, Hshieh TT, Inouye SK. Delirium in older persons: advances in diagnosis and treatment. JAMA. 2017;318(12):1161-1174. doi:10.1001/jama.2017.12067
6. Goldwater DS, Dharmarajan K, McEwan BS, Krumholz HM. Is posthospital syndrome a result of hospitalization-induced allostatic overload? J Hosp Med. 2018;13(5). doi:10.12788/jhm.2986