User login
Rethinking your journey to work every day
Burnout is seldom the result of a single factor. It is more often a tragic case of death by a thousand cuts: a balky user-unfriendly electronic medical record system, administrative pressure to see more patients and the resulting frustration of not being able to provide the care you feel they deserve, an overemphasis on documentation or you won’t get paid, the dark cloud of malpractice always overhead, and of course the difficult balance between family responsibilities and work. It often boils down to feeling that there aren’t enough hours in the day to get everything done and still have time to recharge your physical and psychological batteries.

A recent report in the Harvard Business School newsletter, Working Knowledge (“Commuting Hurts Productivity and Your Best Talent Suffers Most.” Lane Lambert. 2021 Mar 30) describes an interesting study by Andy Wu, assistant professor of business administration, in which he discovered that, for every 10 kilometers of commuting distance, there was a decrease in the productivity of high-tech inventors as measured by the number of patents registered by their companies. The quality of their inventions declined even more (7%) for each additional 10 kilometers of commute.
You might question the relevance of these findings with your work in an outpatient clinic, but a conscientious physician is also an inventor and a creator. Every patient, even those with what sounds like a routine complaint, presents a novel collection of management challenges. The best physicians treat their profession as an art and must be invent solutions on the fly.
There is abundant evidence that commuting also can have a negative effect on the physical and mental health of workers. (“The astonishing human potential wasted on commutes.” The Washington Post .Christopher Ingraham. 2016 Feb 25). Watching my father walk into the house after an hour-long train ride out of the city and listening to him grumble created an image that influenced every decision I made about where my wife and I would live and work.
Did I benefit from the luxury of growing up in a small suburban community? Of course I did and I shall be forever grateful for the sacrifice my father made to allow that to happen. But, I promised myself that, while I would make sacrifices for my family, a long or unpleasant commute was not going to be on that list. For a few years I tolerated a 10- to 12-minute car commute (three stoplights) but asked to dissolve the partnership because even that 9-mile ride was too much for me and instead spent the bulk of my 40-year career a 10-minute bike ride from my office and the two hospitals. It meant we didn’t have a view of the ocean or a gentleman’s farm but we had an extra hour together as a family and I arrived at work and at home happy.
The pandemic has been a wake-up call for many of the fortunate folks who have found that they can work from home, eliminating what may have been a time-gobbling commute that was creating more stress than they may have realized. Even if telemedicine continues to maintain some postpandemic presence, I suspect that most physicians will continue to be faced with the challenge of traveling to an office or hospital.
If work is losing some of its luster and/or you are arriving home grumpy from a long day in the office, it is easy to blame an insensitive office administrator or the clunky electronic medical record system ... they deserve it. But, it may be the journey and not just the destination that is the contributing to the problem. I realize that rethinking the decision about where one lives can be painful and the options may be limited. However, I hope that at least some of you can rethink the role your journey is playing in your life.
Dr. Wilkoff practiced primary care pediatrics in Brunswick, Maine, for nearly 40 years. He has authored several books on behavioral pediatrics, including “How to Say No to Your Toddler.” Other than a Littman stethoscope he accepted as a first-year medical student in 1966, Dr. Wilkoff reports having nothing to disclose. Email him at pdnews@mdedge.com.
Burnout is seldom the result of a single factor. It is more often a tragic case of death by a thousand cuts: a balky user-unfriendly electronic medical record system, administrative pressure to see more patients and the resulting frustration of not being able to provide the care you feel they deserve, an overemphasis on documentation or you won’t get paid, the dark cloud of malpractice always overhead, and of course the difficult balance between family responsibilities and work. It often boils down to feeling that there aren’t enough hours in the day to get everything done and still have time to recharge your physical and psychological batteries.
A recent report in the Harvard Business School newsletter, Working Knowledge (“Commuting Hurts Productivity and Your Best Talent Suffers Most.” Lane Lambert. 2021 Mar 30) describes an interesting study by Andy Wu, assistant professor of business administration, in which he discovered that, for every 10 kilometers of commuting distance, there was a decrease in the productivity of high-tech inventors as measured by the number of patents registered by their companies. The quality of their inventions declined even more (7%) for each additional 10 kilometers of commute.
You might question the relevance of these findings with your work in an outpatient clinic, but a conscientious physician is also an inventor and a creator. Every patient, even those with what sounds like a routine complaint, presents a novel collection of management challenges. The best physicians treat their profession as an art and must be invent solutions on the fly.
There is abundant evidence that commuting also can have a negative effect on the physical and mental health of workers. (“The astonishing human potential wasted on commutes.” The Washington Post .Christopher Ingraham. 2016 Feb 25). Watching my father walk into the house after an hour-long train ride out of the city and listening to him grumble created an image that influenced every decision I made about where my wife and I would live and work.
Did I benefit from the luxury of growing up in a small suburban community? Of course I did and I shall be forever grateful for the sacrifice my father made to allow that to happen. But, I promised myself that, while I would make sacrifices for my family, a long or unpleasant commute was not going to be on that list. For a few years I tolerated a 10- to 12-minute car commute (three stoplights) but asked to dissolve the partnership because even that 9-mile ride was too much for me and instead spent the bulk of my 40-year career a 10-minute bike ride from my office and the two hospitals. It meant we didn’t have a view of the ocean or a gentleman’s farm but we had an extra hour together as a family and I arrived at work and at home happy.
The pandemic has been a wake-up call for many of the fortunate folks who have found that they can work from home, eliminating what may have been a time-gobbling commute that was creating more stress than they may have realized. Even if telemedicine continues to maintain some postpandemic presence, I suspect that most physicians will continue to be faced with the challenge of traveling to an office or hospital.
If work is losing some of its luster and/or you are arriving home grumpy from a long day in the office, it is easy to blame an insensitive office administrator or the clunky electronic medical record system ... they deserve it. But, it may be the journey and not just the destination that is the contributing to the problem. I realize that rethinking the decision about where one lives can be painful and the options may be limited. However, I hope that at least some of you can rethink the role your journey is playing in your life.
Dr. Wilkoff practiced primary care pediatrics in Brunswick, Maine, for nearly 40 years. He has authored several books on behavioral pediatrics, including “How to Say No to Your Toddler.” Other than a Littman stethoscope he accepted as a first-year medical student in 1966, Dr. Wilkoff reports having nothing to disclose. Email him at pdnews@mdedge.com.
Sealing the envelope
Mike died last week.
He was a long-retired doc, in his mid-90s. One of my favorite patients to just chat with about nothing in particular. I learned more from him about restoring old grandfather clocks than I ever dreamed I’d know.
After receiving the sad news, I sat down, as I often do, to write a letter to his family. After 23 years I have a pretty standard idea of what I want to say, but it still always takes some thought.
Sealing the envelopes on these letters always seems to be more than just paperwork. There’s a symbolism to it, that I’m closing out my relationship, sometimes of 10-20 years, with the person involved.
Some patients become friends after a time. It’s a matter of chemistry. I don’t socialize with them outside my office, but still enjoy seeing them and talking about nonmedical stuff in the space around clinical questions and answers. They’re the ones it’s hardest to say goodbye to.
I’ll miss my 2-3 visits a year with Mike. We swapped medical war stories, family anecdotes, and the occasional tip about clock restoration that I’ll probably never use (but who knows, he didn’t start until after he retired).
Closing the envelope comes with the realization that I won’t be seeing him again. I don’t go to patient funerals, as I believe those are for families and close friends, and so writing the letter is the closest I’ll get to saying goodbye.
Medicine, and how we practice, is focused on what we do for the patient – which is what it should be.
But lost in the shuffle sometimes is realizing what the patient does for us. That’s also important, but harder to quantify. And sometimes we don’t realize it until we seal the envelope.
Dr. Block has a solo neurology practice in Scottsdale, Ariz.
Garbage out: How much trash does a Mohs surgery practice produce?
left behind after surgical procedures. Their findings: Just two physicians – a surgeon and a surgical fellow – manage to produce nearly a ton of noncontaminated surgical waste annually even though they only see patients twice a week. 
“While our emissions as Mohs surgeons are relatively small compared to other types of surgeries, we still emit a notable amount of greenhouse gases compared to nonmedical fields. Mohs surgeons tend to produce the most noncontaminated waste versus other categories, and that’s the category that could be most recyclable,” said Mohs surgeon Simon S. Yoo, MD, of Northwestern University, Chicago, who presented the results at the annual meeting of the American College of Mohs Surgery.
Dr. Yoo, who spoke in an interview, said the coronavirus pandemic spurred the waste analysis. “In the past year, there seemed to be many questions as to the environmental causes and impacts of the pandemic,” he said. “We decided to investigate the environmental impact of Mohs surgery.”
He and surgical fellow Alvin Li, MD, analyzed all waste produced by their clinic over a 3-week period when 106 procedures were performed. They discovered that the surgeries produced 25.8 kg of biohazardous waste (29%), 2.2 kg of packaging waste (3%), 56.4 kg of noncontaminated waste (63%), and 7.5 kg of sharps waste (8%).
“The majority of the waste we produced was noncontaminated and possibly recyclable,” Dr. Yoo said. “However, most of this waste and its packaging did not have clear recycling instructions and presented a significant barrier to recycling by our staff.”
The study authors extrapolated the waste amount to annual totals of 413.5 kg of biohazardous waste, 34.9 kg of packaging waste, 902.3 kg of noncontaminated waste, and 119.9 kg of sharps waste. That adds up to 1,471 kg. The total of noncontaminated waste is the equivalent of nearly 2,000 pounds – a ton.
Dr. Yoo and Dr. Li estimate that the waste produced annual emissions equal to 6.5 metric tons of carbon dioxide equivalent. They estimate that the amount of emissions produced by Mohs surgeons nationally each year is 7,592 metric tons of carbon dioxide equivalent, equal to emissions produced by 19 million miles of passenger automobile travel.
Still, Dr. Yoo said, Mohs surgeries appear to produce fewer emissions than some other operations. “We estimate that an individual Mohs procedure generates around 10 kg of carbon dioxide equivalent whereas a single hysterectomy generates about 380 kg; much of this is due to the use of volatile anesthetics.”
Environmental protection advocate Mary Maloney, MD, professor of medicine and director of dermatologic surgery at the University of Massachusetts, Worcester, urged colleagues to launch a similar waste-weighing project in their own clinics. “I challenge dermatologists to take a bag of your daily plastic waste and weigh it,” she said. “We’ll all be astounded by how much we throw away each day. Until you do that experiment yourself, you’ll have a hard time getting your arms around how much plastic we’re using.”
Dr. Maloney, a member of the American Academy of Dermatology Expert Resource Group for Climate Change and Environmental Issues, urged colleagues to consider strategies to reduce plastic use specifically. “Look at everything you use and see if there’s a nonplastic equivalent,” she said. Even reducing the use of plastic writing pens can make a difference, she said, as can cutting back on syringes and revising procedures so gloves don’t have to be changed as often.
No study funding was reported. Dr. Yoo and Dr. Maloney report no disclosures.
left behind after surgical procedures. Their findings: Just two physicians – a surgeon and a surgical fellow – manage to produce nearly a ton of noncontaminated surgical waste annually even though they only see patients twice a week.
“While our emissions as Mohs surgeons are relatively small compared to other types of surgeries, we still emit a notable amount of greenhouse gases compared to nonmedical fields. Mohs surgeons tend to produce the most noncontaminated waste versus other categories, and that’s the category that could be most recyclable,” said Mohs surgeon Simon S. Yoo, MD, of Northwestern University, Chicago, who presented the results at the annual meeting of the American College of Mohs Surgery.
Dr. Yoo, who spoke in an interview, said the coronavirus pandemic spurred the waste analysis. “In the past year, there seemed to be many questions as to the environmental causes and impacts of the pandemic,” he said. “We decided to investigate the environmental impact of Mohs surgery.”
He and surgical fellow Alvin Li, MD, analyzed all waste produced by their clinic over a 3-week period when 106 procedures were performed. They discovered that the surgeries produced 25.8 kg of biohazardous waste (29%), 2.2 kg of packaging waste (3%), 56.4 kg of noncontaminated waste (63%), and 7.5 kg of sharps waste (8%).
“The majority of the waste we produced was noncontaminated and possibly recyclable,” Dr. Yoo said. “However, most of this waste and its packaging did not have clear recycling instructions and presented a significant barrier to recycling by our staff.”
The study authors extrapolated the waste amount to annual totals of 413.5 kg of biohazardous waste, 34.9 kg of packaging waste, 902.3 kg of noncontaminated waste, and 119.9 kg of sharps waste. That adds up to 1,471 kg. The total of noncontaminated waste is the equivalent of nearly 2,000 pounds – a ton.
Dr. Yoo and Dr. Li estimate that the waste produced annual emissions equal to 6.5 metric tons of carbon dioxide equivalent. They estimate that the amount of emissions produced by Mohs surgeons nationally each year is 7,592 metric tons of carbon dioxide equivalent, equal to emissions produced by 19 million miles of passenger automobile travel.
Still, Dr. Yoo said, Mohs surgeries appear to produce fewer emissions than some other operations. “We estimate that an individual Mohs procedure generates around 10 kg of carbon dioxide equivalent whereas a single hysterectomy generates about 380 kg; much of this is due to the use of volatile anesthetics.”
Environmental protection advocate Mary Maloney, MD, professor of medicine and director of dermatologic surgery at the University of Massachusetts, Worcester, urged colleagues to launch a similar waste-weighing project in their own clinics. “I challenge dermatologists to take a bag of your daily plastic waste and weigh it,” she said. “We’ll all be astounded by how much we throw away each day. Until you do that experiment yourself, you’ll have a hard time getting your arms around how much plastic we’re using.”
Dr. Maloney, a member of the American Academy of Dermatology Expert Resource Group for Climate Change and Environmental Issues, urged colleagues to consider strategies to reduce plastic use specifically. “Look at everything you use and see if there’s a nonplastic equivalent,” she said. Even reducing the use of plastic writing pens can make a difference, she said, as can cutting back on syringes and revising procedures so gloves don’t have to be changed as often.
No study funding was reported. Dr. Yoo and Dr. Maloney report no disclosures.
FROM THE ACMS ANNUAL MEETING
Dermatologists took 2020’s income drop in stride
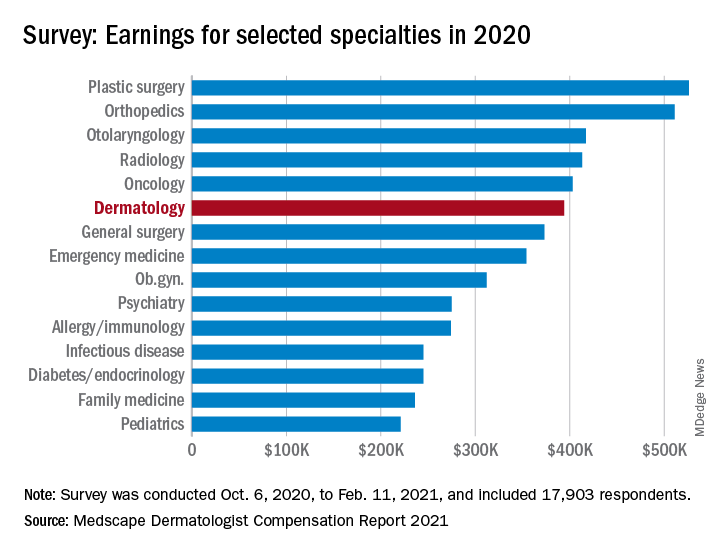
The numbers look like this: Average income was $394,000 in 2020, compared with $411,000 in 2019 – a drop of 4.1% – but 67% of dermatologists said they felt fairly compensated in 2020, compared with 65% in 2019, Medscape said in its 2021 Dermatologist Compensation Report. Only 3 of the 29 participating specialties had a more favorable reaction: oncology (79%), psychiatry (69%), and plastic surgery (68%).
“Most dermatologists who saw a drop in income cited COVID-19–related issues, such as job loss, fewer hours, and fewer patients,” Keith L. Martin wrote in the annual report, while also noting that 45% of dermatologist respondents “said that the pandemic did not cause them financial or practice-related harm.”
For the dermatologists who did see such negative effects, just over half (54%) said that they expect income to return to pre–COVID-19 levels in the next year, while 31% believe it will take 2-3 years and 12% said that their income would never return to normal. For all specialists included in the survey, the corresponding numbers were 42%, 41%, and 12%, with primary care physicians coming in at 39%, 43%, and 10%, the report said.
Among all participating specialties, plastic surgeons reported the highest average earnings at $526,000, with orthopedists ($511,000) and cardiologists ($459,000) next. Pediatricians had not just the lowest average income ($221,000) for 2020, but also the largest decline in patients seen per week (18%), according to the results of the survey, which was conducted from Oct. 6, 2020, to Feb. 11, 2021, and involved 17,903 physicians.
Dermatologists also experienced a larger-than-average decline (16%) in patient traffic – only the pediatricians had a larger drop – as their weekly patient count fell from 141 before the pandemic to the current 119. Despite that drop, though, average hours worked per week remained at 45, as time is now being spent on office safety protocols and other issues involving COVID-19, Medscape pointed out.
Dermatologists also spent more time on paperwork and administration in 2020 than in 2019: 14.6 hours per week versus 13.2 hours. Their 2020 average, however, was still lower than that of all physicians, 16.3 hours, and much lower than that of the infectious disease physicians, who topped the survey with an average of 24.2 hours per week, the Medscape data show.
One area where dermatologists did lead the survey was in their commitment to their specialty: 96% said they would choose dermatology again if given the chance, which was equaled by orthopedics and oncology, Medscape said.
New Editor in Chief: Ebrahim Barkoudah, MD, MPH
With another long winter officially in the rearview mirror and spring sunshine displaying new signs of life outdoors, I am excited to share some of the changes happening inside the offices of the Journal of Clinical Outcomes Management (JCOM). It is my pleasure to introduce Ebrahim Barkoudah, MD, MPH, as the journal’s new physician Editor in Chief. Dr. Barkoudah’s extensive experience in education and his work to improve patient outcomes will be assets to JCOM.
Specializing in both internal medicine and hospital medicine, Dr. Barkoudah is the Associate Director of the Hospital Medicine Unit and a Medical Director in the Department of Medicine at Brigham and Women’s Hospital in Boston. He is also Assistant Professor of Medicine at Harvard Medical School, where he led the school’s international education efforts.
Dr. Barkoudah serves patients with a range of complex clinical disorders, managing their care and seeking innovative treatment options. His research interest is in health care outcomes as well as clinical trials of therapeutic interventions. Dr. Barkoudah also serves on numerous clinical innovation committees at Brigham Health and national task forces.
Dr. Barkoudah is an active member of several professional societies including the American College of Physicians, Society of Hospital Medicine, American Heart Association, Massachusetts Medical Society, among others. He was the Institutional Administration Fellow of the Safety and Quality Fellowship Program at the Institution for Healthcare Improvement.
On behalf of the JCOM Editorial Review Board, I want to extend a special thank you to outgoing editor Lori Tishler, MD, MPH. Dr. Tishler’s impact on the journal cannot be overstated, and we are indebted to the time and expertise she shared with the journal during her tenure.
—Eric Seger
Impact of Hospitalist Programs on Perceived Care Quality, Interprofessional Collaboration, and Communication: Lessons from Implementation of 3 Hospital Medicine Programs in Canada
From the Fraser Health Authority, Surrey, BC, Canada (Drs. Yousefi and Paletta), and Catalyst Consulting Inc., Vancouver, BC, Canada (Elayne McIvor).
Objective: Despite the ongoing growth in the number of hospitalist programs in Canada, their impact on the quality of interprofessional communication, teamwork, and staff satisfaction is not well known. This study aimed to evaluate perceptions of frontline care providers and hospital managers about the impact of the implementation of 3 new hospitalist services on care quality, teamwork, and interprofessional communication.
Design: We used an online survey and semistructured interviews to evaluate respondents’ views on quality of interprofessional communication and collaboration, impact of the new services on quality of care, and overall staff satisfaction with the new inpatient care model.
Setting: Integrated Regional Health Authority in British Columbia, Canada.
Participants: Participants included hospital administrators, frontline care providers (across a range of professions), and hospital and community-based physicians.
Results: The majority of respondents reported high levels of satisfaction with their new hospital medicine services. They identified improvements in interprofessional collaboration and communication between hospitalists and other professionals, which were attributed to enhanced onsite presence of physicians. They also perceived improvements in quality of care and efficiency. On the other hand, they identified a number of challenges with the change process, and raised concerns about the impact of patient handoffs on care quality and efficiency.
Conclusion: Across 3 very different acute care settings, the implementation of a hospitalist service was widely perceived to have resulted in improved teamwork, quality of care, and interprofessional communication.
Keywords: hospital medicine; hospitalist; teamwork; interprofessional collaboration.
Over the past 2 decades, the hospitalist model has become prevalent in Canada and internationally.1 Hospitalist care has been associated with improvements in efficiency and quality of care.2-6 However, less is known about its impact on the quality of interprofessional communication, teamwork, and staff satisfaction. In a 2012 study of a specialized orthopedic facility in the Greater Toronto Area (GTA), Ontario, Webster et al found a pervasive perception among interviewees that the addition of a hospitalist resulted in improved patient safety, expedited transfers, enhanced communication with Primary Care Providers (PCPs), and better continuity of care.7 They also identified enhanced collaboration among providers since the addition of the hospitalist to the care team. In another study of 5 community hospitals in the GTA, Conn et al8 found that staff on General Internal Medicine wards where hospitalists worked described superior interprofessional collaboration, deeper interpersonal relationships between physicians and other care team members, and a higher sense of “team-based care.”
Fraser Health Authority (FH) is an integrated regional health system with one of the largest regional Hospital Medicine (HM) networks in Canada.9 Over the past 2 decades, FH has implemented a number of HM services in its acute care facilities across a range of small and large community and academic hospitals. More recently, 3 hospitalist services were implemented over a 2-year period: new HM services in a tertiary referral center (Site A, July 2016) and a small community hospital (Site B, December 2016), and reintroduction of a hospitalist service in a medium-sized community hospital (Site C, January 2017). This provided a unique opportunity to assess the impact of the implementation of the hospitalist model across a range of facilities. The main objectives of this evaluation were to understand the level of physician, nursing, allied staff, and hospital administration satisfaction with the new hospitalist model, as well as the perceived impact of the service on efficiency and quality of care. As such, FH engaged an external consultant (EM) to conduct a comprehensive evaluation of the introduction of its latest HM services.
Methods
Setting
Hospital medicine services are currently available in 10 of 12 acute care facilities within the FH system. The 3 sites described in this evaluation constitute the most recent sites where a hospitalist service was implemented.
Site A is a 272-bed tertiary referral center situated in a rapidly growing community. At the time of our evaluation, 21 Full Time Equivalent (FTE) hospitalists cared for an average of 126 patients, which constituted the majority of adult medical patients. Each day, 8 individuals rounded on admitted patients (average individual census: 16) with another person providing in-house, evening, and overnight coverage. An additional flexible shift during the early afternoon helped with Emergency Department (ED) admissions.
Site B is small, 45-bed community hospital in a semi-rural community. The hospitalist service began in December 2016, with 4 FTE hospitalists caring for an average of 28 patients daily. This constituted 2 hospitalists rounding daily on admitted patients, with on-call coverage provided from home.
Site C is a 188-bed community hospital with a hospitalist service initially introduced in 2005. In 2016, the program was disbanded and the site moved back to a primarily community-based model, in which family physicians in the community were invited to assume the care of hospitalized patients. However, the hospitalist program had to be reintroduced in January 2017 due to poor uptake among PCPs in the community. At the time of evaluation, 19 FTE hospitalists (with 7 hospitalists working daily) provided most responsible physician care to a daily census of 116 patients (average individual census: 16). The program also covered ED admissions in-house until midnight, with overnight call provided from home.
Approach
We adopted a utilization-focused evaluation approach to guide our investigation. In this approach, the assessment is deliberately planned and conducted in a way that it maximizes the likelihood that findings would be used by the organization to inform learning, adaptations, and decision-making.11 To enable this, the evaluator identified the primary intended recipients and engaged them at the start of the evaluation process to understand the main intended uses of the project. Moreover, the evaluator ensured that these intended uses of the evaluation guided all other decisions made throughout the process.
We collected data using an online survey of the staff at the 3 facilities, complemented by a series of semistructured qualitative interviews with FH administrators and frontline providers.
Online survey
We conducted an open online survey of a broad range of stakeholders who worked in the 3 facilities. To develop the questionnaire, we searched our department’s archives for previous surveys conducted from 2001 to 2005. We also interviewed the regional HM program management team to identify priority areas and reached out to the local leadership of the 3 acute care facilities for their input and support of the project. We refined the survey through several iterations, seeking input from experts in the FH Department of Evaluation and Research. The final questionnaire contained 10 items, including a mix of closed- and open-ended questions (Appendix A).
To reach the target audience, we collaborated with each hospital’s local leadership as well as the Divisions of Family Practice (DFP) that support local community PCPs in each hospital community.10 Existing email lists were compiled to create a master electronic survey distribution list. The initial invitation and 3 subsequent reminders were disseminated to the following target groups: hospital physicians (both hospitalists and nonhospitalists), PCPs, nursing and other allied professionals, administrators, and DFP leadership.
The survey consent form, background information, questions, and online platform (SimpleSurvey, Montreal, QC) were approved by FH’s Privacy Department. All respondents were required to provide their consent and able to withdraw at any time. Survey responses were kept anonymous and confidential, with results captured automatically into a spreadsheet by the survey platform. As an incentive for participation, respondents had the opportunity to win 1 of 3 $100 Visa gift cards. Personal contact information provided for the prize draw was collected in a separate survey that could not link back to respondents’ answers. The survey was trialed several times by the evaluation team to address any technical challenges before dissemination to the targeted participants.
Qualitative interviews
We conducted semistructured interviews with a purposive sample of FH administrators and frontline providers (Appendix B). The interview questions broadly mirrored the survey but allowed for more in-depth exploration of constructs. Interviewees were recruited through email invitations to selected senior and mid-level local and regional administrators, asking interviewees to refer our team to other contacts, and inviting survey respondents to voluntarily participate in a follow-up interview. One of the authors (EM), a Credentialed Evaluator, conducted all the one-time interviews either in-person at the individual participant’s workplace or by telephone. She did not have pre-existing relationships with any of the interviewees. Interviews were recorded and transcribed for analysis. Interviewees were required to consent to participate and understood that they could withdraw at any point. They were not offered incentives to participate. Interviews were carried out until thematic saturation was reached.
Analysis
A content analysis approach was employed for all qualitative data, which included open-ended responses from the online survey and interview transcripts. One of the authors (EM) conducted the analysis. The following steps were followed in the inductive content analysis process: repeated reading of the raw data, generation of initial thematic codes, organizing and sorting codes into categories (ie, main vs subcategories), coding of all data, quantifying codes, and interpreting themes. When responding to open-ended questions, respondents often provided multiple answers per question. Each of the respondents’ answers were coded. In alignment with the inductive nature of the analysis process, themes emerged organically from the data rather than the researchers using preconceived theories and categories to code the text. This was achieved by postponing the review of relevant literature on the topic until after the analysis was complete and using an external evaluation consultant (with no prior relationship to FH and limited theoretical knowledge of the topic matter) to analyze the data. Descriptive statistics were run on quantitative data in SPSS (v.24, IBM, Armonk, NY). For survey responses to be included in the analysis, the respondents needed to indicate which site they worked at and were required to answer at least 1 other survey question. One interviewee was excluded from the analysis since they were not familiar with the hospitalist model at their site.
Ethics approval
The evaluation protocol was reviewed by FH Department of Evaluation and Research and was deemed exempt from formal research ethics review.
Results
A total of 377 individuals responded to the online survey between January 8 and February 28, 2018 (response rate 14%). The distribution of respondents generally reflected the size of the respective acute care facilities. Compared to the overall sampled population, fewer nurses participated in the survey (45% vs 64%) while the rate of participation for Unit Clerks (14% vs 16%) and allied professionals (12% vs 16%) were similar.
")
Out of the 45 people approached for an interview, a total of 38 were conducted from January 3 to March 5, 2018 (response rate 84%). The interviews lasted an average of 42 minutes. Interviewees represented a range of administrative and health professional roles (Figure 1). Some interviewees held multiple positions.

Satisfaction with HM service
Across all sites, survey respondents reported high levels of satisfaction with their respective HM services and identified positive impacts on their job satisfaction (Figure 2). Almost all interviewees similarly expressed high satisfaction levels with their HM services (95%; n = 36).
")
Perceptions of HM service performance
Survey respondents rated the strength of hospitalists’ interprofessional communication and collaboration with other physicians and with care teams. Roughly two-thirds reported that overall hospitalist communication was “good” or “very good.” We also asked participants to rate the frequency at which hospitalists met best practice expectations related to interprofessional teamwork. Across all sites, similar proportions of respondents (23% to 39%) reported that these best practices were met “most of the time” or “always” (Figure 3). Survey questions also assessed perceptions of respondents about the quality and safety of care provided by hospitalists (Figure 4).
")
Perceptions of the impact of the HM service postimplementation
The majority of survey respondents reported improvements in the quality of communication, professional relationships, and coordination of inpatient care at transition points after the implementation of the HM service (Figure 5). This was also reflected in interviews, where some indicated that it was easier to communicate with hospitalists due to their on-site presence, accessibility, and 24/7 availability (n = 21). They also described improved collaboration within the care teams (n = 7), and easier communication with hospitalists because they were approachable, willing, and receptive (n = 4).
")
We also asked the survey respondents to assess the impact of the new hospitalist model on different dimensions of care quality, including patient satisfaction, patient experience, efficiency, and overall quality of care (Figure 6). Findings were comparable across these dimensions, with roughly 50-60% of respondents noting positive changes compared to before the implementation of the programs. However, most interviewees identified both positive and negative effects in these areas. Positive impacts included hospitalist on-site presence leading to better accessibility and timeliness of care (n = 5), hospitalists providing continuity to patients/families by working for weeklong rotations (n = 6), hospitalists being particularly skilled at managing complex clinical presentations (n = 2), and hospitalists being able to spend more time with patients (n = 2). On the other hand, some interviewees noted that patients and families did not like seeing multiple doctors due to frequent handoffs between hospitalists (n = 12). They also raised concerns that hospitalists did not know patients’ histories or had relationships with them, potentially leading to longer length of stay and unnecessary investigations (n = 8).
")
Site-to-site ratings of satisfaction and performance
Survey respondents’ satisfaction and performance ratings varied substantially site-to-site. Across all areas assessed, ratings were consistently highest at Site B (the smallest institution in our evaluation and the most recent addition to the HM network in the health authority). These differences were statistically significant across all survey questions asked.
Discussion
Findings from this study provide insight into the experiences of frontline health care professionals and administrators with the implementation of new HM services across a range of small to large acute care facilities. They indicate that the majority of respondents reported high levels of satisfaction with their hospitalist services. Most also indicated that the service had resulted in improvements compared to prior inpatient care models.
Over half of the survey respondents, and the majority of interviewees, reported a positive impact on interprofessional communication and collaboration. This was largely attributed to enhanced accessibility and availability of hospitalists:
- "Being on-site lends itself to better communication because they’re accessible. Hospitalists always answer the phone, but the general practitioners (GP) don’t always since they may be with other patients." (Dietician, Site A)
- "A big strength is that we have physician presence on the unit all day during scheduled hours, which makes us more accessible to nurses and more able to follow up on patients that we have concerns about." (Physician Leader, Site B)
However, the ratings dropped substantially when they were asked to assess adherence to specific best practices of such communication and collaboration, such as participation in daily check-ins or attendance at team care rounds (Figure 3). Interdisciplinary clinical rounds have been identified as a tool to improve the effectiveness of care teams.12 A number of elements have been identified as key components of effective rounds.13 Bedside rounds have also been found to enhance communication and teamwork.14,15 In our study, the discrepancy between overall high levels of satisfaction with hospitalists’ communication/collaboration despite low scores on participation in more concrete activities may illustrate the importance of informal and ad hoc opportunities for interactions between hospitalists and other care providers that result from the enhanced presence of hospitalists on care units.8 Outside of formal rounds, hospitalists have the ability to interact with other care providers throughout their shifts. Prior studies have shown that hospitalists spend a significant portion of their time communicating with other care team members throughout their workdays.16 At the same time, the amount of time spent on communication should be balanced against the need for provision of direct care at the bedside. Future research should aim to identify the right balance between these competing priorities, and to understand the nature and quality of the communication between various care providers.
We also aimed to understand the perceptions of study participants about the impact of the HM service on quality of care. Survey participants not only expressed reasonable satisfaction with various aspects of hospitalists’ performance, but also described a positive impact on care quality after the implementation of their new services. This was also reflected in the interviews:
- "The clinical knowledge of the new hospitalists is far better. Some are internal medicine trained, so they bring better knowledge and skills. I feel comfortable that they can take patients and manage them. I wasn’t always comfortable with doing that in the past." (Emergency Physician, Site C)
- "Hospitalists are really familiar with acute care and how it works. They’ve become more familiar with the discharge planning system and thus know more about the resources available. And even something as simple as knowing which forms to use." (Dietician, Site A)
It must be noted that these observations should ideally be corroborated through a robust before-after analysis of various quality measures. While such an analysis was beyond the scope of our current project, we have previously demonstrated that across our network (including the 3 sites included in our evaluation) hospitalist care is associated with lower mortality and readmission rates.4 Our findings appear to confirm previous suggestions that hospitalists’ dedicated focus on inpatient care may allow them to develop enhanced skills in the management of common conditions in the acute care setting17 which can be perceived to be of value to other hospital-based care providers.
The issue of frequent handover among hospitalists was the most commonly identified challenge by both survey respondents and interviewees:
- "They’re very reluctant to discharge patients if it’s their first day with the patient. Even if the previous hospitalist said they were ready for discharge, the new doc wants to run all of their own tests before they feel comfortable. Maybe it’s a trust issue between hospitalists when they hand patients over. It’s also being personally liable for patients if you discharge them." (Patient Care Coordinator, Site A)
- "Communication is an issue. There’s lots of turnover in hospitalists. Relationships were closer with GPs because we had so much more interaction with particular individuals." (Hospitalist Physician Leader, Site A)
It must be noted that we conducted our evaluation in a relatively short time span (within 2 years) after the 3 services were implemented. Developing trust among a large number of hospitalists newly recruited to these programs can take time and may be a factor that can explain the reluctance of some to discharge patients after handoffs. However, concerns about discontinuity of care inherent in the hospitalist model are not new.18,19 Better continuity has been associated with higher probability of patient discharges20 and improved outcomes.21 To address this challenge, the hospitalist community has focused on defining the core competencies associated with high quality handovers,22 and deliberate efforts to improve the quality of handoffs through quality improvement methodologies.23 Our study participants similarly identified these measures as potential solutions. Despite this, addressing hospitalist continuity of care remains a pressing challenge for the broader hospitalist community.24
Our evaluation has a number of methodological limitations. First, the survey response rate was only 14%, which raises questions about nonresponse bias and the representativeness of the findings to the larger population of interest. While the distribution of respondents was largely similar to the overall sampled population, a number of factors may have impacted our response rate. For example, we were only able to distribute our survey to health care providers’ institutional email addresses. Moreover, while we provided incentives for participation and sent out a number of reminders, we solely relied on one communication modality (ie, electronic communication) and did not utilize other methods (such as posters, reminder at meetings, in-person invitations). Second, while the survey included a number of open-ended questions, many of these responses were at times brief and difficult to interpret and were not included in the analysis. Third, all data collected were self-reported. For example, we could not corroborate comments about participation in interdisciplinary rounds by objective measures such as attendance records or direct observation. Self-report data is subjective in nature and is vulnerable to a range of biases, such as social desirability bias.25 Finally, patient satisfaction and experience with hospitalist care were not assessed by patients themselves. Ideally, standardized cross-site indicators should validate our patient-related results.
As mentioned above, hospitalist performance ratings varied substantially from site-to-site and were consistently higher at Site B (a small community hospital in a semi-rural area), followed by Site C (a medium-sized community hospital) and Site A (a tertiary referral center). The variability in program ratings and perceived hospitalist impacts between sites could be due to a variety of factors, such as the degree of change between the past and current models at each site, differences in hospitalist hiring processes, hospital size and culture, and differences in service design and operations. It may also be related to the timing of the introduction of the HM service, as Site B was the most recent site where the service was established. As such, there may be an element of recall bias behind the observed discrepancies. This highlights the importance of local context on respondent perceptions and suggests that our results may not be generalizable to other institutions with different attributes and characteristics.
Conclusion
Findings from this study have demonstrated that the recent hospitalist services in our health system have improved overall levels of interprofessional communication and teamwork, as well as perceptions of care quality among the majority of participants who reported high levels of satisfaction with their programs. Our findings further highlight the issue of frequent handovers among hospitalists as a pressing and ongoing challenge.
Corresponding Author: Vandad Yousefi, MD, CCFP, Past Regional Department Head – Hospital Medicine, Fraser Health Authority, Central City Tower, Suite 400, 13450 – 102nd Ave, Surrey, BC V3T 0H1; vandad.yousefi@fraserhealth.ca.
Financial disclosures: This project was funded by the Fraser Health Authority, which provided the funding for hiring of the external consultant to design, implement, and analyze the results of the evaluation program in collaboration with the Regional Hospitalist Program at Fraser Health.
1. Yousefi V, Wilton D. Re-designing Hospital Care: Learning from the Experience of Hospital Medicine in Canada. Journal of Global Health Care Systems. 2011;1(3).
2. White HL. Assessing the Prevalence, Penetration and Performance of Hospital Physicians in Ontario: Implications for the Quality and Efficiency of Inpatient Care. Doctoral Thesis; 2016.
3. Yousefi V, Chong CA. Does implementation of a hospitalist program in a Canadian community hospital improve measures of quality of care and utilization? An observational comparative analysis of hospitalists vs. traditional care providers. BMC Health Serv Res. 2013;13:204.
4. Yousefi V, Hejazi S, Lam A. Impact of Hospitalists on Care Outcomes in a Large Integrated Health System in British Columbia. Journal of Clinical Outcomes Management. 2020;27(2):59-72.
5. Salim SA, Elmaraezy A, Pamarthy A, et al. Impact of hospitalists on the efficiency of inpatient care and patient satisfaction: a systematic review and meta-analysis. J Community Hosp Intern Med Perspect. 2019;9(2):121-134.
6. Peterson MC. A systematic review of outcomes and quality measures in adult patients cared for by hospitalists vs nonhospitalists. Mayo Clinic Proc. 2009;84(3):248-254.
7. Webster F, Bremner S, Jackson M, et al. The impact of a hospitalist on role boundaries in an orthopedic environment. J Multidiscip Healthc. 2012;5:249-256.
8. Gotlib Conn L, Reeves S, Dainty K, et al. Interprofessional communication with hospitalist and consultant physicians in general internal medicine: a qualitative study. BMC Health Serv Res. 2012; 12:437.
9. About Fraser Health. Fraser Health Authority. Updated 2018. Accessed January 30, 2019. https://www.fraserhealth.ca/about-us/about-fraser-health#.XFJrl9JKiUk
10. Divisions of Family Practice. Accessed May 2, 2020. https://www.divisionsbc.ca/provincial/about-us
11. Patton MQ. Essentials of Utilization-Focused Evaluation. 2012. Sage Publications, Inc; 2011.
12. Buljac-Samardzic M, Doekhie KD, van Wijngaarden JDH. Interventions to improve team effectiveness within health care: a systematic review of the past decade. Hum Resour Health. 2020;18(1):2.
13. Verhaegh KJ, Seller-Boersma A, Simons R, et al. An exploratory study of healthcare professionals’ perceptions of interprofessional communication and collaboration. J Interprof Care. 2017;31(3):397-400.
14. O’Leary KJ, Johnson JK, Manojlovich M, et al. Redesigning systems to improve teamwork and quality for hospitalized patients (RESET): study protocol evaluating the effect of mentored implementation to redesign clinical microsystems. BMC Health Serv Res. 2019;19(1):293.
15. Stein J, Payne C, Methvin A, et al. Reorganizing a hospital ward as an accountable care unit. J Hosp Med. 2015;10(1):36-40.
16. Yousefi V. How Canadian hospitalists spend their time - A work-sampling study within a hospital medicine program in Ontario. Journal of Clinical Outcomes Management. 2011;18(4):159.
17. Marinella MA: Hospitalists-Where They Came from, Who They Are, and What They Do. Hosp Physician. 2002;38(5):32-36.
18. Wachter RM. An introduction to the hospitalist model. Ann Intern Med. 1999;130(4 Pt 2):338-342.
19. Wachter RM, Goldman L. The hospitalist movement 5 years later. JAMA. 2002;287(4):487-494.
20. van Walraven C. The Influence of Inpatient Physician Continuity on Hospital Discharge. J Gen Intern Med. 2019;34(9):1709-1714.
21. Goodwin JS, Li S, Kuo YF. Association of the Work Schedules of Hospitalists With Patient Outcomes of Hospitalization. JAMA Intern Med. 2020;180(2):215-222.
22. Nichani S, Fitterman N, Lukela M, Crocker J, the Society of Hospital Medicine, Patient Handoff. 2017 Hospital Medicine Revised Core Competencies. J Hosp Med. 2017;4:S74.
23. Lo HY, Mullan PC, Lye C, et al. A QI initiative: implementing a patient handoff checklist for pediatric hospitalist attendings. BMJ Qual Improv Rep. 2016;5(1):u212920.w5661.
24. Wachter RM, Goldman L. Zero to 50,000 - The 20th Anniversary of the Hospitalist. N Engl J Med. 2016;375(11):1009-1011.
25. Grimm, P. Social Desirability Bias. In: Sheth J, Malhotra N, eds. Wiley International Encyclopedia of Marketing. John Wiley & Sons, Ltd; 2010.
From the Fraser Health Authority, Surrey, BC, Canada (Drs. Yousefi and Paletta), and Catalyst Consulting Inc., Vancouver, BC, Canada (Elayne McIvor).
Objective: Despite the ongoing growth in the number of hospitalist programs in Canada, their impact on the quality of interprofessional communication, teamwork, and staff satisfaction is not well known. This study aimed to evaluate perceptions of frontline care providers and hospital managers about the impact of the implementation of 3 new hospitalist services on care quality, teamwork, and interprofessional communication.
Design: We used an online survey and semistructured interviews to evaluate respondents’ views on quality of interprofessional communication and collaboration, impact of the new services on quality of care, and overall staff satisfaction with the new inpatient care model.
Setting: Integrated Regional Health Authority in British Columbia, Canada.
Participants: Participants included hospital administrators, frontline care providers (across a range of professions), and hospital and community-based physicians.
Results: The majority of respondents reported high levels of satisfaction with their new hospital medicine services. They identified improvements in interprofessional collaboration and communication between hospitalists and other professionals, which were attributed to enhanced onsite presence of physicians. They also perceived improvements in quality of care and efficiency. On the other hand, they identified a number of challenges with the change process, and raised concerns about the impact of patient handoffs on care quality and efficiency.
Conclusion: Across 3 very different acute care settings, the implementation of a hospitalist service was widely perceived to have resulted in improved teamwork, quality of care, and interprofessional communication.
Keywords: hospital medicine; hospitalist; teamwork; interprofessional collaboration.
Over the past 2 decades, the hospitalist model has become prevalent in Canada and internationally.1 Hospitalist care has been associated with improvements in efficiency and quality of care.2-6 However, less is known about its impact on the quality of interprofessional communication, teamwork, and staff satisfaction. In a 2012 study of a specialized orthopedic facility in the Greater Toronto Area (GTA), Ontario, Webster et al found a pervasive perception among interviewees that the addition of a hospitalist resulted in improved patient safety, expedited transfers, enhanced communication with Primary Care Providers (PCPs), and better continuity of care.7 They also identified enhanced collaboration among providers since the addition of the hospitalist to the care team. In another study of 5 community hospitals in the GTA, Conn et al8 found that staff on General Internal Medicine wards where hospitalists worked described superior interprofessional collaboration, deeper interpersonal relationships between physicians and other care team members, and a higher sense of “team-based care.”
Fraser Health Authority (FH) is an integrated regional health system with one of the largest regional Hospital Medicine (HM) networks in Canada.9 Over the past 2 decades, FH has implemented a number of HM services in its acute care facilities across a range of small and large community and academic hospitals. More recently, 3 hospitalist services were implemented over a 2-year period: new HM services in a tertiary referral center (Site A, July 2016) and a small community hospital (Site B, December 2016), and reintroduction of a hospitalist service in a medium-sized community hospital (Site C, January 2017). This provided a unique opportunity to assess the impact of the implementation of the hospitalist model across a range of facilities. The main objectives of this evaluation were to understand the level of physician, nursing, allied staff, and hospital administration satisfaction with the new hospitalist model, as well as the perceived impact of the service on efficiency and quality of care. As such, FH engaged an external consultant (EM) to conduct a comprehensive evaluation of the introduction of its latest HM services.
Methods
Setting
Hospital medicine services are currently available in 10 of 12 acute care facilities within the FH system. The 3 sites described in this evaluation constitute the most recent sites where a hospitalist service was implemented.
Site A is a 272-bed tertiary referral center situated in a rapidly growing community. At the time of our evaluation, 21 Full Time Equivalent (FTE) hospitalists cared for an average of 126 patients, which constituted the majority of adult medical patients. Each day, 8 individuals rounded on admitted patients (average individual census: 16) with another person providing in-house, evening, and overnight coverage. An additional flexible shift during the early afternoon helped with Emergency Department (ED) admissions.
Site B is small, 45-bed community hospital in a semi-rural community. The hospitalist service began in December 2016, with 4 FTE hospitalists caring for an average of 28 patients daily. This constituted 2 hospitalists rounding daily on admitted patients, with on-call coverage provided from home.
Site C is a 188-bed community hospital with a hospitalist service initially introduced in 2005. In 2016, the program was disbanded and the site moved back to a primarily community-based model, in which family physicians in the community were invited to assume the care of hospitalized patients. However, the hospitalist program had to be reintroduced in January 2017 due to poor uptake among PCPs in the community. At the time of evaluation, 19 FTE hospitalists (with 7 hospitalists working daily) provided most responsible physician care to a daily census of 116 patients (average individual census: 16). The program also covered ED admissions in-house until midnight, with overnight call provided from home.
Approach
We adopted a utilization-focused evaluation approach to guide our investigation. In this approach, the assessment is deliberately planned and conducted in a way that it maximizes the likelihood that findings would be used by the organization to inform learning, adaptations, and decision-making.11 To enable this, the evaluator identified the primary intended recipients and engaged them at the start of the evaluation process to understand the main intended uses of the project. Moreover, the evaluator ensured that these intended uses of the evaluation guided all other decisions made throughout the process.
We collected data using an online survey of the staff at the 3 facilities, complemented by a series of semistructured qualitative interviews with FH administrators and frontline providers.
Online survey
We conducted an open online survey of a broad range of stakeholders who worked in the 3 facilities. To develop the questionnaire, we searched our department’s archives for previous surveys conducted from 2001 to 2005. We also interviewed the regional HM program management team to identify priority areas and reached out to the local leadership of the 3 acute care facilities for their input and support of the project. We refined the survey through several iterations, seeking input from experts in the FH Department of Evaluation and Research. The final questionnaire contained 10 items, including a mix of closed- and open-ended questions (Appendix A).
To reach the target audience, we collaborated with each hospital’s local leadership as well as the Divisions of Family Practice (DFP) that support local community PCPs in each hospital community.10 Existing email lists were compiled to create a master electronic survey distribution list. The initial invitation and 3 subsequent reminders were disseminated to the following target groups: hospital physicians (both hospitalists and nonhospitalists), PCPs, nursing and other allied professionals, administrators, and DFP leadership.
The survey consent form, background information, questions, and online platform (SimpleSurvey, Montreal, QC) were approved by FH’s Privacy Department. All respondents were required to provide their consent and able to withdraw at any time. Survey responses were kept anonymous and confidential, with results captured automatically into a spreadsheet by the survey platform. As an incentive for participation, respondents had the opportunity to win 1 of 3 $100 Visa gift cards. Personal contact information provided for the prize draw was collected in a separate survey that could not link back to respondents’ answers. The survey was trialed several times by the evaluation team to address any technical challenges before dissemination to the targeted participants.
Qualitative interviews
We conducted semistructured interviews with a purposive sample of FH administrators and frontline providers (Appendix B). The interview questions broadly mirrored the survey but allowed for more in-depth exploration of constructs. Interviewees were recruited through email invitations to selected senior and mid-level local and regional administrators, asking interviewees to refer our team to other contacts, and inviting survey respondents to voluntarily participate in a follow-up interview. One of the authors (EM), a Credentialed Evaluator, conducted all the one-time interviews either in-person at the individual participant’s workplace or by telephone. She did not have pre-existing relationships with any of the interviewees. Interviews were recorded and transcribed for analysis. Interviewees were required to consent to participate and understood that they could withdraw at any point. They were not offered incentives to participate. Interviews were carried out until thematic saturation was reached.
Analysis
A content analysis approach was employed for all qualitative data, which included open-ended responses from the online survey and interview transcripts. One of the authors (EM) conducted the analysis. The following steps were followed in the inductive content analysis process: repeated reading of the raw data, generation of initial thematic codes, organizing and sorting codes into categories (ie, main vs subcategories), coding of all data, quantifying codes, and interpreting themes. When responding to open-ended questions, respondents often provided multiple answers per question. Each of the respondents’ answers were coded. In alignment with the inductive nature of the analysis process, themes emerged organically from the data rather than the researchers using preconceived theories and categories to code the text. This was achieved by postponing the review of relevant literature on the topic until after the analysis was complete and using an external evaluation consultant (with no prior relationship to FH and limited theoretical knowledge of the topic matter) to analyze the data. Descriptive statistics were run on quantitative data in SPSS (v.24, IBM, Armonk, NY). For survey responses to be included in the analysis, the respondents needed to indicate which site they worked at and were required to answer at least 1 other survey question. One interviewee was excluded from the analysis since they were not familiar with the hospitalist model at their site.
Ethics approval
The evaluation protocol was reviewed by FH Department of Evaluation and Research and was deemed exempt from formal research ethics review.
Results
A total of 377 individuals responded to the online survey between January 8 and February 28, 2018 (response rate 14%). The distribution of respondents generally reflected the size of the respective acute care facilities. Compared to the overall sampled population, fewer nurses participated in the survey (45% vs 64%) while the rate of participation for Unit Clerks (14% vs 16%) and allied professionals (12% vs 16%) were similar.
Out of the 45 people approached for an interview, a total of 38 were conducted from January 3 to March 5, 2018 (response rate 84%). The interviews lasted an average of 42 minutes. Interviewees represented a range of administrative and health professional roles (Figure 1). Some interviewees held multiple positions.
Satisfaction with HM service
Across all sites, survey respondents reported high levels of satisfaction with their respective HM services and identified positive impacts on their job satisfaction (Figure 2). Almost all interviewees similarly expressed high satisfaction levels with their HM services (95%; n = 36).
Perceptions of HM service performance
Survey respondents rated the strength of hospitalists’ interprofessional communication and collaboration with other physicians and with care teams. Roughly two-thirds reported that overall hospitalist communication was “good” or “very good.” We also asked participants to rate the frequency at which hospitalists met best practice expectations related to interprofessional teamwork. Across all sites, similar proportions of respondents (23% to 39%) reported that these best practices were met “most of the time” or “always” (Figure 3). Survey questions also assessed perceptions of respondents about the quality and safety of care provided by hospitalists (Figure 4).
Perceptions of the impact of the HM service postimplementation
The majority of survey respondents reported improvements in the quality of communication, professional relationships, and coordination of inpatient care at transition points after the implementation of the HM service (Figure 5). This was also reflected in interviews, where some indicated that it was easier to communicate with hospitalists due to their on-site presence, accessibility, and 24/7 availability (n = 21). They also described improved collaboration within the care teams (n = 7), and easier communication with hospitalists because they were approachable, willing, and receptive (n = 4).
We also asked the survey respondents to assess the impact of the new hospitalist model on different dimensions of care quality, including patient satisfaction, patient experience, efficiency, and overall quality of care (Figure 6). Findings were comparable across these dimensions, with roughly 50-60% of respondents noting positive changes compared to before the implementation of the programs. However, most interviewees identified both positive and negative effects in these areas. Positive impacts included hospitalist on-site presence leading to better accessibility and timeliness of care (n = 5), hospitalists providing continuity to patients/families by working for weeklong rotations (n = 6), hospitalists being particularly skilled at managing complex clinical presentations (n = 2), and hospitalists being able to spend more time with patients (n = 2). On the other hand, some interviewees noted that patients and families did not like seeing multiple doctors due to frequent handoffs between hospitalists (n = 12). They also raised concerns that hospitalists did not know patients’ histories or had relationships with them, potentially leading to longer length of stay and unnecessary investigations (n = 8).
Site-to-site ratings of satisfaction and performance
Survey respondents’ satisfaction and performance ratings varied substantially site-to-site. Across all areas assessed, ratings were consistently highest at Site B (the smallest institution in our evaluation and the most recent addition to the HM network in the health authority). These differences were statistically significant across all survey questions asked.
Discussion
Findings from this study provide insight into the experiences of frontline health care professionals and administrators with the implementation of new HM services across a range of small to large acute care facilities. They indicate that the majority of respondents reported high levels of satisfaction with their hospitalist services. Most also indicated that the service had resulted in improvements compared to prior inpatient care models.
Over half of the survey respondents, and the majority of interviewees, reported a positive impact on interprofessional communication and collaboration. This was largely attributed to enhanced accessibility and availability of hospitalists:
- "Being on-site lends itself to better communication because they’re accessible. Hospitalists always answer the phone, but the general practitioners (GP) don’t always since they may be with other patients." (Dietician, Site A)
- "A big strength is that we have physician presence on the unit all day during scheduled hours, which makes us more accessible to nurses and more able to follow up on patients that we have concerns about." (Physician Leader, Site B)
However, the ratings dropped substantially when they were asked to assess adherence to specific best practices of such communication and collaboration, such as participation in daily check-ins or attendance at team care rounds (Figure 3). Interdisciplinary clinical rounds have been identified as a tool to improve the effectiveness of care teams.12 A number of elements have been identified as key components of effective rounds.13 Bedside rounds have also been found to enhance communication and teamwork.14,15 In our study, the discrepancy between overall high levels of satisfaction with hospitalists’ communication/collaboration despite low scores on participation in more concrete activities may illustrate the importance of informal and ad hoc opportunities for interactions between hospitalists and other care providers that result from the enhanced presence of hospitalists on care units.8 Outside of formal rounds, hospitalists have the ability to interact with other care providers throughout their shifts. Prior studies have shown that hospitalists spend a significant portion of their time communicating with other care team members throughout their workdays.16 At the same time, the amount of time spent on communication should be balanced against the need for provision of direct care at the bedside. Future research should aim to identify the right balance between these competing priorities, and to understand the nature and quality of the communication between various care providers.
We also aimed to understand the perceptions of study participants about the impact of the HM service on quality of care. Survey participants not only expressed reasonable satisfaction with various aspects of hospitalists’ performance, but also described a positive impact on care quality after the implementation of their new services. This was also reflected in the interviews:
- "The clinical knowledge of the new hospitalists is far better. Some are internal medicine trained, so they bring better knowledge and skills. I feel comfortable that they can take patients and manage them. I wasn’t always comfortable with doing that in the past." (Emergency Physician, Site C)
- "Hospitalists are really familiar with acute care and how it works. They’ve become more familiar with the discharge planning system and thus know more about the resources available. And even something as simple as knowing which forms to use." (Dietician, Site A)
It must be noted that these observations should ideally be corroborated through a robust before-after analysis of various quality measures. While such an analysis was beyond the scope of our current project, we have previously demonstrated that across our network (including the 3 sites included in our evaluation) hospitalist care is associated with lower mortality and readmission rates.4 Our findings appear to confirm previous suggestions that hospitalists’ dedicated focus on inpatient care may allow them to develop enhanced skills in the management of common conditions in the acute care setting17 which can be perceived to be of value to other hospital-based care providers.
The issue of frequent handover among hospitalists was the most commonly identified challenge by both survey respondents and interviewees:
- "They’re very reluctant to discharge patients if it’s their first day with the patient. Even if the previous hospitalist said they were ready for discharge, the new doc wants to run all of their own tests before they feel comfortable. Maybe it’s a trust issue between hospitalists when they hand patients over. It’s also being personally liable for patients if you discharge them." (Patient Care Coordinator, Site A)
- "Communication is an issue. There’s lots of turnover in hospitalists. Relationships were closer with GPs because we had so much more interaction with particular individuals." (Hospitalist Physician Leader, Site A)
It must be noted that we conducted our evaluation in a relatively short time span (within 2 years) after the 3 services were implemented. Developing trust among a large number of hospitalists newly recruited to these programs can take time and may be a factor that can explain the reluctance of some to discharge patients after handoffs. However, concerns about discontinuity of care inherent in the hospitalist model are not new.18,19 Better continuity has been associated with higher probability of patient discharges20 and improved outcomes.21 To address this challenge, the hospitalist community has focused on defining the core competencies associated with high quality handovers,22 and deliberate efforts to improve the quality of handoffs through quality improvement methodologies.23 Our study participants similarly identified these measures as potential solutions. Despite this, addressing hospitalist continuity of care remains a pressing challenge for the broader hospitalist community.24
Our evaluation has a number of methodological limitations. First, the survey response rate was only 14%, which raises questions about nonresponse bias and the representativeness of the findings to the larger population of interest. While the distribution of respondents was largely similar to the overall sampled population, a number of factors may have impacted our response rate. For example, we were only able to distribute our survey to health care providers’ institutional email addresses. Moreover, while we provided incentives for participation and sent out a number of reminders, we solely relied on one communication modality (ie, electronic communication) and did not utilize other methods (such as posters, reminder at meetings, in-person invitations). Second, while the survey included a number of open-ended questions, many of these responses were at times brief and difficult to interpret and were not included in the analysis. Third, all data collected were self-reported. For example, we could not corroborate comments about participation in interdisciplinary rounds by objective measures such as attendance records or direct observation. Self-report data is subjective in nature and is vulnerable to a range of biases, such as social desirability bias.25 Finally, patient satisfaction and experience with hospitalist care were not assessed by patients themselves. Ideally, standardized cross-site indicators should validate our patient-related results.
As mentioned above, hospitalist performance ratings varied substantially from site-to-site and were consistently higher at Site B (a small community hospital in a semi-rural area), followed by Site C (a medium-sized community hospital) and Site A (a tertiary referral center). The variability in program ratings and perceived hospitalist impacts between sites could be due to a variety of factors, such as the degree of change between the past and current models at each site, differences in hospitalist hiring processes, hospital size and culture, and differences in service design and operations. It may also be related to the timing of the introduction of the HM service, as Site B was the most recent site where the service was established. As such, there may be an element of recall bias behind the observed discrepancies. This highlights the importance of local context on respondent perceptions and suggests that our results may not be generalizable to other institutions with different attributes and characteristics.
Conclusion
Findings from this study have demonstrated that the recent hospitalist services in our health system have improved overall levels of interprofessional communication and teamwork, as well as perceptions of care quality among the majority of participants who reported high levels of satisfaction with their programs. Our findings further highlight the issue of frequent handovers among hospitalists as a pressing and ongoing challenge.
Corresponding Author: Vandad Yousefi, MD, CCFP, Past Regional Department Head – Hospital Medicine, Fraser Health Authority, Central City Tower, Suite 400, 13450 – 102nd Ave, Surrey, BC V3T 0H1; vandad.yousefi@fraserhealth.ca.
Financial disclosures: This project was funded by the Fraser Health Authority, which provided the funding for hiring of the external consultant to design, implement, and analyze the results of the evaluation program in collaboration with the Regional Hospitalist Program at Fraser Health.
1. Yousefi V, Wilton D. Re-designing Hospital Care: Learning from the Experience of Hospital Medicine in Canada. Journal of Global Health Care Systems. 2011;1(3).
2. White HL. Assessing the Prevalence, Penetration and Performance of Hospital Physicians in Ontario: Implications for the Quality and Efficiency of Inpatient Care. Doctoral Thesis; 2016.
3. Yousefi V, Chong CA. Does implementation of a hospitalist program in a Canadian community hospital improve measures of quality of care and utilization? An observational comparative analysis of hospitalists vs. traditional care providers. BMC Health Serv Res. 2013;13:204.
4. Yousefi V, Hejazi S, Lam A. Impact of Hospitalists on Care Outcomes in a Large Integrated Health System in British Columbia. Journal of Clinical Outcomes Management. 2020;27(2):59-72.
5. Salim SA, Elmaraezy A, Pamarthy A, et al. Impact of hospitalists on the efficiency of inpatient care and patient satisfaction: a systematic review and meta-analysis. J Community Hosp Intern Med Perspect. 2019;9(2):121-134.
6. Peterson MC. A systematic review of outcomes and quality measures in adult patients cared for by hospitalists vs nonhospitalists. Mayo Clinic Proc. 2009;84(3):248-254.
7. Webster F, Bremner S, Jackson M, et al. The impact of a hospitalist on role boundaries in an orthopedic environment. J Multidiscip Healthc. 2012;5:249-256.
8. Gotlib Conn L, Reeves S, Dainty K, et al. Interprofessional communication with hospitalist and consultant physicians in general internal medicine: a qualitative study. BMC Health Serv Res. 2012; 12:437.
9. About Fraser Health. Fraser Health Authority. Updated 2018. Accessed January 30, 2019. https://www.fraserhealth.ca/about-us/about-fraser-health#.XFJrl9JKiUk
10. Divisions of Family Practice. Accessed May 2, 2020. https://www.divisionsbc.ca/provincial/about-us
11. Patton MQ. Essentials of Utilization-Focused Evaluation. 2012. Sage Publications, Inc; 2011.
12. Buljac-Samardzic M, Doekhie KD, van Wijngaarden JDH. Interventions to improve team effectiveness within health care: a systematic review of the past decade. Hum Resour Health. 2020;18(1):2.
13. Verhaegh KJ, Seller-Boersma A, Simons R, et al. An exploratory study of healthcare professionals’ perceptions of interprofessional communication and collaboration. J Interprof Care. 2017;31(3):397-400.
14. O’Leary KJ, Johnson JK, Manojlovich M, et al. Redesigning systems to improve teamwork and quality for hospitalized patients (RESET): study protocol evaluating the effect of mentored implementation to redesign clinical microsystems. BMC Health Serv Res. 2019;19(1):293.
15. Stein J, Payne C, Methvin A, et al. Reorganizing a hospital ward as an accountable care unit. J Hosp Med. 2015;10(1):36-40.
16. Yousefi V. How Canadian hospitalists spend their time - A work-sampling study within a hospital medicine program in Ontario. Journal of Clinical Outcomes Management. 2011;18(4):159.
17. Marinella MA: Hospitalists-Where They Came from, Who They Are, and What They Do. Hosp Physician. 2002;38(5):32-36.
18. Wachter RM. An introduction to the hospitalist model. Ann Intern Med. 1999;130(4 Pt 2):338-342.
19. Wachter RM, Goldman L. The hospitalist movement 5 years later. JAMA. 2002;287(4):487-494.
20. van Walraven C. The Influence of Inpatient Physician Continuity on Hospital Discharge. J Gen Intern Med. 2019;34(9):1709-1714.
21. Goodwin JS, Li S, Kuo YF. Association of the Work Schedules of Hospitalists With Patient Outcomes of Hospitalization. JAMA Intern Med. 2020;180(2):215-222.
22. Nichani S, Fitterman N, Lukela M, Crocker J, the Society of Hospital Medicine, Patient Handoff. 2017 Hospital Medicine Revised Core Competencies. J Hosp Med. 2017;4:S74.
23. Lo HY, Mullan PC, Lye C, et al. A QI initiative: implementing a patient handoff checklist for pediatric hospitalist attendings. BMJ Qual Improv Rep. 2016;5(1):u212920.w5661.
24. Wachter RM, Goldman L. Zero to 50,000 - The 20th Anniversary of the Hospitalist. N Engl J Med. 2016;375(11):1009-1011.
25. Grimm, P. Social Desirability Bias. In: Sheth J, Malhotra N, eds. Wiley International Encyclopedia of Marketing. John Wiley & Sons, Ltd; 2010.
Implementation of a Symptom–Triggered Protocol for Severe Alcohol Withdrawal Treatment in a Medical Step-down Unit
From Stamford Hospital, Stamford, CT.
Objective: This single-center, quasi-experimental study of adult patients admitted or transferred to a medical step-down unit with alcohol withdrawal diagnoses sought to determine if symptom–triggered therapy (STT) is more effective than combined fixed-scheduled (FS) and STT in severe alcohol withdrawal.
Methods: In the preintervention group (72 episodes), patients were treated with FS and STT based on physician preference. In the postintervention group (69 episodes), providers were required to utilize only the STT protocol.
Results: Implementation of the intervention was associated with a significant reduction in average (per patient) cumulative benzodiazepine dose, from 250 mg to 96 mg (P < .001) and a decrease in average length of stay from 8.0 days to 5.1 days (P < .001). Secondary safety measures included a reduction in the proportion of patients who experienced delirium tremens from 47.5% to 22.5% (P < .001), and a reduction in intubation rates from 13.8% to 1.3% (P = .003).
Conclusion: The STT protocol proved to be more effective and safer in treating severe alcohol withdrawal patients than usual care employing STT with FS. We believe the successful implementation of a STT protocol in high-acuity patients requires frequent monitoring to assess withdrawal severity combined with appropriate and timely dosing of benzodiazepines.
Keywords: alcohol withdrawal delirium; alcohol withdrawal syndrome; treatment protocol; benzodiazepine; lorazepam.
Management of severe alcohol withdrawal and delirium tremens (DT) is challenging and requires significant resources, including close monitoring and intensive treatment, frequently in an intensive care unit (ICU).1 Early diagnosis and therapeutic intervention are important to limit potential complications associated with DT.2 Benzodiazepines are first-line therapeutic agents, but the definition of optimal use and dosing regimens has been limited, due to a lack of randomized controlled trials. In lower acuity patients admitted to a detoxification unit, systematic symptom–triggered benzodiazepine therapy (STT) has been established to be more effective than fixed-schedule (FS) dosing.3-5 Patients treated using STT require lower total benzodiazepine dosing and achieve shorter treatment durations. However, in higher-acuity patients admitted to general medical services, analyses have not shown an advantage of STT over combined FS and STT.6
Methods
The purpose of this study was to determine whether implementation of STT is more effective than FS dosing combined with episodic STT in the management of hospitalized high-acuity alcohol withdrawal patients. We conducted a preintervention and postintervention quasi-experimental study in the step-down unit (SDU) of a 305-bed community teaching hospital. The study population consisted of adult inpatients 18 years or older admitted or transferred to the 12-bed SDU with alcohol withdrawal, as defined by primary or secondary International Classification of Diseases, Tenth Revision diagnoses. SDU admission criteria included patients with prior DT or those who had received multiple doses of benzodiazepines in the emergency department. In-hospital transfer to the SDU was at the physician’s discretion, if the patient required escalating doses of benzodiazepines or the use of increasing resources, such as those for behavioral emergencies. The majority of patients admitted or transferred to the SDU were assigned to medical house staff teams under hospitalist supervision, and, on occasion, under community physicians. The nurse-to-patient ratio in the SDU was 1:3.
Study groups
The preintervention group consisted of 80 successive treatment episodes involving patients admitted or transferred to the SDU from
In the preintervention group, fixed, scheduled doses of lorazepam or chlordiazepoxide and as-needed lorazepam were prescribed and adjusted based upon physician judgment. Monitoring of symptom severity was scored using the revised Clinical Institute Withdrawal Assessment for Alcohol scale (CIWA-Ar). Benzodiazepine dosing occurred if the CIWA-Ar score had increased 2 or more points from the last score.
In the postintervention group, the STT protocol included the creation of a standardized physician order set for benzodiazepine “sliding scale” administration. The STT protocol allowed for escalating doses for higher withdrawal scores. Symptom severity was scored using MINDS (Minnesota Detoxification Scale) criteria.1 Lorazepam as-needed dosing was based upon MINDS scores. A MINDS score less than 10 resulted in no medication, MINDS 10-12 required 2 mg, MINDS 13-16 required 4 mg, MINDS 17-19 required 6 mg, and MINDS 20 required 8 mg and a call to the physician. Transfer to the ICU was recommended if the MINDS score was ≥ 20 for 3 consecutive hours. Monitoring intervals occurred more frequently at 30 minutes unless the MINDS score was less than 10. After 7 days, the MINDS protocol was recommended to be discontinued, as the patient might have had iatrogenic delirium.
The STT protocol was introduced during a didactic session for the hospitalists and a separate session for internal medicine and family residents. Each registered nurse working in the SDU was trained in the use of the STT protocol and MINDS during nursing huddles.
Patients were excluded from evaluation if they were transferred to the SDU after 7 or more days in the hospital, if they had stayed in the hospital more than 30 days, were chronically on benzodiazepine therapy (to avoid confounding withdrawal symptoms), or if they left the hospital against medical advice (AMA). To avoid bias in the results, the patients with early discontinuation of treatment were included in analyses of secondary outcomes, thus resulting in all 80 episodes analyzed.
Measures and data
The primary outcome measure was benzodiazepine dose intensity, expressed in total lorazepam-equivalents. Secondary measures included average length of stay (including general medical, surgical, and ICU days), seizure incidence, DT incidence, sitter use, behavioral emergency responses, rates of leaving AMA, intubation, transfer to the ICU, and death.
Benzodiazepine dosing and length of stay were obtained from the data warehouse of the hospital’s electronic health record (EHR; Meditech). Benzodiazepine dosing was expressed in total lorazepam-equivalents, with conversion as follows: lorazepam orally and intravenously 1 mg = chlordiazepoxide 25 mg = diazepam 5 mg. All other measures were obtained from chart review of the patients’ EMR entries. The Stamford Hospital Institutional Review Board approved this study.
Analysis
Data analyses for this study were performed using SPSS version 25.0 (IBM). Categorical data were reported as frequency (count) and percent within category. Continuous data were reported as mean (SD). Categorical data were analyzed using χ2 analysis; continuous data were analyzed using t-tests. A P value of .05 was considered significant for each analysis.
Results
During the preintervention period, 72 episodes (58 patients) met inclusion criteria, and 69 episodes (55 patients) met inclusion criteria during the postintervention period. Ten patients were represented in both groups. Eight preintervention episodes were excluded from the primary analysis because the patient left AMA. Eleven postintervention episodes were excluded: 9 due to patients leaving AMA, 1 due to chronic benzodiazepine usage, and 1 due to transfer to the SDU unit after 7 days. Baseline characteristics and medication use profiles of the preintervention and postintervention groups are summarized in Table 1.

Implementation of the intervention was associated with a significant reduction in average (per patient) cumulative benzodiazepine dose, from 250 mg to 96 mg (P < .001), as shown in Table 2. Average length of stay decreased from 8.0 days to 5.1 days (P < .001). Secondary safety measures were notable for a reduction in DT incidence, from 47.5% to 22.5% (P < .001), and lower rates of intubation, from 13.8% to 1.3% (P = .003). Seven-day readmission rates were 0% preintervention and 1.4% postintervention.

Discussion
We found that hospitalized patients with severe alcohol withdrawal treated with STT required fewer benzodiazepines and had a lower length of stay than patients treated with a conventional combined STT and FS regimen. Implementation of the change from the STT and FS approach to the STT approach in the SDU resulted in concerns that waiting for symptoms to appear could result in more severe withdrawal and prolonged treatment.3 To address this, the intervention included monitoring and dosing every 30 minutes, as compared to monitoring and dosing every 1 hour preintervention. In addition, a sliding-scale approach to match alcohol withdrawal score with dosage was employed in postintervention patients.
Employment of the STT protocol also resulted in decreased complications, including lower rates of DT and transfer to the ICU. This new intervention resulted in significantly decreased time required to control severe symptoms. In the preintervention phase, if a patient’s symptoms escalated despite administration of the as-needed dose of benzodiazepine, there was often a delay in administration of additional doses due to the time needed for nurses to reach a physician and subsequent placement of a new order. In the postintervention phase, the STT protocol allowed nursing staff to give benzodiazepines without delay when needed. We believe this reduced the number of calls by nursing staff to physicians requesting additional medications, and that this improved teamwork when managing these patients.
As part of the intervention, a decision was made to use the MINDS scale rather than the CIWA-Ar scale to assess withdrawal severity. This was because the CIWA-Ar has only been validated in patients with uncomplicated alcohol withdrawal syndrome and has not been researched extensively in patients requiring ICU-level care.1 MINDS assessment has proven to be reliable and reflects severity of withdrawal. Furthermore, MINDS requires less time to administer—3 to 5 minutes vs 5 to 15 minutes for the CIWA-Ar scale. CIWA-Ar, unlike MINDS, requires subjective input from the patient, which is less reliable for higher acuity patients. Our study is unique in that it focused on high-acuity patients and it showed both a significant reduction in quantity of benzodiazepines prescribed and length of stay. Previous studies on lower acuity patients in detoxification units have confirmed that STT is more effective than a FS approach.3-5 In patients of higher acuity, STT has not proven to be superior.
A key lesson learned was the need for proper education of nursing staff. Concurrent nursing audits were necessary to ensure that scoring was performed in an accurate and timely manner. In addition, it was challenging to predict which patients might develop DTs versus those requiring a brief inpatient stay. While there was initial concern that an STT protocol could result in underdosing, we found that patients had fewer DT episodes and fewer ICU transfers.
This study had several limitations. These include a relatively small sample size and the data being less recent. As there has been no intervening change to the therapeutic paradigm of DT treatment, the findings remain pertinent to the present time. The study employed a simple pre/post design and was conducted in a single setting. We are not aware of any temporal or local trends likely to influence these results. Admissions and transfers to the SDU for severe alcohol withdrawal were based on physician discretion. However, patient characteristics in both groups were similar (Table 1). We note that the postintervention STT protocol allowed for more frequent benzodiazepine dosing, though benzodiazepine use did decrease. Different alcohol withdrawal scores (MINDS vs. CIWA-Ar) were used for postintervention and preintervention, although previous research has shown that MINDS and CIWA-Ar scores correlate well.7 Finally, some patients of higher acuity and complexity were excluded, potentially limiting the generalizability of our results.
Conclusion
Our STT protocol proved to be more effective and safer in treating severe alcohol withdrawal patients than usual care employing STT with FS. We believe the successful implementation of a STT protocol in high-acuity patients also requires frequent monitoring using the MINDS scale, integrated with benzodiazepine sliding-scale dosing to match symptom severity. This bundled approach resulted in a significant reduction of benzodiazepine usage and reduced length of stay. Timely treatment of these patients also reduced the percent of patients developing DTs, and reduced intubation rates and transfers to the ICU. Further studies may be warranted at other sites to confirm the effectiveness of this STT protocol.
Corresponding author: Paul W. Huang, MD, Stamford Hospital, One Hospital Plaza, PO Box 9317, Stamford, CT 06904; phuang@stamhealth.org.
Financial disclosures: None.
1. DeCarolis DD, Rice KL, Ho L, et al. Symptom-driven lorazepam protocol for treatment of severe alcohol withdrawal delirium in the intensive care unit. Pharmacotherapy. 2007;27(4):510-518.
2. DeBellis R, Smith BS, Choi S, Malloy M. Management of delirium tremens. J Intensive Care Med. 2005;20(3):164-173.
3. Saitz R, Mayo-Smith MF, Roberts MS, et al. Individualized treatment for alcohol withdrawal. A randomized double-blind controlled trial. JAMA. 1994;272(7):519-523.
4. Sachdeva A, Chandra M, Deshpande SN. A comparative study of fixed tapering dose regimen versus symptom-triggered regimen of lorazepam for alcohol detoxification. Alcohol Alcohol. 2014;49(3):287-291.
5. Daeppen JB, Gache P, Landry U, et al. Symptom-triggered vs fixed-schedule doses of benzodiazepine for alcohol withdrawal: a randomized treatment trial. Arch Intern Med. 2002;162(10):1117-1121.
6. Jaeger TM, Lohr RH, Pankratz VS. Symptom-triggered therapy for alcohol withdrawal syndrome in medical inpatients. Mayo Clin Proc. 2001;76(7):695-701.
7. Littlefield AJ, Heavner MS, Eng CC, et al. Correlation Between mMINDS and CIWA-Ar Scoring Tools in Patients With Alcohol Withdrawal Syndrome. Am J Crit Care. 2018;27(4):280-286.
From Stamford Hospital, Stamford, CT.
Objective: This single-center, quasi-experimental study of adult patients admitted or transferred to a medical step-down unit with alcohol withdrawal diagnoses sought to determine if symptom–triggered therapy (STT) is more effective than combined fixed-scheduled (FS) and STT in severe alcohol withdrawal.
Methods: In the preintervention group (72 episodes), patients were treated with FS and STT based on physician preference. In the postintervention group (69 episodes), providers were required to utilize only the STT protocol.
Results: Implementation of the intervention was associated with a significant reduction in average (per patient) cumulative benzodiazepine dose, from 250 mg to 96 mg (P < .001) and a decrease in average length of stay from 8.0 days to 5.1 days (P < .001). Secondary safety measures included a reduction in the proportion of patients who experienced delirium tremens from 47.5% to 22.5% (P < .001), and a reduction in intubation rates from 13.8% to 1.3% (P = .003).
Conclusion: The STT protocol proved to be more effective and safer in treating severe alcohol withdrawal patients than usual care employing STT with FS. We believe the successful implementation of a STT protocol in high-acuity patients requires frequent monitoring to assess withdrawal severity combined with appropriate and timely dosing of benzodiazepines.
Keywords: alcohol withdrawal delirium; alcohol withdrawal syndrome; treatment protocol; benzodiazepine; lorazepam.
Management of severe alcohol withdrawal and delirium tremens (DT) is challenging and requires significant resources, including close monitoring and intensive treatment, frequently in an intensive care unit (ICU).1 Early diagnosis and therapeutic intervention are important to limit potential complications associated with DT.2 Benzodiazepines are first-line therapeutic agents, but the definition of optimal use and dosing regimens has been limited, due to a lack of randomized controlled trials. In lower acuity patients admitted to a detoxification unit, systematic symptom–triggered benzodiazepine therapy (STT) has been established to be more effective than fixed-schedule (FS) dosing.3-5 Patients treated using STT require lower total benzodiazepine dosing and achieve shorter treatment durations. However, in higher-acuity patients admitted to general medical services, analyses have not shown an advantage of STT over combined FS and STT.6
Methods
The purpose of this study was to determine whether implementation of STT is more effective than FS dosing combined with episodic STT in the management of hospitalized high-acuity alcohol withdrawal patients. We conducted a preintervention and postintervention quasi-experimental study in the step-down unit (SDU) of a 305-bed community teaching hospital. The study population consisted of adult inpatients 18 years or older admitted or transferred to the 12-bed SDU with alcohol withdrawal, as defined by primary or secondary International Classification of Diseases, Tenth Revision diagnoses. SDU admission criteria included patients with prior DT or those who had received multiple doses of benzodiazepines in the emergency department. In-hospital transfer to the SDU was at the physician’s discretion, if the patient required escalating doses of benzodiazepines or the use of increasing resources, such as those for behavioral emergencies. The majority of patients admitted or transferred to the SDU were assigned to medical house staff teams under hospitalist supervision, and, on occasion, under community physicians. The nurse-to-patient ratio in the SDU was 1:3.
Study groups
The preintervention group consisted of 80 successive treatment episodes involving patients admitted or transferred to the SDU from
In the preintervention group, fixed, scheduled doses of lorazepam or chlordiazepoxide and as-needed lorazepam were prescribed and adjusted based upon physician judgment. Monitoring of symptom severity was scored using the revised Clinical Institute Withdrawal Assessment for Alcohol scale (CIWA-Ar). Benzodiazepine dosing occurred if the CIWA-Ar score had increased 2 or more points from the last score.
In the postintervention group, the STT protocol included the creation of a standardized physician order set for benzodiazepine “sliding scale” administration. The STT protocol allowed for escalating doses for higher withdrawal scores. Symptom severity was scored using MINDS (Minnesota Detoxification Scale) criteria.1 Lorazepam as-needed dosing was based upon MINDS scores. A MINDS score less than 10 resulted in no medication, MINDS 10-12 required 2 mg, MINDS 13-16 required 4 mg, MINDS 17-19 required 6 mg, and MINDS 20 required 8 mg and a call to the physician. Transfer to the ICU was recommended if the MINDS score was ≥ 20 for 3 consecutive hours. Monitoring intervals occurred more frequently at 30 minutes unless the MINDS score was less than 10. After 7 days, the MINDS protocol was recommended to be discontinued, as the patient might have had iatrogenic delirium.
The STT protocol was introduced during a didactic session for the hospitalists and a separate session for internal medicine and family residents. Each registered nurse working in the SDU was trained in the use of the STT protocol and MINDS during nursing huddles.
Patients were excluded from evaluation if they were transferred to the SDU after 7 or more days in the hospital, if they had stayed in the hospital more than 30 days, were chronically on benzodiazepine therapy (to avoid confounding withdrawal symptoms), or if they left the hospital against medical advice (AMA). To avoid bias in the results, the patients with early discontinuation of treatment were included in analyses of secondary outcomes, thus resulting in all 80 episodes analyzed.
Measures and data
The primary outcome measure was benzodiazepine dose intensity, expressed in total lorazepam-equivalents. Secondary measures included average length of stay (including general medical, surgical, and ICU days), seizure incidence, DT incidence, sitter use, behavioral emergency responses, rates of leaving AMA, intubation, transfer to the ICU, and death.
Benzodiazepine dosing and length of stay were obtained from the data warehouse of the hospital’s electronic health record (EHR; Meditech). Benzodiazepine dosing was expressed in total lorazepam-equivalents, with conversion as follows: lorazepam orally and intravenously 1 mg = chlordiazepoxide 25 mg = diazepam 5 mg. All other measures were obtained from chart review of the patients’ EMR entries. The Stamford Hospital Institutional Review Board approved this study.
Analysis
Data analyses for this study were performed using SPSS version 25.0 (IBM). Categorical data were reported as frequency (count) and percent within category. Continuous data were reported as mean (SD). Categorical data were analyzed using χ2 analysis; continuous data were analyzed using t-tests. A P value of .05 was considered significant for each analysis.
Results
During the preintervention period, 72 episodes (58 patients) met inclusion criteria, and 69 episodes (55 patients) met inclusion criteria during the postintervention period. Ten patients were represented in both groups. Eight preintervention episodes were excluded from the primary analysis because the patient left AMA. Eleven postintervention episodes were excluded: 9 due to patients leaving AMA, 1 due to chronic benzodiazepine usage, and 1 due to transfer to the SDU unit after 7 days. Baseline characteristics and medication use profiles of the preintervention and postintervention groups are summarized in Table 1.
Implementation of the intervention was associated with a significant reduction in average (per patient) cumulative benzodiazepine dose, from 250 mg to 96 mg (P < .001), as shown in Table 2. Average length of stay decreased from 8.0 days to 5.1 days (P < .001). Secondary safety measures were notable for a reduction in DT incidence, from 47.5% to 22.5% (P < .001), and lower rates of intubation, from 13.8% to 1.3% (P = .003). Seven-day readmission rates were 0% preintervention and 1.4% postintervention.
Discussion
We found that hospitalized patients with severe alcohol withdrawal treated with STT required fewer benzodiazepines and had a lower length of stay than patients treated with a conventional combined STT and FS regimen. Implementation of the change from the STT and FS approach to the STT approach in the SDU resulted in concerns that waiting for symptoms to appear could result in more severe withdrawal and prolonged treatment.3 To address this, the intervention included monitoring and dosing every 30 minutes, as compared to monitoring and dosing every 1 hour preintervention. In addition, a sliding-scale approach to match alcohol withdrawal score with dosage was employed in postintervention patients.
Employment of the STT protocol also resulted in decreased complications, including lower rates of DT and transfer to the ICU. This new intervention resulted in significantly decreased time required to control severe symptoms. In the preintervention phase, if a patient’s symptoms escalated despite administration of the as-needed dose of benzodiazepine, there was often a delay in administration of additional doses due to the time needed for nurses to reach a physician and subsequent placement of a new order. In the postintervention phase, the STT protocol allowed nursing staff to give benzodiazepines without delay when needed. We believe this reduced the number of calls by nursing staff to physicians requesting additional medications, and that this improved teamwork when managing these patients.
As part of the intervention, a decision was made to use the MINDS scale rather than the CIWA-Ar scale to assess withdrawal severity. This was because the CIWA-Ar has only been validated in patients with uncomplicated alcohol withdrawal syndrome and has not been researched extensively in patients requiring ICU-level care.1 MINDS assessment has proven to be reliable and reflects severity of withdrawal. Furthermore, MINDS requires less time to administer—3 to 5 minutes vs 5 to 15 minutes for the CIWA-Ar scale. CIWA-Ar, unlike MINDS, requires subjective input from the patient, which is less reliable for higher acuity patients. Our study is unique in that it focused on high-acuity patients and it showed both a significant reduction in quantity of benzodiazepines prescribed and length of stay. Previous studies on lower acuity patients in detoxification units have confirmed that STT is more effective than a FS approach.3-5 In patients of higher acuity, STT has not proven to be superior.
A key lesson learned was the need for proper education of nursing staff. Concurrent nursing audits were necessary to ensure that scoring was performed in an accurate and timely manner. In addition, it was challenging to predict which patients might develop DTs versus those requiring a brief inpatient stay. While there was initial concern that an STT protocol could result in underdosing, we found that patients had fewer DT episodes and fewer ICU transfers.
This study had several limitations. These include a relatively small sample size and the data being less recent. As there has been no intervening change to the therapeutic paradigm of DT treatment, the findings remain pertinent to the present time. The study employed a simple pre/post design and was conducted in a single setting. We are not aware of any temporal or local trends likely to influence these results. Admissions and transfers to the SDU for severe alcohol withdrawal were based on physician discretion. However, patient characteristics in both groups were similar (Table 1). We note that the postintervention STT protocol allowed for more frequent benzodiazepine dosing, though benzodiazepine use did decrease. Different alcohol withdrawal scores (MINDS vs. CIWA-Ar) were used for postintervention and preintervention, although previous research has shown that MINDS and CIWA-Ar scores correlate well.7 Finally, some patients of higher acuity and complexity were excluded, potentially limiting the generalizability of our results.
Conclusion
Our STT protocol proved to be more effective and safer in treating severe alcohol withdrawal patients than usual care employing STT with FS. We believe the successful implementation of a STT protocol in high-acuity patients also requires frequent monitoring using the MINDS scale, integrated with benzodiazepine sliding-scale dosing to match symptom severity. This bundled approach resulted in a significant reduction of benzodiazepine usage and reduced length of stay. Timely treatment of these patients also reduced the percent of patients developing DTs, and reduced intubation rates and transfers to the ICU. Further studies may be warranted at other sites to confirm the effectiveness of this STT protocol.
Corresponding author: Paul W. Huang, MD, Stamford Hospital, One Hospital Plaza, PO Box 9317, Stamford, CT 06904; phuang@stamhealth.org.
Financial disclosures: None.
1. DeCarolis DD, Rice KL, Ho L, et al. Symptom-driven lorazepam protocol for treatment of severe alcohol withdrawal delirium in the intensive care unit. Pharmacotherapy. 2007;27(4):510-518.
2. DeBellis R, Smith BS, Choi S, Malloy M. Management of delirium tremens. J Intensive Care Med. 2005;20(3):164-173.
3. Saitz R, Mayo-Smith MF, Roberts MS, et al. Individualized treatment for alcohol withdrawal. A randomized double-blind controlled trial. JAMA. 1994;272(7):519-523.
4. Sachdeva A, Chandra M, Deshpande SN. A comparative study of fixed tapering dose regimen versus symptom-triggered regimen of lorazepam for alcohol detoxification. Alcohol Alcohol. 2014;49(3):287-291.
5. Daeppen JB, Gache P, Landry U, et al. Symptom-triggered vs fixed-schedule doses of benzodiazepine for alcohol withdrawal: a randomized treatment trial. Arch Intern Med. 2002;162(10):1117-1121.
6. Jaeger TM, Lohr RH, Pankratz VS. Symptom-triggered therapy for alcohol withdrawal syndrome in medical inpatients. Mayo Clin Proc. 2001;76(7):695-701.
7. Littlefield AJ, Heavner MS, Eng CC, et al. Correlation Between mMINDS and CIWA-Ar Scoring Tools in Patients With Alcohol Withdrawal Syndrome. Am J Crit Care. 2018;27(4):280-286.
Study finds little impact of private equity on dermatology practices
A new 
The authors reported that – with an average of five quarters postacquisition – there was no statistically significant differential between investor-owned and non–investor-owned practices “in total spending, overall use of dermatology procedures per patient, or specific high-volume and profitable procedures.”
Essentially, the study findings were equivocal, reported Robert Tyler Braun, PhD and his colleagues at Weill Cornell Medicine, New York. “The results provide mixed support for both proponents and opponents of private equity acquisitions,” they wrote in the study, which was published in Health Affairs.
But two dermatologists not involved with the study said the analysis has significant limitations, including a lack of pathology data, a lack of Medicare data, and a lack of insight into how advanced practice clinicians, such as nurse practitioners and physician assistants, were used by the private equity (PE)–owned practices. The study was not able to track “incident to billing.”
Leaving out Medicare data is a “huge oversight,” Joseph K. Francis, MD, a Mohs surgeon at the University of Florida, Gainesville, said in an interview. “The study is fundamentally flawed.”
“With all of these limitations, it’s difficult to draw meaningful conclusions,” agreed Clifford Perlis, MD, Mbe, of Keystone Dermatology in King of Prussia, Pa.
Both Dr. Francis and Dr. Perlis also questioned the influence of one of the study’s primary sponsors, the Physicians Foundation, formed out of the settlement of a class action lawsuit against third-party payers.
In addition, Dr. Francis and Dr. Perlis said they thought the study did not follow the PE-owned practices for a long enough period of time after acquisition to detect any differences, and that the dataset – looking at practice acquisitions from 2012 to 2017 – was too old to paint a reliable picture of the current state of PE-owned practices. Acquisitions have accelerated since 2017.
In March 2021, Harvard researchers reported in JAMA Health Forum that PE purchases in health care peaked in the first quarter of 2018 and surged to almost as high a level in the fourth quarter of 2020, with 153 deals announced in the second half of the year. Of the 153 acquisitions, 98, or 64%, were for physician practices or other health care services.
Dr. Braun said his study focused on 2012-2017 because it was an available data set. And, he defended the snapshot, saying that he and his colleagues had as much as 4 years of postacquisition data for the practices that were purchased in 2013. He acknowledged there were less data on practices purchased from 2014 to 2016.
“It is possible that our results would change with a longer postacquisition period,” Dr. Braun said in an interview. But, he said there was no way to predict whether that change “would look better or worse for private equity.”
Modest price increases
The authors analyzed data from the Health Care Cost Institute, which aggregates claims for some 50 million individuals insured by Aetna, Humana, and United Healthcare. The data do not include Medicare claims.
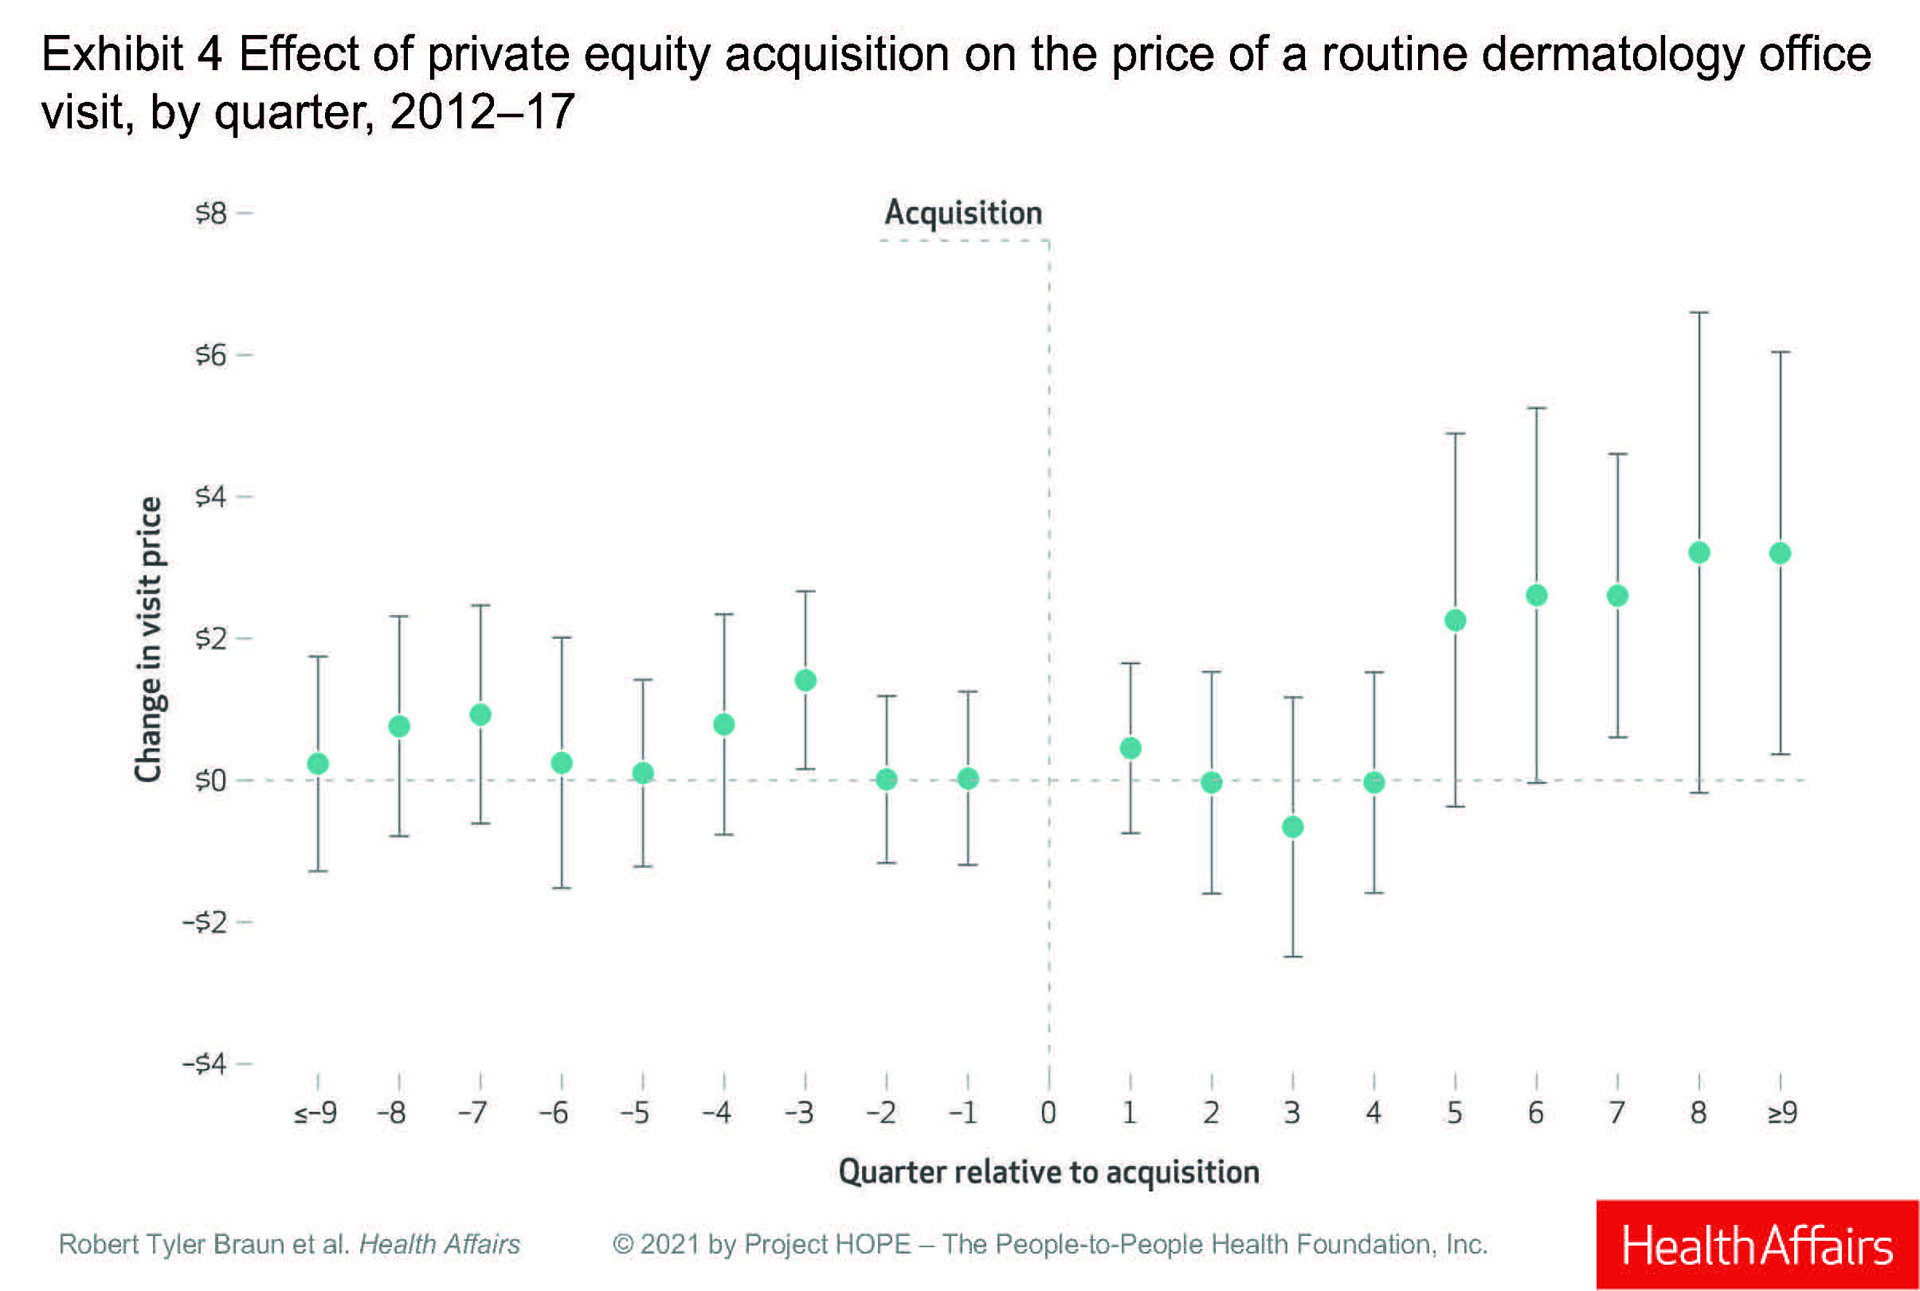
They examined dermatologists in practices bought between 2013 and 2016 and compared them to dermatologists who were in practices not owned by private equity. Each dermatologist had to have at least 2 years of data, and the authors compared preacquisition with postacquisition data for those in PE-owned practices.
They identified 64 practices – with 246 dermatologists – bought by private investors. Preacquisition, PE practices were larger than non-PE practices, with 4.2 clinicians (including advanced practitioners) per practice, compared with 1.7 in non–investor-owned practices.
The authors looked at volume and prices for routine office visits (CPT code 99213), biopsies (11101), excisions (11602), destruction of first lesion (cryotherapy; 17000), and Mohs micrographic surgery (17311).
Prices for a routine office visit rose nominally in the first quarter after acquisition (under $1), stayed at 0 in the second quarter, decreased in the third quarter, and was 0 again in the fourth quarter. It was not until the fifth quarter post acquisition that prices rose, increasing by 3% ($2.26), and then rising 5% ($3.20) in the ninth quarter.
Dr. Braun said the price increases make sense because practices get “rolled up” into larger platforms, theoretically giving them more negotiating leverage with insurers. And he said the paper’s results “are consistent with physician practice consolidation research – mainly hospitals acquiring practices – that prices increase after acquisition.” He acknowledged that the dermatology paper found “more modest effects,” than other studies.
Dr. Francis, however, said the increases are basically “pocket change,” and that they reflect a failed promise from private investors that clinicians in PE-owned practices will be paid more. The small differences in pay may also mean that insurers are likely not acquiescing to the theoretical leverage of larger dermatology entities.
PE-owned dermatologists saw about 5% more patients per quarter initially, rising to 17% more per quarter by eight quarters after purchase, according to the study.
The study reported a significant increase in Mohs surgery and cryotherapy in the first quarter post purchase, and a significant increase in biopsies after eight quarters. But Dr. Braun and colleagues concluded that total spending per patient did not change significantly after acquisition. “That says that maybe physicians aren’t changing their behaviors that much,” Dr. Braun said in an interview.
Dr. Perlis disagreed, noting that practices rarely change quickly. “Anecdotally, most groups that are taken over, nothing changes initially,” while the new owners are getting a feel for the practice.
He also said the paper erred in not addressing quality of and access to care. “Quality and patient satisfaction and access are also other important factors that need to be examined.”
Not benign players
Both Dr. Perlis and Dr. Francis said the study may have been improved by having a dermatologist as a coauthor. Dr. Braun countered that he and his colleagues consulted several dermatologists during the course of the study, and that they also conducted 30 interviews with proponents and opponents of PE ownership.
The authors warned of what they viewed as some disturbing trends in PE-owned practices, including what Dr. Braun called “stealth” consolidation – investors making small purchases that fall outside of federal regulation, and then amassing them into large entities.
He also commented that it was “alarming” that PE-owned practices were hiring a larger number of advanced practitioners. The authors also expressed concern about leveraged buyouts, in which investors require a practice to carry high debt loads that can eventually drive it into bankruptcy.
“These are not benign players,” said Dr. Francis. He noted that it took “an act of Congress to stop surprise billing,” a tactic employed by PE-owned health care entities. “Policy makers should be looking at what’s best for patients, especially Medicare and vulnerable patients.”
Dr. Perlis also has qualms about PE-owned practices. “The money to support returns to investors has to come from somewhere and that creates an inherent tension between patient care and optimizing revenue for investors,” he said. “It’s a pretty head-on conflict.”
A new
The authors reported that – with an average of five quarters postacquisition – there was no statistically significant differential between investor-owned and non–investor-owned practices “in total spending, overall use of dermatology procedures per patient, or specific high-volume and profitable procedures.”
Essentially, the study findings were equivocal, reported Robert Tyler Braun, PhD and his colleagues at Weill Cornell Medicine, New York. “The results provide mixed support for both proponents and opponents of private equity acquisitions,” they wrote in the study, which was published in Health Affairs.
But two dermatologists not involved with the study said the analysis has significant limitations, including a lack of pathology data, a lack of Medicare data, and a lack of insight into how advanced practice clinicians, such as nurse practitioners and physician assistants, were used by the private equity (PE)–owned practices. The study was not able to track “incident to billing.”
Leaving out Medicare data is a “huge oversight,” Joseph K. Francis, MD, a Mohs surgeon at the University of Florida, Gainesville, said in an interview. “The study is fundamentally flawed.”
“With all of these limitations, it’s difficult to draw meaningful conclusions,” agreed Clifford Perlis, MD, Mbe, of Keystone Dermatology in King of Prussia, Pa.
Both Dr. Francis and Dr. Perlis also questioned the influence of one of the study’s primary sponsors, the Physicians Foundation, formed out of the settlement of a class action lawsuit against third-party payers.
In addition, Dr. Francis and Dr. Perlis said they thought the study did not follow the PE-owned practices for a long enough period of time after acquisition to detect any differences, and that the dataset – looking at practice acquisitions from 2012 to 2017 – was too old to paint a reliable picture of the current state of PE-owned practices. Acquisitions have accelerated since 2017.
In March 2021, Harvard researchers reported in JAMA Health Forum that PE purchases in health care peaked in the first quarter of 2018 and surged to almost as high a level in the fourth quarter of 2020, with 153 deals announced in the second half of the year. Of the 153 acquisitions, 98, or 64%, were for physician practices or other health care services.
Dr. Braun said his study focused on 2012-2017 because it was an available data set. And, he defended the snapshot, saying that he and his colleagues had as much as 4 years of postacquisition data for the practices that were purchased in 2013. He acknowledged there were less data on practices purchased from 2014 to 2016.
“It is possible that our results would change with a longer postacquisition period,” Dr. Braun said in an interview. But, he said there was no way to predict whether that change “would look better or worse for private equity.”
Modest price increases
The authors analyzed data from the Health Care Cost Institute, which aggregates claims for some 50 million individuals insured by Aetna, Humana, and United Healthcare. The data do not include Medicare claims.
They examined dermatologists in practices bought between 2013 and 2016 and compared them to dermatologists who were in practices not owned by private equity. Each dermatologist had to have at least 2 years of data, and the authors compared preacquisition with postacquisition data for those in PE-owned practices.
They identified 64 practices – with 246 dermatologists – bought by private investors. Preacquisition, PE practices were larger than non-PE practices, with 4.2 clinicians (including advanced practitioners) per practice, compared with 1.7 in non–investor-owned practices.
The authors looked at volume and prices for routine office visits (CPT code 99213), biopsies (11101), excisions (11602), destruction of first lesion (cryotherapy; 17000), and Mohs micrographic surgery (17311).
Prices for a routine office visit rose nominally in the first quarter after acquisition (under $1), stayed at 0 in the second quarter, decreased in the third quarter, and was 0 again in the fourth quarter. It was not until the fifth quarter post acquisition that prices rose, increasing by 3% ($2.26), and then rising 5% ($3.20) in the ninth quarter.
Dr. Braun said the price increases make sense because practices get “rolled up” into larger platforms, theoretically giving them more negotiating leverage with insurers. And he said the paper’s results “are consistent with physician practice consolidation research – mainly hospitals acquiring practices – that prices increase after acquisition.” He acknowledged that the dermatology paper found “more modest effects,” than other studies.
Dr. Francis, however, said the increases are basically “pocket change,” and that they reflect a failed promise from private investors that clinicians in PE-owned practices will be paid more. The small differences in pay may also mean that insurers are likely not acquiescing to the theoretical leverage of larger dermatology entities.
PE-owned dermatologists saw about 5% more patients per quarter initially, rising to 17% more per quarter by eight quarters after purchase, according to the study.
The study reported a significant increase in Mohs surgery and cryotherapy in the first quarter post purchase, and a significant increase in biopsies after eight quarters. But Dr. Braun and colleagues concluded that total spending per patient did not change significantly after acquisition. “That says that maybe physicians aren’t changing their behaviors that much,” Dr. Braun said in an interview.
Dr. Perlis disagreed, noting that practices rarely change quickly. “Anecdotally, most groups that are taken over, nothing changes initially,” while the new owners are getting a feel for the practice.
He also said the paper erred in not addressing quality of and access to care. “Quality and patient satisfaction and access are also other important factors that need to be examined.”
Not benign players
Both Dr. Perlis and Dr. Francis said the study may have been improved by having a dermatologist as a coauthor. Dr. Braun countered that he and his colleagues consulted several dermatologists during the course of the study, and that they also conducted 30 interviews with proponents and opponents of PE ownership.
The authors warned of what they viewed as some disturbing trends in PE-owned practices, including what Dr. Braun called “stealth” consolidation – investors making small purchases that fall outside of federal regulation, and then amassing them into large entities.
He also commented that it was “alarming” that PE-owned practices were hiring a larger number of advanced practitioners. The authors also expressed concern about leveraged buyouts, in which investors require a practice to carry high debt loads that can eventually drive it into bankruptcy.
“These are not benign players,” said Dr. Francis. He noted that it took “an act of Congress to stop surprise billing,” a tactic employed by PE-owned health care entities. “Policy makers should be looking at what’s best for patients, especially Medicare and vulnerable patients.”
Dr. Perlis also has qualms about PE-owned practices. “The money to support returns to investors has to come from somewhere and that creates an inherent tension between patient care and optimizing revenue for investors,” he said. “It’s a pretty head-on conflict.”
FROM HEALTH AFFAIRS
More and more doctors abandoning private practice
according to a new report.
These patterns likely reflect broader trends toward consolidation in health care, with both insurance companies and hospitals also having grown in size in recent years.
The latest biennial analysis of doctors’ practices by the American Medical Association showed an acceleration of a trend away from private practice, defined as a practice wholly owned by physicians. The 2020 results found less than half – 49.1 % – of doctors involved in patient care worked in a private practice, the AMA said in a report released in May 2021.
This marked the first time private practice was not the dominant approach since the AMA analysis began in 2012. What’s more, the trend appears to be gaining steam, with a drop of almost 5 percentage points from 54.0% in private practice in 2018. The percent of doctors in private practice declined at a slower rate in previous AMA surveys, slipping to 55.8% in 2016 from 56.8% in 2018 and 60.1% in 2012.
Employment and ownership structures have become so varied that no single approach or size of organization “can or should be considered the typical physician practice,” the report noted.
The AMA, for example, added to its 2020 benchmark survey an option to identify private equity organizations as employers. The survey found 4% of doctors involved in patient care worked in practices owned by these kinds of firms. Other options include practices wholly or jointly owned by hospital and health systems and insurers, as well as direct employment and contracting.
There are signs that the shift away from smaller private practices will continue, with younger doctors appearing more likely to seek employment.
The survey found 42% of doctors ages 55 and older were employed by someone else, compared with 51.2% of doctors ages 40-54 and 70% of physicians under the age of 40.
The AMA surveyed 3,500 U.S. doctors through the 2020 Physician Practice Benchmark Survey. The survey was conducted from September to October 2020, roughly 6 months into the COVID-19 pandemic, and therefore may not reflect its full impact.
“Physician practices were hit hard by the economic impact of the early pandemic as patient volume and revenues shrank while medical supply expenses spiked. The impact of these economic forces on physician practice arrangements is ongoing and may not be fully realized for some time,” AMA President Susan R. Bailey, MD, said in a statement.
In a survey released in 2020 by McKinsey & Company, 53% of independent doctors reported that they were worried about their practices surviving the stresses of the pandemic, this news organization reported.
Challenging environment
It’s not just money leading to the shift away from private practice, according to a 2020 report from the American Hospital Association, titled “Evolving Physician-Practice Ownership Models.”
Many recent graduates of medical schools have significant debt and are more likely to opt for employment, which offers more financial stability and work-life balance, the report said.
Doctors also need to keep up with expectations of their patients that have been shaped by advances in other sectors, like banking, the AHA noted. People are used to working on their own schedules, and want to make appointments through apps, get test results rapidly and on their mobile devices, and communicate with their providers virtually.
“It is challenging to meet these expectations and make the necessary technology investments as a solo or small group practice,” the AHA report said.
Hospitals face competition for doctors from insurers, which have been looking in some cases to directly employ more physicians, the AHA also noted. The report cites insurance giant UnitedHealth Group’s Optum unit as the most visible example of this trend.
On a January call about corporate earnings, David Wichmann, then chief executive of UnitedHealth, spoke about the firm’s “aim to reinvent health care delivery,” including efforts to have its own primary and multispecialty care practices.
“OptumCare entered 2021 with over 50,000 physicians and 1,400 clinics,” Mr. Wichmann said. “Over the course of this year, we expect to grow our employed and affiliated physicians by at least 10,000. This work of building local physician-led systems of care continues to be central to our mission. “
UnitedHealth’s new CEO is Andrew Witty, who had led the Optum unit.
Attractions of larger groups
Older doctors – those 55 years and up – were significantly more likely to work in small practices than those younger than 40, the 2020 survey found. Results showed 40.9% of doctors under 40 worked in practices of 10 or fewer colleagues, compared with 61.4% of those age 55 and older.
The large difference between age groups suggests that attrition is one reason for the shift in practice size. Retiring doctors who leave small practices are not being replaced on a one-for-one basis by younger doctors, AMA said. The same reason also appears to be a factor in the shift in practice ownership to larger systems.
Doctors in larger group practices can count on a stable business model, with a better ability to survive disruptive market trends, including those of a more extreme nature, like COVID-19, said Fred Horton, president of AMGA Consulting.
AMGA Consulting is a wholly-owned subsidiary of AMGA, formerly called American Medical Group Association. Its more than 400 members include well-known multispecialty groups and health care systems such as the Mayo Clinic, Cleveland Clinic, Geisinger, the Permanente Medical Group, and Intermountain Healthcare as well as many smaller physician practices.
Mr. Horton, who holds a master’s degree in health administration, said some doctors may want to participate in alternative payment programs offered by insurers, who are seeking to shift away from the fee-for-service model
“Larger organizations can dedicate more resources to continuous quality improvement,” Mr. Horton said. “This is especially important for physicians who are taking on risk-based contracts, as quality can directly impact how much they earn.”
For one oncologist, it was turning to alternative payment methods that helped him keep his private practice afloat.
Kashyap Patel, MD, chief executive of the Carolina Blood and Cancer Care Associates in Rock Hill, S.C., said he maintained the independence of his practice amid pressure from a large health system, which had been buying medical groups in the area. That began to interfere with referrals of patients from other doctors, which are key for cancer specialists, said Dr. Patel, who also is president of the Community Oncology Alliance.
In response, Dr. Patel worked with Blue Cross Blue Shield of South Carolina on an arrangement where his practice sought certifications from the National Committee for Quality Assurance to get better rates.
The effort has allowed Dr. Patel’s clinic to focus more on preventing hospitalizations and visits to the emergency room he said.
In Dr. Patel’s view, his patients benefit from his efforts to remain in independent practice. A switch to ownership by a large health care organization would have put them at risk for higher medical bills, jeopardizing their access to treatment, he said. The reason? Hospitals can charge more for services provided by doctors they employ.
“Nothing would change. I would be the same. The building would be the same, but the cost would go up,” Dr. Patel said.
For its part, the AHA has repeatedly challenged arguments that acquisitions and mergers result in higher costs for patients.
Instead, the AHA has raised alarms about consolidation of health insurers, a concern it shares with AMA. In a 2020 report examining competition among insurers, AMA noted doctors working in small practices can be put at a disadvantage if mergers and acquisitions leave an insurer with too much market power.
“Under antitrust law, independent physicians cannot negotiate collectively with health
Insurers,” the AMA said in the report. “This imbalance in relative size leaves most physicians with a weak bargaining position relative to commercial payers.”
AMA’s research on the effects of insurers’ wielding significant market clout has been used in effort to thwart mergers in this industry.
‘Dramatic restructuring’
The Federal Trade Commission also has taken note of the trends discussed in the new AMA report, saying that “U.S. physician markets are undergoing a dramatic restructuring.”
The FTC in January announced a study of the impact of the consolidation of doctors groups and health care facilities. FTC is seeking data for inpatient, outpatient, and doctors services in 15 states from 2015 through 2020. To gather this data, the commission has issued orders to six major insurers – Aetna, Anthem, Florida Blue, Cigna, Health Care Service Corporation and United Healthcare.
The FTC is concerned that acquired practices may have to alter their referral patterns to favor their affiliated hospital system over competing hospital systems. But FTC staff also said it might be that these acquisitions result in efficiencies, such as enhanced coordination of care between doctors and hospitals “that outweigh potential competitive harms.”
The research project will likely take several years to complete because of its scope, the FTC said. For that reason, the FTC said its Bureau of Economics will release a series of research papers examining different aspects of this inquiry rather than a single paper containing all of the analyses.
Private equity ‘roll-ups’
On the day the FTC announced the study of the impact of doctors groups, one of the panel’s commissioners argued for a closer look at how private equity firms make their purchases.
In a Jan. 15 tweet, FTC Commissioner Rohit Chopra said his agency needs to challenge their “roll-ups of small physician practices” as well as clinics and labs. This is a practice of using a series of acquisitions too small to trigger the federal threshold for a serious look from the FTC and Department of Justice. (The threshold for 2021 stands around the $92 million mark. This benchmark is known as Hart-Scott-Rodino notification after a 1976 law that set a reporting standard.)
Mr. Chopra attached to his Jan. 15 tweet a 2020 statement in which he called for stepped-up scrutiny of private-equity firms’ acquisitions of doctors’ practices. Mr. Chopra noted that private-equity firms have been buying practices focused on anesthesiology and emergency medicine, fields which triggered consumer complaints about surprise billing for emergency care.
“Given trends in today’s markets, it is critical that the FTC find new ways to ensure the agency has a rigorous, data-driven approach to market monitoring and enforcement,” Mr. Chopra wrote.
A version of this article first appeared on WebMD.com.
Bill seeks to streamline prior authorization in Medicare Advantage plans
A group of bipartisan lawmakers intends to compel insurers to streamline prior authorization processes for Medicare Advantage plans, including a bid to end the use of faxes and develop systems that can allow for real-time decisions.
Rep. Suzan DelBene (D-Wash.); Rep. Mike Kelly (R-Pa.); Rep. Ami Bera, MD (D-Calif.); and Rep. Larry Bucshon, MD, (R-Ind.) on May 13 introduced a bill that would task federal officials with refining standards regarding prior authorization for Medicare Advantage. Titled the Improving Seniors’ Timely Access to Care Act of 2021, the bill would direct the Department of Health & Human Services to create rules intended to make prior authorization more transparent and speedy for the insurer-run Medicare plans. Known as Medicare Advantage, these plans cover about 24.1 million people of the 62 million enrolled in the giant federal health program, according to the nonprofit Kaiser Family Foundation.
These revamped prior authorization systems could not rely on faxes nor could they employ proprietary payer portals that did not meet HHS’ standards, says the text of the bill released by Rep. DelBene. Insurers would also have to report to the Centers for Medicare & Medicaid Services about the extent of their use of prior authorization and the rate of approvals or denials. The bill seeks to encourage plans to adopt prior authorization programs that adhere to evidence-based medical guidelines in consultation with physicians.
There were several reasons for focusing on Medicare Advantage plans, although prior authorization concerns extend more broadly in the U.S. health care system, said Susan Bailey, MD, president of the American Medical Association.
There’s an ample body of research about issues seen in the Medicare Advantage plans. Dr. Bailey also said that, in her experience, Medicare Advantage plans have had some of the most restrictive policies. And, by starting with Medicare Advantage, there’s a potential for a ripple effect in the industry, easing this issue when physicians work with other insurers as well.
“When Medicare adopts a policy whether it be a payment policy or a coverage policy, private insurers typically follow along,” she said.
Strong support among health care groups
There’s strong support for streamlining prior authorization both in the medical community and in Congress.
The bill has the support of about 70 health care organizations, including the AMA and the American Academy of Family Physicians, according to its sponsors. As of May 17, the bill had attracted the backing of 97 members of the House of Representatives, roughly evenly split among Democrats and Republicans.
Rep. DelBene’s previous version of this bill, the Improving Seniors’ Timely Access to Care Act of 2019, attracted 143 Democratic cosponsors and 137 Republican ones, or more than half of the members of the House. This bill was not completed during the previous session of Congress (January 2019–January 2021) because of the more urgent needs of pandemic response, said Rep. Bucshon, who practiced cardiothoracic surgery before joining Congress.
“It wasn’t quite on the radar as much as it might have been if we didn’t have COVID,” Rep. Bucshon said.
Rep. Bucshon added that he expects strong Senate support for a companion measure of the House bill, which could make the difference for efforts to pass it this year.
Insurers have become more aggressive over time in denying payments through prior authorization systems for services that physicians say their patients need, according to Rep. Bucshon. There may be some “bad actors” in medicine who would order unnecessary procedures, Rep. Bucshon allowed, but in most cases, the cumbersome prior authorization processes only put a hurdle for patients seeking needed treatments, he said.
“The premise is that it controls health care costs but actually what it does is it helps insurance company’s bottom line,” Rep. Bucshon said.
In a prepared statement, former Pennsylvania representative Allyson Y. Schwartz, now CEO of the Better Medicare Alliance, said her group had spoken with sponsors of this legislation and appreciates “their receptiveness to feedback in this process.”
“Prior authorization ensures beneficiaries receive clinically appropriate care and reduces exposures to duplicative and unnecessary services,” Ms. Schwartz said. “We share an interest in ensuring prior authorization works as smoothly and effectively as possible for beneficiaries while protecting its essential function of facilitating safe, evidenced-based care.”
The Better Medicare Alliance said its funders include UnitedHealth, Humana, and CVS Health/Aetna, which run Advantage plans. The group also lists as its partners many medical organizations.
“Rationing care by hassling”
Like Rep. Bucshon, Dr. Bailey sees a different motivation in insurers’ persistence in keeping the prior authorization process cumbersome.
Phone calls and faxes remain the key methods for handling prior authorization for medical services, according to the results of a survey done by the AMA in December. Phone calls were always or often required for prior authorization for medical services (59%), with faxes the second-most common approach (46%), followed by health plans’ online portals (39%), electronic health records and practice management systems (29%), and email or U.S. mail (26%), according to the AMA’s report on the survey.
“It seems like every step in the process is designed to make the patient less likely to get the therapy that the doctor thinks that the patient needs,” Dr. Bailey said. “It’s almost like rationing care by hassling the patient and the physician.”
The findings of an investigation by HHS’ internal watchdog unit appear to support Dr. Bailey’s view, showing that insurer-run Medicare plans had a pattern of often walking back their initial rejections.
In 2018, the Office of the Inspector General for HHS reported that Medicare Advantage organizations (MAOs) overturned 75% of their own denials during 2014-16. In addition, independent reviewers within the appeals process overturned additional denials in favor of patients and clinicians, OIG said.
“The high number of overturned denials raises concerns that some Medicare Advantage beneficiaries and providers were initially denied services and payments that should have been provided,” the OIG said in the report. “This is especially concerning because beneficiaries and providers rarely used the appeals process, which is designed to ensure access to care and payment.”
During 2014-2016, patients and clinicians appealed only 1% of denials to the first level of appeal, OIG said. In the report, the watchdog group noted that CMS audits had highlighted “widespread and persistent MAO performance problems related to denials of care and payment.” In 2015, for example, CMS cited 56% of audited contracts for making inappropriate denials.
Dr. Bailey also said in an interview that she routinely encounters problems with prior authorization in her own practice as an allergist and immunologist in Fort Worth, Tex.
In late May, for example, a Medicare Advantage plan made a patient whose chronic asthma had been stable for years change to a new inhaler that resulted in him developing a yeast infection in his mouth, Dr. Bailey said.
“We treated the yeast infection, made some changes in the way he uses his inhaler, so hopefully he would tolerate it better,” Dr. Bailey said. “He had a reaction to the medication to treat the yeast infection and ended up in the hospital. How is that helping anyone? It certainly hasn’t helped my patient.”
Dr. Bailey said insurers have also asked to seek prior authorization to prescribe medications that have been generic for years and have used the process to challenge her on cases of what seem to be common sense in medical practice. This included a bid to have Dr. Bailey prescribe a medication in pill form for a 6-month-old baby who had no teeth.
“Every doctor has got absurd stories like that, but unfortunately, every doctor is going to have tragic stories where prior authorization has resulted in death and harm to the patients,” Dr. Bailey said.
Some physicians leave it to the patient to try to overcome insurers’ decisions on prior authorization, seeing this task as falling outside of their duties, Dr. Bailey said.
“I don’t do that. I fight. I spend a lot of time fighting. I don’t like to lose. I don’t like my patients to lose, so I will go to the mat for them,” Dr. Bailey said. “But I’m blessed to be in a specialty where I’ve got loads more control over my schedule than many other specialties do.”
A version of this article first appeared on Medscape.com.