User login
Bringing you the latest news, research and reviews, exclusive interviews, podcasts, quizzes, and more.
CDC: Look for early symptoms of acute flaccid myelitis, report suspected cases
the CDC said in a telebriefing.
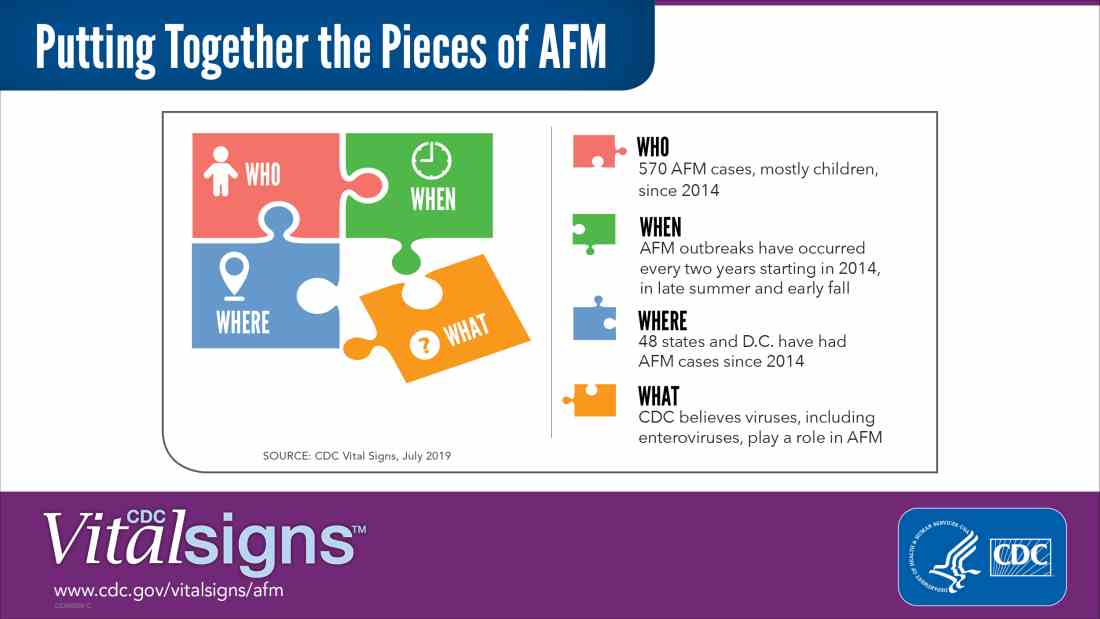
Acute flaccid myelitis (AFM) is defined as acute, flaccid muscle weakness that occurs less than 1 week after a fever or respiratory illness. Viruses, including enterovirus, are believed to play a role in AFM, but the cause still is unknown. The disease appears mostly in children, and the average age of a patient diagnosed with AFM is 5 years.
“Doctors and other clinicians in the United States play a critical role,” Anne Schuchat, MD, principal deputy director of the Centers for Disease Control and Prevention, said in the telebriefing. “We ask for your help with early recognition of patients with AFM symptoms, prompt specimen collection for testing, and immediate reporting of suspected AFM cases to health departments.”
While there is no proven treatment for AFM, early diagnosis is critical to getting patients the best care possible, according to a Vital Signs report released today. This means that clinicians should not wait for the CDC’s case definition before diagnosis, the CDC said.
“When specimens are collected as soon as possible after symptom onset, we have a better chance of understanding the causes of AFM, these recurrent outbreaks, and developing a diagnostic test,” Dr. Schuchat said. “Rapid reporting also helps us to identify and respond to outbreaks early and alert other clinicians and the public.”
AFM appears to follow a seasonal and biennial pattern, with the number of cases increasing mainly in the late summer and early fall. As the season approaches where AFM cases increase, CDC is asking clinicians to look out for patients with suspected AFM so cases can be reported as early as possible.
Since the CDC began tracking AFM, the number of cases has risen every 2 years. In 2018, there were 233 cases in 41 states, the highest number of reported cases since the CDC began tracking AFM following an outbreak in 2014, according to a Vital Signs report. Overall, there have been 570 cases of AFM reported in 48 states and the District of Columbia since 2014.
There is yet to be a confirmatory test for AFM, but clinicians should obtain cerebrospinal fluid, serum, stool and nasopharyngeal swab from patients with suspected AFM as soon as possible, followed by an MRI. AFM has unique MRI features , such as gray matter involvement, that can help distinguish it from other diseases characterized by acute weakness.
In the Vital Signs report, which examined AFM in 2018, 92% of confirmed cases had respiratory symptoms or fever, and 42% of confirmed cases had upper limb involvement. The median time from limb weakness to hospitalization was 1 day, and time from weakness to MRI was 2 days. Cases were reported to the CDC a median of 18 days from onset of limb weakness, but time to reporting ranged between 18 days and 36 days, said Tom Clark, MD, MPH, deputy director of the division of viral diseases at CDC.
“This delay hampers our ability to understand the causes AFM,” he said. “We believe that recognizing AFM early is critical and can lead to better patient management.”
In lieu of a diagnostic test for AFM, clinicians should make management decisions through review of patient symptoms, exam findings, MRI, other test results, and in consulting with neurology experts. The Transverse Myelitis Association also has created a support portal for 24/7 physician consultation in AFM cases.
SOURCE: Lopez A et al. MMWR Morb Mortal Wkly Rep. 2019;68:1-7 .
the CDC said in a telebriefing.
Acute flaccid myelitis (AFM) is defined as acute, flaccid muscle weakness that occurs less than 1 week after a fever or respiratory illness. Viruses, including enterovirus, are believed to play a role in AFM, but the cause still is unknown. The disease appears mostly in children, and the average age of a patient diagnosed with AFM is 5 years.
“Doctors and other clinicians in the United States play a critical role,” Anne Schuchat, MD, principal deputy director of the Centers for Disease Control and Prevention, said in the telebriefing. “We ask for your help with early recognition of patients with AFM symptoms, prompt specimen collection for testing, and immediate reporting of suspected AFM cases to health departments.”
While there is no proven treatment for AFM, early diagnosis is critical to getting patients the best care possible, according to a Vital Signs report released today. This means that clinicians should not wait for the CDC’s case definition before diagnosis, the CDC said.
“When specimens are collected as soon as possible after symptom onset, we have a better chance of understanding the causes of AFM, these recurrent outbreaks, and developing a diagnostic test,” Dr. Schuchat said. “Rapid reporting also helps us to identify and respond to outbreaks early and alert other clinicians and the public.”
AFM appears to follow a seasonal and biennial pattern, with the number of cases increasing mainly in the late summer and early fall. As the season approaches where AFM cases increase, CDC is asking clinicians to look out for patients with suspected AFM so cases can be reported as early as possible.
Since the CDC began tracking AFM, the number of cases has risen every 2 years. In 2018, there were 233 cases in 41 states, the highest number of reported cases since the CDC began tracking AFM following an outbreak in 2014, according to a Vital Signs report. Overall, there have been 570 cases of AFM reported in 48 states and the District of Columbia since 2014.
There is yet to be a confirmatory test for AFM, but clinicians should obtain cerebrospinal fluid, serum, stool and nasopharyngeal swab from patients with suspected AFM as soon as possible, followed by an MRI. AFM has unique MRI features , such as gray matter involvement, that can help distinguish it from other diseases characterized by acute weakness.
In the Vital Signs report, which examined AFM in 2018, 92% of confirmed cases had respiratory symptoms or fever, and 42% of confirmed cases had upper limb involvement. The median time from limb weakness to hospitalization was 1 day, and time from weakness to MRI was 2 days. Cases were reported to the CDC a median of 18 days from onset of limb weakness, but time to reporting ranged between 18 days and 36 days, said Tom Clark, MD, MPH, deputy director of the division of viral diseases at CDC.
“This delay hampers our ability to understand the causes AFM,” he said. “We believe that recognizing AFM early is critical and can lead to better patient management.”
In lieu of a diagnostic test for AFM, clinicians should make management decisions through review of patient symptoms, exam findings, MRI, other test results, and in consulting with neurology experts. The Transverse Myelitis Association also has created a support portal for 24/7 physician consultation in AFM cases.
SOURCE: Lopez A et al. MMWR Morb Mortal Wkly Rep. 2019;68:1-7 .
NEWS FROM THE FDA/CDC
Industry payments influence prescription choices
Two studies show a link between industry payments by drug manufacturers to physicians and doctors’ prescribing patterns for certain medications.

In the first study, lead author Taeho Greg Rhee, PhD, of the University of Connecticut, Farmington, and colleagues analyzed Centers for Medicare & Medicaid Services Part D data and Open Payments data for general payments from industry to physicians associated with gabapentinoids.
Specifically, investigators examined data for three brand name products: Gralise (Assertio) and Horizant (Arbor), both of which are extended release formulas approved for the treatment of seizure disorders and postherpetic neuralgia, and Lyrica (Pfizer), which is approved for treatment of seizure disorders, postherpetic neuralgia, neuropathic pain, and fibromyalgia. To evaluate prescribing patterns, researchers estimated physician prescribing as the physician’s proportion of prescription days filled for the three brand-name gabapentinoids in aggregate of all gabapentinoid prescription days filled.
Between 2014 and 2016, manufacturers of the three brand-name gabapentinoids made approximately 510,000 general payments ($11.5 million) to 51,005 physicians, according to Dr. Rhee and colleagues. The doctors represented 14% of physicians who prescribed any gabapentinoid product under Part D during the same time period.
Among physicians who prescribed any gabapentinoid, generic forms of Gralise (gabapentin; 87%) and Lyrica (pregabalin; 12%) were most frequently prescribed. However, physicians receiving payments from industry were more likely to prescribe the three brand-name gabapentinoids than they were gabapentin (JAMA Intern Med. 2019 July 8. doi: 10.1001/jamainternmed.2019.1082).
Generalist physicians received the majority of payments (62%) payments totaling about $4 million, followed by about $7 million for pain medication specialists and $1 million for other physicians.
The majority of payments were for food and beverages, gifts, or educational materials. In addition, industry payments were most commonly paid to physicians in the southern and eastern regions of the United States.
Among physicians who prescribed gabapentinoids, industry payment was associated with a higher likelihood of prescribing brand-name products than generic gabapentin and that such prescribing patterns increase Medicare spending. Data show that brand name gabapentinoids typically cost account for nearly $2,500 in mean Medicare spending per beneficiary in 2016, compared with less than $20 for a 1-month supply of gabapentin, authors noted.
In the second study, Rishad Khan, MD, of the University of Toronto and colleagues examined the association between industry payments to physicians and Medicare spending on adalimumab (Humira; AbbVie) and certolizumab (Cimzia; Union Chimique Belge), both of which are approved for Crohn’s disease and numerous other indications. Investigators analyzed CMS Part D data and Open Payments data linked to the prescribing of adalimumab and certolizumab. Payments were considered relevant if a gastroenterologist received them from a drug manufacturer the year that the medication was prescribed.
From 2014 to 2016, drug makers made more than $10 million in payments to gastroenterologists prescribing adalimumab or certolizumab, the study found. Investigators found that for every $1 in physician payments, there was a $3.16 increase in spending for adalimumab and a $4.72 increase for certolizumab (JAMA Intern Med. 2019 July 8. doi: 10.1001/jamainternmed.2019.0999).
For adalimumab, payments totaled $5.5 million for speaking and consulting, $4.9 million for food, travel,and lodging expenses, and $13,000 for education. For certolizumab, payments totaled $180,000 for speaking and consulting, $117,000 for food, travel,and lodging expenses, and $60,000 for education.
Dr. Khan and associates concluded that the findings suggest a significant association between industry payments by drug manufacturers to physicians and Medicare spending.
The studies by Rhee et. al. and Khan et. al. add to previous research finding that marketing to physicians is associated with increased sales of a company’s product and higher Medicare expenditures.
While the analyses do not account for other influences on prescribing, such as direct-to-consumer advertising, the pattern they illustrate is indisputable.
Drug manufacturers market to physicians because they write the prescriptions; however, that marketing can obscure the fact that generic drugs are just as effective and generally less expensive than brand-name medications. When there are choices, the generics should be prescribed.
The growing research demonstrating a link between industry payments and physicians’ prescribing of brand-name medications raise troubling questions about whether such payments are in the best interest of patients.
Robert Steinbrook, MD, is editor at large for JAMA Internal Medicine. His comments are adapted from an editorial (JAMA Intern Med. 2019 July 8. doi:10.1001/jamainternmed.2019.1081) accompanying the studies by Rhee et al. and Khan et al.
Two studies show a link between industry payments by drug manufacturers to physicians and doctors’ prescribing patterns for certain medications.
In the first study, lead author Taeho Greg Rhee, PhD, of the University of Connecticut, Farmington, and colleagues analyzed Centers for Medicare & Medicaid Services Part D data and Open Payments data for general payments from industry to physicians associated with gabapentinoids.
Specifically, investigators examined data for three brand name products: Gralise (Assertio) and Horizant (Arbor), both of which are extended release formulas approved for the treatment of seizure disorders and postherpetic neuralgia, and Lyrica (Pfizer), which is approved for treatment of seizure disorders, postherpetic neuralgia, neuropathic pain, and fibromyalgia. To evaluate prescribing patterns, researchers estimated physician prescribing as the physician’s proportion of prescription days filled for the three brand-name gabapentinoids in aggregate of all gabapentinoid prescription days filled.
Between 2014 and 2016, manufacturers of the three brand-name gabapentinoids made approximately 510,000 general payments ($11.5 million) to 51,005 physicians, according to Dr. Rhee and colleagues. The doctors represented 14% of physicians who prescribed any gabapentinoid product under Part D during the same time period.
Among physicians who prescribed any gabapentinoid, generic forms of Gralise (gabapentin; 87%) and Lyrica (pregabalin; 12%) were most frequently prescribed. However, physicians receiving payments from industry were more likely to prescribe the three brand-name gabapentinoids than they were gabapentin (JAMA Intern Med. 2019 July 8. doi: 10.1001/jamainternmed.2019.1082).
Generalist physicians received the majority of payments (62%) payments totaling about $4 million, followed by about $7 million for pain medication specialists and $1 million for other physicians.
The majority of payments were for food and beverages, gifts, or educational materials. In addition, industry payments were most commonly paid to physicians in the southern and eastern regions of the United States.
Among physicians who prescribed gabapentinoids, industry payment was associated with a higher likelihood of prescribing brand-name products than generic gabapentin and that such prescribing patterns increase Medicare spending. Data show that brand name gabapentinoids typically cost account for nearly $2,500 in mean Medicare spending per beneficiary in 2016, compared with less than $20 for a 1-month supply of gabapentin, authors noted.
In the second study, Rishad Khan, MD, of the University of Toronto and colleagues examined the association between industry payments to physicians and Medicare spending on adalimumab (Humira; AbbVie) and certolizumab (Cimzia; Union Chimique Belge), both of which are approved for Crohn’s disease and numerous other indications. Investigators analyzed CMS Part D data and Open Payments data linked to the prescribing of adalimumab and certolizumab. Payments were considered relevant if a gastroenterologist received them from a drug manufacturer the year that the medication was prescribed.
From 2014 to 2016, drug makers made more than $10 million in payments to gastroenterologists prescribing adalimumab or certolizumab, the study found. Investigators found that for every $1 in physician payments, there was a $3.16 increase in spending for adalimumab and a $4.72 increase for certolizumab (JAMA Intern Med. 2019 July 8. doi: 10.1001/jamainternmed.2019.0999).
For adalimumab, payments totaled $5.5 million for speaking and consulting, $4.9 million for food, travel,and lodging expenses, and $13,000 for education. For certolizumab, payments totaled $180,000 for speaking and consulting, $117,000 for food, travel,and lodging expenses, and $60,000 for education.
Dr. Khan and associates concluded that the findings suggest a significant association between industry payments by drug manufacturers to physicians and Medicare spending.
Metformin linked to lower dementia risk in black patients
Black individuals who develop type 2 diabetes are more likely than their white counterparts to develop dementia. Now, findings from a new study point to a possible preventive strategy: Putting older patients on metformin when they are diagnosed could reduce their risk for dementia by as much as 40%, whereas sulfonylureas do not seem to have such an effect.
The researchers did not examine cause and effect, so their findings are not conclusive, and very few women were included in the study. Still, the authors said that their data showing a 29% lower risk of dementia associated with metformin use in black patients aged 65-74 years, and a 40% lower risk in those aged 50-64 years, suggested that “this inexpensive, widely available treatment could be broadly prescribed to substantially reduce the risk of dementia in younger [black] patients with [type 2 diabetes]” (Ann Fam Med. 2019;17:352-62).
Previous findings have suggested that black patients with type 2 diabetes face a 10%-18% higher risk of dementia, compared with white patients (Diabetes Care. 2014; 37[4]:1009-15). Another study linked type 2 diabetes in middle-aged black patients to a 41% decrease in cognition per test results over 14 years. There was no such decrease in white patients (Neuroepidemiology. 2014;43[3-4]: 220-7).
For the new study, researchers led by Jeffrey F. Scherrer, PhD, of Saint Louis University tracked 73,761 patients aged 50 years or older from 2000-2001 (when they were free of dementia and not taking diabetes) to 2015. Among the patients, 86% were white and 14% were black. In the white and black groups, 97% and 95% were men, respectively, and 61% and 55% were obese, respectively.
All participants began metformin (76%) or sulfonylurea (24%) monotherapy after the baseline period. Guidelines recommend metformin as a first-line treatment for type 2 diabetes, whereas sulfonylureas are considered second-line drugs that should be added to metformin.
After adjustment for confounders such as socioeconomic status and other medical conditions, the researchers found a significantly lower risk of dementia in black patients who took metformin, compared with those taking a sulfonylurea (hazard ratio, 0.73; 95% confidence interval, 0.6-0.89). There was no difference between the drugs among white patients (HR, 0.96; 95% CI, 0.9-1.03, both P = .008)
The results were not statistically significant among age groups, but there were trends. In black patients, the dementia-lowering benefit was largest among those aged 50-64 years (HR, 0.6; 95% CI, 0.45-0.81), followed by those aged 65-74 years (HR, 0.71; 95% CI, 0.53-0.94), and there was no benefit among those aged at least 75 (HR, 1.17; 95% CI, 0.73-1.85) all P = .055. There was a slight benefit among white patients in one of the age groups – 65-74 years (HR, 0.9; 95% CI, 0.82-0.99; P = .315).
The authors suggested that the findings could have been the result of an effect of metformin to reduce vascular disease and chronic inflammation in black patients.
They also noted that further research is needed to identify the demographic and clinical subgroups in which metformin is most strongly associated with a reduction in the risk of dementia. In addition, they emphasized that clinical trials are needed to confirm the study findings.
The National Institutes of Health funded the study. The authors report no relevant disclosures.
SOURCE: Scherrer JF et al. Ann Fam Med. 2019;17:352-62.
FROM ANNALS OF FAMILY MEDICINE
Key clinical point:
Major finding: Metformin monotherapy, compared with sulfonylurea monotherapy, was linked to a significantly lower risk for dementia in black patients (HR, 0.73; 95% CI, 0.6-0.89), but not in white patients (HR, 0.96; 95% CI, 0.9-1.03; P = .008).
Study details: Retrospective analysis of 73,761 patients aged 50 years or older in the Veterans Health Administration system who were tracked from 2000-2001 to 2015 and began metformin or sulfonylurea monotherapy after baseline.
Disclosures: The National Institutes of Health funded the study. The authors report no relevant disclosures.
Source: Scherrer JF et al. Ann Fam Med. 2019;17:352-62.
Tranexamic acid may not improve neurologic outcomes in patients with TBI
PHILADELPHIA – according to an investigation presented at the annual meeting of the American Academy of Neurology. For patients with TBI and intracranial hemorrhage (ICH), however, treatment with a 2-gram bolus of tranexamic acid within 42 minutes of injury significantly improves the rate of 28-day survival. Tranexamic acid therefore “is the first therapeutic with evidence for benefit in acute TBI,” said Susan Rowell, MD, trauma medical director at Duke University in Durham, North Carolina.

No effective treatment is available for TBI, which is a major cause of death after trauma. In 2010, the CRASH-2 trial (Lancet. 2010 Jul 03;376[9734]:23-32), suggested that tranexamic acid, a lysine analogue that decreases the breakdown of clots, safely reduced the rate of death from hemorrhage in patients with trauma and bleeding. Patients treated within 1 hour of injury were significantly more likely to survive than those treated at 1 hour or more after injury.
Two small, prospective trials failed to show that tranexamic acid reduced in-hospital mortality, improved neurologic function at discharge, or reduced the progression of ICH. A meta-analysis of both trials, however, showed a trend toward a benefit of treatment with this therapy.
A multicenter, prehospital trial
Dr. Rowell and colleagues hypothesized that prehospital administration of tranexamic acid to patients with moderate to severe TBI early after injury would increase the likelihood of a favorable neurologic outcome. Between March 2015 and March 2017, they enrolled 1,280 participants in a multicenter, prehospital trial. Eligible participants had moderate to severe TBI, were not in shock (as evidenced by a systolic blood pressure greater than 90 mm Hg before randomization), and were enrolled within 2 hours of injury.
Patients were randomized to one of three treatment arms and followed for 6 months. The first treatment arm received a 1-gram bolus of tranexamic acid before hospital admission and an 8-hour, 1-gram infusion of tranexamic acid in the hospital. The second arm received a 2-gram bolus of tranexamic acid before hospital admission and a placebo infusion in the hospital. The third arm received a placebo bolus and placebo infusion. Paramedics and participants were blinded to treatment assignment. The trial was conducted at 20 hospitals and 39 emergency medical services agencies in the United States and Canada.
The study’s primary outcome was functional neurologic outcome at 6 months, as measured by the Glasgow Outcomes Scale – Extended (GOSE). The investigators dichotomized results into favorable and poor categories. Other prespecified outcomes included early and late mortality, the disability rating scale (DRS), and progression of ICH.
Treatment was administered early
The researchers identified 1,280 eligible patients, of whom 1,063 were randomized. The modified intention-to-treat analysis included 309 participants in the placebo group, 312 in the bolus-maintenance group (the 1-gram group), and 345 in the bolus-only group (the 2-gram group). The population’s average age was approximately 42 years, and 75% of the sample was male. About half of the patients had a Glasgow Coma Scale score between 3 and 8. Injury severity and prehospital care were similar among the groups.
The researchers provided the drug infusion at an average of 0.7 hours (42 minutes) after injury, “which is actually quite early,” said Dr. Rowell. They observed few infusion-related deviations, and the entire bolus was infused in about 95% of patients. Approximately 70% of patients received the full 8-hour infusion. This result was influenced partly by stopping rules and by providers who requested unblinding to give open-label tranexamic acid. Overall, 57% of patients in the trial had an ICH on head CT, which was approximately the proportion that the researchers had anticipated.
Dr. Rowell and colleagues completed the 6-month follow-up for 85% of patients. They saw no difference in the 6-month neurologic outcome between the group of all patients who received tranexamic acid and those who received placebo. The investigators also saw no differences between groups in early and late mortality and the DRS.
About half of patients with ICH were evaluated for progression. Progression occurred in 20% of the placebo arm, 17% of the bolus-maintenance arm, and 15% of the bolus-only arm. The differences between groups were not statistically significant. Participants in the bolus-only group, however, were significantly less likely to die, compared with the placebo and the bolus-maintenance groups. The odds ratio of death for the bolus-only group, compared with the others, was about 0.5. The absolute mortality rate for the placebo and bolus-maintenance groups was 17%, compared with 12% for the bolus-only group. Most deaths were attributable to TBI, and few patients died of exsanguination.
In addition, the bolus-only group also had improved long-term neurologic outcome, as assessed by the 6-month DRS and the 6-month GOSE, compared with the bolus maintenance group.
Among patients with ICH, survival increased by approximately 12% at 10 hours after injury in the bolus-only group, compared with the bolus-maintenance and placebo groups. This difference persisted throughout the follow-up period, said Dr. Rowell.
Among predefined major adverse events, seizure-like activity occurred in 5% of the bolus-only group, compared with 2% of the placebo and bolus-maintenance groups. The researchers found no significant differences in any thrombotic event between the bolus-only group and the placebo group.
The study was sponsored by University of Washington, Seattle. Collaborators included the National Heart, Lung, and Blood Institute; the U.S. Army Medical Research and Development Command; and the American Heart Association. Dr. Rowell had no relevant disclosures.
SOURCE: Rowell S et al. AAN 2019, Abstract.
PHILADELPHIA – according to an investigation presented at the annual meeting of the American Academy of Neurology. For patients with TBI and intracranial hemorrhage (ICH), however, treatment with a 2-gram bolus of tranexamic acid within 42 minutes of injury significantly improves the rate of 28-day survival. Tranexamic acid therefore “is the first therapeutic with evidence for benefit in acute TBI,” said Susan Rowell, MD, trauma medical director at Duke University in Durham, North Carolina.
No effective treatment is available for TBI, which is a major cause of death after trauma. In 2010, the CRASH-2 trial (Lancet. 2010 Jul 03;376[9734]:23-32), suggested that tranexamic acid, a lysine analogue that decreases the breakdown of clots, safely reduced the rate of death from hemorrhage in patients with trauma and bleeding. Patients treated within 1 hour of injury were significantly more likely to survive than those treated at 1 hour or more after injury.
Two small, prospective trials failed to show that tranexamic acid reduced in-hospital mortality, improved neurologic function at discharge, or reduced the progression of ICH. A meta-analysis of both trials, however, showed a trend toward a benefit of treatment with this therapy.
A multicenter, prehospital trial
Dr. Rowell and colleagues hypothesized that prehospital administration of tranexamic acid to patients with moderate to severe TBI early after injury would increase the likelihood of a favorable neurologic outcome. Between March 2015 and March 2017, they enrolled 1,280 participants in a multicenter, prehospital trial. Eligible participants had moderate to severe TBI, were not in shock (as evidenced by a systolic blood pressure greater than 90 mm Hg before randomization), and were enrolled within 2 hours of injury.
Patients were randomized to one of three treatment arms and followed for 6 months. The first treatment arm received a 1-gram bolus of tranexamic acid before hospital admission and an 8-hour, 1-gram infusion of tranexamic acid in the hospital. The second arm received a 2-gram bolus of tranexamic acid before hospital admission and a placebo infusion in the hospital. The third arm received a placebo bolus and placebo infusion. Paramedics and participants were blinded to treatment assignment. The trial was conducted at 20 hospitals and 39 emergency medical services agencies in the United States and Canada.
The study’s primary outcome was functional neurologic outcome at 6 months, as measured by the Glasgow Outcomes Scale – Extended (GOSE). The investigators dichotomized results into favorable and poor categories. Other prespecified outcomes included early and late mortality, the disability rating scale (DRS), and progression of ICH.
Treatment was administered early
The researchers identified 1,280 eligible patients, of whom 1,063 were randomized. The modified intention-to-treat analysis included 309 participants in the placebo group, 312 in the bolus-maintenance group (the 1-gram group), and 345 in the bolus-only group (the 2-gram group). The population’s average age was approximately 42 years, and 75% of the sample was male. About half of the patients had a Glasgow Coma Scale score between 3 and 8. Injury severity and prehospital care were similar among the groups.
The researchers provided the drug infusion at an average of 0.7 hours (42 minutes) after injury, “which is actually quite early,” said Dr. Rowell. They observed few infusion-related deviations, and the entire bolus was infused in about 95% of patients. Approximately 70% of patients received the full 8-hour infusion. This result was influenced partly by stopping rules and by providers who requested unblinding to give open-label tranexamic acid. Overall, 57% of patients in the trial had an ICH on head CT, which was approximately the proportion that the researchers had anticipated.
Dr. Rowell and colleagues completed the 6-month follow-up for 85% of patients. They saw no difference in the 6-month neurologic outcome between the group of all patients who received tranexamic acid and those who received placebo. The investigators also saw no differences between groups in early and late mortality and the DRS.
About half of patients with ICH were evaluated for progression. Progression occurred in 20% of the placebo arm, 17% of the bolus-maintenance arm, and 15% of the bolus-only arm. The differences between groups were not statistically significant. Participants in the bolus-only group, however, were significantly less likely to die, compared with the placebo and the bolus-maintenance groups. The odds ratio of death for the bolus-only group, compared with the others, was about 0.5. The absolute mortality rate for the placebo and bolus-maintenance groups was 17%, compared with 12% for the bolus-only group. Most deaths were attributable to TBI, and few patients died of exsanguination.
In addition, the bolus-only group also had improved long-term neurologic outcome, as assessed by the 6-month DRS and the 6-month GOSE, compared with the bolus maintenance group.
Among patients with ICH, survival increased by approximately 12% at 10 hours after injury in the bolus-only group, compared with the bolus-maintenance and placebo groups. This difference persisted throughout the follow-up period, said Dr. Rowell.
Among predefined major adverse events, seizure-like activity occurred in 5% of the bolus-only group, compared with 2% of the placebo and bolus-maintenance groups. The researchers found no significant differences in any thrombotic event between the bolus-only group and the placebo group.
The study was sponsored by University of Washington, Seattle. Collaborators included the National Heart, Lung, and Blood Institute; the U.S. Army Medical Research and Development Command; and the American Heart Association. Dr. Rowell had no relevant disclosures.
SOURCE: Rowell S et al. AAN 2019, Abstract.
REPORTING FROM AAN 2019
Key clinical point: Early administration of tranexamic acid after TBI does not improve neurologic outcome at 6 months.
Major finding: Patients with TBI and ICH who received a 2-g bolus of tranexamic acid had a 50% lower rate of mortality.
Study details: A multicenter, prehospital trial that enrolled 1,063 patients with moderate to severe TBI.
Disclosures: The study was sponsored by University of Washington, Seattle. Collaborators included the National Heart, Lung, and Blood Institute; the U.S. Army Medical Research and Development Command; and the American Heart Association. Dr. Rowell had no relevant disclosures.
Source: Rowell S et al. AAN 2019, Abstract.
AASM hypopnea definition best for detecting OSA cases, study finds
SAN DIEGO – The prevalence of obstructive sleep apnea (OSA) is substantially lower using the Centers for Medicare & Medicaid Services apnea-hypopnea index definition of OSA than using the one recommended by the American Academy of Sleep Medicine.

In addition,
The findings come from an analysis which set out to assess the relationship between OSA and hypertension using the AASM-recommended definition and the 2018 American Heart Association/American College of Cardiology blood pressure guidelines, and to determine if there is an association between hypertension and OSA among individuals who did not meet the CMS definition of OSA.
“Given the substantial morbidity associated with hypertension, these results suggest that universal adoption of the AASM AHI definition would be a reasonable step in ensuring appropriate diagnosis and treatment of OSA,” lead study author Stuart F. Quan, MD, said at the annual meeting of the Associated Professional Sleep Societies.
Dr. Quan, of the division of sleep and circadian disorders at Brigham and Women’s Hospital in Boston, noted that a number of studies have demonstrated that OSA is a risk factor for hypertension and a variety of other medical conditions. “Rightly or wrongly, the most important metric for determining whether OSA is present and determining its severity, is the apnea-hypopnea index,” he said. “It’s the most common metric used for determining OSA severity, and mostly importantly, Medicare and some other insurers use this metric to determine whether a person is eligible for treatment. If a person falls above the line, they can get continuous positive airway pressure, for example. If they’re below the line, that’s too bad; they don’t have OSA insofar as the insurance company is concerned.”
There is no controversy as to what constitutes apnea, he continued, but some disagreement exists on the definition of hypopnea. The AASM recommends using a 3% oxygen desaturation or an arousal, while Medicare uses a definition of hypopnea requiring only a 4% oxygen desaturation. Hypertension definitions have changed recently as well. Before 2018, the definition of hypertension was greater than 140/90 mm Hg for people younger than age 65 years and 150/80 mm Hg for people age 65 years and older. In 2018, the AHA and ACC changed the hypertension guidelines, defining normal as less than 120/80 mm Hg.
“Previous studies linking OSA and hypertension used older definitions, but to my knowledge there are no current studies examining the association between OSA and hypertension using new definitions,” Dr. Quan said.
He reported on results from an analysis of 6,307 participants in the Sleep Heart Health Study who underwent home polysomnography. Their AHI defined by a 3% oxygen desaturation or an arousal was classified into four categories of OSA severity: fewer than 5 events per hour (normal sleep), 5-14 events per hour (mild sleep apnea), 15-29 events per hour (moderate sleep apnea), and 30 or more events per hour (severe sleep apnea).
The researchers used three definitions of dichotomous BP elevation: elevated (greater than 120/80 mm Hg or use of hypertension medications [meds]), stage 1 (greater than 130/80 mm Hg or meds), or stage 2 (greater than 140/90 mm Hg or meds). They used logistic regression to assess the association between elevated BP and/or hypertension and OSA severity, controlling for demographics and body mass index. Additional analyses utilized multiple linear regression to determine the relationship between natural log AHI and systolic and diastolic BP, controlling for the same covariates.
For all definitions of elevated BP, increasing OSA severity was associated with greater likelihood of an elevated or hypertensive status in fully adjusted models. Specifically, the odds ratios among those with elevated BP was 1.30 (95% confidence interval, 1.10-1.54), 1.41 (95% CI, 1.15-1.72), and 1.69 (95% CI, 1.32-2.17) for mild, moderate, and severe sleep apnea, respectively. The ORs among those with stage 1 BP was 1.27 (95% CI, 1.09-1.49), 1.36 (95% CI, 1.13-1.63), 1.58 (95% CI, 1.27-1.97) for mild, moderate, and severe sleep apnea, while the OR among those with stage 2 BP was 1.07 (95% CI, 0.92-1.26), 1.22 (95% CI, 1.02-1.45), 1.38 (95% CI, 1.12-1.69) for mild, moderate, and severe sleep apnea. Linear regression found that AHI was associated with both systolic and diastolic BP in fully adjusted models.
“Using the AASM and CMS AHI definitions, increasing severity of AHI is associated with greater likelihood of having an elevated blood pressure or hypertension,” Dr. Quan concluded. “However, the prevalence of OSA was substantially lower using the CMS definition of OSA. In fact, 218 of these individuals had moderate to severe OSA when the AASM definition was applied.”
He characterized the study as “a practical analysis, a way to help identify patients who might benefit from treatment. This is not the issue of whether the science of 3% AHI is better than 4%.”
The Sleep Heart Health Study was supported by the National Heart, Lung, and Blood Institute. Dr. Quan reported that he helped draft the AASM AHI recommendations but had no other relevant disclosures.
SOURCE: Quan SF et al. SLEEP 2019, Abstract 0501.
SAN DIEGO – The prevalence of obstructive sleep apnea (OSA) is substantially lower using the Centers for Medicare & Medicaid Services apnea-hypopnea index definition of OSA than using the one recommended by the American Academy of Sleep Medicine.
In addition,
The findings come from an analysis which set out to assess the relationship between OSA and hypertension using the AASM-recommended definition and the 2018 American Heart Association/American College of Cardiology blood pressure guidelines, and to determine if there is an association between hypertension and OSA among individuals who did not meet the CMS definition of OSA.
“Given the substantial morbidity associated with hypertension, these results suggest that universal adoption of the AASM AHI definition would be a reasonable step in ensuring appropriate diagnosis and treatment of OSA,” lead study author Stuart F. Quan, MD, said at the annual meeting of the Associated Professional Sleep Societies.
Dr. Quan, of the division of sleep and circadian disorders at Brigham and Women’s Hospital in Boston, noted that a number of studies have demonstrated that OSA is a risk factor for hypertension and a variety of other medical conditions. “Rightly or wrongly, the most important metric for determining whether OSA is present and determining its severity, is the apnea-hypopnea index,” he said. “It’s the most common metric used for determining OSA severity, and mostly importantly, Medicare and some other insurers use this metric to determine whether a person is eligible for treatment. If a person falls above the line, they can get continuous positive airway pressure, for example. If they’re below the line, that’s too bad; they don’t have OSA insofar as the insurance company is concerned.”
There is no controversy as to what constitutes apnea, he continued, but some disagreement exists on the definition of hypopnea. The AASM recommends using a 3% oxygen desaturation or an arousal, while Medicare uses a definition of hypopnea requiring only a 4% oxygen desaturation. Hypertension definitions have changed recently as well. Before 2018, the definition of hypertension was greater than 140/90 mm Hg for people younger than age 65 years and 150/80 mm Hg for people age 65 years and older. In 2018, the AHA and ACC changed the hypertension guidelines, defining normal as less than 120/80 mm Hg.
“Previous studies linking OSA and hypertension used older definitions, but to my knowledge there are no current studies examining the association between OSA and hypertension using new definitions,” Dr. Quan said.
He reported on results from an analysis of 6,307 participants in the Sleep Heart Health Study who underwent home polysomnography. Their AHI defined by a 3% oxygen desaturation or an arousal was classified into four categories of OSA severity: fewer than 5 events per hour (normal sleep), 5-14 events per hour (mild sleep apnea), 15-29 events per hour (moderate sleep apnea), and 30 or more events per hour (severe sleep apnea).
The researchers used three definitions of dichotomous BP elevation: elevated (greater than 120/80 mm Hg or use of hypertension medications [meds]), stage 1 (greater than 130/80 mm Hg or meds), or stage 2 (greater than 140/90 mm Hg or meds). They used logistic regression to assess the association between elevated BP and/or hypertension and OSA severity, controlling for demographics and body mass index. Additional analyses utilized multiple linear regression to determine the relationship between natural log AHI and systolic and diastolic BP, controlling for the same covariates.
For all definitions of elevated BP, increasing OSA severity was associated with greater likelihood of an elevated or hypertensive status in fully adjusted models. Specifically, the odds ratios among those with elevated BP was 1.30 (95% confidence interval, 1.10-1.54), 1.41 (95% CI, 1.15-1.72), and 1.69 (95% CI, 1.32-2.17) for mild, moderate, and severe sleep apnea, respectively. The ORs among those with stage 1 BP was 1.27 (95% CI, 1.09-1.49), 1.36 (95% CI, 1.13-1.63), 1.58 (95% CI, 1.27-1.97) for mild, moderate, and severe sleep apnea, while the OR among those with stage 2 BP was 1.07 (95% CI, 0.92-1.26), 1.22 (95% CI, 1.02-1.45), 1.38 (95% CI, 1.12-1.69) for mild, moderate, and severe sleep apnea. Linear regression found that AHI was associated with both systolic and diastolic BP in fully adjusted models.
“Using the AASM and CMS AHI definitions, increasing severity of AHI is associated with greater likelihood of having an elevated blood pressure or hypertension,” Dr. Quan concluded. “However, the prevalence of OSA was substantially lower using the CMS definition of OSA. In fact, 218 of these individuals had moderate to severe OSA when the AASM definition was applied.”
He characterized the study as “a practical analysis, a way to help identify patients who might benefit from treatment. This is not the issue of whether the science of 3% AHI is better than 4%.”
The Sleep Heart Health Study was supported by the National Heart, Lung, and Blood Institute. Dr. Quan reported that he helped draft the AASM AHI recommendations but had no other relevant disclosures.
SOURCE: Quan SF et al. SLEEP 2019, Abstract 0501.
REPORTING FROM SLEEP 2019
Can serum inflammatory markers predict concussion recovery?
Levels of interleukin-6 (IL-6) and IL-1 receptor antagonist (IL-1RA) are significantly elevated 6 hours after concussion, and higher IL-6 levels are associated with slower recovery, according to a study of 41 high school and college football players with concussion. The findings were published online ahead of print July 3 in Neurology.

“With so many people sustaining concussions and a sizeable number of them having prolonged symptoms and recovery, any tools we can develop to help determine who would be at greater risk of problems would be very beneficial,” said study author Timothy B. Meier, PhD, assistant professor of neurosurgery at the Medical College of Wisconsin in Milwaukee, in a news release. “These results are a crucial first step.”
Symptoms of sport-related concussion typically resolve within 1-2 weeks but may last longer. Although prior studies have focused on biomarkers that are specific to brain injury, nonspecific inflammatory markers also may hold promise in predicting recovery after a mild traumatic brain injury, the authors said.
To examine whether acute elevations in serum inflammatory markers predict symptom recovery following sport-related concussion, Dr. Meier and his research colleagues enrolled 857 high school and college football players into a prospective cohort study. They included in their analyses 41 concussed athletes and 43 matched control athletes with an average age of 18 years. None of the concussed athletes lost consciousness, two had posttraumatic amnesia, and one had retrograde amnesia. The concussed athletes had a mean symptom duration of 8.86 days.
The researchers measured serum levels of IL-6, IL-1RA, IL-1 beta, IL-10, tumor necrosis factor, C-reactive protein, and interferon-gamma and recorded Sport Concussion Assessment Tool, 3rd edition, symptom severity scores.
Participants with concussion underwent testing at the start of the season, within 6 hours of injury, 24-48 hours after injury, and at 8, 15, and 45 days after injury. Control athletes underwent testing at similar times.
Among athletes with concussion, IL-1RA and IL-6 were elevated at 6 hours, compared with all other postinjury visits and with controls. IL-6 and IL-1RA significantly discriminated concussed from control athletes at 6 hours postconcussion with an area under the receiver operating characteristic curve of 0.79 for IL-6 and 0.79 for IL-1RA. Furthermore, IL-6 levels at 6 hours significantly correlated with symptom duration, “with a 1-unit increase in natural log-transformed IL-6 associated with 39% lower hazard of symptom recovery,” the researchers reported.
The extent to which these results generalize to females, youth athletes, or athletes who develop postconcussion syndrome is unclear, and larger studies may be needed to adequately assess inflammatory markers as clinical biomarkers of sport-related concussion, the authors noted.
“Eventually, these results may help us better understand the relationship between injury and inflammation and potentially lead to new treatments,” Dr. Meier said.
The research was supported by the U.S. Department of Defense, National Institute of Neurological Disorders and Stroke, National Institute of General Medical Sciences, National Institute of Mental Health, and the National Center for Advancing Translational Sciences. The authors had no relevant disclosures.
SOURCE: Nitta ME et al. Neurology. 2019 Jul 3. doi: 10.1212/WNL.0000000000007864.
Levels of interleukin-6 (IL-6) and IL-1 receptor antagonist (IL-1RA) are significantly elevated 6 hours after concussion, and higher IL-6 levels are associated with slower recovery, according to a study of 41 high school and college football players with concussion. The findings were published online ahead of print July 3 in Neurology.
“With so many people sustaining concussions and a sizeable number of them having prolonged symptoms and recovery, any tools we can develop to help determine who would be at greater risk of problems would be very beneficial,” said study author Timothy B. Meier, PhD, assistant professor of neurosurgery at the Medical College of Wisconsin in Milwaukee, in a news release. “These results are a crucial first step.”
Symptoms of sport-related concussion typically resolve within 1-2 weeks but may last longer. Although prior studies have focused on biomarkers that are specific to brain injury, nonspecific inflammatory markers also may hold promise in predicting recovery after a mild traumatic brain injury, the authors said.
To examine whether acute elevations in serum inflammatory markers predict symptom recovery following sport-related concussion, Dr. Meier and his research colleagues enrolled 857 high school and college football players into a prospective cohort study. They included in their analyses 41 concussed athletes and 43 matched control athletes with an average age of 18 years. None of the concussed athletes lost consciousness, two had posttraumatic amnesia, and one had retrograde amnesia. The concussed athletes had a mean symptom duration of 8.86 days.
The researchers measured serum levels of IL-6, IL-1RA, IL-1 beta, IL-10, tumor necrosis factor, C-reactive protein, and interferon-gamma and recorded Sport Concussion Assessment Tool, 3rd edition, symptom severity scores.
Participants with concussion underwent testing at the start of the season, within 6 hours of injury, 24-48 hours after injury, and at 8, 15, and 45 days after injury. Control athletes underwent testing at similar times.
Among athletes with concussion, IL-1RA and IL-6 were elevated at 6 hours, compared with all other postinjury visits and with controls. IL-6 and IL-1RA significantly discriminated concussed from control athletes at 6 hours postconcussion with an area under the receiver operating characteristic curve of 0.79 for IL-6 and 0.79 for IL-1RA. Furthermore, IL-6 levels at 6 hours significantly correlated with symptom duration, “with a 1-unit increase in natural log-transformed IL-6 associated with 39% lower hazard of symptom recovery,” the researchers reported.
The extent to which these results generalize to females, youth athletes, or athletes who develop postconcussion syndrome is unclear, and larger studies may be needed to adequately assess inflammatory markers as clinical biomarkers of sport-related concussion, the authors noted.
“Eventually, these results may help us better understand the relationship between injury and inflammation and potentially lead to new treatments,” Dr. Meier said.
The research was supported by the U.S. Department of Defense, National Institute of Neurological Disorders and Stroke, National Institute of General Medical Sciences, National Institute of Mental Health, and the National Center for Advancing Translational Sciences. The authors had no relevant disclosures.
SOURCE: Nitta ME et al. Neurology. 2019 Jul 3. doi: 10.1212/WNL.0000000000007864.
FROM NEUROLOGY
Key clinical point: Serum biomarkers of inflammation may help identify which athletes will take longer to recover after a sport-related concussion.
Major finding: IL-6 and IL-1RA significantly discriminated concussed from control athletes at 6 hours postconcussion with an area under the receiver operating characteristic curve of 0.79 for IL-6 and 0.79 for IL-1RA. Furthermore, IL-6 levels at 6 hours significantly correlated with symptom duration.
Study details: A prospective cohort study of high school and college football players. The analyses included 41 concussed athletes and 43 matched control athletes with an average age of about 18 years.
Disclosures: The research was supported by the U.S. Department of Defense, National Institute of Neurological Disorders and Stroke, National Institute of General Medical Sciences, National Institute of Mental Health, and the National Center for Advancing Translational Sciences. The authors had no relevant disclosures.
Source: Nitta ME et al. Neurology. 2019 Jul 3. doi: 10.1212/WNL.0000000000007864.
Sleepiest OSA patients have worse CV outcomes
SAN ANTONIO – Patients with obstructive sleep apnea who complain of feeling tired when they wake up, being sleepy during the day, and have a high score on the Epworth Sleepiness Scale face an increased risk for cardiovascular disease, results from a population-based analysis suggest.
“OSA is a highly heterogeneous disease, with multiple clinical presentations and consequences,” the study’s first author, Diego R. Mazzotti, PhD, said at the annual meeting of the Associated Professional Sleep Societies. “These patients also have diverse comorbidities, and there are arbitrary severity definitions and variable therapeutic responses. It’s difficult to lump these patients together.”
Symptom subtypes of OSA were originally described in the Icelandic Sleep Apnea Cohort, and defined as excessively sleepy, minimally symptomatic, and disturbed sleep (Eur Respir J. 2014; 44[6]:1600-7). These distinct clusters were identified based on symptom experiences and the existence of major comorbidities. “This concept is more popular today, trying to identify symptom clusters, or groups of individuals, that share similar polysomnographic data, and then compare differences in prevalence or incidence of cardiovascular disease,” said Dr. Mazzotti, a research associate at the University of Pennsylvania, Philadelphia. “That’s a concept that needs to be moving forward.”
Dr. Mazzotti and colleagues set out to determine if OSA symptom subtypes are present in the Sleep Heart Health Study, a multicenter, prospective, community-based cohort of individuals aged 40 years and older designed to assess the cardiovascular (CV) consequences of OSA. They also wanted to know if there is additional evidence of the relevance of OSA symptom subtypes, particularly with respect to cardiovascular disease .
Participant-reported symptoms, such as difficulty falling and staying asleep, snoring, fatigue, drowsy driving and daytime sleepiness, and responses to the Epworth Sleepiness Scale were used to determine the patient’s subtype. Assessments including questionnaires and in-home polysomnography were conducted at baseline (between 1995 and 1998) and follow-up (between 2001 and 2003), while CV outcomes were assessed until the end of follow-up (between 2008 and 2011).
In all, 1,207 patients from the Sleep Heart Health Study met criteria for moderate to severe OSA (apnea-hypopnea index, or AHI, of 15 or greater) and were included in the final analysis. They were followed for a mean of 12 years. Based on the clustering of symptoms, the researchers identified four OSA symptom subtypes: disturbed sleep (12%), minimally symptomatic (33%), excessively sleepy (17%), and moderately sleepy (38%) – proportions that were similar to those observed in prior studies.
The disturbed sleep subtype presented with increased prevalence of “insomnialike” symptoms, such as difficulty initiating or maintaining sleep, according to Dr. Mazzotti. “On the other hand, the excessively sleepy subtype presented with a very high prevalence of several symptoms related to excessive daytime sleepiness, while the moderately sleepy showed a moderately high prevalence of such symptoms, but not as much when compared to the excessively sleepy subtype,” he explained. “Finally, the minimally symptomatic subtype was found to have the lowest prevalence of all investigated symptoms, suggesting that these patients have low symptom burden. They do not complain as much, even though they have moderate-to-severe OSA.”
Next, Dr. Mazzotti and colleagues used Kaplan-Meier survival analysis and Cox proportional hazards models to evaluate whether subtypes were associated with incident coronary heart disease (CHD), heart failure, and CV disease, including CV mortality. Similar analyses were performed comparing each symptom subtype with 2,830 individuals without OSA (AHI less than 5).
Compared with other subtypes, the excessively sleepy group had a more than threefold increased odds of prevalent heart failure, after adjustment for other CV risk factors. They also had a 1.7- to 2.3-fold increased risk for incident CV disease (P less than .001), CHD (P = .015) and heart failure (P = 0.018), after adjustment for other CV risk factors.
“Compared to individuals without OSA, the excessively sleepy subtype is the only subtype with increased risk of incident CV disease and CHD,” Dr. Mazzotti said. “It is possible that excessively sleepy OSA patients are more likely to benefit from CPAP therapy in preventing CV disease.” These results were published online earlier this year (Am J Respir Crit Care Med. 2019 Feb 15. doi: 10.1164/rccm.201808-1509OC).
Dr. Mazzotti reported having no financial disclosures.
SOURCE: Mazzotti D et al. SLEEP 2019, Abstract 0586.
REPORTING FROM SLEEP 2019
FDA warning letters fall on Trump’s watch
according to findings from an analysis of public records sponsored by Science magazine and published July 2.
From Jan. 20, 2017, (President Trump’s inauguration day) through May 22, 2019, FDA sent out 1,033 warning letters, compared with 1,532 warning letters sent during the 28 months ending just before the inauguration, a drop of 33%, wrote Charles Piller, an investigative journalist on the Science staff (Science. 2019 Jul 2. doi: 10.1126/science.aay5859). Also during January 2017–May 2019, “official action indicated” reports, described by Mr. Piller as a frequent precursor to warning letters, fell by 45%, from 1,879 during the final 28 months of the Obama administration to 1,040 during the first 28 months of the Trump administration. The incidence of an injunction, characterized by Mr. Piller as a ”more forceful” step than a warning letter, was 35 during the 28 months before Donald Trump became president and 26 during the 28 months after, a relative 26% decline.
More detailed numbers in the report included a 33% drop in warning letters from the FDA center that deals with tobacco products, a 37% drop in warning letters from the center that deals with food safety, and a 72% fall in letters sent from the Center for Devices & Radiological Health. However the FDA Center for Drug Evaluation & Research sent 62% more warning letters (188) during the first 28 months after Donald Trump became president, compared with the final 28 months under President Obama, when it sent 116 warning letters. A year-by-year analysis that started in 2009 showed that warning letters peaked at about 800 per year during both 2011 and 2012, and then showed a steady decline during all subsequent years, falling to a rate during the first months of 2019 that projected to an annualized rate of 385 total warning letters sent by the end of this year.
In response to publication of these findings, FDA Media Relations Director Angela Stark said “the way the data are presented in the story does not accurately reflect FDA’s overarching work to protect the public health. While one publicly visible measure of FDA action, it’s important to understand that warning letters are just one action the FDA takes to seek compliance. The FDA has several tools at its disposal to work with a company to ensure compliance, such as through regulatory meetings with companies; untitled letters; follow-up inspections; and other regulatory and compliance measures depending on the situation, and we often do much of this behind the scenes in the interest of patient safety. Our use of any one enforcement tool may fluctuate year to year based on a number of factors, including the FDA’s assessment of the violations uncovered during the course of inspections, along with additional product-monitoring efforts.”
Ms. Stark also noted that, in some FDA centers, warning letters may have decreased “because the FDA has increased its interactions with industry to resolve issues, which often achieves more timely and effective corrective action.”
She also highlighted 1,300 warning letter and monetary penalty complaints sent to retailers since September 2018 over illegal sales of e-cigarettes to minors, “tens of thousands” of warning letters sent to tobacco retailers since the start of 2017 over other tobacco-related issues, and actions against stem-cell clinics that have marketed unapproved treatments.
mzoler@mdedge.com
SOURCE: Piller C. Science. 2019 Jul 2. doi: 10.1126/science.aay5859)
FROM SCIENCE
Some burnout factors are within a physician’s control
SAN DIEGO – Eat a healthy lunch. Get more sleep. Move your body. How many times in the course of a week do you give patients gentle reminders to practice these most basic steps of self-care? And how many times in the course of a week do you allow these basics to go by the wayside for yourself?
Self-care is one of the elements that can defend against physician burnout, Carol Burke, MD, said at a session on physician burnout held during the annual Digestive Disease Week®. Personal self-care can make a real difference, and shouldn’t be ignored as the profession works to reel back some of the institutional changes that challenge physicians today.
In the workplace, unhealthy stress levels can contribute to burnout, disruptive behavior, decreased productivity, and disengagement. Burnout – a response to chronic stress characterized by a diminished sense of personal accomplishment and emotional exhaustion – can result in cynicism, a lack of compassion, and feelings of depersonalization, said Dr. Burke.
Contributors to physician stress have been well documented, said Dr. Burke, a professor of gastroenterology at the Cleveland Clinic. These range from personal debt and the struggle for work-life balance to an increased focus on metrics and documentation at the expense of authentic patient engagement. All of these factors are measurable by means of the validated Maslach Burnout Inventory, said Dr. Burke. A recent survey that used this measure indicated that nearly half of physician respondents report experiencing burnout.
In 2017, Dr. Burke led a survey of American College of Gastroenterology members that showed 49.3% of respondents reported feeling emotional exhaustion and/or depersonalization. Some key themes emerged from the survey, she said. Women and younger physicians were more likely to experience burnout. Having children in the middle years (11-15 years old) and spending more time on domestic duties and child care increased the risk of burnout.
And doing patient-related work at home or having a spouse or partner bring work home also upped burnout risk. Skipping breakfast and lunch during the workweek was another risk factor, which highlights the importance of basic self-care as armor against the administrative onslaught, said Dr. Burke.
Measured by volume alone, physician work can be overwhelming: 45% of physicians in the United States work more than 60 hours weekly, compared with fewer than 10% of the general workforce, said Dr. Burke.
What factors within the control of an individual practitioner can reduce the risk of debilitating burnout and improve quality of life? Physicians who do report a high quality of life, said Dr. Burke, are more likely to have a positive outlook. They also practice basic self-care like taking vacations, exercising regularly, and engaging in hobbies outside of work.
For exhausted, overworked clinicians, getting a good night’s sleep is a critical form of self-care. But erratic schedules, stress, and family demands can all sabotage plans for better sleep hygiene. Still, attending to sleep is important, said Dr. Burke. Individuals with disturbed sleep are less mindful and have less self-compassion. Sleep disturbance is also strongly correlated with perceived stress.
She also reported that the odds ratio for burnout was 14.7 for physicians who reported insomnia when compared with those without sleep disturbance, and it was 9.9 for those who reported nonrestorative sleep.
Physical activity can help sleep and also help other markers of burnout. Dr. Burke pointed to a recent study of 4,402 medical students. Participants were able to reduce burnout risk when they met the Centers for Disease Control and Prevention recommendations of achieving at least 150 minutes/week of moderate exercise or 75 minutes/week of vigorous exercise, plus at least 2 days/week of strength training (P less than .001; Acad Med. 2017;92:1006).
These physician-targeted programs can work, she said: “Faciliated interventions improve well-being, attitudes associated with patient-centered care, meaning and engagement in work, and reduce burnout.”
Practice-focused interventions to reclaim a semblance of control over one’s time are varied, and some are easier to implement than others. Virtual visits and group visits are surprisingly well received by patients, and each can be huge time-savers for physicians, said Dr. Burke. There are billing and workflow pitfalls to avoid, but group visits, in particular, can be practice changing for those who have heavy backlogs and see many patients with the same condition.
Medical scribes can improve productivity and reduce physician time spent on documentation. Also, said Dr. Burke, visits can appropriately be billed at a higher level of complexity when contemporaneous documentation is thorough. Clinicians overall feel that they can engage more fully with patients, and also feel more effective, when well-trained scribes are integrated into a practice, she said.
Female physicians have repeatedly been shown to have patient panels that are more demanding, and male and female patients alike expect more empathy and social support from their physicians, said Dr. Burke. When psychosocial complexities are interwoven with patient care, as they are more frequently for female providers, a 15-minute visit can easily run twice that – or more. Dr. Burke is among the physicians advocating for recognition of this invisible burden on female clinicians, either through adaptive scheduling or differential productivity expectations. This approach is not without controversy, she acknowledged; still, practices should acknowledge that clinic flow can be very different for male and female gastroenterologists, she said.
Dr. Burke reported no relevant conflicts of interest.
EXPERT ANALYSIS FROM DDW 2019

Functional GI disorders are common in MS
SEATTLE – according to research presented at the annual meeting of the Consortium of Multiple Sclerosis Centers. Managing patients’ psychiatric comorbidities could effectively reduce the burden of functional GI disorders, the researchers said.
Knowledge about the prevalence of functional GI disorders in the population of patients with MS is limited. For the most part, previous studies in this population have focused on irritable bowel syndrome (IBS). A 2013 study by Levinthal et al. (Mult Scler Int. 2013. doi: 10.1155/2013/319201) investigated the prevalence of other functional GI disorders in MS, but the literature contains little information about the clinical and demographic characteristics associated with these disorders. In addition, the extent to which comorbid functional GI disorders influence health-related quality of life in MS is also unknown.
Ruth Ann Marrie, MD, PhD, professor of neurology at the University of Manitoba in Winnipeg, and colleagues sought to determine the prevalence of functional bowel disorders, the demographic and clinical characteristics associated with functional bowel disorders, and the effects of these disorders on health-related quality of life in a large, diverse population of persons with MS. In 2014, the investigators used the Rome III questionnaire to survey participants in the North American Research Committee on MS (NARCOMS) registry about functional bowel disorders. Participants also provided information about their sociodemographic characteristics, their disability status (using Patient-Determined Disease Steps), and any comorbid depression or anxiety, their health behaviors, and their health-related quality of life (using the RAND-12).
Dr. Marrie and colleagues used these data to determine the prevalence of IBS, functional bloating, functional constipation, functional diarrhea, and functional dyspepsia. They used multivariable logistic regression models to examine the factors associated with any functional GI disorder, and they used linear regression to analyze the association between functional GI disorders and health-related quality of life using linear regression.
Dr. Marrie and colleagues identified 6,312 eligible respondents. Approximately 77% of the population was female, and the sample’s mean age was 58.3 years. In all, 2,647 respondents (42%) had a functional GI disorder. The most common was IBS, which affected 28.2% of participants. The prevalence of all functional GI disorders increased with increasing disability. Depression and anxiety were associated with increased odds of IBS and functional dyspepsia. After adjustment for sociodemographic and clinical characteristics, functional GI disorders were associated with lower physical and mental health-related quality of life.
The research was not supported by outside funding. Dr. Marrie had no disclosures, but other researchers had financial relationships with pharmaceutical companies, such as Merck, Novartis, Roche, Sanofi-Aventis, and Teva.
SOURCE: Marrie RA et al. CMSC 2019, Abstract QOL13.
REPORTING FROM CMSC 2019