User login
Pandemic-related stress causing health issues in many Americans
Over the last 2 months, more than half of Americans have experienced some sort of adverse effect caused by stress related to the COVID-19 pandemic, according to a survey from the Kaiser Family Foundation (KFF).
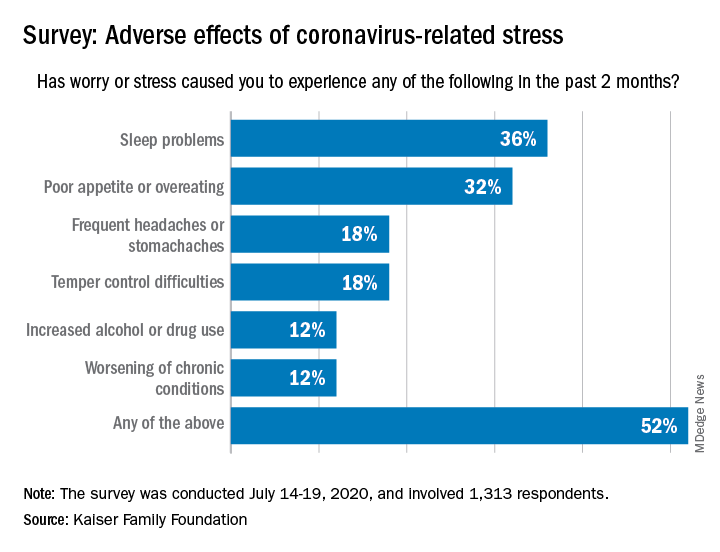
More than a third (36%) of the 1,313 respondents said they either had difficulty sleeping, falling asleep, or sleeping too much, KFF said in its latest Health Tracking Poll, conducted July 14-19, 2020. That was followed by poor appetite or overeating, which was mentioned by 32% of those surveyed.
Other adverse effects included frequent headaches or stomachaches (18%), temper-control issues (18%), increased drug or alcohol use (12%), and worsening of chronic conditions such as diabetes or hypertension (12%). Altogether, 52% of Americans have had at least one of these issues in the past 2 months, Liz Hamel and associates at KFF reported.
breaking down to 26% reporting a major impact and 28% reporting a minor impact (figures have been rounded), they said.
“As life with the coronavirus pandemic wears on, Americans increasingly say it is taking a negative toll on their mental health,” the investigators wrote. Earlier polls showed that pandemic-related stress was having an impact on mental health for 39% of respondents in May, compared with 45% in early April and 32% in March.
In the July poll, Black adults were much more likely to report a negative mental health impact (68%) than were Hispanics or Whites, who were both at 51%. Age was also a factor: The youngest group of respondents (ages 18-29 years) had the highest negative-impact rate (62%), and the oldest group (65 years and older) had the lowest (47%), they said.
When it came to reporting the adverse effects of stress or worry, however, the situation was somewhat different. Hispanics had the highest rate of such effects at 63%, while Blacks had a rate of 57% and 47% of Whites reported issues with sleep, eating, temper, and other problems, Ms. Hamel and associates reported.
Over the last 2 months, more than half of Americans have experienced some sort of adverse effect caused by stress related to the COVID-19 pandemic, according to a survey from the Kaiser Family Foundation (KFF).
More than a third (36%) of the 1,313 respondents said they either had difficulty sleeping, falling asleep, or sleeping too much, KFF said in its latest Health Tracking Poll, conducted July 14-19, 2020. That was followed by poor appetite or overeating, which was mentioned by 32% of those surveyed.
Other adverse effects included frequent headaches or stomachaches (18%), temper-control issues (18%), increased drug or alcohol use (12%), and worsening of chronic conditions such as diabetes or hypertension (12%). Altogether, 52% of Americans have had at least one of these issues in the past 2 months, Liz Hamel and associates at KFF reported.
breaking down to 26% reporting a major impact and 28% reporting a minor impact (figures have been rounded), they said.
“As life with the coronavirus pandemic wears on, Americans increasingly say it is taking a negative toll on their mental health,” the investigators wrote. Earlier polls showed that pandemic-related stress was having an impact on mental health for 39% of respondents in May, compared with 45% in early April and 32% in March.
In the July poll, Black adults were much more likely to report a negative mental health impact (68%) than were Hispanics or Whites, who were both at 51%. Age was also a factor: The youngest group of respondents (ages 18-29 years) had the highest negative-impact rate (62%), and the oldest group (65 years and older) had the lowest (47%), they said.
When it came to reporting the adverse effects of stress or worry, however, the situation was somewhat different. Hispanics had the highest rate of such effects at 63%, while Blacks had a rate of 57% and 47% of Whites reported issues with sleep, eating, temper, and other problems, Ms. Hamel and associates reported.
AHA statement addresses genetic testing for CVD
A new scientific statement from the American Heart Association recommends that genetic testing for inherited cardiovascular disease should be reserved for four specific types of heart diseases – cardiomyopathies, thoracic aortic aneurysms and dissections, arrhythmias, and familial hypercholesterolemia – and should enlist skilled geneticists and genetic counselors in the care team.

The guidance comes in a scientific statement published online in the journal Circulation: Genomic and Precision Medicine.
Kiran Musunuru, MD, PhD, MPH, ML, chair of the writing group for the scientific statement, described in an interview the rationale for publishing the statement at this time. “There was no prior single statement that summarized best practices for the whole gamut of inherited cardiovascular diseases in adults, only statements for individual diseases,” he said in an interview. “With genetic testing seeing explosive growth in the past few years, both in the clinical setting and with direct-to-consumer testing, we felt that cardiovascular practitioners would benefit from having a single document to serve as a general resource on genetic testing.”
The statement describes two types of patients who would be suitable for genetic testing for cardiovascular disease (CVD), Dr. Musunuru noted: “Patients who have been diagnosed with or are strongly suspected to have a cardiovascular disease that is often inherited and family members of patients who have been diagnosed with an inherited cardiovascular disease and found by genetic testing to have a mutation that is felt to be the cause of the disease.”
The statement also spells out two crucial elements for genetic testing: thorough disease-specific phenotyping – that is, using genetic information to identify the individual’s disease characteristics and a comprehensive family history that spans at least three generations. Testing should only proceed after patients has had genetic counseling and made a shared decision with their doctors.
“Genetic counseling is absolutely essential both before genetic testing to educate patients on what genetic testing entails and what potential results to expect, as well as the risks of testing; and after genetic testing, to review the results of the genetic testing and explain the potential consequences for the patient’s health and the health of family members, including children,” Dr. Musunuru said.
The process should involve board-certified geneticists or at least cardiovascular specialists well-versed in genetics and genetic counselors, the statement noted. The latter are “critical” in the care team, Dr. Musunuru said.
After the decision is made to do genetic testing, the next step is to decide the scope of the testing. That can range from targeted sequencing of a single gene or a few genes linked to the disease to large gene panels; the latter “may not increase the likelihood of clinically actionable results in adult patients,” Dr. Musunuru and colleagues wrote.
But genetic testing is no guarantee to identify a cause or confirm a diagnosis of CVD, the statement noted. “The yield for any genetic testing for any inherited cardiovascular disease remains <100%, usually much less than 100%,” the writing committee stated.
Dr. Musunuru explained that the results can sometimes be inconclusive. “In many cases, genetic testing reveals a mutation that is uninterpretable, what we call a variant of uncertain significance,” he said. “It is not clear whether the mutation increases the risk of disease or is entirely benign, which makes it very challenging to counsel patients as to whether anything should be done about the mutation.”
Even in a diagnosed patient the test results can be uncertain. “This makes it challenging to explain why the patient has the disease and whether any of the family members are at risk,” Dr. Musunuru said.
According to the statement, providers should encourage patients with a confirmed or likely pathogenic variant for CVD to share that information with “all of their at-risk relative,” the statement noted, suggesting “family letters” given to patients are a way to navigate HIPAA’s privacy limits.
The statement was written on behalf of the American Heart Association’s Council on Genomic and Precision Medicine; Council on Arteriosclerosis, Thrombosis and Vascular Biology; Council on Cardiovascular and Stroke Nursing; and Council on Clinical Cardiology.
Dr. Musunuru and writing group members have no relevant financial relationships to disclose.
SOURCE: Musunuru K et al. Circ Genom Precis Med. 2020 Jul 23. doi: 10.1161/HCG.0000000000000067.
A new scientific statement from the American Heart Association recommends that genetic testing for inherited cardiovascular disease should be reserved for four specific types of heart diseases – cardiomyopathies, thoracic aortic aneurysms and dissections, arrhythmias, and familial hypercholesterolemia – and should enlist skilled geneticists and genetic counselors in the care team.
The guidance comes in a scientific statement published online in the journal Circulation: Genomic and Precision Medicine.
Kiran Musunuru, MD, PhD, MPH, ML, chair of the writing group for the scientific statement, described in an interview the rationale for publishing the statement at this time. “There was no prior single statement that summarized best practices for the whole gamut of inherited cardiovascular diseases in adults, only statements for individual diseases,” he said in an interview. “With genetic testing seeing explosive growth in the past few years, both in the clinical setting and with direct-to-consumer testing, we felt that cardiovascular practitioners would benefit from having a single document to serve as a general resource on genetic testing.”
The statement describes two types of patients who would be suitable for genetic testing for cardiovascular disease (CVD), Dr. Musunuru noted: “Patients who have been diagnosed with or are strongly suspected to have a cardiovascular disease that is often inherited and family members of patients who have been diagnosed with an inherited cardiovascular disease and found by genetic testing to have a mutation that is felt to be the cause of the disease.”
The statement also spells out two crucial elements for genetic testing: thorough disease-specific phenotyping – that is, using genetic information to identify the individual’s disease characteristics and a comprehensive family history that spans at least three generations. Testing should only proceed after patients has had genetic counseling and made a shared decision with their doctors.
“Genetic counseling is absolutely essential both before genetic testing to educate patients on what genetic testing entails and what potential results to expect, as well as the risks of testing; and after genetic testing, to review the results of the genetic testing and explain the potential consequences for the patient’s health and the health of family members, including children,” Dr. Musunuru said.
The process should involve board-certified geneticists or at least cardiovascular specialists well-versed in genetics and genetic counselors, the statement noted. The latter are “critical” in the care team, Dr. Musunuru said.
After the decision is made to do genetic testing, the next step is to decide the scope of the testing. That can range from targeted sequencing of a single gene or a few genes linked to the disease to large gene panels; the latter “may not increase the likelihood of clinically actionable results in adult patients,” Dr. Musunuru and colleagues wrote.
But genetic testing is no guarantee to identify a cause or confirm a diagnosis of CVD, the statement noted. “The yield for any genetic testing for any inherited cardiovascular disease remains <100%, usually much less than 100%,” the writing committee stated.
Dr. Musunuru explained that the results can sometimes be inconclusive. “In many cases, genetic testing reveals a mutation that is uninterpretable, what we call a variant of uncertain significance,” he said. “It is not clear whether the mutation increases the risk of disease or is entirely benign, which makes it very challenging to counsel patients as to whether anything should be done about the mutation.”
Even in a diagnosed patient the test results can be uncertain. “This makes it challenging to explain why the patient has the disease and whether any of the family members are at risk,” Dr. Musunuru said.
According to the statement, providers should encourage patients with a confirmed or likely pathogenic variant for CVD to share that information with “all of their at-risk relative,” the statement noted, suggesting “family letters” given to patients are a way to navigate HIPAA’s privacy limits.
The statement was written on behalf of the American Heart Association’s Council on Genomic and Precision Medicine; Council on Arteriosclerosis, Thrombosis and Vascular Biology; Council on Cardiovascular and Stroke Nursing; and Council on Clinical Cardiology.
Dr. Musunuru and writing group members have no relevant financial relationships to disclose.
SOURCE: Musunuru K et al. Circ Genom Precis Med. 2020 Jul 23. doi: 10.1161/HCG.0000000000000067.
FROM CIRCULATION: GENOMIC AND PRECISION MEDICINE
A Multidisciplinary Ambulation Protocol to Reduce Postoperative Venous Thromboembolism After Colorectal Surgery
From the Department of Surgery, Washington University School of Medicine, St. Louis, MO.
Abstract
Background: Patients undergoing colorectal surgery are at high risk for postoperative venous thromboembolism (VTE). Early ambulation has been encouraged to lower rates of VTE, but evidence demonstrating its effectiveness outside of a bundle is limited.
Objective: To create a multidisciplinary ambulation protocol in an effort to reduce postoperative VTE.
Methods: A single-center, retrospective, comparative study of patients who underwent colectomy or proctectomy was conducted. Outcomes of patients operated on prior to protocol implementation were compared with a cohort after implementation. The intervention studied was the implementation of a multidisciplinary ambulation protocol. The primary endpoint was postoperative VTE.
Results: There was no difference between the pre-intervention group (n = 1762) and the postintervention group (n = 253) in terms of sex, race, origin, emergency status, operative time, and the majority of medical comorbidities (with the exception of smoking status and congestive heart failure). After the protocol was implemented, ambulation rates on postoperative days 0, 1, and 2 improved from 36.4%, 47.3%, and 50.2% to 36.8%, 74.7%, and 82.6%, respectively The VTE rate in the pre-intervention group was 2.7% versus a rate of 0.4% in the postintervention group (P = 0.02).
Conclusion: Creation of an ambulation protocol is associated with a significant reduction in VTE. Commitment from patients, families, nurses, physician extenders, and physicians is critical to the success of the program.
Keywords: VTE; pulmonary embolism; deep vein thrombosis; postoperative; quality improvement.
Postoperative venous thromboembolism (VTE) is a significant source of morbidity, mortality, and cost.1,2 Colorectal surgery patients are at particularly high risk for VTE due to positioning during surgery, pelvic dissection, and other conditions often found in these patients, such as cancer and inflammatory bowel disease.3 A National Surgical Quality Improvement Program (NSQIP) analysis demonstrated an overall rate of VTE in colorectal surgery patients of 2.4%, although other studies have demonstrated rates up to 9%, even in those receiving appropriate chemoprophylaxis.4-6 Many of these VTEs occur in the postdischarge setting. In a NSQIP study of colorectal surgery patients, the rate of VTE between discharge and 30 days was 0.47%.7 The cost burdenfor a postoperative VTE has been estimated to be more than $18,000.8
Studies from NSQIP have identified multiple factors associated with VTE in colorectal surgery patients, but NSQIP does not record ambulation as a standard variable.9 Multiple strategies have been implemented to reduce postoperative VTE. Often, these studies focus on increasing compliance with appropriate chemoprophylaxis, risk stratification, or bundling multiple strategies.10,11 However, despite the fact that postsurgical ambulation is widely encouraged and recommended by the American Society of Colon and Rectal Surgeons clinical practice guidelines, there is little evidence demonstrating the role of ambulation alone in the reduction of VTE.4,12 The purpose of this study was to create a multidisciplinary protocol to increase postoperative ambulation and evaluate its effect on VTE.
Methods
Setting
This study was conducted at a single academic tertiary care center.
Patients and Outcome Measures
All patients undergoing colectomy or proctectomy by surgeons in the section of colon and rectal surgery at a single institution between January 2011 and March 2017 were included. Colectomy and proctectomy were defined by CPT codes 44140, 44141, 44143, 44144, 44145, 44146, 44147, 44150, 44151, 44155, 44156, 44157, 44158, 44160, 44204, 44205, 44206, 44207, 44208, 44210, 44211, 44212, 44213, 45110, 45111, 45112, 45113, 45114, 45116, 45119, 45120, 45121, 45123, 45126, 45160, 45395, and 45397. The primary outcome of VTE within 30 days, including deep venous thrombosis (DVT) and pulmonary embolism (PE), was measured using institution-specific data from NSQIP in both the pre-intervention and postintervention setting. The occurrence of both DVT and PE in 1 patient was counted as a single event of VTE. Ambulation rate on postoperative day (POD) 0, 1, and 2 was calculated by NSQIP in the pre-intervention setting (our institution-specific NSQIP recorded ambulation data for an unrelated project) and by review of the electronic health record in the postintervention setting, as this institution-specific variable was no longer being collected. Ambulation was defined as getting out of bed and taking at least 1 step. The threshold for ambulating each day was once on POD 0 and twice on PODs 1 and 2. Patients with missing ambulation data were excluded from the analysis. Both prior to and throughout the intervention, all patients were given VTE chemoprophylaxis with either low-dose unfractionated heparin or low-molecular-weight heparin prior to induction of anesthesia, with chemoprophylaxis extending an additional 21 days after discharge (unless specifically contraindicated); sequential compression devices; and standard orders to ambulate 3 times daily from POD 0 as part of the standard Enhanced Recovery After Surgery protocol.
Analysis
Statistical analysis was performed using univariate analysis. Chi-square test and univariate logistic regression were used to determine the association between ambulation rates and VTE in the pre-intervention group. Chi-square test was also used to compare ambulation and VTE rates between the pre-intervention and postintervention groups. Plan-Do-Study-Act (PDSA) cycle fidelity (the degree to which a PDSA cycle is carried out in accordance with the guiding principles of its use) was measured by recording the ambulation rates both before and after the intervention.13 Statistical analysis was performed using SAS Version 9.4 (SAS Institute, Cary, NC). This study was reviewed by the Washington University School of Medicine Institutional Review Board and deemed to be quality improvement, not human subjects research, and therefore did not require formal approval.
Baseline Outcome Rates
A total of 1762 patients were identified during the pre-intervention period. The overall VTE rate in the pre-intervention group was 2.7% (n = 48), with 39 DVTs (2.2%) and 13 PEs (0.7%). Pre-intervention ambulation data were available on 590 patients. Baseline ambulation rates on PODs 0, 1, and 2 were 36.4% (213/590), 47.3% (279/590), and 50.2% (296/590), respectively. Patients who did not ambulate on POD 0 had a VTE rate of 4.3%, as compared to 0.9% in those who did ambulate (Table 1). Patients who did not ambulate twice on POD 1 had a VTE rate of 4.8%, compared to 1.1% in those who did ambulate (odds ratio [OR], 4.66; 95% confidence interval [CI], 1.34 to 16.28). Patients who did not ambulate twice on POD 2 had a VTE rate of 5.4%, compared to 0.7% in those who did. Finally, those who ambulated twice on both PODs 1 and 2 had a 0% rate of VTE, compared to 4.9% in those who did not ambulate on both PODs.

Ambulation Protocol
After baseline outcome rates had been established, a multidisciplinary team of medical assistants, nurses, nurse practitioners, and physicians worked together to identify all processes that involved postoperative ambulation. Given the significant differences in VTE rates between patients who ambulated and those that did not, we created a multidisciplinary ambulation protocol using the PDSA method.14 Multiple points of patient contact were chosen for intervention, and the ambulation protocol was implemented in June 2018 and continued for 7 months.
Patients were observed from their initial office visit with a surgeon, during the preoperative education encounter, and in the operating room and on the surgical ward until discharge. Representatives from multiple disciplines who encountered patients at various times in the process, including medical assistants, patient care technicians, nurses, nurse practitioners, physical therapists, and physicians, participated in a kick-off meeting to identify difficulties they encounter when encouraging patient ambulation. The following 4 areas were identified.
Barriers to Patient Ambulation
Patient Expectations. Patients did not appear to have a clear expectation of what their ambulation goals were postoperatively, despite the fact that each patient is given an operative pathway booklet that includes their goals for each day, including ambulation. The consensus was that patients were overwhelmed with the amount of information and, oftentimes, the severity of their diagnosis, so the information regarding ambulation was not retained. Nurses commented that patients frequently stated that they did not think their surgeon wanted them to get out of bed postoperatively.
Electronic Orders. There was confusion within the nursing staff regarding orders in the electronic health record compared to physician expectations. Orders stated patients should ambulate 3 times daily, but did not specify on which postoperative day this should start. Often, nursing verbal sign-out from the post-anesthesia care unit (PACU) would be an order for bedrest, despite no clear origin of this order. This created confusion among the nursing staff as to what the appropriate ambulation orders should be.
Nursing Workflow. The initial state of the nursing workflow was not conducive to evaluating for, or assisting with, ambulation. With no set time to assist and evaluate patients for ambulation, it turned into a task nurses needed to accomplish when they had extra time. With increasing demands of charting in the electronic health record, nurses often had to skip ambulation in order to accomplish other tasks.
Family Expectations. In addition to patient expectations, family members often had expectations that were not congruent with the planned postoperative course. Nurses stated family members would often tell them that they did not feel that their family member should be ambulating so soon after surgery. Often these family members had not attended preoperative education sessions with the patient. This was compounded by the uncertainty among the nursing staff regarding what exactly the ambulation orders were.
Interventions
Targeted interventions were created to address these 4 barriers to ambulation identified by staff.
Preoperative Education. Although all elective patients received a printed operative pathway booklet describing daily goals, including ambulation, patients still did not have a sufficient understanding of what was expected of them. The education session was modified to increase the time spent on both the expectation for and the rationale behind ambulation. That section of the education session ended with a verbal commitment and read-back of the expectations for ambulation by the patient.
Clarification of Electronic Orders. Postoperative orders within the colorectal standard pathway were changed, including specific time frames and frequency, to match the information provided in the patient education booklet. These orders were for ambulation within 4 hours of arrival to the floor, and the orders also noted that no patient should be on bedrest unless explicitly stated. From POD 1, all patients were to ambulate at least twice daily for the remainder of the hospital stay (patients were encouraged to walk 4 times daily, but we set a minimum expectation of twice daily for the order set). These orders were clarified with in-person meetings with the nursing staff and leadership from the PACU and the colorectal surgical ward.
Adjusted Nursing Workflow. Nurses were interviewed and asked to create a plan regarding how they could better incorporate ambulation into their daily workflow. Ambulation assessment was incorporated into the twice-per-shift recording of vital signs and patient safety assessment. This was recorded into the electronic health record at the same time as the patients’ vital signs. This allowed nurses to keep track of which patients would need extra assistance in ambulation and which patients were doing well on their own with the assistance of family. It also helped focus the resources of physical therapy and the single ambulation technician on the floor and to assist patients who needed more assistance.
Creation of Ambulation Encouragement Signs. The authors discovered that despite patients being told preoperatively about ambulation expectations, friends and family are not always included in these conversations. As nurses frequently cited both patients and family as reasons patients thought they should not walk, multiple signs inviting patients to take an active role in their recovery by ambulating were created and placed around the unit. The signs outlined the expectations of being out of bed and taking at least 1 step on the day of surgery and walking at least 4 times per day thereafter. In addition, we addressed frequently asked questions around issues such as walking with intravenous poles and urinary catheters. The posters were signed by all staff colorectal surgeons.
Results
Over the course of 7 months (June 2018 to December 2018), 253 postintervention patients were identified (Table 2). There was no difference between the pre-intervention group (n = 1762) and the postintervention group in terms of sex, race, origin, emergency status, operative time, and the majority of medical comorbidities (with the exception of smoking status and congestive heart failure). The postintervention group was slightly older (60 versus 57 years) and had a higher percentage of patients with an American Society of Anesthesiologists physical status score greater than 2 (66.8% versus 51.2%). The postintervention group also had higher rates of both malignancy (53.4% versus 33.3%) and inflammatory bowel disease (18.2% versus 14.4%).

The fidelity of the PDSA cycle was measured by pre-intervention and postintervention ambulation rates. Ambulation rates on POD 0, 1, and 2 improved from 36.4%, 47.3%, and 50.2% to 36.8%, 74.7%, and 82.6%, respectively (Table 3). The VTE rate decreased from 2.7% to 0.4% (P = 0.02), with 1 DVT and 0 PEs. It should be noted that the only patient who developed a VTE postintervention did not ambulate on PODs 0, 1, or 2.

Discussion
Postoperative VTE is a severe complication for postoperative colorectal surgery patients. Previous studies have demonstrated that increasing ambulation is associated with a lower rate of overall complications, and, when incorporated into a bundle, is associated with decreased rates of VTE.11,15 However, this is the first study to our knowledge demonstrating that creation of an ambulation protocol alone is associated with a decrease in VTE.
Analysis of pre-intervention data demonstrated a strong association between ambulation and an absence of VTE. No patient who ambulated on PODs 0, 1, and 2 developed a VTE. Based on those results, we moved forward with creating the ambulation protocol. While ambulation stayed stable on POD 0, there were 60% and 65% increases on PODs 1 and 2, respectively. Nurses cited late arrival to the floor for second and third start cases as the primary difficulty in getting patients to ambulate more on POD 0.
We believe the key to the success of the ambulation protocol was its multidisciplinary nature. Certainly, the easiest way to create an ambulation protocol is to change the postoperative orders to state patients must walk 4 times per day. However, if the nursing staff is unable or unwilling to carry out these orders, the orders serve little purpose. In order to make lasting changes, all stakeholders in the process must be identified. In our case, stakeholders included surgery and nursing leadership, surgeons, nurse practitioners, nurses, medical assistants, physical therapists, patient care technicians, and patients. This is where we utilized kaizen, a core principle of Lean methodology that empowers employees at the level of the work being carried out to propose ideas for improvement.16 From the beginning of the patient experience, the health care practitioners who were carrying out each step of the process were best able to identify the problems and create solutions. In addition, stakeholders were given regular updates regarding how their efforts were increasing ambulation rates and the results at the end of the study period.
This study also demonstrates that, in a health care system increasingly focused on both quality and cost, significant improvements in quality can be made without increasing cost or resource utilization. Early in the process, it was proposed that the only way to increase the ambulation rate would be to increase the number of physical therapists, nurses, and nursing assistants. However, after identifying the root causes of the problem, the solutions had more to do with improving workflow and fixing problem areas identified by the staff.
In addition to having a positive effect on the outcome studied, collaborative projects such as this between physicians and nurses may lead to increased nursing job satisfaction. A meta-analysis of 31 studies identified nurse-physician collaboration and autonomy as 2 factors that correlate most strongly with nursing satisfaction.17 A Cochrane review also suggests that practice-based interprofessional collaboration may lead to improved health care processes and outcomes.18
This study has several limitations. Pre-intervention ambulation rates were abstracted from institution-specific NSQIP data, and missing data were excluded from analysis. Also, due to the retrospective collection of the pre-intervention data, the distance of ambulation could not be quantified. The bar for ambulation is low, as patients were only required to get out of bed and walk 1 step. However, we feel that getting out of bed and taking even 1 step is substantially better than complete bedrest. It is likely that once patients cross the threshold of taking 1 step, they are more likely to ambulate. An area of future study may be to more precisely define the relationship between the quantity of ambulation in steps and its effect on VTE. Finally, we acknowledge that while there is no direct increase in costs, implementing an ambulation protocol does take time from all who participate in the project.
Conclusion
Creation of an ambulation protocol is associated with a decrease in postoperative VTE rates in colorectal surgery patients. A multidisciplinary approach is critical to identify the underlying problems and propose effective solutions. Further studies are required to better correlate the distance of ambulation and its effect on VTE. However, this study shows that even a minimum of 1 step is associated with decreased VTE rates.
Corresponding author: Aneel Damle, MD, MBA, Colon & Rectal Surgery Associates, 3433 Broadway St. NE, Suite 115, Minneapolis, MN 55413; adamle@CRSAL.org.
Financial disclosures: None.
1. Gangireddy C, Rectenwald JR, Upchurch GR, et al. Risk factors and clinical impact of postoperative symptomatic venous thromboembolism. J Vasc Surg. 2007;45:341-342.
2. Newhook TE, LaPar DJ, Walters DM, et al. Impact of postoperative venous thromboembolism on postoperative morbidity, mortality, and resource utilization after hepatectomy. Am Surg. 2015;81:1216-1223.
3. Bergqvist D. Venous thromboembolism: a review of risk and prevention in colorectal surgery patients. Dis Colon Rectum. 2006;49:1620-1628.
4. Fleming F, Gaertner W, Ternent CA, et al. The American society of colon and rectal surgeons clinical practice guideline for the prevention of venous thromboembolic disease in colorectal surgery. Dis Colon Rectum. 2018;61:14-20.
5. McLeod RS, Geerts WH, Sniderman KW, et al. Canadian Colorectal Surgery DVT Prophylaxis Trial investigators. Subcutaneous heparin versus low-molecular-weight heparin as thromboprophylaxis in patients undergoing colorectal surgery: results of the Canadian colorectal DV prophylaxis trial: a randomized, double-blind trial. Ann Surg. 2001;233:438-444.
6. Shapiro R, Vogel JD, Kiran RP. Risk of postoperative venous thromboembolism after laparoscopic and open colorectal surgery: an additional benefit of the minimally invasive approach? Dis Colon Rectum. 2011;54:1496-1502.
7. Dimick JB, Chen SL, Taheri PA, et al. Hospital costs associated with surgical complications: a report from the private-sector National Surgical Quality Improvement Program. J Am Coll Surg. 2004;199:531-537.
8. Fleming FJ, Kim MJ, Salloum RM, et al. How much do we need to worry about venous thromboembolism after hospital discharge? A study of colorectal surgery patients using the National Surgical Quality Improvement Program database. Dis Colon Rectum. 2010;53:1355-1360.
9. ACS NSQIP. User guide for the 2016 ACS NSQIP participant use data file (PUF). 2017. www.facs.org/~/media/files/quality%20programs/nsqip/nsqip_puf_userguide_2016.ashx Accessed July 10, 2020.
10. Caprini JA. Risk assessment as a guide for the prevention of the many faces of venous thromboembolism. Am J Surg. 2010;199(1 Suppl):S3-S10.
11. Cassidy MR, Rosenkranz P, McAney D. Reducing postoperative venous thromboembolism complications with a standardized risk-stratified prophylaxis protocol and mobilization protocol. J Am Coll Surg. 2014;218:1095-1104.
12. Lau BD, Streiff MB, Kraus PS, et al. No evidence to support ambulation for reducing postoperative venous thromboembolism. J Am Coll Surg. 2014;219:1101-1103.
13. McNicholas C, Lennox L, Woodcock T, et al. Evolving quality improvement support strategies to improve Plan–Do–Study–Act cycle fidelity: a retrospective mixed-methods study. BMJ Qual Saf. 2019;28:356-365.
14. Taylor MJ, McNicholas C, Nicolay C, et al. Systematic review of the application of the plan–do–study–act method to improve quality in healthcare. BMC Qual Saf. 2014;23:290-298.
15. Nevo Y, Shaltiel T, Constantini N, et al. Effect of ambulation and physical activity on postoperative complications. J Am Coll Surg. 2016;223(Suppl 1):S61.
16. Mazzocato P, Stenfors-Hayes T, von Thiele Schwarz U, et al. Kaizen practice in healthcare: a qualitative analysis of hospital employees’ suggestions for improvement. BMJ Open. 2016;6:e012256.
17. Zangaro GA, Soeken KL. A meta-analysis of studies of nurses’ job satisfaction. Res Nursing Health. 2007;30:445-458.
18. Reeves S, Pelone F, Harrison R, et al. Interprofessional collaboration to improve professional practice and healthcare outcomes. Cochrane Database Syst Rev. 2017;6(6):CD000072.
From the Department of Surgery, Washington University School of Medicine, St. Louis, MO.
Abstract
Background: Patients undergoing colorectal surgery are at high risk for postoperative venous thromboembolism (VTE). Early ambulation has been encouraged to lower rates of VTE, but evidence demonstrating its effectiveness outside of a bundle is limited.
Objective: To create a multidisciplinary ambulation protocol in an effort to reduce postoperative VTE.
Methods: A single-center, retrospective, comparative study of patients who underwent colectomy or proctectomy was conducted. Outcomes of patients operated on prior to protocol implementation were compared with a cohort after implementation. The intervention studied was the implementation of a multidisciplinary ambulation protocol. The primary endpoint was postoperative VTE.
Results: There was no difference between the pre-intervention group (n = 1762) and the postintervention group (n = 253) in terms of sex, race, origin, emergency status, operative time, and the majority of medical comorbidities (with the exception of smoking status and congestive heart failure). After the protocol was implemented, ambulation rates on postoperative days 0, 1, and 2 improved from 36.4%, 47.3%, and 50.2% to 36.8%, 74.7%, and 82.6%, respectively The VTE rate in the pre-intervention group was 2.7% versus a rate of 0.4% in the postintervention group (P = 0.02).
Conclusion: Creation of an ambulation protocol is associated with a significant reduction in VTE. Commitment from patients, families, nurses, physician extenders, and physicians is critical to the success of the program.
Keywords: VTE; pulmonary embolism; deep vein thrombosis; postoperative; quality improvement.
Postoperative venous thromboembolism (VTE) is a significant source of morbidity, mortality, and cost.1,2 Colorectal surgery patients are at particularly high risk for VTE due to positioning during surgery, pelvic dissection, and other conditions often found in these patients, such as cancer and inflammatory bowel disease.3 A National Surgical Quality Improvement Program (NSQIP) analysis demonstrated an overall rate of VTE in colorectal surgery patients of 2.4%, although other studies have demonstrated rates up to 9%, even in those receiving appropriate chemoprophylaxis.4-6 Many of these VTEs occur in the postdischarge setting. In a NSQIP study of colorectal surgery patients, the rate of VTE between discharge and 30 days was 0.47%.7 The cost burdenfor a postoperative VTE has been estimated to be more than $18,000.8
Studies from NSQIP have identified multiple factors associated with VTE in colorectal surgery patients, but NSQIP does not record ambulation as a standard variable.9 Multiple strategies have been implemented to reduce postoperative VTE. Often, these studies focus on increasing compliance with appropriate chemoprophylaxis, risk stratification, or bundling multiple strategies.10,11 However, despite the fact that postsurgical ambulation is widely encouraged and recommended by the American Society of Colon and Rectal Surgeons clinical practice guidelines, there is little evidence demonstrating the role of ambulation alone in the reduction of VTE.4,12 The purpose of this study was to create a multidisciplinary protocol to increase postoperative ambulation and evaluate its effect on VTE.
Methods
Setting
This study was conducted at a single academic tertiary care center.
Patients and Outcome Measures
All patients undergoing colectomy or proctectomy by surgeons in the section of colon and rectal surgery at a single institution between January 2011 and March 2017 were included. Colectomy and proctectomy were defined by CPT codes 44140, 44141, 44143, 44144, 44145, 44146, 44147, 44150, 44151, 44155, 44156, 44157, 44158, 44160, 44204, 44205, 44206, 44207, 44208, 44210, 44211, 44212, 44213, 45110, 45111, 45112, 45113, 45114, 45116, 45119, 45120, 45121, 45123, 45126, 45160, 45395, and 45397. The primary outcome of VTE within 30 days, including deep venous thrombosis (DVT) and pulmonary embolism (PE), was measured using institution-specific data from NSQIP in both the pre-intervention and postintervention setting. The occurrence of both DVT and PE in 1 patient was counted as a single event of VTE. Ambulation rate on postoperative day (POD) 0, 1, and 2 was calculated by NSQIP in the pre-intervention setting (our institution-specific NSQIP recorded ambulation data for an unrelated project) and by review of the electronic health record in the postintervention setting, as this institution-specific variable was no longer being collected. Ambulation was defined as getting out of bed and taking at least 1 step. The threshold for ambulating each day was once on POD 0 and twice on PODs 1 and 2. Patients with missing ambulation data were excluded from the analysis. Both prior to and throughout the intervention, all patients were given VTE chemoprophylaxis with either low-dose unfractionated heparin or low-molecular-weight heparin prior to induction of anesthesia, with chemoprophylaxis extending an additional 21 days after discharge (unless specifically contraindicated); sequential compression devices; and standard orders to ambulate 3 times daily from POD 0 as part of the standard Enhanced Recovery After Surgery protocol.
Analysis
Statistical analysis was performed using univariate analysis. Chi-square test and univariate logistic regression were used to determine the association between ambulation rates and VTE in the pre-intervention group. Chi-square test was also used to compare ambulation and VTE rates between the pre-intervention and postintervention groups. Plan-Do-Study-Act (PDSA) cycle fidelity (the degree to which a PDSA cycle is carried out in accordance with the guiding principles of its use) was measured by recording the ambulation rates both before and after the intervention.13 Statistical analysis was performed using SAS Version 9.4 (SAS Institute, Cary, NC). This study was reviewed by the Washington University School of Medicine Institutional Review Board and deemed to be quality improvement, not human subjects research, and therefore did not require formal approval.
Baseline Outcome Rates
A total of 1762 patients were identified during the pre-intervention period. The overall VTE rate in the pre-intervention group was 2.7% (n = 48), with 39 DVTs (2.2%) and 13 PEs (0.7%). Pre-intervention ambulation data were available on 590 patients. Baseline ambulation rates on PODs 0, 1, and 2 were 36.4% (213/590), 47.3% (279/590), and 50.2% (296/590), respectively. Patients who did not ambulate on POD 0 had a VTE rate of 4.3%, as compared to 0.9% in those who did ambulate (Table 1). Patients who did not ambulate twice on POD 1 had a VTE rate of 4.8%, compared to 1.1% in those who did ambulate (odds ratio [OR], 4.66; 95% confidence interval [CI], 1.34 to 16.28). Patients who did not ambulate twice on POD 2 had a VTE rate of 5.4%, compared to 0.7% in those who did. Finally, those who ambulated twice on both PODs 1 and 2 had a 0% rate of VTE, compared to 4.9% in those who did not ambulate on both PODs.
Ambulation Protocol
After baseline outcome rates had been established, a multidisciplinary team of medical assistants, nurses, nurse practitioners, and physicians worked together to identify all processes that involved postoperative ambulation. Given the significant differences in VTE rates between patients who ambulated and those that did not, we created a multidisciplinary ambulation protocol using the PDSA method.14 Multiple points of patient contact were chosen for intervention, and the ambulation protocol was implemented in June 2018 and continued for 7 months.
Patients were observed from their initial office visit with a surgeon, during the preoperative education encounter, and in the operating room and on the surgical ward until discharge. Representatives from multiple disciplines who encountered patients at various times in the process, including medical assistants, patient care technicians, nurses, nurse practitioners, physical therapists, and physicians, participated in a kick-off meeting to identify difficulties they encounter when encouraging patient ambulation. The following 4 areas were identified.
Barriers to Patient Ambulation
Patient Expectations. Patients did not appear to have a clear expectation of what their ambulation goals were postoperatively, despite the fact that each patient is given an operative pathway booklet that includes their goals for each day, including ambulation. The consensus was that patients were overwhelmed with the amount of information and, oftentimes, the severity of their diagnosis, so the information regarding ambulation was not retained. Nurses commented that patients frequently stated that they did not think their surgeon wanted them to get out of bed postoperatively.
Electronic Orders. There was confusion within the nursing staff regarding orders in the electronic health record compared to physician expectations. Orders stated patients should ambulate 3 times daily, but did not specify on which postoperative day this should start. Often, nursing verbal sign-out from the post-anesthesia care unit (PACU) would be an order for bedrest, despite no clear origin of this order. This created confusion among the nursing staff as to what the appropriate ambulation orders should be.
Nursing Workflow. The initial state of the nursing workflow was not conducive to evaluating for, or assisting with, ambulation. With no set time to assist and evaluate patients for ambulation, it turned into a task nurses needed to accomplish when they had extra time. With increasing demands of charting in the electronic health record, nurses often had to skip ambulation in order to accomplish other tasks.
Family Expectations. In addition to patient expectations, family members often had expectations that were not congruent with the planned postoperative course. Nurses stated family members would often tell them that they did not feel that their family member should be ambulating so soon after surgery. Often these family members had not attended preoperative education sessions with the patient. This was compounded by the uncertainty among the nursing staff regarding what exactly the ambulation orders were.
Interventions
Targeted interventions were created to address these 4 barriers to ambulation identified by staff.
Preoperative Education. Although all elective patients received a printed operative pathway booklet describing daily goals, including ambulation, patients still did not have a sufficient understanding of what was expected of them. The education session was modified to increase the time spent on both the expectation for and the rationale behind ambulation. That section of the education session ended with a verbal commitment and read-back of the expectations for ambulation by the patient.
Clarification of Electronic Orders. Postoperative orders within the colorectal standard pathway were changed, including specific time frames and frequency, to match the information provided in the patient education booklet. These orders were for ambulation within 4 hours of arrival to the floor, and the orders also noted that no patient should be on bedrest unless explicitly stated. From POD 1, all patients were to ambulate at least twice daily for the remainder of the hospital stay (patients were encouraged to walk 4 times daily, but we set a minimum expectation of twice daily for the order set). These orders were clarified with in-person meetings with the nursing staff and leadership from the PACU and the colorectal surgical ward.
Adjusted Nursing Workflow. Nurses were interviewed and asked to create a plan regarding how they could better incorporate ambulation into their daily workflow. Ambulation assessment was incorporated into the twice-per-shift recording of vital signs and patient safety assessment. This was recorded into the electronic health record at the same time as the patients’ vital signs. This allowed nurses to keep track of which patients would need extra assistance in ambulation and which patients were doing well on their own with the assistance of family. It also helped focus the resources of physical therapy and the single ambulation technician on the floor and to assist patients who needed more assistance.
Creation of Ambulation Encouragement Signs. The authors discovered that despite patients being told preoperatively about ambulation expectations, friends and family are not always included in these conversations. As nurses frequently cited both patients and family as reasons patients thought they should not walk, multiple signs inviting patients to take an active role in their recovery by ambulating were created and placed around the unit. The signs outlined the expectations of being out of bed and taking at least 1 step on the day of surgery and walking at least 4 times per day thereafter. In addition, we addressed frequently asked questions around issues such as walking with intravenous poles and urinary catheters. The posters were signed by all staff colorectal surgeons.
Results
Over the course of 7 months (June 2018 to December 2018), 253 postintervention patients were identified (Table 2). There was no difference between the pre-intervention group (n = 1762) and the postintervention group in terms of sex, race, origin, emergency status, operative time, and the majority of medical comorbidities (with the exception of smoking status and congestive heart failure). The postintervention group was slightly older (60 versus 57 years) and had a higher percentage of patients with an American Society of Anesthesiologists physical status score greater than 2 (66.8% versus 51.2%). The postintervention group also had higher rates of both malignancy (53.4% versus 33.3%) and inflammatory bowel disease (18.2% versus 14.4%).
The fidelity of the PDSA cycle was measured by pre-intervention and postintervention ambulation rates. Ambulation rates on POD 0, 1, and 2 improved from 36.4%, 47.3%, and 50.2% to 36.8%, 74.7%, and 82.6%, respectively (Table 3). The VTE rate decreased from 2.7% to 0.4% (P = 0.02), with 1 DVT and 0 PEs. It should be noted that the only patient who developed a VTE postintervention did not ambulate on PODs 0, 1, or 2.
Discussion
Postoperative VTE is a severe complication for postoperative colorectal surgery patients. Previous studies have demonstrated that increasing ambulation is associated with a lower rate of overall complications, and, when incorporated into a bundle, is associated with decreased rates of VTE.11,15 However, this is the first study to our knowledge demonstrating that creation of an ambulation protocol alone is associated with a decrease in VTE.
Analysis of pre-intervention data demonstrated a strong association between ambulation and an absence of VTE. No patient who ambulated on PODs 0, 1, and 2 developed a VTE. Based on those results, we moved forward with creating the ambulation protocol. While ambulation stayed stable on POD 0, there were 60% and 65% increases on PODs 1 and 2, respectively. Nurses cited late arrival to the floor for second and third start cases as the primary difficulty in getting patients to ambulate more on POD 0.
We believe the key to the success of the ambulation protocol was its multidisciplinary nature. Certainly, the easiest way to create an ambulation protocol is to change the postoperative orders to state patients must walk 4 times per day. However, if the nursing staff is unable or unwilling to carry out these orders, the orders serve little purpose. In order to make lasting changes, all stakeholders in the process must be identified. In our case, stakeholders included surgery and nursing leadership, surgeons, nurse practitioners, nurses, medical assistants, physical therapists, patient care technicians, and patients. This is where we utilized kaizen, a core principle of Lean methodology that empowers employees at the level of the work being carried out to propose ideas for improvement.16 From the beginning of the patient experience, the health care practitioners who were carrying out each step of the process were best able to identify the problems and create solutions. In addition, stakeholders were given regular updates regarding how their efforts were increasing ambulation rates and the results at the end of the study period.
This study also demonstrates that, in a health care system increasingly focused on both quality and cost, significant improvements in quality can be made without increasing cost or resource utilization. Early in the process, it was proposed that the only way to increase the ambulation rate would be to increase the number of physical therapists, nurses, and nursing assistants. However, after identifying the root causes of the problem, the solutions had more to do with improving workflow and fixing problem areas identified by the staff.
In addition to having a positive effect on the outcome studied, collaborative projects such as this between physicians and nurses may lead to increased nursing job satisfaction. A meta-analysis of 31 studies identified nurse-physician collaboration and autonomy as 2 factors that correlate most strongly with nursing satisfaction.17 A Cochrane review also suggests that practice-based interprofessional collaboration may lead to improved health care processes and outcomes.18
This study has several limitations. Pre-intervention ambulation rates were abstracted from institution-specific NSQIP data, and missing data were excluded from analysis. Also, due to the retrospective collection of the pre-intervention data, the distance of ambulation could not be quantified. The bar for ambulation is low, as patients were only required to get out of bed and walk 1 step. However, we feel that getting out of bed and taking even 1 step is substantially better than complete bedrest. It is likely that once patients cross the threshold of taking 1 step, they are more likely to ambulate. An area of future study may be to more precisely define the relationship between the quantity of ambulation in steps and its effect on VTE. Finally, we acknowledge that while there is no direct increase in costs, implementing an ambulation protocol does take time from all who participate in the project.
Conclusion
Creation of an ambulation protocol is associated with a decrease in postoperative VTE rates in colorectal surgery patients. A multidisciplinary approach is critical to identify the underlying problems and propose effective solutions. Further studies are required to better correlate the distance of ambulation and its effect on VTE. However, this study shows that even a minimum of 1 step is associated with decreased VTE rates.
Corresponding author: Aneel Damle, MD, MBA, Colon & Rectal Surgery Associates, 3433 Broadway St. NE, Suite 115, Minneapolis, MN 55413; adamle@CRSAL.org.
Financial disclosures: None.
1. Gangireddy C, Rectenwald JR, Upchurch GR, et al. Risk factors and clinical impact of postoperative symptomatic venous thromboembolism. J Vasc Surg. 2007;45:341-342.
2. Newhook TE, LaPar DJ, Walters DM, et al. Impact of postoperative venous thromboembolism on postoperative morbidity, mortality, and resource utilization after hepatectomy. Am Surg. 2015;81:1216-1223.
3. Bergqvist D. Venous thromboembolism: a review of risk and prevention in colorectal surgery patients. Dis Colon Rectum. 2006;49:1620-1628.
4. Fleming F, Gaertner W, Ternent CA, et al. The American society of colon and rectal surgeons clinical practice guideline for the prevention of venous thromboembolic disease in colorectal surgery. Dis Colon Rectum. 2018;61:14-20.
5. McLeod RS, Geerts WH, Sniderman KW, et al. Canadian Colorectal Surgery DVT Prophylaxis Trial investigators. Subcutaneous heparin versus low-molecular-weight heparin as thromboprophylaxis in patients undergoing colorectal surgery: results of the Canadian colorectal DV prophylaxis trial: a randomized, double-blind trial. Ann Surg. 2001;233:438-444.
6. Shapiro R, Vogel JD, Kiran RP. Risk of postoperative venous thromboembolism after laparoscopic and open colorectal surgery: an additional benefit of the minimally invasive approach? Dis Colon Rectum. 2011;54:1496-1502.
7. Dimick JB, Chen SL, Taheri PA, et al. Hospital costs associated with surgical complications: a report from the private-sector National Surgical Quality Improvement Program. J Am Coll Surg. 2004;199:531-537.
8. Fleming FJ, Kim MJ, Salloum RM, et al. How much do we need to worry about venous thromboembolism after hospital discharge? A study of colorectal surgery patients using the National Surgical Quality Improvement Program database. Dis Colon Rectum. 2010;53:1355-1360.
9. ACS NSQIP. User guide for the 2016 ACS NSQIP participant use data file (PUF). 2017. www.facs.org/~/media/files/quality%20programs/nsqip/nsqip_puf_userguide_2016.ashx Accessed July 10, 2020.
10. Caprini JA. Risk assessment as a guide for the prevention of the many faces of venous thromboembolism. Am J Surg. 2010;199(1 Suppl):S3-S10.
11. Cassidy MR, Rosenkranz P, McAney D. Reducing postoperative venous thromboembolism complications with a standardized risk-stratified prophylaxis protocol and mobilization protocol. J Am Coll Surg. 2014;218:1095-1104.
12. Lau BD, Streiff MB, Kraus PS, et al. No evidence to support ambulation for reducing postoperative venous thromboembolism. J Am Coll Surg. 2014;219:1101-1103.
13. McNicholas C, Lennox L, Woodcock T, et al. Evolving quality improvement support strategies to improve Plan–Do–Study–Act cycle fidelity: a retrospective mixed-methods study. BMJ Qual Saf. 2019;28:356-365.
14. Taylor MJ, McNicholas C, Nicolay C, et al. Systematic review of the application of the plan–do–study–act method to improve quality in healthcare. BMC Qual Saf. 2014;23:290-298.
15. Nevo Y, Shaltiel T, Constantini N, et al. Effect of ambulation and physical activity on postoperative complications. J Am Coll Surg. 2016;223(Suppl 1):S61.
16. Mazzocato P, Stenfors-Hayes T, von Thiele Schwarz U, et al. Kaizen practice in healthcare: a qualitative analysis of hospital employees’ suggestions for improvement. BMJ Open. 2016;6:e012256.
17. Zangaro GA, Soeken KL. A meta-analysis of studies of nurses’ job satisfaction. Res Nursing Health. 2007;30:445-458.
18. Reeves S, Pelone F, Harrison R, et al. Interprofessional collaboration to improve professional practice and healthcare outcomes. Cochrane Database Syst Rev. 2017;6(6):CD000072.
A Curriculum for Training Medical Faculty to Teach Mental Health Care—and Their Responses to the Learning
From Michigan State University, East Lansing, MI.
Abstract
- Objective: We previously reported that training medical faculty to teach mental health care to residents was effective. We here describe the faculty’s training curriculum and their responses to learning and teaching mental health care, a unique focus in the educational literature.
- Design: Qualitative researchers assessed the experiences of medical faculty trainees in learning and teaching mental health care.
- Setting: Internal medicine residency training program at Michigan State University.
- Participants: One early career medicine faculty learner and another faculty learner at mid-career, 4 faculty trainers, and 2 qualitative researchers.
- Measurements: Typed qualitative research reports were evaluated by the authors from 4 time periods: (1) following didactic and interviewing training; (2) following training in a mental health clinic; (3) following training to teach residents mental health care; and (4) 8 months after training.
- Results: Faculty expressed anxiety and low confidence at each of 3 levels of training, but progressively developed confidence and satisfaction during training at each level. They rated didactic experiences as least valuable, seeing these experiences as lacking practical application. Experiential training in interviewing and mental health care were positively viewed, as was the benefit from mentoring. Teaching mental health skills to residents was initially difficult, but faculty became comfortable with experience, which solidified the faculty’s confidence in their own skills.
- Conclusion: A new curriculum for training medical faculty to teach mental health care was demonstrated to be acceptable to the faculty, based on findings from multiple focus groups.
Keywords: psychiatry; primary care mental health; medical education; curriculum; formative evaluation.
We previously trained general medicine faculty intensively in 3 evidence-based models essential for mental health care.1-4 They, in turn, trained medical residents in the models over all 3 years of residency training.5 The results of this quasi-experimental trial demonstrated highly significant learning by residents on all 3 models.6 To address the mental health care crisis caused by the severe shortage of psychiatrists in the United States,7-14 we propose this train-the-trainer intervention as a model for widescale training of medical faculty in mental health care, thus enabling them to then train their own residents and students indefinitely.6
This brief report details the faculty training curriculum in mental health care and its teaching, along with the responses of medical faculty to the training; no similar training experiences have been reported in the medical or psychiatric literature. While the residency training curriculum has been published,5 the faculty training curriculum has not. Additionally, faculty responses to the training are important because they can provide key information about what did and did not work. Even though demonstrated to be effective for teaching mental health care to residents,6 the training must also be acceptable to its new teachers.15
Methods
Design, Setting, and Participants
This descriptive study was conducted by 2 experienced qualitative researchers in the setting of a 5-year quantitative study of residents’ learning of mental health care.5,6 They interviewed 2 general medicine faculty undergoing training in mental health care on 4 occasions: 3 times during training and once following training. Learners were taught by 4 faculty trainers (2 general medicine, 2 psychiatry). The setting was the internal medicine residency program at Michigan State University. The project was approved by the local Institutional Review Board.
Faculty Training Intervention
The 2 training faculty evaluated in this study were taught in a predominantly experiential way.5 Learning objectives were behaviorally defined (see Table 1, which also presents the teaching methods). Teaching occurred in 3 segments over 15 months, with a 10% weekly commitment to training supported by a research grant.

First 6 Months. For 1 half-day (4 hours) every week, teaching sessions were divided into 2 parts:
1. Experiential learning of the objectives, particularly patient-centered interviewing (Table 2)16 and mental health care models (Table 3).3,17 This initially involved role playing and was followed by using the models with hospital and clinic patients, sometimes directly observed, other times evaluated via audiotaped recordings.

2. Lecture and reading series, which occurred in 2 parts: (a) For the first 3 months, a biopsychosocial and patient-centered medicine seminar was guided by readings from a patient-centered interviewing textbook and 4 articles.3,16,18-20 These readings were supplemented by a large collection of material on our website that was utilized in a learner-centered fashion, depending on learners’ interests (these are available from the authors, along with a detailed outline we followed for each teaching session). (b) For the last 3 months, a psychiatry lecture series addressed the material needed for primary care mental health. The lectures were guided by a psychiatry textbook (the schedule and content of presentations is available from the authors).21

Beginning in the first 6 months, faculty also participated as co-teachers with their trainers in a long-standing psychosocial rotation, a 1-month full-time rotation for PGY-1 residents that occurred twice yearly during training. This initially helped them learn the models, and they later received experience in how to teach the models.
Middle 4 Months. During this period, faculty learners were supervised by trainers as they transitioned to learn mental health care in a Complex Patient Clinic (CPC). Training was guided by a syllabus now contained in a textbook.17 The CPC is a unique mental health care clinic located in the clinic area where faculty and residents observe other patients. Rooms resemble other exam rooms, except they have a computer attached to an audio-video camera that delivers the physician-patient interaction live to another room, where faculty observe it via a software program (Vidyo, Hackensack, NJ)22,23; no recordings are made of the live interactions. The details of patient recruitment and the CPC are described elsewhere.22 CPC patients had an average of 2.3 DSM-V diagnoses and 3.3 major medical diagnoses. Faculty trainees evaluated 2 or 3 patients each day.
Final 5 Months. Supervision continued for faculty learners as they taught mental health care to postgraduate year (PGY) 2 and 3 residents in the CPC. Residents had between 6 and 8 sessions in each of their last 2 years of training; 2 residents were assigned for each half-day CPC session and each evaluated 2 or 3 patients under faculty-learner supervision.
Data Collection
The qualitative interviewers were independent of the study. The research team members did not see the transcripts until preparing this report in conjunction with the interviewers. Data were collected from faculty at 4 points: following the initial 6 months of training in the models; following training in mental health care in the CPC; following supervision of faculty training of residents; and 8 months following completion of training, during which time they independently taught residents.
Data were collected in a systematic way over 1 hour, beginning and continuing open-endedly for about 30 minutes and concluding with closed-ended inquiry to pin down details and to ask any pre-planned questions that had not been answered. The protocol that guided focus group interviews is available from the authors.
Audio recordings were made from each group, and a 500- to 1000-word report was written by the interviewers, which served as the basis of the present descriptive evaluation. The authors independently analyzed the data at each collection point and then came to the consensus that follows.
Results
Lectures/Didactic Training
The training sessions involved 2 parts: lectures and didactic material around interviewing, general system theory, and psychiatry diagnoses; and skills practice in interviewing and the mental health care models. The trainers and faculty met weekly for 4 hours, and the first 2 hours of these sessions were spent reviewing the background of what would become the mainstay of the teaching, the models for interviewing and mental health care (Table 2 and Table 3). These readings differed in content and style from the typical clinical readings that physicians use, and they required considerable outside time and preparation, beyond that anticipated by the trainees. Digging into these theoretical concepts was described as interesting and “refreshing,” but the trainees at first found the readings disconnected from their clinical work. Faculty trainees later recognized the importance of understanding the models as they prepared for their roles as teachers. All told, however, the trainees believed there was too much didactic material.
Receiving education on diagnosis and management of common psychiatric disorders from academic psychiatrists was appreciated, but the trainees also expressed the greatest frustrations about this part of the curriculum. They felt that the level of these sessions was not always appropriately gauged—ranging from too simplistic, as in medical school, to too detailed, especially around neurochemical and neurobiological mechanisms. Although they appreciated learning about advanced psychiatric illness and treatments (eg, electroconvulsive treatment, especially), they did not believe the information was necessary in primary care. Trainees were experienced primary care providers and were more interested in case-based education that could highlight the types of patients seen in their office every day. One trainee indicated that these sessions were lacking “the patient voice.” Abstract discussion of diagnoses and treatments made it challenging to apply this new knowledge to the trainees’ practices. Trainees also suggested trying to integrate this section of the training with the interviewing skills training to better highlight that interplay. The trainees believed that their understanding and familiarity with the diagnosis and management of mental disorders occurred primarily in later CPC training. The trainees recommended that all didactic material be reduced by half or more in future teaching.
Skills Practice
The patient-centered interviewing skills practice, which occurred in the second 2-hour period during the first 6 months, was lauded by the faculty trainees. It was considered the “most immediately relevant component” of this period of training. Because the trainees were experienced physicians when they began this project, they felt this part of training made the “…material more accessible to myself, more germane to what I do day in and day out.” The insight of modifying the interviewing techniques to connect with different patient personality types was particularly helpful. One trainee described an “aha moment” of “getting patients to open up in a way I had not been able to do before.” As time went on, the trainees felt empowered to adapt “the interviewing script” modestly to fit their already developed “rhythm and style with their patients.”
Wellness/Mentoring
The 2 trainees were at different stages of their careers, 1 early-career faculty and 1 mid-career faculty. This academic diversity within the small training group provided varied perspectives not only on the concepts presented and discussed, but also on a more personal level. In an otherwise hectic academic medicine environment, this group had a weekly chance to stop, “check in” with each other, and truly connect on a personal level. To be asked “about your week and actually mean it and want to hear the answer” is an unusual opportunity, one noted. It also offered time and support for purposeful self-reflection, which “often brought some emotions to the surface…at different times.” These connections were perhaps one of the most valuable parts of the experience. With burnout among physicians rampant,24 establishing these networks is invaluable. In addition to introspection and personal connections, there was a strong element of mentoring during these weekly meetings. The opportunity to meet in a small group with senior faculty was highly valued by the trainees.
Mental Health Care: Complex Patient Clinic
The faculty were eager, but very apprehensive, in beginning the second segment of training, where work shifted from lectures and practicing skills to mental health care training in the CPC. The trainees expressed anxiety about several areas. These included additional clinical workload, patient referral/selection, and transition of patient care back to the primary care provider. Of note, they did not particularly express worries about the care they would be providing, because a psychiatrist would be available to them on site. In reflection, after spending 4 months in the clinic, trainees noted “how important observing live interviews for evaluation/feedback was to their learning.” The CPC provided “learning in the moment on specific patients [which] was without question the most powerful teaching tool.” The support of the training faculty who were present at each clinic was invaluable. Whereas the earlier didactics given by psychiatrists were received by trainees with lukewarm enthusiasm, the point-of-care, case-by-case learning and feedback truly advanced the trainees’ knowledge, as well as skills, and improved their confidence in providing mental health care.
One of the tenets of the mental health care models is collaborative care.25 Recognizing this critical component of patient care, the CPC experience integrated a clinical social worker. The faculty noted the critical role she played in the patient care experience. They described her as “fabulous and awesome.” Her grasp of the health care system and community resources (particularly for an underserved population) was indispensable. Additionally, she was able to serve as a steady contact to follow patients through multiple visits and improve their feelings of continuity.
Teaching: Psychosocial Rotation
The first psychosocial teaching occurred after the interviewing skills and didactic experiences in the first 6 months. The trainees expressed great doubt about tackling this initial teaching experience. From residents challenging the need for interviewing and other aspects of “touchy-feely” teaching, to patients expressing raw emotions, the trainees lacked confidence in their ability to handle these moments. At this early stage of their training, one trainee said, “I feel like I am becoming a better interrogator, but I haven’t learned the skills to be a better healer yet.” Over time, this concern disappeared. As training evolved, the trainees began to thrive in their role as educator. At the final focus group, it was noted that “teaching has enhanced [my] confidence in the framework and in turn has made it easier to teach.”
Teaching: Complex Patient Clinic
This powerful teaching tool to train residents was the centerpiece of training. The faculty trainees had some hesitation about their role as teacher before it began. The faculty trainees were at different stages of their careers, and their confidence in their own teaching skills was not uniform. Importantly, the initial structure of the CPC, which included psychiatrists and senior faculty supervision, provided strong and continued support for the faculty trainees. Later work in the CPC as teacher, rather than trainee, further bolstered the faculty’s confidence in the treatment models. As confidence with their own skills grew, faculty noted that it became “easier to teach” as well. Faculty also recognized the unique opportunity that the CPC provided in directly observing a resident’s patient interaction. This allows them to “monitor progress, provide specific feedback, and address issues.” The time spent debriefing after each patient encounter was noted to be particularly important. When they became too busy to adequately provide this debriefing, changes to the schedule were made to accommodate it (follow-up visits were lengthened from 30 to 60 minutes). In addition to giving an opportunity to provide feedback, this extra time available for residents to interact with a patient—to utilize and practice the interviewing skills, for example—was quite valuable, independent of actual mental health care training. Finally, the faculty were able to create a “relaxed and comfortable” space in the CPC. Indeed, the faculty felt comfortable sharing some of their struggles and reflections on caring for a mental health patient population, and residents were able, in turn, to engage in some self-reflection and debriefing as well.
Discussion
Faculty trainees demonstrated a striking evolution as they progressed through this curriculum. At each of the 3 stages of training, they endorsed a broad range of feelings, from anxiety and uncertainty initially, to confidence and growth and appreciation later. They felt satisfied with having participated in the project and are engaged in exploring next steps.
Of note, these faculty members had some exposure to the skills models prior to starting the program because the residency program has integrated patient-centered interviewing into its program for many years. The faculty were supportive of the models prior to engaging in the curriculum, and they volunteered to participate. Similarly, the residents were familiar with the expectations as they went through the psychosocial rotation and the CPC. It is conceivable that the interviewing and mental health material may not be received as easily at an institution where the culture has had less exposure to such teaching.
While describing a faculty curriculum for mental health training is unique5 and the primary intent of this paper, we wanted to present its formative evaluation even though only 2 faculty trainees were involved. Simply put, the grant for this project supported only 2 trainees, and no more were required. Nevertheless, we propose that this only reported experience of medical faculty with mental health training is an important addition to the literature in mental health education. It will be a critical guide for others who choose the new direction of training medical faculty to teach mental health care.
As the research team looks to foster dissemination of the curriculum, it continues to be streamlined to highlight the components most useful and germane to learners. The early didactic readings on subjects such as general system theory were less engaging. (In later training of new medical faculty learners, the focus on theory and other didactics was reduced.) In contrast, the trainees clearly valued the interviewing skills experience (both learning and teaching). While the mental health curriculum and the CPC were associated with much greater anxiety in the trainees, with practical, respectful, and supervised teaching, they became confident and satisfied—as well as effective.6 Future teachers will benefit from slowly and understandingly addressing trainees’ personal issues, particularly during the initial phases of training.26 It appeared to us to be the key factor enabling the faculty to successfully learn and teach mental health care. Once they overcame their personal reactions to mental health material, they learned mental health skills just as they learn the more familiar physical disease material.
Conclusion
In a new direction in medical education, a curriculum for training medical faculty to teach mental health care is presented. Not only did prior research demonstrate that the faculty effectively trained residents, but we also demonstrated here that the training was acceptable to and valued by faculty. With mental health often an alien dimension of medicine, acceptability is especially important when we recommend disseminating the curriculum as a way to offset the national mental health care crisis.
Corresponding author: Robert C. Smith, 788 Service Road, B314 Clinical Center, East Lansing, MI 48824; smithrr@msu.edu.
Financial disclosures: None.
Funding support: The authors are grateful for the generous support from the Health Resources and Services Administration (D58HP23259).
1. Smith R, Gardiner J, Luo Z, et al. Primary care physicians treat somatization. J Gen Int Med. 2009;24:829-832.
2. Smith RC, Lyles JS, Gardiner JC, et al. Primary care clinicians treat patients with medically unexplained symptoms—a randomized controlled trial. J Gen Intern Med. 2006;21:671-677.
3. Smith RC, Lein C, Collins C, et al. Treating patients with medically unexplained symptoms in primary care. J Gen Intern Med. 2003;18:478-489.
4. Smith RC, Lyles JS, Mettler J, et al. The effectiveness of intensive training for residents in interviewing. A randomized, controlled study. Ann Intern Med. 1998;128:118-126.
5. Smith R, Laird-Fick H, D’Mello D, et al. Addressing mental health issues in primary care: an initial curriculum for medical residents. Patient Educ Couns. 2014;94:33-42.
6. Smith R, Laird-Fick H, Dwamena F, et al. Teaching residents mental health care. Patient Educ Couns. 2018;101:2145-2155.
7. Cunningham PJ. Beyond parity: primary care physicians’ perspectives on access to mental health care. Health Aff (Millwood). 2009;28:w490-501.
8. US Department of Health and Human Services: Healthy People 2020: The Road Ahead. Washington, DC: US Governmant Printing Office; 2011.
9. US Department of Health and Human Services. Facing Addiction in America—The Surgeon General’s Report on Alcohol, Drugs, and Health. Washington, DC: US Dept of Health and Human Services; 2016.
10. US Department of Health and Human Services. Mental Health and Mental Disorders. Washington, DC: US Government Printing Office; 2000.
11. Hogan MF. The President’s New Freedom Commission: recommendations to transform mental health care in America. Psychiatr Serv. 2003;54:1467-1474.
12. Morrisey J, Thomas K, Ellis A, et al. Development of a New Method for Designation of Mental Health Professional Shortage Areas. Chapel Hill, NC: University of North Carolina at Chapel Hill; 2007.
13. US Department of Health and Human Services. Mental Health: a Report of the Surgeon General. Rockville, MD: Dept. of Health and Human Services; 1999.
14. Wang PS, Lane M, Olfson M, et al. Twelve-month use of mental health services in the United States: results from the National Comorbidity Survey Replication. Arch Gen Psychiatry. 2005;62:629-640.
15. Kern DE, Thomas PA, Hughes MT. Curriculum Development for Medical Education: A Six-Step Approach. Baltimore, MD: The Johns Hopkins University Press; 2009.
16. Fortin 6th AH, Dwamena F, Frankel R, et al. Smith’s Patient-Centered Interviewing: An Evidence-Based Method. 4th ed. New York, NY: McGraw-Hill; 2018.
17. Smith R, D’Mello D, Osborn G, et al. Essentials of Psychiatry in Primary Care: Behavioral Health in the Medical Setting. New York, NY: McGraw Hill; 2019 .
18. Smith R, Fortin AH 6th, Dwamena F, et al. An evidence-based patient-centered method makes the biopsychosocial model scientific. Patient Educ Couns. 2013;90:265-270.
19. Smith R, Dwamena F, Grover M, et al. Behaviorally-defined patient-centered communication—a narrative review of the literature. J Gen Intern Med. 2010;26:185-191.
20. Smith RC, Dwamena FC. Classification and diagnosis of patients with medically unexplained symptoms. J Gen Intern Med. 2007;22:685-691.
21. Schneider RK, Levenson JL. Psychiatry Essentials for Primary Care. Philadelphia, PA: American College of Physicians; 2008.
22. Dwamena F, Laird-Fick H, Freilich L, et al. Behavioral health problems in medical patients. J Clin Outcomes Manage. 2014;21:497-505.
23. Vidyo (Hackensack, NJ). http://www.vidyo.com/products/use/. 2014.
24. Panagioti M, Panagopoulou E, Bower P, et al. Controlled interventions to reduce burnout in physicians: a systematic review and meta-analysis. JAMA Intern Med. 2017;177:195-205.
25. Huffman JC, Niazi SK, Rundell JR, et al. Essential articles on collaborative care models for the treatment of psychiatric disorders in medical settings: a publication by the Academy of Psychosomatic Medicine Research and Evidence-Based Practice Committee. Psychosomatics. 2014;55:109-122.
26. Smith RC, Dwamena FC, Fortin AH 6th. Teaching personal awareness. J Gen Intern Med. 2005;20:201-207.
From Michigan State University, East Lansing, MI.
Abstract
- Objective: We previously reported that training medical faculty to teach mental health care to residents was effective. We here describe the faculty’s training curriculum and their responses to learning and teaching mental health care, a unique focus in the educational literature.
- Design: Qualitative researchers assessed the experiences of medical faculty trainees in learning and teaching mental health care.
- Setting: Internal medicine residency training program at Michigan State University.
- Participants: One early career medicine faculty learner and another faculty learner at mid-career, 4 faculty trainers, and 2 qualitative researchers.
- Measurements: Typed qualitative research reports were evaluated by the authors from 4 time periods: (1) following didactic and interviewing training; (2) following training in a mental health clinic; (3) following training to teach residents mental health care; and (4) 8 months after training.
- Results: Faculty expressed anxiety and low confidence at each of 3 levels of training, but progressively developed confidence and satisfaction during training at each level. They rated didactic experiences as least valuable, seeing these experiences as lacking practical application. Experiential training in interviewing and mental health care were positively viewed, as was the benefit from mentoring. Teaching mental health skills to residents was initially difficult, but faculty became comfortable with experience, which solidified the faculty’s confidence in their own skills.
- Conclusion: A new curriculum for training medical faculty to teach mental health care was demonstrated to be acceptable to the faculty, based on findings from multiple focus groups.
Keywords: psychiatry; primary care mental health; medical education; curriculum; formative evaluation.
We previously trained general medicine faculty intensively in 3 evidence-based models essential for mental health care.1-4 They, in turn, trained medical residents in the models over all 3 years of residency training.5 The results of this quasi-experimental trial demonstrated highly significant learning by residents on all 3 models.6 To address the mental health care crisis caused by the severe shortage of psychiatrists in the United States,7-14 we propose this train-the-trainer intervention as a model for widescale training of medical faculty in mental health care, thus enabling them to then train their own residents and students indefinitely.6
This brief report details the faculty training curriculum in mental health care and its teaching, along with the responses of medical faculty to the training; no similar training experiences have been reported in the medical or psychiatric literature. While the residency training curriculum has been published,5 the faculty training curriculum has not. Additionally, faculty responses to the training are important because they can provide key information about what did and did not work. Even though demonstrated to be effective for teaching mental health care to residents,6 the training must also be acceptable to its new teachers.15
Methods
Design, Setting, and Participants
This descriptive study was conducted by 2 experienced qualitative researchers in the setting of a 5-year quantitative study of residents’ learning of mental health care.5,6 They interviewed 2 general medicine faculty undergoing training in mental health care on 4 occasions: 3 times during training and once following training. Learners were taught by 4 faculty trainers (2 general medicine, 2 psychiatry). The setting was the internal medicine residency program at Michigan State University. The project was approved by the local Institutional Review Board.
Faculty Training Intervention
The 2 training faculty evaluated in this study were taught in a predominantly experiential way.5 Learning objectives were behaviorally defined (see Table 1, which also presents the teaching methods). Teaching occurred in 3 segments over 15 months, with a 10% weekly commitment to training supported by a research grant.
First 6 Months. For 1 half-day (4 hours) every week, teaching sessions were divided into 2 parts:
1. Experiential learning of the objectives, particularly patient-centered interviewing (Table 2)16 and mental health care models (Table 3).3,17 This initially involved role playing and was followed by using the models with hospital and clinic patients, sometimes directly observed, other times evaluated via audiotaped recordings.
2. Lecture and reading series, which occurred in 2 parts: (a) For the first 3 months, a biopsychosocial and patient-centered medicine seminar was guided by readings from a patient-centered interviewing textbook and 4 articles.3,16,18-20 These readings were supplemented by a large collection of material on our website that was utilized in a learner-centered fashion, depending on learners’ interests (these are available from the authors, along with a detailed outline we followed for each teaching session). (b) For the last 3 months, a psychiatry lecture series addressed the material needed for primary care mental health. The lectures were guided by a psychiatry textbook (the schedule and content of presentations is available from the authors).21
Beginning in the first 6 months, faculty also participated as co-teachers with their trainers in a long-standing psychosocial rotation, a 1-month full-time rotation for PGY-1 residents that occurred twice yearly during training. This initially helped them learn the models, and they later received experience in how to teach the models.
Middle 4 Months. During this period, faculty learners were supervised by trainers as they transitioned to learn mental health care in a Complex Patient Clinic (CPC). Training was guided by a syllabus now contained in a textbook.17 The CPC is a unique mental health care clinic located in the clinic area where faculty and residents observe other patients. Rooms resemble other exam rooms, except they have a computer attached to an audio-video camera that delivers the physician-patient interaction live to another room, where faculty observe it via a software program (Vidyo, Hackensack, NJ)22,23; no recordings are made of the live interactions. The details of patient recruitment and the CPC are described elsewhere.22 CPC patients had an average of 2.3 DSM-V diagnoses and 3.3 major medical diagnoses. Faculty trainees evaluated 2 or 3 patients each day.
Final 5 Months. Supervision continued for faculty learners as they taught mental health care to postgraduate year (PGY) 2 and 3 residents in the CPC. Residents had between 6 and 8 sessions in each of their last 2 years of training; 2 residents were assigned for each half-day CPC session and each evaluated 2 or 3 patients under faculty-learner supervision.
Data Collection
The qualitative interviewers were independent of the study. The research team members did not see the transcripts until preparing this report in conjunction with the interviewers. Data were collected from faculty at 4 points: following the initial 6 months of training in the models; following training in mental health care in the CPC; following supervision of faculty training of residents; and 8 months following completion of training, during which time they independently taught residents.
Data were collected in a systematic way over 1 hour, beginning and continuing open-endedly for about 30 minutes and concluding with closed-ended inquiry to pin down details and to ask any pre-planned questions that had not been answered. The protocol that guided focus group interviews is available from the authors.
Audio recordings were made from each group, and a 500- to 1000-word report was written by the interviewers, which served as the basis of the present descriptive evaluation. The authors independently analyzed the data at each collection point and then came to the consensus that follows.
Results
Lectures/Didactic Training
The training sessions involved 2 parts: lectures and didactic material around interviewing, general system theory, and psychiatry diagnoses; and skills practice in interviewing and the mental health care models. The trainers and faculty met weekly for 4 hours, and the first 2 hours of these sessions were spent reviewing the background of what would become the mainstay of the teaching, the models for interviewing and mental health care (Table 2 and Table 3). These readings differed in content and style from the typical clinical readings that physicians use, and they required considerable outside time and preparation, beyond that anticipated by the trainees. Digging into these theoretical concepts was described as interesting and “refreshing,” but the trainees at first found the readings disconnected from their clinical work. Faculty trainees later recognized the importance of understanding the models as they prepared for their roles as teachers. All told, however, the trainees believed there was too much didactic material.
Receiving education on diagnosis and management of common psychiatric disorders from academic psychiatrists was appreciated, but the trainees also expressed the greatest frustrations about this part of the curriculum. They felt that the level of these sessions was not always appropriately gauged—ranging from too simplistic, as in medical school, to too detailed, especially around neurochemical and neurobiological mechanisms. Although they appreciated learning about advanced psychiatric illness and treatments (eg, electroconvulsive treatment, especially), they did not believe the information was necessary in primary care. Trainees were experienced primary care providers and were more interested in case-based education that could highlight the types of patients seen in their office every day. One trainee indicated that these sessions were lacking “the patient voice.” Abstract discussion of diagnoses and treatments made it challenging to apply this new knowledge to the trainees’ practices. Trainees also suggested trying to integrate this section of the training with the interviewing skills training to better highlight that interplay. The trainees believed that their understanding and familiarity with the diagnosis and management of mental disorders occurred primarily in later CPC training. The trainees recommended that all didactic material be reduced by half or more in future teaching.
Skills Practice
The patient-centered interviewing skills practice, which occurred in the second 2-hour period during the first 6 months, was lauded by the faculty trainees. It was considered the “most immediately relevant component” of this period of training. Because the trainees were experienced physicians when they began this project, they felt this part of training made the “…material more accessible to myself, more germane to what I do day in and day out.” The insight of modifying the interviewing techniques to connect with different patient personality types was particularly helpful. One trainee described an “aha moment” of “getting patients to open up in a way I had not been able to do before.” As time went on, the trainees felt empowered to adapt “the interviewing script” modestly to fit their already developed “rhythm and style with their patients.”
Wellness/Mentoring
The 2 trainees were at different stages of their careers, 1 early-career faculty and 1 mid-career faculty. This academic diversity within the small training group provided varied perspectives not only on the concepts presented and discussed, but also on a more personal level. In an otherwise hectic academic medicine environment, this group had a weekly chance to stop, “check in” with each other, and truly connect on a personal level. To be asked “about your week and actually mean it and want to hear the answer” is an unusual opportunity, one noted. It also offered time and support for purposeful self-reflection, which “often brought some emotions to the surface…at different times.” These connections were perhaps one of the most valuable parts of the experience. With burnout among physicians rampant,24 establishing these networks is invaluable. In addition to introspection and personal connections, there was a strong element of mentoring during these weekly meetings. The opportunity to meet in a small group with senior faculty was highly valued by the trainees.
Mental Health Care: Complex Patient Clinic
The faculty were eager, but very apprehensive, in beginning the second segment of training, where work shifted from lectures and practicing skills to mental health care training in the CPC. The trainees expressed anxiety about several areas. These included additional clinical workload, patient referral/selection, and transition of patient care back to the primary care provider. Of note, they did not particularly express worries about the care they would be providing, because a psychiatrist would be available to them on site. In reflection, after spending 4 months in the clinic, trainees noted “how important observing live interviews for evaluation/feedback was to their learning.” The CPC provided “learning in the moment on specific patients [which] was without question the most powerful teaching tool.” The support of the training faculty who were present at each clinic was invaluable. Whereas the earlier didactics given by psychiatrists were received by trainees with lukewarm enthusiasm, the point-of-care, case-by-case learning and feedback truly advanced the trainees’ knowledge, as well as skills, and improved their confidence in providing mental health care.
One of the tenets of the mental health care models is collaborative care.25 Recognizing this critical component of patient care, the CPC experience integrated a clinical social worker. The faculty noted the critical role she played in the patient care experience. They described her as “fabulous and awesome.” Her grasp of the health care system and community resources (particularly for an underserved population) was indispensable. Additionally, she was able to serve as a steady contact to follow patients through multiple visits and improve their feelings of continuity.
Teaching: Psychosocial Rotation
The first psychosocial teaching occurred after the interviewing skills and didactic experiences in the first 6 months. The trainees expressed great doubt about tackling this initial teaching experience. From residents challenging the need for interviewing and other aspects of “touchy-feely” teaching, to patients expressing raw emotions, the trainees lacked confidence in their ability to handle these moments. At this early stage of their training, one trainee said, “I feel like I am becoming a better interrogator, but I haven’t learned the skills to be a better healer yet.” Over time, this concern disappeared. As training evolved, the trainees began to thrive in their role as educator. At the final focus group, it was noted that “teaching has enhanced [my] confidence in the framework and in turn has made it easier to teach.”
Teaching: Complex Patient Clinic
This powerful teaching tool to train residents was the centerpiece of training. The faculty trainees had some hesitation about their role as teacher before it began. The faculty trainees were at different stages of their careers, and their confidence in their own teaching skills was not uniform. Importantly, the initial structure of the CPC, which included psychiatrists and senior faculty supervision, provided strong and continued support for the faculty trainees. Later work in the CPC as teacher, rather than trainee, further bolstered the faculty’s confidence in the treatment models. As confidence with their own skills grew, faculty noted that it became “easier to teach” as well. Faculty also recognized the unique opportunity that the CPC provided in directly observing a resident’s patient interaction. This allows them to “monitor progress, provide specific feedback, and address issues.” The time spent debriefing after each patient encounter was noted to be particularly important. When they became too busy to adequately provide this debriefing, changes to the schedule were made to accommodate it (follow-up visits were lengthened from 30 to 60 minutes). In addition to giving an opportunity to provide feedback, this extra time available for residents to interact with a patient—to utilize and practice the interviewing skills, for example—was quite valuable, independent of actual mental health care training. Finally, the faculty were able to create a “relaxed and comfortable” space in the CPC. Indeed, the faculty felt comfortable sharing some of their struggles and reflections on caring for a mental health patient population, and residents were able, in turn, to engage in some self-reflection and debriefing as well.
Discussion
Faculty trainees demonstrated a striking evolution as they progressed through this curriculum. At each of the 3 stages of training, they endorsed a broad range of feelings, from anxiety and uncertainty initially, to confidence and growth and appreciation later. They felt satisfied with having participated in the project and are engaged in exploring next steps.
Of note, these faculty members had some exposure to the skills models prior to starting the program because the residency program has integrated patient-centered interviewing into its program for many years. The faculty were supportive of the models prior to engaging in the curriculum, and they volunteered to participate. Similarly, the residents were familiar with the expectations as they went through the psychosocial rotation and the CPC. It is conceivable that the interviewing and mental health material may not be received as easily at an institution where the culture has had less exposure to such teaching.
While describing a faculty curriculum for mental health training is unique5 and the primary intent of this paper, we wanted to present its formative evaluation even though only 2 faculty trainees were involved. Simply put, the grant for this project supported only 2 trainees, and no more were required. Nevertheless, we propose that this only reported experience of medical faculty with mental health training is an important addition to the literature in mental health education. It will be a critical guide for others who choose the new direction of training medical faculty to teach mental health care.
As the research team looks to foster dissemination of the curriculum, it continues to be streamlined to highlight the components most useful and germane to learners. The early didactic readings on subjects such as general system theory were less engaging. (In later training of new medical faculty learners, the focus on theory and other didactics was reduced.) In contrast, the trainees clearly valued the interviewing skills experience (both learning and teaching). While the mental health curriculum and the CPC were associated with much greater anxiety in the trainees, with practical, respectful, and supervised teaching, they became confident and satisfied—as well as effective.6 Future teachers will benefit from slowly and understandingly addressing trainees’ personal issues, particularly during the initial phases of training.26 It appeared to us to be the key factor enabling the faculty to successfully learn and teach mental health care. Once they overcame their personal reactions to mental health material, they learned mental health skills just as they learn the more familiar physical disease material.
Conclusion
In a new direction in medical education, a curriculum for training medical faculty to teach mental health care is presented. Not only did prior research demonstrate that the faculty effectively trained residents, but we also demonstrated here that the training was acceptable to and valued by faculty. With mental health often an alien dimension of medicine, acceptability is especially important when we recommend disseminating the curriculum as a way to offset the national mental health care crisis.
Corresponding author: Robert C. Smith, 788 Service Road, B314 Clinical Center, East Lansing, MI 48824; smithrr@msu.edu.
Financial disclosures: None.
Funding support: The authors are grateful for the generous support from the Health Resources and Services Administration (D58HP23259).
1. Smith R, Gardiner J, Luo Z, et al. Primary care physicians treat somatization. J Gen Int Med. 2009;24:829-832.
2. Smith RC, Lyles JS, Gardiner JC, et al. Primary care clinicians treat patients with medically unexplained symptoms—a randomized controlled trial. J Gen Intern Med. 2006;21:671-677.
3. Smith RC, Lein C, Collins C, et al. Treating patients with medically unexplained symptoms in primary care. J Gen Intern Med. 2003;18:478-489.
4. Smith RC, Lyles JS, Mettler J, et al. The effectiveness of intensive training for residents in interviewing. A randomized, controlled study. Ann Intern Med. 1998;128:118-126.
5. Smith R, Laird-Fick H, D’Mello D, et al. Addressing mental health issues in primary care: an initial curriculum for medical residents. Patient Educ Couns. 2014;94:33-42.
6. Smith R, Laird-Fick H, Dwamena F, et al. Teaching residents mental health care. Patient Educ Couns. 2018;101:2145-2155.
7. Cunningham PJ. Beyond parity: primary care physicians’ perspectives on access to mental health care. Health Aff (Millwood). 2009;28:w490-501.
8. US Department of Health and Human Services: Healthy People 2020: The Road Ahead. Washington, DC: US Governmant Printing Office; 2011.
9. US Department of Health and Human Services. Facing Addiction in America—The Surgeon General’s Report on Alcohol, Drugs, and Health. Washington, DC: US Dept of Health and Human Services; 2016.
10. US Department of Health and Human Services. Mental Health and Mental Disorders. Washington, DC: US Government Printing Office; 2000.
11. Hogan MF. The President’s New Freedom Commission: recommendations to transform mental health care in America. Psychiatr Serv. 2003;54:1467-1474.
12. Morrisey J, Thomas K, Ellis A, et al. Development of a New Method for Designation of Mental Health Professional Shortage Areas. Chapel Hill, NC: University of North Carolina at Chapel Hill; 2007.
13. US Department of Health and Human Services. Mental Health: a Report of the Surgeon General. Rockville, MD: Dept. of Health and Human Services; 1999.
14. Wang PS, Lane M, Olfson M, et al. Twelve-month use of mental health services in the United States: results from the National Comorbidity Survey Replication. Arch Gen Psychiatry. 2005;62:629-640.
15. Kern DE, Thomas PA, Hughes MT. Curriculum Development for Medical Education: A Six-Step Approach. Baltimore, MD: The Johns Hopkins University Press; 2009.
16. Fortin 6th AH, Dwamena F, Frankel R, et al. Smith’s Patient-Centered Interviewing: An Evidence-Based Method. 4th ed. New York, NY: McGraw-Hill; 2018.
17. Smith R, D’Mello D, Osborn G, et al. Essentials of Psychiatry in Primary Care: Behavioral Health in the Medical Setting. New York, NY: McGraw Hill; 2019 .
18. Smith R, Fortin AH 6th, Dwamena F, et al. An evidence-based patient-centered method makes the biopsychosocial model scientific. Patient Educ Couns. 2013;90:265-270.
19. Smith R, Dwamena F, Grover M, et al. Behaviorally-defined patient-centered communication—a narrative review of the literature. J Gen Intern Med. 2010;26:185-191.
20. Smith RC, Dwamena FC. Classification and diagnosis of patients with medically unexplained symptoms. J Gen Intern Med. 2007;22:685-691.
21. Schneider RK, Levenson JL. Psychiatry Essentials for Primary Care. Philadelphia, PA: American College of Physicians; 2008.
22. Dwamena F, Laird-Fick H, Freilich L, et al. Behavioral health problems in medical patients. J Clin Outcomes Manage. 2014;21:497-505.
23. Vidyo (Hackensack, NJ). http://www.vidyo.com/products/use/. 2014.
24. Panagioti M, Panagopoulou E, Bower P, et al. Controlled interventions to reduce burnout in physicians: a systematic review and meta-analysis. JAMA Intern Med. 2017;177:195-205.
25. Huffman JC, Niazi SK, Rundell JR, et al. Essential articles on collaborative care models for the treatment of psychiatric disorders in medical settings: a publication by the Academy of Psychosomatic Medicine Research and Evidence-Based Practice Committee. Psychosomatics. 2014;55:109-122.
26. Smith RC, Dwamena FC, Fortin AH 6th. Teaching personal awareness. J Gen Intern Med. 2005;20:201-207.

eConsult Data Shed Light on Care Coordination Decisions During the COVID-19 Pandemic
From the Multi-County eConsult Initiative, Rancho Cucamonga, CA.
The COVID-19 pandemic has forced many health care professionals and their patients to use telehealth and virtual care to address care needs in new ways.1 To shed light on care coordination decisions with respect to specialty resource access, we analyzed data collected from the Multi-County eConsult Initiative (MCeI)—the second-largest electronic consultation (eConsult) program in the United States—before and during the COVID-19 pandemic. Our analysis of these data suggests opportunities for improving access to care and reducing unnecessary costs in the health system nationally.
The Inland Empire Health Plan (IEHP) launched MCeI (econsultie.com) in 2018. The initiative is a partnership between IEHP, Arrowhead Regional Medical Center, and Riverside University Health System aimed at improving access to specialty care for the safety-net population across San Bernardino and Riverside counties. IEHP is 1 of the 10 largest Medicaid health plans and the largest not-for-profit Medicare-Medicaid plan in the country, serving more than 1.2 million members.2 Data from MCel reveal the impacts of COVID-19 on eConsult use and offer insights into specialty resource availability during and outside of a crisis.
At the time of this analysis, 86 IEHP clinics in rural and urban settings across 38 specialties used the eConsult process to provide and obtain virtual specialty care, as well as timely appointments for in-person specialty care.3 eConsults are facilitated through a HIPAA-secure web-based portal that enables communication and sharing of information between the primary care provider (PCP) and a specialist. eConsult gives PCPs virtual access to specialists to coordinate care for their patients and determine the need for in-person specialty visits. Through the PCP-specialist eConsult dialogue, patients gain virtual access to specialty care. If a PCP-specialist care team determines the patient needs an in-person visit, that specialty referral is automatically authorized by IEHP, without the need for further review. At IEHP, eConsult is the primary method used for obtaining outpatient specialty referrals.
To analyze eConsult utilization before and during the pandemic, we gathered data from the MCeI program for the periods February 20–March 19, 2020, and March 20–April 19, 2020. Measures included eConsult volume and outcomes of eConsults (eConsults closed as referrals for face-to-face specialist visits versus eConsults closed without resulting in referrals for face-to-face specialist visits). Statistical analysis using chi-square tests for independence was performed using IBM SPSS Statistics 25 (IBM, Armonk, NY).
The data show that after California’s stay-at-home order, issued on March 19, 2020,4 eConsult volumes initially decreased, reflecting a similar decrease in clinic visits and authorization requests submitted to IEHP. We observed a 4-week average of 1100 eConsults processed before the pandemic, and then a steep drop to a 4-week average of 500 eConsults processed after the stay-at-home order was issued. Despite the overall drop in the volume of eConsults submitted, demand for specialties like hematology and neurology remained high throughout the pandemic.

During the pandemic, certain specialties displayed rising rates of eConsults completed with specialists providing care recommendations to the PCP instead of resulting in a recommendation for a face-to-face (in-person or via telehealth) visit with a specialist (see Figure and Table). The trend of increasing eConsults that concluded without a face-to-face visit suggests newfound clinical consideration of limited medical resources, along with the desire to eliminate unnecessary risks of infection.

eConsults between PCPs and specialist reviewers via the IEHP portal resulted in higher rates of non-face-to-face recommendations. The specialist reviewers were able to provide treatment plans for PCPs to take care of patients without having to refer their patients to a specialist. This increase was significant across most of the specialties live on the MCeI program.
We believe that clinicians’ heightened awareness of the limitations of the US health care system should remain a key consideration and factor in medical decision-making about appropriate referrals after the pandemic has passed. The data demonstrate that the pandemic drove clinicians to make different decisions about referrals and care coordination. Physicians scrutinized individual cases more keenly and were not as quick to recommend a face-to-face visit. This awareness and consideration of specialty access before making a referral provides a valuable lesson. If this approach is applied to health care delivery post-pandemic, eConsults will help reduce unnecessary in-person specialist visits and will free up space and time for patients who genuinely do need in-person specialty care. In this way, eConsult will improve appropriate access to care for everyone and reduce unnecessary costs to the health care system at large.
An examination of eConsult utilization trends across Riverside and San Bernardino counties before and during the COVID-19 pandemic provides useful insights into how to reduce costs and improve access to care. Although the risk of exposure to COVID-19 currently presents a significant obstacle to obtaining in-person specialty care, pre-existing and long-standing barriers, such as long wait times and scarcity of specialists, remain critical issues to receiving care during and after the pandemic. The pandemic has proven eConsult’s value as a tool for effective care coordination. Leveraging provider-to-provider asynchronous communication offers an opportunity to reduce unnecessary utilization of scarce resources during and beyond the pandemic.
Corresponding author: Lisa Aubry, Aubry-L@iehp.org.
Financial disclosures: None.
Keywords: electronic consultation; care coordination; telehealth; telemedicine; virtual care.
1. Wosik J, Fudim M, Cameron B, et al. Telehealth transformation: COVID-19 and the rise of virtual care. J Am Med Inform Assoc. 2020;27:957-962.
2. Nash-Wong K. Inland Empire Health Plan Multi-county eConsult Initiative with Safety Net Connect improves specialty care for Southern California residents. [Press Release]. (July 24, 2019). www.businesswire.com/news/home/20190724005208/en/Inland-Empire-Health-Plan-Multi-county-eConsult-Initiative. Accessed July 16, 2020.
3. The Multi-County eConsult Initiative (March 2018). https://www.eConsultie.com. Accessed July 16, 2020.
4. Executive Department State of California. Exec. Order No. N-33-20 of March 19, 2020. Safer at Home, Stay at Home. www.gov.ca.gov. Accessed July 16, 2020.
From the Multi-County eConsult Initiative, Rancho Cucamonga, CA.
The COVID-19 pandemic has forced many health care professionals and their patients to use telehealth and virtual care to address care needs in new ways.1 To shed light on care coordination decisions with respect to specialty resource access, we analyzed data collected from the Multi-County eConsult Initiative (MCeI)—the second-largest electronic consultation (eConsult) program in the United States—before and during the COVID-19 pandemic. Our analysis of these data suggests opportunities for improving access to care and reducing unnecessary costs in the health system nationally.
The Inland Empire Health Plan (IEHP) launched MCeI (econsultie.com) in 2018. The initiative is a partnership between IEHP, Arrowhead Regional Medical Center, and Riverside University Health System aimed at improving access to specialty care for the safety-net population across San Bernardino and Riverside counties. IEHP is 1 of the 10 largest Medicaid health plans and the largest not-for-profit Medicare-Medicaid plan in the country, serving more than 1.2 million members.2 Data from MCel reveal the impacts of COVID-19 on eConsult use and offer insights into specialty resource availability during and outside of a crisis.
At the time of this analysis, 86 IEHP clinics in rural and urban settings across 38 specialties used the eConsult process to provide and obtain virtual specialty care, as well as timely appointments for in-person specialty care.3 eConsults are facilitated through a HIPAA-secure web-based portal that enables communication and sharing of information between the primary care provider (PCP) and a specialist. eConsult gives PCPs virtual access to specialists to coordinate care for their patients and determine the need for in-person specialty visits. Through the PCP-specialist eConsult dialogue, patients gain virtual access to specialty care. If a PCP-specialist care team determines the patient needs an in-person visit, that specialty referral is automatically authorized by IEHP, without the need for further review. At IEHP, eConsult is the primary method used for obtaining outpatient specialty referrals.
To analyze eConsult utilization before and during the pandemic, we gathered data from the MCeI program for the periods February 20–March 19, 2020, and March 20–April 19, 2020. Measures included eConsult volume and outcomes of eConsults (eConsults closed as referrals for face-to-face specialist visits versus eConsults closed without resulting in referrals for face-to-face specialist visits). Statistical analysis using chi-square tests for independence was performed using IBM SPSS Statistics 25 (IBM, Armonk, NY).
The data show that after California’s stay-at-home order, issued on March 19, 2020,4 eConsult volumes initially decreased, reflecting a similar decrease in clinic visits and authorization requests submitted to IEHP. We observed a 4-week average of 1100 eConsults processed before the pandemic, and then a steep drop to a 4-week average of 500 eConsults processed after the stay-at-home order was issued. Despite the overall drop in the volume of eConsults submitted, demand for specialties like hematology and neurology remained high throughout the pandemic.
During the pandemic, certain specialties displayed rising rates of eConsults completed with specialists providing care recommendations to the PCP instead of resulting in a recommendation for a face-to-face (in-person or via telehealth) visit with a specialist (see Figure and Table). The trend of increasing eConsults that concluded without a face-to-face visit suggests newfound clinical consideration of limited medical resources, along with the desire to eliminate unnecessary risks of infection.
eConsults between PCPs and specialist reviewers via the IEHP portal resulted in higher rates of non-face-to-face recommendations. The specialist reviewers were able to provide treatment plans for PCPs to take care of patients without having to refer their patients to a specialist. This increase was significant across most of the specialties live on the MCeI program.
We believe that clinicians’ heightened awareness of the limitations of the US health care system should remain a key consideration and factor in medical decision-making about appropriate referrals after the pandemic has passed. The data demonstrate that the pandemic drove clinicians to make different decisions about referrals and care coordination. Physicians scrutinized individual cases more keenly and were not as quick to recommend a face-to-face visit. This awareness and consideration of specialty access before making a referral provides a valuable lesson. If this approach is applied to health care delivery post-pandemic, eConsults will help reduce unnecessary in-person specialist visits and will free up space and time for patients who genuinely do need in-person specialty care. In this way, eConsult will improve appropriate access to care for everyone and reduce unnecessary costs to the health care system at large.
An examination of eConsult utilization trends across Riverside and San Bernardino counties before and during the COVID-19 pandemic provides useful insights into how to reduce costs and improve access to care. Although the risk of exposure to COVID-19 currently presents a significant obstacle to obtaining in-person specialty care, pre-existing and long-standing barriers, such as long wait times and scarcity of specialists, remain critical issues to receiving care during and after the pandemic. The pandemic has proven eConsult’s value as a tool for effective care coordination. Leveraging provider-to-provider asynchronous communication offers an opportunity to reduce unnecessary utilization of scarce resources during and beyond the pandemic.
Corresponding author: Lisa Aubry, Aubry-L@iehp.org.
Financial disclosures: None.
Keywords: electronic consultation; care coordination; telehealth; telemedicine; virtual care.
1. Wosik J, Fudim M, Cameron B, et al. Telehealth transformation: COVID-19 and the rise of virtual care. J Am Med Inform Assoc. 2020;27:957-962.
2. Nash-Wong K. Inland Empire Health Plan Multi-county eConsult Initiative with Safety Net Connect improves specialty care for Southern California residents. [Press Release]. (July 24, 2019). www.businesswire.com/news/home/20190724005208/en/Inland-Empire-Health-Plan-Multi-county-eConsult-Initiative. Accessed July 16, 2020.
3. The Multi-County eConsult Initiative (March 2018). https://www.eConsultie.com. Accessed July 16, 2020.
4. Executive Department State of California. Exec. Order No. N-33-20 of March 19, 2020. Safer at Home, Stay at Home. www.gov.ca.gov. Accessed July 16, 2020.
Dapagliflozin Improves Cardiovascular Outcomes in Patients With Heart Failure and Reduced Ejection Fraction
Study Overview
Objective. To evaluate the effects of dapagliflozin in patients with heart failure with reduced ejection fraction in the presence or absence of type 2 diabetes.
Design. Multicenter, international, double-blind, prospective, randomized, controlled trial.
Setting and participants. Adult patients with symptomatic heart failure with an ejection fraction of 40% or less and elevated heart failure biomarkers who were already on appropriate guideline-directed therapies were eligible for the study.
Intervention. A total of 4744 patients were randomly assigned to receive dapagliflozin (10 mg once daily) or placebo, in addition to recommended therapy. Randomization was stratified by the presence or absence of type 2 diabetes.
Main outcome measures. The primary outcome was the composite of a first episode of worsening heart failure (hospitalization or urgent intravenous therapy) or cardiovascular death.
Main results. Median follow-up was 18.2 months; during this time, the primary outcome occurred in 16.3% (386 of 2373) of patients in the dapagliflozin group and in 21.2% (502 of 2371) of patients in the placebo group (hazard ratio [HR], 0.74; 95% confidence interval [CI], 0.65-0.85; P < 0.001). In the dapagliflozin group, 237 patients (10.0%) experienced a first worsening heart failure event, as compared with 326 patients (13.7%) in the placebo group (HR, 0.70; 95% CI, 0.59-0.83). The dapagliflozin group hadlower rates of death from cardiovascular causes (9.6% vs 11.5%; HR, 0.82; 95% CI, 0.69-0.98) and from any causes (11.6% vs 13.9%; HR, 0.83; 95% CI, 0.71-0.97), compared to the placebo group. Findings in patients with diabetes were similar to those in patients without diabetes.
Conclusion. Among patients with heart failure and a reduced ejection fraction, the risk of worsening heart failure or death from cardiovascular causes was lower among those who received dapagliflozin than among those who received placebo, regardless of the presence or absence of diabetes.
Commentary
Inhibitors of sodium-glucose cotransporter 2 (SGLT-2) are a novel class of diabetic medication that decrease renal glucose reabsorption, thereby increasing urinary glucose excretion. In several large clinical trials of these medications for patients with diabetes, which were designed to meet the regulatory requirements for cardiovascular safety in novel diabetic agents, investigators unexpectedly found that SGLT-2 inhibitors were associated with a reduction in cardiovascular events, driven by a reduction in heart failure hospitalizations. The results of EMPA-REG OUTCOME, the first of these trials, showed significantly lower risks of both death from any cause and hospitalization for heart failure in patients treated with empagliflozin.1 This improvement in cardiovascular outcomes was subsequently confirmed as a class effect of SGLT-2 inhibitors in the CANVAS Program (canagliflozin) and DECLARE TIMI 58 (dapagliflozin) trials.2,3
While these trials were designed for patients with type 2 diabetes who had either established cardiovascular disease or multiple risk factors for it, most patients did not have heart failure at baseline. Accordingly, despite a signal toward benefit of SGLT-2 inhibitors in patients with heart failure, the trials were not powered to test the hypothesis that SGLT-2 inhibitors benefit patients with heart failure, regardless of diabetes status. Therefore, McMurray et al designed the DAPA-HF trial to investigate whether SGLT-2 inhibitors can improve cardiovascular outcomes in patients with heart failure with reduced ejection fraction, with or without diabetes. The trial included 4744 patients with heart failure with reduced ejection fraction, who were randomly assigned to dapagliflozin 10 mg once daily or placebo, atop guideline-directed heart failure therapy, with randomization stratified by presence or absence of type 2 diabetes. Investigators found that the composite primary outcome, a first episode of worsening heart failure or cardiovascular death, occurred less frequently in patients in the dapagliflozin group compared to the placebo group (16.3% vs 21.2%; HR, 0.74; 95% CI, 0.65-0.85; P < 0.001). Individual components of the primary outcome and death from any cause were all significantly lower, and heart failure–related quality of life was significantly improved in the dapagliflozin group compared to placebo.
DAPA-HF was the first randomized study to investigate the effect of SGLT-2 inhibitors on patients with heart failure regardless of the presence of diabetes. In addition to the reduction in the above-mentioned primary and secondary endpoints, the study yielded other important findings worth noting. First, the consistent benefit of dapagliflozin on cardiovascular outcomes in patients with and without diabetes suggests that the cardioprotective effect of dapagliflozin is independent of its glucose-lowering effect. Prior studies have proposed alternative mechanisms, such as diuretic function and related hemodynamic actions, effects on myocardial metabolism, ion transporters, fibrosis, adipokines, vascular function, and the preservation of renal function. Future studies are needed to fully understand the likely pleiotropic effects of this class of medication on patients with heart failure. Second, there was no difference in the safety endpoints between the groups, including renal adverse events and major hypoglycemia, implying dapagliflozin is as safe as placebo.
There are a few limitations of this trial. First, as the authors point out, the study included mostly white males—less than 5% of participants were African Americans—and the finding may not be generalizable to all patient populations. Second, although all patients were already treated with guideline-directed heart failure therapy, only 10% of patients were on sacubitril–valsartan, which is more effective than renin–angiotensin system blockade alone at reducing the incidence of hospitalization for heart failure and death from cardiovascular causes. Also, mineralocorticoid receptor blockers were used in only 70% of the population. Finally, since the doses were not provided, whether patients were on the maximal tolerated dose of heart failure therapy prior to enrollment is unclear.
Based on the results of the DAPA-HF trial, the Food and Drug Administration approved dapagliflozin for the treatment of heart failure with reduced ejection fraction on May 5, 2020. This is the first diabetic drug approved for the treatment of heart failure.
Applications for Clinical Practice
SGLT-2 inhibitors represent a fourth class of medication that patients with heart failure with reduced ejection fraction should be initiated on, in addition to beta blocker, ACE inhibitor/angiotensin receptor blocker/neprilysin inhibitor, and mineralocorticoid receptor blocker. SGLT-2 inhibitors may be especially applicable in patients with heart failure with reduced ejection fraction and relative hypotension, as these agents are not associated with a significant blood-pressure-lowering effect, which can often limit our ability to initiate or uptitrate the other main 3 classes of guideline-directed medical therapy.
—Rie Hirai, MD, Fukui Kosei Hospital, Fukui, Japan
—Taishi Hirai, MD, University of Missouri Medical Center, Columbia, MO
—Timothy Fendler, MD, St. Luke’s Mid America Heart Institute, Kansas City, MO
1. Zinman B, Wanner C, Lachin JM, et al. Empagliflozin, cardiovascular outcomes, and mortality in type 2 diabetes. N Engl J Med. 2015;373:2117-2128.
2. Neal B, Perkovic V, Mahaffey KW, et al. Canagliflozin and cardiovascular and renal events in type 2 diabetes. N Engl J Med. 2017;377:644-657.
3. Wiviott SD, Raz I, Bonaca MP, et al. Dapagliflozin and cardiovascular outcomes in type 2 diabetes. N Engl J Med. 2019;380:347-357.
Study Overview
Objective. To evaluate the effects of dapagliflozin in patients with heart failure with reduced ejection fraction in the presence or absence of type 2 diabetes.
Design. Multicenter, international, double-blind, prospective, randomized, controlled trial.
Setting and participants. Adult patients with symptomatic heart failure with an ejection fraction of 40% or less and elevated heart failure biomarkers who were already on appropriate guideline-directed therapies were eligible for the study.
Intervention. A total of 4744 patients were randomly assigned to receive dapagliflozin (10 mg once daily) or placebo, in addition to recommended therapy. Randomization was stratified by the presence or absence of type 2 diabetes.
Main outcome measures. The primary outcome was the composite of a first episode of worsening heart failure (hospitalization or urgent intravenous therapy) or cardiovascular death.
Main results. Median follow-up was 18.2 months; during this time, the primary outcome occurred in 16.3% (386 of 2373) of patients in the dapagliflozin group and in 21.2% (502 of 2371) of patients in the placebo group (hazard ratio [HR], 0.74; 95% confidence interval [CI], 0.65-0.85; P < 0.001). In the dapagliflozin group, 237 patients (10.0%) experienced a first worsening heart failure event, as compared with 326 patients (13.7%) in the placebo group (HR, 0.70; 95% CI, 0.59-0.83). The dapagliflozin group hadlower rates of death from cardiovascular causes (9.6% vs 11.5%; HR, 0.82; 95% CI, 0.69-0.98) and from any causes (11.6% vs 13.9%; HR, 0.83; 95% CI, 0.71-0.97), compared to the placebo group. Findings in patients with diabetes were similar to those in patients without diabetes.
Conclusion. Among patients with heart failure and a reduced ejection fraction, the risk of worsening heart failure or death from cardiovascular causes was lower among those who received dapagliflozin than among those who received placebo, regardless of the presence or absence of diabetes.
Commentary
Inhibitors of sodium-glucose cotransporter 2 (SGLT-2) are a novel class of diabetic medication that decrease renal glucose reabsorption, thereby increasing urinary glucose excretion. In several large clinical trials of these medications for patients with diabetes, which were designed to meet the regulatory requirements for cardiovascular safety in novel diabetic agents, investigators unexpectedly found that SGLT-2 inhibitors were associated with a reduction in cardiovascular events, driven by a reduction in heart failure hospitalizations. The results of EMPA-REG OUTCOME, the first of these trials, showed significantly lower risks of both death from any cause and hospitalization for heart failure in patients treated with empagliflozin.1 This improvement in cardiovascular outcomes was subsequently confirmed as a class effect of SGLT-2 inhibitors in the CANVAS Program (canagliflozin) and DECLARE TIMI 58 (dapagliflozin) trials.2,3
While these trials were designed for patients with type 2 diabetes who had either established cardiovascular disease or multiple risk factors for it, most patients did not have heart failure at baseline. Accordingly, despite a signal toward benefit of SGLT-2 inhibitors in patients with heart failure, the trials were not powered to test the hypothesis that SGLT-2 inhibitors benefit patients with heart failure, regardless of diabetes status. Therefore, McMurray et al designed the DAPA-HF trial to investigate whether SGLT-2 inhibitors can improve cardiovascular outcomes in patients with heart failure with reduced ejection fraction, with or without diabetes. The trial included 4744 patients with heart failure with reduced ejection fraction, who were randomly assigned to dapagliflozin 10 mg once daily or placebo, atop guideline-directed heart failure therapy, with randomization stratified by presence or absence of type 2 diabetes. Investigators found that the composite primary outcome, a first episode of worsening heart failure or cardiovascular death, occurred less frequently in patients in the dapagliflozin group compared to the placebo group (16.3% vs 21.2%; HR, 0.74; 95% CI, 0.65-0.85; P < 0.001). Individual components of the primary outcome and death from any cause were all significantly lower, and heart failure–related quality of life was significantly improved in the dapagliflozin group compared to placebo.
DAPA-HF was the first randomized study to investigate the effect of SGLT-2 inhibitors on patients with heart failure regardless of the presence of diabetes. In addition to the reduction in the above-mentioned primary and secondary endpoints, the study yielded other important findings worth noting. First, the consistent benefit of dapagliflozin on cardiovascular outcomes in patients with and without diabetes suggests that the cardioprotective effect of dapagliflozin is independent of its glucose-lowering effect. Prior studies have proposed alternative mechanisms, such as diuretic function and related hemodynamic actions, effects on myocardial metabolism, ion transporters, fibrosis, adipokines, vascular function, and the preservation of renal function. Future studies are needed to fully understand the likely pleiotropic effects of this class of medication on patients with heart failure. Second, there was no difference in the safety endpoints between the groups, including renal adverse events and major hypoglycemia, implying dapagliflozin is as safe as placebo.
There are a few limitations of this trial. First, as the authors point out, the study included mostly white males—less than 5% of participants were African Americans—and the finding may not be generalizable to all patient populations. Second, although all patients were already treated with guideline-directed heart failure therapy, only 10% of patients were on sacubitril–valsartan, which is more effective than renin–angiotensin system blockade alone at reducing the incidence of hospitalization for heart failure and death from cardiovascular causes. Also, mineralocorticoid receptor blockers were used in only 70% of the population. Finally, since the doses were not provided, whether patients were on the maximal tolerated dose of heart failure therapy prior to enrollment is unclear.
Based on the results of the DAPA-HF trial, the Food and Drug Administration approved dapagliflozin for the treatment of heart failure with reduced ejection fraction on May 5, 2020. This is the first diabetic drug approved for the treatment of heart failure.
Applications for Clinical Practice
SGLT-2 inhibitors represent a fourth class of medication that patients with heart failure with reduced ejection fraction should be initiated on, in addition to beta blocker, ACE inhibitor/angiotensin receptor blocker/neprilysin inhibitor, and mineralocorticoid receptor blocker. SGLT-2 inhibitors may be especially applicable in patients with heart failure with reduced ejection fraction and relative hypotension, as these agents are not associated with a significant blood-pressure-lowering effect, which can often limit our ability to initiate or uptitrate the other main 3 classes of guideline-directed medical therapy.
—Rie Hirai, MD, Fukui Kosei Hospital, Fukui, Japan
—Taishi Hirai, MD, University of Missouri Medical Center, Columbia, MO
—Timothy Fendler, MD, St. Luke’s Mid America Heart Institute, Kansas City, MO
1. Zinman B, Wanner C, Lachin JM, et al. Empagliflozin, cardiovascular outcomes, and mortality in type 2 diabetes. N Engl J Med. 2015;373:2117-2128.
2. Neal B, Perkovic V, Mahaffey KW, et al. Canagliflozin and cardiovascular and renal events in type 2 diabetes. N Engl J Med. 2017;377:644-657.
3. Wiviott SD, Raz I, Bonaca MP, et al. Dapagliflozin and cardiovascular outcomes in type 2 diabetes. N Engl J Med. 2019;380:347-357.
An Advance Care Planning Video Program in Nursing Homes Did Not Reduce Hospital Transfer and Burdensome Treatment in Long-Stay Residents
Study Overview
Objective. To examine the effect of an advance care planning video intervention in nursing homes on resident outcomes of hospital transfer, burdensome treatment, and hospice enrollment.
Design. Pragmatic cluster randomized controlled trial.
Setting and participants. The study was conducted in 360 nursing homes located in 32 states across the United States. The facilities were owned by 2 for-profit nursing home chains; facilities with more than 50 beds were eligible to be included in the study. Facilities deemed by corporate leaders to have serious organizational problems or that lacked the ability to transfer electronic health records were excluded. The facilities, stratified by the primary outcome hospitalizations per 1000 person-days, were then randomized to intervention and control in a 1:2 ratio. Leaders from facilities in the intervention group received letters describing their selection to participate in the advance care planning video program, and all facilities invited agreed to participate. Participants (residents in nursing homes) were enrolled from February 1, 2016, to May 31, 2018. Each participant was followed for 12 months after enrollment. All residents living in intervention facilities were offered the opportunity to watch intervention videos. The target population of the study was residents with advanced illness, including advanced dementia or advanced cardiopulmonary disease, as defined by the Minimum Data Set (MDS) variables, who were aged 65 and older, were long-stay residents (100 days or more), and were enrolled as Medicare fee-for-service beneficiaries. Secondary analysis included residents without advanced illness meeting other criteria.
Intervention. The intervention consisted of a selection of 5 short videos (6 to 10 minutes each), which had been previously developed and tested in smaller randomized trials. These videos cover the topics of general goals of care, goals of care for advanced dementia, hospice, hospitalization, and advance care planning for healthy patients, and use narration and images of typical treatments representing intensive medical care, basic medical care, and comfort care. The video for goals of care for advanced dementia targeted proxies of residents rather than residents themselves.
The implementation strategy for the video program included using a program manager to oversee the organization of the program’s rollout (a manager for each for-profit nursing home chain) and 2 champions at each facility (typically social workers were tasked with showing videos to patients and families). Champions received training from the study investigators and the manager and were asked to choose and offer selected videos to residents or proxies within 7 days of admission or readmission, every 6 months during a resident’s stay, and when specific decisions occurred, such as transition to hospice care, and on special occasions, such as out-of-town family visits.
Video offering and use were captured through documentation by a facility champion using a report tool embedded in the facility’s electronic health record. Champions met with the facility’s program manager and study team to review reports of video use, identify residents who had not been shown a video, and problem-solve on how to reach these residents. Facilities in the control group used their usual procedures for advance care planning.
Main outcome measures. Study outcomes included hospitalization transfers per 1000 person-days alive among long-stay residents with advanced illness (primary outcome); proportion of residents with at least 1 hospital transfer; proportion of residents with at least 1 burdensome treatment; and hospice enrollment (secondary outcomes). Secondary outcomes also included hospitalization transfers for long-stay residents without advanced illness. Hospital transfers were identified using Medicare claims for admissions, emergency department visits, and observation stays. Burdensome treatments were identified from Medicare claims and MDS, including tube feeding, parenteral therapy, invasive mechanical intervention, and intensive care unit admission. Fidelity to video intervention was measured by the proportion of residents offered the videos and the proportion of residents shown the videos at least once during the study period.
Main results. A total of 360 facilities were included in the study, 119 intervention and 241 control facilities. For the primary outcome, 4171 residents with advanced illness were included in the intervention group and 8308 residents with advanced illness were included in the control group. The average age was 83.6 years in both groups. In the intervention and control groups, respectively, 71.2% and 70.5% were female, 78.4% and 81.5% were White, 68.6% and 70.1% had advanced dementia at baseline, and 35.4% and 33.4% had advanced congestive heart failure or chronic obstructive pulmonary disease at baseline. Approximately 34% of residents received hospice care at baseline. In the intervention and control groups, 43.9% and 45.3% of residents died during follow-up, and the average length of follow-up in each group was 253.1 days and 252.6 days, respectively.
For the primary outcome of hospital transfers per 1000 person-days alive, there were 3.7 episodes (standard error 0.2) in the intervention group and 3.9 episodes in the control group (standard error 0.3); the difference was not statistically significant. For residents without advanced illness, there also was no difference in the hospital transfer rate. For other secondary outcomes, the proportion of residents in the intervention and control groups with 1 or more hospital transfer was 40.9% and 41.6%, respectively; the proportion with 1 or more burdensome treatment was 9.6% and 10.7%; and hospice enrollment was 24.9% and 25.5%. None of these differences was statistically significant. In the intervention group, 55.6% of residents or proxies were offered the video intervention and 21.9% were shown the videos at least once. There was substantial variability in the proportion of residents in the intervention group who were shown videos.
Conclusion. The advance planning video program did not lead to a reduction in hospital transfer, burdensome treatment, or changes in hospice enrollment. Acceptance of the intervention by residents was variable, and this may have contributed to the null finding.
Commentary
Nursing home residents often have advanced illness and limited functional ability. Hospital transfers may be burdensome and of limited clinical benefit for these patients, particularly for those with advanced illness and limited life expectancy, and are associated with markers of poor quality of end-of-life care, such as increased rates of stage IV decubitus ulcer and feeding-tube use towards the end of life.1 Advance care planning is associated with less aggressive care towards the end of life for persons with advanced illness,2 which ultimately improves the quality of end-of-life care for these individuals. Prior interventions to improve advance care planning have had variable effects, while video-based interventions to improve advance care planning have shown promise.3
This pragmatic randomized trial assessed the effect of an advance care planning video program on important clinical outcomes for nursing home residents, particularly those with advanced illness. The results, however, are disappointing, as the video intervention failed to improve hospital transfer rate and burdensome treatment in this population. The negative results could be attributed to the limited adoption of the video intervention in the study, as only 21.9% of residents in the intervention group were actually exposed to the intervention. What is not reported, and is difficult to assess, is whether the video intervention led to advance care planning, as would be demonstrated by advance directive documentation and acceptance of goals of care of comfort. A per-protocol analysis may be considered to demonstrate if there is an effect on residents who were exposed to the intervention. Nonetheless, the low adoption rate of the intervention may prompt further investigation of factors limiting adoption and perhaps lead to a redesigned trial aimed at enhancing adoption, with consideration of use of implementation trial designs.
As pointed out by the study investigators, other changes to nursing home practices, specifically on hospital transfer, likely occurred during the study period. A number of national initiatives to reduce unnecessary hospital transfer from nursing homes have been introduced, and a reduction in hospital transfers occurred between 2011 and 20174; these initiatives could have impacted staff priorities and adoption of the study intervention relative to other co-occurring initiatives.
Applications for Clinical Practice
The authors of this study reported negative trial results, but their findings highlight important issues in conducting trials in the nursing home setting. Additional demonstration of actual effect on advance care planning discussions and documentation will further enhance our understanding of whether the intervention, as tested, yields changes in practice on advance care planning in nursing homes. The pragmatic clinical trial design used in this study accounts for real-world settings, but may have limited the study’s ability to account for and adjust for differences in staff, settings, and other conditions and factors that may impact adoption of and fidelity to the intervention. Quality improvement approaches, such as INTERACT, have targeted unnecessary hospital transfers and may yield positive results.5 Quality improvement approaches like INTERACT allow for a high degree of adaptation to local procedures and settings, which in clinical trials is difficult to do. However, in a real-world setting, such approaches may be necessary to improve care.
–William W. Hung, MD, MPH
1. Gozalo P, Teno JM, Mitchell SL, et al. End-of-life transitions among nursing home residents with cognitive issues. N Engl J Med. 2011;365:1212-1221
2. Nichols LH, Bynum J, Iwashyna TJ, et al. Advance directives and nursing home stays associated with less aggressive end-of-life care for patients with severe dementia. Health Aff (Millwood). 2014;33:667-674.
3. Volandes AE, Paasche-Orlow MK, Barry MJ, et al. Video decision support tool for advance care planning in dementia: randomized controlled trial. BMJ. 2009;338:b2159.
4. McCarthy EP, Ogarek JA, Loomer L, et al. Hospital transfer rates among US nursing home residents with advanced illness before and after initiatives to reduce hospitalizations. JAMA Intern Med. 2020;180:385-394.
5. Rantz MJ, Popejoy L, Vogelsmeier, A et al. Successfully reducing hospitalizations of nursing home residents: results of the Missouri Quality Initiative. JAMA. 2017:18;960-966.
Study Overview
Objective. To examine the effect of an advance care planning video intervention in nursing homes on resident outcomes of hospital transfer, burdensome treatment, and hospice enrollment.
Design. Pragmatic cluster randomized controlled trial.
Setting and participants. The study was conducted in 360 nursing homes located in 32 states across the United States. The facilities were owned by 2 for-profit nursing home chains; facilities with more than 50 beds were eligible to be included in the study. Facilities deemed by corporate leaders to have serious organizational problems or that lacked the ability to transfer electronic health records were excluded. The facilities, stratified by the primary outcome hospitalizations per 1000 person-days, were then randomized to intervention and control in a 1:2 ratio. Leaders from facilities in the intervention group received letters describing their selection to participate in the advance care planning video program, and all facilities invited agreed to participate. Participants (residents in nursing homes) were enrolled from February 1, 2016, to May 31, 2018. Each participant was followed for 12 months after enrollment. All residents living in intervention facilities were offered the opportunity to watch intervention videos. The target population of the study was residents with advanced illness, including advanced dementia or advanced cardiopulmonary disease, as defined by the Minimum Data Set (MDS) variables, who were aged 65 and older, were long-stay residents (100 days or more), and were enrolled as Medicare fee-for-service beneficiaries. Secondary analysis included residents without advanced illness meeting other criteria.
Intervention. The intervention consisted of a selection of 5 short videos (6 to 10 minutes each), which had been previously developed and tested in smaller randomized trials. These videos cover the topics of general goals of care, goals of care for advanced dementia, hospice, hospitalization, and advance care planning for healthy patients, and use narration and images of typical treatments representing intensive medical care, basic medical care, and comfort care. The video for goals of care for advanced dementia targeted proxies of residents rather than residents themselves.
The implementation strategy for the video program included using a program manager to oversee the organization of the program’s rollout (a manager for each for-profit nursing home chain) and 2 champions at each facility (typically social workers were tasked with showing videos to patients and families). Champions received training from the study investigators and the manager and were asked to choose and offer selected videos to residents or proxies within 7 days of admission or readmission, every 6 months during a resident’s stay, and when specific decisions occurred, such as transition to hospice care, and on special occasions, such as out-of-town family visits.
Video offering and use were captured through documentation by a facility champion using a report tool embedded in the facility’s electronic health record. Champions met with the facility’s program manager and study team to review reports of video use, identify residents who had not been shown a video, and problem-solve on how to reach these residents. Facilities in the control group used their usual procedures for advance care planning.
Main outcome measures. Study outcomes included hospitalization transfers per 1000 person-days alive among long-stay residents with advanced illness (primary outcome); proportion of residents with at least 1 hospital transfer; proportion of residents with at least 1 burdensome treatment; and hospice enrollment (secondary outcomes). Secondary outcomes also included hospitalization transfers for long-stay residents without advanced illness. Hospital transfers were identified using Medicare claims for admissions, emergency department visits, and observation stays. Burdensome treatments were identified from Medicare claims and MDS, including tube feeding, parenteral therapy, invasive mechanical intervention, and intensive care unit admission. Fidelity to video intervention was measured by the proportion of residents offered the videos and the proportion of residents shown the videos at least once during the study period.
Main results. A total of 360 facilities were included in the study, 119 intervention and 241 control facilities. For the primary outcome, 4171 residents with advanced illness were included in the intervention group and 8308 residents with advanced illness were included in the control group. The average age was 83.6 years in both groups. In the intervention and control groups, respectively, 71.2% and 70.5% were female, 78.4% and 81.5% were White, 68.6% and 70.1% had advanced dementia at baseline, and 35.4% and 33.4% had advanced congestive heart failure or chronic obstructive pulmonary disease at baseline. Approximately 34% of residents received hospice care at baseline. In the intervention and control groups, 43.9% and 45.3% of residents died during follow-up, and the average length of follow-up in each group was 253.1 days and 252.6 days, respectively.
For the primary outcome of hospital transfers per 1000 person-days alive, there were 3.7 episodes (standard error 0.2) in the intervention group and 3.9 episodes in the control group (standard error 0.3); the difference was not statistically significant. For residents without advanced illness, there also was no difference in the hospital transfer rate. For other secondary outcomes, the proportion of residents in the intervention and control groups with 1 or more hospital transfer was 40.9% and 41.6%, respectively; the proportion with 1 or more burdensome treatment was 9.6% and 10.7%; and hospice enrollment was 24.9% and 25.5%. None of these differences was statistically significant. In the intervention group, 55.6% of residents or proxies were offered the video intervention and 21.9% were shown the videos at least once. There was substantial variability in the proportion of residents in the intervention group who were shown videos.
Conclusion. The advance planning video program did not lead to a reduction in hospital transfer, burdensome treatment, or changes in hospice enrollment. Acceptance of the intervention by residents was variable, and this may have contributed to the null finding.
Commentary
Nursing home residents often have advanced illness and limited functional ability. Hospital transfers may be burdensome and of limited clinical benefit for these patients, particularly for those with advanced illness and limited life expectancy, and are associated with markers of poor quality of end-of-life care, such as increased rates of stage IV decubitus ulcer and feeding-tube use towards the end of life.1 Advance care planning is associated with less aggressive care towards the end of life for persons with advanced illness,2 which ultimately improves the quality of end-of-life care for these individuals. Prior interventions to improve advance care planning have had variable effects, while video-based interventions to improve advance care planning have shown promise.3
This pragmatic randomized trial assessed the effect of an advance care planning video program on important clinical outcomes for nursing home residents, particularly those with advanced illness. The results, however, are disappointing, as the video intervention failed to improve hospital transfer rate and burdensome treatment in this population. The negative results could be attributed to the limited adoption of the video intervention in the study, as only 21.9% of residents in the intervention group were actually exposed to the intervention. What is not reported, and is difficult to assess, is whether the video intervention led to advance care planning, as would be demonstrated by advance directive documentation and acceptance of goals of care of comfort. A per-protocol analysis may be considered to demonstrate if there is an effect on residents who were exposed to the intervention. Nonetheless, the low adoption rate of the intervention may prompt further investigation of factors limiting adoption and perhaps lead to a redesigned trial aimed at enhancing adoption, with consideration of use of implementation trial designs.
As pointed out by the study investigators, other changes to nursing home practices, specifically on hospital transfer, likely occurred during the study period. A number of national initiatives to reduce unnecessary hospital transfer from nursing homes have been introduced, and a reduction in hospital transfers occurred between 2011 and 20174; these initiatives could have impacted staff priorities and adoption of the study intervention relative to other co-occurring initiatives.
Applications for Clinical Practice
The authors of this study reported negative trial results, but their findings highlight important issues in conducting trials in the nursing home setting. Additional demonstration of actual effect on advance care planning discussions and documentation will further enhance our understanding of whether the intervention, as tested, yields changes in practice on advance care planning in nursing homes. The pragmatic clinical trial design used in this study accounts for real-world settings, but may have limited the study’s ability to account for and adjust for differences in staff, settings, and other conditions and factors that may impact adoption of and fidelity to the intervention. Quality improvement approaches, such as INTERACT, have targeted unnecessary hospital transfers and may yield positive results.5 Quality improvement approaches like INTERACT allow for a high degree of adaptation to local procedures and settings, which in clinical trials is difficult to do. However, in a real-world setting, such approaches may be necessary to improve care.
–William W. Hung, MD, MPH
1. Gozalo P, Teno JM, Mitchell SL, et al. End-of-life transitions among nursing home residents with cognitive issues. N Engl J Med. 2011;365:1212-1221
2. Nichols LH, Bynum J, Iwashyna TJ, et al. Advance directives and nursing home stays associated with less aggressive end-of-life care for patients with severe dementia. Health Aff (Millwood). 2014;33:667-674.
3. Volandes AE, Paasche-Orlow MK, Barry MJ, et al. Video decision support tool for advance care planning in dementia: randomized controlled trial. BMJ. 2009;338:b2159.
4. McCarthy EP, Ogarek JA, Loomer L, et al. Hospital transfer rates among US nursing home residents with advanced illness before and after initiatives to reduce hospitalizations. JAMA Intern Med. 2020;180:385-394.
5. Rantz MJ, Popejoy L, Vogelsmeier, A et al. Successfully reducing hospitalizations of nursing home residents: results of the Missouri Quality Initiative. JAMA. 2017:18;960-966.
Tackling unhealthy substance use using USPSTF guidance and a 1-question tool
References
- US Preventive Services Task Force. Unhealthy drug use: screening [final recommendation statement]. Published June 9, 2020. https://uspreventiveservicestaskforce.org/uspstf/recommendation/drug-use-illicit-screening. Accessed July 28, 2020.
- US Preventive Services Task Force. Illicit drug use in children, adolescents, and young adults: primary care-based interventions [final recommendation statement]. Published May 26, 2020. https://uspreventiveservicestaskforce.org/uspstf/recommendation/drug-use-illicit-primary-care-interventions-for-children-and-adolescents. Accessed July 28, 2020.
- US Preventive Services Task Force. Prevention and cessation of tobacco use in children and adolescents: primary care interventions [final recommendation statement]. Published April 28, 2020. https://uspreventiveservicestaskforce.org/uspstf/recommendation/tobacco-and-nicotine-use-prevention-in-children-and-adolescents-primary-care-interventions. Accessed July 28, 2020.
- National Institute on Drug Abuse. NIDA Quick Screen v 1.0. www.drugabuse.gov/sites/default/files/pdf/nmassist.pdf. Accessed July 28, 2020.
- US Preventive Services Task Force. Tobacco smoking cessation in adults, including pregnant women: behavioral and pharmacotherapy interventions [update in progress]. Published September 21, 2015. https://uspreventiveservicestaskforce.org/uspstf/recommendation/tobacco-use-in-adults-and-pregnant-women-counseling-and-interventions. Accessed July 28, 2020.

Oral Relugolix Yields Superior Testosterone Suppression and Decreased Cardiovascular Events Compared With GnRH Agonist
Study Overview
Objective. To evaluate the safety and efficacy of the highly selective oral gonadotropin-releasing hormone (GnRH) antagonist relugolix in men with advanced prostate cancer.
Design. Global, multicenter, randomized, open-label, phase 3 trial.
Intervention. Patients were randomized in a 2:1 ratio to receive either relugolix 120 mg once daily after receiving a single loading dose of 360 mg, or 22.5 mg of leuprolide acetate every 3 months. Patients in Japan and Taiwan received 11.25 mg of leuprolide. The randomization was stratified by age (> 75 years or ≤ 75 years), metastatic disease status, and geographic region (Asia, Europe, North and South America). The intervention period was 48 weeks.
Setting and participants. 1327 patients were screened, and 934 patients underwent randomization: 622 patients to the relugolix group and 308 to the leuprolide group. Patients had histologically or cytologically confirmed adenocarcinoma of the prostate. All patients had to have 1 of the following: evidence of biochemical or clinical relapse after primary curative therapy, newly diagnosed hormone-sensitive metastatic disease, or advance localized disease unlikely to be cured by local primary intervention. The patients with disease progression or rising prostate-specific antigen (PSA) had the option to receive enzalutamide or docetaxel after the confirmation of progression. Patients were excluded if they had a major cardiovascular event within 6 months of enrollment.
Main outcome measures. The primary endpoint was sustained castration rate, defined as the cumulative probability of testosterone suppression to ≤ 50 ng/dL while on study treatment from week 5 through week 48. Secondary endpoints included noninferiority of relugolix to leuprolide in regard to sustained castration rate. Superiority testing was performed if the noninferiority margin of –10 percentage points was met. Additional secondary endpoints were probability of testosterone suppression to ≤ 50 ng/dL on day 4 and day 15 and the percentage of patients with a > 50% decrease in PSA at day 15 and follicle-stimulating hormone (FSH) levels at the end of week 24.
Main results. The baseline characteristics were well balanced between the treatment groups. Approximately 30% of the patients in each group had metastatic disease. Approximately 50% of patients enrolled had biochemical recurrence following primary treatment for prostate cancer. The mean PSA was 104.2 ng/mL in the relugolix group and 68.6 ng/mL in the leuprolide group. The majority of patients had at least 1 cardiovascular risk factor (ie, tobacco use, obesity, diabetes, hypertension, or a history of a major adverse cardiac event [MACE]). Adherence to oral therapy was reported as 99% in both groups. The median follow-up time was 52 weeks; 90% of patients in the relugolix arm and 89% in the leuprolide arm completed 48 weeks of treatment.
Sustained testosterone suppression to ≤ 50 ng/dL from day 29 through week 48 was seen in 96.7% of patients in the relugolix group and 88.8% in the leuprolide group, which was determined to be noninferior. Additionally, relugolix was also found to be superior to leuprolide in regard to sustained testosterone suppression (P < 0.001). These results were consistent across all subgroups. Relugolix was also found to be superior to leuprolide for all secondary endpoints, including cumulative probability of castration on day 4 (56% vs 0%) and day 15 (98.7% vs 12%) and testosterone suppression to ≤ 20 ng/dL on day 15 (78.4% vs 1%). Confirmed PSA response on day 15 was seen in 79.4% of patients in the relugolix arm and in 19.8% in the leuprolide arm (P < 0.001). FSH suppression was greater in the relugolix arm compared with the leuprolide arm by the end of week 24. An increase of testosterone levels from baseline was noted in the leuprolide patients at day 4, with the level decreasing to castrate level by day 29. In contrast, relugolix patients maintained castrate testosterone levels from day 4 throughout the intervention period. Testosterone recovery at 90 days was seen in 54% of patients in the relugolix group compared with 3% in the leuprolide group (P = 0.002).
The most frequent adverse event seen in both groups was hot flashes (54.3% in the relugolix group and 51.6% in the leuprolide group). The second most common adverse event report was fatigue, which occurred in 21.5% of patients in the relugolix arm and 18.5% in the leuprolide arm. Diarrhea was reported more frequently with relugolix than with leuprolide (12.2% vs 6.8%); however, diarrhea did not lead to discontinuation of therapy in any patient. Fatal events were reported more frequently in the leuprolide group (2.9%) compared with the relugolix group (1.1%). MACE were defined as nonfatal myocardial infarction, stroke, and death from any cause. After completing the intervention period of 48 weeks, the relugolix group had a 2.9% incidence of major cardiovascular events, compared with 6.2% in the leuprolide group. In patients having a medical history of cardiovascular events, the adverse event rate during the trial period was 3.6% in the relugolix group and 17.8% in leuprolide group. This translated into a 54% lower risk of MACE in the relugolix arm compared with the leuprolide arm.
Conclusion. The use of relugolix in advanced prostate cancer led to rapid, sustained suppression and faster recovery of testosterone level compared with leuprolide. Relugolix appeared safer to use for men with a medical history of cardiovascular events and showed a 54% lower risk of MACE than leuprolide.
Commentary
Relugolix is a highly selective oral GnRH antagonist that rapidly inhibits pituitary release of luteinizing hormone and FSH. The current phase 3 HERO trial highlights the efficacy of relugolix in regard to testosterone suppression, adding to potential therapeutic options for these men. Relugolix yielded superior sustained testosterone suppression to less than 50 ng/dL throughout the 48-week study period, meeting its primary endpoint. Additionally, relugolix showed superiority in all secondary endpoints across all subgroups of patients. To date, the only GnRH antagonist on the market is degarelix, which is given as a monthly subcutaneous injection.1 Injection-site reactions remain an issue with this formulation.
Cardiovascular disease is the leading cause of death in the United States, and it is known that men with prostate cancer have a higher incidence of cardiovascular disease.2 While data regarding adverse cardiac outcomes with androgen deprivation therapy have been mixed, it is thought that this therapy increases the risk for MACE. There is mounting evidence that GnRH antagonists may have a less detrimental effect on cardiovascular outcomes compared with GnRH agonists. For example, a pooled analysis of 6 phase 3 trials showed a lower incidence of cardiovascular events in men with preexisting cardiovascular disease using the GnRH antagonist degarelix compared with GnRH agonists after 12 months of treatment.3 Furthermore, a more recent phase 2 randomized trial showed that 20% of patients treated with a GnRH agonist developed cardiovascular events, compared to 3% in the GnRH antagonist group. The absolute risk reduction of cardiovascular events at 12 months was 18%.4 The results of the current trial support such findings, showing a 54% reduction in MACE after 48 weeks of therapy when compared with leuprolide (2.9% in relugolix arm vs 6.2% in leuprolide arm). More importantly perhaps, in the subgroup of men with preexisting cardiovascular disease, the benefit was even greater, with a MACE incidence of 3.6% with relugolix compared with 17.8% with leuprolide.
Studies have also shown that second-generation antiandrogens such as enzalutamide are associated with an increased risk of death from cardiovascular causes. For example, data from the recently updated PROSPER trial, which evaluated the use of enzalutamide in men with nonmetastatic, castration-resistant prostate cancer, showed an increased risk of adverse events, including falls, fatigue, hypertension, and death from cardiovascular events.5 Furthermore, adding second-generation antiandrogens to GnRH-agonist therapy is associated with a high risk of cardiovascular events in men with preexisting cardiovascular disease.3 These results were noted in all of the trials of second-generation antiandrogens, including enzalutamide, apalutamide, and darolutamide, in combination with GnRH agonists.6-8 Taken together, one might consider whether the use of a GnRH antagonist would result in improved cardiovascular outcomes in high-risk patients.
In light of the efficacy of relugolix in regard to testosterone suppression highlighted in the current trial, it is likely that its efficacy in regard to cancer outcomes will be similar; however, to date there is no level 1 evidence to support this. Nevertheless, there is a clear association of adverse cardiovascular outcomes in men treated with GnRH agonists, and the notable 54% risk reduction seen in the current trial certainly would support considering the use of a GnRH antagonist for the subgroup of patients with preexisting cardiovascular disease or those at high risk for MACE. Further work is needed to define the role of GnRH antagonists in conjunction with second-generation antiandrogens to help mitigate cardiovascular toxicities.
Clinical Implications
The use of GnRH antagonists should be considered in men with advanced prostate cancer who have underlying cardiovascular disease to help mitigate the risk of MACE. Currently, degarelix is the only commercially available agent; however, pending regulatory approval, oral relugolix may be considered an appropriate oral option in such patients, with data supporting superior testosterone suppressive effects. Further follow-up will be needed.
–Saud Alsubait, MD, Michigan State University, East Lansing, MI
–Daniel Isaac, MD, MS
1. Barkin J, Burton S, Lambert C. Optimizing subcutaneous injection of the gonadotropin-releasing hormone receptor antagonist degarelix. Can J Urol. 2016;23:8179-8183.
2. Higano CS. Cardiovascular disease and androgen axis-targeted drugs for prostate cancer. N Engl J Med. 2020;382:2257-2259.
3. Albertsen PC, Klotz L, Tombal B, et al. Cardiovascular morbidity associated with gonadotropin releasing hormone agonists and an antagonist. Eur Urol. 2014;65:565-573.
4. Margel D, Peer A, Ber Y, et al. Cardiovascular morbidity in a randomized trial comparing GnRH agonist and GnRH antagonist among patients with advanced prostate cancer and preexisting cardiovascular disease. J Urol. 2019;202:1199-1208.
5. Sternberg CN, Fizazi K, Saad F, et al. Enzalutamide and survival in nonmetastatic, castration-resistant prostate cancer. N Engl J Med. 2020;382:2197-2206.
6. Smith MR, Saad F, Chowdhury S, et al. Apalutamide treatment and metastasis-free survival in prostate cancer. N Engl J Med. 2018;378:1408-1418.
7. Fizazi K, Shore N, Tammela TL, et al. Darolutamide in nonmetastatic, castration-resistant prostate cancer. N Engl J Med. 2019;380:1235-1246.
Study Overview
Objective. To evaluate the safety and efficacy of the highly selective oral gonadotropin-releasing hormone (GnRH) antagonist relugolix in men with advanced prostate cancer.
Design. Global, multicenter, randomized, open-label, phase 3 trial.
Intervention. Patients were randomized in a 2:1 ratio to receive either relugolix 120 mg once daily after receiving a single loading dose of 360 mg, or 22.5 mg of leuprolide acetate every 3 months. Patients in Japan and Taiwan received 11.25 mg of leuprolide. The randomization was stratified by age (> 75 years or ≤ 75 years), metastatic disease status, and geographic region (Asia, Europe, North and South America). The intervention period was 48 weeks.
Setting and participants. 1327 patients were screened, and 934 patients underwent randomization: 622 patients to the relugolix group and 308 to the leuprolide group. Patients had histologically or cytologically confirmed adenocarcinoma of the prostate. All patients had to have 1 of the following: evidence of biochemical or clinical relapse after primary curative therapy, newly diagnosed hormone-sensitive metastatic disease, or advance localized disease unlikely to be cured by local primary intervention. The patients with disease progression or rising prostate-specific antigen (PSA) had the option to receive enzalutamide or docetaxel after the confirmation of progression. Patients were excluded if they had a major cardiovascular event within 6 months of enrollment.
Main outcome measures. The primary endpoint was sustained castration rate, defined as the cumulative probability of testosterone suppression to ≤ 50 ng/dL while on study treatment from week 5 through week 48. Secondary endpoints included noninferiority of relugolix to leuprolide in regard to sustained castration rate. Superiority testing was performed if the noninferiority margin of –10 percentage points was met. Additional secondary endpoints were probability of testosterone suppression to ≤ 50 ng/dL on day 4 and day 15 and the percentage of patients with a > 50% decrease in PSA at day 15 and follicle-stimulating hormone (FSH) levels at the end of week 24.
Main results. The baseline characteristics were well balanced between the treatment groups. Approximately 30% of the patients in each group had metastatic disease. Approximately 50% of patients enrolled had biochemical recurrence following primary treatment for prostate cancer. The mean PSA was 104.2 ng/mL in the relugolix group and 68.6 ng/mL in the leuprolide group. The majority of patients had at least 1 cardiovascular risk factor (ie, tobacco use, obesity, diabetes, hypertension, or a history of a major adverse cardiac event [MACE]). Adherence to oral therapy was reported as 99% in both groups. The median follow-up time was 52 weeks; 90% of patients in the relugolix arm and 89% in the leuprolide arm completed 48 weeks of treatment.
Sustained testosterone suppression to ≤ 50 ng/dL from day 29 through week 48 was seen in 96.7% of patients in the relugolix group and 88.8% in the leuprolide group, which was determined to be noninferior. Additionally, relugolix was also found to be superior to leuprolide in regard to sustained testosterone suppression (P < 0.001). These results were consistent across all subgroups. Relugolix was also found to be superior to leuprolide for all secondary endpoints, including cumulative probability of castration on day 4 (56% vs 0%) and day 15 (98.7% vs 12%) and testosterone suppression to ≤ 20 ng/dL on day 15 (78.4% vs 1%). Confirmed PSA response on day 15 was seen in 79.4% of patients in the relugolix arm and in 19.8% in the leuprolide arm (P < 0.001). FSH suppression was greater in the relugolix arm compared with the leuprolide arm by the end of week 24. An increase of testosterone levels from baseline was noted in the leuprolide patients at day 4, with the level decreasing to castrate level by day 29. In contrast, relugolix patients maintained castrate testosterone levels from day 4 throughout the intervention period. Testosterone recovery at 90 days was seen in 54% of patients in the relugolix group compared with 3% in the leuprolide group (P = 0.002).
The most frequent adverse event seen in both groups was hot flashes (54.3% in the relugolix group and 51.6% in the leuprolide group). The second most common adverse event report was fatigue, which occurred in 21.5% of patients in the relugolix arm and 18.5% in the leuprolide arm. Diarrhea was reported more frequently with relugolix than with leuprolide (12.2% vs 6.8%); however, diarrhea did not lead to discontinuation of therapy in any patient. Fatal events were reported more frequently in the leuprolide group (2.9%) compared with the relugolix group (1.1%). MACE were defined as nonfatal myocardial infarction, stroke, and death from any cause. After completing the intervention period of 48 weeks, the relugolix group had a 2.9% incidence of major cardiovascular events, compared with 6.2% in the leuprolide group. In patients having a medical history of cardiovascular events, the adverse event rate during the trial period was 3.6% in the relugolix group and 17.8% in leuprolide group. This translated into a 54% lower risk of MACE in the relugolix arm compared with the leuprolide arm.
Conclusion. The use of relugolix in advanced prostate cancer led to rapid, sustained suppression and faster recovery of testosterone level compared with leuprolide. Relugolix appeared safer to use for men with a medical history of cardiovascular events and showed a 54% lower risk of MACE than leuprolide.
Commentary
Relugolix is a highly selective oral GnRH antagonist that rapidly inhibits pituitary release of luteinizing hormone and FSH. The current phase 3 HERO trial highlights the efficacy of relugolix in regard to testosterone suppression, adding to potential therapeutic options for these men. Relugolix yielded superior sustained testosterone suppression to less than 50 ng/dL throughout the 48-week study period, meeting its primary endpoint. Additionally, relugolix showed superiority in all secondary endpoints across all subgroups of patients. To date, the only GnRH antagonist on the market is degarelix, which is given as a monthly subcutaneous injection.1 Injection-site reactions remain an issue with this formulation.
Cardiovascular disease is the leading cause of death in the United States, and it is known that men with prostate cancer have a higher incidence of cardiovascular disease.2 While data regarding adverse cardiac outcomes with androgen deprivation therapy have been mixed, it is thought that this therapy increases the risk for MACE. There is mounting evidence that GnRH antagonists may have a less detrimental effect on cardiovascular outcomes compared with GnRH agonists. For example, a pooled analysis of 6 phase 3 trials showed a lower incidence of cardiovascular events in men with preexisting cardiovascular disease using the GnRH antagonist degarelix compared with GnRH agonists after 12 months of treatment.3 Furthermore, a more recent phase 2 randomized trial showed that 20% of patients treated with a GnRH agonist developed cardiovascular events, compared to 3% in the GnRH antagonist group. The absolute risk reduction of cardiovascular events at 12 months was 18%.4 The results of the current trial support such findings, showing a 54% reduction in MACE after 48 weeks of therapy when compared with leuprolide (2.9% in relugolix arm vs 6.2% in leuprolide arm). More importantly perhaps, in the subgroup of men with preexisting cardiovascular disease, the benefit was even greater, with a MACE incidence of 3.6% with relugolix compared with 17.8% with leuprolide.
Studies have also shown that second-generation antiandrogens such as enzalutamide are associated with an increased risk of death from cardiovascular causes. For example, data from the recently updated PROSPER trial, which evaluated the use of enzalutamide in men with nonmetastatic, castration-resistant prostate cancer, showed an increased risk of adverse events, including falls, fatigue, hypertension, and death from cardiovascular events.5 Furthermore, adding second-generation antiandrogens to GnRH-agonist therapy is associated with a high risk of cardiovascular events in men with preexisting cardiovascular disease.3 These results were noted in all of the trials of second-generation antiandrogens, including enzalutamide, apalutamide, and darolutamide, in combination with GnRH agonists.6-8 Taken together, one might consider whether the use of a GnRH antagonist would result in improved cardiovascular outcomes in high-risk patients.
In light of the efficacy of relugolix in regard to testosterone suppression highlighted in the current trial, it is likely that its efficacy in regard to cancer outcomes will be similar; however, to date there is no level 1 evidence to support this. Nevertheless, there is a clear association of adverse cardiovascular outcomes in men treated with GnRH agonists, and the notable 54% risk reduction seen in the current trial certainly would support considering the use of a GnRH antagonist for the subgroup of patients with preexisting cardiovascular disease or those at high risk for MACE. Further work is needed to define the role of GnRH antagonists in conjunction with second-generation antiandrogens to help mitigate cardiovascular toxicities.
Clinical Implications
The use of GnRH antagonists should be considered in men with advanced prostate cancer who have underlying cardiovascular disease to help mitigate the risk of MACE. Currently, degarelix is the only commercially available agent; however, pending regulatory approval, oral relugolix may be considered an appropriate oral option in such patients, with data supporting superior testosterone suppressive effects. Further follow-up will be needed.
–Saud Alsubait, MD, Michigan State University, East Lansing, MI
–Daniel Isaac, MD, MS
1. Barkin J, Burton S, Lambert C. Optimizing subcutaneous injection of the gonadotropin-releasing hormone receptor antagonist degarelix. Can J Urol. 2016;23:8179-8183.
2. Higano CS. Cardiovascular disease and androgen axis-targeted drugs for prostate cancer. N Engl J Med. 2020;382:2257-2259.
3. Albertsen PC, Klotz L, Tombal B, et al. Cardiovascular morbidity associated with gonadotropin releasing hormone agonists and an antagonist. Eur Urol. 2014;65:565-573.
4. Margel D, Peer A, Ber Y, et al. Cardiovascular morbidity in a randomized trial comparing GnRH agonist and GnRH antagonist among patients with advanced prostate cancer and preexisting cardiovascular disease. J Urol. 2019;202:1199-1208.
5. Sternberg CN, Fizazi K, Saad F, et al. Enzalutamide and survival in nonmetastatic, castration-resistant prostate cancer. N Engl J Med. 2020;382:2197-2206.
6. Smith MR, Saad F, Chowdhury S, et al. Apalutamide treatment and metastasis-free survival in prostate cancer. N Engl J Med. 2018;378:1408-1418.
7. Fizazi K, Shore N, Tammela TL, et al. Darolutamide in nonmetastatic, castration-resistant prostate cancer. N Engl J Med. 2019;380:1235-1246.
MIS-C is a serious immune-mediated response to COVID-19 infection
One of the take-away messages from a review of multisystem inflammatory syndrome in children (MIS-C) is that clinicians treating this condition “need to be comfortable with uncertainty,” Melissa Hazen, MD, said at a synthesis of multiple published case series and personal experience summarized at the virtual Pediatric Hospital Medicine meeting.

She emphasized MIS-C patient care “requires flexibility,” and she advised clinicians managing these patients to open the lines of communication with the many specialists who often are required to deal with complications affecting an array of organ systems.
MIS-C might best be understood as the most serious manifestation of an immune-mediated response to COVID-19 infection that ranges from transient mild symptoms to the life-threatening multiple organ involvement that characterizes this newly recognized threat. Although “most children who encounter this pathogen only develop mild disease,” the spectrum of the disease can move in a subset of patients to a “Kawasaki-like illness” without hemodynamic instability and then to MIS-C “with highly elevated systemic inflammatory markers and multiple organ involvement,” explained Dr. Hazen, an attending physician in the rheumatology program at Boston Children’s Hospital.
most of which have only recently reached publication, according to Dr. Hazen. In general, the description of the most common symptoms and their course has been relatively consistent.
In 186 cases of MIS-C collected in a study funded by the Centers for Disease Control and Prevention, 148 (80%) were admitted to intensive care, 90 patients (48%) received vasoactive support, 37 (20%) received mechanical ventilation, and 4 (2%) died.1 The median age was 8 years (range, 3-13 years) in this study. The case definition was fever for at least 24 hours, laboratory evidence of inflammation, multisystem organ involvement, and evidence of COVID-19 infection. In this cohort of 186 children, 92% had gastrointestinal, 80% had cardiovascular, 76% had hematologic, and 70% had respiratory system involvement.
In a different series of 95 cases collected in New York State, 79 (80%) were admitted to intensive care, 61 (62%) received vasoactive support, 10 (10%) received mechanical ventilation, 4 (4%) received extracorporeal membrane oxygenation (ECMO), and 2 (2%) died. 2 Thirty-one percent patients were aged 0-5 years, 42% were 6-12 years, and 26% were 13-20 years of age. In that series, for which the case definition was elevation of two or more inflammatory markers, virologic evidence of COVID-19 infection, 80% had gastrointestinal system involvement, and 53% had evidence of myocarditis.
In both of these series, as well as others published and unpublished, the peak in MIS-C cases has occurred about 3 to 4 weeks after peak COVID-19 activity, according to Diana Lee, MD, a pediatrician at Icahn School of Medicine at Mount Sinai, New York. This pattern, reported by others, was observed in New York State, where 230 cases of MIS-C were collected from the beginning of May until the end of June, which reflected this 3- to 4-week delay in peak incidence.
“This does seem to be a rare syndrome since this [group of] 230 cases is amongst the entire population of children in New York State. So, yes, we should be keeping this in mind in our differential, but we should not forget all the other reasons that children can have a fever,” she said.
Both Dr. Hazen and Dr. Lee cautioned that MIS-C, despite a general consistency among published studies, remains a moving target in regard to how it is being characterized. In a 2-day period in May, the CDC, the World Health Organization, and New York State all issued descriptions of MIS-C, employing compatible but slightly different terminology and diagnostic criteria. Many questions regarding optimal methods of diagnosis, treatment, and follow-up remain unanswered.

Questions regarding the risk to the cardiovascular system, one of the organs most commonly affected in MIS-C, are among the most urgent. It is not now clear how best to monitor cardiovascular involvement, how to intervene, and how to follow patients in the postinfection period, according to Kevin G. Friedman, MD, a pediatrician at Harvard Medical School, Boston, and an attending physician in the department of cardiology at Boston Children’s Hospital.
“The most frequent complication we have seen is ventricular dysfunction, which occurs in about half of these patients,” he reported. “Usually it is in the mild to moderate range, but occasionally patients have an ejection fraction of less than 40%.”
Coronary abnormalities, typically in the form of dilations or small aneurysms, occur in 10%-20% of children with MIS-C, according to Dr. Friedman. Giant aneurysms have been reported.
“Some of these findings can progress including in both the acute phase and, particularly for the coronary aneurysms, in the subacute phase. We recommend echocardiograms and EKGs at diagnosis and at 1-2 weeks to recheck coronary size or sooner if there are clinical indications,” Dr. Friedman advised.
Protocols like these are constantly under review as more information becomes available. There are as yet no guidelines, and practice differs across institutions, according to the investigators summarizing this information.
None of the speakers had any relevant financial disclosures.
References
1. Feldstein LR et al. Multisystem inflammatory syndrome in U.S. children and adolescents. N Engl J Med. 2020;383:334-46.
2. Dufort EM et al. Multisystem inflammatory syndrome in children in New York State. N Engl J Med 2020;383:347-58.
One of the take-away messages from a review of multisystem inflammatory syndrome in children (MIS-C) is that clinicians treating this condition “need to be comfortable with uncertainty,” Melissa Hazen, MD, said at a synthesis of multiple published case series and personal experience summarized at the virtual Pediatric Hospital Medicine meeting.
She emphasized MIS-C patient care “requires flexibility,” and she advised clinicians managing these patients to open the lines of communication with the many specialists who often are required to deal with complications affecting an array of organ systems.
MIS-C might best be understood as the most serious manifestation of an immune-mediated response to COVID-19 infection that ranges from transient mild symptoms to the life-threatening multiple organ involvement that characterizes this newly recognized threat. Although “most children who encounter this pathogen only develop mild disease,” the spectrum of the disease can move in a subset of patients to a “Kawasaki-like illness” without hemodynamic instability and then to MIS-C “with highly elevated systemic inflammatory markers and multiple organ involvement,” explained Dr. Hazen, an attending physician in the rheumatology program at Boston Children’s Hospital.
most of which have only recently reached publication, according to Dr. Hazen. In general, the description of the most common symptoms and their course has been relatively consistent.
In 186 cases of MIS-C collected in a study funded by the Centers for Disease Control and Prevention, 148 (80%) were admitted to intensive care, 90 patients (48%) received vasoactive support, 37 (20%) received mechanical ventilation, and 4 (2%) died.1 The median age was 8 years (range, 3-13 years) in this study. The case definition was fever for at least 24 hours, laboratory evidence of inflammation, multisystem organ involvement, and evidence of COVID-19 infection. In this cohort of 186 children, 92% had gastrointestinal, 80% had cardiovascular, 76% had hematologic, and 70% had respiratory system involvement.
In a different series of 95 cases collected in New York State, 79 (80%) were admitted to intensive care, 61 (62%) received vasoactive support, 10 (10%) received mechanical ventilation, 4 (4%) received extracorporeal membrane oxygenation (ECMO), and 2 (2%) died. 2 Thirty-one percent patients were aged 0-5 years, 42% were 6-12 years, and 26% were 13-20 years of age. In that series, for which the case definition was elevation of two or more inflammatory markers, virologic evidence of COVID-19 infection, 80% had gastrointestinal system involvement, and 53% had evidence of myocarditis.
In both of these series, as well as others published and unpublished, the peak in MIS-C cases has occurred about 3 to 4 weeks after peak COVID-19 activity, according to Diana Lee, MD, a pediatrician at Icahn School of Medicine at Mount Sinai, New York. This pattern, reported by others, was observed in New York State, where 230 cases of MIS-C were collected from the beginning of May until the end of June, which reflected this 3- to 4-week delay in peak incidence.
“This does seem to be a rare syndrome since this [group of] 230 cases is amongst the entire population of children in New York State. So, yes, we should be keeping this in mind in our differential, but we should not forget all the other reasons that children can have a fever,” she said.
Both Dr. Hazen and Dr. Lee cautioned that MIS-C, despite a general consistency among published studies, remains a moving target in regard to how it is being characterized. In a 2-day period in May, the CDC, the World Health Organization, and New York State all issued descriptions of MIS-C, employing compatible but slightly different terminology and diagnostic criteria. Many questions regarding optimal methods of diagnosis, treatment, and follow-up remain unanswered.
Questions regarding the risk to the cardiovascular system, one of the organs most commonly affected in MIS-C, are among the most urgent. It is not now clear how best to monitor cardiovascular involvement, how to intervene, and how to follow patients in the postinfection period, according to Kevin G. Friedman, MD, a pediatrician at Harvard Medical School, Boston, and an attending physician in the department of cardiology at Boston Children’s Hospital.
“The most frequent complication we have seen is ventricular dysfunction, which occurs in about half of these patients,” he reported. “Usually it is in the mild to moderate range, but occasionally patients have an ejection fraction of less than 40%.”
Coronary abnormalities, typically in the form of dilations or small aneurysms, occur in 10%-20% of children with MIS-C, according to Dr. Friedman. Giant aneurysms have been reported.
“Some of these findings can progress including in both the acute phase and, particularly for the coronary aneurysms, in the subacute phase. We recommend echocardiograms and EKGs at diagnosis and at 1-2 weeks to recheck coronary size or sooner if there are clinical indications,” Dr. Friedman advised.
Protocols like these are constantly under review as more information becomes available. There are as yet no guidelines, and practice differs across institutions, according to the investigators summarizing this information.
None of the speakers had any relevant financial disclosures.
References
1. Feldstein LR et al. Multisystem inflammatory syndrome in U.S. children and adolescents. N Engl J Med. 2020;383:334-46.
2. Dufort EM et al. Multisystem inflammatory syndrome in children in New York State. N Engl J Med 2020;383:347-58.
FROM PHM20 VIRTUAL