User login
Antenatal corticosteroids may increase risk for mental and behavioral disorders
according to a Finnish population-based study published in JAMA. The findings may lead to changes in clinical practice, particularly for infants who may be born full term.

After adjustment for variables such as maternal age, smoking during pregnancy, any lifetime mental disorder diagnosis, and gestational age at birth, exposure to maternal antenatal corticosteroid treatment was significantly associated with mental and behavioral disorders in children, compared with nonexposure, with a hazard ratio of 1.33. Among children born at term, the adjusted hazard ratio was 1.47. Among preterm children, the hazard ratio was not significant.
“Although benefits of this therapy outweigh risks in the most vulnerable infants, this may not be true for all infants,” wrote Sara B. DeMauro, MD, an attending neonatologist and program director of the neonatal follow-up program at Children’s Hospital of Philadelphia, in an editorial also published in JAMA. “Recommendations to administer this therapy to broader populations of pregnant women may need to be reexamined until sufficient safety data, particularly among more mature infants, are available.”
Corticosteroid treatment to accelerate fetal maturation is standard care before 34 weeks’ gestation when there is a likelihood of delivery within 7 days, and studies have found that providing this therapy reduces the risk for respiratory problems when administered beyond 34 weeks. In 2016, updates to U.S. guidelines allowed for the use of corticosteroid treatment between 34 weeks and 36 weeks 6 days when women are at risk for preterm delivery within 7 days and have not received a previous course of antenatal corticosteroids.
The data from Finland indicate that “a significant number of very preterm children who might have benefited from this treatment did not receive it,” Dr. DeMauro wrote. At the same time, “45% of steroid-exposed infants were delivered at term. In these infants, minor short-term benefit may have been outweighed by significant longer-term risks. These data elucidate both the continuing struggle to accurately predict preterm birth and the incomplete uptake of an effective therapy that is beneficial when administered to the correct patients.”
Pause expanded use?
“Since the recommendations came out to expand the use of corticosteroids for preterm labor up until 37 weeks gestational age, my practice has incorporated these guidelines,” said Santina Wheat, MD, assistant professor of family and community medicine at Northwestern University in Chicago. “We have incorporated the guidelines though with the understanding that the benefits outweigh the risk. This article indicates that we may have been wrong in that understanding.” Although the association does not establish that the treatment causes mental and behavioral disorders, it “raises the question of whether we should halt this practice until additional information can be gathered,” noted Dr. Wheat, who also serves on the editorial advisory board of Family Practice News.
When administered before delivery of a very premature infant, corticosteroid therapy accelerates fetal lung maturation and helps prevent neonatal mortality, respiratory distress syndrome, and brain injury. Investigators demonstrated the benefits of antenatal corticosteroids in 1972, and the treatment – “one of the most important advances in perinatal care” – became widely used in the 1990s, Dr. DeMauro said.
To examine whether treatment exposure is associated with a risk of childhood mental and behavioral disorders and whether the risk is similar in infants born at term and preterm, Katri Räikkönen, PhD, a researcher at the University of Helsinki, and colleagues conducted a population-based retrospective study of more than 670,000 children.
The researchers identified all singleton pregnancies ending in a live birth in Finland during Jan. 1, 2006–Dec.31, 2017. In addition, they identified all consecutive maternal sibling pairs born at term, including sibling pairs discordant for maternal antenatal corticosteroid treatment exposure and sibling pairs concordant for treatment exposure or nonexposure. The investigators identified diagnoses of childhood mental and behavioral disorders using the Finnish Care Register for Health Care using ICD-10 codes on hospital inpatient and outpatient treatments by physicians in specialized medical care.
A range of disorders
In all, 670,097 infants with a median follow-up duration of 5.8 years were included in the analysis, and 14,868 (2.22%) were exposed to antenatal corticosteroids. Of the treatment-exposed children, about 45% were born at term. Of the nonexposed children, approximately 97% were born at term. Cumulative incidence rates for any mental and behavioral disorder were significantly higher for treatment-exposed children, compared with nonexposed children, in the entire cohort (12.01% vs. 6.45%; P less than .001) and in term-born children (8.89% vs. 6.31%; P less than .001).

In preterm children, the incidence rate of any mental and behavioral disorder was significantly higher among those with treatment exposure (14.59% vs. 10.71%; P less than .001). Associations persisted when the investigators focused on 241,621 sibling pairs, “suggesting that unmeasured familial confounding did not explain these associations,” the authors said.
“[In] the entire cohort and term-born children, treatment exposure ... was significantly associated with psychological development disorders; attention-deficit/hyperactivity or conduct disorders; mixed disorders of conduct and emotions, emotional disorders, disorders of social functioning or tic disorders; other behavioral or emotional disorders; and sleep disorders,” Dr. Räikkönen and colleagues reported. Among preterm-born, treatment-exposed children, the adjusted hazard ratio was significantly lower for intellectual disability and higher for sleep disorders.
Dr. DeMauro noted potential confounders in this observational study, including abnormal pregnancy events that lead clinicians to administer steroids. Such events “predispose the exposed children to adverse cognitive outcomes,” suggests some research. “Alternately, after a pregnancy at high risk for preterm delivery, families may perceive their children as vulnerable and therefore may be more likely to seek care and earlier diagnosis of mental or behavioral disorders,” Dr. DeMauro said.
The study was funded by the Academy of Finland, European Commission, Foundation for Pediatric Research, the Signe and Ane Gyllenberg Foundation, the Novo Nordisk Foundation, the Sigrid Juselius Foundation, and the Juho Vainio Foundation. The investigators and Dr. DeMauro had no conflict of interest disclosures.
SOURCE: Räikkönen K et al. JAMA. 2020;323(19):1924-33. doi: 10.1001/jama.2020.3937.
according to a Finnish population-based study published in JAMA. The findings may lead to changes in clinical practice, particularly for infants who may be born full term.
After adjustment for variables such as maternal age, smoking during pregnancy, any lifetime mental disorder diagnosis, and gestational age at birth, exposure to maternal antenatal corticosteroid treatment was significantly associated with mental and behavioral disorders in children, compared with nonexposure, with a hazard ratio of 1.33. Among children born at term, the adjusted hazard ratio was 1.47. Among preterm children, the hazard ratio was not significant.
“Although benefits of this therapy outweigh risks in the most vulnerable infants, this may not be true for all infants,” wrote Sara B. DeMauro, MD, an attending neonatologist and program director of the neonatal follow-up program at Children’s Hospital of Philadelphia, in an editorial also published in JAMA. “Recommendations to administer this therapy to broader populations of pregnant women may need to be reexamined until sufficient safety data, particularly among more mature infants, are available.”
Corticosteroid treatment to accelerate fetal maturation is standard care before 34 weeks’ gestation when there is a likelihood of delivery within 7 days, and studies have found that providing this therapy reduces the risk for respiratory problems when administered beyond 34 weeks. In 2016, updates to U.S. guidelines allowed for the use of corticosteroid treatment between 34 weeks and 36 weeks 6 days when women are at risk for preterm delivery within 7 days and have not received a previous course of antenatal corticosteroids.
The data from Finland indicate that “a significant number of very preterm children who might have benefited from this treatment did not receive it,” Dr. DeMauro wrote. At the same time, “45% of steroid-exposed infants were delivered at term. In these infants, minor short-term benefit may have been outweighed by significant longer-term risks. These data elucidate both the continuing struggle to accurately predict preterm birth and the incomplete uptake of an effective therapy that is beneficial when administered to the correct patients.”
Pause expanded use?
“Since the recommendations came out to expand the use of corticosteroids for preterm labor up until 37 weeks gestational age, my practice has incorporated these guidelines,” said Santina Wheat, MD, assistant professor of family and community medicine at Northwestern University in Chicago. “We have incorporated the guidelines though with the understanding that the benefits outweigh the risk. This article indicates that we may have been wrong in that understanding.” Although the association does not establish that the treatment causes mental and behavioral disorders, it “raises the question of whether we should halt this practice until additional information can be gathered,” noted Dr. Wheat, who also serves on the editorial advisory board of Family Practice News.
When administered before delivery of a very premature infant, corticosteroid therapy accelerates fetal lung maturation and helps prevent neonatal mortality, respiratory distress syndrome, and brain injury. Investigators demonstrated the benefits of antenatal corticosteroids in 1972, and the treatment – “one of the most important advances in perinatal care” – became widely used in the 1990s, Dr. DeMauro said.
To examine whether treatment exposure is associated with a risk of childhood mental and behavioral disorders and whether the risk is similar in infants born at term and preterm, Katri Räikkönen, PhD, a researcher at the University of Helsinki, and colleagues conducted a population-based retrospective study of more than 670,000 children.
The researchers identified all singleton pregnancies ending in a live birth in Finland during Jan. 1, 2006–Dec.31, 2017. In addition, they identified all consecutive maternal sibling pairs born at term, including sibling pairs discordant for maternal antenatal corticosteroid treatment exposure and sibling pairs concordant for treatment exposure or nonexposure. The investigators identified diagnoses of childhood mental and behavioral disorders using the Finnish Care Register for Health Care using ICD-10 codes on hospital inpatient and outpatient treatments by physicians in specialized medical care.
A range of disorders
In all, 670,097 infants with a median follow-up duration of 5.8 years were included in the analysis, and 14,868 (2.22%) were exposed to antenatal corticosteroids. Of the treatment-exposed children, about 45% were born at term. Of the nonexposed children, approximately 97% were born at term. Cumulative incidence rates for any mental and behavioral disorder were significantly higher for treatment-exposed children, compared with nonexposed children, in the entire cohort (12.01% vs. 6.45%; P less than .001) and in term-born children (8.89% vs. 6.31%; P less than .001).
In preterm children, the incidence rate of any mental and behavioral disorder was significantly higher among those with treatment exposure (14.59% vs. 10.71%; P less than .001). Associations persisted when the investigators focused on 241,621 sibling pairs, “suggesting that unmeasured familial confounding did not explain these associations,” the authors said.
“[In] the entire cohort and term-born children, treatment exposure ... was significantly associated with psychological development disorders; attention-deficit/hyperactivity or conduct disorders; mixed disorders of conduct and emotions, emotional disorders, disorders of social functioning or tic disorders; other behavioral or emotional disorders; and sleep disorders,” Dr. Räikkönen and colleagues reported. Among preterm-born, treatment-exposed children, the adjusted hazard ratio was significantly lower for intellectual disability and higher for sleep disorders.
Dr. DeMauro noted potential confounders in this observational study, including abnormal pregnancy events that lead clinicians to administer steroids. Such events “predispose the exposed children to adverse cognitive outcomes,” suggests some research. “Alternately, after a pregnancy at high risk for preterm delivery, families may perceive their children as vulnerable and therefore may be more likely to seek care and earlier diagnosis of mental or behavioral disorders,” Dr. DeMauro said.
The study was funded by the Academy of Finland, European Commission, Foundation for Pediatric Research, the Signe and Ane Gyllenberg Foundation, the Novo Nordisk Foundation, the Sigrid Juselius Foundation, and the Juho Vainio Foundation. The investigators and Dr. DeMauro had no conflict of interest disclosures.
SOURCE: Räikkönen K et al. JAMA. 2020;323(19):1924-33. doi: 10.1001/jama.2020.3937.
FROM JAMA
Key clinical point: Exposure to maternal antenatal corticosteroid treatment is significantly associated with mental and behavioral disorders in children, compared with nonexposure.
Major finding: After adjustment for such variables as maternal age, smoking during pregnancy, any lifetime mental disorder diagnosis, and gestational age at birth, exposure to maternal antenatal corticosteroid treatment was significantly associated with mental and behavioral disorders in children, compared with nonexposure (HR, 1.33). Among children born at term, the adjusted HR was 1.47.
Study details: A population-based retrospective cohort study that included 670,097 children in Finland.
Disclosures: The study was funded by the Academy of Finland, European Commission, Foundation for Pediatric Research, the Signe and Ane Gyllenberg Foundation, the Novo Nordisk Foundation, the Sigrid Juselius Foundation, and the Juho Vainio Foundation. The authors had no conflict of interest disclosures.
Source: Räikkönen K et al. JAMA. 2020;323(19):1924-33. doi: 10.1001/jama.2020.3937.
Most rheumatology drugs don’t increase COVID-19 hospitalization risk
The vast majority of patients with rheumatic and musculoskeletal diseases who contract COVID-19 recover from the virus, regardless of which medication they receive for their rheumatic condition, new international research suggests.

“These results provide, for the first time, information about the outcome of COVID-19 in patients with rheumatic and musculoskeletal diseases,” said study investigator Pedro Machado, MD, PhD, from University College London. “They should provide some reassurance to patients and healthcare providers.”
Machado and his colleagues looked at 600 COVID-19 patients from 40 countries, and found that those taking TNF inhibitors for their rheumatic disease were less likely to be hospitalized for COVID-19. However, treatment with more than 10 mg of prednisone daily — considered a moderate to high dose — was associated with a higher probability of hospitalization.
In addition, hospitalization was not associated with biologics; JAK inhibitors; conventional disease-modifying antirheumatic drugs (DMARDs), such as methotrexate; antimalarials, such as hydroxychloroquine; or nonsteroidal anti-inflammatory drugs (NSAIDs) — either alone or in combination with other biologics, such as TNF-alpha inhibitors.
The findings were presented at the virtual European League Against Rheumatism (EULAR) 2020 Congress and were published online in Annals of the Rheumatic Diseases.
“Initially, there was a huge concern that these drugs could affect the outcome of patients getting COVID-19, but what this is showing is that probably these drugs do not increase their risk of severe outcome,” Machado, who is chair of the EULAR standing committee on epidemiology and health services research, told Medscape Medical News.
As of June 1, 1061 patients from 28 participating countries had been entered into the EULAR COVID-19 database, which was launched as part of the international Global Rheumatology Alliance registry. Patient data are categorized by factors such as top rheumatology diagnosis, comorbidities, top-five COVID-19 symptoms, and DMARD therapy at the time of virus infection. Anonymized data will be shared with an international register based in the United States.
Machado’s team combined data from the EULAR and Global Rheumatology Alliance COVID-19 registries from March 24 to April 20. They looked at patient factors — such as age, sex, smoking status, rheumatic diagnosis, comorbidities, and rheumatic therapies — to examine the association of rheumatic therapies with hospitalization rates and COVID-19 disease course.

Of the 277 patients (46%) in the study cohort who required hospitalization, 55 (9%) died. But this finding shouldn’t be viewed as the true rate of hospitalization or death in patients with rheumatic disease and COVID-19, said Gerd Burmester, MD, from Charité–University Medicine Berlin.
“There’s tremendous bias in terms of more serious cases of COVID-19 being reported to the registries,” he explained, “because the mild cases won’t even show up at their rheumatologist’s office.”
“This can skew the idea that COVID-19 is much more dangerous to rheumatic patients than to the regular population,” Burmester told Medscape Medical News. “It scares the patients, obviously, but we believe this is not justified.”
It’s still unclear whether rituximab use raises the risk for severe COVID-19, he said. “It appears to be the only biologic for which the jury is still out,” he said.
“Anti-TNFs and anti-IL-6 drugs may even be beneficial, although we don’t have robust data,” he added.
The study can only highlight associations between rheumatic drugs and COVID-19 outcomes. “We cannot say there is a causal relationship between the findings,” Machado said.
Longer-term data, when available, should illuminate “more granular” aspects of COVID-19 outcomes in rheumatic patients, including their risks of requiring ventilation or developing a cytokine storm, he noted.
Burmester and Machado agree that research needs to continue as the pandemic rages on. But so far, “there are no data suggesting that, if you’re on a targeted, dedicated immunomodulator, your risk is higher to have a worse course of COVID-19 than the general population,” Burmester said.
“We simply didn’t know that when the pandemic started, and some patients even discontinued their drugs out of this fear,” he added. “It’s more reassuring than we originally thought.”
This article first appeared on Medscape.com.
The vast majority of patients with rheumatic and musculoskeletal diseases who contract COVID-19 recover from the virus, regardless of which medication they receive for their rheumatic condition, new international research suggests.
“These results provide, for the first time, information about the outcome of COVID-19 in patients with rheumatic and musculoskeletal diseases,” said study investigator Pedro Machado, MD, PhD, from University College London. “They should provide some reassurance to patients and healthcare providers.”
Machado and his colleagues looked at 600 COVID-19 patients from 40 countries, and found that those taking TNF inhibitors for their rheumatic disease were less likely to be hospitalized for COVID-19. However, treatment with more than 10 mg of prednisone daily — considered a moderate to high dose — was associated with a higher probability of hospitalization.
In addition, hospitalization was not associated with biologics; JAK inhibitors; conventional disease-modifying antirheumatic drugs (DMARDs), such as methotrexate; antimalarials, such as hydroxychloroquine; or nonsteroidal anti-inflammatory drugs (NSAIDs) — either alone or in combination with other biologics, such as TNF-alpha inhibitors.
The findings were presented at the virtual European League Against Rheumatism (EULAR) 2020 Congress and were published online in Annals of the Rheumatic Diseases.
“Initially, there was a huge concern that these drugs could affect the outcome of patients getting COVID-19, but what this is showing is that probably these drugs do not increase their risk of severe outcome,” Machado, who is chair of the EULAR standing committee on epidemiology and health services research, told Medscape Medical News.
As of June 1, 1061 patients from 28 participating countries had been entered into the EULAR COVID-19 database, which was launched as part of the international Global Rheumatology Alliance registry. Patient data are categorized by factors such as top rheumatology diagnosis, comorbidities, top-five COVID-19 symptoms, and DMARD therapy at the time of virus infection. Anonymized data will be shared with an international register based in the United States.
Machado’s team combined data from the EULAR and Global Rheumatology Alliance COVID-19 registries from March 24 to April 20. They looked at patient factors — such as age, sex, smoking status, rheumatic diagnosis, comorbidities, and rheumatic therapies — to examine the association of rheumatic therapies with hospitalization rates and COVID-19 disease course.
Of the 277 patients (46%) in the study cohort who required hospitalization, 55 (9%) died. But this finding shouldn’t be viewed as the true rate of hospitalization or death in patients with rheumatic disease and COVID-19, said Gerd Burmester, MD, from Charité–University Medicine Berlin.
“There’s tremendous bias in terms of more serious cases of COVID-19 being reported to the registries,” he explained, “because the mild cases won’t even show up at their rheumatologist’s office.”
“This can skew the idea that COVID-19 is much more dangerous to rheumatic patients than to the regular population,” Burmester told Medscape Medical News. “It scares the patients, obviously, but we believe this is not justified.”
It’s still unclear whether rituximab use raises the risk for severe COVID-19, he said. “It appears to be the only biologic for which the jury is still out,” he said.
“Anti-TNFs and anti-IL-6 drugs may even be beneficial, although we don’t have robust data,” he added.
The study can only highlight associations between rheumatic drugs and COVID-19 outcomes. “We cannot say there is a causal relationship between the findings,” Machado said.
Longer-term data, when available, should illuminate “more granular” aspects of COVID-19 outcomes in rheumatic patients, including their risks of requiring ventilation or developing a cytokine storm, he noted.
Burmester and Machado agree that research needs to continue as the pandemic rages on. But so far, “there are no data suggesting that, if you’re on a targeted, dedicated immunomodulator, your risk is higher to have a worse course of COVID-19 than the general population,” Burmester said.
“We simply didn’t know that when the pandemic started, and some patients even discontinued their drugs out of this fear,” he added. “It’s more reassuring than we originally thought.”
This article first appeared on Medscape.com.
A bumpy virtual #ASCO20; Returning to Chicago in 2021?
Called ‘incredibly boring,’ Praised as ‘special’
CYBERSPACE – Hope Rugo, MD, was one of the would-be attendees of the American Society of Clinical Oncology annual meeting who could not access the online event on its first day, Friday, May 29.
“Such a shame – virtual ASCO is nonexistent,” tweeted Rugo, who is from the University of California, San Francisco.
The breast cancer specialist tried for more than hour before finally gaining entry in the late morning.
Not everyone was as successful.
That same day, Arjun Balar, MD, of NYU Langone Health in New York announced on Twitter that he’d quit for the day. “I give up @ASCO. Time for a cocktail.”
Don Dizon, MD, of Brown University in Providence, Rhode Island, tried repeatedly to join the meeting as a live broadcast, using his desktop and laptop computers as well as an iPad. Nothing worked. Limited to seeing data and discussions “after the fact,” Dizon looked to next year, tweeting hopefully: “... fingers crossed for an inperson #ASCO21.”
ASCO did not respond to a request for further information about the technical difficulties of the meeting’s first day.
This year’s meeting, which involved 40,000-plus attendees, was shortened to 3 days and limited to scientific presentations because of the COVID-19 pandemic. Education sessions will be held online August 8-10.
Despite those technical glitches, dozens of virtual meeting attendees praised the online effort, which was assembled in just a few months, and called out virtues such as the quick availability of video transcripts as well as the obvious benefits of low cost, zero travel, and overall convenience. But one sentiment was nearly universal: there’s nothing like the real thing.
At the same time, a Medscape Oncology online meeting poll indicated that nearly half (48%) of the 335 respondents said “no,” they do not envision themselves in person at the real thing in Chicago in 2021. About one fifth (21%) said, “yes, if there is a vaccine.” Roughly 15% said “yes,” and another 15% said “not sure right now.”
What did oncologists miss most with virtual ASCO?
Many said face-to-face (F2F) interactions. Collaboration, networking, and catching up with old friends were some of the stock F2F moments cited as losses.
Others described more idiosyncratic disappointments, including Riyaz Shah, MD, of the Kent Oncology Centre in the UK, who dismissed a future with exclusively virtual meetings.
He tweeted: “Not sustainable. We need to meet F2F. Oncology is an odd one. Exposed to human distress daily (if not hourly). [Very] few people understand what we do, fewer would do it. There aren’t many people we can talk to. I love chewing the cud with my colleagues who are close friends.”
The virtual meeting inspired more social media engagement, but fewer oncologists participated, according to data from social media analytics firm Symplur. This year, 1K users identified as oncologists generated 17.75K tweets. In 2019, 1.3K oncologists put out 15.2K tweets.
Virtual meeting ‘like homework’
George Sledge, MD, of Stanford University, California, asked his 1700 Twitter followers to discuss the virtual ASCO experience, including the spotty functionality of presenter videos (a con) and eating dinner between talks (a pro).
One of his criticisms struck a nerve – that the online meeting was “like homework.”
“ ‘Feels like homework’ is the best expression I [have] read so far!” tweeted Gustavo Gössling, MD, from the Kaplan Oncology Institute in Porto Alegre, Brazil.
Yes, it feels “like studying alone,” agreed Stanford’s Lidia Schapira, MD, in a tweet.
“It’s incredibly boring – let’s bring back F2F next year,” tweeted Ioannis Gounaris, MD, Merck Group, Cambridge, UK, in response to Sledge’s request.
Sledge joined many others in saying that, ultimately, the future should include – and will demand – both virtual and in-person meetings.
What will happen with ASCO next year?
Medscape Medical News asked some virtual attendees whether they envisioned going in person to the ASCO meeting next year in Chicago.
“Counting on it,” said Harold Burstein, MD, PhD, Dana-Farber Cancer Institute, Boston. “But I also recognize that it fully depends on what happens between now and then. Vaccines. Safety of travel. Safety of large, indoor, crowded spaces.”
Despite acknowledging the uncertainty of how things will “play out,” Burstein advised: “Put it on your calendar and make reservations, and make sure the reservations are fully refundable.”
Ahmad Tarhini, MD, from the Moffitt Cancer Center in Tampa, Florida, sounded similarly optimistic: “Hopefully we will have a vaccine by then. I expect the ASCO annual meeting will happen in person in 2021.”
Moffitt colleague Michelle Echevarria Colon, MD, said, “I could see myself attending ... in Chicago in 2021.” And she added: “I think we’ll get to a point where it could happen.”
Others were uncertain.
Ishwaria Subbiah, MD, University of Texas MD Anderson Cancer Center, Houston, said: “If someone told us 6 months ago that our ‘new normal’ would be in this near-total virtual existence, most of us would not have believed them. So it is hard to imagine what our reality will be in a year from now at ASCO 2021.”
Jack West, MD, from City of Hope Comprehensive Cancer Center in Duarte, California, thinks the meeting will be changed for a long time, even if 2021 is a live event.
“While I think that there MIGHT be a live conference, I think it will be many years, if ever, before we see it return to its prior magnitude,” he wrote in an email, echoing remarks previously made by other healthcare professionals about medical meetings in any post–COVID-19 world.
A year from now, said West, “I strongly suspect that we will still be contending with risk of exposure” and that means clinician attendees might, in turn, expose their cancer patients back home.
Despite his wistful “fingers crossed” tweet during ASCO 2020, Brown’s Dizon also recently commented on Medscape that “I wonder whether I will ever sit in a crowded auditorium at an ASCO annual meeting again.”
Sagar Sardesai, MBBS, Ohio State Comprehensive Cancer Center, Columbus, responded: “Unless we have a vaccine that is successful or we can demonstrate enough herd immunity in the United States, I can’t imagine that such large gatherings are a real possibility. We need to protect our vulnerable populations.”
City of Hope’s Cary Presant, MD, acknowledged he is one of those vulnerable people. “In 2021, if the environment is safe for oncologists of my age, I will be in Chicago,” he said. “But with COVID-19 still a threat, I might have to attend only virtually.”
“This year was special”
On social media, MD Anderson’s Vivek Subbiah, MD, did not speculate about next year’s meeting but observed the uniqueness of the current moment.
He tweeted: “The last 8 years of @asco are a blur in my memory. This year #ASCO was special, and I’m sure we will all remember where we were for this year’s meeting.”
Other oncologists praised the accessibility of the virtual meeting.
“The power of a virtual meeting is it creates an unlimited number of seats at the oncology research table. Anyone globally can be involved and that is really special,” said Suneel Kamath, MD, Cleveland Clinic, Ohio.
“Virtual ASCO levels the playing field for oncologists everywhere,” says Bishal Gyawali, MD, PhD, from Queen’s University, Kingston, Canada. In a Medscape Commentary, he notes that “attending a typical ASCO meeting is astonishingly cost-prohibitive, especially for colleagues from low- and middle-income countries ... now everybody has the same access to the meeting.”
ASCO made the best out of a bad situation with the expanded virtual meeting, suggested David Henry, MD, Pennsylvania Hospital, Philadelphia, host of MDEdge’s Blood and Cancer podcast, part of the Medscape Professional Network. In an interview with ASCO president Skip Burris, MD, before the meeting, Henry said: “Making lemonade out of lemons. It’ll give us something new and different. What an amazing turn of events.”
With additional reporting by Zosia Chustecka , Liz Neporent, Neil Osterweil, and Jennifer Smith. This article first appeared on Medscape.com.
Called ‘incredibly boring,’ Praised as ‘special’
Called ‘incredibly boring,’ Praised as ‘special’
CYBERSPACE – Hope Rugo, MD, was one of the would-be attendees of the American Society of Clinical Oncology annual meeting who could not access the online event on its first day, Friday, May 29.
“Such a shame – virtual ASCO is nonexistent,” tweeted Rugo, who is from the University of California, San Francisco.
The breast cancer specialist tried for more than hour before finally gaining entry in the late morning.
Not everyone was as successful.
That same day, Arjun Balar, MD, of NYU Langone Health in New York announced on Twitter that he’d quit for the day. “I give up @ASCO. Time for a cocktail.”
Don Dizon, MD, of Brown University in Providence, Rhode Island, tried repeatedly to join the meeting as a live broadcast, using his desktop and laptop computers as well as an iPad. Nothing worked. Limited to seeing data and discussions “after the fact,” Dizon looked to next year, tweeting hopefully: “... fingers crossed for an inperson #ASCO21.”
ASCO did not respond to a request for further information about the technical difficulties of the meeting’s first day.
This year’s meeting, which involved 40,000-plus attendees, was shortened to 3 days and limited to scientific presentations because of the COVID-19 pandemic. Education sessions will be held online August 8-10.
Despite those technical glitches, dozens of virtual meeting attendees praised the online effort, which was assembled in just a few months, and called out virtues such as the quick availability of video transcripts as well as the obvious benefits of low cost, zero travel, and overall convenience. But one sentiment was nearly universal: there’s nothing like the real thing.
At the same time, a Medscape Oncology online meeting poll indicated that nearly half (48%) of the 335 respondents said “no,” they do not envision themselves in person at the real thing in Chicago in 2021. About one fifth (21%) said, “yes, if there is a vaccine.” Roughly 15% said “yes,” and another 15% said “not sure right now.”
What did oncologists miss most with virtual ASCO?
Many said face-to-face (F2F) interactions. Collaboration, networking, and catching up with old friends were some of the stock F2F moments cited as losses.
Others described more idiosyncratic disappointments, including Riyaz Shah, MD, of the Kent Oncology Centre in the UK, who dismissed a future with exclusively virtual meetings.
He tweeted: “Not sustainable. We need to meet F2F. Oncology is an odd one. Exposed to human distress daily (if not hourly). [Very] few people understand what we do, fewer would do it. There aren’t many people we can talk to. I love chewing the cud with my colleagues who are close friends.”
The virtual meeting inspired more social media engagement, but fewer oncologists participated, according to data from social media analytics firm Symplur. This year, 1K users identified as oncologists generated 17.75K tweets. In 2019, 1.3K oncologists put out 15.2K tweets.
Virtual meeting ‘like homework’
George Sledge, MD, of Stanford University, California, asked his 1700 Twitter followers to discuss the virtual ASCO experience, including the spotty functionality of presenter videos (a con) and eating dinner between talks (a pro).
One of his criticisms struck a nerve – that the online meeting was “like homework.”
“ ‘Feels like homework’ is the best expression I [have] read so far!” tweeted Gustavo Gössling, MD, from the Kaplan Oncology Institute in Porto Alegre, Brazil.
Yes, it feels “like studying alone,” agreed Stanford’s Lidia Schapira, MD, in a tweet.
“It’s incredibly boring – let’s bring back F2F next year,” tweeted Ioannis Gounaris, MD, Merck Group, Cambridge, UK, in response to Sledge’s request.
Sledge joined many others in saying that, ultimately, the future should include – and will demand – both virtual and in-person meetings.
What will happen with ASCO next year?
Medscape Medical News asked some virtual attendees whether they envisioned going in person to the ASCO meeting next year in Chicago.
“Counting on it,” said Harold Burstein, MD, PhD, Dana-Farber Cancer Institute, Boston. “But I also recognize that it fully depends on what happens between now and then. Vaccines. Safety of travel. Safety of large, indoor, crowded spaces.”
Despite acknowledging the uncertainty of how things will “play out,” Burstein advised: “Put it on your calendar and make reservations, and make sure the reservations are fully refundable.”
Ahmad Tarhini, MD, from the Moffitt Cancer Center in Tampa, Florida, sounded similarly optimistic: “Hopefully we will have a vaccine by then. I expect the ASCO annual meeting will happen in person in 2021.”
Moffitt colleague Michelle Echevarria Colon, MD, said, “I could see myself attending ... in Chicago in 2021.” And she added: “I think we’ll get to a point where it could happen.”
Others were uncertain.
Ishwaria Subbiah, MD, University of Texas MD Anderson Cancer Center, Houston, said: “If someone told us 6 months ago that our ‘new normal’ would be in this near-total virtual existence, most of us would not have believed them. So it is hard to imagine what our reality will be in a year from now at ASCO 2021.”
Jack West, MD, from City of Hope Comprehensive Cancer Center in Duarte, California, thinks the meeting will be changed for a long time, even if 2021 is a live event.
“While I think that there MIGHT be a live conference, I think it will be many years, if ever, before we see it return to its prior magnitude,” he wrote in an email, echoing remarks previously made by other healthcare professionals about medical meetings in any post–COVID-19 world.
A year from now, said West, “I strongly suspect that we will still be contending with risk of exposure” and that means clinician attendees might, in turn, expose their cancer patients back home.
Despite his wistful “fingers crossed” tweet during ASCO 2020, Brown’s Dizon also recently commented on Medscape that “I wonder whether I will ever sit in a crowded auditorium at an ASCO annual meeting again.”
Sagar Sardesai, MBBS, Ohio State Comprehensive Cancer Center, Columbus, responded: “Unless we have a vaccine that is successful or we can demonstrate enough herd immunity in the United States, I can’t imagine that such large gatherings are a real possibility. We need to protect our vulnerable populations.”
City of Hope’s Cary Presant, MD, acknowledged he is one of those vulnerable people. “In 2021, if the environment is safe for oncologists of my age, I will be in Chicago,” he said. “But with COVID-19 still a threat, I might have to attend only virtually.”
“This year was special”
On social media, MD Anderson’s Vivek Subbiah, MD, did not speculate about next year’s meeting but observed the uniqueness of the current moment.
He tweeted: “The last 8 years of @asco are a blur in my memory. This year #ASCO was special, and I’m sure we will all remember where we were for this year’s meeting.”
Other oncologists praised the accessibility of the virtual meeting.
“The power of a virtual meeting is it creates an unlimited number of seats at the oncology research table. Anyone globally can be involved and that is really special,” said Suneel Kamath, MD, Cleveland Clinic, Ohio.
“Virtual ASCO levels the playing field for oncologists everywhere,” says Bishal Gyawali, MD, PhD, from Queen’s University, Kingston, Canada. In a Medscape Commentary, he notes that “attending a typical ASCO meeting is astonishingly cost-prohibitive, especially for colleagues from low- and middle-income countries ... now everybody has the same access to the meeting.”
ASCO made the best out of a bad situation with the expanded virtual meeting, suggested David Henry, MD, Pennsylvania Hospital, Philadelphia, host of MDEdge’s Blood and Cancer podcast, part of the Medscape Professional Network. In an interview with ASCO president Skip Burris, MD, before the meeting, Henry said: “Making lemonade out of lemons. It’ll give us something new and different. What an amazing turn of events.”
With additional reporting by Zosia Chustecka , Liz Neporent, Neil Osterweil, and Jennifer Smith. This article first appeared on Medscape.com.
FROM ASCO 2020
Newest oral DMTs haven’t yet made a big impact in the MS world
So far, it’s more like a ripple, according to a study of neurologists’ prescribing patterns. “The recently approved therapies will initially be niched as later-line options,” predicted Virginia R. Schobel, MSc, nephrology franchise head at Spherix Global Insights, an independent market intelligence firm in Exton, Pa.
At the virtual annual meeting of the Consortium of Multiple Sclerosis Centers, Ms. Schobel presented the results of a retrospective chart audit Spherix conducted in February 2020 of 1,006 patients with MS who were switched to a new DMT by 199 U.S. participating neurologists within the previous 3 months. About 72% of the switchers had relapsing remitting MS (RRMS).
Assessing the three new oral DMTs
The purpose of the study was to gain an understanding of the early adoption patterns for the three recently approved oral DMTs: siponimod (Mayzent), cladribine (Mavenclad), and diroximel fumarate (Vumerity).
The first surprise was that only 41% of medication switches to a new DMT among the RRMS group were to oral DMTs; that’s a substantially lower proportion than in prior Spherix chart audits. Instead, the most popular switch was to ocrelizumab (Ocrevus), a monoclonal antibody.
“Things to keep in mind when we see the switch shares for the newer products are just how crowded this market has become and how much Ocrevus has really changed the market,” Ms. Schobel explained in an interview. “Ocrevus has become increasingly dominant in the RRMS segment, so that now there are six oral DMTs competing among themselves for a relatively limited pool of patients.”
Because of grandfathering by the Food and Drug Administration, most of the oral DMTs now share identical indications for clinically isolated syndrome, RRMS, and active secondary progressive MS. Ocrevus, she noted, has the same indications.
Only 1% of MS patients who switched to a different DMT in late 2019 or early 2020 moved to diroximel fumarate. Three percent switched to siponimod, and another 3% switched to cladribine. Switches to the three older, established oral DMTs were collectively five times more common, with 15% of patients moving to dimethyl fumarate (Tecfidera), 11% to fingolimod (Gilenya), and 9% to teriflunomide (Aubagio).
Ms. Schobel said that the three latest oral DMTs offer advantages over the older ones in terms of various combinations of efficacy, dosing schedule, and/or tolerability, which may make them attractive options as first-line therapy. She predicted that, over time as neurologists gain increasing familiarity with these drugs as first line, they will also gradually become more comfortable in turning to them as switch options.
First-time switches to an oral DMT among patients with RRMS were most often made in search of improved efficacy. Neurologists cited this as their main reason for 73% of switches to cladribine and 36% of switches to teriflunomide, with the other oral agents falling at various points in between. A switch to fingolimod was most often driven by a wish for a high-efficacy DMT with once-daily oral dosing. Improved tolerability figured prominently in switches to teriflunomide, and even more so in the relatively few changes to diroximel fumarate.
Drug switching in the pandemic era
Ms. Schobel said Spherix has been serially tracking neurologists’ prescribing for MS during the COVID-19 pandemic, which has clearly had an enormous dampening effect on medication switching. In mid-April, neurologists’ switching volume was down by 70%, compared with prepandemic figures. A slow recovery began in May, but by the end of the month prescription-switching volume was still down by 52%.
Of the neurologist prescriptions that are being run for switching thus far during the pandemic, 82% are being done via telemedicine. Therein hangs a tale, since neurology doesn’t readily lend itself to practice by telemedicine. Indeed, neurologists are using telemedicine to a lesser extent than physicians in the other specialties that Spherix monitors, according to Ms. Schobel. “COVID is definitely changing the MS world. Within MS, drug switching is now much more likely to involve a switch to a DMT that doesn’t impact the immune response and is not immunosuppressant, such as an injectable interferon or glatiramer acetate,” she said. “In this COVID world, safety and conservatism may end up trumping the move toward ‘time is brain’ which we’ve been talking so much about in recent years: the importance of getting patients on high-efficacy DMTs from the start in order to give them the best chance for positive outcomes.”
Ms. Schobel noted that Spherix received no industry funding to conduct these studies.
FROM CMSC 2020
RA raises cardiac risk even without CAD
In patients with rheumatoid arthritis (RA), strategies to prevent cardiovascular events, such as treating hypertension, encouraging patients to stop smoking, and reinforcing statin therapy, may be especially important, regardless of whether they have a history of coronary artery disease because their risk for adverse cardiovascular outcomes is significantly greater than for patients who have neither RA nor coronary artery disease (CAD), a large population-based study from Denmark suggests.
“Among patients with RA, risk stratification by presence or absence of documented CAD may allow for screening and personalized treatment strategies,” wrote Brian B. Løgstrup, MD, PhD, DMSc, of Aarhus (Denmark) University Hospital, and his colleagues.
The study, published in Annals of the Rheumatic Diseases, analyzed 125,331 patients with and without CAD in the Western Denmark Heart Registry who had coronary angiography from 2003 through 2016. The cohort included 671 RA patients with no confirmed CAD and 1,061 RA patients who had CAD.
The study makes a significant contribution to the literature in reporting on the additive risk of RA and CAD, said Christie M. Bartels, MD, associate professor in the division of rheumatology at the University of Wisconsin, Madison. “Even among patients with both conditions [RA and CVD], they were less likely to get statin therapy,” she said, noting that the 82.6% of study patients with both CAD and RA were on statins vs. 86.5% of those with CAD alone, while the former had significantly higher rates of hypertension – 64.3% vs. 58.8%. “We’re doing a less effective job on secondary prevention,” she said. The anti-inflammatory properties of statins can also have an additive benefit in RA, she noted.

“This study shows that the rheumatologist can play a role in reinforcing the importance of primary and secondary cardiovascular disease prevention – meaning hypertension control, counseling patients to stop smoking and following up on statin therapy in RA,” Dr. Bartels added.
The study presents two novel findings, Dr. Løgstrup and colleagues noted:
- That RA confers a statistically significant, “but numerically marginally,” heightened risk of cardiovascular events other than stroke.
- Among patients with CAD, RA confers an increased risk of cardiac and all-cause death as well as MI and major adverse cardiovascular events (MACE).
“These finding indicate that RA may have a potential impact for precipitating cardiovascular events beyond CAD and, even more importantly, that RA seems to exacerbate the clinical risk of cardiovascular events in the presence of CAD,” Dr. Løgstrup and colleagues wrote.
The study found that patients with neither RA nor CAD had the lowest 10-year rates of MI (2.7%), ischemic stroke (2.9%), all-cause death (21.6%), cardiac death (2.3%), and MACE (7.3%).
By comparison, those with RA but no CAD had 10-year rates of 3.8% for MI, 5.5% for stroke, 35.6% for all-cause death, 3% for cardiac death, and 11.5% for MACE. Rates for those outcomes for people with CAD but no RA were 9.9% for MI, 4.6% for stroke, 33.3% for all-cause death, 7% for cardiac death, and 19.1% for MACE.
For patients with both RA and CAD, 10-year rates were 12.2% for MI, 4.4% for stroke, 49% for all-cause death, 10.9% for cardiac death, and 24.3% for MACE.
The researchers also performed a risk adjustment analysis based on potential confounding variables across the different groups, such as age, gender, comorbidities including diabetes and hypertension, active smoking status, and anticoagulant, antiplatelet, and statin therapy. The adjusted analysis revealed that patients with RA alone had a 63% greater risk of MI, 68% greater risk for stroke, 42% greater risk for all-cause death, 25% greater risk for cardiac death, and 60% greater risk for MACE than did people who had neither RA nor CAD.
For people with both RA and CAD, the adjusted risks were significantly higher when compared to people with neither: more than four times greater for MI and MACE, 55% greater for stroke, almost double for all-cause death, and 3.7 times greater for cardiac death. People with CAD but no RA also had higher adjusted risk rates compared to people with neither, but had variable rates when compared to people with RA but no CAD, and significantly lower adjusted rates compared to people with both.
The nature of CAD was also a factor, Dr. Løgstrup and colleagues noted. “We found more non-obstructive CAD but no increased incidence of one-vessel, two-vessel, and three-vessel disease in patients with RA than in patients without RA,” they wrote. That’s in line with other published studies (Semin Arthritis Rheum. 2010;40[3]:215–21 and J Rheumatol. 2007;34[5]:937–42), but counter to a study that found increased plaque burden and higher rates of multivessel disease among people with RA (Ann Rheum Dis. 2014;73:1797–804). Differences in methodology, vessel disease definitions, and study population may explain these deviations.
The study authors did not declare any outside source of funding or any competing interests.
Dr. Bartels disclosed receiving institutional grant funding through Pfizer.
SOURCE: Løgstrup BB et al. Ann Rheum Dis. 2020 May 29. doi: 10.1136/annrheumdis-2020-217154.
In patients with rheumatoid arthritis (RA), strategies to prevent cardiovascular events, such as treating hypertension, encouraging patients to stop smoking, and reinforcing statin therapy, may be especially important, regardless of whether they have a history of coronary artery disease because their risk for adverse cardiovascular outcomes is significantly greater than for patients who have neither RA nor coronary artery disease (CAD), a large population-based study from Denmark suggests.
“Among patients with RA, risk stratification by presence or absence of documented CAD may allow for screening and personalized treatment strategies,” wrote Brian B. Løgstrup, MD, PhD, DMSc, of Aarhus (Denmark) University Hospital, and his colleagues.
The study, published in Annals of the Rheumatic Diseases, analyzed 125,331 patients with and without CAD in the Western Denmark Heart Registry who had coronary angiography from 2003 through 2016. The cohort included 671 RA patients with no confirmed CAD and 1,061 RA patients who had CAD.
The study makes a significant contribution to the literature in reporting on the additive risk of RA and CAD, said Christie M. Bartels, MD, associate professor in the division of rheumatology at the University of Wisconsin, Madison. “Even among patients with both conditions [RA and CVD], they were less likely to get statin therapy,” she said, noting that the 82.6% of study patients with both CAD and RA were on statins vs. 86.5% of those with CAD alone, while the former had significantly higher rates of hypertension – 64.3% vs. 58.8%. “We’re doing a less effective job on secondary prevention,” she said. The anti-inflammatory properties of statins can also have an additive benefit in RA, she noted.
“This study shows that the rheumatologist can play a role in reinforcing the importance of primary and secondary cardiovascular disease prevention – meaning hypertension control, counseling patients to stop smoking and following up on statin therapy in RA,” Dr. Bartels added.
The study presents two novel findings, Dr. Løgstrup and colleagues noted:
- That RA confers a statistically significant, “but numerically marginally,” heightened risk of cardiovascular events other than stroke.
- Among patients with CAD, RA confers an increased risk of cardiac and all-cause death as well as MI and major adverse cardiovascular events (MACE).
“These finding indicate that RA may have a potential impact for precipitating cardiovascular events beyond CAD and, even more importantly, that RA seems to exacerbate the clinical risk of cardiovascular events in the presence of CAD,” Dr. Løgstrup and colleagues wrote.
The study found that patients with neither RA nor CAD had the lowest 10-year rates of MI (2.7%), ischemic stroke (2.9%), all-cause death (21.6%), cardiac death (2.3%), and MACE (7.3%).
By comparison, those with RA but no CAD had 10-year rates of 3.8% for MI, 5.5% for stroke, 35.6% for all-cause death, 3% for cardiac death, and 11.5% for MACE. Rates for those outcomes for people with CAD but no RA were 9.9% for MI, 4.6% for stroke, 33.3% for all-cause death, 7% for cardiac death, and 19.1% for MACE.
For patients with both RA and CAD, 10-year rates were 12.2% for MI, 4.4% for stroke, 49% for all-cause death, 10.9% for cardiac death, and 24.3% for MACE.
The researchers also performed a risk adjustment analysis based on potential confounding variables across the different groups, such as age, gender, comorbidities including diabetes and hypertension, active smoking status, and anticoagulant, antiplatelet, and statin therapy. The adjusted analysis revealed that patients with RA alone had a 63% greater risk of MI, 68% greater risk for stroke, 42% greater risk for all-cause death, 25% greater risk for cardiac death, and 60% greater risk for MACE than did people who had neither RA nor CAD.
For people with both RA and CAD, the adjusted risks were significantly higher when compared to people with neither: more than four times greater for MI and MACE, 55% greater for stroke, almost double for all-cause death, and 3.7 times greater for cardiac death. People with CAD but no RA also had higher adjusted risk rates compared to people with neither, but had variable rates when compared to people with RA but no CAD, and significantly lower adjusted rates compared to people with both.
The nature of CAD was also a factor, Dr. Løgstrup and colleagues noted. “We found more non-obstructive CAD but no increased incidence of one-vessel, two-vessel, and three-vessel disease in patients with RA than in patients without RA,” they wrote. That’s in line with other published studies (Semin Arthritis Rheum. 2010;40[3]:215–21 and J Rheumatol. 2007;34[5]:937–42), but counter to a study that found increased plaque burden and higher rates of multivessel disease among people with RA (Ann Rheum Dis. 2014;73:1797–804). Differences in methodology, vessel disease definitions, and study population may explain these deviations.
The study authors did not declare any outside source of funding or any competing interests.
Dr. Bartels disclosed receiving institutional grant funding through Pfizer.
SOURCE: Løgstrup BB et al. Ann Rheum Dis. 2020 May 29. doi: 10.1136/annrheumdis-2020-217154.
FROM ANNALS OF THE RHEUMATIC DISEASES
FLU/SAL inhalers for COPD carry greater pneumonia risk
For well over a decade the elevated risk of pneumonia from inhaled corticosteroids for moderate to very severe COPD has been well documented, although the pneumonia risks from different types of ICSs have not been well understood.
Researchers from Taiwan have taken a step in to investigate this question with a nationwide cohort study that reported inhalers with budesonide and beclomethasone may have a lower pneumonia risk than that of fluticasone propionate/salmeterol inhalers (CHEST. 2020;157:117-29).
The study is the first to include beclomethasone-containing inhalers in a comparison of ICS/long-acting beta2-agonist (LABA) fixed combinations to evaluate pneumonia risk, along with dose and drug properties, wrote Ting-Yu Chang, MS, of the Graduate Institute of Clinical Pharmacology at the College of Medicine, National Taiwan University in Taipei, and colleagues.
The study evaluated 42,393 people with COPD in the National Health Insurance Research Database who got at least two continuous prescriptions for three different types of inhalers:
- Budesonide/formoterol (BUD/FOR).
- Beclomethasone/formoterol (BEC/FOR).
- Fluticasone propionate/salmeterol (FLU/SAL).
The study included patients aged 40 years and older who used a metered-dose inhaler (MDI) or dry-powder inhaler (DPI) between January 2011 and June 2015.
Patient experience with adverse events (AEs) was a factor in risk stratification, Mr. Chang and colleagues noted. “For the comparison between the BEC/FOR MDI and FLU/SAL MDI, the lower risk associated with the BEC/FOR MDI was more prominent in patients without severe AE in the past year,” they wrote.
The study found that BUD/FOR DPI users had a 17% lower risk of severe pneumonia and a 12% lower risk of severe AEs than that of FLU/SAL DPI users. The risk difference in pneumonia remained significant after adjustment for the ICS-equivalent daily dose, but the spread for AEs didn’t.
BEC/FOR MDI users were 31% less likely to get severe pneumonia and 18% less likely to have severe AEs than were FLU/SAL MDI users, but that difference declined and became nonsignificant after adjustment for the ICS-equivalent daily dose.
The study also found that a high average daily dose (> 500 mcg/d) of FLU/SAL MDI carried a 66% greater risk of severe pneumonia, compared with that of low-dose users. Also, medium-dose BEC/FOR MDI users (FLU equivalent 299-499 mcg/d) had a 38% greater risk of severe pneumonia than low-dose (< 200 mcg/d) users.
The variable pneumonia risks may be linked to each ICS’s pharmacokinetics, specifically their distinct lipophilic properties, Mr. Chang and colleagues wrote. Fluticasone propionate is known to be more lipophilic than budesonide, and while beclomethasone is more lipophilic than both, as a prodrug it rapidly converts to lower lipophilicity upon contact with bronchial secretions. “In general, a lipophilic ICS has a longer retention time within the airway or lung tissue to exert local immunosuppression and reduce inflammation,” Mr. Chang and colleagues stated.
The Taiwan Ministry of Science and Technology provided partial support for the study. Mr. Chang and colleagues have no relationships to disclose.
SOURCE: Chang TY et al. CHEST. 2020;157:117-29.
FROM CHEST
NIMH strategic plan returns balance to research priorities
Digital health, suicide prevention, innovation addressed
The National Institute of Mental Health’s 2020 Strategic Plan outlines priorities in basic science research and clinical trials for psychiatry over the next 5 years, emphasizing where advances are needed in suicide prevention, digital health technology, early diagnosis in psychosis, and much more.
Experts’ reaction to the strategic plan is mixed. Some applaud the NIMH for addressing many essential research priorities and for returning a balance to the focus on basic/translational research and clinical advances. Others would have liked to see a different emphasis on some components of the plan.
Focusing on diversity
A greater weight on research in diverse populations and a renewed focus on studies across the lifespan – including developmental origins of psychiatric illness – are among the novel aspects of the plan.

“The enhanced attention to recruiting diverse subjects and focusing on diversity in our research is new and very welcome,” Jonathan E. Alpert, MD, PhD, chair of the American Psychiatric Association’s Council on Research, said in an interview.
Addressing the entire lifespan is likewise important, added Dr. Alpert, who holds the Dorothy and Marty Silverman Chair of Psychiatry at the Albert Einstein College of Medicine in New York. “Many of the conditions we treat – whether they are mood disorders or even dementia– might have developmental origins that would be best studied early in life.”
Furthermore, the plan promotes more interdisciplinary collaboration. For example, there are new cross-cutting research themes, including prevention, environmental influences, global health, and more. These are areas where psychiatry needs strengthening, said Stevan M. Weine, MD, director of Global Medicine at the University of Illinois at Chicago, in an interview.
In the era of COVID-19, which will involve ongoing diseases and disasters such as those tied to climate changes and disparities, there will be a need to conduct research and train researchers who are more open to new research questions, said Dr. Weine, also director of the Center for Global Health and professor of psychiatry at the university. It also will be important to partner with researchers from multiple disciplines, he added.

The plan also recognizes novel applications of digital technology. In addition, the plan outlines the promise of “harnessing the power of data,” such as machine learning, to help identify suicide risk factors based on large data, for example. However, Igor Galynker, MD, PhD, predicted that this technology will likely identify factors that “we see again and again,” such as depression, other forms of mental illness, and previous attempt history.
“Machine learning is useful but should not be emphasized” even if it is “technologically sexy and almost seductive,” Dr. Galynker, director of the Suicide Research & Prevention Laboratory at the Icahn School of Medicine at Mount Sinai in New York, said in an interview.
Addressing suicide
The strategic plan places a renewed emphasis on suicide prevention. The report cites a “troubling rise in the national suicide rate.” The authors suggested expanding initial success with brief screening tools in emergency departments to other clinical settings. Furthermore, the report highlights evidence that pairing such screening with low-cost follow-up interventions, such as telephone calls, can reduce the number of suicide attempts the following year.
Widespread screening could help identify people at risk, but it relies on the honesty of self-reporting, Dr. Galynker said, adding that about 75% of people who end their own lives never disclose their plan to anyone. Furthermore, suicide intent can be very short-lived – a crisis lasting as little as 15 minutes for some – reducing the likelihood that routine screening will flag a person in crisis.
“What is missing is an individual approach,” Dr. Galynker said while also endorsing the systemic approach to suicide prevention in the plan. “One thing in the strategic plan I may not agree with is the emphasis on administrative prediction measures ... based on drop-down menus and risk factors, and not on patient stories.” Risk factors are useful for long-term or lifetime risk, but they are not going to predict who will switch to acute suicidal state in the next several days or hours.”
Instead, Dr. Galynker suggested screening people for suicide crisis syndrome, which is “a very defined, characteristic, reproducible, and importantly, treatable,” state.
Covering basic neuroscience
Suicide prevention is just one of seven challenges and opportunities highlighted in the strategic plan. The authors also address research priorities for early treatment of psychosis and for research into mental health equity, HIV/AIDS research, genetics, and neural circuits.
“My overall impression is it’s very positive,” said Dr. Alpert, who is also professor and chair of the psychiatry and behavioral sciences department at Albert Einstein. “It really spans basic and translational neuroscience all the way to health services research and health disparities research. And I think, for many of us, we welcome that. It feels very relevant to the broad span of meaningful psychiatric research.”

Dr. Weine agreed. The strategic plan is “very helpful,” he said. “It is comprehensive, broad, and multidisciplinary.”
Promoting four overall goals
The plan seeks to promote the four following goals:
- Define the brain mechanisms underlying complex behaviors.
- Examine mental illness trajectories across the lifespan.
- Strive for prevention and cures.
- Strengthen the public health effects of National Institutes of Health–supported research.
The first goal is “an effort to try to make sense of the underlying biology, and that has to be your foundation point,” Ken Duckworth, MD, chief medical officer at the National Alliance on Mental Illness in Arlington, Va., said in an interview. “The reason we don’t have a lot of new drug discovery is because the fundamentals of biology still need understanding. It’s a long-term goal, so it’s hard,” he added. “Everyone living with someone in their life with an illness wants better ideas now.”
The third goal is likewise challenging, Dr. Duckworth said. “That is optimistic and ... aspirational, but very important and valuable.”
Developing innovative models
Regarding the public health goal, Dr. Duckworth cited one of the objectives, to “Develop innovative service delivery models to dramatically improve the outcomes of mental health services received in diverse communities and populations.” Dr. Duckworth explained, “Trying to solve for the problem in the context of an inadequate workforce that is insufficiently diverse – it just gets to something that I’m not sure would have been a priority in the past.
“That speaks to the awakening we’re having as a society. To address some of these historic and systemic injustices and how research can play into that is really important,” Dr. Duckworth added.
Overall, he saluted the plan and its goals. Dr. Duckworth added, “We gave some feedback that we wanted more emphasis on co-occurring disorders, such as research into people with mental health and addiction [issues] and on premature mortality. I think they took some of that feedback.”
Facing ‘significant challenges’
Dr. Weine added. “It sets a path for scientific advances that are responsive to these problems.”

“The future is bright. Looking forward to the next 5 years and beyond, the new NIMH Strategic Plan for Research aims to build on these advances,” Joshua A. Gordon, MD, PhD, NIMH director, noted in his Director’s Messages blog.
“Nonetheless, we face significant challenges,” he adds. “Studies of the origins of mental illnesses suggest that a combination of causes – genetic, environmental, social, and psychological – act on the brain through a complex web of interactions, resulting in a set of heterogeneous and overlapping illnesses.”
“My hope is that the actual funding of research over the coming years reflects the comprehensive, broad, and multidisciplinary characteristics of this strategic plan,” Dr. Weine said.
The NIMH plans to its post progress for each goal on an ongoing basis on the Strategic Plan website.
Dr. Alpert, Dr. Galynker, Dr. Weine, and Dr. Duckworth had no relevant disclosures.
Digital health, suicide prevention, innovation addressed
Digital health, suicide prevention, innovation addressed
The National Institute of Mental Health’s 2020 Strategic Plan outlines priorities in basic science research and clinical trials for psychiatry over the next 5 years, emphasizing where advances are needed in suicide prevention, digital health technology, early diagnosis in psychosis, and much more.
Experts’ reaction to the strategic plan is mixed. Some applaud the NIMH for addressing many essential research priorities and for returning a balance to the focus on basic/translational research and clinical advances. Others would have liked to see a different emphasis on some components of the plan.
Focusing on diversity
A greater weight on research in diverse populations and a renewed focus on studies across the lifespan – including developmental origins of psychiatric illness – are among the novel aspects of the plan.
“The enhanced attention to recruiting diverse subjects and focusing on diversity in our research is new and very welcome,” Jonathan E. Alpert, MD, PhD, chair of the American Psychiatric Association’s Council on Research, said in an interview.
Addressing the entire lifespan is likewise important, added Dr. Alpert, who holds the Dorothy and Marty Silverman Chair of Psychiatry at the Albert Einstein College of Medicine in New York. “Many of the conditions we treat – whether they are mood disorders or even dementia– might have developmental origins that would be best studied early in life.”
Furthermore, the plan promotes more interdisciplinary collaboration. For example, there are new cross-cutting research themes, including prevention, environmental influences, global health, and more. These are areas where psychiatry needs strengthening, said Stevan M. Weine, MD, director of Global Medicine at the University of Illinois at Chicago, in an interview.
In the era of COVID-19, which will involve ongoing diseases and disasters such as those tied to climate changes and disparities, there will be a need to conduct research and train researchers who are more open to new research questions, said Dr. Weine, also director of the Center for Global Health and professor of psychiatry at the university. It also will be important to partner with researchers from multiple disciplines, he added.
The plan also recognizes novel applications of digital technology. In addition, the plan outlines the promise of “harnessing the power of data,” such as machine learning, to help identify suicide risk factors based on large data, for example. However, Igor Galynker, MD, PhD, predicted that this technology will likely identify factors that “we see again and again,” such as depression, other forms of mental illness, and previous attempt history.
“Machine learning is useful but should not be emphasized” even if it is “technologically sexy and almost seductive,” Dr. Galynker, director of the Suicide Research & Prevention Laboratory at the Icahn School of Medicine at Mount Sinai in New York, said in an interview.
Addressing suicide
The strategic plan places a renewed emphasis on suicide prevention. The report cites a “troubling rise in the national suicide rate.” The authors suggested expanding initial success with brief screening tools in emergency departments to other clinical settings. Furthermore, the report highlights evidence that pairing such screening with low-cost follow-up interventions, such as telephone calls, can reduce the number of suicide attempts the following year.
Widespread screening could help identify people at risk, but it relies on the honesty of self-reporting, Dr. Galynker said, adding that about 75% of people who end their own lives never disclose their plan to anyone. Furthermore, suicide intent can be very short-lived – a crisis lasting as little as 15 minutes for some – reducing the likelihood that routine screening will flag a person in crisis.
“What is missing is an individual approach,” Dr. Galynker said while also endorsing the systemic approach to suicide prevention in the plan. “One thing in the strategic plan I may not agree with is the emphasis on administrative prediction measures ... based on drop-down menus and risk factors, and not on patient stories.” Risk factors are useful for long-term or lifetime risk, but they are not going to predict who will switch to acute suicidal state in the next several days or hours.”
Instead, Dr. Galynker suggested screening people for suicide crisis syndrome, which is “a very defined, characteristic, reproducible, and importantly, treatable,” state.
Covering basic neuroscience
Suicide prevention is just one of seven challenges and opportunities highlighted in the strategic plan. The authors also address research priorities for early treatment of psychosis and for research into mental health equity, HIV/AIDS research, genetics, and neural circuits.
“My overall impression is it’s very positive,” said Dr. Alpert, who is also professor and chair of the psychiatry and behavioral sciences department at Albert Einstein. “It really spans basic and translational neuroscience all the way to health services research and health disparities research. And I think, for many of us, we welcome that. It feels very relevant to the broad span of meaningful psychiatric research.”
Dr. Weine agreed. The strategic plan is “very helpful,” he said. “It is comprehensive, broad, and multidisciplinary.”
Promoting four overall goals
The plan seeks to promote the four following goals:
- Define the brain mechanisms underlying complex behaviors.
- Examine mental illness trajectories across the lifespan.
- Strive for prevention and cures.
- Strengthen the public health effects of National Institutes of Health–supported research.
The first goal is “an effort to try to make sense of the underlying biology, and that has to be your foundation point,” Ken Duckworth, MD, chief medical officer at the National Alliance on Mental Illness in Arlington, Va., said in an interview. “The reason we don’t have a lot of new drug discovery is because the fundamentals of biology still need understanding. It’s a long-term goal, so it’s hard,” he added. “Everyone living with someone in their life with an illness wants better ideas now.”
The third goal is likewise challenging, Dr. Duckworth said. “That is optimistic and ... aspirational, but very important and valuable.”
Developing innovative models
Regarding the public health goal, Dr. Duckworth cited one of the objectives, to “Develop innovative service delivery models to dramatically improve the outcomes of mental health services received in diverse communities and populations.” Dr. Duckworth explained, “Trying to solve for the problem in the context of an inadequate workforce that is insufficiently diverse – it just gets to something that I’m not sure would have been a priority in the past.
“That speaks to the awakening we’re having as a society. To address some of these historic and systemic injustices and how research can play into that is really important,” Dr. Duckworth added.
Overall, he saluted the plan and its goals. Dr. Duckworth added, “We gave some feedback that we wanted more emphasis on co-occurring disorders, such as research into people with mental health and addiction [issues] and on premature mortality. I think they took some of that feedback.”
Facing ‘significant challenges’
Dr. Weine added. “It sets a path for scientific advances that are responsive to these problems.”
“The future is bright. Looking forward to the next 5 years and beyond, the new NIMH Strategic Plan for Research aims to build on these advances,” Joshua A. Gordon, MD, PhD, NIMH director, noted in his Director’s Messages blog.
“Nonetheless, we face significant challenges,” he adds. “Studies of the origins of mental illnesses suggest that a combination of causes – genetic, environmental, social, and psychological – act on the brain through a complex web of interactions, resulting in a set of heterogeneous and overlapping illnesses.”
“My hope is that the actual funding of research over the coming years reflects the comprehensive, broad, and multidisciplinary characteristics of this strategic plan,” Dr. Weine said.
The NIMH plans to its post progress for each goal on an ongoing basis on the Strategic Plan website.
Dr. Alpert, Dr. Galynker, Dr. Weine, and Dr. Duckworth had no relevant disclosures.
Parenting special needs children: An unlikely model
COVID-19 can give physicians a window into lives of families
The last few months have tested the stamina of most families. Many people are struggling to keep some semblance of normalcy amid a radical transformation of everyday life. It seems as if everything changed overnight.

In a similar way, when a child with many needs is born into a family, adjustments also have to take place to receive the new baby. Families are, in most cases, not prepared for what is to come. Their expectations usually are not in sync with how their lives end up. They are crunched for time. They need to adjust, and at the same time, they mourn the loss of their previous less demanding lifestyle. More importantly, these parents learn that this might be an adjustment that they might need to make for a long time – in some instances, for a lifetime.
Stress load over time can correlate with a sense of burnout, and mental health professionals need to be prepared to address these issues in our patients.
Here is a list of some chronic struggles with which many special needs parents must contend. These strongly resemble the challenges parents in the general population have been facing with their families during this pandemic:
- Bypassing breaks to unwind and having to be always “on” while at home: These parents take care of children who need to be chronically tube fed, can’t sleep well at night because they are often sick, have recurrent seizures or maladaptive behaviors that affect the caretakers and the rest of the family. For parents of children who are on the autism spectrum, these challenges can be a constant struggle. Almost 60% of children with autism spectrum disorder (ASD) experience bodily difficulties, such as trouble breathing. However, nearly 100% of children with ASD experienced difficulties with their abilities and activities, such as self-care tasks like eating and dressing, and emotional or behavioral health, according to a 2016 report on child and adolescent health by the Johns Hopkins Bloomberg School of Public Health.
- Taking on roles for which they are not trained: Parents may take on active roles supplementing their developmentally delayed children with educational experiences or therapeutic modalities in their own homes given that the needs might be too great to just rely on the school or therapy time. There are about 1.17 million children in the United States living with ASD and more than 12% of children with ASD have severe cases, the Hopkins report said. Parents frequently are forced to take on the role of “therapist” to meet the needs of their child.
- Staying home often: Some parents are unable to have a “regular sitter” to provide respite, because the needs of the child require a higher level of care, training, and consideration. Caring for a special child means parents often don’t have the option of leaving their older child alone. As a result, they may end up spending more time at home than their counterpart parents with children who are the same age.
- Struggling to meet everyone’s demands for attention while at home: The child might require full-time attention or prolonged hospitalizations, and the needs of other siblings are sometimes put on hold until time or energy are available for all.
- Not traveling unless absolutely necessary: Families have a hard time leaving home for vacations or for other reasons. They may have to travel with medical supplies and equipment. They need to make sure that their destination is ready to welcome their child with all needs taken into consideration (special diets, activities, and facilities). Will the vacation set them back because it might take more effort to go than to stay home?
- Avoiding unnecessary exposures: Trying to avoid infections (even the ones that may be innocuous to others) if their child is immunocompromised. These children may readily decompensate and end up hospitalized with a more serious medical complication.
- Being very aware of remaining physically distant from others: Parents must go to great lengths not to impinge on other people’s space if the child is being loud or moving in a disruptive way, or if other people negatively affect how the child responds. Some families are apprehensive because they have felt judged by others when they are in the community, restaurants, or other places of gathering.
- Feeling concerned about having the right food, medicines, and supplements in the house: Parents are constantly trying to fulfill special dietary requirements and have the reserve to make sure that all meals and treatments are accounted for in the near future. They might need oxygen or specialized formulas that are hard to find in local stores. Some treatments, when withdrawn or unavailable, can prove life threatening.
- Restricting social circles: Some families with children with severe autism may self-isolate when they feel it is hard to be around them and be friends with them, since they can’t readily participate in “usual family activities,” and the regular norms of socialization can’t apply to their family’s set of behaviors. Their child might seem to be disruptive, or loud, nonverbal, mute, or unable to easily relate to others.
- Experiencing a pervasive sense of uncertainty about the future: A child might continue to miss milestones, or might have a rare condition that hasn’t been diagnosed. When thinking of the future, parents can’t predict what level of care they need to plan and budget for.
- Being concerned about dying early and not being able to provide for their child: Parents worry about who would take care of their child for life. Who would take care of their aging adult “child” after parents are gone? They might have concerns about having a will in place early on.
- Facing financial stress secondary to losing a job or the cost of treatments: Absenteeism might be the end result of having to care for their child’s ongoing needs, appointments, and medical emergencies. Sometimes, they might depend on a caretaker who might be very difficult to replace. It might take extensive training once a candidate is found. Direct costs include medical care, hospitalizations, special education, special therapies (occupational, speech, and physical therapy), and paid caregivers. Indirect costs include lost productivity for family caregivers because of the inability to maintain employment while caring for affected individuals, as well as lost wages and benefits, the Hopkins report said.
- Struggling to coordinate daily schedules: Parents face this challenge not only with young children but with those who are chronically ill and might need ongoing 24/7 care. The schedule might include educational and therapeutic (physical, occupational, speech, language therapy, recreational) interventions regularly or daily. This schedule is to be superimposed on all the other necessary responsibilities parents already have to contend with. Forty-eight percent of school-aged children with ASD use three or more services. In addition, children with moderate or severe cases of ASD used three or more services at almost twice the rate of children with mild cases of ASD (60% vs. 35%).
- Longing for a cure or a medicine that will improve the outcome: Often, parents search for treatments so that their child could live a more comfortable or healthier life. For children who have a rare condition, there may not be sufficient research dedicated to their cause or diagnostic pursuits. Currently, it is estimated that 1 in 10 Americans has a rare disease – about 80% of which are genetically based. Of the nearly 7,000 rare diseases known to exist, less than 500 – roughly 5% – have a known treatment approved by the U.S. Food and Drug Administration, reports the National Center for Advancing Translational Diseases and the Genetic and Rare Diseases Information Center.
- Hoping for better times to come: It is difficult at times to appreciate the present when it happens to be so chronically challenging and exhausting for everyone.

Parents of children with significant special needs experience many hurdles that they learn to endure, overcome, and master. This pandemic can provide physicians with a window into the lives of these families.
Dr. Sotir is a psychiatrist in private practice in Wheaton, Ill. As a parent of three children, one with special needs, she has extensive experience helping parents challenged by having special needs children find balance, support, direction, and joy in all dimensions of individual and family life. This area is the focus of her practice and public speaking. In Part 2, she will explore how psychiatrists as a specialty can support these families. She has no disclosures.
COVID-19 can give physicians a window into lives of families
COVID-19 can give physicians a window into lives of families
The last few months have tested the stamina of most families. Many people are struggling to keep some semblance of normalcy amid a radical transformation of everyday life. It seems as if everything changed overnight.
In a similar way, when a child with many needs is born into a family, adjustments also have to take place to receive the new baby. Families are, in most cases, not prepared for what is to come. Their expectations usually are not in sync with how their lives end up. They are crunched for time. They need to adjust, and at the same time, they mourn the loss of their previous less demanding lifestyle. More importantly, these parents learn that this might be an adjustment that they might need to make for a long time – in some instances, for a lifetime.
Stress load over time can correlate with a sense of burnout, and mental health professionals need to be prepared to address these issues in our patients.
Here is a list of some chronic struggles with which many special needs parents must contend. These strongly resemble the challenges parents in the general population have been facing with their families during this pandemic:
- Bypassing breaks to unwind and having to be always “on” while at home: These parents take care of children who need to be chronically tube fed, can’t sleep well at night because they are often sick, have recurrent seizures or maladaptive behaviors that affect the caretakers and the rest of the family. For parents of children who are on the autism spectrum, these challenges can be a constant struggle. Almost 60% of children with autism spectrum disorder (ASD) experience bodily difficulties, such as trouble breathing. However, nearly 100% of children with ASD experienced difficulties with their abilities and activities, such as self-care tasks like eating and dressing, and emotional or behavioral health, according to a 2016 report on child and adolescent health by the Johns Hopkins Bloomberg School of Public Health.
- Taking on roles for which they are not trained: Parents may take on active roles supplementing their developmentally delayed children with educational experiences or therapeutic modalities in their own homes given that the needs might be too great to just rely on the school or therapy time. There are about 1.17 million children in the United States living with ASD and more than 12% of children with ASD have severe cases, the Hopkins report said. Parents frequently are forced to take on the role of “therapist” to meet the needs of their child.
- Staying home often: Some parents are unable to have a “regular sitter” to provide respite, because the needs of the child require a higher level of care, training, and consideration. Caring for a special child means parents often don’t have the option of leaving their older child alone. As a result, they may end up spending more time at home than their counterpart parents with children who are the same age.
- Struggling to meet everyone’s demands for attention while at home: The child might require full-time attention or prolonged hospitalizations, and the needs of other siblings are sometimes put on hold until time or energy are available for all.
- Not traveling unless absolutely necessary: Families have a hard time leaving home for vacations or for other reasons. They may have to travel with medical supplies and equipment. They need to make sure that their destination is ready to welcome their child with all needs taken into consideration (special diets, activities, and facilities). Will the vacation set them back because it might take more effort to go than to stay home?
- Avoiding unnecessary exposures: Trying to avoid infections (even the ones that may be innocuous to others) if their child is immunocompromised. These children may readily decompensate and end up hospitalized with a more serious medical complication.
- Being very aware of remaining physically distant from others: Parents must go to great lengths not to impinge on other people’s space if the child is being loud or moving in a disruptive way, or if other people negatively affect how the child responds. Some families are apprehensive because they have felt judged by others when they are in the community, restaurants, or other places of gathering.
- Feeling concerned about having the right food, medicines, and supplements in the house: Parents are constantly trying to fulfill special dietary requirements and have the reserve to make sure that all meals and treatments are accounted for in the near future. They might need oxygen or specialized formulas that are hard to find in local stores. Some treatments, when withdrawn or unavailable, can prove life threatening.
- Restricting social circles: Some families with children with severe autism may self-isolate when they feel it is hard to be around them and be friends with them, since they can’t readily participate in “usual family activities,” and the regular norms of socialization can’t apply to their family’s set of behaviors. Their child might seem to be disruptive, or loud, nonverbal, mute, or unable to easily relate to others.
- Experiencing a pervasive sense of uncertainty about the future: A child might continue to miss milestones, or might have a rare condition that hasn’t been diagnosed. When thinking of the future, parents can’t predict what level of care they need to plan and budget for.
- Being concerned about dying early and not being able to provide for their child: Parents worry about who would take care of their child for life. Who would take care of their aging adult “child” after parents are gone? They might have concerns about having a will in place early on.
- Facing financial stress secondary to losing a job or the cost of treatments: Absenteeism might be the end result of having to care for their child’s ongoing needs, appointments, and medical emergencies. Sometimes, they might depend on a caretaker who might be very difficult to replace. It might take extensive training once a candidate is found. Direct costs include medical care, hospitalizations, special education, special therapies (occupational, speech, and physical therapy), and paid caregivers. Indirect costs include lost productivity for family caregivers because of the inability to maintain employment while caring for affected individuals, as well as lost wages and benefits, the Hopkins report said.
- Struggling to coordinate daily schedules: Parents face this challenge not only with young children but with those who are chronically ill and might need ongoing 24/7 care. The schedule might include educational and therapeutic (physical, occupational, speech, language therapy, recreational) interventions regularly or daily. This schedule is to be superimposed on all the other necessary responsibilities parents already have to contend with. Forty-eight percent of school-aged children with ASD use three or more services. In addition, children with moderate or severe cases of ASD used three or more services at almost twice the rate of children with mild cases of ASD (60% vs. 35%).
- Longing for a cure or a medicine that will improve the outcome: Often, parents search for treatments so that their child could live a more comfortable or healthier life. For children who have a rare condition, there may not be sufficient research dedicated to their cause or diagnostic pursuits. Currently, it is estimated that 1 in 10 Americans has a rare disease – about 80% of which are genetically based. Of the nearly 7,000 rare diseases known to exist, less than 500 – roughly 5% – have a known treatment approved by the U.S. Food and Drug Administration, reports the National Center for Advancing Translational Diseases and the Genetic and Rare Diseases Information Center.
- Hoping for better times to come: It is difficult at times to appreciate the present when it happens to be so chronically challenging and exhausting for everyone.
Parents of children with significant special needs experience many hurdles that they learn to endure, overcome, and master. This pandemic can provide physicians with a window into the lives of these families.
Dr. Sotir is a psychiatrist in private practice in Wheaton, Ill. As a parent of three children, one with special needs, she has extensive experience helping parents challenged by having special needs children find balance, support, direction, and joy in all dimensions of individual and family life. This area is the focus of her practice and public speaking. In Part 2, she will explore how psychiatrists as a specialty can support these families. She has no disclosures.

Telemedicine: Common hurdles and proper coding for ObGyns
Since the COVID-19 pandemic began, many significant changes have occurred that have made the implementation of telemedicine easier and more attractive for gynecologic practices. In the first article in this series, we discussed the benefits of telemedicine to physicians and patients, how to get started using telemedicine, and implementing a workflow. This article will discuss the common hurdles in the process and the proper coding to use to insure reimbursement for services rendered.
Barriers to implementing telemedicine
Incorrect assumptions
Latecomers to telemedicine often assume that patients prefer face-to-face visits when, in fact, many may prefer the convenience of virtual visits. More than 50% of patients who are surveyed about their experience with telemedicine say that online tools have helped improve their relationship with their providers.1 Telemedicine has grown astronomically during the COVID-19 pandemic to the point where many patients now expect their health care providers to be able to conduct virtual visits. Practices that do not offer telemedicine may find their patients seeking services elsewhere. Nearly two-thirds of health care professionals expect their commitment to telemedicine to increase significantly in the next 3 years.2 Of those providers who have not yet adopted the practice, nearly 85% expect to implement telemedicine in the near future.3 COVID-19 has motivated the increased use of telemedicine to enhance the communication with patients, making it possible for patients to have enhanced access to health care during this pandemic while minimizing infectious transmission of COVID-19 to physicians and their staff.4
Admittedly, telemedicine is not appropriate for all patients. In general, situations that do not lend themselves to telemedicine are those for which an in-person visit is required to evaluate the patient via a physical examination, to perform a protocol-driven procedure, or provide an aggressive intervention. Additional patients for whom telemedicine may be inappropriate include those with cognitive disorders, those with language barriers, those with emergency situations that warrant an office visit or a visit to the emergency department, and patients who do not have access to the technology to conduct a virtual visit.
Cost and complexity
The process of implementing electronic health records (EHRs) left a bitter taste in the mouths of many health care professionals. But EHRs are complicated and expensive. Implementation often resulted in lost productivity. Because the learning curve was so steep, many physicians had to decrease the number of patients they saw before becoming comfortable with the conversion from paper charts to an EHR.
Telemedicine implementation is much less onerous and expensive. Telemedicine is available as a cloud-based platform, which requires less information technology (IT) support and less hardware and software. The technology required for patients to participate in telemedicine is nearly ubiquitous. According to the Pew Research Center, 96% of Americans own a cell phone (81% have a smart phone), and more than half (52%) own a tablet, so the basic equipment to connect patients to providers is already in place.5
On the provider side, the basic equipment required for a telemedicine program is a computer with video and audio capabilities and a broadband connection that is fast enough to show video in real time and to provide high-quality viewing of any images to be reviewed.
The growth in telemedicine means that telemedicine options are now more diverse, with many more affordable solutions. However, most telemedicine programs do require the purchase and set-up of new technology and equipment and the training of staff—some of which may be outside the budgets of health care providers in smaller independent practices. Many gynecologists have technology budgets that are already stretched thin. And for patients who do not have access to a smartphone or computer with Internet access, real-time telemedicine may be out of reach.
But with new guidelines put forth by the Centers for Medicare and Medicaid Services (CMS) in March 2020, connectivity can take place inexpensively using free platforms such as Google Hangouts, Skype, Facetime, and Facebook Messenger. If a non‒HIPAA-compliant platform is used initially, conversion to a HIPAA-compliant platform is recommended.6 These platforms do not require the purchase of, or subscription to, any expensive hardware or software. The disadvantages of these programs are the lack of documentation, the failure to be Health Insurance Portability and Accountability Act (HIPAA)-compliant, and the lack of encryption; however, these disadvantages are no longer an issue after the new CMS guidelines.
Depending on the magnitude of the program, IT assistance may be needed to get started. It is imperative that the telemedicine program is interoperable with the EHR and the billing program. Otherwise, double and triple entry will erase the efficiency provided by conducting a virtual visit.
Continue to: Licensing...
Licensing
Another concern or barrier is a license to participate in telemedicine. The March 15, 2020, approval of telemedicine states that physicians who are licensed in the state where the patient is located do not require any additional license or permission to conduct virtual visits.7 CMS has temporarily waived the requirement that out-of-state providers be licensed in the state where they are providing services when they are licensed in another state. For questions regarding licensure, contact your State Board of Medicine or Department of Health for information on requirements for licenses across state lines (see “Resources,” at the end of the article).
Informed consent
Just like with any other aspect of providing care for patients, obtaining informed consent is paramount. Not only is getting informed patient consent a recommended best practice of the American Telemedicine Association (ATA), but it is actually a legal requirement in many states and could be a condition of getting paid, depending on the payer. To check the requirements regarding patient consent in your state, look at The National Telehealth Policy Resource Center’s state map (see “Resources.")
Some states do not have any requirements regarding consent for a virtual visit. Others require verbal consent. Even if it is not a legal requirement in your state, consider making it a part of your practice’s policy to obtain written or verbal consent and to document in the patient’s record that consent was obtained prior to the virtual visit so that you are protected when using this new technology.
Because telemedicine is a new way of receiving care for many patients, it is important to let them know how it works including how patient confidentiality and privacy are handled, what technical equipment is required, and what they should expect in terms of scheduling, cancellations, and billing policies. A sample consent form for telemedicine use is shown in FIGURE 1.

Liability insurance
Another hurdle that must be considered is liability insurance for conducting virtual visits with patients. Gynecologists who are going to offer telemedicine care to patients should request proof in writing that their liability insurance policy covers telemedicine malpractice and that the coverage extends to other states should the patient be in another state from the state in which the gynecologist holds a license. Additionally, gynecologists who provide telemedicine care should check with liability insurers regarding any requirements or limitations to conducting a virtual visit with their patients and should document them. For example, the policy may require that the physician keep a written or recorded record of the visit in the EHR. If that is the case, then using Skype, Facebook, or Google for the virtual visit, which do not include documentation, would be less desirable.
Privacy
Certainly, there is concern about privacy, and HIPAA compliance is critical to telemedicine success. Because of the COVID-19 emergency, as of March 1, 2020, physicians may now communicate with patients, and provide telehealth services, through remote communications without penalties.8 With these changes in the HIPAA requirements, physicians may use applications that allow for video chats, including Apple FaceTime, Facebook Messenger video chat, Google Hangouts video, and Skype, to provide telehealth without risk that the Office for Civil Rights will impose a penalty for noncompliance with HIPAA rules. The consent for patients should mention that these “public” applications potentially introduce privacy risks. This is a motivation for gynecologists to consider one of the programs that promises encryption, privacy, and HIPAA compliance, such as Updox, Doxy.me, and Amazon Chime. It is also important to recognize that a virtual visit could result in colleagues (if the patient is in an office setting) or family members (if the patient is in the home environment) overhearing conversations between the health care professional and the patient. Therefore, we suggest that patients conduct virtual visits in locations in which they feel assured of some semblance of privacy.
Continue to: Compensation for telemedicine...
Compensation for telemedicine
Perhaps the biggest barrier to virtual health adoption has been compensation for telemedicine visits. Both commercial payers and CMS have been slow to enact formal policies for telemedicine reimbursement. Because of this, the common misconceptions (that providers cannot be reimbursed for telemedicine appointments or that compensation occurs at a reduced rate) have persisted, making telemedicine economically unappealing.
The good news is that this is changing; legislation in most states is quickly embracing virtual health visits as a result of the COVID-19 pandemic.9 In fact, as of January 1, 2020, telemedicine services are no longer considered “optional” coverage in Medicare Advantage plans.10 Nor are they required to have an additional fee. Instead, CMS now allows telemedicine as a standard, covered benefit in all plans, enabling beneficiaries to seek care from their homes rather than requiring them to go to a health care facility.11 In the past, telemedicine was restricted for use in rural areas or when patients resided a great distance from their health care providers. Starting March 6, 2020, and for the duration of the COVID-19 public health emergency, Medicare will make payment for professional services furnished to beneficiaries in all areas of the country in all settings regardless of location or distance between the patient and the health care provider.12
In addition, since March 15, 2020, CMS has expanded access to telemedicine services for all Medicare beneficiaries—not just those who have been diagnosed with COVID-19.13 The expanded access also applies to pre-COVID-19 coverage from physician offices, skilled nursing facilities, and hospitals. This means that Medicare will now make payments to physicians for telemedicine services provided in any health care facility or in a patient’s home, so that patients do not need to go to the physician’s office.
The facts are that there are parity laws and that commercial payers and CMS are required by state law to reimburse for telemedicine—often at the same rate as that for a comparable in-person visit. On the commercial side, there has been an increase in commercial parity legislation that requires health plans to cover virtual visits in the same way they cover face-to-face services. With the new guidelines for reimbursement, every state and Washington DC has parity laws in place. (To stay abreast of state-by-state changes in virtual health reimbursement, the Center for Connected Health Policy and the Advisory Board Primer are valuable resources. See “Resources.”) As long as the provider performs and documents the elements of history and decision-making, including the time spent counseling, and documents the visit as if a face-to-face visit occurred, then clinicians have a billable evaluation and management (E&M) visit.
Continue to: Virtual services for Medicare patients...
Virtual services for Medicare patients
There are 3 main types of virtual services gynecologists can provide to Medicare patients: Medicare telehealth visits, virtual check-ins, and e-visits.
Medicare telehealth visits. Largely because of the COVID-19 pandemic, Medicare patients may now use telecommunication technology for any services that previously occurred in an in-person communication. The gynecologist must use an interactive audio and video telecommunications system that permits real-time communication between the physician and the patient, and the patient should have a prior established relationship with the gynecologist with whom the telemedicine visit is taking place. The new guidelines indicate that the US Department of Health and Human Services (HHS) will not conduct audits to ensure that such a prior relationship exists for claims submitted during this public health emergency.14
The Current Procedural Terminology (CPT) codes for virtual visits using synchronous audio/visual communication are:
- 99201-99295, Office visit for a new patient
- 99211-99215, Office visit for an established patient.
Important modifiers for telemedicine visits include:
- modifier 02 for POS (place of service) for telehealth Medicare
- modifier 95 for commercial payers.
(A list of all available CPT codes for telehealth services from CMS can be found in “Resources.”)
Virtual check-ins. Established Medicare patients may have a brief communication with gynecologists the traditional way using a telephone or via live video. These brief virtual services, usually 5 to 10 minutes in duration, are initiated by the patient. The purpose of the virtual check-in is to determine if an office visit or a test or procedure is indicated.
Medicare pays for these “virtual check-ins” (or brief communication technology-based services) for patients to communicate with their physicians and avoid unnecessary trips to the office. These brief virtual check-ins are only for established patients. If an existing patient contacts the gynecologist’s office to ask a question or determine if an office visit is necessary, the gynecologist may bill for it using code G2012.
E-visits. Established Medicare patients may have non–face-to-face patient-initiated communications with their gynecologists without going to the physician’s office. These services can be billed only when the physician has an established relationship with the patient. The services may be billed using CPT codes 99421 to 99423. Coding for these visits is determined by the length of time the gynecologist spends online with the patient:
- 99421: Online digital evaluation and management service, for an established patient 5 to 10 minutes spent on the virtual visit
- 99422: 11 to 20 minutes
- 99423: ≥ 21 minutes.
Many clinicians want to immediately start the communication process with their patients. Many will avail themselves of the free video communication offered by Google Hangouts, Skype, Facetime, and Facebook Messenger. Since the March 15, 2020, relaxation of the HIPAA restrictions for telemedicine, it is now possible to have a virtual visit with a patient using one of the free, non–HIPAA-compliant connections. This type of visit is no different than a telephone call but with an added video component. Using these free technologies, a gynecologist can have an asynchronous visit with a patient (referred to as the store and forward method of sending information or medical images), which means that the service takes place in one direction with no opportunity for interaction with the patient. Asynchronous visits are akin to video text messages left for the patient. By contrast, a synchronous or real-time video visit with a patient is a 2-way communication that provides medical care without examining the patient.
Using triangulation
There are some downsides to telemedicine visits. First, virtual visits on Skype, FaceTime, and other non–HIPAA-compliant methods are not conducted on an encrypted website. Second, no documentation is created for the doctor-patient encounter. Finally, unless the physician keeps a record of these virtual visits and submits the interactions to the practice coders, there will be no billing and no reimbursement for the visits. In this scenario, physicians are legally responsible for their decision-making, prescription writing, and medical advice, but do not receive compensation for their efforts.
This can be remedied by using “triangulation,” which involves: 1. the physician, 2. the patient, and 3. a scribe or medical assistant who will record the visit. Before initiating the virtual visit using triangulation, it is imperative to ask the patient for permission if your medical assistant (or any other person in the office who functions as a scribe) will be listening to the conversation. It is important to explain that the person is there to take accurate notes and ascertain that the notes are entered into the EHR. Also, the scribe or assistant will record the time, date, and duration of the visit, which is a requirement for billing purposes. The scribe may also ascertain that the visit is properly coded and entered into the practice management system, and that a bill is submitted to the insurance company. By using triangulation, you have documentation that consent was obtained, that the visit took place, that notes were taken, and that the patient’s insurance company will be billed for the visit (see FIGURE 2 for a sample documentation form).
Continue to: Which CPT codes should I use?...
Which CPT codes should I use?
The answer depends on a number of factors, but a good rule of thumb is to use the same codes that you would use for an in-person appointment (CPT codes 99211-99215 for an established patient visit and 99201-99205 for a new patient visit). These are the most common CPT codes for outpatient gynecologic office visits whether they take place face-to-face or as a synchronous virtual visit (via a real-time interactive audio and video telecommunications system).
For example, the reimbursement for code 99213 has a range from $73 to $100. You may wonder how you can achieve the complexity requirements for a level-3 office visit without a physical examination. Whether as a face-to-face or virtual visit, documentation for these encounters requires 2 of 3 of the following components:
- expanded problem-focused history
- expanded problem-focused exam (not accomplished with telemedicine)
- low-complexity medical decision-making OR
- at least 15 minutes spent face to face with the patient if coding is based on time.
If a gynecologist reviews the results of a recent lab test for an estrogen-deficient patient and adjusts the estrogen dosage, writes a prescription, and spends 15 minutes communicating with the patient, he/she has met the complexity requirements for a code 99213. Because Level 3 and 4 visits (99214 and 99215) require a comprehensive physical examination, it is necessary to document the time spent with the patient (code 99214 requires 25 to 39 minutes of consultation and code 99215 requires ≥ 40 minutes).
Some final billing and coding advice
Always confirm telemedicine billing guidelines before beginning to conduct telemedicine visits. Consider starting a phone call to a payer armed with the fact that the payer is required by law to offer parity between telemedicine and face-to-face visits. Then ask which specific billing codes should be used.
Until you and your practice become comfortable with the process of, and the coding and billing for, telemedicine, consider using a telemedicine platform that has a built-in rules engine that offers recommendations for each telemedicine visit based on past claims data. These systems help gynecologists determine which CPT code to use and which modifiers are appropriate for the various insurance companies. In other words, the rules engine helps you submit a clean claim that is less likely to be denied and very likely to be paid. There are some vendors who are so confident that their rules engine will match the service with the proper CPT code and modifier that they guarantee full private payer reimbursement for telemedicine visits, or the vendor will reimburse the claim.
Watch for the third and final installment in this series, which was written with the assistance of 2 attorneys. It will review the legal guidelines for implementing telemedicine in a gynecologic practice and discuss the future of the technology. ●
- COVID-19 and Telehealth Coding Options as of March 20, 2020. https://www.ismanet.org/pdf/COVID-19andTelehealthcodes3-20-2020Updates.pdf.
- Federation of State Medical Boards. US States and Territories Modifying Licensure Requirements for Physicians in Response to COVID-19. Last updated May 26, 2020. https://www.fsmb.org/siteassets/advocacy/pdf/state-emergency-declarations-licensures-requirementscovid-19.pdf.
- Center for Connected Health Policy. Current State Laws and Reimbursement Policies https://www.cchpca.org/telehealth-policy/current-state-laws-and-reimbursement-policies.
- Centers for Medicare and Medicaid Services. List of Telehealth Services. Updated April 30, 2020. https://www.cms.gov/Medicare/Medicare-General-Information/Telehealth/Telehealth-Codes.
- American Medical Association. AMA quick guide to telemedicinein practice. Updated May 22, 2020. https://www.ama-assn.org/practice-management/digital/ama-quick-guide-telemedicine-practice.
- Eddy N. Patients increasingly trusting of remote care technology. Healthcare IT News. October 22, 2019. https://www.healthcareitnews.com/news/patients-increasingly-trusting-remote-care-technology-says-new-report. Accessed May 26, 2020.
- Welch BM, Harvey J, O’Connell NS, et al. Patient preferences for direct-to-consumer telemedicine services: a nationwide survey. BMC Health Serv Res. 2017;17:784.
- Tsai JM, Cheng MJ, Tsai HH, et al. Acceptance and resistance of telehealth: the perspective of dual-factor concepts in technology adoption. Int J Inform Manag. 2019;49:34-44.
- Hollander J, Carr BG. Virtually perfect? Telemedicine for COVID-19. N Engl J Med. 2020;382:1679-1681.
- Pew Research Center. Internet and Technology. Mobile Fact Sheet. June 12, 2019. https://www.pewresearch.org /internet/fact-sheet/mobile/. Accessed May 18, 2020.
- American Medical Association. AMA quick guide to telemedicine in practice. https://www.ama-assn.org/ practice-management/digital/ama-quick-guide-telemedicine- practice. Accessed March 20, 2020.
- Center for Connected Health Policy. Federal and state regulation updates. https://www.cchpca.org. Accessed March 20, 2020.
- The White House. Proclamation on declaring a national emergency concerning the novel coronavirus disease (Covid-19) outbreak. March 13, 2020. https://www.whitehouse.gov/presidential-actions/proclamation-declaring-national-emergency-concerning-novel-coronavirus-disease-covid-19-outbreak/. Accessed May 18, 2020.
- Center for Connected Health Policy. Quick glance state telehealth actions in response to COVID-19. https://www.cchpca.org/sites/default/files/2020-05/STATE%20TELEHEALTH%20ACTIONS%20IN%20RESPONSE%20TO%20COVID%20
OVERVIEW%205.5.2020_0.pdf. AccessedMay 13, 2020. - Medicare.gov. https://www.medicare.gov/sign-up-change -plans/types-of-medicare-health-plans/medicare-advantage-plans/how-do-medicare-advantage-plans-work. Accessed May 13, 2020.
- Centers for Medicare and Medicaid Services. CMS finalizes policies to bring innovative telehealth benefit to Medicare Advantage. April 5, 2019. https://www.cms.gov/newsroom /press-releases/cms-finalizes-policies-bring-innovative-telehealth-benefit-medicare-advantage. Accessed May 18,2020.
- Centers for Medicare & Medicaid Services. Medicare telemedicine health care provider fact sheet. https://www.cms.gov/newsroom/fact-sheets/medicare-telemedicine-health-care-provider-fact-sheet. Accessed May 30, 2020.
- Centers for Medicare & Medicaid Services. Medicare telehealth frequently asked questions. https://www.cms.gov/files/document/medicare-telehealth-frequently-asked-questions-faqs-31720.pdf.
- American Hospital Association. Coronavirus update: CMS broadens access to telehealth during Covid-19 public health emergency. https://www.aha.org/advisory/2020-03-17-coronavirus-update-cms-broadens-access-telehealth-during-covid-19-public-health. Accessed May 18, 2020.

Dr. Karram is Clinical Professor of Obstetrics and Gynecology, University of Cincinnati, and Director of Urogynecology, The Christ Hospital, Cincinnati, Ohio.

Dr. Baum is Professor of Clinical Urology, Tulane Medical School, New Orleans, Louisiana.
The authors report no financial relationships relevant to this article.
Dr. Karram is Clinical Professor of Obstetrics and Gynecology, University of Cincinnati, and Director of Urogynecology, The Christ Hospital, Cincinnati, Ohio.
Dr. Baum is Professor of Clinical Urology, Tulane Medical School, New Orleans, Louisiana.
The authors report no financial relationships relevant to this article.
Since the COVID-19 pandemic began, many significant changes have occurred that have made the implementation of telemedicine easier and more attractive for gynecologic practices. In the first article in this series, we discussed the benefits of telemedicine to physicians and patients, how to get started using telemedicine, and implementing a workflow. This article will discuss the common hurdles in the process and the proper coding to use to insure reimbursement for services rendered.
Barriers to implementing telemedicine
Incorrect assumptions
Latecomers to telemedicine often assume that patients prefer face-to-face visits when, in fact, many may prefer the convenience of virtual visits. More than 50% of patients who are surveyed about their experience with telemedicine say that online tools have helped improve their relationship with their providers.1 Telemedicine has grown astronomically during the COVID-19 pandemic to the point where many patients now expect their health care providers to be able to conduct virtual visits. Practices that do not offer telemedicine may find their patients seeking services elsewhere. Nearly two-thirds of health care professionals expect their commitment to telemedicine to increase significantly in the next 3 years.2 Of those providers who have not yet adopted the practice, nearly 85% expect to implement telemedicine in the near future.3 COVID-19 has motivated the increased use of telemedicine to enhance the communication with patients, making it possible for patients to have enhanced access to health care during this pandemic while minimizing infectious transmission of COVID-19 to physicians and their staff.4
Admittedly, telemedicine is not appropriate for all patients. In general, situations that do not lend themselves to telemedicine are those for which an in-person visit is required to evaluate the patient via a physical examination, to perform a protocol-driven procedure, or provide an aggressive intervention. Additional patients for whom telemedicine may be inappropriate include those with cognitive disorders, those with language barriers, those with emergency situations that warrant an office visit or a visit to the emergency department, and patients who do not have access to the technology to conduct a virtual visit.
Cost and complexity
The process of implementing electronic health records (EHRs) left a bitter taste in the mouths of many health care professionals. But EHRs are complicated and expensive. Implementation often resulted in lost productivity. Because the learning curve was so steep, many physicians had to decrease the number of patients they saw before becoming comfortable with the conversion from paper charts to an EHR.
Telemedicine implementation is much less onerous and expensive. Telemedicine is available as a cloud-based platform, which requires less information technology (IT) support and less hardware and software. The technology required for patients to participate in telemedicine is nearly ubiquitous. According to the Pew Research Center, 96% of Americans own a cell phone (81% have a smart phone), and more than half (52%) own a tablet, so the basic equipment to connect patients to providers is already in place.5
On the provider side, the basic equipment required for a telemedicine program is a computer with video and audio capabilities and a broadband connection that is fast enough to show video in real time and to provide high-quality viewing of any images to be reviewed.
The growth in telemedicine means that telemedicine options are now more diverse, with many more affordable solutions. However, most telemedicine programs do require the purchase and set-up of new technology and equipment and the training of staff—some of which may be outside the budgets of health care providers in smaller independent practices. Many gynecologists have technology budgets that are already stretched thin. And for patients who do not have access to a smartphone or computer with Internet access, real-time telemedicine may be out of reach.
But with new guidelines put forth by the Centers for Medicare and Medicaid Services (CMS) in March 2020, connectivity can take place inexpensively using free platforms such as Google Hangouts, Skype, Facetime, and Facebook Messenger. If a non‒HIPAA-compliant platform is used initially, conversion to a HIPAA-compliant platform is recommended.6 These platforms do not require the purchase of, or subscription to, any expensive hardware or software. The disadvantages of these programs are the lack of documentation, the failure to be Health Insurance Portability and Accountability Act (HIPAA)-compliant, and the lack of encryption; however, these disadvantages are no longer an issue after the new CMS guidelines.
Depending on the magnitude of the program, IT assistance may be needed to get started. It is imperative that the telemedicine program is interoperable with the EHR and the billing program. Otherwise, double and triple entry will erase the efficiency provided by conducting a virtual visit.
Continue to: Licensing...
Licensing
Another concern or barrier is a license to participate in telemedicine. The March 15, 2020, approval of telemedicine states that physicians who are licensed in the state where the patient is located do not require any additional license or permission to conduct virtual visits.7 CMS has temporarily waived the requirement that out-of-state providers be licensed in the state where they are providing services when they are licensed in another state. For questions regarding licensure, contact your State Board of Medicine or Department of Health for information on requirements for licenses across state lines (see “Resources,” at the end of the article).
Informed consent
Just like with any other aspect of providing care for patients, obtaining informed consent is paramount. Not only is getting informed patient consent a recommended best practice of the American Telemedicine Association (ATA), but it is actually a legal requirement in many states and could be a condition of getting paid, depending on the payer. To check the requirements regarding patient consent in your state, look at The National Telehealth Policy Resource Center’s state map (see “Resources.")
Some states do not have any requirements regarding consent for a virtual visit. Others require verbal consent. Even if it is not a legal requirement in your state, consider making it a part of your practice’s policy to obtain written or verbal consent and to document in the patient’s record that consent was obtained prior to the virtual visit so that you are protected when using this new technology.
Because telemedicine is a new way of receiving care for many patients, it is important to let them know how it works including how patient confidentiality and privacy are handled, what technical equipment is required, and what they should expect in terms of scheduling, cancellations, and billing policies. A sample consent form for telemedicine use is shown in FIGURE 1.
Liability insurance
Another hurdle that must be considered is liability insurance for conducting virtual visits with patients. Gynecologists who are going to offer telemedicine care to patients should request proof in writing that their liability insurance policy covers telemedicine malpractice and that the coverage extends to other states should the patient be in another state from the state in which the gynecologist holds a license. Additionally, gynecologists who provide telemedicine care should check with liability insurers regarding any requirements or limitations to conducting a virtual visit with their patients and should document them. For example, the policy may require that the physician keep a written or recorded record of the visit in the EHR. If that is the case, then using Skype, Facebook, or Google for the virtual visit, which do not include documentation, would be less desirable.
Privacy
Certainly, there is concern about privacy, and HIPAA compliance is critical to telemedicine success. Because of the COVID-19 emergency, as of March 1, 2020, physicians may now communicate with patients, and provide telehealth services, through remote communications without penalties.8 With these changes in the HIPAA requirements, physicians may use applications that allow for video chats, including Apple FaceTime, Facebook Messenger video chat, Google Hangouts video, and Skype, to provide telehealth without risk that the Office for Civil Rights will impose a penalty for noncompliance with HIPAA rules. The consent for patients should mention that these “public” applications potentially introduce privacy risks. This is a motivation for gynecologists to consider one of the programs that promises encryption, privacy, and HIPAA compliance, such as Updox, Doxy.me, and Amazon Chime. It is also important to recognize that a virtual visit could result in colleagues (if the patient is in an office setting) or family members (if the patient is in the home environment) overhearing conversations between the health care professional and the patient. Therefore, we suggest that patients conduct virtual visits in locations in which they feel assured of some semblance of privacy.
Continue to: Compensation for telemedicine...
Compensation for telemedicine
Perhaps the biggest barrier to virtual health adoption has been compensation for telemedicine visits. Both commercial payers and CMS have been slow to enact formal policies for telemedicine reimbursement. Because of this, the common misconceptions (that providers cannot be reimbursed for telemedicine appointments or that compensation occurs at a reduced rate) have persisted, making telemedicine economically unappealing.
The good news is that this is changing; legislation in most states is quickly embracing virtual health visits as a result of the COVID-19 pandemic.9 In fact, as of January 1, 2020, telemedicine services are no longer considered “optional” coverage in Medicare Advantage plans.10 Nor are they required to have an additional fee. Instead, CMS now allows telemedicine as a standard, covered benefit in all plans, enabling beneficiaries to seek care from their homes rather than requiring them to go to a health care facility.11 In the past, telemedicine was restricted for use in rural areas or when patients resided a great distance from their health care providers. Starting March 6, 2020, and for the duration of the COVID-19 public health emergency, Medicare will make payment for professional services furnished to beneficiaries in all areas of the country in all settings regardless of location or distance between the patient and the health care provider.12
In addition, since March 15, 2020, CMS has expanded access to telemedicine services for all Medicare beneficiaries—not just those who have been diagnosed with COVID-19.13 The expanded access also applies to pre-COVID-19 coverage from physician offices, skilled nursing facilities, and hospitals. This means that Medicare will now make payments to physicians for telemedicine services provided in any health care facility or in a patient’s home, so that patients do not need to go to the physician’s office.
The facts are that there are parity laws and that commercial payers and CMS are required by state law to reimburse for telemedicine—often at the same rate as that for a comparable in-person visit. On the commercial side, there has been an increase in commercial parity legislation that requires health plans to cover virtual visits in the same way they cover face-to-face services. With the new guidelines for reimbursement, every state and Washington DC has parity laws in place. (To stay abreast of state-by-state changes in virtual health reimbursement, the Center for Connected Health Policy and the Advisory Board Primer are valuable resources. See “Resources.”) As long as the provider performs and documents the elements of history and decision-making, including the time spent counseling, and documents the visit as if a face-to-face visit occurred, then clinicians have a billable evaluation and management (E&M) visit.
Continue to: Virtual services for Medicare patients...
Virtual services for Medicare patients
There are 3 main types of virtual services gynecologists can provide to Medicare patients: Medicare telehealth visits, virtual check-ins, and e-visits.
Medicare telehealth visits. Largely because of the COVID-19 pandemic, Medicare patients may now use telecommunication technology for any services that previously occurred in an in-person communication. The gynecologist must use an interactive audio and video telecommunications system that permits real-time communication between the physician and the patient, and the patient should have a prior established relationship with the gynecologist with whom the telemedicine visit is taking place. The new guidelines indicate that the US Department of Health and Human Services (HHS) will not conduct audits to ensure that such a prior relationship exists for claims submitted during this public health emergency.14
The Current Procedural Terminology (CPT) codes for virtual visits using synchronous audio/visual communication are:
- 99201-99295, Office visit for a new patient
- 99211-99215, Office visit for an established patient.
Important modifiers for telemedicine visits include:
- modifier 02 for POS (place of service) for telehealth Medicare
- modifier 95 for commercial payers.
(A list of all available CPT codes for telehealth services from CMS can be found in “Resources.”)
Virtual check-ins. Established Medicare patients may have a brief communication with gynecologists the traditional way using a telephone or via live video. These brief virtual services, usually 5 to 10 minutes in duration, are initiated by the patient. The purpose of the virtual check-in is to determine if an office visit or a test or procedure is indicated.
Medicare pays for these “virtual check-ins” (or brief communication technology-based services) for patients to communicate with their physicians and avoid unnecessary trips to the office. These brief virtual check-ins are only for established patients. If an existing patient contacts the gynecologist’s office to ask a question or determine if an office visit is necessary, the gynecologist may bill for it using code G2012.
E-visits. Established Medicare patients may have non–face-to-face patient-initiated communications with their gynecologists without going to the physician’s office. These services can be billed only when the physician has an established relationship with the patient. The services may be billed using CPT codes 99421 to 99423. Coding for these visits is determined by the length of time the gynecologist spends online with the patient:
- 99421: Online digital evaluation and management service, for an established patient 5 to 10 minutes spent on the virtual visit
- 99422: 11 to 20 minutes
- 99423: ≥ 21 minutes.
Many clinicians want to immediately start the communication process with their patients. Many will avail themselves of the free video communication offered by Google Hangouts, Skype, Facetime, and Facebook Messenger. Since the March 15, 2020, relaxation of the HIPAA restrictions for telemedicine, it is now possible to have a virtual visit with a patient using one of the free, non–HIPAA-compliant connections. This type of visit is no different than a telephone call but with an added video component. Using these free technologies, a gynecologist can have an asynchronous visit with a patient (referred to as the store and forward method of sending information or medical images), which means that the service takes place in one direction with no opportunity for interaction with the patient. Asynchronous visits are akin to video text messages left for the patient. By contrast, a synchronous or real-time video visit with a patient is a 2-way communication that provides medical care without examining the patient.
Using triangulation
There are some downsides to telemedicine visits. First, virtual visits on Skype, FaceTime, and other non–HIPAA-compliant methods are not conducted on an encrypted website. Second, no documentation is created for the doctor-patient encounter. Finally, unless the physician keeps a record of these virtual visits and submits the interactions to the practice coders, there will be no billing and no reimbursement for the visits. In this scenario, physicians are legally responsible for their decision-making, prescription writing, and medical advice, but do not receive compensation for their efforts.
This can be remedied by using “triangulation,” which involves: 1. the physician, 2. the patient, and 3. a scribe or medical assistant who will record the visit. Before initiating the virtual visit using triangulation, it is imperative to ask the patient for permission if your medical assistant (or any other person in the office who functions as a scribe) will be listening to the conversation. It is important to explain that the person is there to take accurate notes and ascertain that the notes are entered into the EHR. Also, the scribe or assistant will record the time, date, and duration of the visit, which is a requirement for billing purposes. The scribe may also ascertain that the visit is properly coded and entered into the practice management system, and that a bill is submitted to the insurance company. By using triangulation, you have documentation that consent was obtained, that the visit took place, that notes were taken, and that the patient’s insurance company will be billed for the visit (see FIGURE 2 for a sample documentation form).
Continue to: Which CPT codes should I use?...
Which CPT codes should I use?
The answer depends on a number of factors, but a good rule of thumb is to use the same codes that you would use for an in-person appointment (CPT codes 99211-99215 for an established patient visit and 99201-99205 for a new patient visit). These are the most common CPT codes for outpatient gynecologic office visits whether they take place face-to-face or as a synchronous virtual visit (via a real-time interactive audio and video telecommunications system).
For example, the reimbursement for code 99213 has a range from $73 to $100. You may wonder how you can achieve the complexity requirements for a level-3 office visit without a physical examination. Whether as a face-to-face or virtual visit, documentation for these encounters requires 2 of 3 of the following components:
- expanded problem-focused history
- expanded problem-focused exam (not accomplished with telemedicine)
- low-complexity medical decision-making OR
- at least 15 minutes spent face to face with the patient if coding is based on time.
If a gynecologist reviews the results of a recent lab test for an estrogen-deficient patient and adjusts the estrogen dosage, writes a prescription, and spends 15 minutes communicating with the patient, he/she has met the complexity requirements for a code 99213. Because Level 3 and 4 visits (99214 and 99215) require a comprehensive physical examination, it is necessary to document the time spent with the patient (code 99214 requires 25 to 39 minutes of consultation and code 99215 requires ≥ 40 minutes).
Some final billing and coding advice
Always confirm telemedicine billing guidelines before beginning to conduct telemedicine visits. Consider starting a phone call to a payer armed with the fact that the payer is required by law to offer parity between telemedicine and face-to-face visits. Then ask which specific billing codes should be used.
Until you and your practice become comfortable with the process of, and the coding and billing for, telemedicine, consider using a telemedicine platform that has a built-in rules engine that offers recommendations for each telemedicine visit based on past claims data. These systems help gynecologists determine which CPT code to use and which modifiers are appropriate for the various insurance companies. In other words, the rules engine helps you submit a clean claim that is less likely to be denied and very likely to be paid. There are some vendors who are so confident that their rules engine will match the service with the proper CPT code and modifier that they guarantee full private payer reimbursement for telemedicine visits, or the vendor will reimburse the claim.
Watch for the third and final installment in this series, which was written with the assistance of 2 attorneys. It will review the legal guidelines for implementing telemedicine in a gynecologic practice and discuss the future of the technology. ●
- COVID-19 and Telehealth Coding Options as of March 20, 2020. https://www.ismanet.org/pdf/COVID-19andTelehealthcodes3-20-2020Updates.pdf.
- Federation of State Medical Boards. US States and Territories Modifying Licensure Requirements for Physicians in Response to COVID-19. Last updated May 26, 2020. https://www.fsmb.org/siteassets/advocacy/pdf/state-emergency-declarations-licensures-requirementscovid-19.pdf.
- Center for Connected Health Policy. Current State Laws and Reimbursement Policies https://www.cchpca.org/telehealth-policy/current-state-laws-and-reimbursement-policies.
- Centers for Medicare and Medicaid Services. List of Telehealth Services. Updated April 30, 2020. https://www.cms.gov/Medicare/Medicare-General-Information/Telehealth/Telehealth-Codes.
- American Medical Association. AMA quick guide to telemedicinein practice. Updated May 22, 2020. https://www.ama-assn.org/practice-management/digital/ama-quick-guide-telemedicine-practice.
- Eddy N. Patients increasingly trusting of remote care technology. Healthcare IT News. October 22, 2019. https://www.healthcareitnews.com/news/patients-increasingly-trusting-remote-care-technology-says-new-report. Accessed May 26, 2020.
- Welch BM, Harvey J, O’Connell NS, et al. Patient preferences for direct-to-consumer telemedicine services: a nationwide survey. BMC Health Serv Res. 2017;17:784.
- Tsai JM, Cheng MJ, Tsai HH, et al. Acceptance and resistance of telehealth: the perspective of dual-factor concepts in technology adoption. Int J Inform Manag. 2019;49:34-44.
- Hollander J, Carr BG. Virtually perfect? Telemedicine for COVID-19. N Engl J Med. 2020;382:1679-1681.
- Pew Research Center. Internet and Technology. Mobile Fact Sheet. June 12, 2019. https://www.pewresearch.org /internet/fact-sheet/mobile/. Accessed May 18, 2020.
- American Medical Association. AMA quick guide to telemedicine in practice. https://www.ama-assn.org/ practice-management/digital/ama-quick-guide-telemedicine- practice. Accessed March 20, 2020.
- Center for Connected Health Policy. Federal and state regulation updates. https://www.cchpca.org. Accessed March 20, 2020.
- The White House. Proclamation on declaring a national emergency concerning the novel coronavirus disease (Covid-19) outbreak. March 13, 2020. https://www.whitehouse.gov/presidential-actions/proclamation-declaring-national-emergency-concerning-novel-coronavirus-disease-covid-19-outbreak/. Accessed May 18, 2020.
- Center for Connected Health Policy. Quick glance state telehealth actions in response to COVID-19. https://www.cchpca.org/sites/default/files/2020-05/STATE%20TELEHEALTH%20ACTIONS%20IN%20RESPONSE%20TO%20COVID%20
OVERVIEW%205.5.2020_0.pdf. AccessedMay 13, 2020. - Medicare.gov. https://www.medicare.gov/sign-up-change -plans/types-of-medicare-health-plans/medicare-advantage-plans/how-do-medicare-advantage-plans-work. Accessed May 13, 2020.
- Centers for Medicare and Medicaid Services. CMS finalizes policies to bring innovative telehealth benefit to Medicare Advantage. April 5, 2019. https://www.cms.gov/newsroom /press-releases/cms-finalizes-policies-bring-innovative-telehealth-benefit-medicare-advantage. Accessed May 18,2020.
- Centers for Medicare & Medicaid Services. Medicare telemedicine health care provider fact sheet. https://www.cms.gov/newsroom/fact-sheets/medicare-telemedicine-health-care-provider-fact-sheet. Accessed May 30, 2020.
- Centers for Medicare & Medicaid Services. Medicare telehealth frequently asked questions. https://www.cms.gov/files/document/medicare-telehealth-frequently-asked-questions-faqs-31720.pdf.
- American Hospital Association. Coronavirus update: CMS broadens access to telehealth during Covid-19 public health emergency. https://www.aha.org/advisory/2020-03-17-coronavirus-update-cms-broadens-access-telehealth-during-covid-19-public-health. Accessed May 18, 2020.

How to perform a vulvar biopsy
Many benign, premalignant, and malignant lesions can occur on the vulva. These can be challenging to differentiate by examination alone. A vulvar biopsy often is needed to appropriately diagnose—and ultimately treat—these various conditions.
In this article, we review vulvar biopsy procedures, describe how to prepare tissue specimens for the pathologist, and provide some brief case examples in which biopsy established the diagnosis.
Ask questions first
Prior to examining a patient with a vulvar lesion, obtain a detailed history. Asking specific questions may aid in making the correct diagnosis, such as:
- How long has the lesion been present? Has it changed? What color is it?
- Was any trigger, or trauma, associated with onset of the lesion?
- Does the lesion itch, burn, or cause pain? Is there any associated bleeding or discharge?
- Are other lesions present in the vagina, anus, or mouth, or are other skin lesions present?
- Are any systemic symptoms present, such as fever, lymphadenopathy, weight loss, or joint pain?
- What is the patient’s previous treatment history, including over-the-counter medications and prescribed medications?
- Has there been any incontinence of urine or stool? Does the patient use a pad?
- Is the patient scratching? Is there any nighttime scratching? It also can be useful to ask her partner, if she has one, about nighttime scratching.
- Is there a family history of vulvar conditions?
- Has there been any change in her use of products like soap, lotions, cleansing wipes, sprays, lubricants, or laundry detergent?
- Has the patient had any new partners or significant travel history?
Preprocedure counseling points
Prior to proceeding with a vulvar biopsy, review with the patient the risks, benefits, and alternatives and obtain patient consent for the procedure. Vulvar biopsy risks include pain, bleeding, infection, injury to surrounding tissue, and the need for further surgery. Make patients aware that some biopsies are nondiagnostic. We recommend that clinicians perform a time-out verification to ensure that the patient’s identity and planned procedure are correct.
Assess the biopsy site
A wide variety of lesions may require a biopsy for diagnosis. While it can be challenging to know where to biopsy, taking the time to determine the proper biopsy site may enhance pathology results.
When considering colored lesions, depth is the important factor, and a punch biopsy often is sufficient. A tumor should be biopsied in the thickest area. Lesions that are concerning for malignancy may require multiple biopsies. An erosion or ulcer is best biopsied on the edge, including a small amount of surrounding tissue. For most patients, biopsy of normal-appearing tissue is of low diagnostic yield. Lastly, we try to avoid biopsies directly on the midline to facilitate better healing.1
A photograph of the vulva prior to biopsy may be helpful for the pathologist to see the tissue. Some electronic medical records have the capability to include photographs. Due to the sensitive nature of these photographs, we prefer that a separate written patient consent be obtained prior to taking photographs. We find also that photos are a useful reference for progression of disease at follow-up in a shared care team.
Continue to: Anesthesia procedure and instrument kit...
Anesthesia procedure and instrument kit
Some patients may benefit from the application of topical lidocaine 4% cream (L.M.X.4) prior to the injection of a local anesthetic for tissue biopsy. Ideally, topical lidocaine should be placed on the vulva and covered with a dressing such as Tegaderm or cellophane up to 30 minutes before the anticipated biopsy procedure. The anesthetic effect generally lasts for about 60 minutes. Many patients report stinging for several seconds upon application. Due to clinic time restrictions, we tend to reserve this method for a limited subset of patients. If planning a return visit for a biopsy, the patient can place the topical anesthetic herself.
For the anesthetic injection, we recommend lidocaine 1% or 2% with epinephrine in all areas of the vulva except for the glans clitoris. For a punch biopsy, we draw up 1 to 3 mL in a 3-mL syringe and inject with a 21- to 30-gauge needle, using a lower gauge for thicker tissue. We have not found buffering the anesthetic with sodium bicarbonate to be of particular use. For the glans clitoris, lidocaine without epinephrine should be utilized.
Equipment. Depending on your office setting, having a premade instrument kit may be preferred to peel-pack equipment. We prefer a premade tray that contains sterile gauze, a hemostat, iris scissors, a needle driver, a scalpel handle, and Adson forceps (FIGURE 1).

Types of biopsy procedures
Punch biopsy. We recommend a 4-mm Keyes biopsy punch. As mentioned, we use a biopsy kit to facilitate the procedure. After the tissue is properly anesthetized and prepped, we test the area via gentle touch to the skin with the hemostat or Adson forceps. To perform the punch biopsy, gentle, consistent pressure in a clockwise-counterclockwise fashion yields the best results. The goal is to obtain a 5-mm depth for hair-bearing skin and a 3-mm depth for all other tissue.2 The tissue should then be excised at the base with scissors, taking care not to crush the specimen with forceps.
Punch biopsy permits sampling of the epidermis, dermis, and subcutaneous tissue. Hemostasis is maintained with either silver nitrate, Monsel’s solution (ferric sulfate), or a dissolvable suture such as 4-0 Monocryl (poliglecaprone 25) or Vicryl Rapide (polyglactin 910).
Stitch biopsy. We find the stitch biopsy to be very useful given the architecture of the vulva. A modification of the shave biopsy, the stitch biopsy is depicted in FIGURE 2. A 3-0 or 4-0 dissolvable suture is placed through the intended area of biopsy. Iris scissors are used to undermine the tissue while the suture is held on tension. The goal is to remove the suture with the specimen. Separate sutures are used for hemostasis. The stitch does not cause the crushing artifacts on prepared specimens. Depending on the proceduralist’s comfort, a relatively large sample can be obtained in this fashion. If the suture held on tension is inadvertently cut, a second pass can be made with suture; alternatively, care can be used to remove remaining tissue with forceps and scissors, again avoiding crush injury to the tissue.

Excisional biopsy. Often, a larger area or margins are desired. We find that with adequate preparation, patients tolerate excisions in the office quite well. The planned area for excision can be marked with ink to ensure margins. Adequate anesthesia is instilled. A No. 15 blade scalpel is often the best size used to excise vulvar tissue in an elliptical fashion. Depending on depth of incision, the tissue may need to be approximated in layers for cosmesis and healing.
When planning an excisional biopsy, place a stitch on the excised tissue to mark orientation or pin out the entire specimen to a foam board to help your pathologist interpret tissue orientation.
The box "Vulvar biopsy established the diagnosis" at the end of this discussion provides 6 case examples of vulvar lesions and the respective diagnoses confirmed by biopsy.
Continue to: Preparing tissue for the pathologist...
Preparing tissue for the pathologist
Here are 5 tips for preparing the biopsied specimen for pathology:
- Include a question for the pathologist, such as “rule out lichen sclerosus or lichen simplex chronicus.” The majority of specimens should be sent in formalin. At times, frozen sections are done in the operating room.
- Double-check that the proper paperwork is included with every specimen and be very specific regarding the exact location of the lesion on the vulva. Include photographs whenever possible.
- Request that a dermatopathologist or a gynecologic pathologist with a special interest in vulvar dermatology, when feasible, review the tissue.
- Check your laboratory’s protocol for sending biopsies from areas around ulcerated tissue. Often, special medium is required for immunohistochemistry stains.
- Call your pathologist with questions about results; he or she often is happy to clarify, and together you may be able to arrive at a diagnosis to better serve your patient.3
Complications and how to avoid them
Bleeding. Any procedure has bleeding risks. To avoid bleeding, review the patient’s medication list and medical history prior to biopsy, as certain medications, such as blood thinners, increase risk for bleeding. Counseling a patient on applying direct pressure to the biopsy site for 2 minutes is generally sufficient for any bleeding that may occur once she is discharged from the clinic.
Infection. With aseptic technique, infection of a biopsy site is rare. We use nonsterile gloves for biopsy procedures. This does not increase the risk of infection.4 If a patient has iodine allergy, dilute chlorhexidine is a reasonable alternative for skin cleansing. Instruct the patient to keep the site clean and dry; if the biopsy proximity is close to the urethra or anus, use of a peri-bottle may be preferred after toileting. Instruct patients not to pull sutures. While instructions are specific for each patient, we generally advise that patients wait 4 to 7 days before resuming use of topical medications.
Scarring or tattooing. Avoid using dyed suture on skin surfaces and counsel the patient that silver nitrate can permanently stain tissue. Usually, small biopsies heal well but a small scar is possible.
Key points to keep in mind
- Counsel patients on biopsy risks, benefits, and alternatives. Counsel regarding possible inconclusive results.
- Take time in choosing the biopsy site and consider multiple biopsies.
- Have all anticipated equipment available; consider using premade biopsy kits.
- Consider performing a stitch biopsy to avoid crush injury.
- Take photographs of the area to be biopsied and communicate with your pathologist to facilitate diagnosis.
Case 1

Biopsies were obtained of the areas highlighted in the photo. Pathology shows dVIN.
Image courtesy of Hope Haefner, MD.
Case 2
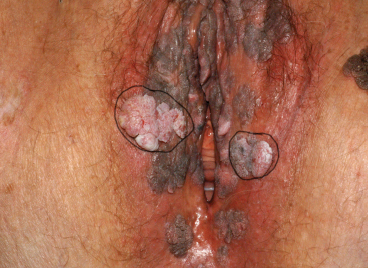
The examination is consistent with condylomata acuminata and biopsy is recommended with a 4-mm punch. Biopsy results are consistent with condylomata acuminata.
Image courtesy of Hope Haefner, MD.
Case 3
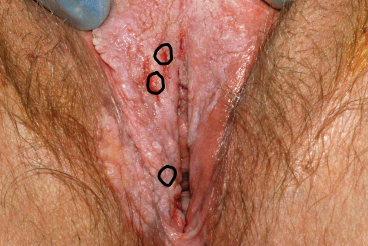
The final pathology shows high-grade squamous intraepithelial lesions (HSIL) of the vulva.
Image courtesy of Hope Haefner, MD.
Case 4
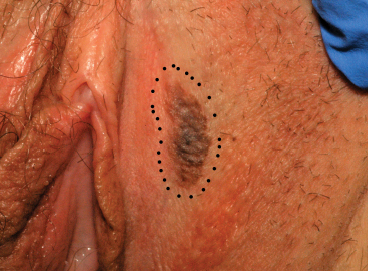
This presentation is an excellent opportunity for an excisional biopsy of the vulva. A marking pen is used to draw margins. A No. 15 blade is used to outline and then undermine the lesion, removing it in its entirety.
Final pathology shows a compound nevus of the vulva.
Image courtesy of Hope Haefner, MD.
Case 5

A 4-mm punch biopsy result is consistent with a diagnosis of lichen sclerosus.
Image courtesy of Hope Haefner, MD.
Case 6

A 4-mm punch biopsy result reveals that the pathology is significant for squamous cell carcinoma.
Image courtesy of Hope Haefner, MD.
- Edwards L, Lynch PJ. Genital Dermatology Atlas and Manual. 3rd ed. Philadelphia, PA: Wolters Kluwer; 2018.
- American College of Obstetricians and Gynecologists. Practice bulletin no. 93: Diagnosis and management of vulvar skin disorders. Obstet Gynecol. 2008;111:1243-1253.
- Heller DS. Areas of confusion in pathologist-clinician communication as it relates to understanding the vulvar pathology report. J Low Genit Tract Dis. 2017;21:327-328.
- Rietz A, Barzin A, Jones K, et al. Sterile or non-sterile gloves for minor skin excisions? J Fam Pract. 2015;64:723-727.

Dr. Welch is Clinical Assistant Professor of Obstetrics and Gynecology, University of Michigan, Ann Arbor.

Dr. Haefner is Harold A. Furlong Professor of Women’s Health, University of Michigan, Ann Arbor.

Dr. Saunders is Clinical Assistant Professor of Obstetrics and Gynecology, University of Michigan, Ann Arbor.
The authors report no financial relationships relevant to this article.
Dr. Welch is Clinical Assistant Professor of Obstetrics and Gynecology, University of Michigan, Ann Arbor.
Dr. Haefner is Harold A. Furlong Professor of Women’s Health, University of Michigan, Ann Arbor.
Dr. Saunders is Clinical Assistant Professor of Obstetrics and Gynecology, University of Michigan, Ann Arbor.
The authors report no financial relationships relevant to this article.
Many benign, premalignant, and malignant lesions can occur on the vulva. These can be challenging to differentiate by examination alone. A vulvar biopsy often is needed to appropriately diagnose—and ultimately treat—these various conditions.
In this article, we review vulvar biopsy procedures, describe how to prepare tissue specimens for the pathologist, and provide some brief case examples in which biopsy established the diagnosis.
Ask questions first
Prior to examining a patient with a vulvar lesion, obtain a detailed history. Asking specific questions may aid in making the correct diagnosis, such as:
- How long has the lesion been present? Has it changed? What color is it?
- Was any trigger, or trauma, associated with onset of the lesion?
- Does the lesion itch, burn, or cause pain? Is there any associated bleeding or discharge?
- Are other lesions present in the vagina, anus, or mouth, or are other skin lesions present?
- Are any systemic symptoms present, such as fever, lymphadenopathy, weight loss, or joint pain?
- What is the patient’s previous treatment history, including over-the-counter medications and prescribed medications?
- Has there been any incontinence of urine or stool? Does the patient use a pad?
- Is the patient scratching? Is there any nighttime scratching? It also can be useful to ask her partner, if she has one, about nighttime scratching.
- Is there a family history of vulvar conditions?
- Has there been any change in her use of products like soap, lotions, cleansing wipes, sprays, lubricants, or laundry detergent?
- Has the patient had any new partners or significant travel history?
Preprocedure counseling points
Prior to proceeding with a vulvar biopsy, review with the patient the risks, benefits, and alternatives and obtain patient consent for the procedure. Vulvar biopsy risks include pain, bleeding, infection, injury to surrounding tissue, and the need for further surgery. Make patients aware that some biopsies are nondiagnostic. We recommend that clinicians perform a time-out verification to ensure that the patient’s identity and planned procedure are correct.
Assess the biopsy site
A wide variety of lesions may require a biopsy for diagnosis. While it can be challenging to know where to biopsy, taking the time to determine the proper biopsy site may enhance pathology results.
When considering colored lesions, depth is the important factor, and a punch biopsy often is sufficient. A tumor should be biopsied in the thickest area. Lesions that are concerning for malignancy may require multiple biopsies. An erosion or ulcer is best biopsied on the edge, including a small amount of surrounding tissue. For most patients, biopsy of normal-appearing tissue is of low diagnostic yield. Lastly, we try to avoid biopsies directly on the midline to facilitate better healing.1
A photograph of the vulva prior to biopsy may be helpful for the pathologist to see the tissue. Some electronic medical records have the capability to include photographs. Due to the sensitive nature of these photographs, we prefer that a separate written patient consent be obtained prior to taking photographs. We find also that photos are a useful reference for progression of disease at follow-up in a shared care team.
Continue to: Anesthesia procedure and instrument kit...
Anesthesia procedure and instrument kit
Some patients may benefit from the application of topical lidocaine 4% cream (L.M.X.4) prior to the injection of a local anesthetic for tissue biopsy. Ideally, topical lidocaine should be placed on the vulva and covered with a dressing such as Tegaderm or cellophane up to 30 minutes before the anticipated biopsy procedure. The anesthetic effect generally lasts for about 60 minutes. Many patients report stinging for several seconds upon application. Due to clinic time restrictions, we tend to reserve this method for a limited subset of patients. If planning a return visit for a biopsy, the patient can place the topical anesthetic herself.
For the anesthetic injection, we recommend lidocaine 1% or 2% with epinephrine in all areas of the vulva except for the glans clitoris. For a punch biopsy, we draw up 1 to 3 mL in a 3-mL syringe and inject with a 21- to 30-gauge needle, using a lower gauge for thicker tissue. We have not found buffering the anesthetic with sodium bicarbonate to be of particular use. For the glans clitoris, lidocaine without epinephrine should be utilized.
Equipment. Depending on your office setting, having a premade instrument kit may be preferred to peel-pack equipment. We prefer a premade tray that contains sterile gauze, a hemostat, iris scissors, a needle driver, a scalpel handle, and Adson forceps (FIGURE 1).
Types of biopsy procedures
Punch biopsy. We recommend a 4-mm Keyes biopsy punch. As mentioned, we use a biopsy kit to facilitate the procedure. After the tissue is properly anesthetized and prepped, we test the area via gentle touch to the skin with the hemostat or Adson forceps. To perform the punch biopsy, gentle, consistent pressure in a clockwise-counterclockwise fashion yields the best results. The goal is to obtain a 5-mm depth for hair-bearing skin and a 3-mm depth for all other tissue.2 The tissue should then be excised at the base with scissors, taking care not to crush the specimen with forceps.
Punch biopsy permits sampling of the epidermis, dermis, and subcutaneous tissue. Hemostasis is maintained with either silver nitrate, Monsel’s solution (ferric sulfate), or a dissolvable suture such as 4-0 Monocryl (poliglecaprone 25) or Vicryl Rapide (polyglactin 910).
Stitch biopsy. We find the stitch biopsy to be very useful given the architecture of the vulva. A modification of the shave biopsy, the stitch biopsy is depicted in FIGURE 2. A 3-0 or 4-0 dissolvable suture is placed through the intended area of biopsy. Iris scissors are used to undermine the tissue while the suture is held on tension. The goal is to remove the suture with the specimen. Separate sutures are used for hemostasis. The stitch does not cause the crushing artifacts on prepared specimens. Depending on the proceduralist’s comfort, a relatively large sample can be obtained in this fashion. If the suture held on tension is inadvertently cut, a second pass can be made with suture; alternatively, care can be used to remove remaining tissue with forceps and scissors, again avoiding crush injury to the tissue.
Excisional biopsy. Often, a larger area or margins are desired. We find that with adequate preparation, patients tolerate excisions in the office quite well. The planned area for excision can be marked with ink to ensure margins. Adequate anesthesia is instilled. A No. 15 blade scalpel is often the best size used to excise vulvar tissue in an elliptical fashion. Depending on depth of incision, the tissue may need to be approximated in layers for cosmesis and healing.
When planning an excisional biopsy, place a stitch on the excised tissue to mark orientation or pin out the entire specimen to a foam board to help your pathologist interpret tissue orientation.
The box "Vulvar biopsy established the diagnosis" at the end of this discussion provides 6 case examples of vulvar lesions and the respective diagnoses confirmed by biopsy.
Continue to: Preparing tissue for the pathologist...
Preparing tissue for the pathologist
Here are 5 tips for preparing the biopsied specimen for pathology:
- Include a question for the pathologist, such as “rule out lichen sclerosus or lichen simplex chronicus.” The majority of specimens should be sent in formalin. At times, frozen sections are done in the operating room.
- Double-check that the proper paperwork is included with every specimen and be very specific regarding the exact location of the lesion on the vulva. Include photographs whenever possible.
- Request that a dermatopathologist or a gynecologic pathologist with a special interest in vulvar dermatology, when feasible, review the tissue.
- Check your laboratory’s protocol for sending biopsies from areas around ulcerated tissue. Often, special medium is required for immunohistochemistry stains.
- Call your pathologist with questions about results; he or she often is happy to clarify, and together you may be able to arrive at a diagnosis to better serve your patient.3
Complications and how to avoid them
Bleeding. Any procedure has bleeding risks. To avoid bleeding, review the patient’s medication list and medical history prior to biopsy, as certain medications, such as blood thinners, increase risk for bleeding. Counseling a patient on applying direct pressure to the biopsy site for 2 minutes is generally sufficient for any bleeding that may occur once she is discharged from the clinic.
Infection. With aseptic technique, infection of a biopsy site is rare. We use nonsterile gloves for biopsy procedures. This does not increase the risk of infection.4 If a patient has iodine allergy, dilute chlorhexidine is a reasonable alternative for skin cleansing. Instruct the patient to keep the site clean and dry; if the biopsy proximity is close to the urethra or anus, use of a peri-bottle may be preferred after toileting. Instruct patients not to pull sutures. While instructions are specific for each patient, we generally advise that patients wait 4 to 7 days before resuming use of topical medications.
Scarring or tattooing. Avoid using dyed suture on skin surfaces and counsel the patient that silver nitrate can permanently stain tissue. Usually, small biopsies heal well but a small scar is possible.
Key points to keep in mind
- Counsel patients on biopsy risks, benefits, and alternatives. Counsel regarding possible inconclusive results.
- Take time in choosing the biopsy site and consider multiple biopsies.
- Have all anticipated equipment available; consider using premade biopsy kits.
- Consider performing a stitch biopsy to avoid crush injury.
- Take photographs of the area to be biopsied and communicate with your pathologist to facilitate diagnosis.
Case 1
Biopsies were obtained of the areas highlighted in the photo. Pathology shows dVIN.
Image courtesy of Hope Haefner, MD.
Case 2
The examination is consistent with condylomata acuminata and biopsy is recommended with a 4-mm punch. Biopsy results are consistent with condylomata acuminata.
Image courtesy of Hope Haefner, MD.
Case 3
The final pathology shows high-grade squamous intraepithelial lesions (HSIL) of the vulva.
Image courtesy of Hope Haefner, MD.
Case 4
This presentation is an excellent opportunity for an excisional biopsy of the vulva. A marking pen is used to draw margins. A No. 15 blade is used to outline and then undermine the lesion, removing it in its entirety.
Final pathology shows a compound nevus of the vulva.
Image courtesy of Hope Haefner, MD.
Case 5
A 4-mm punch biopsy result is consistent with a diagnosis of lichen sclerosus.
Image courtesy of Hope Haefner, MD.
Case 6
A 4-mm punch biopsy result reveals that the pathology is significant for squamous cell carcinoma.
Image courtesy of Hope Haefner, MD.
- Edwards L, Lynch PJ. Genital Dermatology Atlas and Manual. 3rd ed. Philadelphia, PA: Wolters Kluwer; 2018.
- American College of Obstetricians and Gynecologists. Practice bulletin no. 93: Diagnosis and management of vulvar skin disorders. Obstet Gynecol. 2008;111:1243-1253.
- Heller DS. Areas of confusion in pathologist-clinician communication as it relates to understanding the vulvar pathology report. J Low Genit Tract Dis. 2017;21:327-328.
- Rietz A, Barzin A, Jones K, et al. Sterile or non-sterile gloves for minor skin excisions? J Fam Pract. 2015;64:723-727.