User login
Isolated iliac disease a marker for better health status?
CHICAGO – Surgery and endovascular treatment for peripheral artery disease (PAD) among patients with claudication improves health status more in the setting of isolated iliac disease and multilevel disease than in other forms of PAD, which suggests that vascular specialists should give pause before pursuing interventions on superficial femoral and infrapopliteal artery lesions, a researcher of the PORTRAIT registry reported at the annual meeting of the Midwestern Vascular Surgery Society.

“Our analysis demonstrated that interventions for aortoiliac disease and multilevel disease appeared to improve overall health status more over time compared to femoral-popliteal disease and infrapopliteal disease,” said Todd R. Vogel, MD, of the University of Missouri Health System in Columbia.
The study evaluated improvement in Peripheral Artery Questionnaire (PAQ) scores from baseline to post intervention in 623 patients in the PORTRAIT (Patient-Centered Outcomes Related to Treatment Practices in Peripheral Arterial Disease: Investigating Trajectories) registry. The patients were selected and combined with anatomic data on the nature of their claudication. Aortoiliac-only (AI) disease represented 20.4% (n = 127) of the study group, femoral-popliteal-only (FP) 35.5% (n = 221), infrapopliteal/distal (IP) 6.3% (n = 39), and multilevel disease (ML) 37.9% (n = 236).
In terms of demographics, patients in the AI group tended to be younger (average age of 61.2 years vs. 66.6 years for the study overall; P less than .001) and had a higher rate of smokers (96.1% former and current smokers vs. 90.7% overall; P less than .001). Otherwise, Dr. Vogel noted, demographics, smoking status, and severity of claudication were similar across the disease groups.
Rates of medical intervention were similar in the AI and ML disease groups, which were primarily endovascular procedures: 26% and 27%, respectively. The AI group had the highest rates of endovascular interventions, at 24%, with the FP group at 15%, IP at 11% and ML at 21%. Those who did not have surgery or endovascular aneurysm repair were treated medically.
“The AI group did significantly better at 3 months than the other groups,” Dr. Vogel pointed out, noting that at 12 months those patients had an average PAQ score of around 78 versus scores of around 75 for FP, 74 for IP, and 70 for ML.
“In the AI group, there’s also an immediate increase in quality of life that is sustained over time,” he said. At 3 months, PAQ scores in AI patients who had endovascular aneurysm repair increased 41 points over baseline, leveling off to a 38.8-point gain at 12 months, the highest gains across all disease groups and all treatment categories.
“However,” Dr. Vogel added, “the group with ML disease probably was the most improved over time on the PAQ scores,” he said, explaining that across the board, this group had lower baseline PAQ scores than all the other groups.
“No significant benefits were found with intervention versus medical management for FP and IP,” he said. “This suggests that intervention should be considered after medical management has been exhausted.”
Dr. Vogel also said the findings support aggressive treatment of AI and ML for symptomatic claudication. “This anatomic region represents the greatest potential benefit for improving overall health status in patients with symptomatic PAD,” he said.
Dr. Vogel had no relevant financial relationships to disclose.
CHICAGO – Surgery and endovascular treatment for peripheral artery disease (PAD) among patients with claudication improves health status more in the setting of isolated iliac disease and multilevel disease than in other forms of PAD, which suggests that vascular specialists should give pause before pursuing interventions on superficial femoral and infrapopliteal artery lesions, a researcher of the PORTRAIT registry reported at the annual meeting of the Midwestern Vascular Surgery Society.
“Our analysis demonstrated that interventions for aortoiliac disease and multilevel disease appeared to improve overall health status more over time compared to femoral-popliteal disease and infrapopliteal disease,” said Todd R. Vogel, MD, of the University of Missouri Health System in Columbia.
The study evaluated improvement in Peripheral Artery Questionnaire (PAQ) scores from baseline to post intervention in 623 patients in the PORTRAIT (Patient-Centered Outcomes Related to Treatment Practices in Peripheral Arterial Disease: Investigating Trajectories) registry. The patients were selected and combined with anatomic data on the nature of their claudication. Aortoiliac-only (AI) disease represented 20.4% (n = 127) of the study group, femoral-popliteal-only (FP) 35.5% (n = 221), infrapopliteal/distal (IP) 6.3% (n = 39), and multilevel disease (ML) 37.9% (n = 236).
In terms of demographics, patients in the AI group tended to be younger (average age of 61.2 years vs. 66.6 years for the study overall; P less than .001) and had a higher rate of smokers (96.1% former and current smokers vs. 90.7% overall; P less than .001). Otherwise, Dr. Vogel noted, demographics, smoking status, and severity of claudication were similar across the disease groups.
Rates of medical intervention were similar in the AI and ML disease groups, which were primarily endovascular procedures: 26% and 27%, respectively. The AI group had the highest rates of endovascular interventions, at 24%, with the FP group at 15%, IP at 11% and ML at 21%. Those who did not have surgery or endovascular aneurysm repair were treated medically.
“The AI group did significantly better at 3 months than the other groups,” Dr. Vogel pointed out, noting that at 12 months those patients had an average PAQ score of around 78 versus scores of around 75 for FP, 74 for IP, and 70 for ML.
“In the AI group, there’s also an immediate increase in quality of life that is sustained over time,” he said. At 3 months, PAQ scores in AI patients who had endovascular aneurysm repair increased 41 points over baseline, leveling off to a 38.8-point gain at 12 months, the highest gains across all disease groups and all treatment categories.
“However,” Dr. Vogel added, “the group with ML disease probably was the most improved over time on the PAQ scores,” he said, explaining that across the board, this group had lower baseline PAQ scores than all the other groups.
“No significant benefits were found with intervention versus medical management for FP and IP,” he said. “This suggests that intervention should be considered after medical management has been exhausted.”
Dr. Vogel also said the findings support aggressive treatment of AI and ML for symptomatic claudication. “This anatomic region represents the greatest potential benefit for improving overall health status in patients with symptomatic PAD,” he said.
Dr. Vogel had no relevant financial relationships to disclose.
CHICAGO – Surgery and endovascular treatment for peripheral artery disease (PAD) among patients with claudication improves health status more in the setting of isolated iliac disease and multilevel disease than in other forms of PAD, which suggests that vascular specialists should give pause before pursuing interventions on superficial femoral and infrapopliteal artery lesions, a researcher of the PORTRAIT registry reported at the annual meeting of the Midwestern Vascular Surgery Society.
“Our analysis demonstrated that interventions for aortoiliac disease and multilevel disease appeared to improve overall health status more over time compared to femoral-popliteal disease and infrapopliteal disease,” said Todd R. Vogel, MD, of the University of Missouri Health System in Columbia.
The study evaluated improvement in Peripheral Artery Questionnaire (PAQ) scores from baseline to post intervention in 623 patients in the PORTRAIT (Patient-Centered Outcomes Related to Treatment Practices in Peripheral Arterial Disease: Investigating Trajectories) registry. The patients were selected and combined with anatomic data on the nature of their claudication. Aortoiliac-only (AI) disease represented 20.4% (n = 127) of the study group, femoral-popliteal-only (FP) 35.5% (n = 221), infrapopliteal/distal (IP) 6.3% (n = 39), and multilevel disease (ML) 37.9% (n = 236).
In terms of demographics, patients in the AI group tended to be younger (average age of 61.2 years vs. 66.6 years for the study overall; P less than .001) and had a higher rate of smokers (96.1% former and current smokers vs. 90.7% overall; P less than .001). Otherwise, Dr. Vogel noted, demographics, smoking status, and severity of claudication were similar across the disease groups.
Rates of medical intervention were similar in the AI and ML disease groups, which were primarily endovascular procedures: 26% and 27%, respectively. The AI group had the highest rates of endovascular interventions, at 24%, with the FP group at 15%, IP at 11% and ML at 21%. Those who did not have surgery or endovascular aneurysm repair were treated medically.
“The AI group did significantly better at 3 months than the other groups,” Dr. Vogel pointed out, noting that at 12 months those patients had an average PAQ score of around 78 versus scores of around 75 for FP, 74 for IP, and 70 for ML.
“In the AI group, there’s also an immediate increase in quality of life that is sustained over time,” he said. At 3 months, PAQ scores in AI patients who had endovascular aneurysm repair increased 41 points over baseline, leveling off to a 38.8-point gain at 12 months, the highest gains across all disease groups and all treatment categories.
“However,” Dr. Vogel added, “the group with ML disease probably was the most improved over time on the PAQ scores,” he said, explaining that across the board, this group had lower baseline PAQ scores than all the other groups.
“No significant benefits were found with intervention versus medical management for FP and IP,” he said. “This suggests that intervention should be considered after medical management has been exhausted.”
Dr. Vogel also said the findings support aggressive treatment of AI and ML for symptomatic claudication. “This anatomic region represents the greatest potential benefit for improving overall health status in patients with symptomatic PAD,” he said.
Dr. Vogel had no relevant financial relationships to disclose.
REPORTING FROM MIDWESTERN VASCULAR 2019

National HPV vaccination rates among teens according to provider recommendation


Romosozumab benefits prevail, despite renal insufficiency
ORLANDO – Use of romosozumab (Evenity) by patients with osteoporosis in various stages of renal insufficiency did not appear to affect increases in bone mineral density, the rate of new vertebral fractures, or the number of adverse events when compared with placebo, Paul D. Miller, MD, said at the annual meeting of the American Society for Bone and Mineral Research.
“Romosozumab could be considered a treatment option for osteoporotic patients with mild to moderate reductions in renal function,” said Dr. Miller, distinguished clinical professor of medicine at the University of Colorado at Denver, Aurora.
Since bisphosphonates are not recommended for use in patients with an estimated glomerular filtration rate (eGFR) of less than 30 or 35 mL/min/1.73 m2, other osteoporosis treatments such as romosozumab should also be examined. “It is important to evaluate other osteoporosis treatments in this setting, particularly in the context of monoclonal antibodies, which are not cleared in the kidneys and are metabolized in the reticular endothelial system, and have no FDA ... cut-off for their use,” Dr. Miller said.
Dr. Miller and colleagues performed a post hoc analysis of patients in the FRAME study, which enrolled 3,589 patients who received a monthly dose of subcutaneous romosozumab (215 mg) and 3,591 patients who received placebo in a double-blinded study for 12 months before moving to a 12-month, open-label portion of the study where all patients received 60 mg of subcutaneous denosumab every 6 months. After 12 months, the researchers analyzed the least squares mean (LSM) percentage change in bone mineral density (BMD) at the total hip, lumbar spine, and femoral neck as well as whether patients had any new vertebral fractures or experienced adverse events from treatment.
Patients were postmenopausal women between ages 55 and 90 years with a BMD T-score between –2.5 and –3.5 at the total hip or femoral neck. Researchers divided patients into four eGFR groups based chronic kidney disease (CKD) stage: normal (90 mL/min/1.73 m2 or higher; 848 patients), mild CKD (60-89 mL/min/1.73 m2; 4,939 patients), moderate CKD (30-59 mL/min/1.73 m2; 1,360 patients), and severe (15-29 mL/min/1.73 m2; 18 patients).
The LSM percentage change was 13.1% in the lumbar spine (95% confidence interval, 12.8%-13.3%) for the romosozumab group, compared with 0.4% in the placebo group (95% CI, 0.2%-0.5%). The LSM percentage change for total hip was 6.0% in the romosozumab group (95% CI, 5.9%-6.2%), compared with 0.3% in the placebo group (95% CI, 0.1%-0.4%), while the LSM percentage change for the femoral neck was 5.5% in the romosozumab group (95% CI, 5.2%-5.7%) and 0.3% in the placebo group (0.1%-0.5%).
“[The] risk of new vertebral fractures was decreased in all eGFR subgroups and did not appear to be affected by eGFR level,” he said.
Specifically, vertebral fracture incidence was 0.5% in the romosozumab group, compared with 3.0% in the placebo group, for patients with normal renal function, 0.4% in the romosozumab group, compared with 1.5% in the placebo group, for patients with mild chronic kidney disease, and 0.6% in the romosozumab group vs. 2.1% in the placebo group for patients with moderate chronic kidney disease. The incidence of adverse events, serious adverse events, and positively adjudicated cardiovascular events were similar between patients in the romosozumab group regardless of renal function status. The researchers reported 1 patient in the romosozumab group who experienced grade 2 hypocalcemia, and 14 patients in the romosozumab group who experienced mild to moderate decreases in calcium, compared with 4 patients in the placebo group.
Dr. Miller noted the study was limited by having few patients with an eGFR of less than 30 mL/min/1.73 m2 and no patients with an eGFR of less than 15 mL/min/1.73 m2, but said the study strengths were its large randomized nature and well-balanced baseline characteristics between each group.
This study was sponsored in part by Amgen, Astellas, and UCB Pharma. Dr. Miller reported receiving grants from Alexion, Amgen, Radius, Regeneron, UCB, and Ultragenyx. Amgen and UCB assisted in and provided financial assistance for the preparation of Dr. Miller’s presentation.
SOURCE: Miller P et al. ASBMR 2019. Abstract 1085.
ORLANDO – Use of romosozumab (Evenity) by patients with osteoporosis in various stages of renal insufficiency did not appear to affect increases in bone mineral density, the rate of new vertebral fractures, or the number of adverse events when compared with placebo, Paul D. Miller, MD, said at the annual meeting of the American Society for Bone and Mineral Research.
“Romosozumab could be considered a treatment option for osteoporotic patients with mild to moderate reductions in renal function,” said Dr. Miller, distinguished clinical professor of medicine at the University of Colorado at Denver, Aurora.
Since bisphosphonates are not recommended for use in patients with an estimated glomerular filtration rate (eGFR) of less than 30 or 35 mL/min/1.73 m2, other osteoporosis treatments such as romosozumab should also be examined. “It is important to evaluate other osteoporosis treatments in this setting, particularly in the context of monoclonal antibodies, which are not cleared in the kidneys and are metabolized in the reticular endothelial system, and have no FDA ... cut-off for their use,” Dr. Miller said.
Dr. Miller and colleagues performed a post hoc analysis of patients in the FRAME study, which enrolled 3,589 patients who received a monthly dose of subcutaneous romosozumab (215 mg) and 3,591 patients who received placebo in a double-blinded study for 12 months before moving to a 12-month, open-label portion of the study where all patients received 60 mg of subcutaneous denosumab every 6 months. After 12 months, the researchers analyzed the least squares mean (LSM) percentage change in bone mineral density (BMD) at the total hip, lumbar spine, and femoral neck as well as whether patients had any new vertebral fractures or experienced adverse events from treatment.
Patients were postmenopausal women between ages 55 and 90 years with a BMD T-score between –2.5 and –3.5 at the total hip or femoral neck. Researchers divided patients into four eGFR groups based chronic kidney disease (CKD) stage: normal (90 mL/min/1.73 m2 or higher; 848 patients), mild CKD (60-89 mL/min/1.73 m2; 4,939 patients), moderate CKD (30-59 mL/min/1.73 m2; 1,360 patients), and severe (15-29 mL/min/1.73 m2; 18 patients).
The LSM percentage change was 13.1% in the lumbar spine (95% confidence interval, 12.8%-13.3%) for the romosozumab group, compared with 0.4% in the placebo group (95% CI, 0.2%-0.5%). The LSM percentage change for total hip was 6.0% in the romosozumab group (95% CI, 5.9%-6.2%), compared with 0.3% in the placebo group (95% CI, 0.1%-0.4%), while the LSM percentage change for the femoral neck was 5.5% in the romosozumab group (95% CI, 5.2%-5.7%) and 0.3% in the placebo group (0.1%-0.5%).
“[The] risk of new vertebral fractures was decreased in all eGFR subgroups and did not appear to be affected by eGFR level,” he said.
Specifically, vertebral fracture incidence was 0.5% in the romosozumab group, compared with 3.0% in the placebo group, for patients with normal renal function, 0.4% in the romosozumab group, compared with 1.5% in the placebo group, for patients with mild chronic kidney disease, and 0.6% in the romosozumab group vs. 2.1% in the placebo group for patients with moderate chronic kidney disease. The incidence of adverse events, serious adverse events, and positively adjudicated cardiovascular events were similar between patients in the romosozumab group regardless of renal function status. The researchers reported 1 patient in the romosozumab group who experienced grade 2 hypocalcemia, and 14 patients in the romosozumab group who experienced mild to moderate decreases in calcium, compared with 4 patients in the placebo group.
Dr. Miller noted the study was limited by having few patients with an eGFR of less than 30 mL/min/1.73 m2 and no patients with an eGFR of less than 15 mL/min/1.73 m2, but said the study strengths were its large randomized nature and well-balanced baseline characteristics between each group.
This study was sponsored in part by Amgen, Astellas, and UCB Pharma. Dr. Miller reported receiving grants from Alexion, Amgen, Radius, Regeneron, UCB, and Ultragenyx. Amgen and UCB assisted in and provided financial assistance for the preparation of Dr. Miller’s presentation.
SOURCE: Miller P et al. ASBMR 2019. Abstract 1085.
ORLANDO – Use of romosozumab (Evenity) by patients with osteoporosis in various stages of renal insufficiency did not appear to affect increases in bone mineral density, the rate of new vertebral fractures, or the number of adverse events when compared with placebo, Paul D. Miller, MD, said at the annual meeting of the American Society for Bone and Mineral Research.
“Romosozumab could be considered a treatment option for osteoporotic patients with mild to moderate reductions in renal function,” said Dr. Miller, distinguished clinical professor of medicine at the University of Colorado at Denver, Aurora.
Since bisphosphonates are not recommended for use in patients with an estimated glomerular filtration rate (eGFR) of less than 30 or 35 mL/min/1.73 m2, other osteoporosis treatments such as romosozumab should also be examined. “It is important to evaluate other osteoporosis treatments in this setting, particularly in the context of monoclonal antibodies, which are not cleared in the kidneys and are metabolized in the reticular endothelial system, and have no FDA ... cut-off for their use,” Dr. Miller said.
Dr. Miller and colleagues performed a post hoc analysis of patients in the FRAME study, which enrolled 3,589 patients who received a monthly dose of subcutaneous romosozumab (215 mg) and 3,591 patients who received placebo in a double-blinded study for 12 months before moving to a 12-month, open-label portion of the study where all patients received 60 mg of subcutaneous denosumab every 6 months. After 12 months, the researchers analyzed the least squares mean (LSM) percentage change in bone mineral density (BMD) at the total hip, lumbar spine, and femoral neck as well as whether patients had any new vertebral fractures or experienced adverse events from treatment.
Patients were postmenopausal women between ages 55 and 90 years with a BMD T-score between –2.5 and –3.5 at the total hip or femoral neck. Researchers divided patients into four eGFR groups based chronic kidney disease (CKD) stage: normal (90 mL/min/1.73 m2 or higher; 848 patients), mild CKD (60-89 mL/min/1.73 m2; 4,939 patients), moderate CKD (30-59 mL/min/1.73 m2; 1,360 patients), and severe (15-29 mL/min/1.73 m2; 18 patients).
The LSM percentage change was 13.1% in the lumbar spine (95% confidence interval, 12.8%-13.3%) for the romosozumab group, compared with 0.4% in the placebo group (95% CI, 0.2%-0.5%). The LSM percentage change for total hip was 6.0% in the romosozumab group (95% CI, 5.9%-6.2%), compared with 0.3% in the placebo group (95% CI, 0.1%-0.4%), while the LSM percentage change for the femoral neck was 5.5% in the romosozumab group (95% CI, 5.2%-5.7%) and 0.3% in the placebo group (0.1%-0.5%).
“[The] risk of new vertebral fractures was decreased in all eGFR subgroups and did not appear to be affected by eGFR level,” he said.
Specifically, vertebral fracture incidence was 0.5% in the romosozumab group, compared with 3.0% in the placebo group, for patients with normal renal function, 0.4% in the romosozumab group, compared with 1.5% in the placebo group, for patients with mild chronic kidney disease, and 0.6% in the romosozumab group vs. 2.1% in the placebo group for patients with moderate chronic kidney disease. The incidence of adverse events, serious adverse events, and positively adjudicated cardiovascular events were similar between patients in the romosozumab group regardless of renal function status. The researchers reported 1 patient in the romosozumab group who experienced grade 2 hypocalcemia, and 14 patients in the romosozumab group who experienced mild to moderate decreases in calcium, compared with 4 patients in the placebo group.
Dr. Miller noted the study was limited by having few patients with an eGFR of less than 30 mL/min/1.73 m2 and no patients with an eGFR of less than 15 mL/min/1.73 m2, but said the study strengths were its large randomized nature and well-balanced baseline characteristics between each group.
This study was sponsored in part by Amgen, Astellas, and UCB Pharma. Dr. Miller reported receiving grants from Alexion, Amgen, Radius, Regeneron, UCB, and Ultragenyx. Amgen and UCB assisted in and provided financial assistance for the preparation of Dr. Miller’s presentation.
SOURCE: Miller P et al. ASBMR 2019. Abstract 1085.
REPORTING FROM ASBMR 2019
Study questions preemptive TEVAR for extended type A dissections
CHICAGO – The need for additional intervention after repair of the ascending aorta in extended type A aortic dissection has been thought to follow the practice for type B dissection and favor preemptive thoracic endovascular aortic repair. However, preemptive TEVAR may, at least in the midterm, provide no benefit in patients with extended type A dissections, according to results reported at the annual meeting of the Midwestern Vascular Surgery Society.

“TEVAR does not appear to be indicated in patients with extended type A dissections after acute aortic repair,” said Amy B. Reed, MD, of the University of Minnesota.
The study’s hypothesis was that growth rates of dissection and the need for additional intervention in the descending thoracic aorta are similar between extended type A (ExTA) and type B aortic dissection after initial repair of the ascending aorta. Dr. Reed noted that investigators from the INSTEAD-XL trial reported that preemptive TEVAR improved outcomes in patients with type B dissections (Circ Cardiovasc Interv. 2013;6:407-16). “The thinking has been that patients with uncomplicated ExTA would also benefit from early TEVAR,” Dr. Reed said.
The study evaluated 87 consecutive patients from 2011 to 2018, 43 with ExTA and 44 with type B dissections. Characteristics of both groups were similar, except the type B group had a significantly higher rate of coronary artery disease, 16% vs. 0% (P = .01). The distal extent of the dissection was beyond the aortic bifurcation in 75% of the ExTA patients and 52% of the type B group, “so we felt that these groups were really well matched,” Dr. Reed said.
Of the 43 ExTA patients, five had repair and 38 had no intervention. At an average follow-up of 33 months, 23 of the no-intervention patients showed no growth of their dissection, Dr. Reed said. In the type B group, 15 had no repair, and of those nine showed no growth (one patient died early and five did show growth).
“When we look at intervention-free survival, there’s a significant difference between our ExTA patients vs. our type B patients over time, with significantly more type B patients requiring intervention,” she said. At 28 months, 88% of ExTA were intervention free, whereas at 9 months 35% of type B patients were.
“We feel that, following the repair of ascending acute aortic dissection, in those patients with ExTA dissections, there does appear to be a slow progression of distal aortic disease,” Dr. Reed said. “Rarely do these patients develop complications such as dissection needing intervention either in the acute hospital period or delayed.”
Because the findings are based on medium-term follow-up, she said, “We certainly need further follow-up to confirm these midterm findings.”
Dr. Reed had no relevant financial relationships to disclose.
CHICAGO – The need for additional intervention after repair of the ascending aorta in extended type A aortic dissection has been thought to follow the practice for type B dissection and favor preemptive thoracic endovascular aortic repair. However, preemptive TEVAR may, at least in the midterm, provide no benefit in patients with extended type A dissections, according to results reported at the annual meeting of the Midwestern Vascular Surgery Society.
“TEVAR does not appear to be indicated in patients with extended type A dissections after acute aortic repair,” said Amy B. Reed, MD, of the University of Minnesota.
The study’s hypothesis was that growth rates of dissection and the need for additional intervention in the descending thoracic aorta are similar between extended type A (ExTA) and type B aortic dissection after initial repair of the ascending aorta. Dr. Reed noted that investigators from the INSTEAD-XL trial reported that preemptive TEVAR improved outcomes in patients with type B dissections (Circ Cardiovasc Interv. 2013;6:407-16). “The thinking has been that patients with uncomplicated ExTA would also benefit from early TEVAR,” Dr. Reed said.
The study evaluated 87 consecutive patients from 2011 to 2018, 43 with ExTA and 44 with type B dissections. Characteristics of both groups were similar, except the type B group had a significantly higher rate of coronary artery disease, 16% vs. 0% (P = .01). The distal extent of the dissection was beyond the aortic bifurcation in 75% of the ExTA patients and 52% of the type B group, “so we felt that these groups were really well matched,” Dr. Reed said.
Of the 43 ExTA patients, five had repair and 38 had no intervention. At an average follow-up of 33 months, 23 of the no-intervention patients showed no growth of their dissection, Dr. Reed said. In the type B group, 15 had no repair, and of those nine showed no growth (one patient died early and five did show growth).
“When we look at intervention-free survival, there’s a significant difference between our ExTA patients vs. our type B patients over time, with significantly more type B patients requiring intervention,” she said. At 28 months, 88% of ExTA were intervention free, whereas at 9 months 35% of type B patients were.
“We feel that, following the repair of ascending acute aortic dissection, in those patients with ExTA dissections, there does appear to be a slow progression of distal aortic disease,” Dr. Reed said. “Rarely do these patients develop complications such as dissection needing intervention either in the acute hospital period or delayed.”
Because the findings are based on medium-term follow-up, she said, “We certainly need further follow-up to confirm these midterm findings.”
Dr. Reed had no relevant financial relationships to disclose.
CHICAGO – The need for additional intervention after repair of the ascending aorta in extended type A aortic dissection has been thought to follow the practice for type B dissection and favor preemptive thoracic endovascular aortic repair. However, preemptive TEVAR may, at least in the midterm, provide no benefit in patients with extended type A dissections, according to results reported at the annual meeting of the Midwestern Vascular Surgery Society.
“TEVAR does not appear to be indicated in patients with extended type A dissections after acute aortic repair,” said Amy B. Reed, MD, of the University of Minnesota.
The study’s hypothesis was that growth rates of dissection and the need for additional intervention in the descending thoracic aorta are similar between extended type A (ExTA) and type B aortic dissection after initial repair of the ascending aorta. Dr. Reed noted that investigators from the INSTEAD-XL trial reported that preemptive TEVAR improved outcomes in patients with type B dissections (Circ Cardiovasc Interv. 2013;6:407-16). “The thinking has been that patients with uncomplicated ExTA would also benefit from early TEVAR,” Dr. Reed said.
The study evaluated 87 consecutive patients from 2011 to 2018, 43 with ExTA and 44 with type B dissections. Characteristics of both groups were similar, except the type B group had a significantly higher rate of coronary artery disease, 16% vs. 0% (P = .01). The distal extent of the dissection was beyond the aortic bifurcation in 75% of the ExTA patients and 52% of the type B group, “so we felt that these groups were really well matched,” Dr. Reed said.
Of the 43 ExTA patients, five had repair and 38 had no intervention. At an average follow-up of 33 months, 23 of the no-intervention patients showed no growth of their dissection, Dr. Reed said. In the type B group, 15 had no repair, and of those nine showed no growth (one patient died early and five did show growth).
“When we look at intervention-free survival, there’s a significant difference between our ExTA patients vs. our type B patients over time, with significantly more type B patients requiring intervention,” she said. At 28 months, 88% of ExTA were intervention free, whereas at 9 months 35% of type B patients were.
“We feel that, following the repair of ascending acute aortic dissection, in those patients with ExTA dissections, there does appear to be a slow progression of distal aortic disease,” Dr. Reed said. “Rarely do these patients develop complications such as dissection needing intervention either in the acute hospital period or delayed.”
Because the findings are based on medium-term follow-up, she said, “We certainly need further follow-up to confirm these midterm findings.”
Dr. Reed had no relevant financial relationships to disclose.
REPORTING FROM MIDWESTERN VASCULAR 2019

i-HOPE study engages patients, families to improve quality of hospital stays
Make patients ‘equal members of the team.’
Hospitalization can be a challenging and vulnerable time for patients and their families. While challenges associated with the quality and safety of hospital care are well documented, perspectives of patients, families, caregivers, and other stakeholders are not as easily understood and are important targets of improvement research.

This led to the initiation of the i-HOPE Patient Engagement Study, a collaboration including the Society for Hospital Medicine’s Center for Quality Improvement. The team completed a systematic and broad engagement process with patients, families, and caregivers, followed by an in-person prioritization meeting to generate a priority list of research topics that describe the most important gaps in the care of hospitalized patients.
The Hospitalist recently spoke with Luci Leykum, MD, MSc, MBA, SFHM, principal investigator for the i-HOPE Study, professor of medicine and investigator in the South Texas Veterans Health Care System and incoming associate chair for clinical innovation at the University of Texas at Austin.
Why is it so important to include the perspective of the patient during a hospital stay?
We cannot optimally improve outcomes of hospitalized patients if we don’t have patients’ perspectives on what needs to be improved. Hearing these perspectives also provides insights into how we can address gaps in hospital care.
How were patients and other stakeholders engaged during the i-HOPE program?
Patients, caregivers, and stakeholders were engaged throughout the entire project, from conceptualization to dissemination of results.
We worked with seven patient partners to develop the proposal that we submitted to the Patient-Centered Outcomes Research Institute. They were involved in all phases of the project, from developing the informational webinars and surveys to analyzing our results.
We engaged additional patients, caregivers, and stakeholders to submit their highest priority unanswered research questions for improving hospital care. A total of 117 patients and 127 caregivers submitted questions. Our patient partners and more than 30 stakeholders were involved in prioritizing those research questions to develop our final agenda.
What is unique about the approach in the i-HOPE project, compared with other projects that may have had similar intended objectives?
Our project is unique in several respects. First, it was completely patient partnered. Having patients as equal members of the team changed our approach at every level – from how we communicated with patients and stakeholders to how we analyzed and presented our data. Second, we worked with a larger number of stakeholders representing a broad range of constituencies, from professional societies to health care delivery systems to payers.
How has SHM’s Center for Quality Improvement helped the i-HOPE program to realize its goals?
The Center for Quality Improvement helped considerably with the execution of the project. The researchers involved in i-HOPE were all members of the SHM Research Committee and were familiar with SHM’s capability as a partner in these larger-scale projects. The SHM Meetings team was instrumental in making our in-person patient and stakeholder prioritization meeting happen as well.
How can the findings of the i-HOPE program be applied?
We hope everyone can utilize our findings. Patients, families, and caregivers can use our results to improve their own care. Providers and delivery systems can target their improvement efforts using our findings to ensure that their work has the greatest impact on patients. Policy makers and funders can use our findings to direct work to the priority areas we identified. And finally, we hope the hospital research community uses our results to develop novel interventions to improve care.
For more information on the i-HOPE Patient Engagement Study, visit hospitalmedicine.org/ihope.
Make patients ‘equal members of the team.’
Make patients ‘equal members of the team.’
Hospitalization can be a challenging and vulnerable time for patients and their families. While challenges associated with the quality and safety of hospital care are well documented, perspectives of patients, families, caregivers, and other stakeholders are not as easily understood and are important targets of improvement research.
This led to the initiation of the i-HOPE Patient Engagement Study, a collaboration including the Society for Hospital Medicine’s Center for Quality Improvement. The team completed a systematic and broad engagement process with patients, families, and caregivers, followed by an in-person prioritization meeting to generate a priority list of research topics that describe the most important gaps in the care of hospitalized patients.
The Hospitalist recently spoke with Luci Leykum, MD, MSc, MBA, SFHM, principal investigator for the i-HOPE Study, professor of medicine and investigator in the South Texas Veterans Health Care System and incoming associate chair for clinical innovation at the University of Texas at Austin.
Why is it so important to include the perspective of the patient during a hospital stay?
We cannot optimally improve outcomes of hospitalized patients if we don’t have patients’ perspectives on what needs to be improved. Hearing these perspectives also provides insights into how we can address gaps in hospital care.
How were patients and other stakeholders engaged during the i-HOPE program?
Patients, caregivers, and stakeholders were engaged throughout the entire project, from conceptualization to dissemination of results.
We worked with seven patient partners to develop the proposal that we submitted to the Patient-Centered Outcomes Research Institute. They were involved in all phases of the project, from developing the informational webinars and surveys to analyzing our results.
We engaged additional patients, caregivers, and stakeholders to submit their highest priority unanswered research questions for improving hospital care. A total of 117 patients and 127 caregivers submitted questions. Our patient partners and more than 30 stakeholders were involved in prioritizing those research questions to develop our final agenda.
What is unique about the approach in the i-HOPE project, compared with other projects that may have had similar intended objectives?
Our project is unique in several respects. First, it was completely patient partnered. Having patients as equal members of the team changed our approach at every level – from how we communicated with patients and stakeholders to how we analyzed and presented our data. Second, we worked with a larger number of stakeholders representing a broad range of constituencies, from professional societies to health care delivery systems to payers.
How has SHM’s Center for Quality Improvement helped the i-HOPE program to realize its goals?
The Center for Quality Improvement helped considerably with the execution of the project. The researchers involved in i-HOPE were all members of the SHM Research Committee and were familiar with SHM’s capability as a partner in these larger-scale projects. The SHM Meetings team was instrumental in making our in-person patient and stakeholder prioritization meeting happen as well.
How can the findings of the i-HOPE program be applied?
We hope everyone can utilize our findings. Patients, families, and caregivers can use our results to improve their own care. Providers and delivery systems can target their improvement efforts using our findings to ensure that their work has the greatest impact on patients. Policy makers and funders can use our findings to direct work to the priority areas we identified. And finally, we hope the hospital research community uses our results to develop novel interventions to improve care.
For more information on the i-HOPE Patient Engagement Study, visit hospitalmedicine.org/ihope.
Hospitalization can be a challenging and vulnerable time for patients and their families. While challenges associated with the quality and safety of hospital care are well documented, perspectives of patients, families, caregivers, and other stakeholders are not as easily understood and are important targets of improvement research.
This led to the initiation of the i-HOPE Patient Engagement Study, a collaboration including the Society for Hospital Medicine’s Center for Quality Improvement. The team completed a systematic and broad engagement process with patients, families, and caregivers, followed by an in-person prioritization meeting to generate a priority list of research topics that describe the most important gaps in the care of hospitalized patients.
The Hospitalist recently spoke with Luci Leykum, MD, MSc, MBA, SFHM, principal investigator for the i-HOPE Study, professor of medicine and investigator in the South Texas Veterans Health Care System and incoming associate chair for clinical innovation at the University of Texas at Austin.
Why is it so important to include the perspective of the patient during a hospital stay?
We cannot optimally improve outcomes of hospitalized patients if we don’t have patients’ perspectives on what needs to be improved. Hearing these perspectives also provides insights into how we can address gaps in hospital care.
How were patients and other stakeholders engaged during the i-HOPE program?
Patients, caregivers, and stakeholders were engaged throughout the entire project, from conceptualization to dissemination of results.
We worked with seven patient partners to develop the proposal that we submitted to the Patient-Centered Outcomes Research Institute. They were involved in all phases of the project, from developing the informational webinars and surveys to analyzing our results.
We engaged additional patients, caregivers, and stakeholders to submit their highest priority unanswered research questions for improving hospital care. A total of 117 patients and 127 caregivers submitted questions. Our patient partners and more than 30 stakeholders were involved in prioritizing those research questions to develop our final agenda.
What is unique about the approach in the i-HOPE project, compared with other projects that may have had similar intended objectives?
Our project is unique in several respects. First, it was completely patient partnered. Having patients as equal members of the team changed our approach at every level – from how we communicated with patients and stakeholders to how we analyzed and presented our data. Second, we worked with a larger number of stakeholders representing a broad range of constituencies, from professional societies to health care delivery systems to payers.
How has SHM’s Center for Quality Improvement helped the i-HOPE program to realize its goals?
The Center for Quality Improvement helped considerably with the execution of the project. The researchers involved in i-HOPE were all members of the SHM Research Committee and were familiar with SHM’s capability as a partner in these larger-scale projects. The SHM Meetings team was instrumental in making our in-person patient and stakeholder prioritization meeting happen as well.
How can the findings of the i-HOPE program be applied?
We hope everyone can utilize our findings. Patients, families, and caregivers can use our results to improve their own care. Providers and delivery systems can target their improvement efforts using our findings to ensure that their work has the greatest impact on patients. Policy makers and funders can use our findings to direct work to the priority areas we identified. And finally, we hope the hospital research community uses our results to develop novel interventions to improve care.
For more information on the i-HOPE Patient Engagement Study, visit hospitalmedicine.org/ihope.

Eltrombopag elicits positive responses in secondary ITP
Eltrombopag showed good safety and promising clinical activity in patients with immune thrombocytopenia (ITP) secondary to chronic lymphoproliferative disorders, according to results from a phase 2 trial.
Carlo Visco, MD, of the University of Verona (Italy), and colleagues investigated the efficacy and safety of eltrombopag in increasing platelet counts in patients with ITP that was secondary to chronic lymphoproliferative disorders. The findings were published in Blood.
The single-arm, open-label study included 18 patients with ITP secondary to chronic lymphocytic leukemia (14), Waldenstrom macroglobulinemia (2), and classical Hodgkin lymphoma (2). The median age at baseline was 70 years (range, 43-83 years), and all patients were previously treated with ITP.
Study participants were recruited from seven Italian centers from September 2012 to November 2015. Eligible participants were enrolled into an extension phase if a response was observed.
Study patients received oral eltrombopag at 50 mg daily, up to a maximum of 150 mg daily. At weeks 4 and 24, the median dose was 50 mg (ranges, 25-100 mg and 25-150 mg, respectively), with a median total exposure time of 16 months.
At 4 weeks, the researchers found that the platelet response rate was 78%, with a complete response rate of 50%.
After 24 weeks of therapy, the platelet response rate was 59%, with a complete response rate of 30%.
With respect to safety, the therapy was well tolerated, with no adverse events higher than grade 2 reported.
Fifteen patients discontinued therapy: eight due to loss of response, six for disease progression or death, and one for inefficacy and protocol violation, they reported.
The researchers acknowledged two key limitations of the study: the small sample size and lack of a comparison group. “Further prospective studies comparing eltrombopag to standard of care are needed to confirm our findings on the efficacy of this treatment and also to expand our knowledge on its safety, including the potential increased risk of thrombosis,” they wrote.
The study was funded by the Hematology Project Foundation, Vicenza. The authors reported financial affiliations with Amgen, Argenx, and Novartis.
SOURCE: Visco C et al. Blood. 2019 Sep 30. doi: 10.1182/blood.2019001617.
Eltrombopag showed good safety and promising clinical activity in patients with immune thrombocytopenia (ITP) secondary to chronic lymphoproliferative disorders, according to results from a phase 2 trial.
Carlo Visco, MD, of the University of Verona (Italy), and colleagues investigated the efficacy and safety of eltrombopag in increasing platelet counts in patients with ITP that was secondary to chronic lymphoproliferative disorders. The findings were published in Blood.
The single-arm, open-label study included 18 patients with ITP secondary to chronic lymphocytic leukemia (14), Waldenstrom macroglobulinemia (2), and classical Hodgkin lymphoma (2). The median age at baseline was 70 years (range, 43-83 years), and all patients were previously treated with ITP.
Study participants were recruited from seven Italian centers from September 2012 to November 2015. Eligible participants were enrolled into an extension phase if a response was observed.
Study patients received oral eltrombopag at 50 mg daily, up to a maximum of 150 mg daily. At weeks 4 and 24, the median dose was 50 mg (ranges, 25-100 mg and 25-150 mg, respectively), with a median total exposure time of 16 months.
At 4 weeks, the researchers found that the platelet response rate was 78%, with a complete response rate of 50%.
After 24 weeks of therapy, the platelet response rate was 59%, with a complete response rate of 30%.
With respect to safety, the therapy was well tolerated, with no adverse events higher than grade 2 reported.
Fifteen patients discontinued therapy: eight due to loss of response, six for disease progression or death, and one for inefficacy and protocol violation, they reported.
The researchers acknowledged two key limitations of the study: the small sample size and lack of a comparison group. “Further prospective studies comparing eltrombopag to standard of care are needed to confirm our findings on the efficacy of this treatment and also to expand our knowledge on its safety, including the potential increased risk of thrombosis,” they wrote.
The study was funded by the Hematology Project Foundation, Vicenza. The authors reported financial affiliations with Amgen, Argenx, and Novartis.
SOURCE: Visco C et al. Blood. 2019 Sep 30. doi: 10.1182/blood.2019001617.
Eltrombopag showed good safety and promising clinical activity in patients with immune thrombocytopenia (ITP) secondary to chronic lymphoproliferative disorders, according to results from a phase 2 trial.
Carlo Visco, MD, of the University of Verona (Italy), and colleagues investigated the efficacy and safety of eltrombopag in increasing platelet counts in patients with ITP that was secondary to chronic lymphoproliferative disorders. The findings were published in Blood.
The single-arm, open-label study included 18 patients with ITP secondary to chronic lymphocytic leukemia (14), Waldenstrom macroglobulinemia (2), and classical Hodgkin lymphoma (2). The median age at baseline was 70 years (range, 43-83 years), and all patients were previously treated with ITP.
Study participants were recruited from seven Italian centers from September 2012 to November 2015. Eligible participants were enrolled into an extension phase if a response was observed.
Study patients received oral eltrombopag at 50 mg daily, up to a maximum of 150 mg daily. At weeks 4 and 24, the median dose was 50 mg (ranges, 25-100 mg and 25-150 mg, respectively), with a median total exposure time of 16 months.
At 4 weeks, the researchers found that the platelet response rate was 78%, with a complete response rate of 50%.
After 24 weeks of therapy, the platelet response rate was 59%, with a complete response rate of 30%.
With respect to safety, the therapy was well tolerated, with no adverse events higher than grade 2 reported.
Fifteen patients discontinued therapy: eight due to loss of response, six for disease progression or death, and one for inefficacy and protocol violation, they reported.
The researchers acknowledged two key limitations of the study: the small sample size and lack of a comparison group. “Further prospective studies comparing eltrombopag to standard of care are needed to confirm our findings on the efficacy of this treatment and also to expand our knowledge on its safety, including the potential increased risk of thrombosis,” they wrote.
The study was funded by the Hematology Project Foundation, Vicenza. The authors reported financial affiliations with Amgen, Argenx, and Novartis.
SOURCE: Visco C et al. Blood. 2019 Sep 30. doi: 10.1182/blood.2019001617.
FROM BLOOD
Erythematous Papules on the Scrotum, Trunk, and Extremities
The Diagnosis: Lichenoid and Granulomatous Dermatitis in the Setting of Secondary Syphilis
Syphilis, an infectious disease that has risen in incidence and is most commonly reported in men who have sex with men, involves a vast array of clinical and histologic presentations.1 Clinically, secondary syphilis involves an erythematous maculopapular eruption on the face, trunk, palms, soles, or genital area.2 The characteristic histologic features for secondary syphilis include endothelial swelling, interstitial inflammatory array, irregular acanthosis, elongated rete ridges, and vacuolar interface dermatitis with lymphocytes and plasma cells.1 Syphilitic infection has been associated with lichenoid and granulomatous dermatitis, which is an inflammatory skin disease described by Magro and Crowson.3 Lichenoid and granulomatous dermatitis has been linked to various systemic disorders, including chronic hepatitis C, Crohn disease, rheumatoid arthritis, endocrinopathy, subacute cutaneous lupus erythematosus, secondary syphilis, prior herpes infection, tuberculoid leprosy, mycobacterial infection, and human immunodeficiency virus infection.3-7 For this patient, given histopathology findings, clinical presentation, and positive rapid plasma reagin serologies, a diagnosis of lichenoid and granulomatous dermatitis in the setting of a secondary syphilis infection was established. A comprehensive investigation should be conducted to consider secondary syphilis or other systemic diseases in patients with a histologic finding of lichenoid and granulomatous dermatitis.
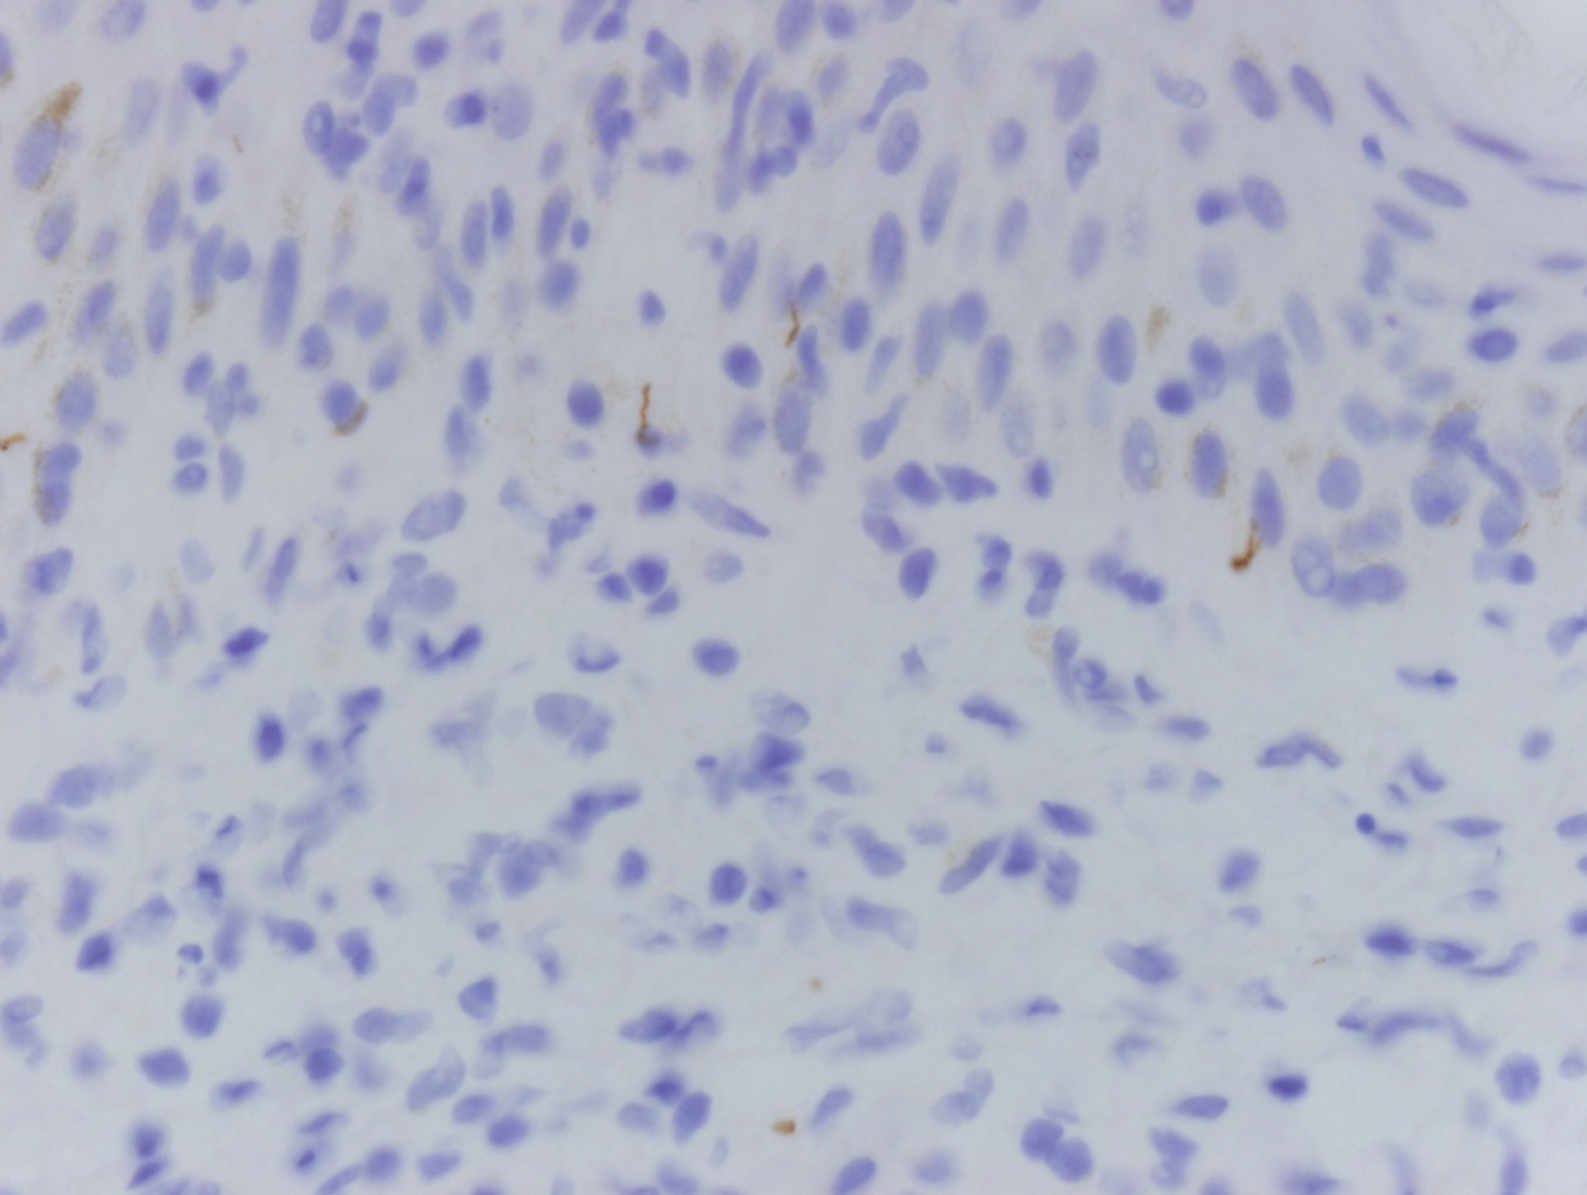
Histologically, lichenoid and granulomatous dermatitis cases show a bandlike infiltrate of lymphocytes with neighboring histiocytes along the dermoepidermal junction, accompanied by epithelial changes of dyskeratosis, vasculopathy, and colloid body formation, in addition to a dermal histiocytic component.3 Our patient's biopsy showed a lichenoid reaction pattern with vacuolar interface changes, dyskeratosis, plump endothelial cells, and small collections of plasma cells. Additionally, there was a granulomatous component in the dermis with histiocytes admixed with lymphocytes and plasma cells. The presence of spirochetes was confirmed with antitreponemal immunohistochemical stain (Figure 1). Quantitative rapid plasma reagin was 1:64 (reference range, <1:1) and Treponema pallidum antibody was reactive.
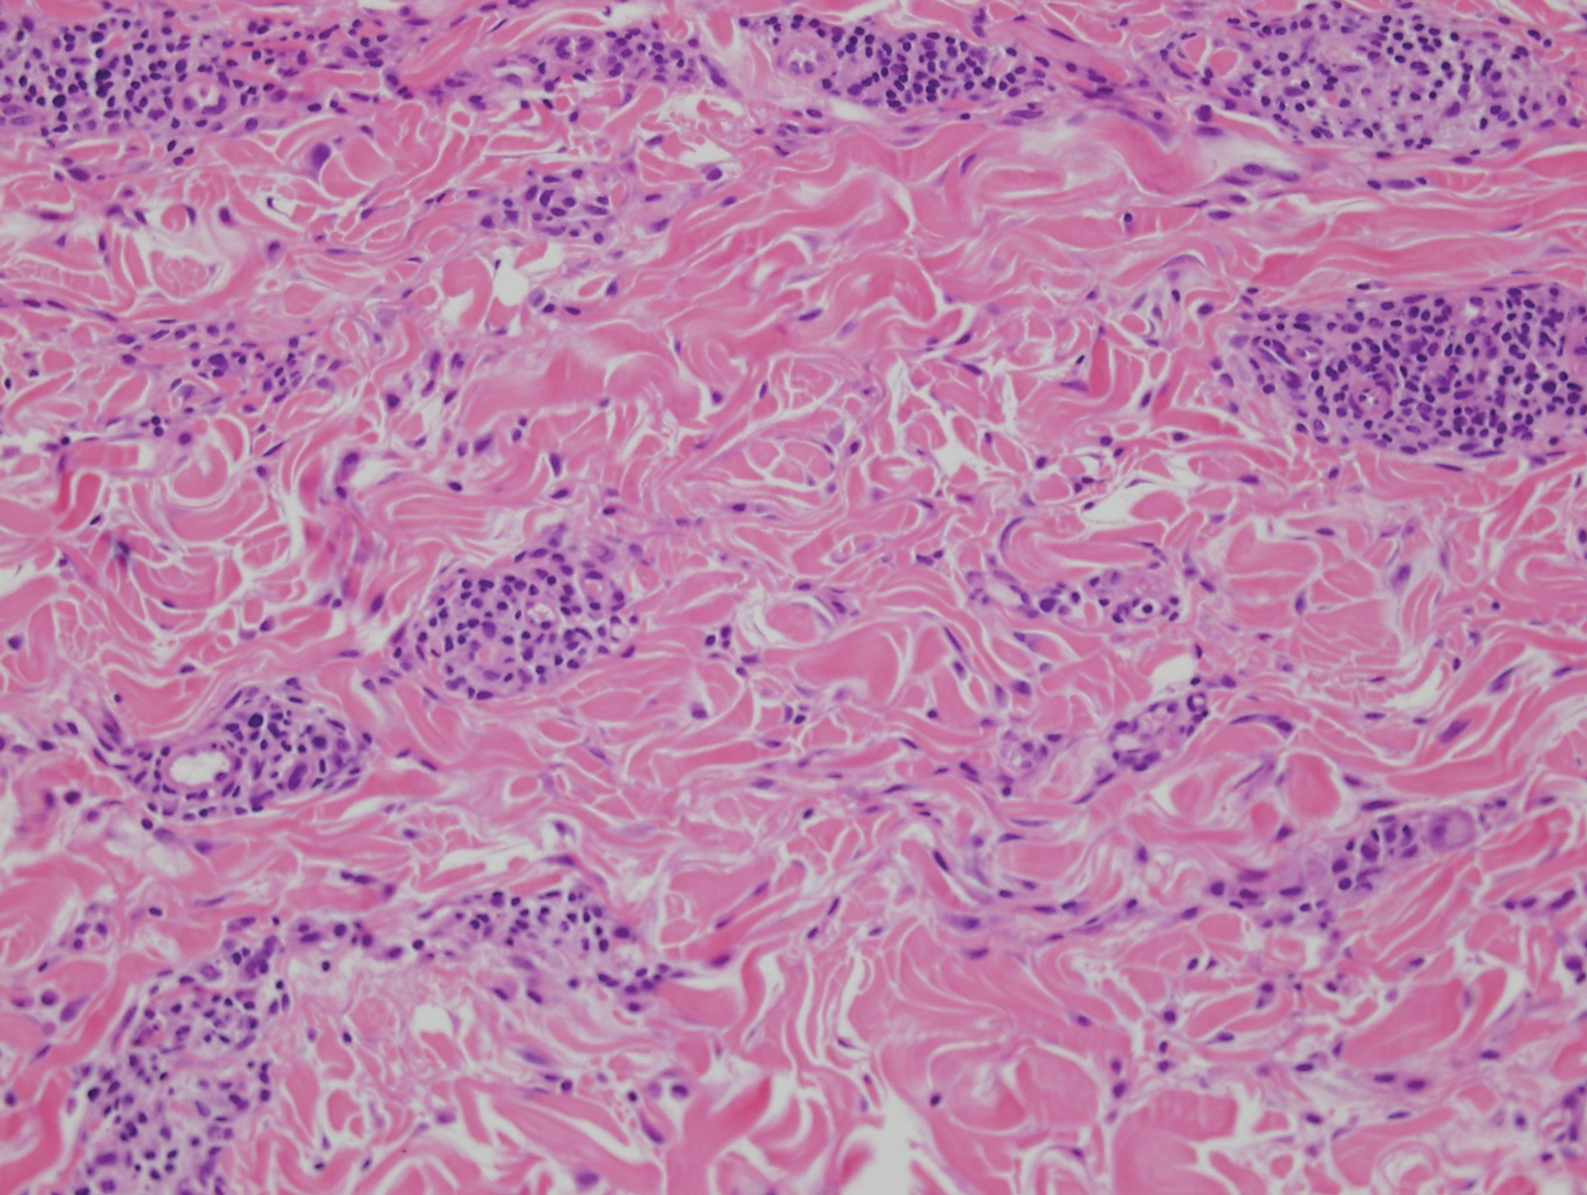
Interstitial granulomatous dermatitis has a variable clinical presentation, often with red-purple annular plaques, hyperpigmented papules, and nodules frequently in a linear arrangement and predominantly on the trunk, thighs, groin, or buttocks.8,9 On histopathology, there are histiocytes in the reticular dermis and/or a macrophage infiltrate in the mid to deep dermis with collections of degenerated collagen (Figure 2).8,10 An interstitial infiltrate of eosinophils and neutrophils also may be appreciated, but mucin generally is absent.8,11 This condition often coexists with rheumatic and systemic autoimmune diseases.8-10
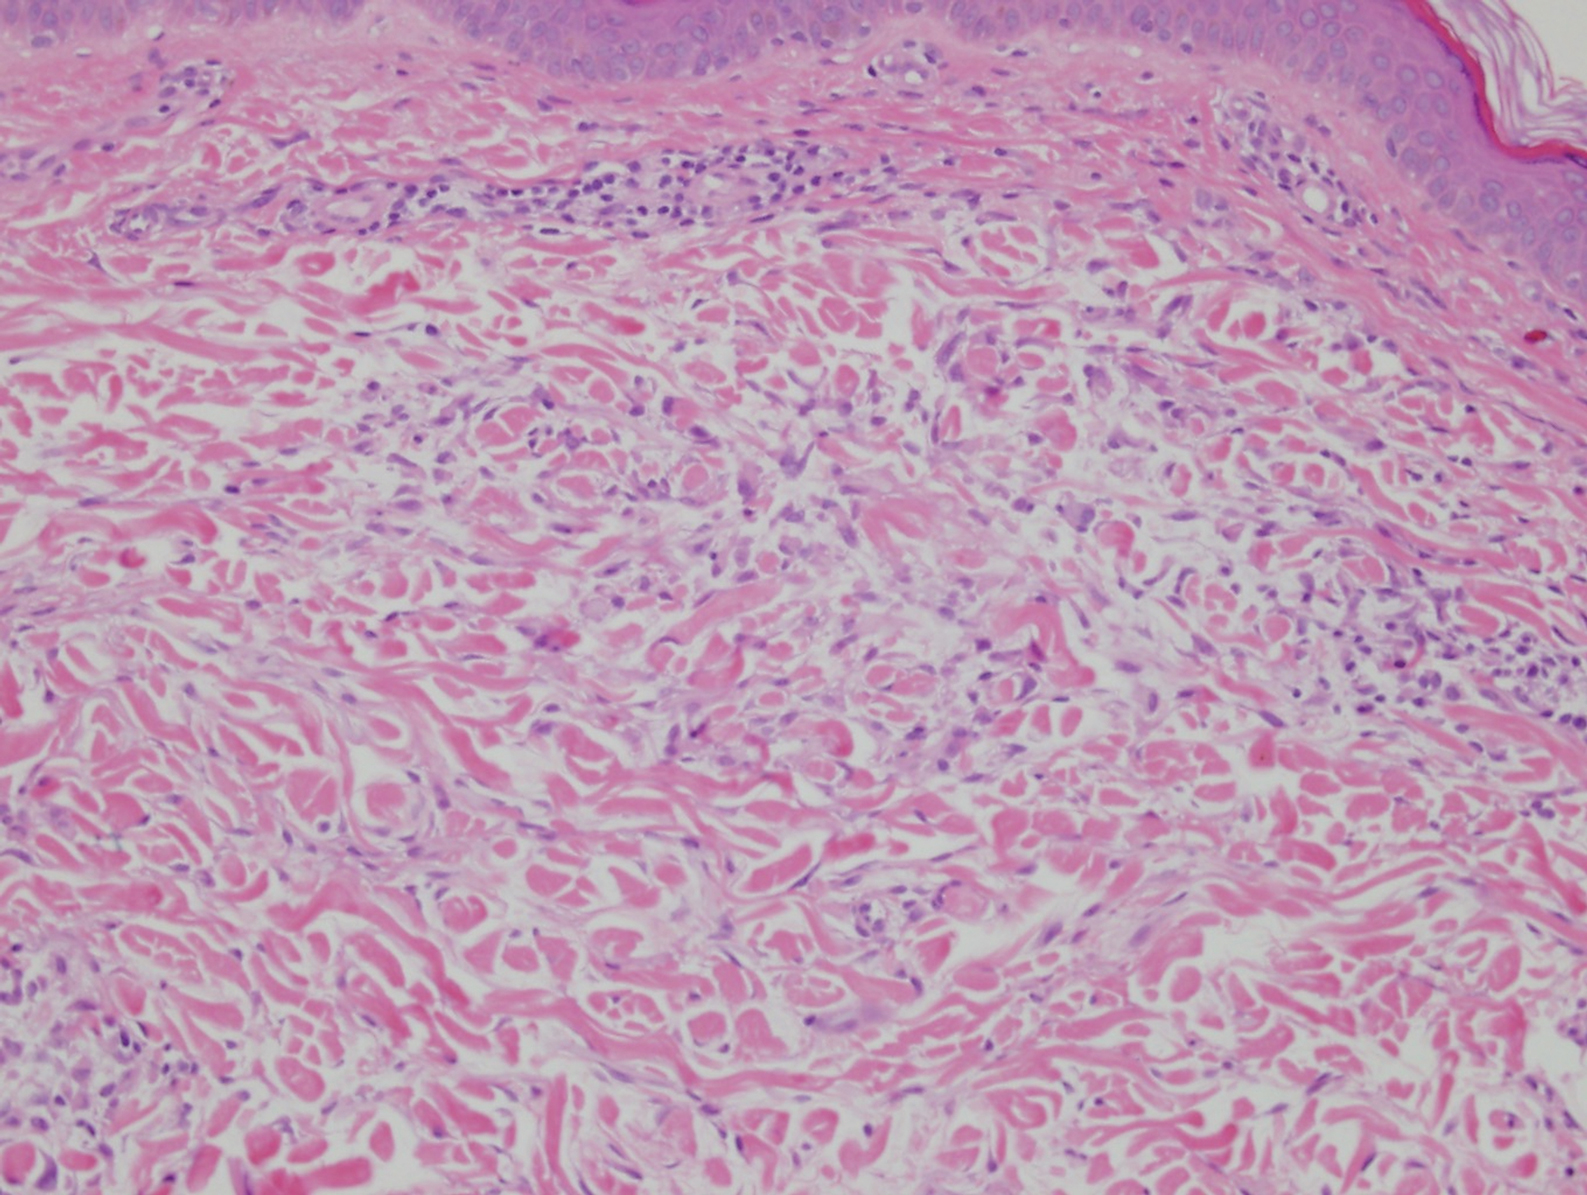
Interstitial granuloma annulare is a noninfectious granulomatous skin condition that often presents clinically as asymptomatic annular red-brown patches, usually on the extremities.11-13 On histopathology, an interstitial or palisaded inflammatory infiltrate with histiocytes and multinucleated giant cells may be seen along with collagen degeneration or collagen bundles without necrosis (Figure 3).9 Mucin often is associated with the histiocytes.11 Of note, our patient's skin biopsy shows interface dermatitis, differentiating it from both interstitial granuloma annulare and interstitial granulomatous dermatitis.
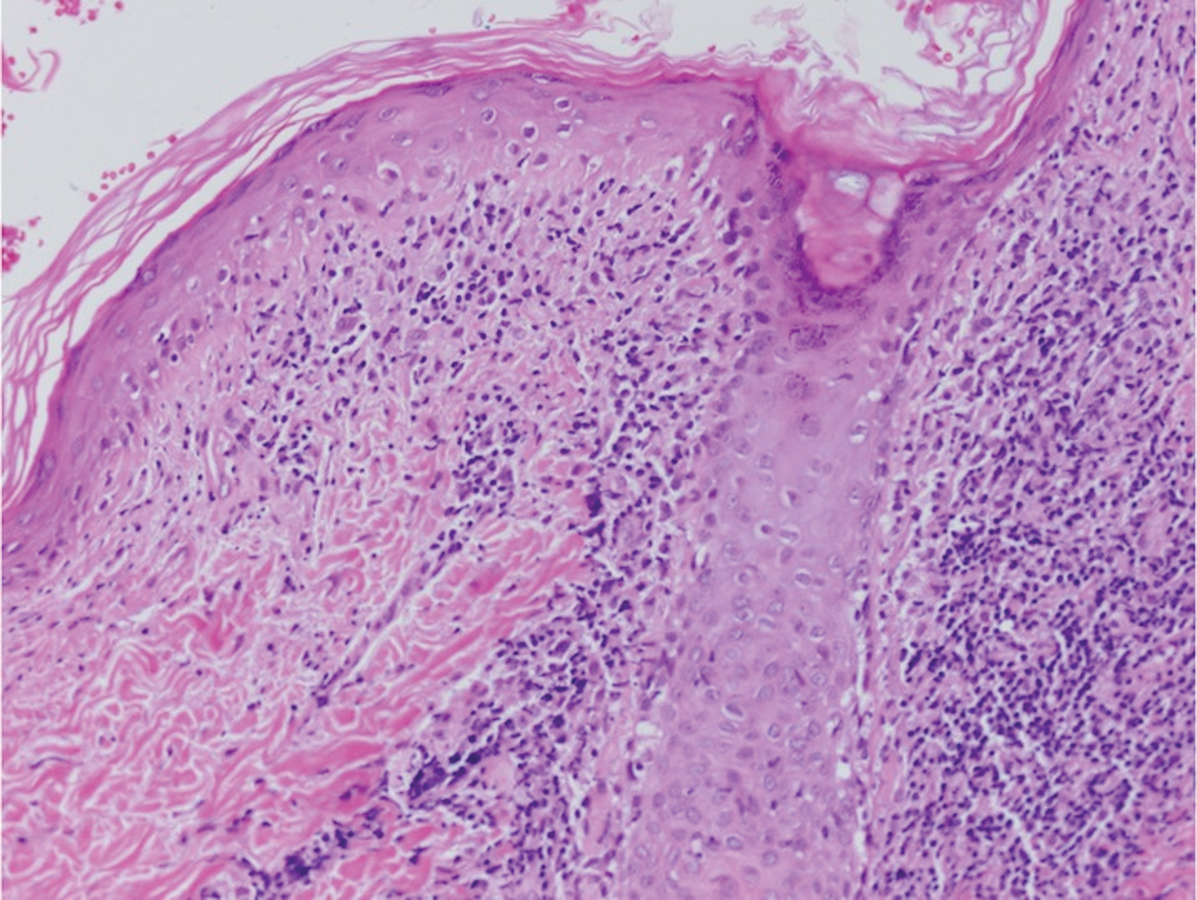
Postviral granulomatous reactions are the most frequently reported types of reactions to occur at the location of herpes zoster infection up to years after the initial disease. Wolf isotopic reaction encompasses skin reactions in the body region of formerly resolved skin disease, commonly herpesvirus infection.14,15 This manifestation may occur due to a hypersensitivity reaction from enduring viral proteins, resident memory T cells, or local neuroimmune imbalance from herpesvirus-induced injury to dermal sensory nerve fibers.14-17 Clinically, patients present with red-purple pruritic papules and plaques in a bandlike unilateral pattern, usually in the same region as the prior herpes infection and often accompanied by postherpetic neuralgia.16-19 Of note, our patient's clinical findings were more diffuse than the frequently localized and often linear distribution seen in postherpetic granulomatous reaction. On histopathology, granulomatous or lichenoid tissue reaction most commonly is appreciated.15 Specifically, interstitial granulomatous dermatitis with histiocytes, lymphocytes, and multinucleated giant cells showing elastophagocytosis and an inflammatory infiltrate with lymphocytes and plasma cells around vasculature, eccrine glands, and nerves can be noted (Figure 4).19

Lupus erythematosus is an autoimmune condition with a wide array of clinical features, including skin manifestations and systemic symptoms. Specifically, discoid lupus erythematosus presents with clearly outlined, red-pink macules or papules with scaling. Histologic features include keratotic follicular plugging, acanthosis, dermal mucin, thickening of the basement membrane zone, and dense lymphocytic infiltrate (Figure 5).20
- Flamm A, Parikh K, Xie Q, et al. Histologic features of secondary syphilis: a multicenter retrospective review. J Am Acad Dermatol. 2015;73:325-330.
- Zeltser R, Kurban AK. Syphilis. Clin Dermatol. 2004;22:461-468.
- Magro CM, Crowson AN. Lichenoid and granulomatous dermatitis. Int J Dermatol. 2000;39:12-33.
- S Breza T Jr, Magro CM. Lichenoid and granulomatous dermatitis associated with atypical mycobacterium infections. J Cutan Pathol. 2006;33:512-515.
- Granel B, Serratrice J, Rey J, et al. Chronic hepatitis C virus infection associated with a generalized granuloma annulare. J Am Acad Dermatol. 2000;43(5, pt 2):918-919.
- Jorizzo JL, Gonzalez EB, Apisarnthanarax P, et al. Pigmented purpuric eruption in a patient with rheumatoid arthritis. Arch Intern Med. 1982;142:2184-2185.
- Magro CM, Crowson AN, Regauer S. Granuloma annulare and necrobiosis lipoidica tissue reactions as a manifestation of systemic disease. Hum Pathol. 1996;27:50-56.
- Błażewicz I, Szczerkowska-Dobosz A, Pęksa R, et al. Interstitial granulomatous dermatitis: a characteristic histological pattern with variable clinical manifestations. Postepy Dermatol Alergol. 2015;32:475-477.
- Sezer E, Luzar B, Calonje E. Secondary syphilis with an interstitial granuloma annulare-like histopathologic pattern. J Cutan Pathol. 2011;38:439-442.
- Peroni A, Colato C, Schena D, et al. Interstitial granulomatous dermatitis: a distinct entity with characteristic histological and clinical pattern. Br J Dermatol. 2012;166:775-783.
- Sakiyama T, Hirai I, Konohana A, et al. Interstitial-type granuloma annulare associated with Sjögren syndrome. J Dtsch Dermatol Ges. 2014;12:415-416.
- Spring P, Vernez M, Maniu CM, et al. Localized interstitial granuloma annulare induced by subcutaneous injections for desensitization. Dermatol Online J. 2013;19:18572.
- Kluger N, Moguelet P, Chaslin-Ferbus D, et al. Generalized interstitial granuloma annulare induced by pegylated interferon-alpha. Dermatology. 2006;213:248-249.
- Ruocco E, Baroni A, Cutrì FT, et al. Granuloma annulare in a site of healed herpes zoster: Wolf's isotopic response. J Eur Acad Dermatol Venereol. 2003;17:686-688.
- Ise M, Tanese K, Adachi T, et al. Postherpetic Wolf's isotopic response: possible contribution of resident memory T cells to the pathogenesis of lichenoid reaction. Br J Dermatol. 2015;173:1331-1334.
- Lora V, Cota C, Kanitakis J. Zosteriform lichen planus after herpes zoster: report of a new case of Wolf's isotopic phenomenon and literature review. Dermatol Online J. 2014;20. pii:13030/qt5vf99178.
- Lin CH, Chen HC, Gao HW, et al. Wolf's post-herpetic isotopic response to tocilizumab for rheumatoid arthritis. Australas J Dermatol. 2018;59:E135-E137.
- Melgar E, Henry J, Valois A, et al. Extra-facial Lever granuloma on a herpes zoster scar: Wolf's isotopic response. Ann Dermatol Venereol. 2018;145:354-358.
- Ferenczi K, Rosenberg AS, McCalmont TH, et al. Herpes zoster granulomatous dermatitis: histopathologic findings in a case series. J Cutan Pathol. 2015;42:739-745.
- Li Q, Wu H, Liao W, et al. A comprehensive review of immune-mediated dermatopathology in systemic lupus erythematosus. J Autoimmun. 2018;93:1-15.
The Diagnosis: Lichenoid and Granulomatous Dermatitis in the Setting of Secondary Syphilis
Syphilis, an infectious disease that has risen in incidence and is most commonly reported in men who have sex with men, involves a vast array of clinical and histologic presentations.1 Clinically, secondary syphilis involves an erythematous maculopapular eruption on the face, trunk, palms, soles, or genital area.2 The characteristic histologic features for secondary syphilis include endothelial swelling, interstitial inflammatory array, irregular acanthosis, elongated rete ridges, and vacuolar interface dermatitis with lymphocytes and plasma cells.1 Syphilitic infection has been associated with lichenoid and granulomatous dermatitis, which is an inflammatory skin disease described by Magro and Crowson.3 Lichenoid and granulomatous dermatitis has been linked to various systemic disorders, including chronic hepatitis C, Crohn disease, rheumatoid arthritis, endocrinopathy, subacute cutaneous lupus erythematosus, secondary syphilis, prior herpes infection, tuberculoid leprosy, mycobacterial infection, and human immunodeficiency virus infection.3-7 For this patient, given histopathology findings, clinical presentation, and positive rapid plasma reagin serologies, a diagnosis of lichenoid and granulomatous dermatitis in the setting of a secondary syphilis infection was established. A comprehensive investigation should be conducted to consider secondary syphilis or other systemic diseases in patients with a histologic finding of lichenoid and granulomatous dermatitis.
Histologically, lichenoid and granulomatous dermatitis cases show a bandlike infiltrate of lymphocytes with neighboring histiocytes along the dermoepidermal junction, accompanied by epithelial changes of dyskeratosis, vasculopathy, and colloid body formation, in addition to a dermal histiocytic component.3 Our patient's biopsy showed a lichenoid reaction pattern with vacuolar interface changes, dyskeratosis, plump endothelial cells, and small collections of plasma cells. Additionally, there was a granulomatous component in the dermis with histiocytes admixed with lymphocytes and plasma cells. The presence of spirochetes was confirmed with antitreponemal immunohistochemical stain (Figure 1). Quantitative rapid plasma reagin was 1:64 (reference range, <1:1) and Treponema pallidum antibody was reactive.
Interstitial granulomatous dermatitis has a variable clinical presentation, often with red-purple annular plaques, hyperpigmented papules, and nodules frequently in a linear arrangement and predominantly on the trunk, thighs, groin, or buttocks.8,9 On histopathology, there are histiocytes in the reticular dermis and/or a macrophage infiltrate in the mid to deep dermis with collections of degenerated collagen (Figure 2).8,10 An interstitial infiltrate of eosinophils and neutrophils also may be appreciated, but mucin generally is absent.8,11 This condition often coexists with rheumatic and systemic autoimmune diseases.8-10
Interstitial granuloma annulare is a noninfectious granulomatous skin condition that often presents clinically as asymptomatic annular red-brown patches, usually on the extremities.11-13 On histopathology, an interstitial or palisaded inflammatory infiltrate with histiocytes and multinucleated giant cells may be seen along with collagen degeneration or collagen bundles without necrosis (Figure 3).9 Mucin often is associated with the histiocytes.11 Of note, our patient's skin biopsy shows interface dermatitis, differentiating it from both interstitial granuloma annulare and interstitial granulomatous dermatitis.
Postviral granulomatous reactions are the most frequently reported types of reactions to occur at the location of herpes zoster infection up to years after the initial disease. Wolf isotopic reaction encompasses skin reactions in the body region of formerly resolved skin disease, commonly herpesvirus infection.14,15 This manifestation may occur due to a hypersensitivity reaction from enduring viral proteins, resident memory T cells, or local neuroimmune imbalance from herpesvirus-induced injury to dermal sensory nerve fibers.14-17 Clinically, patients present with red-purple pruritic papules and plaques in a bandlike unilateral pattern, usually in the same region as the prior herpes infection and often accompanied by postherpetic neuralgia.16-19 Of note, our patient's clinical findings were more diffuse than the frequently localized and often linear distribution seen in postherpetic granulomatous reaction. On histopathology, granulomatous or lichenoid tissue reaction most commonly is appreciated.15 Specifically, interstitial granulomatous dermatitis with histiocytes, lymphocytes, and multinucleated giant cells showing elastophagocytosis and an inflammatory infiltrate with lymphocytes and plasma cells around vasculature, eccrine glands, and nerves can be noted (Figure 4).19
Lupus erythematosus is an autoimmune condition with a wide array of clinical features, including skin manifestations and systemic symptoms. Specifically, discoid lupus erythematosus presents with clearly outlined, red-pink macules or papules with scaling. Histologic features include keratotic follicular plugging, acanthosis, dermal mucin, thickening of the basement membrane zone, and dense lymphocytic infiltrate (Figure 5).20
The Diagnosis: Lichenoid and Granulomatous Dermatitis in the Setting of Secondary Syphilis
Syphilis, an infectious disease that has risen in incidence and is most commonly reported in men who have sex with men, involves a vast array of clinical and histologic presentations.1 Clinically, secondary syphilis involves an erythematous maculopapular eruption on the face, trunk, palms, soles, or genital area.2 The characteristic histologic features for secondary syphilis include endothelial swelling, interstitial inflammatory array, irregular acanthosis, elongated rete ridges, and vacuolar interface dermatitis with lymphocytes and plasma cells.1 Syphilitic infection has been associated with lichenoid and granulomatous dermatitis, which is an inflammatory skin disease described by Magro and Crowson.3 Lichenoid and granulomatous dermatitis has been linked to various systemic disorders, including chronic hepatitis C, Crohn disease, rheumatoid arthritis, endocrinopathy, subacute cutaneous lupus erythematosus, secondary syphilis, prior herpes infection, tuberculoid leprosy, mycobacterial infection, and human immunodeficiency virus infection.3-7 For this patient, given histopathology findings, clinical presentation, and positive rapid plasma reagin serologies, a diagnosis of lichenoid and granulomatous dermatitis in the setting of a secondary syphilis infection was established. A comprehensive investigation should be conducted to consider secondary syphilis or other systemic diseases in patients with a histologic finding of lichenoid and granulomatous dermatitis.
Histologically, lichenoid and granulomatous dermatitis cases show a bandlike infiltrate of lymphocytes with neighboring histiocytes along the dermoepidermal junction, accompanied by epithelial changes of dyskeratosis, vasculopathy, and colloid body formation, in addition to a dermal histiocytic component.3 Our patient's biopsy showed a lichenoid reaction pattern with vacuolar interface changes, dyskeratosis, plump endothelial cells, and small collections of plasma cells. Additionally, there was a granulomatous component in the dermis with histiocytes admixed with lymphocytes and plasma cells. The presence of spirochetes was confirmed with antitreponemal immunohistochemical stain (Figure 1). Quantitative rapid plasma reagin was 1:64 (reference range, <1:1) and Treponema pallidum antibody was reactive.
Interstitial granulomatous dermatitis has a variable clinical presentation, often with red-purple annular plaques, hyperpigmented papules, and nodules frequently in a linear arrangement and predominantly on the trunk, thighs, groin, or buttocks.8,9 On histopathology, there are histiocytes in the reticular dermis and/or a macrophage infiltrate in the mid to deep dermis with collections of degenerated collagen (Figure 2).8,10 An interstitial infiltrate of eosinophils and neutrophils also may be appreciated, but mucin generally is absent.8,11 This condition often coexists with rheumatic and systemic autoimmune diseases.8-10
Interstitial granuloma annulare is a noninfectious granulomatous skin condition that often presents clinically as asymptomatic annular red-brown patches, usually on the extremities.11-13 On histopathology, an interstitial or palisaded inflammatory infiltrate with histiocytes and multinucleated giant cells may be seen along with collagen degeneration or collagen bundles without necrosis (Figure 3).9 Mucin often is associated with the histiocytes.11 Of note, our patient's skin biopsy shows interface dermatitis, differentiating it from both interstitial granuloma annulare and interstitial granulomatous dermatitis.
Postviral granulomatous reactions are the most frequently reported types of reactions to occur at the location of herpes zoster infection up to years after the initial disease. Wolf isotopic reaction encompasses skin reactions in the body region of formerly resolved skin disease, commonly herpesvirus infection.14,15 This manifestation may occur due to a hypersensitivity reaction from enduring viral proteins, resident memory T cells, or local neuroimmune imbalance from herpesvirus-induced injury to dermal sensory nerve fibers.14-17 Clinically, patients present with red-purple pruritic papules and plaques in a bandlike unilateral pattern, usually in the same region as the prior herpes infection and often accompanied by postherpetic neuralgia.16-19 Of note, our patient's clinical findings were more diffuse than the frequently localized and often linear distribution seen in postherpetic granulomatous reaction. On histopathology, granulomatous or lichenoid tissue reaction most commonly is appreciated.15 Specifically, interstitial granulomatous dermatitis with histiocytes, lymphocytes, and multinucleated giant cells showing elastophagocytosis and an inflammatory infiltrate with lymphocytes and plasma cells around vasculature, eccrine glands, and nerves can be noted (Figure 4).19
Lupus erythematosus is an autoimmune condition with a wide array of clinical features, including skin manifestations and systemic symptoms. Specifically, discoid lupus erythematosus presents with clearly outlined, red-pink macules or papules with scaling. Histologic features include keratotic follicular plugging, acanthosis, dermal mucin, thickening of the basement membrane zone, and dense lymphocytic infiltrate (Figure 5).20
- Flamm A, Parikh K, Xie Q, et al. Histologic features of secondary syphilis: a multicenter retrospective review. J Am Acad Dermatol. 2015;73:325-330.
- Zeltser R, Kurban AK. Syphilis. Clin Dermatol. 2004;22:461-468.
- Magro CM, Crowson AN. Lichenoid and granulomatous dermatitis. Int J Dermatol. 2000;39:12-33.
- S Breza T Jr, Magro CM. Lichenoid and granulomatous dermatitis associated with atypical mycobacterium infections. J Cutan Pathol. 2006;33:512-515.
- Granel B, Serratrice J, Rey J, et al. Chronic hepatitis C virus infection associated with a generalized granuloma annulare. J Am Acad Dermatol. 2000;43(5, pt 2):918-919.
- Jorizzo JL, Gonzalez EB, Apisarnthanarax P, et al. Pigmented purpuric eruption in a patient with rheumatoid arthritis. Arch Intern Med. 1982;142:2184-2185.
- Magro CM, Crowson AN, Regauer S. Granuloma annulare and necrobiosis lipoidica tissue reactions as a manifestation of systemic disease. Hum Pathol. 1996;27:50-56.
- Błażewicz I, Szczerkowska-Dobosz A, Pęksa R, et al. Interstitial granulomatous dermatitis: a characteristic histological pattern with variable clinical manifestations. Postepy Dermatol Alergol. 2015;32:475-477.
- Sezer E, Luzar B, Calonje E. Secondary syphilis with an interstitial granuloma annulare-like histopathologic pattern. J Cutan Pathol. 2011;38:439-442.
- Peroni A, Colato C, Schena D, et al. Interstitial granulomatous dermatitis: a distinct entity with characteristic histological and clinical pattern. Br J Dermatol. 2012;166:775-783.
- Sakiyama T, Hirai I, Konohana A, et al. Interstitial-type granuloma annulare associated with Sjögren syndrome. J Dtsch Dermatol Ges. 2014;12:415-416.
- Spring P, Vernez M, Maniu CM, et al. Localized interstitial granuloma annulare induced by subcutaneous injections for desensitization. Dermatol Online J. 2013;19:18572.
- Kluger N, Moguelet P, Chaslin-Ferbus D, et al. Generalized interstitial granuloma annulare induced by pegylated interferon-alpha. Dermatology. 2006;213:248-249.
- Ruocco E, Baroni A, Cutrì FT, et al. Granuloma annulare in a site of healed herpes zoster: Wolf's isotopic response. J Eur Acad Dermatol Venereol. 2003;17:686-688.
- Ise M, Tanese K, Adachi T, et al. Postherpetic Wolf's isotopic response: possible contribution of resident memory T cells to the pathogenesis of lichenoid reaction. Br J Dermatol. 2015;173:1331-1334.
- Lora V, Cota C, Kanitakis J. Zosteriform lichen planus after herpes zoster: report of a new case of Wolf's isotopic phenomenon and literature review. Dermatol Online J. 2014;20. pii:13030/qt5vf99178.
- Lin CH, Chen HC, Gao HW, et al. Wolf's post-herpetic isotopic response to tocilizumab for rheumatoid arthritis. Australas J Dermatol. 2018;59:E135-E137.
- Melgar E, Henry J, Valois A, et al. Extra-facial Lever granuloma on a herpes zoster scar: Wolf's isotopic response. Ann Dermatol Venereol. 2018;145:354-358.
- Ferenczi K, Rosenberg AS, McCalmont TH, et al. Herpes zoster granulomatous dermatitis: histopathologic findings in a case series. J Cutan Pathol. 2015;42:739-745.
- Li Q, Wu H, Liao W, et al. A comprehensive review of immune-mediated dermatopathology in systemic lupus erythematosus. J Autoimmun. 2018;93:1-15.
- Flamm A, Parikh K, Xie Q, et al. Histologic features of secondary syphilis: a multicenter retrospective review. J Am Acad Dermatol. 2015;73:325-330.
- Zeltser R, Kurban AK. Syphilis. Clin Dermatol. 2004;22:461-468.
- Magro CM, Crowson AN. Lichenoid and granulomatous dermatitis. Int J Dermatol. 2000;39:12-33.
- S Breza T Jr, Magro CM. Lichenoid and granulomatous dermatitis associated with atypical mycobacterium infections. J Cutan Pathol. 2006;33:512-515.
- Granel B, Serratrice J, Rey J, et al. Chronic hepatitis C virus infection associated with a generalized granuloma annulare. J Am Acad Dermatol. 2000;43(5, pt 2):918-919.
- Jorizzo JL, Gonzalez EB, Apisarnthanarax P, et al. Pigmented purpuric eruption in a patient with rheumatoid arthritis. Arch Intern Med. 1982;142:2184-2185.
- Magro CM, Crowson AN, Regauer S. Granuloma annulare and necrobiosis lipoidica tissue reactions as a manifestation of systemic disease. Hum Pathol. 1996;27:50-56.
- Błażewicz I, Szczerkowska-Dobosz A, Pęksa R, et al. Interstitial granulomatous dermatitis: a characteristic histological pattern with variable clinical manifestations. Postepy Dermatol Alergol. 2015;32:475-477.
- Sezer E, Luzar B, Calonje E. Secondary syphilis with an interstitial granuloma annulare-like histopathologic pattern. J Cutan Pathol. 2011;38:439-442.
- Peroni A, Colato C, Schena D, et al. Interstitial granulomatous dermatitis: a distinct entity with characteristic histological and clinical pattern. Br J Dermatol. 2012;166:775-783.
- Sakiyama T, Hirai I, Konohana A, et al. Interstitial-type granuloma annulare associated with Sjögren syndrome. J Dtsch Dermatol Ges. 2014;12:415-416.
- Spring P, Vernez M, Maniu CM, et al. Localized interstitial granuloma annulare induced by subcutaneous injections for desensitization. Dermatol Online J. 2013;19:18572.
- Kluger N, Moguelet P, Chaslin-Ferbus D, et al. Generalized interstitial granuloma annulare induced by pegylated interferon-alpha. Dermatology. 2006;213:248-249.
- Ruocco E, Baroni A, Cutrì FT, et al. Granuloma annulare in a site of healed herpes zoster: Wolf's isotopic response. J Eur Acad Dermatol Venereol. 2003;17:686-688.
- Ise M, Tanese K, Adachi T, et al. Postherpetic Wolf's isotopic response: possible contribution of resident memory T cells to the pathogenesis of lichenoid reaction. Br J Dermatol. 2015;173:1331-1334.
- Lora V, Cota C, Kanitakis J. Zosteriform lichen planus after herpes zoster: report of a new case of Wolf's isotopic phenomenon and literature review. Dermatol Online J. 2014;20. pii:13030/qt5vf99178.
- Lin CH, Chen HC, Gao HW, et al. Wolf's post-herpetic isotopic response to tocilizumab for rheumatoid arthritis. Australas J Dermatol. 2018;59:E135-E137.
- Melgar E, Henry J, Valois A, et al. Extra-facial Lever granuloma on a herpes zoster scar: Wolf's isotopic response. Ann Dermatol Venereol. 2018;145:354-358.
- Ferenczi K, Rosenberg AS, McCalmont TH, et al. Herpes zoster granulomatous dermatitis: histopathologic findings in a case series. J Cutan Pathol. 2015;42:739-745.
- Li Q, Wu H, Liao W, et al. A comprehensive review of immune-mediated dermatopathology in systemic lupus erythematosus. J Autoimmun. 2018;93:1-15.
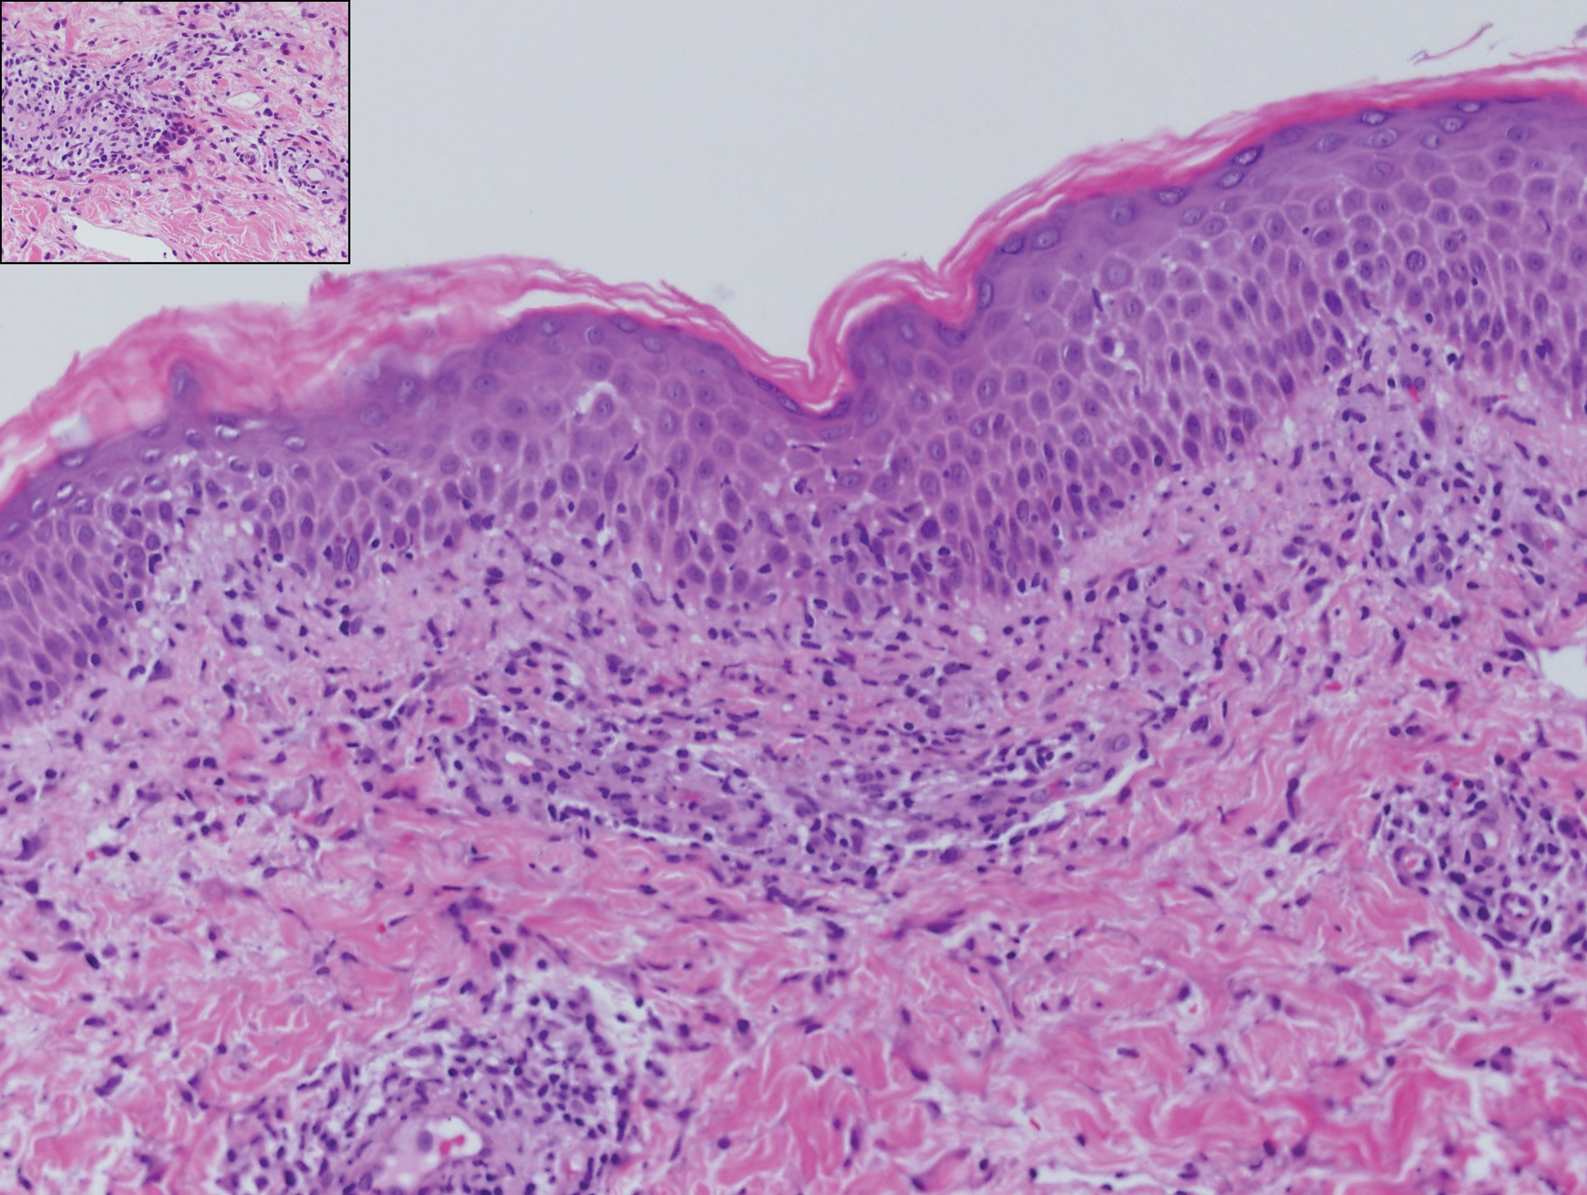
A 54-year-old man presented with painful, nonpruritic, erythematous papules that began on the scrotum. The eruption progressed to involve the trunk, arms, and legs.
Twin births down among women 30 and older
according to the National Center for Health Statistics.
The twin birthrate, which had increased by 79% during 1980-2014, fell by 4% during 2014-2018, but that decline was “not universal across maternal age and race and Hispanic-origin groups,” the NCHS investigators said.
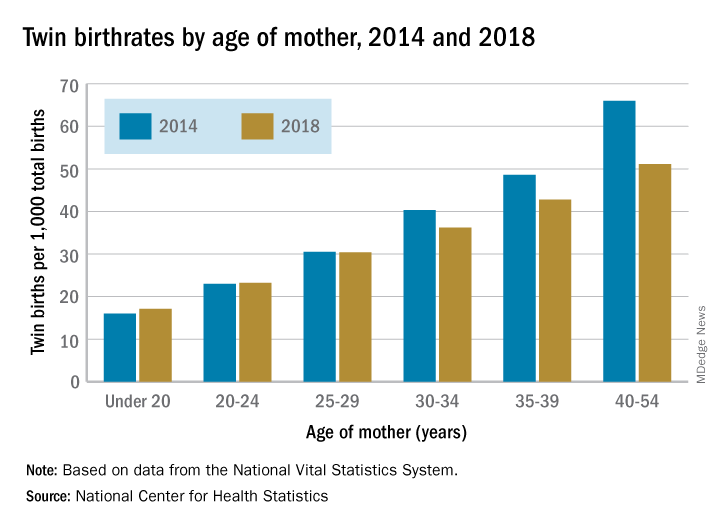
Twin birthrates fell by at least 10% for mothers aged 30 years and older from 2014 to 2018 but held steady for women in their twenties. Over that same period, the twin birthrate fell by a significant 7% among non-Hispanic white women (36.7 to 34.3 per 1,000 total births) but increased just slightly for non-Hispanic black women (40.0 to 40.5 per 1,000) and Hispanic women (24.1 to 24.4), the investigators reported.
For women 30 years and older, the drops in twin births got larger as age increased and were significant for each age group. The rate for women aged 30-34 years fell 10% as it went from 40.3 per 1,000 total births in 2014 to 36.2 per 1,000. The decrease was 12% (from 48.6 per 1,000 to 42.8) for women aged 35-39 and 23% (from 66.0 to 51.1) for those aged 40 years and older, they said based on data from the National Vital Statistics System.
The rates were basically unchanged for women in their 20s, from 23.0 to 23.2 in 20- to 24-year-olds and 30.5 to 30.4 in 25- to 29-year-olds – but there was a significant increase for the youngest group with rates among those younger than 20 years going from 16.0 to 17.1 per 1,000, the report showed.
according to the National Center for Health Statistics.
The twin birthrate, which had increased by 79% during 1980-2014, fell by 4% during 2014-2018, but that decline was “not universal across maternal age and race and Hispanic-origin groups,” the NCHS investigators said.
Twin birthrates fell by at least 10% for mothers aged 30 years and older from 2014 to 2018 but held steady for women in their twenties. Over that same period, the twin birthrate fell by a significant 7% among non-Hispanic white women (36.7 to 34.3 per 1,000 total births) but increased just slightly for non-Hispanic black women (40.0 to 40.5 per 1,000) and Hispanic women (24.1 to 24.4), the investigators reported.
For women 30 years and older, the drops in twin births got larger as age increased and were significant for each age group. The rate for women aged 30-34 years fell 10% as it went from 40.3 per 1,000 total births in 2014 to 36.2 per 1,000. The decrease was 12% (from 48.6 per 1,000 to 42.8) for women aged 35-39 and 23% (from 66.0 to 51.1) for those aged 40 years and older, they said based on data from the National Vital Statistics System.
The rates were basically unchanged for women in their 20s, from 23.0 to 23.2 in 20- to 24-year-olds and 30.5 to 30.4 in 25- to 29-year-olds – but there was a significant increase for the youngest group with rates among those younger than 20 years going from 16.0 to 17.1 per 1,000, the report showed.
according to the National Center for Health Statistics.
The twin birthrate, which had increased by 79% during 1980-2014, fell by 4% during 2014-2018, but that decline was “not universal across maternal age and race and Hispanic-origin groups,” the NCHS investigators said.
Twin birthrates fell by at least 10% for mothers aged 30 years and older from 2014 to 2018 but held steady for women in their twenties. Over that same period, the twin birthrate fell by a significant 7% among non-Hispanic white women (36.7 to 34.3 per 1,000 total births) but increased just slightly for non-Hispanic black women (40.0 to 40.5 per 1,000) and Hispanic women (24.1 to 24.4), the investigators reported.
For women 30 years and older, the drops in twin births got larger as age increased and were significant for each age group. The rate for women aged 30-34 years fell 10% as it went from 40.3 per 1,000 total births in 2014 to 36.2 per 1,000. The decrease was 12% (from 48.6 per 1,000 to 42.8) for women aged 35-39 and 23% (from 66.0 to 51.1) for those aged 40 years and older, they said based on data from the National Vital Statistics System.
The rates were basically unchanged for women in their 20s, from 23.0 to 23.2 in 20- to 24-year-olds and 30.5 to 30.4 in 25- to 29-year-olds – but there was a significant increase for the youngest group with rates among those younger than 20 years going from 16.0 to 17.1 per 1,000, the report showed.
Dismantling the opioid crisis
Dr. John Hickner’s editorial, “Doing our part to dismantle the opioid crisis” (J Fam Pract 2019;68:308) had important inaccuracies.
The Joint Commission, for which I serve as an executive vice president, did not “dub pain assessment the ‘fifth vital sign’. ” The concept of the fifth vital sign was developed by the American Pain Society in the 1990s.1 It gained national attention through a Veterans Health Administration initiative in 1999.2 And in 2001, the Joint Commission (then the Joint Commission on Accreditation of Healthcare Organizations or JCAHO) issued its Pain Standards.
Dr. Hickner wrote that the push to assess for pain as the fifth vital sign was a central cause of the opioid epidemic; however, this is contrary to published data on the epidemic. Total opioid prescriptions had been steadily increasing in the United States for at least a decade before the Pain Standards went into effect in 2001 (FIGURE).3 Between 1991 and 1997, the number of prescriptions increased from 76 million to 97 million. The rate of increase from 1997 to 2011 appears to have been more rapid, which is likely due to the 1995 approval of the new sustained-release opioid OxyContin and the associated aggressive marketing campaigns to physicians.

Your readers should know that we, at the Joint Commission, are also “doing our part to dismantle the opioid crisis.” In 2016, we completely revised our Pain Standards, adding new criteria to help address the epidemic. Some adjustments include: requiring improved availability of nonpharmacologic therapy, encouraging engagement of patients in pain management plans, enhancing accessibility of Physician Drug Monitoring Program tools, and monitoring opioid prescribing.
David W. Baker, MD, FACP, executive vice president
The Joint Commission, Oakbrook Terrace, IL
1. American Pain Society. Principles of Analgesic Use in the Treatment of Acute Pain and Chronic Cancer Pain. 2nd ed. Skokie, Illinois: American Pain Society; 1989.
2. Department of Veteran’s Affairs. Pain: the fifth vital sign. www.va.gov/PAINMANAGEMENT/docs/Pain_As_the_5th_Vital_Sign_Toolkit.pdf. Published October 2000. Accessed September 30, 2019.
3 National Institute on Drug Abuse. America’s addiction to opioids: heroin and prescription drug abuse. https://archives.drugabuse.gov/testimonies/2014/americas-addiction-to-opioids-heroin-prescription-drug-abuse. Published May 14, 2014. Accessed September 30, 2019.
Dr. John Hickner’s editorial, “Doing our part to dismantle the opioid crisis” (J Fam Pract 2019;68:308) had important inaccuracies.
The Joint Commission, for which I serve as an executive vice president, did not “dub pain assessment the ‘fifth vital sign’. ” The concept of the fifth vital sign was developed by the American Pain Society in the 1990s.1 It gained national attention through a Veterans Health Administration initiative in 1999.2 And in 2001, the Joint Commission (then the Joint Commission on Accreditation of Healthcare Organizations or JCAHO) issued its Pain Standards.
Dr. Hickner wrote that the push to assess for pain as the fifth vital sign was a central cause of the opioid epidemic; however, this is contrary to published data on the epidemic. Total opioid prescriptions had been steadily increasing in the United States for at least a decade before the Pain Standards went into effect in 2001 (FIGURE).3 Between 1991 and 1997, the number of prescriptions increased from 76 million to 97 million. The rate of increase from 1997 to 2011 appears to have been more rapid, which is likely due to the 1995 approval of the new sustained-release opioid OxyContin and the associated aggressive marketing campaigns to physicians.
Your readers should know that we, at the Joint Commission, are also “doing our part to dismantle the opioid crisis.” In 2016, we completely revised our Pain Standards, adding new criteria to help address the epidemic. Some adjustments include: requiring improved availability of nonpharmacologic therapy, encouraging engagement of patients in pain management plans, enhancing accessibility of Physician Drug Monitoring Program tools, and monitoring opioid prescribing.
David W. Baker, MD, FACP, executive vice president
The Joint Commission, Oakbrook Terrace, IL
Dr. John Hickner’s editorial, “Doing our part to dismantle the opioid crisis” (J Fam Pract 2019;68:308) had important inaccuracies.
The Joint Commission, for which I serve as an executive vice president, did not “dub pain assessment the ‘fifth vital sign’. ” The concept of the fifth vital sign was developed by the American Pain Society in the 1990s.1 It gained national attention through a Veterans Health Administration initiative in 1999.2 And in 2001, the Joint Commission (then the Joint Commission on Accreditation of Healthcare Organizations or JCAHO) issued its Pain Standards.
Dr. Hickner wrote that the push to assess for pain as the fifth vital sign was a central cause of the opioid epidemic; however, this is contrary to published data on the epidemic. Total opioid prescriptions had been steadily increasing in the United States for at least a decade before the Pain Standards went into effect in 2001 (FIGURE).3 Between 1991 and 1997, the number of prescriptions increased from 76 million to 97 million. The rate of increase from 1997 to 2011 appears to have been more rapid, which is likely due to the 1995 approval of the new sustained-release opioid OxyContin and the associated aggressive marketing campaigns to physicians.
Your readers should know that we, at the Joint Commission, are also “doing our part to dismantle the opioid crisis.” In 2016, we completely revised our Pain Standards, adding new criteria to help address the epidemic. Some adjustments include: requiring improved availability of nonpharmacologic therapy, encouraging engagement of patients in pain management plans, enhancing accessibility of Physician Drug Monitoring Program tools, and monitoring opioid prescribing.
David W. Baker, MD, FACP, executive vice president
The Joint Commission, Oakbrook Terrace, IL
1. American Pain Society. Principles of Analgesic Use in the Treatment of Acute Pain and Chronic Cancer Pain. 2nd ed. Skokie, Illinois: American Pain Society; 1989.
2. Department of Veteran’s Affairs. Pain: the fifth vital sign. www.va.gov/PAINMANAGEMENT/docs/Pain_As_the_5th_Vital_Sign_Toolkit.pdf. Published October 2000. Accessed September 30, 2019.
3 National Institute on Drug Abuse. America’s addiction to opioids: heroin and prescription drug abuse. https://archives.drugabuse.gov/testimonies/2014/americas-addiction-to-opioids-heroin-prescription-drug-abuse. Published May 14, 2014. Accessed September 30, 2019.
1. American Pain Society. Principles of Analgesic Use in the Treatment of Acute Pain and Chronic Cancer Pain. 2nd ed. Skokie, Illinois: American Pain Society; 1989.
2. Department of Veteran’s Affairs. Pain: the fifth vital sign. www.va.gov/PAINMANAGEMENT/docs/Pain_As_the_5th_Vital_Sign_Toolkit.pdf. Published October 2000. Accessed September 30, 2019.
3 National Institute on Drug Abuse. America’s addiction to opioids: heroin and prescription drug abuse. https://archives.drugabuse.gov/testimonies/2014/americas-addiction-to-opioids-heroin-prescription-drug-abuse. Published May 14, 2014. Accessed September 30, 2019.
Burned out? Change your practice
This month’s cover story addresses a phenomenon familiar to all of us: burnout. Mohanty and colleagues provide an excellent, concise summary of what burnout is, the probable causes of it, and possible solutions.
What has puzzled me about burnout is why there was no discussion of it 30 years ago when physicians worked easily as many hours but did not complain of being “burned out.” We just described ourselves as being tired. One could argue that the disconnect is due to a change in physicians’ expectations, but that theory does not hold up because burnout is common in both older and younger physicians.
I think that Dr. Wendy Dean, a psychiatrist at the Henry M. Jackson Foundation for the Advancement of Military Medicine, and her colleagues are correct in identifying a different culprit. They contend that the real issue is that we are “increasingly forced to consider the demands of other stakeholders—the electronic medical record (EMR), the insurers, the hospital, the health care system, even our own financial security—before the needs of our patients.”1 To redefine the problem of burnout, Dr. Dean uses a different term to label this phenomenon of exhaustion, demoralization, and depersonalization. She calls it “moral injury.”
“Moral injury . . . describes the challenge of simultaneously knowing what care patients need but being unable to provide it due to constraints that are beyond our control.”1
So what needs to change? No amount of yoga, mindfulness, meditation, or exercise will be sufficient, although these are great therapeutic activities. Office redesign, however, has already been shown to be highly effective in reducing physician burnout. For example, in an intensive practice redesign project in Colorado that included hiring more medical assistants, physician burnout declined from 56% to 25% in the first practice and from 40% to 0% in the second practice!2
One of the oldest examples of using team care to reduce physician burnout was implemented by Dr. Peter Anderson in 2003.3 Dr. Anderson was on the brink of throwing in the towel when he hired a second nurse and redistributed many tasks to the nurses. In a few years he had a thriving and satisfying practice for himself, his staff, and his patients.
These are only 2 examples of many successful redesign projects around the country. If you are getting burned out, change your practice, not yourself.
1. Dean W, Talbot S, Dean A. Reframing clinician distress: moral injury not burnout. Fed Pract. 2019;36:400-402.
2. Smith PC, Lyon C, English AF, et al. Practice transformation under the University of Colorado’s primary care redesign model. Ann Fam Med. 2019;17(suppl 1):S24-S32.
3. Anderson P, Halley MD. A new approach to making your doctor-nurse team more productive. Fam Pract Manag. 2008;15:35-40.
Editor-in-Chief
Editor-in-Chief
Editor-in-Chief
This month’s cover story addresses a phenomenon familiar to all of us: burnout. Mohanty and colleagues provide an excellent, concise summary of what burnout is, the probable causes of it, and possible solutions.
What has puzzled me about burnout is why there was no discussion of it 30 years ago when physicians worked easily as many hours but did not complain of being “burned out.” We just described ourselves as being tired. One could argue that the disconnect is due to a change in physicians’ expectations, but that theory does not hold up because burnout is common in both older and younger physicians.
I think that Dr. Wendy Dean, a psychiatrist at the Henry M. Jackson Foundation for the Advancement of Military Medicine, and her colleagues are correct in identifying a different culprit. They contend that the real issue is that we are “increasingly forced to consider the demands of other stakeholders—the electronic medical record (EMR), the insurers, the hospital, the health care system, even our own financial security—before the needs of our patients.”1 To redefine the problem of burnout, Dr. Dean uses a different term to label this phenomenon of exhaustion, demoralization, and depersonalization. She calls it “moral injury.”
“Moral injury . . . describes the challenge of simultaneously knowing what care patients need but being unable to provide it due to constraints that are beyond our control.”1
So what needs to change? No amount of yoga, mindfulness, meditation, or exercise will be sufficient, although these are great therapeutic activities. Office redesign, however, has already been shown to be highly effective in reducing physician burnout. For example, in an intensive practice redesign project in Colorado that included hiring more medical assistants, physician burnout declined from 56% to 25% in the first practice and from 40% to 0% in the second practice!2
One of the oldest examples of using team care to reduce physician burnout was implemented by Dr. Peter Anderson in 2003.3 Dr. Anderson was on the brink of throwing in the towel when he hired a second nurse and redistributed many tasks to the nurses. In a few years he had a thriving and satisfying practice for himself, his staff, and his patients.
These are only 2 examples of many successful redesign projects around the country. If you are getting burned out, change your practice, not yourself.
This month’s cover story addresses a phenomenon familiar to all of us: burnout. Mohanty and colleagues provide an excellent, concise summary of what burnout is, the probable causes of it, and possible solutions.
What has puzzled me about burnout is why there was no discussion of it 30 years ago when physicians worked easily as many hours but did not complain of being “burned out.” We just described ourselves as being tired. One could argue that the disconnect is due to a change in physicians’ expectations, but that theory does not hold up because burnout is common in both older and younger physicians.
I think that Dr. Wendy Dean, a psychiatrist at the Henry M. Jackson Foundation for the Advancement of Military Medicine, and her colleagues are correct in identifying a different culprit. They contend that the real issue is that we are “increasingly forced to consider the demands of other stakeholders—the electronic medical record (EMR), the insurers, the hospital, the health care system, even our own financial security—before the needs of our patients.”1 To redefine the problem of burnout, Dr. Dean uses a different term to label this phenomenon of exhaustion, demoralization, and depersonalization. She calls it “moral injury.”
“Moral injury . . . describes the challenge of simultaneously knowing what care patients need but being unable to provide it due to constraints that are beyond our control.”1
So what needs to change? No amount of yoga, mindfulness, meditation, or exercise will be sufficient, although these are great therapeutic activities. Office redesign, however, has already been shown to be highly effective in reducing physician burnout. For example, in an intensive practice redesign project in Colorado that included hiring more medical assistants, physician burnout declined from 56% to 25% in the first practice and from 40% to 0% in the second practice!2
One of the oldest examples of using team care to reduce physician burnout was implemented by Dr. Peter Anderson in 2003.3 Dr. Anderson was on the brink of throwing in the towel when he hired a second nurse and redistributed many tasks to the nurses. In a few years he had a thriving and satisfying practice for himself, his staff, and his patients.
These are only 2 examples of many successful redesign projects around the country. If you are getting burned out, change your practice, not yourself.
1. Dean W, Talbot S, Dean A. Reframing clinician distress: moral injury not burnout. Fed Pract. 2019;36:400-402.
2. Smith PC, Lyon C, English AF, et al. Practice transformation under the University of Colorado’s primary care redesign model. Ann Fam Med. 2019;17(suppl 1):S24-S32.
3. Anderson P, Halley MD. A new approach to making your doctor-nurse team more productive. Fam Pract Manag. 2008;15:35-40.
1. Dean W, Talbot S, Dean A. Reframing clinician distress: moral injury not burnout. Fed Pract. 2019;36:400-402.
2. Smith PC, Lyon C, English AF, et al. Practice transformation under the University of Colorado’s primary care redesign model. Ann Fam Med. 2019;17(suppl 1):S24-S32.
3. Anderson P, Halley MD. A new approach to making your doctor-nurse team more productive. Fam Pract Manag. 2008;15:35-40.