User login
Investigators identify 21 genomic “hotspots” in breast cancers
Cancer geneticists have identified 21 clusters of complex chromosomal rearrangements in breast cancers that contain both known oncogenes and potential new driver loci.
A systematic analysis of chromosomal rearrangements in tissues from 560 patients with breast cancer identified 21 “hotspots,” some of which contain known oncogene chromosomal loci, and others of which contain genes not typically associated with breast cancer, reported Serena Nik-Zainal, PhD, of the University of Cambridge, England, and her colleagues.
“Detailed analysis of rearrangements at these hotspots highlights chromosomal aberrations likely driven by selection, and reveal underlying mutational processes,” they wrote in a study published online in Annals of Oncology.
The investigators sought insight into mutational mechanisms of gene amplifications by examining clustered rearrangements – somatic breakpoints occurring in high densities – in individual patients.
To see whether these rearrangements were associated with breast cancer, they identified the aforementioned chromosomal hotspots where clustered rearrangements were seen in samples from different patients.
They identified 624 cluster rearrangements in the 560 breast cancer genomes, including 17,247 within-chromosome rearrangements, and 6,509 between-chromosome translocations.
Of the 560 samples, 372 had at least one rearrangement cluster, with the frequency of clusters similar between some breast cancer types. For example, there were 0.96 rearrangements clusters per sample from patients with triple negative breast cancers, and 1.00 per sample from women with estrogen receptor–positive tumors.
“To identify loci where clusters of rearrangements recur across multiple independent tumor samples, we pooled all breakpoints in the ‘clustered’ category and sorted them according to position in the reference genome,” the investigators explained.
They used a Piecewise-Constant-Fitting algorithm to identify genome sequences where there were short inter-mutation distances between rearrangement clusters, suggesting the presence of hotspots.
In the 21 hotspots they identified, they found, as expected, common driver amplification regions (e.g., CCND1, ERBB2, ZNF217, chr8:ZNF703/FGFR1, IGF1R, and MYC), but also several hotspots near oncogenes that are not typically associated with breast cancer.
Notably, they saw simultaneous amplification of regions on chromosomes 8 and 11 (chr8:ZNF703/FGFR1 and chr11:CCND1). Amplification of these regions are frequent in estrogen receptor–positive breast cancers. The investigators propose a pathogenic model in which a chromosome 8 to chromosome 11 translocation is an early, critical event leading to breast tumor development.
“Clustered rearrangements are common in breast cancer genomes, and often associated with gene amplifications that drive oncogenesis. Understanding the process of amplicon formation, an example of which we present here for the chr8:ZNF703/FGFR1 and chr11:CCND1 co-amplifications, will be important for our understanding of the origins of a subset of breast cancers,” they concluded.
The study was supported by an award from the Wellcome Trust. Dr. Nik-Zainal and coauthor Dominik Glodzik are inventors on several patent applications. All remaining authors declared no conflicts of interest.
SOURCE: Glodzik D et al. Ann Oncol. 2018 Sept 25. doi: 10.1093/annonc/mdy404.
FROM ANNALS OF ONCOLOGY
Key clinical point: Chromosomal rearrangement “hotspots” contain both known breast cancer oncogenes and potential new loci that may explain the mechanism of deleterious gene amplifications.
Major finding: A chromosome 8 to 11 translocation may be the initiating event for some breast cancer subtypes.
Study details: Genomic analysis of samples from 560 patients with breast cancer.
Disclosures: The study was supported by an award from the Wellcome Trust. Dr. Nik-Zainal and coauthor Dominik Glodzik are inventors on several patent applications. All remaining authors declared no conflicts of interest.
Source: Glodzik D et al. Ann Oncol. 2018 Sep 25. doi: 10.1093/annonc/mdy404.
Sexual assault and harassment linked to hypertension, depression, and anxiety
Sexual harassment and assault may have significant health impacts on women in midlife, including greater risk of hypertension, poor sleep, depression, and anxiety, research suggests.

In the Oct. 3 online edition of JAMA Internal Medicine, a study of 304 women aged 40-60 years showed that 19% reported a history of workplace sexual harassment, 22% reported a history of sexual assault, and 10% reported both. The report was presented simultaneously at the North American Menopause Society annual meeting in San Diego.
The researchers found that those with a history of sexual assault had an almost threefold higher odds of clinically elevated depressive symptoms (OR, 2.86, P = .003), and more than twofold greater odds of anxiety and poor sleep (OR, 2.26, P = .006 and OR, 2.15, P = .007 respectively).
Women who reported experiencing sexual harassment in the workplace – and who were not taking antihypertensive medication – were more than twice as likely to have stage 1 or 2 hypertension, compared with women who had not experienced sexual harassment (OR, 2.36, P = .03). They also had 89% higher odds of poor sleep consistent with clinical insomnia (P = .03).
These associations all persisted even after adjustment for demographic and biomedical factors such as age, ethnicity, body mass index, snoring, and the use of antihypertensive, antidepressant, and anti-anxiety medications.
“Given the high prevalence of sexual harassment and assault, addressing these prevalent and potent social exposures may be critical to promoting health and preventing disease in women,” wrote Rebecca C. Thurston, PhD, of the department of psychiatry at the University of Pittsburgh, and her coauthors.

They noted that the 1-in-5 rate of sexual harassment or assault seen in the study was actually lower than that seen in national samples, which may be have been because of the exclusion of women who smoked, had undergone hysterectomies, or were using common antidepressants or cardiovascular medications.
“Few characteristics distinguished between women who had been sexually harassed and those who had been sexually assaulted, with the exception that women who were sexually harassed were more highly educated yet more financially strained,” they wrote. “Notably, women who are younger or are in more precarious employment situations are more likely to be harassed, and financially stressed women can lack the financial security to leave abusive work situations.”
The study was supported by the National Institutes of Health, National Heart Lung and Blood Institute, and the University of Pittsburgh Clinical and Translational Science Institute. Dr. Thurston declared consultancies for MAS Innovations, Procter & Gamble, and Pfizer, but no other conflicts of interest were declared.
SOURCE: Thurston R et al. JAMA Intern Med. 2018, Oct 3. doi: 10.1001/jamainternmed.2018.4886.
Sexual harassment and assault may have significant health impacts on women in midlife, including greater risk of hypertension, poor sleep, depression, and anxiety, research suggests.
In the Oct. 3 online edition of JAMA Internal Medicine, a study of 304 women aged 40-60 years showed that 19% reported a history of workplace sexual harassment, 22% reported a history of sexual assault, and 10% reported both. The report was presented simultaneously at the North American Menopause Society annual meeting in San Diego.
The researchers found that those with a history of sexual assault had an almost threefold higher odds of clinically elevated depressive symptoms (OR, 2.86, P = .003), and more than twofold greater odds of anxiety and poor sleep (OR, 2.26, P = .006 and OR, 2.15, P = .007 respectively).
Women who reported experiencing sexual harassment in the workplace – and who were not taking antihypertensive medication – were more than twice as likely to have stage 1 or 2 hypertension, compared with women who had not experienced sexual harassment (OR, 2.36, P = .03). They also had 89% higher odds of poor sleep consistent with clinical insomnia (P = .03).
These associations all persisted even after adjustment for demographic and biomedical factors such as age, ethnicity, body mass index, snoring, and the use of antihypertensive, antidepressant, and anti-anxiety medications.
“Given the high prevalence of sexual harassment and assault, addressing these prevalent and potent social exposures may be critical to promoting health and preventing disease in women,” wrote Rebecca C. Thurston, PhD, of the department of psychiatry at the University of Pittsburgh, and her coauthors.
They noted that the 1-in-5 rate of sexual harassment or assault seen in the study was actually lower than that seen in national samples, which may be have been because of the exclusion of women who smoked, had undergone hysterectomies, or were using common antidepressants or cardiovascular medications.
“Few characteristics distinguished between women who had been sexually harassed and those who had been sexually assaulted, with the exception that women who were sexually harassed were more highly educated yet more financially strained,” they wrote. “Notably, women who are younger or are in more precarious employment situations are more likely to be harassed, and financially stressed women can lack the financial security to leave abusive work situations.”
The study was supported by the National Institutes of Health, National Heart Lung and Blood Institute, and the University of Pittsburgh Clinical and Translational Science Institute. Dr. Thurston declared consultancies for MAS Innovations, Procter & Gamble, and Pfizer, but no other conflicts of interest were declared.
SOURCE: Thurston R et al. JAMA Intern Med. 2018, Oct 3. doi: 10.1001/jamainternmed.2018.4886.
FROM JAMA INTERNAL MEDICINE
Key clinical point:
Major finding: Women who have experienced sexual assault showed nearly threefold higher odds of depressive symptoms.
Study details: Study of 304 women aged 40-60 years.
Disclosures: The study was supported by the National Institutes of Health, National Heart Lung and Blood Institute, and the University of Pittsburgh Clinical and Translational Science Institute. Dr. Thurston declared consultancies for MAS Innovations, Procter & Gamble, and Pfizer, but no other conflicts of interest were declared.
Source: Thurston R et al. JAMA Intern Med. 2018 Oct 3. doi: 10.1001/jamainternmed.2018.4886.
IMPower132 trial: Atezolizumab improves PFS in advanced nonsquamous NSCLC
TORONTO – Adding the programmed death-ligand 1 (PD-L1) inhibitor atezolizumab to standard first-line chemotherapy and maintenance therapy in patients with advanced nonsquamous non–small-cell lung cancer significantly improved progression-free survival (PFS), in the randomized, open-label IMpower132 trial.
At a minimum follow-up of 11.7 months (median, 14.8 months), investigator-assessed median PFS in 292 patients enrolled in the atezolizumab arm of the global study was 7.6 months, compared with 5.2 months – a 40% reduction in risk of disease progression – in 286 patients who received only first-line carboplatin plus pemetrexed and pemetrexed maintenance therapy (hazard ratio, 0.60), Vassiliki A Papadimitrakopoulou, MD, reported at the World Conference on Lung Cancer.
“The landmark PFS at 12-months showed almost a doubling for the investigational arm [at] 33.7% vs. 17%,” said Dr. Papadimitrakopoulou, professor of medicine and chief of the section of thoracic medical oncology at MD Anderson Cancer Center in Houston. “PFS benefit was seen across all key subgroups, [and was] especially pronounced for female patients (HR, 0.51), Asian patients (HR, 0.42), never-smokers (HR, 0.49), and patients who didn’t have liver metastases (HR, 0.56).”
PFS was also looked at – as an exploratory endpoint – by PD-L1 status in biomarker-evaluable patients, and “again, benefit was seen across all PD-L1-defined subgroups with a consistent trend for most benefit among the highest expressers,” she noted.
Median PFS was 10.8 months in 25 atezolizumab-treated patients with high PD-L1 expression, vs. 6.5 months in 20 control group patients with high PD-L1 expression; 6.2 vs. 5.7 months in 63 and 73 patients with low-PD-L1 expression in the groups, respectively; and 8.5 vs. 4.9 months in 88 and 75 PD-L1-negative patients in the groups, respectively, she reported at the conference, which was sponsored by the International Association for the Study of Lung Cancer.
Interim analyses also showed a numerically superior improvement in median and 12-month overall survival in the atezolizumab vs. control group (median, 18.1 vs. 13.6 months; HR, 0.813; P = .0797; 12-month, 59.6% vs. 55.4%), she said, adding that overall survival will be looked at again at the final analysis of the data, which is anticipated some time in the first half of 2019.
Study participants were chemotherapy-naive patients with measurable stage IV nonsquamous NSCLC and Eastern Cooperative Oncology Group Performance Status 0-1. Those with tumors known to harbor epidermal growth factor receptor or anaplastic lymphoma kinase driver mutations were excluded, as were those with untreated central nervous system metastases, autoimmune disease, and prior exposure to immunotherapy.
All patients received four or six cycles of carboplatin at a dose of area under the curve 6 mg/mL/min or cisplatin at a dose of 75 mg/m2 plus 500 mg/m2 of pemetrexed every 3 weeks, and those in the experimental arm also received 1,200 mg of atezolizumab every 3 weeks. Maintenance therapy included pemetrexed alone in the control arm, and atezolizumab plus pemetrexed in the experimental arm.
Treatment was well tolerated, and no new safety signals emerged, Dr. Papadimitrakopoulou said, noting that adverse events were similar in the groups, but more common in the atezolizumab-treated patients. Grade 3-4 treatment-related adverse events occurred in 54% of patients receiving atezolizumab vs. 39% of those in the control group, and serious adverse events occurred in 33% vs. 16%.
“The findings from IMpower132 indicate that the addition of atezolizumab to a backbone of carboplatin and pemetrexed chemotherapy provides better clinical efficacy than carboplatin and pemetrexed alone,” Dr. Papadimitrakopoulou said in a press statement. “By inhibiting the interaction of PD-L1 with its receptors PD-1 and B7.1, atezolizumab restores tumor-specific T-cell immunity, offering a valuable treatment option that prolongs survival for patients with stage IV nonsquamous NSCLC.”
IMpower132 is sponsored by F. Hoffmann–La Roche Ltd. Dr. Papadimitrakopoulou has received research support from, and/or is an advisory board member for numerous companies including F. Hoffmann–La Roche.
SOURCE: Papadimitrakopoulou V et al. WCLC 2018 Abstract OA05.07.
REPORTING FROM WCLC 2018
Key clinical point: Atezolizumab added to first-line chemotherapy and maintenance improved PFS in advanced nonsquamous NSCLC
Major finding: Median PFS was 7.6 months vs. 5.2 months (HR, 0.60).
Study details: A global, randomized, open-label trial of 578 patients.
Disclosures: IMpower132 is sponsored by F. Hoffmann–La Roche Ltd. Dr. Papadimitrakopoulou has received research support from, and/or is an advisory board member for numerous companies including F. Hoffmann–La Roche.
Source: Papadimitrakopoulou V et al. WCLC 2018 Abstract OA05.07.
Diagnosing placenta accreta spectrum with prenatal ultrasound
Placenta accreta spectrum (PAS) describes abnormal invasion of placental tissue into or through the myometrium, comprising 3 distinct conditions: placenta accreta, placenta increta, and placenta percreta. This complication is relatively new to obstetrics, first described in 1937.1
The overall incidence of PAS has been increasing over several decades, in parallel to an increasing rate of cesarean delivery (CD), with an incidence from 1982 through 2002 of 1 in 533 pregnancies, representing a 5-fold increase since the 1980s.2 PAS is associated with significant morbidity and mortality, including fetal growth restriction, preterm delivery, placental abruption antenatally, and hemorrhage during delivery or postpartum.
Prenatal diagnosis of PAS and planned delivery at an experienced center are associated with significant reduction in maternal and fetal morbidity.3 In an era of advanced imaging modalities, prenatal detection of PAS regrettably remains variable and largely subjective: As many as 20% to 50% of cases of PAS escape prenatal diagnosis.3,4
In this article, we review the sonographic markers of PAS, including diagnostic accuracy, and propose a standardized approach to prenatal diagnosis. Throughout our discussion, we describe protocols for detection of PAS practiced at our Maternal-Fetal Medicine Program in the Department of Obstetrics and Gynecology, Eastern Virginia Medical School (also see “US evaluation of PAS risk: The authors’ recommended approach”).
Numerous risk factors
There are many risk factors for PAS, including prior uterine surgery or instrumentation, such as CD, uterine curettage, myomectomy, pelvic radiation, and endometrial ablation. Other risk factors include smoking, in vitro fertilization, advanced maternal age, multiparity, and a brief interval between prior CD and subsequent pregnancy.5 Of major significance is the increased risk of PAS in the presence of placenta previa with prior CD.6 Knowledge of clinical risk factors by the interpreting physician appears to be associated with improved detection of PAS on ultrasonography (US).4
Ultrasonographic markers of PAS
First-trimester markers
Sonographic markers of PAS in the first trimester include:
- a gestational sac implanted in the lower uterine segment or in a CD scar
- multiple hypoechoic spaces within the placenta (lacunae).7
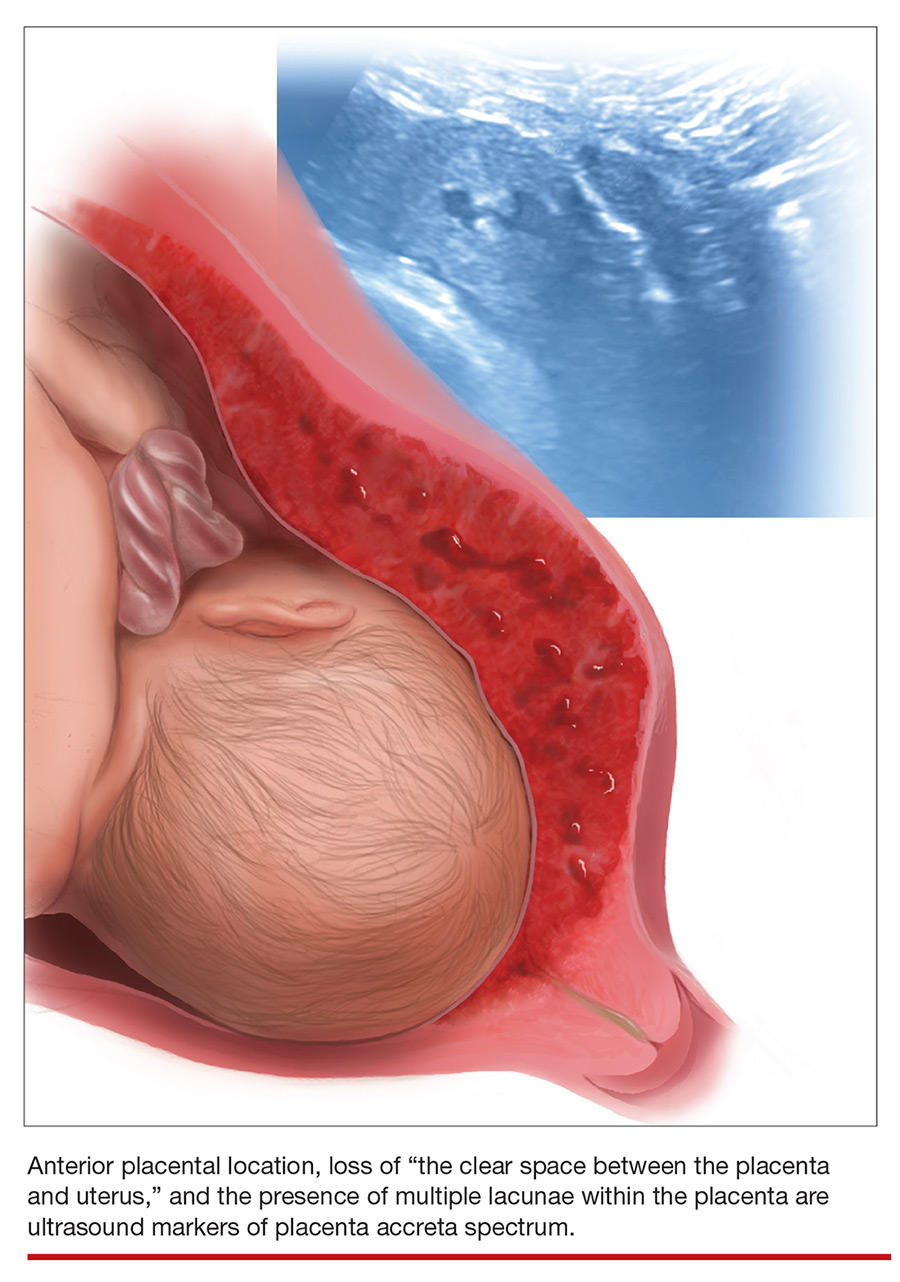
Lower uterine-segment implantation has been defined by Ballas and colleagues as 1) a gestational sac implanted in the lower one-third of the uterus between 8 and 10 weeks’ gestation or 2) a gestational sac occupying primarily the lower uterine segment from 10 weeks’ gestation onward (FIGURE 1).8 Our experience is that it is difficult to accurately assess lower uterine-segment implantation beyond 13 weeks of gestation because the sac typically expands to fill the upper uterine cavity.

Continue to: Color Doppler US...
Color Doppler US can help differentiate lower uterine-segment implantation from a gestational sac of a failed pregnancy in the process of expulsion by demonstrating loss of circumferential blood flow in the failed pregnancy. Furthermore, applying pressure to the anterior surface of the uterus will result in downward movement of the gestational sac of a failed pregnancy.9
Not all gestational sacs that implant in the lower uterine segment lead to PAS: Subsequent normal pregnancies have been reported in this circumstance. In such cases, a normal thick myometrium is noted anterior to the gestational sac.7 A patient with lower uterine-segment implantation without evidence of anterior myometrial thinning remains at risk for third-trimester placenta previa.7
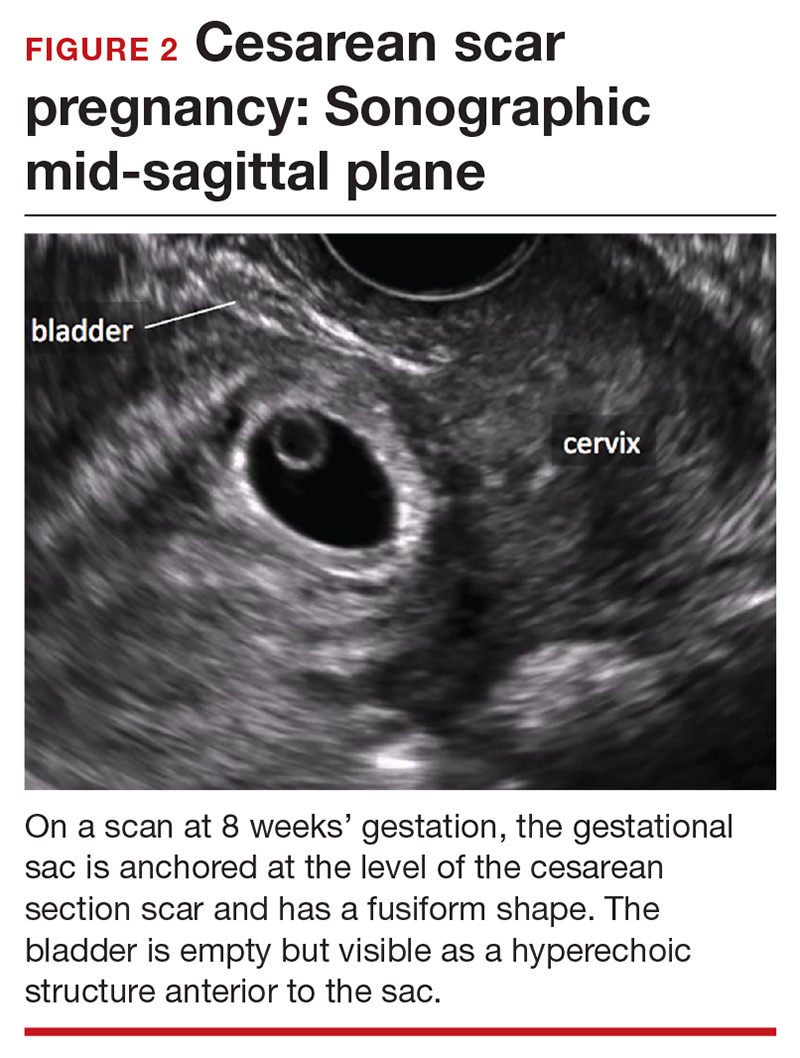
Cesarean scar pregnancy carries significant risk of PAS. In these cases, the gestational sac is typically implanted within the scar, resulting in a thin anterior myometrium and significantly increased vascularity of the placental–myometrial and bladder–uterine wall interfaces (FIGURE 2).9 Differentiating cesarean scar pregnancy from a lower uterine-segment implantation is easier to perform before the eighth week of gestation but becomes more difficult as pregnancy advances. Although it might be useful to distinguish between true cesarean scar pregnancy and lower uterine-segment implantation adjacent to or involving the scar, both carry considerable risk of PAS and excessive hemorrhage, and the approach to treating both conditions is quite similar.
Lacunae, with or without documented blood flow on color Doppler US, are the third marker of PAS in the first trimester.8 Although some retrospective series and case reports describe the finding of lacunae in the first trimester of patients with diagnosed PAS, more recent literature suggests that these spaces are seen infrequently and at a similar frequency in women with and without PAS at delivery.7
Second- and third-trimester markers
Multiple diagnostic sonographic markers of PAS have been described in the second and third trimesters.
Placental location is a significant risk factor for PAS. Placenta previa in the setting of prior CD carries the highest risk of PAS—as high as 61% in women with both placenta previa and a history of 3 CDs.10 An anterior placenta appears to be a stronger risk factor for PAS than a posterior placenta in women with prior CD; the location of the placenta should therefore be evaluated in all women in the second trimester.
Continue to: Lacunae
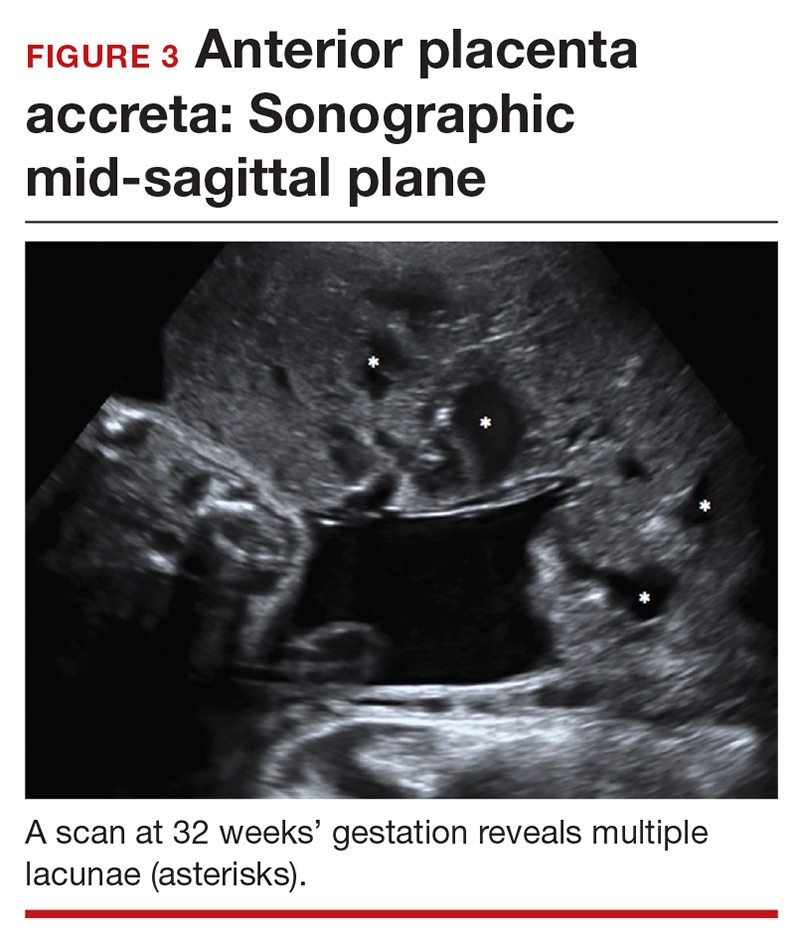
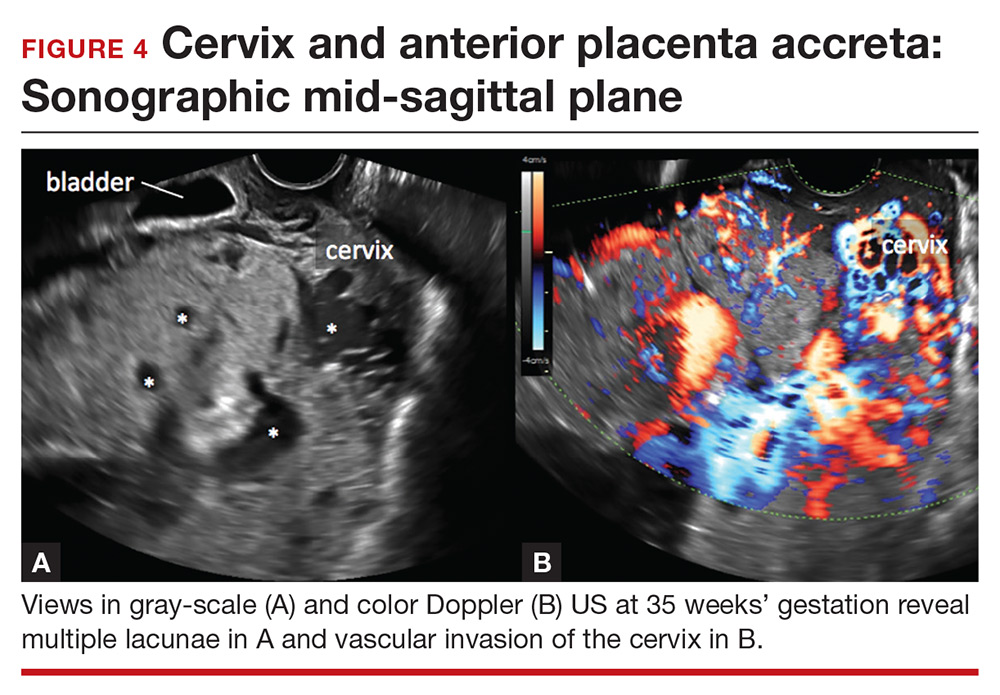
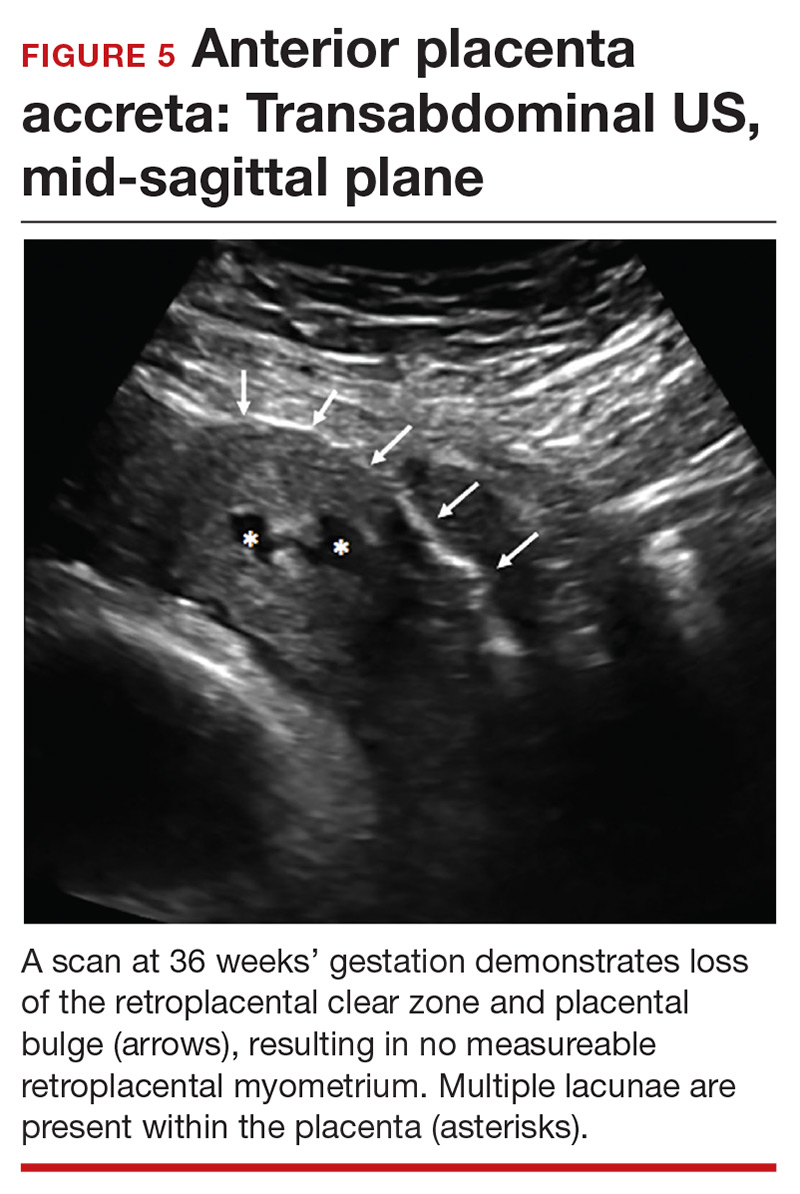
Lacunae. The finding of multiple hypoechoic vascular spaces within the placental parenchyma has been associated with PAS (FIGURES 3 and 4). The pathogenesis of this finding is probably related to alterations in placental tissue resulting from long-term exposure to pulsatile blood flow.11
Finberg and colleagues introduced a grading system for placental lacunae in 1992 that is still used:
- Grade 0: no lacunae seen
- Grade 1: 1 to 3 lacunae seen
- Grade 2: 4 to 6 lacunae seen
- Grade 3: multiple lacunae seen throughout the placenta.12
The sensitivity and specificity of lacunae as an independent marker for PAS have been reported to be 77% and 95%, respectively.13 Despite these findings, several studies report a range of sensitivity (73% to 100%) and negative predictive value (88% to 100%).14 Even in Finberg’s original work, 27% of cases of confirmed PAS had Grade 0 or Grade 1 placental lacunae and 11% of cases of placenta previa, without PAS, demonstrated Grade 2 lacunae.12 There is agreement, however, that, the more lacunae, the higher the risk of PAS.
Continue to: Other US markers for PAS
Other US markers of PAS
Retroplacental–myometrial interface
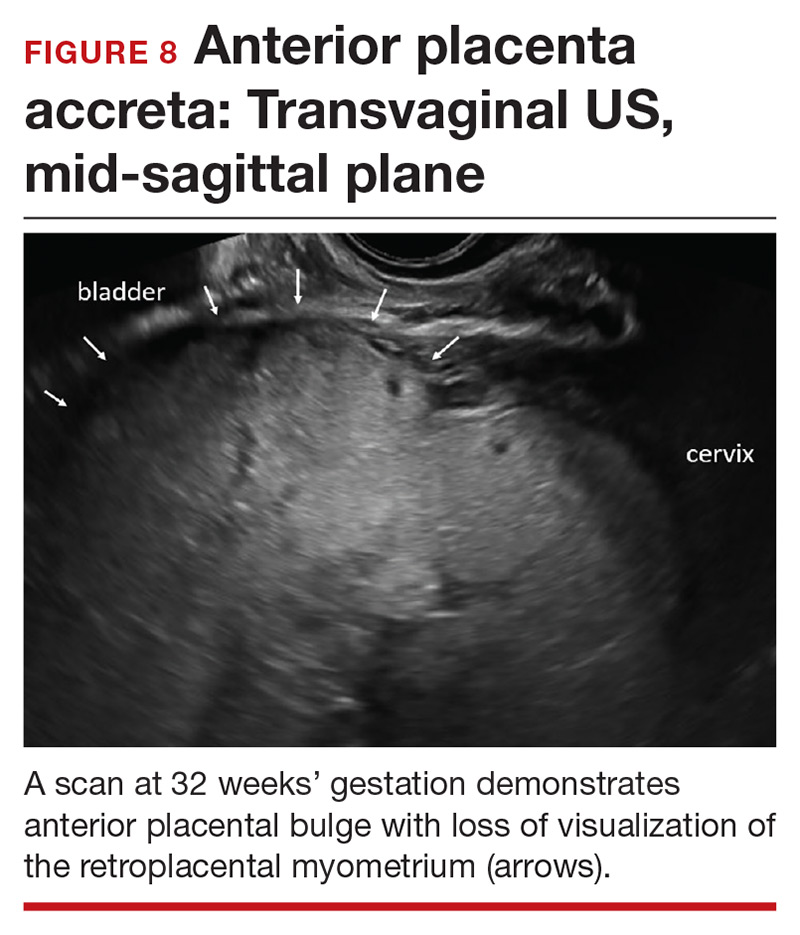
Loss of the normal hypoechoic (clear) retroplacental zone, also referred to as loss of the clear space between placenta and uterus, is another marker of PAS (FIGURE 5). This finding corresponds to pathologic loss of the decidua basalis as trophoblastic tissue invades directly through the myometrium.15 This sonographic finding has been reported to have a detection rate of approximately 93%, with sensitivity of 52% and specificity of 57%, for PAS; the false-positive rate, however, has been in the range of 21% or higher. This marker should not be used alone because it is angle-dependent and can be found (as an absent clear zone) in normal anterior placentas.16
The strength of this US marker is in its negative predictive value, which ranges from 96% to 100%. The presence of a hypoechoic retroplacental clear space that extends the length of the placenta makes PAS unlikely.17 Of note, the clear zone may appear falsely absent as a result of increased pressure from the US probe.
Retroplacental myometrial thickness
Retroplacental myometrial thickness is difficult to assess because the lower uterine-segment myometrium thins in normal pregnancy as term approaches. This measurement also can be influenced by direct pressure of the US probe and fullness of the maternal bladder.18 In patients who have had a CD but who do not have PAS, the median myometrial thickness of the lower uterine segment in the third trimester is 2.4 mm.19
Thinning of the myometrium in the upper uterine segment always should be of concern. Studies of this marker have reported sensitivity of US ranging from 22% to 100% and specificity from 72% to 100%.9,20 Given such variability, it is important to standardize the gestational age and sonographic approach for this marker.
Continue to: Uterovesical interface
Uterovesical interface
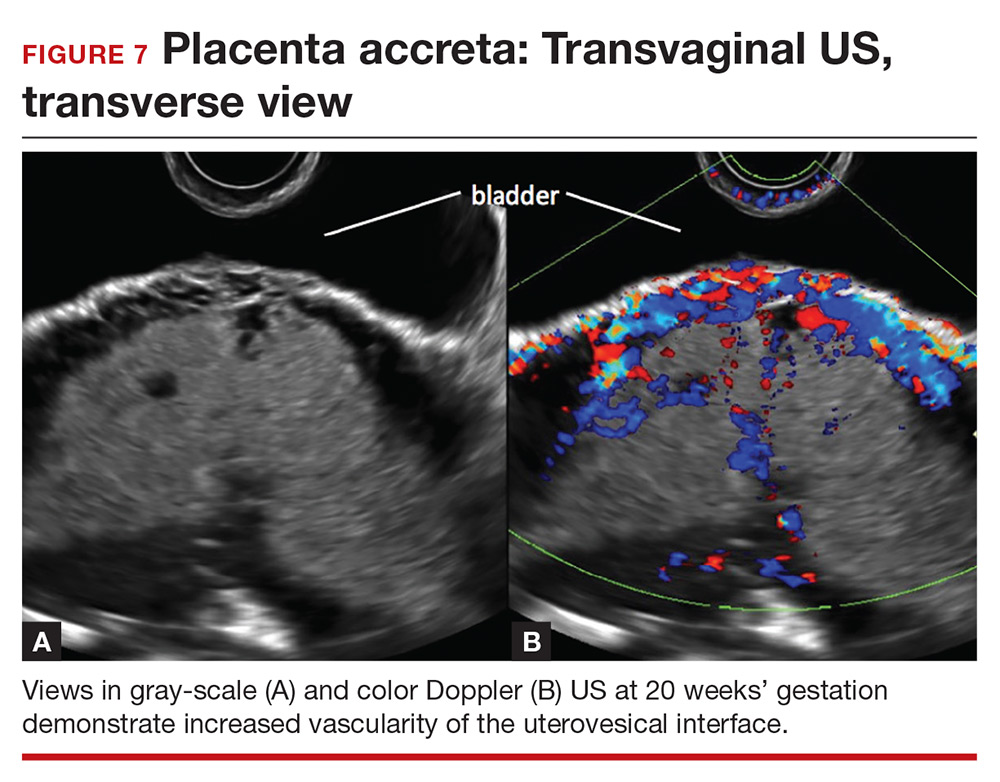
Studies also have reported that abnormalities of the uterovesical interface are predictive of PAS. The uterovesical interface is best evaluated in a sagittal plane containing the lower uterine segment and a partially full bladder in gray-scale and color Doppler US.15 The normal uterovesical interface appears as a smooth line, without irregularities or increased vascularity on sagittal imaging.
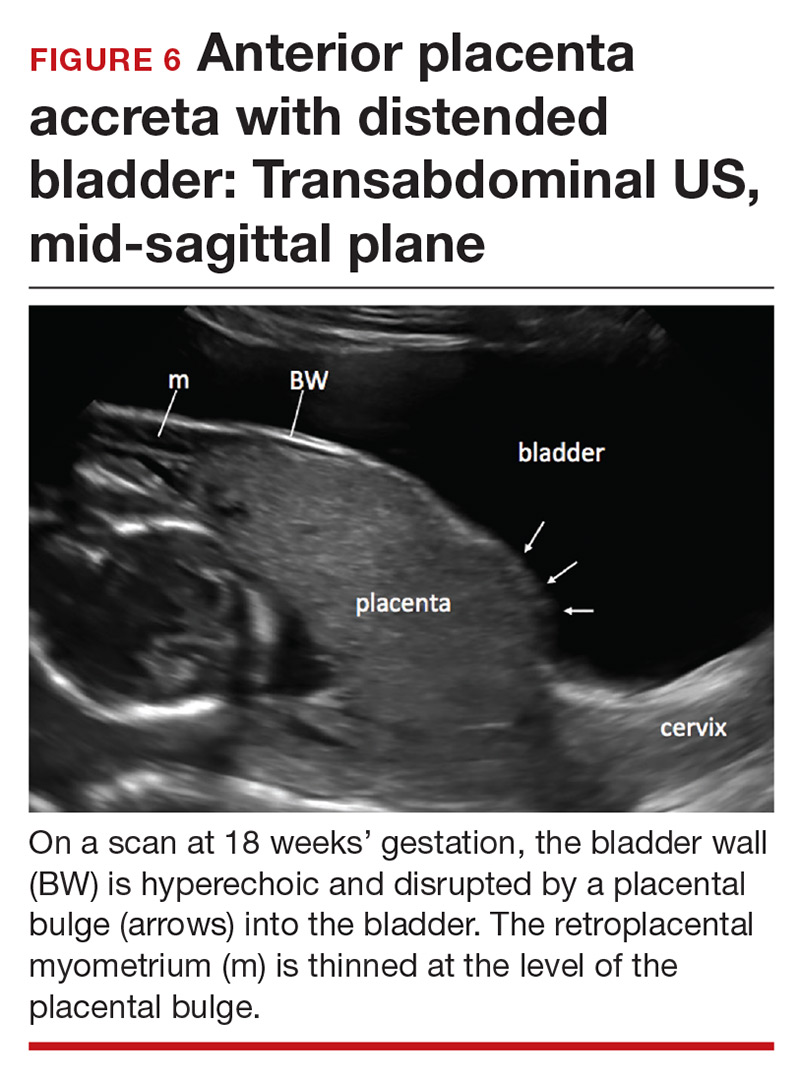
Abnormalities include focal interruption of the hyperechoic bladder wall, bulging of the bladder wall, and increased vascularity, such as varicosities (FIGURES 5, 6, and 7).15 These findings may be seen as early as the first trimester but are more commonly noted in the second and third trimesters.7 The authors of a recent meta-analysis concluded that irregularity of the uterovesical interface is the most specific marker for invasive placentation (99.75% confidence interval; range, 99.5% to 99.9%).13
Other US markers and modalities
Three-dimensional US. Studies have evaluated the role of 3-dimensional (3D) US for predicting PAS. Application of 3D US in vascular mode has shown promise because it allows for semiquantitative assessment of placental vasculature.22 Using 3D US to screen for PAS presents drawbacks, however: The technology is not well-standardized and requires significant operator expertise for volume acquisition and manipulation. Prospective studies are needed before 3D US can be applied routinely to screen for and diagnose PAS.
Color Doppler US. As an adjunct to gray-scale US, color Doppler US can be used for making a diagnosis of PAS. Color Doppler US helps differentiate a normal subplacental venous complex with nonpulsatile, low-velocity venous blood flow waveforms from markedly dilated peripheral subplacental vascular channels with pulsatile venous-type flow, which suggests PAS. These vascular channels are often located directly over the cervix. In addition, the observation of bridging vessels linking the placenta and bladder with high diastolic arterial blood flow also suggests invasion.21 In a meta-analysis, overall sensitivity of color Doppler US for the diagnosis of PAS was 91%, with specificity of 87%.13
The value of utilizing multiple markers
The accuracy of US diagnosis of PAS is likely improved by using more than 1 sonographic marker. Pilloni and colleagues,20 in a prospective analysis, found that 81% of cases of confirmed PAS had ≥2 markers and 51% of cases had ≥3 markers.
Several scoring systems have been proposed for making the diagnosis of PAS using combinations of sonographic markers, placental location, and clinical history.19,24,25 In 2016, Tovbin and colleagues,25 in a prospective study, evaluated a scoring system that included:
- number of previous CDs
- number of, maximum dimension of, and presence of blood flow in lacunae
- loss of uteroplacental clear zone
- placental location
- hypervascularity of the uterovesical or uteroplacental interface.
Tovbin assigned 1 or 2 points to each criterion. Each sonographic marker was found to be significantly associated with PAS when compared to a high-risk control group. A score of ≥8 was considered “at high risk” and predicted 69% of PAS cases.
Regrettably, no combination of US markers reliably predicts the depth of invasion of the placenta.26
Continue to: A standardized approach is needed
A standardized approach is needed
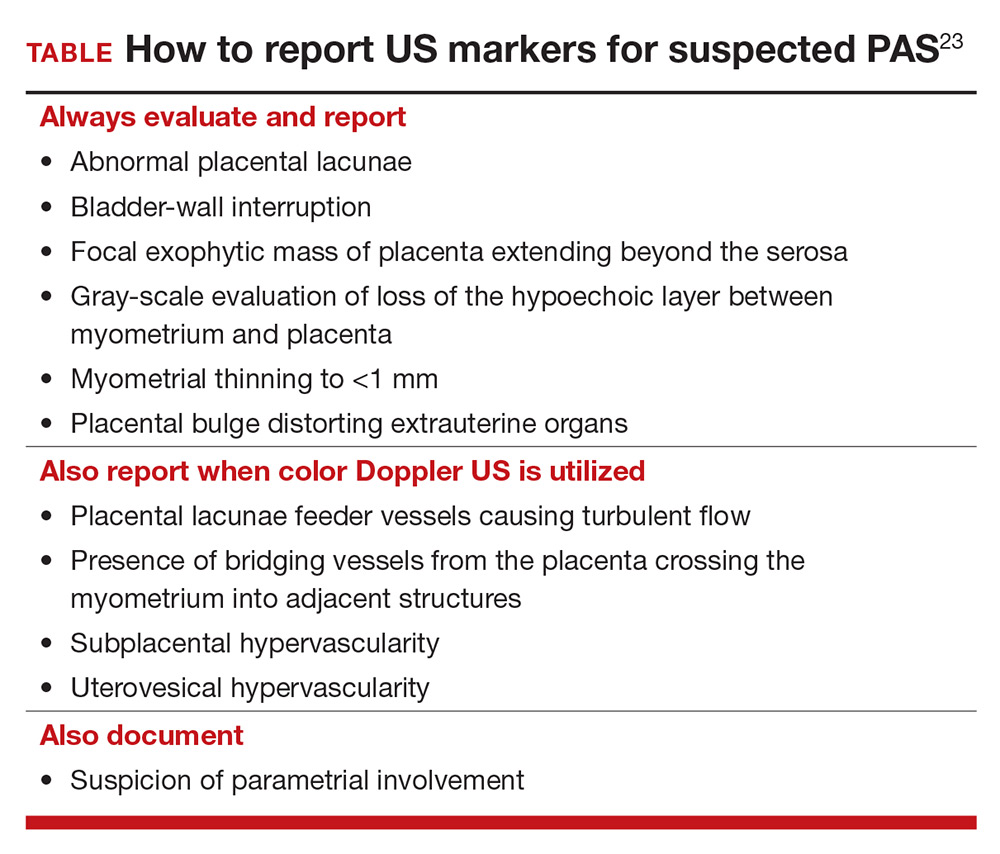
To decrease variability and improve the US diagnosis of PAS, it is important to define and standardize the diagnosis of each sonographic marker for PAS.4 In 2016, the European Working Group on Abnormally Invasive Placenta (EW-AIP) proposed a set of US markers that always should be reported when performing an US examination for suspected abnormal placentation (TABLE).23 Despite this effort by the EW-AIP, ambiguity remains over sonographic definitions of several PAS markers. For example, what determines a placental lacuna on US? And what constitutes an abnormal uterovesical interface? There is a need for a more objective definition of US markers of PAS and a standardized approach to the US examination in at-risk pregnancies.
The Society for Maternal-Fetal Medicine is coordinating a multi-society task force to address the need to define and standardize the US diagnosis of PAS.
Observations on other PAS diagnostic modalities
Magnetic resonance imaging
Adjunctive role. Magnetic resonance imaging (MRI) is often used as an adjunctive diagnostic modality in cases of suspected PAS. Several markers for PAS have been described on MRI, including15:
- intraplacental T2-weighted dark bands
- abnormal intraplacental vascularity
- heterogeneous intraplacental signal intensity
- focal interruption of the myometrium by the placenta
- uterine bulging.
- Assess a priori risk for the patient before initiating the US exam
- In the presence of a placenta previa, or low-lying placenta, we strongly recommend a transvaginal, in addition to transabdominal, US to further assess for the presence of placenta accreta spectrum (PAS) markers
- Until prospective studies clearly define the diagnostic accuracy of PAS sonographic markers and their performance in high-risk and low-risk pregnancies, we recommend that US findings be reported as a risk profile—that is, high, moderate, and low risk of PAS
- Be especially cautious with patients who are at substantially increased risk for PAS, such as those with placenta previa and prior multiple CDs. In this setting, a low-risk report for PAS only should be provided when none of the PAS markers are seen on transabdominal and transvaginal US examinations
- While awaiting national guidelines that 1) standardize the approach to the US examination and 2) define PAS US markers, we encourage US laboratories to develop local protocols to standardize the sonographic evaluation of the placenta and ensure uniform and complete placental assessment
Based on a recent meta-analysis, overall sensitivity of MRI for detecting PAS is 86% to 95%, with specificity of 80% to 95%. Although this is comparable to the sensitivity and specificity of US,27 studies of MRI in PAS are smaller and more prone to bias than in studies of US, because MRI typically is used only in patients at highest risk for PAS. Few studies comparing US to MRI for PAS have been performed; all are small and lack statistical power.
Complementary role. MRI can be complementary to US in cases in which the placenta is posterior or located laterally28 but, importantly, rarely changes decisions about surgical management when used in conjunction with US to assess patients for the diagnosis of PAS. (An exception might lie in the ability of MRI to assess the degree or depth of invasion of the placenta and discerning placenta percreta from placenta accreta.15)
Enhancement with contrast. Addition of gadolinium-based contrast might improve the ability of MRI to make a diagnosis of PAS, but gadolinium crosses the placenta barrier. Although fetal effects of gadolinium have not been observed, American College of Radiology guidelines recommend avoiding this contrast agent during pregnancy unless absolutely essential.29
Specific indications. MRI without contrast should be considered 1) when US is inconclusive and 2) to further evaluate a posterior placenta suspicious for invasion, to define the precise topography of extrauterine placental invasion. The additional information offered by MRI might alter surgical planning.15
Overall, based on current literature, gray-scale US appears to be an excellent tool for prenatal diagnosis of PAS in women at risk: Sensitivity has been reported in the range of 80% to 90%; specificity, 91% to 98%; positive predictive value, 65% to 93%; and negative predictive value, 98%.5,6
However, these values might overestimate the true ability of prenatal US to predict PAS. Why? Early studies that assessed the accuracy of US prediction of PAS might have been biased by inclusion of single-expert observations, high suspicion of placenta accreta, and prior knowledge of patients’ risk factors. In addition, small sample size, retrospective design, and wide variability in the definition of PAS and inclusion criteria led to inconsistency in performance and skewed sensitivity.7
In fact, when experienced providers, reviewing the same US images, were blinded to patients’ clinical history, the accuracy of US diagnosis of PAS decreased in regard to sensitivity (to 54%), specificity (88%), positive (82%) and negative (65%) predictive value, and accuracy (65%).4 Investigators also found wide inter-observer variability in the interpretation of markers of PAS.4 Furthermore, there is evidence that several PAS US markers are commonly seen in low-risk normal pregnancy.
Although studies have yielded variable findings of the precise sensitivity and positive predictive value of US in the diagnosis of PAS, there is a general agreement that US should be the primary imaging modality for this purpose, and can be used exclusively in most cases.
References
- Comstock CH, Bronsteen RA. The antenatal diagnosis of placenta accreta. BJOG. 2014;121:171-181.
- D’Antonio F, Iacovella C, Bhide A. Prenatal identification of invasive placentation using ultrasound: systematic review and metaanalysis. Ultrasound Obstet Gynecol. 2013;42:509-517.
- Comstock CH, Love JJ Jr, Bronsteen RA, et al. Sonographic detection of placenta accreta in the second and third trimesters of pregnancy. Am J Obstet Gynecol. 2004;190:1135-1140.
- Bowman ZS, Eller AG, Kennedy AM, et al. Interobserver variability of sonography for prediction of placenta accreta. J Ultrasound Med. 2014;33:2153-2158.
Biomarkers
Multiple serum biomarkers have been proposed to predict PAS in high-risk women. PAS might be associated with increased levels of first-trimester pregnancy-associated plasma protein A, second-trimester maternal serum alpha fetoprotein, and human chorionic gonadotropin, but studies of the utility of these biomarkers have yielded contradictory results.30,31 Biomarkers are of interest and have significant clinical applicability, but none of the ones identified to date have high sensitivity or specificity for predicting PAS prenatally. Research is ongoing to identify markers of PAS that have sufficient predictive power.
Share your thoughts! Send your Letter to the Editor to rbarbieri@mdedge.com. Please include your name and the city and state in which you practice.
- Irving FC, Hertig AT. A study of placenta accreta. Surg Gynec Obstet. 1937:64:178–200.
- Wu S, Kocherginsky M, Hibbard JU. Abnormal placentation: twenty-year analysis. Am J Obstet Gynecol. 2005;192:1458–1461.
- Hall T, Wax JR, Lucas FL, et al. Prenatal sonographic diagnosis of placenta accreta—impact on maternal and neonatal outcomes. J Clin Ultrasound. 2014;42:449–455.
- Bowman ZS, Eller AG, Kennedy AM, et al. Interobserver variability of sonography for prediction of placenta accreta. J Ultrasound Med. 2014;33:2153–2158.
- Silver RM. Abnormal placentation: placenta previa, vasa previa, and placenta accreta. Obstet Gynecol. 2015;126:654–668.
- Silver RM, Landon MB, Rouse DJ, et al; National Institute of Child Health and Human Development Maternal-Fetal Medicine Units Network. Maternal morbidity associated with multiple repeat cesarean deliveries. Obstet Gynecol. 2006;107:1226–1232.
- Rac MW, Moschos E, Wells CE, et al. Sonographic findings of morbidly adherent placenta in the first trimester. J Ultrasound Med. 2016;35:263–269.
- Ballas J, Pretorius D, Hull AD, et al. Identifying sonographic markers for placenta accreta in the first trimester. J Ultrasound Med. 2012;31:1835–1841.
- Comstock CH, Bronsteen RA. The antenatal diagnosis of placenta accreta. BJOG. 2014;121:171–181.
- Marshall NE, Fu R, Guise JM. Impact of multiple cesarean deliveries on maternal morbidity: a systematic review. Am J Obstet Gynecol. 2011;205:262.e1–e8.
- Baughman WC, Corteville JE, Shah RR. Placenta accreta: spectrum of US and MR imaging findings. Radiographics. 2008;28:1905–1916.
- Finberg HJ, Williams JW. Placenta accreta: prospective sonographic diagnosis in patients with placenta previa and prior cesarean section. J Ultrasound Med. 1992;11:333–343.
- D’Antonio F, Iacovella C, Bhide A. Prenatal identification of invasive placentation using ultrasound: systematic review and meta-analysis. Ultrasound Obstet Gynecol. 2013;42:509–517.
- Comstock CH, Love JJ Jr, Bronsteen RA, et al. Sonographic detection of placenta accreta in the second and third trimesters of pregnancy. Am J Obstet Gynecol. 2004;190:1135–1140.
- D’Antonio F, Palacios-Jaraquemada J, Lim PS, et al. Counseling in fetal medicine: evidence-based answers to clinical questions on morbidly adherent placenta. Ultrasound Obstet Gynecol. 2016;47:290–301.
- Hudon L, Belfort MA, Broome DR. Diagnosis and management of placenta percreta: a review. Obstet Gynecol Surv. 1998;53:509–517.
- Wong HS, Cheung YK, Zuccollo J, et al. Evaluation of sonographic diagnostic criteria for placenta accreta. J Clin Ultrasound. 2008;36:551–559.
- Jauniaux E, Collins S, Burton GJ. Placenta accreta spectrum: pathophysiology and evidence-based anatomy for prenatal ultrasound imaging. Am J Obstet Gynecol. 2018;218:75–87.
- Rac MW, Dashe JS, Wells CE, et al. Ultrasound predictors of placental invasion: the Placenta Accreta Index. Am J Obstet Gynecol. 2015;212:343.e1–e7.
- Pilloni E, Alemanno MG, Gaglioti P, et al. Accuracy of ultrasound in antenatal diagnosis of placental attachment disorders. Ultrasound Obstet Gynecol. 2016;47:302–307.
- Comstock CH. Antenatal diagnosis of placenta accreta: a review. Ultrasound Obstet Gynecol. 2005;26:89–96.
- Collins SL, Stevenson GN, Al-Khan A, et al. Three-dimensional power Doppler ultrasonography for diagnosing abnormally invasive placenta and quantifying the risk. Obstet Gynecol. 2015;126:645–653.
- Collins SL, Ashcroft A, Braun T, et al; European Working Group on Abnormally Invasive Placenta (EW-AIP). Proposal for standardized ultrasound descriptors of abnormally invasive placenta (AIP). Ultrasound Obstet Gynecol. 2016;47:271–275.
- Gilboa Y, Spira M, Mazaki-Tovi S, et al. A novel sonographic scoring system for antenatal risk assessment of obstetric complications in suspected morbidly adherent placenta. J Ultrasound Med. 2015;34:561–567.
- Tovbin J, Melcer Y, Shor S, et al. Prediction of morbidly adherent placenta using a scoring system. Ultrasound Obstet Gynecol. 2016;48:504–510.
- Jauniaux E, Collins SL, Jurkovic D, Burton GJ. Accreta placentation: a systematic review of prenatal ultrasound imaging and grading of villous invasiveness. Am J Obstet Gynecol. 2016:215:712–721.
- Familiari A, Liberati M, Lim P, et al. Diagnostic accuracy of magnetic resonance imaging in detecting the severity of abnormal invasive placenta: a systematic review and meta-analysis. Acta Obstet Gynecol Scand. 2018;97:507–520.
- Rezk MA, Shawky M. Grey-scale and colour Doppler ultrasound versus magnetic resonance imaging for the prenatal diagnosis of placenta accreta. J Matern Fetal Neonatal Med. 2016;29:218–223.
- Expert Panel on MR Safety; Kanal E, Barkovich AJ, Bell C, et al. ACR guidance document on MR safe practices: 2013. J Magn Reson Imaging. 2013;37:501–530.
- Pekar-Zlotin M, Melcer Y, Maymon R, Jauniaux E. Secondtrimester levels of fetoplacental hormones among women with placenta accreta spectrum disorders. Int J Gynaecol Obstet. 2018;140:377–378.
- Lyell DJ, Faucett AM, Baer RJ, et al. Maternal serum markers, characteristics and morbidly adherent placenta in women with previa. J Perinatol. 2015;35:570–574.
Placenta accreta spectrum (PAS) describes abnormal invasion of placental tissue into or through the myometrium, comprising 3 distinct conditions: placenta accreta, placenta increta, and placenta percreta. This complication is relatively new to obstetrics, first described in 1937.1
The overall incidence of PAS has been increasing over several decades, in parallel to an increasing rate of cesarean delivery (CD), with an incidence from 1982 through 2002 of 1 in 533 pregnancies, representing a 5-fold increase since the 1980s.2 PAS is associated with significant morbidity and mortality, including fetal growth restriction, preterm delivery, placental abruption antenatally, and hemorrhage during delivery or postpartum.
Prenatal diagnosis of PAS and planned delivery at an experienced center are associated with significant reduction in maternal and fetal morbidity.3 In an era of advanced imaging modalities, prenatal detection of PAS regrettably remains variable and largely subjective: As many as 20% to 50% of cases of PAS escape prenatal diagnosis.3,4
In this article, we review the sonographic markers of PAS, including diagnostic accuracy, and propose a standardized approach to prenatal diagnosis. Throughout our discussion, we describe protocols for detection of PAS practiced at our Maternal-Fetal Medicine Program in the Department of Obstetrics and Gynecology, Eastern Virginia Medical School (also see “US evaluation of PAS risk: The authors’ recommended approach”).
Numerous risk factors
There are many risk factors for PAS, including prior uterine surgery or instrumentation, such as CD, uterine curettage, myomectomy, pelvic radiation, and endometrial ablation. Other risk factors include smoking, in vitro fertilization, advanced maternal age, multiparity, and a brief interval between prior CD and subsequent pregnancy.5 Of major significance is the increased risk of PAS in the presence of placenta previa with prior CD.6 Knowledge of clinical risk factors by the interpreting physician appears to be associated with improved detection of PAS on ultrasonography (US).4
Ultrasonographic markers of PAS
First-trimester markers
Sonographic markers of PAS in the first trimester include:
- a gestational sac implanted in the lower uterine segment or in a CD scar
- multiple hypoechoic spaces within the placenta (lacunae).7
Lower uterine-segment implantation has been defined by Ballas and colleagues as 1) a gestational sac implanted in the lower one-third of the uterus between 8 and 10 weeks’ gestation or 2) a gestational sac occupying primarily the lower uterine segment from 10 weeks’ gestation onward (FIGURE 1).8 Our experience is that it is difficult to accurately assess lower uterine-segment implantation beyond 13 weeks of gestation because the sac typically expands to fill the upper uterine cavity.
Continue to: Color Doppler US...
Color Doppler US can help differentiate lower uterine-segment implantation from a gestational sac of a failed pregnancy in the process of expulsion by demonstrating loss of circumferential blood flow in the failed pregnancy. Furthermore, applying pressure to the anterior surface of the uterus will result in downward movement of the gestational sac of a failed pregnancy.9
Not all gestational sacs that implant in the lower uterine segment lead to PAS: Subsequent normal pregnancies have been reported in this circumstance. In such cases, a normal thick myometrium is noted anterior to the gestational sac.7 A patient with lower uterine-segment implantation without evidence of anterior myometrial thinning remains at risk for third-trimester placenta previa.7
Cesarean scar pregnancy carries significant risk of PAS. In these cases, the gestational sac is typically implanted within the scar, resulting in a thin anterior myometrium and significantly increased vascularity of the placental–myometrial and bladder–uterine wall interfaces (FIGURE 2).9 Differentiating cesarean scar pregnancy from a lower uterine-segment implantation is easier to perform before the eighth week of gestation but becomes more difficult as pregnancy advances. Although it might be useful to distinguish between true cesarean scar pregnancy and lower uterine-segment implantation adjacent to or involving the scar, both carry considerable risk of PAS and excessive hemorrhage, and the approach to treating both conditions is quite similar.
Lacunae, with or without documented blood flow on color Doppler US, are the third marker of PAS in the first trimester.8 Although some retrospective series and case reports describe the finding of lacunae in the first trimester of patients with diagnosed PAS, more recent literature suggests that these spaces are seen infrequently and at a similar frequency in women with and without PAS at delivery.7
Second- and third-trimester markers
Multiple diagnostic sonographic markers of PAS have been described in the second and third trimesters.
Placental location is a significant risk factor for PAS. Placenta previa in the setting of prior CD carries the highest risk of PAS—as high as 61% in women with both placenta previa and a history of 3 CDs.10 An anterior placenta appears to be a stronger risk factor for PAS than a posterior placenta in women with prior CD; the location of the placenta should therefore be evaluated in all women in the second trimester.
Continue to: Lacunae
Lacunae. The finding of multiple hypoechoic vascular spaces within the placental parenchyma has been associated with PAS (FIGURES 3 and 4). The pathogenesis of this finding is probably related to alterations in placental tissue resulting from long-term exposure to pulsatile blood flow.11
Finberg and colleagues introduced a grading system for placental lacunae in 1992 that is still used:
- Grade 0: no lacunae seen
- Grade 1: 1 to 3 lacunae seen
- Grade 2: 4 to 6 lacunae seen
- Grade 3: multiple lacunae seen throughout the placenta.12
The sensitivity and specificity of lacunae as an independent marker for PAS have been reported to be 77% and 95%, respectively.13 Despite these findings, several studies report a range of sensitivity (73% to 100%) and negative predictive value (88% to 100%).14 Even in Finberg’s original work, 27% of cases of confirmed PAS had Grade 0 or Grade 1 placental lacunae and 11% of cases of placenta previa, without PAS, demonstrated Grade 2 lacunae.12 There is agreement, however, that, the more lacunae, the higher the risk of PAS.
Continue to: Other US markers for PAS
Other US markers of PAS
Retroplacental–myometrial interface
Loss of the normal hypoechoic (clear) retroplacental zone, also referred to as loss of the clear space between placenta and uterus, is another marker of PAS (FIGURE 5). This finding corresponds to pathologic loss of the decidua basalis as trophoblastic tissue invades directly through the myometrium.15 This sonographic finding has been reported to have a detection rate of approximately 93%, with sensitivity of 52% and specificity of 57%, for PAS; the false-positive rate, however, has been in the range of 21% or higher. This marker should not be used alone because it is angle-dependent and can be found (as an absent clear zone) in normal anterior placentas.16
The strength of this US marker is in its negative predictive value, which ranges from 96% to 100%. The presence of a hypoechoic retroplacental clear space that extends the length of the placenta makes PAS unlikely.17 Of note, the clear zone may appear falsely absent as a result of increased pressure from the US probe.
Retroplacental myometrial thickness
Retroplacental myometrial thickness is difficult to assess because the lower uterine-segment myometrium thins in normal pregnancy as term approaches. This measurement also can be influenced by direct pressure of the US probe and fullness of the maternal bladder.18 In patients who have had a CD but who do not have PAS, the median myometrial thickness of the lower uterine segment in the third trimester is 2.4 mm.19
Thinning of the myometrium in the upper uterine segment always should be of concern. Studies of this marker have reported sensitivity of US ranging from 22% to 100% and specificity from 72% to 100%.9,20 Given such variability, it is important to standardize the gestational age and sonographic approach for this marker.
Continue to: Uterovesical interface
Uterovesical interface
Studies also have reported that abnormalities of the uterovesical interface are predictive of PAS. The uterovesical interface is best evaluated in a sagittal plane containing the lower uterine segment and a partially full bladder in gray-scale and color Doppler US.15 The normal uterovesical interface appears as a smooth line, without irregularities or increased vascularity on sagittal imaging.
Abnormalities include focal interruption of the hyperechoic bladder wall, bulging of the bladder wall, and increased vascularity, such as varicosities (FIGURES 5, 6, and 7).15 These findings may be seen as early as the first trimester but are more commonly noted in the second and third trimesters.7 The authors of a recent meta-analysis concluded that irregularity of the uterovesical interface is the most specific marker for invasive placentation (99.75% confidence interval; range, 99.5% to 99.9%).13
Other US markers and modalities
Three-dimensional US. Studies have evaluated the role of 3-dimensional (3D) US for predicting PAS. Application of 3D US in vascular mode has shown promise because it allows for semiquantitative assessment of placental vasculature.22 Using 3D US to screen for PAS presents drawbacks, however: The technology is not well-standardized and requires significant operator expertise for volume acquisition and manipulation. Prospective studies are needed before 3D US can be applied routinely to screen for and diagnose PAS.
Color Doppler US. As an adjunct to gray-scale US, color Doppler US can be used for making a diagnosis of PAS. Color Doppler US helps differentiate a normal subplacental venous complex with nonpulsatile, low-velocity venous blood flow waveforms from markedly dilated peripheral subplacental vascular channels with pulsatile venous-type flow, which suggests PAS. These vascular channels are often located directly over the cervix. In addition, the observation of bridging vessels linking the placenta and bladder with high diastolic arterial blood flow also suggests invasion.21 In a meta-analysis, overall sensitivity of color Doppler US for the diagnosis of PAS was 91%, with specificity of 87%.13
The value of utilizing multiple markers
The accuracy of US diagnosis of PAS is likely improved by using more than 1 sonographic marker. Pilloni and colleagues,20 in a prospective analysis, found that 81% of cases of confirmed PAS had ≥2 markers and 51% of cases had ≥3 markers.
Several scoring systems have been proposed for making the diagnosis of PAS using combinations of sonographic markers, placental location, and clinical history.19,24,25 In 2016, Tovbin and colleagues,25 in a prospective study, evaluated a scoring system that included:
- number of previous CDs
- number of, maximum dimension of, and presence of blood flow in lacunae
- loss of uteroplacental clear zone
- placental location
- hypervascularity of the uterovesical or uteroplacental interface.
Tovbin assigned 1 or 2 points to each criterion. Each sonographic marker was found to be significantly associated with PAS when compared to a high-risk control group. A score of ≥8 was considered “at high risk” and predicted 69% of PAS cases.
Regrettably, no combination of US markers reliably predicts the depth of invasion of the placenta.26
Continue to: A standardized approach is needed
A standardized approach is needed
To decrease variability and improve the US diagnosis of PAS, it is important to define and standardize the diagnosis of each sonographic marker for PAS.4 In 2016, the European Working Group on Abnormally Invasive Placenta (EW-AIP) proposed a set of US markers that always should be reported when performing an US examination for suspected abnormal placentation (TABLE).23 Despite this effort by the EW-AIP, ambiguity remains over sonographic definitions of several PAS markers. For example, what determines a placental lacuna on US? And what constitutes an abnormal uterovesical interface? There is a need for a more objective definition of US markers of PAS and a standardized approach to the US examination in at-risk pregnancies.
The Society for Maternal-Fetal Medicine is coordinating a multi-society task force to address the need to define and standardize the US diagnosis of PAS.
Observations on other PAS diagnostic modalities
Magnetic resonance imaging
Adjunctive role. Magnetic resonance imaging (MRI) is often used as an adjunctive diagnostic modality in cases of suspected PAS. Several markers for PAS have been described on MRI, including15:
- intraplacental T2-weighted dark bands
- abnormal intraplacental vascularity
- heterogeneous intraplacental signal intensity
- focal interruption of the myometrium by the placenta
- uterine bulging.
- Assess a priori risk for the patient before initiating the US exam
- In the presence of a placenta previa, or low-lying placenta, we strongly recommend a transvaginal, in addition to transabdominal, US to further assess for the presence of placenta accreta spectrum (PAS) markers
- Until prospective studies clearly define the diagnostic accuracy of PAS sonographic markers and their performance in high-risk and low-risk pregnancies, we recommend that US findings be reported as a risk profile—that is, high, moderate, and low risk of PAS
- Be especially cautious with patients who are at substantially increased risk for PAS, such as those with placenta previa and prior multiple CDs. In this setting, a low-risk report for PAS only should be provided when none of the PAS markers are seen on transabdominal and transvaginal US examinations
- While awaiting national guidelines that 1) standardize the approach to the US examination and 2) define PAS US markers, we encourage US laboratories to develop local protocols to standardize the sonographic evaluation of the placenta and ensure uniform and complete placental assessment
Based on a recent meta-analysis, overall sensitivity of MRI for detecting PAS is 86% to 95%, with specificity of 80% to 95%. Although this is comparable to the sensitivity and specificity of US,27 studies of MRI in PAS are smaller and more prone to bias than in studies of US, because MRI typically is used only in patients at highest risk for PAS. Few studies comparing US to MRI for PAS have been performed; all are small and lack statistical power.
Complementary role. MRI can be complementary to US in cases in which the placenta is posterior or located laterally28 but, importantly, rarely changes decisions about surgical management when used in conjunction with US to assess patients for the diagnosis of PAS. (An exception might lie in the ability of MRI to assess the degree or depth of invasion of the placenta and discerning placenta percreta from placenta accreta.15)
Enhancement with contrast. Addition of gadolinium-based contrast might improve the ability of MRI to make a diagnosis of PAS, but gadolinium crosses the placenta barrier. Although fetal effects of gadolinium have not been observed, American College of Radiology guidelines recommend avoiding this contrast agent during pregnancy unless absolutely essential.29
Specific indications. MRI without contrast should be considered 1) when US is inconclusive and 2) to further evaluate a posterior placenta suspicious for invasion, to define the precise topography of extrauterine placental invasion. The additional information offered by MRI might alter surgical planning.15
Overall, based on current literature, gray-scale US appears to be an excellent tool for prenatal diagnosis of PAS in women at risk: Sensitivity has been reported in the range of 80% to 90%; specificity, 91% to 98%; positive predictive value, 65% to 93%; and negative predictive value, 98%.5,6
However, these values might overestimate the true ability of prenatal US to predict PAS. Why? Early studies that assessed the accuracy of US prediction of PAS might have been biased by inclusion of single-expert observations, high suspicion of placenta accreta, and prior knowledge of patients’ risk factors. In addition, small sample size, retrospective design, and wide variability in the definition of PAS and inclusion criteria led to inconsistency in performance and skewed sensitivity.7
In fact, when experienced providers, reviewing the same US images, were blinded to patients’ clinical history, the accuracy of US diagnosis of PAS decreased in regard to sensitivity (to 54%), specificity (88%), positive (82%) and negative (65%) predictive value, and accuracy (65%).4 Investigators also found wide inter-observer variability in the interpretation of markers of PAS.4 Furthermore, there is evidence that several PAS US markers are commonly seen in low-risk normal pregnancy.
Although studies have yielded variable findings of the precise sensitivity and positive predictive value of US in the diagnosis of PAS, there is a general agreement that US should be the primary imaging modality for this purpose, and can be used exclusively in most cases.
References
- Comstock CH, Bronsteen RA. The antenatal diagnosis of placenta accreta. BJOG. 2014;121:171-181.
- D’Antonio F, Iacovella C, Bhide A. Prenatal identification of invasive placentation using ultrasound: systematic review and metaanalysis. Ultrasound Obstet Gynecol. 2013;42:509-517.
- Comstock CH, Love JJ Jr, Bronsteen RA, et al. Sonographic detection of placenta accreta in the second and third trimesters of pregnancy. Am J Obstet Gynecol. 2004;190:1135-1140.
- Bowman ZS, Eller AG, Kennedy AM, et al. Interobserver variability of sonography for prediction of placenta accreta. J Ultrasound Med. 2014;33:2153-2158.
Biomarkers
Multiple serum biomarkers have been proposed to predict PAS in high-risk women. PAS might be associated with increased levels of first-trimester pregnancy-associated plasma protein A, second-trimester maternal serum alpha fetoprotein, and human chorionic gonadotropin, but studies of the utility of these biomarkers have yielded contradictory results.30,31 Biomarkers are of interest and have significant clinical applicability, but none of the ones identified to date have high sensitivity or specificity for predicting PAS prenatally. Research is ongoing to identify markers of PAS that have sufficient predictive power.
Share your thoughts! Send your Letter to the Editor to rbarbieri@mdedge.com. Please include your name and the city and state in which you practice.
- Irving FC, Hertig AT. A study of placenta accreta. Surg Gynec Obstet. 1937:64:178–200.
- Wu S, Kocherginsky M, Hibbard JU. Abnormal placentation: twenty-year analysis. Am J Obstet Gynecol. 2005;192:1458–1461.
- Hall T, Wax JR, Lucas FL, et al. Prenatal sonographic diagnosis of placenta accreta—impact on maternal and neonatal outcomes. J Clin Ultrasound. 2014;42:449–455.
- Bowman ZS, Eller AG, Kennedy AM, et al. Interobserver variability of sonography for prediction of placenta accreta. J Ultrasound Med. 2014;33:2153–2158.
- Silver RM. Abnormal placentation: placenta previa, vasa previa, and placenta accreta. Obstet Gynecol. 2015;126:654–668.
- Silver RM, Landon MB, Rouse DJ, et al; National Institute of Child Health and Human Development Maternal-Fetal Medicine Units Network. Maternal morbidity associated with multiple repeat cesarean deliveries. Obstet Gynecol. 2006;107:1226–1232.
- Rac MW, Moschos E, Wells CE, et al. Sonographic findings of morbidly adherent placenta in the first trimester. J Ultrasound Med. 2016;35:263–269.
- Ballas J, Pretorius D, Hull AD, et al. Identifying sonographic markers for placenta accreta in the first trimester. J Ultrasound Med. 2012;31:1835–1841.
- Comstock CH, Bronsteen RA. The antenatal diagnosis of placenta accreta. BJOG. 2014;121:171–181.
- Marshall NE, Fu R, Guise JM. Impact of multiple cesarean deliveries on maternal morbidity: a systematic review. Am J Obstet Gynecol. 2011;205:262.e1–e8.
- Baughman WC, Corteville JE, Shah RR. Placenta accreta: spectrum of US and MR imaging findings. Radiographics. 2008;28:1905–1916.
- Finberg HJ, Williams JW. Placenta accreta: prospective sonographic diagnosis in patients with placenta previa and prior cesarean section. J Ultrasound Med. 1992;11:333–343.
- D’Antonio F, Iacovella C, Bhide A. Prenatal identification of invasive placentation using ultrasound: systematic review and meta-analysis. Ultrasound Obstet Gynecol. 2013;42:509–517.
- Comstock CH, Love JJ Jr, Bronsteen RA, et al. Sonographic detection of placenta accreta in the second and third trimesters of pregnancy. Am J Obstet Gynecol. 2004;190:1135–1140.
- D’Antonio F, Palacios-Jaraquemada J, Lim PS, et al. Counseling in fetal medicine: evidence-based answers to clinical questions on morbidly adherent placenta. Ultrasound Obstet Gynecol. 2016;47:290–301.
- Hudon L, Belfort MA, Broome DR. Diagnosis and management of placenta percreta: a review. Obstet Gynecol Surv. 1998;53:509–517.
- Wong HS, Cheung YK, Zuccollo J, et al. Evaluation of sonographic diagnostic criteria for placenta accreta. J Clin Ultrasound. 2008;36:551–559.
- Jauniaux E, Collins S, Burton GJ. Placenta accreta spectrum: pathophysiology and evidence-based anatomy for prenatal ultrasound imaging. Am J Obstet Gynecol. 2018;218:75–87.
- Rac MW, Dashe JS, Wells CE, et al. Ultrasound predictors of placental invasion: the Placenta Accreta Index. Am J Obstet Gynecol. 2015;212:343.e1–e7.
- Pilloni E, Alemanno MG, Gaglioti P, et al. Accuracy of ultrasound in antenatal diagnosis of placental attachment disorders. Ultrasound Obstet Gynecol. 2016;47:302–307.
- Comstock CH. Antenatal diagnosis of placenta accreta: a review. Ultrasound Obstet Gynecol. 2005;26:89–96.
- Collins SL, Stevenson GN, Al-Khan A, et al. Three-dimensional power Doppler ultrasonography for diagnosing abnormally invasive placenta and quantifying the risk. Obstet Gynecol. 2015;126:645–653.
- Collins SL, Ashcroft A, Braun T, et al; European Working Group on Abnormally Invasive Placenta (EW-AIP). Proposal for standardized ultrasound descriptors of abnormally invasive placenta (AIP). Ultrasound Obstet Gynecol. 2016;47:271–275.
- Gilboa Y, Spira M, Mazaki-Tovi S, et al. A novel sonographic scoring system for antenatal risk assessment of obstetric complications in suspected morbidly adherent placenta. J Ultrasound Med. 2015;34:561–567.
- Tovbin J, Melcer Y, Shor S, et al. Prediction of morbidly adherent placenta using a scoring system. Ultrasound Obstet Gynecol. 2016;48:504–510.
- Jauniaux E, Collins SL, Jurkovic D, Burton GJ. Accreta placentation: a systematic review of prenatal ultrasound imaging and grading of villous invasiveness. Am J Obstet Gynecol. 2016:215:712–721.
- Familiari A, Liberati M, Lim P, et al. Diagnostic accuracy of magnetic resonance imaging in detecting the severity of abnormal invasive placenta: a systematic review and meta-analysis. Acta Obstet Gynecol Scand. 2018;97:507–520.
- Rezk MA, Shawky M. Grey-scale and colour Doppler ultrasound versus magnetic resonance imaging for the prenatal diagnosis of placenta accreta. J Matern Fetal Neonatal Med. 2016;29:218–223.
- Expert Panel on MR Safety; Kanal E, Barkovich AJ, Bell C, et al. ACR guidance document on MR safe practices: 2013. J Magn Reson Imaging. 2013;37:501–530.
- Pekar-Zlotin M, Melcer Y, Maymon R, Jauniaux E. Secondtrimester levels of fetoplacental hormones among women with placenta accreta spectrum disorders. Int J Gynaecol Obstet. 2018;140:377–378.
- Lyell DJ, Faucett AM, Baer RJ, et al. Maternal serum markers, characteristics and morbidly adherent placenta in women with previa. J Perinatol. 2015;35:570–574.
Five “can’t miss” oncologic emergencies
SAN DIEGO – Acute promyelocytic leukemia is one of five “can’t miss” oncologic emergencies, Megan Boysen Osborn, MD, MHPE, told a standing-room-only crowd at the annual meeting of the American College of Emergency Physicians.
In our exclusive video interview, Dr. Osborn, vice chair of education and the residency program director in the department of emergency medicine at the University of California, Irvine, offered tips on how to recognize acute promyelocytic leukemia, leukostasis, neutropenic fever, tumor lysis syndrome, and disseminated intravascular coagulation.
“All patients with suspected leukemias should be admitted,” she said. “Time is of the essence.”
Dr. Osborn reported having no financial disclosures related to her presentation.
REPORTING FROM ACEP18

Dr. Bernard Maria Recognized With Prestigious Child Neurology Honor
Bernard Maria, MD, MBA, Director of the Division of Child Neurology and Developmental Medicine at Goryeb Children’s Hospital in Morristown, NJ, part of the Atlantic Health System, has been recognized with the 2018 Hower Award, the highest recognition from the Child Neurology Society. This prestigious award is given yearly to one member of the Child Neurology Society who is highly regarded by peers as an outstanding teacher and scholar. There is a particular emphasis on contributions to child neurology at national and international levels. 
“I am deeply humbled by this award, and the opportunity to honor two of my mentors that were past Hower recipients, Drs. John Menkes and John Freeman,” Dr. Maria said. “I am so grateful to all the children, families, students, and colleagues I have served.”
Dr. Maria has been instrumental in developing specialty services within the Atlantic Health System for children with neurologic and neuromuscular disorders including: autism and development, brain and spinal tumors, concussion, epilepsy, headache and migraine, muscle and nerve diseases, and other neurologic problems. In addition to providing care and shaping future research directions, Dr. Maria has lectured on these topics nationally and internationally. Dr. Maria also is a member of the Neurology Reviews Editorial Advisory Board.
“The Hower Award is the Child Neurology Society’s highest honor, given annually to a child neurologist in recognition for sustained and outstanding contributions to the field of Child Neurology and to the Child Neurology Society,” said Dr. Jonathan W. Mink, MD PhD, President of the Child Neurology Society. “We congratulate Dr. Maria on being the 2018 recipient of this honor and look forward to his presentation at our next annual meeting.”
Dr. Maria received his MD from the Université de Sherbrooke in Sherbrooke, Québec, Canada, and subsequently earned his MBA from the University of Florida. He completed his pediatrics residency at McGill University and pediatric neurology residency at the Johns Hopkins Hospital, where he also served as chief resident. He completed his fellowship in pediatric neuro-oncology at the MD Anderson Cancer Center. He is a diplomate of the American Board of Pediatrics, and American Board of Psychiatry and Neurology (with a special qualification in child neurology).
Dr. Maria is a Fellow of the American Academy of Pediatrics, Fellow of the American Academy of Neurology, Elected Active Member of the Society for Pediatric Research and the American Pediatric Society, the oldest medical society in America. He has been continuously funded by the National Institutes of Health since 2001 for the Neurobiology of Disease in Children (neurobiologyofdisease.com) conferences, and he has been named to national top/best doctors lists multiple times.
Dr. Maria has held a number of professorial roles o
Bernard Maria, MD, MBA, Director of the Division of Child Neurology and Developmental Medicine at Goryeb Children’s Hospital in Morristown, NJ, part of the Atlantic Health System, has been recognized with the 2018 Hower Award, the highest recognition from the Child Neurology Society. This prestigious award is given yearly to one member of the Child Neurology Society who is highly regarded by peers as an outstanding teacher and scholar. There is a particular emphasis on contributions to child neurology at national and international levels.
“I am deeply humbled by this award, and the opportunity to honor two of my mentors that were past Hower recipients, Drs. John Menkes and John Freeman,” Dr. Maria said. “I am so grateful to all the children, families, students, and colleagues I have served.”
Dr. Maria has been instrumental in developing specialty services within the Atlantic Health System for children with neurologic and neuromuscular disorders including: autism and development, brain and spinal tumors, concussion, epilepsy, headache and migraine, muscle and nerve diseases, and other neurologic problems. In addition to providing care and shaping future research directions, Dr. Maria has lectured on these topics nationally and internationally. Dr. Maria also is a member of the Neurology Reviews Editorial Advisory Board.
“The Hower Award is the Child Neurology Society’s highest honor, given annually to a child neurologist in recognition for sustained and outstanding contributions to the field of Child Neurology and to the Child Neurology Society,” said Dr. Jonathan W. Mink, MD PhD, President of the Child Neurology Society. “We congratulate Dr. Maria on being the 2018 recipient of this honor and look forward to his presentation at our next annual meeting.”
Dr. Maria received his MD from the Université de Sherbrooke in Sherbrooke, Québec, Canada, and subsequently earned his MBA from the University of Florida. He completed his pediatrics residency at McGill University and pediatric neurology residency at the Johns Hopkins Hospital, where he also served as chief resident. He completed his fellowship in pediatric neuro-oncology at the MD Anderson Cancer Center. He is a diplomate of the American Board of Pediatrics, and American Board of Psychiatry and Neurology (with a special qualification in child neurology).
Dr. Maria is a Fellow of the American Academy of Pediatrics, Fellow of the American Academy of Neurology, Elected Active Member of the Society for Pediatric Research and the American Pediatric Society, the oldest medical society in America. He has been continuously funded by the National Institutes of Health since 2001 for the Neurobiology of Disease in Children (neurobiologyofdisease.com) conferences, and he has been named to national top/best doctors lists multiple times.
Dr. Maria has held a number of professorial roles o

Happy Federal New Year
If the hospital or clinic where you work is anything like my medical center, the looming deadline of October 1 is anything but a contemplative occasion. There are encounters to close, budgets to prepare, a flurry of e-mails—either pleading or threatening—to complete consults, mandatory training to finish, and on and on with protean tasks in the parlance of bureaucracy. For many it is the nadir of the mundane, mindless drudgery we slog through all year in pursuit of those transcendent moments when we feel morally certain we have made things better for a real human being.
What is the origin and rationale for the federal New Year beginning on October 1? In 1974, Congress passed the Congressional Budget and Impoundment Act. The act shifted the beginning of the fiscal year—for our purposes the date of the federal New Year—from the first of July to October 1. Shifting the end of the fiscal year 3 months later enabled Congress to have additional time to study and prepare to receive the annual budget from the executive office and productively engage in the subsequent negotiations regarding federal spending priorities.1
For all of us who practice in a federal health care system, our New Year is fast approaching and will indeed be past when most of you read this editorial. While January 1 may be the date for parades and football for the rest of the country, the federal government is not alone in selecting a different day on which to begin the New Year. In fact, were we to look at most of the world, we would find a variety of dates chosen for reasons both symbolic and functional to be the end of an annum. Let’s look at a few of them to see whether we can glean any hints about how we might sublimate what often seem to be meaningless demands into something more personal and profound.
Currently, we are in the last quarter of the Chinese New Year of the earth dog, which began on February 16, using a lunar calendar. In the modern era China has adopted January 1 as the official New Year, but the traditional Chinese festival remains among the most popular holidays in China—and for good reason. Historically, the New Year in China was a period of turning away from work to focus on the honoring of family both living and dead, those in heaven and on earth joining in one timeless community. The family home was often thoroughly cleaned to purge any residual bad luck from the prior cycle and to welcome the good fortune sought for the coming year.2
Several weeks before the writing of this column, the Jewish people celebrated Rosh Hashanah (literally, “head of the year” in Hebrew), one of the holiest days of the Jewish liturgical calendar. It is a commemoration of both creation and judgment. Rosh Hashanah ushers in a period of introspection and repentance, of taking responsibility for past actions, and of committing to do better in the future.
There are some common themes in all these celebrations, religious or secular, and among the most prominent is preparation. Too often, preparing in federal service is a word associated with resentment and apprehension. The US Department of Veterans Affairs prepares for the next investigation, the US Public Health Service for the next inspection, and the military, sadly, for the next war. Our thoughts are perforce focused on funding and finances: Will the president and Congress agree on a timely and sufficient allocation of resources for all of us to do our work well and without excessive worry and wear?
With the exception of the most powerful among us, these negotiations are far beyond our ken or dominion, and the new fiscal year becomes yet another imposed burden. I suggest that we all take back some of that power and purpose, not literally but psychologically. No, I am not advocating either sedition or a new Hallmark holiday with “Happy Federal New Year” cards and parties. Instead I am inviting all of us to consider how we can reset as we do with our computers.
Management experts tell us that cleaning our desk can have positive mental and even physical health benefits. I am not there, but I am willing to try to be more organized if you are. Combat veteran and psychologist Dr. Brett Moore offers “tips to police your workspace” as a means to fight against stress.3
Another New Year’s theme is remembering as a way of consolidating lessons learned and rededicating yourself to continue personal and professional growth in the months ahead. Invent your own rituals to commemorate another year of working for federal health care, even if that custom is to mark your calendar another year closer to retirement! Fall is beautiful in many parts of the country: Go outside for a few minutes a couple of times a week. Find somewhere quiet to sit and look around at the leaves turning and reflect. Reflection is literally, “return of light or sound from a surface.” It does not have to be formal meditation but simply mindfully looking back on the year to see what fruitful images and ideas return to you.
Reflection and preparation prime us for the third theme, which is a rekindling of motivation to be better and the commitment to do things differently, however that is expressed in the unique struggles and rewards of each individual’s career. New Year’s resolutions have become a trite cliché for stores to advertise exercise clothing and the Internet to feature fad diets. The ancient history of resolutions reveals their more spiritual nature as a celebration of the renewal of life.4
Virtue ethics tells us to look to walk in the steps of those we admire to know how to stay on the higher moral road: Who in your unit or clinic or office inspires you to aspire? There are a multitude of opportunities to recreate your work personae to be more like those you would emulate, the colleagues who are often able to solve the “impossible” problem, to stand up to the bully, and to find the ethical values in even the most ridiculous or demoralizing rule. Songwriter and performer Bob Dylan was right when he wrote, “You’re gonna have to serve somebody, yes indeed.”5 But no matter how oppressive we experience that mastery, we must hold tight and recognize that these forces are external.
No one can stop us from the small acts of compassion toward ourselves and one another that keep us free. Pick up the phone or walk over to see someone you know or used to work with and ask how they are doing. Volunteer for a new committee or service project to feel as though your work is more than your job. Repair a torn relationship or mend a departmental fence so you leave work with less emotional baggage than you carried in with you that morning. The next time you want to say something sarcastic or critical, challenge yourself to be silent instead or say something kind or affirming. As a priest I knew once told me, when someone cuts in front of you on the road, instead of raging “bless them before you start cursing.”
After you read this column, take a few minutes to ask yourself how you can cast off the shadows that gather around us from the media and government and find a new way of letting sunlight into your work life. Happy Fiscal Year 2019 from the Editor-in-Chief.
1. History, Art, & Archives Office of the U.S. House of Representatives. Congressional Budget and Impoundment Control Act of 1974. http://history.house.gov/Historical-Highlights/1951-2000/Congressional-Budget-and-Impoundment-Control-Act-of-1974. Accessed September 24, 2018.
2. Chinese New Year 2018. https://www.history.com/topics/holidays/chinese-new-year. Accessed September 22, 2018.
3. Moore BA. Kevlar for the mind: how a clean workspace can fight stress. https://www.militarytimes.com/opinion/commentary/2018/02/27/kevlar-for-the-mind-how-a-clean-workspace-can-fight-stress. Accessed September 23, 2018.
4. The Economist explains: the origins of new year’s resolutions. https://www.economist.com/the-economist-explains/2018/01/05/the-origin-of-new-years-resolutions. Accessed September 23, 2018.
5. Dylan B. Gotta serve somebody. https://www.bobdylan.com/songs/gotta-serve-somebody. Published 1979. Accessed September 24, 2018.
If the hospital or clinic where you work is anything like my medical center, the looming deadline of October 1 is anything but a contemplative occasion. There are encounters to close, budgets to prepare, a flurry of e-mails—either pleading or threatening—to complete consults, mandatory training to finish, and on and on with protean tasks in the parlance of bureaucracy. For many it is the nadir of the mundane, mindless drudgery we slog through all year in pursuit of those transcendent moments when we feel morally certain we have made things better for a real human being.
What is the origin and rationale for the federal New Year beginning on October 1? In 1974, Congress passed the Congressional Budget and Impoundment Act. The act shifted the beginning of the fiscal year—for our purposes the date of the federal New Year—from the first of July to October 1. Shifting the end of the fiscal year 3 months later enabled Congress to have additional time to study and prepare to receive the annual budget from the executive office and productively engage in the subsequent negotiations regarding federal spending priorities.1
For all of us who practice in a federal health care system, our New Year is fast approaching and will indeed be past when most of you read this editorial. While January 1 may be the date for parades and football for the rest of the country, the federal government is not alone in selecting a different day on which to begin the New Year. In fact, were we to look at most of the world, we would find a variety of dates chosen for reasons both symbolic and functional to be the end of an annum. Let’s look at a few of them to see whether we can glean any hints about how we might sublimate what often seem to be meaningless demands into something more personal and profound.
Currently, we are in the last quarter of the Chinese New Year of the earth dog, which began on February 16, using a lunar calendar. In the modern era China has adopted January 1 as the official New Year, but the traditional Chinese festival remains among the most popular holidays in China—and for good reason. Historically, the New Year in China was a period of turning away from work to focus on the honoring of family both living and dead, those in heaven and on earth joining in one timeless community. The family home was often thoroughly cleaned to purge any residual bad luck from the prior cycle and to welcome the good fortune sought for the coming year.2
Several weeks before the writing of this column, the Jewish people celebrated Rosh Hashanah (literally, “head of the year” in Hebrew), one of the holiest days of the Jewish liturgical calendar. It is a commemoration of both creation and judgment. Rosh Hashanah ushers in a period of introspection and repentance, of taking responsibility for past actions, and of committing to do better in the future.
There are some common themes in all these celebrations, religious or secular, and among the most prominent is preparation. Too often, preparing in federal service is a word associated with resentment and apprehension. The US Department of Veterans Affairs prepares for the next investigation, the US Public Health Service for the next inspection, and the military, sadly, for the next war. Our thoughts are perforce focused on funding and finances: Will the president and Congress agree on a timely and sufficient allocation of resources for all of us to do our work well and without excessive worry and wear?
With the exception of the most powerful among us, these negotiations are far beyond our ken or dominion, and the new fiscal year becomes yet another imposed burden. I suggest that we all take back some of that power and purpose, not literally but psychologically. No, I am not advocating either sedition or a new Hallmark holiday with “Happy Federal New Year” cards and parties. Instead I am inviting all of us to consider how we can reset as we do with our computers.
Management experts tell us that cleaning our desk can have positive mental and even physical health benefits. I am not there, but I am willing to try to be more organized if you are. Combat veteran and psychologist Dr. Brett Moore offers “tips to police your workspace” as a means to fight against stress.3
Another New Year’s theme is remembering as a way of consolidating lessons learned and rededicating yourself to continue personal and professional growth in the months ahead. Invent your own rituals to commemorate another year of working for federal health care, even if that custom is to mark your calendar another year closer to retirement! Fall is beautiful in many parts of the country: Go outside for a few minutes a couple of times a week. Find somewhere quiet to sit and look around at the leaves turning and reflect. Reflection is literally, “return of light or sound from a surface.” It does not have to be formal meditation but simply mindfully looking back on the year to see what fruitful images and ideas return to you.
Reflection and preparation prime us for the third theme, which is a rekindling of motivation to be better and the commitment to do things differently, however that is expressed in the unique struggles and rewards of each individual’s career. New Year’s resolutions have become a trite cliché for stores to advertise exercise clothing and the Internet to feature fad diets. The ancient history of resolutions reveals their more spiritual nature as a celebration of the renewal of life.4
Virtue ethics tells us to look to walk in the steps of those we admire to know how to stay on the higher moral road: Who in your unit or clinic or office inspires you to aspire? There are a multitude of opportunities to recreate your work personae to be more like those you would emulate, the colleagues who are often able to solve the “impossible” problem, to stand up to the bully, and to find the ethical values in even the most ridiculous or demoralizing rule. Songwriter and performer Bob Dylan was right when he wrote, “You’re gonna have to serve somebody, yes indeed.”5 But no matter how oppressive we experience that mastery, we must hold tight and recognize that these forces are external.
No one can stop us from the small acts of compassion toward ourselves and one another that keep us free. Pick up the phone or walk over to see someone you know or used to work with and ask how they are doing. Volunteer for a new committee or service project to feel as though your work is more than your job. Repair a torn relationship or mend a departmental fence so you leave work with less emotional baggage than you carried in with you that morning. The next time you want to say something sarcastic or critical, challenge yourself to be silent instead or say something kind or affirming. As a priest I knew once told me, when someone cuts in front of you on the road, instead of raging “bless them before you start cursing.”
After you read this column, take a few minutes to ask yourself how you can cast off the shadows that gather around us from the media and government and find a new way of letting sunlight into your work life. Happy Fiscal Year 2019 from the Editor-in-Chief.
1. History, Art, & Archives Office of the U.S. House of Representatives. Congressional Budget and Impoundment Control Act of 1974. http://history.house.gov/Historical-Highlights/1951-2000/Congressional-Budget-and-Impoundment-Control-Act-of-1974. Accessed September 24, 2018.
2. Chinese New Year 2018. https://www.history.com/topics/holidays/chinese-new-year. Accessed September 22, 2018.
3. Moore BA. Kevlar for the mind: how a clean workspace can fight stress. https://www.militarytimes.com/opinion/commentary/2018/02/27/kevlar-for-the-mind-how-a-clean-workspace-can-fight-stress. Accessed September 23, 2018.
4. The Economist explains: the origins of new year’s resolutions. https://www.economist.com/the-economist-explains/2018/01/05/the-origin-of-new-years-resolutions. Accessed September 23, 2018.
5. Dylan B. Gotta serve somebody. https://www.bobdylan.com/songs/gotta-serve-somebody. Published 1979. Accessed September 24, 2018.

Comparison of Cardiovascular Outcomes Between Statin Monotherapy and Fish Oil and Statin Combination Therapy in a Veteran Population
The Centers for Disease Control and Prevention lists cardiovascular-related diseases as a leading cause of mortality.1 The medication class of 3-hydroxy-3-methylglutaryl coenzyme A reductase inhibitors, more commonly known as statins, is first-line therapy to prevent negative cardiovascular outcomes and reduce premature death.2 Additional hyperlipidemia medications, such as fish oil, can be added for potential cardiovascular benefit.
Yokoyama and colleagues demonstrated that fish oil is a promising treatment for the prevention of major coronary events in patients with hypercholesterolemia.3 Furthermore, Macchia and colleagues found reductions in cardiovascular outcomes and all-cause mortality in postmyocardial infarction patients treated with fish oil and statin combination therapy.4 In contrast, the Outcomes Reduction with an Initial Glargine Intervention (ORIGIN) trial found glucose intolerant and patients with diabetes mellitus did not have improved cardiovascular outcomes with fish oil therapy.5 Likewise The Risk and Prevention Study Collaborative Group found fish oil supplementation provided no benefit for primary prevention in patients with multiple cardiovascular risk factors.6 These studies demonstrate fish oil therapy can cause diverse cardiovascular outcomes in different patient populations.
Currently, there are no studies examining the impact of fish oil and statin combination therapy on the US veteran population. The research of Yokoyama, Macchia, and The Risk and Prevention Study Collaborative Group took place in Japanese and Italian populations, which impacts their external validity.
This study aims to help the US Department of Veterans Affairs (VA) primary care providers and clinical pharmacists address the role of fish oil and statin combination therapy in the prevention of cardiovascular disease and all-cause mortality in the veteran population. The addition of fish oil to statin therapy was compared with an established standard of care, statin monotherapy, in veterans at the Fargo Veterans Affairs Health Care System (FVAHCS).
Methods
A retrospective chart review was conducted using the FVAHCS Computerized Patient Record System (CPRS). The institution’s review board and VA medical center approved the study. Eligible veterans with prescriptions for fish oil or statin therapy between January 1, 2000 and September 30, 2015 were randomly selected, reviewed, and sorted based on inclusion and exclusion criteria. 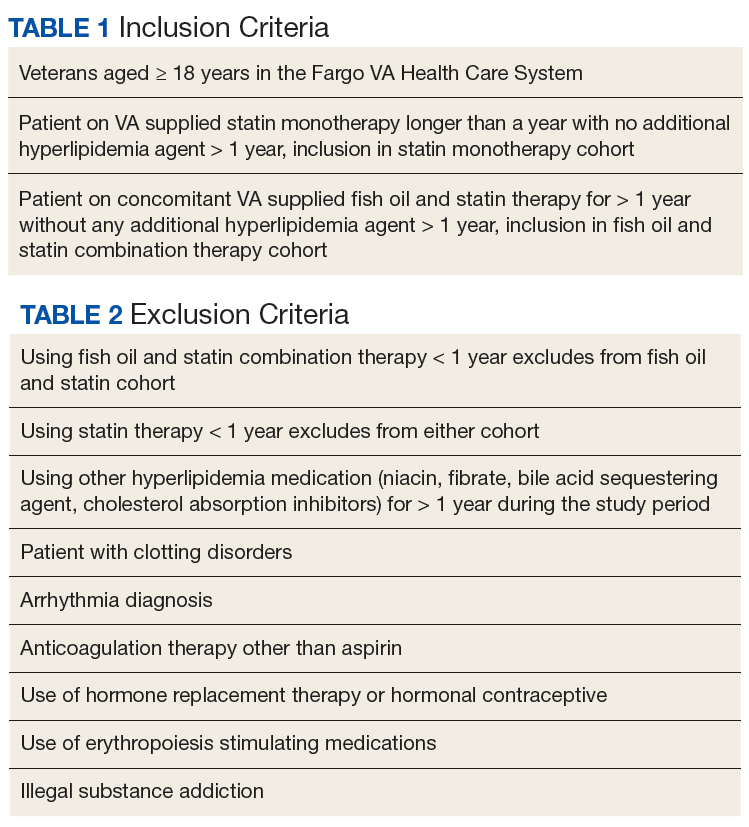
The primary outcome was time to aggregate cardiovascular events, specifically myocardial infarction (MI), stroke, transient ischemic attack, coronary artery bypass graft, and percutaneous intervention. Adverse cardiovascular event data were obtained from the veterans’ International Classification of Disease (ICD) 9 codes. Furthermore, the secondary outcome—time to all-cause mortality—was gathered by death records in CPRS. Time to these events was compared in veterans on fish oil and statin combination therapy or statin monotherapy. The date of the cardiovascular event or death was recorded for each outcome and was obtained by reviewing provider notes that documented the incidence. If a specific day or month of incidence was not documented, July 1 was selected as the default date for the adverse cardiovascular event.
Demographics, medication adherence, diagnoses, lab values within 90 days of initiation of therapy, and primary and secondary outcomes were collected. Demographics that included age, race, and sex all were obtained via chart review. Diagnoses were gathered using ICD 9 codes. Refill history was retrieved to assess adherence. Adherence was calculated by the total days of medication therapy divided by the total days within the study. Total days in the study was calculated by the duration of therapy days between therapy initiation date and a terminating factor. Terminating factors included an adverse cardiovascular event, death, or the study termination date.
Statistics
Demographic and other cohort characterization variables were compared either by a t test, rank sum test, or Fisher exact test given the character of the variable. Kaplan Meier analysis was used to evaluate time to aggregate cardiovascular events and all-cause mortality. VA Informatics and Computing Infrastructure (VINCI) R 3.4.3 was used for data analysis. One of the few combination studies by Macchia and colleagues gave an estimate of unadjusted incident rates for patients treated with statin monotherapy vs fish oil and statin combination therapy in patients having a recent MI.4 Based on this information, a power analysis determined that a 2% difference in incidence rate of adverse cardiovascular events could be detected between the 2 cohorts with 1,000 veterans in the statin cohort, and 500 veterans in the fish oil and statin cohort assuming a time to event interval of about 7.5 years. An α level of 0.05 was set to determine statistical significance.
Results
A total of 3,940 veterans with prescriptions for fish oil or statin therapy were randomly reviewed and sorted based on inclusion and exclusion criteria. This inclusion criteria resulted in 2,575 fish oil and statin combination patients and 1,365 statin monotherapy patients. Exclusion criteria produced a final total of 437 fish oil and statin combination patients and 559 statin monotherapy patients. Patient demographics are presented in Table 3. 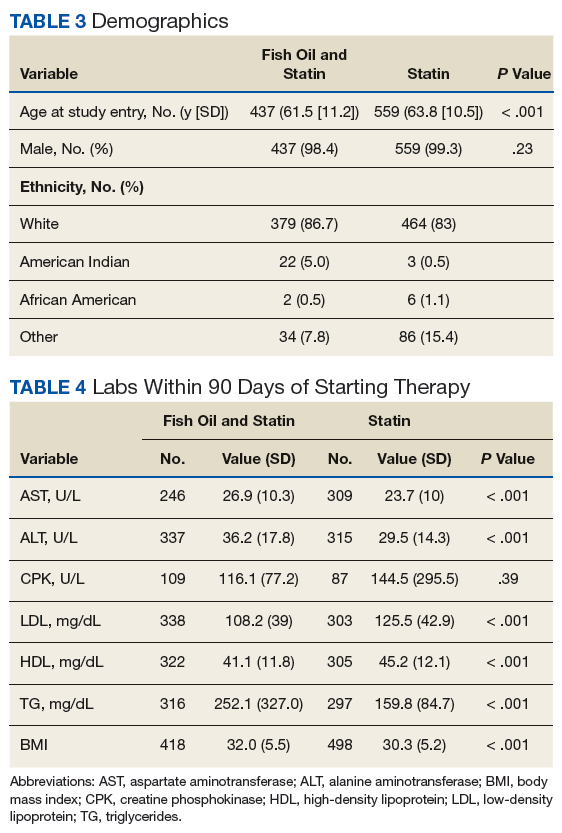
All baseline laboratory data were collected within 90 days of therapy initiation (Table 4). Statin monotherapy patients had lower triglyceride levels compared with those of the fish oil and statin combination patients. However, both high-density lipoprotein (HDL) and low-density lipoprotein (LDL) levels were higher in the statin monotherapy patients. As seen in Table 5, diagnosis of heart failure, hypertension, hypothyroidism, and dyslipidemia were higher in the statin monotherapy cohort, while tobacco use and pancreatitis were more prevalent in the fish oil and statin combination cohort. 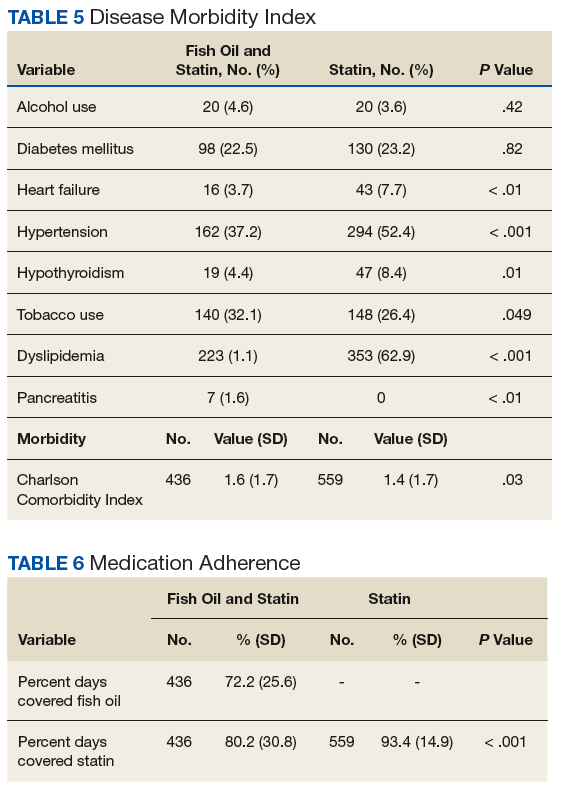
Kaplan Meier curves of the primary outcome, time to aggregate adverse cardiovascular event, and the secondary outcome, time to all-cause mortality are shown in Figure 1 and Figure 2, respectively. This shows adverse cardiovascular events and all-cause mortality for approximately 4,500 days for the fish oil and statin cohort and approximately 6,000 days for the statin monotherapy cohort.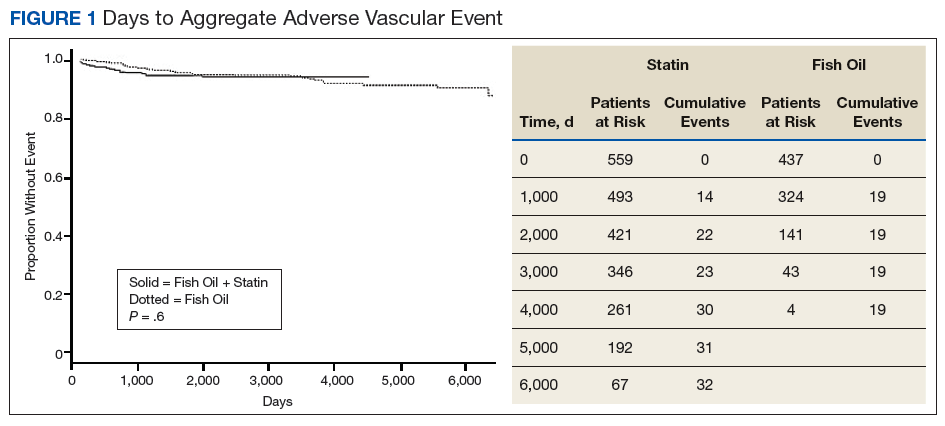
Discussion
Analysis of this study failed to detect a statistically significant difference for time to aggregate adverse cardiovascular events or all-cause mortality. This may be due to fewer adverse cardiovascular events and mortality in the 2 cohorts than was anticipated.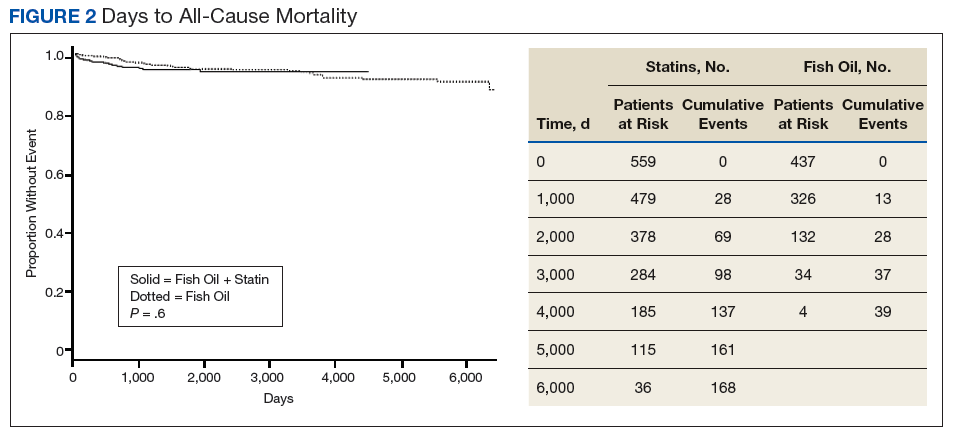
There are no studies examining fish oil and statin therapy in the veteran population and only limited studies comparing statin and fish oil combination therapy vs statin monotherapy for adverse cardiovascular outcomes and all-cause mortality. One of the few comparison studies was by Macchia and colleagues and consisted of 7,924 post MI patients in Italy. Over a 4-year period, researchers found a slight improvement in the adjusted paired-matched population for all-cause mortality in the fish oil and statin therapy cohort vs statin monotherapy (8.6% vs 13.6% P < .001).3 A benefit also was seen in the fish oil and statin cohort vs statin monotherapy in the adjusted paired-matched population for death or stroke (16.7% vs 11.5% P < .001).3
In contrast, this study did not address postmyocardial infarction patients exclusively. Rather, patients in this study had lower morbidity, which resulted in fewer adverse cardiovascular outcomes and a greater difficulty to detect a difference in this healthier population. These healthier patients may derive less benefit from primary or secondary prevention with statin and fish oil combination therapy.
In this study, there were extensive inclusion and exclusion criteria to assess the relationship between the cohorts for
Comparison of demographic data showed both cohorts were of similar age, sex, and race. Of note the Fargo veteran population was primarily white (> 80% in both cohorts). This is slightly higher than the percentage of whites for all US veterans. The slight difference most likely had a minimal clinical impact. Laboratory values recorded within 90 days of initiation of therapy were largely clinically similar except for triglycerides being significantly higher in the fish oil and statin combination cohort (Table 4). This may reflect selection bias, where providers may be more likely to add fish oil therapy for the potential to further control triglycerides.
Diagnoses of hypertension, heart failure, and dyslipidemia were higher in the statin monotherapy cohort. However, body mass index, tobacco use, and pancreatitis were statistically higher in fish oil and statin combination cohort. Even though there was a statistically significant difference in disease diagnoses, this likely created a minor clinical difference between the groups. This is further illustrated by the similarity of the Charlson Comorbidity Index of 1.6 for fish oil and statin cohort and 1.4 in statin monotherapy cohort.
Strengths
A strength of this study was its adherence rates. Adherence rates were high in both cohorts (Table 6). Fish oil and statin cohort did have slightly lower adherence compared with that of statin monotherapy. This may demonstrate extra pill burden influencing adherence. Overall demographics, laboratory values, disease, and adherence rates were clinically similar in both cohorts, thus reducing the potential for confounders.
Limitations
Limitations of this study include its retrospective chart review design. This design is susceptible to incorrect recording of events. The primary outcome, aggregate adverse cardiovascular events, may have been incorrectly recorded in the medical record as other diseases, such as coronary artery disease or heart disease, and therefore not captured by ICD 9 code retrieval. Also, important information, such as laboratory data, disease, and medication adherence, may not have been documented for all patients. Of note 1 patient in the fish oil and statin combination cohort did not have any recorded laboratory data, disease, or adherence data.
Another limitation is lack of access to medical notes from non-VA providers, which can result in missed data collection. To reduce this limitation, the study excluded veterans that received non-VA fish oil, statins, or other hyperlipidemia medications for > 1 year. Veterans were included only if they used VA-provided fish oil or statins. This inclusion and exclusion criteria reduced the chance of missing data from other facilities because it favored inclusion of only subjects that received care exclusively through the VA.
Last, on study initiation it was not realized that fish oil was not provided by the health care system until about the year 2004. This resulted in less risk days for the fish oil and statin cohort. However, Kaplan Meier analysis lessens this issue from being a confounder. Time to event rates for both the primary and secondary outcomes were similar and most likely would have continued to trend together with the same therapy duration.
Conclusion
Fish oil and statin combination therapy when compared with statin monotherapy failed to show that a statistically significant difference exists in the rates of MI, stroke, transient ischemic attack, coronary artery bypass graft, and percutaneous intervention. The clinical difference of fish oil and statin combination therapy vs statin monotherapy is most likely small or nonexistent. From our literature search, this is the only study concerning the use of fish oil and statin combination therapy in the veteran population. It is most likely that fish oil and statin combination therapy and statin monotherapy are similar for the reduction of time to aggregate adverse cardiovascular events and all-cause mortality in the veteran population.
Acknowledgments
This material is the result of work supported with resources and the use of facilities at the Fargo VA Healthcare System.
1. Kochanek KD, Murphy SL, Xu J, Tejada-Vera B. Deaths: final data for 2014. https://www.cdc.gov/nchs/data/nvsr/nvsr65/nvsr65_04.pdf. Published June 30, 2016. Accessed July 26, 2018.
2. Stone NJ, Robinson JG, Lichtenstein AH, et al; American College of Cardiology/American Heart Association Task Force on Practice Guidelines. 2013 ACC/AHA guideline on the treatment of blood cholesterol to reduce atherosclerotic cardiovascular risk in adults: a report of the American College of Cardiology/American Heart Association Task Force on Practice Guidelines. J Am Coll Cardiol. 2014;63(25 pt B):2889-2934.
3. Yokoyama M, Origasa H, Matsuzaki M, et al; Japan EPA lipid intervention study (JELIS) Investigators. Effects of eicosapentaenoic acid on major coronary events in hypercholesterolaemic patients (JELIS): a randomised open-label, blinded endpoint analysis. Lancet. 2007;369(9567):1090-1098.
4. Macchia A, Romero M, D’Ettorre A, Tognoni G, Mariani J. Exploratory analysis on the use of statins with or without n-3 PUFA and major events in patients discharged for acute myocardial infarction: an observational retrospective study. PLoS One. 2013;8(5):e62772.
5. ORIGIN Trial Investigators, Bosch J, Gerstein HC, et al. n-3 fatty acids and cardiovascular outcomes in patients with dysglycemia. N Engl J Med. 2012;367(4):309-318.
6. The Risk and Prevention Study Collaborative Group, Roncaglioni MC, Tombesi M, et al. n-3 fatty acids in patients with multiple cardiovascular risk factors. N Engl J Med. 2013;368(19):1800-1808.
7. Rizos EC, Ntzani EE, Bika E, Kostapanos MS, Elisaf MS. Association between omega-3 fatty acid supplementation and risk of major cardiovascular disease events: a systematic review and meta-analysis. JAMA. 2012;308(10):1024-1033.
The Centers for Disease Control and Prevention lists cardiovascular-related diseases as a leading cause of mortality.1 The medication class of 3-hydroxy-3-methylglutaryl coenzyme A reductase inhibitors, more commonly known as statins, is first-line therapy to prevent negative cardiovascular outcomes and reduce premature death.2 Additional hyperlipidemia medications, such as fish oil, can be added for potential cardiovascular benefit.
Yokoyama and colleagues demonstrated that fish oil is a promising treatment for the prevention of major coronary events in patients with hypercholesterolemia.3 Furthermore, Macchia and colleagues found reductions in cardiovascular outcomes and all-cause mortality in postmyocardial infarction patients treated with fish oil and statin combination therapy.4 In contrast, the Outcomes Reduction with an Initial Glargine Intervention (ORIGIN) trial found glucose intolerant and patients with diabetes mellitus did not have improved cardiovascular outcomes with fish oil therapy.5 Likewise The Risk and Prevention Study Collaborative Group found fish oil supplementation provided no benefit for primary prevention in patients with multiple cardiovascular risk factors.6 These studies demonstrate fish oil therapy can cause diverse cardiovascular outcomes in different patient populations.
Currently, there are no studies examining the impact of fish oil and statin combination therapy on the US veteran population. The research of Yokoyama, Macchia, and The Risk and Prevention Study Collaborative Group took place in Japanese and Italian populations, which impacts their external validity.
This study aims to help the US Department of Veterans Affairs (VA) primary care providers and clinical pharmacists address the role of fish oil and statin combination therapy in the prevention of cardiovascular disease and all-cause mortality in the veteran population. The addition of fish oil to statin therapy was compared with an established standard of care, statin monotherapy, in veterans at the Fargo Veterans Affairs Health Care System (FVAHCS).
Methods
A retrospective chart review was conducted using the FVAHCS Computerized Patient Record System (CPRS). The institution’s review board and VA medical center approved the study. Eligible veterans with prescriptions for fish oil or statin therapy between January 1, 2000 and September 30, 2015 were randomly selected, reviewed, and sorted based on inclusion and exclusion criteria.
The primary outcome was time to aggregate cardiovascular events, specifically myocardial infarction (MI), stroke, transient ischemic attack, coronary artery bypass graft, and percutaneous intervention. Adverse cardiovascular event data were obtained from the veterans’ International Classification of Disease (ICD) 9 codes. Furthermore, the secondary outcome—time to all-cause mortality—was gathered by death records in CPRS. Time to these events was compared in veterans on fish oil and statin combination therapy or statin monotherapy. The date of the cardiovascular event or death was recorded for each outcome and was obtained by reviewing provider notes that documented the incidence. If a specific day or month of incidence was not documented, July 1 was selected as the default date for the adverse cardiovascular event.
Demographics, medication adherence, diagnoses, lab values within 90 days of initiation of therapy, and primary and secondary outcomes were collected. Demographics that included age, race, and sex all were obtained via chart review. Diagnoses were gathered using ICD 9 codes. Refill history was retrieved to assess adherence. Adherence was calculated by the total days of medication therapy divided by the total days within the study. Total days in the study was calculated by the duration of therapy days between therapy initiation date and a terminating factor. Terminating factors included an adverse cardiovascular event, death, or the study termination date.
Statistics
Demographic and other cohort characterization variables were compared either by a t test, rank sum test, or Fisher exact test given the character of the variable. Kaplan Meier analysis was used to evaluate time to aggregate cardiovascular events and all-cause mortality. VA Informatics and Computing Infrastructure (VINCI) R 3.4.3 was used for data analysis. One of the few combination studies by Macchia and colleagues gave an estimate of unadjusted incident rates for patients treated with statin monotherapy vs fish oil and statin combination therapy in patients having a recent MI.4 Based on this information, a power analysis determined that a 2% difference in incidence rate of adverse cardiovascular events could be detected between the 2 cohorts with 1,000 veterans in the statin cohort, and 500 veterans in the fish oil and statin cohort assuming a time to event interval of about 7.5 years. An α level of 0.05 was set to determine statistical significance.
Results
A total of 3,940 veterans with prescriptions for fish oil or statin therapy were randomly reviewed and sorted based on inclusion and exclusion criteria. This inclusion criteria resulted in 2,575 fish oil and statin combination patients and 1,365 statin monotherapy patients. Exclusion criteria produced a final total of 437 fish oil and statin combination patients and 559 statin monotherapy patients. Patient demographics are presented in Table 3.
All baseline laboratory data were collected within 90 days of therapy initiation (Table 4). Statin monotherapy patients had lower triglyceride levels compared with those of the fish oil and statin combination patients. However, both high-density lipoprotein (HDL) and low-density lipoprotein (LDL) levels were higher in the statin monotherapy patients. As seen in Table 5, diagnosis of heart failure, hypertension, hypothyroidism, and dyslipidemia were higher in the statin monotherapy cohort, while tobacco use and pancreatitis were more prevalent in the fish oil and statin combination cohort.
Kaplan Meier curves of the primary outcome, time to aggregate adverse cardiovascular event, and the secondary outcome, time to all-cause mortality are shown in Figure 1 and Figure 2, respectively. This shows adverse cardiovascular events and all-cause mortality for approximately 4,500 days for the fish oil and statin cohort and approximately 6,000 days for the statin monotherapy cohort.
Discussion
Analysis of this study failed to detect a statistically significant difference for time to aggregate adverse cardiovascular events or all-cause mortality. This may be due to fewer adverse cardiovascular events and mortality in the 2 cohorts than was anticipated.
There are no studies examining fish oil and statin therapy in the veteran population and only limited studies comparing statin and fish oil combination therapy vs statin monotherapy for adverse cardiovascular outcomes and all-cause mortality. One of the few comparison studies was by Macchia and colleagues and consisted of 7,924 post MI patients in Italy. Over a 4-year period, researchers found a slight improvement in the adjusted paired-matched population for all-cause mortality in the fish oil and statin therapy cohort vs statin monotherapy (8.6% vs 13.6% P < .001).3 A benefit also was seen in the fish oil and statin cohort vs statin monotherapy in the adjusted paired-matched population for death or stroke (16.7% vs 11.5% P < .001).3
In contrast, this study did not address postmyocardial infarction patients exclusively. Rather, patients in this study had lower morbidity, which resulted in fewer adverse cardiovascular outcomes and a greater difficulty to detect a difference in this healthier population. These healthier patients may derive less benefit from primary or secondary prevention with statin and fish oil combination therapy.
In this study, there were extensive inclusion and exclusion criteria to assess the relationship between the cohorts for
Comparison of demographic data showed both cohorts were of similar age, sex, and race. Of note the Fargo veteran population was primarily white (> 80% in both cohorts). This is slightly higher than the percentage of whites for all US veterans. The slight difference most likely had a minimal clinical impact. Laboratory values recorded within 90 days of initiation of therapy were largely clinically similar except for triglycerides being significantly higher in the fish oil and statin combination cohort (Table 4). This may reflect selection bias, where providers may be more likely to add fish oil therapy for the potential to further control triglycerides.
Diagnoses of hypertension, heart failure, and dyslipidemia were higher in the statin monotherapy cohort. However, body mass index, tobacco use, and pancreatitis were statistically higher in fish oil and statin combination cohort. Even though there was a statistically significant difference in disease diagnoses, this likely created a minor clinical difference between the groups. This is further illustrated by the similarity of the Charlson Comorbidity Index of 1.6 for fish oil and statin cohort and 1.4 in statin monotherapy cohort.
Strengths
A strength of this study was its adherence rates. Adherence rates were high in both cohorts (Table 6). Fish oil and statin cohort did have slightly lower adherence compared with that of statin monotherapy. This may demonstrate extra pill burden influencing adherence. Overall demographics, laboratory values, disease, and adherence rates were clinically similar in both cohorts, thus reducing the potential for confounders.
Limitations
Limitations of this study include its retrospective chart review design. This design is susceptible to incorrect recording of events. The primary outcome, aggregate adverse cardiovascular events, may have been incorrectly recorded in the medical record as other diseases, such as coronary artery disease or heart disease, and therefore not captured by ICD 9 code retrieval. Also, important information, such as laboratory data, disease, and medication adherence, may not have been documented for all patients. Of note 1 patient in the fish oil and statin combination cohort did not have any recorded laboratory data, disease, or adherence data.
Another limitation is lack of access to medical notes from non-VA providers, which can result in missed data collection. To reduce this limitation, the study excluded veterans that received non-VA fish oil, statins, or other hyperlipidemia medications for > 1 year. Veterans were included only if they used VA-provided fish oil or statins. This inclusion and exclusion criteria reduced the chance of missing data from other facilities because it favored inclusion of only subjects that received care exclusively through the VA.
Last, on study initiation it was not realized that fish oil was not provided by the health care system until about the year 2004. This resulted in less risk days for the fish oil and statin cohort. However, Kaplan Meier analysis lessens this issue from being a confounder. Time to event rates for both the primary and secondary outcomes were similar and most likely would have continued to trend together with the same therapy duration.
Conclusion
Fish oil and statin combination therapy when compared with statin monotherapy failed to show that a statistically significant difference exists in the rates of MI, stroke, transient ischemic attack, coronary artery bypass graft, and percutaneous intervention. The clinical difference of fish oil and statin combination therapy vs statin monotherapy is most likely small or nonexistent. From our literature search, this is the only study concerning the use of fish oil and statin combination therapy in the veteran population. It is most likely that fish oil and statin combination therapy and statin monotherapy are similar for the reduction of time to aggregate adverse cardiovascular events and all-cause mortality in the veteran population.
Acknowledgments
This material is the result of work supported with resources and the use of facilities at the Fargo VA Healthcare System.
1. Kochanek KD, Murphy SL, Xu J, Tejada-Vera B. Deaths: final data for 2014. https://www.cdc.gov/nchs/data/nvsr/nvsr65/nvsr65_04.pdf. Published June 30, 2016. Accessed July 26, 2018.
2. Stone NJ, Robinson JG, Lichtenstein AH, et al; American College of Cardiology/American Heart Association Task Force on Practice Guidelines. 2013 ACC/AHA guideline on the treatment of blood cholesterol to reduce atherosclerotic cardiovascular risk in adults: a report of the American College of Cardiology/American Heart Association Task Force on Practice Guidelines. J Am Coll Cardiol. 2014;63(25 pt B):2889-2934.
3. Yokoyama M, Origasa H, Matsuzaki M, et al; Japan EPA lipid intervention study (JELIS) Investigators. Effects of eicosapentaenoic acid on major coronary events in hypercholesterolaemic patients (JELIS): a randomised open-label, blinded endpoint analysis. Lancet. 2007;369(9567):1090-1098.
4. Macchia A, Romero M, D’Ettorre A, Tognoni G, Mariani J. Exploratory analysis on the use of statins with or without n-3 PUFA and major events in patients discharged for acute myocardial infarction: an observational retrospective study. PLoS One. 2013;8(5):e62772.
5. ORIGIN Trial Investigators, Bosch J, Gerstein HC, et al. n-3 fatty acids and cardiovascular outcomes in patients with dysglycemia. N Engl J Med. 2012;367(4):309-318.
6. The Risk and Prevention Study Collaborative Group, Roncaglioni MC, Tombesi M, et al. n-3 fatty acids in patients with multiple cardiovascular risk factors. N Engl J Med. 2013;368(19):1800-1808.
7. Rizos EC, Ntzani EE, Bika E, Kostapanos MS, Elisaf MS. Association between omega-3 fatty acid supplementation and risk of major cardiovascular disease events: a systematic review and meta-analysis. JAMA. 2012;308(10):1024-1033.
Inflammation in schizophrenia tied to poor functioning
Targeting inflammation in people with schizophrenia could lead to improvements in daily functioning, a study by Sophia Kogan, MD, PhD, and her associates at the Icahn School of Medicine at Mount Sinai, New York, has suggested.
“Our findings invite speculation about the underlying link between inflammation and neurocognitive dysfunction in schizophrenia,” Dr. Kogan and her associates wrote in Brain, Behavior, and Immunity. “Our results suggest that these associations also extend to poor daily functioning in this population.”
to analyze neurocognition, functions of daily living, and inflammatory markers in 41 adults aged 18-55 years with schizophrenia, schizoaffective disorder, or psychosis. Among the individuals in the trial, 36% were female, the average age was 37 years, and the average body mass index was 31 kg/m2. In addition, all of the individuals were either taking antipsychotics or were on doses of injectable depot antipsychotics. People with active substance use and mild depressive symptoms were excluded.
Dr. Kogan and her associates found that poorer neurocognition was tied to increased levels of peripheral tumor necrosis factor–alpha (TNF-a) and interleukin-12 (IL-12p70).
“For TNF-a, these findings were driven primarily by significant associations with poorer neurocognitive performance in the domains of speed of processing (P = .02), visual learning (P = .02), and reasoning and problem solving (P = .03),” wrote Dr. Kogan and her associates. “Similarly, the association between neurocognition and IL-12p70 was driven primarily by decreased speed of processing (P less than .01) and visual learning (P = .05).”
The small sample size was cited as a limitation, as was the exclusion of people with substance use and mild depressive symptoms.
The National Institute of Mental Health funded the study. Dr. Kogan reported no conflicts of interest. Coauthor David Kimhy, PhD, is a consultant to NeuroCog Trials relating to another project.
SOURCE: Kogan S et al. Brain Behav Immun. 2018 Sep 12. doi: 10.1016/j.bbi.2018.09.016.
FROM BRAIN, BEHAVIOR, AND IMMUNITY
Simplified SYNTAX holds promise, but still has doubters
SAN DIEGO – A simplified version of the SYNTAX score for coronary artery disease complexity strongly correlated with the unmodified SYNTAX score and could make it easier for cardiologists to employ it in everyday practice. The modified version can be easily memorized and has simplified values that a clinician can calculate and use to determine an appropriate treatment without breaking their work flow to consult a computerized system.

“It’s primarily simplifying the values for the location of the lesions that has allowed it to be more memorizable. That does make it a slightly blunter tool, but only slightly,” said Sonya Burgess, MBCHB, during a presentation at the Transcatheter Cardiovascular Therapeutics annual meeting. Dr. Burgess is an interventional cardiologist at the University of New South Wales, Sydney.
In common practice, SYNTAX scores often go uncalculated because of their complexity, despite guidelines that recommend it. “My guess might be that 1 in every 10 [cardiologists] do it, and that’s not right for our patients,” said Dr. Burgess.
Others at the session agreed that SYNTAX is underutilized, but not all agreed with Dr. Burgess’ solution. Notable among the attendees was Patrick Serruys, MD, of Erasmus University, Rotterdam, the Netherlands, who originally published the SYNTAX system. He doesn’t like the idea of simplifying SYNTAX, based in part on previous experience. “About 10 years ago, Boston Scientific found the score too difficult and they wanted to simplify it, but the score completely lost its prognostic value. I was very emotional about that and I said, ‘no, we have to keep all of the components until we understand [the risk factors] much better,’ ” said Dr. Serruys.
But Dr. Burgess argued that the simplified system, which she and her coinvestigators created, makes concessions to the realities of an interventional cardiology suite. To obtain a standard SYNTAX score, “they have to stop doing something or rebook something, or there’s a lesion there that they just want to treat. [With the simplified score], at least before they go on to treat that lesion, they don’t have to take their gowns and gloves off. You can even have a card hanging on the bar [to refer to].” Dr. Burgess did not provide details of the system.
Dr. Serruys agreed with the source of the problem. “Dr. Burgess is right, it is somewhat demanding,” he allowed, but he also called on clinicians to consider the needs of the patient, even going so far as picturing the patient as a family member. “People complain that doing the SYNTAX is on average 7 minutes, with a standard deviation of 7, so you could work 15 minutes just looking at film. But when you think that the future of your father or brother is depending on the surgeon and the cardiologist looking carefully, I find the argument absolutely obnoxious,” said Dr. Serruys at the meeting sponsored by the Cardiovascular Research Foundation.
Rather than simplification, he stresses teamwork. With at least three people looking at the angiogram, the results are consistent and useful. “You look at the film with the trainees, and that’s how they learn. Never do a SYNTAX score alone,” said Dr. Serruys.
To assess the simplified SYNTAX score, the researchers conducted a retrospective assessment of both the SYNTAX score and the simplified SYNTAX score in 617 patients who had multivessel disease. They performed both assessments in subgroups of patients with 169 patients with ST-segment elevation MI, 78 patients with chronic total occlusion, and 113 patients with left main coronary artery (LMCA) stenosis. They used a 100-patient derivation cohort to determine cutoffs for patients who would not be suitable for percutaneous coronary intervention. They also looked at the accuracy of the simplified version compared with standard SYNTAX in 517 patients from five tertiary centers.
The Spearman’s rho value was 0.93 overall and at least 0.91 for all subgroups (P less than .001 for all). In patients with LMCA stenosis, the simplified version had a sensitivity of 100%, specificity of 85%, negative predictive of 100%, and an area under the curve of 1.0 (P less than .001). For patients with multivessel disease and no LMCA stenosis, the values were 98%, 82%, 99%, and 0.971, respectively (P less than .001).
Dr. Burgess and Dr. Serruys reported no financial conflicts of interest.
SAN DIEGO – A simplified version of the SYNTAX score for coronary artery disease complexity strongly correlated with the unmodified SYNTAX score and could make it easier for cardiologists to employ it in everyday practice. The modified version can be easily memorized and has simplified values that a clinician can calculate and use to determine an appropriate treatment without breaking their work flow to consult a computerized system.
“It’s primarily simplifying the values for the location of the lesions that has allowed it to be more memorizable. That does make it a slightly blunter tool, but only slightly,” said Sonya Burgess, MBCHB, during a presentation at the Transcatheter Cardiovascular Therapeutics annual meeting. Dr. Burgess is an interventional cardiologist at the University of New South Wales, Sydney.
In common practice, SYNTAX scores often go uncalculated because of their complexity, despite guidelines that recommend it. “My guess might be that 1 in every 10 [cardiologists] do it, and that’s not right for our patients,” said Dr. Burgess.
Others at the session agreed that SYNTAX is underutilized, but not all agreed with Dr. Burgess’ solution. Notable among the attendees was Patrick Serruys, MD, of Erasmus University, Rotterdam, the Netherlands, who originally published the SYNTAX system. He doesn’t like the idea of simplifying SYNTAX, based in part on previous experience. “About 10 years ago, Boston Scientific found the score too difficult and they wanted to simplify it, but the score completely lost its prognostic value. I was very emotional about that and I said, ‘no, we have to keep all of the components until we understand [the risk factors] much better,’ ” said Dr. Serruys.
But Dr. Burgess argued that the simplified system, which she and her coinvestigators created, makes concessions to the realities of an interventional cardiology suite. To obtain a standard SYNTAX score, “they have to stop doing something or rebook something, or there’s a lesion there that they just want to treat. [With the simplified score], at least before they go on to treat that lesion, they don’t have to take their gowns and gloves off. You can even have a card hanging on the bar [to refer to].” Dr. Burgess did not provide details of the system.
Dr. Serruys agreed with the source of the problem. “Dr. Burgess is right, it is somewhat demanding,” he allowed, but he also called on clinicians to consider the needs of the patient, even going so far as picturing the patient as a family member. “People complain that doing the SYNTAX is on average 7 minutes, with a standard deviation of 7, so you could work 15 minutes just looking at film. But when you think that the future of your father or brother is depending on the surgeon and the cardiologist looking carefully, I find the argument absolutely obnoxious,” said Dr. Serruys at the meeting sponsored by the Cardiovascular Research Foundation.
Rather than simplification, he stresses teamwork. With at least three people looking at the angiogram, the results are consistent and useful. “You look at the film with the trainees, and that’s how they learn. Never do a SYNTAX score alone,” said Dr. Serruys.
To assess the simplified SYNTAX score, the researchers conducted a retrospective assessment of both the SYNTAX score and the simplified SYNTAX score in 617 patients who had multivessel disease. They performed both assessments in subgroups of patients with 169 patients with ST-segment elevation MI, 78 patients with chronic total occlusion, and 113 patients with left main coronary artery (LMCA) stenosis. They used a 100-patient derivation cohort to determine cutoffs for patients who would not be suitable for percutaneous coronary intervention. They also looked at the accuracy of the simplified version compared with standard SYNTAX in 517 patients from five tertiary centers.
The Spearman’s rho value was 0.93 overall and at least 0.91 for all subgroups (P less than .001 for all). In patients with LMCA stenosis, the simplified version had a sensitivity of 100%, specificity of 85%, negative predictive of 100%, and an area under the curve of 1.0 (P less than .001). For patients with multivessel disease and no LMCA stenosis, the values were 98%, 82%, 99%, and 0.971, respectively (P less than .001).
Dr. Burgess and Dr. Serruys reported no financial conflicts of interest.
REPORTING FROM TCT 2018
Key clinical point: A simplified SYNTAX score could lead to broader implementation of evidence-based decision making for complex coronary artery disease.
Major finding: The simplified score had a Spearman’s rho value of 0.93 overall.
Study details: A retrospective analysis of 617 patients with multivessel disease.
Disclosures: Dr. Burgess and Dr. Serruys reported no financial conflicts of interest.