User login
Necrotizing fasciitis after a watercraft accident
A 57-year-old man was transferred to our hospital with leg pain and confusion. His family reported that he had injured his leg while launching a motorized personal watercraft at the North Carolina seashore 2 days before. He had a history of cirrhosis secondary to hepatitis C and alcohol abuse.


Blood and wound cultures eventually grew V vulnificus, and surgical pathology confirmed the diagnosis of necrotizing fasciitis (Figure 2).
RISE IN V VULNIFICUS INFECTIONS IS ATTRIBUTED TO GLOBAL WARMING
V vulnificus infection occurs most commonly from consuming raw shellfish, especially oysters, but it also occurs after exposure of an open wound to contaminated salt water. The pathogen is a gram-negative bacterium that resides in coastal waters worldwide, but in the United States it is usually seen on the Pacific and Gulf coasts1 during the summer.2
Although only 58 cases of V vulnificus infection were reported to the US Centers for Disease Control and Prevention in 1997, the number more than doubled to 124 in 2014.1 This rise is suspected to be due in part to warmer coastal waters associated with global warming.2
Various marine pathogens can cause wound infections, but V vulnificus is most commonly implicated in deaths and hospitalizations.2 Immunocompromised patients and those with liver disease are at particularly high risk of rapid progression to septic shock.
First-line antibiotics are doxycycline plus a third-generation cephalosporin.3 Studies have shown a direct correlation between delay of antibiotics and death,4 and early surgery is critical.5
Given the rising incidence of V vulnificus infection, it is increasingly important for providers across the United States to be aware of this infection.
- Centers for Disease Control and Prevention. National enteric disease surveillance: COVIS annual summary, 2014. US Department of Health and Human Services, Atlanta, GA. 2014. www.cdc.gov/nationalsurveillance/pdfs/covis-annual-summary-2014-508c.pdf. Accessed May 8, 2018.
- Newton A, Kendall M, Vugia DJ, Henao OL, Mahon BE. Increasing rates of vibriosis in the United States, 1996–2010: review of surveillance data from 2 systems. Clinl Infect Dis 2012; 54(suppl 5):S391–S395. doi:10.1093/cid/cis243
- Stevens DL, Bisno AL, Chambers HF, et al. Practice guidelines for the diagnosis and management of skin and soft tissue infections: 2014 update by the Infectious Diseases Society of America. Clin Infect Dis 2014; 59(2):147-159. doi:10.1093/cid/ciu444
- Klontz KC, Lieb S, Schreiber M, Janowski HT, Baldy LM, Gunn RA. Syndromes of Vibrio vulnificus infections. Clinical and epidemiologic features in Florida cases, 1981-1987. Ann Intern Med 1988; 109:318–323. pmid:3260760
- Chao WN, Tsai CF, Chang HR, et al. Impact of timing of surgery on outcome of Vibrio vulnificus-related necrotizing fasciitis. Am J Surg 2013; 206(1):32–39. doi:10.1016/j.amjsurg.2012.08.008
A 57-year-old man was transferred to our hospital with leg pain and confusion. His family reported that he had injured his leg while launching a motorized personal watercraft at the North Carolina seashore 2 days before. He had a history of cirrhosis secondary to hepatitis C and alcohol abuse.
Blood and wound cultures eventually grew V vulnificus, and surgical pathology confirmed the diagnosis of necrotizing fasciitis (Figure 2).
RISE IN V VULNIFICUS INFECTIONS IS ATTRIBUTED TO GLOBAL WARMING
V vulnificus infection occurs most commonly from consuming raw shellfish, especially oysters, but it also occurs after exposure of an open wound to contaminated salt water. The pathogen is a gram-negative bacterium that resides in coastal waters worldwide, but in the United States it is usually seen on the Pacific and Gulf coasts1 during the summer.2
Although only 58 cases of V vulnificus infection were reported to the US Centers for Disease Control and Prevention in 1997, the number more than doubled to 124 in 2014.1 This rise is suspected to be due in part to warmer coastal waters associated with global warming.2
Various marine pathogens can cause wound infections, but V vulnificus is most commonly implicated in deaths and hospitalizations.2 Immunocompromised patients and those with liver disease are at particularly high risk of rapid progression to septic shock.
First-line antibiotics are doxycycline plus a third-generation cephalosporin.3 Studies have shown a direct correlation between delay of antibiotics and death,4 and early surgery is critical.5
Given the rising incidence of V vulnificus infection, it is increasingly important for providers across the United States to be aware of this infection.
- Centers for Disease Control and Prevention. National enteric disease surveillance: COVIS annual summary, 2014. US Department of Health and Human Services, Atlanta, GA. 2014. www.cdc.gov/nationalsurveillance/pdfs/covis-annual-summary-2014-508c.pdf. Accessed May 8, 2018.
- Newton A, Kendall M, Vugia DJ, Henao OL, Mahon BE. Increasing rates of vibriosis in the United States, 1996–2010: review of surveillance data from 2 systems. Clinl Infect Dis 2012; 54(suppl 5):S391–S395. doi:10.1093/cid/cis243
- Stevens DL, Bisno AL, Chambers HF, et al. Practice guidelines for the diagnosis and management of skin and soft tissue infections: 2014 update by the Infectious Diseases Society of America. Clin Infect Dis 2014; 59(2):147-159. doi:10.1093/cid/ciu444
- Klontz KC, Lieb S, Schreiber M, Janowski HT, Baldy LM, Gunn RA. Syndromes of Vibrio vulnificus infections. Clinical and epidemiologic features in Florida cases, 1981-1987. Ann Intern Med 1988; 109:318–323. pmid:3260760
- Chao WN, Tsai CF, Chang HR, et al. Impact of timing of surgery on outcome of Vibrio vulnificus-related necrotizing fasciitis. Am J Surg 2013; 206(1):32–39. doi:10.1016/j.amjsurg.2012.08.008

Reverse T3 or perverse T3? Still puzzling after 40 years
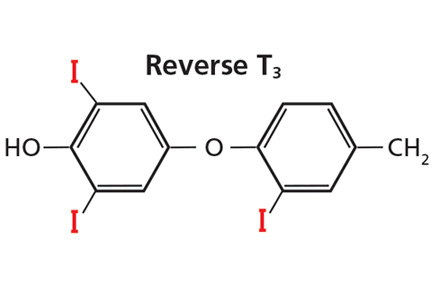
Four decades after reverse T3 (3,3´5´-triiodothyronine) was discovered, its physiologic and clinical relevance remains unclear and is still being studied. But scientific uncertainty has not stopped writers in the consumer press and on the Internet from making unsubstantiated claims about this hormone. Many patients believe their hypothyroid symptoms are due to high levels of reverse T3 and want to be tested for it, and some even bring in test results from independent laboratories.
HOW THYROID HORMONES WERE DISCOVERED

In 1970, Braverman et al9 showed that T4 is converted to T3 in athyreotic humans, and Sterling et al10 demonstrated the same in healthy humans. During that decade, techniques for measuring T4 were refined,11 and a specific radioimmunoassay for reverse T3 allowed a glimpse of its physiologic role.12 In 1975, Chopra et al13 noted reciprocal changes in the levels of T3 and reverse T3 in systemic illnesses—ie, when people are sick, their T3 levels go down and their reverse T3 levels go up.

The end of the 70s was marked by a surge of interest in T4 metabolites, including the development of a radioimmunoassay for 3,3´-diiodothyronine (3-3´ T2).18
The observed reciprocal changes in serum levels of T3 and reverse T3 suggested that T4 degradation is regulated into activating (T3) or inactivating (reverse T3) pathways, and that these changes are a presumed homeostatic process of energy conservation.19
HOW THYROID HORMONES ARE METABOLIZED
In the thyroid gland, for thyroid hormones to be synthesized, iodide must be oxidized and incorporated into the precursors 3-monoiodotyrosine (MIT) and 3,5-diiodotyrosine (DIT). This process is mediated by the enzyme thyroid peroxidase in the presence of hydrogen peroxide.20
The thyroid can make T4 and some T3
T4 is the main iodothyronine produced by the thyroid gland, at a rate of 80 to 100 µg per day.21 It is synthesized from the fusion of 2 DIT molecules.
The thyroid can also make T3 by fusing 1 DIT and 1 MIT molecule, but this process accounts for no more than 20% of the circulating T3 in humans. The rest of T3, and 95% to 98% of all reverse T3, is derived from peripheral conversion of T4 through deiodination.
T4 is converted to T3 or reverse T3
The metabolic transformation of thyroid hormones in peripheral tissues determines their biologic potency and regulates their biologic effects.
")
The number 4 in T4 means it has 4 iodine atoms. It can lose 1 of them, yielding either T3 or reverse T3, depending on which iodine atom it loses (Figure 3). Loss of iodine from the five-prime (5´) position on its outer ring yields T3, the most potent thyroid hormone, produced at a rate of 30 to 40 µg per day.21 On the other hand, when T4 loses an iodine atom from the five (5) position on its inner ring it yields reverse T3, produced at a rate slightly less than that of T3, 28 to 40 µg per day.21 Reverse T3 is inactive.
Both T3 and reverse T3 can shed more iodine atoms, forming in turn various isomers of T2, T1, and ultimately T0. Other pathways for thyroid hormone metabolism include glucuronidation, sulfation, oxidative deamination, and ether bond cleavage.20–22
D1 and D2 catalyze T3, D3 catalyzes reverse T3
Three types of enzymes that mediate deiodination have been identified and designated D1, D2, and D3. In humans they are expressed in variable amounts throughout the body:
- D1 mainly in the liver, kidneys, thyroid, and pituitary, but notably absent in the central nervous system
- D2 in the central nervous system, pituitary, brown adipose tissue, thyroid, placenta, skeletal muscle, and heart
- D3 in the central nervous system, skin, hemangiomas, fetal liver, placenta, and fetal tissues.23
D1 and D2 are responsible for converting T4 to T3, and D3 is responsible for converting T4 to reverse T3.
Plasma concentrations of free T4 and free T3 are relatively constant; however, tissue concentrations of free T3 vary in different tissues according to the amount of hormone transported and the activity of local deiodinases.23 Most thyroid hormone actions are initiated after T3 binds to its nuclear receptor. In this setting, deiodinases play a critical role in maintaining tissue and cellular thyroid hormone levels, so that thyroid hormone signaling can change irrespective of serum hormonal concentrations.22–24 For example, in the central nervous system, production of T3 by local D2 is significantly relevant for T3 homeostasis.22,23
Deiodinases also modulate the tissue-specific concentrations of T3 in response to iodine deficiency and to changes in thyroid state.23 During iodine deficiency and hypothyroidism, tissues that express D2, especially brain tissues, increase the activity of this enzyme in order to increase local conversion of T4 to T3. In hyperthyroidism, D1 overexpression contributes to the relative excess of T3 production, while D3 up-regulation in the brain protects the central nervous system from excessive amounts of thyroid hormone.23
REVERSE T3 AND SYSTEMIC ILLNESS
D3 is the main physiologic inactivator of thyroid hormones. This enzyme plays a central role in protecting tissues from an excess of thyroid hormone.23,24 This mechanism is crucial for fetal development and explains the high expression of D3 in the human placenta and fetal tissues.
In adult tissues, the importance of D3 in the regulation of thyroid hormone homeostasis becomes apparent under certain pathophysiologic conditions, such as nonthyroidal illness and malnutrition.
Whenever a reduction in metabolism is homeostatically desirable, such as in critically ill patients or during starvation, conversion to T3 is reduced and, alternatively, conversion to reverse T3 is increased. This pathway represents a metabolic adaptation that may protect the tissues from the catabolic effects of thyroid hormone that could otherwise worsen the patient’s basic clinical condition.
Euthyroid sick syndrome or hypothyroid?
In a variety of systemic illnesses, some patients with low T3, low or normal T4, and normal thyroid-stimulating hormone (TSH) levels could in fact be “sick euthyroid” rather than hypothyroid. The first reports of the euthyroid sick syndrome or low T3 syndrome date back to about 1976, and even though assays for reverse T3 were not widely available, some authors linked the syndrome to high levels of reverse T3.15,16 The syndrome is also known as nonthyroidal illness syndrome.
Advances in techniques for measuring T3, reverse T3, and other iodothyronines filled a gap in the understanding of the alterations that occur in thyroid hormone economy during severe nonthyroidal diseases. In 1982, Wartofsky and Burman25 reviewed the alterations in thyroid function in patients with systemic illness and discussed other factors that may alter thyroid economy, such as age, stress, and diverse drugs.
More recently, the low-T3 syndrome was revisited with a generalized concept regarding the role of D3 in the syndrome.26 D3, normally undetectable in mature tissues, is reactivated in diverse cell types in response to injury and is responsible for a fall in serum T3 levels. Hypoxia induces D3 activity and mRNA in vitro and in vivo.27 Recent studies have focused on the role of cytokines in the low T3 syndrome. For instance, interleukin 6 reduces D1 and D2 activity and increases D3 activity in vitro.28
In the outpatient setting, diverse conditions may affect thyroid hormone homeostasis, compatible with mild or atypical forms of low-T3 syndrome, including caloric deprivation, heart failure, and human immunodeficiency virus infection.29
POSSIBLE CLINICAL UTILITY OF MEASURING REVERSE T3
In inpatients
Unfortunately, measuring serum reverse T3 levels has not, in general, proven clinically useful for the diagnosis of hypothyroidism in systemically ill patients. Burmeister30 demonstrated, in a retrospective study, that when illness complicates the interpretation of thyroid function tests, serum reverse T3 measurements do not reliably distinguish the hypothyroid sick patient from the euthyroid sick patient. The best way to make the diagnosis, Burmeister suggested, is by clinical assessment, combined use of free T4 and TSH measurements, and patient follow-up.

In the outpatient setting, the utility of reverse T3 measurements is controversial. In intensive care units, the differential diagnosis between hypothyroidism and nonthyroidal illness syndrome can sometimes be difficult. Reverse T3 levels can be low, normal, or high regardless of the thyroidal state of the patient.30 Moreover, endogenous changes in the hypothalamic-pituitary-thyroid axis may be further complicated by medications commonly used in intensive care units, such as dopamine and glucocorticoids. Changes in thyroid function should be evaluated in the context of the patient’s clinical condition (Table 1).20 But regardless of the T3 level, treatment with T3 or T4 should not be started without taking into consideration the patient’s general clinical context; controlled trials have not shown such therapy to be beneficial.20
In outpatients
In noncritical conditions that may be associated with mild forms of low T3 syndrome, patients generally present with low T3 concentrations concurrently with low or normal TSH. Not infrequently, however, patients present with a serum reverse T3 measurement and impute their symptoms of hypothyroidism to “abnormal” reverse T3 levels, in spite of normal TSH levels.
There is no rationale for measuring reverse T3 to initiate or to adjust levothyroxine therapy—the single test relevant for these purposes is the TSH measurement. The risks of basing treatment decisions on reverse T3 levels include the use of excessive doses of levothyroxine that may lead to a state of subclinical or even clinical hyperthyroidism.
TAKE-HOME MESSAGE
The existence of an inactivating pathway of thyroid hormones represents a homeostatic mechanism, and in selected circumstances measuring serum reverse T3 may be useful, such as in euthyroid sick patients. The discovery of the molecular mechanisms that lead to the reactivation of D3 in illness is an important field of research.
- Kendall EC. Landmark article, June 19, 1915. The isolation in crystalline form of the compound containing iodin, which occurs in the thyroid. Its chemical nature and physiologic activity. By E.C. Kendall. JAMA 1983; 250(15):2045–2046. doi:10.1001/jama.1983.03340150087037
- Harington CR. Chemistry of thyroxine: isolation of thyroxine from the thyroid gland. Biochem J 1926; 20(2):293–299. pmid: 16743658
- Harington CR, Barger G. Chemistry of thyroxine: constitution and synthesis of thyroxine. Biochem J 1927; 21(1):169–183. pmid:16743801
- Gross J, Pitt-Rivers R. The identification of 3,5,3’L-triiodothyronine in human plasma. Lancet 1952; 1(6705):439–441. doi:10.1016/S0140-6736(52)91952-1
- Gross J, Pitt-Rivers R. 3:5:3’-triiodothyronine. 1. Isolation from thyroid gland and synthesis. Biochem J 1953; 53(4):645–650. pmid:13032123
- Pitt-Rivers R, Stanbury JB, Rapp B. Conversion of thyroxine to 3-5-3´-triiodothyronine in vivo. J Clin Endocrinol Metab 1955; 15(5):616–620. doi:10.1210/jcem-15-5-616
- Maclagan NF, Bowden CH, Wilkinson JH. The metabolism of thyroid hormones. 2. Detection of thyroxine and tri-iodothyronine in human plasma. Biochem J. 1957; 67(1):5–11. pmid:13471502
- Galton VA, Pitt-Rivers R. The identification of the acetic acid analogues of thyroxine and tri-iodothyronine in mammalian tissues. Biochem J 1959; 72(2):319–321. pmid: 13662303
- Braverman LE, Ingbar SH, Sterling K. Conversion of thyroxine (T4) to triiodothyronine (T3) in athyreotic human subjects. J Clin Invest 1970; 49(5):855–864. doi:10.1172/JCI106304
- Sterling K, Brenner MA, Newman ES. Conversion of thyroxine to triiodothyronine in normal human subjects. Science 1970; 169(3950):1099–1100. doi:10.1126/science.169.3950.1099
- Chopra IJ. A radioimmunoassay for measurement of thyroxine in unextracted serum. J Clin Endocrinol Metab 1972; 34:938–947. doi:10.1210/jcem-34-6-938
- Chopra IJ. A radioimmunoassay for measurement of 3,3´,5´-triiodothyronine (reverse T3). J Clin Invest 1974; 54(3):583–592. doi:10.1172/JCI107795
- Chopra IJ, Chopra U, Smith SR, Reza M, Solomon DH. Reciprocal changes in serum concentrations of 3,3´,5-triiodothyronine (T3) in systemic illnesses. J Clin Endocrinol Metab 1975; 41(6):1043–1049. doi:10.1210/jcem-41-6-1043
- Burman KD, Read J, Dimond RC, Strum D, et al. Measurement of 3,3’,5’-triiodothyroinine (reverse T3), 3,3’-L-diiodothyronine, T3 and T4 in human amniotic fluid and in cord and maternal serum. J Clin Endocrinol Metab 1976; 43(6):1351–1359. doi:10.1210/jcem-43-6-1351
- Rubenfeld S. Euthyroid sick syndrome. N Engl J Med 1978; 299(25):1414. doi:10.1056/NEJM197812212992514
- Burger A, Nicod P, Suter P, Vallotton MB, Vagenakis P, Braverman L. Reduced active thyroid hormone levels in acute illness. Lancet 1976; 1(7961):653–655. doi:10.1016/S0140-6736(76)92774-4
- Burman KD, Dimond RC, Wright FD, Earll JM, Bruton J, Wartofsky L. A radioimmunoassay for 3,3´,5´-L-triiodothyronine (reverse T3): assessment of thyroid gland content and serum measurements in conditions of normal and altered thyroidal economy and following administration of thyrotropin releasing hormone (TRH) and thyrotropin (TSH). J Clin Endocrinol Metab 1977; 44(4):660–672. doi:10.1210/jcem-44-4-660
- Burman KD, Strum D, Dimond RC, et al. A radioimmunoassay for 3,3´-L-diiodothyronine (3,3´T2). J Clin Endocrinol Metab 1977; 45(2):339–352. doi:10.1210/jcem-45-2-339
- Burman KD. Recent developments in thyroid hormone metabolism: interpretation and significance of measurements of reverse T3, 3,3´T2, and thyroglobulin. Metabolism 1978; 27(5):615–630. doi:10.1016/0026-0495(78)90028-8.
- Salvatore D, Davies TF, Schlumberger M, Hay ID, Larsen PR. Thyroid physiology and diagnostic evaluation of patients with thyroid disorders. In: Melmed S, Polonsky KS, Larsen PR, Kronenberg HM, eds. Williams Textbook of Endocrinology. 13th ed. Philadelphia, PA; Elsevier; 2016:334–368.
- Engler D, Burger AG. The deiodination of the iodothyronines and of their derivatives in man. Endocr Rev 1984; 5(2):151–184. doi:10.1210/edrv-5-2-151
- Peeters RP, Visser TJ, Peeters RP. Metabolism of thyroid hormone. Thyroid Disease Manager. www.thyroidmanager.org/chapter/metabolism-of-thyroid-hormone. Accessed March 14, 2018.
- Bianco AC, Salvatore D, Gereben B, Berry MJ, Larsen PR. Biochemistry, cellular and molecular biology, and physiological roles of the iodothyronine selenodeiodinases. Endocr Rev 2002; 23(1):38–89. doi:10.1210/edrv.23.1.0455
- Dentice M, Salvatore D. Deiodinases: the balance of thyroid hormone: local impact of thyroid hormone inactivation. J Endocrinol 2011; 209(3):273–282. doi:10.1530/JOE-11-0002
- Wartofsky L, Burman KD. Alterations in thyroid function in patients with systemic illness: the “euthyroid sick syndrome.” Endocr Rev 1982; 3(2):164–217. doi:10.1210/edrv-3-2-164
- Huang SA, Bianco AC. Reawakened interest in type III iodothyronine deiodinase in critical illness and injury. Nat Clin Pract Endocrinol Metab 2008; 4(3):148–155. doi:10.1038/ncpendmet0727
- Simonides WS, Mulcahey MA, Redout EM, et al. Hypoxia-inducible factor induces local thyroid hormone inactivation during hypoxic-ischemic disease in rats. J Clin Invest 2008; 118(3):975–983. doi:10.1172/JCI32824
- Wajner SM, Goemann IM, Bueno AL, Larsen PR, Maia AL. IL-6 promotes nonthyroidal illness syndrome by blocking thyroxine activation while promoting thyroid hormone inactivation in human cells. J Clin Invest 2011; 121(5):1834–1845. doi:10.1172/JCI44678
- Moura Neto A, Zantut-Wittmann DE. Abnormalities of thyroid hormone metabolism during systemic illness: the low T3 syndrome in different clinical settings. Int J Endocrinol 2016; 2016:2157583. doi:10.1155/2016/2157583
- Burmeister LA. Reverse T3 does not reliably differentiate hypothyroid sick syndrome from euthyroid sick syndrome. Thyroid 1995; 5(6):435–441. doi:10.1089/thy.1995.5.435
- Huang SA, Tu HM, Harney JW, et al. Severe hypothyroidism caused by type 3 iodothyronine deiodinase in infantile hemangiomas. N Engl J Med 2000; 343(3):185–189. doi:10.1056/NEJM200007203430305
Four decades after reverse T3 (3,3´5´-triiodothyronine) was discovered, its physiologic and clinical relevance remains unclear and is still being studied. But scientific uncertainty has not stopped writers in the consumer press and on the Internet from making unsubstantiated claims about this hormone. Many patients believe their hypothyroid symptoms are due to high levels of reverse T3 and want to be tested for it, and some even bring in test results from independent laboratories.
HOW THYROID HORMONES WERE DISCOVERED
In 1970, Braverman et al9 showed that T4 is converted to T3 in athyreotic humans, and Sterling et al10 demonstrated the same in healthy humans. During that decade, techniques for measuring T4 were refined,11 and a specific radioimmunoassay for reverse T3 allowed a glimpse of its physiologic role.12 In 1975, Chopra et al13 noted reciprocal changes in the levels of T3 and reverse T3 in systemic illnesses—ie, when people are sick, their T3 levels go down and their reverse T3 levels go up.
The end of the 70s was marked by a surge of interest in T4 metabolites, including the development of a radioimmunoassay for 3,3´-diiodothyronine (3-3´ T2).18
The observed reciprocal changes in serum levels of T3 and reverse T3 suggested that T4 degradation is regulated into activating (T3) or inactivating (reverse T3) pathways, and that these changes are a presumed homeostatic process of energy conservation.19
HOW THYROID HORMONES ARE METABOLIZED
In the thyroid gland, for thyroid hormones to be synthesized, iodide must be oxidized and incorporated into the precursors 3-monoiodotyrosine (MIT) and 3,5-diiodotyrosine (DIT). This process is mediated by the enzyme thyroid peroxidase in the presence of hydrogen peroxide.20
The thyroid can make T4 and some T3
T4 is the main iodothyronine produced by the thyroid gland, at a rate of 80 to 100 µg per day.21 It is synthesized from the fusion of 2 DIT molecules.
The thyroid can also make T3 by fusing 1 DIT and 1 MIT molecule, but this process accounts for no more than 20% of the circulating T3 in humans. The rest of T3, and 95% to 98% of all reverse T3, is derived from peripheral conversion of T4 through deiodination.
T4 is converted to T3 or reverse T3
The metabolic transformation of thyroid hormones in peripheral tissues determines their biologic potency and regulates their biologic effects.
The number 4 in T4 means it has 4 iodine atoms. It can lose 1 of them, yielding either T3 or reverse T3, depending on which iodine atom it loses (Figure 3). Loss of iodine from the five-prime (5´) position on its outer ring yields T3, the most potent thyroid hormone, produced at a rate of 30 to 40 µg per day.21 On the other hand, when T4 loses an iodine atom from the five (5) position on its inner ring it yields reverse T3, produced at a rate slightly less than that of T3, 28 to 40 µg per day.21 Reverse T3 is inactive.
Both T3 and reverse T3 can shed more iodine atoms, forming in turn various isomers of T2, T1, and ultimately T0. Other pathways for thyroid hormone metabolism include glucuronidation, sulfation, oxidative deamination, and ether bond cleavage.20–22
D1 and D2 catalyze T3, D3 catalyzes reverse T3
Three types of enzymes that mediate deiodination have been identified and designated D1, D2, and D3. In humans they are expressed in variable amounts throughout the body:
- D1 mainly in the liver, kidneys, thyroid, and pituitary, but notably absent in the central nervous system
- D2 in the central nervous system, pituitary, brown adipose tissue, thyroid, placenta, skeletal muscle, and heart
- D3 in the central nervous system, skin, hemangiomas, fetal liver, placenta, and fetal tissues.23
D1 and D2 are responsible for converting T4 to T3, and D3 is responsible for converting T4 to reverse T3.
Plasma concentrations of free T4 and free T3 are relatively constant; however, tissue concentrations of free T3 vary in different tissues according to the amount of hormone transported and the activity of local deiodinases.23 Most thyroid hormone actions are initiated after T3 binds to its nuclear receptor. In this setting, deiodinases play a critical role in maintaining tissue and cellular thyroid hormone levels, so that thyroid hormone signaling can change irrespective of serum hormonal concentrations.22–24 For example, in the central nervous system, production of T3 by local D2 is significantly relevant for T3 homeostasis.22,23
Deiodinases also modulate the tissue-specific concentrations of T3 in response to iodine deficiency and to changes in thyroid state.23 During iodine deficiency and hypothyroidism, tissues that express D2, especially brain tissues, increase the activity of this enzyme in order to increase local conversion of T4 to T3. In hyperthyroidism, D1 overexpression contributes to the relative excess of T3 production, while D3 up-regulation in the brain protects the central nervous system from excessive amounts of thyroid hormone.23
REVERSE T3 AND SYSTEMIC ILLNESS
D3 is the main physiologic inactivator of thyroid hormones. This enzyme plays a central role in protecting tissues from an excess of thyroid hormone.23,24 This mechanism is crucial for fetal development and explains the high expression of D3 in the human placenta and fetal tissues.
In adult tissues, the importance of D3 in the regulation of thyroid hormone homeostasis becomes apparent under certain pathophysiologic conditions, such as nonthyroidal illness and malnutrition.
Whenever a reduction in metabolism is homeostatically desirable, such as in critically ill patients or during starvation, conversion to T3 is reduced and, alternatively, conversion to reverse T3 is increased. This pathway represents a metabolic adaptation that may protect the tissues from the catabolic effects of thyroid hormone that could otherwise worsen the patient’s basic clinical condition.
Euthyroid sick syndrome or hypothyroid?
In a variety of systemic illnesses, some patients with low T3, low or normal T4, and normal thyroid-stimulating hormone (TSH) levels could in fact be “sick euthyroid” rather than hypothyroid. The first reports of the euthyroid sick syndrome or low T3 syndrome date back to about 1976, and even though assays for reverse T3 were not widely available, some authors linked the syndrome to high levels of reverse T3.15,16 The syndrome is also known as nonthyroidal illness syndrome.
Advances in techniques for measuring T3, reverse T3, and other iodothyronines filled a gap in the understanding of the alterations that occur in thyroid hormone economy during severe nonthyroidal diseases. In 1982, Wartofsky and Burman25 reviewed the alterations in thyroid function in patients with systemic illness and discussed other factors that may alter thyroid economy, such as age, stress, and diverse drugs.
More recently, the low-T3 syndrome was revisited with a generalized concept regarding the role of D3 in the syndrome.26 D3, normally undetectable in mature tissues, is reactivated in diverse cell types in response to injury and is responsible for a fall in serum T3 levels. Hypoxia induces D3 activity and mRNA in vitro and in vivo.27 Recent studies have focused on the role of cytokines in the low T3 syndrome. For instance, interleukin 6 reduces D1 and D2 activity and increases D3 activity in vitro.28
In the outpatient setting, diverse conditions may affect thyroid hormone homeostasis, compatible with mild or atypical forms of low-T3 syndrome, including caloric deprivation, heart failure, and human immunodeficiency virus infection.29
POSSIBLE CLINICAL UTILITY OF MEASURING REVERSE T3
In inpatients
Unfortunately, measuring serum reverse T3 levels has not, in general, proven clinically useful for the diagnosis of hypothyroidism in systemically ill patients. Burmeister30 demonstrated, in a retrospective study, that when illness complicates the interpretation of thyroid function tests, serum reverse T3 measurements do not reliably distinguish the hypothyroid sick patient from the euthyroid sick patient. The best way to make the diagnosis, Burmeister suggested, is by clinical assessment, combined use of free T4 and TSH measurements, and patient follow-up.
In the outpatient setting, the utility of reverse T3 measurements is controversial. In intensive care units, the differential diagnosis between hypothyroidism and nonthyroidal illness syndrome can sometimes be difficult. Reverse T3 levels can be low, normal, or high regardless of the thyroidal state of the patient.30 Moreover, endogenous changes in the hypothalamic-pituitary-thyroid axis may be further complicated by medications commonly used in intensive care units, such as dopamine and glucocorticoids. Changes in thyroid function should be evaluated in the context of the patient’s clinical condition (Table 1).20 But regardless of the T3 level, treatment with T3 or T4 should not be started without taking into consideration the patient’s general clinical context; controlled trials have not shown such therapy to be beneficial.20
In outpatients
In noncritical conditions that may be associated with mild forms of low T3 syndrome, patients generally present with low T3 concentrations concurrently with low or normal TSH. Not infrequently, however, patients present with a serum reverse T3 measurement and impute their symptoms of hypothyroidism to “abnormal” reverse T3 levels, in spite of normal TSH levels.
There is no rationale for measuring reverse T3 to initiate or to adjust levothyroxine therapy—the single test relevant for these purposes is the TSH measurement. The risks of basing treatment decisions on reverse T3 levels include the use of excessive doses of levothyroxine that may lead to a state of subclinical or even clinical hyperthyroidism.
TAKE-HOME MESSAGE
The existence of an inactivating pathway of thyroid hormones represents a homeostatic mechanism, and in selected circumstances measuring serum reverse T3 may be useful, such as in euthyroid sick patients. The discovery of the molecular mechanisms that lead to the reactivation of D3 in illness is an important field of research.
- Kendall EC. Landmark article, June 19, 1915. The isolation in crystalline form of the compound containing iodin, which occurs in the thyroid. Its chemical nature and physiologic activity. By E.C. Kendall. JAMA 1983; 250(15):2045–2046. doi:10.1001/jama.1983.03340150087037
- Harington CR. Chemistry of thyroxine: isolation of thyroxine from the thyroid gland. Biochem J 1926; 20(2):293–299. pmid: 16743658
- Harington CR, Barger G. Chemistry of thyroxine: constitution and synthesis of thyroxine. Biochem J 1927; 21(1):169–183. pmid:16743801
- Gross J, Pitt-Rivers R. The identification of 3,5,3’L-triiodothyronine in human plasma. Lancet 1952; 1(6705):439–441. doi:10.1016/S0140-6736(52)91952-1
- Gross J, Pitt-Rivers R. 3:5:3’-triiodothyronine. 1. Isolation from thyroid gland and synthesis. Biochem J 1953; 53(4):645–650. pmid:13032123
- Pitt-Rivers R, Stanbury JB, Rapp B. Conversion of thyroxine to 3-5-3´-triiodothyronine in vivo. J Clin Endocrinol Metab 1955; 15(5):616–620. doi:10.1210/jcem-15-5-616
- Maclagan NF, Bowden CH, Wilkinson JH. The metabolism of thyroid hormones. 2. Detection of thyroxine and tri-iodothyronine in human plasma. Biochem J. 1957; 67(1):5–11. pmid:13471502
- Galton VA, Pitt-Rivers R. The identification of the acetic acid analogues of thyroxine and tri-iodothyronine in mammalian tissues. Biochem J 1959; 72(2):319–321. pmid: 13662303
- Braverman LE, Ingbar SH, Sterling K. Conversion of thyroxine (T4) to triiodothyronine (T3) in athyreotic human subjects. J Clin Invest 1970; 49(5):855–864. doi:10.1172/JCI106304
- Sterling K, Brenner MA, Newman ES. Conversion of thyroxine to triiodothyronine in normal human subjects. Science 1970; 169(3950):1099–1100. doi:10.1126/science.169.3950.1099
- Chopra IJ. A radioimmunoassay for measurement of thyroxine in unextracted serum. J Clin Endocrinol Metab 1972; 34:938–947. doi:10.1210/jcem-34-6-938
- Chopra IJ. A radioimmunoassay for measurement of 3,3´,5´-triiodothyronine (reverse T3). J Clin Invest 1974; 54(3):583–592. doi:10.1172/JCI107795
- Chopra IJ, Chopra U, Smith SR, Reza M, Solomon DH. Reciprocal changes in serum concentrations of 3,3´,5-triiodothyronine (T3) in systemic illnesses. J Clin Endocrinol Metab 1975; 41(6):1043–1049. doi:10.1210/jcem-41-6-1043
- Burman KD, Read J, Dimond RC, Strum D, et al. Measurement of 3,3’,5’-triiodothyroinine (reverse T3), 3,3’-L-diiodothyronine, T3 and T4 in human amniotic fluid and in cord and maternal serum. J Clin Endocrinol Metab 1976; 43(6):1351–1359. doi:10.1210/jcem-43-6-1351
- Rubenfeld S. Euthyroid sick syndrome. N Engl J Med 1978; 299(25):1414. doi:10.1056/NEJM197812212992514
- Burger A, Nicod P, Suter P, Vallotton MB, Vagenakis P, Braverman L. Reduced active thyroid hormone levels in acute illness. Lancet 1976; 1(7961):653–655. doi:10.1016/S0140-6736(76)92774-4
- Burman KD, Dimond RC, Wright FD, Earll JM, Bruton J, Wartofsky L. A radioimmunoassay for 3,3´,5´-L-triiodothyronine (reverse T3): assessment of thyroid gland content and serum measurements in conditions of normal and altered thyroidal economy and following administration of thyrotropin releasing hormone (TRH) and thyrotropin (TSH). J Clin Endocrinol Metab 1977; 44(4):660–672. doi:10.1210/jcem-44-4-660
- Burman KD, Strum D, Dimond RC, et al. A radioimmunoassay for 3,3´-L-diiodothyronine (3,3´T2). J Clin Endocrinol Metab 1977; 45(2):339–352. doi:10.1210/jcem-45-2-339
- Burman KD. Recent developments in thyroid hormone metabolism: interpretation and significance of measurements of reverse T3, 3,3´T2, and thyroglobulin. Metabolism 1978; 27(5):615–630. doi:10.1016/0026-0495(78)90028-8.
- Salvatore D, Davies TF, Schlumberger M, Hay ID, Larsen PR. Thyroid physiology and diagnostic evaluation of patients with thyroid disorders. In: Melmed S, Polonsky KS, Larsen PR, Kronenberg HM, eds. Williams Textbook of Endocrinology. 13th ed. Philadelphia, PA; Elsevier; 2016:334–368.
- Engler D, Burger AG. The deiodination of the iodothyronines and of their derivatives in man. Endocr Rev 1984; 5(2):151–184. doi:10.1210/edrv-5-2-151
- Peeters RP, Visser TJ, Peeters RP. Metabolism of thyroid hormone. Thyroid Disease Manager. www.thyroidmanager.org/chapter/metabolism-of-thyroid-hormone. Accessed March 14, 2018.
- Bianco AC, Salvatore D, Gereben B, Berry MJ, Larsen PR. Biochemistry, cellular and molecular biology, and physiological roles of the iodothyronine selenodeiodinases. Endocr Rev 2002; 23(1):38–89. doi:10.1210/edrv.23.1.0455
- Dentice M, Salvatore D. Deiodinases: the balance of thyroid hormone: local impact of thyroid hormone inactivation. J Endocrinol 2011; 209(3):273–282. doi:10.1530/JOE-11-0002
- Wartofsky L, Burman KD. Alterations in thyroid function in patients with systemic illness: the “euthyroid sick syndrome.” Endocr Rev 1982; 3(2):164–217. doi:10.1210/edrv-3-2-164
- Huang SA, Bianco AC. Reawakened interest in type III iodothyronine deiodinase in critical illness and injury. Nat Clin Pract Endocrinol Metab 2008; 4(3):148–155. doi:10.1038/ncpendmet0727
- Simonides WS, Mulcahey MA, Redout EM, et al. Hypoxia-inducible factor induces local thyroid hormone inactivation during hypoxic-ischemic disease in rats. J Clin Invest 2008; 118(3):975–983. doi:10.1172/JCI32824
- Wajner SM, Goemann IM, Bueno AL, Larsen PR, Maia AL. IL-6 promotes nonthyroidal illness syndrome by blocking thyroxine activation while promoting thyroid hormone inactivation in human cells. J Clin Invest 2011; 121(5):1834–1845. doi:10.1172/JCI44678
- Moura Neto A, Zantut-Wittmann DE. Abnormalities of thyroid hormone metabolism during systemic illness: the low T3 syndrome in different clinical settings. Int J Endocrinol 2016; 2016:2157583. doi:10.1155/2016/2157583
- Burmeister LA. Reverse T3 does not reliably differentiate hypothyroid sick syndrome from euthyroid sick syndrome. Thyroid 1995; 5(6):435–441. doi:10.1089/thy.1995.5.435
- Huang SA, Tu HM, Harney JW, et al. Severe hypothyroidism caused by type 3 iodothyronine deiodinase in infantile hemangiomas. N Engl J Med 2000; 343(3):185–189. doi:10.1056/NEJM200007203430305
Hydroxychloroquine: An old drug with new relevance
A 29-year-old African American woman presents with a photosensitive malar rash, fatigue, morning stiffness, and swelling in her hands. She is found to have elevated antinuclear antibody at a titer of 1:320. A complete blood cell count demonstrates leukopenia and thrombocytopenia. Results of renal function testing and urinalysis are within normal limits. She has no other medical problems and no history of blood clots or pregnancy loss.
Her arthritis and rash suggest systemic lupus erythematosus. She is counseled to avoid sun exposure, and treatment with hydroxychloroquine is considered.
WHAT IS HYDROXYCHLOROQUINE?
Hydroxychloroquine was developed to treat malaria but was later found to have immunomodulatory properties. It is now approved by the US Food and Drug Administration for treatment of discoid lupus, systemic lupus erythematosus, and rheumatoid arthritis. It is also approved to treat malaria; however, of the several malarial parasites, only Plasmodium falciparum can still be cured by hydroxychloroquine, and growing resistance limits the geographic locations where this drug can be used effectively.1,2
HISTORICAL BACKGROUND
Antimalarial drugs were discovered shortly before World War II. Their production was industrialized during the war because malaria was a leading cause of disease among soldiers, especially those deployed to the South Pacific.3
Atabrine (quinacrine), the first antimalarial widely used, had numerous side effects including yellowing of the skin. Aggressive research efforts to develop an alternative led to field testing of one of its derivative compounds, chloroquine, by the US Army in 1943. Continued chemical modification would create hydroxychloroquine, introduced in 1955.
A serendipitous consequence of the mass use of antimalarials during World War II was the discovery that they could be used to treat inflammatory arthritis and lupus. Eight years after the war ended, Shee4 reported that chloroquine had a beneficial effect on lupus and rheumatoid arthritis in US soldiers. Hydroxychloroquine is now the most commonly prescribed antimalarial for treatment of autoimmune disease.
HOW HYDROXYCHLOROQUINE WORKS
The primary mechanism by which hydroxychloroquine modulates systemic lupus erythematosus is by suppressing activation of Toll-like receptors, which exist on the surface of endosomes and play a significant role in the innate immune response and in autoimmune disease. Their activation is necessary for the expression of interferon-regulated genes and production of tumor necrosis factor alpha, which are key in the cell-mediated inflammatory response.
Antimalarial drugs such as hydroxychloroquine prevent Toll-like receptor activation by binding directly to nucleic acids in the activation pathway.5 In vitro studies show that blocking this pathway blunts the body’s primary cell-mediated inflammatory response; in vivo studies show that use of hydroxychloroquine is strongly correlated with a reduction in interferon alpha levels.6 The powerful effect of hydroxychloroquine on the cell-mediated pattern of inflammation found in lupus is consistent with this theory.
It was previously hypothesized that the immune-modulating effects of hydroxychloroquine were associated with a more general dysregulation of cellular lysosomes through inhibition of proteolysis or changes in cellular pH.7 This theory has since been displaced by the more specific and elegant mechanism described above.5
HOW WELL DOES IT WORK?
Benefit in systemic lupus erythematosus
Hydroxychloroquine has consistently demonstrated significant and multifaceted benefit in patients with systemic lupus erythematosus.
A systematic review of 95 articles8 concluded that this drug decreases lupus flares and decreases mortality rates in lupus patients by at least 50%, with a high level of evidence. Beneficial effects that had a moderate level of evidence were an increase in bone mineral density, fewer thrombotic events, and fewer cases of irreversible organ damage.
The preventive effect of hydroxychloroquine on thrombosis in lupus patients has been consistently demonstrated and is one of the key reasons the drug is considered a cornerstone of therapy in this disease.9 A nested case-control study of patients with lupus and thromboembolism demonstrated an odds ratio of 0.31 and relative risk reduction of 68% for those using antimalarials.10
Benefit in antiphospholipid antibody syndrome
Hydroxychloroquine prevents thrombosis in other diseases as well. For example, it has been shown to reduce the incidence of thrombotic events in patients with primary antiphospholipid syndrome.
In a retrospective cohort study in 114 patients with this disease, hydroxychloroquine significantly reduced the incidence of arterial thrombotic events over 10 years of follow-up (recurrence incidence 0 in those treated with hydroxychloroquine vs 1.14% in those not treated).11 The study also tracked levels of antiphospholipid antibodies and reported that hydroxychloroquine significantly reduced the levels of antibodies to cardiolipin and beta-2 glycoprotein 1, both implicated in the pathology of thrombosis.11
In vitro studies have also demonstrated that hydroxychloroquine can modulate a dysregulated inflammatory system to reduce thrombosis. For example, it has been shown that hydroxychloroquine can reverse platelet activation by antiphospholipid antibodies, prevent linking of antibody complexes to cell membranes, and promote proper membrane protein expression, thereby reducing the thrombotic qualities of antiphospholipid antibodies and even improving clearance times of antiphospholipid-related thrombi.12
Benefit in rheumatoid arthritis
Though there is less evidence, hydroxychloroquine has also shown benefit in rheumatoid arthritis, where it can be used by itself in mild disease or as part of combination therapy with active arthritis. Compared with biologic therapy in patients with early aggressive rheumatoid arthritis, triple therapy with methotrexate, sulfasalazine, and hydroxychloroquine was nearly as effective in terms of quality of life, and it cost only one-third as much, saving $20,000 per year of therapy per patient.13
Hydroxychloroquine has also been compared directly with chloroquine, its closest relation, in a large study incorporating patients with rheumatoid arthritis and patients with systemic lupus erythematosus. Patients using chloroquine experienced significantly more side effects, though it did prove marginally more effective.14
No benefit shown in Sjögren syndrome
Unfortunately, despite widespread use, hydroxychloroquine has not demonstrated positive clinical effects when used to treat primary Sjögren syndrome. Most notably, a 2014 randomized controlled trial of hydroxychloroquine vs placebo in 120 Sjögren patients found no significant improvement in primary symptoms of dryness, pain, or fatigue after 6 months of therapy.15
Metabolic benefits
Unexpectedly, hydroxychloroquine is associated with multiple metabolic benefits including improved lipid profiles and lower blood glucose levels. These findings, in addition to a reduced incidence of thrombosis, were initially reported in the Baltimore Lupus Cohort in 1996.16 Specifically, longitudinal evaluation of a cohort of lupus patients showed that hydroxychloroquine use was associated with a 7.6% reduction in total cholesterol and a 13.7% reduction in low-density lipoprotein cholesterol (LDL-C) over 3 months of therapy.17
Similar findings, including a reduction in LDL-C and an increase in high-density lipoprotein cholesterol, were strongly associated with the addition of hydroxychloroquine to methotrexate or to methotrexate and etanercept in a large cohort of rheumatoid arthritis patients followed over 2 years of therapy.18
In nondiabetic women with systemic lupus erythematosus or rheumatoid arthritis, average blood glucose was significantly lower in those taking hydroxychloroquine than in nonusers. The incidence of insulin resistance was also lower, but the difference was not statistically significant.19
Some have suggested that hydroxychloroquine may prevent diabetes mellitus. In a retrospective case series, compared with rheumatoid arthritis patients not taking the drug, patients treated with hydroxychloroquine for more than 4 years had a 25% lower risk of developing diabetes mellitus.20
In view of these metabolic benefits, especially regarding lipid regulation, and the above described antithrombotic properties of hydroxychloroquine, some researchers have recently hypothesized that hydroxychloroquine may be of benefit in patients with coronary artery disease.21 They suggested that the inflammatory contribution to the mechanism of coronary artery disease could be lessened by hydroxychloroquine even in patients without lupus erythematosus or rheumatoid arthritis.
PHARMACOLOGIC PROPERTIES
Understanding the pharmacologic properties of hydroxychloroquine is key to using it appropriately in clinical practice.
The half-life of elimination of hydroxychloroquine is 40 to 50 days, with half of the drug excreted renally in a concentration-dependent fashion.22,23 The drug reaches 95% of its steady-state concentration by about 6 months of therapy. Shorter durations of therapy do not provide adequate time for the drug to achieve steady-state concentration and may not allow patients and providers time to see its full clinical results. Therefore, its manufacturers recommend a 6-month trial of therapy to adequately determine if the drug improves symptoms.1
The oral bioavailability of hydroxychloroquine is about 75%, but pharmacokinetics vary among individuals.22,23 It has been suggested that this variability affects the efficacy of hydroxychloroquine. In a study of 300 patients with cutaneous lupus erythematosus, those whose treatment failed had significantly lower blood concentrations of hydroxychloroquine, while those who achieved complete remission had significantly higher concentrations.24
Another study found that titrating doses to target therapeutic blood concentrations can reduce disease activity in cutaneous lupus erythematosus.25 Measuring the blood concentration of hydroxychloroquine is not common in clinical practice but may have a role in select patients in whom initial therapy using a standard dosing regimen does not produce the desired results.
HOW SAFE IS HYDROXYCHLOROQUINE?
Hydroxychloroquine has numerous adverse effects, necessitating vigilance on the part of the prescriber. Most commonly reported are retinopathy, hyperpigmentation, myopathy, and skin reactions.1
Retinopathy
Retinopathy’s irreversibility—the threat of permanent vision loss—and its substantial prevalence in patients with a large drug exposure history, have marked retinopathy as the most concerning potential toxicity. The risk of ocular toxicity increases with the cumulative hydroxychloroquine dose. The prevalence of retinopathy in those using the drug less than 10 years is less than 2%; in contrast, the prevalence in patients with more than 20 years of exposure is reported to be as high as 20%.26
The American Academy of Ophthalmology has long stated that retinopathy is a significant risk of hydroxychloroquine therapy and that patients taking hydroxychloroquine should therefore undergo routine retinal and visual field screening by an ophthalmologist.

Currently, initial screening followed by yearly screening beginning 5 years thereafter is recommended for patients at low risk of toxicity (Table 1).27 Patients determined by an ophthalmologist to be at higher risk of retinopathy should be screened yearly. As identified by the American Academy of Ophthalmology, major risk factors for retinopathy include duration of use, concomitant tamoxifen exposure, significant renal disease, and preexisting retinal and macular disease.26,28
Recommendations for hydroxychloroquine dosing and screening were recently revised, for 2 reasons. Initially, its manufacturers recommended that hydroxychloroquine dosage be no higher than 6.5 mg/kg of ideal body weight to prevent retinopathy.1,29,30 However, it has recently been demonstrated that real body weight is a better predictor of risk of retinopathy than ideal body weight when dosing hydroxychloroquine, perhaps because of the increasing variance of real body weight in our patient population.26

Further, an atypical pattern of retinopathy called pericentral retinopathy is more common in Asians. A study of about 200 patients with a history of hydroxychloroquine retinopathy, including 36 Asian patients, found that the pericentral pattern occurred in half the Asian patients but only 2% of the white patients.31 The mechanism for this finding is unclear, but because pericentral retinopathy spares the macula, it can be missed using standard screening methods. Therefore, the American Academy of Ophthalmology now recommends that the dose limit be reduced from 6.5 mg/kg of ideal body weight to no more than 5.0 mg/kg of real body weight (Table 2).28
It is also recommended that screening methods such as automated visual fields and optical coherence tomography extend their fields beyond the macula in Asian patients to ensure that pericentral retinopathy is not missed.28
Optical coherence tomography is a particularly useful tool in the ocular evaluation of patients taking hydroxychloroquine. It can detect subtle changes such as thinning of the foveal photoreceptor outer segment, thickening of the retinal pigment epithelium, and loss of the macular ganglion cell–inner plexiform layer before there are visible signs of retinopathy and before symptoms arise.32
Currently, these guidelines are underutilized in clinical practice. Physician adherence to ophthalmologic guidelines is reported at about 50%.33 This statistic is jarring, given the potential for permanent loss of vision in those with hydroxychloroquine-mediated retinopathy, and demonstrates the importance of reinforcing proper understanding of the use of hydroxychloroquine in clinical practice.
Other adverse effects
Cutaneous hyperpigmentation can occur with hydroxychloroquine use (Figure 1). The hyperpigmentation appears to be due to local bruising following deposition of iron in the soft tissue.

While the pigmentation may persist permanently and cause an undesirable cosmetic effect, it has not been associated with other adverse outcomes.
Myopathy is a rare adverse effect. In one case series, 3 of 214 patients treated with hydroxychloroquine developed hydroxychloroquine-induced myopathy.35 Over the duration of their therapy, this was equivalent to an incidence of 1 case of myopathy in 100 patient-years of therapy. Myopathy improves with discontinuation of therapy, though it can persist for weeks, likely because of hydroxychloroquine’s prolonged elimination half-life.
Cardiomyopathy, specifically neurocardiomyopathy, is also an extremely rare adverse effect of hydroxychloroquine use. The mechanism is believed to be associated with the effect of hydroxychloroquine on lysosomal action, leading to an acquired lysosomal storage disorder with the typical cardiac hypertrophy and conduction abnormalities associated with this family of diseases.36
Acute generalized exanthematous pustulosis is another rare complication of hydroxychloroquine therapy. The appearance of the reaction is similar to that of pustular psoriasis, with pustules overlying flaking and scaling skin. It usually resolves within 2 weeks after cessation of hydroxychloroquine therapy. In a select few cases, the reaction persists or waxes and wanes over a period of weeks to months, and longer durations of recovery are thought to be due to hydroxychloroquine’s long half-life, as in hydroxychloroquine-induced myopathy.37
In view of this rare reaction, manufacturers of hydroxychloroquine recommend caution when using the drug in patients with psoriasis.1
Hematologic abnormalities. In very rare cases, hydroxychloroquine is associated with hematologic abnormalities including agranulocytosis, anemia, aplastic anemia, leukopenia, and thrombocytopenia.1
While no specific guidelines exist, caution is warranted when using hydroxychloroquine in patients with porphyria. Additionally, hydroxychloroquine and other antimalarials including primaquine have been associated with hemolysis in patients with glucose-6-phosphate dehydrogenase (G6PD) deficiency. The risk of hemolysis is generally considered low except at high hydroxychloroquine doses in patients with severe G6PD deficiency.38

For the above reasons, manufacturers recommended baseline and routine blood counts, and some providers screen patients for G6PD deficiency when prescribing hydroxychloroquine (Table 3).
PREGNANCY
Hydroxychloroquine is in pregnancy category C. Information is limited, and in view of the risks, the manufacturer says that it should be avoided in pregnancy.1 Nevertheless, it is generally considered safe during pregnancy, and its benefits may make it acceptable to continue in a patient who becomes pregnant, in spite of the possible risks.
We favor continuing hydroxychloroquine. This drug has been associated with improved maternal and fetal outcomes in lupus patients. Its use during pregnancy has not been associated with congenital malformations. The adverse visual effects of long-term hydroxychloroquine use, namely retinopathy, have never been reported in children as a consequence of exposure in utero.
In addition, hydroxychloroquine is transmitted only in minute quantities in breast milk.39 In pregnant women with systemic lupus erythematosus, hydroxychloroquine was associated with a lower risk of adverse outcomes, including preterm delivery and intrauterine growth restriction.40 However, hydroxychloroquine is far more toxic when ingested directly by infants than in adults.1
Maternal outcomes are also improved with the use of hydroxychloroquine. Stopping hydroxychloroquine during pregnancy in women with systemic lupus erythematosus is associated with significantly higher disease activity—fully twice as high as in those who continue hydroxychloroquine.41 These study results were corroborated in a small randomized trial in which pregnant women with lupus on placebo had significantly higher lupus disease activity scores than those pregnant women who were given hydroxychloroquine.42 The women taking hydroxychloroquine experienced no severe lupus flares for the duration of their pregnancies.
These findings suggest not only that hydroxychloroquine is safe in pregnancy, but also that it should be continued in lupus patients during pregnancy to prevent disease flares and adverse fetal outcomes.
AREAS OF UNCERTAINTY
Benefit in preclinical lupus?
Hydroxychloroquine has a consistently profound effect on outcomes in systemic lupus erythematosus. These findings, in addition to the more widespread use of antibody screening, have led to suggestions that hydroxychloroquine could be of benefit even before systemic lupus erythematosus is diagnosed.
A study in US military personnel found that patients taking hydroxychloroquine experienced a significantly longer lag time between first reported clinical symptoms of lupus and official diagnosis compared with matched controls who also went on to develop the disease, averaging 1.08 vs 0.29 years to disease classification.43 Those who used hydroxychloroquine also had lower rates of autoantibody accumulation. Therefore, hydroxychloroquine could be of benefit in carefully selected candidates at high risk of developing systemic lupus erythematosus.
The beneficial effects of hydroxychloroquine on patients with lupus and rheumatoid arthritis, in terms of primary measures of disease activity and secondary outcomes, were discovered fortuitously and were not the original intended targets of the drug. Because of its versatility, there are numerous other disease states in which hydroxychloroquine has shown a degree of benefit or has shown a potential for benefit.
Antiviral activity?
It has been suggested that antimalarial drugs could serve as adjunctive therapies against filoviruses such as Marburg and Ebola. There is a small body of in vitro and in vivo evidence that hydroxychloroquine could temper severe systemic inflammatory responses to filoviruses both through dysregulation of lysosomes and lysosomal pH (filoviruses have a pH-dependent mechanism of action) and through decreased production of tumor necrosis factor alpha and interferons. Heavy burdens of interferons and tumor necrosis factor alpha are associated with increased mortality rates in those infected with filoviruses.44
Antineoplastic activity?
Hydroxychloroquine has undergone in vitro testing as an adjunct to cancer therapies. There are several mechanisms by which it is theorized that hydroxychloroquine could target malignant cells, including inhibition of multidrug resistance pumps or autophagy, improvement of chemotherapy cell penetration, potentiation of presentation of major histocompatibility complexes, or even intercalation directly into DNA.45,46 However, it can also impair natural anticancer immunity and may allow cancer cells better nutrient supply through vascular effects.
In vitro studies have shown tumoricidal effects in lymphoma and melanoma, and inhibition of growth in lung, colon, breast, cervix, larynx, liver, and prostate cancers. In vivo studies have shown that hydroxychloroquine in high doses can prolong survival in glioblastoma.45
Unfortunately, all of these theorized or observed effects are dose-dependent and likely require doses that exceed currently recommended maximums.
Negative chronotropic effect?
Hydroxychloroquine has been found to decrease the resting heart rate in a cumulative dose-dependent fashion.47 Further, hydroxychloroquine has been known to increase digoxin levels, and the medications should not be used in combination.1
Whether the decrease in resting heart rate is associated with harm or benefit and whether the effect is significant enough to be considered when implementing therapy remain unanswered and deserve further investigation, as does the primary use of hydroxychloroquine for beneficial lipid and glucose reduction in patients who are otherwise healthy.
CASE CONCLUSION
The patient described at the beginning of this article was provided with information on the risks and benefits of hydroxychloroquine for treatment of her arthritis and rash suggestive of mild systemic lupus, and she opted to begin therapy. Her baseline eye screening was within normal limits. Based on her weight of 62 kg, she was started on 300 mg of hydroxychloroquine daily.
She had no significant adverse effects from the medication and reported slow improvement in her rash and joint complaints over the next 2 months. She remained on hydroxychloroquine over the next year without adverse effects or new evidence of autoimmune disease.
- Sanofi-Aventis. Product monograph: Plaquenil. http://products.sanofi.ca/en/plaquenil.pdf. Accessed May 2, 2018.
- Centers for Disease Control and Prevention (CDC). Malaria information and prophylaxis, by country. www.cdc.gov/malaria/travelers/country_table/a.html. Accessed May 2, 2018.
- Wallace DJ. The history of antimalarials. Lupus 1996; 5(suppl 1):S2–S3. pmid:8803902
- Shee JC. Lupus erythematosus treated with chloroquine. Lancet 1953; 265(6778):201–202. pmid:13070595
- Kuznik A, Bencina M, Svajger U, Jeras M, Rozman B, Jerala R. Mechanism of endosomal TLR inhibition by antimalarial drugs and imidazoquinolines. J Immunol 2011; 186:4794–4804. doi:10.4049/jimmunol.1000702
- Willis R, Seif AM, McGwin G Jr, et al. Effect of hydroxychloroquine treatment on pro-inflammatory cytokines and disease activity in SLE patients: data from LUMINA, a multiethnic US cohort. Lupus 2012; 21(8):830–835. doi:10.1177/0961203312437270
- Fox R. Anti-malarial drugs: possible mechanisms of action in autoimmune disease and prospects for drug development. Lupus 1996; 5(suppl 1):S4–S10. pmid:8803903
- Ruiz-Irastorza G, Ramos-Casals M, Brito-Zeron P, Khamashta MA. Clinical efficacy and side effects of antimalarials in systemic lupus erythematosus: a systematic review. Ann Rheum Dis 2010; 69(1):20–28. doi:10.1136/ard.2008.101766
- Lam NC, Ghetu MV, Bieniek ML. Systemic lupus erythematosus: primary care approach to diagnosis and management. Am Fam Physician 2016; 94(4):284–294. pmid:27548593
- Jung H, Bobba R, Su J, et al. The protective effect of antimalarial drugs on thrombovascular events in systemic lupus erythematosus. Arthritis Rheum 2010; 62(3):863–868. doi:10.1002/art.27289
- Nuri E, Taraborelli M, Andreoli L, et al. Long-term use of hydroxychloroquine reduces antiphospholipid antibodies levels in patients with primary antiphospholipid syndrome. Immunol Res 2017; 65(1):17–24. doi:10.1007/s12026-016-8812-z
- Erkan D, Aguiar CL, Andrade D, et al. 14th International Congress on Antiphospholipid Antibodies: task force report on antiphospholipid syndrome treatment trends. Autoimmun Rev 2014; 13(6):685–696. doi:10.1016/j.autrev.2014.01.053
- Jalal H, O’Dell JR, Bridges SL Jr, et al. Cost-effectiveness of triple therapy versus etanercept plus methotrexate in early aggressive rheumatoid arthritis. Arthritis Care Res (Hoboken) 2016; 68(12):1751–1757. doi:10.1002/acr.22895
- Avina-Zubieta JA, Galindo-Rodriguez G, Newman S, Suarez-Almazor ME, Russell AS. Long-term effectiveness of antimalarial drugs in rheumatic diseases. Ann Rheum Dis 1998; 57(10):582–587. pmid:9893568
- Gottenberg JE, Ravaud P, Puechal X, et al. Effects of hydroxychloroquine on symptomatic improvement in primary Sjogren syndrome. JAMA 2014; 312(3):249–258. doi:10.1001/jama.2014.7682
- Petri M. Hydroxychloroquine use in the Baltimore Lupus Cohort: effects on lipids, glucose and thrombosis. Lupus 1996; 5(suppl 1):S16–S22. pmid:8803905
- Cairoli E, Rebella M, Danese N, Garra V, Borba EF. Hydroxychloroquine reduces low-density lipoprotein cholesterol levels in systemic lupus erythematosus: a longitudinal evaluation of the lipid-lowering effect. Lupus 2012; 21(11):1178–1182. doi:10.1177/0961203312450084
- Charles-Schoeman C, Wang X, Lee YY, et al. Association of triple therapy with improvement in cholesterol profiles over two-year followup in the treatment of early aggressive rheumatoid arthritis trial. Arthritis Rheumatol 2016; 68(3):577–586. doi:10.1002/art.39502
- Penn SK, Kao AH, Schott LL, et al. Hydroxychloroquine and glycemia in women with rheumatoid arthritis and systemic lupus erythematosus. J Rheumatol 2010; 37(6):1136–1142. doi:10.3899/jrheum.090994
- Wasko MC, Hubert HB, Lingala VB, et al. Hydroxychloroquine and risk of diabetes in patients with rheumatoid arthritis. JAMA 2007; 298(2):187–193. doi:10.1001/jama.298.2.187
- Sun L, Liu M, Li R, et al. Hydroxychloroquine, a promising choice for coronary artery disease? Med Hypotheses 2016; 93:5–7. doi:10.1016/j.mehy.2016.04.045
- Tett SE, Cutler DJ, Day RO, Brown KF. Bioavailability of hydroxychloroquine tablets in healthy volunteers. Br J Clin Pharmacol 1989; 27(6):771–779. pmid:2757893
- Furst DE. Pharmacokinetics of hydroxychloroquine and chloroquine during treatment of rheumatic diseases. Lupus 1996; 5(suppl 1):S11–S15. pmid:8803904
- Frances C, Cosnes A, Duhaut P, et al. Low blood concentration of hydroxychloroquine in patients with refractory cutaneous lupus erythematosus. Arch Dermatol 2012; 148(4):479–484. doi:10.1001/archdermatol.2011.2558
- Chasset F, Arnaud L, Costedoat-Chalumeau N, Zahr N, Bessis D, Francès C. The effect of increasing the dose of hydroxychloroquine in patients with refractory cutaneous lupus erythematosus: an open-label prospective pilot study. J Am Acad Dermatol 2016; 74(4):693–699.e3. doi:10.1016/j.jaad.2015.09.064
- Melles RB, Marmor MF. The risk of toxic retinopathy in patients on long-term hydroxychloroquine therapy. JAMA Ophthalmol 2014; 132(12):1453–1460. doi:10.1001/jamaophthalmol.2014.3459
- Committee on Rheumatologic Care. American College of Rheumatology position statement. Screening for hydroxychloroquine retinopathy. www.rheumatology.org/Portals/0/Files/Screening-for-Hydroxychloroquine-Retinopathy-Position-Statement.pdf. Accessed April 2, 2018.
- Marmor MF, Kellner U, Lai TY, Melles RB, Mieler WF; American Academy of Ophthalmology. Recommendations on screening for chloroquine and hydroxychloroquine retinopathy (2016 revision). Ophthalmology 2016; 123(6):1386–1394. doi:10.1016/j.ophtha.2016.01.058
- Mackenzie AH. Antimalarial drugs for rheumatoid arthritis. Am J Med 1983; 75(6A):48–58. pmid:6362406
- Mackenzie AH. Dose refinements in long-term therapy of rheumatoid arthritis with antimalarials. Am J Med 1983; 75(1A):40–45. pmid:6869410
- Melles RB, Marmor MF. Pericentral retinopathy and racial differences in hydroxychloroquine toxicity. Ophthalmology 2015; 122(1):110–116. doi:10.1016/j.ophtha.2014.07.018
- Uslu H, Gurler B, Yildirim A, et al. Effect of hydroxychloroquine on the retinal layers: a quantitative evaluation with spectral-domain optical coherence tomography. J Ophthalmol 2016; 2016:8643174. doi:10.1155/2016/8643174
- Au A, Parikh V, Modi YS, Ehlers JP, Schachat AP, Singh RP. Hydroxychloroquine screening practice patterns within a large multispecialty ophthalmic practice. Am J Ophthalmol 2015; 160(3):561–568.e2. doi:10.1016/j.ajo.2015.06.009
- Jallouli M, Frances C, Plette JC, et al; Plaquenil Lupus Systemic Study Group. Hydroxychloroquine-induced pigmentation in patients with systemic lupus erythematosus. JAMA Dermatol 2013; 149(8):935–940. doi:10.1001/jamadermatol.2013.709
- Avina-Zubieta JA, Johnson ES, Suarez-Almazor ME, Russell AS. Incidence of myopathy in patients treated with antimalarials: a report of three cases and review of the literature. Br J Rheumatol 1995; 34(2):166–170. pmid:7704464
- Yogasundaram H, Putko BN, Tien J, et al. Hydroxychloroquine-induced cardiomyopathy: case report, pathophysiology, diagnosis, and treatment. Can J Cardiol 2014; 30:1706–1715. doi:10.1016/j.cjca.2014.08.016
- Pearson KC, Morrell DS, Runge SR, Jolly P. Prolonged pustular eruption from hydroxychloroquine: an unusual case of acute generalized exanthematous pustulosis. Cutis 2016; 97(3):212–216. pmid:27023083
- Youngster I, Arcavi L, Schechmaster R, et al. Medications and glucose-6-phosphate dehydrogenase deficiency: an evidence-based review. Drug Saf 2010; 33(9):713–726. doi:10.2165/11536520-000000000-00000
- Ostensen M, Khamashta M, Lockshin M, et al. Anti-inflammatory and immunosuppressive drugs and reproduction. Arthritis Res Ther 2006; 8(3):209. doi:10.1186/ar1957
- Leroux M, Desveaux C, Parcevaux M, et al. Impact of hydroxychloroquine on preterm delivery and intrauterine growth restriction in pregnant women with systemic lupus erythematosus: a descriptive cohort study. Lupus 2015; 24(13):1384–1391. doi:10.1177/0961203315591027
- Clowse MEB, Magder L, Witter F, Petri M. Hydroxychloroquine in lupus pregnancy. Arthritis Rheum 2006; 54(11):3640–3647. doi:10.1002/art.22159
- Levy RA, Vilela VS, Cataldo MJ, et al. Hydroxychloroquine in lupus pregnancy: double-blind and placebo-controlled study. Lupus 2001; 10(6):401–404. doi:10.1191/096120301678646137
- James JA, Kim-Howard XR, Bruner BF, et al. Hydroxychloroquine sulfate treatment is associated with later onset of systemic lupus erythematosus. Lupus 2007; 16(6):401–409. doi:10.1177/0961203307078579
- Akpovwa H. Chloroquine could be used for the treatment of filoviral infections and other viral infections that emerge or emerged from viruses requiring an acidic pH for infectivity. Cell Biochem Funct 2016; 34(4):191–196. doi:10.1002/cbf.3182
- Pascolo S. Time to use a dose of chloroquine as an adjuvant to anti-cancer chemotherapies. Eur J Pharmacol 2016; 771:139–144. doi:10.1016/j.ejphar.2015.12.017
- Furlong HC, Wessels JM, Guerra MT, Stämpfli MR, Foster WG. Hydroxychloroquine attenuates cigarette smoke induced autophagic signaling in the mouse ovary. Reprod Toxicol 2016; 61:105–113. doi:10.1016/j.reprotox.2016.03.044
- Cairoli E, Danese N, Teliz M, et al. Cumulative dose of hydroxychloroquine is associated with a decrease of resting heart rate in patients with systemic lupus erythematosus: a pilot study. Lupus 2015; 24(11):1204–1209. doi:10.1177/0961203315580870
A 29-year-old African American woman presents with a photosensitive malar rash, fatigue, morning stiffness, and swelling in her hands. She is found to have elevated antinuclear antibody at a titer of 1:320. A complete blood cell count demonstrates leukopenia and thrombocytopenia. Results of renal function testing and urinalysis are within normal limits. She has no other medical problems and no history of blood clots or pregnancy loss.
Her arthritis and rash suggest systemic lupus erythematosus. She is counseled to avoid sun exposure, and treatment with hydroxychloroquine is considered.
WHAT IS HYDROXYCHLOROQUINE?
Hydroxychloroquine was developed to treat malaria but was later found to have immunomodulatory properties. It is now approved by the US Food and Drug Administration for treatment of discoid lupus, systemic lupus erythematosus, and rheumatoid arthritis. It is also approved to treat malaria; however, of the several malarial parasites, only Plasmodium falciparum can still be cured by hydroxychloroquine, and growing resistance limits the geographic locations where this drug can be used effectively.1,2
HISTORICAL BACKGROUND
Antimalarial drugs were discovered shortly before World War II. Their production was industrialized during the war because malaria was a leading cause of disease among soldiers, especially those deployed to the South Pacific.3
Atabrine (quinacrine), the first antimalarial widely used, had numerous side effects including yellowing of the skin. Aggressive research efforts to develop an alternative led to field testing of one of its derivative compounds, chloroquine, by the US Army in 1943. Continued chemical modification would create hydroxychloroquine, introduced in 1955.
A serendipitous consequence of the mass use of antimalarials during World War II was the discovery that they could be used to treat inflammatory arthritis and lupus. Eight years after the war ended, Shee4 reported that chloroquine had a beneficial effect on lupus and rheumatoid arthritis in US soldiers. Hydroxychloroquine is now the most commonly prescribed antimalarial for treatment of autoimmune disease.
HOW HYDROXYCHLOROQUINE WORKS
The primary mechanism by which hydroxychloroquine modulates systemic lupus erythematosus is by suppressing activation of Toll-like receptors, which exist on the surface of endosomes and play a significant role in the innate immune response and in autoimmune disease. Their activation is necessary for the expression of interferon-regulated genes and production of tumor necrosis factor alpha, which are key in the cell-mediated inflammatory response.
Antimalarial drugs such as hydroxychloroquine prevent Toll-like receptor activation by binding directly to nucleic acids in the activation pathway.5 In vitro studies show that blocking this pathway blunts the body’s primary cell-mediated inflammatory response; in vivo studies show that use of hydroxychloroquine is strongly correlated with a reduction in interferon alpha levels.6 The powerful effect of hydroxychloroquine on the cell-mediated pattern of inflammation found in lupus is consistent with this theory.
It was previously hypothesized that the immune-modulating effects of hydroxychloroquine were associated with a more general dysregulation of cellular lysosomes through inhibition of proteolysis or changes in cellular pH.7 This theory has since been displaced by the more specific and elegant mechanism described above.5
HOW WELL DOES IT WORK?
Benefit in systemic lupus erythematosus
Hydroxychloroquine has consistently demonstrated significant and multifaceted benefit in patients with systemic lupus erythematosus.
A systematic review of 95 articles8 concluded that this drug decreases lupus flares and decreases mortality rates in lupus patients by at least 50%, with a high level of evidence. Beneficial effects that had a moderate level of evidence were an increase in bone mineral density, fewer thrombotic events, and fewer cases of irreversible organ damage.
The preventive effect of hydroxychloroquine on thrombosis in lupus patients has been consistently demonstrated and is one of the key reasons the drug is considered a cornerstone of therapy in this disease.9 A nested case-control study of patients with lupus and thromboembolism demonstrated an odds ratio of 0.31 and relative risk reduction of 68% for those using antimalarials.10
Benefit in antiphospholipid antibody syndrome
Hydroxychloroquine prevents thrombosis in other diseases as well. For example, it has been shown to reduce the incidence of thrombotic events in patients with primary antiphospholipid syndrome.
In a retrospective cohort study in 114 patients with this disease, hydroxychloroquine significantly reduced the incidence of arterial thrombotic events over 10 years of follow-up (recurrence incidence 0 in those treated with hydroxychloroquine vs 1.14% in those not treated).11 The study also tracked levels of antiphospholipid antibodies and reported that hydroxychloroquine significantly reduced the levels of antibodies to cardiolipin and beta-2 glycoprotein 1, both implicated in the pathology of thrombosis.11
In vitro studies have also demonstrated that hydroxychloroquine can modulate a dysregulated inflammatory system to reduce thrombosis. For example, it has been shown that hydroxychloroquine can reverse platelet activation by antiphospholipid antibodies, prevent linking of antibody complexes to cell membranes, and promote proper membrane protein expression, thereby reducing the thrombotic qualities of antiphospholipid antibodies and even improving clearance times of antiphospholipid-related thrombi.12
Benefit in rheumatoid arthritis
Though there is less evidence, hydroxychloroquine has also shown benefit in rheumatoid arthritis, where it can be used by itself in mild disease or as part of combination therapy with active arthritis. Compared with biologic therapy in patients with early aggressive rheumatoid arthritis, triple therapy with methotrexate, sulfasalazine, and hydroxychloroquine was nearly as effective in terms of quality of life, and it cost only one-third as much, saving $20,000 per year of therapy per patient.13
Hydroxychloroquine has also been compared directly with chloroquine, its closest relation, in a large study incorporating patients with rheumatoid arthritis and patients with systemic lupus erythematosus. Patients using chloroquine experienced significantly more side effects, though it did prove marginally more effective.14
No benefit shown in Sjögren syndrome
Unfortunately, despite widespread use, hydroxychloroquine has not demonstrated positive clinical effects when used to treat primary Sjögren syndrome. Most notably, a 2014 randomized controlled trial of hydroxychloroquine vs placebo in 120 Sjögren patients found no significant improvement in primary symptoms of dryness, pain, or fatigue after 6 months of therapy.15
Metabolic benefits
Unexpectedly, hydroxychloroquine is associated with multiple metabolic benefits including improved lipid profiles and lower blood glucose levels. These findings, in addition to a reduced incidence of thrombosis, were initially reported in the Baltimore Lupus Cohort in 1996.16 Specifically, longitudinal evaluation of a cohort of lupus patients showed that hydroxychloroquine use was associated with a 7.6% reduction in total cholesterol and a 13.7% reduction in low-density lipoprotein cholesterol (LDL-C) over 3 months of therapy.17
Similar findings, including a reduction in LDL-C and an increase in high-density lipoprotein cholesterol, were strongly associated with the addition of hydroxychloroquine to methotrexate or to methotrexate and etanercept in a large cohort of rheumatoid arthritis patients followed over 2 years of therapy.18
In nondiabetic women with systemic lupus erythematosus or rheumatoid arthritis, average blood glucose was significantly lower in those taking hydroxychloroquine than in nonusers. The incidence of insulin resistance was also lower, but the difference was not statistically significant.19
Some have suggested that hydroxychloroquine may prevent diabetes mellitus. In a retrospective case series, compared with rheumatoid arthritis patients not taking the drug, patients treated with hydroxychloroquine for more than 4 years had a 25% lower risk of developing diabetes mellitus.20
In view of these metabolic benefits, especially regarding lipid regulation, and the above described antithrombotic properties of hydroxychloroquine, some researchers have recently hypothesized that hydroxychloroquine may be of benefit in patients with coronary artery disease.21 They suggested that the inflammatory contribution to the mechanism of coronary artery disease could be lessened by hydroxychloroquine even in patients without lupus erythematosus or rheumatoid arthritis.
PHARMACOLOGIC PROPERTIES
Understanding the pharmacologic properties of hydroxychloroquine is key to using it appropriately in clinical practice.
The half-life of elimination of hydroxychloroquine is 40 to 50 days, with half of the drug excreted renally in a concentration-dependent fashion.22,23 The drug reaches 95% of its steady-state concentration by about 6 months of therapy. Shorter durations of therapy do not provide adequate time for the drug to achieve steady-state concentration and may not allow patients and providers time to see its full clinical results. Therefore, its manufacturers recommend a 6-month trial of therapy to adequately determine if the drug improves symptoms.1
The oral bioavailability of hydroxychloroquine is about 75%, but pharmacokinetics vary among individuals.22,23 It has been suggested that this variability affects the efficacy of hydroxychloroquine. In a study of 300 patients with cutaneous lupus erythematosus, those whose treatment failed had significantly lower blood concentrations of hydroxychloroquine, while those who achieved complete remission had significantly higher concentrations.24
Another study found that titrating doses to target therapeutic blood concentrations can reduce disease activity in cutaneous lupus erythematosus.25 Measuring the blood concentration of hydroxychloroquine is not common in clinical practice but may have a role in select patients in whom initial therapy using a standard dosing regimen does not produce the desired results.
HOW SAFE IS HYDROXYCHLOROQUINE?
Hydroxychloroquine has numerous adverse effects, necessitating vigilance on the part of the prescriber. Most commonly reported are retinopathy, hyperpigmentation, myopathy, and skin reactions.1
Retinopathy
Retinopathy’s irreversibility—the threat of permanent vision loss—and its substantial prevalence in patients with a large drug exposure history, have marked retinopathy as the most concerning potential toxicity. The risk of ocular toxicity increases with the cumulative hydroxychloroquine dose. The prevalence of retinopathy in those using the drug less than 10 years is less than 2%; in contrast, the prevalence in patients with more than 20 years of exposure is reported to be as high as 20%.26
The American Academy of Ophthalmology has long stated that retinopathy is a significant risk of hydroxychloroquine therapy and that patients taking hydroxychloroquine should therefore undergo routine retinal and visual field screening by an ophthalmologist.
Currently, initial screening followed by yearly screening beginning 5 years thereafter is recommended for patients at low risk of toxicity (Table 1).27 Patients determined by an ophthalmologist to be at higher risk of retinopathy should be screened yearly. As identified by the American Academy of Ophthalmology, major risk factors for retinopathy include duration of use, concomitant tamoxifen exposure, significant renal disease, and preexisting retinal and macular disease.26,28
Recommendations for hydroxychloroquine dosing and screening were recently revised, for 2 reasons. Initially, its manufacturers recommended that hydroxychloroquine dosage be no higher than 6.5 mg/kg of ideal body weight to prevent retinopathy.1,29,30 However, it has recently been demonstrated that real body weight is a better predictor of risk of retinopathy than ideal body weight when dosing hydroxychloroquine, perhaps because of the increasing variance of real body weight in our patient population.26
Further, an atypical pattern of retinopathy called pericentral retinopathy is more common in Asians. A study of about 200 patients with a history of hydroxychloroquine retinopathy, including 36 Asian patients, found that the pericentral pattern occurred in half the Asian patients but only 2% of the white patients.31 The mechanism for this finding is unclear, but because pericentral retinopathy spares the macula, it can be missed using standard screening methods. Therefore, the American Academy of Ophthalmology now recommends that the dose limit be reduced from 6.5 mg/kg of ideal body weight to no more than 5.0 mg/kg of real body weight (Table 2).28
It is also recommended that screening methods such as automated visual fields and optical coherence tomography extend their fields beyond the macula in Asian patients to ensure that pericentral retinopathy is not missed.28
Optical coherence tomography is a particularly useful tool in the ocular evaluation of patients taking hydroxychloroquine. It can detect subtle changes such as thinning of the foveal photoreceptor outer segment, thickening of the retinal pigment epithelium, and loss of the macular ganglion cell–inner plexiform layer before there are visible signs of retinopathy and before symptoms arise.32
Currently, these guidelines are underutilized in clinical practice. Physician adherence to ophthalmologic guidelines is reported at about 50%.33 This statistic is jarring, given the potential for permanent loss of vision in those with hydroxychloroquine-mediated retinopathy, and demonstrates the importance of reinforcing proper understanding of the use of hydroxychloroquine in clinical practice.
Other adverse effects
Cutaneous hyperpigmentation can occur with hydroxychloroquine use (Figure 1). The hyperpigmentation appears to be due to local bruising following deposition of iron in the soft tissue.
While the pigmentation may persist permanently and cause an undesirable cosmetic effect, it has not been associated with other adverse outcomes.
Myopathy is a rare adverse effect. In one case series, 3 of 214 patients treated with hydroxychloroquine developed hydroxychloroquine-induced myopathy.35 Over the duration of their therapy, this was equivalent to an incidence of 1 case of myopathy in 100 patient-years of therapy. Myopathy improves with discontinuation of therapy, though it can persist for weeks, likely because of hydroxychloroquine’s prolonged elimination half-life.
Cardiomyopathy, specifically neurocardiomyopathy, is also an extremely rare adverse effect of hydroxychloroquine use. The mechanism is believed to be associated with the effect of hydroxychloroquine on lysosomal action, leading to an acquired lysosomal storage disorder with the typical cardiac hypertrophy and conduction abnormalities associated with this family of diseases.36
Acute generalized exanthematous pustulosis is another rare complication of hydroxychloroquine therapy. The appearance of the reaction is similar to that of pustular psoriasis, with pustules overlying flaking and scaling skin. It usually resolves within 2 weeks after cessation of hydroxychloroquine therapy. In a select few cases, the reaction persists or waxes and wanes over a period of weeks to months, and longer durations of recovery are thought to be due to hydroxychloroquine’s long half-life, as in hydroxychloroquine-induced myopathy.37
In view of this rare reaction, manufacturers of hydroxychloroquine recommend caution when using the drug in patients with psoriasis.1
Hematologic abnormalities. In very rare cases, hydroxychloroquine is associated with hematologic abnormalities including agranulocytosis, anemia, aplastic anemia, leukopenia, and thrombocytopenia.1
While no specific guidelines exist, caution is warranted when using hydroxychloroquine in patients with porphyria. Additionally, hydroxychloroquine and other antimalarials including primaquine have been associated with hemolysis in patients with glucose-6-phosphate dehydrogenase (G6PD) deficiency. The risk of hemolysis is generally considered low except at high hydroxychloroquine doses in patients with severe G6PD deficiency.38
For the above reasons, manufacturers recommended baseline and routine blood counts, and some providers screen patients for G6PD deficiency when prescribing hydroxychloroquine (Table 3).
PREGNANCY
Hydroxychloroquine is in pregnancy category C. Information is limited, and in view of the risks, the manufacturer says that it should be avoided in pregnancy.1 Nevertheless, it is generally considered safe during pregnancy, and its benefits may make it acceptable to continue in a patient who becomes pregnant, in spite of the possible risks.
We favor continuing hydroxychloroquine. This drug has been associated with improved maternal and fetal outcomes in lupus patients. Its use during pregnancy has not been associated with congenital malformations. The adverse visual effects of long-term hydroxychloroquine use, namely retinopathy, have never been reported in children as a consequence of exposure in utero.
In addition, hydroxychloroquine is transmitted only in minute quantities in breast milk.39 In pregnant women with systemic lupus erythematosus, hydroxychloroquine was associated with a lower risk of adverse outcomes, including preterm delivery and intrauterine growth restriction.40 However, hydroxychloroquine is far more toxic when ingested directly by infants than in adults.1
Maternal outcomes are also improved with the use of hydroxychloroquine. Stopping hydroxychloroquine during pregnancy in women with systemic lupus erythematosus is associated with significantly higher disease activity—fully twice as high as in those who continue hydroxychloroquine.41 These study results were corroborated in a small randomized trial in which pregnant women with lupus on placebo had significantly higher lupus disease activity scores than those pregnant women who were given hydroxychloroquine.42 The women taking hydroxychloroquine experienced no severe lupus flares for the duration of their pregnancies.
These findings suggest not only that hydroxychloroquine is safe in pregnancy, but also that it should be continued in lupus patients during pregnancy to prevent disease flares and adverse fetal outcomes.
AREAS OF UNCERTAINTY
Benefit in preclinical lupus?
Hydroxychloroquine has a consistently profound effect on outcomes in systemic lupus erythematosus. These findings, in addition to the more widespread use of antibody screening, have led to suggestions that hydroxychloroquine could be of benefit even before systemic lupus erythematosus is diagnosed.
A study in US military personnel found that patients taking hydroxychloroquine experienced a significantly longer lag time between first reported clinical symptoms of lupus and official diagnosis compared with matched controls who also went on to develop the disease, averaging 1.08 vs 0.29 years to disease classification.43 Those who used hydroxychloroquine also had lower rates of autoantibody accumulation. Therefore, hydroxychloroquine could be of benefit in carefully selected candidates at high risk of developing systemic lupus erythematosus.
The beneficial effects of hydroxychloroquine on patients with lupus and rheumatoid arthritis, in terms of primary measures of disease activity and secondary outcomes, were discovered fortuitously and were not the original intended targets of the drug. Because of its versatility, there are numerous other disease states in which hydroxychloroquine has shown a degree of benefit or has shown a potential for benefit.
Antiviral activity?
It has been suggested that antimalarial drugs could serve as adjunctive therapies against filoviruses such as Marburg and Ebola. There is a small body of in vitro and in vivo evidence that hydroxychloroquine could temper severe systemic inflammatory responses to filoviruses both through dysregulation of lysosomes and lysosomal pH (filoviruses have a pH-dependent mechanism of action) and through decreased production of tumor necrosis factor alpha and interferons. Heavy burdens of interferons and tumor necrosis factor alpha are associated with increased mortality rates in those infected with filoviruses.44
Antineoplastic activity?
Hydroxychloroquine has undergone in vitro testing as an adjunct to cancer therapies. There are several mechanisms by which it is theorized that hydroxychloroquine could target malignant cells, including inhibition of multidrug resistance pumps or autophagy, improvement of chemotherapy cell penetration, potentiation of presentation of major histocompatibility complexes, or even intercalation directly into DNA.45,46 However, it can also impair natural anticancer immunity and may allow cancer cells better nutrient supply through vascular effects.
In vitro studies have shown tumoricidal effects in lymphoma and melanoma, and inhibition of growth in lung, colon, breast, cervix, larynx, liver, and prostate cancers. In vivo studies have shown that hydroxychloroquine in high doses can prolong survival in glioblastoma.45
Unfortunately, all of these theorized or observed effects are dose-dependent and likely require doses that exceed currently recommended maximums.
Negative chronotropic effect?
Hydroxychloroquine has been found to decrease the resting heart rate in a cumulative dose-dependent fashion.47 Further, hydroxychloroquine has been known to increase digoxin levels, and the medications should not be used in combination.1
Whether the decrease in resting heart rate is associated with harm or benefit and whether the effect is significant enough to be considered when implementing therapy remain unanswered and deserve further investigation, as does the primary use of hydroxychloroquine for beneficial lipid and glucose reduction in patients who are otherwise healthy.
CASE CONCLUSION
The patient described at the beginning of this article was provided with information on the risks and benefits of hydroxychloroquine for treatment of her arthritis and rash suggestive of mild systemic lupus, and she opted to begin therapy. Her baseline eye screening was within normal limits. Based on her weight of 62 kg, she was started on 300 mg of hydroxychloroquine daily.
She had no significant adverse effects from the medication and reported slow improvement in her rash and joint complaints over the next 2 months. She remained on hydroxychloroquine over the next year without adverse effects or new evidence of autoimmune disease.
- Sanofi-Aventis. Product monograph: Plaquenil. http://products.sanofi.ca/en/plaquenil.pdf. Accessed May 2, 2018.
- Centers for Disease Control and Prevention (CDC). Malaria information and prophylaxis, by country. www.cdc.gov/malaria/travelers/country_table/a.html. Accessed May 2, 2018.
- Wallace DJ. The history of antimalarials. Lupus 1996; 5(suppl 1):S2–S3. pmid:8803902
- Shee JC. Lupus erythematosus treated with chloroquine. Lancet 1953; 265(6778):201–202. pmid:13070595
- Kuznik A, Bencina M, Svajger U, Jeras M, Rozman B, Jerala R. Mechanism of endosomal TLR inhibition by antimalarial drugs and imidazoquinolines. J Immunol 2011; 186:4794–4804. doi:10.4049/jimmunol.1000702
- Willis R, Seif AM, McGwin G Jr, et al. Effect of hydroxychloroquine treatment on pro-inflammatory cytokines and disease activity in SLE patients: data from LUMINA, a multiethnic US cohort. Lupus 2012; 21(8):830–835. doi:10.1177/0961203312437270
- Fox R. Anti-malarial drugs: possible mechanisms of action in autoimmune disease and prospects for drug development. Lupus 1996; 5(suppl 1):S4–S10. pmid:8803903
- Ruiz-Irastorza G, Ramos-Casals M, Brito-Zeron P, Khamashta MA. Clinical efficacy and side effects of antimalarials in systemic lupus erythematosus: a systematic review. Ann Rheum Dis 2010; 69(1):20–28. doi:10.1136/ard.2008.101766
- Lam NC, Ghetu MV, Bieniek ML. Systemic lupus erythematosus: primary care approach to diagnosis and management. Am Fam Physician 2016; 94(4):284–294. pmid:27548593
- Jung H, Bobba R, Su J, et al. The protective effect of antimalarial drugs on thrombovascular events in systemic lupus erythematosus. Arthritis Rheum 2010; 62(3):863–868. doi:10.1002/art.27289
- Nuri E, Taraborelli M, Andreoli L, et al. Long-term use of hydroxychloroquine reduces antiphospholipid antibodies levels in patients with primary antiphospholipid syndrome. Immunol Res 2017; 65(1):17–24. doi:10.1007/s12026-016-8812-z
- Erkan D, Aguiar CL, Andrade D, et al. 14th International Congress on Antiphospholipid Antibodies: task force report on antiphospholipid syndrome treatment trends. Autoimmun Rev 2014; 13(6):685–696. doi:10.1016/j.autrev.2014.01.053
- Jalal H, O’Dell JR, Bridges SL Jr, et al. Cost-effectiveness of triple therapy versus etanercept plus methotrexate in early aggressive rheumatoid arthritis. Arthritis Care Res (Hoboken) 2016; 68(12):1751–1757. doi:10.1002/acr.22895
- Avina-Zubieta JA, Galindo-Rodriguez G, Newman S, Suarez-Almazor ME, Russell AS. Long-term effectiveness of antimalarial drugs in rheumatic diseases. Ann Rheum Dis 1998; 57(10):582–587. pmid:9893568
- Gottenberg JE, Ravaud P, Puechal X, et al. Effects of hydroxychloroquine on symptomatic improvement in primary Sjogren syndrome. JAMA 2014; 312(3):249–258. doi:10.1001/jama.2014.7682
- Petri M. Hydroxychloroquine use in the Baltimore Lupus Cohort: effects on lipids, glucose and thrombosis. Lupus 1996; 5(suppl 1):S16–S22. pmid:8803905
- Cairoli E, Rebella M, Danese N, Garra V, Borba EF. Hydroxychloroquine reduces low-density lipoprotein cholesterol levels in systemic lupus erythematosus: a longitudinal evaluation of the lipid-lowering effect. Lupus 2012; 21(11):1178–1182. doi:10.1177/0961203312450084
- Charles-Schoeman C, Wang X, Lee YY, et al. Association of triple therapy with improvement in cholesterol profiles over two-year followup in the treatment of early aggressive rheumatoid arthritis trial. Arthritis Rheumatol 2016; 68(3):577–586. doi:10.1002/art.39502
- Penn SK, Kao AH, Schott LL, et al. Hydroxychloroquine and glycemia in women with rheumatoid arthritis and systemic lupus erythematosus. J Rheumatol 2010; 37(6):1136–1142. doi:10.3899/jrheum.090994
- Wasko MC, Hubert HB, Lingala VB, et al. Hydroxychloroquine and risk of diabetes in patients with rheumatoid arthritis. JAMA 2007; 298(2):187–193. doi:10.1001/jama.298.2.187
- Sun L, Liu M, Li R, et al. Hydroxychloroquine, a promising choice for coronary artery disease? Med Hypotheses 2016; 93:5–7. doi:10.1016/j.mehy.2016.04.045
- Tett SE, Cutler DJ, Day RO, Brown KF. Bioavailability of hydroxychloroquine tablets in healthy volunteers. Br J Clin Pharmacol 1989; 27(6):771–779. pmid:2757893
- Furst DE. Pharmacokinetics of hydroxychloroquine and chloroquine during treatment of rheumatic diseases. Lupus 1996; 5(suppl 1):S11–S15. pmid:8803904
- Frances C, Cosnes A, Duhaut P, et al. Low blood concentration of hydroxychloroquine in patients with refractory cutaneous lupus erythematosus. Arch Dermatol 2012; 148(4):479–484. doi:10.1001/archdermatol.2011.2558
- Chasset F, Arnaud L, Costedoat-Chalumeau N, Zahr N, Bessis D, Francès C. The effect of increasing the dose of hydroxychloroquine in patients with refractory cutaneous lupus erythematosus: an open-label prospective pilot study. J Am Acad Dermatol 2016; 74(4):693–699.e3. doi:10.1016/j.jaad.2015.09.064
- Melles RB, Marmor MF. The risk of toxic retinopathy in patients on long-term hydroxychloroquine therapy. JAMA Ophthalmol 2014; 132(12):1453–1460. doi:10.1001/jamaophthalmol.2014.3459
- Committee on Rheumatologic Care. American College of Rheumatology position statement. Screening for hydroxychloroquine retinopathy. www.rheumatology.org/Portals/0/Files/Screening-for-Hydroxychloroquine-Retinopathy-Position-Statement.pdf. Accessed April 2, 2018.
- Marmor MF, Kellner U, Lai TY, Melles RB, Mieler WF; American Academy of Ophthalmology. Recommendations on screening for chloroquine and hydroxychloroquine retinopathy (2016 revision). Ophthalmology 2016; 123(6):1386–1394. doi:10.1016/j.ophtha.2016.01.058
- Mackenzie AH. Antimalarial drugs for rheumatoid arthritis. Am J Med 1983; 75(6A):48–58. pmid:6362406
- Mackenzie AH. Dose refinements in long-term therapy of rheumatoid arthritis with antimalarials. Am J Med 1983; 75(1A):40–45. pmid:6869410
- Melles RB, Marmor MF. Pericentral retinopathy and racial differences in hydroxychloroquine toxicity. Ophthalmology 2015; 122(1):110–116. doi:10.1016/j.ophtha.2014.07.018
- Uslu H, Gurler B, Yildirim A, et al. Effect of hydroxychloroquine on the retinal layers: a quantitative evaluation with spectral-domain optical coherence tomography. J Ophthalmol 2016; 2016:8643174. doi:10.1155/2016/8643174
- Au A, Parikh V, Modi YS, Ehlers JP, Schachat AP, Singh RP. Hydroxychloroquine screening practice patterns within a large multispecialty ophthalmic practice. Am J Ophthalmol 2015; 160(3):561–568.e2. doi:10.1016/j.ajo.2015.06.009
- Jallouli M, Frances C, Plette JC, et al; Plaquenil Lupus Systemic Study Group. Hydroxychloroquine-induced pigmentation in patients with systemic lupus erythematosus. JAMA Dermatol 2013; 149(8):935–940. doi:10.1001/jamadermatol.2013.709
- Avina-Zubieta JA, Johnson ES, Suarez-Almazor ME, Russell AS. Incidence of myopathy in patients treated with antimalarials: a report of three cases and review of the literature. Br J Rheumatol 1995; 34(2):166–170. pmid:7704464
- Yogasundaram H, Putko BN, Tien J, et al. Hydroxychloroquine-induced cardiomyopathy: case report, pathophysiology, diagnosis, and treatment. Can J Cardiol 2014; 30:1706–1715. doi:10.1016/j.cjca.2014.08.016
- Pearson KC, Morrell DS, Runge SR, Jolly P. Prolonged pustular eruption from hydroxychloroquine: an unusual case of acute generalized exanthematous pustulosis. Cutis 2016; 97(3):212–216. pmid:27023083
- Youngster I, Arcavi L, Schechmaster R, et al. Medications and glucose-6-phosphate dehydrogenase deficiency: an evidence-based review. Drug Saf 2010; 33(9):713–726. doi:10.2165/11536520-000000000-00000
- Ostensen M, Khamashta M, Lockshin M, et al. Anti-inflammatory and immunosuppressive drugs and reproduction. Arthritis Res Ther 2006; 8(3):209. doi:10.1186/ar1957
- Leroux M, Desveaux C, Parcevaux M, et al. Impact of hydroxychloroquine on preterm delivery and intrauterine growth restriction in pregnant women with systemic lupus erythematosus: a descriptive cohort study. Lupus 2015; 24(13):1384–1391. doi:10.1177/0961203315591027
- Clowse MEB, Magder L, Witter F, Petri M. Hydroxychloroquine in lupus pregnancy. Arthritis Rheum 2006; 54(11):3640–3647. doi:10.1002/art.22159
- Levy RA, Vilela VS, Cataldo MJ, et al. Hydroxychloroquine in lupus pregnancy: double-blind and placebo-controlled study. Lupus 2001; 10(6):401–404. doi:10.1191/096120301678646137
- James JA, Kim-Howard XR, Bruner BF, et al. Hydroxychloroquine sulfate treatment is associated with later onset of systemic lupus erythematosus. Lupus 2007; 16(6):401–409. doi:10.1177/0961203307078579
- Akpovwa H. Chloroquine could be used for the treatment of filoviral infections and other viral infections that emerge or emerged from viruses requiring an acidic pH for infectivity. Cell Biochem Funct 2016; 34(4):191–196. doi:10.1002/cbf.3182
- Pascolo S. Time to use a dose of chloroquine as an adjuvant to anti-cancer chemotherapies. Eur J Pharmacol 2016; 771:139–144. doi:10.1016/j.ejphar.2015.12.017
- Furlong HC, Wessels JM, Guerra MT, Stämpfli MR, Foster WG. Hydroxychloroquine attenuates cigarette smoke induced autophagic signaling in the mouse ovary. Reprod Toxicol 2016; 61:105–113. doi:10.1016/j.reprotox.2016.03.044
- Cairoli E, Danese N, Teliz M, et al. Cumulative dose of hydroxychloroquine is associated with a decrease of resting heart rate in patients with systemic lupus erythematosus: a pilot study. Lupus 2015; 24(11):1204–1209. doi:10.1177/0961203315580870
KEY POINTS
- Hydroxychloroquine acts by suppressing Toll-like receptors to trigger important immunomodulatory effects.
- Hydroxychloroquine is a well-established and effective therapy for systemic and cutaneous lupus and other autoimmune diseases.
- Patients with systemic lupus erythematosus treated with hydroxychloroquine have lower mortality rates and a lower risk of lupus nephritis.
- Retinal toxicity is the most serious potential complication of hydroxychloroquine therapy. Adherence to current ophthalmologic screening recommendations and proper dosing protocols lowers this risk.

Training physician leaders to save the health system…and us
Lerman and Jameson1 recently called for expanding formal leadership development of physicians and increasing the reach of effective physician leaders. From the perspective of physicians, these are certainly good goals. We should have leaders in white coats who understand the joy of practicing medicine and can rally for our missions, challenges, and passions as doctors, clinical educators, and researchers.
But the rationale for most of their argument seems to stem from the perceived need to train physician leaders to promote the survival of increasingly complex health systems and strategically guide individual institutions. This seems also to be the focus of many health systems as they search for and hire physicians for various system leadership positions. But only in the final sentence of their thoughtful essay do Lerman and Jameson mention “patient and physician satisfaction and improved clinical outcomes,” and then only as a byproduct of achieving “organizational efficiency.”1
The financial success (ie, survival) of a health system and the emotional well-being and clinical skills of its physicians are clearly interrelated and cannot be completely dichotomized, and I am not implying that Lerman and Jameson have done so. But trying to promote both can create potential for mission malalignment. Achieving an appropriate balance between these two goals, which at a tactical level are not always congruent, is critical. Training leaders in the skills to achieve alignment with the organization’s culture and priorities may make it easier to administer and guide the course of a medical system with apparent physician leadership, but it still may not well represent the human constituents. The recent trend for health systems to establish new committees charged with improving physician wellness is a statement of problem recognition, but whether their existence can accomplish “mission alignment” remains to be seen.
Swensen et al2 from the Mayo Clinic have highlighted the need to focus on the needs of the physician, and not primarily on those of the institution, to reduce the epidemic of physician burnout. A physician leader who is wonderfully trained in organizational psychology, communication skills, and performance metrics analysis, but who lacks a deep and authentic understanding of the joys of practicing medicine and delivering care to the sick, of the need to stoke the individual physician’s intellectual curiosity and provide time for reflection to clinicians working in their institutions, is a unidirectional institutional leader, and thus a leader in name alone. We need to be careful about grooming young physician leaders at too early a stage. Having the book knowledge of a physician is not the same as having the heart of one.
We have appropriately morphed away from the academic curriculum vitae as the only ticket to titled organizational leadership. But we need to look closely at our choice of physician leaders and be careful that the physician component of that terminology is not defined by degree alone. Just as the number of first-authored publications and surgical procedures performed should not suffice for selection to leadership positions, nor should participation in leadership courses or the ability to respond as desired in a behavioral interview be viewed as adequate for selection as a leader of physicians. Administrators with a tailored MBA degree, extensive and real job experience in a clinical center, and participation in a seminar on physician behavior can also be successful supervisors and (maybe) leaders in a medical center.
But if we really care about our clinical staff, organizational leadership must include physicians in positions of influence who are true advocates for clinicians and patients, and not primarily caretakers of the health system and enforcers of performance metrics. Although (some of) the latter are absolutely necessary, we need more than that from our physician leaders. We need them to reflect and support our perspective as well as the institution’s needs. We need them to understand and defend the need to maintain the joy of practicing medicine. How can we as physicians really take care of others if there is no one to take care of us?3
Note: this discussion is not new. We had a dialogue on this topic in the Journal almost 10 years ago!4
- Lerman C, Jameson JL. Leadership development in medicine. N Engl J Med 2018; 378(20):1862–1863. doi:10.1056/NEJMp1801610
- Swensen S, Kabcenell A, Shanafelt T. Physician-organization collaboration reduces physician burnout and promotes engagement: the Mayo Clinic experience. J Healthcare Manag 2016; 61(2):105–127. pmid:27111930
- Shem S. The House of God: A Novel. New York: R. Marek Publishers, 1978.
- Longworth D. A medical center is not a hospital: reflections of a department chair still in the game. Cleve Clin J Med 2008; 75(12):832–834. doi:10.3949/ccjm.75a.08094
Lerman and Jameson1 recently called for expanding formal leadership development of physicians and increasing the reach of effective physician leaders. From the perspective of physicians, these are certainly good goals. We should have leaders in white coats who understand the joy of practicing medicine and can rally for our missions, challenges, and passions as doctors, clinical educators, and researchers.
But the rationale for most of their argument seems to stem from the perceived need to train physician leaders to promote the survival of increasingly complex health systems and strategically guide individual institutions. This seems also to be the focus of many health systems as they search for and hire physicians for various system leadership positions. But only in the final sentence of their thoughtful essay do Lerman and Jameson mention “patient and physician satisfaction and improved clinical outcomes,” and then only as a byproduct of achieving “organizational efficiency.”1
The financial success (ie, survival) of a health system and the emotional well-being and clinical skills of its physicians are clearly interrelated and cannot be completely dichotomized, and I am not implying that Lerman and Jameson have done so. But trying to promote both can create potential for mission malalignment. Achieving an appropriate balance between these two goals, which at a tactical level are not always congruent, is critical. Training leaders in the skills to achieve alignment with the organization’s culture and priorities may make it easier to administer and guide the course of a medical system with apparent physician leadership, but it still may not well represent the human constituents. The recent trend for health systems to establish new committees charged with improving physician wellness is a statement of problem recognition, but whether their existence can accomplish “mission alignment” remains to be seen.
Swensen et al2 from the Mayo Clinic have highlighted the need to focus on the needs of the physician, and not primarily on those of the institution, to reduce the epidemic of physician burnout. A physician leader who is wonderfully trained in organizational psychology, communication skills, and performance metrics analysis, but who lacks a deep and authentic understanding of the joys of practicing medicine and delivering care to the sick, of the need to stoke the individual physician’s intellectual curiosity and provide time for reflection to clinicians working in their institutions, is a unidirectional institutional leader, and thus a leader in name alone. We need to be careful about grooming young physician leaders at too early a stage. Having the book knowledge of a physician is not the same as having the heart of one.
We have appropriately morphed away from the academic curriculum vitae as the only ticket to titled organizational leadership. But we need to look closely at our choice of physician leaders and be careful that the physician component of that terminology is not defined by degree alone. Just as the number of first-authored publications and surgical procedures performed should not suffice for selection to leadership positions, nor should participation in leadership courses or the ability to respond as desired in a behavioral interview be viewed as adequate for selection as a leader of physicians. Administrators with a tailored MBA degree, extensive and real job experience in a clinical center, and participation in a seminar on physician behavior can also be successful supervisors and (maybe) leaders in a medical center.
But if we really care about our clinical staff, organizational leadership must include physicians in positions of influence who are true advocates for clinicians and patients, and not primarily caretakers of the health system and enforcers of performance metrics. Although (some of) the latter are absolutely necessary, we need more than that from our physician leaders. We need them to reflect and support our perspective as well as the institution’s needs. We need them to understand and defend the need to maintain the joy of practicing medicine. How can we as physicians really take care of others if there is no one to take care of us?3
Note: this discussion is not new. We had a dialogue on this topic in the Journal almost 10 years ago!4
- Lerman C, Jameson JL. Leadership development in medicine. N Engl J Med 2018; 378(20):1862–1863. doi:10.1056/NEJMp1801610
- Swensen S, Kabcenell A, Shanafelt T. Physician-organization collaboration reduces physician burnout and promotes engagement: the Mayo Clinic experience. J Healthcare Manag 2016; 61(2):105–127. pmid:27111930
- Shem S. The House of God: A Novel. New York: R. Marek Publishers, 1978.
- Longworth D. A medical center is not a hospital: reflections of a department chair still in the game. Cleve Clin J Med 2008; 75(12):832–834. doi:10.3949/ccjm.75a.08094

Evaluating suspected pulmonary hypertension: A structured approach
Pulmonary arterial hypertension (PAH) is a hemodynamic disorder that affects small and medium-size pulmonary arteries through cellular proliferation and luminal narrowing.1 Increased pulmonary vascular resistance causes restricted blood flow in these arteries, leading to elevated pulmonary arterial pressure and afterload on the right ventricle. Despite advances in therapy, death usually occurs as a result of right ventricular failure.

- Group 1—PAH, due to narrowed pulmonary arteries
- Group 2—due to left heart disease
- Group 3—due to lung disease or hypoxia, or both
- Group 4—due to chronic thromboembolism or other pulmonary artery obstruction
- Group 5—due to uncertain or multifactorial causes.
Experts recognize the morbidity and mortality associated with pulmonary hypertension now more than in the past, and they emphasize recognizing it early. Guidelines for its diagnosis and treatment were updated in 2015.1
Below, we use a case to discuss recommendations for initial evaluation and classification of pulmonary hypertension, particularly PAH.
A PATIENT SUSPECTED OF HAVING PULMONARY HYPERTENSION
A 63-year-old woman with a 25-pack-year history of tobacco use, as well as pulmonary embolism and coronary artery disease, presents to her primary care physician with exertional dyspnea. She had been a clerk at a hardware store and physically active until she took early retirement 8 months ago because of increasing fatigue. She initially felt the fatigue was simply “a sign of getting old.”
Since retiring, she has noticed the slow onset of progressive dyspnea on exertion. She can no longer climb more than 1 flight of stairs or walk more than 1 block. She also complains of mild, fluctuating edema in her lower extremities over the past month. She quit smoking 8 years ago after undergoing placement of a drug-eluting stent in the mid-left circumflex artery. After this, she received clopidogrel and was followed by a cardiologist for 2 years but stopped taking the medication because of bruising. She has not seen her cardiologist in more than 5 years.
She underwent elective right total knee arthroplasty 3 years ago, complicated by acute deep vein thrombosis in the right common femoral vein. Computed tomography (CT) at that time did not reveal pulmonary emboli. She received warfarin therapy for 3 months.
She reports no current cough, chest pain, lightheadedness, or syncope. She has no orthopnea, and she feels normal at rest.
Her family history is unremarkable, and she has had no exposure to illicit substances, environmental toxins, or dietary supplements. She takes aspirin 81 mg daily, metoprolol 25 mg twice daily, lisinopril 10 mg daily, and simvastatin 40 mg at bedtime.
Her primary care physician detects a murmur in the left lower sternal border and sends her for transthoracic echocardiography, which demonstrates mild right ventricular dilation, right atrial dilation, and mildly reduced right ventricular function. The calculated right ventricular systolic pressure is 69 mm Hg. The left ventricle shows mild concentric hypertrophy; the left atrium is normal in size.
DIAGNOSTIC EVALUATION OF SUSPECTED PULMONARY HYPERTENSION

CLINICAL MANIFESTATIONS

Symptoms and signs. As in the patient described above, the first symptoms such as exertional dyspnea, fatigue, and lightheadedness usually arise in situations that call for increased cardiac output.4 As right ventricular function worsens, symptoms start to occur at rest, and signs of increased right ventricular preload appear, such as abdominal and lower-extremity edema and pericardial effusion. Syncope is a sign of severe right ventricular dysfunction.5
Physical examination. Look for signs of increased right ventricular loading and failure, eg:
- An accentuated intensity and persistent splitting of the second heart sound
- A prominent parasternal heave
- A prominent jugular “a” wave
- A systolic murmur along the left sternal border at the fourth intercostal space, which may worsen with breath-holding
- Pitting lower-extremity edema
- Hepatomegaly
- Hepatojugular reflux
- Hepatic pulsatility.6
ECHOCARDIOGRAPHY IN SUSPECTED PULMONARY HYPERTENSION

Many practitioners rely heavily on the estimated right ventricular systolic pressure in diagnosing pulmonary hypertension. In theory, this number should be nearly the same as the pulmonary arterial systolic pressure. However, technical and patient-related aspects of transthoracic echocardiography often limit accurate measurement of the right ventricular systolic pressure, and readings often differ from those measured with right heart catheterization.8

Our patient had a markedly elevated right ventricular systolic pressure and signs of right ventricular dysfunction, suggesting a high probability of pulmonary hypertension.
EVALUATING LEFT HEART DISEASE (WHO GROUP 2)
More than 75% of cases of pulmonary hypertension are directly related to left ventricular dysfunction or mitral or aortic valve disease (WHO group 2).1 Since group 2 differs markedly from group 1 (PAH) in its pathophysiology and treatment, it is important to distinguish between them.
Compared with WHO group 1 patients, those in group 2 tend to be older, more of them are male, and more of them have comorbidities such as metabolic syndrome, hypertension, and coronary artery disease.1,9 A combination of risk factors and clinical findings should be considered in identifying these patients.10
Transthoracic echocardiography is used to detect features of systolic and diastolic dysfunction. Left atrial enlargement is a clue that left heart disease may be present. In addition, signs of left ventricular or valvular dysfunction on electrocardiography or chest radiography are often helpful.
When estimated right ventricular systolic pressures are only minimally abnormal and no significant right ventricular dysfunction exists, further diagnostic evaluation is not warranted. However, because no single identifying feature or variable can readily distinguish group 2 from the other WHO groups, further evaluation should be considered if the right ventricular systolic pressure is significantly elevated or right ventricular dysfunction exists.
Our patient had several risk factors for left heart disease, including a history of smoking and coronary artery disease. Nonetheless, findings consistent with severe right ventricular dysfunction necessitated further evaluation for other possible causes of her suspected pulmonary hypertension.
Postcapillary pulmonary hypertension
In patients for whom further evaluation is pursued, the diagnosis of WHO group 2 pulmonary hypertension is ultimately based on findings consistent with postcapillary or “passive” pulmonary hypertension on right heart catheterization. Although mean pulmonary arterial pressures must be at least 25 mm Hg to certify the diagnosis of pulmonary hypertension, a pulmonary artery occlusion pressure greater than 15 mm Hg (normal 6–12) and pulmonary vascular resistance of 3 Wood units or less (normal 0.3–1.6) suggests the pulmonary hypertension is due to elevated left atrial pressure (ie, postcapillary) rather than precapillary pulmonary arterial remodeling.
Mixed pre- and postcapillary pulmonary hypertension
Distinguishing pulmonary venous hypertension from PAH is important, since their management differs. In particular, PAH-specific therapies (ie, prostacyclin analogues, prostaglandin I2 receptor agonists, endothelin receptor antagonists, phosphodiesterase-5 inhibitors, and cyclic guanosine monophosphate stimulators) can have a detrimental effect in WHO group 2 patients by causing increased pulmonary capillary leakage with pulmonary edema.11,12
In some patients, chronic passive congestion in the pulmonary venous circulation causes additional disruption of the homeostatic milieu regulating precapillary smooth muscle and endothelial function. These changes result in structural remodeling of precapillary arterioles and increased precapillary vascular resistance, creating a “mixed” pulmonary hypertension with both pre- and postcapillary abnormalities.
There is controversy over the ideal way to identify these patients but little disagreement that they face a worse prognosis than those without precapillary remodeling.13 In light of this, efforts have been made to characterize this cohort.
Historically, mixed pre- and postcapillary pulmonary hypertension was defined as the combination of all of the following:
- Mean pulmonary arterial pressure ≥ 25 mm Hg
- Pulmonary artery occlusion pressure > 15 mm Hg
- Transpulmonary gradient (the mean pulmonary arterial pressure minus the pulmonary artery occlusion pressure) > 12 mm Hg.14
However, the utility of the transpulmonary gradient for distinguishing mixed pulmonary hypertension has been questioned because of concerns over its susceptibility to variations in stroke volume and loading conditions.15
The diastolic pulmonary gradient (the pulmonary arterial diastolic pressure minus the pulmonary artery occlusion pressure) has been proposed as an alternative to the transpulmonary gradient under the theory that it is less sensitive to fluctuation from variations in flow or loading.15
Current guidelines1 suggest that a patient who has all of the following should be considered to have mixed pulmonary hypertension:
- A mean pulmonary arterial pressure > 25 mm Hg
- A pulmonary artery occlusion pressure > 15 mm Hg
- A diastolic pulmonary gradient > 7 mm Hg or a pulmonary vascular resistance > 3 Wood units, or both.
Occult group 2 pulmonary hypertension
Currently, the diagnosis of WHO group 2 pulmonary hypertension is based on elevated resting pulmonary artery occlusion pressure. However, some patients with WHO group 2 pulmonary hypertension and transiently low preload from aggressive diuresis or fasting may have a low pulmonary artery occlusion pressure during right heart catheterization and be misdiagnosed as having WHO group 1 PAH.12,16
This concern was acknowledged in the 2015 Ambrisentan and Tadalafil in Patients With Pulmonary Arterial Hypertension (AMBITION) study after investigators changed the protocol to exclude patients who technically met the criteria for WHO group 1 PAH, but had borderline-elevated pulmonary artery occlusion pressure and additional risk factors worrisome for left heart disease and occult WHO group 2 pulmonary hypertension.17,18
Several strategies, including passive leg-raising, fluid challenge, and exercise during diagnostic right heart catheterization, have been proposed to better classify these patients.19 Unfortunately, due to a lack of standardization of normal values and methodology for executing these maneuvers, consensus is lacking over their routine use, and recommendations for their use have not been provided.1
EVALUATION OF LUNG DISEASE (WHO GROUP 3)
All patients with suspected pulmonary hypertension should also be assessed for underlying pulmonary parenchymal or physiologic disease.
WHO group 3 consists of pulmonary disorders that, over an extended time, can lead to pulmonary hypertension. The most common of these disorders include chronic obstructive pulmonary disease, interstitial lung disease, and combined pulmonary fibrosis and emphysema.1
Pulmonary hypertension in these patients is precapillary, and changes in pulmonary vascular resistance are influenced by multiple factors, the most significant of which is alveolar hypoxia. Hypoxia induces pulmonary artery vasoconstrictionn (in contrast to the reflexive hemodynamics seen in peripheral tissues, where systemic vascular tone is generally lower in states of hypoxia) as a mechanism to divert pulmonary blood flow to well-ventilated portions of the lung and maintain ventilation-perfusion matching.
Repeated chronic hypoxia also alters cellular structure and function of pulmonary vessels and leads to medial hypertrophy and increased vascular tone, thus contributing to the development of pulmonary hypertension in many of these patients.20
Obstructive sleep apnea. Up to 70% of patients with obstructive sleep apnea have pulmonary hypertension.21 Chronic repetitive hypoxia throughout the night increases the levels of reactive oxygen species and alters cellular and molecular signaling, thus inducing vascular remodeling. In addition, apneic events during sleep promote catecholamine-driven elevations in systemic blood pressure. Over time, patients are at higher risk of developing left ventricular dysfunction and concomitant postcapillary group 2 pulmonary hypertension.22 Because typical methods of obstructive sleep apnea screening (eg, the Epworth Sleep Scale) have been historically poor at discriminating PAH patients with obstructive sleep apnea from those without, patients diagnosed with PAH should be considered for formal sleep testing.23,24
Pulmonary function tests, chest imaging
Pulmonary function tests and high-resolution computed tomography are essential to any PAH evaluation and help to exclude WHO group 3 pulmonary hypertension.1
An abnormal result on CT or spirometry can help point toward parenchymal lung disease. Normal spirometry and lung volumes with an isolated reduction in the diffusing capacity of the lung for carbon monoxide (Dlco) is typical of patients with WHO group 1 PAH.

In our patient, CT of the chest did not show any evidence of parenchymal lung disease, and pulmonary function tests showed no evidence of obstruction or restriction. There was a moderate decrease in Dlco, which did not reach normal limits when adjusted for lung volumes. In this setting, further evaluation of her PAH was warranted.
EVALUATION OF THROMBOEMBOLIC DISEASE (WHO GROUP 4)
Once pulmonary hypertension due to underlying left heart disease or parenchymal lung disease has been excluded, testing for chronic thromboembolic pulmonary hypertension is necessary, even in the absence of prior known pulmonary embolism. Identifying these patients is paramount, as chronic thromboembolic pulmonary hypertension (WHO group 4) is the only type of pulmonary hypertension for which a definitive cure is available.26
Up to 9% of patients who survive acute pulmonary embolism exhibit features of chronic proximal thrombosis and remodeling of distal pulmonary arteries.27
It remains unknown exactly why some patients develop chronic thromboembolic pulmonary hypertension and others do not, but the pathophysiology involves inappropriate thrombus resolution after venous thromboembolic events. Monocyte recruitment (which plays an important role in thrombus resolution) is reduced, angiogenesis is impaired (preventing effective vascular collateralization), and abnormal fibroblast proliferation leads to distal pulmonary vascular wall thickening.28 There is some evidence of increased thrombophilic risk in this population, and approximately 10% to 20% of patients are positive for antiphospholipid antibodies or lupus anticoagulant.29,30
Patients with chronic thromboembolic pulmonary hypertension usually present with symptoms similar to those of WHO group 1 PAH. Up to one-quarter of patients have no recollection of prior pulmonary embolism.31 As the disease progresses, signs and symptoms related to elevated pulmonary vascular resistance and right ventricular dysfunction are common.32,33
Although thrombi usually resolve quickly, the diagnosis of chronic thromboembolic pulmonary hypertension should be made only after at least 3 months of appropriate anticoagulation to avoid treatment of transient hemodynamic changes often seen after an acute pulmonary embolism.1
Radiographic changes associated with chronic thromboembolic pulmonary hypertension are distinct from the intraluminal filling defects seen with acute thromboembolism, since chronic thrombi tend to become organized and eccentric. On imaging, one may see features of rapid luminal narrowing or eccentric filling defects rather than the conventional central filling defects of acute pulmonary embolism. These changes are often overlooked by radiologists who are not specifically looking for chronic thromboembolic pulmonary hypertension.34 For this reason, the sensitivity and specificity of identifying chronic thromboembolic disease using radionuclide ventilation-perfusion lung scanning is superior to that of CT angiography.
All patients with suspected PAH should undergo a ventilation-perfusion scan.1,35 In patients with ventilation-perfusion mismatch on radionuclide scanning, pulmonary angiography can fulfill multiple goals of measuring pulmonary arterial pressures, identifying the extent and location of chronic thromboemboli, and can determine whether surgical thromboendarterectomy is feasible.
If chronic thromboembolic pulmonary hypertension is identified, it is imperative that patients be referred to a center of excellence specializing in its management regardless of symptom severity, as surgery can be curative and may prevent development of progressive right ventricular dysfunction.36
Our patient’s ventilation-perfusion scan was normal, effectively ruling out the possibility of chronic thromboembolism as a cause of her pulmonary hypertension.
RIGHT HEART CATHETERIZATION
Once the above-mentioned conditions have been evaluated, patients with suspected PAH should be referred to a pulmonary hypertension center of excellence to undergo right heart catheterization. If this test reveals PAH, further vasoreactivity testing should be performed if the etiology of the PAH is considered to be idiopathic, heritable, or drug-induced.1
Vasoreactivity is most commonly tested using 20 ppm of inhaled nitric oxide, but alternative formulations including intravenous epoprostenol, intravenous adenosine, or inhaled iloprost are acceptable. Patients who have a positive vasoreactive test usually respond well to high-dose calcium channel blocker therapy and have a significantly better prognosis than other patients with PAH.37
Patients with WHO group 1 PAH who do not have idiopathic, heritable, or drug-induced PAH have not been shown to have favorable outcomes using calcium channel blockers even if they have a positive vasoreactive response. A positive vasoreactive response is defined as a drop in mean pulmonary arterial pressure of at least 10 mm Hg to an absolute level of 40 mm Hg or less. Cardiac output should be preserved or elevated compared with baseline values during the challenge.1
In reality, only 10% to 15% of patients with idiopathic PAH have a positive vasoreactive response, and half of these patients stop responding within 1 year.38 Therefore, clinicians should not assume that calcium channel blockers will be successful in the long term in a vasoreactive patient, and these patients should have follow-up right heart catheterization after 3 to 6 months and annually thereafter to ensure continued vasoreactivity.1
In patients who are no longer vasoreactive or whose functional status is worse than New York Heart Association functional class I or II, conventional PAH-specific therapy should be started.
LOOKING FOR CAUSES OF ‘IDIOPATHIC’ PAH
Pulmonary hypertension is considered the final common pathway of many varied diseases and syndromes, and therefore one cannot say it is idiopathic without making a robust effort to identify features of alternative causes and rule out other contributing factors.
Although the exact etiology of idiopathic PAH is unclear, well-characterized imbalances in vascular homeostasis have been identified. These include processes that promote vasoconstriction, cell proliferation, and thrombosis (thromboxane A2, endothelin-1, and serotonin) and those that suppress prostacyclin, nitric oxide, and vasoactive intestinal peptide-mediated vasodilation.1 Furthermore, an abnormal angiogenic response to hypoxia and vascular endothelial growth factor has been observed.39
Before considering a diagnosis of idiopathic PAH, a careful history is essential. Other causative agents include appetite-suppressing medications, such as fenfluramine derivatives or stimulants such as amphetamines. Human immunodeficiency virus (HIV) or hepatitis, a history of splenectomy, and prior thyroid or liver disease are also common causes of PAH. Joint pain, myalgias, Raynaud features, or a rash characteristic of connective tissue disease can be identified on history and physical examination. Worldwide, chronic exposure to high-altitude climates and exposure to schistosomiasis are significant causes of PAH, but are rarely seen in developed nations. Confirmatory serum tests for HIV, antinuclear antibody, scleroderma antibody, and thyroid function are essential.1
Genetic factors
If patients report having relatives with possible or probable PAH, genetic counseling is recommended, particularly for rare but causative gene mutations.
BMPR2, the gene that codes for the bone morphogenetic protein receptor type 2, can carry mutations with variable penetrance over the patient’s lifetime depending on other genetic polymorphisms, concurrent inflammation, and the patient’s sex.40
The population carrier estimates of BMPR2 mutations are only 0.001% to 0.01%, but mutations in this gene are identified in approximately 25% of nonfamilial PAH patients and in over 75% of those with a familial inheritance pattern. The BMPR2 protein is a part of the transforming growth factor beta family and is partially responsible for control of vascular cell proliferation. Mutations in this gene lead to PAH at a younger age than in those with mutation-negative idiopathic PAH and to a more severe clinical phenotype in terms of pulmonary vascular resistance and cardiac function.40
Other mutations. Although BMPR2 is the most commonly identified gene mutation in patients with PAH, other gene mutations within this family have also been recognized. These include mutations in the genes for activin receptor-like kinase 1 and endoglin, which, although better known for their association with hereditary hemorrhagic telangiectasia, can lead directly to PAH.40
More recently, a novel autosomal recessive gene mutation in eukaryotic translation initiation factor 2 alpha kinase 4 (EIF2AK4) has been identified in patients with pulmonary veno-occlusive disease41 and pulmonary capillary hemangiomatosis,42 which are specific subclasses of WHO group 1 PAH. The mechanistic parallels between EIF2AK4 and these diseases are not clear, but the prevalence of disease in those with a familial inheritance pattern and an EIF2AK4 mutation is nearly 100%.41 Thus, identification of this mutation has been accepted as a way to confirm pulmonary veno-occlusive disease and pulmonary capillary hemangiomatosis in patients suspected of PAH with features of these diseases.43,44
GROUP 5: MISCELLANEOUS FORMS OF PULMONARY HYPERTENSION
WHO group 5 pulmonary hypertension encompasses disorders whose pathophysiology does not fit neatly within the context of the other pulmonary hypertension subtypes. Nonetheless, appreciation of these disorders is important in determining the etiology and appropriate therapy for patients with pulmonary hypertension. The mechanism driving abnormal pulmonary arterial pressures in patients with group 5 pulmonary hypertension is not always clear and may involve intrinsic or extrinsic factors.1
Diseases within group 5 include those that cause extrinsic compression of the pulmonary arteries (ie, fibrosing mediastinitis) or intrinsic elevations in pulmonary vascular resistance (sarcoidosis, pulmonary Langerhans cell histiocytosis, sickle cell anemia, polycythemia vera, and malignancy).
The most common cause of pulmonary hypertension in this category is sarcoidosis. Current theories suggest that, for most patients, invasion of granulomatous inflammation within the arterial walls induces PAH via fibrotic or inflammatory vascular occlusion. Extrinsic compression due to lymphadenopathy, right or left ventricular dysfunction due to cardiac myocite infiltration, and endothelin-induced pulmonary vasoconstriction are other possible links between the PAH and sarcoidosis.45
PROGNOSTIC RISK STRATIFICATION IN THE PATIENTS WITH PAH

Cardiac magnetic resonance imaging (MRI) has gained popularity as a noninvasive and reproducible alternative to echocardiography. Image fidelity and characterization of right ventricular function and right ventricular ejection fraction are all more accurate than with echocardiography, and serial MRI has proven valuable in its ability to guide patient prognosis.46
However, MRI is more expensive than echocardiography, and some patients cannot tolerate the procedure. In addition, for those who can tolerate it, MRI is not a suitable alternative to right heart catheterization, since it cannot accurately estimate pulmonary artery occlusion pressure or pulmonary arterial pressures.1 For these reasons, cardiac MRI use varies across pulmonary hypertension centers.
A goal of treatment is to reduce a patient’s risk. While no consensus has been achieved over which PAH-specific therapy to start with, evidence is robust that using more than 1 class of agent is beneficial, capitalizing on multiple therapeutic targets.17,47
In our patient, right heart catheterization revealed PAH with a mean pulmonary arterial pressure of 44 mm Hg, pulmonary artery occlusion pressure 6 mm Hg, and a cardiac index of 2.1 L/min/m2. Ancillary testing for alternative causes of PAH was unrevealing, as was vasoreactivity testing. Our patient could walk only 314 meters on her 6-minute walk test and had an initial NT-proBNP level of 750 ng/L.
Based on these and the findings during her evaluation, she would be classified as having intermediate-risk PAH with an estimated 1-year mortality risk of 5% to 10%.1 Appropriate therapy and follow-up would be guided by this determination. Specific therapy is beyond the scope of this article but we would start her on dual oral therapy with close follow-up to reassess her 1-year mortality risk. If there were no improvement over a short period of time, we would add further therapy.
- Galiè N, Humbert M, Vachiery JL, et al. 2015 ESC/ERS guidelines for the diagnosis and treatment of pulmonary hypertension: the Joint Task Force for the Diagnosis and Treatment of Pulmonary Hypertension of the European Society of Cardiology (ESC) and the European Respiratory Society (ERS): Endorsed by: Association for European Paediatric and Congenital Cardiology (AEPC), International Society for Heart and Lung Transplantation (ISHLT). Eur Respir J 2015; 46(4):903–975. doi:10.1183/13993003.01032-2015
- Galiè N, Rubin LJ, Hoeper M, et al. Treatment of patients with mildly symptomatic pulmonary arterial hypertension with bosentan (EARLY study): a double-blind, randomized controlled trial. Lancet 2008; 371(9630):2093–2100. doi:10.1016/S0140-6736(08)60919-8
- Howard LS. Prognostic factors in pulmonary arterial hypertension: assessing the course of the disease. Eur Respir Rev 2011; 20:236–242. doi:10.1183/09059180.00006711
- Brown LM, Chen H, Halpern S, et al. Delay in recognition of pulmonary arterial hypertension: factors identified from the REVEAL registry. Chest 2011; 140:19–26. doi:10.1378/chest.10-1166
- Elliot CG, Farber H, Frost A, Liou TG, Turner M. REVEAL Registry: medical history and time to diagnosis of enrolled patients. Chest 2007; 132(4):631a. doi:10.1378/chest.132.4_MeetingAbstracts.631a
- Minai OA, Budev MM. Diagnostic strategies for suspected pulmonary arterial hypertension: a primer for the internist. Cleve Clin J Med 2007; 74(10):737–747. pmid:17941295
- Badesch DB, Raskob GE, Elliott CG, et al. Pulmonary arterial hypertension: baseline characteristics from the REVEAL registry. Chest 2010; 137(2):376–387. doi:10.1378/chest.09-1140
- Fisher MR, Forfia PR, Chamera E, et al. Accuracy of Doppler echocardiography in the hemodynamic assessment of pulmonary hypertension. Am J Respir Crit Care Med 2009; 179(7):615–621. doi:10.1164/rccm.200811-1691OC
- Robbins IM, Newman JH, Johnson RF, et al. Association of the metabolic syndrome with pulmonary venous hypertension. Chest 2009; 136(1):31–36. doi:10.1378/chest.08-2008
- Rosenkranz S, Gibbs JS, Wachter R, De Marco T, Vonk-Noordegraaf A, Vachiery JL. Left ventricular heart failure and pulmonary hypertension. Eur Heart J 2016; 37(12):942–954. doi:10.1093/eurheartj/ehv512
- Opitz CF, Hoeper MM, Gibbs JSR, et al. Pre-capillary, combined, and post-capillary pulmonary hypertension: a pathophysiological continuum. J Am Coll Cardiol 2016; 68:368–378. doi: 10.1016/j.jacc.2016.05.047
- Robbins IM, Hemnes AR, Pugh ME, et al. High prevalence of occult pulmonary venous hypertension revealed by fluid challenge in pulmonary hypertension. Circ Heart Fail 2014; 7(1):116–122. doi:10.1161/CIRCHEARTFAILURE.113.000468
- Gerges C, Gerges M, Lang MB, et al. Diastolic pulmonary vascular pressure gradient: a predictor of prognosis in “out-of-proportion” pulmonary hypertension. Chest 2013; 143(3):758–766. doi:10.1378/chest.12-1653
- Task Force for Diagnosis and Treatment of Pulmonary Hypertension of European Society of Cardiology (ESC); European Respiratory Society (ERS); International Society of Heart and Lung Transplantation (ISHLT); Galiè N, Hoeper MM, Humbert M, et al. Guidelines for the diagnosis and treatment of pulmonary hypertension. Eur Respir J 2009; 34(6):1219–1263. doi:10.1183/09031936.00139009
- Naeije R, Vachiery JL, Yerly P, Vanderpool R. The transpulmonary pressure gradient for the diagnosis of pulmonary vascular disease. Eur Respir J 2013; 41(1):217–223. doi:10.1183/09031936.00074312
- Frost AE, Badesch DB, Miller DP, Benza RL, Meltzer LA, McGoon MD. Evaluation of the predictive value of a clinical worsening definition using 2-year outcomes in patients with pulmonary arterial hypertension: a REVEAL registry analysis. Chest 2013; 144(5):1521–1529. doi:10.1378/chest.12-3023
- Galiè N, Barberà JA, Frost AE, et al; AMBITION Investigators. Initial use of ambrisentan plus tadalafil in pulmonary arterial hypertension. N Engl J Med 2015; 373(9):834–844. doi:10.1056/NEJMoa1413687
- Farr G, Shah K, Markley R, Abbate A, Salloum FN, Grinnan D. Development of pulmonary hypertension in heart failure with preserved ejection fraction. Prog Cardiovasc Dis 2016; 59(1):52–58. doi:10.1016/j.pcad.2016.06.002
- Hoeper MM, Barberà JA, Channick RN, et al. Diagnosis, assessment, and treatment of non-pulmonary arterial hypertension pulmonary hypertension. J Am Coll Cardiol 2009; 54(suppl 1):S85–S96. doi:10.1016/j.jacc.2009.04.008
- Chaouat A, Naeije R, Weitzenblum E. Pulmonary hypertension in COPD. Eur Respir J 2008; 32(5):1371–1385. doi:10.1183/09031936.00015608
- Minai OA, Ricaurte B, Kaw R, et al. Frequency and impact of pulmonary hypertension in patients with obstructive sleep apnea syndrome. Am J Cardiol 2009; 104(9):1300–1306. doi:10.1016/j.amjcard.2009.06.048
- Kholdani C, Fares WH, Mohsenin V. Pulmonary hypertension in obstructive sleep apnea: is it clinically significant? A critical analysis of the association and pathophysiology. Pulm Circ 2015; 5(2):220–227. doi:10.1086/679995
- Prisco DL, Sica AL, Talwar A, et al. Correlation of pulmonary hypertension severity with metrics of comorbid sleep-disordered breathing. Sleep Breath 2011; 15(4):633–639. doi:10.1007/s11325-010-0411-y
- Dumitrascu R, Tiede H, Eckermann J, et al. Sleep apnea in precapillary pulmonary hypertension. Sleep Med 2013; 14(3):247–251. doi:10.1016/j.sleep.2012.11.013
- Arcasoy SM, Christie JD, Ferrari VA, et al. Echocardiographic assessment of pulmonary hypertension in patients with advanced lung disease. Am J Respir Crit Care Med 2003; 167(5):735–740. doi:10.1164/rccm.200210-1130OC
- Pepke-Zaba J, Jansa P, Kim NH, Naeije R, Simonneau G. Chronic thromboembolic pulmonary hypertension: role of medical therapy. Eur Respir J 2013; 41(4):985–990. doi:10.1183/09031936.00201612
- Guérin L, Couturaud F, Parent F, et al. Prevalence of chronic thromboembolic pulmonary hypertension after acute pulmonary embolism. Prevalence of CTEPH after pulmonary embolism. Thromb Haemost 2014; 112(3):598–605. doi:10.1160/TH13-07-0538
- Lang IM, Pesavento R, Bonderman D, Yuan JX. Risk factors and basic mechanisms of chronic thromboembolic pulmonary hypertension: a current understanding. Eur Respir J 2013; 41(2):462–468. doi:10.1183/09031936.00049312
- Pepke-Zaba J. Diagnostic testing to guide the management of chronic thromboembolic pulmonary hypertension: state of the art. Eur Respir Rev 2010; 19(115):55–58. doi:10.1183/09059180.00007209
- Bonderman D, Turecek PL, Jakowitsch J, et al. High prevalence of elevated clotting factor VIII in chronic thromboembolic pulmonary hypertension. Thromb Haemost 2003; 90(3):372–376. doi:10.1160/TH03-02-0067
- Pepke-Zaba J, Delcroix M, Lang I, et al. Chronic thromboembolic pulmonary hypertension (CTEPH): results from an international prospective registry. Circulation 2011; 124(18):1973–1981. doi:10.1161/CIRCULATIONAHA.110.015008
- Kim NH, Delcroix M, Jenkins DP, et al. Chronic thromboembolic pulmonary hypertension. J Am Coll Cardiol 2013; 62:(suppl 25):D92–D99. doi:10.1016/j.jacc.2013.10.024
- Moser KM, Auger WR, Fedullo PF. Chronic major-vessel thromboembolic pulmonary hypertension. Circulation 1990; 81(6):1735–1743. pmid:2188751
- McNeil K, Dunning J. Chronic thromboembolic pulmonary hypertension (CTEPH). Heart 2007; 93(9):1152–1158. doi:10.1136/hrt.2004.053603
- Tunariu N, Gibbs SJ, Win Z, et al. Ventilation-perfusion scintigraphy is more sensitive than multidetector CTPA in detecting chronic thromboembolic pulmonary disease as a treatable cause of pulmonary hypertension. J Nucl Med 2007; 48(5):680–684. doi:10.2967/jnumed.106.039438
- Fedullo P, Kerr KM, Kim NH, Auger WR. Chronic thromboembolic pulmonary hypertension. Am J Respir Crit Care Med 2011; 183(12):1605–1613. doi:10.1164/rccm.201011-1854CI
- Rich S, Kaufmann E, Levy PS. The effect of high doses of calcium-channel blockers on survival in primary pulmonary hypertension. N Engl J Med 1992; 327(2):76–81. doi:10.1056/NEJM199207093270203
- Sitbon O, Humbert M, Jaıs X, et al. Long-term response to calcium channel blockers in idiopathic pulmonary arterial hypertension. Circulation 2005; 111(23):3105–3111. doi:10.1161/CIRCULATIONAHA.104.488486
- Chin KM, Rubin LJ. Pulmonary arterial hypertension. J Am Coll Cardiol 2008; 51(16):1527–1538. doi:10.1016/j.jacc.2008.01.024
- Soubrier F, Chung WK, Machado R, et al. Genetics and genomics of pulmonary arterial hypertension. J Am Coll Cardiol 2013; 62(suppl 25):D13–D21. doi:10.1016/j.jacc.2013.10.035
- Eyries M, Montani D, Girerd B, et al. EIF2AK4 mutations cause pulmonary veno-occlusive disease, a recessive form of pulmonary hypertension. Nat Genet 2014; 46(1):65–69. doi: 10.1038/ng.2844
- Best DH, Sumner KL, Austin ED, et al. EIF2AK4 mutations in pulmonary capillary hemangiomatosis. Chest 2014; 145(2):231–236. doi:10.1378/chest.13-2366
- Best DH, Sumner KL, Smith BP, et al. EIF2AK4 mutations in patients diagnosed with pulmonary arterial hypertension. Chest 2017; 151(4):821–828. doi:10.1016/j.chest.2016.11.014
- Hadinnapola C, Bleda M, Haimel M, et al; NIHR BioResource–Rare Diseases Consortium; UK National Cohort Study of Idiopathic and Heritable PAH. Phenotypic characterization of EIF2AK4 mutation carriers in a large cohort of patients diagnosed clinically with pulmonary arterial hypertension. Circulation 2017; 136(21):2022–2033. doi:10.1161/CIRCULATIONAHA.117.028351
- Diaz-Guzman E, Farver C, Parambil J, Culver DA. Pulmonary hypertension caused by sarcoidosis. Clin Chest Med 2008; 29(3):549–563. doi:10.1016/j.ccm.2008.03.010
- Mauritz GJ, Kind T, Marcus JT, et al. Progressive changes in right ventricular geometric shortening and long-term survival in pulmonary arterial hypertension. Chest 2012; 141(4):935–943. doi:10.1378/chest.10-3277
- Galiè N, Palazzini M, Manes A. Pulmonary arterial hypertension: from the kingdom of the near-dead to multiple clinical trial meta-analyses. Eur Heart J 2010; 31(17):2080–2086. doi:10.1093/eurheartj/ehq152
Pulmonary arterial hypertension (PAH) is a hemodynamic disorder that affects small and medium-size pulmonary arteries through cellular proliferation and luminal narrowing.1 Increased pulmonary vascular resistance causes restricted blood flow in these arteries, leading to elevated pulmonary arterial pressure and afterload on the right ventricle. Despite advances in therapy, death usually occurs as a result of right ventricular failure.
- Group 1—PAH, due to narrowed pulmonary arteries
- Group 2—due to left heart disease
- Group 3—due to lung disease or hypoxia, or both
- Group 4—due to chronic thromboembolism or other pulmonary artery obstruction
- Group 5—due to uncertain or multifactorial causes.
Experts recognize the morbidity and mortality associated with pulmonary hypertension now more than in the past, and they emphasize recognizing it early. Guidelines for its diagnosis and treatment were updated in 2015.1
Below, we use a case to discuss recommendations for initial evaluation and classification of pulmonary hypertension, particularly PAH.
A PATIENT SUSPECTED OF HAVING PULMONARY HYPERTENSION
A 63-year-old woman with a 25-pack-year history of tobacco use, as well as pulmonary embolism and coronary artery disease, presents to her primary care physician with exertional dyspnea. She had been a clerk at a hardware store and physically active until she took early retirement 8 months ago because of increasing fatigue. She initially felt the fatigue was simply “a sign of getting old.”
Since retiring, she has noticed the slow onset of progressive dyspnea on exertion. She can no longer climb more than 1 flight of stairs or walk more than 1 block. She also complains of mild, fluctuating edema in her lower extremities over the past month. She quit smoking 8 years ago after undergoing placement of a drug-eluting stent in the mid-left circumflex artery. After this, she received clopidogrel and was followed by a cardiologist for 2 years but stopped taking the medication because of bruising. She has not seen her cardiologist in more than 5 years.
She underwent elective right total knee arthroplasty 3 years ago, complicated by acute deep vein thrombosis in the right common femoral vein. Computed tomography (CT) at that time did not reveal pulmonary emboli. She received warfarin therapy for 3 months.
She reports no current cough, chest pain, lightheadedness, or syncope. She has no orthopnea, and she feels normal at rest.
Her family history is unremarkable, and she has had no exposure to illicit substances, environmental toxins, or dietary supplements. She takes aspirin 81 mg daily, metoprolol 25 mg twice daily, lisinopril 10 mg daily, and simvastatin 40 mg at bedtime.
Her primary care physician detects a murmur in the left lower sternal border and sends her for transthoracic echocardiography, which demonstrates mild right ventricular dilation, right atrial dilation, and mildly reduced right ventricular function. The calculated right ventricular systolic pressure is 69 mm Hg. The left ventricle shows mild concentric hypertrophy; the left atrium is normal in size.
DIAGNOSTIC EVALUATION OF SUSPECTED PULMONARY HYPERTENSION
CLINICAL MANIFESTATIONS
Symptoms and signs. As in the patient described above, the first symptoms such as exertional dyspnea, fatigue, and lightheadedness usually arise in situations that call for increased cardiac output.4 As right ventricular function worsens, symptoms start to occur at rest, and signs of increased right ventricular preload appear, such as abdominal and lower-extremity edema and pericardial effusion. Syncope is a sign of severe right ventricular dysfunction.5
Physical examination. Look for signs of increased right ventricular loading and failure, eg:
- An accentuated intensity and persistent splitting of the second heart sound
- A prominent parasternal heave
- A prominent jugular “a” wave
- A systolic murmur along the left sternal border at the fourth intercostal space, which may worsen with breath-holding
- Pitting lower-extremity edema
- Hepatomegaly
- Hepatojugular reflux
- Hepatic pulsatility.6
ECHOCARDIOGRAPHY IN SUSPECTED PULMONARY HYPERTENSION
Many practitioners rely heavily on the estimated right ventricular systolic pressure in diagnosing pulmonary hypertension. In theory, this number should be nearly the same as the pulmonary arterial systolic pressure. However, technical and patient-related aspects of transthoracic echocardiography often limit accurate measurement of the right ventricular systolic pressure, and readings often differ from those measured with right heart catheterization.8
Our patient had a markedly elevated right ventricular systolic pressure and signs of right ventricular dysfunction, suggesting a high probability of pulmonary hypertension.
EVALUATING LEFT HEART DISEASE (WHO GROUP 2)
More than 75% of cases of pulmonary hypertension are directly related to left ventricular dysfunction or mitral or aortic valve disease (WHO group 2).1 Since group 2 differs markedly from group 1 (PAH) in its pathophysiology and treatment, it is important to distinguish between them.
Compared with WHO group 1 patients, those in group 2 tend to be older, more of them are male, and more of them have comorbidities such as metabolic syndrome, hypertension, and coronary artery disease.1,9 A combination of risk factors and clinical findings should be considered in identifying these patients.10
Transthoracic echocardiography is used to detect features of systolic and diastolic dysfunction. Left atrial enlargement is a clue that left heart disease may be present. In addition, signs of left ventricular or valvular dysfunction on electrocardiography or chest radiography are often helpful.
When estimated right ventricular systolic pressures are only minimally abnormal and no significant right ventricular dysfunction exists, further diagnostic evaluation is not warranted. However, because no single identifying feature or variable can readily distinguish group 2 from the other WHO groups, further evaluation should be considered if the right ventricular systolic pressure is significantly elevated or right ventricular dysfunction exists.
Our patient had several risk factors for left heart disease, including a history of smoking and coronary artery disease. Nonetheless, findings consistent with severe right ventricular dysfunction necessitated further evaluation for other possible causes of her suspected pulmonary hypertension.
Postcapillary pulmonary hypertension
In patients for whom further evaluation is pursued, the diagnosis of WHO group 2 pulmonary hypertension is ultimately based on findings consistent with postcapillary or “passive” pulmonary hypertension on right heart catheterization. Although mean pulmonary arterial pressures must be at least 25 mm Hg to certify the diagnosis of pulmonary hypertension, a pulmonary artery occlusion pressure greater than 15 mm Hg (normal 6–12) and pulmonary vascular resistance of 3 Wood units or less (normal 0.3–1.6) suggests the pulmonary hypertension is due to elevated left atrial pressure (ie, postcapillary) rather than precapillary pulmonary arterial remodeling.
Mixed pre- and postcapillary pulmonary hypertension
Distinguishing pulmonary venous hypertension from PAH is important, since their management differs. In particular, PAH-specific therapies (ie, prostacyclin analogues, prostaglandin I2 receptor agonists, endothelin receptor antagonists, phosphodiesterase-5 inhibitors, and cyclic guanosine monophosphate stimulators) can have a detrimental effect in WHO group 2 patients by causing increased pulmonary capillary leakage with pulmonary edema.11,12
In some patients, chronic passive congestion in the pulmonary venous circulation causes additional disruption of the homeostatic milieu regulating precapillary smooth muscle and endothelial function. These changes result in structural remodeling of precapillary arterioles and increased precapillary vascular resistance, creating a “mixed” pulmonary hypertension with both pre- and postcapillary abnormalities.
There is controversy over the ideal way to identify these patients but little disagreement that they face a worse prognosis than those without precapillary remodeling.13 In light of this, efforts have been made to characterize this cohort.
Historically, mixed pre- and postcapillary pulmonary hypertension was defined as the combination of all of the following:
- Mean pulmonary arterial pressure ≥ 25 mm Hg
- Pulmonary artery occlusion pressure > 15 mm Hg
- Transpulmonary gradient (the mean pulmonary arterial pressure minus the pulmonary artery occlusion pressure) > 12 mm Hg.14
However, the utility of the transpulmonary gradient for distinguishing mixed pulmonary hypertension has been questioned because of concerns over its susceptibility to variations in stroke volume and loading conditions.15
The diastolic pulmonary gradient (the pulmonary arterial diastolic pressure minus the pulmonary artery occlusion pressure) has been proposed as an alternative to the transpulmonary gradient under the theory that it is less sensitive to fluctuation from variations in flow or loading.15
Current guidelines1 suggest that a patient who has all of the following should be considered to have mixed pulmonary hypertension:
- A mean pulmonary arterial pressure > 25 mm Hg
- A pulmonary artery occlusion pressure > 15 mm Hg
- A diastolic pulmonary gradient > 7 mm Hg or a pulmonary vascular resistance > 3 Wood units, or both.
Occult group 2 pulmonary hypertension
Currently, the diagnosis of WHO group 2 pulmonary hypertension is based on elevated resting pulmonary artery occlusion pressure. However, some patients with WHO group 2 pulmonary hypertension and transiently low preload from aggressive diuresis or fasting may have a low pulmonary artery occlusion pressure during right heart catheterization and be misdiagnosed as having WHO group 1 PAH.12,16
This concern was acknowledged in the 2015 Ambrisentan and Tadalafil in Patients With Pulmonary Arterial Hypertension (AMBITION) study after investigators changed the protocol to exclude patients who technically met the criteria for WHO group 1 PAH, but had borderline-elevated pulmonary artery occlusion pressure and additional risk factors worrisome for left heart disease and occult WHO group 2 pulmonary hypertension.17,18
Several strategies, including passive leg-raising, fluid challenge, and exercise during diagnostic right heart catheterization, have been proposed to better classify these patients.19 Unfortunately, due to a lack of standardization of normal values and methodology for executing these maneuvers, consensus is lacking over their routine use, and recommendations for their use have not been provided.1
EVALUATION OF LUNG DISEASE (WHO GROUP 3)
All patients with suspected pulmonary hypertension should also be assessed for underlying pulmonary parenchymal or physiologic disease.
WHO group 3 consists of pulmonary disorders that, over an extended time, can lead to pulmonary hypertension. The most common of these disorders include chronic obstructive pulmonary disease, interstitial lung disease, and combined pulmonary fibrosis and emphysema.1
Pulmonary hypertension in these patients is precapillary, and changes in pulmonary vascular resistance are influenced by multiple factors, the most significant of which is alveolar hypoxia. Hypoxia induces pulmonary artery vasoconstrictionn (in contrast to the reflexive hemodynamics seen in peripheral tissues, where systemic vascular tone is generally lower in states of hypoxia) as a mechanism to divert pulmonary blood flow to well-ventilated portions of the lung and maintain ventilation-perfusion matching.
Repeated chronic hypoxia also alters cellular structure and function of pulmonary vessels and leads to medial hypertrophy and increased vascular tone, thus contributing to the development of pulmonary hypertension in many of these patients.20
Obstructive sleep apnea. Up to 70% of patients with obstructive sleep apnea have pulmonary hypertension.21 Chronic repetitive hypoxia throughout the night increases the levels of reactive oxygen species and alters cellular and molecular signaling, thus inducing vascular remodeling. In addition, apneic events during sleep promote catecholamine-driven elevations in systemic blood pressure. Over time, patients are at higher risk of developing left ventricular dysfunction and concomitant postcapillary group 2 pulmonary hypertension.22 Because typical methods of obstructive sleep apnea screening (eg, the Epworth Sleep Scale) have been historically poor at discriminating PAH patients with obstructive sleep apnea from those without, patients diagnosed with PAH should be considered for formal sleep testing.23,24
Pulmonary function tests, chest imaging
Pulmonary function tests and high-resolution computed tomography are essential to any PAH evaluation and help to exclude WHO group 3 pulmonary hypertension.1
An abnormal result on CT or spirometry can help point toward parenchymal lung disease. Normal spirometry and lung volumes with an isolated reduction in the diffusing capacity of the lung for carbon monoxide (Dlco) is typical of patients with WHO group 1 PAH.
In our patient, CT of the chest did not show any evidence of parenchymal lung disease, and pulmonary function tests showed no evidence of obstruction or restriction. There was a moderate decrease in Dlco, which did not reach normal limits when adjusted for lung volumes. In this setting, further evaluation of her PAH was warranted.
EVALUATION OF THROMBOEMBOLIC DISEASE (WHO GROUP 4)
Once pulmonary hypertension due to underlying left heart disease or parenchymal lung disease has been excluded, testing for chronic thromboembolic pulmonary hypertension is necessary, even in the absence of prior known pulmonary embolism. Identifying these patients is paramount, as chronic thromboembolic pulmonary hypertension (WHO group 4) is the only type of pulmonary hypertension for which a definitive cure is available.26
Up to 9% of patients who survive acute pulmonary embolism exhibit features of chronic proximal thrombosis and remodeling of distal pulmonary arteries.27
It remains unknown exactly why some patients develop chronic thromboembolic pulmonary hypertension and others do not, but the pathophysiology involves inappropriate thrombus resolution after venous thromboembolic events. Monocyte recruitment (which plays an important role in thrombus resolution) is reduced, angiogenesis is impaired (preventing effective vascular collateralization), and abnormal fibroblast proliferation leads to distal pulmonary vascular wall thickening.28 There is some evidence of increased thrombophilic risk in this population, and approximately 10% to 20% of patients are positive for antiphospholipid antibodies or lupus anticoagulant.29,30
Patients with chronic thromboembolic pulmonary hypertension usually present with symptoms similar to those of WHO group 1 PAH. Up to one-quarter of patients have no recollection of prior pulmonary embolism.31 As the disease progresses, signs and symptoms related to elevated pulmonary vascular resistance and right ventricular dysfunction are common.32,33
Although thrombi usually resolve quickly, the diagnosis of chronic thromboembolic pulmonary hypertension should be made only after at least 3 months of appropriate anticoagulation to avoid treatment of transient hemodynamic changes often seen after an acute pulmonary embolism.1
Radiographic changes associated with chronic thromboembolic pulmonary hypertension are distinct from the intraluminal filling defects seen with acute thromboembolism, since chronic thrombi tend to become organized and eccentric. On imaging, one may see features of rapid luminal narrowing or eccentric filling defects rather than the conventional central filling defects of acute pulmonary embolism. These changes are often overlooked by radiologists who are not specifically looking for chronic thromboembolic pulmonary hypertension.34 For this reason, the sensitivity and specificity of identifying chronic thromboembolic disease using radionuclide ventilation-perfusion lung scanning is superior to that of CT angiography.
All patients with suspected PAH should undergo a ventilation-perfusion scan.1,35 In patients with ventilation-perfusion mismatch on radionuclide scanning, pulmonary angiography can fulfill multiple goals of measuring pulmonary arterial pressures, identifying the extent and location of chronic thromboemboli, and can determine whether surgical thromboendarterectomy is feasible.
If chronic thromboembolic pulmonary hypertension is identified, it is imperative that patients be referred to a center of excellence specializing in its management regardless of symptom severity, as surgery can be curative and may prevent development of progressive right ventricular dysfunction.36
Our patient’s ventilation-perfusion scan was normal, effectively ruling out the possibility of chronic thromboembolism as a cause of her pulmonary hypertension.
RIGHT HEART CATHETERIZATION
Once the above-mentioned conditions have been evaluated, patients with suspected PAH should be referred to a pulmonary hypertension center of excellence to undergo right heart catheterization. If this test reveals PAH, further vasoreactivity testing should be performed if the etiology of the PAH is considered to be idiopathic, heritable, or drug-induced.1
Vasoreactivity is most commonly tested using 20 ppm of inhaled nitric oxide, but alternative formulations including intravenous epoprostenol, intravenous adenosine, or inhaled iloprost are acceptable. Patients who have a positive vasoreactive test usually respond well to high-dose calcium channel blocker therapy and have a significantly better prognosis than other patients with PAH.37
Patients with WHO group 1 PAH who do not have idiopathic, heritable, or drug-induced PAH have not been shown to have favorable outcomes using calcium channel blockers even if they have a positive vasoreactive response. A positive vasoreactive response is defined as a drop in mean pulmonary arterial pressure of at least 10 mm Hg to an absolute level of 40 mm Hg or less. Cardiac output should be preserved or elevated compared with baseline values during the challenge.1
In reality, only 10% to 15% of patients with idiopathic PAH have a positive vasoreactive response, and half of these patients stop responding within 1 year.38 Therefore, clinicians should not assume that calcium channel blockers will be successful in the long term in a vasoreactive patient, and these patients should have follow-up right heart catheterization after 3 to 6 months and annually thereafter to ensure continued vasoreactivity.1
In patients who are no longer vasoreactive or whose functional status is worse than New York Heart Association functional class I or II, conventional PAH-specific therapy should be started.
LOOKING FOR CAUSES OF ‘IDIOPATHIC’ PAH
Pulmonary hypertension is considered the final common pathway of many varied diseases and syndromes, and therefore one cannot say it is idiopathic without making a robust effort to identify features of alternative causes and rule out other contributing factors.
Although the exact etiology of idiopathic PAH is unclear, well-characterized imbalances in vascular homeostasis have been identified. These include processes that promote vasoconstriction, cell proliferation, and thrombosis (thromboxane A2, endothelin-1, and serotonin) and those that suppress prostacyclin, nitric oxide, and vasoactive intestinal peptide-mediated vasodilation.1 Furthermore, an abnormal angiogenic response to hypoxia and vascular endothelial growth factor has been observed.39
Before considering a diagnosis of idiopathic PAH, a careful history is essential. Other causative agents include appetite-suppressing medications, such as fenfluramine derivatives or stimulants such as amphetamines. Human immunodeficiency virus (HIV) or hepatitis, a history of splenectomy, and prior thyroid or liver disease are also common causes of PAH. Joint pain, myalgias, Raynaud features, or a rash characteristic of connective tissue disease can be identified on history and physical examination. Worldwide, chronic exposure to high-altitude climates and exposure to schistosomiasis are significant causes of PAH, but are rarely seen in developed nations. Confirmatory serum tests for HIV, antinuclear antibody, scleroderma antibody, and thyroid function are essential.1
Genetic factors
If patients report having relatives with possible or probable PAH, genetic counseling is recommended, particularly for rare but causative gene mutations.
BMPR2, the gene that codes for the bone morphogenetic protein receptor type 2, can carry mutations with variable penetrance over the patient’s lifetime depending on other genetic polymorphisms, concurrent inflammation, and the patient’s sex.40
The population carrier estimates of BMPR2 mutations are only 0.001% to 0.01%, but mutations in this gene are identified in approximately 25% of nonfamilial PAH patients and in over 75% of those with a familial inheritance pattern. The BMPR2 protein is a part of the transforming growth factor beta family and is partially responsible for control of vascular cell proliferation. Mutations in this gene lead to PAH at a younger age than in those with mutation-negative idiopathic PAH and to a more severe clinical phenotype in terms of pulmonary vascular resistance and cardiac function.40
Other mutations. Although BMPR2 is the most commonly identified gene mutation in patients with PAH, other gene mutations within this family have also been recognized. These include mutations in the genes for activin receptor-like kinase 1 and endoglin, which, although better known for their association with hereditary hemorrhagic telangiectasia, can lead directly to PAH.40
More recently, a novel autosomal recessive gene mutation in eukaryotic translation initiation factor 2 alpha kinase 4 (EIF2AK4) has been identified in patients with pulmonary veno-occlusive disease41 and pulmonary capillary hemangiomatosis,42 which are specific subclasses of WHO group 1 PAH. The mechanistic parallels between EIF2AK4 and these diseases are not clear, but the prevalence of disease in those with a familial inheritance pattern and an EIF2AK4 mutation is nearly 100%.41 Thus, identification of this mutation has been accepted as a way to confirm pulmonary veno-occlusive disease and pulmonary capillary hemangiomatosis in patients suspected of PAH with features of these diseases.43,44
GROUP 5: MISCELLANEOUS FORMS OF PULMONARY HYPERTENSION
WHO group 5 pulmonary hypertension encompasses disorders whose pathophysiology does not fit neatly within the context of the other pulmonary hypertension subtypes. Nonetheless, appreciation of these disorders is important in determining the etiology and appropriate therapy for patients with pulmonary hypertension. The mechanism driving abnormal pulmonary arterial pressures in patients with group 5 pulmonary hypertension is not always clear and may involve intrinsic or extrinsic factors.1
Diseases within group 5 include those that cause extrinsic compression of the pulmonary arteries (ie, fibrosing mediastinitis) or intrinsic elevations in pulmonary vascular resistance (sarcoidosis, pulmonary Langerhans cell histiocytosis, sickle cell anemia, polycythemia vera, and malignancy).
The most common cause of pulmonary hypertension in this category is sarcoidosis. Current theories suggest that, for most patients, invasion of granulomatous inflammation within the arterial walls induces PAH via fibrotic or inflammatory vascular occlusion. Extrinsic compression due to lymphadenopathy, right or left ventricular dysfunction due to cardiac myocite infiltration, and endothelin-induced pulmonary vasoconstriction are other possible links between the PAH and sarcoidosis.45
PROGNOSTIC RISK STRATIFICATION IN THE PATIENTS WITH PAH
Cardiac magnetic resonance imaging (MRI) has gained popularity as a noninvasive and reproducible alternative to echocardiography. Image fidelity and characterization of right ventricular function and right ventricular ejection fraction are all more accurate than with echocardiography, and serial MRI has proven valuable in its ability to guide patient prognosis.46
However, MRI is more expensive than echocardiography, and some patients cannot tolerate the procedure. In addition, for those who can tolerate it, MRI is not a suitable alternative to right heart catheterization, since it cannot accurately estimate pulmonary artery occlusion pressure or pulmonary arterial pressures.1 For these reasons, cardiac MRI use varies across pulmonary hypertension centers.
A goal of treatment is to reduce a patient’s risk. While no consensus has been achieved over which PAH-specific therapy to start with, evidence is robust that using more than 1 class of agent is beneficial, capitalizing on multiple therapeutic targets.17,47
In our patient, right heart catheterization revealed PAH with a mean pulmonary arterial pressure of 44 mm Hg, pulmonary artery occlusion pressure 6 mm Hg, and a cardiac index of 2.1 L/min/m2. Ancillary testing for alternative causes of PAH was unrevealing, as was vasoreactivity testing. Our patient could walk only 314 meters on her 6-minute walk test and had an initial NT-proBNP level of 750 ng/L.
Based on these and the findings during her evaluation, she would be classified as having intermediate-risk PAH with an estimated 1-year mortality risk of 5% to 10%.1 Appropriate therapy and follow-up would be guided by this determination. Specific therapy is beyond the scope of this article but we would start her on dual oral therapy with close follow-up to reassess her 1-year mortality risk. If there were no improvement over a short period of time, we would add further therapy.
- Galiè N, Humbert M, Vachiery JL, et al. 2015 ESC/ERS guidelines for the diagnosis and treatment of pulmonary hypertension: the Joint Task Force for the Diagnosis and Treatment of Pulmonary Hypertension of the European Society of Cardiology (ESC) and the European Respiratory Society (ERS): Endorsed by: Association for European Paediatric and Congenital Cardiology (AEPC), International Society for Heart and Lung Transplantation (ISHLT). Eur Respir J 2015; 46(4):903–975. doi:10.1183/13993003.01032-2015
- Galiè N, Rubin LJ, Hoeper M, et al. Treatment of patients with mildly symptomatic pulmonary arterial hypertension with bosentan (EARLY study): a double-blind, randomized controlled trial. Lancet 2008; 371(9630):2093–2100. doi:10.1016/S0140-6736(08)60919-8
- Howard LS. Prognostic factors in pulmonary arterial hypertension: assessing the course of the disease. Eur Respir Rev 2011; 20:236–242. doi:10.1183/09059180.00006711
- Brown LM, Chen H, Halpern S, et al. Delay in recognition of pulmonary arterial hypertension: factors identified from the REVEAL registry. Chest 2011; 140:19–26. doi:10.1378/chest.10-1166
- Elliot CG, Farber H, Frost A, Liou TG, Turner M. REVEAL Registry: medical history and time to diagnosis of enrolled patients. Chest 2007; 132(4):631a. doi:10.1378/chest.132.4_MeetingAbstracts.631a
- Minai OA, Budev MM. Diagnostic strategies for suspected pulmonary arterial hypertension: a primer for the internist. Cleve Clin J Med 2007; 74(10):737–747. pmid:17941295
- Badesch DB, Raskob GE, Elliott CG, et al. Pulmonary arterial hypertension: baseline characteristics from the REVEAL registry. Chest 2010; 137(2):376–387. doi:10.1378/chest.09-1140
- Fisher MR, Forfia PR, Chamera E, et al. Accuracy of Doppler echocardiography in the hemodynamic assessment of pulmonary hypertension. Am J Respir Crit Care Med 2009; 179(7):615–621. doi:10.1164/rccm.200811-1691OC
- Robbins IM, Newman JH, Johnson RF, et al. Association of the metabolic syndrome with pulmonary venous hypertension. Chest 2009; 136(1):31–36. doi:10.1378/chest.08-2008
- Rosenkranz S, Gibbs JS, Wachter R, De Marco T, Vonk-Noordegraaf A, Vachiery JL. Left ventricular heart failure and pulmonary hypertension. Eur Heart J 2016; 37(12):942–954. doi:10.1093/eurheartj/ehv512
- Opitz CF, Hoeper MM, Gibbs JSR, et al. Pre-capillary, combined, and post-capillary pulmonary hypertension: a pathophysiological continuum. J Am Coll Cardiol 2016; 68:368–378. doi: 10.1016/j.jacc.2016.05.047
- Robbins IM, Hemnes AR, Pugh ME, et al. High prevalence of occult pulmonary venous hypertension revealed by fluid challenge in pulmonary hypertension. Circ Heart Fail 2014; 7(1):116–122. doi:10.1161/CIRCHEARTFAILURE.113.000468
- Gerges C, Gerges M, Lang MB, et al. Diastolic pulmonary vascular pressure gradient: a predictor of prognosis in “out-of-proportion” pulmonary hypertension. Chest 2013; 143(3):758–766. doi:10.1378/chest.12-1653
- Task Force for Diagnosis and Treatment of Pulmonary Hypertension of European Society of Cardiology (ESC); European Respiratory Society (ERS); International Society of Heart and Lung Transplantation (ISHLT); Galiè N, Hoeper MM, Humbert M, et al. Guidelines for the diagnosis and treatment of pulmonary hypertension. Eur Respir J 2009; 34(6):1219–1263. doi:10.1183/09031936.00139009
- Naeije R, Vachiery JL, Yerly P, Vanderpool R. The transpulmonary pressure gradient for the diagnosis of pulmonary vascular disease. Eur Respir J 2013; 41(1):217–223. doi:10.1183/09031936.00074312
- Frost AE, Badesch DB, Miller DP, Benza RL, Meltzer LA, McGoon MD. Evaluation of the predictive value of a clinical worsening definition using 2-year outcomes in patients with pulmonary arterial hypertension: a REVEAL registry analysis. Chest 2013; 144(5):1521–1529. doi:10.1378/chest.12-3023
- Galiè N, Barberà JA, Frost AE, et al; AMBITION Investigators. Initial use of ambrisentan plus tadalafil in pulmonary arterial hypertension. N Engl J Med 2015; 373(9):834–844. doi:10.1056/NEJMoa1413687
- Farr G, Shah K, Markley R, Abbate A, Salloum FN, Grinnan D. Development of pulmonary hypertension in heart failure with preserved ejection fraction. Prog Cardiovasc Dis 2016; 59(1):52–58. doi:10.1016/j.pcad.2016.06.002
- Hoeper MM, Barberà JA, Channick RN, et al. Diagnosis, assessment, and treatment of non-pulmonary arterial hypertension pulmonary hypertension. J Am Coll Cardiol 2009; 54(suppl 1):S85–S96. doi:10.1016/j.jacc.2009.04.008
- Chaouat A, Naeije R, Weitzenblum E. Pulmonary hypertension in COPD. Eur Respir J 2008; 32(5):1371–1385. doi:10.1183/09031936.00015608
- Minai OA, Ricaurte B, Kaw R, et al. Frequency and impact of pulmonary hypertension in patients with obstructive sleep apnea syndrome. Am J Cardiol 2009; 104(9):1300–1306. doi:10.1016/j.amjcard.2009.06.048
- Kholdani C, Fares WH, Mohsenin V. Pulmonary hypertension in obstructive sleep apnea: is it clinically significant? A critical analysis of the association and pathophysiology. Pulm Circ 2015; 5(2):220–227. doi:10.1086/679995
- Prisco DL, Sica AL, Talwar A, et al. Correlation of pulmonary hypertension severity with metrics of comorbid sleep-disordered breathing. Sleep Breath 2011; 15(4):633–639. doi:10.1007/s11325-010-0411-y
- Dumitrascu R, Tiede H, Eckermann J, et al. Sleep apnea in precapillary pulmonary hypertension. Sleep Med 2013; 14(3):247–251. doi:10.1016/j.sleep.2012.11.013
- Arcasoy SM, Christie JD, Ferrari VA, et al. Echocardiographic assessment of pulmonary hypertension in patients with advanced lung disease. Am J Respir Crit Care Med 2003; 167(5):735–740. doi:10.1164/rccm.200210-1130OC
- Pepke-Zaba J, Jansa P, Kim NH, Naeije R, Simonneau G. Chronic thromboembolic pulmonary hypertension: role of medical therapy. Eur Respir J 2013; 41(4):985–990. doi:10.1183/09031936.00201612
- Guérin L, Couturaud F, Parent F, et al. Prevalence of chronic thromboembolic pulmonary hypertension after acute pulmonary embolism. Prevalence of CTEPH after pulmonary embolism. Thromb Haemost 2014; 112(3):598–605. doi:10.1160/TH13-07-0538
- Lang IM, Pesavento R, Bonderman D, Yuan JX. Risk factors and basic mechanisms of chronic thromboembolic pulmonary hypertension: a current understanding. Eur Respir J 2013; 41(2):462–468. doi:10.1183/09031936.00049312
- Pepke-Zaba J. Diagnostic testing to guide the management of chronic thromboembolic pulmonary hypertension: state of the art. Eur Respir Rev 2010; 19(115):55–58. doi:10.1183/09059180.00007209
- Bonderman D, Turecek PL, Jakowitsch J, et al. High prevalence of elevated clotting factor VIII in chronic thromboembolic pulmonary hypertension. Thromb Haemost 2003; 90(3):372–376. doi:10.1160/TH03-02-0067
- Pepke-Zaba J, Delcroix M, Lang I, et al. Chronic thromboembolic pulmonary hypertension (CTEPH): results from an international prospective registry. Circulation 2011; 124(18):1973–1981. doi:10.1161/CIRCULATIONAHA.110.015008
- Kim NH, Delcroix M, Jenkins DP, et al. Chronic thromboembolic pulmonary hypertension. J Am Coll Cardiol 2013; 62:(suppl 25):D92–D99. doi:10.1016/j.jacc.2013.10.024
- Moser KM, Auger WR, Fedullo PF. Chronic major-vessel thromboembolic pulmonary hypertension. Circulation 1990; 81(6):1735–1743. pmid:2188751
- McNeil K, Dunning J. Chronic thromboembolic pulmonary hypertension (CTEPH). Heart 2007; 93(9):1152–1158. doi:10.1136/hrt.2004.053603
- Tunariu N, Gibbs SJ, Win Z, et al. Ventilation-perfusion scintigraphy is more sensitive than multidetector CTPA in detecting chronic thromboembolic pulmonary disease as a treatable cause of pulmonary hypertension. J Nucl Med 2007; 48(5):680–684. doi:10.2967/jnumed.106.039438
- Fedullo P, Kerr KM, Kim NH, Auger WR. Chronic thromboembolic pulmonary hypertension. Am J Respir Crit Care Med 2011; 183(12):1605–1613. doi:10.1164/rccm.201011-1854CI
- Rich S, Kaufmann E, Levy PS. The effect of high doses of calcium-channel blockers on survival in primary pulmonary hypertension. N Engl J Med 1992; 327(2):76–81. doi:10.1056/NEJM199207093270203
- Sitbon O, Humbert M, Jaıs X, et al. Long-term response to calcium channel blockers in idiopathic pulmonary arterial hypertension. Circulation 2005; 111(23):3105–3111. doi:10.1161/CIRCULATIONAHA.104.488486
- Chin KM, Rubin LJ. Pulmonary arterial hypertension. J Am Coll Cardiol 2008; 51(16):1527–1538. doi:10.1016/j.jacc.2008.01.024
- Soubrier F, Chung WK, Machado R, et al. Genetics and genomics of pulmonary arterial hypertension. J Am Coll Cardiol 2013; 62(suppl 25):D13–D21. doi:10.1016/j.jacc.2013.10.035
- Eyries M, Montani D, Girerd B, et al. EIF2AK4 mutations cause pulmonary veno-occlusive disease, a recessive form of pulmonary hypertension. Nat Genet 2014; 46(1):65–69. doi: 10.1038/ng.2844
- Best DH, Sumner KL, Austin ED, et al. EIF2AK4 mutations in pulmonary capillary hemangiomatosis. Chest 2014; 145(2):231–236. doi:10.1378/chest.13-2366
- Best DH, Sumner KL, Smith BP, et al. EIF2AK4 mutations in patients diagnosed with pulmonary arterial hypertension. Chest 2017; 151(4):821–828. doi:10.1016/j.chest.2016.11.014
- Hadinnapola C, Bleda M, Haimel M, et al; NIHR BioResource–Rare Diseases Consortium; UK National Cohort Study of Idiopathic and Heritable PAH. Phenotypic characterization of EIF2AK4 mutation carriers in a large cohort of patients diagnosed clinically with pulmonary arterial hypertension. Circulation 2017; 136(21):2022–2033. doi:10.1161/CIRCULATIONAHA.117.028351
- Diaz-Guzman E, Farver C, Parambil J, Culver DA. Pulmonary hypertension caused by sarcoidosis. Clin Chest Med 2008; 29(3):549–563. doi:10.1016/j.ccm.2008.03.010
- Mauritz GJ, Kind T, Marcus JT, et al. Progressive changes in right ventricular geometric shortening and long-term survival in pulmonary arterial hypertension. Chest 2012; 141(4):935–943. doi:10.1378/chest.10-3277
- Galiè N, Palazzini M, Manes A. Pulmonary arterial hypertension: from the kingdom of the near-dead to multiple clinical trial meta-analyses. Eur Heart J 2010; 31(17):2080–2086. doi:10.1093/eurheartj/ehq152
KEY POINTS
- PAH has nonspecific symptoms, largely attributable to right ventricular dysfunction but seen in a host of other common cardiopulmonary ailments.
- In a patient suspected of having pulmonary hypertension, it is important to take a methodic diagnostic approach to identify underlying contributors and minimize unnecessary testing.
- Patients suspected of having PAH should be referred to a pulmonary hypertension center of excellence for evaluation and right heart catheterization.
- Once testing is complete, therapy and management should be guided both by data obtained during the initial evaluation and by factors with prognostic significance. This approach has changed PAH from a disease with a grim outlook to one in which appropriate evaluation and guidance can improve patient outcomes.
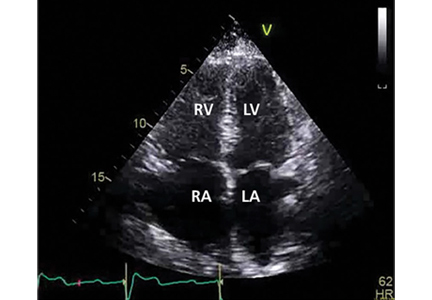
‘Non-criteria’ antiphospholipid antibodies and thrombosis
To the Editor: We read with great interest the excellent article on thrombosis secondary to antiphospholipid antibody syndrome.1 We wish to comment on the section “Antiphospholipid antibodies are not all the same,” specifically on question 6: “Which of the following antiphospholipid antibodies have not been associated with an increased thrombotic risk?”
The answer offered was antiphosphatidylserine, and the authors stated, “While lupus anticoagulant, anti-beta-2-glycoprotein I, and anticardiolipin antibodies are associated with thrombosis, antiprothrombin antibodies (including antiprothrombin and antiphosphatidylserine antibodies) are not.”1
Antiphospholipid antibody testing in antiphospholipid antibody syndrome is complicated, but we feel the information provided was inaccurate. It should be noted that 3 antibodies are under discussion: in addition to antiphosphatidylserine (aPS) antibodies, antiprothrombin antibodies are heterogeneous, comprising antibodies to prothrombin alone (aPT-A) and antibodies to the antiphosphatidylserine-prothrombin complex (aPS/PT). While the diagnostic utility of these antibodies is in evolution, there are numerous studies on their association with thrombosis or antiphospholipid antibody syndrome, or both.2,3 Most recently, a systematic review (N = 7,000) concluded that prothrombin antibodies (aPT, aPS/PT) were strong risk factors for thrombosis (odds ratio 2.3, 95% confidence interval 1.72–3.5).4
The revised Sapporo (Sydney) guidelines referenced by the authors addressed these “non-criteria” antiphospholipid antibodies.5 At that time (2006), it was thought premature to include these antibodies as independent criteria for definite antiphospholipid antibody syndrome, even though their association with the syndrome was recognized by the committee. The guidelines considered an interesting scenario: What if a case fulfills the clinical criteria of antiphospholipid antibody syndrome, but serology is positive only for these “non-criteria” antibodies? It was suggested that these cases be classified as “probable” antiphospholipid antibody syndrome. Also, aPS/PT was proposed as a confirmatory assay for lupus anticoagulant testing.
In 2010, the International Congress on Antiphospholipid Antibodies concluded that aPS/PT is truly relevant to thrombosis and antiphospholipid antibody syndrome, with the possibility of aPS/PT becoming a criterion for the syndrome in the future.6 Studies have already started on this.7 Since then, 2 scoring systems to quantify the risk of thrombosis and obstetric events have incorporated aPS/PT—the Antiphospholipid Score (2012) and the Global Anti-Phospholipid Syndrome Score (2013).8.9
In conclusion, these antibodies are associated with thrombosis, can be considered features of antiphospholipid antibody syndrome in the right clinical context, and have a role in contemporary discussion of this disease.
- Serhal M, Evans N, Gornik HL. A 75-year-old with abdominal pain, hypoxia, and weak pulses in the left leg. Cleve Clin J Med 2018; 85(2):145–154. doi:10.3949/ccjm.85a.16069
- Khogeer H, Alfattani A, Al Kaff M, Al Shehri T, Khojah O, Owaidah T. Antiphosphatidylserine antibodies as diagnostic indicators of antiphospholipid syndrome. Lupus 2015; 24(2):186–190. doi:10.1177/0961203314552462
- Sciascia S, Bertolaccini ML. Antibodies to phosphatidylserine/prothrombin complex and the antiphospholipid syndrome. Lupus 2014; 23(12):1309–1312. doi:10.1177/0961203314538332
- Sciascia S, Sanna G, Murru V, Roccatello D, Khamashta MA, Bertolaccini ML. Anti-prothrombin (aPT) and anti-phosphatidylserine/prothrombin (aPS/PT) antibodies and the risk of thrombosis in the antiphospholipid syndrome. A systematic review. Thromb Haemost 2014; 111(2):354–364. doi:10.1160/TH13-06-0509
- Miyakis S, Lockshin MD, Atsumi T, et al. International consensus statement on an update of the classification criteria for definite antiphospholipid syndrome (APS). J Thromb Haemost 2006; 4(2):295–306. doi:10.1111/j.1538-7836.2006.01753.x
- Bertolaccini ML, Amengual O, Atsumi T, et al. ‘Non-criteria’ aPL tests: report of a task force and preconference workshop at the 13th International Congress on Antiphospholipid Antibodies, Galveston, TX, USA, April 2010. Lupus 2011; 20:191–205. doi:10.1177/0961203310397082
- Fabris M, Giacomello R, Poz A, et al. The introduction of anti-phosphatidylserine/prothrombin autoantibodies in the laboratory diagnostic process of anti-phospholipid antibody syndrome: 6 months of observation. Auto-Immunity Highlights 2014; 5(2):63–67. doi:10.1007/s13317-014-0061-3
- Otomo K, Atsumi T, Amengual O, et al. Efficacy of the antiphospholipid score for the diagnosis of antiphospholipid syndrome and its predictive value for thrombotic events. Arthritis Rheum 2012; 64(2):504–512. doi:10.1002/art.33340
- Sciascia S, Sanna G, Murru V, Roccatello D, Khamashta MA, Bertolaccini ML. GAPSS: the Global Anti-Phospholipid Syndrome Score. Rheumatology (Oxford) 2013; 52(8):1397–1403. doi:10.1093/rheumatology/kes388
To the Editor: We read with great interest the excellent article on thrombosis secondary to antiphospholipid antibody syndrome.1 We wish to comment on the section “Antiphospholipid antibodies are not all the same,” specifically on question 6: “Which of the following antiphospholipid antibodies have not been associated with an increased thrombotic risk?”
The answer offered was antiphosphatidylserine, and the authors stated, “While lupus anticoagulant, anti-beta-2-glycoprotein I, and anticardiolipin antibodies are associated with thrombosis, antiprothrombin antibodies (including antiprothrombin and antiphosphatidylserine antibodies) are not.”1
Antiphospholipid antibody testing in antiphospholipid antibody syndrome is complicated, but we feel the information provided was inaccurate. It should be noted that 3 antibodies are under discussion: in addition to antiphosphatidylserine (aPS) antibodies, antiprothrombin antibodies are heterogeneous, comprising antibodies to prothrombin alone (aPT-A) and antibodies to the antiphosphatidylserine-prothrombin complex (aPS/PT). While the diagnostic utility of these antibodies is in evolution, there are numerous studies on their association with thrombosis or antiphospholipid antibody syndrome, or both.2,3 Most recently, a systematic review (N = 7,000) concluded that prothrombin antibodies (aPT, aPS/PT) were strong risk factors for thrombosis (odds ratio 2.3, 95% confidence interval 1.72–3.5).4
The revised Sapporo (Sydney) guidelines referenced by the authors addressed these “non-criteria” antiphospholipid antibodies.5 At that time (2006), it was thought premature to include these antibodies as independent criteria for definite antiphospholipid antibody syndrome, even though their association with the syndrome was recognized by the committee. The guidelines considered an interesting scenario: What if a case fulfills the clinical criteria of antiphospholipid antibody syndrome, but serology is positive only for these “non-criteria” antibodies? It was suggested that these cases be classified as “probable” antiphospholipid antibody syndrome. Also, aPS/PT was proposed as a confirmatory assay for lupus anticoagulant testing.
In 2010, the International Congress on Antiphospholipid Antibodies concluded that aPS/PT is truly relevant to thrombosis and antiphospholipid antibody syndrome, with the possibility of aPS/PT becoming a criterion for the syndrome in the future.6 Studies have already started on this.7 Since then, 2 scoring systems to quantify the risk of thrombosis and obstetric events have incorporated aPS/PT—the Antiphospholipid Score (2012) and the Global Anti-Phospholipid Syndrome Score (2013).8.9
In conclusion, these antibodies are associated with thrombosis, can be considered features of antiphospholipid antibody syndrome in the right clinical context, and have a role in contemporary discussion of this disease.
- Serhal M, Evans N, Gornik HL. A 75-year-old with abdominal pain, hypoxia, and weak pulses in the left leg. Cleve Clin J Med 2018; 85(2):145–154. doi:10.3949/ccjm.85a.16069
- Khogeer H, Alfattani A, Al Kaff M, Al Shehri T, Khojah O, Owaidah T. Antiphosphatidylserine antibodies as diagnostic indicators of antiphospholipid syndrome. Lupus 2015; 24(2):186–190. doi:10.1177/0961203314552462
- Sciascia S, Bertolaccini ML. Antibodies to phosphatidylserine/prothrombin complex and the antiphospholipid syndrome. Lupus 2014; 23(12):1309–1312. doi:10.1177/0961203314538332
- Sciascia S, Sanna G, Murru V, Roccatello D, Khamashta MA, Bertolaccini ML. Anti-prothrombin (aPT) and anti-phosphatidylserine/prothrombin (aPS/PT) antibodies and the risk of thrombosis in the antiphospholipid syndrome. A systematic review. Thromb Haemost 2014; 111(2):354–364. doi:10.1160/TH13-06-0509
- Miyakis S, Lockshin MD, Atsumi T, et al. International consensus statement on an update of the classification criteria for definite antiphospholipid syndrome (APS). J Thromb Haemost 2006; 4(2):295–306. doi:10.1111/j.1538-7836.2006.01753.x
- Bertolaccini ML, Amengual O, Atsumi T, et al. ‘Non-criteria’ aPL tests: report of a task force and preconference workshop at the 13th International Congress on Antiphospholipid Antibodies, Galveston, TX, USA, April 2010. Lupus 2011; 20:191–205. doi:10.1177/0961203310397082
- Fabris M, Giacomello R, Poz A, et al. The introduction of anti-phosphatidylserine/prothrombin autoantibodies in the laboratory diagnostic process of anti-phospholipid antibody syndrome: 6 months of observation. Auto-Immunity Highlights 2014; 5(2):63–67. doi:10.1007/s13317-014-0061-3
- Otomo K, Atsumi T, Amengual O, et al. Efficacy of the antiphospholipid score for the diagnosis of antiphospholipid syndrome and its predictive value for thrombotic events. Arthritis Rheum 2012; 64(2):504–512. doi:10.1002/art.33340
- Sciascia S, Sanna G, Murru V, Roccatello D, Khamashta MA, Bertolaccini ML. GAPSS: the Global Anti-Phospholipid Syndrome Score. Rheumatology (Oxford) 2013; 52(8):1397–1403. doi:10.1093/rheumatology/kes388
In reply: ‘Non-criteria’ antiphospholipid antibodies and thrombosis
In Reply: We appreciate the response of Drs. Maharaj, Chang, and Shaikh. Antiphospholipid antibody testing and the diagnosis of antiphospholipid antibody syndrome are quite complex. We recognize that there is controversy with regard to the role of antiphosphatidylserine (aPS) antibodies, antiprothrombin antibodies, (aPT-A), and antibodies to the antiphosphatidylserine-prothrombin complex (aPS/PT).
In the systematic review cited, the authors concluded that measurement of aPS/PT may be helpful in determining the thrombotic risk in a subset of patients with prior thrombosis and systemic lupus erythematosus (SLE).1 However, the majority of the studies included in the systematic review enrolled patients with antiphospholipid antibody syndrome and SLE. Our patient did not have SLE. Additionally, most of the studies were small. Therefore, the independent association between aPS/PT and thrombosis in patients without known SLE or previously known antiphospholipid antibody syndrome is challenging to infer on the basis of available data.1
At our institution, we do not routinely test for these “non-criteria” antibodies as part of our evaluation of suspected antiphospholipid antibody syndrome. However, we agree that this is an area that warrants further investigation. There is a need for prospective trials or, more likely, longitudinal observational studies to further delineate the association of aPT-A, aPS, or aPS/PT with clinical features of antiphospholipid antibody syndrome.2
- Sciascia S, Sanna G, Murru V, Roccatello D, Khamashta MA, Bertolaccini ML. Anti-prothrombin (aPT) and anti-phosphatidylserine/prothrombin (aPS/PT) antibodies and the risk of thrombosis in the antiphospholipid syndrome. A systematic review. Thromb Haemost 2014; 111(2):354–364. doi:10.1160/TH13-06-0509
- Miyakis S, Lockshin MD, Atsumi T et al. International consensus statement on an update of the classification criteria for definite antiphospholipid syndrome (APS). J Thromb Haemost 2006; 4(2):295–306. doi:10.1111/j.1538-7836.2006.01753.x
In Reply: We appreciate the response of Drs. Maharaj, Chang, and Shaikh. Antiphospholipid antibody testing and the diagnosis of antiphospholipid antibody syndrome are quite complex. We recognize that there is controversy with regard to the role of antiphosphatidylserine (aPS) antibodies, antiprothrombin antibodies, (aPT-A), and antibodies to the antiphosphatidylserine-prothrombin complex (aPS/PT).
In the systematic review cited, the authors concluded that measurement of aPS/PT may be helpful in determining the thrombotic risk in a subset of patients with prior thrombosis and systemic lupus erythematosus (SLE).1 However, the majority of the studies included in the systematic review enrolled patients with antiphospholipid antibody syndrome and SLE. Our patient did not have SLE. Additionally, most of the studies were small. Therefore, the independent association between aPS/PT and thrombosis in patients without known SLE or previously known antiphospholipid antibody syndrome is challenging to infer on the basis of available data.1
At our institution, we do not routinely test for these “non-criteria” antibodies as part of our evaluation of suspected antiphospholipid antibody syndrome. However, we agree that this is an area that warrants further investigation. There is a need for prospective trials or, more likely, longitudinal observational studies to further delineate the association of aPT-A, aPS, or aPS/PT with clinical features of antiphospholipid antibody syndrome.2
- Sciascia S, Sanna G, Murru V, Roccatello D, Khamashta MA, Bertolaccini ML. Anti-prothrombin (aPT) and anti-phosphatidylserine/prothrombin (aPS/PT) antibodies and the risk of thrombosis in the antiphospholipid syndrome. A systematic review. Thromb Haemost 2014; 111(2):354–364. doi:10.1160/TH13-06-0509
- Miyakis S, Lockshin MD, Atsumi T et al. International consensus statement on an update of the classification criteria for definite antiphospholipid syndrome (APS). J Thromb Haemost 2006; 4(2):295–306. doi:10.1111/j.1538-7836.2006.01753.x
Sesamol
The protective effects of the antioxidative compound sesamol against radiation were reported as early as 1991.1 The water-soluble lignan sesamol, a natural phenolic compound derived from Sesamum indicum (sesame) seed oil, has since become known as a potent antioxidant with significant anticancer potential.2,3 As a constituent found in food oils such as sesame and sunflower oil, sesamol has been studied for the dietary benefits that it has been said to impart. Sesame oil, in particular, has been used in Ayurveda, traditional Chinese medicine, as well as in folk medicine in Nigeria and other African countries.Data on its antioxidant and chemopreventive properties also have prompted investigations into its potential in the dermatologic realm because sesamol has demonstrated an increasingly wide array of cutaneous applications.

Antibacterial effects
In 2007, Bankole et al. ascertained the synergistic antimicrobial properties of the essential oils and lignans found in the leaf extracts of S. radiatum and S. indicum. Phytochemical screening of methanolic extracts revealed the presence of phenolic compounds such as the potent antioxidants sesamol, sesamolin, and sesamin, as well as carboxylic acids. Methanolic and ethanolic extracts were shown to exhibit broad-spectrum antimicrobial effects against all of the pathogens tested except Streptococcus pneumoniae (methanolic extracts) and Staphylococcus aureus (ethanolic extracts). The investigators concluded that their results buttressed long-held traditional claims in multiple regions in Nigeria where consumption of sesame leaf extracts has been known to confer antibacterial effects with effectiveness reported for common skin infections.4
Anticancer activity
Kapadia et al. studied the dietary components resveratrol, sesamol, sesame oil, and sunflower oil in various protocols, including a murine two-stage skin cancer model, for their potential as cancer chemopreventive agents. In this 2002 study, the mouse skin tumor model, sesamol was found to provide a 50% reduction in skin papillomas at 20 weeks after promotion with 12-O-tetradecanoylphorbol 13-acetate. The researchers concluded that all of the dietary constituents appeared to provide chemopreventive effects.5
In 2010, Ramachandran et al. observed that pretreating human skin dermal fibroblast adult cells with sesamol before irradiation with UVB yielded significant reductions in cytotoxicity, intracellular reactive oxygen species levels, lipid peroxidation, and apoptosis. In noting increases in enzymatic and nonenzymatic antioxidant activity in sesamol-pretreated UVB-exposed fibroblasts, the investigators ascribed the apparent protective effects of sesamol to its antioxidant scavenging of reactive oxygen species.6
Seven years later, Bhardwaj et al. evaluated the chemopreventive efficacy of free and encapsulated sesamol in a 7,12-dimethylbenz[a]-anthracene–induced skin cancer animal model. The investigators found that in both forms sesamol significantly reduced tumor burden and lipid peroxidation while raising antioxidant levels. This resulted in the inhibition of skin tumor development and promotion. Apoptosis in tumor cells also was found to result from the down-regulation of Bcl-2 and stimulation of Bcl-2–associated X protein expression from administration of both free and encapsulated sesamol. Furthermore, the irritant qualities of sesamol were mitigated by encapsulation, which also aided in direct targeting of the skin.2
Potential cosmeceutical applications: Anti-aging and skin-whitening activity
In 2006, Sharma and Kaur demonstrated in mouse skin, through biochemical and histopathologic evaluations, that a topical sesamol formulation was effective in preventing photodamage (such as alterations in skin integrity, lesions, ulcers) from chronic UV exposure. They suggested the merits of further testing and consideration of sesamol as an antiaging agent.7
Almost a decade later, Srisayam et al. conducted a systematic study of the antimelanogenic and skin protective activities of sesamol. They found that sesamol exhibited significant scavenging activity of the 2,2-Diphenyl-1-picrylhydrazyl hydrate radical with an IC50 value less than 14.48 mcm. The antioxidant also suppressed lipid peroxidation (IC50 value of 6.15 mcm), and displayed a whitening effect via mushroom tyrosinase inhibition as well as inhibition of cellular tyrosinase. In noting the potent antioxidant and antityrosinase activity in comparison to the positive control – kojic acid and beta-arbutin – the researchers highlighted the potential cosmeceutical applications of sesamol.8
Baek and Lee showed in 2015 that sesamol potently suppressed melanin biosynthesis by down-regulating tyrosinase activity and regulating gene expression of melanogenesis-related proteins via microphthalmia-associated transcription factor (MITF) activity modulation. They concluded that sesamol warrants attention in the cosmetic realm as a new skin-whitening agent.9
Formulation issues
Earlier that year, Geetha et al. confirmed the apoptotic characteristics of sesamol in in vitro antiproliferative and DNA-fragmentation studies in HL60 cell lines. Because of its small size, low molecular weight, and easy permeability, its viability in topical applications is considered minimal. The investigators addressed this issue by preparing sesamol-loaded solid-lipid nanoparticles, which, when applied in a cream base in mice, revealed significant retention in the skin. Its use in in vivo anticancer studies performed on tumor production induced by 12-O-tetradecanoylphorbol 13-acetate and initiated by benzo(a)pyrene in mouse epidermis resulted in the normalization of skin cancers.10
More recently, Puglia et al. set out to improve the delivery of the benefits of sesamol to the skin by developing a nanostructured lipid carrier for topical administration. They synthesized two different carrier systems and performed an in vitro percutaneous absorption study in excised human skin to determine antioxidant activity. The carrier systems differed by oil phase: One contained Miglyol 812 (nanostructured lipid carrier–M) and the other contained sesame oil (nanostructured lipid carrier–PLUS). Greater encapsulation efficiency was reported when sesame oil was employed as the oil phase, but both products displayed the capacity in vitro to control the rate of sesamol diffusion through the skin, compared with reference preparations. Both formulations also showed the extended antioxidant activity of sesamol, particularly the nanostructured lipid carrier–PLUS.3
Conclusion

Dr. Baumann is a private practice dermatologist, researcher, author and entrepreneur who practices in Miami. She founded the Cosmetic Dermatology Center at the University of Miami in 1997. Dr. Baumann has written two textbooks: “Cosmetic Dermatology: Principles and Practice” (New York: McGraw-Hill, 2002) and “Cosmeceuticals and Cosmetic Ingredients” (New York: McGraw-Hill, 2014). She also wrote a New York Times Best Sellers book for consumers, “The Skin Type Solution” (New York: Bantam Dell, 2006). Dr. Baumann has received funding for advisory boards and/or clinical research trials from Allergan, Evolus, Galderma, and Revance. She is the founder and CEO of Skin Type Solutions Franchise Systems LLC.
References
1. Sato Y et al. Yakugaku Zasshi. 1991 Jan;111(1):51-8.
2. Bhardwaj R et al. Anticancer Agents Med Chem. 2017;17(5):726-33.
3. Puglia C et al. Planta Med. 2017 Mar;83(5):398-404.
4. Bankole MA et al. Afr J Tradit Complement Altern Med. 2007; 4(4): 427-33.
5. Kapadia GJ et al. Pharmacol Res. 2002 Jun;45(6):499-505.
6. Ramachandran S et al. Arch Dermatol Res. 2010 Dec;302(10):733-44.
7. Sharma S and Kaur IP. Int J Dermatol. 2006 Mar;45(3):200-8.
8. Srisayam M et al. J Cosmet Sci. 2014 Mar-Apr;65(2):69-79.
9. Baek SH and Lee SH. Exp Dermatol. 2015 Oct;24(10):761-6.
10. Geetha T et al. J Drug Target. 2015 Feb;23(2):159-69.
The protective effects of the antioxidative compound sesamol against radiation were reported as early as 1991.1 The water-soluble lignan sesamol, a natural phenolic compound derived from Sesamum indicum (sesame) seed oil, has since become known as a potent antioxidant with significant anticancer potential.2,3 As a constituent found in food oils such as sesame and sunflower oil, sesamol has been studied for the dietary benefits that it has been said to impart. Sesame oil, in particular, has been used in Ayurveda, traditional Chinese medicine, as well as in folk medicine in Nigeria and other African countries.Data on its antioxidant and chemopreventive properties also have prompted investigations into its potential in the dermatologic realm because sesamol has demonstrated an increasingly wide array of cutaneous applications.
Antibacterial effects
In 2007, Bankole et al. ascertained the synergistic antimicrobial properties of the essential oils and lignans found in the leaf extracts of S. radiatum and S. indicum. Phytochemical screening of methanolic extracts revealed the presence of phenolic compounds such as the potent antioxidants sesamol, sesamolin, and sesamin, as well as carboxylic acids. Methanolic and ethanolic extracts were shown to exhibit broad-spectrum antimicrobial effects against all of the pathogens tested except Streptococcus pneumoniae (methanolic extracts) and Staphylococcus aureus (ethanolic extracts). The investigators concluded that their results buttressed long-held traditional claims in multiple regions in Nigeria where consumption of sesame leaf extracts has been known to confer antibacterial effects with effectiveness reported for common skin infections.4
Anticancer activity
Kapadia et al. studied the dietary components resveratrol, sesamol, sesame oil, and sunflower oil in various protocols, including a murine two-stage skin cancer model, for their potential as cancer chemopreventive agents. In this 2002 study, the mouse skin tumor model, sesamol was found to provide a 50% reduction in skin papillomas at 20 weeks after promotion with 12-O-tetradecanoylphorbol 13-acetate. The researchers concluded that all of the dietary constituents appeared to provide chemopreventive effects.5
In 2010, Ramachandran et al. observed that pretreating human skin dermal fibroblast adult cells with sesamol before irradiation with UVB yielded significant reductions in cytotoxicity, intracellular reactive oxygen species levels, lipid peroxidation, and apoptosis. In noting increases in enzymatic and nonenzymatic antioxidant activity in sesamol-pretreated UVB-exposed fibroblasts, the investigators ascribed the apparent protective effects of sesamol to its antioxidant scavenging of reactive oxygen species.6
Seven years later, Bhardwaj et al. evaluated the chemopreventive efficacy of free and encapsulated sesamol in a 7,12-dimethylbenz[a]-anthracene–induced skin cancer animal model. The investigators found that in both forms sesamol significantly reduced tumor burden and lipid peroxidation while raising antioxidant levels. This resulted in the inhibition of skin tumor development and promotion. Apoptosis in tumor cells also was found to result from the down-regulation of Bcl-2 and stimulation of Bcl-2–associated X protein expression from administration of both free and encapsulated sesamol. Furthermore, the irritant qualities of sesamol were mitigated by encapsulation, which also aided in direct targeting of the skin.2
Potential cosmeceutical applications: Anti-aging and skin-whitening activity
In 2006, Sharma and Kaur demonstrated in mouse skin, through biochemical and histopathologic evaluations, that a topical sesamol formulation was effective in preventing photodamage (such as alterations in skin integrity, lesions, ulcers) from chronic UV exposure. They suggested the merits of further testing and consideration of sesamol as an antiaging agent.7
Almost a decade later, Srisayam et al. conducted a systematic study of the antimelanogenic and skin protective activities of sesamol. They found that sesamol exhibited significant scavenging activity of the 2,2-Diphenyl-1-picrylhydrazyl hydrate radical with an IC50 value less than 14.48 mcm. The antioxidant also suppressed lipid peroxidation (IC50 value of 6.15 mcm), and displayed a whitening effect via mushroom tyrosinase inhibition as well as inhibition of cellular tyrosinase. In noting the potent antioxidant and antityrosinase activity in comparison to the positive control – kojic acid and beta-arbutin – the researchers highlighted the potential cosmeceutical applications of sesamol.8
Baek and Lee showed in 2015 that sesamol potently suppressed melanin biosynthesis by down-regulating tyrosinase activity and regulating gene expression of melanogenesis-related proteins via microphthalmia-associated transcription factor (MITF) activity modulation. They concluded that sesamol warrants attention in the cosmetic realm as a new skin-whitening agent.9
Formulation issues
Earlier that year, Geetha et al. confirmed the apoptotic characteristics of sesamol in in vitro antiproliferative and DNA-fragmentation studies in HL60 cell lines. Because of its small size, low molecular weight, and easy permeability, its viability in topical applications is considered minimal. The investigators addressed this issue by preparing sesamol-loaded solid-lipid nanoparticles, which, when applied in a cream base in mice, revealed significant retention in the skin. Its use in in vivo anticancer studies performed on tumor production induced by 12-O-tetradecanoylphorbol 13-acetate and initiated by benzo(a)pyrene in mouse epidermis resulted in the normalization of skin cancers.10
More recently, Puglia et al. set out to improve the delivery of the benefits of sesamol to the skin by developing a nanostructured lipid carrier for topical administration. They synthesized two different carrier systems and performed an in vitro percutaneous absorption study in excised human skin to determine antioxidant activity. The carrier systems differed by oil phase: One contained Miglyol 812 (nanostructured lipid carrier–M) and the other contained sesame oil (nanostructured lipid carrier–PLUS). Greater encapsulation efficiency was reported when sesame oil was employed as the oil phase, but both products displayed the capacity in vitro to control the rate of sesamol diffusion through the skin, compared with reference preparations. Both formulations also showed the extended antioxidant activity of sesamol, particularly the nanostructured lipid carrier–PLUS.3
Conclusion
Dr. Baumann is a private practice dermatologist, researcher, author and entrepreneur who practices in Miami. She founded the Cosmetic Dermatology Center at the University of Miami in 1997. Dr. Baumann has written two textbooks: “Cosmetic Dermatology: Principles and Practice” (New York: McGraw-Hill, 2002) and “Cosmeceuticals and Cosmetic Ingredients” (New York: McGraw-Hill, 2014). She also wrote a New York Times Best Sellers book for consumers, “The Skin Type Solution” (New York: Bantam Dell, 2006). Dr. Baumann has received funding for advisory boards and/or clinical research trials from Allergan, Evolus, Galderma, and Revance. She is the founder and CEO of Skin Type Solutions Franchise Systems LLC.
References
1. Sato Y et al. Yakugaku Zasshi. 1991 Jan;111(1):51-8.
2. Bhardwaj R et al. Anticancer Agents Med Chem. 2017;17(5):726-33.
3. Puglia C et al. Planta Med. 2017 Mar;83(5):398-404.
4. Bankole MA et al. Afr J Tradit Complement Altern Med. 2007; 4(4): 427-33.
5. Kapadia GJ et al. Pharmacol Res. 2002 Jun;45(6):499-505.
6. Ramachandran S et al. Arch Dermatol Res. 2010 Dec;302(10):733-44.
7. Sharma S and Kaur IP. Int J Dermatol. 2006 Mar;45(3):200-8.
8. Srisayam M et al. J Cosmet Sci. 2014 Mar-Apr;65(2):69-79.
9. Baek SH and Lee SH. Exp Dermatol. 2015 Oct;24(10):761-6.
10. Geetha T et al. J Drug Target. 2015 Feb;23(2):159-69.

Scoring system quantified chances of HCV treatment benefit
A new scoring system predicted which patients with decompensated cirrhosis caused by hepatitis C virus (HCV) infection were most likely to experience meaningful benefits from direct-acting antiviral (DAA) therapy.
Dubbed BEA3, their scoring system assigns one point each for body mass index under 25 kg/m2, absence of encephalopathy, absence of ascites, ALT more than 1.5 times the upper limit of normal, and albumin above 3.5 g/dL. Patients who scored 4 or 5 were more than 50 times more likely to improve to Child-Pugh Turcotte (CPT) class A (compensated) cirrhosis with DAA therapy than were patients who scored 0 (hazard ratio, 52.3; 95% confidence interval, 15.2-179.7; P less than .001), wrote Omar El-Sherif, MB, BCh, of St. James’s Hospital, Dublin, together with his associates in the June issue of Gastroenterology.
Eradicating HCV does not necessarily improve the odds of transplant-free survival in the setting of decompensated cirrhosis, the researchers noted. Patients can end up in “MELD [Model for End-Stage Liver Disease] purgatory,” meaning they are still decompensated despite achieving sustained virologic response and improved MELD scores. Such patients can face longer waits for liver transplantation than if they had foregone DAA therapy. “There is an urgent need for data to refine our understanding of the reversibility of hepatic decompensation with viral eradication, and, ultimately, define the “point of no return,” the degree of liver dysfunction at which HCV therapy does not yield any meaningful clinical benefit, the researchers wrote.
Their study included 622 patients from the SOLAR-1, SOLAR-2, ASTRAL-4, and GS-US-334-0125 trials, which evaluated interferon-free sofosbuvir-based DAA therapy in patients with chronic hepatitis C virus infection and advanced liver disease. Patients received 12 or 24 weeks of therapy with ledipasvir, sofosbuvir, and ribavirin or velpatasvir, sofosbuvir, and/or ribavirin, or 48 weeks of treatment with sofosbuvir and ribavirin.
A total of 32% of patients with CPT class B cirrhosis improved to class A, as did 12% of patients with class C cirrhosis. Each factor in the scoring system independently affected the chances of reaching CPT class A cirrhosis, even after accounting for SVR.
Notably, patients with intermediate BEA3 scores of 1, 2, or 3 were significantly more likely to reach CPT class A cirrhosis than were patients with scores of 0, with hazard ratios ranging from 4.2 (for a score of 1) to 21.2 (for a score of 3). Most patients had scores of 0 (106 individuals), 1 (219 individuals), or 2 (180 individuals), and only 23 patients scored a 4 or a 5.
CPT score reflects prothrombin time, serum albumin and bilirubin, and the presence or severity of ascites. The investigators called the new scoring system “a tool that can enhance shared decision making at the point of care, quantifying the potential benefits of DAA therapy for patients with decompensated cirrhosis in the pretransplant setting.”Dr. El-Sherif disclosed ties to Gilead Sciences, Bristol-Myers Squibb, and the Health Research Board of Ireland. Four coinvestigators disclosed employment with Gilead, and several other coinvestigators disclosed ties to Gilead, BMS, AbbVie, and other companies.
SOURCE: El-Sherif O et al. Gastroenterology. 2018 Mar 10. doi: 10.1053/j.gastro.2018.03.022.
Patients with decompensated cirrhosis are now able to receive antiviral therapy without risk of worsening symptoms of decompensation. More clinics are able to offer DAA therapy to patients with hepatitis C, without the need for expertise in managing the side effects of interferon-based therapy.
The study by El-Sherif et al. summarizes well the benefits and potential pitfalls of treatment of hepatitis C in patients with decompensated cirrhosis. Their scoring system is largely intuitive and mirrors the traditional Child-Turcotte-Pugh score in that patients with low serum albumin, hepatic encephalopathy, and ascites are at risk of failing to improve clinically. Patients can have their hepatitis C successfully treated but can be trapped in “MELD purgatory,” a state of significant symptoms of liver disease, without the objective priority points necessary to be candidates for liver transplantation.
As experience is gained in the use of DAA medications for HCV, it is incumbent on physicians to gather knowledge that will further refine their understanding of which patients with signs of liver decompensation might benefit. It is also clear that patients with decompensated cirrhosis should be managed by clinicians who have experience in liver transplantation, to ensure that patients are counseled regarding not just the benefits, but potential risks of DAA therapy for hepatitis C.
Roman E. Perri, MD, is assistant professor of medicine, division of gastroenterology and hepatology, Medical Director for Liver Transplantion, Vanderbilt University, Nashville, Tenn. He has no conflicts of interest.
A new scoring system predicted which patients with decompensated cirrhosis caused by hepatitis C virus (HCV) infection were most likely to experience meaningful benefits from direct-acting antiviral (DAA) therapy.
Dubbed BEA3, their scoring system assigns one point each for body mass index under 25 kg/m2, absence of encephalopathy, absence of ascites, ALT more than 1.5 times the upper limit of normal, and albumin above 3.5 g/dL. Patients who scored 4 or 5 were more than 50 times more likely to improve to Child-Pugh Turcotte (CPT) class A (compensated) cirrhosis with DAA therapy than were patients who scored 0 (hazard ratio, 52.3; 95% confidence interval, 15.2-179.7; P less than .001), wrote Omar El-Sherif, MB, BCh, of St. James’s Hospital, Dublin, together with his associates in the June issue of Gastroenterology.
Eradicating HCV does not necessarily improve the odds of transplant-free survival in the setting of decompensated cirrhosis, the researchers noted. Patients can end up in “MELD [Model for End-Stage Liver Disease] purgatory,” meaning they are still decompensated despite achieving sustained virologic response and improved MELD scores. Such patients can face longer waits for liver transplantation than if they had foregone DAA therapy. “There is an urgent need for data to refine our understanding of the reversibility of hepatic decompensation with viral eradication, and, ultimately, define the “point of no return,” the degree of liver dysfunction at which HCV therapy does not yield any meaningful clinical benefit, the researchers wrote.
Their study included 622 patients from the SOLAR-1, SOLAR-2, ASTRAL-4, and GS-US-334-0125 trials, which evaluated interferon-free sofosbuvir-based DAA therapy in patients with chronic hepatitis C virus infection and advanced liver disease. Patients received 12 or 24 weeks of therapy with ledipasvir, sofosbuvir, and ribavirin or velpatasvir, sofosbuvir, and/or ribavirin, or 48 weeks of treatment with sofosbuvir and ribavirin.
A total of 32% of patients with CPT class B cirrhosis improved to class A, as did 12% of patients with class C cirrhosis. Each factor in the scoring system independently affected the chances of reaching CPT class A cirrhosis, even after accounting for SVR.
Notably, patients with intermediate BEA3 scores of 1, 2, or 3 were significantly more likely to reach CPT class A cirrhosis than were patients with scores of 0, with hazard ratios ranging from 4.2 (for a score of 1) to 21.2 (for a score of 3). Most patients had scores of 0 (106 individuals), 1 (219 individuals), or 2 (180 individuals), and only 23 patients scored a 4 or a 5.
CPT score reflects prothrombin time, serum albumin and bilirubin, and the presence or severity of ascites. The investigators called the new scoring system “a tool that can enhance shared decision making at the point of care, quantifying the potential benefits of DAA therapy for patients with decompensated cirrhosis in the pretransplant setting.”Dr. El-Sherif disclosed ties to Gilead Sciences, Bristol-Myers Squibb, and the Health Research Board of Ireland. Four coinvestigators disclosed employment with Gilead, and several other coinvestigators disclosed ties to Gilead, BMS, AbbVie, and other companies.
SOURCE: El-Sherif O et al. Gastroenterology. 2018 Mar 10. doi: 10.1053/j.gastro.2018.03.022.
FROM GASTROENTEROLOGY
June 2018 Digital Edition
Click here to access the June 2018 Digital Edition.
Table of Contents
- Setting and Method of Measurement Affect Blood Pressure Readings
- Workforce Assessment of VA Home-Based Primary Care Pharmacists
- Using Simulation to Enhance Care of Older Veterans
- Effect of High-Dose Ergocalciferol on Rate of Falls
- Vitreous Hemorrhage in the Setting of a Vascular Loop
- Nephrogenic Systemic Fibrosis in a Patient With Multiple Inflammatory Disorders
- C difficile Colitis in a Patient With Abdominal Complications
- The VA Cannot Be Privatized