User login
FDA approves new HPV assay
Manufacturer Becton Dickinson announced on Feb. 13 that it had received premarket approval from the U.S. Food and Drug Administration for a human papillomavirus (HPV) assay.
The Onclarity assay detects 14 types of high-risk HPV from specimens collected from cervical cancer screening via a SurePath liquid-based Pap test. It has previously been approved in Europe, Canada, and Japan. The bench-top molecular testing platform used for the assay has received prior FDA approval for chlamydia and gonorrhea infection testing.
The assay in particular identifies the HPV genotypes 16, 18, and 45, which are associated with more than two-thirds of cervical cancers and precancerous cervical lesions and as many as 94% of glandular cervical cancer cases.
Cutaneous multiple myeloma is a deadly indicator
Cutaneous involvement was present in less than 1.2% of patients with multiple myeloma (MM) and was associated with reduced overall survival, according to the results of a small, retrospective analysis.
Cutaneous manifestations of MM can be divided into nonspecific and specific lesions, according to according to Yu Ri Woo, MD, and colleagues at Yeouido St. Mary’s Hospital, the Catholic University of Korea, Seoul, South Korea.
Nonspecific cutaneous manifestations include amyloidosis, cryoglobulinemia, Raynaud’s phenomenon, xanthomas, pyoderma gangrenosum, and purpura, and were excluded from the study, while the specific cutaneous manifestation in MM was exemplified by secondary extramedullary plasmacytomas, seen as cutaneous waxy dome-shaped nodules with variable sizes in various locations. These were assessed in the study published in the Journal of the American Academy of Dermatology.
The medical records of 1,228 patients with MM seen at two institutions from Jan.1, 1996, to Dec. 31, 2016, were examined. Among these patients, 14 (1.14%) had specific cutaneous involvement of MM indicated, and their charts were evaluated further for their clinical and histopathologic findings.
There were no significant differences seen among patients in terms of age, sex, the presence of heavy or light chain disease, International Staging System stage, or albumin level.
Patients with cutaneous involvement showed significantly reduced overall survival, compared with patients without cutaneous involvement (median, 28 months vs. 57 months; hazard ratio, 1.9; 95% confidence interval, 1.0-3.6).
In a subgroup analyses of those patients who had MM with cutaneous involvement, the presence of erythematous nodules (P = .004), multiple cutaneous lesions (P = .002), and the absence of a grenz zone (P = .004) were associated with reduced overall survival.
Although the investigators found a relatively low incidence of cutaneous involvement in their database study, they pointed out that the exact incidence of cutaneous involvement in MM might be higher than expected.
“Many clinicians are less interested in the cutaneous lesions specifically,” they wrote, indicating that the original physicians may not have been looking for such lesions closely or reporting them if found. “Additional large sample prospective research is needed to determine the exact incidence of cutaneous involvement in MM.”
The investigators reported that they had no funding sources or conflicts of interest.
SOURCE: Woo YR et al. J Am Acad Dermatol 2018;78:471-8.
FROM JOURNAL OF THE AMERICAN ACADEMY OF DERMATOLOGY
Key clinical point:
Major finding: Patients with cutaneous involvement showed significantly reduced overall survival, compared with those without cutaneous involvement (median, 28 months vs. 57 months; HR, 1.9).
Study details: A retrospective study of 1,228 patients with multiple myeloma, of whom 14 patients had cutaneous involvement (1.14%).
Disclosures: The investigators reported that they had no funding sources or conflicts of interest.
Source: Woo YR et al. J Am Acad Dermatol. 2018;78:471-8.
Postcesarean SSI rate declines with care bundle*
DALLAS – A surgical site infection care bundle reduced the rate of surgical site infections (SSIs) after cesarean delivery by more than half, according to a case-control study examining data from more than 2,000 patients.
At the health center where the SSI bundle was implemented, rates per 1,000 women undergoing cesarean delivery fell from 2.44 to 1.10 (P = .013).
The study showed the effectiveness of implementing evidence-based and -supported recommendations, and of having standardized protocols with little variation, said Christina Davidson, MD, presenting the pre-post findings during a plenary session at the meeting sponsored by the Society for Maternal-Fetal Medicine.
The bundle of interventions was developed over the course of 3 months in late 2013 and early 2014 by a multidisciplinary task force, drawing from colorectal surgery literature about SSI prevention. Both nurses and physicians were on the task force, and representatives came from the departments of obstetrics and gynecology, anesthesia, and infection prevention, said Dr. Davidson of the Baylor College of Medicine, Houston. All inpatient and outpatient clinical care sites had representation.
After the bundle elements were identified, a full month was devoted to education and team training, with full bundle implementation occurring in April 2014. “Visual aids were placed in close proximity to the operating rooms,” said Dr. Davidson. For example, antimicrobial prophylaxis cards were placed on all anesthetic carts.
“A surgical checklist was placed in the chart for each patient undergoing cesarean delivery and compliance was tracked for the first 12 months of implementation,” said Dr. Davidson. Additionally, members of the care team received feedback in the form of quarterly reports on SSI rates and statistics about bundle compliance.
Care bundle elements included a set of instructions for pre- and postoperative antiseptic skin cleaning, wound care, and glycemic control in patients. Women were given chlorhexidine cleanser and asked to use it when showering the day before and the morning of surgery for planned deliveries. Forced warm-air blankets maintained patient normothermia in the preoperative holding area.
A group of intraoperative interventions included use of antiseptic skin and vaginal preparations, double-gloving, and having all scrubbed members of the surgical team change their outer gloves for fascial closure. A new instrument tray also was used for fascial closure. Prophylactic antibiotics were administered within 1 hour of skin incision, and doses were readministered based on the length of the procedure.
Postoperatively, said Dr. Davidson, “a set of insulin orders within the electronic medical record [was] used to maintain euglycemia in all diabetic patients.”
After the surgical dressing was removed on the 2nd postoperative day, patients were given a handout and education about wound control and infection prevention.
Finally, all patients received postdischarge follow-up calls from nurses within 72 hours after discharge.
Patient characteristics generally were similar before (n = 1,085) and after (n = 1,261) SSI bundle implementation. Body mass index was slightly higher in the postbundle group, and women in this group also were less likely to have had a prior cesarean delivery. There were no significant differences in age, gravidity, ethnicity, or race.
The study showed that with continued tracking, data-sharing, and reeducation efforts, “The SSI rate was sustained after bundle implementation,” said Dr. Davidson. The implementation team, working with hospital departments, was able to achieve a high compliance rate. And, she said, the effect size of the intervention was large enough to show significant reduction from an already low SSI rate.
However, Dr. Davidson also noted some limitations: All of the bundle elements were implemented simultaneously, so it wasn’t possible to tell which components had the greatest effect. Also, not all demographic data were available, and the type of SSI was sometimes unavailable from the deidentified data repository used for analysis, she said. “We weren’t able to tease out individual patient-level characteristics” about the timing and type of SSI in a patient-by-patient fashion, she said during discussion following her presentation.
All in all, she said, the bundle’s effectiveness “supports the synergistic effects of multiple strategies and the impact of a multidisciplinary team approach.”
The study authors reported no conflicts of interest.
SOURCE: Davidson C et al. Am J Obstet Gynecol. 2018 Jan;218:S46.
Correction, 3/5/18: An earlier version of this article omitted the word "rate" from the headline and Vitals section.
REPORTING FROM THE PREGNANCY MEETING
Key clinical point: The postcesarean surgical site infection rate dropped by more than half after a multicomponent care bundle was put in place.*
Major finding: SSIs patients went from 2.44 to 1.10/1,000 after the bundle was implemented (P = .013).
Study details: Case-control study of 1,085 women pre– and 1,261 women post–care bundle implementation.
Disclosures: The authors reported no conflicts of interest.
Source: Davidson C et al. Am J Obstet Gynecol. 2018 Jan;218:S46.
Short cervical length more common among black women, and more predictive of preterm birth
DALLAS – Black women are more than twice as likely as nonblacks to have a short cervix in midpregnancy – a finding that may bear some responsibility for their consistently higher rates of spontaneous preterm birth.
A large retrospective study of more than 16,500 women determined that having a cervical length of 20 mm or less was 2.6 times more common among black women than it was among women of other races or ethnicities, Katherine Bligard, MD, reported at the meeting sponsored by the Society for Maternal-Fetal Medicine. And no matter what the cervical length cutoff – from 20 mm or less all the way up to 25 mm – having a short cervix conferred a significantly higher risk of spontaneous preterm birth upon black women than it did upon the comparator groups.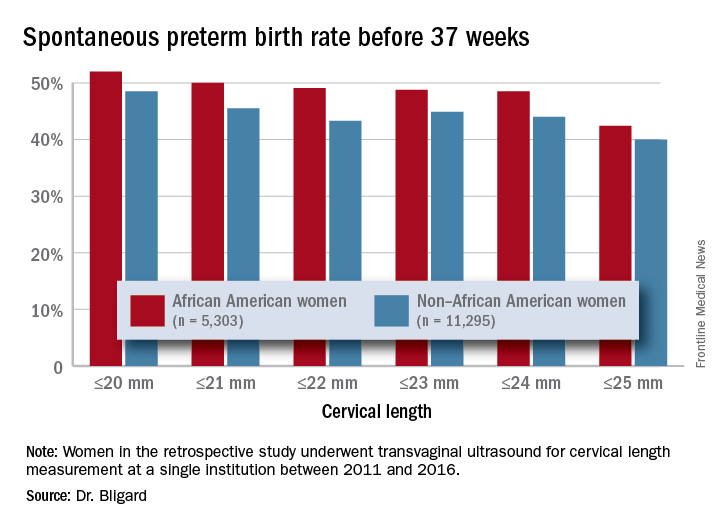
Dr. Bligard and her colleagues retrospectively examined the prevalence of short cervical length in a cohort of 16,598 women who underwent transvaginal ultrasound for cervical length measurement at a single institution between 2011 and 2016. Of these, 5,303 identified as black. These women were significantly younger than were the women who were not black (27 vs. 31 years, respectively) and were seen at a later gestational age (20.2 vs. 19.8 weeks). They were more likely to be smokers (10% vs. 5%), to be obese (40% vs. 25%), to be multiparous (70% vs. 65%), and to have a history of spontaneous preterm birth (6% vs. 3%).
The mean cervical length was significantly shorter in black women (40.3 vs. 41.1 mm). Significantly more had a cervical length of 25 mm or less (3% vs. 1.2%) or 20 mm or less (1.9% vs. 0.6%). After adjusting for gestational age at scan, tobacco use, and history of preterm birth, black women were twice as likely to have a cervical length of 25 mm or less and 2.6 times more likely to have one of 20 mm or less.
An area-under-the-curve analysis showed that shorter cervical length was significantly more predictive of spontaneous preterm birth for black women than it was for nonblack women (AUC, 0.66 vs. 0.62).
Dr. Bligard also looked at sensitivity and specificity for preterm birth at different gestational ages. At a 20 mm or less cutoff, cervical length in black women was just as specific for preterm birth occurring at less than 24 weeks, less than 28 weeks, less than 34 weeks, and less than 37 weeks (98%-99%), but it had a much higher sensitivity (44% vs. 26%, 36% vs. 23%, 26% vs.13%, and 12% vs. 5%, respectively).
The rate of preterm birth was higher for black women at every cervical length cutoff examined, Dr. Bligard noted.
The results should guide current therapy and inform future investigations, she suggested.
“Our data also suggest that race-based cervical length cutoffs may be beneficial in driving treatment, especially in light of the therapies that are available,” Dr. Bligard said. “Future studies should evaluate the efficacy of currently available therapies at a longer cervical length in African American women.”
Washington University sponsored the study, which was also funded by a training grant from the National Institutes of Health. Dr. Bligard had no financial disclosures.
SOURCE: Bligard K et al. Am J Obstet Gynecol. 2018;218:S62-3.
REPORTING FROM THE PREGNANCY MEETING
Key clinical point: Having a short cervix is more common among black women and more predictive of spontaneous preterm birth.
Major finding: Cervical length of 20 mm or less was 2.6 times more common among black women than it was women of other races or ethnicities.
Study details: The retrospective review comprised more than 16,500 women.
Disclosures: The study was sponsored by Washington University and the National Institutes of Health. Dr. Bligard had no financial disclosures.
Source: Bligard K et al. Am J Obstet Gynecol. 2018;218:S62-3.
Liver cancer deaths expected to increase again in 2018
Liver cancer mortality for 2018 is expected to be lowest in Utah and highest in Hawaii.
A total of 30,200 deaths from liver and intrahepatic bile duct cancer are predicted for the year in the United States by the American Cancer Society (ACS) in its Cancer Facts & Figures 2018, based on analysis of 2001-2015 data from the National Center for Health Statistics. That’s up from the 28,920 predicted by the ACS for 2017.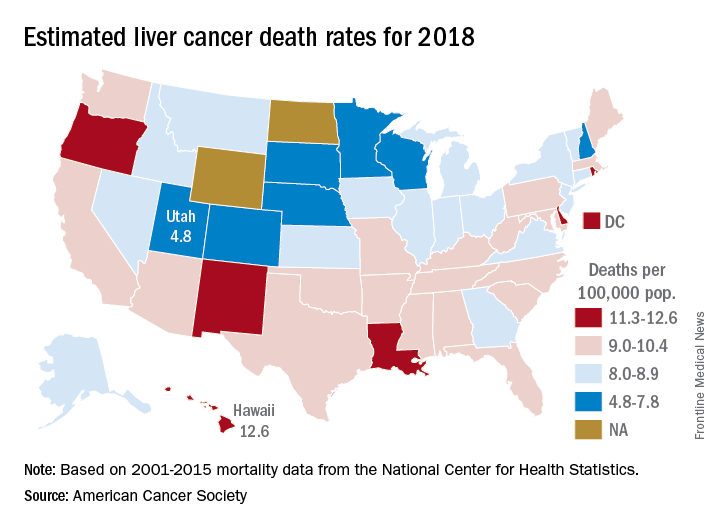
Mortality from liver cancer has been rising since the early 1980s, and in the last 10 years for which data are available (2006-2015), it increased by 2.5% per year. Over almost the same period (2005-2014), incidence rose by approximately 3% a year, and 42,220 new cases are expected in 2018, the ACS noted.
Over the most recent 5 years with available data (2011-2015), racial and ethnic disparities put American Indian/Alaska Natives at the highest mortality risk – 14.8 per 100,000 for men and 7.0 for women – followed by Asian/Pacific Islanders at 14.0 and 6.0, respectively. Non-Hispanic whites had the lowest rates: 8.2 for men and 3.4 for women, according to the ACS report.
Read more about the ACS’s research and estimates here.
Building a better U.S. health care system
Since 2010, when Democrats passed the Affordable Care Act – also known as Obamacare – without a single Republican vote, the GOP has vowed to repeal and replace it. With the election of Donald Trump in November 2016, Republicans gained control of the presidency and Congress and hoped to put Obamacare on the chopping block.

Although the Affordable Care Act’s (ACA’s) individual mandate was eliminated in the Tax Cuts and Jobs Act passed in late 2017, Republican leaders have been unable to secure the votes they need for a full repeal of Obamacare and a complete reboot of the American health care system. That may be, in part, because in the search for a better American health care system, there is no single right answer. In few places is that more clear than when making comparisons of health care systems across the world.
“Comparisons are fun, and everyone loves rankings,” said Ashish Jha, MD, MPH, a physician with the Harvard T.H. Chan School of Public Health and director of the Harvard Global Health Institute in Cambridge, Mass. Last fall Shah published an analysis on his personal blog comparing health care in the United States with that in seven high-income nations.1 It was prompted by a similar side-by-side comparison he participated in with other experts for the New York Times.2 “The most important part is we get to ask questions about things we care about, like ‘What do other countries do when they’re better than us?’ We’re not going to adopt any country’s model wholesale, but we can learn from them,” he said.
For instance, just 7.4% of people in Switzerland (according to data from the Organisation for Economic Cooperation and Development) skip medical tests, treatments, or follow-ups because of costs, compared with 21.3% in the United States. Meanwhile, the United States leads in innovation, producing 57% of new drugs (according to the Milken Institute), which is more than Switzerland’s 13% and Germany’s 6%.1
Although many Americans tend to think that health care in other developed nations is entirely single payer or government run, systems across Europe and the rest of the globe vary immensely in how they approach health care. One thing common among high-income nations, however, is some form of universal health care. In Canada, for example, the government funds health insurance for care delivered in the private sector. In Australia, public hospitals provide free inpatient care. In France, the Ministry of Health sets prices, budgets, and funding levels.2
“There are really two main purposes” when it comes to international comparisons, said Eric Schneider, MD, senior vice president for policy and research for the Commonwealth Fund. “The first is to understand how other countries perform, and the second is what lessons can we learn from the way care is financed, organized, and delivered in other nations and how we might import some of those ideas to the U.S. and improve policies here.”
The Affordable Care Act, Dr. Jha said, was something of the ultimate test for applying lessons learned in other countries and those put forward over the past decades in the United States by policy experts and leaders in health care thinking.
“The Affordable Care Act includes several ideas that are prevalent in other countries, particularly around how to expand insurance coverage and how to subsidize the poor so they can have good insurance coverage, too,” said Dr. Schneider. “The notion of essential health benefits, the mandate for insurance, the notion of subsidies, in some ways, these were all borrowed from abroad.”
For instance, health care in The Netherlands – which, like the United States, also relies on private health insurers – ranked among the highest of other high-income countries in the world in The Commonwealth Fund’s 2017 international comparison, published in July 2017.3 The Dutch have standardized their health benefits, reducing administrative burden for providers and making copayments more predictable for patients.
Dr. Schneider believes that the United States should continue to build on the progress of the Affordable Care Act – particularly since more than 20 million Americans have gained insurance coverage since the passage of the law (91% of Americans are insured today).4 And the ACA has renewed focus in the United States on improving and strengthening primary care and changing the incentives around care delivery.
Some Democrats and Republicans in Congress have started working on bipartisan solutions to solve some of the problems inherent in the ACA – or those engineered by those who oppose it.
That direction is, at least in part, a health care system with spending that continues to rank among the highest in the world.1,3 The United States spends more than 17% of its GDP on health care, compared with the 11.4% spent by Switzerland, which Jha ranked as having the best health care system among the high-income nations he evaluated.1Craig Garthwaite, a conservative health economist at Northwestern University’s Kellogg School of Management in Evanston, Ill., called the Swiss health care system a “better-functioning version of the Affordable Care Act” in the New York Times’ head-to-head debate.2
However, Dr. Lenchus noted that Switzerland’s system may not be scalable to a country the size of the United States. At 8.5 million people, Switzerland’s population is on par with that of New York City. The U.S. system must support more than 323 million people.
And international comparisons can be challenging for other reasons, as Dr. Jha wrote in a JAMA Viewpoint piece in August 2017 with coauthor Irene Papanicolas, PhD, of the London School of Economics, because they must account for the limitations of data, consider different values in national systems, and define the boundaries of the health system.5 For instance, Dr. Schneider said, some other high-income countries also invest more in housing, nutrition, and transportation than does the United States, which reduces the detrimental impact of social determinants of health, like poverty, poor nutrition, and homelessness.
Dr. Lenchus believes better health care in the United States hinges on more community-level investments and partnerships and on more focus on the social determinants of health. “To some degree, this country should be able to leverage the resources we have at a community level to improve the health of that community’s population,” he said. “Hospitalists are in a prime position to do that.”
Indeed, the Commonwealth Fund report concluded the United States excels on measures that involve the doctor-patient relationship – like end-of-life discussions and chronic disease management – and on preventive measures like screening mammography and adult influenza vaccination.
In a New England Journal of Medicine Perspective published in July 2017, Dr. Schneider and a coauthor outlined four strategies to improve health care in the United States, gleaned from comparisons abroad: ensure universal and adequate health insurance coverage, strengthen primary care, reduce administrative burden, and reduce income-related disparities.6
Regardless of how the United States goes about achieving a better health care system, Dr. Jha said we should stop the partisan rhetoric.
“Where I find a lot of consensus is we should have more competition and less monopoly,” he said. “Liberals and conservatives should be able to get together and say: We are really going to have competitive markets, and we should see the prices of health care services fall; we should see premiums come down, and it would make the coverage problem a lot easier to solve.”
References
1. Jha A. Judging health systems: focusing on what matters. An Ounce of Evidence. Published Sep 18, 2017. Last accessed Oct 19, 2017. https://blogs.sph.harvard.edu/ashish-jha/.
2. Carroll AE et al. The best health care system in the world: Which one would you pick? New York Times. Published Sep 18, 2017. Accessed Oct 19, 2017. https://www.nytimes.com/interactive/2017/09/18/upshot/best-health-care-system-country-bracket.html?action=click&contentCollection=upshot®ion=rank&module=package&version=highlights&contentPlacement=1&pgtype=sectionfront.
3. Schneider EC et al. Mirror, mirror 2017: International comparison reflects flaws and opportunities for better U.S. health care. The Commonwealth Fund. Published Jul 14, 2017. Accessed Oct 19, 2017. http://www.commonwealthfund.org/publications/fund-reports/2017/jul/mirror-mirror-international-comparisons-2017.
4. Martinez ME et al. Health insurance coverage: Early release of estimates from the national health interview survey, January-September 2016. Centers for Disease Control and Prevention, Division of Health Interview Statistics, National Center for Health Statistics. Published Feb, 2017. Accessed Oct 19, 2017. https://www.cdc.gov/nchs/data/nhis/earlyrelease/insur201702.pdf.
5. Papanicolas I et al. Challenges in international comparison of health care systems. JAMA. 2017 Aug 8;318(6):515-6. https://jamanetwork.com/journals/jama/article-abstract/2646461.
6. Schneider EC et al. From last to first – Could the U.S. health care system become the best in the world? N Engl J Med. 2017 Sep 7; 377(10):901-4.
Since 2010, when Democrats passed the Affordable Care Act – also known as Obamacare – without a single Republican vote, the GOP has vowed to repeal and replace it. With the election of Donald Trump in November 2016, Republicans gained control of the presidency and Congress and hoped to put Obamacare on the chopping block.
Although the Affordable Care Act’s (ACA’s) individual mandate was eliminated in the Tax Cuts and Jobs Act passed in late 2017, Republican leaders have been unable to secure the votes they need for a full repeal of Obamacare and a complete reboot of the American health care system. That may be, in part, because in the search for a better American health care system, there is no single right answer. In few places is that more clear than when making comparisons of health care systems across the world.
“Comparisons are fun, and everyone loves rankings,” said Ashish Jha, MD, MPH, a physician with the Harvard T.H. Chan School of Public Health and director of the Harvard Global Health Institute in Cambridge, Mass. Last fall Shah published an analysis on his personal blog comparing health care in the United States with that in seven high-income nations.1 It was prompted by a similar side-by-side comparison he participated in with other experts for the New York Times.2 “The most important part is we get to ask questions about things we care about, like ‘What do other countries do when they’re better than us?’ We’re not going to adopt any country’s model wholesale, but we can learn from them,” he said.
For instance, just 7.4% of people in Switzerland (according to data from the Organisation for Economic Cooperation and Development) skip medical tests, treatments, or follow-ups because of costs, compared with 21.3% in the United States. Meanwhile, the United States leads in innovation, producing 57% of new drugs (according to the Milken Institute), which is more than Switzerland’s 13% and Germany’s 6%.1
Although many Americans tend to think that health care in other developed nations is entirely single payer or government run, systems across Europe and the rest of the globe vary immensely in how they approach health care. One thing common among high-income nations, however, is some form of universal health care. In Canada, for example, the government funds health insurance for care delivered in the private sector. In Australia, public hospitals provide free inpatient care. In France, the Ministry of Health sets prices, budgets, and funding levels.2
“There are really two main purposes” when it comes to international comparisons, said Eric Schneider, MD, senior vice president for policy and research for the Commonwealth Fund. “The first is to understand how other countries perform, and the second is what lessons can we learn from the way care is financed, organized, and delivered in other nations and how we might import some of those ideas to the U.S. and improve policies here.”
The Affordable Care Act, Dr. Jha said, was something of the ultimate test for applying lessons learned in other countries and those put forward over the past decades in the United States by policy experts and leaders in health care thinking.
“The Affordable Care Act includes several ideas that are prevalent in other countries, particularly around how to expand insurance coverage and how to subsidize the poor so they can have good insurance coverage, too,” said Dr. Schneider. “The notion of essential health benefits, the mandate for insurance, the notion of subsidies, in some ways, these were all borrowed from abroad.”
For instance, health care in The Netherlands – which, like the United States, also relies on private health insurers – ranked among the highest of other high-income countries in the world in The Commonwealth Fund’s 2017 international comparison, published in July 2017.3 The Dutch have standardized their health benefits, reducing administrative burden for providers and making copayments more predictable for patients.
Dr. Schneider believes that the United States should continue to build on the progress of the Affordable Care Act – particularly since more than 20 million Americans have gained insurance coverage since the passage of the law (91% of Americans are insured today).4 And the ACA has renewed focus in the United States on improving and strengthening primary care and changing the incentives around care delivery.
Some Democrats and Republicans in Congress have started working on bipartisan solutions to solve some of the problems inherent in the ACA – or those engineered by those who oppose it.
That direction is, at least in part, a health care system with spending that continues to rank among the highest in the world.1,3 The United States spends more than 17% of its GDP on health care, compared with the 11.4% spent by Switzerland, which Jha ranked as having the best health care system among the high-income nations he evaluated.1Craig Garthwaite, a conservative health economist at Northwestern University’s Kellogg School of Management in Evanston, Ill., called the Swiss health care system a “better-functioning version of the Affordable Care Act” in the New York Times’ head-to-head debate.2
However, Dr. Lenchus noted that Switzerland’s system may not be scalable to a country the size of the United States. At 8.5 million people, Switzerland’s population is on par with that of New York City. The U.S. system must support more than 323 million people.
And international comparisons can be challenging for other reasons, as Dr. Jha wrote in a JAMA Viewpoint piece in August 2017 with coauthor Irene Papanicolas, PhD, of the London School of Economics, because they must account for the limitations of data, consider different values in national systems, and define the boundaries of the health system.5 For instance, Dr. Schneider said, some other high-income countries also invest more in housing, nutrition, and transportation than does the United States, which reduces the detrimental impact of social determinants of health, like poverty, poor nutrition, and homelessness.
Dr. Lenchus believes better health care in the United States hinges on more community-level investments and partnerships and on more focus on the social determinants of health. “To some degree, this country should be able to leverage the resources we have at a community level to improve the health of that community’s population,” he said. “Hospitalists are in a prime position to do that.”
Indeed, the Commonwealth Fund report concluded the United States excels on measures that involve the doctor-patient relationship – like end-of-life discussions and chronic disease management – and on preventive measures like screening mammography and adult influenza vaccination.
In a New England Journal of Medicine Perspective published in July 2017, Dr. Schneider and a coauthor outlined four strategies to improve health care in the United States, gleaned from comparisons abroad: ensure universal and adequate health insurance coverage, strengthen primary care, reduce administrative burden, and reduce income-related disparities.6
Regardless of how the United States goes about achieving a better health care system, Dr. Jha said we should stop the partisan rhetoric.
“Where I find a lot of consensus is we should have more competition and less monopoly,” he said. “Liberals and conservatives should be able to get together and say: We are really going to have competitive markets, and we should see the prices of health care services fall; we should see premiums come down, and it would make the coverage problem a lot easier to solve.”
References
1. Jha A. Judging health systems: focusing on what matters. An Ounce of Evidence. Published Sep 18, 2017. Last accessed Oct 19, 2017. https://blogs.sph.harvard.edu/ashish-jha/.
2. Carroll AE et al. The best health care system in the world: Which one would you pick? New York Times. Published Sep 18, 2017. Accessed Oct 19, 2017. https://www.nytimes.com/interactive/2017/09/18/upshot/best-health-care-system-country-bracket.html?action=click&contentCollection=upshot®ion=rank&module=package&version=highlights&contentPlacement=1&pgtype=sectionfront.
3. Schneider EC et al. Mirror, mirror 2017: International comparison reflects flaws and opportunities for better U.S. health care. The Commonwealth Fund. Published Jul 14, 2017. Accessed Oct 19, 2017. http://www.commonwealthfund.org/publications/fund-reports/2017/jul/mirror-mirror-international-comparisons-2017.
4. Martinez ME et al. Health insurance coverage: Early release of estimates from the national health interview survey, January-September 2016. Centers for Disease Control and Prevention, Division of Health Interview Statistics, National Center for Health Statistics. Published Feb, 2017. Accessed Oct 19, 2017. https://www.cdc.gov/nchs/data/nhis/earlyrelease/insur201702.pdf.
5. Papanicolas I et al. Challenges in international comparison of health care systems. JAMA. 2017 Aug 8;318(6):515-6. https://jamanetwork.com/journals/jama/article-abstract/2646461.
6. Schneider EC et al. From last to first – Could the U.S. health care system become the best in the world? N Engl J Med. 2017 Sep 7; 377(10):901-4.
JAK inhibitors for RA: Is VTE risk overblown?
MAUI, HAWAII – Rheumatologists, regulatory agencies, and the pharmaceutical industry all have gone off the deep end in their fretting over what appears to be a low rate of venous thromboembolic events in the major randomized trials of the oral Janus kinase inhibitors for RA, Mark C. Genovese, MD, asserted at the 2018 Rheumatology Winter Clinical Symposium.
“The reality is all of our drugs pose potential risks. Unfortunately, I think that at least for the moment, the field has turned all attention in one direction: VTE [venous thromboembolic] events. I suspect there’s some truth [to the possible associated risk]. Certainly we are seeing these events. The question is, how overdone is this?” according to Dr. Genovese, professor of medicine and cochief of the division of immunology and rheumatology at Stanford (Calif.) University.
“I think the upadacitinib data has been entirely overshadowed by concerns about VTEs,” he said. “In the last year, we saw three significant phase 3 studies on upadacitinib arrive in the rheumatology community, and I think the only thing we talked about was VTEs.”
All parties interested in developing Janus kinase (JAK) inhibitors for the treatment of RA began to freak out about a possible increase in VTEs when in April 2017 the Food and Drug Administration turned down Eli Lilly and Incyte’s initial application for marketing approval of the JAK inhibitor baricitinib. Among the problems the agency cited was evidence of potential thrombotic risk.
The VTE rate in baricitinib clinical trials up to 48 weeks in duration was 0.53 events/100 patient-years, with no significant difference in risk between the2-mg and 4-mg doses. This appears to be a class effect for the oral JAK inhibitors, as low rates of VTE, albeit numerically higher than in placebo-treated controls, have also been recorded in the RA development programs for tofacitinib (Xeljanz) as well as the investigational agents filgotinib and upadacitinib, the rheumatologist noted.
This begs the question of whether these VTE rates are significantly higher than background rates in patients with RA or other rheumatologic diseases, which are known to be elevated relative to the general population. Indeed, a retrospective study of insurance claims data by investigators at Brigham and Women’s Hospital, Boston, concluded that the VTE rate in RA patients was 0.61 events/100 patient-years, 120% greater than in a matched patient population without RA. After fully adjusting for comorbid conditions and demographics, the relative risk increase associated with RA dropped to 40%, still significantly higher than in controls (Arthritis Care Res [Hoboken]. 2013 Oct;65[10]:1600-7).
Similarly, Canadian investigators conducted a meta-analysis of 25 studies with VTE data in patients with RA, systemic lupus erythematosus, Sjögren’s syndrome, systemic sclerosis, or inflammatory myositis. This meta-analysis included 10 studies of more than 5.2 million RA patients and nearly 900,000 controls. The conclusion: each of these rheumatic diseases was associated with a VTE rate more than three times higher than in the general population (Arthritis Res Ther. 2014 Sep 25;16[5]:435).
“Patients with RA are at higher risk for VTE than those without RA. It’s unfortunate, and it’s certainly something I don’t think many of us have thought much about before. It’s something we don’t often get to see and something we don’t like to think about,” the rheumatologist observed.
Dr. Genovese admitted to a degree of personal frustration with the current tunnel vision focus on VTEs in JAK inhibitor trials. At the 2017 annual meeting of the American College of Rheumatology he presented the results of the phase 3 SELECT-BEYOND study in which 499 RA patients who had previously failed to respond or were intolerant to biologic therapy were randomized to once daily upadacitinib at 15 or 30 mg or placebo on top of background methotrexate. At week 12, the ACR 20 response rate was 65% for upadacitinib at 15 mg, 56% at 30 mg, and 28% in placebo-treated controls.
“That’s almost a 40% placebo-adjusted response rate. In fact, it’s the highest response I’ve ever seen in a biologic inadequate-responder population. This really looked pretty good, but I don’t think anyone ever took notice. Why not? Because we were all worried about VTE,” he said.
There were in fact a handful of VTEs in upadacitinib-treated patients, Dr. Genovese was quick to note. But he was more impressed by the week 12 ACR 20 responses in patients who had previously failed on three or more biologics: 71% with upadacitinib at 15 mg and 50% at 30 mg, compared with 23% in controls. Moreover, among patients with a baseline history of failure to respond to anti–interleukin-6 therapy, the week 12 ACR 20 rate was 56% with upadacitinib at 15 mg and 58% at 30 mg, versus 20% in controls.
“This looks like a pretty effective drug for patients who’ve failed everything else in our practice,” he commented.
Dr. Genovese reminded his audience that the rheumatology community has a history of overreacting to safety signals in the early days after introduction of new therapies. Examples: tuberculosis with tumor necrosis factor inhibitors, lymphoma with abatacept (Orencia), lymphoma with anti–tumor necrosis factor agents, and cardiovascular events with anti–interleukin-6 inhibition.
“PML [progressive multifocal leukoencephalopathy] is a breathtaking side effect with rituximab [Rituxan], but we’ve gotten over that. We recognize that it’s a potential problem, but we still prescribe rituximab,” the rheumatologist noted. “We’re probably going to need to address the issue of which of our patients are potentially at higher risk for VTE, and maybe we avoid this class in those patients. Like we now do as we look at patients we think are at increased risk for infection, or multiple sclerosis, or TB, we may also need to think of VTE risk.”
But , he argued. There is a pressing unmet need for new therapies for RA with novel mechanisms of action. Only about one-half of patients on contemporary biologic therapies are still on that agent 5 years after initiating therapy.
“Virtually all our patients are partial responders. Everybody gets some benefit. But true remission is achieved by only a minority,” Dr. Genovese said. “The gap between where we are and where we want to be is actually much greater than we often perceive.”
He reported having financial relationships with AbbVie, which is developing upadacitinib, and more than a dozen other medical companies.
EXPERT ANALYSIS FROM RWCS 2018
Monitoring Laser Tx with Changes in Mammillary Body Volume
Measuring mammillary body volume among patients with mesial temporal lobe epilepsy after laser interstitial thermal therapy may help determine how effective the ablative procedure is, according to a recent study published in Epilepsy Research.
- Investigators reviewed pre- and post-laser interstitial thermal therapy data with the help of magnetic resonance imaging, looking at the axial and coronal planes.
- Patient demographics, clinical semiology, and localization of seizures were considered.
- From 2012 to 2015, 20 patients were available for complete analysis, of which 13 were found to be free of seizures at the end of one year.
- Among patients who remained free of seizures, ipsilaterial mammillary body volume dropped by 34.6% on average, compared to 8.4% in patients who continued to have seizures after laser treatment, suggesting that mammillary body volume may be a useful marker to evaluate the benefits of ablation.
Grewala SS, Guptab V, Vibhute P, Shih JJ, Tatum WO, Wharen RE. Mammillary body changes and seizure outcome after laser interstitial thermal therapy of the mesial temporal lobe. Epilepsy Res. 2018;141:19-22.
Perivascular Spaces May Offer Epilepsy Clues
Differences in the perivascular spaces in the brain may serve as a biomarker for patients with epilepsy, assisting clinicians in determining the impact of the disorder, according to a comparison of MRI images from healthy controls and patients.
- Researchers used 7T magnetic resonance imaging to evaluate the brains of 21 patients with epilepsy and 17 healthy controls.
- Perivascular spaces were marked with the use of Osirix image analysis software.
- Investigators calculated the asymmetry index for each region of the brain and reported a maximum asymmetry index for patients and controls.
- Significant differences were found in the maximum asymmetry index between patients with epilepsy and controls (P=.016).
- In nearly 3 of 4 patients (72%), the area or lobe of the brain that displayed the maximum perivascular space asymmetry was also the area that contained the suspected area for the onset of seizures.
Feldman RE, Rutland JW, Fields MC, et al. Quantification of perivascular spaces at 7T: A potential MRI biomarker for epilepsy. Seizure. 2018;54:11-18.
Study pinpoints link between ERAS and acute kidney injury
JACKSONVILLE, FLA. – Surgeons at the University of Alabama at Birmingham embraced the enhanced recovery pathway for elective colorectal surgery, but after they initiated the program, they noted high rates of postoperative acute kidney injury. They set about tweaking their approach to bring their results into line with national averages, according to a report presented at the Association for Academic Surgery/Society of University Surgeons Academic Surgical Congress.
Their response is an example of how surgery departments can use American College of Surgeons National Surgical Quality Improvement Program (ACS NSQIP) data to monitor and improve their outcomes.
The rate of acute kidney injury (AKI) before ERAS was 7.1% ,compared with 13.6% after ERAS (P less than .01). After researchers adjusted for significant covariates, “ERAS patients were 2.3 times more likely to develop postoperative acute kidney injury,” Mr. Wiener said (P less than .01). That led the researchers to conclude that the ERAS protocol was independently associated with AKI following colorectal surgery. Average hospital stays for the ERAS group were less than half of those for the non-ERAS group, Wiener said: 3 days for the former vs. 7 days for the latter (P less than .01).
He noted that when UAB implemented ERAS for colorectal surgery, it also adopted the PDSA – Plan, Do, Study, Act – a cyclical quality improvement tool. “So we had done the study,” he said. “How do we act?”
Further investigation revealed the surgeons were using a stacked dosing of ketorolac with one dose at the end of the case and the next dose with initiation of the postoperative order set. “We eliminated the last intraoperative ketorolac dose to avoid the stacked dosing,” Wiener said. “Furthermore, we educated our residents to use ERAS as a guideline, but to always remember to treat the patient individually first.”
After that change, the subsequent semiannual ACS NSQIP report showed that UAB’s outcomes had improved. “We were able to go from the 10th decile for kidney failure after colorectal surgery to the first decile,” Wiener said.
“Moving forward, we will continue to monitor protocol outcomes in our ERAS patients and customize a pathway based on individual preoperative risk,” he said. That includes identifying optimal perioperative IV fluid management and refining multimodal pain management.
Mr. Wiener and coauthors had no financial relationships to disclose.
SOURCE: Wiener JG et al. Abstract 76.03
REPORTING FROM THE ACADEMIC SURGICAL CONGRESS
Key clinical point: Implementation of the ERAS protocol for colorectal surgery was independently associated with acute kidney injury.
Major finding: After elective colorectal surgery, 13.6% of those in the ERAS protocol had acute kidney failure vs. 7.1 % of those who had surgery preprotocol (P less than .01).
Study details: Single-institution retrospective study of a prospectively maintained database containing 480 patients in the pre-ERAS group and 572 in the ERAS group.
Disclosures: The investigators reported having no financial disclosures.
Source: Wiener JG et al. Abstract 76.03.