User login
Journal of Hospital Medicine – Jan. 2018
BACKGROUND: Hospital charges and lengths of stay may be greater when adults with chronic conditions are admitted to children’s hospitals. Despite multiple efforts to improve pediatric-adult health care transitions, little guidance exists for transitioning inpatient care.
OBJECTIVE: This study sought to characterize pediatric-adult inpatient care transitions across general pediatric services at U.S. children’s hospitals.
DESIGN and SETTING: National survey of inpatient general pediatric service leaders at U.S. children’s hospitals from January 2016 to July 2016.
MEASUREMENT: Questionnaires assessed institutional characteristics, presence of inpatient transition initiatives (having a specific process and/or leader), and 22 inpatient transition activities. Scales of highly correlated activities were created using exploratory factor analysis. Logistic regression identified associations among institutional characteristics, transition activities, and presence of an inpatient transition initiative.
RESULTS: Of 195 children’s hospitals, 96 responded (49.2% response rate). Transition initiatives were present at 38% of children’s hospitals, more often where there were providers who were trained in both internal medicine and pediatrics or where there were outpatient transition processes. Specific activities were infrequent and varied widely from 2.1% (systems to track youth in transition) to 40.5% (addressing potential insurance problems). Institutions with initiatives more often consistently performed the majority of activities, including using checklists and creating patient-centered transition care plans. Of remaining activities, half involved transition planning, the essential step between readiness and transfer.
CONCLUSION: Relatively few inpatient general pediatric services at U.S. children’s hospitals have leaders or dedicated processes to shepherd transitions to adult-oriented inpatient care. Across institutions, there is wide variability in performance of activities to facilitate this transition. Feasible process and outcome measures are needed.
Also in JHM this month
Characterizing hospitalist practice and perceptions of critical care delivery
AUTHORS: Joseph R. Sweigart, MD, FACP, FHM; David Aymond, MD; Alfred Burger, MD, FACP, SFHM; Andy Kelly, MAS, MS; Nick Marzano, Med; Thomas McIlraith, MD, SFHM; Peter Morris, MD; Mark V. Williams, MD, FACP, MHM; and Eric M. Siegal, MD, SFHM, FCCM
Clinical decision making: Observing the smartphone user an observational study in predicting acute surgical patients’ suitability for discharge
AUTHORS: Richard Hoffmann, MBBS; Simon Harley, MBBS; Samuel Ellison, MBBS; and Peter G. Devitt, MBBS, FRACS
Isotretinoin and shea butter
It took Jared till the end of his third month on isotretinoin to tell me he was two-timing me with another skin doctor.
“She calls herself a cosmetic dermatologist,” he said, naming a nearby practitioner I didn’t know. “She formulates special skin care products tailored to my particular skin. The one she came up with for me is based on shea butter, and it feels great.”
I am always amazed at people’s capacity to believe that there is a unique regimen just right for them, preferably one specially formulated by an expert who is privy to a secret no one else knows. Shea butter, it turns out, comes from the African shea tree (Ugandan trees are best). Africans eat the shea nuts; Westerners smear on ground-up nut contents.
Nut of shea. Tree of tea. Eye of newt. Toe of frog. The list goes on.
But I digress.
That didn’t seem very nice of her. I hadn’t murmured about her moisturizer, had I?
“What did she object to?” I asked. “Did her patients have problems with it?”
“She just said the drug is very bad,” said Jared. “She doesn’t like it at all. I was a little taken aback. I wasn’t expecting her to object so strongly.”
“But you’re still OK with taking isotretinoin?” I asked.
“Oh, yes,” said Jared. “It seems to be working, and I trust you.”
That was good to hear. I wondered whether Jared’s trust was based on the rigor of my scientific background or on my kindly smile and reassuring beard.
“Thank you, Jared,” I said. “I like isotretinoin a lot. It’s not for everybody, but for the last 35 years, I’ve seen it do excellent things for the appearance and self-image of many people.”
When I teach medical students, I often emphasize, as a point of professional etiquette, the impropriety of snorting or rolling your eyes at what patients report that other colleagues said and did. First of all, patient accounts may be imprecise or colored by their wish to build you up and flatter themselves for picking you. Second, just imagine what they might say about you at the next office they visit.
Reputation aside (you can hire folks to buff yours, if you like), my little exchange with Jared points up a basic difference between the way doctors think and the way our patients do.
What’s behind doctors’ professional lives is our assumption that diseases exist outside the bodies that the diseases inhabit. We therefore can offer a “treatment of choice” (or maybe a couple of them) that is best for treating a disease, regardless of who has it. This assumption is so obvious that we rarely think about it.
Obvious to us, that is, but not to our patients, to whom every patient has (to a large if not exclusive extent) his or her own disease. If possible, every patient wants a treatment tailored to each person’s unique makeup and predicament.
Jared is far from alone in playing both ends at the same time. From me he gets universal, evidence-based truths. From his other (more jealous!) medical mistress, he gets a skin care regimen tailored lovingly just for him.
Test your unique genes, get the treatment tailored just for you. Some rigorous scientists are trying not to so much debunk this effort as to point out how its promise is massively overhyped and unlikely to be worthy of the massive research investment it attracts. Perhaps their rigorous rationality will bear fruit, but they’re up against not just vested medical/industrial/venture capital interests, but the expectations of sick people who have always known that there is – that there simply has to be – a treatment out there that’s just for them.
Mock if you must, but tell me this: If people can prosper marketing a moisturizer called Kiss My Face or rake in the bucks with a skin care line named Urban Decay, then what’s your problem with Eye of Newt? You want focus groups?
Crowdfunding, anyone?
Dr. Rockoff practices dermatology in Brookline, Mass., and is a longtime contributor to Dermatology News. He serves on the clinical faculty at Tufts University, Boston, and has taught senior medical students and other trainees for 30 years. His second book, “Act Like a Doctor, Think Like a Patient,” is available at amazon.com and barnesandnoble.com. Write to him at dermnews@frontlinemedcom.com.
Doctors to Congress: Keep Part B drug payments out of MIPS adjustment
Physician specialists are calling on Congress to isolate Medicare Part B drug reimbursements from payment adjustments under the Merit-Based Incentive Payment System (MIPS).
A coalition of medical societies, large group practices, and patient advocacy groups has asked for an “intervention this year with a technical correction that ensures the [MIPS] score adjustment is not applied to Part B drug payments,” according to Jan. 18 letter sent to the leaders of the Senate Finance Committee, House Energy and Commerce Committee, and the House Ways and Means Committee. “Since the 2018 MIPS year has begun, it is imperative that Congress acts quickly to ensure that patient access to critical treatments is not negatively impacted.”
Under MIPS, physicians are scored based on their performance across three categories: quality, improvement activities, and advancing care information. A fourth category, cost, is planned but not yet included in the score. Medicare payments, which currently include Part B drug reimbursements, are subject to bonuses and penalties based on performance scores.
In their November 2017 update to the Quality Payment Program, which includes MIPS, officials at the Centers for Medicare & Medicaid Services said they would be moving forward with including Part B drug payments in the MIPS adjustment.
“This application of the adjustment ... is a significant departure from current policy and would disproportionately affect certain specialties,” according to the coalition’s letter.
Certain specialties, including rheumatology, oncology, and ophthalmology, have more to lose under the current policy because these specialists administer more Part B drugs than other specialists, according to health care consultancy Avalere Health.
“Certain specialists administer more Part B drugs than others and, therefore, may be exposed to significant financial risk and payment swings year-over-year under the CMS [Centers for Medicare & Medicaid Services] proposal,” John Feore, director at Avalere, said in a statement.
In 2018, physicians in those specialties could see drug payments increase or decrease by as much as 16%, according to Avalere research.
The policy likely will have an even greater effect on smaller practices and those in rural settings and could lead to access issues, according to the coalition letter.
“Some patients already face access challenges because the budget sequester has eroded reimbursements to physicians, and this policy would exacerbate these problems,” the letter states. “Patients would be left with fewer locations where they could receive care, resulting in less access and higher costs. A growing number of patients would then have to seek care in a hospital, which would result in higher out-of-pocket expenses and, particularly in rural communities, may require traveling longer distances to receive care.”
Predicting MDR Gram-negative infection mortality risk
Source control, defined as location and elimination of the source of the infection, was critical for patient survival in the case of multidrug resistant bacterial infection, according to the results of a case-control study of 62 critically ill surgical patients who were assessed between 2011 and 2014.
Researchers examined the characteristics of infected patients surviving to hospital discharge compared with those of nonsurvivors to look for predictive factors. Demographically, patients had an overall mean age of 62 years; 30.6% were women; 69.4% were white. The first culture obtained during a surgical ICU admission that grew a carbapenem-resistant Enterobacteriaceae (CRE), MDR Pseudomonas aeruginosa, or MDR Acinetobacter spp. was defined as the index culture.
“In this study, 33.9% [21/62] of critically ill surgical patients with a culture positive for MDR Gram-negative bacteria died prior to hospital discharge,” according to Andrew S. Jarrell, PharmD, of the Johns Hopkins Hospital, Baltimore, and his colleagues.
With multivariate logistic regression, achievement of source control was the only variable associated with decreased in-hospital mortality (odds ratio 0.04, 95% confidence interval, 0.003-0.52); P = .01).
“Source control status was predictive of in-hospital mortality after controlling for other factors. Specifically, the odds of in-hospital mortality were 97% lower when source control was achieved as compared to when source control was not achieved,” the authors stated (J Crit Care. 2018;43:321-6).
Scenarios in which source control was not applicable (pneumonia and urinary tract infection) were also similarly distributed between survivors and nonsurvivors, they reported.
Other than source control, the only significant risk factors for mortality, as seen in univariate analysis, all occurred prior to index culture. They were: vasopressor use (46.3% of survivors, vs. 76.2% of nonsurvivors, P = .03); mechanical ventilation (63.4% vs. 100%, P = .001); and median ICU length of stay (10 days vs. 18 days, P = .001).
“Achievement of source control stands out as a critical factor for patient survival. Clinicians should take this, along with prior ICU LOS, vasopressor use, and mechanical ventilation status, into consideration when evaluating patient prognosis,” Dr. Jarrell and his colleagues concluded.
The authors reported that they had no conflicts or source of funding.
Source: Jarrell, A.S., et al. J Crit Care. 2018;43:321-6.
FROM THE JOURNAL OF CRITICAL CARE
Key clinical point: Source control was the most important predictor of MDR Gram-negative infection mortality in hospitalized patients.
Major finding: The odds of in-hospital mortality were 97% lower when source control was achieved.
Study details: Case-control study of 62 critically ill surgical patients from 2011 to 2014 who had an MDR infection.
Disclosures: The authors reported that they had no conflicts or source of funding.
Source: Jarrell, A.S., et al. J Crit Care. 2018;43:321-6.
Greater gynecological but not medical risks with hysteroscopic sterilization
Hysteroscopic sterilization is associated with a significantly greater risk of gynecological complications but not medical or surgical complications, compared with laparoscopic sterilization, according to data from a French nationwide cohort study.
In a report published Jan. 23 in JAMA, researchers conducted a study of 105,357 women – 71,303 (67.7%) of whom underwent hysteroscopic sterilization, and 34,054 (32.3%) of whom underwent laparoscopic sterilization – and who were followed for at least 1 year after the procedure.
Women who had the hysteroscopic procedure had a nearly threefold higher risk of tubal disorder or surgery, a sevenfold higher risk of sterilization failure, and a 25-fold higher risk of undergoing a second sterilization procedure at 1 year compared with those who had the laparoscopic procedure (P less than .001 for each). These risk increases persisted even at 3 years after the procedure (hazard ratios of 1.79, 4.66, and 16.63, respectively; 95% confidence interval for each).
“A second sterilization procedure following hysteroscopic sterilization is a well-identified risk already described in phase 2 and 3 studies, in which the risk varied between 4.0% and 4.5%,” wrote Kim Bouillon, MD, PhD, of the French National Agency for Medicines and Health Products Safety, and her coauthors.
“In the present study, this risk was 4.1% at the 1-year follow-up, comparable with that reported in previous studies conducted in real-life conditions in patients who received care in public or private hospitals, and much higher than after laparoscopic sterilization.”
However, hysteroscopic sterilization was associated with a significantly reduced risk of surgical complications, compared with laparoscopic sterilization (adjusted odds ratio, 0.18; 95% CI, 0.14-0.23). The overall rate of in-hospital surgical complications was 0.13% with the hysteroscopic procedure and 0.78% with the laparoscopic procedure. Medical complications occurred in 0.06% of hysteroscopic procedures and 0.11% of laparoscopic procedures.
Women who underwent hysteroscopic procedures also had a significantly lower risk of uterine disorders (adjusted HR, 0.85; 95% CI, 0.74-0.98), uterine bleeding, and hysterectomies at 1 year, after adjustment for known hysterectomy risk factors.
The researchers noted that in absolute terms, the differences in the risk of procedural complications were very small, compared with the differences in the risk of gynecological complications.
The risk of pregnancy was significantly lower in the hysteroscopic group, compared with the laparoscopic group at 1 year after the procedure, but by 3 years’ follow-up, the difference was no longer significant.
There were no significant differences seen in the risk of medical complications such as autoimmune disease and thyroid disorders, attempted suicide, or death between the two procedures. Women who underwent hysteroscopic sterilization had a slightly lower use of analgesics, antidepressants, and benzodiazepines at 1 year that was more pronounced by 3 years.
There was a significantly higher risk of allergic reaction seen with hysteroscopic sterilization among women with prior allergies, but the authors suggested that a null overall effect and large number of tested interactions made the finding “hypothesis-generating” only.
The study was prompted by safety concerns about hysteroscopic sterilization, with the Food and Drug Administration in 2015 receiving a large number of reports of adverse events including bleeding, pelvic pain, fallopian tube perforation, unwanted pregnancy, hysterectomies, depression, and allergic reactions.
The FDA has since ordered the device manufacturer to undertake an open-label, nonrandomized study comparing outcomes between hysteroscopic and laparoscopic sterilization, which is expected to deliver results in 2023.
“To our knowledge, this is the first study aiming at comparing medical outcomes in addition to gynecological outcomes between hysteroscopic and laparoscopic sterilization,” the authors wrote, referring to their own work. They concluded, “these findings do not support increased medical risks associated with hysteroscopic sterilization.”
One author declared personal fees from Boston Scientific but no other conflicts of interest were declared.
SOURCE: Bouillon K et al. JAMA. 2018 Jan 23;319:375-87.
In 2016, in response to safety concerns about the hysteroscopic sterilization implant Essure, the Food and Drug Administration placed a “black box” warning on the device to highlight potential risks, and a global patient advocacy movement called for a ban on the product. In this environment, there is therefore a need for strong scientific evidence to inform objective decision making.
This study provides reassuring evidence that adverse outcomes are not significantly higher after hysteroscopic sterilization compared with laparoscopic sterilization, at least up to 3 years after the procedure. However, given the powerful and very public grassroots effort to ban the hysteroscopic implant and the possibility of class action litigation, the future of hysteroscopic sterilization is uncertain.
Eve Espey, MD, MPH, and Lisa G. Hofler, MD, MPH, are in the department of obstetrics and gynecology at the University of New Mexico, Albuquerque. The comments are taken from an editorial (JAMA. 2018 Jan 23;319[4]:347-50). Dr. Hofler declared personal fees and nonfinancial support from the American College of Obstetricians and Gynecologists.
Hysteroscopic sterilization is associated with a significantly greater risk of gynecological complications but not medical or surgical complications, compared with laparoscopic sterilization, according to data from a French nationwide cohort study.
In a report published Jan. 23 in JAMA, researchers conducted a study of 105,357 women – 71,303 (67.7%) of whom underwent hysteroscopic sterilization, and 34,054 (32.3%) of whom underwent laparoscopic sterilization – and who were followed for at least 1 year after the procedure.
Women who had the hysteroscopic procedure had a nearly threefold higher risk of tubal disorder or surgery, a sevenfold higher risk of sterilization failure, and a 25-fold higher risk of undergoing a second sterilization procedure at 1 year compared with those who had the laparoscopic procedure (P less than .001 for each). These risk increases persisted even at 3 years after the procedure (hazard ratios of 1.79, 4.66, and 16.63, respectively; 95% confidence interval for each).
“A second sterilization procedure following hysteroscopic sterilization is a well-identified risk already described in phase 2 and 3 studies, in which the risk varied between 4.0% and 4.5%,” wrote Kim Bouillon, MD, PhD, of the French National Agency for Medicines and Health Products Safety, and her coauthors.
“In the present study, this risk was 4.1% at the 1-year follow-up, comparable with that reported in previous studies conducted in real-life conditions in patients who received care in public or private hospitals, and much higher than after laparoscopic sterilization.”
However, hysteroscopic sterilization was associated with a significantly reduced risk of surgical complications, compared with laparoscopic sterilization (adjusted odds ratio, 0.18; 95% CI, 0.14-0.23). The overall rate of in-hospital surgical complications was 0.13% with the hysteroscopic procedure and 0.78% with the laparoscopic procedure. Medical complications occurred in 0.06% of hysteroscopic procedures and 0.11% of laparoscopic procedures.
Women who underwent hysteroscopic procedures also had a significantly lower risk of uterine disorders (adjusted HR, 0.85; 95% CI, 0.74-0.98), uterine bleeding, and hysterectomies at 1 year, after adjustment for known hysterectomy risk factors.
The researchers noted that in absolute terms, the differences in the risk of procedural complications were very small, compared with the differences in the risk of gynecological complications.
The risk of pregnancy was significantly lower in the hysteroscopic group, compared with the laparoscopic group at 1 year after the procedure, but by 3 years’ follow-up, the difference was no longer significant.
There were no significant differences seen in the risk of medical complications such as autoimmune disease and thyroid disorders, attempted suicide, or death between the two procedures. Women who underwent hysteroscopic sterilization had a slightly lower use of analgesics, antidepressants, and benzodiazepines at 1 year that was more pronounced by 3 years.
There was a significantly higher risk of allergic reaction seen with hysteroscopic sterilization among women with prior allergies, but the authors suggested that a null overall effect and large number of tested interactions made the finding “hypothesis-generating” only.
The study was prompted by safety concerns about hysteroscopic sterilization, with the Food and Drug Administration in 2015 receiving a large number of reports of adverse events including bleeding, pelvic pain, fallopian tube perforation, unwanted pregnancy, hysterectomies, depression, and allergic reactions.
The FDA has since ordered the device manufacturer to undertake an open-label, nonrandomized study comparing outcomes between hysteroscopic and laparoscopic sterilization, which is expected to deliver results in 2023.
“To our knowledge, this is the first study aiming at comparing medical outcomes in addition to gynecological outcomes between hysteroscopic and laparoscopic sterilization,” the authors wrote, referring to their own work. They concluded, “these findings do not support increased medical risks associated with hysteroscopic sterilization.”
One author declared personal fees from Boston Scientific but no other conflicts of interest were declared.
SOURCE: Bouillon K et al. JAMA. 2018 Jan 23;319:375-87.
FROM JAMA
Key clinical point: Hysteroscopic sterilization is associated with a significantly greater risk of gynecological complications – but not medical or surgical complications – compared with laparoscopic sterilization.
Major finding: The risks of repeat sterilization procedure, sterilization failure, and tubal disorder are higher with hysteroscopic sterilization than with laparoscopic sterilization, but the surgical risks are lower and there are no significant differences in other medical risks.
Data source: Nationwide cohort study of 105,357 women.
Disclosures: One author declared personal fees from Boston Scientific but no other conflicts of interest were declared.
Source: Bouillon K et al. JAMA. 2018 Jan 23;319:375-87.
Rural residents admitted for opioid overdoses increasingly are hospitalized in urban hospitals
Clinical question: Is there an association between rurality and trends and characteristics of hospitalizations for opioid overdose?
Background: Hospitalization for an opioid overdose is an opportunity for intervention, and patients may have different discharge needs depending on their rurality. Differences in patient characteristics or overall trends in opioid overdose hospitalizations by rural status have not been described.
Study design: Time trend (2007-2014) and cross-sectional analysis (2012-2014).
Setting: Nationally representative sample of U.S. hospital discharges.
Synopsis: Using weighted data from the National Inpatient Sample and the American Community Survey, the authors found that 43,935 individuals were hospitalized for opioid overdose in the United States in 2007, increasing to 71,280 in 2014. A total of 99% of urban and 37% of rural residents were admitted to urban hospitals. Hospitalization rates for prescription opioid overdoses were higher among rural residents and increased among rural and urban residents until 2011 before declining among rural residents during 2012-2014. Hospitalization rates for prescription opioid overdoses increased among all groups before they declined among large urban population residents after 2011, declined among rural residents after 2012, and continued to rise among small urban residents. Hospitalization rates for heroin overdose increased across all years in all groups and were higher among urban as compared to rural residents.
Bottom line: Opioid overdose hospitalization is associated with patient rurality and a significant proportion of rural individuals are hospitalized for opioid overdose in urban facilities. These patients may have distinct discharge needs.
Citation: Mosher H et al. Trends in hospitalization for opioid overdose among rural compared to urban residents of the United States, 2007-2014. J Hosp Med. 2017. doi: 10.12788/jhm.2793.
Dr. Simonetti is a hospitalist at the University of Colorado School of Medicine.
Sotatercept promising for treatment of anemia in MDS
A novel agent holds promise as a treatment option for anemia in patients with lower-risk myelodysplastic syndromes who are not helped by erythropoiesis-stimulating agents (ESAs), according to results from a phase 2 trial.
Sotatercept (ACE-011) is a first-in-class novel recombinant fusion protein, and was found to be effective and well tolerated, increasing hemoglobin concentrations and decreasing the transfusion burden in this patient population.
Nearly half (29, 47%) of 62 patients with a high transfusion burden achieved hematologic improvement–erythroid (HI-E), which for them was a reduction in red blood cell transfusion from baseline of 4 U or more for at least 56 days. Additionally, 7 of 12 patients (58%) with a low transfusion burden also achieved HI-E, defined as an increase in hemoglobin of 1.5 g/dL or more that was sustained for at least 56 days without a transfusion.
“Taken together, these findings provide proof of principle that the recombinant protein sotatercept can restore ineffective erythropoiesis in patients with lower-risk myelodysplastic syndromes, with an acceptable safety profile,” Rami Komrokji, MD, of Moffitt Cancer Center and Research Institute, Tampa, and his colleagues, wrote in the Lancet Haematology.
There are few effective treatment options available for patients with lower-risk myelodysplastic syndromes who have anemia, especially after they fail primary or secondary treatment with ESAs, or for those who are not likely to benefit from ESA therapy.
In this phase 2 trial, the researchers sought to establish a safe and effective dose of sotatercept in a cohort of 74 patients. Of this group, 7 received 0.1 mg/kg sotatercept, 6 got 0.3 mg/kg, 21 received 0.5 mg/kg, 35 got 1.0 mg/kg, and 5 patients received doses up to 2.0 mg/kg. The primary efficacy endpoint of the study was the proportion of patients who achieved HI-E.
All of the patients were pretreated, having received prior therapy for myelodysplastic syndromes, including ESAs, hypomethylating agents (azacitidine or decitabine), lenalidomide, and other agents including corticosteroids and immunomodulators.
Within this cohort, 36 patients (49%; 95% confidence intervaI, 38-60) achieved HI-E while 20 patients (27%; 95% CI, 18-38) achieved independence from transfusion for at least 56 days.
Fatigue (26%) and peripheral edema (24%) were the most common adverse events reported, while grade 3-4 treatment-emergent adverse events (TEAEs) were reported in 34% of patients. Of these, 4 patients had grade 3-4 TEAEs that were probably related to the treatment. The most common grade 3-4 TEAEs were lipase increase and anemia, and each was reported in three patients. Additionally, 17 patients (23%) experienced at least one serious TEAE, including a death from a treatment-emergent subdural hematoma (which caused the patient to fall).
The study was funded by the Celgene. Dr. Komrokji reported financial relationships with Celgene and Novartis. Other study authors reported relationships with various pharmaceutical companies.
SOURCE: Komrokji R et al. Lancet Haematol. 2018 Jan 10. doi: 10.1016/S2352-3026(18)30002-4.
Sotatercept appears to have promise in treating anemia in patients with lower-risk myelodysplastic syndromes, and has also demonstrated an acceptable safety profile, according to Valeria Santini, MD.
“Ameliorating anemia in myelodysplastic syndromes by reversing ineffective erythropoiesis secondary to aberrant TGF [transforming growth factor]-beta stimulation is indeed an interesting new therapeutic avenue for these patients,” she wrote.
Dr. Santini also pointed out that the “most intriguing aspect of sotatercept” is its unique mechanism of action. The current study demonstrated the agent’s erythroid-stimulating and antiosteoporotic activity, which should encourage continuing research into the mutifaceted and extremely complex TGF-beta pathway.
While important results were demonstrated in this study, several questions remain, Dr. Santini noted. For example, what are the clinical characteristics of the patients who were sensitive to and responded to treatment with sotatercept? Are these patients different from those who responded to a different agent, luspatercept?
Dr. Santini is with department of hematology at the University of Florence (Italy). She reported giving lectures in supported symposia for Celgene, Janssen, and Novartis and serving on the advisory boards for Abbvie, Otsuka, and Janssen. Her remarks were adapted from an accompanying editorial (Lancet Haematol. 2018 Jan 10. doi: 10.1016/S2352-3026[18]30003-6).
A novel agent holds promise as a treatment option for anemia in patients with lower-risk myelodysplastic syndromes who are not helped by erythropoiesis-stimulating agents (ESAs), according to results from a phase 2 trial.
Sotatercept (ACE-011) is a first-in-class novel recombinant fusion protein, and was found to be effective and well tolerated, increasing hemoglobin concentrations and decreasing the transfusion burden in this patient population.
Nearly half (29, 47%) of 62 patients with a high transfusion burden achieved hematologic improvement–erythroid (HI-E), which for them was a reduction in red blood cell transfusion from baseline of 4 U or more for at least 56 days. Additionally, 7 of 12 patients (58%) with a low transfusion burden also achieved HI-E, defined as an increase in hemoglobin of 1.5 g/dL or more that was sustained for at least 56 days without a transfusion.
“Taken together, these findings provide proof of principle that the recombinant protein sotatercept can restore ineffective erythropoiesis in patients with lower-risk myelodysplastic syndromes, with an acceptable safety profile,” Rami Komrokji, MD, of Moffitt Cancer Center and Research Institute, Tampa, and his colleagues, wrote in the Lancet Haematology.
There are few effective treatment options available for patients with lower-risk myelodysplastic syndromes who have anemia, especially after they fail primary or secondary treatment with ESAs, or for those who are not likely to benefit from ESA therapy.
In this phase 2 trial, the researchers sought to establish a safe and effective dose of sotatercept in a cohort of 74 patients. Of this group, 7 received 0.1 mg/kg sotatercept, 6 got 0.3 mg/kg, 21 received 0.5 mg/kg, 35 got 1.0 mg/kg, and 5 patients received doses up to 2.0 mg/kg. The primary efficacy endpoint of the study was the proportion of patients who achieved HI-E.
All of the patients were pretreated, having received prior therapy for myelodysplastic syndromes, including ESAs, hypomethylating agents (azacitidine or decitabine), lenalidomide, and other agents including corticosteroids and immunomodulators.
Within this cohort, 36 patients (49%; 95% confidence intervaI, 38-60) achieved HI-E while 20 patients (27%; 95% CI, 18-38) achieved independence from transfusion for at least 56 days.
Fatigue (26%) and peripheral edema (24%) were the most common adverse events reported, while grade 3-4 treatment-emergent adverse events (TEAEs) were reported in 34% of patients. Of these, 4 patients had grade 3-4 TEAEs that were probably related to the treatment. The most common grade 3-4 TEAEs were lipase increase and anemia, and each was reported in three patients. Additionally, 17 patients (23%) experienced at least one serious TEAE, including a death from a treatment-emergent subdural hematoma (which caused the patient to fall).
The study was funded by the Celgene. Dr. Komrokji reported financial relationships with Celgene and Novartis. Other study authors reported relationships with various pharmaceutical companies.
SOURCE: Komrokji R et al. Lancet Haematol. 2018 Jan 10. doi: 10.1016/S2352-3026(18)30002-4.
FROM LANCET HAEMATOLOGY
Key clinical point:
Major finding: In all, 36 patients (49%) achieved hematologic improvement–erythroid and 20 patients (27%) achieved independence from transfusion for at least 56 days.
Data source: A phase 2 trial that included 74 patients with lower-risk myelodysplastic syndromes who did not respond to erythropoiesis-stimulating agents.
Disclosures: Celgene funded the study. Dr. Komrokji reported financial relationships with Celgene and Novartis. Other study authors reported relationships with various pharmaceutical companies.
Source: Komrokji R et al. Lancet Haematol. 2018 Jan 10. doi: 10.1016/S2352-3026(18)30002-4.
Emergency Ultrasound: Focused Ultrasound for Respiratory Distress: The BLUE Protocol
Acute dyspnea, with or without hypoxia, is a common patient presentation in the ED, and can be the result of a myriad of mainly cardiac, pulmonary, and metabolic conditions—many of which are life-threatening. Therefore, it is crucial to determine or narrow the diagnosis promptly and initiate appropriate treatment. Focused ultrasound of the lungs can provide important information that can change a patient’s clinical course within minutes of initial evaluation.
Background
Prior to the 1990s, the lung was considered unsuitable for evaluation by ultrasound given the scatter of the ultrasound beam that is produced by the presence of aerated tissue. Lung pathology, however, produces distinct artifacts and signs on ultrasound that correspond with specific disease patterns.
The Bedside Lung Ultrasound in Emergencies (BLUE) protocol1 was developed by Daniel Lichtenstein, a French intensivist, and published in 2008. The goal of the examination is to improve the speed and precision of identifying common causes of acute dyspnea. The sensitivity of ultrasound for cardiogenic pulmonary edema, asthma/chronic obstructive pulmonary disease (COPD), and pneumothorax were reported as exceeding 88%.2 Strictly speaking, the BLUE protocol includes an evaluation of the deep veins as well to exclude thrombus; however, this article will focus on ultrasound imaging of the lung.
Relevant Findings
A-line Artifact
The A-line seen on lung ultrasound (Figure 1) originates from the pleura and can be seen in a normal lung. 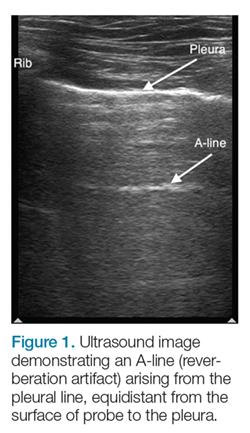
B-line Artifact
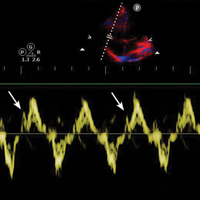
B-lines, also referred to as “lung rockets,” are a comet-tail artifact arising from the pleura (Figure 2). 
Lung Profiles
A patient can have one of three predominant lung profiles: A-profile, B-profile, or AB-profile.
A-profile. A-lines appear bilaterally with lung sliding in the anterior surface of lungs, suggestive of COPD, or pulmonary embolism. Exacerbation of congestive heart failure can be ruled out.
B-profile. The appearance of prominent B-lines bilaterally, suggestive of heart failure, essentially rules out COPD, pulmonary embolism, and pneumothorax.
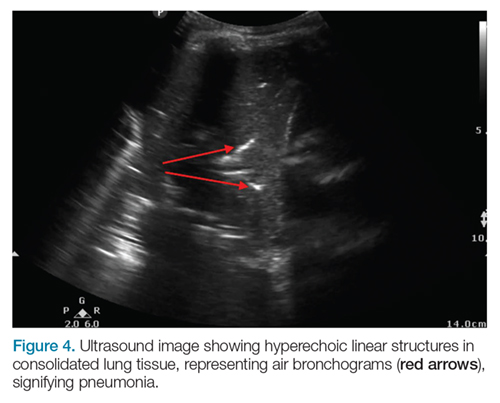
AB-profile. The appearance of predominant B-lines on one lung and predominant A-lines on the other lung, is consistent with an AB profile. This is usually associated with unilateral pneumonia, especially if seen with other findings such as subpleural consolidation (Figure 3) and air bronchograms (Figure 4).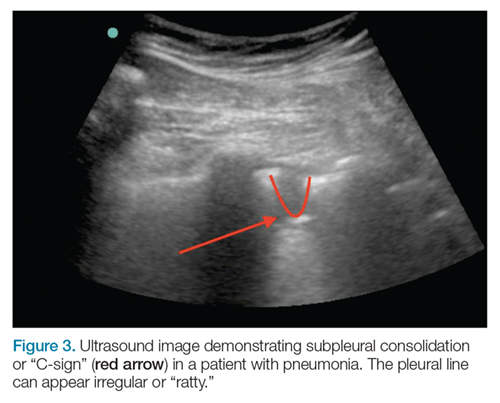
Lung Point
The lung point sign is the only specific finding in the BLUE protocol, and signifies the limits of a pneumothorax by showing the interface between normal lung sliding and the edge of the pneumothorax. Without a specific search for the lung point, it may not be seen in the anterior assessment of lung sliding, although lung sliding will still be abolished. 
Imaging Technique
The mid-to-high frequency phased array transducer is used to examine the anterior and posterolateral chest. The original BLUE protocol assesses three zones, but the most relevant information can be obtained from performing the ultrasound in the anterior and posterolateral locations (Figures 6 and 7).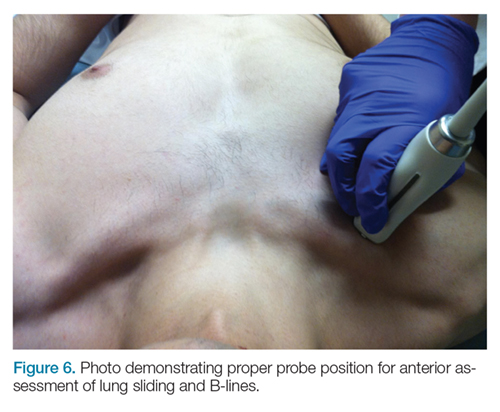
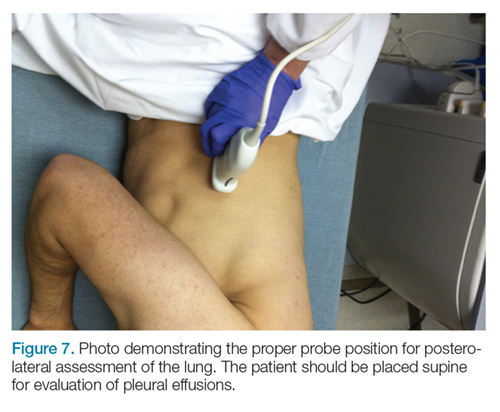
Anterior Pleural Assessment
The first step is to evaluate the pleural line anteriorly (Figure 1) for lung sliding. This is best accomplished by setting the depth to no more than 5 cm so that the focal zone of the ultrasound beam is directed at the pleural line, and it is centered on the screen. If no sliding is present, it is because the visceral and parietal pleura are not apposed to one another. There are many pathological entities that can cause this finding, but one of the more common is pneumothorax.
After evaluating the pleural line, the depth will then need to be switched to 15 cm to evaluate for B-lines. If B-lines are present without lung sliding, pneumonia should be strongly considered. The appearance of B-lines with lung sliding signifies alveolar interstitial fluid, commonly from pulmonary edema.
Posterolateral Assessment
The posterolateral assessment (Figure 7) evaluates for pleural effusion and consolidation. The dome of the diaphragm is the landmark above which abnormal lung and artifacts will be seen. 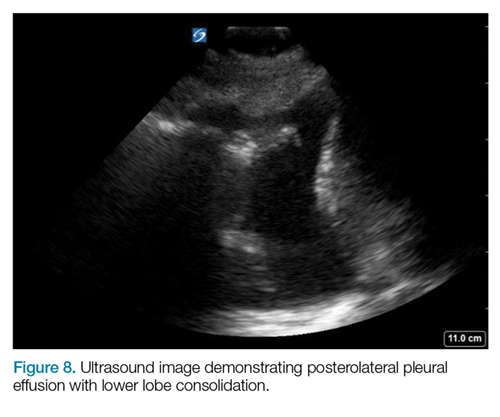
Summary
Lung ultrasound can help narrow the differential diagnosis for acute dyspnea within the first few minutes of the patient encounter. The BLUE protocol provides an organized approach to this evaluation. Often, the protocol is combined with focused examinations of the heart, inferior vena cava, and/or deep veins to complete the clinical picture. It is important to keep in mind that patients may have two or more pathological conditions (eg, asthma and pneumonia) that can affect the ultrasound findings. For this reason, ultrasound interpretation should always occur in the context of the clinical condition. If it does not exclude important diagnoses, additional investigations such as plain radiography, cross-sectional imaging, or ventilation/perfusion studies should be pursued.
1. Lichtenstein DA. BLUE-protocol and FALLS-protocol: two applications of lung ultrasound in the critically ill. Chest. 2015;147(6):1659-1670. doi:10.1378/chest.14-1313.
2. Lichtenstein DA, Mezière GA. Relevance of lung ultrasound in the diagnosis of acute respiratory failure: the BLUE protocol. Chest. 2008;134(1):117-125. doi:10.1378/chest.07-2800.
Acute dyspnea, with or without hypoxia, is a common patient presentation in the ED, and can be the result of a myriad of mainly cardiac, pulmonary, and metabolic conditions—many of which are life-threatening. Therefore, it is crucial to determine or narrow the diagnosis promptly and initiate appropriate treatment. Focused ultrasound of the lungs can provide important information that can change a patient’s clinical course within minutes of initial evaluation.
Background
Prior to the 1990s, the lung was considered unsuitable for evaluation by ultrasound given the scatter of the ultrasound beam that is produced by the presence of aerated tissue. Lung pathology, however, produces distinct artifacts and signs on ultrasound that correspond with specific disease patterns.
The Bedside Lung Ultrasound in Emergencies (BLUE) protocol1 was developed by Daniel Lichtenstein, a French intensivist, and published in 2008. The goal of the examination is to improve the speed and precision of identifying common causes of acute dyspnea. The sensitivity of ultrasound for cardiogenic pulmonary edema, asthma/chronic obstructive pulmonary disease (COPD), and pneumothorax were reported as exceeding 88%.2 Strictly speaking, the BLUE protocol includes an evaluation of the deep veins as well to exclude thrombus; however, this article will focus on ultrasound imaging of the lung.
Relevant Findings
A-line Artifact
The A-line seen on lung ultrasound (Figure 1) originates from the pleura and can be seen in a normal lung.
B-line Artifact
B-lines, also referred to as “lung rockets,” are a comet-tail artifact arising from the pleura (Figure 2).
Lung Profiles
A patient can have one of three predominant lung profiles: A-profile, B-profile, or AB-profile.
A-profile. A-lines appear bilaterally with lung sliding in the anterior surface of lungs, suggestive of COPD, or pulmonary embolism. Exacerbation of congestive heart failure can be ruled out.
B-profile. The appearance of prominent B-lines bilaterally, suggestive of heart failure, essentially rules out COPD, pulmonary embolism, and pneumothorax.
AB-profile. The appearance of predominant B-lines on one lung and predominant A-lines on the other lung, is consistent with an AB profile. This is usually associated with unilateral pneumonia, especially if seen with other findings such as subpleural consolidation (Figure 3) and air bronchograms (Figure 4).
Lung Point
The lung point sign is the only specific finding in the BLUE protocol, and signifies the limits of a pneumothorax by showing the interface between normal lung sliding and the edge of the pneumothorax. Without a specific search for the lung point, it may not be seen in the anterior assessment of lung sliding, although lung sliding will still be abolished.
Imaging Technique
The mid-to-high frequency phased array transducer is used to examine the anterior and posterolateral chest. The original BLUE protocol assesses three zones, but the most relevant information can be obtained from performing the ultrasound in the anterior and posterolateral locations (Figures 6 and 7).
Anterior Pleural Assessment
The first step is to evaluate the pleural line anteriorly (Figure 1) for lung sliding. This is best accomplished by setting the depth to no more than 5 cm so that the focal zone of the ultrasound beam is directed at the pleural line, and it is centered on the screen. If no sliding is present, it is because the visceral and parietal pleura are not apposed to one another. There are many pathological entities that can cause this finding, but one of the more common is pneumothorax.
After evaluating the pleural line, the depth will then need to be switched to 15 cm to evaluate for B-lines. If B-lines are present without lung sliding, pneumonia should be strongly considered. The appearance of B-lines with lung sliding signifies alveolar interstitial fluid, commonly from pulmonary edema.
Posterolateral Assessment
The posterolateral assessment (Figure 7) evaluates for pleural effusion and consolidation. The dome of the diaphragm is the landmark above which abnormal lung and artifacts will be seen.
Summary
Lung ultrasound can help narrow the differential diagnosis for acute dyspnea within the first few minutes of the patient encounter. The BLUE protocol provides an organized approach to this evaluation. Often, the protocol is combined with focused examinations of the heart, inferior vena cava, and/or deep veins to complete the clinical picture. It is important to keep in mind that patients may have two or more pathological conditions (eg, asthma and pneumonia) that can affect the ultrasound findings. For this reason, ultrasound interpretation should always occur in the context of the clinical condition. If it does not exclude important diagnoses, additional investigations such as plain radiography, cross-sectional imaging, or ventilation/perfusion studies should be pursued.
1. Lichtenstein DA. BLUE-protocol and FALLS-protocol: two applications of lung ultrasound in the critically ill. Chest. 2015;147(6):1659-1670. doi:10.1378/chest.14-1313.
2. Lichtenstein DA, Mezière GA. Relevance of lung ultrasound in the diagnosis of acute respiratory failure: the BLUE protocol. Chest. 2008;134(1):117-125. doi:10.1378/chest.07-2800.
Ethanol Intoxication From Hand Sanitizer Ingestion
Case
A 29-year-old man presented to the ED several hours after ingesting what he described as a “hefty” bottle of hand sanitizer. The patient stated that he ingested such a considerable quantity of liquid hand sanitizer because he was unable to obtain beer or liquor. He further admitted to drinking two 40-ounce beers daily for the past several years, noting that he last consumed drinking alcohol the preceding day.
The patient denied any other coingestants. He also denied nausea, vomiting, abdominal pain, or other somatic complaints. The patient’s medical history was significant for hypertension and hepatitis C, and his social history was significant for daily alcohol consumption, tobacco abuse, and former benzodiazepine, marijuana, and intravenous heroin abuse. His psychiatric history was significant for borderline personality disorder, major depression, and bulimia. The patient’s home medications included a daily multivitamin, folate, thiamine, sertraline, mirtazapine, and prazosin.
Initial vital signs at presentation were: blood pressure, 124/77 mm Hg; heart rate, 86 beats/min; respiratory rate, 15 breaths/min; and temperature, 98.0°F. On physical examination, he was noted to have slurred speech and nystagmus. His pupils were equal and reactive, without scleral icterus. The abdomen was nontender and nondistended, with regular bowel sounds, and without ascites or varicosities visualized. The rest of the examination was unremarkable. The patient did express thoughts of suicidality, but denied any homicidal ideation.
Laboratory studies revealed a serum ethanol concentration of 446 mg/dL. The patient’s basic metabolic panel was unremarkable, and liver function test results showed mildly elevated enzymes. The coagulation panel was within normal limits.
Is alcohol-based hand sanitizer consumption an emerging public health concern?
Excessive alcohol consumption is a recognized public health problem in the United States and is associated with an average of 88,000 deaths per year.1 In a select population of patients, an untoward effect has developed from another public health target—that of hand hygiene.
Alcohol-based liquid hand sanitizers have become ubiquitous as a weapon in the antimicrobial arsenal with recommendations for its use as an alternative to soap and water in certain clinical settings. Liquid hand sanitizers are ideal for hospital or community use as they are faster, more effective, and less irritating to the skin than traditional hand-washing techniques.2
The downside to the widespread availability of hand sanitizers is that they offer easy access to individuals in search of clandestine sources of alcohol. Prior case reports have discussed the practice of consuming alcohol-based hand sanitizers for the purpose of intoxication in institutionalized persons, such as prisoners or patients in psychiatric facilities who are restricted to conventional sources of alcohol.
Children and confused elderly patients are also at risk for unintentional ingestions.3,4 An article reviewed exposures reported to the American Association of Poison Control Center’s National Poison Data System over a 5-year period from 2005 to 2009.3 Of the 68,712 reported cases in this cohort, 80.5% were in children younger than 6 years of age. The investigators also noted an increased incidence of exposure over this period with an average of 1,894 additional cases per year.3There were 17,154 children aged 12 years and younger reported in 2017 to poison centers with exposures to hand sanitizers. Young children may be enticed by the bright colorful packaging and similarity to food and candy smells.5
What are the clinical manifestations of alcohol-based hand sanitizer ingestion?
Significant hazards exist from ingesting liquid hand sanitizer, including the high alcohol content, which varies from 40% to 85%.2 Because isopropanol is commonly one of the components (if not the sole component) of many hand-sanitizer preparations, isopropanol toxicity may occur when ingested. The effects of isopropanol are similar to those of ethanol, with clinical effects reported after ingestion of as little as 100 mL of 70% isopropanol solution.4
Hand sanitizer formulations vary by manufacturer and contain different concentrations of ethanol and/or isopropanol, as well as additional potential inactive ingredients such as acetone, 1-propanol, 2-propanol, benzyl alcohol, hydrogen peroxide, glycerin, water, and different perfumes.3,4
Persons who consume hand sanitizers recreationally are often unaware of the large alcohol content by volume that they are consuming. Recreational ingestion of hand sanitizer is believed to be the cause of at least one case of lethal ethanol intoxication. An articlereported a case of a male patient who suffered respiratory arrest after consuming an ethanol-based hand sanitizer.6 This patient was noted to have a serum ethanol of 536 mg/dL after consuming an unknown quantity of a 354 mL container of a 62% ethanol by volume hand sanitizer.6
Institutionalized individuals seeking alcohol through this source have discovered novel ways to yield a stronger product. Through the use of table salt and a cotton sock, it is possible to extract a liquid from a gel hand sanitizer preparation, yielding an alcohol context 30% higher by volume than the parent mixture.7
Alcohol intoxication poses a host of health effects. In nonhabituated individuals, a lethal load of alcohol can be achieved by consuming a volume of as little as 400 mL of an 80% alcohol-based solution.4 Symptoms from ingestion of an alcohol-based liquid hand sanitizer typically appear 1 to 2 hours after ingestion and mirror that of the alcohol toxidrome. Most commonly, this includes nausea, vomiting, epigastric pain, and varying degrees of central nervous system (CNS) depression.4 The life-threatening clinical manifestation of alcohol intoxication includes severe CNS and respiratory depression resulting in respiratory arrest, hypothermia, cardiac dysrhythmias with possible cardiac arrest, hypoglycemia, ketoacidosis, and hypotension.3
How is alcohol-based hand sanitizer ingestion managed?
The management of patients with alcohol-based hand sanitizer ingestion is the same as the management of alcohol ingestion from more socially acceptable sources and is mainly supportive.3,4 These measures are directed at managing the patient’s airway with intubation and mechanical ventilation when appropriate, as well as supportive measures to address any underlying metabolic derangement or hypotension.2 While hemodialysis has been used in some patients who had severe organ dysfunction and did not respond to supportive measures, it is usually not necessary.1,3
Case Conclusion
The patient in this case was subsequently admitted to an intermediate level of care. He did not require intubation or further hemodynamic support during his initial acute intoxication. Later in the patient’s hospital course, he was noted to be in alcohol withdrawal, and proper management was initiated. He also required therapeutic one-to-one supervision after members of the nursing staff observed the patient consuming the hand sanitizer gel present in patient-care areas. He was later seen by psychiatry services. The psychiatrist recommended transfer to an inpatient psychiatric facility upon medical clearance for treatment of his psychiatric illness as well as alcohol dependence.
1. Esser MB, Hedden SL, Kanny D, Brewer RD, Gfroerer JC, Naimi TS. Prevalence of alcohol dependence among US adult drinkers, 2009-2011. Prev Chronic Dis. 2014;11:E206. doi:10.5888/pcd11.140329.
2. Pittet D, Boyce JM. Revolutionizing hand hygiene in health-care settings: guidelines revisted. Lancet Infect Dis. 2003;3(5):269-270.
3. Gormley NJ, Bronstein AC, Rasimas JJ, et al. The rising incidence of intentional ingestion of ethanol-containing hand sanitizers. Crit Care Med. 2012:40(1):290-294. doi:10.1097/CCM.0b013e31822f09c0.
4. Archer JR, Wood DM, Tizzard Z, Jones AL, Dargan PI. Alcohol hand rubs: hygiene and hazard. BMJ. 2007;335(7630):1154-1155.
5. Hand sanitizer. American Association of Poison Control Centers Web site. http://www.aapcc.org/alerts/hand-sanitizer/. Accessed December 27, 2017.
6. Schneir AB, Clark RF. Death caused by ingestion of an ethanol-based hand sanitizer. J Emerg Med. 2013;45(3):358-360. doi:10.1016/j.jemermed.2013.03.018.
7. Darracq MA, Ghafouri N, Pesce A, Cantrell FL. Hand sanitizer intoxication following a crude extraction method. Am J Drug Alcohol Abuse. 2013;39(3):217-218. doi:10.3109/00952990.2013.773335.
Case
A 29-year-old man presented to the ED several hours after ingesting what he described as a “hefty” bottle of hand sanitizer. The patient stated that he ingested such a considerable quantity of liquid hand sanitizer because he was unable to obtain beer or liquor. He further admitted to drinking two 40-ounce beers daily for the past several years, noting that he last consumed drinking alcohol the preceding day.
The patient denied any other coingestants. He also denied nausea, vomiting, abdominal pain, or other somatic complaints. The patient’s medical history was significant for hypertension and hepatitis C, and his social history was significant for daily alcohol consumption, tobacco abuse, and former benzodiazepine, marijuana, and intravenous heroin abuse. His psychiatric history was significant for borderline personality disorder, major depression, and bulimia. The patient’s home medications included a daily multivitamin, folate, thiamine, sertraline, mirtazapine, and prazosin.
Initial vital signs at presentation were: blood pressure, 124/77 mm Hg; heart rate, 86 beats/min; respiratory rate, 15 breaths/min; and temperature, 98.0°F. On physical examination, he was noted to have slurred speech and nystagmus. His pupils were equal and reactive, without scleral icterus. The abdomen was nontender and nondistended, with regular bowel sounds, and without ascites or varicosities visualized. The rest of the examination was unremarkable. The patient did express thoughts of suicidality, but denied any homicidal ideation.
Laboratory studies revealed a serum ethanol concentration of 446 mg/dL. The patient’s basic metabolic panel was unremarkable, and liver function test results showed mildly elevated enzymes. The coagulation panel was within normal limits.
Is alcohol-based hand sanitizer consumption an emerging public health concern?
Excessive alcohol consumption is a recognized public health problem in the United States and is associated with an average of 88,000 deaths per year.1 In a select population of patients, an untoward effect has developed from another public health target—that of hand hygiene.
Alcohol-based liquid hand sanitizers have become ubiquitous as a weapon in the antimicrobial arsenal with recommendations for its use as an alternative to soap and water in certain clinical settings. Liquid hand sanitizers are ideal for hospital or community use as they are faster, more effective, and less irritating to the skin than traditional hand-washing techniques.2
The downside to the widespread availability of hand sanitizers is that they offer easy access to individuals in search of clandestine sources of alcohol. Prior case reports have discussed the practice of consuming alcohol-based hand sanitizers for the purpose of intoxication in institutionalized persons, such as prisoners or patients in psychiatric facilities who are restricted to conventional sources of alcohol.
Children and confused elderly patients are also at risk for unintentional ingestions.3,4 An article reviewed exposures reported to the American Association of Poison Control Center’s National Poison Data System over a 5-year period from 2005 to 2009.3 Of the 68,712 reported cases in this cohort, 80.5% were in children younger than 6 years of age. The investigators also noted an increased incidence of exposure over this period with an average of 1,894 additional cases per year.3There were 17,154 children aged 12 years and younger reported in 2017 to poison centers with exposures to hand sanitizers. Young children may be enticed by the bright colorful packaging and similarity to food and candy smells.5
What are the clinical manifestations of alcohol-based hand sanitizer ingestion?
Significant hazards exist from ingesting liquid hand sanitizer, including the high alcohol content, which varies from 40% to 85%.2 Because isopropanol is commonly one of the components (if not the sole component) of many hand-sanitizer preparations, isopropanol toxicity may occur when ingested. The effects of isopropanol are similar to those of ethanol, with clinical effects reported after ingestion of as little as 100 mL of 70% isopropanol solution.4
Hand sanitizer formulations vary by manufacturer and contain different concentrations of ethanol and/or isopropanol, as well as additional potential inactive ingredients such as acetone, 1-propanol, 2-propanol, benzyl alcohol, hydrogen peroxide, glycerin, water, and different perfumes.3,4
Persons who consume hand sanitizers recreationally are often unaware of the large alcohol content by volume that they are consuming. Recreational ingestion of hand sanitizer is believed to be the cause of at least one case of lethal ethanol intoxication. An articlereported a case of a male patient who suffered respiratory arrest after consuming an ethanol-based hand sanitizer.6 This patient was noted to have a serum ethanol of 536 mg/dL after consuming an unknown quantity of a 354 mL container of a 62% ethanol by volume hand sanitizer.6
Institutionalized individuals seeking alcohol through this source have discovered novel ways to yield a stronger product. Through the use of table salt and a cotton sock, it is possible to extract a liquid from a gel hand sanitizer preparation, yielding an alcohol context 30% higher by volume than the parent mixture.7
Alcohol intoxication poses a host of health effects. In nonhabituated individuals, a lethal load of alcohol can be achieved by consuming a volume of as little as 400 mL of an 80% alcohol-based solution.4 Symptoms from ingestion of an alcohol-based liquid hand sanitizer typically appear 1 to 2 hours after ingestion and mirror that of the alcohol toxidrome. Most commonly, this includes nausea, vomiting, epigastric pain, and varying degrees of central nervous system (CNS) depression.4 The life-threatening clinical manifestation of alcohol intoxication includes severe CNS and respiratory depression resulting in respiratory arrest, hypothermia, cardiac dysrhythmias with possible cardiac arrest, hypoglycemia, ketoacidosis, and hypotension.3
How is alcohol-based hand sanitizer ingestion managed?
The management of patients with alcohol-based hand sanitizer ingestion is the same as the management of alcohol ingestion from more socially acceptable sources and is mainly supportive.3,4 These measures are directed at managing the patient’s airway with intubation and mechanical ventilation when appropriate, as well as supportive measures to address any underlying metabolic derangement or hypotension.2 While hemodialysis has been used in some patients who had severe organ dysfunction and did not respond to supportive measures, it is usually not necessary.1,3
Case Conclusion
The patient in this case was subsequently admitted to an intermediate level of care. He did not require intubation or further hemodynamic support during his initial acute intoxication. Later in the patient’s hospital course, he was noted to be in alcohol withdrawal, and proper management was initiated. He also required therapeutic one-to-one supervision after members of the nursing staff observed the patient consuming the hand sanitizer gel present in patient-care areas. He was later seen by psychiatry services. The psychiatrist recommended transfer to an inpatient psychiatric facility upon medical clearance for treatment of his psychiatric illness as well as alcohol dependence.
1. Esser MB, Hedden SL, Kanny D, Brewer RD, Gfroerer JC, Naimi TS. Prevalence of alcohol dependence among US adult drinkers, 2009-2011. Prev Chronic Dis. 2014;11:E206. doi:10.5888/pcd11.140329.
2. Pittet D, Boyce JM. Revolutionizing hand hygiene in health-care settings: guidelines revisted. Lancet Infect Dis. 2003;3(5):269-270.
3. Gormley NJ, Bronstein AC, Rasimas JJ, et al. The rising incidence of intentional ingestion of ethanol-containing hand sanitizers. Crit Care Med. 2012:40(1):290-294. doi:10.1097/CCM.0b013e31822f09c0.
4. Archer JR, Wood DM, Tizzard Z, Jones AL, Dargan PI. Alcohol hand rubs: hygiene and hazard. BMJ. 2007;335(7630):1154-1155.
5. Hand sanitizer. American Association of Poison Control Centers Web site. http://www.aapcc.org/alerts/hand-sanitizer/. Accessed December 27, 2017.
6. Schneir AB, Clark RF. Death caused by ingestion of an ethanol-based hand sanitizer. J Emerg Med. 2013;45(3):358-360. doi:10.1016/j.jemermed.2013.03.018.
7. Darracq MA, Ghafouri N, Pesce A, Cantrell FL. Hand sanitizer intoxication following a crude extraction method. Am J Drug Alcohol Abuse. 2013;39(3):217-218. doi:10.3109/00952990.2013.773335.

Advanced Hemodynamic and Cardiopulmonary Ultrasound for Critically Ill Patients in the Emergency Department
Critically ill patients presenting to the ED represent the most time-sensitive patient encounter for the emergency physician (EP), as delays in restoring physiological homeostasis increase the risks of organ dysfunction and death. Management and treatment strategies in critically ill patients have evolved from the routine use of invasive catheters and radiography for cardiopulmonary evaluation to a variety of noninvasive devices and pathways. The widespread adoption of point-of-care ultrasound (POCUS) in EDs provides the opportunity to rapidly obtain invaluable information about the diagnosis and etiology to guide resuscitation in critically ill patients—particularly those in shock and acute dyspnea.
Over the last two decades, EPs and critical care physicians have employed POCUS to assist in identifying emergent reversible causes of shock and cardiac arrest, including cardiac tamponade, massive pulmonary embolism (PE), and hemoperitoneum. Recent advances in hemodynamic and cardiopulmonary POCUS allow for a nuanced approach to hemodynamic evaluation.1 In addition, the use of ultrasound “first” in the critical care setting may reduce the dependence on radiographic-based management, catheter-based protocols, and the need for invasive procedures.
Bedside cardiopulmonary ultrasound to evaluate the hemodynamic status of hypotensive patients can help determine the etiology of shock, provide evidence of fluid-volume responsiveness, visualize hemodynamic abnormalities that would alter fluid resuscitation strategies, and assess patient response to an intervention. The use of ultrasound can also identify the etiology of acute respiratory failure—providing the opportunity to initiate the appropriate interventions prior to patient decompensation. Findings such as pneumothorax or pleural effusion may require immediate procedural intervention, while other findings may only require noninvasive positive pressure ventilation and diuresis.
The tools to implement these concepts include basic POCUS education common to emergency medicine and critical care (American College of Emergency Physicians Guidelines and American College of Chest Physicians/Society of Critical Care Medicine guidelines); ultrasound machines with phased array, linear, and curvilinear probes; and ultrasonographic instrumentation such as M-Mode, color Doppler, and spectral Doppler. An understanding of common Doppler imaging techniques optimizes the examination, and the use of presets common to cardiac packages may further assist the provider with adoption.
When evaluating critically ill patients, we recommend the following step-wise approach:
- Identify a clinical question to be answered prior to doing the examination;
- Determine the hemodynamic profile of the patient to guide therapeutic maneuvers; and
- Monitor the response to any therapeutic maneuver and adjust accordingly. (In these complicated patients, repeat examinations are invaluable, as the hemodynamic profile can change rapidly.)
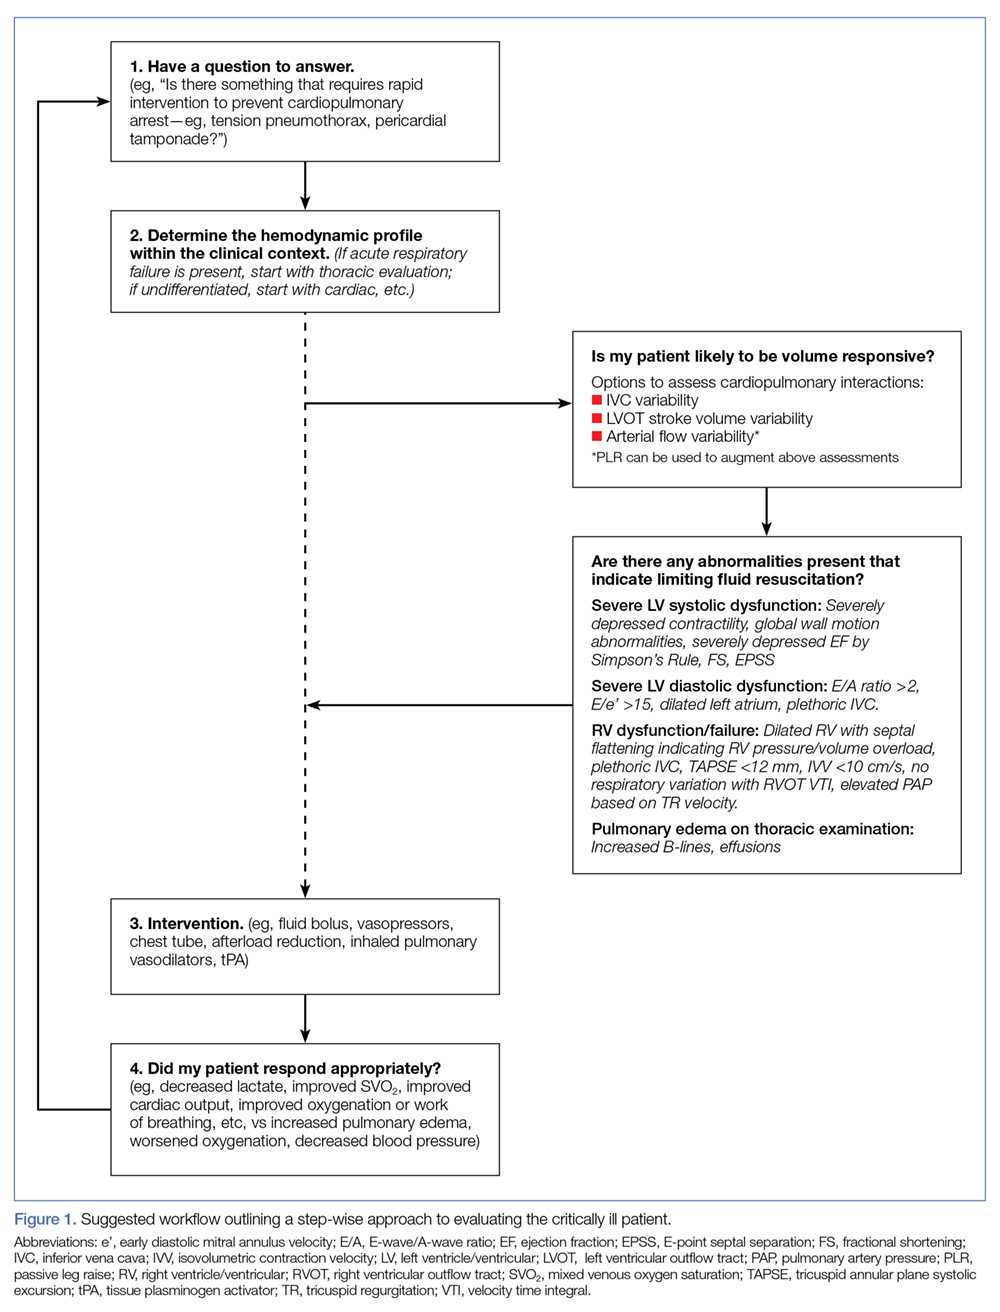
Thoracic Assessment
Emergency physicians are increasingly utilizing POCUS to rapidly evaluate the thoracic cavity in critically ill patients. This modality is an appealing alternative to formal chest radiography because of the ease of rapid image acquisition, lack of ionizing radiation, and the ability to repeat the examination in real-time.
When critically ill patients present in respiratory distress, POCUS allows the EP to rapidly diagnose potential etiologies, such as pleural effusion, pneumothorax, or pulmonary edema, and employ emergent intervention, which can greatly alter the patient’s clinical course. Additionally, the rapid diagnosis of consolidation permits earlier appropriate management of sepsis and respiratory failure when the clinical setting is consistent with pneumonia.
In many cases, ultrasound has been shown to be superior to traditional chest radiography to assess critically ill patients.2-8 Although there are several protocols that utilize thoracic ultrasound in evaluating the critical patient, this review focuses solely on the components of thoracic ultrasound, rather than specific protocols.
Pneumothorax
Ultrasound imaging with a high-frequency probe is highly sensitive and specific in assessing for pneumothorax in a supine patient.9 In the normal lung, the visceral and parietal pleura are visualized as sliding with each breath. In this examination, the transducer is placed on the chest wall to visualize two ribs and the pleura between them (Figures 2a and 2b). 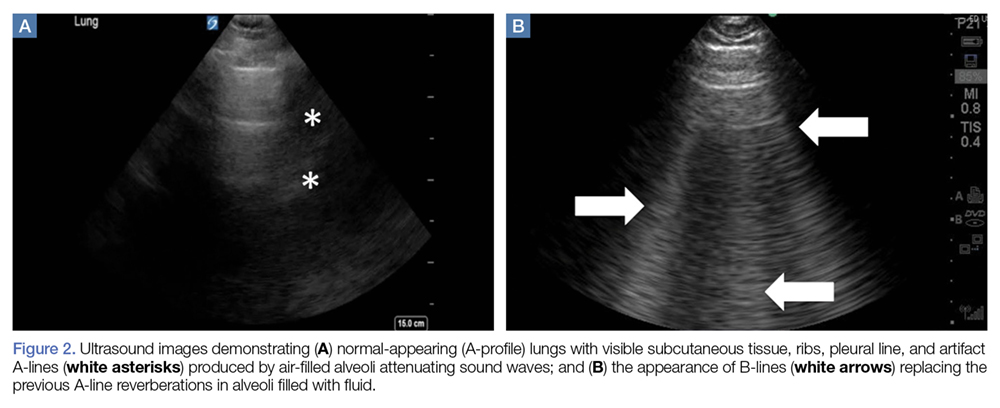
When lung sliding is present, the appearance in M-mode is that of the “seashore” or “sandy beach.” The hyperechoic white pleura is seen as moving with the respiratory cycle. Additionally, lung artifacts such as A-lines, horizontal reverberation artifacts; and B-lines (also referred to as “comet-tails”), vertical lines arising from distended subpleural alveoli, will be seen in a normal lung. If pneumothorax is present, no sliding or comet-tail artifacts will be present at the pleural surface. Although A-lines may also be absent in pneumothorax, studies have shown that the absence of lung sliding and the presence of A-lines are associated with increased specificity (94% vs 78% with absent lung sliding alone) for diagnosing occult pneumothorax.9 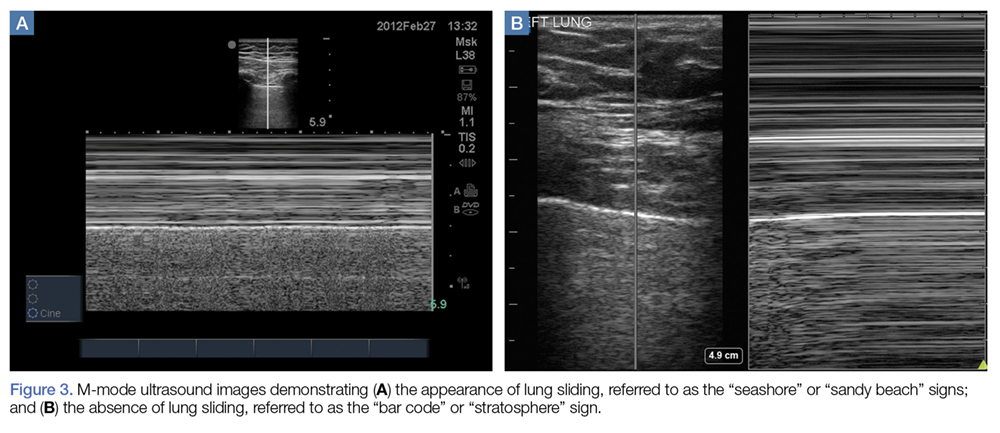
While the lack of pleural sliding is highly sensitive for pneumothorax, the clinician must place this finding within the clinical context of the patient. For example, an intubated patient may not have left-sided sliding in the case of a right main-stem intubation. Moreover, patients who have an underlying obstructive lung disease (eg, chronic obstructive pulmonary disease [COPD]) and/or emphysema may present a more challenging examination because pleural sliding is often absent, especially in the apical segments, and can mimic pneumothorax in these patients.10
In addition to pleural sliding, presence or absence of a lung pulse also assists in assessing patients for pneumothorax. The detection of a lung pulse on M-mode ultrasound indicates subtle cardiac pulsation at the periphery of the lung; this finding only appears in the nonventilated lung in the absence of a pneumothorax. The presence of lung pulse is therefore useful in distinguishing other causes of nonventilated lung from pneumothorax.11
Pleural Fluid
The low-frequency curvilinear or phased array probes are used to assess for pleural fluid. In this study, the clinician fans the probe cephalad from Morison’s pouch on the patient’s right side, or from the splenorenal recess on the left side, to visualize the bright, hyperechoic diaphragm. If pleural fluid is present, there will be loss of the mirroring artifact, and the fluid will appear as an anechoic collection cephalad to the diaphragm. In addition, when fluid is present, the normal lung may be visualized moving within the effusion, evoking a quad or sinusoid sign with M-mode imaging.12,13 In the setting of complicated parapneumonic effusion, the echogenicity may be mixed or difficult to detect.
Visualization of the thoracic spine above the diaphragm may serve as a surrogate marker for the presence of fluid. Typically, the thoracic spine is not visualized on ultrasound due to the scatter caused by the air-filled lungs. 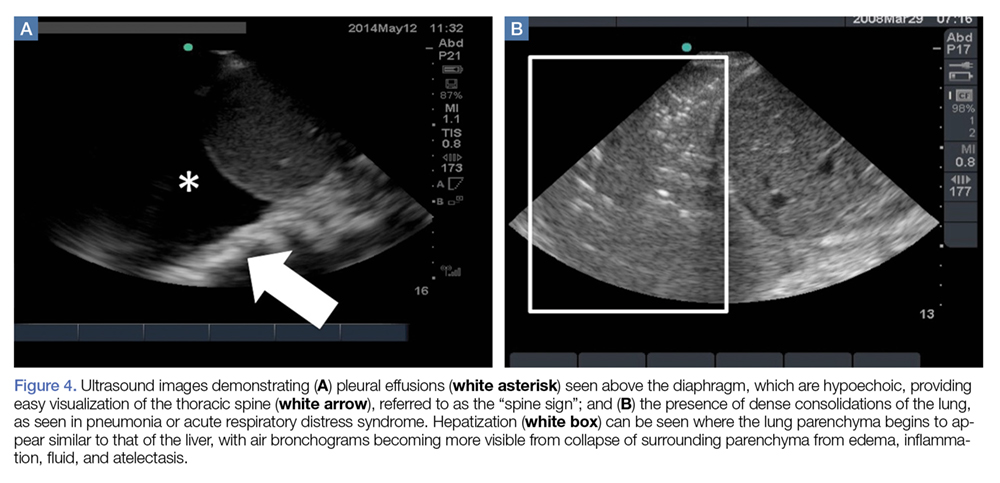
Ultrasound has been shown to be superior to routine chest radiograph for the identification of small pleural effusions.7 Given that both critically ill medical and injured patients can present with pleural fluid, the use of POCUS to rapidly determine the presence or absence of fluid is an adjunct in the evaluation of these patients.
Interstitial Fluid
Evaluation of the thoracic cavity for interstitial fluid in the setting of acute pulmonary edema, acute respiratory distress syndrome (ARDS), or interstitial pneumonia is best accomplished using either the curvilinear low-frequency probe or the phased array probe. The visualization of vertically oriented B-lines in the upper lung fields is very sensitive for interstitial fluid or edema of the interlobular septa (Figures 2a and 2b).13,15 In this study, B-lines originate at the pleural line, move with the pleura, and extend off the bottom of the monitor without obliteration (in contrast to A-lines). An isolated B-line may be physiological; however, the presence of several B-lines is consistent with an interstitial pathology. On imaging, the presence of three or more B-lines in a single rib space with a convex probe, or more than six B-lines when utilizing the curvilinear, is considered pathological and referred to as “lung rockets.” B-lines may be focal or diffuse, as seen respectively in cases of pneumonia or acute pulmonary edema.16
Pulmonary Assessment for Fluid Resuscitation
Fluid Resuscitation
Lung ultrasound studies have been proposed as a means of determining adequate fluid resuscitation and preventing complications associated with excessive fluid. The appearance of diffuse B-lines of acute interstitial syndrome on lung ultrasound can uncover the first signs of extravascular lung water and prevent pulmonary alveolar edema and associated morbidity and mortality.17 The appearance of an A-line predominance throughout the lung does not predict fluid responsiveness, but rather potential fluid tolerance.
A benefit of lung ultrasound is that it provides information more rapidly than many of the dynamic measures of fluid responsiveness and cardiac output variability. In addition, lung ultrasound studies are much more easily reproduced than repeating a velocity time integral (VTI) measurements.
Lichtenstein’s FALLS Protocol
Lichtenstein’s FALLS (Fluid Administration Limited by Lung Sonography) protocol provides an approach to performing lung ultrasound on patients presenting in shock.12 In this approach, lung ultrasound studies are performed after echocardiography to evaluate the patient for causes of obstructive shock. The predominance of B-lines on lung ultrasound suggests cardiogenic shock and, by definition, fluid intolerance. The predominance of A-lines on ultrasound may be present in patients in hypovolemic or septic shock.
In hypovolemic shock, continued fluid boluses will improve hemodynamics with preserved A-line predominance. In septic shock, B-lines will begin to appear, suggesting that other means of improving forward flow should be initiated.
Consolidation
Chest radiography is known to have variable test characteristics for the detection of pneumonia. Consolidation may not be detected in profoundly immunocompromised or dehydrated patients. Additionally, in critically ill patients, it is often challenging to obtain a posteroanterior and lateral chest X-ray, given the patient’s hemodynamic status and stability for transport, and a single portable anteroposterior film will often miss retrocardiac infiltrates. In both of these clinical settings, POCUS can provide a rapid diagnosis, expediting the care of these septic patients.
In the presence of a dense consolidation, there may be hepatization of the lung parenchyma (Figure 4b). Additionally, hyperechoic air bronchograms are often visualized. Pneumonia is often associated with pleural effusion and localized B-lines. Using lung ultrasound, rapid bedside detection of these pulmonary findings in clinical presentations suggestive of pneumonia can accelerate appropriate antibiotic and respiratory supportive treatment.
Left Ventricular Systolic Assessment
Critically ill patients commonly present with a mixed shock picture, and it is rare for a patient to have solely cardiogenic shock, hemorrhagic shock, etc. Rather, a patient who presents in septic shock may have an underlying cardiomyopathy for which she or he is being treated with a beta-blocker.
Cardiomyopathy associated with sepsis is common18 and, at least in the case of diastolic dysfunction, it is underdiagnosed and associated with a higher mortality rate.19 It is therefore essential that the EP evaluate left ventricular (LV) systolic function rapidly and reliably—particularly in critically ill patients whose disease process may be undifferentiated and whose hemodynamic status is unclear.20-22 Bedside echocardiography by the EP is invaluable in identifying the LV contribution to the hemodynamic profile and tailoring resuscitation to optimize patient outcomes.
Although gross visual assessment is the most widely used method by which EPs estimate LV systolic function, this strategy is subjective, operator-dependent, and requires at least two quality views to understand the heart’s three-dimensional movement. However, when faced with a rapid diagnostic dilemma, a global visual estimate of the overall contractility (hyperdynamic, normal, depressed, severely depressed) may be more useful than estimating the ejection fraction (EF), especially when the patient’s baseline EF is unknown.
Regional Wall-Motion Abnormalities
Regional wall-motion abnormalities can be evaluated by considering and correlating the coronary artery distributions with the electrocardiographic findings and the clinical scenario (Figure 5). 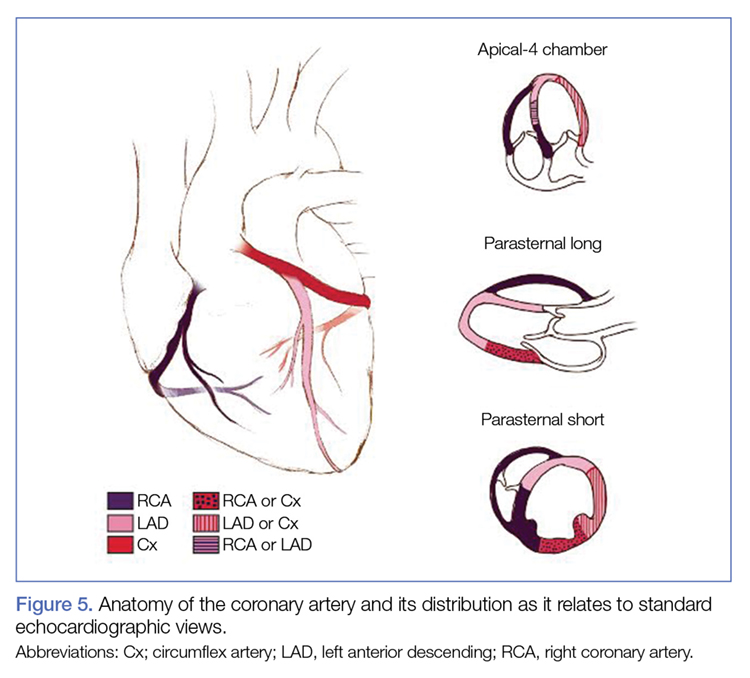
Simpson’s Rule
Although no one parameter can quantitatively assess LV function, the EF is the one most commonly used. The Simpson’s Rule or the “method of disks” estimates EF by changes in calculated ventricular volumes. The endocardial border is outlined in end-diastole and end-systole (ES) in both the apical four- (AP4) and two-chamber views. The cardiac package on the ultrasound system can divide the selected area into a series of disks, calculate the volume of each disk, and then add these figures to estimate the ventricular volume (Figure 6a). Limitations of this study include potentially difficult visualization of the endocardial border, and the length of time to conduct this study. 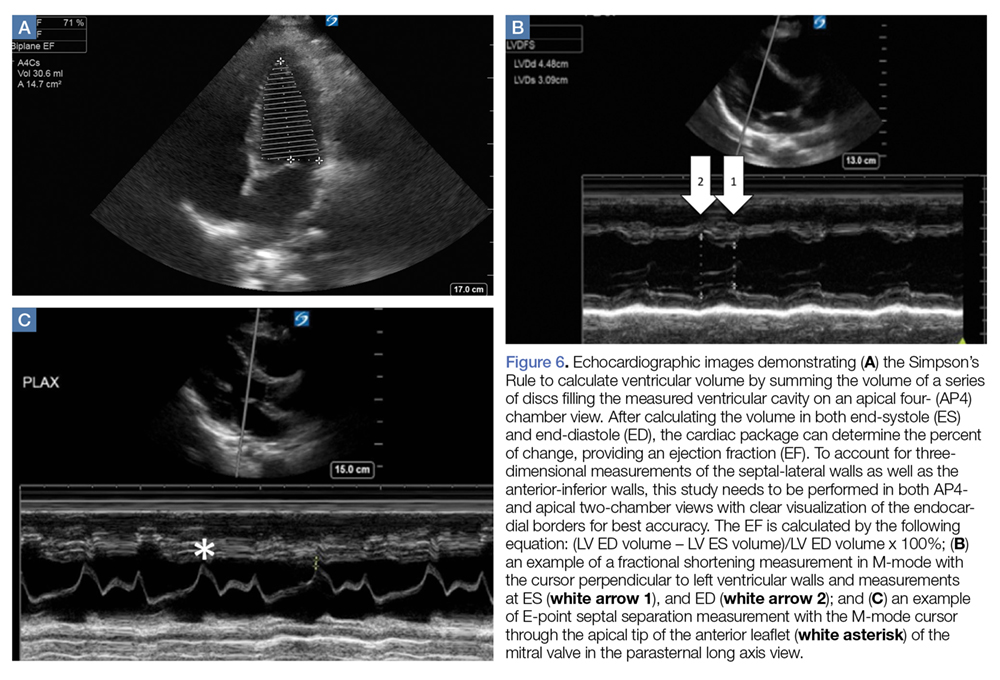
Fractional Shortening
M-mode ultrasound can be used in several ways to estimate LV EF. Fractional shortening (FS) estimates the size reduction of the LV during systole. In the parasternal long axis (PLAX) view, the M-mode cursor is placed over the walls of the LV, just apical to the tips of the mitral valve (MV) leaflets (Figure 6b). Maximal (end-diastolic diameter [EDD]) and minimal (end-systolic diameter [ESD]) dimensions of the LV are measured and FS is calculated as (LVEDD – LVESD)/ LVEDD. A normal value is more than 25%, and a rough estimate of EF is FS x 2.24 Limitations to this study include nonplacement of the M-mode cursor perpendicular to the LV walls, and inaccuracy in patients with regional wall abnormalities.
E-Point Septal Separation
Another way to assess EF with POCUS is through E-point septal separation (EPSS), which uses the movement of the MV during diastole to estimate the EF during systole. In the PLAX view, the M-mode cursor is placed over the apical tip of the anterior leaflet of the MV to visualize the movement of the leaflet in relation to the interventricular septum (Figure 6c). Two characteristic waves are created during each diastole—the larger first wave representing early filling (the E-wave) and the smaller second wave representing the atrial kick (the A-wave). The E-point is the tallest point of the E-wave, and the EPSS is measured as the distance in millimeters between the E-point and the interventricular septum.21
The opening of the anterior leaflet of the MV toward the interventricular septum in diastole requires a pressure difference between the left atrium (LA) and LV. In a patient with poor LV systolic function, the LV is still full at the end of systole, the pressure difference is not as great, and the mitral leaflets will not snap open vigorously. The EPSS should be at or less than 6 mm in patients with normal LV systolic function. An EPSS of 6 to 12 mm suggests moderately depressed LV systolic function, and over 12 mm signifies severely decreased LV systolic function.25 Limitations include inaccuracy in patients with valvular abnormalities, such as mitral stenosis or aortic regurgitation, severe LV or septal hypertrophy, regional wall abnormalities or severe LV dilation, limited data, and a wide margin of error when comparing to magnetic resonance imaging measurement of EF.
Cardiac Output
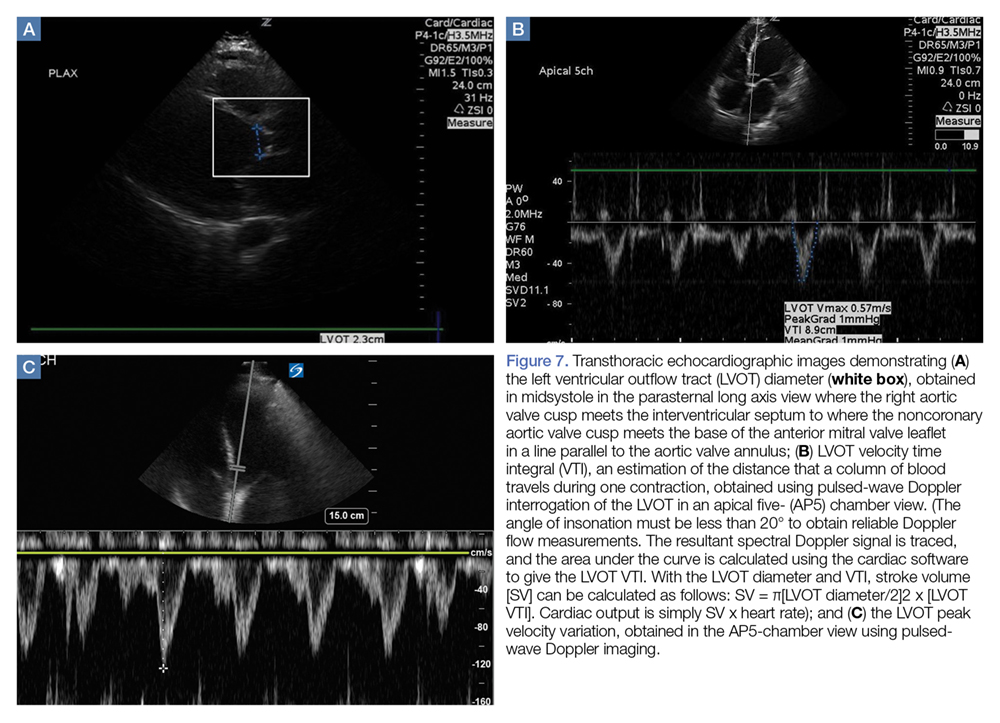
Left Ventricular Diastolic Assessment
In an aging population of patients who have longstanding, undiagnosed, or untreated hypertension, LV hypertrophy leads to impaired relaxation and diastolic filling, eventually causing elevated LA pressure and, in extreme cases, restrictive cardiomyopathy. It has been reported that approximately half of all symptomatic patients with heart failure have a preserved EF.27
Determination of LV pressures allows for the distinction between hydrostatic pulmonary edema and ARDS. Diagnosing elevated LA pressure is not inconsequential, as diastolic dysfunction in septic patients has been associated with increased mortality, likely due to increased pulmonary edema from fluid resuscitation.19 An invasive method of using a pulmonary artery catheter and measuring the pulmonary artery occlusion pressure to estimate the LA pressure is the gold standard, but is no longer routinely performed.
Echocardiography is a noninvasive surrogate to estimating LA and LV filling pressures. Two different echocardiographic measurements can be used in conjunction to estimate LV filling pressures: MV inflow velocity and tissue Doppler imaging.
Mitral Valve Inflow Velocity
Assessment of the MV inflow is performed by placing the pulse-wave Doppler gate between the tips of the MV leaflets in the AP4 view. Early diastolic filling produces the E-wave, and LA contraction produces the late diastolic A-wave (Figure 8a). 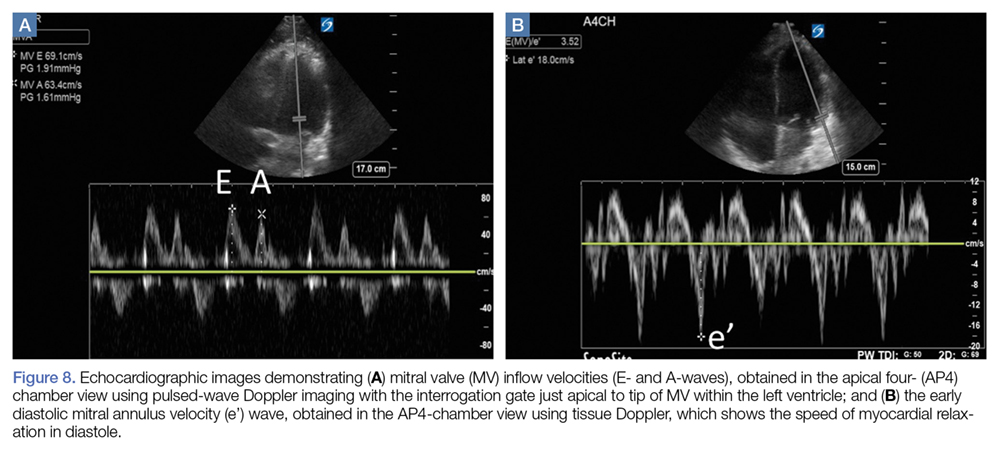
Tissue Doppler Imaging
Tissue Doppler imaging enables the clinician to measure myocardial velocities such as the speed of relaxation to evaluate if LV relaxation is due to a drop in LV pressure below LA pressure after systole, pulling the MV open; or if increased LA pressure is required to push open the MV and fill the LV.
For this study, the tissue Doppler sampling gate is placed at the septal or lateral annulus of the MV in the AP4 view to visualize early diastolic mitral annulus velocity (e’) (Figure 8b). The E/e’ ratio can be helpful for estimating LV filling pressures. An E/e’ of less than 8 is associated with normal LV filling pressure whereas an E/e’ >15 is associated with an elevated LV filling pressure.28,29 When the E/e’ is 8 to 10, other indices such as the E/A ratio and deceleration time, as well as the clinical picture, can provide insight into the presence of hemodynamically significant diastolic dysfunction.
Learning and applying the assessment of diastolic parameters can be challenging; however, these parameters can be used to help predict LV filling pressures in patients with findings of pulmonary edema on chest radiograph. Limitations of these techniques are inter-rater variability, as well as the ability of the operator to acquire the required AP4 view. In addition, these techniques are unreliable in patients with irregular cardiac rhythms, severe mitral disease, and in hypertrophic cardiomyopathy.
Right Ventricular Assessment
The right ventricle (RV) is a small, thin-walled ventricle with only two layers of muscle, as opposed to the three layers of the LV. In contrast to the rocking motion of LV contraction, the orientation of the two muscle layers of the RV permits mostly longitudinal contraction. The circumferential muscle fibers are shared at the base and apex with the LV, which can provide some of the contractile strength of the RV.30 Because of this orientation, RV strain, which can manifest as decreased longitudinal contraction, speed of contraction, septal movement, and tethering abnormalities through ventricular interdependence, can be measured easily using bedside echocardiography.
In healthy individuals, the RV is a low-pressure chamber that acts as a conduit for propelling venous return into the pulmonary circulation without much effect on systemic hemodynamics. However, in critical illness, RV abnormalities can have profound effects on hemodynamics, and the efforts typically used to improve LV performance will worsen a failing RV.
While RV dysfunction is most commonly due to chronic LV disease, acute RV dysfunction is commonly encountered in critical illness,31 including many septic patients with ARDS,32,33 PE, or decompensated chronic pulmonary hypertension.34 The examinations that follow, allow the EP to assess for the presence of RV dysfunction and to guide resuscitation appropriately to avoid the untoward hemodynamic effects of conventional resuscitation strategies in these patients.
When evaluating the RV, the clinician must determine (1) if the patient’s RV strain is due to pressure or volume overload; and (2) if the patient’s RV is responsive or nonresponsive to a preload challenge, prompting an alteration in the resuscitation plan in nonresponsive cases.
Right Ventricular Pressure/Volume Overload
While inferior vena cava (IVC) ultrasound has been shown to be a pre-heart/lung assessment of cardiopulmonary interactions that predicts volume responsiveness, the IVC is also a good predictor of right atrial (RA) pressure.35 If the IVC is dilated and lacks respiratory variation, the patient likely has an elevated RA pressure, which is most likely transmitted from an elevated RV pressure (Figure 9a). However, compliance of the RA, RA pressure and, by extension, IVC prediction of that RA pressure, may underestimate the degree of RV pressure or afterload.
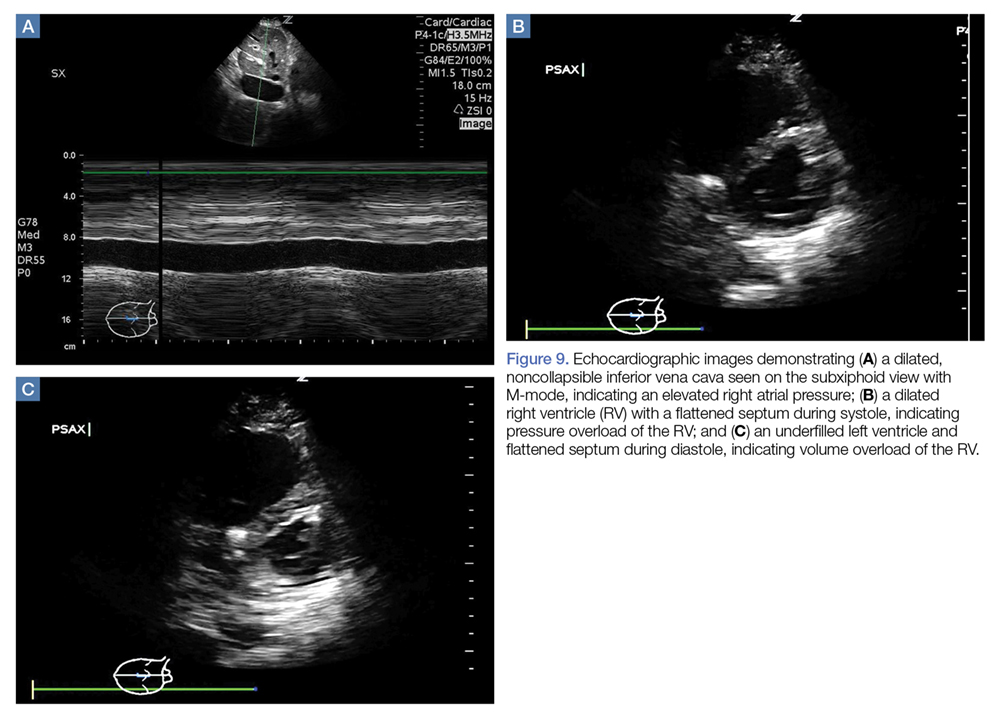
Right Ventricular Strain and Contractile Reserve
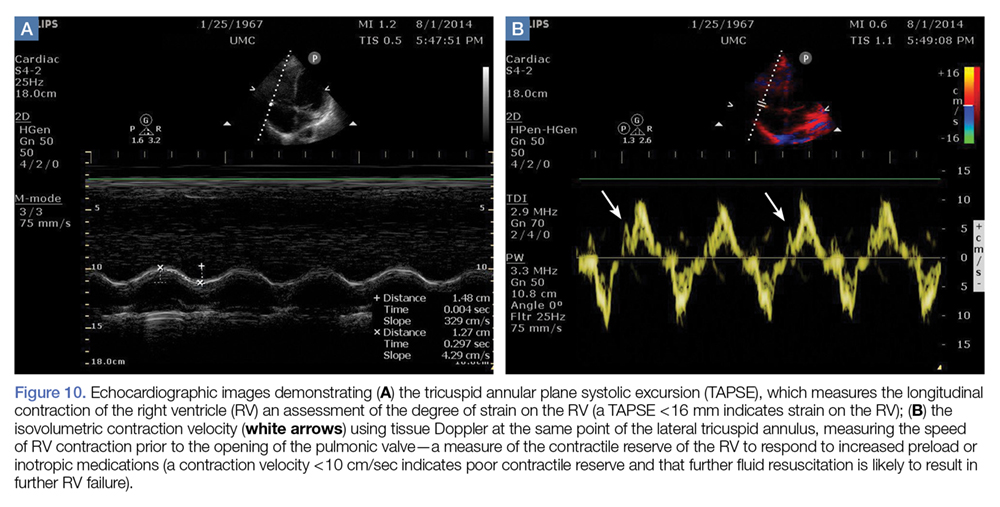
From the same apical view, tissue Doppler at the lateral tricuspid annulus will give a tricuspid annular peak velocity, a measure of the isovolumetric contraction velocity. This measurement will provide a measure of the contractile reserve of the RV (Figure 10b). A measure of less than 10 cm/sec indicates that further volume and inotropic challenges to the RV will not be effective, and the focus should be to decrease RV afterload with pulmonary vasodilators.34,39,40
Fluid Resuscitation Assessment
Restoring circulating volume to increase cardiac output and improve oxygen delivery is the primary objective when managing patients in shock. Patient outcomes improve dramatically with early aggressive fluid resuscitation.41-44 However, many critically ill patients do not respond to fluid resuscitation, which is generally defined as the rise of cardiac output of more than 15% in response to volume expansion. Not all patients found to be fluid responsive will require volume expansion.45,46
Excessive fluid resuscitation has been shown to increase intensive care unit length of stay, morbidity, and mortality.47,48 Further, pathophysiological processes such as RV dysfunction and severe diastolic dysfunction can significantly alter the hemodynamic profile such that fluid management can be quite challenging in critically ill patients.
Distinguishing responders from nonresponders prior to fluid administration is the goal of early resuscitation. Unfortunately, this distinction cannot be made based on the patient’s vital signs or the physical examination.49 Static filling pressures and volumetric measures are unreliable markers of fluid responsiveness.50,51 The practice of administering a fluid challenge and observing the clinical effect on cardiac output is undesirable because it requires, by definition, on administering fluids, which ultimately may be harmful to the patient.
Dynamic measures of fluid responsiveness that reliably predict cardiac response to a preload challenge are proven to be of greater utility.52,53 These assessments determine volume responsiveness by evaluating the change in LV output with intrathoracic pressure changes due to the respiratory cycle, (ie, cardiopulmonary interaction). Ultrasound studies to assess cardiopulmonary interactions include IVC variability, arterial flow variability, brachial artery peak velocity variability, and common carotid artery (CCA) flow. In addition to echocardiography, lung ultrasound may be used to determine the endpoint of fluid resuscitation by monitoring for the appearance of extravascular lung water.
Inferior Vena Cava Variability
The IVC is a large extrathoracic vein which is easily insonated and accessible, even to a clinician with basic bedside ultrasound competency. Static IVC measures, such as diameter alone, correlate with central venous pressure but do not predict fluid responsiveness.54-56 Dynamic IVC evaluation provides an upstream assessment of cardiopulmonary interactions.
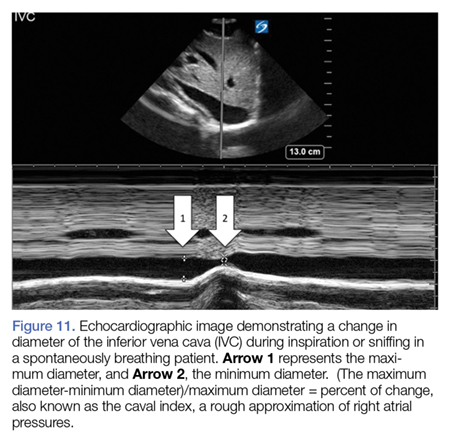
In the spontaneously breathing patient, the IVC collapses with inspiration as the RA pressure falls below atmospheric pressure, collapsing the intrathoracic veins for a short period until the intravascular pressure at the entry to the thorax exceeds atmospheric pressure, causing a bolus of venous return to the right heart. The overall effect is an increase in venous return59. Conversely, in the mechanically ventilated patient, the IVC will distend with insufflation as increased intrathoracic pressure results in increased RV afterload and a transient increase in pulmonary artery pressure with an overall net decrease in venous return.60
This IVC variability, termed the caval index, quantifies the degree of change in size of the IVC between end-inspiration and end-expiration. An M-mode imaging evaluation of the IVC allows for measurement of the maximal and minimal diameters for this calculation (Figure 11). Passively mechanically ventilated patients, with tidal volumes (TV) of 8 to 10 cc/kg in sinus rhythm, are predictably volume-responsive when the IVC distends by 12% to 18%.54,61,62 However, there is considerable debate as to whether evaluating the degree of IVC collapse is of value in spontaneously breathing patients.63 Cardiopulmonary interactions that drive IVC variability are affected by variable TV, intrathoracic pressure changes, etc. Nonetheless, two studies have shown that IVC collapse reliably predicts fluid responsiveness in spontaneously breathing patients.64,65
Stroke Volume/Arterial Flow Variability
Intrathoracic pressure changes induce dynamic changes in venous return that ultimately result in alterations in LV stroke volume (LVSV) when the blood volume traverses pulmonary circulation.66 This variability in LVSV is the basis for all dynamic assessments of cardiopulmonary interactions, whether by arterial pressure waveform analysis or echocardiographic assessment of arterial flow.
The LVSV variability reliably predicts fluid responsiveness and may be assessed by esophageal Doppler echocardiography of the ascending aorta.67,68 Transesophageal echocardiography has also been used to assess SV variability at the LVOT.69 Both of these measures require equipment and skill that may not be available in every clinical setting. Fortunately, LVOT SV is easily obtained through transthoracic echocardiography (TTE) (Figures 7a and 7b) using LVOT Doppler velocities as a surrogate for SV variations. A small study of TTE in mechanically ventilated children found that aortic flow variability predicted fluid responsiveness.70 Therefore, transthoracic echocardiography provides a well-established alternative to thermodilution in determining cardiac output. Multiplication of the HR by an estimate of the column of blood flowing through the LVOT with each systolic contraction gives the cardiac output.71
Using TTE measurement of SV and cardiac output, the clinician can assess the effect of small fluid challenges on cardiac output.72 Cardiac output can be augmented with the passive leg raise (PLR), which is an entirely reversible preload challenge maneuver thought to increase preload by 300 to 500 mL. To assess volume responsiveness using this technique, LVOT cardiac output must first be determined. With the transducer in place, the patient’s legs are lifted to a 45° angle. After a minute of equilibration, the LVOT VTI is repeated and cardiac output recalculated. An increase in VTI of more than 12.5% predicts an increase in cardiac output with volume expansion.73,74 This procedure requires proficiency with pulsed-wave Doppler and the ability to obtain the apical five-chamber view while a patient’s legs are being manipulated. In addition, the angle of insonation and location of measurement of LVOT and VTI must not vary for this measure to be valid.
Alternatively, respiratory variation in LVOT peak velocities has been shown to reliably predict volume responsiveness when variability is more than 12% (Figure 7c).69 This measurement is easier to obtain in that it does not require multiple views or complex calculations, and can be easily augmented with a passive leg raise maneuver.
Brachial Artery Peak Velocity Variation
In the search for easily accessible alternatives to cardiac and aortic flow, brachial artery peak velocity variation (BAPVV) was found to be useful for predicting volume responsiveness.75 To perform this study, the brachial artery is imaged in the long axis view using a linear transducer. Doppler gating should be adjusted to ensure an angle of less than 60°. The patient’s BAPVV is calculated as the difference between maximum and minimum peak velocity divided by the mean peak velocity. A variability in peak velocity of more than 10% predicts volume responsiveness.75
Common Carotid Artery Flow
Similarly, CCA flow has attracted attention as a potential surrogate to assess SV response to preload challenge.76,77 The CCA is large, easily accessible and does not require specialized training to assess (Figure 12).78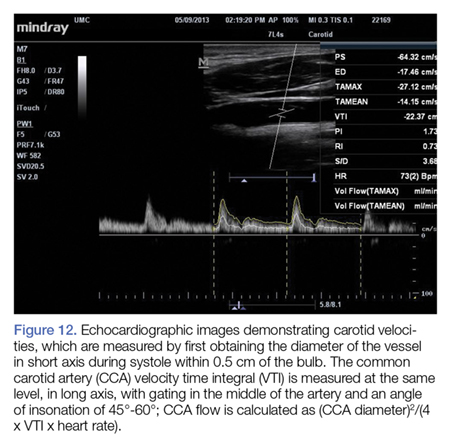
Even though cardiopulmonary interaction assessment has excellent performance for predicting volume responsiveness, limitations do exist. For example, cardiopulmonary interactions may be exaggerated or diminished—thus decreasing the reliability of this assessment—in patients on mechanical ventilation who have spontaneous breathing, high positive end-expiratory pressures or a high minute ventilation, low TV, dysrhythmias, external compression of extra- or intrathoracic vessels (eg, intra-abdominal hypertension, pericardial tamponade, COPD/asthma exacerbations); and in patients who have decreased arterial elastance, or high RV afterload causing RV dysfunction or failure.
Conclusion
The advanced ultrasound techniques described in this review provide several useful tools to rapidly evaluate and manage cardiopulmonary interactions and assess the hemodynamic profile of critically ill patients. With these bedside techniques added to basic POCUS examinations, a new era in noninvasive critical care management is now available.
As we enter the days of precision medicine, these examinations will enable EPs to optimize the care of this high-risk patient population. Moreover, future research by the emergency ultrasound and critical care communities on morbidity and mortality associated with resuscitation strategies in the ED will undoubtedly incorporate cardiopulmonary and hemodynamic ultrasound.
1. Kanji HD, McCallum J, Sirounis D, MacRedmond R, Moss R, Boyd JH. Limited echocardiography-guided therapy in subacute shock is associated with change in management and improved outcomes. J Crit Care. 2014;29(5):700-705. doi:10.1016/j.jcrc.2014.04.008.
2. Raja AS, Jacobus CH. How accurate is ultrasonography for excluding pneumothorax? Ann Emerg Med. 2013;61(2):207-208. doi:10.1016/j.annemergmed.2012.07.005.
3. Alrajhi K, Woo MY, Vaillancourt C. Test characteristics of ultrasonography for the detection of pneumothorax: a systematic review and analysis. Chest. 2012;141(3):703-708. doi:10.1378/chest.11-0131.
4. Blaivas M, Lyon M, Duggal S. A prospective comparison of supine chest radiography and bedside ultrasound for the diagnosis of traumatic pneumothorax. Acad Emerg Med. 2005;12(9):844-849. doi:10.1197/j.aem.2005.05.005.
5. Zanobetti M, Poggioni C, Pini R. Can chest ultrasonography replace standard chest radiography for evaluation of acute dyspnea in the ED? Chest. 2011;139(5):1140-1147.
6. Lichtenstein D, Goldstein I, Mourgeon E, Cluzel P, Grenier P, Rouby JJ. Comparative diagnostic performances of auscultation, chest radiography, and lung ultrasonography in acute respiratory distress syndrome. Anesthesiology. 2004;100(1):9-15.
7. Xirouchaki N, Magkanas E, Vaporidi K, et al. Lung ultrasound in critically ill patients: comparison with bedside chest radiography. Intensive Care Med. 2011;37(9):1488-1493. doi:10.1007/s00134-011-2317-y.
8. Lichtenstein DA. Lung ultrasound in the critically ill. Ann Intensive Care. 2014;4(1):1.
9. Lichtenstein DA, Mezière G, Lascols N, et al. Ultrasound diagnosis of occult pneumothorax. Crit Care Med. 2005;33(6):1231-1238.
10. Slater A, Goodwin M, Anderson KE, Gleeson FV. COPD can mimic the appearance of pneumothorax on thoracic ultrasound. Chest. 2006;129(3):545-550. doi:10.1378/chest.129.3.545.
11. Lichtenstein DA, Lascols N, Prin S, Mezière G. The “lung pulse”: an early ultrasound sign of complete atelectasis. [published online ahead of print October 14, 2003]. Intensive Care Med. 2003;29(12):2187-2192. doi:10.1007/s00134-003-1930-9.
12. Lichtenstein D. Fluid administration limited by lung sonography: the place of lung ultrasound in assessment of acute circulatory failure (the FALLS-protocol). Expert Rev Respir Med. 2012;6(2):155-162. doi:10.1586/ers.12.13.
13. Lichtenstein D, Mezière G. A lung ultrasound sign allowing bedside distinction between pulmonary edema and COPD: the comet-tail artifact. Intensive Care Med. 1998;24(12):1331-1334.
14. Dickman E, Terentiev V, Likourezos A, Derman A, Haines L. Extension of the thoracic spine sign: a new sonographic marker of pleural effusion. [published online ahead of print August 12, 2015]. J Ultrasound Med. 2015;34(9):1555-1561. doi:10.7863/ultra.15.14.06013.
15. Noble VE, Murray AF, Capp R, Sylvia-Reardon MH, Steele DJ, Liteplo A. Ultrasound assessment for extravascular lung water in patients undergoing hemodialysis. Time course for resolution. [published online ahead of print February 2, 2009]. Chest. 2009;135(6):1433-1439. doi:10.1378/chest.08-1811.
16. Lichtenstein D. Lung and Interstitial Syndrome. In: Lichtenstein D, ed. Whole Body Ultrasonography in the Critically IIl. New York, NY: Springer; 2010:151-157.
17. Lichtenstein DA, Mezière GA, Lagoueyte JF, Biderman P, Goldstein I, Gepner A. A-lines and B-lines: lung ultrasound as a bedside tool for predicting pulmonary artery occlusion pressure in the critically ill. Chest. 2009;136(4):1014-1020. doi:10.1378/chest.09-0001.
18. Romero-Bermejo FJ, Ruiz-Bailen M, Gil-Cebrian J, Huertos-Ranchal MJ. Sepsis-induced cardiomyopathy. Curr Cardiol Rev. 2011;7(3):163-183.
19. Sanfilippo F, Corredor C, Fletcher N, et al. Diastolic dysfunction and mortality in septic patients: a systematic review and meta-analysis. [published online ahead of print March 24, 2015]. Intensive Care Med. 2015;41(6):1004-1013. doi:10.1007/s00134-015-3748-7.
20. Randazzo MR, Snoey ER, Levitt MA, Binder K. Accuracy of emergency physician assessment of left ventricular ejection fraction and central venous pressure using echocardiography. Acad Emerg Med. 2003;10(9):973-977.
21. Reardon R. Cardiac. In: Ma O, Mateer J, eds. Emergency Ultrasound. 2nd ed. New York, NY: McGraw Hill Companies, Inc; 2008:114-115.
22. Martindale JL, Wakai A, Collins SP, et al. Diagnosing acute heart failure in the emergency department: a systematic review and meta-analysis. [published online ahead of print February 13, 2016]. Acad Emerg Med. 2016;23(3):223-242. doi:10.1111/acem.12878.
23. Cerqueira MD, Weissman NJ, Dilsizian V, et al; American Heart Association Writing Group on Myocardial Segmentation and Registration for Cardiac Imaging. Standardized myocardial segmentation and nomenclature for tomographic imaging of the heart. A statement for healthcare professionals from the Cardiac Imaging Committee of the Council on Clinical Cardiology of the American Heart Association. Circulation. 2002;105(4):539-542.
24. Lang RM, Bierig M, Devereux RB, et al. Recommendations for chamber quantification. [published online ahead of print February 2, 2006]. Eur J Echocardiogr. 2006;7(2):79-108. doi:10.1016/j.euje.2005.12.014.
25. Secko MA, Lazar JM, Salciccioli LA, Stone MB. Can junior emergency physicians use E-point septal separation to accurately estimate left ventricular function in acutely dyspneic patients? [published online ahead of print November 1, 2011]. Acad Emerg Med. 2011;18(11):1223-1226. doi:10.1111/j.1553-2712.2011.01196.x.
26. Dinh VA, Ko HS, Rao R, et al. Measuring cardiac index with a focused cardiac ultrasound examination in the ED. [published online ahead of print July 12, 2012]. Am J Emerg Med. 2012;30(9):1845-1851. doi:10.1016/j.ajem.2012.03.025.
27. Owan TE, Hodge DO, Herges RM, Jacobsen SJ, Roger VL, Redfield MM. Trends in prevalence and outcome of heart failure with preserved ejection fraction. N Engl J Med. 2006;355(3):251-259. doi:10.1056/NEJMoa052256.
28. Nagueh SF, Appleton CP, Gillebert TC, et al. Recommendations for the evaluation of left ventricular diastolic function by echocardiography. J Am Soc Echocardiogr. 2009;22(2):107-133. doi:10.1016/j.echo.2008.11.023.
29. Ommen SR, Nishimura RA. A clinical approach to the assessment of left ventricular diastolic function by Doppler echocardiography: update 2003. Heart. 2003;89 Suppl 3:iii18-23.
30. Haddad F, Hunt SA, Rosenthal DN, Murphy DJ. Right ventricular function in cardiovascular disease, part I: anatomy, physiology, aging, and functional assessment of the right ventricle. Circulation. 2008;117(11):1436-1448. doi:10.1161/CIRCULATIONAHA.107.653576.
31. Zochios V, Jones N. Acute right heart syndrome in the critically ill patient. Heart Lung Vessel. 2014;6(3):157-170.
32. Mekontso Dessap A, Boissier F, Charron C, et al. Acute cor pulmonale during protective ventilation for acute respiratory distress syndrome: prevalence, predictors, and clinical impact. [published online ahead of print December 9, 2015]. Intensive Care Med. 2016;42(5):862-870. doi:10.1007/s00134-015-4141-2.
33. Jardin F, Gueret P, Dubourg O, Farcot JC, Margairaz A, Bourdarias JP. Two-dimensional echocardiographic evaluation of right ventricular size and contractility in acute respiratory failure. Crit Care Med. 1985;13(11):952-956.
34. Dalabih M, Rischard F, Mosier JM. What’s new: the management of acute right ventricular decompensation of chronic pulmonary hypertension. [published online ahead of print September 3, 2014]. Intensive Care Med. 2014;40(12):1930-1933. doi:10.1007/s00134-014-3459-5.
35. Brennan JM, Blair JE, Goonewardena S, et al. Reappraisal of the use of inferior vena cava for estimating right atrial pressure. J Am Soc Echocardiogr. 2007;20(7):857-861. doi:10.1016/j.echo.2007.01.005.
36. Haddad F, Doyle R, Murphy DJ, Hunt SA. Right ventricular function in cardiovascular disease, part II: pathophysiology, clinical importance, and management of right ventricular failure. Circulation. 2008;117(13):1717-1731. doi:10.1161/CIRCULATIONAHA.107.653584.
37. McConnell MV, Solomon SD, Rayan ME, Come PC, Goldhaber SZ, Lee RT. Regional right ventricular dysfunction detected by echocardiography in acute pulmonary embolism. Am J Cardiol. 1996;78(4):469-473.
38. Gajanana D, Seetha Rammohan H, Alli O, et al. Tricuspid annular plane systolic excursion and its association with mortality in critically ill patients. [published online ahead of print March 1, 2015]. Echocardiography. 2015;32(8):1222-1227. doi:10.1111/echo.12926.
39. Rudski LG, Lai WW, Afilalo J, et al. Guidelines for the echocardiographic assessment of the right heart in adults: a report from the American Society of Echocardiography endorsed by the European Association of Echocardiography, a registered branch of the European Society of Cardiology, and the Canadian Society of Echocardiography. J Am Soc Echocardiogr. 2010;23(7):685-713; quiz 786-788. doi:10.1016/j.echo.2010.05.010.
40. Vogel M, Schmidt MR, Kristiansen SB, et al. Validation of myocardial acceleration during isovolumic contraction as a novel noninvasive index of right ventricular contractility: comparison with ventricular pressure-volume relations in an animal model. Circulation. 2002;105(14):1693-1699.
41. Rivers E, Nguyen B, Havstad S, et al. Early goal-directed therapy in the treatment of severe sepsis and septic shock. N Engl J Med. 2001;345(19):1368-1377. doi:10.1056/NEJMoa010307.
42. Peake SL, Delaney A, Bailey M, et al; ARISE Investigators, ANZICS Clinical Trials Group. Goal-directed resuscitation for patients with early septic shock. [published online ahead of print October 1, 2014]. N Engl J Med. 2014;371(16):1496-1506. doi:10.1056/NEJMoa1404380.
43. Yealy DM, Kellum JA, Huang DT, et al; ProCESS Investigators. A randomized trial of protocol-based care for early septic shock. [published online ahead of print March 18, 2014]. N Engl J Med. 2014;370(18):1683-1693. doi:10.1056/NEJMoa1401602.
44. Mouncey PR, Osborn TM, Power GS, et al. Trial of early, goal-directed resuscitation for septic shock. [published online ahead of print March 17, 2015]. N Engl J Med. 2015;372(14):1301-1311. doi:10.1056/NEJMoa1500896.
45. Marik PE, Lemson J. Fluid responsiveness: an evolution of our understanding. [published online ahead of print February 16, 2014]. Br J Anaesth. 2014;112(4):617-620. doi:10.1093/bja/aet590.
46. Marik PE. Fluid Responsiveness and the Six Guiding Principles of Fluid Resuscitation. Crit Care Med. 2016;44(10):1920-1922. doi:10.1097/CCM.0000000000001483.
47. Boyd JH, Forbes J, Nakada TA, Walley KR, Russell JA. Fluid resuscitation in septic shock: a positive fluid balance and elevated central venous pressure are associated with increased mortality. Crit Care Med. 2011;39(2):259-265. doi:10.1097/CCM.0b013e3181feeb15.
48. Wiedemann HP, Wheeler AP, Bernard GR, et al; National Heart, Lung, and Blood Institute Acute Respiratory Distress Syndrome (ARDS) Clinical Trials Network. Comparison of two fluid-management strategies in acute lung injury. [published online ahead of print May 21, 2006]. N Engl J Med. 2006;354(24):2564-2575. doi:10.1056/NEJMoa062200.
49. McGee S, Abernethy WB 3rd, Simel DL. The rational clinical examination. Is this patient hypovolemic? JAMA. 1999;281(11):1022-1029.
50. Marik PE, Cavallazzi R. Does the central venous pressure predict fluid responsiveness? An updated meta-analysis and a plea for some common sense. Crit Care Med. 2013;41(7):1774-1781. doi:10.1097/CCM.0b013e31828a25fd.
51. Osman D, Ridel C, Ray P, et al. Cardiac filling pressures are not appropriate to predict hemodynamic response to volume challenge. Crit Care Med. 2007;35(1):64-68. doi:10.1097/01.CCM.0000249851.94101.4F.
52. Marik PE, Cavallazzi R, Vasu T, Hirani A. Dynamic changes in arterial waveform derived variables and fluid responsiveness in mechanically ventilated patients: a systematic review of the literature. Crit Care Med. 2009;37(9):2642-2647. doi:10.1097/CCM.0b013e3181a590da.
53. Michard F, Teboul JL. Predicting fluid responsiveness in ICU patients: a critical analysis of the evidence. Chest. 2002;121(6):2000-2008.
54. Feissel M, Michard F, Faller JP, Teboul JL. The respiratory variation in inferior vena cava diameter as a guide to fluid therapy. [published online ahead of print March 25, 2004]. Intensive Care Med. 2004;30(9):1834-1837. doi:10.1007/s00134-004-2233-5.
55. Marik PE, Baram M, Vahid B. Does central venous pressure predict fluid responsiveness? A systematic review of the literature and the tale of seven mares. Chest. 2008;134(1):172-178. doi:10.1378/chest.07-2331.
56. Nagdev AD, Merchant RC, Tirado-Gonzalez A, Sisson CA, Murphy MC. Emergency department bedside ultrasonographic measurement of the caval index for noninvasive determination of low central venous pressure. [published online ahead of print June 25, 2009]. Ann Emerg Med. 2010;55(3):290-295. doi:10.1016/j.annemergmed.2009.04.021.
57. Wallace DJ, Allison M, Stone MB. Inferior vena cava percentage collapse during respiration is affected by the sampling location: an ultrasound study in healthy volunteers. [published online ahead of print December 9, 2009]. Acad Emerg Med. 2010;17(1):96-99. doi:10.1111/j.1553-2712.2009.00627.x.
58. Blehar DJ, Resop D, Chin B, Dayno M, Gaspari R. Inferior vena cava displacement during respirophasic ultrasound imaging. Crit Ultrasound J. 2012;4(1):18. doi:10.1186/2036-7902-4-18.
59. Funk DJ, Jacobsohn E, Kumar A. The role of venous return in critical illness and shock-part I: physiology. Crit Care Med. 2013;41(1):255-262. doi:10.1097/CCM.0b013e3182772ab6.
60. Lansdorp B, Hofhuizen C, van Lavieren M, et al. Mechanical ventilation-induced intrathoracic pressure distribution and heart-lung interactions*. Crit Care Med. 2014;42(9):1983-1990. doi:10.1097/CCM.0000000000000345.
61. Barbier C, Loubières Y, Schmit C, et al. Respiratory changes in inferior vena cava diameter are helpful in predicting fluid responsiveness in ventilated septic patients. [published online ahead of print March 18, 2004]. Intensive Care Med. 2004;30(9):1740-1746. doi:10.1007/s00134-004-2259-8.
62. Machare-Delgado E, Decaro M, Marik PE. Inferior vena cava variation compared to pulse contour analysis as predictors of fluid responsiveness: a prospective cohort study. J Intensive Care Med. 2011;26(2):116-124. doi:10.1177/0885066610384192.
63. Corl K, Napoli AM, Gardiner F. Bedside sonographic measurement of the inferior vena cava caval index is a poor predictor of fluid responsiveness in emergency department patients. [published online ahead of print September 7, 2012]. Emerg Med Australas. 2012;24(5):534-539. doi:10.1111/j.1742-6723.2012.01596.x.
64. Lanspa MJ, Grissom CK, Hirshberg EL, Jones JP, Brown SM. Applying dynamic parameters to predict hemodynamic response to volume expansion in spontaneously breathing patients with septic shock. Shock. 2013;39(2):155-160. doi:10.1097/SHK.0b013e31827f1c6a.
65. Muller L, Bobbia X, Toumi M, et al. Respiratory variations of inferior vena cava diameter to predict fluid responsiveness in spontaneously breathing patients with acute circulatory failure: need for a cautious use. Crit Care. 2012;16(5):R188. doi:10.1186/cc11672.
66. de Witt B, Joshi R, Meislin H, Mosier JM. Optimizing oxygen delivery in the critically ill: assessment of volume responsiveness in the septic patient. [published online ahead of print August 1, 2014]. J Emerg Med. 2014;47(5):608-615. doi:10.1016/j.jemermed.2014.06.015.
67. Monnet X, Rienzo M, Osman D, et al. Esophageal Doppler monitoring predicts fluid responsiveness in critically ill ventilated patients. [published online ahead of print July 30, 2005]. Intensive Care Med. 2005;31(9):1195-1201. doi:10.1007/s00134-005-2731-0.
68. Slama M, Masson H, Teboul JL, et al. Monitoring of respiratory variations of aortic blood flow velocity using esophageal Doppler. [published online ahead of print March 5, 2004]. Intensive Care Med. 2004;30(6):1182-1187. doi:10.1007/s00134-004-2190-z.
69. Feissel M, Michard F, Mangin I, Ruyer O, Faller JP, Teboul JL. Respiratory changes in aortic blood velocity as an indicator of fluid responsiveness in ventilated patients with septic shock. Chest. 2001;119(3):867-873.
70. Durand P, Chevret L, Essouri S, Haas V, Devictor D. Respiratory variations in aortic blood flow predict fluid responsiveness in ventilated children. [published online ahead of print February 8, 2008]. Intensive Care Med. 2008;34(5):888-894. doi:10.1007/s00134-008-1021-z.
71. Lewis JF, Kuo LC, Nelson JG, Limacher MC, Quinones MA. Pulsed Doppler echocardiographic determination of stroke volume and cardiac output: clinical validation of two new methods using the apical window. Circulation. 1984;70(3):425-431.
72. Muller L, Toumi M, Bousquet PJ, et al. An increase in aortic blood flow after an infusion of 100 ml colloid over 1 minute can predict fluid responsiveness: the mini-fluid challenge study. Anesthesiology. 2011;115(3):541-547. doi:10.1097/ALN.0b013e318229a500.
73. Lamia B, Ochagavia A, Monnet X, Chemla D, Richard C, Teboul JL. Echocardiographic prediction of volume responsiveness in critically ill patients with spontaneously breathing activity. [published online ahead of print May 17, 2007]. Intensive Care Med. 2007;33(7):1125-1132. doi:10.1007/s00134-007-0646-7.
74. Maizel J, Airapetian N, Lorne E, Tribouilloy C, Massy Z, Slama M. Diagnosis of central hypovolemia by using passive leg raising. [published online ahead of print May 17, 2007]. Intensive Care Med. 2007;33(7):1133-1138. doi:10.1007/s00134-007-0642-y.
75. Monge García MI, Gil Cano A, Díaz Monrové JC. Brachial artery peak velocity variation to predict fluid responsiveness in mechanically ventilated patients. [published online ahead of print September 3, 2009]. Crit Care. 2009;13(5):R142. doi:10.1186/cc8027.
76. Blehar DJ, Glazier S, Gaspari RJ. Correlation of corrected flow time in the carotid artery with changes in intravascular volume status. [published online ahead of print April 2, 2014]. J Crit Care. 2014;29(4):486-488. doi:10.1016/j.jcrc.2014.03.025.
77. Mackenzie DC, Khan NA, Blehar D, et al. Carotid Flow Time Changes With Volume Status in Acute Blood Loss. [published online ahead of print May 21, 2005]. Ann Emerg Med. 2015;66(3):277-282.e1. doi:10.1016/j.annemergmed.2015.04.014.
78. Stolz LA, Mosier JM, Gross AM, Douglas MJ, Blaivas M, Adhikari S. Can emergency physicians perform common carotid Doppler flow measurements to assess volume responsiveness? [published online ahead of print February 26, 2015]. West J Emerg Med. 2015;16(2):255-259. doi:10.5811/westjem.2015.1.24301.
79. Marik PE, Levitov A, Young A, Andrews L. The use of bioreactance and carotid Doppler to determine volume responsiveness and blood flow redistribution following passive leg raising in hemodynamically unstable patients. Chest. 2013;143(2):364-370. doi:10.1378/chest.12-1274.
Critically ill patients presenting to the ED represent the most time-sensitive patient encounter for the emergency physician (EP), as delays in restoring physiological homeostasis increase the risks of organ dysfunction and death. Management and treatment strategies in critically ill patients have evolved from the routine use of invasive catheters and radiography for cardiopulmonary evaluation to a variety of noninvasive devices and pathways. The widespread adoption of point-of-care ultrasound (POCUS) in EDs provides the opportunity to rapidly obtain invaluable information about the diagnosis and etiology to guide resuscitation in critically ill patients—particularly those in shock and acute dyspnea.
Over the last two decades, EPs and critical care physicians have employed POCUS to assist in identifying emergent reversible causes of shock and cardiac arrest, including cardiac tamponade, massive pulmonary embolism (PE), and hemoperitoneum. Recent advances in hemodynamic and cardiopulmonary POCUS allow for a nuanced approach to hemodynamic evaluation.1 In addition, the use of ultrasound “first” in the critical care setting may reduce the dependence on radiographic-based management, catheter-based protocols, and the need for invasive procedures.
Bedside cardiopulmonary ultrasound to evaluate the hemodynamic status of hypotensive patients can help determine the etiology of shock, provide evidence of fluid-volume responsiveness, visualize hemodynamic abnormalities that would alter fluid resuscitation strategies, and assess patient response to an intervention. The use of ultrasound can also identify the etiology of acute respiratory failure—providing the opportunity to initiate the appropriate interventions prior to patient decompensation. Findings such as pneumothorax or pleural effusion may require immediate procedural intervention, while other findings may only require noninvasive positive pressure ventilation and diuresis.
The tools to implement these concepts include basic POCUS education common to emergency medicine and critical care (American College of Emergency Physicians Guidelines and American College of Chest Physicians/Society of Critical Care Medicine guidelines); ultrasound machines with phased array, linear, and curvilinear probes; and ultrasonographic instrumentation such as M-Mode, color Doppler, and spectral Doppler. An understanding of common Doppler imaging techniques optimizes the examination, and the use of presets common to cardiac packages may further assist the provider with adoption.
When evaluating critically ill patients, we recommend the following step-wise approach:
- Identify a clinical question to be answered prior to doing the examination;
- Determine the hemodynamic profile of the patient to guide therapeutic maneuvers; and
- Monitor the response to any therapeutic maneuver and adjust accordingly. (In these complicated patients, repeat examinations are invaluable, as the hemodynamic profile can change rapidly.)
Thoracic Assessment
Emergency physicians are increasingly utilizing POCUS to rapidly evaluate the thoracic cavity in critically ill patients. This modality is an appealing alternative to formal chest radiography because of the ease of rapid image acquisition, lack of ionizing radiation, and the ability to repeat the examination in real-time.
When critically ill patients present in respiratory distress, POCUS allows the EP to rapidly diagnose potential etiologies, such as pleural effusion, pneumothorax, or pulmonary edema, and employ emergent intervention, which can greatly alter the patient’s clinical course. Additionally, the rapid diagnosis of consolidation permits earlier appropriate management of sepsis and respiratory failure when the clinical setting is consistent with pneumonia.
In many cases, ultrasound has been shown to be superior to traditional chest radiography to assess critically ill patients.2-8 Although there are several protocols that utilize thoracic ultrasound in evaluating the critical patient, this review focuses solely on the components of thoracic ultrasound, rather than specific protocols.
Pneumothorax
Ultrasound imaging with a high-frequency probe is highly sensitive and specific in assessing for pneumothorax in a supine patient.9 In the normal lung, the visceral and parietal pleura are visualized as sliding with each breath. In this examination, the transducer is placed on the chest wall to visualize two ribs and the pleura between them (Figures 2a and 2b).
When lung sliding is present, the appearance in M-mode is that of the “seashore” or “sandy beach.” The hyperechoic white pleura is seen as moving with the respiratory cycle. Additionally, lung artifacts such as A-lines, horizontal reverberation artifacts; and B-lines (also referred to as “comet-tails”), vertical lines arising from distended subpleural alveoli, will be seen in a normal lung. If pneumothorax is present, no sliding or comet-tail artifacts will be present at the pleural surface. Although A-lines may also be absent in pneumothorax, studies have shown that the absence of lung sliding and the presence of A-lines are associated with increased specificity (94% vs 78% with absent lung sliding alone) for diagnosing occult pneumothorax.9
While the lack of pleural sliding is highly sensitive for pneumothorax, the clinician must place this finding within the clinical context of the patient. For example, an intubated patient may not have left-sided sliding in the case of a right main-stem intubation. Moreover, patients who have an underlying obstructive lung disease (eg, chronic obstructive pulmonary disease [COPD]) and/or emphysema may present a more challenging examination because pleural sliding is often absent, especially in the apical segments, and can mimic pneumothorax in these patients.10
In addition to pleural sliding, presence or absence of a lung pulse also assists in assessing patients for pneumothorax. The detection of a lung pulse on M-mode ultrasound indicates subtle cardiac pulsation at the periphery of the lung; this finding only appears in the nonventilated lung in the absence of a pneumothorax. The presence of lung pulse is therefore useful in distinguishing other causes of nonventilated lung from pneumothorax.11
Pleural Fluid
The low-frequency curvilinear or phased array probes are used to assess for pleural fluid. In this study, the clinician fans the probe cephalad from Morison’s pouch on the patient’s right side, or from the splenorenal recess on the left side, to visualize the bright, hyperechoic diaphragm. If pleural fluid is present, there will be loss of the mirroring artifact, and the fluid will appear as an anechoic collection cephalad to the diaphragm. In addition, when fluid is present, the normal lung may be visualized moving within the effusion, evoking a quad or sinusoid sign with M-mode imaging.12,13 In the setting of complicated parapneumonic effusion, the echogenicity may be mixed or difficult to detect.
Visualization of the thoracic spine above the diaphragm may serve as a surrogate marker for the presence of fluid. Typically, the thoracic spine is not visualized on ultrasound due to the scatter caused by the air-filled lungs.
Ultrasound has been shown to be superior to routine chest radiograph for the identification of small pleural effusions.7 Given that both critically ill medical and injured patients can present with pleural fluid, the use of POCUS to rapidly determine the presence or absence of fluid is an adjunct in the evaluation of these patients.
Interstitial Fluid
Evaluation of the thoracic cavity for interstitial fluid in the setting of acute pulmonary edema, acute respiratory distress syndrome (ARDS), or interstitial pneumonia is best accomplished using either the curvilinear low-frequency probe or the phased array probe. The visualization of vertically oriented B-lines in the upper lung fields is very sensitive for interstitial fluid or edema of the interlobular septa (Figures 2a and 2b).13,15 In this study, B-lines originate at the pleural line, move with the pleura, and extend off the bottom of the monitor without obliteration (in contrast to A-lines). An isolated B-line may be physiological; however, the presence of several B-lines is consistent with an interstitial pathology. On imaging, the presence of three or more B-lines in a single rib space with a convex probe, or more than six B-lines when utilizing the curvilinear, is considered pathological and referred to as “lung rockets.” B-lines may be focal or diffuse, as seen respectively in cases of pneumonia or acute pulmonary edema.16
Pulmonary Assessment for Fluid Resuscitation
Fluid Resuscitation
Lung ultrasound studies have been proposed as a means of determining adequate fluid resuscitation and preventing complications associated with excessive fluid. The appearance of diffuse B-lines of acute interstitial syndrome on lung ultrasound can uncover the first signs of extravascular lung water and prevent pulmonary alveolar edema and associated morbidity and mortality.17 The appearance of an A-line predominance throughout the lung does not predict fluid responsiveness, but rather potential fluid tolerance.
A benefit of lung ultrasound is that it provides information more rapidly than many of the dynamic measures of fluid responsiveness and cardiac output variability. In addition, lung ultrasound studies are much more easily reproduced than repeating a velocity time integral (VTI) measurements.
Lichtenstein’s FALLS Protocol
Lichtenstein’s FALLS (Fluid Administration Limited by Lung Sonography) protocol provides an approach to performing lung ultrasound on patients presenting in shock.12 In this approach, lung ultrasound studies are performed after echocardiography to evaluate the patient for causes of obstructive shock. The predominance of B-lines on lung ultrasound suggests cardiogenic shock and, by definition, fluid intolerance. The predominance of A-lines on ultrasound may be present in patients in hypovolemic or septic shock.
In hypovolemic shock, continued fluid boluses will improve hemodynamics with preserved A-line predominance. In septic shock, B-lines will begin to appear, suggesting that other means of improving forward flow should be initiated.
Consolidation
Chest radiography is known to have variable test characteristics for the detection of pneumonia. Consolidation may not be detected in profoundly immunocompromised or dehydrated patients. Additionally, in critically ill patients, it is often challenging to obtain a posteroanterior and lateral chest X-ray, given the patient’s hemodynamic status and stability for transport, and a single portable anteroposterior film will often miss retrocardiac infiltrates. In both of these clinical settings, POCUS can provide a rapid diagnosis, expediting the care of these septic patients.
In the presence of a dense consolidation, there may be hepatization of the lung parenchyma (Figure 4b). Additionally, hyperechoic air bronchograms are often visualized. Pneumonia is often associated with pleural effusion and localized B-lines. Using lung ultrasound, rapid bedside detection of these pulmonary findings in clinical presentations suggestive of pneumonia can accelerate appropriate antibiotic and respiratory supportive treatment.
Left Ventricular Systolic Assessment
Critically ill patients commonly present with a mixed shock picture, and it is rare for a patient to have solely cardiogenic shock, hemorrhagic shock, etc. Rather, a patient who presents in septic shock may have an underlying cardiomyopathy for which she or he is being treated with a beta-blocker.
Cardiomyopathy associated with sepsis is common18 and, at least in the case of diastolic dysfunction, it is underdiagnosed and associated with a higher mortality rate.19 It is therefore essential that the EP evaluate left ventricular (LV) systolic function rapidly and reliably—particularly in critically ill patients whose disease process may be undifferentiated and whose hemodynamic status is unclear.20-22 Bedside echocardiography by the EP is invaluable in identifying the LV contribution to the hemodynamic profile and tailoring resuscitation to optimize patient outcomes.
Although gross visual assessment is the most widely used method by which EPs estimate LV systolic function, this strategy is subjective, operator-dependent, and requires at least two quality views to understand the heart’s three-dimensional movement. However, when faced with a rapid diagnostic dilemma, a global visual estimate of the overall contractility (hyperdynamic, normal, depressed, severely depressed) may be more useful than estimating the ejection fraction (EF), especially when the patient’s baseline EF is unknown.
Regional Wall-Motion Abnormalities
Regional wall-motion abnormalities can be evaluated by considering and correlating the coronary artery distributions with the electrocardiographic findings and the clinical scenario (Figure 5).
Simpson’s Rule
Although no one parameter can quantitatively assess LV function, the EF is the one most commonly used. The Simpson’s Rule or the “method of disks” estimates EF by changes in calculated ventricular volumes. The endocardial border is outlined in end-diastole and end-systole (ES) in both the apical four- (AP4) and two-chamber views. The cardiac package on the ultrasound system can divide the selected area into a series of disks, calculate the volume of each disk, and then add these figures to estimate the ventricular volume (Figure 6a). Limitations of this study include potentially difficult visualization of the endocardial border, and the length of time to conduct this study.
Fractional Shortening
M-mode ultrasound can be used in several ways to estimate LV EF. Fractional shortening (FS) estimates the size reduction of the LV during systole. In the parasternal long axis (PLAX) view, the M-mode cursor is placed over the walls of the LV, just apical to the tips of the mitral valve (MV) leaflets (Figure 6b). Maximal (end-diastolic diameter [EDD]) and minimal (end-systolic diameter [ESD]) dimensions of the LV are measured and FS is calculated as (LVEDD – LVESD)/ LVEDD. A normal value is more than 25%, and a rough estimate of EF is FS x 2.24 Limitations to this study include nonplacement of the M-mode cursor perpendicular to the LV walls, and inaccuracy in patients with regional wall abnormalities.
E-Point Septal Separation
Another way to assess EF with POCUS is through E-point septal separation (EPSS), which uses the movement of the MV during diastole to estimate the EF during systole. In the PLAX view, the M-mode cursor is placed over the apical tip of the anterior leaflet of the MV to visualize the movement of the leaflet in relation to the interventricular septum (Figure 6c). Two characteristic waves are created during each diastole—the larger first wave representing early filling (the E-wave) and the smaller second wave representing the atrial kick (the A-wave). The E-point is the tallest point of the E-wave, and the EPSS is measured as the distance in millimeters between the E-point and the interventricular septum.21
The opening of the anterior leaflet of the MV toward the interventricular septum in diastole requires a pressure difference between the left atrium (LA) and LV. In a patient with poor LV systolic function, the LV is still full at the end of systole, the pressure difference is not as great, and the mitral leaflets will not snap open vigorously. The EPSS should be at or less than 6 mm in patients with normal LV systolic function. An EPSS of 6 to 12 mm suggests moderately depressed LV systolic function, and over 12 mm signifies severely decreased LV systolic function.25 Limitations include inaccuracy in patients with valvular abnormalities, such as mitral stenosis or aortic regurgitation, severe LV or septal hypertrophy, regional wall abnormalities or severe LV dilation, limited data, and a wide margin of error when comparing to magnetic resonance imaging measurement of EF.
Cardiac Output
Left Ventricular Diastolic Assessment
In an aging population of patients who have longstanding, undiagnosed, or untreated hypertension, LV hypertrophy leads to impaired relaxation and diastolic filling, eventually causing elevated LA pressure and, in extreme cases, restrictive cardiomyopathy. It has been reported that approximately half of all symptomatic patients with heart failure have a preserved EF.27
Determination of LV pressures allows for the distinction between hydrostatic pulmonary edema and ARDS. Diagnosing elevated LA pressure is not inconsequential, as diastolic dysfunction in septic patients has been associated with increased mortality, likely due to increased pulmonary edema from fluid resuscitation.19 An invasive method of using a pulmonary artery catheter and measuring the pulmonary artery occlusion pressure to estimate the LA pressure is the gold standard, but is no longer routinely performed.
Echocardiography is a noninvasive surrogate to estimating LA and LV filling pressures. Two different echocardiographic measurements can be used in conjunction to estimate LV filling pressures: MV inflow velocity and tissue Doppler imaging.
Mitral Valve Inflow Velocity
Assessment of the MV inflow is performed by placing the pulse-wave Doppler gate between the tips of the MV leaflets in the AP4 view. Early diastolic filling produces the E-wave, and LA contraction produces the late diastolic A-wave (Figure 8a).
Tissue Doppler Imaging
Tissue Doppler imaging enables the clinician to measure myocardial velocities such as the speed of relaxation to evaluate if LV relaxation is due to a drop in LV pressure below LA pressure after systole, pulling the MV open; or if increased LA pressure is required to push open the MV and fill the LV.
For this study, the tissue Doppler sampling gate is placed at the septal or lateral annulus of the MV in the AP4 view to visualize early diastolic mitral annulus velocity (e’) (Figure 8b). The E/e’ ratio can be helpful for estimating LV filling pressures. An E/e’ of less than 8 is associated with normal LV filling pressure whereas an E/e’ >15 is associated with an elevated LV filling pressure.28,29 When the E/e’ is 8 to 10, other indices such as the E/A ratio and deceleration time, as well as the clinical picture, can provide insight into the presence of hemodynamically significant diastolic dysfunction.
Learning and applying the assessment of diastolic parameters can be challenging; however, these parameters can be used to help predict LV filling pressures in patients with findings of pulmonary edema on chest radiograph. Limitations of these techniques are inter-rater variability, as well as the ability of the operator to acquire the required AP4 view. In addition, these techniques are unreliable in patients with irregular cardiac rhythms, severe mitral disease, and in hypertrophic cardiomyopathy.
Right Ventricular Assessment
The right ventricle (RV) is a small, thin-walled ventricle with only two layers of muscle, as opposed to the three layers of the LV. In contrast to the rocking motion of LV contraction, the orientation of the two muscle layers of the RV permits mostly longitudinal contraction. The circumferential muscle fibers are shared at the base and apex with the LV, which can provide some of the contractile strength of the RV.30 Because of this orientation, RV strain, which can manifest as decreased longitudinal contraction, speed of contraction, septal movement, and tethering abnormalities through ventricular interdependence, can be measured easily using bedside echocardiography.
In healthy individuals, the RV is a low-pressure chamber that acts as a conduit for propelling venous return into the pulmonary circulation without much effect on systemic hemodynamics. However, in critical illness, RV abnormalities can have profound effects on hemodynamics, and the efforts typically used to improve LV performance will worsen a failing RV.
While RV dysfunction is most commonly due to chronic LV disease, acute RV dysfunction is commonly encountered in critical illness,31 including many septic patients with ARDS,32,33 PE, or decompensated chronic pulmonary hypertension.34 The examinations that follow, allow the EP to assess for the presence of RV dysfunction and to guide resuscitation appropriately to avoid the untoward hemodynamic effects of conventional resuscitation strategies in these patients.
When evaluating the RV, the clinician must determine (1) if the patient’s RV strain is due to pressure or volume overload; and (2) if the patient’s RV is responsive or nonresponsive to a preload challenge, prompting an alteration in the resuscitation plan in nonresponsive cases.
Right Ventricular Pressure/Volume Overload
While inferior vena cava (IVC) ultrasound has been shown to be a pre-heart/lung assessment of cardiopulmonary interactions that predicts volume responsiveness, the IVC is also a good predictor of right atrial (RA) pressure.35 If the IVC is dilated and lacks respiratory variation, the patient likely has an elevated RA pressure, which is most likely transmitted from an elevated RV pressure (Figure 9a). However, compliance of the RA, RA pressure and, by extension, IVC prediction of that RA pressure, may underestimate the degree of RV pressure or afterload.
Right Ventricular Strain and Contractile Reserve
From the same apical view, tissue Doppler at the lateral tricuspid annulus will give a tricuspid annular peak velocity, a measure of the isovolumetric contraction velocity. This measurement will provide a measure of the contractile reserve of the RV (Figure 10b). A measure of less than 10 cm/sec indicates that further volume and inotropic challenges to the RV will not be effective, and the focus should be to decrease RV afterload with pulmonary vasodilators.34,39,40
Fluid Resuscitation Assessment
Restoring circulating volume to increase cardiac output and improve oxygen delivery is the primary objective when managing patients in shock. Patient outcomes improve dramatically with early aggressive fluid resuscitation.41-44 However, many critically ill patients do not respond to fluid resuscitation, which is generally defined as the rise of cardiac output of more than 15% in response to volume expansion. Not all patients found to be fluid responsive will require volume expansion.45,46
Excessive fluid resuscitation has been shown to increase intensive care unit length of stay, morbidity, and mortality.47,48 Further, pathophysiological processes such as RV dysfunction and severe diastolic dysfunction can significantly alter the hemodynamic profile such that fluid management can be quite challenging in critically ill patients.
Distinguishing responders from nonresponders prior to fluid administration is the goal of early resuscitation. Unfortunately, this distinction cannot be made based on the patient’s vital signs or the physical examination.49 Static filling pressures and volumetric measures are unreliable markers of fluid responsiveness.50,51 The practice of administering a fluid challenge and observing the clinical effect on cardiac output is undesirable because it requires, by definition, on administering fluids, which ultimately may be harmful to the patient.
Dynamic measures of fluid responsiveness that reliably predict cardiac response to a preload challenge are proven to be of greater utility.52,53 These assessments determine volume responsiveness by evaluating the change in LV output with intrathoracic pressure changes due to the respiratory cycle, (ie, cardiopulmonary interaction). Ultrasound studies to assess cardiopulmonary interactions include IVC variability, arterial flow variability, brachial artery peak velocity variability, and common carotid artery (CCA) flow. In addition to echocardiography, lung ultrasound may be used to determine the endpoint of fluid resuscitation by monitoring for the appearance of extravascular lung water.
Inferior Vena Cava Variability
The IVC is a large extrathoracic vein which is easily insonated and accessible, even to a clinician with basic bedside ultrasound competency. Static IVC measures, such as diameter alone, correlate with central venous pressure but do not predict fluid responsiveness.54-56 Dynamic IVC evaluation provides an upstream assessment of cardiopulmonary interactions.
In the spontaneously breathing patient, the IVC collapses with inspiration as the RA pressure falls below atmospheric pressure, collapsing the intrathoracic veins for a short period until the intravascular pressure at the entry to the thorax exceeds atmospheric pressure, causing a bolus of venous return to the right heart. The overall effect is an increase in venous return59. Conversely, in the mechanically ventilated patient, the IVC will distend with insufflation as increased intrathoracic pressure results in increased RV afterload and a transient increase in pulmonary artery pressure with an overall net decrease in venous return.60
This IVC variability, termed the caval index, quantifies the degree of change in size of the IVC between end-inspiration and end-expiration. An M-mode imaging evaluation of the IVC allows for measurement of the maximal and minimal diameters for this calculation (Figure 11). Passively mechanically ventilated patients, with tidal volumes (TV) of 8 to 10 cc/kg in sinus rhythm, are predictably volume-responsive when the IVC distends by 12% to 18%.54,61,62 However, there is considerable debate as to whether evaluating the degree of IVC collapse is of value in spontaneously breathing patients.63 Cardiopulmonary interactions that drive IVC variability are affected by variable TV, intrathoracic pressure changes, etc. Nonetheless, two studies have shown that IVC collapse reliably predicts fluid responsiveness in spontaneously breathing patients.64,65
Stroke Volume/Arterial Flow Variability
Intrathoracic pressure changes induce dynamic changes in venous return that ultimately result in alterations in LV stroke volume (LVSV) when the blood volume traverses pulmonary circulation.66 This variability in LVSV is the basis for all dynamic assessments of cardiopulmonary interactions, whether by arterial pressure waveform analysis or echocardiographic assessment of arterial flow.
The LVSV variability reliably predicts fluid responsiveness and may be assessed by esophageal Doppler echocardiography of the ascending aorta.67,68 Transesophageal echocardiography has also been used to assess SV variability at the LVOT.69 Both of these measures require equipment and skill that may not be available in every clinical setting. Fortunately, LVOT SV is easily obtained through transthoracic echocardiography (TTE) (Figures 7a and 7b) using LVOT Doppler velocities as a surrogate for SV variations. A small study of TTE in mechanically ventilated children found that aortic flow variability predicted fluid responsiveness.70 Therefore, transthoracic echocardiography provides a well-established alternative to thermodilution in determining cardiac output. Multiplication of the HR by an estimate of the column of blood flowing through the LVOT with each systolic contraction gives the cardiac output.71
Using TTE measurement of SV and cardiac output, the clinician can assess the effect of small fluid challenges on cardiac output.72 Cardiac output can be augmented with the passive leg raise (PLR), which is an entirely reversible preload challenge maneuver thought to increase preload by 300 to 500 mL. To assess volume responsiveness using this technique, LVOT cardiac output must first be determined. With the transducer in place, the patient’s legs are lifted to a 45° angle. After a minute of equilibration, the LVOT VTI is repeated and cardiac output recalculated. An increase in VTI of more than 12.5% predicts an increase in cardiac output with volume expansion.73,74 This procedure requires proficiency with pulsed-wave Doppler and the ability to obtain the apical five-chamber view while a patient’s legs are being manipulated. In addition, the angle of insonation and location of measurement of LVOT and VTI must not vary for this measure to be valid.
Alternatively, respiratory variation in LVOT peak velocities has been shown to reliably predict volume responsiveness when variability is more than 12% (Figure 7c).69 This measurement is easier to obtain in that it does not require multiple views or complex calculations, and can be easily augmented with a passive leg raise maneuver.
Brachial Artery Peak Velocity Variation
In the search for easily accessible alternatives to cardiac and aortic flow, brachial artery peak velocity variation (BAPVV) was found to be useful for predicting volume responsiveness.75 To perform this study, the brachial artery is imaged in the long axis view using a linear transducer. Doppler gating should be adjusted to ensure an angle of less than 60°. The patient’s BAPVV is calculated as the difference between maximum and minimum peak velocity divided by the mean peak velocity. A variability in peak velocity of more than 10% predicts volume responsiveness.75
Common Carotid Artery Flow
Similarly, CCA flow has attracted attention as a potential surrogate to assess SV response to preload challenge.76,77 The CCA is large, easily accessible and does not require specialized training to assess (Figure 12).78
Even though cardiopulmonary interaction assessment has excellent performance for predicting volume responsiveness, limitations do exist. For example, cardiopulmonary interactions may be exaggerated or diminished—thus decreasing the reliability of this assessment—in patients on mechanical ventilation who have spontaneous breathing, high positive end-expiratory pressures or a high minute ventilation, low TV, dysrhythmias, external compression of extra- or intrathoracic vessels (eg, intra-abdominal hypertension, pericardial tamponade, COPD/asthma exacerbations); and in patients who have decreased arterial elastance, or high RV afterload causing RV dysfunction or failure.
Conclusion
The advanced ultrasound techniques described in this review provide several useful tools to rapidly evaluate and manage cardiopulmonary interactions and assess the hemodynamic profile of critically ill patients. With these bedside techniques added to basic POCUS examinations, a new era in noninvasive critical care management is now available.
As we enter the days of precision medicine, these examinations will enable EPs to optimize the care of this high-risk patient population. Moreover, future research by the emergency ultrasound and critical care communities on morbidity and mortality associated with resuscitation strategies in the ED will undoubtedly incorporate cardiopulmonary and hemodynamic ultrasound.
1. Kanji HD, McCallum J, Sirounis D, MacRedmond R, Moss R, Boyd JH. Limited echocardiography-guided therapy in subacute shock is associated with change in management and improved outcomes. J Crit Care. 2014;29(5):700-705. doi:10.1016/j.jcrc.2014.04.008.
2. Raja AS, Jacobus CH. How accurate is ultrasonography for excluding pneumothorax? Ann Emerg Med. 2013;61(2):207-208. doi:10.1016/j.annemergmed.2012.07.005.
3. Alrajhi K, Woo MY, Vaillancourt C. Test characteristics of ultrasonography for the detection of pneumothorax: a systematic review and analysis. Chest. 2012;141(3):703-708. doi:10.1378/chest.11-0131.
4. Blaivas M, Lyon M, Duggal S. A prospective comparison of supine chest radiography and bedside ultrasound for the diagnosis of traumatic pneumothorax. Acad Emerg Med. 2005;12(9):844-849. doi:10.1197/j.aem.2005.05.005.
5. Zanobetti M, Poggioni C, Pini R. Can chest ultrasonography replace standard chest radiography for evaluation of acute dyspnea in the ED? Chest. 2011;139(5):1140-1147.
6. Lichtenstein D, Goldstein I, Mourgeon E, Cluzel P, Grenier P, Rouby JJ. Comparative diagnostic performances of auscultation, chest radiography, and lung ultrasonography in acute respiratory distress syndrome. Anesthesiology. 2004;100(1):9-15.
7. Xirouchaki N, Magkanas E, Vaporidi K, et al. Lung ultrasound in critically ill patients: comparison with bedside chest radiography. Intensive Care Med. 2011;37(9):1488-1493. doi:10.1007/s00134-011-2317-y.
8. Lichtenstein DA. Lung ultrasound in the critically ill. Ann Intensive Care. 2014;4(1):1.
9. Lichtenstein DA, Mezière G, Lascols N, et al. Ultrasound diagnosis of occult pneumothorax. Crit Care Med. 2005;33(6):1231-1238.
10. Slater A, Goodwin M, Anderson KE, Gleeson FV. COPD can mimic the appearance of pneumothorax on thoracic ultrasound. Chest. 2006;129(3):545-550. doi:10.1378/chest.129.3.545.
11. Lichtenstein DA, Lascols N, Prin S, Mezière G. The “lung pulse”: an early ultrasound sign of complete atelectasis. [published online ahead of print October 14, 2003]. Intensive Care Med. 2003;29(12):2187-2192. doi:10.1007/s00134-003-1930-9.
12. Lichtenstein D. Fluid administration limited by lung sonography: the place of lung ultrasound in assessment of acute circulatory failure (the FALLS-protocol). Expert Rev Respir Med. 2012;6(2):155-162. doi:10.1586/ers.12.13.
13. Lichtenstein D, Mezière G. A lung ultrasound sign allowing bedside distinction between pulmonary edema and COPD: the comet-tail artifact. Intensive Care Med. 1998;24(12):1331-1334.
14. Dickman E, Terentiev V, Likourezos A, Derman A, Haines L. Extension of the thoracic spine sign: a new sonographic marker of pleural effusion. [published online ahead of print August 12, 2015]. J Ultrasound Med. 2015;34(9):1555-1561. doi:10.7863/ultra.15.14.06013.
15. Noble VE, Murray AF, Capp R, Sylvia-Reardon MH, Steele DJ, Liteplo A. Ultrasound assessment for extravascular lung water in patients undergoing hemodialysis. Time course for resolution. [published online ahead of print February 2, 2009]. Chest. 2009;135(6):1433-1439. doi:10.1378/chest.08-1811.
16. Lichtenstein D. Lung and Interstitial Syndrome. In: Lichtenstein D, ed. Whole Body Ultrasonography in the Critically IIl. New York, NY: Springer; 2010:151-157.
17. Lichtenstein DA, Mezière GA, Lagoueyte JF, Biderman P, Goldstein I, Gepner A. A-lines and B-lines: lung ultrasound as a bedside tool for predicting pulmonary artery occlusion pressure in the critically ill. Chest. 2009;136(4):1014-1020. doi:10.1378/chest.09-0001.
18. Romero-Bermejo FJ, Ruiz-Bailen M, Gil-Cebrian J, Huertos-Ranchal MJ. Sepsis-induced cardiomyopathy. Curr Cardiol Rev. 2011;7(3):163-183.
19. Sanfilippo F, Corredor C, Fletcher N, et al. Diastolic dysfunction and mortality in septic patients: a systematic review and meta-analysis. [published online ahead of print March 24, 2015]. Intensive Care Med. 2015;41(6):1004-1013. doi:10.1007/s00134-015-3748-7.
20. Randazzo MR, Snoey ER, Levitt MA, Binder K. Accuracy of emergency physician assessment of left ventricular ejection fraction and central venous pressure using echocardiography. Acad Emerg Med. 2003;10(9):973-977.
21. Reardon R. Cardiac. In: Ma O, Mateer J, eds. Emergency Ultrasound. 2nd ed. New York, NY: McGraw Hill Companies, Inc; 2008:114-115.
22. Martindale JL, Wakai A, Collins SP, et al. Diagnosing acute heart failure in the emergency department: a systematic review and meta-analysis. [published online ahead of print February 13, 2016]. Acad Emerg Med. 2016;23(3):223-242. doi:10.1111/acem.12878.
23. Cerqueira MD, Weissman NJ, Dilsizian V, et al; American Heart Association Writing Group on Myocardial Segmentation and Registration for Cardiac Imaging. Standardized myocardial segmentation and nomenclature for tomographic imaging of the heart. A statement for healthcare professionals from the Cardiac Imaging Committee of the Council on Clinical Cardiology of the American Heart Association. Circulation. 2002;105(4):539-542.
24. Lang RM, Bierig M, Devereux RB, et al. Recommendations for chamber quantification. [published online ahead of print February 2, 2006]. Eur J Echocardiogr. 2006;7(2):79-108. doi:10.1016/j.euje.2005.12.014.
25. Secko MA, Lazar JM, Salciccioli LA, Stone MB. Can junior emergency physicians use E-point septal separation to accurately estimate left ventricular function in acutely dyspneic patients? [published online ahead of print November 1, 2011]. Acad Emerg Med. 2011;18(11):1223-1226. doi:10.1111/j.1553-2712.2011.01196.x.
26. Dinh VA, Ko HS, Rao R, et al. Measuring cardiac index with a focused cardiac ultrasound examination in the ED. [published online ahead of print July 12, 2012]. Am J Emerg Med. 2012;30(9):1845-1851. doi:10.1016/j.ajem.2012.03.025.
27. Owan TE, Hodge DO, Herges RM, Jacobsen SJ, Roger VL, Redfield MM. Trends in prevalence and outcome of heart failure with preserved ejection fraction. N Engl J Med. 2006;355(3):251-259. doi:10.1056/NEJMoa052256.
28. Nagueh SF, Appleton CP, Gillebert TC, et al. Recommendations for the evaluation of left ventricular diastolic function by echocardiography. J Am Soc Echocardiogr. 2009;22(2):107-133. doi:10.1016/j.echo.2008.11.023.
29. Ommen SR, Nishimura RA. A clinical approach to the assessment of left ventricular diastolic function by Doppler echocardiography: update 2003. Heart. 2003;89 Suppl 3:iii18-23.
30. Haddad F, Hunt SA, Rosenthal DN, Murphy DJ. Right ventricular function in cardiovascular disease, part I: anatomy, physiology, aging, and functional assessment of the right ventricle. Circulation. 2008;117(11):1436-1448. doi:10.1161/CIRCULATIONAHA.107.653576.
31. Zochios V, Jones N. Acute right heart syndrome in the critically ill patient. Heart Lung Vessel. 2014;6(3):157-170.
32. Mekontso Dessap A, Boissier F, Charron C, et al. Acute cor pulmonale during protective ventilation for acute respiratory distress syndrome: prevalence, predictors, and clinical impact. [published online ahead of print December 9, 2015]. Intensive Care Med. 2016;42(5):862-870. doi:10.1007/s00134-015-4141-2.
33. Jardin F, Gueret P, Dubourg O, Farcot JC, Margairaz A, Bourdarias JP. Two-dimensional echocardiographic evaluation of right ventricular size and contractility in acute respiratory failure. Crit Care Med. 1985;13(11):952-956.
34. Dalabih M, Rischard F, Mosier JM. What’s new: the management of acute right ventricular decompensation of chronic pulmonary hypertension. [published online ahead of print September 3, 2014]. Intensive Care Med. 2014;40(12):1930-1933. doi:10.1007/s00134-014-3459-5.
35. Brennan JM, Blair JE, Goonewardena S, et al. Reappraisal of the use of inferior vena cava for estimating right atrial pressure. J Am Soc Echocardiogr. 2007;20(7):857-861. doi:10.1016/j.echo.2007.01.005.
36. Haddad F, Doyle R, Murphy DJ, Hunt SA. Right ventricular function in cardiovascular disease, part II: pathophysiology, clinical importance, and management of right ventricular failure. Circulation. 2008;117(13):1717-1731. doi:10.1161/CIRCULATIONAHA.107.653584.
37. McConnell MV, Solomon SD, Rayan ME, Come PC, Goldhaber SZ, Lee RT. Regional right ventricular dysfunction detected by echocardiography in acute pulmonary embolism. Am J Cardiol. 1996;78(4):469-473.
38. Gajanana D, Seetha Rammohan H, Alli O, et al. Tricuspid annular plane systolic excursion and its association with mortality in critically ill patients. [published online ahead of print March 1, 2015]. Echocardiography. 2015;32(8):1222-1227. doi:10.1111/echo.12926.
39. Rudski LG, Lai WW, Afilalo J, et al. Guidelines for the echocardiographic assessment of the right heart in adults: a report from the American Society of Echocardiography endorsed by the European Association of Echocardiography, a registered branch of the European Society of Cardiology, and the Canadian Society of Echocardiography. J Am Soc Echocardiogr. 2010;23(7):685-713; quiz 786-788. doi:10.1016/j.echo.2010.05.010.
40. Vogel M, Schmidt MR, Kristiansen SB, et al. Validation of myocardial acceleration during isovolumic contraction as a novel noninvasive index of right ventricular contractility: comparison with ventricular pressure-volume relations in an animal model. Circulation. 2002;105(14):1693-1699.
41. Rivers E, Nguyen B, Havstad S, et al. Early goal-directed therapy in the treatment of severe sepsis and septic shock. N Engl J Med. 2001;345(19):1368-1377. doi:10.1056/NEJMoa010307.
42. Peake SL, Delaney A, Bailey M, et al; ARISE Investigators, ANZICS Clinical Trials Group. Goal-directed resuscitation for patients with early septic shock. [published online ahead of print October 1, 2014]. N Engl J Med. 2014;371(16):1496-1506. doi:10.1056/NEJMoa1404380.
43. Yealy DM, Kellum JA, Huang DT, et al; ProCESS Investigators. A randomized trial of protocol-based care for early septic shock. [published online ahead of print March 18, 2014]. N Engl J Med. 2014;370(18):1683-1693. doi:10.1056/NEJMoa1401602.
44. Mouncey PR, Osborn TM, Power GS, et al. Trial of early, goal-directed resuscitation for septic shock. [published online ahead of print March 17, 2015]. N Engl J Med. 2015;372(14):1301-1311. doi:10.1056/NEJMoa1500896.
45. Marik PE, Lemson J. Fluid responsiveness: an evolution of our understanding. [published online ahead of print February 16, 2014]. Br J Anaesth. 2014;112(4):617-620. doi:10.1093/bja/aet590.
46. Marik PE. Fluid Responsiveness and the Six Guiding Principles of Fluid Resuscitation. Crit Care Med. 2016;44(10):1920-1922. doi:10.1097/CCM.0000000000001483.
47. Boyd JH, Forbes J, Nakada TA, Walley KR, Russell JA. Fluid resuscitation in septic shock: a positive fluid balance and elevated central venous pressure are associated with increased mortality. Crit Care Med. 2011;39(2):259-265. doi:10.1097/CCM.0b013e3181feeb15.
48. Wiedemann HP, Wheeler AP, Bernard GR, et al; National Heart, Lung, and Blood Institute Acute Respiratory Distress Syndrome (ARDS) Clinical Trials Network. Comparison of two fluid-management strategies in acute lung injury. [published online ahead of print May 21, 2006]. N Engl J Med. 2006;354(24):2564-2575. doi:10.1056/NEJMoa062200.
49. McGee S, Abernethy WB 3rd, Simel DL. The rational clinical examination. Is this patient hypovolemic? JAMA. 1999;281(11):1022-1029.
50. Marik PE, Cavallazzi R. Does the central venous pressure predict fluid responsiveness? An updated meta-analysis and a plea for some common sense. Crit Care Med. 2013;41(7):1774-1781. doi:10.1097/CCM.0b013e31828a25fd.
51. Osman D, Ridel C, Ray P, et al. Cardiac filling pressures are not appropriate to predict hemodynamic response to volume challenge. Crit Care Med. 2007;35(1):64-68. doi:10.1097/01.CCM.0000249851.94101.4F.
52. Marik PE, Cavallazzi R, Vasu T, Hirani A. Dynamic changes in arterial waveform derived variables and fluid responsiveness in mechanically ventilated patients: a systematic review of the literature. Crit Care Med. 2009;37(9):2642-2647. doi:10.1097/CCM.0b013e3181a590da.
53. Michard F, Teboul JL. Predicting fluid responsiveness in ICU patients: a critical analysis of the evidence. Chest. 2002;121(6):2000-2008.
54. Feissel M, Michard F, Faller JP, Teboul JL. The respiratory variation in inferior vena cava diameter as a guide to fluid therapy. [published online ahead of print March 25, 2004]. Intensive Care Med. 2004;30(9):1834-1837. doi:10.1007/s00134-004-2233-5.
55. Marik PE, Baram M, Vahid B. Does central venous pressure predict fluid responsiveness? A systematic review of the literature and the tale of seven mares. Chest. 2008;134(1):172-178. doi:10.1378/chest.07-2331.
56. Nagdev AD, Merchant RC, Tirado-Gonzalez A, Sisson CA, Murphy MC. Emergency department bedside ultrasonographic measurement of the caval index for noninvasive determination of low central venous pressure. [published online ahead of print June 25, 2009]. Ann Emerg Med. 2010;55(3):290-295. doi:10.1016/j.annemergmed.2009.04.021.
57. Wallace DJ, Allison M, Stone MB. Inferior vena cava percentage collapse during respiration is affected by the sampling location: an ultrasound study in healthy volunteers. [published online ahead of print December 9, 2009]. Acad Emerg Med. 2010;17(1):96-99. doi:10.1111/j.1553-2712.2009.00627.x.
58. Blehar DJ, Resop D, Chin B, Dayno M, Gaspari R. Inferior vena cava displacement during respirophasic ultrasound imaging. Crit Ultrasound J. 2012;4(1):18. doi:10.1186/2036-7902-4-18.
59. Funk DJ, Jacobsohn E, Kumar A. The role of venous return in critical illness and shock-part I: physiology. Crit Care Med. 2013;41(1):255-262. doi:10.1097/CCM.0b013e3182772ab6.
60. Lansdorp B, Hofhuizen C, van Lavieren M, et al. Mechanical ventilation-induced intrathoracic pressure distribution and heart-lung interactions*. Crit Care Med. 2014;42(9):1983-1990. doi:10.1097/CCM.0000000000000345.
61. Barbier C, Loubières Y, Schmit C, et al. Respiratory changes in inferior vena cava diameter are helpful in predicting fluid responsiveness in ventilated septic patients. [published online ahead of print March 18, 2004]. Intensive Care Med. 2004;30(9):1740-1746. doi:10.1007/s00134-004-2259-8.
62. Machare-Delgado E, Decaro M, Marik PE. Inferior vena cava variation compared to pulse contour analysis as predictors of fluid responsiveness: a prospective cohort study. J Intensive Care Med. 2011;26(2):116-124. doi:10.1177/0885066610384192.
63. Corl K, Napoli AM, Gardiner F. Bedside sonographic measurement of the inferior vena cava caval index is a poor predictor of fluid responsiveness in emergency department patients. [published online ahead of print September 7, 2012]. Emerg Med Australas. 2012;24(5):534-539. doi:10.1111/j.1742-6723.2012.01596.x.
64. Lanspa MJ, Grissom CK, Hirshberg EL, Jones JP, Brown SM. Applying dynamic parameters to predict hemodynamic response to volume expansion in spontaneously breathing patients with septic shock. Shock. 2013;39(2):155-160. doi:10.1097/SHK.0b013e31827f1c6a.
65. Muller L, Bobbia X, Toumi M, et al. Respiratory variations of inferior vena cava diameter to predict fluid responsiveness in spontaneously breathing patients with acute circulatory failure: need for a cautious use. Crit Care. 2012;16(5):R188. doi:10.1186/cc11672.
66. de Witt B, Joshi R, Meislin H, Mosier JM. Optimizing oxygen delivery in the critically ill: assessment of volume responsiveness in the septic patient. [published online ahead of print August 1, 2014]. J Emerg Med. 2014;47(5):608-615. doi:10.1016/j.jemermed.2014.06.015.
67. Monnet X, Rienzo M, Osman D, et al. Esophageal Doppler monitoring predicts fluid responsiveness in critically ill ventilated patients. [published online ahead of print July 30, 2005]. Intensive Care Med. 2005;31(9):1195-1201. doi:10.1007/s00134-005-2731-0.
68. Slama M, Masson H, Teboul JL, et al. Monitoring of respiratory variations of aortic blood flow velocity using esophageal Doppler. [published online ahead of print March 5, 2004]. Intensive Care Med. 2004;30(6):1182-1187. doi:10.1007/s00134-004-2190-z.
69. Feissel M, Michard F, Mangin I, Ruyer O, Faller JP, Teboul JL. Respiratory changes in aortic blood velocity as an indicator of fluid responsiveness in ventilated patients with septic shock. Chest. 2001;119(3):867-873.
70. Durand P, Chevret L, Essouri S, Haas V, Devictor D. Respiratory variations in aortic blood flow predict fluid responsiveness in ventilated children. [published online ahead of print February 8, 2008]. Intensive Care Med. 2008;34(5):888-894. doi:10.1007/s00134-008-1021-z.
71. Lewis JF, Kuo LC, Nelson JG, Limacher MC, Quinones MA. Pulsed Doppler echocardiographic determination of stroke volume and cardiac output: clinical validation of two new methods using the apical window. Circulation. 1984;70(3):425-431.
72. Muller L, Toumi M, Bousquet PJ, et al. An increase in aortic blood flow after an infusion of 100 ml colloid over 1 minute can predict fluid responsiveness: the mini-fluid challenge study. Anesthesiology. 2011;115(3):541-547. doi:10.1097/ALN.0b013e318229a500.
73. Lamia B, Ochagavia A, Monnet X, Chemla D, Richard C, Teboul JL. Echocardiographic prediction of volume responsiveness in critically ill patients with spontaneously breathing activity. [published online ahead of print May 17, 2007]. Intensive Care Med. 2007;33(7):1125-1132. doi:10.1007/s00134-007-0646-7.
74. Maizel J, Airapetian N, Lorne E, Tribouilloy C, Massy Z, Slama M. Diagnosis of central hypovolemia by using passive leg raising. [published online ahead of print May 17, 2007]. Intensive Care Med. 2007;33(7):1133-1138. doi:10.1007/s00134-007-0642-y.
75. Monge García MI, Gil Cano A, Díaz Monrové JC. Brachial artery peak velocity variation to predict fluid responsiveness in mechanically ventilated patients. [published online ahead of print September 3, 2009]. Crit Care. 2009;13(5):R142. doi:10.1186/cc8027.
76. Blehar DJ, Glazier S, Gaspari RJ. Correlation of corrected flow time in the carotid artery with changes in intravascular volume status. [published online ahead of print April 2, 2014]. J Crit Care. 2014;29(4):486-488. doi:10.1016/j.jcrc.2014.03.025.
77. Mackenzie DC, Khan NA, Blehar D, et al. Carotid Flow Time Changes With Volume Status in Acute Blood Loss. [published online ahead of print May 21, 2005]. Ann Emerg Med. 2015;66(3):277-282.e1. doi:10.1016/j.annemergmed.2015.04.014.
78. Stolz LA, Mosier JM, Gross AM, Douglas MJ, Blaivas M, Adhikari S. Can emergency physicians perform common carotid Doppler flow measurements to assess volume responsiveness? [published online ahead of print February 26, 2015]. West J Emerg Med. 2015;16(2):255-259. doi:10.5811/westjem.2015.1.24301.
79. Marik PE, Levitov A, Young A, Andrews L. The use of bioreactance and carotid Doppler to determine volume responsiveness and blood flow redistribution following passive leg raising in hemodynamically unstable patients. Chest. 2013;143(2):364-370. doi:10.1378/chest.12-1274.