User login
Sex disparities seen in surgical professorships
Female surgeons were less likely than were male surgeons to be full professors in 2014, according to an analysis that adjusted for a number of “factors known to influence academic rank independently of sex.”
The overall , after adjustment for such factors as age, years since residency, subspecialty, total publications, and clinical trial participation. “This methodological rigor is a central and unique strength of this analysis and bolsters the validity of the study findings,” wrote Daniel M. Blumenthal, MD, of Massachusetts General Hospital and Harvard Medical School, Boston, and his associates. The report was published in Annals of Surgery (2018 Jan 12. doi: 10.1097/SLA.0000000000002662).
Differences favoring men were seen in eight of the nine subspecialties included in the study, with vascular surgery being the exception (adjusted odds ratio, 1.63). Of the other eight, however, only in general surgery (adjusted odds ratio, 0.68) was the difference significant, the investigators said.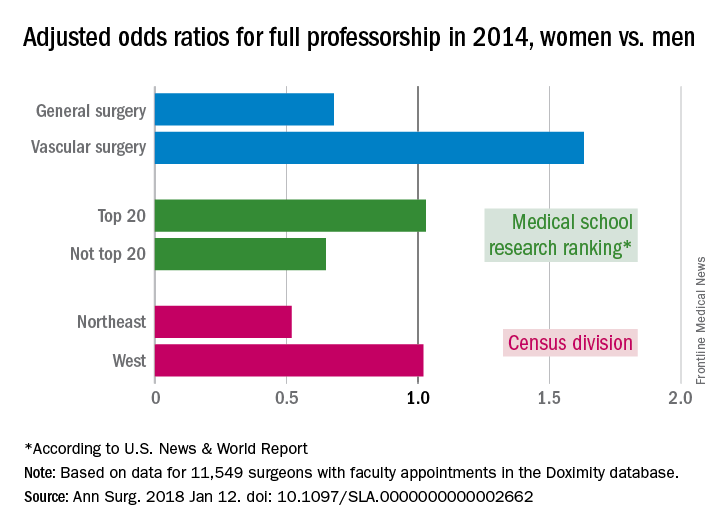
Another factor included in the analysis was the research ranking of the medical schools. There was no significant sex disparity for faculty members at medical schools ranked in the top 20 by U.S. News & World Report (adjusted odds ratio, 1.03), but schools outside the top 20 had an adjusted odds ratio (AOR) of 0.65 for women, compared with men. Geographically speaking, the largest disadvantage for female surgeons among the four main census divisions was in the Northeast (AOR, 0.52), with the West generating relative equality (AOR, 1.02) and the South (AOR, 0.83) and the Midwest (AOR, 0.87) in between, they reported.
Dr. Blumenthal and his associates used a cross-sectional database maintained by Doximity, an online networking company. The analysis included data for 11,549 surgeons with faculty appointments in 2014: 3,080 were full professors (7% were women), 2,931 were associate professors (13.8% were women), and 5,538 were assistant professors (19.4% were women).
Dr. Blumenthal reported research funding from a fellowship at Harvard. The investigators declared no conflict of interests.
SOURCE: Blumenthal DM et al. Ann Surg. 2018 Jan 12. doi: 10.1097/SLA.0000000000002662.
FROM ANNALS OF SURGERY
FDA Pledges Faster Updates for Antibiotics
The FDA is launching a new website to get critical updates about antibiotics and antifungals out faster to health care professionals to help them make more informed prescribing decisions. The site will provide “direct and timely access” to information about when bacterial or fungal infections are likely to respond to a specific drug.
“When you are treating critically ill patients, you want as much information as possible about the pathogen…and the susceptibility of that pathogen to various treatment,” said FDA Commissioner Scott Gottlieb, MD. Under the old approach, he said, updating each drug’s individual labeling took too long. Only after the revised drug labeling was approved could a drug or device manufacturer update testing criteria and labeling for the latest antimicrobial susceptibility test results. Each drug and device labeling had to be updated whenever criteria changed.
The new tool will allow the FDA to simultaneously provide updates multiple drugs that have the same active ingredient and share that information transparently via a dedicated web page.
VA Transparency and Quality Initiatives: An Update
As Assistant Deputy Under Secretary of Health Quality, Safety and Value, Shereef Elnahal, MD led VA efforts to improve the quality of care and to find, develop, and expand successful local programs through the Diffusion of Excellence initiative. More recently, he helped to develop new performance metrics for VA facilities and to increase transparency to veterans about wait times and quality. Federal Practitioner recently asked Dr. Elnahal to discuss these initiatives.
Improving the Veteran Experience
Federal Practitioner. Last year, VA launched accesstocare.va.gov to provide the public access to performance, wait time, and other data. What was the rationale for creating the website?
Shereef Elnahal, MD. The rationale, which directly aligns with the top priorities outlined by VA Secretary David J. Shulkin, MD, was simple: If we provide veterans with an easy-to-use tool that lets them see data on wait times and quality, they’ll be able to make informed decisions about where and when they receive their health care.
Secretary Shulkin has underscored the importance of improving the timeliness of VA health care services while simultaneously empowering veterans through transparency of information. This website provides a vital tool for realizing his vision.
Federal Practitioner. What types of data and tools are currently included on the site and what would you like to include in the future?
Dr. Elnahal. Right now, veterans can find information about wait times, quality of care, as well as other veterans’ experiences at local VA facilities. They also can compare quality of care provided by VA medical centers with that of local private hospitals. In addition, we recently added a feature whereby veterans can see if a local VA facility is better, worse, or the same as the regional average wait time of private sector clinics.
For example, if you’re a veteran and want to find out how quickly you can get an appointment with a primary care provider in your area, you simply visit www.accesstocare.va.gov and click the box “How Quickly Can My VA Facility See Me?” You’ll then be directed to a page that asks whether you want to find out about wait times at individual facilities or learn about facilities with same-day access. By clicking the former, you’ll be taken to a screen that includes a map and a few drop-down menus. From there, you can query the system in several ways, including “How soon can I get an appointment at the facility closest to me?” in which case the site will display a list of facilities in your area, with the closest facility listed first, along with wait times. Or you can ask “How soon can I get an appointment at a nearby facility?” in which case, the system will list facilities in your area displayed according to wait time, with the shortest wait time listed first. No other health care system that we know of provides this level of transparency.
Finally, last October, we also added a new feature, “Our Providers,” which provides information on more than 40,000 full-time and part-time VA health care providers. By visiting www.accesstocare.va.gov/ourproviders, veterans and their families can search practitioners by state, VA facility name, occupation, gender, and the service line to which the practitioner is assigned.
Federal Practitioner. What feedback have you received on accesstocare.va.gov from veterans and veterans groups?
Dr. Elnahal. The response has been overwhelmingly positive, both in terms of what veterans and Veterans Service Organizations (VSOs) have told us, and what we’ve seen in the news. For example, I read a story quoting an Arizona Veterans of Foreign Wars senior vice commander who said “That’s the thing about transparency. You can talk about it and promise it, but putting yourself out there online and making it available for everyone to use is a whole other story. That’s being pretty transparent.”1
I should note, though, that our desire for feedback didn’t end with the site’s launch. We want veterans and VSOs to continue advising us on ways to improve the site. On the website itself, you can find a section that allows you to give feedback, and we encourage veterans and their family members to do so.
Quality of Care
Federal Practitioner. What metrics are you using internally to measure and improve the quality of VA performance and health care?
Dr. Elnahal. We mainly use metrics that are already reported by private sector hospitals and clinics, such as Medicare core metrics, patient experience surveys, and those that are administered by the National Committee for Quality Assurance (NCQA).
Federal Practitioner. How are central office, VISN, or facility leadership using these metrics?
Dr. Elnahal. Each of these levels of management look at their specific purview, identify areas where they are falling behind the rest of the system or the private sector, and focus their resources on improving those specific areas. At the national level, the main focus right now is on those facilities that Secretary Shulkin has identified as “high risk” so that we can make sure they are on a fast path to improvement. We cannot afford to wait on improving these facilities, and Secretary Shulkin has asked us to focus our resources on the areas that need it most. I think it’s also important to note that we’ve been working to create a standard structure for quality (and safety) governance. Through this structure, which includes boards and committees at every level of VHA, we’re supporting front-line improvement teams that focus on quality of care in particular clinical service lines. We’re also leveraging these front-line teams to promote rapid sharing of best practices across the entire enterprise.
Federal Practitioner. How important is employee engagement and employee satisfaction to VA quality improvement?
Dr. Elnahal. Employee engagement and satisfaction are integral to quality improvement and are high priorities at VA. One factor that makes VA especially unique, even among other federal departments and agencies, is that our workforce truly is mission driven. VA employees are typically not paid quite as highly as health care workers in the private sector and are often asked to do jobs that are more difficult. Our veterans need and deserve the highest quality of care, and for service-related conditions, that can be quite complex. The people who choose to work for VA are invested in the mission, and about one-third of them are veterans themselves.
In addition, VA measures employee satisfaction more consistently and robustly than do most other health care institutions. Every year, a survey called the All-Employee Survey is released to every employee in VHA, and detailed questions are asked about how folks are feeling about their work environment, supervisors, you name it. We play close attention to these results across the organization—happier, engaged employees are more likely to provide the best service they can to veterans, which is why we care so much about this issue.
Federal Practitioner. Do you have any insight based on these metrics on the VA’s recent progress in improving access and quality of care?
In a recent analysis of 15 large metropolitan areas, we found that VA facility outpatient access has improved by 6 days on average between 2014 and 2017, while wait times in the private sector increased by 6 days on average. Wait times have improved in 11 of the 15 metropolitan areas. The number of unique patients seen and the volume of encounters nationally increased substantially between FY14 and FY17 for all 4 analyzed specialties: cardiology, dermatology, primary care and orthopedics.
For example, in cardiology the number of unique patients seen increased by 12%, and the volume of encounters increased by 19%. This progress is further illustrated by our improvement in our Hospital Consumer Assessment of Healthcare Providers and Systems (HCAHPS) data. VA has had incremental improvements annually in access according to reported HCAHPS scores for primary care and specialty care appointments, both urgent and routine care. The percentage of patients who believe “I ‘always’ got an appointment for care needed right away/routine care,” has been improving, on average, 1.3% annually since 2014.
In terms of care quality, several reports have been published in recent years that show high levels of performance in standard metrics for quality and patient safety, and in most, VA exceeds the private sector’s performance. VA continues to strive for the highest possible quality of care that we can provide.
Diffusion of Excellence
Federal Practitioner. How has the Diffusion of Excellence (DoE) program grown from its inception?
Dr. Elnahal. Since 2015, when we launched the initiative, the program has grown considerably both in size as well as in the diversity of best practices put forward.
Federal Practitioner. Does this initiative play into the larger efforts to improve transparency and quality of care?
Dr. Elnahal. Absolutely. Every cycle, categories of best practices are aligned seamlessly with the priorities of the moment. For example, suicide prevention and controlling the opioid epidemic were just some of the priorities we focused on this past year, because they are what the organization has been focused on at large. Quality and patient safety—perennial priorities of VHA—are always reflected in our solicitation of best practices.
Federal Practitioner. Can you identify/describe a few successful DoE programs that exemplify VA employees’ commitment to improving quality of care?
Dr. Elnahal. One example that springs to mind is the Home-based Mental Health Evaluation, or HOME, a program that bridges the gap in mental health care recently discharged rural veterans’ experience. In VISN 16, the program reduced psychiatric rehospitalizations by nearly 50% and the average length of a hospital stay by 41% by having staff meet with hospitalized veterans; complete a home visit within 1 week after the patient is discharged; and maintain weekly phone contact until the veteran starts outpatient mental health services.
Another example is a program developed by staff at the North Florida/South Georgia Veterans Health Care System in Gainesville, which helped reduce wait times in the hospital’s cardiology clinic. This best practice encourages physicians to review individual requests for consultations with specialists. They are asked to triage the requests to determine whether a face-to-face encounter is needed, if the request can be handled either at a local outpatient clinic or electronically, or whether the doctor needs more information before deciding what to do. In 1 year, this process reduced wait times in Gainesville’s cardiology clinic by 46%, to about 10 days.
Another Boston VA project is the development of a screening and transfer process for patients who want to be detoxified from substances to which they have become addicted. The facility’s psychosomatic medicine service team uses an algorithm for screenings and transfers that embeds available literature on the subject and a multidisciplinary consensus into an order set for electronic consultations. This results in an evidence-based, multidisciplinary, and technologic approach to the transfer process.
Federal Practitioner. Do you see DoE as a laboratory for quality of care improvement that could expand beyond the VA?
Dr. Elnahal. Absolutely. In fact, I recently coauthored, with Secretary Shulkin and Deputy Under Secretary for Health Carolyn Clancy, a commentary that provided a how-to for private sector systems to replicate our efforts.2 In that commentary, we identified four distinct phases of diffusing best practices across health care systems: Identify promising practices, recruit champions, replicate; and establish consistency, standardize, and sustain.
1. Cronkite News. VA unveils tool to give vets clearer picture of medical care, delays. https://cronkitenews.azpbs.org/2017/04/12/va-unveils-tool-to-give-vets-clearer-picture-of-medical-care-delays. Published April 12, 2017. Accessed January 22, 2018.
2. Elnahal SM, Clancy CM, Shulkin DJ. A framework for disseminating clinical best practices in the VA Health System. JAMA. 2017;317(3):255-256.
As Assistant Deputy Under Secretary of Health Quality, Safety and Value, Shereef Elnahal, MD led VA efforts to improve the quality of care and to find, develop, and expand successful local programs through the Diffusion of Excellence initiative. More recently, he helped to develop new performance metrics for VA facilities and to increase transparency to veterans about wait times and quality. Federal Practitioner recently asked Dr. Elnahal to discuss these initiatives.
Improving the Veteran Experience
Federal Practitioner. Last year, VA launched accesstocare.va.gov to provide the public access to performance, wait time, and other data. What was the rationale for creating the website?
Shereef Elnahal, MD. The rationale, which directly aligns with the top priorities outlined by VA Secretary David J. Shulkin, MD, was simple: If we provide veterans with an easy-to-use tool that lets them see data on wait times and quality, they’ll be able to make informed decisions about where and when they receive their health care.
Secretary Shulkin has underscored the importance of improving the timeliness of VA health care services while simultaneously empowering veterans through transparency of information. This website provides a vital tool for realizing his vision.
Federal Practitioner. What types of data and tools are currently included on the site and what would you like to include in the future?
Dr. Elnahal. Right now, veterans can find information about wait times, quality of care, as well as other veterans’ experiences at local VA facilities. They also can compare quality of care provided by VA medical centers with that of local private hospitals. In addition, we recently added a feature whereby veterans can see if a local VA facility is better, worse, or the same as the regional average wait time of private sector clinics.
For example, if you’re a veteran and want to find out how quickly you can get an appointment with a primary care provider in your area, you simply visit www.accesstocare.va.gov and click the box “How Quickly Can My VA Facility See Me?” You’ll then be directed to a page that asks whether you want to find out about wait times at individual facilities or learn about facilities with same-day access. By clicking the former, you’ll be taken to a screen that includes a map and a few drop-down menus. From there, you can query the system in several ways, including “How soon can I get an appointment at the facility closest to me?” in which case the site will display a list of facilities in your area, with the closest facility listed first, along with wait times. Or you can ask “How soon can I get an appointment at a nearby facility?” in which case, the system will list facilities in your area displayed according to wait time, with the shortest wait time listed first. No other health care system that we know of provides this level of transparency.
Finally, last October, we also added a new feature, “Our Providers,” which provides information on more than 40,000 full-time and part-time VA health care providers. By visiting www.accesstocare.va.gov/ourproviders, veterans and their families can search practitioners by state, VA facility name, occupation, gender, and the service line to which the practitioner is assigned.
Federal Practitioner. What feedback have you received on accesstocare.va.gov from veterans and veterans groups?
Dr. Elnahal. The response has been overwhelmingly positive, both in terms of what veterans and Veterans Service Organizations (VSOs) have told us, and what we’ve seen in the news. For example, I read a story quoting an Arizona Veterans of Foreign Wars senior vice commander who said “That’s the thing about transparency. You can talk about it and promise it, but putting yourself out there online and making it available for everyone to use is a whole other story. That’s being pretty transparent.”1
I should note, though, that our desire for feedback didn’t end with the site’s launch. We want veterans and VSOs to continue advising us on ways to improve the site. On the website itself, you can find a section that allows you to give feedback, and we encourage veterans and their family members to do so.
Quality of Care
Federal Practitioner. What metrics are you using internally to measure and improve the quality of VA performance and health care?
Dr. Elnahal. We mainly use metrics that are already reported by private sector hospitals and clinics, such as Medicare core metrics, patient experience surveys, and those that are administered by the National Committee for Quality Assurance (NCQA).
Federal Practitioner. How are central office, VISN, or facility leadership using these metrics?
Dr. Elnahal. Each of these levels of management look at their specific purview, identify areas where they are falling behind the rest of the system or the private sector, and focus their resources on improving those specific areas. At the national level, the main focus right now is on those facilities that Secretary Shulkin has identified as “high risk” so that we can make sure they are on a fast path to improvement. We cannot afford to wait on improving these facilities, and Secretary Shulkin has asked us to focus our resources on the areas that need it most. I think it’s also important to note that we’ve been working to create a standard structure for quality (and safety) governance. Through this structure, which includes boards and committees at every level of VHA, we’re supporting front-line improvement teams that focus on quality of care in particular clinical service lines. We’re also leveraging these front-line teams to promote rapid sharing of best practices across the entire enterprise.
Federal Practitioner. How important is employee engagement and employee satisfaction to VA quality improvement?
Dr. Elnahal. Employee engagement and satisfaction are integral to quality improvement and are high priorities at VA. One factor that makes VA especially unique, even among other federal departments and agencies, is that our workforce truly is mission driven. VA employees are typically not paid quite as highly as health care workers in the private sector and are often asked to do jobs that are more difficult. Our veterans need and deserve the highest quality of care, and for service-related conditions, that can be quite complex. The people who choose to work for VA are invested in the mission, and about one-third of them are veterans themselves.
In addition, VA measures employee satisfaction more consistently and robustly than do most other health care institutions. Every year, a survey called the All-Employee Survey is released to every employee in VHA, and detailed questions are asked about how folks are feeling about their work environment, supervisors, you name it. We play close attention to these results across the organization—happier, engaged employees are more likely to provide the best service they can to veterans, which is why we care so much about this issue.
Federal Practitioner. Do you have any insight based on these metrics on the VA’s recent progress in improving access and quality of care?
In a recent analysis of 15 large metropolitan areas, we found that VA facility outpatient access has improved by 6 days on average between 2014 and 2017, while wait times in the private sector increased by 6 days on average. Wait times have improved in 11 of the 15 metropolitan areas. The number of unique patients seen and the volume of encounters nationally increased substantially between FY14 and FY17 for all 4 analyzed specialties: cardiology, dermatology, primary care and orthopedics.
For example, in cardiology the number of unique patients seen increased by 12%, and the volume of encounters increased by 19%. This progress is further illustrated by our improvement in our Hospital Consumer Assessment of Healthcare Providers and Systems (HCAHPS) data. VA has had incremental improvements annually in access according to reported HCAHPS scores for primary care and specialty care appointments, both urgent and routine care. The percentage of patients who believe “I ‘always’ got an appointment for care needed right away/routine care,” has been improving, on average, 1.3% annually since 2014.
In terms of care quality, several reports have been published in recent years that show high levels of performance in standard metrics for quality and patient safety, and in most, VA exceeds the private sector’s performance. VA continues to strive for the highest possible quality of care that we can provide.
Diffusion of Excellence
Federal Practitioner. How has the Diffusion of Excellence (DoE) program grown from its inception?
Dr. Elnahal. Since 2015, when we launched the initiative, the program has grown considerably both in size as well as in the diversity of best practices put forward.
Federal Practitioner. Does this initiative play into the larger efforts to improve transparency and quality of care?
Dr. Elnahal. Absolutely. Every cycle, categories of best practices are aligned seamlessly with the priorities of the moment. For example, suicide prevention and controlling the opioid epidemic were just some of the priorities we focused on this past year, because they are what the organization has been focused on at large. Quality and patient safety—perennial priorities of VHA—are always reflected in our solicitation of best practices.
Federal Practitioner. Can you identify/describe a few successful DoE programs that exemplify VA employees’ commitment to improving quality of care?
Dr. Elnahal. One example that springs to mind is the Home-based Mental Health Evaluation, or HOME, a program that bridges the gap in mental health care recently discharged rural veterans’ experience. In VISN 16, the program reduced psychiatric rehospitalizations by nearly 50% and the average length of a hospital stay by 41% by having staff meet with hospitalized veterans; complete a home visit within 1 week after the patient is discharged; and maintain weekly phone contact until the veteran starts outpatient mental health services.
Another example is a program developed by staff at the North Florida/South Georgia Veterans Health Care System in Gainesville, which helped reduce wait times in the hospital’s cardiology clinic. This best practice encourages physicians to review individual requests for consultations with specialists. They are asked to triage the requests to determine whether a face-to-face encounter is needed, if the request can be handled either at a local outpatient clinic or electronically, or whether the doctor needs more information before deciding what to do. In 1 year, this process reduced wait times in Gainesville’s cardiology clinic by 46%, to about 10 days.
Another Boston VA project is the development of a screening and transfer process for patients who want to be detoxified from substances to which they have become addicted. The facility’s psychosomatic medicine service team uses an algorithm for screenings and transfers that embeds available literature on the subject and a multidisciplinary consensus into an order set for electronic consultations. This results in an evidence-based, multidisciplinary, and technologic approach to the transfer process.
Federal Practitioner. Do you see DoE as a laboratory for quality of care improvement that could expand beyond the VA?
Dr. Elnahal. Absolutely. In fact, I recently coauthored, with Secretary Shulkin and Deputy Under Secretary for Health Carolyn Clancy, a commentary that provided a how-to for private sector systems to replicate our efforts.2 In that commentary, we identified four distinct phases of diffusing best practices across health care systems: Identify promising practices, recruit champions, replicate; and establish consistency, standardize, and sustain.
1. Cronkite News. VA unveils tool to give vets clearer picture of medical care, delays. https://cronkitenews.azpbs.org/2017/04/12/va-unveils-tool-to-give-vets-clearer-picture-of-medical-care-delays. Published April 12, 2017. Accessed January 22, 2018.
2. Elnahal SM, Clancy CM, Shulkin DJ. A framework for disseminating clinical best practices in the VA Health System. JAMA. 2017;317(3):255-256.

Low inhibitor rate observed in PUPs with hemophilia A

Researchers have observed a low inhibitor rate in previously untreated patients (PUPs) with severe hemophilia A who received treatment with Octanate®.
The study included 51 PUPs who received octanate, a plasma-derived, von Willebrand factor-stabilized coagulation factor VIII (FVIII) concentrate.
Five of these patients (9.8%) developed FVIII inhibitors, all of whom were receiving on-demand treatment.
The hemostatic efficacy of octanate was rated as “excellent” for 99.6% of all infusions, and tolerability was rated “very good” for 99.98% of infusions.
“We are very excited by the low inhibitor rates and the excellent efficacy and tolerability achieved with octanate® in this particularly challenging patient population,” said Larisa Belyanskaya, head of IBU Haematology at Octapharma AG, the company marketing octanate.
Octapharma sponsored this study, the results of which were published in Haemophilia.
The study enrolled 51 Caucasian males with previously untreated, severe hemophilia A. They had a median age at study entry of 7.7 months (range, 0.1 months to 67.3 months).
Patients received octanate, either prophylactically or on-demand, for 100 exposure days (EDs) or 5 years, whichever came first.
There were a mean of 136.33 (±246.3) EDs, and the mean dose of octanate was 38.4 (±28.6) IU/kg/ED. Most patients (78.4%) had at least 100 EDs. The total number of EDs was 6953.
Prophylaxis accounted for 3027 EDs, immune tolerance induction for 1869 EDs, treatment of bleeds for 1817 EDs, surgical procedures for 149 EDs, and in vivo recovery assessments for 106 EDs.
Inhibitors
Five patients developed FVIII inhibitors, 4 of which were high titer and 1 low titer.
In 3 cases, the inhibitors were considered clinically relevant. In the other 2 cases, the inhibitors disappeared without a change in dose or treatment frequency.
All inhibitors developed during on-demand treatment, and all 4 high-titer inhibitors developed within the first 20 EDs.
All patients who developed inhibitors had major F8 gene defects (intron 22 inversions or large deletions of exons 7-12) that are associated with a high risk of inhibitor development.
Efficacy
The hemostatic efficacy of octanate was rated as “excellent” in 99.6% of infusions (n=4700), “good” in 0.3% (n=15), and “moderate” in 0.02% (n=1).
Most bleeds resolved within 1 day of treatment (81.2%) or within 2 days (14.3%).
Efficacy was rated as “excellent” for all but 1 of the 2611 prophylactic infusions. One was rated as “good.”
For treatment of bleeds, efficacy was rated as “excellent” for 99.2% of infusions (n=1809), “good” for 0.8% (n=14), and “moderate” for 0.05% (n=1).
There were 23 evaluable surgical procedures in 19 patients. The efficacy of octanate was rated as “excellent” in all cases (201 infusions).
Safety
There were 260 treatment-emergent adverse events (AEs) in 45 patients (88.2%). Seventy-eight of these AEs were serious.
Twenty-one AEs were considered probably or possibly related to octanate—asymptomatic parvovirus B19 seroconversions (n=16) and FVIII inhibitor development (n=5). These were classified as serious AEs according to the study protocol.
The tolerability of octanate was considered “very good” in 99.98% of infusions (n=8674) and “good” in 0.02% (n=2). ![]()
FDA approves ready-to-use bivalirudin

The US Food and Drug Administration (FDA) has approved a ready-to-use formulation of bivalirudin for use as an anticoagulant in patients undergoing percutaneous coronary intervention.
Baxter International Inc. expects to launch this frozen, premixed formulation of bivalirudin—Bivalirudin in 0.9% Sodium Chloride Injection—in the US early this year.
The product will be available in 2 commonly prescribed dosage forms and strengths: 250 mg of bivalirudin per 50 mL (5 mg/mL) and 500 mg of bivalirudin per 100 mL (5 mg/mL).
This frozen, premixed, ready-to-use bivalirudin makes use of Baxter’s proprietary frozen GALAXY container technology, a non-PVC and non-DEHP system specifically designed to create a ready-to-use format for unstable molecules.
Baxter’s premixed medications are manufactured to current Good Manufacturing Practice regulations established and monitored by the FDA. ![]()
EC grants orphan designation to gilteritinib for AML

The European Commission (EC) has granted orphan designation to gilteritinib for the treatment of patients with acute myeloid leukemia (AML).
Gilteritinib is an investigational compound that has demonstrated inhibitory activity against FLT3 internal tandem duplication, FLT3 tyrosine kinase domain, and the AXL receptor.
Astellas Pharma Inc. is currently investigating gilteritinib in phase 3 trials of AML patients.
Results from a phase 1/2 study of gilteritinib in AML were published in The Lancet Oncology last June.
The study enrolled 252 adults with relapsed/refractory AML. They received gilteritinib once daily in 1 of 7 dose-escalation (n=23) or dose-expansion (n=229) cohorts.
The maximum tolerated dose was 300 mg/day. There were 2 dose-limiting toxicities in the 450 mg dose-escalation cohort—grade 3 diarrhea and grade 3 elevated aspartate aminotransferase.
Common treatment-related adverse events were diarrhea (37%), anemia (34%), fatigue (33%), elevated aspartate aminotransferase (26%), and increased alanine aminotransferase (19%).
Serious adverse events related to treatment included febrile neutropenia (n=5), sepsis (n=2), acute renal failure (n=5), pyrexia (n=3), and bacteremia (n=1).
There were 7 deaths considered possibly or probably related to treatment—pulmonary embolism (200 mg/day), respiratory failure (120 mg/day), hemoptysis (80 mg/day), intracranial hemorrhage (20 mg/day), ventricular fibrillation (120 mg/day), septic shock (80 mg/day), and neutropenia (120 mg/day).
The overall response rate was 40% (100/249), and the complete response (CR) rate was 8% (n=19).
Four percent of patients (n=10) had a CR with incomplete platelet recovery, 18% (n=46) had a CR with incomplete hematological recovery, and 10% (n=25) had a partial response.
About orphan designation
Orphan designation provides regulatory and financial incentives for companies to develop and market therapies that treat life-threatening or chronically debilitating conditions affecting no more than 5 in 10,000 people in the European Union, and where no satisfactory treatment is available.
Orphan designation provides a 10-year period of marketing exclusivity if the drug receives regulatory approval.
The designation also provides incentives for companies seeking protocol assistance from the European Medicines Agency during the product development phase and direct access to the centralized authorization procedure. ![]()
Checkpoint inhibitors look safe in rheumatology patients
People with rheumatologic diseases and cancer appear to be at no higher risk of having an adverse event or disease flare if they receive checkpoint inhibitor therapy, compared with the general population, experience from the Mayo Clinic suggests.
In a brief report published in Arthritis and Rheumatology, a team from the Mayo Clinic in Rochester, Minn., reported on 16 patients with rheumatologic diseases who received cancer immunotherapy. They found that only a minority experienced a flare of their disease or another immune-related event.
The rate of severe immune-related adverse effects (IRAEs) with a single immune checkpoint inhibitor (ICI) has been reported to be less than 2% among the average population. However, less is known about patients with underlying rheumatologic disease, largely because initial trials of ICIs had excluded patients with autoimmune diseases for fear the treatment would induce a disease flare, the researchers noted.
Small studies have suggested that people with inflammatory arthritis or connective tissue diseases have higher rates of IRAEs with immunotherapy, but it is unclear how often these events represented flares of their disease or new autoimmune events, and whether the events had any predictive significance for cancer survival.
In this study, researchers performed a retrospective review of medical records and identified 16 patients with rheumatologic diseases who had received checkpoint inhibitor therapy at the Mayo Clinic between 2011 and 2016.
The most common rheumatologic diseases among the 16 patients were rheumatoid arthritis, polymyalgia rheumatica, Sjögren’s syndrome, and systemic lupus erythematosus, and the most common cancers were malignant melanoma, pulmonary malignancies, and non-Hodgkin lymphoma. Seven of the patients were receiving immunosuppressive therapy or glucocorticoids for their rheumatologic disease upon initiation of a checkpoint inhibitor.
Ten patients had received a prior disease-modifying antirheumatic drug, but only two patients were still taking this at the time of ICI initiation.
Results showed that six of the patients (38%) had an IRAE or flare of their rheumatologic disease, two were graded as mild. All of the patients responded well to glucocorticoids and discontinuation of therapy. The most common event was colitis and just one patient had a flare of rheumatologic disease.
“This is consistent with what is currently known about the management of IRAEs,” the research team wrote. “This study adds further support to the emerging notion that the rate of IRAEs is not necessarily higher in this group compared to the general population.”
The type and severity of rheumatologic disease may play an important role in both the risk of disease flare and IRAEs, a factor that they were unable to assess in the current study, the researchers wrote.
“Further large, prospective studies are needed to address the link between the type, severity, and concurrent rheumatologic disease activity on the risk of flare and IRAE. It is possible that patients with more severe or active disease are at higher risk for these complications,” they wrote.
While patients in the study did not appear to have significantly increased incidence or severity of adverse effects, the research team advised that “treatment decisions must factor in clinical judgement.”
They noted that some studies had proposed predictive biomarkers, pretreatment workup, and monitoring, but this advice was based on a small body of evidence.
“Larger, prospective studies will be necessary to validate these findings and establish evidence-based guidelines for appropriate identification and rating of the rheumatologic IRAEs as well as their treatment, such that patients can continue to receive potentially life-saving cancer treatments,” they wrote.
One of the researchers reported advisory board membership with Bristol-Myers Squibb.
SOURCE: Richter M et al. Arthritis Rheumatol. 2018 Jan 24. doi: 10.1002/art.40397.
FROM ARTHRITIS AND RHEUMATOLOGY
Key clinical point:
Major finding: Six of 16 patients (38%) with rheumatologic disease and cancer had an IRAE or flare of their rheumatologic disease.
Study details: A single-center, retrospective records review to identify patients with rheumatologic diseases who had received checkpoint inhibitor therapy at Mayo Clinic between 2011 and 2016.
Disclosures: One of the authors reported advisory board membership with Bristol-Myers Squibb.
Source: Richter M et al. Arthritis Rheumatol. 2018 Jan 24. doi: 10.1002/art.40397.
Abstract: Antibiotic Prescribing for Nonbacterial Acute Upper Respiratory Infections in Elderly Persons
The video associated with this article is no longer available on this site. Please view all of our videos on the MDedge YouTube channel
Silverman, M., et al, Ann Intern Med 166(11):765, June 6, 2017
BACKGROUND: Overuse of antibiotics increases healthcare costs and contributes to the emergence of resistance, but these agents continue to be prescribed heavily for nonbacterial acute upper respiratory infections. Factors influencing physicians may include patient expectations, decision fatigue, fear of complications and unintended financial incentives.
METHODS: In this retrospective analysis of administrative healthcare data, the authors from the University of Western Ontario included 185,014 patients aged 66 or older (mean age 74.6 years) presenting to 8990 primary care physicians who were diagnosed with a first episode of nonbacterial acute upper respiratory infection that did not otherwise warrant antibiotic treatment. More than 90% of the episodes were managed by one physician and involved one visit. The primary outcome was antibiotic prescription within 30 days. Episode, patient and physician factors, in the context of antibiotic prescription, were evaluated.
RESULTS: Overall, 46.2% of the patients were prescribed antibiotics (broad-spectrum agents in 69.9% of these cases). Patients receiving an antibiotic prescription were more likely than those not prescribed an antibiotic to be diagnosed with acute bronchitis (45.3% vs. 19.3%) or acute sinusitis (17.1% vs. 10.6%). Patients were more likely to receive antibiotic prescriptions when physicians were mid- and late-career vs. early-career, trained outside of Canada or the United States, and seeing more than 25 patients per day. Broad-spectrum agents were more frequently prescribed by mid- and late-career physicians and those trained in Canada or the United States.
CONCLUSIONS: Almost one-half of these elderly patients with nonbacterial acute upper respiratory infections received unnecessary antibiotic prescriptions. This study sheds light on the prevalence and predictors of such prescribing. 58 references (michael.silverman@sjhc.london.on.ca for reprints)
Learn more about the Primary Care Medical Abstracts and podcasts, for which you can earn up to 9 CME credits per month.
Copyright © The Center for Medical Education
SHM launches 2018 State of Hospital Medicine Survey
The Society of Hospital Medicine recently opened the 2018 State of Hospital Medicine (SoHM) Survey and is now seeking participants from hospital medicine groups to contribute to the collective understanding of the state of the specialty.
Results from the biennial survey will be analyzed and compiled into the 2018 SoHM Report to provide current data on hospitalist compensation and production, as well as cutting-edge knowledge covering practice demographics, staffing levels, turnover, staff growth, and financial support. The SoHM Survey closes on Feb. 16, 2018.
“The SoHM Survey lays the foundation for the creation of one of the most expansive tools for hospital medicine professionals,” said Beth Hawley, MBA, FACHE, chief operating officer of SHM. “With the help of participants from hospital medicine groups nationwide, it creates an up-to-date snapshot of trends in the specialty to help inform staffing and management decisions.”
The 2018 SoHM Survey includes new questions about open hospitalist physician positions during the year, including what percentage of approved staffing was unfilled and how the group filled the coverage. Other new topics ask about the number of work Relative Value Units generated by participating hospital medicine groups and who selects the billing codes for the groups.
Over the past year and a half, five distinct efforts were completed to collect user feedback for both the survey and report development processes. Efforts ranged from in-person focus groups at SHM’s Annual Conference to online user surveys. After information was collected and summarized, SHM’s Practice Analysis Committee ranked every question to trim down the Survey from 70 questions in 2016 to 52 questions in 2018.
The 2018 SoHM Report will be available this fall in print only, as a bundle of print and digital, or as digital only, with special discounts available for SHM members.
Committee members are available for one-on-one guidance as participants complete the Survey. For more information and to participate, visit www.hospitalmedicine.org/sohm.
You paid how much for that medicine?
This is the first article in a series on the cost of medications.
While it’s not news that some pharmaceuticals are exorbitantly expensive and therefore unavailable to our patients, I have learned that there are ways around the obstacle of cost for at least some medications. I want to tell you what I’ve learned about the high cost of two medications: aripiprazole, the generic of Abilify, and modafinil, the generic of Provigil, but the lessons learned may apply to other psychotropics – and Smokey Robinson and the Miracles said it best in a line from their 1960 hit song, “You’d better shop around.”

Over the past few years, the price of aripiprazole has come down considerably, or so I believed. A patient recently complained that his copay after insurance for a 1-month supply of 2-mg tablets was hundreds of dollars, and he showed me a bill where the cost before insurance was more than $2,000! Another patient, also someone with commercial insurance, said he couldn’t afford aripiprazole and asked me to phone in a prescription to healthwarehouse.com. The medication was mailed to him for about $35 a month. Finally, a third patient with Medicare used an online service called Blink Health. He explained that he paid for the medicine online with a credit card – about $80, far less than the price quoted by the pharmacy. He was then given some type of code to present to the pharmacist, who then supplied the medications. In this case, the same pills, the same pharmacy, at a fraction of the cost. With that, I called several pharmacies and asked about the price of generic Abilify, 5 mg, 30 tablets.
I also wrote a column about the tremendous difficulty I had trying to get preauthorization for modafinil, in “Preauthorization of medications: Who oversees the placement of the hoops?” In that case, I spent weeks trying to get approval for the medication, and in the end, it was not approved, and the patient was not able to get it. Soon after, I learned on a Psychiatry Network Facebook discussion that generic Provigil is not expensive at all! Once again, I fired up my phone and called around. Those prices and those I found for Abilify are listed in the chart.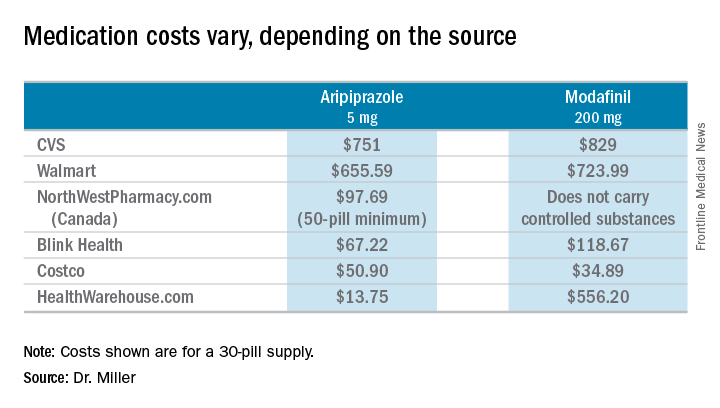
So these are cash prices; they do not take into account the cost with insurance. My patients have educated me after they could not afford the insurance copays. I wondered about my own coverage, and signed on to my pharmacy benefits manager account to look up the cost of both Abilify and Provigil. I’m sorry to say that I can’t report back: With my health insurance, Empire Blue Cross and Express Scripts, both medications require Coverage Review. It was also noted that Abilify requires Step treatment; I must first fail other medications. Should I ever need either of these medications, you’ll know where to find me: in line at the Costco pharmacy. I’ll be the one dancing to Smokey Robinson and the Miracles. https://www.youtube.com/watch?v=AQGXa3FiXKM
Dr. Miller is coauthor with Annette Hanson, MD, of “Committed: The Battle Over Involuntary Psychiatric Care” (Baltimore: Johns Hopkins University Press, 2016).
This is the first article in a series on the cost of medications.
While it’s not news that some pharmaceuticals are exorbitantly expensive and therefore unavailable to our patients, I have learned that there are ways around the obstacle of cost for at least some medications. I want to tell you what I’ve learned about the high cost of two medications: aripiprazole, the generic of Abilify, and modafinil, the generic of Provigil, but the lessons learned may apply to other psychotropics – and Smokey Robinson and the Miracles said it best in a line from their 1960 hit song, “You’d better shop around.”
Over the past few years, the price of aripiprazole has come down considerably, or so I believed. A patient recently complained that his copay after insurance for a 1-month supply of 2-mg tablets was hundreds of dollars, and he showed me a bill where the cost before insurance was more than $2,000! Another patient, also someone with commercial insurance, said he couldn’t afford aripiprazole and asked me to phone in a prescription to healthwarehouse.com. The medication was mailed to him for about $35 a month. Finally, a third patient with Medicare used an online service called Blink Health. He explained that he paid for the medicine online with a credit card – about $80, far less than the price quoted by the pharmacy. He was then given some type of code to present to the pharmacist, who then supplied the medications. In this case, the same pills, the same pharmacy, at a fraction of the cost. With that, I called several pharmacies and asked about the price of generic Abilify, 5 mg, 30 tablets.
I also wrote a column about the tremendous difficulty I had trying to get preauthorization for modafinil, in “Preauthorization of medications: Who oversees the placement of the hoops?” In that case, I spent weeks trying to get approval for the medication, and in the end, it was not approved, and the patient was not able to get it. Soon after, I learned on a Psychiatry Network Facebook discussion that generic Provigil is not expensive at all! Once again, I fired up my phone and called around. Those prices and those I found for Abilify are listed in the chart.
So these are cash prices; they do not take into account the cost with insurance. My patients have educated me after they could not afford the insurance copays. I wondered about my own coverage, and signed on to my pharmacy benefits manager account to look up the cost of both Abilify and Provigil. I’m sorry to say that I can’t report back: With my health insurance, Empire Blue Cross and Express Scripts, both medications require Coverage Review. It was also noted that Abilify requires Step treatment; I must first fail other medications. Should I ever need either of these medications, you’ll know where to find me: in line at the Costco pharmacy. I’ll be the one dancing to Smokey Robinson and the Miracles. https://www.youtube.com/watch?v=AQGXa3FiXKM
Dr. Miller is coauthor with Annette Hanson, MD, of “Committed: The Battle Over Involuntary Psychiatric Care” (Baltimore: Johns Hopkins University Press, 2016).