User login
FDA: Gadolinium retention prompts new GBCA class warning, safety measures
Gadolinium-based contrast agents (GBCAs) used for MRI will now carry a warning regarding their potential retention in the bodies and brains of treated patients, according to the Food and Drug Administration.
The FDA is requiring the new class warning, along with other safety measures, based on evidence showing that trace amounts of gadolinium can be retained in the body for months to years after treatment.
Specifically, the agency will require that patients receiving GBCAs first receive a Medication Guide and that GBCA manufacturers conduct human and animal studies to further assess GBCA safety. At this time, the only known adverse health effect of gadolinium retention is nephrogenic systemic fibrosis, which affects a small subgroup of patients with pre-existing kidney failure. No causal association has been established between gadolinium retention and reported adverse events in those with normal kidney function.
The FDA recommended that health care professionals consider the retention characteristics of GBCAs for patients who may be at higher risk for retention, including those requiring multiple lifetime doses, pregnant women, children, and patients with inflammatory conditions, but stressed that, although repeated GBCA imaging studies should be minimized when possible, they should not be avoided or deferred when they are necessary. In the safety alert, the FDA noted that administration of the GBCAs Dotarem (gadoterate meglumine), Gadavist (gadobutrol), and ProHance (gadoteridol) produce the lowest gadolinium levels in the body, and the three agents leave similar gadolinium levels in the body.
The agency encourages reports of adverse events or side effects related to the use of GBCAs to its MedWatch Safety information and Adverse Event Reporting Program. Reports can be submitted online at www.fda.gov/MedWatch/report or by calling 1-800-332-1088 to request a preaddressed form that can be mailed or faxed to 1-800-FDA-0178.
Use of the dual-antiplatelet therapy score to guide treatment duration after percutaneous coronary intervention
Clinical question: Can the dual-antiplatelet therapy scoring system be used to determine which patients undergoing percutaneous coronary intervention (PCI) would benefit from prolonged (24 months) DAPT?
Background: Prolonged DAPT therapy has been estimated to prevent 8 myocardial infarctions per 1,000 persons treated for 1 year but at the cost of 6 major bleeding events with no clear mortality benefit. Given these trade-offs, the DAPT score could be used to identify patients who would benefit or would be harmed from prolonged DAPT. The safety and efficacy of DAPT duration as guided by the DAPT score has not been assessed outside the derivation cohort. This study applied the DAPT score to the PRODIGY trial patients to evaluate safety and outcomes of DAPT for 24 months versus a less than 6-month regimen.
Setting: PCI patients in PRODIGY trial.
Synopsis: In the original derivation cohort, a low DAPT score of less than 2 identified patients whose bleeding risks outweigh ischemic benefits and a high score above 2 identifies patients for whom ischemic benefits outweigh bleeding risks. When the DAPT score was applied to the 1,970 patients enrolled in PRODIGY, 55% had a low score and 45% had a high score. The primary efficacy outcomes of death, MI, and stroke were evaluated as well as primary safety outcomes of bleeding according to the Bleeding Academic Research Consortium definition. The reduction in the primary efficacy outcomes with 24-month vs. 6-month DAPT was greater in patients with a high DAPT score but only in the older paclitaxel-eluting stents. Since these stents have mostly fallen out of favor, there are some limitations to the applicability of the study findings. The study also provides support for 6 months of DAPT for patients with a DAPT score of less than 2.
Bottom line: For patients who underwent PCI with a DAPT score of less than 2, the risk for bleeding appears to be higher than are the ischemic benefits, while patients who had a high DAPT score of greater than 2 with a first-generation stent, the ischemic benefits of prolonged DAPT seemed to outweigh the bleeding risks.
Citation: Piccolo R et al. Use of the dual-antiplatelet therapy score to guide treatment duration after percutaneous coronary intervention. Ann Intern Med. 2017 Jul 4;167(1):17-25
Dr. Setji is a hospitalist and medical director, Duke University Hospital.
Update in Hospital Palliative Care: Symptom Management, Communication, Caregiver Outcomes, and Moral Distress
The aim of palliative care (PC) is to improve quality of life for patients facing serious, life-threatening illness and their families.1 Due to insufficient numbers of PC specialists to meet the PC needs for every hospitalized patient,2 all hospitalists should maintain basic PC skills as recognized by PC being a core competency for hospitalists.3,4
We summarize and critique PC research articles published between January 1, 2016, and December 31, 2016, that have a high likelihood of impacting the practice of hospital medicine. We hand searched 15 journals and conducted a MEDLINE keyword search of PC terms (see Table). All titles and/or abstracts were reviewed and selected for full review based on the following factors: palliative medicine content, scientific rigor, impact on practice, and relevance to hospital medicine. Fifty-five articles were individually reviewed and scored by all authors according to rigor, impact, and relevance. Articles were ranked according to their mean scores, and 9 articles were chosen for inclusion through consensus discussion.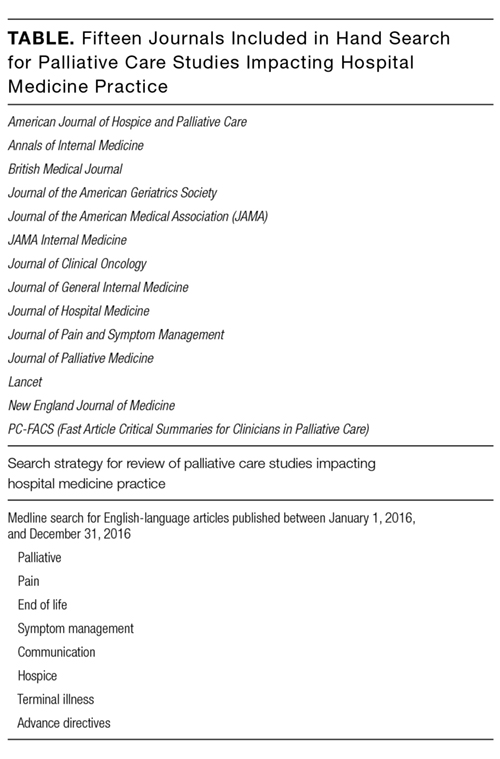
SYMPTOM MANAGEMENT
Antipsychotics Were Inferior to a Placebo in Treating Nonterminal Delirium
Agar MR, Lawlor PG, Quinn S, et al. Efficacy of oral risperidone, haloperidol, or placebo for symptoms of delirium among patients in palliative care: a randomized clinical trial. JAMA Intern Med. 2017;177(1):34-42.
Background
Delirium is highly prevalent in PC and is associated with significant distress.5 Antipsychotics are widely used for symptoms of delirium, although current evidence does not support this practice in hospitalized adults.6,7
Findings
This was a double-blind, parallel-arm, placebo randomized controlled trial (RCT) of 247 patients with delirium with an estimated life expectancy of ≥7 days in 11 PC or hospice units across Australia. Patients were randomized to receive risperidone, haloperidol, or a placebo in addition to nonpharmacological management of delirium. Delirium symptom scores after 3 days of treatment, the use of midazolam as a rescue medication, and the presence of extrapyramidal symptoms (EPS) were measured. The risperidone and haloperidol arms had significantly higher delirium symptom scores (P = .02 and P = .009, respectively), mean EPS symptoms (P < .001), and more use of rescue midazolam than the placebo arm. Mortality was higher for antipsychotics, with a hazard ratio of 1.73 for haloperidol (P = .003), 1.29 for risperidone (P = .14), and 1.47 for any antipsychotic (P = .01).
Cautions
The study population was elderly (mean age >70 years) with mild delirium scores. The use of antipsychotics was associated with more benzodiazepine use, which could itself worsen delirium. As patients with clinician-predicted life expectancy of <7 days were excluded, findings cannot be extrapolated to the treatment of terminal delirium, which can often be more symptomatic and difficult to treat.
Implications
Avoid scheduled antipsychotics in patients with nonterminal delirium, as they can increase risk of harm without advantages, over nonpharmacologic interventions.
Low-Dose Morphine Was Superior to Weak Opioids in the Treatment of Moderate Cancer Pain
Bandieri E, Romero M, Ripamonti CI, et al. Randomized trial of low-dose morphine versus weak opioids in moderate cancer pain. J Clin Oncol. 2016;34(5):436-442.
Background
The World Health Organization guidelines recommend the use of weak opioids (WOs), such as codeine or tramadol, as a sequential step in the management of cancer pain.8 This strategy has not been tested against low doses of stronger opioids.
Findings
In this multicenter, open-label RCT, 240 patients in Italy were randomized and stratified by age (<75 years or ≥75 years) to either the WO group or low-dose morphine (M) group. The primary outcome measure was a reduction in pain intensity by 20% or more. Secondary outcomes included an improvement in symptom scores, a ≥30% and ≥50% reduction in pain, increased opioid dosage, and adverse side effects. Compared with the WO group, the M group had more patients with a 20% reduction in pain (88.2% vs 54.7%; P < .001), more evidence of pain control in the first week (80.9% vs 43.6%; P < .001), more patients with a ≥30% and ≥50% reduction in pain, and less need to switch to a stronger opioid (15.5% vs 35.0%; P = .001) or require dose increases. Adverse effects were similar in both groups.
Cautions
Patients with chronic kidney disease (CKD) were excluded due to concerns about the accumulation of morphine metabolites. Additionally, this study was open label, increasing the risk of bias.
Implications
Low-dose morphine should be considered over the use of WOs to achieve better and more rapid pain control in patients without CKD.
The Use of Methadone as a Coanalgesic May Improve Moderate Cancer Pain
Courtemanche F, Dao D, Gagné F, et al. Methadone as a coanalgesic for palliative care cancer patients. J Palliat Med. 2016;19(9):972-978.
Background
Methadone is effective at treating cancer pain and is often utilized when patients have neuropathic pain, fail to respond to traditional opioids, or have renal failure.9,10 However, its long half-life and many drug interactions make methadone challenging to use.
Findings
This cohort study looked at 153 inpatient or outpatient PC patients in Montreal who received methadone as a coanalgesic for cancer pain. The patients’ median morphine equivalent dose was 120 mg when initiating methadone. The median starting dose of methadone was 3 mg per day. Of patients, 49.3% had a significant response (≥30% pain reduction), with a median response time of 7 days, and 30.1% achieved a substantial response (≥50% pain reduction), with a median response time of 3 days. Patients with higher initial pain scores were more likely to respond to adjuvant methadone. Those who had not responded after a week of methadone were unlikely to respond despite dose escalations. Adverse effects included drowsiness (51.4%), confusion (27.4%), constipation (24.7%), nausea (19.9%), and myoclonia (16.4%).
Cautions
This was an observational study with retrospective data, leading to higher levels of missing data. A high rate of adverse side effects was reported (90.4%). Further study is needed to validate and reproduce the findings.
Implications
The use of adjuvant low-dose methadone may be considered in patients with moderate pain despite high-dose opioids. If a response is not seen within 7 days, then methadone use should be reconsidered.
ANTIBIOTIC STEWARDSHIP
Many Hospitalized Patients on Comfort Care Still Receive Antimicrobials
Merel SE, Meier CA, McKinney CM, Pottinger PS. Antimicrobial use in patients on a comfort care protocol: a retrospective cohort study. J Palliat Med. 2016;19(11):1210-1214.
Background
It is unknown how often patients who are hospitalized at the end of life continue to receive antimicrobials and what factors are associated with antimicrobial use.
Findings
This retrospective cohort study of 1881 hospitalized adults transitioned to a comfort care order (CCO) set at 2 academic medical centers found that 77% of these patients received antimicrobials during their hospital stay (62.4% at 24 hours prior to CCO). Of the 711 still alive at ≥24 hours after CCO, 111 (15.6%) were still on antimicrobials, with that proportion remaining stable for the remainder of hospitalization. In comparing those who did and did not receive antimicrobials after 24 hours of CCO, the presence of a documented infection was not significantly different after adjusting for age. Those with a cancer diagnosis (adjusted risk ratio [ARR] = 1.44: P = .04), a longer length of stay (≥7 days vs <7 days; ARR = 1.49; P = .05), and those discharged home (ARR 2.93; P < .001) or to a facility (ARR 3.63; P < .001) versus dying in the hospital were more likely to be on antimicrobials 24 hours after CCO. Compared with those on a medicine service, patients in the medical and surgical intensive care units (ICUs) were less likely to receive antimicrobials (medical ICU ARR = 0.32; P = .01; surgical ICU and/or neuro-ICU ARR = 0.32; P = .02). The most commonly administered antimicrobials were fluoroquinolones and vancomycin.
Cautions
Only 111 patients were still on antimicrobials at 24 hours, which limited analysis. Investigators relied on retrospective data for medication administration and diagnoses.
Implications
Further work is needed to understand and address the expectations of clinicians, patients, and families regarding the role of antimicrobials at the end of life.
COMMUNICATION AND DECISION MAKING
Video Decision Aids Improved Rates of Advance Care Planning and Hospice Use and Decreased Costs
Volandes, AE, Paasche-Orlow MK, Davis AD et al. Use of video decision aids to promote advance care planning in Hilo, Hawai‘i. J Gen Intern Med. 2016;31(9):1035-1040.
Background
Advance care planning (ACP) can be enhanced with the use of video decision aids, which may help address scalability and cost.11 The Hawaii Medical Service Association began an initiative to improve ACP rates, which included a financial incentive. Clinician training and patient access to ACP videos were implemented 1 year into this campaign, which was intended for patients with late-stage disease.
Findings
This study tested the impact of the video intervention on the rates of ACP documentation in Hilo, Hawaii, along with secondary outcomes of hospice use, hospital deaths, and costs. The intervention was sequentially rolled out to Hilo Medical Center (HMC), followed by hospice and primary care practices. Following the video introduction, the proportion of patients discharged from HMC with ACP documentation markedly increased (3.2% to 39.9%; P < .001). The percentage of hospital patients discharged to hospice increased from 5.7% to 13.8% (P < .001). Overall admissions to the Hospice of Hilo increased at a greater rate than in other parts of Hawaii. After the intervention in Hilo, the in-hospital death rate among patients >65 years old declined slightly (P = .14), while in the rest of the state, the rate remained essentially unchanged. ACP planning did not reduce healthcare costs at the end of life, but costs seemed to increase more slowly in Hilo after the intervention than they did in the rest of Hawaii (P < .05).
Cautions
This report relies on before-and-after comparisons, with potential confounding by a background pay-for-quality initiative; however, the timing of the changes in outcomes correlates well with the introduction of the videos. ACP videos have been studied in other settings, so the intervention is likely generalizable to other states.
Implications
A widespread distribution of ACP videos and training for physicians in their use may lead to significant increases in ACP documentation and other beneficial clinical outcomes for patients and health systems.
A Standardized Palliative Care-Led Intervention Did Not Improve Psychological Outcomes in Families of Patients with Chronic Critical Illness
Carson SS, Cox CE, Wallenstein S, et al. Effect of palliative care-led meetings for families of patients with chronic critical illness: a randomized clinical trial. JAMA. 2016;316(1):51-62.
Background
Chronic critical illness (CCI) occurs when a patient neither recovers nor dies for days to weeks after an acute illness requiring aggressive intensive care. CCI is associated with poor patient and family outcomes.12 Does a protocol-driven support and information meeting led by PC providers improve these outcomes?
Findings
This multicenter RCT compared 130 CCI patients (184 surrogates) who received a structured intervention to 126 patients (181 surrogates) with usual care. The structured intervention was led by PC clinicians in order to provide supportive conversations and information about CCI and prognosis compared with the usual intensivist communication. The support and information team met with the families of patients in the intervention group after day 7 of mechanical ventilation (MV) and again 10 days later. Both the intervention and control groups received validated information about CCI, and all were eligible for specialty PC consultation, as indicated. The primary outcome of the study was the Hospital Anxiety and Depression Scale (HADS) at 90-day follow-up with the surrogates. Secondary endpoints included posttraumatic stress disorder (PTSD) assessment and other communication measures as well as patient outcomes (hospital mortality, 90-day survival, length of stay, and days of MV). At least 1 meeting took place for 89% of patients (82% of surrogates) in the intervention arm. Fewer patients in the intervention arm had nonstudy PC consultations (13% vs 22%). Ninety-day HADS results were similar in the 2 groups. PTSD symptoms, however, were higher in the intervention group (Impact of Event Scale-Revised score: 25.9 for intervention and 21.3 for control; intergroup difference 4.6 [95% confidence interval, 0.01-9.10]). There were no statistically significant differences among the patient-focused measures, including survival.
Cautions
Although the teams contained skilled clinicians led by PC practitioners, this was not an ordinary PC intervention. The intervention included information and emotional support meetings alone rather than support from a PC team driven by clinical considerations. This study included surrogates of patients with CCI but not other conditions.
Implications
Protocol-driven support and information meetings may not improve, and may slightly worsen, outcomes in families of patients with CCI. This study did not evaluate and should not be applied to clinically indicated, specialty PC consultation in the ICU.
CAREGIVER OUTCOMES
Caregivers of Patients Surviving Prolonged Critical Illness Experience High and Persistent Rates of Depression
Cameron JI, Chu LM, Matte A, et al. One-year outcomes in caregivers of critically ill patients. N Engl J Med. 2016;374(19):1831-1841.
Background
More than half of patients with a CCI require caregiver support 1 year after hospitalization.13 Caregivers provide tremendous physical and psychosocial support to their loved ones, but that care is often associated with significant burden.14
Findings
This prospective parallel cohort study followed caregivers of surviving patients ventilated for at least 7 days from 10 academic hospitals in Canada. The prevalence of depression (Center for Epidemiologic Studies–Depression scale ≥16) in this cohort of 280 caregivers (70% were women) was 67%, 49%, 43%, and 43% at the survey intervals of 7 days, 3 months, 6 months, and 12 months after ICU discharge, respectively. Using latent-class linear mixed models, the investigators identified 2 groups of caregivers: those whose depressive symptoms decreased over time (84%) and those whose depressive symptoms persisted at a high level for the year (16%). Patient characteristics (such as age, comorbidity, sex, and functional status) were not associated with caregiver outcomes. Younger caregiver age, greater effect of patient care on other activities, less social support, less mastery (sense of control), and less personal growth were associated with worse caregiver mental health outcomes.
Cautions
Although this is a high-quality prospective study, causality of caregiving on the high rates of depressive symptoms cannot be confirmed without a control group or knowledge of the caregivers’ mental health status prior to the episode of prolonged critical illness.
Implications
Patient critical illness may have serious impacts on caregiver health and well-being. Hospitalists should be attentive to factors associated with caregiver vulnerability and offer support. Improving caregivers’ sense of control and social support may be targets for interventions.
People with Non-normative Sexuality or Gender Face Additional Barriers and Stressors with Partner Loss
Bristowe K, Marshall S, Harding R. The bereavement experiences of lesbian, gay, bisexual and/or trans* people who have lost a partner: A systematic review, thematic synthesis and modelling of the literature. Palliat Med. 2016;30(8):730-744.
Background
Grief and bereavement impact individuals differently as they adjust to a death. Increasingly, it is recognized that lesbian, gay, bisexual, and/or transgender (LGBT) communities may face additional barriers when interacting with the healthcare system. This review sought to identify and appraise the evidence of the bereavement experiences among LGBT communities.
Findings
This systematic review summarized quantitative and qualitative data from 23 articles (13 studies). The synthesis noted that the pain associated with the loss of a partner was a universal experience regardless of sexual identity or gender history. Additional barriers and stressors of bereavement were reported for LGBT people, including homophobia, failure to acknowledge the relationship, additional legal and financial issues, and the shadow of human immunodeficiency virus (HIV) or acquired immunodeficiency syndrome (AIDS). LGBT people turned to additional resources for bereavement help: professional support, social and familial support, and societal and community support. Caregiver bereavement support experiences were shaped by whether the relationships were disclosed and accepted (acceptance-disclosure model).
Cautions
The quantitative data was mostly from the 1990s and described the context of HIV/AIDS. The qualitative studies, however, were done in the last decade. Very little research was available for transgender or bisexual caregivers.
Implications
People who identify as LGBT face additional barriers and stressors with the loss of a partner. The described acceptance-disclosure model may help providers be mindful of the additional barriers to LGBT bereavement support.
MORAL DISTRESS AND RESILIENCY
Physician Trainees Experience Significant Moral Distress with Futile Treatments
Dzeng E, Colaianni A, Roland M, et al. Moral distress amongst American physician trainees regarding futile treatments at the end of life: a qualitative study. J Gen Intern Med. 2016;31(1):93-99.
Background
Physician trainees are often faced with ethical challenges in providing end-of-life care. These ethical challenges can create confusion and conflict about the balance between the benefits and burdens experienced by patients.
Findings
The authors used semistructured, in-depth, qualitative interviews of 22 internal medicine trainees from 3 academic medical centers. An analysis of these interviews revealed several themes. Trainees reported moral distress when (1) many of the treatments provided in end-of-life care (ie, feeding tubes in advanced dementia) were perceived to be futile; (2) they felt obligated to provide end-of-life care that was not in the patient’s best interest, leading to “torture” or “suffering” for the patient; (3) they provided care they felt not to be in the patient’s best interest; (4) they perceived themselves to be powerless to affect change in these dilemmas; (5) they attributed some of their powerlessness to the hierarchy of their academic institutions; and (6) they feared that dehumanization and cynicism would be required to endure this distress.
Cautions
Resident recruitment occurred by solicitation, which may invite bias. Generalizability of qualitative studies to other settings can be limited.
Implications
Trainees may experience several dimensions of moral distress in end-of-life care. These findings challenge training programs to find ways to reduce the dehumanization, sense of powerlessness, and cynicism that this distress may cause.
Disclosure
The authors declare that they have no relevant financial conflicts of interest.
1. Morrison RS, Meier DE. Palliative care. N Engl J Med. 2004;350:2582-2590. PubMed
2. Quill TE, Abernethy AP. Generalist plus specialist palliative care—creating a more sustainable model. N Engl J Med. 2013;368(13):1173-1175. PubMed
3. Meier DE. Palliative care in hospitals. J Hosp Med. 2006;1:21-28. PubMed
4. Society of Hospital Medicine. Palliative care. J Hosp Med. 2006;1,S1:80-81.
5. Hosie A, Davidson PM, Agar M, Sanderson CR, Phillips J. Delirium prevalence, incidence, and implications for screening in specialist palliative care inpatient settings: a systematic review. Palliat Med. 2013;27(6):486-493. PubMed
6. Carnes M, Howell T, Rosenberg M, Francis J, Hildebrand C, Knuppel J. Physicians vary in approaches to the clinical management of delirium. J Am Geriatr Soc. 2003;51(2):234-239. PubMed
7. Neufeld KJ, Yue J, Robinson TN, Inouye SK, Needham DM. Antipsychotic medication for prevention and treatment of delirium in hospitalized adults: a systematic review and meta-analysis. J Am Geriatr Soc. 2016;64(4):705-14. PubMed
8. WHO. Cancer Pain Relief. 2nd ed. Geneva, Switzerland: WHO; 1996.
9. Leppert W. The role of methadone in cancer pain treatment—a review. Int J Clin Pract. 2009;63(7):1095-1109. PubMed
10. Morley JS, Bridson J, Nash TP, et al. Low-dose methadone has an analgesic effect in neuropathic pain: a double-blind randomized controlled crossover trial. Palliat Med. 2003;17(7):576-587. PubMed
11. Institute of Medicine. Dying in America: Improving Quality and Honoring Individual Preferences Near the End of Life. Washington, DC: The National Academies Press; 2014.
12. Nelson JE, Cox CE, Hope AA, Carson SS. Chronic Critical Illness. Am J Respir Crit Care Med. 2010;182(4):446-454. PubMed
13. Chelluri L, Im KA, Belle SH, et al. Long-term mortality and quality of life after prolonged mechanical ventilation. Crit Care Med. 2004;32(1):61-9. PubMed
14. Van Beusekom I, Bakhshi-Raiez F, deKeizer NF, Dongelmans DA, van der Schaaf M. Reported burden on informal caregivers of ICU survivors: a literature review. Crit Care. 2015;20:16. PubMed
The aim of palliative care (PC) is to improve quality of life for patients facing serious, life-threatening illness and their families.1 Due to insufficient numbers of PC specialists to meet the PC needs for every hospitalized patient,2 all hospitalists should maintain basic PC skills as recognized by PC being a core competency for hospitalists.3,4
We summarize and critique PC research articles published between January 1, 2016, and December 31, 2016, that have a high likelihood of impacting the practice of hospital medicine. We hand searched 15 journals and conducted a MEDLINE keyword search of PC terms (see Table). All titles and/or abstracts were reviewed and selected for full review based on the following factors: palliative medicine content, scientific rigor, impact on practice, and relevance to hospital medicine. Fifty-five articles were individually reviewed and scored by all authors according to rigor, impact, and relevance. Articles were ranked according to their mean scores, and 9 articles were chosen for inclusion through consensus discussion.
SYMPTOM MANAGEMENT
Antipsychotics Were Inferior to a Placebo in Treating Nonterminal Delirium
Agar MR, Lawlor PG, Quinn S, et al. Efficacy of oral risperidone, haloperidol, or placebo for symptoms of delirium among patients in palliative care: a randomized clinical trial. JAMA Intern Med. 2017;177(1):34-42.
Background
Delirium is highly prevalent in PC and is associated with significant distress.5 Antipsychotics are widely used for symptoms of delirium, although current evidence does not support this practice in hospitalized adults.6,7
Findings
This was a double-blind, parallel-arm, placebo randomized controlled trial (RCT) of 247 patients with delirium with an estimated life expectancy of ≥7 days in 11 PC or hospice units across Australia. Patients were randomized to receive risperidone, haloperidol, or a placebo in addition to nonpharmacological management of delirium. Delirium symptom scores after 3 days of treatment, the use of midazolam as a rescue medication, and the presence of extrapyramidal symptoms (EPS) were measured. The risperidone and haloperidol arms had significantly higher delirium symptom scores (P = .02 and P = .009, respectively), mean EPS symptoms (P < .001), and more use of rescue midazolam than the placebo arm. Mortality was higher for antipsychotics, with a hazard ratio of 1.73 for haloperidol (P = .003), 1.29 for risperidone (P = .14), and 1.47 for any antipsychotic (P = .01).
Cautions
The study population was elderly (mean age >70 years) with mild delirium scores. The use of antipsychotics was associated with more benzodiazepine use, which could itself worsen delirium. As patients with clinician-predicted life expectancy of <7 days were excluded, findings cannot be extrapolated to the treatment of terminal delirium, which can often be more symptomatic and difficult to treat.
Implications
Avoid scheduled antipsychotics in patients with nonterminal delirium, as they can increase risk of harm without advantages, over nonpharmacologic interventions.
Low-Dose Morphine Was Superior to Weak Opioids in the Treatment of Moderate Cancer Pain
Bandieri E, Romero M, Ripamonti CI, et al. Randomized trial of low-dose morphine versus weak opioids in moderate cancer pain. J Clin Oncol. 2016;34(5):436-442.
Background
The World Health Organization guidelines recommend the use of weak opioids (WOs), such as codeine or tramadol, as a sequential step in the management of cancer pain.8 This strategy has not been tested against low doses of stronger opioids.
Findings
In this multicenter, open-label RCT, 240 patients in Italy were randomized and stratified by age (<75 years or ≥75 years) to either the WO group or low-dose morphine (M) group. The primary outcome measure was a reduction in pain intensity by 20% or more. Secondary outcomes included an improvement in symptom scores, a ≥30% and ≥50% reduction in pain, increased opioid dosage, and adverse side effects. Compared with the WO group, the M group had more patients with a 20% reduction in pain (88.2% vs 54.7%; P < .001), more evidence of pain control in the first week (80.9% vs 43.6%; P < .001), more patients with a ≥30% and ≥50% reduction in pain, and less need to switch to a stronger opioid (15.5% vs 35.0%; P = .001) or require dose increases. Adverse effects were similar in both groups.
Cautions
Patients with chronic kidney disease (CKD) were excluded due to concerns about the accumulation of morphine metabolites. Additionally, this study was open label, increasing the risk of bias.
Implications
Low-dose morphine should be considered over the use of WOs to achieve better and more rapid pain control in patients without CKD.
The Use of Methadone as a Coanalgesic May Improve Moderate Cancer Pain
Courtemanche F, Dao D, Gagné F, et al. Methadone as a coanalgesic for palliative care cancer patients. J Palliat Med. 2016;19(9):972-978.
Background
Methadone is effective at treating cancer pain and is often utilized when patients have neuropathic pain, fail to respond to traditional opioids, or have renal failure.9,10 However, its long half-life and many drug interactions make methadone challenging to use.
Findings
This cohort study looked at 153 inpatient or outpatient PC patients in Montreal who received methadone as a coanalgesic for cancer pain. The patients’ median morphine equivalent dose was 120 mg when initiating methadone. The median starting dose of methadone was 3 mg per day. Of patients, 49.3% had a significant response (≥30% pain reduction), with a median response time of 7 days, and 30.1% achieved a substantial response (≥50% pain reduction), with a median response time of 3 days. Patients with higher initial pain scores were more likely to respond to adjuvant methadone. Those who had not responded after a week of methadone were unlikely to respond despite dose escalations. Adverse effects included drowsiness (51.4%), confusion (27.4%), constipation (24.7%), nausea (19.9%), and myoclonia (16.4%).
Cautions
This was an observational study with retrospective data, leading to higher levels of missing data. A high rate of adverse side effects was reported (90.4%). Further study is needed to validate and reproduce the findings.
Implications
The use of adjuvant low-dose methadone may be considered in patients with moderate pain despite high-dose opioids. If a response is not seen within 7 days, then methadone use should be reconsidered.
ANTIBIOTIC STEWARDSHIP
Many Hospitalized Patients on Comfort Care Still Receive Antimicrobials
Merel SE, Meier CA, McKinney CM, Pottinger PS. Antimicrobial use in patients on a comfort care protocol: a retrospective cohort study. J Palliat Med. 2016;19(11):1210-1214.
Background
It is unknown how often patients who are hospitalized at the end of life continue to receive antimicrobials and what factors are associated with antimicrobial use.
Findings
This retrospective cohort study of 1881 hospitalized adults transitioned to a comfort care order (CCO) set at 2 academic medical centers found that 77% of these patients received antimicrobials during their hospital stay (62.4% at 24 hours prior to CCO). Of the 711 still alive at ≥24 hours after CCO, 111 (15.6%) were still on antimicrobials, with that proportion remaining stable for the remainder of hospitalization. In comparing those who did and did not receive antimicrobials after 24 hours of CCO, the presence of a documented infection was not significantly different after adjusting for age. Those with a cancer diagnosis (adjusted risk ratio [ARR] = 1.44: P = .04), a longer length of stay (≥7 days vs <7 days; ARR = 1.49; P = .05), and those discharged home (ARR 2.93; P < .001) or to a facility (ARR 3.63; P < .001) versus dying in the hospital were more likely to be on antimicrobials 24 hours after CCO. Compared with those on a medicine service, patients in the medical and surgical intensive care units (ICUs) were less likely to receive antimicrobials (medical ICU ARR = 0.32; P = .01; surgical ICU and/or neuro-ICU ARR = 0.32; P = .02). The most commonly administered antimicrobials were fluoroquinolones and vancomycin.
Cautions
Only 111 patients were still on antimicrobials at 24 hours, which limited analysis. Investigators relied on retrospective data for medication administration and diagnoses.
Implications
Further work is needed to understand and address the expectations of clinicians, patients, and families regarding the role of antimicrobials at the end of life.
COMMUNICATION AND DECISION MAKING
Video Decision Aids Improved Rates of Advance Care Planning and Hospice Use and Decreased Costs
Volandes, AE, Paasche-Orlow MK, Davis AD et al. Use of video decision aids to promote advance care planning in Hilo, Hawai‘i. J Gen Intern Med. 2016;31(9):1035-1040.
Background
Advance care planning (ACP) can be enhanced with the use of video decision aids, which may help address scalability and cost.11 The Hawaii Medical Service Association began an initiative to improve ACP rates, which included a financial incentive. Clinician training and patient access to ACP videos were implemented 1 year into this campaign, which was intended for patients with late-stage disease.
Findings
This study tested the impact of the video intervention on the rates of ACP documentation in Hilo, Hawaii, along with secondary outcomes of hospice use, hospital deaths, and costs. The intervention was sequentially rolled out to Hilo Medical Center (HMC), followed by hospice and primary care practices. Following the video introduction, the proportion of patients discharged from HMC with ACP documentation markedly increased (3.2% to 39.9%; P < .001). The percentage of hospital patients discharged to hospice increased from 5.7% to 13.8% (P < .001). Overall admissions to the Hospice of Hilo increased at a greater rate than in other parts of Hawaii. After the intervention in Hilo, the in-hospital death rate among patients >65 years old declined slightly (P = .14), while in the rest of the state, the rate remained essentially unchanged. ACP planning did not reduce healthcare costs at the end of life, but costs seemed to increase more slowly in Hilo after the intervention than they did in the rest of Hawaii (P < .05).
Cautions
This report relies on before-and-after comparisons, with potential confounding by a background pay-for-quality initiative; however, the timing of the changes in outcomes correlates well with the introduction of the videos. ACP videos have been studied in other settings, so the intervention is likely generalizable to other states.
Implications
A widespread distribution of ACP videos and training for physicians in their use may lead to significant increases in ACP documentation and other beneficial clinical outcomes for patients and health systems.
A Standardized Palliative Care-Led Intervention Did Not Improve Psychological Outcomes in Families of Patients with Chronic Critical Illness
Carson SS, Cox CE, Wallenstein S, et al. Effect of palliative care-led meetings for families of patients with chronic critical illness: a randomized clinical trial. JAMA. 2016;316(1):51-62.
Background
Chronic critical illness (CCI) occurs when a patient neither recovers nor dies for days to weeks after an acute illness requiring aggressive intensive care. CCI is associated with poor patient and family outcomes.12 Does a protocol-driven support and information meeting led by PC providers improve these outcomes?
Findings
This multicenter RCT compared 130 CCI patients (184 surrogates) who received a structured intervention to 126 patients (181 surrogates) with usual care. The structured intervention was led by PC clinicians in order to provide supportive conversations and information about CCI and prognosis compared with the usual intensivist communication. The support and information team met with the families of patients in the intervention group after day 7 of mechanical ventilation (MV) and again 10 days later. Both the intervention and control groups received validated information about CCI, and all were eligible for specialty PC consultation, as indicated. The primary outcome of the study was the Hospital Anxiety and Depression Scale (HADS) at 90-day follow-up with the surrogates. Secondary endpoints included posttraumatic stress disorder (PTSD) assessment and other communication measures as well as patient outcomes (hospital mortality, 90-day survival, length of stay, and days of MV). At least 1 meeting took place for 89% of patients (82% of surrogates) in the intervention arm. Fewer patients in the intervention arm had nonstudy PC consultations (13% vs 22%). Ninety-day HADS results were similar in the 2 groups. PTSD symptoms, however, were higher in the intervention group (Impact of Event Scale-Revised score: 25.9 for intervention and 21.3 for control; intergroup difference 4.6 [95% confidence interval, 0.01-9.10]). There were no statistically significant differences among the patient-focused measures, including survival.
Cautions
Although the teams contained skilled clinicians led by PC practitioners, this was not an ordinary PC intervention. The intervention included information and emotional support meetings alone rather than support from a PC team driven by clinical considerations. This study included surrogates of patients with CCI but not other conditions.
Implications
Protocol-driven support and information meetings may not improve, and may slightly worsen, outcomes in families of patients with CCI. This study did not evaluate and should not be applied to clinically indicated, specialty PC consultation in the ICU.
CAREGIVER OUTCOMES
Caregivers of Patients Surviving Prolonged Critical Illness Experience High and Persistent Rates of Depression
Cameron JI, Chu LM, Matte A, et al. One-year outcomes in caregivers of critically ill patients. N Engl J Med. 2016;374(19):1831-1841.
Background
More than half of patients with a CCI require caregiver support 1 year after hospitalization.13 Caregivers provide tremendous physical and psychosocial support to their loved ones, but that care is often associated with significant burden.14
Findings
This prospective parallel cohort study followed caregivers of surviving patients ventilated for at least 7 days from 10 academic hospitals in Canada. The prevalence of depression (Center for Epidemiologic Studies–Depression scale ≥16) in this cohort of 280 caregivers (70% were women) was 67%, 49%, 43%, and 43% at the survey intervals of 7 days, 3 months, 6 months, and 12 months after ICU discharge, respectively. Using latent-class linear mixed models, the investigators identified 2 groups of caregivers: those whose depressive symptoms decreased over time (84%) and those whose depressive symptoms persisted at a high level for the year (16%). Patient characteristics (such as age, comorbidity, sex, and functional status) were not associated with caregiver outcomes. Younger caregiver age, greater effect of patient care on other activities, less social support, less mastery (sense of control), and less personal growth were associated with worse caregiver mental health outcomes.
Cautions
Although this is a high-quality prospective study, causality of caregiving on the high rates of depressive symptoms cannot be confirmed without a control group or knowledge of the caregivers’ mental health status prior to the episode of prolonged critical illness.
Implications
Patient critical illness may have serious impacts on caregiver health and well-being. Hospitalists should be attentive to factors associated with caregiver vulnerability and offer support. Improving caregivers’ sense of control and social support may be targets for interventions.
People with Non-normative Sexuality or Gender Face Additional Barriers and Stressors with Partner Loss
Bristowe K, Marshall S, Harding R. The bereavement experiences of lesbian, gay, bisexual and/or trans* people who have lost a partner: A systematic review, thematic synthesis and modelling of the literature. Palliat Med. 2016;30(8):730-744.
Background
Grief and bereavement impact individuals differently as they adjust to a death. Increasingly, it is recognized that lesbian, gay, bisexual, and/or transgender (LGBT) communities may face additional barriers when interacting with the healthcare system. This review sought to identify and appraise the evidence of the bereavement experiences among LGBT communities.
Findings
This systematic review summarized quantitative and qualitative data from 23 articles (13 studies). The synthesis noted that the pain associated with the loss of a partner was a universal experience regardless of sexual identity or gender history. Additional barriers and stressors of bereavement were reported for LGBT people, including homophobia, failure to acknowledge the relationship, additional legal and financial issues, and the shadow of human immunodeficiency virus (HIV) or acquired immunodeficiency syndrome (AIDS). LGBT people turned to additional resources for bereavement help: professional support, social and familial support, and societal and community support. Caregiver bereavement support experiences were shaped by whether the relationships were disclosed and accepted (acceptance-disclosure model).
Cautions
The quantitative data was mostly from the 1990s and described the context of HIV/AIDS. The qualitative studies, however, were done in the last decade. Very little research was available for transgender or bisexual caregivers.
Implications
People who identify as LGBT face additional barriers and stressors with the loss of a partner. The described acceptance-disclosure model may help providers be mindful of the additional barriers to LGBT bereavement support.
MORAL DISTRESS AND RESILIENCY
Physician Trainees Experience Significant Moral Distress with Futile Treatments
Dzeng E, Colaianni A, Roland M, et al. Moral distress amongst American physician trainees regarding futile treatments at the end of life: a qualitative study. J Gen Intern Med. 2016;31(1):93-99.
Background
Physician trainees are often faced with ethical challenges in providing end-of-life care. These ethical challenges can create confusion and conflict about the balance between the benefits and burdens experienced by patients.
Findings
The authors used semistructured, in-depth, qualitative interviews of 22 internal medicine trainees from 3 academic medical centers. An analysis of these interviews revealed several themes. Trainees reported moral distress when (1) many of the treatments provided in end-of-life care (ie, feeding tubes in advanced dementia) were perceived to be futile; (2) they felt obligated to provide end-of-life care that was not in the patient’s best interest, leading to “torture” or “suffering” for the patient; (3) they provided care they felt not to be in the patient’s best interest; (4) they perceived themselves to be powerless to affect change in these dilemmas; (5) they attributed some of their powerlessness to the hierarchy of their academic institutions; and (6) they feared that dehumanization and cynicism would be required to endure this distress.
Cautions
Resident recruitment occurred by solicitation, which may invite bias. Generalizability of qualitative studies to other settings can be limited.
Implications
Trainees may experience several dimensions of moral distress in end-of-life care. These findings challenge training programs to find ways to reduce the dehumanization, sense of powerlessness, and cynicism that this distress may cause.
Disclosure
The authors declare that they have no relevant financial conflicts of interest.
1. Morrison RS, Meier DE. Palliative care. N Engl J Med. 2004;350:2582-2590. PubMed
2. Quill TE, Abernethy AP. Generalist plus specialist palliative care—creating a more sustainable model. N Engl J Med. 2013;368(13):1173-1175. PubMed
3. Meier DE. Palliative care in hospitals. J Hosp Med. 2006;1:21-28. PubMed
4. Society of Hospital Medicine. Palliative care. J Hosp Med. 2006;1,S1:80-81.
5. Hosie A, Davidson PM, Agar M, Sanderson CR, Phillips J. Delirium prevalence, incidence, and implications for screening in specialist palliative care inpatient settings: a systematic review. Palliat Med. 2013;27(6):486-493. PubMed
6. Carnes M, Howell T, Rosenberg M, Francis J, Hildebrand C, Knuppel J. Physicians vary in approaches to the clinical management of delirium. J Am Geriatr Soc. 2003;51(2):234-239. PubMed
7. Neufeld KJ, Yue J, Robinson TN, Inouye SK, Needham DM. Antipsychotic medication for prevention and treatment of delirium in hospitalized adults: a systematic review and meta-analysis. J Am Geriatr Soc. 2016;64(4):705-14. PubMed
8. WHO. Cancer Pain Relief. 2nd ed. Geneva, Switzerland: WHO; 1996.
9. Leppert W. The role of methadone in cancer pain treatment—a review. Int J Clin Pract. 2009;63(7):1095-1109. PubMed
10. Morley JS, Bridson J, Nash TP, et al. Low-dose methadone has an analgesic effect in neuropathic pain: a double-blind randomized controlled crossover trial. Palliat Med. 2003;17(7):576-587. PubMed
11. Institute of Medicine. Dying in America: Improving Quality and Honoring Individual Preferences Near the End of Life. Washington, DC: The National Academies Press; 2014.
12. Nelson JE, Cox CE, Hope AA, Carson SS. Chronic Critical Illness. Am J Respir Crit Care Med. 2010;182(4):446-454. PubMed
13. Chelluri L, Im KA, Belle SH, et al. Long-term mortality and quality of life after prolonged mechanical ventilation. Crit Care Med. 2004;32(1):61-9. PubMed
14. Van Beusekom I, Bakhshi-Raiez F, deKeizer NF, Dongelmans DA, van der Schaaf M. Reported burden on informal caregivers of ICU survivors: a literature review. Crit Care. 2015;20:16. PubMed
© 2017 Society of Hospital Medicine
Inpatient Portals for Hospitalized Patients and Caregivers: A Systematic Review
Engaging patients and their caregivers in care improves health outcomes1-3 and is endorsed by leading healthcare organizations as essential to improving care quality and safety.4-6 Patient engagement emphasizes that patients, caregivers, and healthcare providers work together to “promote and support active patient and public involvement in health and healthcare and to strengthen their influence on healthcare decisions.”7 Patient portals, web-based personal health records linked to electronic health record (EHR) data, are intended to promote engagement by providing patients and their caregivers with timely electronic access to their healthcare information and supporting communication through secure messaging with their healthcare team.8 The use of patient portals has also been suggested as a way for patients and/or caregivers to identify and intercept medical errors, thus having the potential to also improve patient safety.8,9
As a requirement for meaningful use, access to health information through patient portals in the ambulatory setting has increased dramatically.10 Studies evaluating the use of these patient portals to promote patient-centered care are growing, but evidence supporting their impact on improved health outcomes is currently insufficient.11-15 Although research and policy focus on the use of patient portals in the ambulatory setting, recent literature suggests that patient portals may be used to share inpatient clinical information to engage patients and their caregivers during their hospitalization.16-18 Before the widespread use of patient portals in the inpatient setting is endorsed, systematic research is needed to understand optimal portal design requirements, if and how these portals are used, and whether their use provides value to the hospitalized patient and/or caregiver.8
Prior literature summarized early findings regarding the use of various technologies designed to engage hospitalized patients.17,19,20 In this systematic review, we describe the emerging literature examining the design, use, and impact of inpatient portals for hospitalized patients and/or caregivers over the last 10 years. Inpatient portals are defined here as electronic patient portals tethered to EHRs that are designed to provide hospitalized patients and/or caregivers secure access to personalized, inpatient clinical information with the intent of engaging them in their hospital care. After analyzing and summarizing these data, we then identify knowledge gaps and potential future research directions.
METHODS
Search Strategy, Study Selection, and Analysis
This systematic review included available, peer-reviewed, and grey literature published from January 1, 2006, to August 8, 2017, in PubMed, Web of Science (including the Institute of Electrical and Electronics Engineers Xplore), Cochrane, CINAHLPlus, and Scopus databases. Terms and phrases, including those found in the Medical Subject Heading (MeSH) index, were used to identify studies evaluating (1) patient portals (“health record, personal [MeSH],” “personal health record,” “patient portal,” “inpatient portal,” “ipad,” “tablet,” or “bedside information technology”), (2) engagement (“engagement,” “empowerment,” “participation,” “activation,” or “self-efficacy”), and (3) in the hospital (“inpatient [MeSH],” “hospital [MeSH],” “hospitalized patient [MeSH],” or “unit”). MeSH terms were used when applicable. Based on previous literature, free-text terms were also used when subject headings were not applied consistently, such as with terms related to engagement.17,21 Studies were excluded if they were not written in English, if they evaluated portals exclusively in the emergency department or ambulatory setting, and/or if they described future study protocols. Studies describing general inpatient technology or evaluating portals used in the hospital but not tethered to inpatient EHR clinical data were also excluded.
By using the Preferred Reporting Items for Systematic Reviews and Meta-Analyses guidelines,22 2 researchers (M.K. and P.H.) completed the literature search and potential article screening. Results were aggregated and studies were screened and excluded from full review based on title and abstract information. Additional studies were included after reference list review. During a full review of included studies, 2 researchers independently extracted data, including the study objective, design, setting, sample, data collection instruments, outcomes, and a description of results. Guided by our study objective, findings were reconciled by consensus and analyzed and described according to the following 3 themes: (1) inpatient portal design, (2) inpatient portal use and usability, and (3) the impact of inpatient portal use on patient or caregiver and healthcare team outcomes as defined by retrieved studies.
The quality of studies was evaluated by the same 2 researchers independently by using the Downs and Black checklist for assessing the methodological quality of randomized and nonrandomized healthcare interventions.23 Qualitative studies describing the development of portal prototypes and/or portal redesign efforts were excluded from these analyses. Discrepancies were resolved by consensus.Because of the wide variability in study designs, populations, and outcomes, a meta-analysis of pooled data was not performed.
RESULTS
Of the 731 studies identified through database searching and reference review, 36 were included for full-text review and 17 met inclusion criteria (Figure; Table 1). Studies excluded after full-text review described portal use outside of the inpatient setting, portals not linked to hospital EHR clinical data, portals not designed for inpatients, and/or inpatient technology in general. The inpatient portal platforms, hardware used, and functionalities varied within included studies (Table 2). The majority of studies used custom, web-based inpatient portal applications on tablet computers. Most provided information about the patients’ hospital medications, healthcare team, and education about their condition and/or a medical glossary. Many included the patient’s schedule, hospital problem list, discharge information, and a way to keep notes.
There has been a recent increase in inpatient portal study publication, with 9 studies published during or after 2016. Five were conducted in the pediatric setting and all but 130 with English-speaking participants. Twelve studies were qualitative, many of which were conducted in multiple phases by using semi-structured interviews and/or focus groups to develop or redesign inpatient portals. Of the remaining studies, 3 used a cross-sectional design, 1 used a before and after design without a control group, and 1 was a nonrandomized trial. Studies were rated as having medium-to-high risk of bias because of design flaws (Table 1 in supplementary Appendix). Because many studies were small pilot studies and all were single-centered studies, the generalizability of findings to different healthcare settings or patient populations is limited.
Inpatient Portal Design
Most included studies evaluated patient and/or caregiver information needs to design and/or enhance inpatient portals.16,24-37 In 1 study, patients described an overall lack of information provided in the hospital and insufficient time to understand and remember information, which, when shared, was often presented by using medical terminology.30 They wanted information to help them understand their daily hospital routine, confirm and compare medications and test results, learn about care, and prepare for discharge. Participants in multiple studies echoed these results, indicating the need for a schedule of upcoming clinical events (eg, medication administration, procedures, imaging), secure and timely clinical information (eg, list of diagnoses and medications, test results), personalized education, a medical glossary, discharge information, and a way to take notes and recognize and communicate with providers.
Patients also requested further information transparency,34,37 including physicians’ notes, radiology results, operative reports, and billing information, along with general hospital information,16 meal ordering,33 and video conferencing.27 ln designing and refining an inpatient medication-tracking tool, participants identified the need for information about medication dosage, frequency, timing, administration method, criticality, alternative medications or forms, and education.26,36 Patients and/or caregivers also indicated interest in communicating with inpatient providers by using the portal.16,27,28,30-37 In 1 study, patients highlighted the need to be involved in care plan development,27 which led to portal refinement to allow for patient-generated data entry, including care goals and a way to communicate real-time concerns and feedback.28
Studies also considered healthcare team perspectives to inform portal design.25,26,28,30,35,37 Although information needs usually overlapped, patient and healthcare team priorities differed in some areas. Although patients wanted to “know what was going to happen to them,” nurses in 1 study were more concerned about providing information to protect patients, such as safety and precaution materials.25 Similarly, when designing a medication-tracking tool, patients sought information that helped them understand what to expect, while pharmacists focused on medication safety and providing information that fit their workflow (eg, abstract medication schedules).36
Identified study data raised important portal interface design considerations. Results suggested clinical data should be presented by using simple displays,28 accommodating real-time information. Participants recommended links16,29 to personalized patient-friendly37 education accessed with minimal steps.26 Interfaces may be personalized for target users, such as patient or proxy and younger or older individuals. For example, older patients reported less familiarity with touch screens, internal keyboards, and handwriting recognition, favoring voice recognition for recording notes.27 This raised questions about how portals can be designed to best maintain patient privacy.25 Interface design, such as navigation, also relied heavily on hardware choice, such as tablet versus mobile phone.28
Inpatient Portal Use and Usability
Most patient and/or caregiver participants in included studies were interested in using an inpatient portal, used it when offered, found it easy to use, useful, and/or were satisfied with it.16,18,24-37 Most used and liked functionalities that provided healthcare team, test result, and medication information.22,33,37 In the 1 identified controlled trial,18 researchers evaluated an inpatient portal given to adult inpatients that included a problem list, schedule, medication list, and healthcare team information. Of the intervention unit patients, 80% used the portal, 76% indicated it was easy to use, and 71% thought it provided useful information. When a portal was given to 239 adult patients and caregivers in another study, 66% sent a total of 291 messages to the healthcare team.31 Of these, 153 provided feedback, 76 expressed preferences, and 16 communicated concerns. In a pediatric study, an inpatient portal was given to 296 parents who sent a total of 36 messages and 176 requests.33 Messages sent included information regarding caregiver needs, questions, updates, and/or positive endorsements of the healthcare team and/or care.
Impact of Inpatient Portal Use
Multiple studies evaluated the impact of inpatient portal use on patient and/or caregiver engagement, empowerment, activation, and/or knowledge, which had mixed results. Most adult patients interviewed in one study had positive experiences using a portal to answer their questions between physician visits and learn about, remember, and engage in care.37 A majority of adult inpatient portal users in another study agreed that portal use helped them feel in control and understand their condition; however, they did not report having improved discharge timing knowledge.29 In a pediatric study, most parent inpatient portal users agreed use improved their ability to monitor, understand, and make decisions about their child’s care.33 In the controlled trial,18 a higher percentage of portal intervention patients could identify their physician or role; however, patient activation was not statistically different between intervention and control patients.
Results from included studies also evaluated the impact of portal use on communication. Some suggest inpatient portal use may replace and/or facilitate verbal communication between patients, caregivers, and providers.35 In a pediatric study, 51% of parent portal users reported it gave them the information they needed, reducing the amount of questions they had for their healthcare team.33 Similarly 43% of 14 adult inpatient portal users in another study thought the portal could replace at least some face-to-face communication.37 Some providers indicated portal use enhanced rounding discussion quality.35 Another study suggested that patient-provider communication via electronic messaging may provide benefits for some patients and not others.37
Multiple studies evaluated patient, caregiver, and/or healthcare team perceptions of the impact of inpatient portal use on detection of errors and patient safety.29,31,33,35 In adult inpatients, 6% agreed portal use could help them find errors.29 In a pediatric study, 8% reported finding at least 1 medication error by using the portal, and 89% thought use reduced errors in their child’s care.33 One patient in a qualitative study of adult inpatients cited an example of a dosing error discovered by using the portal.37 Healthcare providers in another study also reported that use facilitated patient error identification.35
Included studies evaluated the potential impact of portal use on patient anxiety, confusion, and/or worry, and the work of healthcare teams. In 1 study, nurses voiced concerns about giving information subject to change or that couldn’t always be achieved because of competing hospital priorities, such as discharge timing.25 They also worried about giving medical information that would create cognitive overload for patients and/or require professional interpretation. Although providers in another study perceived little negative impact on their workflow after portal implementation, they worried about the potential of adding other information to the portal.35 For example, they were concerned that the future release of abnormal test results or sensitive data would lead to confusion and more time spent answering patient questions. Physicians also worried that secure messaging could be overused by patients, would be used to inappropriately express acute concerns, or might adversely affect verbal communication. Providers in 2 studies expressed concerns about potential negative implications of portal use on their work before implementation, which were subsequently reduced after portal implementation.29,38 Conversely, no parent portal users in another study thought portal information was confusing.33 One parent participant noted portal use may actually decrease anxiety: “Access to their medical information gives patients and their caregivers perspective and insight into their hospital care and empowers them with knowledge about [what is going on], which reduces anxiety.”37
DISCUSSION
We identified multiple studies evaluating the design, use, and impact of inpatient patient portals for hospitalized patients and caregivers. Based on the information needs identified by patients and healthcare team participants, multiple key content and design recommendations are suggested, including presenting (1) timely, personalized clinical and educational information in lay terms, (2) the care trajectory, including care plan and patient schedule, and (3) a way to recognize and communicate with the inpatient healthcare team. Design challenges still exist, such as translating medical terminology from EHRs into patient-friendly language, proxy access, and portal integration across transitions. Data from identified studies suggest hospitalized patients and caregivers are interested in and willing to use inpatient portals, but there is less information about the use of each functionality. Evidence supporting the role of inpatient portal use in improving patient and/or caregiver engagement, knowledge, communication, and the quality and safety of care is currently limited. Included studies indicate that healthcare team members had concerns about using portals to share clinical information and communicate electronically in the hospital. The extent to which these concerns translate to demonstrable problems remains to be seen.
Early studies focus on patient and caregiver information needs and portal interface design. Although the necessity for certain core functionalities and design requirements are becoming clear,20 best practices regarding the amount and timing of information released (eg, physician notes, lab results), optimal hardware decisions (eg, large-screen displays, hospital-owned tablets, bring-your-own-device model), and details around secure-messaging implementation in the acute hospital setting are still lacking. Future work is needed to understand optimal patient-provider communication architectures that support improved synchronous and asynchronous messaging and privacy-preserving approaches to the design of these systems to handle patient-generated data as it becomes more commonplace. Although patient participants in these studies were generally satisfied using inpatient portals, many indicated the need for even more transparency, such as the release of results in real time and inclusion of physician notes (even if they could not be fully comprehended).37 As the movement of sharing notes with patients in the ambulatory setting grows,39 it will inevitably extend to the inpatient setting.40 Further research is needed to understand the impact of increased transparency on health outcomes, patient anxiety, and inpatient healthcare team workload. Although the majority of studies described the design and/or use of custom portal platforms, EHR vendors are now developing inpatient portals that integrate into preexisting systems (eg, MyChart Bedside, Epic Systems). This will increase the likelihood of broad inpatient portal adoption and may facilitate multicenter trials evaluating the impact of their use.
The next steps will need to focus on the evaluation of specific inpatient portal functionalities and the impact of their use on objective process and outcome measures by using rigorous, experimental study designs. Akin to ambulatory portal research, measures of interest will include patient activation,41,42 patient and/or caregiver satisfaction,43 care processes (eg, length of stay, readmissions), and patient safety (eg, safety perceptions, adverse drug events, hospital-acquired conditions, and diagnostic errors). More than a mechanism for unidirectional sharing information from providers to the patient, inpatient portals will also provide a platform for the reciprocal exchange of information from the patient to the provider through patient-generated data, such as goal setting and feedback. Patients may play a larger role in reporting hospital satisfaction in real time, reconciling medications, contributing to the treatment plan, and identifying medical errors. As portals are integrated across the care continuum,20 our understanding of their impact may become more clear.
In this review, only 5 studies were conducted in the pediatric hospital setting.24,32-34,38 With hospitalized children experiencing 3 times more harm from medical errors than adults,44 engaging parents in inpatient care to improve safety has become a national priority.45 Giving patient portals, or “parent portals,” to parents of hospitalized children may provide a unique opportunity to share healthcare information and promote engagement, a direction for future study. There is also a research gap in evaluating adolescent inpatient portal use. Future portals may be designed to incentivize young children to learn about their hospitalization through games linked to health-related education.
Finally, as patients and caregivers begin using inpatient portals, there will almost certainly be consequences for healthcare teams. Understanding and anticipating human and work system factors influencing inpatient portal adoption and use from the perspectives of both patients and healthcare teams are needed.46,47 Engaging healthcare team members as valuable stakeholders during implementation and measuring the impact of portal use on their workload is necessary, especially as portal use spreads beyond pilot units. The success of inpatient portals is dependent upon both the positive benefits for patients and their acceptance by healthcare teams.48
Limitations exist in conducting a systematic literature review.49 The conceptual definition of a portal for hospitalized patients and patient/caregiver engagement is evolving; therefore, our definition may not have captured all relevant studies. We intentionally did not include all inpatient technology, as we were interested in a narrow definition of portals designed for inpatients that provided clinical information from the inpatient EHR. Because of rapid technology changes, we also limited our search to studies published within the last 10 years; prior literature has been described elsewhere.17 We excluded non-English language studies, limiting our ability to capture the full scope of inpatient portal research. These patients already experience healthcare delivery disparities, widened by the inaccessibility of innovative health information technologies.50 Future studies would be enhanced with the inclusion of these participants.
Inpatient portal research is in its infancy but growing rapidly. Studies to date are primarily focused on portal design and have small sample sizes. Early findings suggest that patients and caregivers are, in general, enthusiastic about using inpatient portals. Further research is needed, however, to determine the impact of inpatient portal use on patient engagement and hospital-care quality, safety, and cost.
Disclosure
This work was supported by a Department of Pediatrics Research and Development Grant at the University of Wisconsin School of Medicine and Public Health. This publication was also supported by the Clinical and Translational Science Award program through the National Center for Advancing Translational Sciences, grant UL1TR000427. Dr. Hoonakker’s involvement was also partially supported by the National Science Foundation, grant CMMI 1536987. Funding sources had no involvement in study design, analysis, or interpretation of data. The authors have no conflicts of interest to declare.
1. Stewart M, Brown JB, Donner A, et al. The impact of patient-centered care on outcomes. J Fam Pract. 2000;49(9):796-804. PubMed
2. Little P, Everitt H, Williamson I, et al. Observational study of effect of patient centredness and positive approach on outcomes of general practice consultations. BMJ. 2001;323(7318):908-911. PubMed
3. Maeng DD, Graf TR, Davis DE, Tomcavage J, Bloom FJ, Jr. Can a patient-centered medical home lead to better patient outcomes? The Quality Implications of Geisinger’s ProvenHealth Navigator. Am J Med Qual. 2012;27(3):210-216. PubMed
4. Joint Commision on Accreditation of Healthcare Organizations. Speak up: Prevent errors in your child’s care. http://www.jointcommission.org/Speak_Up_Prevent_Errors_in_Your_Childs_Care/. Accessed June 10, 2017.
5. Committee on Hospital Care and Institute for Patient and Family-centered Care. Patient- and family-centered care and the pediatrician’s role. Pediatrics. 2012;129(2):394-404. PubMed
6. Institute of Medicine Committee on Quality of Health Care in America. Crossing the Quality Chasm: A New Health System for the 21st Century. Washington, DC: National Academy Press; 2001. PubMed
7. Coulter A. Engaging Patients in Healthcare. New York: McGraw-Hill Education; 2011. PubMed
8. Tang PC, Ash JS, Bates DW, Overhage JM, Sands DZ. Personal health records: definitions, benefits, and strategies for overcoming barriers to adoption. J Am Med Inform Assoc. 2006;13(2):121-126. PubMed
9. Schnipper JL, Gandhi TK, Wald JS, et al. Design and implementation of a web-based patient portal linked to an electronic health record designed to improve medication safety: the Patient Gateway medications module. Inform Prim Care. 2008;16(2):147-155. PubMed
10. Blumenthal D, Tavenner M. The “meaningful use” regulation for electronic health records. N Engl J Med. 2010;363(6):501-504. PubMed
11. Ammenwerth E, Schnell-Inderst P, Hoerbst A. The impact of electronic patient portals on patient care: a systematic review of controlled trials. J Med Internet Res. 2012;14(6):e162. PubMed
12. Goldzweig CL, Orshansky G, Paige NM, et al. Electronic patient portals: evidence on health utcomes, satisfaction, efficiency, and attitudes: a systematic review. Ann Intern Med. 2013;159(10):677-687. PubMed
13. Davis Giardina T, Menon S, Parrish DE, Sittig DF, Singh H. Patient access to medical records and healthcare outcomes: a systematic review. J Am Med Inform Assoc. 2014;21(4):737-741. PubMed
14. Kalra D, Fernando B. A review of the empirical evidence of the healthcare benefits of personal health records. Yearb Med Inform. 2013;8(1):93-102. PubMed
15. Kruse CS, Bolton K, Freriks G. The effect of patient portals on quality outcomes and its implications to meaningful use: a systematic review. J Med Internet Res. 2015;17(2):e44. PubMed
16. Vawdrey DK, Wilcox LG, Collins SA, et al. A tablet computer application for patients to participate in their hospital care. AMIA Annu Symp Proc. 2011:1428-1435. PubMed
17. Prey JE, Woollen J, Wilcox L, et al. Patient engagement in the inpatient setting: a systematic review. J Am Med Inform Assoc. 2014;21(4):742-750. PubMed
18. O’Leary KJ, Lohman ME, Culver E, et al. The effect of tablet computers with a mobile patient portal application on hospitalized patients’ knowledge and activation. J Am Med Inform Assoc. 2016;23(1):159-165. PubMed
19. Skeels M, Tan DS. Identifying opportunities for inpatient-centric technology. Proceedings of the 1st ACM International Health Informatics Symposium. Arlington: ACM; 2010:580-589.
20. Collins SA, Rozenblum R, Leung WY, et al. Acute care patient portals: a qualitative study of stakeholder perspectives on current practices. J Am Med Inform Assoc. 2017;24(e1):e9-e17. PubMed
21. Morris D, Karlson A. Dynamic Accessibility Requirements for Hospital Patients. SIGCHI Conference on Human Factors in Computing Systems. Vancouver, BC, Canada: ACM; 2011.
22. Moher D, Liberati A, Tetzlaff J, Altman DG; PRISMA Group. Preferred reporting items for systematic reviews and meta-analyses: the PRISMA statement. BMJ. 2009;339:b2535. PubMed
23. Downs SH, Black N. The feasibility of creating a checklist for the assessment of the methodological quality both of randomised and non-randomised studies of health care interventions. J Epidemiol Community Health. 1998;52(6):377-384. PubMed
24. Weyand SA, Frize M, Bariciak E, Dunn S. Development and usability testing of a parent decision support tool for the neonatal intensive care unit. Conf Proc IEEE Eng Med Biol Soc. 2011:6430-6433. PubMed
25. Caligtan CA, Carroll DL, Hurley AC, Gersh-Zaremski R, Dykes PC. Bedside information technology to support patient-centered care. Int J Med Inform. 2012;81(7):442-451. PubMed
26. Wilcox L, Feiner S, Liu A, Restaino S, Collins S, Vawdrey D. Designing inpatient technology to meet the medication information needs of cardiology patients. Proceedings of the 2nd ACM SIGHIT International Health Informatics Symposium. Miami: ACM; 2012:831-836. PubMed
27. Dykes PC, Carroll DL, Hurley AC, et al. Building and testing a patient-centric electronic bedside communication center. J Gerontol Nurs. 2013;39(1):15-19. PubMed
28. Dykes PC, Stade D, Chang F, et al. Participatory design and development of a patient-centered toolkit to engage hospitalized patients and care partners in their plan of care. AMIA Annu Symp Proc. 2014:486-495. PubMed
29. Pell JM, Mancuso M, Limon S, Oman K, Lin CT. Patient access to electronic health records during hospitalization. JAMA Intern Med. 2015;175(5):856-858. PubMed
30. Yoo S, Lee KH, Baek H, et al. Development and user research of a smart bedside station system toward patient-centered healthcare system. J Med Syst. 2015;39(9):86. PubMed
31. Dalal AK, Dykes PC, Collins S, et al. A web-based, patient-centered toolkit to engage patients and caregivers in the acute care setting: a preliminary evaluation. J Am Med Inform Assoc. 2016;23(1):80-87. PubMed
32. Kaziunas E, Hanauer DA, Ackerman MS, Choi SW. Identifying unmet informational needs in the inpatient setting to increase patient and caregiver engagement in the context of pediatric hematopoietic stem cell transplantation. J Am Med Inform Assoc. 2016;23(1):94-104. PubMed
33. Kelly MM, Hoonakker PLT, Dean SM. Using an inpatient portal to engage families in pediatric hospital care. J Am Med Inform Assoc. 2016;24(1):153-161. PubMed
34. Maher M, Kaziunas E, Ackerman M, et al. User-centered design groups to engage patients and caregivers with a personalized health information technology tool. Biol Blood Marrow Transplant. 2016;22(2):349-358. PubMed
35. O’Leary KJ, Sharma RK, Killarney A, et al. Patients’ and healthcare providers’ perceptions of a mobile portal application for hospitalized patients. BMC Med Inform Decis Mak. 2016;16(1):123-130. PubMed
36. Wilcox L, Woollen J, Prey J, et al. Interactive tools for inpatient medication tracking: a multi-phase study with cardiothoracic surgery patients. J Am Med Inform Assoc. 2016;23(1):144-158. PubMed
37. Woollen J, Prey J, Wilcox L, et al. Patient experiences using an inpatient personal health record. Appl Clin Inform. 2016;7(2):446-460. PubMed
38. Kelly MM, Dean SM, Carayon P, Wetterneck TB, Hoonakker PLT. Healthcare team perceptions of a portal for parents of hospitalized children before and after implementation. Appl Clin Inform. 2017;8(1):265-278. PubMed
39. Wolff JL, Darer JD, Berger A, et al. Inviting patients and care partners to read doctors’ notes: OpenNotes and shared access to electronic medical records. J Am Med Inform Assoc. 2017;24(e1):e166-e172. PubMed
40. Feldman HJ, Walker J, Li J, Delbanco T. OpenNotes:hospitalists’ challenge and opportunity. J Hosp Med. 2013;8(7):414-417. PubMed
41. Hibbard JH, Stockard J, Mahoney ER, Tusler M. Development of the Patient Activation Measure (PAM): conceptualizing and measuring activation in patients and consumers. Health Serv Res. 2004;39(4 Pt 1):1005-1026. PubMed
42. Prey JE, Qian M, Restaino S, et al. Reliability and validity of the patient activation measure in hospitalized patients. Patient Educ Couns. 2016;99(12):2026-2033. PubMed
43. Toomey SL, Zaslavsky AM, Elliott MN, et al. The development of a pediatric inpatient experience of care measure: Child HCAHPS. Pediatrics. 2015;136(2):360-369. PubMed
44. Kaushal R, Bates DW, Landrigan C, et al. Medication errors and adverse drug events in pediatric inpatients. JAMA. 2001;285(16):2114-2120. PubMed
45. Agency for Healthcare Research and Quality. 20 Tips to help prevent medical errors in children. Secondary 20 Tips to help prevent medical errors in children. http://www.ahrq.gov/patients-consumers/care-planning/errors/20tips/index.html. Accessed on June 10, 2017.
46. Thompson MJ, Reilly JD, Valdez RS. Work system barriers to patient, provider, and caregiver use of personal health records: A systematic review. Appl Ergon. 2016;54:218-242. PubMed
47. Holden RJ, Carayon P, Gurses AP, et al. SEIPS 2.0: a human factors framework for studying and improving the work of healthcare professionals and patients. Ergonomics. 2013;56(11):1669-1686. PubMed
48. Gagnon MP, Ngangue P, Payne-Gagnon J, Desmartis M. m-Health adoption by healthcare professionals: a systematic review. J Am Med Inform Assoc. 2016;23(1):212-220. PubMed
49. Russell CL. An overview of the integrative research review. Prog Transplant. 2005;15(1):8-13. PubMed
50. Yamin CK, Emani S, Williams DH, et al. The digital divide in adoption and use of a personal health record. Arch Intern Med. 2011;171(6):568-574. PubMed
Engaging patients and their caregivers in care improves health outcomes1-3 and is endorsed by leading healthcare organizations as essential to improving care quality and safety.4-6 Patient engagement emphasizes that patients, caregivers, and healthcare providers work together to “promote and support active patient and public involvement in health and healthcare and to strengthen their influence on healthcare decisions.”7 Patient portals, web-based personal health records linked to electronic health record (EHR) data, are intended to promote engagement by providing patients and their caregivers with timely electronic access to their healthcare information and supporting communication through secure messaging with their healthcare team.8 The use of patient portals has also been suggested as a way for patients and/or caregivers to identify and intercept medical errors, thus having the potential to also improve patient safety.8,9
As a requirement for meaningful use, access to health information through patient portals in the ambulatory setting has increased dramatically.10 Studies evaluating the use of these patient portals to promote patient-centered care are growing, but evidence supporting their impact on improved health outcomes is currently insufficient.11-15 Although research and policy focus on the use of patient portals in the ambulatory setting, recent literature suggests that patient portals may be used to share inpatient clinical information to engage patients and their caregivers during their hospitalization.16-18 Before the widespread use of patient portals in the inpatient setting is endorsed, systematic research is needed to understand optimal portal design requirements, if and how these portals are used, and whether their use provides value to the hospitalized patient and/or caregiver.8
Prior literature summarized early findings regarding the use of various technologies designed to engage hospitalized patients.17,19,20 In this systematic review, we describe the emerging literature examining the design, use, and impact of inpatient portals for hospitalized patients and/or caregivers over the last 10 years. Inpatient portals are defined here as electronic patient portals tethered to EHRs that are designed to provide hospitalized patients and/or caregivers secure access to personalized, inpatient clinical information with the intent of engaging them in their hospital care. After analyzing and summarizing these data, we then identify knowledge gaps and potential future research directions.
METHODS
Search Strategy, Study Selection, and Analysis
This systematic review included available, peer-reviewed, and grey literature published from January 1, 2006, to August 8, 2017, in PubMed, Web of Science (including the Institute of Electrical and Electronics Engineers Xplore), Cochrane, CINAHLPlus, and Scopus databases. Terms and phrases, including those found in the Medical Subject Heading (MeSH) index, were used to identify studies evaluating (1) patient portals (“health record, personal [MeSH],” “personal health record,” “patient portal,” “inpatient portal,” “ipad,” “tablet,” or “bedside information technology”), (2) engagement (“engagement,” “empowerment,” “participation,” “activation,” or “self-efficacy”), and (3) in the hospital (“inpatient [MeSH],” “hospital [MeSH],” “hospitalized patient [MeSH],” or “unit”). MeSH terms were used when applicable. Based on previous literature, free-text terms were also used when subject headings were not applied consistently, such as with terms related to engagement.17,21 Studies were excluded if they were not written in English, if they evaluated portals exclusively in the emergency department or ambulatory setting, and/or if they described future study protocols. Studies describing general inpatient technology or evaluating portals used in the hospital but not tethered to inpatient EHR clinical data were also excluded.
By using the Preferred Reporting Items for Systematic Reviews and Meta-Analyses guidelines,22 2 researchers (M.K. and P.H.) completed the literature search and potential article screening. Results were aggregated and studies were screened and excluded from full review based on title and abstract information. Additional studies were included after reference list review. During a full review of included studies, 2 researchers independently extracted data, including the study objective, design, setting, sample, data collection instruments, outcomes, and a description of results. Guided by our study objective, findings were reconciled by consensus and analyzed and described according to the following 3 themes: (1) inpatient portal design, (2) inpatient portal use and usability, and (3) the impact of inpatient portal use on patient or caregiver and healthcare team outcomes as defined by retrieved studies.
The quality of studies was evaluated by the same 2 researchers independently by using the Downs and Black checklist for assessing the methodological quality of randomized and nonrandomized healthcare interventions.23 Qualitative studies describing the development of portal prototypes and/or portal redesign efforts were excluded from these analyses. Discrepancies were resolved by consensus.Because of the wide variability in study designs, populations, and outcomes, a meta-analysis of pooled data was not performed.
RESULTS
Of the 731 studies identified through database searching and reference review, 36 were included for full-text review and 17 met inclusion criteria (Figure; Table 1). Studies excluded after full-text review described portal use outside of the inpatient setting, portals not linked to hospital EHR clinical data, portals not designed for inpatients, and/or inpatient technology in general. The inpatient portal platforms, hardware used, and functionalities varied within included studies (Table 2). The majority of studies used custom, web-based inpatient portal applications on tablet computers. Most provided information about the patients’ hospital medications, healthcare team, and education about their condition and/or a medical glossary. Many included the patient’s schedule, hospital problem list, discharge information, and a way to keep notes.
There has been a recent increase in inpatient portal study publication, with 9 studies published during or after 2016. Five were conducted in the pediatric setting and all but 130 with English-speaking participants. Twelve studies were qualitative, many of which were conducted in multiple phases by using semi-structured interviews and/or focus groups to develop or redesign inpatient portals. Of the remaining studies, 3 used a cross-sectional design, 1 used a before and after design without a control group, and 1 was a nonrandomized trial. Studies were rated as having medium-to-high risk of bias because of design flaws (Table 1 in supplementary Appendix). Because many studies were small pilot studies and all were single-centered studies, the generalizability of findings to different healthcare settings or patient populations is limited.
Inpatient Portal Design
Most included studies evaluated patient and/or caregiver information needs to design and/or enhance inpatient portals.16,24-37 In 1 study, patients described an overall lack of information provided in the hospital and insufficient time to understand and remember information, which, when shared, was often presented by using medical terminology.30 They wanted information to help them understand their daily hospital routine, confirm and compare medications and test results, learn about care, and prepare for discharge. Participants in multiple studies echoed these results, indicating the need for a schedule of upcoming clinical events (eg, medication administration, procedures, imaging), secure and timely clinical information (eg, list of diagnoses and medications, test results), personalized education, a medical glossary, discharge information, and a way to take notes and recognize and communicate with providers.
Patients also requested further information transparency,34,37 including physicians’ notes, radiology results, operative reports, and billing information, along with general hospital information,16 meal ordering,33 and video conferencing.27 ln designing and refining an inpatient medication-tracking tool, participants identified the need for information about medication dosage, frequency, timing, administration method, criticality, alternative medications or forms, and education.26,36 Patients and/or caregivers also indicated interest in communicating with inpatient providers by using the portal.16,27,28,30-37 In 1 study, patients highlighted the need to be involved in care plan development,27 which led to portal refinement to allow for patient-generated data entry, including care goals and a way to communicate real-time concerns and feedback.28
Studies also considered healthcare team perspectives to inform portal design.25,26,28,30,35,37 Although information needs usually overlapped, patient and healthcare team priorities differed in some areas. Although patients wanted to “know what was going to happen to them,” nurses in 1 study were more concerned about providing information to protect patients, such as safety and precaution materials.25 Similarly, when designing a medication-tracking tool, patients sought information that helped them understand what to expect, while pharmacists focused on medication safety and providing information that fit their workflow (eg, abstract medication schedules).36
Identified study data raised important portal interface design considerations. Results suggested clinical data should be presented by using simple displays,28 accommodating real-time information. Participants recommended links16,29 to personalized patient-friendly37 education accessed with minimal steps.26 Interfaces may be personalized for target users, such as patient or proxy and younger or older individuals. For example, older patients reported less familiarity with touch screens, internal keyboards, and handwriting recognition, favoring voice recognition for recording notes.27 This raised questions about how portals can be designed to best maintain patient privacy.25 Interface design, such as navigation, also relied heavily on hardware choice, such as tablet versus mobile phone.28
Inpatient Portal Use and Usability
Most patient and/or caregiver participants in included studies were interested in using an inpatient portal, used it when offered, found it easy to use, useful, and/or were satisfied with it.16,18,24-37 Most used and liked functionalities that provided healthcare team, test result, and medication information.22,33,37 In the 1 identified controlled trial,18 researchers evaluated an inpatient portal given to adult inpatients that included a problem list, schedule, medication list, and healthcare team information. Of the intervention unit patients, 80% used the portal, 76% indicated it was easy to use, and 71% thought it provided useful information. When a portal was given to 239 adult patients and caregivers in another study, 66% sent a total of 291 messages to the healthcare team.31 Of these, 153 provided feedback, 76 expressed preferences, and 16 communicated concerns. In a pediatric study, an inpatient portal was given to 296 parents who sent a total of 36 messages and 176 requests.33 Messages sent included information regarding caregiver needs, questions, updates, and/or positive endorsements of the healthcare team and/or care.
Impact of Inpatient Portal Use
Multiple studies evaluated the impact of inpatient portal use on patient and/or caregiver engagement, empowerment, activation, and/or knowledge, which had mixed results. Most adult patients interviewed in one study had positive experiences using a portal to answer their questions between physician visits and learn about, remember, and engage in care.37 A majority of adult inpatient portal users in another study agreed that portal use helped them feel in control and understand their condition; however, they did not report having improved discharge timing knowledge.29 In a pediatric study, most parent inpatient portal users agreed use improved their ability to monitor, understand, and make decisions about their child’s care.33 In the controlled trial,18 a higher percentage of portal intervention patients could identify their physician or role; however, patient activation was not statistically different between intervention and control patients.
Results from included studies also evaluated the impact of portal use on communication. Some suggest inpatient portal use may replace and/or facilitate verbal communication between patients, caregivers, and providers.35 In a pediatric study, 51% of parent portal users reported it gave them the information they needed, reducing the amount of questions they had for their healthcare team.33 Similarly 43% of 14 adult inpatient portal users in another study thought the portal could replace at least some face-to-face communication.37 Some providers indicated portal use enhanced rounding discussion quality.35 Another study suggested that patient-provider communication via electronic messaging may provide benefits for some patients and not others.37
Multiple studies evaluated patient, caregiver, and/or healthcare team perceptions of the impact of inpatient portal use on detection of errors and patient safety.29,31,33,35 In adult inpatients, 6% agreed portal use could help them find errors.29 In a pediatric study, 8% reported finding at least 1 medication error by using the portal, and 89% thought use reduced errors in their child’s care.33 One patient in a qualitative study of adult inpatients cited an example of a dosing error discovered by using the portal.37 Healthcare providers in another study also reported that use facilitated patient error identification.35
Included studies evaluated the potential impact of portal use on patient anxiety, confusion, and/or worry, and the work of healthcare teams. In 1 study, nurses voiced concerns about giving information subject to change or that couldn’t always be achieved because of competing hospital priorities, such as discharge timing.25 They also worried about giving medical information that would create cognitive overload for patients and/or require professional interpretation. Although providers in another study perceived little negative impact on their workflow after portal implementation, they worried about the potential of adding other information to the portal.35 For example, they were concerned that the future release of abnormal test results or sensitive data would lead to confusion and more time spent answering patient questions. Physicians also worried that secure messaging could be overused by patients, would be used to inappropriately express acute concerns, or might adversely affect verbal communication. Providers in 2 studies expressed concerns about potential negative implications of portal use on their work before implementation, which were subsequently reduced after portal implementation.29,38 Conversely, no parent portal users in another study thought portal information was confusing.33 One parent participant noted portal use may actually decrease anxiety: “Access to their medical information gives patients and their caregivers perspective and insight into their hospital care and empowers them with knowledge about [what is going on], which reduces anxiety.”37
DISCUSSION
We identified multiple studies evaluating the design, use, and impact of inpatient patient portals for hospitalized patients and caregivers. Based on the information needs identified by patients and healthcare team participants, multiple key content and design recommendations are suggested, including presenting (1) timely, personalized clinical and educational information in lay terms, (2) the care trajectory, including care plan and patient schedule, and (3) a way to recognize and communicate with the inpatient healthcare team. Design challenges still exist, such as translating medical terminology from EHRs into patient-friendly language, proxy access, and portal integration across transitions. Data from identified studies suggest hospitalized patients and caregivers are interested in and willing to use inpatient portals, but there is less information about the use of each functionality. Evidence supporting the role of inpatient portal use in improving patient and/or caregiver engagement, knowledge, communication, and the quality and safety of care is currently limited. Included studies indicate that healthcare team members had concerns about using portals to share clinical information and communicate electronically in the hospital. The extent to which these concerns translate to demonstrable problems remains to be seen.
Early studies focus on patient and caregiver information needs and portal interface design. Although the necessity for certain core functionalities and design requirements are becoming clear,20 best practices regarding the amount and timing of information released (eg, physician notes, lab results), optimal hardware decisions (eg, large-screen displays, hospital-owned tablets, bring-your-own-device model), and details around secure-messaging implementation in the acute hospital setting are still lacking. Future work is needed to understand optimal patient-provider communication architectures that support improved synchronous and asynchronous messaging and privacy-preserving approaches to the design of these systems to handle patient-generated data as it becomes more commonplace. Although patient participants in these studies were generally satisfied using inpatient portals, many indicated the need for even more transparency, such as the release of results in real time and inclusion of physician notes (even if they could not be fully comprehended).37 As the movement of sharing notes with patients in the ambulatory setting grows,39 it will inevitably extend to the inpatient setting.40 Further research is needed to understand the impact of increased transparency on health outcomes, patient anxiety, and inpatient healthcare team workload. Although the majority of studies described the design and/or use of custom portal platforms, EHR vendors are now developing inpatient portals that integrate into preexisting systems (eg, MyChart Bedside, Epic Systems). This will increase the likelihood of broad inpatient portal adoption and may facilitate multicenter trials evaluating the impact of their use.
The next steps will need to focus on the evaluation of specific inpatient portal functionalities and the impact of their use on objective process and outcome measures by using rigorous, experimental study designs. Akin to ambulatory portal research, measures of interest will include patient activation,41,42 patient and/or caregiver satisfaction,43 care processes (eg, length of stay, readmissions), and patient safety (eg, safety perceptions, adverse drug events, hospital-acquired conditions, and diagnostic errors). More than a mechanism for unidirectional sharing information from providers to the patient, inpatient portals will also provide a platform for the reciprocal exchange of information from the patient to the provider through patient-generated data, such as goal setting and feedback. Patients may play a larger role in reporting hospital satisfaction in real time, reconciling medications, contributing to the treatment plan, and identifying medical errors. As portals are integrated across the care continuum,20 our understanding of their impact may become more clear.
In this review, only 5 studies were conducted in the pediatric hospital setting.24,32-34,38 With hospitalized children experiencing 3 times more harm from medical errors than adults,44 engaging parents in inpatient care to improve safety has become a national priority.45 Giving patient portals, or “parent portals,” to parents of hospitalized children may provide a unique opportunity to share healthcare information and promote engagement, a direction for future study. There is also a research gap in evaluating adolescent inpatient portal use. Future portals may be designed to incentivize young children to learn about their hospitalization through games linked to health-related education.
Finally, as patients and caregivers begin using inpatient portals, there will almost certainly be consequences for healthcare teams. Understanding and anticipating human and work system factors influencing inpatient portal adoption and use from the perspectives of both patients and healthcare teams are needed.46,47 Engaging healthcare team members as valuable stakeholders during implementation and measuring the impact of portal use on their workload is necessary, especially as portal use spreads beyond pilot units. The success of inpatient portals is dependent upon both the positive benefits for patients and their acceptance by healthcare teams.48
Limitations exist in conducting a systematic literature review.49 The conceptual definition of a portal for hospitalized patients and patient/caregiver engagement is evolving; therefore, our definition may not have captured all relevant studies. We intentionally did not include all inpatient technology, as we were interested in a narrow definition of portals designed for inpatients that provided clinical information from the inpatient EHR. Because of rapid technology changes, we also limited our search to studies published within the last 10 years; prior literature has been described elsewhere.17 We excluded non-English language studies, limiting our ability to capture the full scope of inpatient portal research. These patients already experience healthcare delivery disparities, widened by the inaccessibility of innovative health information technologies.50 Future studies would be enhanced with the inclusion of these participants.
Inpatient portal research is in its infancy but growing rapidly. Studies to date are primarily focused on portal design and have small sample sizes. Early findings suggest that patients and caregivers are, in general, enthusiastic about using inpatient portals. Further research is needed, however, to determine the impact of inpatient portal use on patient engagement and hospital-care quality, safety, and cost.
Disclosure
This work was supported by a Department of Pediatrics Research and Development Grant at the University of Wisconsin School of Medicine and Public Health. This publication was also supported by the Clinical and Translational Science Award program through the National Center for Advancing Translational Sciences, grant UL1TR000427. Dr. Hoonakker’s involvement was also partially supported by the National Science Foundation, grant CMMI 1536987. Funding sources had no involvement in study design, analysis, or interpretation of data. The authors have no conflicts of interest to declare.
1. Stewart M, Brown JB, Donner A, et al. The impact of patient-centered care on outcomes. J Fam Pract. 2000;49(9):796-804. PubMed
2. Little P, Everitt H, Williamson I, et al. Observational study of effect of patient centredness and positive approach on outcomes of general practice consultations. BMJ. 2001;323(7318):908-911. PubMed
3. Maeng DD, Graf TR, Davis DE, Tomcavage J, Bloom FJ, Jr. Can a patient-centered medical home lead to better patient outcomes? The Quality Implications of Geisinger’s ProvenHealth Navigator. Am J Med Qual. 2012;27(3):210-216. PubMed
4. Joint Commision on Accreditation of Healthcare Organizations. Speak up: Prevent errors in your child’s care. http://www.jointcommission.org/Speak_Up_Prevent_Errors_in_Your_Childs_Care/. Accessed June 10, 2017.
5. Committee on Hospital Care and Institute for Patient and Family-centered Care. Patient- and family-centered care and the pediatrician’s role. Pediatrics. 2012;129(2):394-404. PubMed
6. Institute of Medicine Committee on Quality of Health Care in America. Crossing the Quality Chasm: A New Health System for the 21st Century. Washington, DC: National Academy Press; 2001. PubMed
7. Coulter A. Engaging Patients in Healthcare. New York: McGraw-Hill Education; 2011. PubMed
8. Tang PC, Ash JS, Bates DW, Overhage JM, Sands DZ. Personal health records: definitions, benefits, and strategies for overcoming barriers to adoption. J Am Med Inform Assoc. 2006;13(2):121-126. PubMed
9. Schnipper JL, Gandhi TK, Wald JS, et al. Design and implementation of a web-based patient portal linked to an electronic health record designed to improve medication safety: the Patient Gateway medications module. Inform Prim Care. 2008;16(2):147-155. PubMed
10. Blumenthal D, Tavenner M. The “meaningful use” regulation for electronic health records. N Engl J Med. 2010;363(6):501-504. PubMed
11. Ammenwerth E, Schnell-Inderst P, Hoerbst A. The impact of electronic patient portals on patient care: a systematic review of controlled trials. J Med Internet Res. 2012;14(6):e162. PubMed
12. Goldzweig CL, Orshansky G, Paige NM, et al. Electronic patient portals: evidence on health utcomes, satisfaction, efficiency, and attitudes: a systematic review. Ann Intern Med. 2013;159(10):677-687. PubMed
13. Davis Giardina T, Menon S, Parrish DE, Sittig DF, Singh H. Patient access to medical records and healthcare outcomes: a systematic review. J Am Med Inform Assoc. 2014;21(4):737-741. PubMed
14. Kalra D, Fernando B. A review of the empirical evidence of the healthcare benefits of personal health records. Yearb Med Inform. 2013;8(1):93-102. PubMed
15. Kruse CS, Bolton K, Freriks G. The effect of patient portals on quality outcomes and its implications to meaningful use: a systematic review. J Med Internet Res. 2015;17(2):e44. PubMed
16. Vawdrey DK, Wilcox LG, Collins SA, et al. A tablet computer application for patients to participate in their hospital care. AMIA Annu Symp Proc. 2011:1428-1435. PubMed
17. Prey JE, Woollen J, Wilcox L, et al. Patient engagement in the inpatient setting: a systematic review. J Am Med Inform Assoc. 2014;21(4):742-750. PubMed
18. O’Leary KJ, Lohman ME, Culver E, et al. The effect of tablet computers with a mobile patient portal application on hospitalized patients’ knowledge and activation. J Am Med Inform Assoc. 2016;23(1):159-165. PubMed
19. Skeels M, Tan DS. Identifying opportunities for inpatient-centric technology. Proceedings of the 1st ACM International Health Informatics Symposium. Arlington: ACM; 2010:580-589.
20. Collins SA, Rozenblum R, Leung WY, et al. Acute care patient portals: a qualitative study of stakeholder perspectives on current practices. J Am Med Inform Assoc. 2017;24(e1):e9-e17. PubMed
21. Morris D, Karlson A. Dynamic Accessibility Requirements for Hospital Patients. SIGCHI Conference on Human Factors in Computing Systems. Vancouver, BC, Canada: ACM; 2011.
22. Moher D, Liberati A, Tetzlaff J, Altman DG; PRISMA Group. Preferred reporting items for systematic reviews and meta-analyses: the PRISMA statement. BMJ. 2009;339:b2535. PubMed
23. Downs SH, Black N. The feasibility of creating a checklist for the assessment of the methodological quality both of randomised and non-randomised studies of health care interventions. J Epidemiol Community Health. 1998;52(6):377-384. PubMed
24. Weyand SA, Frize M, Bariciak E, Dunn S. Development and usability testing of a parent decision support tool for the neonatal intensive care unit. Conf Proc IEEE Eng Med Biol Soc. 2011:6430-6433. PubMed
25. Caligtan CA, Carroll DL, Hurley AC, Gersh-Zaremski R, Dykes PC. Bedside information technology to support patient-centered care. Int J Med Inform. 2012;81(7):442-451. PubMed
26. Wilcox L, Feiner S, Liu A, Restaino S, Collins S, Vawdrey D. Designing inpatient technology to meet the medication information needs of cardiology patients. Proceedings of the 2nd ACM SIGHIT International Health Informatics Symposium. Miami: ACM; 2012:831-836. PubMed
27. Dykes PC, Carroll DL, Hurley AC, et al. Building and testing a patient-centric electronic bedside communication center. J Gerontol Nurs. 2013;39(1):15-19. PubMed
28. Dykes PC, Stade D, Chang F, et al. Participatory design and development of a patient-centered toolkit to engage hospitalized patients and care partners in their plan of care. AMIA Annu Symp Proc. 2014:486-495. PubMed
29. Pell JM, Mancuso M, Limon S, Oman K, Lin CT. Patient access to electronic health records during hospitalization. JAMA Intern Med. 2015;175(5):856-858. PubMed
30. Yoo S, Lee KH, Baek H, et al. Development and user research of a smart bedside station system toward patient-centered healthcare system. J Med Syst. 2015;39(9):86. PubMed
31. Dalal AK, Dykes PC, Collins S, et al. A web-based, patient-centered toolkit to engage patients and caregivers in the acute care setting: a preliminary evaluation. J Am Med Inform Assoc. 2016;23(1):80-87. PubMed
32. Kaziunas E, Hanauer DA, Ackerman MS, Choi SW. Identifying unmet informational needs in the inpatient setting to increase patient and caregiver engagement in the context of pediatric hematopoietic stem cell transplantation. J Am Med Inform Assoc. 2016;23(1):94-104. PubMed
33. Kelly MM, Hoonakker PLT, Dean SM. Using an inpatient portal to engage families in pediatric hospital care. J Am Med Inform Assoc. 2016;24(1):153-161. PubMed
34. Maher M, Kaziunas E, Ackerman M, et al. User-centered design groups to engage patients and caregivers with a personalized health information technology tool. Biol Blood Marrow Transplant. 2016;22(2):349-358. PubMed
35. O’Leary KJ, Sharma RK, Killarney A, et al. Patients’ and healthcare providers’ perceptions of a mobile portal application for hospitalized patients. BMC Med Inform Decis Mak. 2016;16(1):123-130. PubMed
36. Wilcox L, Woollen J, Prey J, et al. Interactive tools for inpatient medication tracking: a multi-phase study with cardiothoracic surgery patients. J Am Med Inform Assoc. 2016;23(1):144-158. PubMed
37. Woollen J, Prey J, Wilcox L, et al. Patient experiences using an inpatient personal health record. Appl Clin Inform. 2016;7(2):446-460. PubMed
38. Kelly MM, Dean SM, Carayon P, Wetterneck TB, Hoonakker PLT. Healthcare team perceptions of a portal for parents of hospitalized children before and after implementation. Appl Clin Inform. 2017;8(1):265-278. PubMed
39. Wolff JL, Darer JD, Berger A, et al. Inviting patients and care partners to read doctors’ notes: OpenNotes and shared access to electronic medical records. J Am Med Inform Assoc. 2017;24(e1):e166-e172. PubMed
40. Feldman HJ, Walker J, Li J, Delbanco T. OpenNotes:hospitalists’ challenge and opportunity. J Hosp Med. 2013;8(7):414-417. PubMed
41. Hibbard JH, Stockard J, Mahoney ER, Tusler M. Development of the Patient Activation Measure (PAM): conceptualizing and measuring activation in patients and consumers. Health Serv Res. 2004;39(4 Pt 1):1005-1026. PubMed
42. Prey JE, Qian M, Restaino S, et al. Reliability and validity of the patient activation measure in hospitalized patients. Patient Educ Couns. 2016;99(12):2026-2033. PubMed
43. Toomey SL, Zaslavsky AM, Elliott MN, et al. The development of a pediatric inpatient experience of care measure: Child HCAHPS. Pediatrics. 2015;136(2):360-369. PubMed
44. Kaushal R, Bates DW, Landrigan C, et al. Medication errors and adverse drug events in pediatric inpatients. JAMA. 2001;285(16):2114-2120. PubMed
45. Agency for Healthcare Research and Quality. 20 Tips to help prevent medical errors in children. Secondary 20 Tips to help prevent medical errors in children. http://www.ahrq.gov/patients-consumers/care-planning/errors/20tips/index.html. Accessed on June 10, 2017.
46. Thompson MJ, Reilly JD, Valdez RS. Work system barriers to patient, provider, and caregiver use of personal health records: A systematic review. Appl Ergon. 2016;54:218-242. PubMed
47. Holden RJ, Carayon P, Gurses AP, et al. SEIPS 2.0: a human factors framework for studying and improving the work of healthcare professionals and patients. Ergonomics. 2013;56(11):1669-1686. PubMed
48. Gagnon MP, Ngangue P, Payne-Gagnon J, Desmartis M. m-Health adoption by healthcare professionals: a systematic review. J Am Med Inform Assoc. 2016;23(1):212-220. PubMed
49. Russell CL. An overview of the integrative research review. Prog Transplant. 2005;15(1):8-13. PubMed
50. Yamin CK, Emani S, Williams DH, et al. The digital divide in adoption and use of a personal health record. Arch Intern Med. 2011;171(6):568-574. PubMed
© 2017 Society of Hospital Medicine
A Method for Attributing Patient-Level Metrics to Rotating Providers in an Inpatient Setting
Hospitalists’ performance is routinely evaluated by third-party payers, employers, and patients. As hospitalist programs mature, there is a need to develop processes to identify, internally measure, and report on individual and group performance. We know from Society of Hospital Medicine (SHM) data that a significant amount of hospitalists’ total compensation is at least partially based on performance. Often this is based at least in part on quality data. In 2006, SHM issued a white paper detailing the key elements of a successful performance monitoring and reporting process.1,2 Recommendations included the identification of meaningful operational and clinical performance metrics, and the ability to monitor and report both group and individual metrics was highlighted as an essential component. There is evidence that comparison of individual provider performance with that of their peers is a necessary element of successful provider dashboards.3 Additionally, regular feedback and a clear, visual presentation of the data are important components of successful provider feedback dashboards.3-6
Much of the literature regarding provider feedback dashboards has been based in the outpatient setting. The majority of these dashboards focus on the management of chronic illnesses (eg, diabetes and hypertension), rates of preventative care services (eg, colonoscopy or mammogram), or avoidance of unnecessary care (eg, antibiotics for sinusitis).4,5 Unlike in the outpatient setting, in which 1 provider often provides a majority of the care for a given episode of care, hospitalized patients are often cared for by multiple providers, challenging the appropriate attribution of patient-level metrics to specific providers. Under the standard approach, an entire hospitalization is attributed to 1 physician, generally the attending of record for the hospitalization, which may be the admitting provider or the discharging provider, depending on the approach used by the hospital. However, assigning responsibility for an entire hospitalization to a provider who may have only seen the patient for a small percentage of a hospitalization may jeopardize the validity of metrics. As provider metrics are increasingly being used for compensation, it is important to ensure that the method for attribution correctly identifies the providers caring for patients. To our knowledge there is no gold standard approach for attributing metrics to providers when patients are cared for by multiple providers, and the standard attending of record–based approach may lack face validity in many cases.
We aimed to develop and operationalize a system to more fairly attribute patient-level data to individual providers across a single hospitalization even when multiple providers cared for the patient. We then compared our methodology to the standard approach, in which the attending of record receives full attribution for each metric, to determine the difference on a provider level between the 2 models.
METHODS
Clinical Setting
The Johns Hopkins Hospital is a 1145-bed, tertiary-care hospital. Over the years of this project, the Johns Hopkins Hospitalist Program was an approximately 20-physician group providing care in a variety of settings, including a dedicated hospitalist floor, where this metrics program was initiated. Hospitalists in this setting work Monday through Friday, with 1 hospitalist and a moonlighter covering on the weekends. Admissions are performed by an admitter, and overnight care is provided by a nocturnist. Initially 17 beds, this unit expanded to 24 beds in June 2012. For the purposes of this article, we included all general medicine patients admitted to this floor between July 1, 2010, and June 30, 2014, who were cared for by hospitalists. During this period, all patients were inpatients; no patients were admitted under observation status. All of these patients were cared for by hospitalists without housestaff or advanced practitioners. Since 2014, the metrics program has been expanded to other hospitalist-run services in the hospital, but for simplicity, we have not presented these more recent data.
Individual Provider Metrics
Metrics were chosen to reflect institutional quality and efficiency priorities. Our choice of metrics was restricted to those that (1) plausibly reflect provider performance, at least in part, and (2) could be accessed in electronic form (without any manual chart review). Whenever possible, we chose metrics with objective data. Additionally, because funding for this effort was provided by the hospital, we sought to ensure that enough of the metrics were related to cost to justify ongoing hospital support of the project. SAS 9.2 (SAS Institute Inc, Cary, NC) was used to calculate metric weights. Specific metrics included American College of Chest Physicians (ACCP)–compliant venous thromboembolism (VTE) prophylaxis,7 observed-to-expected length of stay (LOS) ratio, percentage of discharges per day, discharges before 3 
Appropriate prophylaxis for VTE was calculated by using an algorithm embedded within the computerized provider order entry system, which assessed the prescription of ACCP-compliant VTE prophylaxis within 24 hours following admission. This included a risk assessment, and credit was given for no prophylaxis and/or mechanical and/or pharmacologic prophylaxis per the ACCP guidelines.7
Observed-to-expected LOS was defined by using the University HealthSystem Consortium (UHC; now Vizient Inc) expected LOS for the given calendar year. This approach incorporates patient diagnoses, demographics, and other administrative variables to define an expected LOS for each patient.
The percent of patients discharged per day was defined from billing data as the percentage of a provider’s evaluation and management charges that were the final charge of a patient’s stay (regardless of whether a discharge day service was coded).
Discharge prior to 3
Depth of coding was defined as the number of coded diagnoses submitted to the Maryland Health Services Cost Review Commission for determining payment and was viewed as an indicator of the thoroughness of provider documentation.
Patient satisfaction was defined at the patient level (for those patients who turned in patient satisfaction surveys) as the pooled value of the 5 provider questions on the hospital’s patient satisfaction survey administered by Press Ganey: “time the physician spent with you,” “did the physician show concern for your questions/worries,” “did the physician keep you informed,” “friendliness/courtesy of the physician,” and “skill of the physician.”8
Readmission rates were defined as same-hospital readmissions divided by the total number of patients discharged by a given provider, with exclusions based on the Centers for Medicare and Medicaid Services hospital-wide, all-cause readmission measure.1 The expected same-hospital readmission rate was defined for each patient as the observed readmission rate in the entire UHC (Vizient) data set for all patients with the same All Patient Refined Diagnosis Related Group and severity of illness, as we have described previously.9
Communication with the primary care provider was the only self-reported metric used. It was based on a mandatory prompt on the discharge worksheet in the electronic medical record (EMR). Successful communication with the outpatient provider was defined as verbal or electronic communication by the hospitalist with the outpatient provider. Partial (50%) credit was given for providers who attempted but were unsuccessful in communicating with the outpatient provider, for patients for whom the provider had access to the Johns Hopkins EMR system, and for planned admissions without new or important information to convey. No credit was given for providers who indicated that communication was not indicated, who indicated that a patient and/or family would update the provider, or who indicated that the discharge summary would be sufficient.9 Because the discharge worksheet could be initiated at any time during the hospitalization, providers could document communication with the outpatient provider at any point during hospitalization.
Discharge summary turnaround was defined as the average number of days elapsed between the day of discharge and the signing of the discharge summary in the EMR.
Assigning Ownership of Patients to Individual Providers
Using billing data, we assigned ownership of patient care based on the type, timing, and number of charges that occurred during each hospitalization (Figure 1). Eligible charges included all history and physical (codes 99221, 99222, and 99223), subsequent care (codes 99231, 99232, and 99233), and discharge charges (codes 99238 and 99239).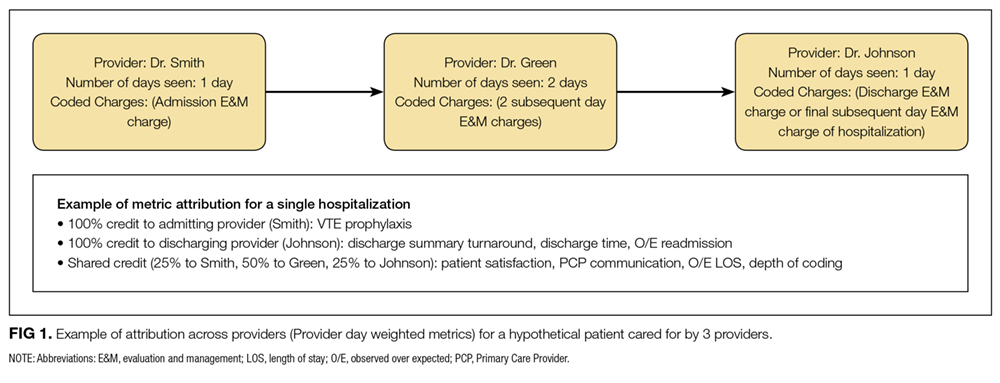
By using a unique identifier assigned for each hospitalization, professional fees submitted by providers were used to identify which provider saw the patient on the admission day, discharge day, as well as subsequent care days. Providers’ productivity, bonus supplements, and policy compliance were determined by using billing data, which encouraged the prompt submittal of charges.
The provider who billed the admission history and physical (codes 99221, 99222, and 99223) within 1 calendar date of the patient’s initial admission was defined as the admitting provider. Patients transferred to the hospitalist service from other services were not assigned an admitting hospitalist. The sole metric assigned to the admitting hospitalist was ACCP-compliant VTE prophylaxis.
The provider who billed the final subsequent care or discharge code (codes 99231, 99232, 99233, 99238, and 99239) within 1 calendar date of discharge was defined as the discharging provider. For hospitalizations characterized by a single provider charge (eg, for patients admitted and discharged on the same day), the provider billing this charge was assigned as both the admitting and discharging physician. Patients upgraded to the intensive care unit (ICU) were not counted as a discharge unless the patient was downgraded and discharged from the hospitalist service. The discharging provider was assigned responsibility for the time of discharge, the percent of patients discharged per day, the discharge summary turnaround time, and hospital readmissions.
Metrics that were assigned to multiple providers for a single hospitalization were termed “provider day–weighted” metrics. The formula for calculating the weight for each provider day–weighted metric was as follows: weight for provider A = [number of daily charges billed by provider A] divided by [LOS +1]. The initial hospital day was counted as day 0. LOS plus 1 was used to recognize that a typical hospitalization will have a charge on the day of admission (day 0) and a charge on the day of discharge such that an LOS of 2 days (eg, a patient admitted on Monday and discharged on Wednesday) will have 3 daily charges. Provider day–weighted metrics included patient satisfaction, communication with the outpatient provider, depth of coding, and observed-to-expected LOS.
Our billing software prevented providers from the same group from billing multiple daily charges, thus ensuring that there were no duplicated charges submitted for a given day.
Presenting Results
Providers were only shown data from the day-weighted approach. For ease of visual interpretation, scores for each metric were scaled ordinally from 1 (worst performance) to 9 (best performance; Table 1). Data were displayed in a dashboard format on a password-protected website for each provider to view his or her own data relative to that of the hospitalist peer group. The dashboard was implemented in this format on July 1, 2011. Data were updated quarterly (Figure 2).
Results were displayed in a polyhedral or spider-web graph (Figure 2). Provider and group metrics were scaled according to predefined benchmarks established for each metric and standardized to a scale ranging from 1 to 9. The scale for each metric was set based on examining historical data and group median performance on the metrics to ensure that there was a range of performance (ie, to avoid having most hospitalists scoring a 1 or 9). Scaling thresholds were periodically adjusted as appropriate to maintain good visual discrimination. Higher scores (creating a larger-volume polygon) are desirable even for metrics such as LOS, for which a low value is desirable. Both a spider-web graph and trends over time were available to the provider (Figure 2). These graphs display a comparison of the individual provider scores for each metric to the hospitalist group average for that metric.
Comparison with the Standard (Attending of Record) Method of Attribution
For the purposes of this report, we sought to determine whether there were meaningful differences between our day-weighted approach versus the standard method of attribution, in which the attending of record is assigned responsibility for each metric that would not have been attributed to the discharging attending under both methods. Our goal was to determine where and whether there was a meaningful difference between the 2 methodologies, recognizing that the degree of difference between these 2 methodologies might vary in other institutions and settings. In our hospital, the attending of record is generally the discharging attending. In order to compare the 2 methodologies, we arbitrarily picked 2015 to retrospectively evaluate the differences between these 2 methods of attribution. We did not display or provide data using the standard methodology to providers at any point; this approach was used only for the purposes of this report. Because these metrics are intended to evaluate relative provider performance, we assigned a percentile to each provider for his or her performance on the given metric using our attribution methodology and then, similarly, assigned a percentile to each provider using the standard methodology. This yielded 2 percentile scores for each provider and each metric. We then compared these percentile ranks for providers in 2 ways: (1) we determined how often providers who scored in the top half of the group for a given metric (above the 50th percentile) also scored in the top half of the group for that metric by using the other calculation method, and (2) we calculated the absolute value of the difference in percentiles between the 2 methods to characterize the impact on a provider’s ranking for that metric that might result from switching to the other method. For instance, if a provider scored at the 20th percentile for the group in patient satisfaction with 1 attribution method and scored at the 40th percentile for the group in patient satisfaction using the other method, the absolute change in percentile would be 20 percentile points. But, this provider would still be below the 50th percentile by both methods (concordant bottom half performance). We did not perform this comparison for metrics assigned to the discharging provider (such as discharge summary turnaround time or readmissions) because the attending of record designation is assigned to the discharging provider at our hospital.
RESULTS
The dashboard was successfully operationalized on July 1, 2011, with displays visible to providers as shown in Figure 2. Consistent with the principles of providing effective performance feedback to providers, the display simultaneously showed providers their individual performance as well as the performance of their peers. Providers were able to view their spider-web plot for prior quarters. Not shown are additional views that allowed providers to see quarterly trends in their data versus their peers across several fiscal years. Also available to providers was their ranking relative to their peers for each metric; specific peers were deidentified in the display.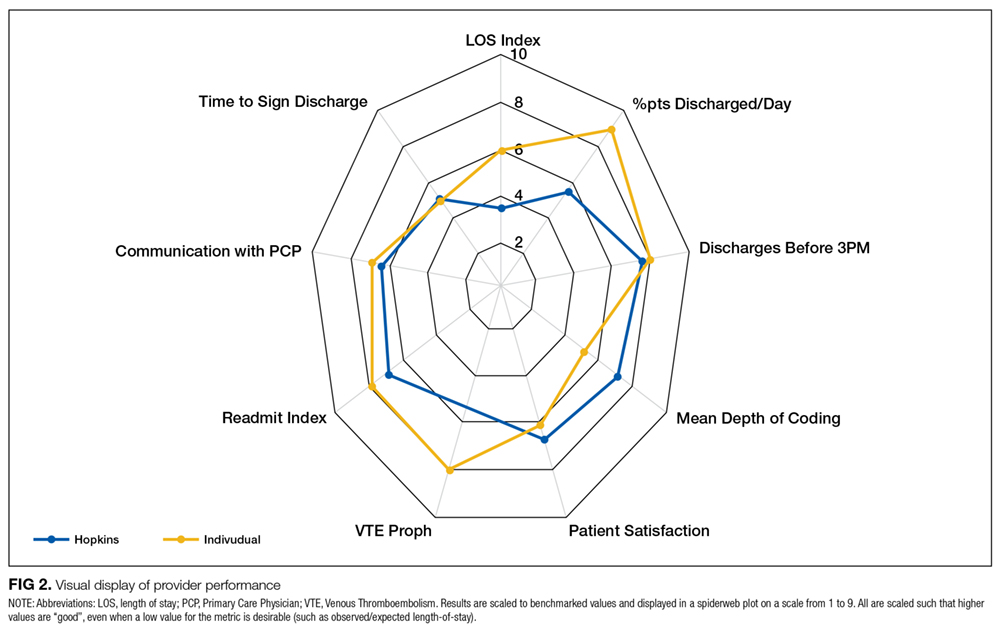
There was notable discordance between provider rankings between the 2 methodologies, as shown in Table 2. Provider performance above or below the median was concordant 56% to 75% of the time (depending on the particular metric), indicating substantial discordance because top-half or bottom-half concordance would be expected to occur by chance 50% of the time. Although the provider percentile differences between the 2 methods tended to be modest for most providers (the median difference between the methods was 13 to 22 percentile points for the various metrics), there were some providers for whom the method of calculation dramatically impacted their rankings. For 5 of the 6 metrics we examined, at least 1 provider had a 50-percentile or greater change in his or her ranking based on the method used. This indicates that at least some providers would have had markedly different scores relative to their peers had we used the alternative methodology (Table 2). In VTE prophylaxis, for example, at least 1 provider had a 94-percentile change in his or her ranking; similarly, a provider had an 88-perentile change in his or her LOS ranking between the 2 methodologies.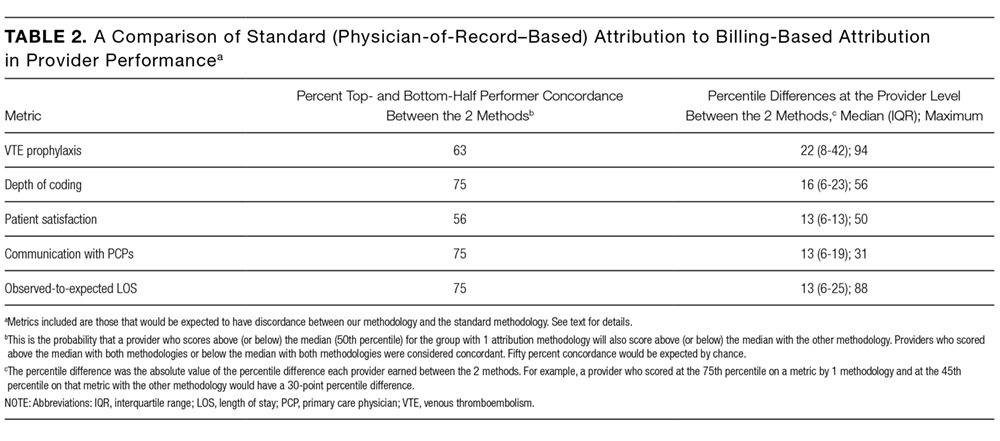
DISCUSSION
We found that it is possible to assign metrics across 1 hospital stay to multiple providers by using billing data. We also found a meaningful discrepancy in how well providers scored (relative to their peers) based on the method used for attribution. These results imply that hospitals should consider attributing performance metrics based on ascribed ownership from billing data and not just from attending of record status.
As hospitalist programs and providers in general are increasingly being asked to develop dashboards to monitor individual and group performance, correctly attributing care to providers is likely to become increasingly important. Experts agree that principles of effective provider performance dashboards include ranking individual provider performance relative to peers, clearly displaying data in an easily accessible format, and ensuring that data can be credibly attributed to the individual provider.3,4,6 However, there appears to be no gold standard method for attribution, especially in the inpatient setting. Our results imply that hospitals should consider attributing performance metrics based on ascribed ownership from billing data and not just from attending of record status.
Several limitations of our findings are important to consider. First, our program is a relatively small, academic group with handoffs that typically occur every 1 to 2 weeks and sometimes with additional handoffs on weekends. Different care patterns and settings might impact the utility of our attribution methodology relative to the standard methodology. Additionally, it is important to note that the relative merits of the different methodologies cannot be ascertained from our comparison. We can demonstrate discordance between the attribution methodologies, but we cannot say that 1 method is correct and the other is flawed. Although we believe that our day-weighted approach feels fairer to providers based on group input and feedback, we did not conduct a formal survey to examine providers’ preferences for the standard versus day-weighted approaches. The appropriateness of a particular attribution method needs to be assessed locally and may vary based on the clinical setting. For instance, on a service in which patients are admitted for procedures, it may make more sense to attribute the outcome of the case to the proceduralist even if that provider did not bill for the patient’s care on a daily basis. Finally, the computational requirements of our methodology are not trivial and require linking billing data with administrative patient-level data, which may be challenging to operationalize in some institutions.
These limitations aside, we believe that our attribution methodology has face validity. For example, a provider might be justifiably frustrated if, using the standard methodology, he or she is charged with the LOS of a patient who had been hospitalized for months, particularly if that patient is discharged shortly after the provider assumes care. Our method addresses this type of misattribution. Particularly when individual provider compensation is based on performance on metrics (as is the case at our institution), optimizing provider attribution to particular patients may be important, and face validity may be required for group buy-in.
In summary, we have demonstrated that it is possible to use billing data to assign ownership of patients to multiple providers over 1 hospital stay. This could be applied to other hospitalist programs as well as other healthcare settings in which multiple providers care for patients during 1 healthcare encounter (eg, ICUs).
Disclosure
The authors declare they have no relevant conflicts of interest.
1. Horwitz L, Partovian C, Lin Z, et al. Hospital-Wide (All-Condition) 30‐Day Risk-Standardized Readmission Measure. https://www.cms.gov/Medicare/Quality-Initiatives-Patient-Assessment-Instruments/MMS/downloads/MMSHospital-WideAll-ConditionReadmissionRate.pdf. Accessed March 6, 2015.
2. Medicine SoH. Measuring Hospitalist Performance: Metrics, Reports, and Dashboards. 2007; https://www.hospitalmedicine.org/Web/Practice_Management/Products_and_Programs/measure_hosp_perf_metrics_reports_dashboards.aspx. Accessed May 12, 2013.
3. Teleki SS, Shaw R, Damberg CL, McGlynn EA. Providing performance feedback to individual physicians: current practice and emerging lessons. Santa Monica, CA: RAND Corporation; 2006. 1-47. https://www.rand.org/content/dam/rand/pubs/working_papers/2006/RAND_WR381.pdf. Accessed August, 2017.
4. Brehaut JC, Colquhoun HL, Eva KW, et al. Practice Feedback Interventions: 15 Suggestions for Optimizing Effectiveness Practice Feedback Interventions. Ann Intern Med. 2016;164(6):435-441. PubMed
5. Dowding D, Randell R, Gardner P, et al. Dashboards for improving patient care: review of the literature. Int J Med Inform. 2015;84(2):87-100. PubMed
6. Landon BE, Normand S-LT, Blumenthal D, Daley J. Physician clinical performance assessment: prospects and barriers. JAMA. 2003;290(9):1183-1189. PubMed
7. Guyatt GH, Akl EA, Crowther M, Gutterman DD, Schuünemann HJ. Executive summary: Antit hrombotic therapy and prevention of thrombosis, 9th ed: American College of Chest Physicians evidence-based clinical practice guidelines. Ann Intern Med. 2012;141(2 suppl):7S-47S. PubMed
8. Siddiqui Z, Qayyum R, Bertram A, et al. Does Provider Self-reporting of Etiquette Behaviors Improve Patient Experience? A Randomized Controlled Trial. J Hosp Med. 2017;12(6):402-406. PubMed
9. Oduyebo I, Lehmann CU, Pollack CE, et al. Association of self-reported hospital discharge handoffs with 30-day readmissions. JAMA Intern Med. 2013;173(8):624-629. PubMed
Hospitalists’ performance is routinely evaluated by third-party payers, employers, and patients. As hospitalist programs mature, there is a need to develop processes to identify, internally measure, and report on individual and group performance. We know from Society of Hospital Medicine (SHM) data that a significant amount of hospitalists’ total compensation is at least partially based on performance. Often this is based at least in part on quality data. In 2006, SHM issued a white paper detailing the key elements of a successful performance monitoring and reporting process.1,2 Recommendations included the identification of meaningful operational and clinical performance metrics, and the ability to monitor and report both group and individual metrics was highlighted as an essential component. There is evidence that comparison of individual provider performance with that of their peers is a necessary element of successful provider dashboards.3 Additionally, regular feedback and a clear, visual presentation of the data are important components of successful provider feedback dashboards.3-6
Much of the literature regarding provider feedback dashboards has been based in the outpatient setting. The majority of these dashboards focus on the management of chronic illnesses (eg, diabetes and hypertension), rates of preventative care services (eg, colonoscopy or mammogram), or avoidance of unnecessary care (eg, antibiotics for sinusitis).4,5 Unlike in the outpatient setting, in which 1 provider often provides a majority of the care for a given episode of care, hospitalized patients are often cared for by multiple providers, challenging the appropriate attribution of patient-level metrics to specific providers. Under the standard approach, an entire hospitalization is attributed to 1 physician, generally the attending of record for the hospitalization, which may be the admitting provider or the discharging provider, depending on the approach used by the hospital. However, assigning responsibility for an entire hospitalization to a provider who may have only seen the patient for a small percentage of a hospitalization may jeopardize the validity of metrics. As provider metrics are increasingly being used for compensation, it is important to ensure that the method for attribution correctly identifies the providers caring for patients. To our knowledge there is no gold standard approach for attributing metrics to providers when patients are cared for by multiple providers, and the standard attending of record–based approach may lack face validity in many cases.
We aimed to develop and operationalize a system to more fairly attribute patient-level data to individual providers across a single hospitalization even when multiple providers cared for the patient. We then compared our methodology to the standard approach, in which the attending of record receives full attribution for each metric, to determine the difference on a provider level between the 2 models.
METHODS
Clinical Setting
The Johns Hopkins Hospital is a 1145-bed, tertiary-care hospital. Over the years of this project, the Johns Hopkins Hospitalist Program was an approximately 20-physician group providing care in a variety of settings, including a dedicated hospitalist floor, where this metrics program was initiated. Hospitalists in this setting work Monday through Friday, with 1 hospitalist and a moonlighter covering on the weekends. Admissions are performed by an admitter, and overnight care is provided by a nocturnist. Initially 17 beds, this unit expanded to 24 beds in June 2012. For the purposes of this article, we included all general medicine patients admitted to this floor between July 1, 2010, and June 30, 2014, who were cared for by hospitalists. During this period, all patients were inpatients; no patients were admitted under observation status. All of these patients were cared for by hospitalists without housestaff or advanced practitioners. Since 2014, the metrics program has been expanded to other hospitalist-run services in the hospital, but for simplicity, we have not presented these more recent data.
Individual Provider Metrics
Metrics were chosen to reflect institutional quality and efficiency priorities. Our choice of metrics was restricted to those that (1) plausibly reflect provider performance, at least in part, and (2) could be accessed in electronic form (without any manual chart review). Whenever possible, we chose metrics with objective data. Additionally, because funding for this effort was provided by the hospital, we sought to ensure that enough of the metrics were related to cost to justify ongoing hospital support of the project. SAS 9.2 (SAS Institute Inc, Cary, NC) was used to calculate metric weights. Specific metrics included American College of Chest Physicians (ACCP)–compliant venous thromboembolism (VTE) prophylaxis,7 observed-to-expected length of stay (LOS) ratio, percentage of discharges per day, discharges before 3
Appropriate prophylaxis for VTE was calculated by using an algorithm embedded within the computerized provider order entry system, which assessed the prescription of ACCP-compliant VTE prophylaxis within 24 hours following admission. This included a risk assessment, and credit was given for no prophylaxis and/or mechanical and/or pharmacologic prophylaxis per the ACCP guidelines.7
Observed-to-expected LOS was defined by using the University HealthSystem Consortium (UHC; now Vizient Inc) expected LOS for the given calendar year. This approach incorporates patient diagnoses, demographics, and other administrative variables to define an expected LOS for each patient.
The percent of patients discharged per day was defined from billing data as the percentage of a provider’s evaluation and management charges that were the final charge of a patient’s stay (regardless of whether a discharge day service was coded).
Discharge prior to 3
Depth of coding was defined as the number of coded diagnoses submitted to the Maryland Health Services Cost Review Commission for determining payment and was viewed as an indicator of the thoroughness of provider documentation.
Patient satisfaction was defined at the patient level (for those patients who turned in patient satisfaction surveys) as the pooled value of the 5 provider questions on the hospital’s patient satisfaction survey administered by Press Ganey: “time the physician spent with you,” “did the physician show concern for your questions/worries,” “did the physician keep you informed,” “friendliness/courtesy of the physician,” and “skill of the physician.”8
Readmission rates were defined as same-hospital readmissions divided by the total number of patients discharged by a given provider, with exclusions based on the Centers for Medicare and Medicaid Services hospital-wide, all-cause readmission measure.1 The expected same-hospital readmission rate was defined for each patient as the observed readmission rate in the entire UHC (Vizient) data set for all patients with the same All Patient Refined Diagnosis Related Group and severity of illness, as we have described previously.9
Communication with the primary care provider was the only self-reported metric used. It was based on a mandatory prompt on the discharge worksheet in the electronic medical record (EMR). Successful communication with the outpatient provider was defined as verbal or electronic communication by the hospitalist with the outpatient provider. Partial (50%) credit was given for providers who attempted but were unsuccessful in communicating with the outpatient provider, for patients for whom the provider had access to the Johns Hopkins EMR system, and for planned admissions without new or important information to convey. No credit was given for providers who indicated that communication was not indicated, who indicated that a patient and/or family would update the provider, or who indicated that the discharge summary would be sufficient.9 Because the discharge worksheet could be initiated at any time during the hospitalization, providers could document communication with the outpatient provider at any point during hospitalization.
Discharge summary turnaround was defined as the average number of days elapsed between the day of discharge and the signing of the discharge summary in the EMR.
Assigning Ownership of Patients to Individual Providers
Using billing data, we assigned ownership of patient care based on the type, timing, and number of charges that occurred during each hospitalization (Figure 1). Eligible charges included all history and physical (codes 99221, 99222, and 99223), subsequent care (codes 99231, 99232, and 99233), and discharge charges (codes 99238 and 99239).
By using a unique identifier assigned for each hospitalization, professional fees submitted by providers were used to identify which provider saw the patient on the admission day, discharge day, as well as subsequent care days. Providers’ productivity, bonus supplements, and policy compliance were determined by using billing data, which encouraged the prompt submittal of charges.
The provider who billed the admission history and physical (codes 99221, 99222, and 99223) within 1 calendar date of the patient’s initial admission was defined as the admitting provider. Patients transferred to the hospitalist service from other services were not assigned an admitting hospitalist. The sole metric assigned to the admitting hospitalist was ACCP-compliant VTE prophylaxis.
The provider who billed the final subsequent care or discharge code (codes 99231, 99232, 99233, 99238, and 99239) within 1 calendar date of discharge was defined as the discharging provider. For hospitalizations characterized by a single provider charge (eg, for patients admitted and discharged on the same day), the provider billing this charge was assigned as both the admitting and discharging physician. Patients upgraded to the intensive care unit (ICU) were not counted as a discharge unless the patient was downgraded and discharged from the hospitalist service. The discharging provider was assigned responsibility for the time of discharge, the percent of patients discharged per day, the discharge summary turnaround time, and hospital readmissions.
Metrics that were assigned to multiple providers for a single hospitalization were termed “provider day–weighted” metrics. The formula for calculating the weight for each provider day–weighted metric was as follows: weight for provider A = [number of daily charges billed by provider A] divided by [LOS +1]. The initial hospital day was counted as day 0. LOS plus 1 was used to recognize that a typical hospitalization will have a charge on the day of admission (day 0) and a charge on the day of discharge such that an LOS of 2 days (eg, a patient admitted on Monday and discharged on Wednesday) will have 3 daily charges. Provider day–weighted metrics included patient satisfaction, communication with the outpatient provider, depth of coding, and observed-to-expected LOS.
Our billing software prevented providers from the same group from billing multiple daily charges, thus ensuring that there were no duplicated charges submitted for a given day.
Presenting Results
Providers were only shown data from the day-weighted approach. For ease of visual interpretation, scores for each metric were scaled ordinally from 1 (worst performance) to 9 (best performance; Table 1). Data were displayed in a dashboard format on a password-protected website for each provider to view his or her own data relative to that of the hospitalist peer group. The dashboard was implemented in this format on July 1, 2011. Data were updated quarterly (Figure 2).
Results were displayed in a polyhedral or spider-web graph (Figure 2). Provider and group metrics were scaled according to predefined benchmarks established for each metric and standardized to a scale ranging from 1 to 9. The scale for each metric was set based on examining historical data and group median performance on the metrics to ensure that there was a range of performance (ie, to avoid having most hospitalists scoring a 1 or 9). Scaling thresholds were periodically adjusted as appropriate to maintain good visual discrimination. Higher scores (creating a larger-volume polygon) are desirable even for metrics such as LOS, for which a low value is desirable. Both a spider-web graph and trends over time were available to the provider (Figure 2). These graphs display a comparison of the individual provider scores for each metric to the hospitalist group average for that metric.
Comparison with the Standard (Attending of Record) Method of Attribution
For the purposes of this report, we sought to determine whether there were meaningful differences between our day-weighted approach versus the standard method of attribution, in which the attending of record is assigned responsibility for each metric that would not have been attributed to the discharging attending under both methods. Our goal was to determine where and whether there was a meaningful difference between the 2 methodologies, recognizing that the degree of difference between these 2 methodologies might vary in other institutions and settings. In our hospital, the attending of record is generally the discharging attending. In order to compare the 2 methodologies, we arbitrarily picked 2015 to retrospectively evaluate the differences between these 2 methods of attribution. We did not display or provide data using the standard methodology to providers at any point; this approach was used only for the purposes of this report. Because these metrics are intended to evaluate relative provider performance, we assigned a percentile to each provider for his or her performance on the given metric using our attribution methodology and then, similarly, assigned a percentile to each provider using the standard methodology. This yielded 2 percentile scores for each provider and each metric. We then compared these percentile ranks for providers in 2 ways: (1) we determined how often providers who scored in the top half of the group for a given metric (above the 50th percentile) also scored in the top half of the group for that metric by using the other calculation method, and (2) we calculated the absolute value of the difference in percentiles between the 2 methods to characterize the impact on a provider’s ranking for that metric that might result from switching to the other method. For instance, if a provider scored at the 20th percentile for the group in patient satisfaction with 1 attribution method and scored at the 40th percentile for the group in patient satisfaction using the other method, the absolute change in percentile would be 20 percentile points. But, this provider would still be below the 50th percentile by both methods (concordant bottom half performance). We did not perform this comparison for metrics assigned to the discharging provider (such as discharge summary turnaround time or readmissions) because the attending of record designation is assigned to the discharging provider at our hospital.
RESULTS
The dashboard was successfully operationalized on July 1, 2011, with displays visible to providers as shown in Figure 2. Consistent with the principles of providing effective performance feedback to providers, the display simultaneously showed providers their individual performance as well as the performance of their peers. Providers were able to view their spider-web plot for prior quarters. Not shown are additional views that allowed providers to see quarterly trends in their data versus their peers across several fiscal years. Also available to providers was their ranking relative to their peers for each metric; specific peers were deidentified in the display.
There was notable discordance between provider rankings between the 2 methodologies, as shown in Table 2. Provider performance above or below the median was concordant 56% to 75% of the time (depending on the particular metric), indicating substantial discordance because top-half or bottom-half concordance would be expected to occur by chance 50% of the time. Although the provider percentile differences between the 2 methods tended to be modest for most providers (the median difference between the methods was 13 to 22 percentile points for the various metrics), there were some providers for whom the method of calculation dramatically impacted their rankings. For 5 of the 6 metrics we examined, at least 1 provider had a 50-percentile or greater change in his or her ranking based on the method used. This indicates that at least some providers would have had markedly different scores relative to their peers had we used the alternative methodology (Table 2). In VTE prophylaxis, for example, at least 1 provider had a 94-percentile change in his or her ranking; similarly, a provider had an 88-perentile change in his or her LOS ranking between the 2 methodologies.
DISCUSSION
We found that it is possible to assign metrics across 1 hospital stay to multiple providers by using billing data. We also found a meaningful discrepancy in how well providers scored (relative to their peers) based on the method used for attribution. These results imply that hospitals should consider attributing performance metrics based on ascribed ownership from billing data and not just from attending of record status.
As hospitalist programs and providers in general are increasingly being asked to develop dashboards to monitor individual and group performance, correctly attributing care to providers is likely to become increasingly important. Experts agree that principles of effective provider performance dashboards include ranking individual provider performance relative to peers, clearly displaying data in an easily accessible format, and ensuring that data can be credibly attributed to the individual provider.3,4,6 However, there appears to be no gold standard method for attribution, especially in the inpatient setting. Our results imply that hospitals should consider attributing performance metrics based on ascribed ownership from billing data and not just from attending of record status.
Several limitations of our findings are important to consider. First, our program is a relatively small, academic group with handoffs that typically occur every 1 to 2 weeks and sometimes with additional handoffs on weekends. Different care patterns and settings might impact the utility of our attribution methodology relative to the standard methodology. Additionally, it is important to note that the relative merits of the different methodologies cannot be ascertained from our comparison. We can demonstrate discordance between the attribution methodologies, but we cannot say that 1 method is correct and the other is flawed. Although we believe that our day-weighted approach feels fairer to providers based on group input and feedback, we did not conduct a formal survey to examine providers’ preferences for the standard versus day-weighted approaches. The appropriateness of a particular attribution method needs to be assessed locally and may vary based on the clinical setting. For instance, on a service in which patients are admitted for procedures, it may make more sense to attribute the outcome of the case to the proceduralist even if that provider did not bill for the patient’s care on a daily basis. Finally, the computational requirements of our methodology are not trivial and require linking billing data with administrative patient-level data, which may be challenging to operationalize in some institutions.
These limitations aside, we believe that our attribution methodology has face validity. For example, a provider might be justifiably frustrated if, using the standard methodology, he or she is charged with the LOS of a patient who had been hospitalized for months, particularly if that patient is discharged shortly after the provider assumes care. Our method addresses this type of misattribution. Particularly when individual provider compensation is based on performance on metrics (as is the case at our institution), optimizing provider attribution to particular patients may be important, and face validity may be required for group buy-in.
In summary, we have demonstrated that it is possible to use billing data to assign ownership of patients to multiple providers over 1 hospital stay. This could be applied to other hospitalist programs as well as other healthcare settings in which multiple providers care for patients during 1 healthcare encounter (eg, ICUs).
Disclosure
The authors declare they have no relevant conflicts of interest.
1. Horwitz L, Partovian C, Lin Z, et al. Hospital-Wide (All-Condition) 30‐Day Risk-Standardized Readmission Measure. https://www.cms.gov/Medicare/Quality-Initiatives-Patient-Assessment-Instruments/MMS/downloads/MMSHospital-WideAll-ConditionReadmissionRate.pdf. Accessed March 6, 2015.
2. Medicine SoH. Measuring Hospitalist Performance: Metrics, Reports, and Dashboards. 2007; https://www.hospitalmedicine.org/Web/Practice_Management/Products_and_Programs/measure_hosp_perf_metrics_reports_dashboards.aspx. Accessed May 12, 2013.
3. Teleki SS, Shaw R, Damberg CL, McGlynn EA. Providing performance feedback to individual physicians: current practice and emerging lessons. Santa Monica, CA: RAND Corporation; 2006. 1-47. https://www.rand.org/content/dam/rand/pubs/working_papers/2006/RAND_WR381.pdf. Accessed August, 2017.
4. Brehaut JC, Colquhoun HL, Eva KW, et al. Practice Feedback Interventions: 15 Suggestions for Optimizing Effectiveness Practice Feedback Interventions. Ann Intern Med. 2016;164(6):435-441. PubMed
5. Dowding D, Randell R, Gardner P, et al. Dashboards for improving patient care: review of the literature. Int J Med Inform. 2015;84(2):87-100. PubMed
6. Landon BE, Normand S-LT, Blumenthal D, Daley J. Physician clinical performance assessment: prospects and barriers. JAMA. 2003;290(9):1183-1189. PubMed
7. Guyatt GH, Akl EA, Crowther M, Gutterman DD, Schuünemann HJ. Executive summary: Antit hrombotic therapy and prevention of thrombosis, 9th ed: American College of Chest Physicians evidence-based clinical practice guidelines. Ann Intern Med. 2012;141(2 suppl):7S-47S. PubMed
8. Siddiqui Z, Qayyum R, Bertram A, et al. Does Provider Self-reporting of Etiquette Behaviors Improve Patient Experience? A Randomized Controlled Trial. J Hosp Med. 2017;12(6):402-406. PubMed
9. Oduyebo I, Lehmann CU, Pollack CE, et al. Association of self-reported hospital discharge handoffs with 30-day readmissions. JAMA Intern Med. 2013;173(8):624-629. PubMed
© 2017 Society of Hospital Medicine
Near and Far
A previously healthy 30-year-old woman presented to the emergency department with 2 weeks of weakness.
True muscle weakness must be distinguished from the more common causes of asthenia. Many systemic disorders produce fatigue, with resulting functional limitation that is often interpreted by patients as weakness. Initial history should focus on conditions producing fatigue, such as cardiopulmonary disease, anemia, connective tissue disease, depression or cachexia related to malignancy, infection, or other inflammatory states. Careful questioning may reveal evidence of dyspnea, poor exercise tolerance, or joint pain as an alternative to actual loss of muscle power. If true weakness is still suspected, attention should be focused on the pattern, onset, anatomic site, and progression of weakness. Muscle weakness is often characterized by difficulty with specific tasks, such as climbing stairs, rising from a chair, raising a hand, or using cutlery. The physical examination is critical in determining whether weakness is due to true loss of motor power. The differential diagnosis of weakness is broad and includes neurologic, infectious, endocrine, inflammatory, genetic, metabolic, and drug-induced etiologies.
She initially experienced 3 days of mild cramps and soreness in her thighs. She then developed weakness that began in her thighs and progressed to involve her lower legs and upper and lower arms. She had difficulty combing her hair. She required the use of her arms to get up from a chair. She grasped onto objects to aid in ambulation around the house. In addition, she described 1 year of moderate fatigue but no fever, weight loss, dyspnea, dysphagia, visual changes, paresthesias, bowel or bladder incontinence, back pain, or preceding gastrointestinal or respiratory illness. She had experienced diffuse intermittent hives, most prominent in her chest and upper arms, for the past several weeks.
History certainly supports true weakness but will need to be confirmed on examination. The distribution began as proximal but now appears diffuse. The presence of myalgia and cramping raises the possibility of noninflammatory myopathies, which are usually more insidious in onset. A severe electrolyte disturbance would be possible, based on the diffuse nature of weakness that was preceded by cramping. The distribution of weakness and lack of bowel or bladder incontinence is reassuring and suggests against a spinal cord disorder; however, a high index of suspicion must be maintained for myelopathy because delayed treatment might result in irreversible paralysis.
The patient’s course also includes hives. Common causes of hives include infections and allergic reactions to medications, foods, and insect stings. Urticaria may also result from systemic disorders, such as vasculitis, lupus, lymphoma, mastocytosis, and paraproteinemias, which can be associated with weakness and fatigue. Although severe weakness in combination with hives makes an infectious and allergic reaction less likely, we still seek to ascertain if the evolving chief complaints of weakness and hives are the result of a single unifying and evolving multisystem disorder or are distinct and unrelated processes.
Her past medical history included fibromyalgia, kidney stones, and gastroesophageal reflux disease. One week prior to presentation, she was prescribed prednisone 60 mg daily for the treatment of hives; the dose had been tapered to 40 mg at presentation, with mild improvement of hives. She recently started doxepin for fibromyalgia and insomnia. She lived at home with her husband and 8-year-old child. She worked as a clerk in a pest control office and denied any pesticide exposure. She denied tobacco, alcohol, or illicit drug use. Her family history included systemic lupus erythematosus (SLE) in her mother and maternal aunt.
Glucocorticoids are associated with myopathy; however, the weakness preceded steroid therapy. Thus, unless there was unknown exposure to high-dose steroid medication to treat recurrent episodes of urticaria earlier in her course, glucocorticoid-related myopathy is unlikely. Fibromyalgia might cause the perception of weakness from pain. However, the history of difficulty combing her hair and rising from a chair suggests actual loss of motor power. The side effects of her medications, such as newly started doxepin, must be reviewed. A family history of SLE raises concern for rheumatologic conditions; however, one might expect improvement with steroid therapy.
On physical examination, her temperature was 36.9 °C, blood pressure 126/93 mmHg, pulse 81 beats per minute, respiratory rate 16 breaths per minute, and oxygen saturation 100% on ambient air. Her cardiopulmonary examination was normal. Her abdomen was nontender and without hepatosplenomegaly. Her strength was 2 out of 5 in proximal and distal legs, bilaterally, and 4 out of 5 in proximal and distal upper extremities. She had normal muscle tone without fasciculations or atrophy. Her joints were without edema, erythema, or impaired range of motion. She had normal sensation to light touch in arms and legs. Her reflexes were 2+ in the patellar, Achilles, and brachioradialis tendons. She had no lymphadenopathy, mucosal ulcerations, or alopecia. A skin examination revealed smooth, slightly elevated, and faded pink wheals that were diffuse but most prominent in upper arms and chest.
Physical examination confirms the presence of true muscle weakness. The differential diagnosis is narrowed by several findings, both positive and negative, elicited in the examination. The diffuse nature of the weakness eliminates focal central nervous system lesions, such as stroke, intracranial mass lesions, or demyelinating white matter foci. Combining this finding with normal reflexes and history of preceding myalgias makes electrolyte-induced and inflammatory (eg, polymyositis) myopathies more likely. The normal deep tendon reflexes and the absence of a delayed relaxation phase lower the likelihood of hypothyroidism.
Diseases originating from the neuromuscular junction, such as myasthenia gravis, may also present with weakness and normal reflexes, although this pattern of weakness would be atypical; myasthenia gravis classically presents with fatigable weakness and ocular findings of diplopia and/or ptosis. First-tier testing should include a complete blood count to evaluate for eosinophilia, comprehensive metabolic panel, and urinalysis for myoglobinuria, thyroid stimulating hormone, and muscle enzymes.
Results of a complete blood count demonstrated a leukocyte count of 16.1 k/uL with 82% neutrophils, 13% lymphocytes, 5% monocytes, and 0% eosinophils. Hemoglobin was 13.2 g/dL, and platelet count 226 k/uL. Sodium was 136 mmol/L, potassium 1.5 mmol/L, chloride 115 mmol/L, bicarbonate 12 mmol/L, blood urea nitrogen 26 mg/dL, creatinine 1.0 mg/dL (baseline creatinine: 0.6), and glucose 102 mg/dL. Calcium was 9.4 mg/dL, magnesium 2.6 mg/dL, phosphorus 1.8 mg/dL, CK 501 U/L (normal: 40-230), and TSH 5.48 uIU/mL (normal: 0.5-4). Aspartate aminotransferase was 64 U/L, alanine aminotransferase 23 U/L, alkaline phosphatase 66 U/L, bilirubin 0.9 mg/dL, albumin 3.8 g/dL, and total protein 8.7 g/dL (normal: 6.2-7.8). Human immunodeficiency virus antibody screen was negative. An electrocardiogram revealed normal sinus rhythm, flattened T waves, and prominent U waves.
Potassium losses are classically categorized into 1 of 3 groups: renal losses, gastrointestinal losses, or transcellular shifts. Without a clear history of diuretic use, renal losses may not be apparent on history and examination. In contrast, gastrointestinal losses are almost always evidenced by a history of vomiting and/or diarrhea, with rare exceptions, including unreported laxative abuse or surreptitious vomiting. Transcellular potassium shifts can be seen in states of increased insulin or beta-adrenergic activity and alkalosis and result from both primary and secondary causes of hypokalemic periodic paralysis.
The presence of a reduced serum bicarbonate and elevated chloride concentration suggests a normal anion gap metabolic acidosis. Many conditions associated with normal anion gap metabolic acidosis are evident by history, such as diarrhea. In enigmatic cases such as this, it will be important to take a stepwise approach that includes an evaluation for urinary potassium losses and assessment of acid-base status. An unexplained normal anion gap metabolic acidosis combined with hypokalemia raises suspicion for a distal renal tubular acidosis (RTA). Additional testing to evaluate for a possible RTA should include the assessment of urinary electrolytes and urinary pH. The hypokalemia explains her weakness, but the etiology of such profound hypokalemia is not evident, nor is it clear how it relates to her hives.
The severity of the hypokalemia, combined with electrocardiogram changes, necessitates rapid intravenous potassium repletion, telemetry monitoring, and frequent serum potassium measurement. Treatment of her metabolic acidosis is more nuanced and depends upon both the severity of disturbance and the suspicion of whether the etiology is transcellular shift, potassium depletion, or both.
Urine studies demonstrated a urine specific gravity of 1.006 (normal: 1.001-1.030), urine pH was 6.5 (normal: 5-6.5), trace leukocyte esterase, negative nitrite, 30 mg/dL of protein (normal: <15), sodium 64 mmol/L (normal: 40-220), potassium 17 mmol/L (normal: 25-125), and chloride 71 mmol/L (normal: 110-250). Urine microscopy demonstrated 3 red blood cells per high power field (normal: 0-1), 4 white blood cells per high power field (normal: 0-4), 4+ bacteria per high power field, and no red blood cell casts. Urine protein-to-creatinine ratio was 1.6. C3 and C4 complement levels were 53 mg/dL (normal: 80-165) and 12 mg/dL (normal: 15-49), respectively. C-reactive protein was <0.5 (normal: 0-0.9), and erythrocyte sedimentation rate was 16 mm/hour (normal: 0-20).
A calculation of the urine anion gap (UAG; [urine sodium + urine potassium] – urine chloride) yields a UAG of 10 mq/L. A positive UAG, together with a nongap metabolic acidosis, should prompt the consideration of RTA. The normal renal response to acidosis is to reduce the urine pH to less than 5.3 through an increase in hydrogen ion excretion in the form of ammonium. A urine pH of 6.5 is highly suggestive of type 1 (distal) RTA and its associated impairment of distal acidification. Treatment with sodium bicarbonate to correct the acidosis and associated complications is warranted.
A distal RTA would account for her past medical history of renal stones. Acidemia promotes both increased calcium phosphate release from bone (with subsequent hypercalciuria) and enhanced citrate reabsorption in the proximal renal tubules, leading to decreased urinary citrate. Citrate inhibits calcium stone formation. The increased calcium load to renal tubules in addition to decreased urinary citrate both lead to increased precipitation of calcium stones in the genitourinary tract.
A diagnosis of distal RTA should prompt evaluation for specific etiologies, such as
Her antinuclear antibody titer was >1:1280 (normal: <80). Anti-SSA and -SSB antibodies were both positive, with a titer >100 (normal: <20). Rheumatoid factor was positive at 22 IU/mL (normal: 0-14). Anti-smith, anti-double stranded DNA, and anti-ribonucleoprotein antibodies were negative.
Sjögren’s syndrome appears to be the ultimate etiology of this patient’s distal RTA. The diagnosis of Sjögren’s is more classically made in the presence of lacrimal and/or salivary dysfunction and confirmed with compatible autoantibodies. In the absence of dry eyes or dry mouth, attention should be focused on her skin findings. Cutaneous vasculitis does occur in a small percentage of Sjögren’s syndrome cases. Urticarial lesions have been reported in this subset, and skin biopsy would further support the diagnosis.
Treatment of Sjögren’s syndrome with immunosuppressive therapy may ameliorate renal parenchymal pathology and improve her profound metabolic disturbances.
On further questioning, she described several months of mild xerostomia, which resulted in increased consumption of fluids. She did not have keratoconjunctivitis sicca. Biopsy of her urticarial rash demonstrated a leukocytoclastic vasculitis with eosinophilic infiltration (Figure 1). Renal biopsy with hematoxylin and eosin staining, immunofluorescence, and electron microscopy demonstrated an immune complex-mediated glomerulonephritis and moderate tubulointerstitial nephritis (Figure 2). A diagnosis of Sjögren’s syndrome was made based on the patient’s xerostomia, high titers of antinuclear antibodies, SSA and SSB antibodies, positive rheumatoid factor, hypocomplementemia, and systemic manifestations associated with Sjögren’s syndrome, including distal RTA, nephrolithiasis, and hives, with histologic evidence of leukocytoclastic vasculitis.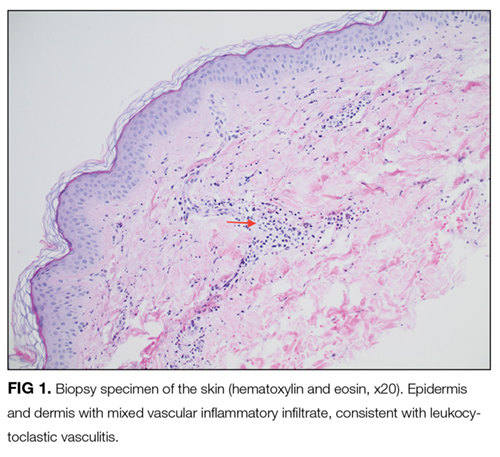
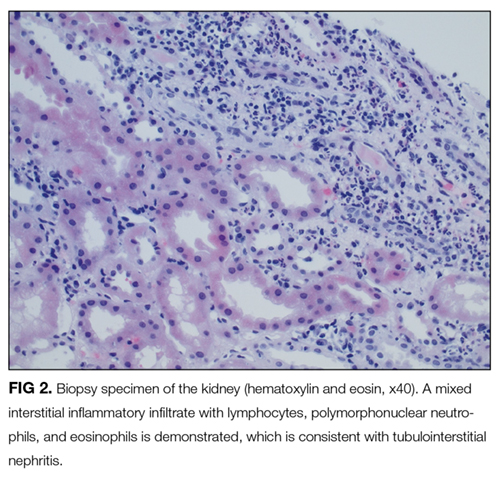
She received aggressive potassium and bicarbonate repletion and, several days later, had normalization of both. Her weakness and myalgia rapidly improved concomitantly with the correction of her hypokalemia. Five days later she was ambulating independently and discharged with potassium citrate and prednisone therapy. She had improved fatigue and rash at a 1-month follow-up with rheumatology. As an outpatient, she was started on azathioprine and slowly tapered off her steroids. Over the next several months, she had normal potassium, bicarbonate, and renal function, although she did require lithotripsy for an obstructive renal stone.
COMMENTARY
RTA should be considered in the differential diagnosis of an unexplained normal anion gap metabolic acidosis. There are 3 major types of RTAs, with different characteristics. In type 1 (distal) RTA, the primary defect is impaired distal acidification of the urine. Distal RTA commonly presents with hypokalemia, calciuria (often presenting as renal stones), and a positive UAG.1 In type 2 (proximal) RTA, the primary defect is impaired bicarbonate reabsorption, leading to bicarbonate wasting in the urine. Proximal RTAs can be secondary to an isolated defect in bicarbonate reabsorption or generalized proximal renal tubule dysfunction (Fanconi syndrome).1 A type 4 RTA is characterized by hypoaldosteronism, presenting usually with a mild nonanion gap metabolic acidosis and hyperkalemia. This patient’s history of renal stones, hypokalemia, and positive UAG supported a type 1 (distal) RTA. Distal RTA is often idiopathic, but initial evaluation should include a review of medications and investigation into an underlying systemic disorder (eg, plasma cell dyscrasia or autoimmune disease). This would include eliciting a possible history of xerostomia and xerophthalmia, together with testing of SSA (Ro) and SSB (La) antibodies, to assess for Sjögren’s syndrome. In addition, checking serum calcium to assess for hyperparathyroidism or familial idiopathic hypercalciuria and a review of medications, such as lithium and amphotericin,1 may uncover other secondary causes of distal RTA.
While Sjögren’s syndrome primarily affects salivary and lacrimal glands, leading to dry mouth and dry eyes, respectively, extraglandular manifestations are common, with fatigue and arthralgia occurring in half of patients. Extra-glandular involvement also often includes the skin and kidneys but can affect several other organ systems, including the central nervous system, heart, lungs, bone marrow, and lymph nodes.2
There are many cutaneous manifestations of Sjögren’s syndrome.3 Xerosis, or xeroderma, is the most common and is characterized by dry, scaly skin. Cutaneous vasculitis can occur in 10% of patients with Sjögren’s syndrome and often presents with palpable purpura or diffuse urticarial lesions, as in our patient.4 Erythematous maculopapules and cryoglobulinemic vasculitis may also occur.4 A less common skin manifestation is annular erythema, presenting as an indurated, ring-like lesion.5
Chronic tubulointerstitial nephritis is the most common renal manifestation of Sjögren’s syndrome.6 This often pre-sents with a mild elevated serum creatinine and a distal RTA, leading to hypokalemia, as in the case discussed. Distal RTA is well described, occurring in one-quarter of patients with Sjögren’s syndrome.7 The pathophysiology leading to distal RTA in Sjögren’s syndrome is thought to arise from autoimmune injury to the H(+)-ATPase pump in the renal collecting tubules, leading to decreased distal proton secretion.8,9 Younger adults with Sjögren’s syndrome, in the third and fourth decades of life, have a predilection to develop tubulointerstitial inflammation, distal RTA, and nephrolithiasis, as in the present case.6 Sjögren’s syndrome less commonly presents with membranoproliferative glomerulonephritis or membranous nephropathy.10,11 Cryoglobulinemia-associated hypocomplementemia and glomerulonephritis may also occur with Sjögren’s syndrome, yet glomerular lesions are less common than is tubulointerstitial inflammation. The patient discussed had proteinuria and evidence of immune complex-mediated glomerulonephritis.
Treatment of sicca symptoms is generally supportive. It includes artificial tears, encouragement of good hydration, salivary stimulants, and maintaining good oral hygiene. Pilocarpine, a cholinergic parasympathomimetic agent, is approved by the Food and Drug Administration to treat dry mouth associated with Sjögren’s syndrome. The treatment of extraglandular manifestations depends on the organ(s) involved. More severe presentations, such as vasculitis and glomerulonephritis, often require immunosuppressive therapy with systemic glucocorticoids, cyclophosphamide, azathioprine, or other immunosuppressive agents,12 including rituximab. RTA often necessitates treatment with oral bicarbonate and supplemental potassium repletion.
The base rate of disease (ie, prevalence of disease) influences a diagnostician’s pretest probability of a given diagnosis. The discussant briefly considered rare causes of hives (eg, vasculitis) but appropriately fine-tuned their differential for the patient’s hypokalemia and RTA. Once the diagnosis of Sjögren’s syndrome was made with certainty, the clinician was able to revisit the patient’s rash with a new lens. Urticarial vasculitis suddenly became a plausible consideration, despite its rarity (compared to allergic causes of hives) because of the direct link to the underlying autoimmune condition, which affected both the proximal muscles and distal nephrons.
TEACHING POINTS
- Evaluation of patients with weakness starts with determining true muscle weakness (ie, pathology involving the brain, spinal cord, peripheral nerve, neuromuscular junction, and/or muscle) from asthenia.
- Distal RTA should be considered in patients with a nonanion gap metabolic acidosis and hypokalemia.
- Sjögren’s syndrome has many extraglandular clinical manifestations, including vasculitis, urticaria, tubulointerstitial renal inflammation, glomerulonephritis, and lymphoma.
Acknowledgment
The authors thank Virgilius Cornea, MD, for his interpretation of the pathologic images.
Disclosure
Dr. Manesh is supported by the Jeremiah A. Barondess Fellowship in the Clinical Transaction of the New York Academy of Medicine, in collaboration with the Accreditation Council for Graduate Medical Education (ACGME). The authors declare no conflicts of interests.
1. Rodríguez Soriano J. Renal tubular acidosis: the clinical entity. J Am Soc Nephrol. 2002;13(8):2160-2170. PubMed
2. Asmussen K, Andersen V, Bendixen G, Schiødt M, Oxholm P. A new model for classification of disease manifestations in primary Sjögren’s syndrome: evaluation in a retrospective long-term study. J Intern Med. 1996;239(6):475-482. PubMed
3. Kittridge A, Routhouska SB, Korman NJ. Dermatologic manifestations of Sjögren syndrome. J Cutan Med Surg. 2011;15(1):8-14. PubMed
4. Ramos-Casals M, Anaya JM, García-Carrasco M, et al. Cutaneous vasculitis in primary Sjögren syndrome: classification and clinical significance of 52 patients. Medicine (Baltimore). 2004; 83(2):96-106. PubMed
5. Katayama I, Kotobuki Y, Kiyohara E, Murota H. Annular erythema associated with Sjögren’s syndrome: review of the literature on the management and clinical analysis of skin lesions. Mod Rheumatol. 2010;20(2):123-129. PubMed
6. Maripuri S, Grande JP, Osborn TG, et al. Renal involvement in primary Sjögren’s syndrome: a clinicopathologic study. Clin J Am Soc Nephrol. 2009;4(9):1423-1431. PubMed
7. Pun KK, Wong CK, Tsui EY, Tam SC, Kung AW, Wang CC. Hypokalemic periodic paralysis due to the Sjögren syndrome in Chinese patients. Ann Intern Med. 1989;110(5):405-406. PubMed
8. Cohen EP, Bastani B, Cohen MR, Kolner S, Hemken P, Gluck SL. Absence of H(+)-ATPase in cortical collecting tubules of a patient with Sjogren’s syndrome and distal renal tubular acidosis. J Am Soc Nephrol. 1992;3(2):264-271. PubMed
9. Bastani B, Haragsim L, Gluck S, Siamopoulos KC. Lack of H-ATPase in distal nephron causing hypokalaemic distal RTA in a patient with Sjögren’s syndrome. Nephrol Dial Transplant. 1995;10(6):908-909. PubMed
10. Cortez MS, Sturgill BC, Bolton WK. Membranoproliferative glomerulonephritis with primary Sjögren’s syndrome. Am J Kidney Dis. 1995;25(4):632-636. PubMed
11. Baba A, Hara S, Sato Y, Yamada K, Fujimoto S, Eto T. [Three patients with nephrotic syndrome due to membranous nephropathy complicated by Sjögren’s syndrome]. Nihon Jinzo Gakkai Shi. 2005;47(8):882-886. PubMed
12. Thanou-Stavraki A, James JA. Primary Sjogren’s syndrome: current and prospective therapies. Semin Arthritis Rheum. 2008;37(5):273-292. PubMed
A previously healthy 30-year-old woman presented to the emergency department with 2 weeks of weakness.
True muscle weakness must be distinguished from the more common causes of asthenia. Many systemic disorders produce fatigue, with resulting functional limitation that is often interpreted by patients as weakness. Initial history should focus on conditions producing fatigue, such as cardiopulmonary disease, anemia, connective tissue disease, depression or cachexia related to malignancy, infection, or other inflammatory states. Careful questioning may reveal evidence of dyspnea, poor exercise tolerance, or joint pain as an alternative to actual loss of muscle power. If true weakness is still suspected, attention should be focused on the pattern, onset, anatomic site, and progression of weakness. Muscle weakness is often characterized by difficulty with specific tasks, such as climbing stairs, rising from a chair, raising a hand, or using cutlery. The physical examination is critical in determining whether weakness is due to true loss of motor power. The differential diagnosis of weakness is broad and includes neurologic, infectious, endocrine, inflammatory, genetic, metabolic, and drug-induced etiologies.
She initially experienced 3 days of mild cramps and soreness in her thighs. She then developed weakness that began in her thighs and progressed to involve her lower legs and upper and lower arms. She had difficulty combing her hair. She required the use of her arms to get up from a chair. She grasped onto objects to aid in ambulation around the house. In addition, she described 1 year of moderate fatigue but no fever, weight loss, dyspnea, dysphagia, visual changes, paresthesias, bowel or bladder incontinence, back pain, or preceding gastrointestinal or respiratory illness. She had experienced diffuse intermittent hives, most prominent in her chest and upper arms, for the past several weeks.
History certainly supports true weakness but will need to be confirmed on examination. The distribution began as proximal but now appears diffuse. The presence of myalgia and cramping raises the possibility of noninflammatory myopathies, which are usually more insidious in onset. A severe electrolyte disturbance would be possible, based on the diffuse nature of weakness that was preceded by cramping. The distribution of weakness and lack of bowel or bladder incontinence is reassuring and suggests against a spinal cord disorder; however, a high index of suspicion must be maintained for myelopathy because delayed treatment might result in irreversible paralysis.
The patient’s course also includes hives. Common causes of hives include infections and allergic reactions to medications, foods, and insect stings. Urticaria may also result from systemic disorders, such as vasculitis, lupus, lymphoma, mastocytosis, and paraproteinemias, which can be associated with weakness and fatigue. Although severe weakness in combination with hives makes an infectious and allergic reaction less likely, we still seek to ascertain if the evolving chief complaints of weakness and hives are the result of a single unifying and evolving multisystem disorder or are distinct and unrelated processes.
Her past medical history included fibromyalgia, kidney stones, and gastroesophageal reflux disease. One week prior to presentation, she was prescribed prednisone 60 mg daily for the treatment of hives; the dose had been tapered to 40 mg at presentation, with mild improvement of hives. She recently started doxepin for fibromyalgia and insomnia. She lived at home with her husband and 8-year-old child. She worked as a clerk in a pest control office and denied any pesticide exposure. She denied tobacco, alcohol, or illicit drug use. Her family history included systemic lupus erythematosus (SLE) in her mother and maternal aunt.
Glucocorticoids are associated with myopathy; however, the weakness preceded steroid therapy. Thus, unless there was unknown exposure to high-dose steroid medication to treat recurrent episodes of urticaria earlier in her course, glucocorticoid-related myopathy is unlikely. Fibromyalgia might cause the perception of weakness from pain. However, the history of difficulty combing her hair and rising from a chair suggests actual loss of motor power. The side effects of her medications, such as newly started doxepin, must be reviewed. A family history of SLE raises concern for rheumatologic conditions; however, one might expect improvement with steroid therapy.
On physical examination, her temperature was 36.9 °C, blood pressure 126/93 mmHg, pulse 81 beats per minute, respiratory rate 16 breaths per minute, and oxygen saturation 100% on ambient air. Her cardiopulmonary examination was normal. Her abdomen was nontender and without hepatosplenomegaly. Her strength was 2 out of 5 in proximal and distal legs, bilaterally, and 4 out of 5 in proximal and distal upper extremities. She had normal muscle tone without fasciculations or atrophy. Her joints were without edema, erythema, or impaired range of motion. She had normal sensation to light touch in arms and legs. Her reflexes were 2+ in the patellar, Achilles, and brachioradialis tendons. She had no lymphadenopathy, mucosal ulcerations, or alopecia. A skin examination revealed smooth, slightly elevated, and faded pink wheals that were diffuse but most prominent in upper arms and chest.
Physical examination confirms the presence of true muscle weakness. The differential diagnosis is narrowed by several findings, both positive and negative, elicited in the examination. The diffuse nature of the weakness eliminates focal central nervous system lesions, such as stroke, intracranial mass lesions, or demyelinating white matter foci. Combining this finding with normal reflexes and history of preceding myalgias makes electrolyte-induced and inflammatory (eg, polymyositis) myopathies more likely. The normal deep tendon reflexes and the absence of a delayed relaxation phase lower the likelihood of hypothyroidism.
Diseases originating from the neuromuscular junction, such as myasthenia gravis, may also present with weakness and normal reflexes, although this pattern of weakness would be atypical; myasthenia gravis classically presents with fatigable weakness and ocular findings of diplopia and/or ptosis. First-tier testing should include a complete blood count to evaluate for eosinophilia, comprehensive metabolic panel, and urinalysis for myoglobinuria, thyroid stimulating hormone, and muscle enzymes.
Results of a complete blood count demonstrated a leukocyte count of 16.1 k/uL with 82% neutrophils, 13% lymphocytes, 5% monocytes, and 0% eosinophils. Hemoglobin was 13.2 g/dL, and platelet count 226 k/uL. Sodium was 136 mmol/L, potassium 1.5 mmol/L, chloride 115 mmol/L, bicarbonate 12 mmol/L, blood urea nitrogen 26 mg/dL, creatinine 1.0 mg/dL (baseline creatinine: 0.6), and glucose 102 mg/dL. Calcium was 9.4 mg/dL, magnesium 2.6 mg/dL, phosphorus 1.8 mg/dL, CK 501 U/L (normal: 40-230), and TSH 5.48 uIU/mL (normal: 0.5-4). Aspartate aminotransferase was 64 U/L, alanine aminotransferase 23 U/L, alkaline phosphatase 66 U/L, bilirubin 0.9 mg/dL, albumin 3.8 g/dL, and total protein 8.7 g/dL (normal: 6.2-7.8). Human immunodeficiency virus antibody screen was negative. An electrocardiogram revealed normal sinus rhythm, flattened T waves, and prominent U waves.
Potassium losses are classically categorized into 1 of 3 groups: renal losses, gastrointestinal losses, or transcellular shifts. Without a clear history of diuretic use, renal losses may not be apparent on history and examination. In contrast, gastrointestinal losses are almost always evidenced by a history of vomiting and/or diarrhea, with rare exceptions, including unreported laxative abuse or surreptitious vomiting. Transcellular potassium shifts can be seen in states of increased insulin or beta-adrenergic activity and alkalosis and result from both primary and secondary causes of hypokalemic periodic paralysis.
The presence of a reduced serum bicarbonate and elevated chloride concentration suggests a normal anion gap metabolic acidosis. Many conditions associated with normal anion gap metabolic acidosis are evident by history, such as diarrhea. In enigmatic cases such as this, it will be important to take a stepwise approach that includes an evaluation for urinary potassium losses and assessment of acid-base status. An unexplained normal anion gap metabolic acidosis combined with hypokalemia raises suspicion for a distal renal tubular acidosis (RTA). Additional testing to evaluate for a possible RTA should include the assessment of urinary electrolytes and urinary pH. The hypokalemia explains her weakness, but the etiology of such profound hypokalemia is not evident, nor is it clear how it relates to her hives.
The severity of the hypokalemia, combined with electrocardiogram changes, necessitates rapid intravenous potassium repletion, telemetry monitoring, and frequent serum potassium measurement. Treatment of her metabolic acidosis is more nuanced and depends upon both the severity of disturbance and the suspicion of whether the etiology is transcellular shift, potassium depletion, or both.
Urine studies demonstrated a urine specific gravity of 1.006 (normal: 1.001-1.030), urine pH was 6.5 (normal: 5-6.5), trace leukocyte esterase, negative nitrite, 30 mg/dL of protein (normal: <15), sodium 64 mmol/L (normal: 40-220), potassium 17 mmol/L (normal: 25-125), and chloride 71 mmol/L (normal: 110-250). Urine microscopy demonstrated 3 red blood cells per high power field (normal: 0-1), 4 white blood cells per high power field (normal: 0-4), 4+ bacteria per high power field, and no red blood cell casts. Urine protein-to-creatinine ratio was 1.6. C3 and C4 complement levels were 53 mg/dL (normal: 80-165) and 12 mg/dL (normal: 15-49), respectively. C-reactive protein was <0.5 (normal: 0-0.9), and erythrocyte sedimentation rate was 16 mm/hour (normal: 0-20).
A calculation of the urine anion gap (UAG; [urine sodium + urine potassium] – urine chloride) yields a UAG of 10 mq/L. A positive UAG, together with a nongap metabolic acidosis, should prompt the consideration of RTA. The normal renal response to acidosis is to reduce the urine pH to less than 5.3 through an increase in hydrogen ion excretion in the form of ammonium. A urine pH of 6.5 is highly suggestive of type 1 (distal) RTA and its associated impairment of distal acidification. Treatment with sodium bicarbonate to correct the acidosis and associated complications is warranted.
A distal RTA would account for her past medical history of renal stones. Acidemia promotes both increased calcium phosphate release from bone (with subsequent hypercalciuria) and enhanced citrate reabsorption in the proximal renal tubules, leading to decreased urinary citrate. Citrate inhibits calcium stone formation. The increased calcium load to renal tubules in addition to decreased urinary citrate both lead to increased precipitation of calcium stones in the genitourinary tract.
A diagnosis of distal RTA should prompt evaluation for specific etiologies, such as
Her antinuclear antibody titer was >1:1280 (normal: <80). Anti-SSA and -SSB antibodies were both positive, with a titer >100 (normal: <20). Rheumatoid factor was positive at 22 IU/mL (normal: 0-14). Anti-smith, anti-double stranded DNA, and anti-ribonucleoprotein antibodies were negative.
Sjögren’s syndrome appears to be the ultimate etiology of this patient’s distal RTA. The diagnosis of Sjögren’s is more classically made in the presence of lacrimal and/or salivary dysfunction and confirmed with compatible autoantibodies. In the absence of dry eyes or dry mouth, attention should be focused on her skin findings. Cutaneous vasculitis does occur in a small percentage of Sjögren’s syndrome cases. Urticarial lesions have been reported in this subset, and skin biopsy would further support the diagnosis.
Treatment of Sjögren’s syndrome with immunosuppressive therapy may ameliorate renal parenchymal pathology and improve her profound metabolic disturbances.
On further questioning, she described several months of mild xerostomia, which resulted in increased consumption of fluids. She did not have keratoconjunctivitis sicca. Biopsy of her urticarial rash demonstrated a leukocytoclastic vasculitis with eosinophilic infiltration (Figure 1). Renal biopsy with hematoxylin and eosin staining, immunofluorescence, and electron microscopy demonstrated an immune complex-mediated glomerulonephritis and moderate tubulointerstitial nephritis (Figure 2). A diagnosis of Sjögren’s syndrome was made based on the patient’s xerostomia, high titers of antinuclear antibodies, SSA and SSB antibodies, positive rheumatoid factor, hypocomplementemia, and systemic manifestations associated with Sjögren’s syndrome, including distal RTA, nephrolithiasis, and hives, with histologic evidence of leukocytoclastic vasculitis.
She received aggressive potassium and bicarbonate repletion and, several days later, had normalization of both. Her weakness and myalgia rapidly improved concomitantly with the correction of her hypokalemia. Five days later she was ambulating independently and discharged with potassium citrate and prednisone therapy. She had improved fatigue and rash at a 1-month follow-up with rheumatology. As an outpatient, she was started on azathioprine and slowly tapered off her steroids. Over the next several months, she had normal potassium, bicarbonate, and renal function, although she did require lithotripsy for an obstructive renal stone.
COMMENTARY
RTA should be considered in the differential diagnosis of an unexplained normal anion gap metabolic acidosis. There are 3 major types of RTAs, with different characteristics. In type 1 (distal) RTA, the primary defect is impaired distal acidification of the urine. Distal RTA commonly presents with hypokalemia, calciuria (often presenting as renal stones), and a positive UAG.1 In type 2 (proximal) RTA, the primary defect is impaired bicarbonate reabsorption, leading to bicarbonate wasting in the urine. Proximal RTAs can be secondary to an isolated defect in bicarbonate reabsorption or generalized proximal renal tubule dysfunction (Fanconi syndrome).1 A type 4 RTA is characterized by hypoaldosteronism, presenting usually with a mild nonanion gap metabolic acidosis and hyperkalemia. This patient’s history of renal stones, hypokalemia, and positive UAG supported a type 1 (distal) RTA. Distal RTA is often idiopathic, but initial evaluation should include a review of medications and investigation into an underlying systemic disorder (eg, plasma cell dyscrasia or autoimmune disease). This would include eliciting a possible history of xerostomia and xerophthalmia, together with testing of SSA (Ro) and SSB (La) antibodies, to assess for Sjögren’s syndrome. In addition, checking serum calcium to assess for hyperparathyroidism or familial idiopathic hypercalciuria and a review of medications, such as lithium and amphotericin,1 may uncover other secondary causes of distal RTA.
While Sjögren’s syndrome primarily affects salivary and lacrimal glands, leading to dry mouth and dry eyes, respectively, extraglandular manifestations are common, with fatigue and arthralgia occurring in half of patients. Extra-glandular involvement also often includes the skin and kidneys but can affect several other organ systems, including the central nervous system, heart, lungs, bone marrow, and lymph nodes.2
There are many cutaneous manifestations of Sjögren’s syndrome.3 Xerosis, or xeroderma, is the most common and is characterized by dry, scaly skin. Cutaneous vasculitis can occur in 10% of patients with Sjögren’s syndrome and often presents with palpable purpura or diffuse urticarial lesions, as in our patient.4 Erythematous maculopapules and cryoglobulinemic vasculitis may also occur.4 A less common skin manifestation is annular erythema, presenting as an indurated, ring-like lesion.5
Chronic tubulointerstitial nephritis is the most common renal manifestation of Sjögren’s syndrome.6 This often pre-sents with a mild elevated serum creatinine and a distal RTA, leading to hypokalemia, as in the case discussed. Distal RTA is well described, occurring in one-quarter of patients with Sjögren’s syndrome.7 The pathophysiology leading to distal RTA in Sjögren’s syndrome is thought to arise from autoimmune injury to the H(+)-ATPase pump in the renal collecting tubules, leading to decreased distal proton secretion.8,9 Younger adults with Sjögren’s syndrome, in the third and fourth decades of life, have a predilection to develop tubulointerstitial inflammation, distal RTA, and nephrolithiasis, as in the present case.6 Sjögren’s syndrome less commonly presents with membranoproliferative glomerulonephritis or membranous nephropathy.10,11 Cryoglobulinemia-associated hypocomplementemia and glomerulonephritis may also occur with Sjögren’s syndrome, yet glomerular lesions are less common than is tubulointerstitial inflammation. The patient discussed had proteinuria and evidence of immune complex-mediated glomerulonephritis.
Treatment of sicca symptoms is generally supportive. It includes artificial tears, encouragement of good hydration, salivary stimulants, and maintaining good oral hygiene. Pilocarpine, a cholinergic parasympathomimetic agent, is approved by the Food and Drug Administration to treat dry mouth associated with Sjögren’s syndrome. The treatment of extraglandular manifestations depends on the organ(s) involved. More severe presentations, such as vasculitis and glomerulonephritis, often require immunosuppressive therapy with systemic glucocorticoids, cyclophosphamide, azathioprine, or other immunosuppressive agents,12 including rituximab. RTA often necessitates treatment with oral bicarbonate and supplemental potassium repletion.
The base rate of disease (ie, prevalence of disease) influences a diagnostician’s pretest probability of a given diagnosis. The discussant briefly considered rare causes of hives (eg, vasculitis) but appropriately fine-tuned their differential for the patient’s hypokalemia and RTA. Once the diagnosis of Sjögren’s syndrome was made with certainty, the clinician was able to revisit the patient’s rash with a new lens. Urticarial vasculitis suddenly became a plausible consideration, despite its rarity (compared to allergic causes of hives) because of the direct link to the underlying autoimmune condition, which affected both the proximal muscles and distal nephrons.
TEACHING POINTS
- Evaluation of patients with weakness starts with determining true muscle weakness (ie, pathology involving the brain, spinal cord, peripheral nerve, neuromuscular junction, and/or muscle) from asthenia.
- Distal RTA should be considered in patients with a nonanion gap metabolic acidosis and hypokalemia.
- Sjögren’s syndrome has many extraglandular clinical manifestations, including vasculitis, urticaria, tubulointerstitial renal inflammation, glomerulonephritis, and lymphoma.
Acknowledgment
The authors thank Virgilius Cornea, MD, for his interpretation of the pathologic images.
Disclosure
Dr. Manesh is supported by the Jeremiah A. Barondess Fellowship in the Clinical Transaction of the New York Academy of Medicine, in collaboration with the Accreditation Council for Graduate Medical Education (ACGME). The authors declare no conflicts of interests.
1. Rodríguez Soriano J. Renal tubular acidosis: the clinical entity. J Am Soc Nephrol. 2002;13(8):2160-2170. PubMed
2. Asmussen K, Andersen V, Bendixen G, Schiødt M, Oxholm P. A new model for classification of disease manifestations in primary Sjögren’s syndrome: evaluation in a retrospective long-term study. J Intern Med. 1996;239(6):475-482. PubMed
3. Kittridge A, Routhouska SB, Korman NJ. Dermatologic manifestations of Sjögren syndrome. J Cutan Med Surg. 2011;15(1):8-14. PubMed
4. Ramos-Casals M, Anaya JM, García-Carrasco M, et al. Cutaneous vasculitis in primary Sjögren syndrome: classification and clinical significance of 52 patients. Medicine (Baltimore). 2004; 83(2):96-106. PubMed
5. Katayama I, Kotobuki Y, Kiyohara E, Murota H. Annular erythema associated with Sjögren’s syndrome: review of the literature on the management and clinical analysis of skin lesions. Mod Rheumatol. 2010;20(2):123-129. PubMed
6. Maripuri S, Grande JP, Osborn TG, et al. Renal involvement in primary Sjögren’s syndrome: a clinicopathologic study. Clin J Am Soc Nephrol. 2009;4(9):1423-1431. PubMed
7. Pun KK, Wong CK, Tsui EY, Tam SC, Kung AW, Wang CC. Hypokalemic periodic paralysis due to the Sjögren syndrome in Chinese patients. Ann Intern Med. 1989;110(5):405-406. PubMed
8. Cohen EP, Bastani B, Cohen MR, Kolner S, Hemken P, Gluck SL. Absence of H(+)-ATPase in cortical collecting tubules of a patient with Sjogren’s syndrome and distal renal tubular acidosis. J Am Soc Nephrol. 1992;3(2):264-271. PubMed
9. Bastani B, Haragsim L, Gluck S, Siamopoulos KC. Lack of H-ATPase in distal nephron causing hypokalaemic distal RTA in a patient with Sjögren’s syndrome. Nephrol Dial Transplant. 1995;10(6):908-909. PubMed
10. Cortez MS, Sturgill BC, Bolton WK. Membranoproliferative glomerulonephritis with primary Sjögren’s syndrome. Am J Kidney Dis. 1995;25(4):632-636. PubMed
11. Baba A, Hara S, Sato Y, Yamada K, Fujimoto S, Eto T. [Three patients with nephrotic syndrome due to membranous nephropathy complicated by Sjögren’s syndrome]. Nihon Jinzo Gakkai Shi. 2005;47(8):882-886. PubMed
12. Thanou-Stavraki A, James JA. Primary Sjogren’s syndrome: current and prospective therapies. Semin Arthritis Rheum. 2008;37(5):273-292. PubMed
© 2017 Society of Hospital Medicine
Improving Quality of Care for Seriously Ill Patients: Opportunities for Hospitalists
Palliative care is specialized medical care focused on providing relief from the symptoms, pain, and stress of a serious illness. The goal is to improve the quality of life for both the patient and the family. In all settings, palliative care has been found to improve patients’ quality of life,1,2 improve family satisfaction and well-being,3 reduce resource utilization and costs,4 and, in some studies, increase the length of life for seriously ill patients.5
Given the frequency with which seriously ill patients are hospitalized, hospitalists are well positioned to identify those who could benefit from palliative care interventions.6 Hospitalists routinely use primary palliative care skills, including pain and symptom management and skilled care planning conversations. For complex cases, such as patients with intractable symptoms or major family conflict, hospitalists may refer to specialist palliative care teams for consultation.
The Society of Hospital Medicine (SHM) defines the key primary palliative care responsibilities for hospitalists as (1) leading discussions on the goals of care and advance care planning with patients and families, (2) screening and treating common physical symptoms, and (3) referring patients to community services to provide support postdischarge.7 According to data in the National Palliative Care Registry,8 48% of all palliative care referrals in 2015 came from hospitalists, which is more than double the percentage of referrals from any other specialty.9
In a recent survey conducted by SHM about serious illness communication, 53% of hospitalists reported concerns about a patient or family’s understanding of their prognosis, and 50% indicated that they do not feel confident managing family conflict.10
IMPROVING VALUE
Context
Patients with multiple serious chronic conditions are often forced to rely on emergency services when crises, such as uncontrolled pain or dyspnea exacerbation, occur after hours, resulting in the revolving-door hospitalizations that typically characterize their care.11 As the prevalence of serious illness rises and the shift to value-based payment accelerates, hospitals are under increasing pressure to deliver efficient and high-quality services that meet the needs of seriously ill patients. The integration of standardized palliative care screening and assessment enables hospitalists and other providers to identify high-need individuals and match services and delivery models to needs, whether it be respite care for an exhausted and overwhelmed family caregiver or a home protocol for managing recurrent dyspnea crises for a patient with chronic obstructive pulmonary disease (COPD). This process improves the quality of care and quality of life, and in doing so, prevents the need for costly crisis care.
Reducing Readmissions
By identifying patients in need of extra symptom management support, or those at a turning point requiring discussion about achievable priorities for care, hospitalists can avert crises for patients earlier in the disease trajectory either by managing the patient’s palliative needs themselves or by connecting patients with specialty palliative care services as needed. This leads to a better quality of life (and survival in some studies) for both patients and their families1,3,5 and reduces unnecessary emergency department (ED) and hospital use.12 Hospitalists providing palliative care can also reduce readmissions by improving care coordination, including clinical communication and medication reconciliation after discharge.13
A 2015 Harvard Business Review study found that the quality of communication in the hospital is the strongest independent predictor of readmissions when combined with process-of-care improvements, such as standardized patient screening and assessment of family caregiver capacity.14 While medical education prepares physicians to deliver evidence-based medical care, it currently offers little to no training in communication skills, despite mounting evidence that this is a critical component of quality healthcare.
Cost Savings
Hospital palliative care teams are associated with significant hospital cost savings that result from aligning care with patient priorities, leading, in turn, to reduced nonbeneficial hospital imaging, medications, procedures, and length of stay.15 See the table16,17 for examples of cost and quality outcomes of specialist palliative care provision and evidence supporting each outcome.18-25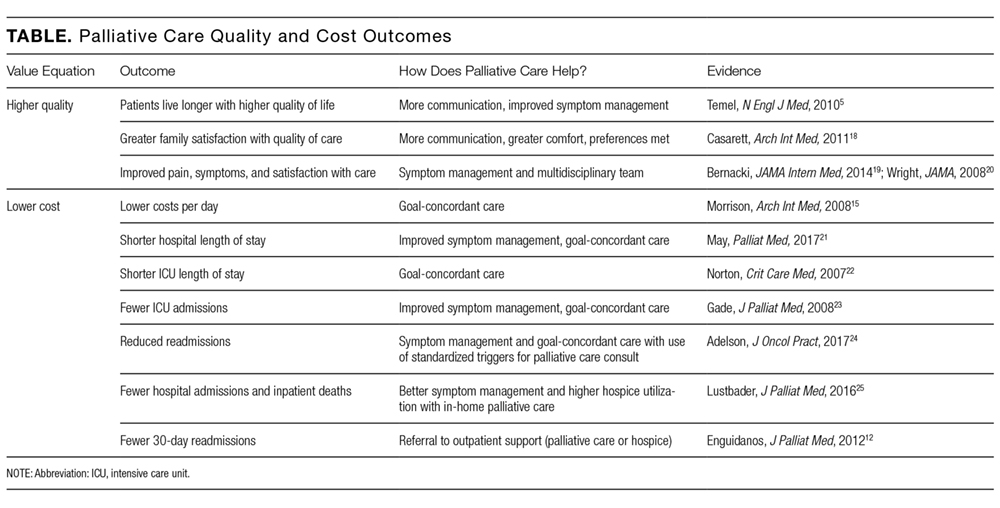
Multiple studies consistently demonstrate that inpatient palliative care teams reduce hospital costs.26 One randomized controlled trial investigating the impact of an inpatient palliative care service found that patients who received care from the palliative care team reported greater satisfaction with their care, had fewer intensive care unit admissions, had more advanced directives at hospital discharge, longer hospice length of stay, and lower total healthcare costs (a net difference of $6766 per patient).23
Research shows that the earlier palliative care is provided, the greater the impact on the subsequent course of care,27 suggesting that hospitalists who provide frontline palliative care interventions as early as possible in a seriously ill patient’s stay will be able to provide higher quality care with lower overall costs. Notably, the majority of research on cost savings associated with palliative care has focused on the impact of specialist palliative care teams, and further research is needed to understand the economic impact of primary palliative care provision.
Improving Satisfaction
Shifting to value-based payment means that the patient and family experience determine an increasingly large percentage of hospital and provider reimbursement. Palliative care approaches, such as family caregiver assessment and support, access to 24/7 assistance after discharge, and person-centered care by an interdisciplinary team, improve performance in all of these measures. Communication skills training improves patient satisfaction scores, and skilled discussions about achievable priorities for care are associated with better quality of life, reduced nonbeneficial and burdensome treatments, and an increase in goal-concordant care.19 Communication skills training has also been shown to reduce burnout and improve empathy among physicians.28,29
SKILLS TRAINING OPPORTUNITIES
Though more evidence is needed to understand the impact of primary palliative care provision by hospitalists, the strong evidence on the benefits of specialty palliative care suggests that the skilled provision of primary palliative care by hospitalists will result in higher quality, higher value care. A number of training options exist for midcareer hospital medicine clinicians, including both in-person and online training in communication and other palliative care skills.
- The Center to Advance Palliative Care (CAPC) is a membership organization that offers online continuing education unit and continuing medical education courses on communication skills, pain and symptom management, caregiver support, and care coordination. CAPC also offers courses on palliative interventions for patients with dementia, COPD, and heart failure.
- SHM is actively invested in engaging hospitalists in palliative care skills training. SHM provides free toolkits on a variety of topics within the palliative care domain, including pain management, postacute care transitions, and opioid safety. The recently released Serious Illness Communication toolkit offers background on the role of hospitalists in palliative care provision, a pathway for fitting goals-of-care conversations into hospitalist workflow and recommended metrics and training resources. SHM also uses a mentored implementation model in which expert physicians mentor hospital team members on best practices in palliative care. SHM’s Palliative Care Task Force seeks to identify educational activities for hospitalists and create opportunities to integrate palliative care in hospital medicine.30
- The Serious Illness Care Program at Ariadne Labs in Boston aims to facilitate conversations between clinicians and seriously ill patients through its Serious Illness Conversation Guide, combined with technical assistance on workflow redesign to help clinicians conduct and document serious illness conversations.
- VitalTalk specializes in clinical communication education. Through online and in-person train-the-trainer programs, VitalTalk equips clinicians to lead communication training programs at their home institutions.
- The Education in Palliative and End-of-Life Care Program and End-of-Life Nursing Education Consortium (ELNEC) uses a train-the-trainer approach to educate providers in palliative care clinical competencies and increase the reach of primary palliative care provision. ELNEC workshops are complemented by a curriculum of online clinical training modules.
CULTURE CHANGE
Though palliative care skills training is a necessary first step, hospitalists also cite lack of time, difficulty finding records of previous patient discussions, and frequent handoffs as among the barriers to integrating palliative care into their practice.10 Studies examining the process of palliative care and hospital culture change have found that barriers to palliative care integration include a culture of aggressive care in EDs, lack of standardized patient identification criteria, and limited knowledge about and staffing for palliative care.31 These data indicate the need for system changes that enable hospitalists to operationalize palliative care principles.
Health systems must implement systems and processes that routinize palliative care, making it part of the mainstream course of care for seriously ill patients and their caregivers. This includes developing systems for the identification of patients with palliative care needs, embedding palliative care assessment and referral into clinical workflows, and enabling standardized palliative care documentation in electronic medical records. While palliative care skills training is essential, investment in systems change is no less critical to embedding palliative care practices in clinical norms across specialties.
CONCLUSION
Hospitalists can use a palliative approach to improve care quality and quality of life for seriously ill patients while helping to avoid preventable and unnecessary 911 calls, ED visits, and hospitalizations. The shift towards value-based payment is a strong incentive for hospitals and hospitalists to direct resources toward practices that improve the quality of life and care for the highest-need patients and their families. When equipped with the tools they need to provide palliative care, either themselves or in collaboration with palliative care teams, hospitalists have the opportunity to profoundly redirect the experience of care for seriously ill patients and their families.
Disclosure
The authors declared no conflicts of interest.
1. Casarett D, Pickard A, Bailey FA, et al. Do Palliative Consultations Improve Patient Outcomes? J Am Geriatr Soc. 2008;56(4):595-599. PubMed
2. Delgado-Guay MO, Parsons HA, Zhijun LM, Palmer LJ, Bruera E. Symptom distress, interventions, and outcomes of intensive care unit cancer patients referred to a palliative care consult team. Cancer. 2009;115(2):437-445. PubMed
3. Gelfman LP, Meier DE, Morrison SR. Does Palliative Care Improve Quality? A Survey of Bereaved Family Members. J Pain Symptom Manage. 2008;36(1):22-28. PubMed
4. Morrison SR, Dietrich J, Ladwig S, et al. Palliative Care Consultation Teams Cut Hospital Costs for Medicaid Beneficiaries. Health Aff. 2011;30:454-463. PubMed
5. Temel JS, Greer JA, Muzikansky A, et al. Early palliative care for patients with metastatic non‐small‐cell lung cancer. N Engl J Med. 2010;363(8):733-742. PubMed
6. Lin RJ, Adelman RD, Diamond RR, Evans AT. The Sentinel Hospitalization and the Role of Palliative Care. J Hosp Med. 2014;9(5):320-323. PubMed
7. Palliative care. J Hosp Med. 2006;1:80-81. doi:10.1002/jhm.54.
8. Center to Advance Palliative Care. National palliative care registry. https://registry.capc.org/. Accessed May 26, 2017.
9. Rogers M, Dumanovsky T. How We Work: Trends and Insights in Hospital Palliative Care. New York: The Center to Advance Palliative Care and the National Palliative Care Research Center. https://registry.capc.org/wp-content/uploads/2017/02/How-We-Work-Trends-and-Insights-in-Hospital-Palliative-Care-2009-2015.pdf; 2017. Accessed May 26, 2017.
10. Rosenberg LB, Greenwald J, Caponi B, et al. Confidence with and Barriers to Serious Illness Communication: A National Survey of Hospitalists. J Palliat Med. 2017;20(9):1013-1019. PubMed
11. Aldridge MD, Kelley AS. The Myth Regarding the High Cost of End-of-Life Care. Am J Public Health. 2015;105(12):2411-2415. PubMed
12. Enguidanos S, Vesper E, Lorenz K. 30-Day Readmissions among Seriously Ill Older Adults. J Palliat Med. 2012;15(12):1356-1361. PubMed
13. Kripalani S, Theobald C, Anctil B, Vasilevskis E. Reducing Hospital Readmission Rates: Current Strategies and Future Directions. Annu Rev Med. 2014;65:471-485. PubMed
14. Senot C, Chandrasekaran A. What Has the Biggest Impact on Hospital Readmission Rates. Harvard Business Review. September 23, 2015. https://hbr.org/2015/09/what-has-the-biggest-impact-on-hospital-readmission-rates. Accessed March 29, 2017.
15. Morrison RS, Penrod JD, Cassel JB, et al. Cost Savings Associated with US Hospital Palliative Care Consultation Programs. Arch Intern Med. 2008;168(16):1783-1790. PubMed
16. Cassel JB. Palliative Care’s Impact on Utilization and Costs: Implications for Health Services Research and Policy. In: Kelley AS, Meier DE, editors. Meeting the Needs of Older Adults with Serious Illness: Challenges and Opportunities in the Age of Health Care Reform. New York: Springer Science+Business Media; 2014:109-126.
17. Meier D, Silvers A. Serious Illness Strategies for Health Plans and Accountable Care Organizations. https://media.capc.org/filer_public/2c/69/2c69a0f0-c90f-43ac-893e-e90cd0438482/serious_illness_strategies_web.pdf. 2017. Accessed August 10, 2017.
18. Casarett D, Johnson M, Smith D, Richardson D. The Optimal Delivery of Palliative Care: A National Comparison of the Outcomes of Consultation Teams vs Inpatient Units. Arch Intern Med. 2011;171(7):649-655. PubMed
19. Bernacki RE, Block SD. Communication About Serious Illness Care Goals: A Review and Synthesis of Best Practices. JAMA Intern Med. 2014;174(12):1994-2003. PubMed
20. Wright AA, Zhang B, Ray A, et al. Associations Between End-of-Life Discussions, Patient Mental Health, Medical Care Near Death, and Caregiver Bereavement Adjustment. JAMA. 2008;300(14):1665-1673. PubMed
21. May P, Garrido M, Cassel JB, et al. Cost Analysis of a Prospective Multi-Site Cohort Study of Palliative Care Consultation Teams for Adults with Advanced Cancer: Where Do Cost Savings Come From? Palliat Med. 2017;31(4):378-386. PubMed
22. Norton SA, Hogan LA, Holloway RG, et al. Proactive Palliative Care in the Medical Intensive Care Unit: Effects of Length of Stay for Selected High-Risk Patients. Crit Care Med. 2007;35(6):1530-1535. PubMed
23. Gade G, Venohr I, Conner D, et al. Impact of an Inpatient Palliative Care Team: A Randomized Controlled Trial. J Palliat Med. 2008;11(2):180-201. PubMed
24. Adelson K, Paris J, Horton J, et al. Standardized Criteria for Palliative Care Consultation on a Solid Tumor Oncology Service Reduces Downstream Health Care use. J Oncol Pract. 2017;13(5):e431-e440. PubMed
25. Lustbader D, Mitchell M, Carole R, et al. The Impact of a Home-Based Palliative Care Program in an Accountable Care Organization. J Palliat Med. 2017;20(1):23-28. PubMed
26. May P, Normand C, Morrison R. Economic Impact of Hospital Inpatient Palliative Care Consultation: Review of Current Evidence and Directions for Future Research. J Palliat Med. 2014;17(9):1054-1063. PubMed
27. May P, Garrido MM, Bassel JB, et al. Prospective Cohort Study of Hospital Palliative Care Teams for Inpatients with Advanced Cancer: Earlier Consultation Is Associated with Larger Cost-Saving Effect. J Clin Oncol. 2015;33(25):2745-2752. PubMed
28. Boissy A, Windover A, Bokar D, et al. Communication Skills Training for Physicians Improves Patient Satisfaction. J Gen Intern Med. 2016;31(7):755-761. PubMed
29. Kirkland KB. Finding Joy in Practice Cocreation in Palliative Care. JAMA. 2017;317(20):2065-2066. PubMed
30. Whelan C. SHM Establishes Palliative Care Task Force. The Hospitalist. 2005;11. http://www.the-hospitalist.org/hospitalist/article/123027/hospice-palliative-medicine/shm-establishes-palliative-care-task-force. Accessed July 31, 2017.
31. Grudzen CR, Richardson LD, Major-Monfried H, et al. Hospital Administrators’ Views on Barriers and Opportunities to Delivering Palliative Care in the Emergency Department. Ann Emerg Med. 2013;61(6):654-660. PubMed
Palliative care is specialized medical care focused on providing relief from the symptoms, pain, and stress of a serious illness. The goal is to improve the quality of life for both the patient and the family. In all settings, palliative care has been found to improve patients’ quality of life,1,2 improve family satisfaction and well-being,3 reduce resource utilization and costs,4 and, in some studies, increase the length of life for seriously ill patients.5
Given the frequency with which seriously ill patients are hospitalized, hospitalists are well positioned to identify those who could benefit from palliative care interventions.6 Hospitalists routinely use primary palliative care skills, including pain and symptom management and skilled care planning conversations. For complex cases, such as patients with intractable symptoms or major family conflict, hospitalists may refer to specialist palliative care teams for consultation.
The Society of Hospital Medicine (SHM) defines the key primary palliative care responsibilities for hospitalists as (1) leading discussions on the goals of care and advance care planning with patients and families, (2) screening and treating common physical symptoms, and (3) referring patients to community services to provide support postdischarge.7 According to data in the National Palliative Care Registry,8 48% of all palliative care referrals in 2015 came from hospitalists, which is more than double the percentage of referrals from any other specialty.9
In a recent survey conducted by SHM about serious illness communication, 53% of hospitalists reported concerns about a patient or family’s understanding of their prognosis, and 50% indicated that they do not feel confident managing family conflict.10
IMPROVING VALUE
Context
Patients with multiple serious chronic conditions are often forced to rely on emergency services when crises, such as uncontrolled pain or dyspnea exacerbation, occur after hours, resulting in the revolving-door hospitalizations that typically characterize their care.11 As the prevalence of serious illness rises and the shift to value-based payment accelerates, hospitals are under increasing pressure to deliver efficient and high-quality services that meet the needs of seriously ill patients. The integration of standardized palliative care screening and assessment enables hospitalists and other providers to identify high-need individuals and match services and delivery models to needs, whether it be respite care for an exhausted and overwhelmed family caregiver or a home protocol for managing recurrent dyspnea crises for a patient with chronic obstructive pulmonary disease (COPD). This process improves the quality of care and quality of life, and in doing so, prevents the need for costly crisis care.
Reducing Readmissions
By identifying patients in need of extra symptom management support, or those at a turning point requiring discussion about achievable priorities for care, hospitalists can avert crises for patients earlier in the disease trajectory either by managing the patient’s palliative needs themselves or by connecting patients with specialty palliative care services as needed. This leads to a better quality of life (and survival in some studies) for both patients and their families1,3,5 and reduces unnecessary emergency department (ED) and hospital use.12 Hospitalists providing palliative care can also reduce readmissions by improving care coordination, including clinical communication and medication reconciliation after discharge.13
A 2015 Harvard Business Review study found that the quality of communication in the hospital is the strongest independent predictor of readmissions when combined with process-of-care improvements, such as standardized patient screening and assessment of family caregiver capacity.14 While medical education prepares physicians to deliver evidence-based medical care, it currently offers little to no training in communication skills, despite mounting evidence that this is a critical component of quality healthcare.
Cost Savings
Hospital palliative care teams are associated with significant hospital cost savings that result from aligning care with patient priorities, leading, in turn, to reduced nonbeneficial hospital imaging, medications, procedures, and length of stay.15 See the table16,17 for examples of cost and quality outcomes of specialist palliative care provision and evidence supporting each outcome.18-25
Multiple studies consistently demonstrate that inpatient palliative care teams reduce hospital costs.26 One randomized controlled trial investigating the impact of an inpatient palliative care service found that patients who received care from the palliative care team reported greater satisfaction with their care, had fewer intensive care unit admissions, had more advanced directives at hospital discharge, longer hospice length of stay, and lower total healthcare costs (a net difference of $6766 per patient).23
Research shows that the earlier palliative care is provided, the greater the impact on the subsequent course of care,27 suggesting that hospitalists who provide frontline palliative care interventions as early as possible in a seriously ill patient’s stay will be able to provide higher quality care with lower overall costs. Notably, the majority of research on cost savings associated with palliative care has focused on the impact of specialist palliative care teams, and further research is needed to understand the economic impact of primary palliative care provision.
Improving Satisfaction
Shifting to value-based payment means that the patient and family experience determine an increasingly large percentage of hospital and provider reimbursement. Palliative care approaches, such as family caregiver assessment and support, access to 24/7 assistance after discharge, and person-centered care by an interdisciplinary team, improve performance in all of these measures. Communication skills training improves patient satisfaction scores, and skilled discussions about achievable priorities for care are associated with better quality of life, reduced nonbeneficial and burdensome treatments, and an increase in goal-concordant care.19 Communication skills training has also been shown to reduce burnout and improve empathy among physicians.28,29
SKILLS TRAINING OPPORTUNITIES
Though more evidence is needed to understand the impact of primary palliative care provision by hospitalists, the strong evidence on the benefits of specialty palliative care suggests that the skilled provision of primary palliative care by hospitalists will result in higher quality, higher value care. A number of training options exist for midcareer hospital medicine clinicians, including both in-person and online training in communication and other palliative care skills.
- The Center to Advance Palliative Care (CAPC) is a membership organization that offers online continuing education unit and continuing medical education courses on communication skills, pain and symptom management, caregiver support, and care coordination. CAPC also offers courses on palliative interventions for patients with dementia, COPD, and heart failure.
- SHM is actively invested in engaging hospitalists in palliative care skills training. SHM provides free toolkits on a variety of topics within the palliative care domain, including pain management, postacute care transitions, and opioid safety. The recently released Serious Illness Communication toolkit offers background on the role of hospitalists in palliative care provision, a pathway for fitting goals-of-care conversations into hospitalist workflow and recommended metrics and training resources. SHM also uses a mentored implementation model in which expert physicians mentor hospital team members on best practices in palliative care. SHM’s Palliative Care Task Force seeks to identify educational activities for hospitalists and create opportunities to integrate palliative care in hospital medicine.30
- The Serious Illness Care Program at Ariadne Labs in Boston aims to facilitate conversations between clinicians and seriously ill patients through its Serious Illness Conversation Guide, combined with technical assistance on workflow redesign to help clinicians conduct and document serious illness conversations.
- VitalTalk specializes in clinical communication education. Through online and in-person train-the-trainer programs, VitalTalk equips clinicians to lead communication training programs at their home institutions.
- The Education in Palliative and End-of-Life Care Program and End-of-Life Nursing Education Consortium (ELNEC) uses a train-the-trainer approach to educate providers in palliative care clinical competencies and increase the reach of primary palliative care provision. ELNEC workshops are complemented by a curriculum of online clinical training modules.
CULTURE CHANGE
Though palliative care skills training is a necessary first step, hospitalists also cite lack of time, difficulty finding records of previous patient discussions, and frequent handoffs as among the barriers to integrating palliative care into their practice.10 Studies examining the process of palliative care and hospital culture change have found that barriers to palliative care integration include a culture of aggressive care in EDs, lack of standardized patient identification criteria, and limited knowledge about and staffing for palliative care.31 These data indicate the need for system changes that enable hospitalists to operationalize palliative care principles.
Health systems must implement systems and processes that routinize palliative care, making it part of the mainstream course of care for seriously ill patients and their caregivers. This includes developing systems for the identification of patients with palliative care needs, embedding palliative care assessment and referral into clinical workflows, and enabling standardized palliative care documentation in electronic medical records. While palliative care skills training is essential, investment in systems change is no less critical to embedding palliative care practices in clinical norms across specialties.
CONCLUSION
Hospitalists can use a palliative approach to improve care quality and quality of life for seriously ill patients while helping to avoid preventable and unnecessary 911 calls, ED visits, and hospitalizations. The shift towards value-based payment is a strong incentive for hospitals and hospitalists to direct resources toward practices that improve the quality of life and care for the highest-need patients and their families. When equipped with the tools they need to provide palliative care, either themselves or in collaboration with palliative care teams, hospitalists have the opportunity to profoundly redirect the experience of care for seriously ill patients and their families.
Disclosure
The authors declared no conflicts of interest.
1. Casarett D, Pickard A, Bailey FA, et al. Do Palliative Consultations Improve Patient Outcomes? J Am Geriatr Soc. 2008;56(4):595-599. PubMed
2. Delgado-Guay MO, Parsons HA, Zhijun LM, Palmer LJ, Bruera E. Symptom distress, interventions, and outcomes of intensive care unit cancer patients referred to a palliative care consult team. Cancer. 2009;115(2):437-445. PubMed
3. Gelfman LP, Meier DE, Morrison SR. Does Palliative Care Improve Quality? A Survey of Bereaved Family Members. J Pain Symptom Manage. 2008;36(1):22-28. PubMed
4. Morrison SR, Dietrich J, Ladwig S, et al. Palliative Care Consultation Teams Cut Hospital Costs for Medicaid Beneficiaries. Health Aff. 2011;30:454-463. PubMed
5. Temel JS, Greer JA, Muzikansky A, et al. Early palliative care for patients with metastatic non‐small‐cell lung cancer. N Engl J Med. 2010;363(8):733-742. PubMed
6. Lin RJ, Adelman RD, Diamond RR, Evans AT. The Sentinel Hospitalization and the Role of Palliative Care. J Hosp Med. 2014;9(5):320-323. PubMed
7. Palliative care. J Hosp Med. 2006;1:80-81. doi:10.1002/jhm.54.
8. Center to Advance Palliative Care. National palliative care registry. https://registry.capc.org/. Accessed May 26, 2017.
9. Rogers M, Dumanovsky T. How We Work: Trends and Insights in Hospital Palliative Care. New York: The Center to Advance Palliative Care and the National Palliative Care Research Center. https://registry.capc.org/wp-content/uploads/2017/02/How-We-Work-Trends-and-Insights-in-Hospital-Palliative-Care-2009-2015.pdf; 2017. Accessed May 26, 2017.
10. Rosenberg LB, Greenwald J, Caponi B, et al. Confidence with and Barriers to Serious Illness Communication: A National Survey of Hospitalists. J Palliat Med. 2017;20(9):1013-1019. PubMed
11. Aldridge MD, Kelley AS. The Myth Regarding the High Cost of End-of-Life Care. Am J Public Health. 2015;105(12):2411-2415. PubMed
12. Enguidanos S, Vesper E, Lorenz K. 30-Day Readmissions among Seriously Ill Older Adults. J Palliat Med. 2012;15(12):1356-1361. PubMed
13. Kripalani S, Theobald C, Anctil B, Vasilevskis E. Reducing Hospital Readmission Rates: Current Strategies and Future Directions. Annu Rev Med. 2014;65:471-485. PubMed
14. Senot C, Chandrasekaran A. What Has the Biggest Impact on Hospital Readmission Rates. Harvard Business Review. September 23, 2015. https://hbr.org/2015/09/what-has-the-biggest-impact-on-hospital-readmission-rates. Accessed March 29, 2017.
15. Morrison RS, Penrod JD, Cassel JB, et al. Cost Savings Associated with US Hospital Palliative Care Consultation Programs. Arch Intern Med. 2008;168(16):1783-1790. PubMed
16. Cassel JB. Palliative Care’s Impact on Utilization and Costs: Implications for Health Services Research and Policy. In: Kelley AS, Meier DE, editors. Meeting the Needs of Older Adults with Serious Illness: Challenges and Opportunities in the Age of Health Care Reform. New York: Springer Science+Business Media; 2014:109-126.
17. Meier D, Silvers A. Serious Illness Strategies for Health Plans and Accountable Care Organizations. https://media.capc.org/filer_public/2c/69/2c69a0f0-c90f-43ac-893e-e90cd0438482/serious_illness_strategies_web.pdf. 2017. Accessed August 10, 2017.
18. Casarett D, Johnson M, Smith D, Richardson D. The Optimal Delivery of Palliative Care: A National Comparison of the Outcomes of Consultation Teams vs Inpatient Units. Arch Intern Med. 2011;171(7):649-655. PubMed
19. Bernacki RE, Block SD. Communication About Serious Illness Care Goals: A Review and Synthesis of Best Practices. JAMA Intern Med. 2014;174(12):1994-2003. PubMed
20. Wright AA, Zhang B, Ray A, et al. Associations Between End-of-Life Discussions, Patient Mental Health, Medical Care Near Death, and Caregiver Bereavement Adjustment. JAMA. 2008;300(14):1665-1673. PubMed
21. May P, Garrido M, Cassel JB, et al. Cost Analysis of a Prospective Multi-Site Cohort Study of Palliative Care Consultation Teams for Adults with Advanced Cancer: Where Do Cost Savings Come From? Palliat Med. 2017;31(4):378-386. PubMed
22. Norton SA, Hogan LA, Holloway RG, et al. Proactive Palliative Care in the Medical Intensive Care Unit: Effects of Length of Stay for Selected High-Risk Patients. Crit Care Med. 2007;35(6):1530-1535. PubMed
23. Gade G, Venohr I, Conner D, et al. Impact of an Inpatient Palliative Care Team: A Randomized Controlled Trial. J Palliat Med. 2008;11(2):180-201. PubMed
24. Adelson K, Paris J, Horton J, et al. Standardized Criteria for Palliative Care Consultation on a Solid Tumor Oncology Service Reduces Downstream Health Care use. J Oncol Pract. 2017;13(5):e431-e440. PubMed
25. Lustbader D, Mitchell M, Carole R, et al. The Impact of a Home-Based Palliative Care Program in an Accountable Care Organization. J Palliat Med. 2017;20(1):23-28. PubMed
26. May P, Normand C, Morrison R. Economic Impact of Hospital Inpatient Palliative Care Consultation: Review of Current Evidence and Directions for Future Research. J Palliat Med. 2014;17(9):1054-1063. PubMed
27. May P, Garrido MM, Bassel JB, et al. Prospective Cohort Study of Hospital Palliative Care Teams for Inpatients with Advanced Cancer: Earlier Consultation Is Associated with Larger Cost-Saving Effect. J Clin Oncol. 2015;33(25):2745-2752. PubMed
28. Boissy A, Windover A, Bokar D, et al. Communication Skills Training for Physicians Improves Patient Satisfaction. J Gen Intern Med. 2016;31(7):755-761. PubMed
29. Kirkland KB. Finding Joy in Practice Cocreation in Palliative Care. JAMA. 2017;317(20):2065-2066. PubMed
30. Whelan C. SHM Establishes Palliative Care Task Force. The Hospitalist. 2005;11. http://www.the-hospitalist.org/hospitalist/article/123027/hospice-palliative-medicine/shm-establishes-palliative-care-task-force. Accessed July 31, 2017.
31. Grudzen CR, Richardson LD, Major-Monfried H, et al. Hospital Administrators’ Views on Barriers and Opportunities to Delivering Palliative Care in the Emergency Department. Ann Emerg Med. 2013;61(6):654-660. PubMed
© 2018 Society of Hospital Medicine
FDA expands approved use of bosutinib in CML

The US Food and Drug Administration (FDA) has expanded the approved indication for bosutinib (BOSULIF®).
The tyrosine kinase inhibitor (TKI) is now approved to treat adults with newly diagnosed, chronic phase, Philadelphia chromosome-positive (Ph+) chronic myelogenous leukemia (CML).
Bosutinib has accelerated approval for this indication. The approval was based on molecular and cytogenetic response rates.
Continued approval may be contingent upon verification and confirmation of clinical benefit in an ongoing, long-term follow-up trial.
Bosutinib was first approved by the FDA in September 2012. At that time, the TKI was approved to treat adults with chronic, accelerated, or blast phase Ph+ CML with resistance or intolerance to prior therapy.
A 400 mg tablet of bosutinib was recently approved by the FDA, adding to the previously approved 100 mg and 500 mg strengths.
The recommended dose of bosutinib for newly diagnosed patients is 400 mg orally once daily with food.
For patients who are resistant or intolerant to prior TKI therapy, the recommended dose is 500 mg orally once daily with food.
BFORE trial
The approval of bosutinib in adults with newly diagnosed, chronic phase, Ph+ CML was based on the phase 3 BFORE trial. Results from the trial were presented at the 2017 ASCO Annual Meeting.
In this ongoing study, researchers are comparing bosutinib and imatinib as first-line treatment of chronic phase CML.
As of the ASCO presentation, the trial had enrolled 536 patients who were randomized 1:1 to receive bosutinib (n=268) or imatinib (n=268).
The presentation included results in a modified intent-to-treat population of Ph+ patients with e13a2/e14a2 transcripts who had at least 12 months of follow-up. In this group, there were 246 patients in the bosutinib arm and 241 in the imatinib arm.
Most of the patients were still on therapy at the 12-month mark or beyond—78% in the bosutinib arm and 73.2% in the imatinib arm. The median treatment duration was 14.1 months and 13.8 months, respectively.
At 12 months, the rate of major molecular response was 47.2% in the bosutinib arm and 36.9% in the imatinib arm (P=0.02). The rate of complete cytogenetic response was 77.2% and 66.4%, respectively (P<0.008).
One patient in the bosutinib arm and 4 in the imatinib arm discontinued treatment due to disease progression, while 12.7% and 8.7%, respectively, discontinued treatment due to drug-related toxicity.
Adverse events that were more common in the bosutinib arm than the imatinib arm included grade 3 or higher diarrhea (7.8% vs 0.8%), increased alanine levels (19% vs 1.5%), increased aspartate levels (9.7% vs 1.9%), cardiovascular events (3% vs 0.4%), and peripheral vascular events (1.5% vs 1.1%).
Cerebrovascular events were more common with imatinib than bosutinib (0.4% and 0%, respectively).
Pfizer and Avillion entered into an exclusive collaborative development agreement in 2014 to conduct the BFORE trial.
Under the terms of the agreement, Avillion provided funding and conducted the trial to generate the clinical data used to support regulatory filings for marketing authorization for bosutinib as first-line treatment for patients with chronic phase, Ph+ CML.
With this approval, Avillion is eligible to receive milestone payments from Pfizer. Pfizer retains all rights to commercialize bosutinib globally. ![]()
Allo-HSCT leads to long-term survival in MF

ATLANTA—One of the largest single-center studies of fludarabine/melphalan-based allogeneic hematopoietic stem cell transplant (allo-HSCT) for patients with myelofibrosis (MF) shows excellent overall survival (OS) with a low risk of relapse, according to investigators.
Allo-HSCT is the only potential curative treatment modality for MF.
However, it is associated with risks of transplant-related morbidity and mortality from graft-versus-host disease (GVHD), infection, graft rejection, and regimen-related toxicities.
This necessitates careful patient selection and intense peri-transplant management, said study investigator Haris Ali, MD, of the City of Hope Medical Center in Duarte, California.
He noted that there has been a 5-fold increase in allo-HSCT in the last 2 decades, mainly among older patients, due to the increase in reduced-intensity conditioning.
At the 2017 ASH Annual Meeting (in abstract 199), Dr Ali reported on a cohort of 110 MF patients who underwent allo-HSCT with fludarabine/melphalan conditioning at City of Hope between 2004 and 2017.
The patients, 58 with primary MF and 52 with secondary MF, were without prior acute leukemic transformation. They were a median age of 58.5 at the time of transplant, with a median interval of 15.2 months from MF diagnosis.
Virtually all (n=107) received peripheral blood stem cells, and 3 were transplanted with bone marrow as the stem cell source. Forty-nine allo-HSCT donors were matched related, 32 were matched unrelated, 27 were mismatched unrelated, 1 was mismatched relative, and 1 was haploidentical family.
Three-quarters of the patients had intermediate-2 or high-risk disease. Of the 110 patients, 16 had splenectomy prior to allo-HSCT. All but 2 patients engrafted.
After a median follow-up of 56.8 months, the 2-year OS rate was 74%, and the 5-year OS rate was 65%.
Non-relapse mortality at 2 years was 12%. At 5 years, it was 24%.
“The risk of non-relapse mortality was acceptable, considering the relatively older age of a large subset of patients; nearly half were over age 60 at allo-HSCT,” Dr Ali said.
In a univariate analysis, mismatched donors and matched unrelated donors were significantly associated with worse OS compared with matched related donors.
The cumulative incidence of relapse was 17% at 2 years and 5 years.
Splenectomy prior to transplant was associated with higher relapse risk, Dr Ali noted.
“Cytogenetic abnormalities were not associated with transplant relapse or other outcomes in our cohort,” he added.
Mutational changes are being tested in pre-transplant samples and will be reported at a later date.
The incidence of grade 2-4 and 3-4 acute GVHD at 100 days was 45% and 17%, respectively.
At 36 months, the cumulative incidence of all chronic GVHD was 66%. For extensive chronic GVHD, it was 59%.
“Interestingly, prior use of ruxolitinib increased the risk of grade 3-4 acute GVHD, possibly due to known inflammatory cytokine rebound,” Dr Ali said.
Extended use of ruxolitinib until day 30 or longer is currently being evaluated in a prospective trial at City of Hope (NCT02917096).
Dr Ali disclosed consulting fees from Incyte. ![]()
FDA issues requirements, recommendations for GBCA use
The US Food and Drug Administration (FDA) has issued new safety-related requirements pertaining to gadolinium-based contrast agents (GBCAs) used for magnetic resonance imaging (MRI).
The agency’s action is due to the fact that gadolinium can be retained in patients’ brains and other body tissues for months to years after they receive GBCAs.
The only known adverse event related to gadolinium retention is nephrogenic systemic fibrosis, which occurs in a small subgroup of patients with pre-existing kidney failure.
Patients with normal kidney function and gadolinium retention have experienced adverse events involving multiple organ systems. However, the FDA has found no evidence confirming that gadolinium retention is causing these events.
Therefore, the agency concluded that the benefit of all approved GBCAs continues to outweigh any potential risks.
Still, the FDA has issued the following safety requirements related to GBCAs:
- Patients receiving GBCAs must read a new medication guide explaining about gadolinium retention
- Manufacturers of GBCAs must conduct human and animal studies to assess the safety of GBCAs
- Labels of GBCAs must be updated with a “Warning and Precaution” about gadolinium retention
- Labels must be changed to include mention of gadolinium retention in the Adverse Reactions, Pregnancy, Clinical Pharmacology, and Patient Instructions sections.
The FDA is also recommending that healthcare professionals consider the retention characteristics of each agent when choosing a GBCA for patients who may be at higher risk for gadolinium retention. This includes patients requiring multiple lifetime doses, pregnant women, children, and patients with inflammatory conditions.
In its latest safety communication on gadolinium retention, the FDA noted that linear GBCAs result in more and longer retention than macrocyclic GBCAs.
Specifically, gadolinium retention is higher with Omniscan (gadodiamide) or OptiMARK (gadoversetamide) than with Eovist (gadoxetate disodium), Magnevist (gadopentetate dimeglumine), or MultiHance (gadobenate dimeglumine).
Gadolinium retention is lowest with Dotarem (gadoterate meglumine), Gadavist (gadobutrol), and ProHance (gadoteridol), which all have similar levels of gadolinium retention.
Finally, the FDA is recommending that healthcare professionals minimize repeated GBCA imaging studies when possible, particularly closely spaced MRI studies. However, necessary GBCA MRI scans should not be deferred or avoided.
The FDA said it is still assessing the health effects of gadolinium retention and will update the public when new information becomes available. In the meantime, patients and healthcare professionals can report adverse events involving GBCAs to the agency’s MedWatch program. ![]()