User login
Authors Needed for SHM Clinical Quick Talks
Busy clinical services and multiple demands on hospitalists’ time make it difficult to prepare brief talks to give to residents and students. The SHM Education Committee has created SHM Clinical Quick Talks, a bank of short prepared lectures on the SHM website. SHM Clinical Quick Talks are designed to be given in fewer than 10 minutes and are intended for use during teaching rounds, for a brief sit-down, or whenever time allows.
SHM is looking for additional authors for this series of micro-lectures. Read more and learn how to submit at connect.hospitalmedicine.org/clinicalquicktalks.
Parents support school-based HPV vaccination
Approximately 86% of middle school students were vaccinated against HPV in a school setting in a review of data from a service project involving more than 8,000 students.
“School-located vaccination programs (SLVPs) provide access to vaccination for those adolescents whose parents cannot miss work or other daytime commitments or those who have multiple after-school commitments,” wrote Dr. Amy Middleman of the University of Oklahoma Health Science Center, Oklahoma City, and her colleagues. Data from previous studies suggest reluctance on the part of parents to allow their children to receive the human papillomavirus vaccine (HPV) in a school setting, but such data may not reflect parents’ opinions when a school-based program is actually available, the researchers noted.

The researchers tested SLVPs at eight middle schools including 8,333 students; 80% were Hispanic, 17% were black, 1% were white, and the remainder of students’ ethnicities were not identified (Human Vaccines & Immunotherapeutics. 2016 Aug. doi: 10.1080/21645515.2016.1208326).
School-based vaccinations were scheduled for three times: September/October 2012, March/April 2013, and September/October 2013; the findings reflect the first two visits.
The SLVPs included the following vaccines: HPV, influenza, Tdap, meningococcal conjugate vaccine (MCV4), hepatitis A, varicella, and MMR. A total of 1,674 vaccines were administered in the fall of 2012, and 532 were administered in the spring of 2013. Overall, 449 of 524 (86%) students in the fall program and 161 of 188 (86%) in the spring program received the HPV vaccine.
The study was limited by several factors including the descriptive nature of the service project and the inability to obtain the vaccination status of all enrolled students. In addition, the schools were located in lower income areas, which might limit the generalizability of the findings, the researchers noted. However, the results suggest that “SLVPs may be more successful not only when they include all vaccines, but also when conducted in the fall prior to the onset of preparation for high-stakes state testing,” they said.
The study was supported by the Society for Adolescent Health through a grant from Merck. One study coauthor previously received salary support from Merck.
Approximately 86% of middle school students were vaccinated against HPV in a school setting in a review of data from a service project involving more than 8,000 students.
“School-located vaccination programs (SLVPs) provide access to vaccination for those adolescents whose parents cannot miss work or other daytime commitments or those who have multiple after-school commitments,” wrote Dr. Amy Middleman of the University of Oklahoma Health Science Center, Oklahoma City, and her colleagues. Data from previous studies suggest reluctance on the part of parents to allow their children to receive the human papillomavirus vaccine (HPV) in a school setting, but such data may not reflect parents’ opinions when a school-based program is actually available, the researchers noted.
The researchers tested SLVPs at eight middle schools including 8,333 students; 80% were Hispanic, 17% were black, 1% were white, and the remainder of students’ ethnicities were not identified (Human Vaccines & Immunotherapeutics. 2016 Aug. doi: 10.1080/21645515.2016.1208326).
School-based vaccinations were scheduled for three times: September/October 2012, March/April 2013, and September/October 2013; the findings reflect the first two visits.
The SLVPs included the following vaccines: HPV, influenza, Tdap, meningococcal conjugate vaccine (MCV4), hepatitis A, varicella, and MMR. A total of 1,674 vaccines were administered in the fall of 2012, and 532 were administered in the spring of 2013. Overall, 449 of 524 (86%) students in the fall program and 161 of 188 (86%) in the spring program received the HPV vaccine.
The study was limited by several factors including the descriptive nature of the service project and the inability to obtain the vaccination status of all enrolled students. In addition, the schools were located in lower income areas, which might limit the generalizability of the findings, the researchers noted. However, the results suggest that “SLVPs may be more successful not only when they include all vaccines, but also when conducted in the fall prior to the onset of preparation for high-stakes state testing,” they said.
The study was supported by the Society for Adolescent Health through a grant from Merck. One study coauthor previously received salary support from Merck.
FROM HUMAN VACCINES & IMMUNOTHERAPEUTICS
Key clinical point: Parents already supportive of school-based vaccination are likely to support school-based HPV vaccination as well.
Major finding: Approximately 86% of adolescents participating in a school-based program received an HPV vaccine.
Data source: A descriptive study based on a service project that included 8,333 middle school students and parents.
Disclosures: The study was supported by the Society for Adolescent Health through a grant from Merck. One study coauthor previously received salary support from Merck.

Data-based Recommendations for Dialysis
Q) I work in a cardiology practice. Recently, a patient on dialysis mentioned that her nephrology practitioner recommended either home therapy or nocturnal dialysis. Why would someone recommend these, and what are the differences between home, nocturnal, and regular daytime dialysis?
Patients usually require dialysis when 90% or more of their renal function is lost.5 This can happen acutely or result from a chronic process. Dialysis performs many of the functions of a kidney, such as removing waste and fluid buildup that damaged kidneys cannot. It also helps maintain electrolyte balance.
There are several forms of hemodialysis including home, incenter, and nocturnal; the most frequently used is in-center hemodialysis.5 Patients on in-center hemodialysis visit the center three times a week, and their treatments last from three to five hours; the nationwide average is four hours. These patients have very restricted schedules and must maintain their appointments with limited flexibility. Food, drinks, and nonmedical personnel may not be allowed in the treatment area. Between treatments, patients must follow a diet that restricts fluid, sodium, and potassium intake.
Home dialysis has become a popular alternative, since it may be done in a location and at a time that is convenient for the patient. With more flexibility, many patients are able to continue working and feel like they have a more “normal” life. Types of home dialysis include home hemodialysis (HHD) or peritoneal dialysis (PD). A relative or friend may need to assist the patient during HHD, which is undergone more frequently (between five and seven days per week) and for a shorter duration of time than in-center dialysis. PD is done every day, either at night or multiple times throughout the day. Although no partner is needed for PD, a medical provider is available by phone to address any concerns that may arise during treatment.
Nocturnal hemodialysis is similar to daytime in-center hemodialysis, but it occurs while the patient is asleep. The treatment duration is longer (an average of eight hours per treatment). The slower blood flow allows for gentler dialysis. Patients who undergo nocturnal hemodialysis have higher survival and lower hospitalization rates, with better phosphorus control and blood pressure.6 This is attributed to the slower removal of excess fluid and more effective clearance of toxins.
So, why is your patient being encouraged to consider home or nocturnal dialysis? Studies have shown that for the cardiac patient, slower, gentler dialysis is preferable.7 The clinician who recommended it has the patient’s best interest in mind. —TAH
Tricia A. Howard, MHS, PA-C, DFAAPA
PA Program, South University, Savannah, Georgia
5. Gilbert S, Weiner DE. National Kidney Foundation Primer on Kidney Diseases. 6th ed. Philadelphia, PA: Elsevier; 2014.
6. Lacson E, Wang W, Lester K, et al. Outcomes associated with in-center nocturnal hemodialysis from a large multicenter program. Clin J Am Soc Nephrol. 2010;5(2):220-226.
7. Lin J, Berns JS. Is hemodialysis bad for the heart? Semin Dial. 2012;25(1):86-87.
Clinician Reviews in partnership with
![]()
Renal Consult is edited by Jane S. Davis, CRNP, DNP, a member of the Clinician Reviews editorial board, who is a nurse practitioner in the Division of Nephrology at the University of Alabama at Birmingham and is the communications chairperson for the National Kidney Foundation’s Council of Advanced Practitioners (NKF-CAP); and Kim Zuber, PA-C, MSPS, DFAAPA, a semi-retired PA who works with the American Academy of Nephrology PAs and is a past chair of the NKF-CAP. This month’s responses were authored by Rebecca V. Rokosky, MSN, APRN, FNP, who practices at the Renal Associates Clinical Advancement Center in San Antonio, Texas, and Tricia A. Howard, MHS, PA-C, DFAAPA, Associate Professor and Assistant Program Director in the PA Program at South University in Savannah, Georgia.
Q) I work in a cardiology practice. Recently, a patient on dialysis mentioned that her nephrology practitioner recommended either home therapy or nocturnal dialysis. Why would someone recommend these, and what are the differences between home, nocturnal, and regular daytime dialysis?
Patients usually require dialysis when 90% or more of their renal function is lost.5 This can happen acutely or result from a chronic process. Dialysis performs many of the functions of a kidney, such as removing waste and fluid buildup that damaged kidneys cannot. It also helps maintain electrolyte balance.
There are several forms of hemodialysis including home, incenter, and nocturnal; the most frequently used is in-center hemodialysis.5 Patients on in-center hemodialysis visit the center three times a week, and their treatments last from three to five hours; the nationwide average is four hours. These patients have very restricted schedules and must maintain their appointments with limited flexibility. Food, drinks, and nonmedical personnel may not be allowed in the treatment area. Between treatments, patients must follow a diet that restricts fluid, sodium, and potassium intake.
Home dialysis has become a popular alternative, since it may be done in a location and at a time that is convenient for the patient. With more flexibility, many patients are able to continue working and feel like they have a more “normal” life. Types of home dialysis include home hemodialysis (HHD) or peritoneal dialysis (PD). A relative or friend may need to assist the patient during HHD, which is undergone more frequently (between five and seven days per week) and for a shorter duration of time than in-center dialysis. PD is done every day, either at night or multiple times throughout the day. Although no partner is needed for PD, a medical provider is available by phone to address any concerns that may arise during treatment.
Nocturnal hemodialysis is similar to daytime in-center hemodialysis, but it occurs while the patient is asleep. The treatment duration is longer (an average of eight hours per treatment). The slower blood flow allows for gentler dialysis. Patients who undergo nocturnal hemodialysis have higher survival and lower hospitalization rates, with better phosphorus control and blood pressure.6 This is attributed to the slower removal of excess fluid and more effective clearance of toxins.
So, why is your patient being encouraged to consider home or nocturnal dialysis? Studies have shown that for the cardiac patient, slower, gentler dialysis is preferable.7 The clinician who recommended it has the patient’s best interest in mind. —TAH
Tricia A. Howard, MHS, PA-C, DFAAPA
PA Program, South University, Savannah, Georgia
5. Gilbert S, Weiner DE. National Kidney Foundation Primer on Kidney Diseases. 6th ed. Philadelphia, PA: Elsevier; 2014.
6. Lacson E, Wang W, Lester K, et al. Outcomes associated with in-center nocturnal hemodialysis from a large multicenter program. Clin J Am Soc Nephrol. 2010;5(2):220-226.
7. Lin J, Berns JS. Is hemodialysis bad for the heart? Semin Dial. 2012;25(1):86-87.
ASH launches sickle cell coalition
To improve the lives of individuals with sickle cell disease, the American Society of Hematology has launched the Sickle Cell Disease Coalition (SCDC). Creation of the coalition with 20 other organizations coincides with the release of “State of Sickle Cell Disease: 2016” – a report detailing the status of access to care for patients with sickle cell disease, gaps in the training and education of health care professionals, areas of interest for research and clinical trials, and the global state of the disease. All four of these areas need improvement, ASH officials said in a statement.
“Not only are individuals with [sickle cell disease] burdened by the pain and disability that comes with a chronic condition, but they also have very few accessible treatment options due to our fragmented health care system,” Dr. Charles S. Abrams, president of ASH, said in the statement. Sickle cell disease affects approximately 100,000 Americans and remains a growing global health concern, according to the statement.

The coalition’s goals include development of evidence-based treatment guidelines to improve quality of care, education of clinicians to increase the number of health care providers available to treat sickle cell disease, investment in research and clinical trials to improve existing treatments and develop new ones, and expansion of early intervention programs to help ease the global burden of sickle cell disease.
For more information regarding the coalition, click here.
To improve the lives of individuals with sickle cell disease, the American Society of Hematology has launched the Sickle Cell Disease Coalition (SCDC). Creation of the coalition with 20 other organizations coincides with the release of “State of Sickle Cell Disease: 2016” – a report detailing the status of access to care for patients with sickle cell disease, gaps in the training and education of health care professionals, areas of interest for research and clinical trials, and the global state of the disease. All four of these areas need improvement, ASH officials said in a statement.
“Not only are individuals with [sickle cell disease] burdened by the pain and disability that comes with a chronic condition, but they also have very few accessible treatment options due to our fragmented health care system,” Dr. Charles S. Abrams, president of ASH, said in the statement. Sickle cell disease affects approximately 100,000 Americans and remains a growing global health concern, according to the statement.
The coalition’s goals include development of evidence-based treatment guidelines to improve quality of care, education of clinicians to increase the number of health care providers available to treat sickle cell disease, investment in research and clinical trials to improve existing treatments and develop new ones, and expansion of early intervention programs to help ease the global burden of sickle cell disease.
For more information regarding the coalition, click here.

HSCT may age T cells as much as 30 years
![]()
Photo by Chad McNeeley
New research suggests hematopoietic stem cell transplant (HSCT) may increase the molecular age of peripheral blood T cells.
The study showed an increase in peripheral blood T-cell senescence in patients with hematologic malignancies who were treated with autologous (auto-) or allogeneic (allo-) HSCT.
The patients had elevated levels of p16INK4a, a known marker of cellular senescence.
Auto-HSCT in particular had a strong effect on p16INK4a, increasing the expression of this marker to a degree comparable to 30 years of chronological aging.
Researchers reported these findings in EBioMedicine.
“We know that transplant is life-prolonging, and, in many cases, it’s life-saving for many patients with blood cancers and other disorders,” said study author William Wood, MD, of the University of North Carolina School of Medicine in Chapel Hill.
“At the same time, we’re increasingly recognizing that survivors of transplant are at risk for long-term health problems, and so there is interest in determining what markers may exist to help predict risk for long-term health problems or even in helping choose which patients are best candidates for transplantation.”
With this in mind, Dr Wood and his colleagues looked at levels of p16INK4a in 63 patients who underwent auto- or allo-HSCT to treat myeloma, lymphoma, or leukemia. The researchers assessed p16INK4a expression in T cells before HSCT and 6 months after.
Among auto-HSCT recipients, there were no baseline characteristics associated with pre-transplant p16INK4a expression.
However, allo-HSCT recipients had significantly higher pre-transplant p16INK4a levels the more cycles of chemotherapy they received before transplant (P=0.003), if they had previously undergone auto-HSCT (P=0.01), and if they had been exposed to alkylating agents (P=0.01).
After transplant, allo-HSCT recipients had a 1.93-fold increase in p16INK4a expression (P=0.0004), and auto-HSCT recipients had a 3.05-fold increase (P=0.002).
The researchers said the measured change in p16INK4a from pre- to post-HSCT in allogeneic recipients likely underestimates the age-promoting effects of HSCT, given that the pre-HSCT levels were elevated in the recipients from prior therapeutic exposure.
The researchers also pointed out that this study does not show a clear connection between changes in p16INK4a levels and the actual function of peripheral blood T cells, but they did say that p16INK4a is “arguably one of the best in vivo markers of cellular senescence and is directly associated with age-related deterioration.”
So the results of this research suggest the forced bone marrow repopulation associated with HSCT accelerates the molecular aging of peripheral blood T cells.
“Many oncologists would not be surprised by the finding that stem cell transplant accelerates aspects of aging,” said study author Norman Sharpless, MD, of the University of North Carolina School of Medicine.
“We know that, years after a curative transplant, stem cell transplant survivors are at increased risk for blood problems that can occur with aging, such as reduced immunity, increased risk for bone marrow failure, and increased risk of blood cancers. What is important about this work, however, is that it allows us to quantify the effect of stem cell transplant on molecular age.” ![]()
Why and How ACOs Must Evolve
The Centers for Medicare & Medicaid Services (CMS) triumphantly announced in January 2016 that 121 new participants had joined 1 of its 3 accountable care organization (ACO) programs, and that the various ACOs had together saved the federal government $411 million in 2014 while improving on various quality metrics.[1] Yet even as the ACO model has gathered political momentum and shown promise in reducing payer spending in the short term, it is facing growing scrutiny that it may be insufficient to support meaningful care delivery transformation.
Different ACO models differ in their financial details, but the fundamental theme is the same: healthcare organizations earn bonuses, or shared savings, if they bill payers less than their projected fee‐for‐service revenue (known as the spending benchmark) and meet quality measures. In double‐sided ACO models, if fee‐for‐service revenue exceeds the benchmark, ACOs are also fined. In contrast with traditional fee‐for‐service, in which payments are tied directly to price and volume of services, ACOs were envisioned as a business model that would enable health systems to thrive by improving the care efficiency and clinical outcomes of their patient populations.
However, because health systems only earn shared savings bonuses if they reduce their fee‐for‐service revenue, ACOs do not have a clear business case for moving toward value‐oriented care. ThedaCare, the best performing Pioneer ACO in the first year of the program, reported that successful reduction of preventable hospital admissions led to shared savings payments. However, those payments did not cover the reduced fee‐for‐service revenue, leading to diminished overall financial performance.[2] Only 5% of the 434 Shared Savings Program ACOs have agreed to double‐sided contracts, suggesting discomfort with the structure of the model.[1] Although ACOs have continued to grow in overall number, the programs have experienced significant churn, with over two thirds of Pioneer ACOs leaving over the last 3 years. This suggests widespread commitment to the principle of population health but a struggle by health systems to make the specific models financially viable.[3]
How can payers reshape the ACO model to better support value‐oriented care delivery transformation while maintaining its key cost control elements? One strategy is for CMS to establish a pathway for adding care delivery interventions to the fee‐for‐service schedule for ACOs, a concept we call population health billing. Payers have shown some interest in supporting population health efforts via fee‐for‐service: for example, in 2015 CMS established the chronic care management fee, which pays a per patient per month fee for care coordination of Medicare beneficiaries with 2 or more chronic conditions, and the transitional care management fee, which reimburses a postdischarge office visit focused on managing a patient's transition out of the hospital.[4] UnitedHealthcare has begun reimbursing virtual physician visits for some self‐insured employers.[5]
These isolated efforts should be rolled up into a systematic pathway for population health interventions to become billable under fee‐for‐service for organizations in Medicare ACO contracts. CMS and institutional provider associations, whose technical committees generate the majority of billing codes, could together adopt a formal set of criteria to grade the evidence basis of population health interventions in terms of their impact on clinical outcomes, care quality, and care value, similar to the National Quality Forum's work with quality metrics, and establish a formal process by which interventions with demonstrated efficacy can be assigned billing values in a timely, rigorous, and transparent manner. Candidates for population health billing codes could include high‐risk case management, virtual visits, and home‐based primary care. ACOs would be free to determine which, if any, particular interventions to adopt.
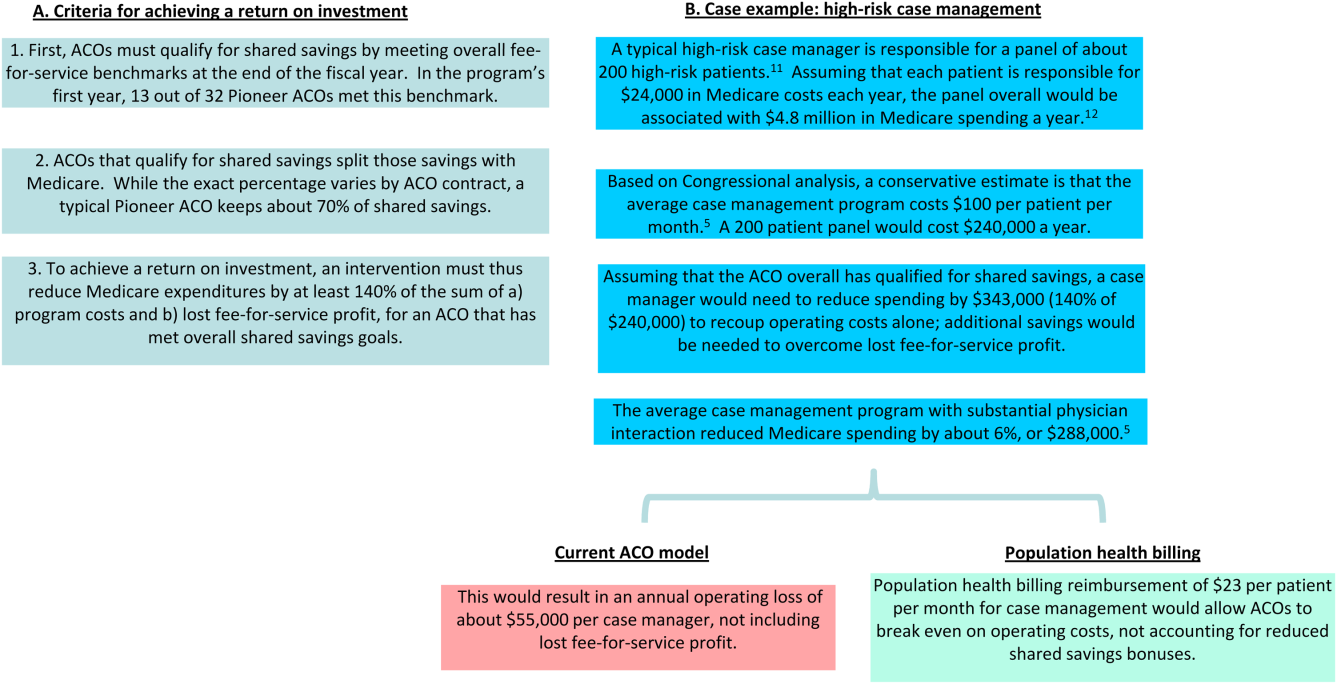
ACOs must currently invest in population health programs with out‐of‐pocket funds and bet that reductions in preventable healthcare utilization result in sufficient shared savings to compensate for both program costs and lost fee‐for‐service profit. Even clinically successful programs are often unable to reach this high threshold.[6] A recent New England Journal of Medicine article lamented a common theme among studies of population health interventions: clinical success, but financial unsustainability.[7] CMS' Comprehensive Primary Care Initiative, which provides about 500 primary care practices with case management fees to redesign their care delivery, resulted in a reduced volume of primary care visits and improved patient communication but no cost savings to Medicare after accounting for program fees (14). Congressional analysis found that although case management programs with substantial physician interaction reduced Medicare expenditures by an average of 6%, only 1 out of 34 programs achieved statistically significant savings to Medicare relative to their program fees alone.[8] E‐consults, when a specialist physician provides recommendations to a primary doctor by reviewing a patient's chart electronically, are associated with decreased wait times, high primary provider satisfaction, and lower costs compared to traditional care, yet adoption among ACOs has been limited by the opportunity cost of fee‐for‐service revenue.[9] In reducing Medicare costs and hence their own fee‐for‐service revenue by $300 million in their first year, Pioneer ACOs were only collectively granted bonuses of about $77 million against the significant operating and capital costs of population health.[10] The financial challenges of ACOs are a reflection of the difficulty in consistently developing a fiscally and clinically successful set of population health interventions under current ACO financial rules.
In Figure 1, we use high‐risk case management as an example to demonstrate how population billing could work. Population health billing could provide a per patient, per month fee‐for‐service payment to ACOs for high‐risk case management services. This payment would count against ACOs' spending benchmarks at the end of the year. By helping cover the operating costs of these programs, population health billing would make value‐oriented interventions significantly more sustainable compared to the current ACO models.

In providing fee‐for‐service revenue for population health interventions, population health billing would break the inherent tension between fee‐for‐service and shared savings bonuses. It would allow ACOs to transition ever‐greater portions of revenue from traditional transactional‐based sources toward shared savings, without requiring success in accountable care to mean fee‐for‐service losses. This is an important threshold for operational leaders who must integrate population health, which currently represent loss centers on balance sheets, within existing profitable fee‐for‐service business lines.
Some observers may argue that allowing billable care delivery interventions may encourage practices to roll out interventions that meet billing requirements but have little meaningful impact on population health; the efficacy of care delivery interventions is clearly dependent on the context of the health system and quality of execution. This concern is the same fundamental concern of fee‐for‐service reimbursement as a whole. However, because ACOs are paid bonuses for reducing fee‐for‐service revenue, they would have an incentive to only develop and bill for population health interventions they believe would have a meaningful return on investment in reducing healthcare costs. The fundamental incentives of ACOs would remain the same‐ to reduce healthcare spending by better managing the costs of their patient populations. Others may argue that population health billing would build upon our fee‐for‐service system that many have advocated we must move past. But ACO initiatives and bundled payments are similarly built upon a foundation of fee‐for‐service.
Whereas a greater number of billable services will likely reduce CMS' short‐term savings from ACO programs, the ACO model must offer a sustainable business case for care delivery reform to ultimately bend long‐term healthcare costs. Payers are not obligated to ensure that providers maintain historical income levels, but over the long term providers will not make the sizable infrastructure investments, such as integrated information technology platforms, data analytics, and risk management, required to deliver value‐based care without a sustainable business case. To limit the costs of population health billing, Medicare should restrict it to ACO contracts that allow for penalties. The fee‐for‐service reimbursement rates under population health billing could also be tied to performance on quality metrics, similar to how Medicare fee‐for‐service hospital reimbursement is linked to performance on value‐based metrics.[13]
In addition, this reduction in short‐term cost savings may actually improve the sustainability of the ACO model. Every year, each ACO's spending benchmark is re‐based, or recalculated based on the most recent spending data. This means that ACOs that successfully reduce their fee‐for‐service revenue below their spending benchmark will face an even lower benchmark the next year and have to reduce their costs even further, creating an unsustainable trend. Because population health billing would count against the spending benchmark, it would help slow down this race to the bottom while driving forward value‐oriented care delivery transformation.
ACOs have a number of other design problems, including high rates of patient churn, imperfect quality metrics that do not adequately capture the scope of population‐level health, and lags in data access.[14] The Next Generation ACO model addresses some of these concerns. For example, it allows ACOs to prospectively define their patient populations. Yet many challenges remain. Population health billing does not solve all of these problems, but it will improve the ability of health systems to meaningfully pivot toward a value‐oriented strategy.
As physicians and ACO operational leaders, we believe in the clinical and policy vision behind the ACO model but have also struggled with the limitations of the model to meaningfully support care delivery transformation. If CMS truly wants to meaningfully transform US healthcare from volume‐based to value‐based, it must invest in the needed care redesign even at the expense of short‐term cost savings.
Disclosures: Dr. Chen was formerly a consultant for Partners HealthCare, a Pioneer ACO, and a physician fellow on the Pioneer ACO Team at the Center for Medicare & Medicaid Innovation. He currently serves on the advisory board of Radial Analytics and is a resident physician at Massachusetts General Hospital. Dr. Ackerly was formerly the associate medical director for Population Health and Continuing Care at Partners HealthCare and an Innovation Advisor to the Center for Medicare & Medicaid Innovation. He currently serves as the Chief Clinical Officer of naviHealth. Dr. Gottlieb was formerly the President and Chief Executive Officer of Partners HealthCare and currently serves as the Chief Executive Officer of Partners In Health. The views represented here are those of the authors' and do not represent the views of Partners HealthCare, Massachusetts General Hospital, naviHealth, or Partners In Health.
- U.S. Department of Health 310:1341–1342.
- , , , . Performance differences in year 1 of the Pioneer accountable care organizations. N Engl J Med. 2015;372:1927–1936.
- , , , , . Medicare chronic care management payments and financial returns to primary care practice: a modeling study. Ann Intern Med. 2015;163:580–588.
- UnitedHealthcare. UnitedHealthcare covers virtual care physician visits, expanding consumers' access to affordable health care options. Available at: http://www.uhc.com/news‐room/2015‐news‐release‐archive/unitedhealthcare‐covers‐virtual‐care‐physician‐visits. Published April 30, 2015. Accessed February 6, 2016.
- , , . Toward increased adoption of complex care management. N Engl J Med. 2014;371:491–493.
- , , . Asymmetric thinking about return on investment. N Engl J Med. 2016;374(7):606–608.
- . Lessons from Medicare's demonstration projects on disease management and care coordination. Washington, D.C.: Congressional Budget Office, Health and Human Resources Division, working paper 2012‐01, 2012. Available at: http://www.cbo.gov/sites/default/files/cbofiles/attachments/WP2012‐01_Nelson_Medicare_DMCC_Demonstrations.pdf. Published January 2012. Accessed June 15, 2015.
- , , , . A safety‐net system gains efficiencies through ‘eReferrals’ to specialists. Health Aff (Millwood). 2010;29:969–971.
- Centers for Medicare MGH Medicare Demonstration Project for High-Cost Beneficiaries. Available at: http://www.massgeneral.org/News/assets/pdf/CMS_project_phase1FactSheet.pdf. Accessed April 2, 2016.
- , , , et al. Two-Year Costs and Quality in the Comprehensive Primary Care Initiative. N Engl J Med. 2016; DOI: 10.1056/NEJMsa1414953.
- , . Beyond ACOs and bundled payments: Medicare's shift toward accountability in fee‐for‐service. JAMA. 2014;311:673–674.
- , , , , . ACO model should encourage efficient care delivery. Healthc (Amst). 2015;3(3):150–152.
The Centers for Medicare & Medicaid Services (CMS) triumphantly announced in January 2016 that 121 new participants had joined 1 of its 3 accountable care organization (ACO) programs, and that the various ACOs had together saved the federal government $411 million in 2014 while improving on various quality metrics.[1] Yet even as the ACO model has gathered political momentum and shown promise in reducing payer spending in the short term, it is facing growing scrutiny that it may be insufficient to support meaningful care delivery transformation.
Different ACO models differ in their financial details, but the fundamental theme is the same: healthcare organizations earn bonuses, or shared savings, if they bill payers less than their projected fee‐for‐service revenue (known as the spending benchmark) and meet quality measures. In double‐sided ACO models, if fee‐for‐service revenue exceeds the benchmark, ACOs are also fined. In contrast with traditional fee‐for‐service, in which payments are tied directly to price and volume of services, ACOs were envisioned as a business model that would enable health systems to thrive by improving the care efficiency and clinical outcomes of their patient populations.
However, because health systems only earn shared savings bonuses if they reduce their fee‐for‐service revenue, ACOs do not have a clear business case for moving toward value‐oriented care. ThedaCare, the best performing Pioneer ACO in the first year of the program, reported that successful reduction of preventable hospital admissions led to shared savings payments. However, those payments did not cover the reduced fee‐for‐service revenue, leading to diminished overall financial performance.[2] Only 5% of the 434 Shared Savings Program ACOs have agreed to double‐sided contracts, suggesting discomfort with the structure of the model.[1] Although ACOs have continued to grow in overall number, the programs have experienced significant churn, with over two thirds of Pioneer ACOs leaving over the last 3 years. This suggests widespread commitment to the principle of population health but a struggle by health systems to make the specific models financially viable.[3]
How can payers reshape the ACO model to better support value‐oriented care delivery transformation while maintaining its key cost control elements? One strategy is for CMS to establish a pathway for adding care delivery interventions to the fee‐for‐service schedule for ACOs, a concept we call population health billing. Payers have shown some interest in supporting population health efforts via fee‐for‐service: for example, in 2015 CMS established the chronic care management fee, which pays a per patient per month fee for care coordination of Medicare beneficiaries with 2 or more chronic conditions, and the transitional care management fee, which reimburses a postdischarge office visit focused on managing a patient's transition out of the hospital.[4] UnitedHealthcare has begun reimbursing virtual physician visits for some self‐insured employers.[5]
These isolated efforts should be rolled up into a systematic pathway for population health interventions to become billable under fee‐for‐service for organizations in Medicare ACO contracts. CMS and institutional provider associations, whose technical committees generate the majority of billing codes, could together adopt a formal set of criteria to grade the evidence basis of population health interventions in terms of their impact on clinical outcomes, care quality, and care value, similar to the National Quality Forum's work with quality metrics, and establish a formal process by which interventions with demonstrated efficacy can be assigned billing values in a timely, rigorous, and transparent manner. Candidates for population health billing codes could include high‐risk case management, virtual visits, and home‐based primary care. ACOs would be free to determine which, if any, particular interventions to adopt.
ACOs must currently invest in population health programs with out‐of‐pocket funds and bet that reductions in preventable healthcare utilization result in sufficient shared savings to compensate for both program costs and lost fee‐for‐service profit. Even clinically successful programs are often unable to reach this high threshold.[6] A recent New England Journal of Medicine article lamented a common theme among studies of population health interventions: clinical success, but financial unsustainability.[7] CMS' Comprehensive Primary Care Initiative, which provides about 500 primary care practices with case management fees to redesign their care delivery, resulted in a reduced volume of primary care visits and improved patient communication but no cost savings to Medicare after accounting for program fees (14). Congressional analysis found that although case management programs with substantial physician interaction reduced Medicare expenditures by an average of 6%, only 1 out of 34 programs achieved statistically significant savings to Medicare relative to their program fees alone.[8] E‐consults, when a specialist physician provides recommendations to a primary doctor by reviewing a patient's chart electronically, are associated with decreased wait times, high primary provider satisfaction, and lower costs compared to traditional care, yet adoption among ACOs has been limited by the opportunity cost of fee‐for‐service revenue.[9] In reducing Medicare costs and hence their own fee‐for‐service revenue by $300 million in their first year, Pioneer ACOs were only collectively granted bonuses of about $77 million against the significant operating and capital costs of population health.[10] The financial challenges of ACOs are a reflection of the difficulty in consistently developing a fiscally and clinically successful set of population health interventions under current ACO financial rules.
In Figure 1, we use high‐risk case management as an example to demonstrate how population billing could work. Population health billing could provide a per patient, per month fee‐for‐service payment to ACOs for high‐risk case management services. This payment would count against ACOs' spending benchmarks at the end of the year. By helping cover the operating costs of these programs, population health billing would make value‐oriented interventions significantly more sustainable compared to the current ACO models.
In providing fee‐for‐service revenue for population health interventions, population health billing would break the inherent tension between fee‐for‐service and shared savings bonuses. It would allow ACOs to transition ever‐greater portions of revenue from traditional transactional‐based sources toward shared savings, without requiring success in accountable care to mean fee‐for‐service losses. This is an important threshold for operational leaders who must integrate population health, which currently represent loss centers on balance sheets, within existing profitable fee‐for‐service business lines.
Some observers may argue that allowing billable care delivery interventions may encourage practices to roll out interventions that meet billing requirements but have little meaningful impact on population health; the efficacy of care delivery interventions is clearly dependent on the context of the health system and quality of execution. This concern is the same fundamental concern of fee‐for‐service reimbursement as a whole. However, because ACOs are paid bonuses for reducing fee‐for‐service revenue, they would have an incentive to only develop and bill for population health interventions they believe would have a meaningful return on investment in reducing healthcare costs. The fundamental incentives of ACOs would remain the same‐ to reduce healthcare spending by better managing the costs of their patient populations. Others may argue that population health billing would build upon our fee‐for‐service system that many have advocated we must move past. But ACO initiatives and bundled payments are similarly built upon a foundation of fee‐for‐service.
Whereas a greater number of billable services will likely reduce CMS' short‐term savings from ACO programs, the ACO model must offer a sustainable business case for care delivery reform to ultimately bend long‐term healthcare costs. Payers are not obligated to ensure that providers maintain historical income levels, but over the long term providers will not make the sizable infrastructure investments, such as integrated information technology platforms, data analytics, and risk management, required to deliver value‐based care without a sustainable business case. To limit the costs of population health billing, Medicare should restrict it to ACO contracts that allow for penalties. The fee‐for‐service reimbursement rates under population health billing could also be tied to performance on quality metrics, similar to how Medicare fee‐for‐service hospital reimbursement is linked to performance on value‐based metrics.[13]
In addition, this reduction in short‐term cost savings may actually improve the sustainability of the ACO model. Every year, each ACO's spending benchmark is re‐based, or recalculated based on the most recent spending data. This means that ACOs that successfully reduce their fee‐for‐service revenue below their spending benchmark will face an even lower benchmark the next year and have to reduce their costs even further, creating an unsustainable trend. Because population health billing would count against the spending benchmark, it would help slow down this race to the bottom while driving forward value‐oriented care delivery transformation.
ACOs have a number of other design problems, including high rates of patient churn, imperfect quality metrics that do not adequately capture the scope of population‐level health, and lags in data access.[14] The Next Generation ACO model addresses some of these concerns. For example, it allows ACOs to prospectively define their patient populations. Yet many challenges remain. Population health billing does not solve all of these problems, but it will improve the ability of health systems to meaningfully pivot toward a value‐oriented strategy.
As physicians and ACO operational leaders, we believe in the clinical and policy vision behind the ACO model but have also struggled with the limitations of the model to meaningfully support care delivery transformation. If CMS truly wants to meaningfully transform US healthcare from volume‐based to value‐based, it must invest in the needed care redesign even at the expense of short‐term cost savings.
Disclosures: Dr. Chen was formerly a consultant for Partners HealthCare, a Pioneer ACO, and a physician fellow on the Pioneer ACO Team at the Center for Medicare & Medicaid Innovation. He currently serves on the advisory board of Radial Analytics and is a resident physician at Massachusetts General Hospital. Dr. Ackerly was formerly the associate medical director for Population Health and Continuing Care at Partners HealthCare and an Innovation Advisor to the Center for Medicare & Medicaid Innovation. He currently serves as the Chief Clinical Officer of naviHealth. Dr. Gottlieb was formerly the President and Chief Executive Officer of Partners HealthCare and currently serves as the Chief Executive Officer of Partners In Health. The views represented here are those of the authors' and do not represent the views of Partners HealthCare, Massachusetts General Hospital, naviHealth, or Partners In Health.
- U.S. Department of Health 310:1341–1342.
- , , , . Performance differences in year 1 of the Pioneer accountable care organizations. N Engl J Med. 2015;372:1927–1936.
- , , , , . Medicare chronic care management payments and financial returns to primary care practice: a modeling study. Ann Intern Med. 2015;163:580–588.
- UnitedHealthcare. UnitedHealthcare covers virtual care physician visits, expanding consumers' access to affordable health care options. Available at: http://www.uhc.com/news‐room/2015‐news‐release‐archive/unitedhealthcare‐covers‐virtual‐care‐physician‐visits. Published April 30, 2015. Accessed February 6, 2016.
- , , . Toward increased adoption of complex care management. N Engl J Med. 2014;371:491–493.
- , , . Asymmetric thinking about return on investment. N Engl J Med. 2016;374(7):606–608.
- . Lessons from Medicare's demonstration projects on disease management and care coordination. Washington, D.C.: Congressional Budget Office, Health and Human Resources Division, working paper 2012‐01, 2012. Available at: http://www.cbo.gov/sites/default/files/cbofiles/attachments/WP2012‐01_Nelson_Medicare_DMCC_Demonstrations.pdf. Published January 2012. Accessed June 15, 2015.
- , , , . A safety‐net system gains efficiencies through ‘eReferrals’ to specialists. Health Aff (Millwood). 2010;29:969–971.
- Centers for Medicare MGH Medicare Demonstration Project for High-Cost Beneficiaries. Available at: http://www.massgeneral.org/News/assets/pdf/CMS_project_phase1FactSheet.pdf. Accessed April 2, 2016.
- , , , et al. Two-Year Costs and Quality in the Comprehensive Primary Care Initiative. N Engl J Med. 2016; DOI: 10.1056/NEJMsa1414953.
- , . Beyond ACOs and bundled payments: Medicare's shift toward accountability in fee‐for‐service. JAMA. 2014;311:673–674.
- , , , , . ACO model should encourage efficient care delivery. Healthc (Amst). 2015;3(3):150–152.
Post-Discharge Methicillin-Resistant Staphylococcus aureus Infections: Epidemiology and Potential Approaches to Control
From the Division of Adult Infectious Diseases, University of Colorado Denver, Aurora, CO, and the Department of Veterans Affairs, Eastern Colorado Healthcare System, Denver, CO.
Abstract
- Objective: To review the published literature on methicillin-resistant Staphylococcus aureus (MRSA) infections among patients recently discharged from hospital, with a focus on possible prevention measures.
- Methods: Literature review.
- Results: MRSA is a major cause of post-discharge infections. Risk factors for post-discharge MRSA include colonization, dependent ambulatory status, duration of hospitalization > 5 days, discharge to a long-term care facility, presence of a central venous catheter (CVC), presence of a non-CVC invasive device, a chronic wound in the post-discharge period, hemodialysis, systemic corticosteroids, and receiving anti-MRSA antimicrobial agents. Potential approaches to control include prevention of incident colonization during hospital stay, removal of nonessential CVCs and other devices, good wound debridement and care, and antimicrobial stewardship. Hand hygiene and environmental cleaning are horizontal measures that are also recommended. Decolonization may be useful in selected cases.
- Conclusion: Post-discharge MRSA infections are an important and underestimated source of morbidity and mortality. The future research agenda should include identification of post-discharge patients who are most likely to benefit from decolonization strategies, and testing those strategies.
Methicillin-resistant Staphylococcus aureus (MRSA) is a leading cause of morbidity and mortality due to infections of the bloodstream, lung, surgical sites, bone, and skin and soft tissues. The mortality associated with S. aureus bloodstream infections is 14% to 45% [1–4]. A bloodstream infection caused by MRSA is associated with a twofold increased mortality as compared to one caused by methicillin-sensitive S. aureus [5]. MRSA pneumonia carries a mortality of 8%, which increases to 39% when bacteremia is also present [6]. S. aureus bloodstream infection also carries a high risk of functional disability, with 65% of patients in a recent series requiring nursing home care in the recovery period [7]. In 2011 there were more than 11,000 deaths due to invasive MRSA infection in the United States [8]. Clearly S. aureus, and particularly MRSA, is a pathogen of major clinical significance.
Methicillin resistance was described in 1961, soon after methicillin became available in the 1950s. Prevalence of MRSA remained low until the 1980s, when it rapidly increased in health care settings. The predominant health care–associated strain in the United States is USA100, a member of clonal complex 5. Community-acquired MRSA infection has garnered much attention since it was recognized in 1996 [9]. The predominant community-associated strain has been USA300, a member of clonal complex 8 [10]. Following its emergence in the community, USA300 became a significant health care–associated pathogen as well [11]. The larger share of MRSA disease remains health care–associated [8]. The most recent data from the Center for Disease Control and Prevention Active Bacterial Core Surveillance system indicate that 77.6% of invasive MRSA infection is health care–associated, resulting in 9127 deaths in 2011 [8].
This article reviews the published literature on MRSA infections among patients recently discharged from hospital, with a focus on possible prevention measures.
MRSA Epidemiologic Categories
Epidemiologic investigations of MRSA categorize infections according to the presumed acquisition site, ie, in the community or in a health care setting. Older literature refers to nosocomial MRSA infection, which is now commonly referred to as hospital-onset health care–associated (HO-HCA) MRSA. A common definition of HO-HCA MRSA infection is an infection with the first positive culture on hospital day 4 or later [12]. Community-onset health care–associated MRSA (CO-HCA MRSA) is defined as infection that is diagnosed in the outpatient setting, or prior to day 4 of hospitalization, in a patient with recent health care exposure, eg, hospitalization within the past year, hemodialysis, surgery, or presence of a central venous catheter at time of presentation to the hospital [12]. Community-associated MRSA (CA-MSRSA) is infection in patients who do not meet criteria for either type of health care associated MRSA. Post-discharge MRSA infections would be included in the CO-HCA MRSA group.
Infection Control Programs
Classic infection control programs, developed in the 1960s, focused on infections that presented more than 48 to 72 hours after admission and prior to discharge from hospital. In that era, the average length of hospital stay was 1 week or more, and there was sufficient time for health care–associated infections to become clinically apparent. In recent years, length of stay has progressively shortened [13]. As hospital stays shortened, the risk that an infection caused by a health care–acquired pathogen would be identified after discharge grew. More recent studies have documented that the majority of HO-HCA infections become apparent after the index hospitalization [8,14].
Data from the Active Bacterial Core Surveillance System quantify the burden of CO-HCA MRSA disease at a national level [8,14]. However, it is not readily detected by many hospital infection surveillance programs. Avery et al studied a database constructed with California state mandated reports of MRSA infection and identified cases with MRSA present on admission. They then searched for a previous admission, within 30 days. If a prior admission was identified, the MRSA case was assigned to the hospital that had recently discharged the patient. Using this approach, they found that the incidence of health care–associated MRSA infection increased from 12.2 cases/10,000 admissions when traditional surveillance methods were used to 35.7/10,000 admissions using the revised method of assignment of health care exposure [15]. These data suggest that post-discharge MRSA disease is underappreciated by hospital infection control programs.
Lessons from Hospital-Onset MRSA
The morbidity and mortality associated with MRSA have led to the development of vigorous infection control programs to reduce the risk of health care–associated MRSA infection [16–18]. Vertical infection control strategies, ie, those focused on MRSA specifically, have included active screening for colonization, and nursing colonized patients in contact precautions. Since colonization is the antecedent to infection in most cases, prevention of transmission of MRSA from patient to patient should prevent most infections. There is ample evidence that colonized patients contaminate their immediate environment with MRSA, creating a reservoir of resistant pathogens that can be transmitted to other patients on the hands and clothing of health care workers [19,20]. Quasi-experimental studies of active screening and isolation strategies have shown decreases in MRSA transmission and infection following implementation [18]. The only randomized comparative trial of active screening and isolation versus usual care did not demonstrate benefit, possibly due to delays in lab confirmation of colonization status [21]. Horizontal infection control strategies are applied to all patients, regardless of colonization with resistant pathogens, in an attempt to decrease health care–associated infections with all pathogens. Examples of horizontal strategies are hand hygiene, environmental cleaning, and the prevention bundles for central line–associated bloodstream infection.
The Burden of Community-Onset MRSA
CO-HCA MRSA represents 60% of the burden of invasive MRSA infection [8]. While this category includes cases that have not been hospitalized, eg, patients on hemodialysis, post-discharge MRSA infection accounts for the majority of cases [15]. Recent data indicate that the incidence of HO-HCA MRSA decreased 54.2% between 2005 and 2011 [8]. This decrease in HO-HCA MRSA infection occurred concurrently with widespread implementation of vigorous horizontal infection control measures, such as bundled prevention strategies for central line–associated bloodstream infection and ventilator-associated pneumonia. The decline in CO-HCA MRSA infection has been much less steep, at 27.7%. The majority of the CO-HCA infections are in post-discharge patients. Furthermore, the incidence of CO-HCA MRSA infection may be underestimated [15].
Post-Discharge MRSA Colonization and Infection
Hospital-associated MRSA infection is reportable in many jurisdictions, but post-discharge MRSA infection is not a specific reportable condition, limiting the available surveillance data. Avery et al [15] studied ICD-9 code data for all hospitals in Orange County, California, and found that 23.5/10,000 hospital admissions were associated with a post-discharge MRSA infection. This nearly tripled the incidence of health care–associated MRSA infection, compared to surveillance that included only hospital-onset cases. Future research should refine these observations, as ICD-9 code data correlate imperfectly with chart reviews and have not yet been well validated for MRSA research.
The CDC estimated that in 2011 there were 48,353 CO-HCA MRSA infections resulting in 10,934 deaths. This estimate is derived from study of the Active Bacterial Core surveillance sample [8]. In that sample, 79% of CO-HCA MRSA infections occurred in patients hospitalized within the last year. Thus, we can estimate that there were 34,249 post-discharge MRSA infections resulting in 8638 deaths in the United States in 2011.
MRSA colonization is the antecedent to infection in the majority of cases [22]. Thus we can assess the health care burden of post-discharge MRSA by analyzing colonization as well as infection. Furthermore, the risk of MRSA colonization of household members can be addressed. Lucet et al evaluated hospital inpatients preparing for discharge to a home health care setting, and found that 12.7% of them were colonized with MRSA at the time of discharge, and 45% of them remained colonized for more than a year [23]. Patients who regained independence in activities of daily living were more likely to become free of MRSA colonization. The study provided no data on the risk of MRSA infection in the colonized patients. 19.1% of household contacts became colonized with MRSA, demonstrating that the burden of MRSA extends beyond the index patient. None of the colonized household contacts developed MRSA infection during the study period.
Risk Factors for Post-Discharge MRSA
Case control studies of patients with post-discharge invasive MRSA have shed light on risk factors for infection. While many risk factors are not modifiable, these studies may provide a road map to development of prevention strategies for the post-discharge setting. A study of hospitals in New York that participated in the Active Bacterial Core surveillance system identified a statistically significant increased risk of MRSA invasive infection among patients with several factors associated with physical disability, including a physical therapy evaluation, dependent ambulatory status, duration of hospitalization > 5 days, and discharge to a long-term care facility. Additional risk factors identified in the bivariate analysis were presence of a central venous catheter, hemodialysis, systemic corticosteroids, and receiving anti-MRSA antimicrobial agents. When subjected to multivariate analysis, however, the most significant and potent risk factor was a previous positive MRSA clinical culture (matched odds ratio 23, P < 0.001). Other significant risk factors in the multivariate analysis were hemodialysis, presence of a central venous catheter in the outpatient setting, and a visit to the emergency department [24]. A second, larger, multistate study also based on data from the Active Bacterial Core surveillance system showed that 5 risk factors were significantly associated with post-discharge invasive MRSA infection: (1) MRSA colonization, (2) a central venous catheter (CVC) present at discharge, (3) presence of a non-CVC invasive device, (4) a chronic wound in the post-discharge period, and (5) discharge to a nursing home. MRSA colonization was associated with a 7.7-fold increased odds of invasive MRSA infection, a much greater increase than any of the other risk factors [25]. Based on these results, strategies to consider include enhanced infection measures for prevention of incident MRSA colonization in the inpatient setting, decolonization therapy for those who become colonized, removal of non-essential medical devices, including central venous catheters, excellent nursing care for essential devices and wounds, hand hygiene, environmental cleaning, and antimicrobial stewardship.
Development of Strategies to Decrease Post-Discharge MRSA
While the epidemiology of post-discharge health care–associated MRSA infections has become a topic of interest to researchers, approaches to control are in their infancy. Few of the approaches have been subjected to rigorous study in the post-discharge environment. Nevertheless, some low risk, common sense strategies may be considered. Furthermore, an outline of research objectives may be constructed.
Prevention of Colonization in the Inpatient Setting
Robust infection control measures must be implemented in inpatient settings to prevent incident MRSA colonization [16,17]. Key recommendations include surveillance and monitoring of MRSA infections, adherence to standard hand hygiene guidance, environmental cleanliness, and use of dedicated equipment for patients who are colonized or infected with MRSA. Active screening for asymptomatic MRSA carriage and isolation of carriers may be implemented if routine measures are not successful.
Decolonization
Despite the best infection control programs, some patients will be colonized with MRSA at the time of hospital discharge. As detailed above, MRSA colonization is a potent risk factor for infection in the post-discharge setting, as well as in hospital inpatients [22]. A logical approach to this would be to attempt to eradicate colonization. There are several strategies for decolonization therapy, which may be used alone or in combination, including nasal mupirocin, nasal povidone-iodine, systemic antistaphylococcal drugs alone or in combination with oral rifampin, chlorhexidine bathing, or bleach baths [26–29].
A preliminary step in approaching the idea of post-discharge decolonization therapy is to show that patients can be successfully decolonized. With those data in hand, randomized trials seeking to demonstrate a decrease in invasive MRSA infections can be planned. Decolonization using nasal mupirocin has an initial success rate of 60% to 100% in a variety of patient populations [30–35]. Poor adherence to the decolonization protocol may limit success in the outpatient setting. Patients are more likely to resolve their MRSA colonization spontaneously when they regain their general health and independence in activities of daily living [23]. Colonization of other household members may provide a reservoir of MRSA leading to recolonization of the index case. Treatment of the household members may be offered, to provide more durable maintenance of the decolonized state [35]. When chronically ill patients who have been decolonized are followed longitudinally, up to 39% become colonized again, most often with the same strain [30,31]. Attempts to maintain a MRSA-free state in nursing home residents using prolonged mupirocin therapy resulted in emergence of mupirocin resistance [31]. Thus decolonization can be achieved, but is difficult to maintain, especially in debilitated, chronically ill patients. Mupirocin resistance can occur, limiting success of decolonization therapies.
Successful decolonization has been proven to reduce the risk of MRSA infection in the perioperative, dialysis, and intensive care unit settings [33,36–38]. In dialysis patients the risk of S. aureus bloodstream infection, including MRSA, can be reduced 59% with the use of mupirocin decolonization of the nares, with or without treatment of dialysis access exit sites [37]. A placebo-controlled trial demonstrated that decolonization of the nares with mupirocin reduced surgical site infections with S. aureus. All S. aureus isolates in the study were methicillin-susceptible. A second randomized controlled trial of nasal mupirocin did not achieve a statistically significant decrease in S. aureus surgical site infections, but it showed that mupirocin decolonization therapy decreased nosocomial S. aureus infections among nasal carriers [33]. 99.2% of isolates in that study et al were methicillin-susceptible. Quasi-experimental studies have shown similar benefits for surgical patients who are colonized with MRSA [39–41]. A more recent randomized trial, in ICU patients, demonstrated decreased incidence of invasive infection in patients treated with nasal mupirocin and chlorhexidine baths [38]. The common themeof these studies is that they enrolled patients who had a short-term condition, eg, surgery or critical illness, placing them at high risk for invasive MRSA infection. This maximizes the potential benefit of decolonization and minimizes the risk of emergence of resistance. Furthermore, adherence to decolonization protocols is likely to be high in the perioperative and ICU settings. To extrapolate the ICU and perioperative data to the post-discharge setting would be imprudent.
In summary, decolonization may be a useful strategy to reduce invasive MRSA infection in post-discharge patients, but more data are needed for most patient populations. The evidence for decolonization therapy is strongest for dialysis patients, in whom implementation of routine decolonization of MRSA colonized nares is a useful intervention [37]. There are not yet clinical trials of decolonization therapy in patients at time of hospital discharge showing a reduction in invasive MRSA infection. Decolonization strategies have important drawbacks, including emergence of resistance to mupirocin, chlorhexidine, and systemic agents. Furthermore, there is a risk of hypersensitivity reactions, Clostridium difficile infection, and potential for negative impacts onthe normal microbiome. The potential for lesser efficacy in a chronically ill outpatient population must also be considered in the post-discharge setting. Randomized controlled trials with invasive infection outcomes should be performed prior to implementing routine decolonization therapy of hospital discharge patients.
Care of Invasive Devices
Discharge with a central venous catheter was associated with a 2.16-fold increased risk of invasive MRSA infection; other invasive devices were associated with a 3.03-fold increased risk [25]. Clinicians must carefully assess patients nearing discharge for any opportunity to remove invasive devices. Idle devices have been reported in inpatient settings [42] and could occur in other settings. Antimicrobial therapy is a common indication for an outpatient central venous catheter and can also be associated with increased risk of invasive MRSA infection [25,43]. Duration and route of administration of antimicrobial agents should be carefully considered, with an eye to switching to oral therapy whenever possible. When a central venous catheter must be utilized, it should be maintained as carefully as in the inpatient setting. Tools for reducing risk of catheter-associated bloodstream infection include keeping the site dry, scrubbing the hub whenever accessing the catheter, aseptic techniques for dressing changes, and chlorhexidine sponges at the insertion site [44,45]. Reporting of central line–associated bloodstream infection rates by home care agencies is an important quality measure.
Wound Care
The presence of a chronic wound in the post-discharge period is associated with a 4.41-fold increased risk of invasive MRSA infection [25]. Although randomized controlled trials are lacking, it is prudent to ensure that wounds are fully debrided to remove devitalized tissue that can be fertile ground for a MRSA infection. The burden of organisms on a chronic wound is often very large, creating high risk of resistance when exposed to antimicrobial agents. Decolonization therapy is not likely to meet with durable success in such cases and should probably be avoided, except in special circumstances, eg, in preparation for cardiothoracic surgery.
Infection Control in Nursing Home Settings
In the Active Bacterial Core cohort, discharge to a nursing home was associated with a 2.1- to 2.65-fold increased risk of invasive MRSA infection [24,25]. It is notable that the authors controlled for the Charlson comorbidity index, suggesting that nursing home care is more than a marker for comorbidity [25]. The tension between the demands of careful infection control and the home-like setting that is desirable for long-term care creates challenges in the prevention of invasive MRSA infection. Nevertheless, careful management of invasive devices and wounds and antimicrobial stewardship are strategies that may reduce the risk of invasive MRSA infection in long-term care settings. Contact precautions for colonized nursing home residents are recommended only during an outbreak [46]. Staff should be trained in proper application of standard precautions, including use of gowns and gloves when handling body fluids. A study of an aggressive program of screening, decolonization with nasal mupirocin and chlorhexidine bathing, enhanced hand hygiene and environmental cleaning demonstrated a significant reduction in MRSA colonization [47]. An increase in mupirocin resistance during the study led to a switch to retapamulin for nasal application. The Association of Practitioners of Infection Control has issued guidance for MRSA prevention in long-term care facilities [48]. The guidance focuses on surveillance for MRSA infection, performing a MRSA risk assessment, hand hygiene, and environmental cleaning.
Antimicrobial Stewardship
Antimicrobial therapy, especially with fluoroquinolones and third- or fourth-generation cephalosporins, is associated with increased risk of MRSA colonization and infection [43,49,50]. Implementation of an antimicrobial stewardship program, coupled with infection control measures, in a region of Scotland resulted in decreased incidence of MRSA infections among hospital inpatients and in the surrounding community [51]. Thus a robust antimicrobial stewardship program is likely to reduce post-discharge MRSA infections.
Role of Hand Hygiene
The importance of hand hygiene in the prevention of infection has been observed for nearly 2 centuries [52]. Multiple quasi-experimental studies have demonstrated a decreased infection rate when hand hygiene practices for health care workers were introduced or strengthened. A randomized trial in a newborn nursery documented a decrease in transmission of S. aureus when nurses washed their hands after handling a colonized infant [53]. In addition to health care providers, patient hand hygiene can reduce health care–associated infections [54]. Traditional handwashing with soap and water will be familiar to most patients and families. Waterless hand hygiene, typically using alcohol-based hand rubs, is more efficacious and convenient for cleaning hands that are not visibly soiled [52]. If products containing emollients are used, it can also reduce skin drying and cracking. Patients and families should be taught to wash their hands before and after manipulating any medical devices and caring for wounds. Education of patients and family members on the techniques and importance of hand hygiene during hospitalization and at the time of discharge is a simple, low-cost strategy to reduce post-discharge MRSA infections. Teaching can be incorporated into the daily care of patients by nursing and medical staff, both verbally and by example. As a horizontal infection control measure, hand hygiene education has the additional benefit of reducing infections due to all pathogens.
Role of Environmental Cleaning in the Home Setting
Multiple studies have found that the immediate environment of patients who are colonized or infected with MRSA is contaminated with the organism, with greater organism burdens associated with infected patients compared to those who are only colonized [55–59]. Greater environmental contamination is observed when MRSA is present in the urine or wounds of patients [59]. This can lead to transmission of MRSA to family members [23,60,61]. Risk factors for transmission include participation in the care of the patient, older age, and being the partner of the case patient. For the patient, there can be transmission to uninfected body sites and a cycle of recolonization and re-infection. Successful decolonization strategies have included frequent laundering of bedclothes and towels, as well as screening and decolonization of family members. While these strategies may succeed in decolonization, there is no consensus on efficacy in preventing infection in patients or family members. More research in this area is needed, particularly for decolonization strategies, which carry risk of resistance. Attention to cleanliness in the home is a basic hygiene measure that can be recommended.
Conclusion
Post-discharge MRSA infections are an important and underestimated source of morbidity and mortality. Strategies for prevention include infection control measures to prevent incident colonization during hospitalization, removal of any nonessential invasive devices, nursing care for essential devices, wound care, avoiding nonessential antimicrobial therapy, hand hygiene for patients and caregivers, and cleaning of the home environment. Decolonization therapies currently play a limited role, particularly in outbreak situations. The future research agenda should include identification of post-discharge patients who are most likely to benefit from decolonization strategies, and testing those strategies.
Corresponding author: Mary Bessesen, MD, InfectiousDiseases (111L), 1055 Clermont St., Denver, CO 80220, Mary.Bessesen@ucdenver.edu.
1. Chen SY, Wang JT, Chen TH et al. Impact of traditional hospital strain of methicillin-resistant Staphylococcus aureus (MRSA) and community strain of MRSA on mortality in patients with community-onset S aureus bacteremia. Medicine 2010;89:285–94.
2. Lahey T, Shah R, Gittzus J,et al. Infectious diseases consultation lowers mortality from Staphylococcus aureus bacteremia. Medicine 2009;88:263–7.
3. Chang FY, MacDonald BB, Peacock JE Jr, et al. A prospective multicenter study of Staphylococcus aureus bacteremia: incidence of endocarditis, risk factors for mortality, and clinical impact of methicillin resistance. Medicine 2003;82:322–32.
4. Blot SI, Vandewoude KH, Hoste EA, Colardyn FA. Outcome and attributable mortality in critically Ill patients with bacteremia involving methicillin-susceptible and methicillin-resistant Staphylococcus aureus. Arch Intern Med 2002;162:2229–35.
5. Cosgrove SE, Sakoulas G, Perencevich EN, et al. Comparison of mortality associated with methicillin-resistant and methicillin-susceptible Staphylococcus aureus bacteremia: a meta-analysis. Clin Infect Dis 2003;36:53–9.
6. Schreiber MP, Chan CM, Shorr AF. Bacteremia in Staphylococcus aureus pneumonia: outcomes and epidemiology. J Crit Care 2011;26:395–401.
7. Malani PN, Rana MM, Banerjee M, Bradley SF. Staphylococcus aureus bloodstream infections: the association between age and mortality and functional status. J Am Geriatr Soc 2008;56:1485–9.
8. Dantes RM, Mu YP, Belflower RR, et al. National burden of invasive methicillin-resistant Staphylococcus aureus infections, United States, 2011. JAMA Intern Med 2013;173:1970–8.
9. Centers for Disease Control and Prevention (CDC). Four pediatric deaths from community-acquired methicillin-resistant Staphylococcus aureus - Minnesota and North Dakota, 1997-1999. MMWR Morb Mortal Wkly Rep 1999;48:707–10.
10. Diep BA, Carleton HA, Chang RF, et al. Roles of 34 virulence genes in the evolution of hospital- and community-associated strains of methicillin-resistant Staphylococcus aureus. J Infect Dis 2006;193:1495–503.
11. Jenkins TC, McCollister BD, Sharma R, et al. Epidemiology of healthcare-associated bloodstream infection caused by USA300 strains of methicillin-resistant Staphylococcus aureus in 3 affiliated hospitals. Infect Control Hosp Epidemiol 2009;30:233–41.
12. Kallen AJ, Mu Y, Bulens S, et al. Health care-associated invasive MRSA infections, 2005-2008. JAMA 2010;304:641–8.
13. Bueno H, Ross JS, Wang Y, et al. Trends in length of stay and short-term outcomes among Medicare patients hospitalized for heart failure, 1993-2006. JAMA 2010;303:2141–7.
14. Klevens RM, Edwards JR, Tenover FC, et al. Changes in the epidemiology of methicillin-resistant Staphylococcus aureus in intensive care units in US hospitals, 1992-2003. Clin Infect Dis 2006;42:389–91.
15. Avery TR, Kleinman KP, Klompas M, et al. Inclusion of 30-day postdischarge detection triples the incidence of hospital-onset methicillin-resistant Staphylococcus aureus. Infect Control Hosp Epidemiol 2012;33:114–21.
16. Calfee DP, Salgado CD, Classen D, et al. Strategies to prevent transmission of methicillin-resistant Staphylococcus aureus in acute care hospitals. Infect Control Hosp Epidemiol 2008;29:Suppl 80.
17. Yokoe DS, Anderson DJ, Berenholtz SM, et al. A compendium of strategies to prevent healthcare-associated infections in acute care hospitals: 2014 updates. Infect Control Hosp Epidemiol 2014;35:967–77.
18. Jain R, Kralovic SM, Evans ME, et al. Veterans Affairs initiative to prevent methicillin-resistant Staphylococcus aureus infections. N Engl J Med 2011;364:1419–30.
19. Stiefel U, Cadnum JL, Eckstein BC, et al. Contamination of hands with methicillin-resistant Staphylococcus aureus after contact with environmental surfaces and after contact with the skin of colonized patients. Infect Control Hosp Epidemiol 2011;32:185–7.
20. Chang S, Sethi AK, Eckstein BC, et al. Skin and environmental contamination with methicillin-resistant Staphylococcus aureus among carriers identified clinically versus through active surveillance. Clin Infect Dis 2009;48:1423–8.
21. Huskins WC, Huckabee CM, O’Grady NP, et al. Intervention to reduce transmission of resistant bacteria in intensive care. N Engl J Med 2011;364:1407–18.
22. Wertheim HF, Vos MC, Ott A, et al. Risk and outcome of nosocomial Staphylococcus aureus bacteraemia in nasal carriers versus non-carriers. Lancet 2004;364:703–5.
23. Lucet JC, Paoletti X, Demontpion C, et al. Carriage of methicillin-resistant Staphylococcus aureus in home care settings: prevalence, duration, and transmission to household members. Arch Intern Med 2009;169:1372–8.
24. Duffy J, Dumyati G, Bulens S, et al. Community-onset invasive methicillin-resistant Staphylococcus aureus infections following hospital discharge. Am J Infect Control 2013;41:782–6.
25. Epstein L, Mu Y, Belflower R, et al. Risk factors for invasive methicillin-resistant Staphylococcus aureus infection after recent discharge from an acute-care hospitalization, 2011-2013. Clin Infect Dis 2016;62:45–52.
26. Simor AE, Phillips E, McGeer A, et al. Randomized controlled trial of chlorhexidine gluconate for washing, intranasal mupirocin, and rifampin and doxycycline versus no treatment for the eradication of methicillin-resistant Staphylococcus aureus colonization. Clin Infect Dis 2007;44:178–85.
27. Buehlmann M, Frei R, Fenner L, et al. Highly effective regimen for decolonization of methicillin-resistant Staphylococcus aureus carriers. Infect Control Hosp Epidemiol 2008;29:510–6.
28. Anderson MJ, David ML, Scholz M, et al. Efficacy of skin and nasal povidone-iodine preparation against mupirocin-resistant methicillin-resistant Staphylococcus aureus and S. aureus within the anterior nares. Antimicrob Agents Chemother 2015;59:2765–73.
29. Strausbaugh LJ, Jacobson C, Sewell DL, et al. Antimicrobial therapy for methicillin-resistant Staphylococcus aureus colonization in residents and staff of a Veterans Affairs nursing home care unit. Infect Control Hosp Epidemiol 1992;13:151–9.
30. Mody L, Kauffman CA, McNeil SA, et al. Mupirocin-based decolonization of Staphylococcus aureus carriers in residents of 2 long-term care facilities: a randomized, double-blind, placebo-controlled trial. Clin Infect Dis 2003;37:1467–74.
31. Kauffman CA, Terpenning MS, He X, et al. Attempts to eradicate methicillin-resistant Staphylococcus aureus from a long-term-care facility with the use of mupirocin ointment. Am J Med 1993;94:371–8.
32. Cederna JE, Terpenning MS, Ensberg M, et al. Staphylococcus aureus nasal colonization in a nursing home: eradication with mupirocin. Infect Control Hosp Epidemiol 1990;11:13–6.
33. Perl TM, Cullen JJ, Wenzel RP, et al. Intranasal mupirocin to prevent postoperative Staphylococcus aureus infections. N Engl J Med 2002;346:1871–7.
34. Kohler P, Bregenzer-Witteck A, Rettenmund G, et al. MRSA decolonization: success rate, risk factors for failure and optimal duration of follow-up. Infection 2013;41:33–40.
35. Ammerlaan HS, Kluytmans JA, Berkhout H, et al. Eradication of carriage with methicillin-resistant Staphylococcus aureus: effectiveness of a national guideline. J Antimicrob Chemother 2011;66:2409–17.
36. Bode LG, Kluytmans JA, Wertheim HF, et al. Preventing surgical-site infections in nasal carriers of Staphylococcus aureus. N Engl J Med 2010;362:9–17.
37. Nair R, Perencevich EN, Blevins AE, et al. Clinical effectiveness of mupirocin for preventing Staphylococcus aureus infections in nonsurgical settings: a meta-analysis. Clin Infect Dis 2016;62:618–30.
38. Huang SS, Septimus E, Kleinman K, et al. Targeted versus universal decolonization to prevent icu infection. N Engl J Med 2013;368:2255–65.
39. Schweizer ML, Chiang HY, Septimus E, et al. Association of a bundled intervention with surgical site infections among patients undergoing cardiac, hip, or knee surgery. JAMA 2015;313:2162–71.
40. Walsh EE, Greene L, Kirshner R. Sustained reduction in methicillin-resistant Staphylococcus aureus wound infections after cardiothoracic surgery. Arch Intern Med 2011;171:68–73.
41. Kim DH, Spencer M, Davidson SM, et al. Institutional prescreening for detection and eradication of methicillin-resistant Staphylococcus aureus in patients undergoing elective orthopaedic surgery. J Bone Joint Surg Am 2010;92:1820–6.
42. Lederle FA, Parenti CM, Berskow LC, Ellingson KJ. The idle intravenous catheter. Ann Intern Med 1992;116:737–8.
43. Avery CM, Ameerally P, Castling B, Swann RA. Infection of surgical wounds in the maxillofacial region and free flap donor sites with methicillin-resistant Staphylococcus aureus. Br J Oral Maxillofac Surg 2006;44:217–21.
44. Timsit JF, Schwebel C, Bouadma L, et al. Chlorhexidine-impregnated sponges and less frequent dressing changes for prevention of catheter-related infections in critically ill adults: a randomized controlled trial. JAMA 2009;301:1231–41.
45. Marschall J, Mermel LA, Fakih M, et al. Strategies to prevent central line-associated bloodstream infections in acute care hospitals: 2014 update. Infect Control Hosp Epidemiol 2014;35:753–71.
46. Manzur A, Gudiol F. Methicillin-resistant Staphylococcus aureus in long-term-care facilities. Clin Microbiol Infect 2009;15 Suppl 7:26–30.
47. Schora DM, Boehm S, Das S, et al. Impact of Detection, Education, Research and Decolonization without Isolation in Long-term care (DERAIL) on methicillin-resistant Staphylococcus aureus colonization and transmission at 3 long-term care facilities. Am J Infect Control 2014;42(10 Suppl):S269–73.
48. Rebmann T, Aureden K, Association for Professionals in Infection Control and Epidemiology. Preventing methicillin-resistant Staphylococcus aureus transmission in long-term care facilities: an executive summary of the APIC Elimination Guide. Am J Infect Control 2011;39:235–8.
49. Mitchell SL, Shaffer ML, Loeb MB, et al. Infection management and multidrug-resistant organisms in nursing home residents with advanced dementia. JAMA Intern Med 2014;174:1660–7.
50. Couderc C, Jolivet S, Thiebaut AC, et al. Fluoroquinolone use is a risk factor for methicillin-resistant Staphylococcus aureus acquisition in long-term care facilities: a nested case-case-control study. Clin Infect Dis 2014;59:206–15.
51. Lawes T, Lopez-Lozano JM, Nebot CA, et al. Effects of national antibiotic stewardship and infection control strategies on hospital-associated and community-associated meticillin-resistant Staphylococcus aureus infections across a region of Scotland: a non-linear time-series study. Lancet Infect Dis 2015;15:1438–49.
52. Centers for Disease Control and Prevention. Guideline for hand hygiene in health-care settings: Recommendations of the Healthcare Infection Control Practices Advisory Committee and the HICPAC/SHEA/APIC/IDSA Hand Hygiene Task Force. MMWR Recomm Rep 2002;51(RR-16):1–48.
53. Mortimer EA Jr, Lipsitz PJ, Wolinsky E, et al. Transmission of staphylococci between newborns. Importance of the hands to personnel. Am J Dis Child 1962;104:289–95.
54. Gagne D, Bedard G, Maziade PJ. Systematic patients’ hand disinfection: impact on meticillin-resistant Staphylococcus aureus infection rates in a community hospital. J Hosp Infect 2010;75:269–72.
55. Knelson LP, Williams DA, Gergen MF, et al. A comparison of environmental contamination by patients infected or colonized with methicillin-resistant Staphylococcus aureus or vancomycin-resistant enterococci: a multicenter study. Infect Control Hosp Epidemiol 2014;35:872–5.
56. Murphy CR, Eells SJ, Quan V, et al. Methicillin-resistant Staphylococcus aureus burden in nursing homes associated with environmental contamination of common areas. J Am Geriatr Soc 2012;60:1012–8.
57. Datta R, Platt R, Yokoe DS, Huang SS. Environmental cleaning intervention and risk of acquiring multidrug-resistant organisms from prior room occupants. Arch Intern Med 2011;171:491–4.
58. Dancer SJ. The role of environmental cleaning in the control of hospital-acquired infection. J Hosp Infect 2009;73:378–85.
59. Boyce JM, Potter-Bynoe G, Chenevert C, King T. Environmental contamination due to methicillin-resistant Staphylococcus aureus: possible infection control implications. Infect Control Hosp Epidemiol 1997;18:622–7.
60. Mollema FP, Richardus JH, Behrendt M, et al. Transmission of methicillin-resistant Staphylococcus aureus to household contacts. J Clin Microbiol 2010;48:202–7.
61. Calfee DP, Durbin LJ, Germanson TP, et al. Spread of methicillin-resistant Staphylococcus aureus (MRSA) among household contacts of individuals with nosocomially acquired MRSA. Infect Control Hosp Epidemiol 2003;24:422–6.
From the Division of Adult Infectious Diseases, University of Colorado Denver, Aurora, CO, and the Department of Veterans Affairs, Eastern Colorado Healthcare System, Denver, CO.
Abstract
- Objective: To review the published literature on methicillin-resistant Staphylococcus aureus (MRSA) infections among patients recently discharged from hospital, with a focus on possible prevention measures.
- Methods: Literature review.
- Results: MRSA is a major cause of post-discharge infections. Risk factors for post-discharge MRSA include colonization, dependent ambulatory status, duration of hospitalization > 5 days, discharge to a long-term care facility, presence of a central venous catheter (CVC), presence of a non-CVC invasive device, a chronic wound in the post-discharge period, hemodialysis, systemic corticosteroids, and receiving anti-MRSA antimicrobial agents. Potential approaches to control include prevention of incident colonization during hospital stay, removal of nonessential CVCs and other devices, good wound debridement and care, and antimicrobial stewardship. Hand hygiene and environmental cleaning are horizontal measures that are also recommended. Decolonization may be useful in selected cases.
- Conclusion: Post-discharge MRSA infections are an important and underestimated source of morbidity and mortality. The future research agenda should include identification of post-discharge patients who are most likely to benefit from decolonization strategies, and testing those strategies.
Methicillin-resistant Staphylococcus aureus (MRSA) is a leading cause of morbidity and mortality due to infections of the bloodstream, lung, surgical sites, bone, and skin and soft tissues. The mortality associated with S. aureus bloodstream infections is 14% to 45% [1–4]. A bloodstream infection caused by MRSA is associated with a twofold increased mortality as compared to one caused by methicillin-sensitive S. aureus [5]. MRSA pneumonia carries a mortality of 8%, which increases to 39% when bacteremia is also present [6]. S. aureus bloodstream infection also carries a high risk of functional disability, with 65% of patients in a recent series requiring nursing home care in the recovery period [7]. In 2011 there were more than 11,000 deaths due to invasive MRSA infection in the United States [8]. Clearly S. aureus, and particularly MRSA, is a pathogen of major clinical significance.
Methicillin resistance was described in 1961, soon after methicillin became available in the 1950s. Prevalence of MRSA remained low until the 1980s, when it rapidly increased in health care settings. The predominant health care–associated strain in the United States is USA100, a member of clonal complex 5. Community-acquired MRSA infection has garnered much attention since it was recognized in 1996 [9]. The predominant community-associated strain has been USA300, a member of clonal complex 8 [10]. Following its emergence in the community, USA300 became a significant health care–associated pathogen as well [11]. The larger share of MRSA disease remains health care–associated [8]. The most recent data from the Center for Disease Control and Prevention Active Bacterial Core Surveillance system indicate that 77.6% of invasive MRSA infection is health care–associated, resulting in 9127 deaths in 2011 [8].
This article reviews the published literature on MRSA infections among patients recently discharged from hospital, with a focus on possible prevention measures.
MRSA Epidemiologic Categories
Epidemiologic investigations of MRSA categorize infections according to the presumed acquisition site, ie, in the community or in a health care setting. Older literature refers to nosocomial MRSA infection, which is now commonly referred to as hospital-onset health care–associated (HO-HCA) MRSA. A common definition of HO-HCA MRSA infection is an infection with the first positive culture on hospital day 4 or later [12]. Community-onset health care–associated MRSA (CO-HCA MRSA) is defined as infection that is diagnosed in the outpatient setting, or prior to day 4 of hospitalization, in a patient with recent health care exposure, eg, hospitalization within the past year, hemodialysis, surgery, or presence of a central venous catheter at time of presentation to the hospital [12]. Community-associated MRSA (CA-MSRSA) is infection in patients who do not meet criteria for either type of health care associated MRSA. Post-discharge MRSA infections would be included in the CO-HCA MRSA group.
Infection Control Programs
Classic infection control programs, developed in the 1960s, focused on infections that presented more than 48 to 72 hours after admission and prior to discharge from hospital. In that era, the average length of hospital stay was 1 week or more, and there was sufficient time for health care–associated infections to become clinically apparent. In recent years, length of stay has progressively shortened [13]. As hospital stays shortened, the risk that an infection caused by a health care–acquired pathogen would be identified after discharge grew. More recent studies have documented that the majority of HO-HCA infections become apparent after the index hospitalization [8,14].
Data from the Active Bacterial Core Surveillance System quantify the burden of CO-HCA MRSA disease at a national level [8,14]. However, it is not readily detected by many hospital infection surveillance programs. Avery et al studied a database constructed with California state mandated reports of MRSA infection and identified cases with MRSA present on admission. They then searched for a previous admission, within 30 days. If a prior admission was identified, the MRSA case was assigned to the hospital that had recently discharged the patient. Using this approach, they found that the incidence of health care–associated MRSA infection increased from 12.2 cases/10,000 admissions when traditional surveillance methods were used to 35.7/10,000 admissions using the revised method of assignment of health care exposure [15]. These data suggest that post-discharge MRSA disease is underappreciated by hospital infection control programs.
Lessons from Hospital-Onset MRSA
The morbidity and mortality associated with MRSA have led to the development of vigorous infection control programs to reduce the risk of health care–associated MRSA infection [16–18]. Vertical infection control strategies, ie, those focused on MRSA specifically, have included active screening for colonization, and nursing colonized patients in contact precautions. Since colonization is the antecedent to infection in most cases, prevention of transmission of MRSA from patient to patient should prevent most infections. There is ample evidence that colonized patients contaminate their immediate environment with MRSA, creating a reservoir of resistant pathogens that can be transmitted to other patients on the hands and clothing of health care workers [19,20]. Quasi-experimental studies of active screening and isolation strategies have shown decreases in MRSA transmission and infection following implementation [18]. The only randomized comparative trial of active screening and isolation versus usual care did not demonstrate benefit, possibly due to delays in lab confirmation of colonization status [21]. Horizontal infection control strategies are applied to all patients, regardless of colonization with resistant pathogens, in an attempt to decrease health care–associated infections with all pathogens. Examples of horizontal strategies are hand hygiene, environmental cleaning, and the prevention bundles for central line–associated bloodstream infection.
The Burden of Community-Onset MRSA
CO-HCA MRSA represents 60% of the burden of invasive MRSA infection [8]. While this category includes cases that have not been hospitalized, eg, patients on hemodialysis, post-discharge MRSA infection accounts for the majority of cases [15]. Recent data indicate that the incidence of HO-HCA MRSA decreased 54.2% between 2005 and 2011 [8]. This decrease in HO-HCA MRSA infection occurred concurrently with widespread implementation of vigorous horizontal infection control measures, such as bundled prevention strategies for central line–associated bloodstream infection and ventilator-associated pneumonia. The decline in CO-HCA MRSA infection has been much less steep, at 27.7%. The majority of the CO-HCA infections are in post-discharge patients. Furthermore, the incidence of CO-HCA MRSA infection may be underestimated [15].
Post-Discharge MRSA Colonization and Infection
Hospital-associated MRSA infection is reportable in many jurisdictions, but post-discharge MRSA infection is not a specific reportable condition, limiting the available surveillance data. Avery et al [15] studied ICD-9 code data for all hospitals in Orange County, California, and found that 23.5/10,000 hospital admissions were associated with a post-discharge MRSA infection. This nearly tripled the incidence of health care–associated MRSA infection, compared to surveillance that included only hospital-onset cases. Future research should refine these observations, as ICD-9 code data correlate imperfectly with chart reviews and have not yet been well validated for MRSA research.
The CDC estimated that in 2011 there were 48,353 CO-HCA MRSA infections resulting in 10,934 deaths. This estimate is derived from study of the Active Bacterial Core surveillance sample [8]. In that sample, 79% of CO-HCA MRSA infections occurred in patients hospitalized within the last year. Thus, we can estimate that there were 34,249 post-discharge MRSA infections resulting in 8638 deaths in the United States in 2011.
MRSA colonization is the antecedent to infection in the majority of cases [22]. Thus we can assess the health care burden of post-discharge MRSA by analyzing colonization as well as infection. Furthermore, the risk of MRSA colonization of household members can be addressed. Lucet et al evaluated hospital inpatients preparing for discharge to a home health care setting, and found that 12.7% of them were colonized with MRSA at the time of discharge, and 45% of them remained colonized for more than a year [23]. Patients who regained independence in activities of daily living were more likely to become free of MRSA colonization. The study provided no data on the risk of MRSA infection in the colonized patients. 19.1% of household contacts became colonized with MRSA, demonstrating that the burden of MRSA extends beyond the index patient. None of the colonized household contacts developed MRSA infection during the study period.
Risk Factors for Post-Discharge MRSA
Case control studies of patients with post-discharge invasive MRSA have shed light on risk factors for infection. While many risk factors are not modifiable, these studies may provide a road map to development of prevention strategies for the post-discharge setting. A study of hospitals in New York that participated in the Active Bacterial Core surveillance system identified a statistically significant increased risk of MRSA invasive infection among patients with several factors associated with physical disability, including a physical therapy evaluation, dependent ambulatory status, duration of hospitalization > 5 days, and discharge to a long-term care facility. Additional risk factors identified in the bivariate analysis were presence of a central venous catheter, hemodialysis, systemic corticosteroids, and receiving anti-MRSA antimicrobial agents. When subjected to multivariate analysis, however, the most significant and potent risk factor was a previous positive MRSA clinical culture (matched odds ratio 23, P < 0.001). Other significant risk factors in the multivariate analysis were hemodialysis, presence of a central venous catheter in the outpatient setting, and a visit to the emergency department [24]. A second, larger, multistate study also based on data from the Active Bacterial Core surveillance system showed that 5 risk factors were significantly associated with post-discharge invasive MRSA infection: (1) MRSA colonization, (2) a central venous catheter (CVC) present at discharge, (3) presence of a non-CVC invasive device, (4) a chronic wound in the post-discharge period, and (5) discharge to a nursing home. MRSA colonization was associated with a 7.7-fold increased odds of invasive MRSA infection, a much greater increase than any of the other risk factors [25]. Based on these results, strategies to consider include enhanced infection measures for prevention of incident MRSA colonization in the inpatient setting, decolonization therapy for those who become colonized, removal of non-essential medical devices, including central venous catheters, excellent nursing care for essential devices and wounds, hand hygiene, environmental cleaning, and antimicrobial stewardship.
Development of Strategies to Decrease Post-Discharge MRSA
While the epidemiology of post-discharge health care–associated MRSA infections has become a topic of interest to researchers, approaches to control are in their infancy. Few of the approaches have been subjected to rigorous study in the post-discharge environment. Nevertheless, some low risk, common sense strategies may be considered. Furthermore, an outline of research objectives may be constructed.
Prevention of Colonization in the Inpatient Setting
Robust infection control measures must be implemented in inpatient settings to prevent incident MRSA colonization [16,17]. Key recommendations include surveillance and monitoring of MRSA infections, adherence to standard hand hygiene guidance, environmental cleanliness, and use of dedicated equipment for patients who are colonized or infected with MRSA. Active screening for asymptomatic MRSA carriage and isolation of carriers may be implemented if routine measures are not successful.
Decolonization
Despite the best infection control programs, some patients will be colonized with MRSA at the time of hospital discharge. As detailed above, MRSA colonization is a potent risk factor for infection in the post-discharge setting, as well as in hospital inpatients [22]. A logical approach to this would be to attempt to eradicate colonization. There are several strategies for decolonization therapy, which may be used alone or in combination, including nasal mupirocin, nasal povidone-iodine, systemic antistaphylococcal drugs alone or in combination with oral rifampin, chlorhexidine bathing, or bleach baths [26–29].
A preliminary step in approaching the idea of post-discharge decolonization therapy is to show that patients can be successfully decolonized. With those data in hand, randomized trials seeking to demonstrate a decrease in invasive MRSA infections can be planned. Decolonization using nasal mupirocin has an initial success rate of 60% to 100% in a variety of patient populations [30–35]. Poor adherence to the decolonization protocol may limit success in the outpatient setting. Patients are more likely to resolve their MRSA colonization spontaneously when they regain their general health and independence in activities of daily living [23]. Colonization of other household members may provide a reservoir of MRSA leading to recolonization of the index case. Treatment of the household members may be offered, to provide more durable maintenance of the decolonized state [35]. When chronically ill patients who have been decolonized are followed longitudinally, up to 39% become colonized again, most often with the same strain [30,31]. Attempts to maintain a MRSA-free state in nursing home residents using prolonged mupirocin therapy resulted in emergence of mupirocin resistance [31]. Thus decolonization can be achieved, but is difficult to maintain, especially in debilitated, chronically ill patients. Mupirocin resistance can occur, limiting success of decolonization therapies.
Successful decolonization has been proven to reduce the risk of MRSA infection in the perioperative, dialysis, and intensive care unit settings [33,36–38]. In dialysis patients the risk of S. aureus bloodstream infection, including MRSA, can be reduced 59% with the use of mupirocin decolonization of the nares, with or without treatment of dialysis access exit sites [37]. A placebo-controlled trial demonstrated that decolonization of the nares with mupirocin reduced surgical site infections with S. aureus. All S. aureus isolates in the study were methicillin-susceptible. A second randomized controlled trial of nasal mupirocin did not achieve a statistically significant decrease in S. aureus surgical site infections, but it showed that mupirocin decolonization therapy decreased nosocomial S. aureus infections among nasal carriers [33]. 99.2% of isolates in that study et al were methicillin-susceptible. Quasi-experimental studies have shown similar benefits for surgical patients who are colonized with MRSA [39–41]. A more recent randomized trial, in ICU patients, demonstrated decreased incidence of invasive infection in patients treated with nasal mupirocin and chlorhexidine baths [38]. The common themeof these studies is that they enrolled patients who had a short-term condition, eg, surgery or critical illness, placing them at high risk for invasive MRSA infection. This maximizes the potential benefit of decolonization and minimizes the risk of emergence of resistance. Furthermore, adherence to decolonization protocols is likely to be high in the perioperative and ICU settings. To extrapolate the ICU and perioperative data to the post-discharge setting would be imprudent.
In summary, decolonization may be a useful strategy to reduce invasive MRSA infection in post-discharge patients, but more data are needed for most patient populations. The evidence for decolonization therapy is strongest for dialysis patients, in whom implementation of routine decolonization of MRSA colonized nares is a useful intervention [37]. There are not yet clinical trials of decolonization therapy in patients at time of hospital discharge showing a reduction in invasive MRSA infection. Decolonization strategies have important drawbacks, including emergence of resistance to mupirocin, chlorhexidine, and systemic agents. Furthermore, there is a risk of hypersensitivity reactions, Clostridium difficile infection, and potential for negative impacts onthe normal microbiome. The potential for lesser efficacy in a chronically ill outpatient population must also be considered in the post-discharge setting. Randomized controlled trials with invasive infection outcomes should be performed prior to implementing routine decolonization therapy of hospital discharge patients.
Care of Invasive Devices
Discharge with a central venous catheter was associated with a 2.16-fold increased risk of invasive MRSA infection; other invasive devices were associated with a 3.03-fold increased risk [25]. Clinicians must carefully assess patients nearing discharge for any opportunity to remove invasive devices. Idle devices have been reported in inpatient settings [42] and could occur in other settings. Antimicrobial therapy is a common indication for an outpatient central venous catheter and can also be associated with increased risk of invasive MRSA infection [25,43]. Duration and route of administration of antimicrobial agents should be carefully considered, with an eye to switching to oral therapy whenever possible. When a central venous catheter must be utilized, it should be maintained as carefully as in the inpatient setting. Tools for reducing risk of catheter-associated bloodstream infection include keeping the site dry, scrubbing the hub whenever accessing the catheter, aseptic techniques for dressing changes, and chlorhexidine sponges at the insertion site [44,45]. Reporting of central line–associated bloodstream infection rates by home care agencies is an important quality measure.
Wound Care
The presence of a chronic wound in the post-discharge period is associated with a 4.41-fold increased risk of invasive MRSA infection [25]. Although randomized controlled trials are lacking, it is prudent to ensure that wounds are fully debrided to remove devitalized tissue that can be fertile ground for a MRSA infection. The burden of organisms on a chronic wound is often very large, creating high risk of resistance when exposed to antimicrobial agents. Decolonization therapy is not likely to meet with durable success in such cases and should probably be avoided, except in special circumstances, eg, in preparation for cardiothoracic surgery.
Infection Control in Nursing Home Settings
In the Active Bacterial Core cohort, discharge to a nursing home was associated with a 2.1- to 2.65-fold increased risk of invasive MRSA infection [24,25]. It is notable that the authors controlled for the Charlson comorbidity index, suggesting that nursing home care is more than a marker for comorbidity [25]. The tension between the demands of careful infection control and the home-like setting that is desirable for long-term care creates challenges in the prevention of invasive MRSA infection. Nevertheless, careful management of invasive devices and wounds and antimicrobial stewardship are strategies that may reduce the risk of invasive MRSA infection in long-term care settings. Contact precautions for colonized nursing home residents are recommended only during an outbreak [46]. Staff should be trained in proper application of standard precautions, including use of gowns and gloves when handling body fluids. A study of an aggressive program of screening, decolonization with nasal mupirocin and chlorhexidine bathing, enhanced hand hygiene and environmental cleaning demonstrated a significant reduction in MRSA colonization [47]. An increase in mupirocin resistance during the study led to a switch to retapamulin for nasal application. The Association of Practitioners of Infection Control has issued guidance for MRSA prevention in long-term care facilities [48]. The guidance focuses on surveillance for MRSA infection, performing a MRSA risk assessment, hand hygiene, and environmental cleaning.
Antimicrobial Stewardship
Antimicrobial therapy, especially with fluoroquinolones and third- or fourth-generation cephalosporins, is associated with increased risk of MRSA colonization and infection [43,49,50]. Implementation of an antimicrobial stewardship program, coupled with infection control measures, in a region of Scotland resulted in decreased incidence of MRSA infections among hospital inpatients and in the surrounding community [51]. Thus a robust antimicrobial stewardship program is likely to reduce post-discharge MRSA infections.
Role of Hand Hygiene
The importance of hand hygiene in the prevention of infection has been observed for nearly 2 centuries [52]. Multiple quasi-experimental studies have demonstrated a decreased infection rate when hand hygiene practices for health care workers were introduced or strengthened. A randomized trial in a newborn nursery documented a decrease in transmission of S. aureus when nurses washed their hands after handling a colonized infant [53]. In addition to health care providers, patient hand hygiene can reduce health care–associated infections [54]. Traditional handwashing with soap and water will be familiar to most patients and families. Waterless hand hygiene, typically using alcohol-based hand rubs, is more efficacious and convenient for cleaning hands that are not visibly soiled [52]. If products containing emollients are used, it can also reduce skin drying and cracking. Patients and families should be taught to wash their hands before and after manipulating any medical devices and caring for wounds. Education of patients and family members on the techniques and importance of hand hygiene during hospitalization and at the time of discharge is a simple, low-cost strategy to reduce post-discharge MRSA infections. Teaching can be incorporated into the daily care of patients by nursing and medical staff, both verbally and by example. As a horizontal infection control measure, hand hygiene education has the additional benefit of reducing infections due to all pathogens.
Role of Environmental Cleaning in the Home Setting
Multiple studies have found that the immediate environment of patients who are colonized or infected with MRSA is contaminated with the organism, with greater organism burdens associated with infected patients compared to those who are only colonized [55–59]. Greater environmental contamination is observed when MRSA is present in the urine or wounds of patients [59]. This can lead to transmission of MRSA to family members [23,60,61]. Risk factors for transmission include participation in the care of the patient, older age, and being the partner of the case patient. For the patient, there can be transmission to uninfected body sites and a cycle of recolonization and re-infection. Successful decolonization strategies have included frequent laundering of bedclothes and towels, as well as screening and decolonization of family members. While these strategies may succeed in decolonization, there is no consensus on efficacy in preventing infection in patients or family members. More research in this area is needed, particularly for decolonization strategies, which carry risk of resistance. Attention to cleanliness in the home is a basic hygiene measure that can be recommended.
Conclusion
Post-discharge MRSA infections are an important and underestimated source of morbidity and mortality. Strategies for prevention include infection control measures to prevent incident colonization during hospitalization, removal of any nonessential invasive devices, nursing care for essential devices, wound care, avoiding nonessential antimicrobial therapy, hand hygiene for patients and caregivers, and cleaning of the home environment. Decolonization therapies currently play a limited role, particularly in outbreak situations. The future research agenda should include identification of post-discharge patients who are most likely to benefit from decolonization strategies, and testing those strategies.
Corresponding author: Mary Bessesen, MD, InfectiousDiseases (111L), 1055 Clermont St., Denver, CO 80220, Mary.Bessesen@ucdenver.edu.
1. Chen SY, Wang JT, Chen TH et al. Impact of traditional hospital strain of methicillin-resistant Staphylococcus aureus (MRSA) and community strain of MRSA on mortality in patients with community-onset S aureus bacteremia. Medicine 2010;89:285–94.
2. Lahey T, Shah R, Gittzus J,et al. Infectious diseases consultation lowers mortality from Staphylococcus aureus bacteremia. Medicine 2009;88:263–7.
3. Chang FY, MacDonald BB, Peacock JE Jr, et al. A prospective multicenter study of Staphylococcus aureus bacteremia: incidence of endocarditis, risk factors for mortality, and clinical impact of methicillin resistance. Medicine 2003;82:322–32.
4. Blot SI, Vandewoude KH, Hoste EA, Colardyn FA. Outcome and attributable mortality in critically Ill patients with bacteremia involving methicillin-susceptible and methicillin-resistant Staphylococcus aureus. Arch Intern Med 2002;162:2229–35.
5. Cosgrove SE, Sakoulas G, Perencevich EN, et al. Comparison of mortality associated with methicillin-resistant and methicillin-susceptible Staphylococcus aureus bacteremia: a meta-analysis. Clin Infect Dis 2003;36:53–9.
6. Schreiber MP, Chan CM, Shorr AF. Bacteremia in Staphylococcus aureus pneumonia: outcomes and epidemiology. J Crit Care 2011;26:395–401.
7. Malani PN, Rana MM, Banerjee M, Bradley SF. Staphylococcus aureus bloodstream infections: the association between age and mortality and functional status. J Am Geriatr Soc 2008;56:1485–9.
8. Dantes RM, Mu YP, Belflower RR, et al. National burden of invasive methicillin-resistant Staphylococcus aureus infections, United States, 2011. JAMA Intern Med 2013;173:1970–8.
9. Centers for Disease Control and Prevention (CDC). Four pediatric deaths from community-acquired methicillin-resistant Staphylococcus aureus - Minnesota and North Dakota, 1997-1999. MMWR Morb Mortal Wkly Rep 1999;48:707–10.
10. Diep BA, Carleton HA, Chang RF, et al. Roles of 34 virulence genes in the evolution of hospital- and community-associated strains of methicillin-resistant Staphylococcus aureus. J Infect Dis 2006;193:1495–503.
11. Jenkins TC, McCollister BD, Sharma R, et al. Epidemiology of healthcare-associated bloodstream infection caused by USA300 strains of methicillin-resistant Staphylococcus aureus in 3 affiliated hospitals. Infect Control Hosp Epidemiol 2009;30:233–41.
12. Kallen AJ, Mu Y, Bulens S, et al. Health care-associated invasive MRSA infections, 2005-2008. JAMA 2010;304:641–8.
13. Bueno H, Ross JS, Wang Y, et al. Trends in length of stay and short-term outcomes among Medicare patients hospitalized for heart failure, 1993-2006. JAMA 2010;303:2141–7.
14. Klevens RM, Edwards JR, Tenover FC, et al. Changes in the epidemiology of methicillin-resistant Staphylococcus aureus in intensive care units in US hospitals, 1992-2003. Clin Infect Dis 2006;42:389–91.
15. Avery TR, Kleinman KP, Klompas M, et al. Inclusion of 30-day postdischarge detection triples the incidence of hospital-onset methicillin-resistant Staphylococcus aureus. Infect Control Hosp Epidemiol 2012;33:114–21.
16. Calfee DP, Salgado CD, Classen D, et al. Strategies to prevent transmission of methicillin-resistant Staphylococcus aureus in acute care hospitals. Infect Control Hosp Epidemiol 2008;29:Suppl 80.
17. Yokoe DS, Anderson DJ, Berenholtz SM, et al. A compendium of strategies to prevent healthcare-associated infections in acute care hospitals: 2014 updates. Infect Control Hosp Epidemiol 2014;35:967–77.
18. Jain R, Kralovic SM, Evans ME, et al. Veterans Affairs initiative to prevent methicillin-resistant Staphylococcus aureus infections. N Engl J Med 2011;364:1419–30.
19. Stiefel U, Cadnum JL, Eckstein BC, et al. Contamination of hands with methicillin-resistant Staphylococcus aureus after contact with environmental surfaces and after contact with the skin of colonized patients. Infect Control Hosp Epidemiol 2011;32:185–7.
20. Chang S, Sethi AK, Eckstein BC, et al. Skin and environmental contamination with methicillin-resistant Staphylococcus aureus among carriers identified clinically versus through active surveillance. Clin Infect Dis 2009;48:1423–8.
21. Huskins WC, Huckabee CM, O’Grady NP, et al. Intervention to reduce transmission of resistant bacteria in intensive care. N Engl J Med 2011;364:1407–18.
22. Wertheim HF, Vos MC, Ott A, et al. Risk and outcome of nosocomial Staphylococcus aureus bacteraemia in nasal carriers versus non-carriers. Lancet 2004;364:703–5.
23. Lucet JC, Paoletti X, Demontpion C, et al. Carriage of methicillin-resistant Staphylococcus aureus in home care settings: prevalence, duration, and transmission to household members. Arch Intern Med 2009;169:1372–8.
24. Duffy J, Dumyati G, Bulens S, et al. Community-onset invasive methicillin-resistant Staphylococcus aureus infections following hospital discharge. Am J Infect Control 2013;41:782–6.
25. Epstein L, Mu Y, Belflower R, et al. Risk factors for invasive methicillin-resistant Staphylococcus aureus infection after recent discharge from an acute-care hospitalization, 2011-2013. Clin Infect Dis 2016;62:45–52.
26. Simor AE, Phillips E, McGeer A, et al. Randomized controlled trial of chlorhexidine gluconate for washing, intranasal mupirocin, and rifampin and doxycycline versus no treatment for the eradication of methicillin-resistant Staphylococcus aureus colonization. Clin Infect Dis 2007;44:178–85.
27. Buehlmann M, Frei R, Fenner L, et al. Highly effective regimen for decolonization of methicillin-resistant Staphylococcus aureus carriers. Infect Control Hosp Epidemiol 2008;29:510–6.
28. Anderson MJ, David ML, Scholz M, et al. Efficacy of skin and nasal povidone-iodine preparation against mupirocin-resistant methicillin-resistant Staphylococcus aureus and S. aureus within the anterior nares. Antimicrob Agents Chemother 2015;59:2765–73.
29. Strausbaugh LJ, Jacobson C, Sewell DL, et al. Antimicrobial therapy for methicillin-resistant Staphylococcus aureus colonization in residents and staff of a Veterans Affairs nursing home care unit. Infect Control Hosp Epidemiol 1992;13:151–9.
30. Mody L, Kauffman CA, McNeil SA, et al. Mupirocin-based decolonization of Staphylococcus aureus carriers in residents of 2 long-term care facilities: a randomized, double-blind, placebo-controlled trial. Clin Infect Dis 2003;37:1467–74.
31. Kauffman CA, Terpenning MS, He X, et al. Attempts to eradicate methicillin-resistant Staphylococcus aureus from a long-term-care facility with the use of mupirocin ointment. Am J Med 1993;94:371–8.
32. Cederna JE, Terpenning MS, Ensberg M, et al. Staphylococcus aureus nasal colonization in a nursing home: eradication with mupirocin. Infect Control Hosp Epidemiol 1990;11:13–6.
33. Perl TM, Cullen JJ, Wenzel RP, et al. Intranasal mupirocin to prevent postoperative Staphylococcus aureus infections. N Engl J Med 2002;346:1871–7.
34. Kohler P, Bregenzer-Witteck A, Rettenmund G, et al. MRSA decolonization: success rate, risk factors for failure and optimal duration of follow-up. Infection 2013;41:33–40.
35. Ammerlaan HS, Kluytmans JA, Berkhout H, et al. Eradication of carriage with methicillin-resistant Staphylococcus aureus: effectiveness of a national guideline. J Antimicrob Chemother 2011;66:2409–17.
36. Bode LG, Kluytmans JA, Wertheim HF, et al. Preventing surgical-site infections in nasal carriers of Staphylococcus aureus. N Engl J Med 2010;362:9–17.
37. Nair R, Perencevich EN, Blevins AE, et al. Clinical effectiveness of mupirocin for preventing Staphylococcus aureus infections in nonsurgical settings: a meta-analysis. Clin Infect Dis 2016;62:618–30.
38. Huang SS, Septimus E, Kleinman K, et al. Targeted versus universal decolonization to prevent icu infection. N Engl J Med 2013;368:2255–65.
39. Schweizer ML, Chiang HY, Septimus E, et al. Association of a bundled intervention with surgical site infections among patients undergoing cardiac, hip, or knee surgery. JAMA 2015;313:2162–71.
40. Walsh EE, Greene L, Kirshner R. Sustained reduction in methicillin-resistant Staphylococcus aureus wound infections after cardiothoracic surgery. Arch Intern Med 2011;171:68–73.
41. Kim DH, Spencer M, Davidson SM, et al. Institutional prescreening for detection and eradication of methicillin-resistant Staphylococcus aureus in patients undergoing elective orthopaedic surgery. J Bone Joint Surg Am 2010;92:1820–6.
42. Lederle FA, Parenti CM, Berskow LC, Ellingson KJ. The idle intravenous catheter. Ann Intern Med 1992;116:737–8.
43. Avery CM, Ameerally P, Castling B, Swann RA. Infection of surgical wounds in the maxillofacial region and free flap donor sites with methicillin-resistant Staphylococcus aureus. Br J Oral Maxillofac Surg 2006;44:217–21.
44. Timsit JF, Schwebel C, Bouadma L, et al. Chlorhexidine-impregnated sponges and less frequent dressing changes for prevention of catheter-related infections in critically ill adults: a randomized controlled trial. JAMA 2009;301:1231–41.
45. Marschall J, Mermel LA, Fakih M, et al. Strategies to prevent central line-associated bloodstream infections in acute care hospitals: 2014 update. Infect Control Hosp Epidemiol 2014;35:753–71.
46. Manzur A, Gudiol F. Methicillin-resistant Staphylococcus aureus in long-term-care facilities. Clin Microbiol Infect 2009;15 Suppl 7:26–30.
47. Schora DM, Boehm S, Das S, et al. Impact of Detection, Education, Research and Decolonization without Isolation in Long-term care (DERAIL) on methicillin-resistant Staphylococcus aureus colonization and transmission at 3 long-term care facilities. Am J Infect Control 2014;42(10 Suppl):S269–73.
48. Rebmann T, Aureden K, Association for Professionals in Infection Control and Epidemiology. Preventing methicillin-resistant Staphylococcus aureus transmission in long-term care facilities: an executive summary of the APIC Elimination Guide. Am J Infect Control 2011;39:235–8.
49. Mitchell SL, Shaffer ML, Loeb MB, et al. Infection management and multidrug-resistant organisms in nursing home residents with advanced dementia. JAMA Intern Med 2014;174:1660–7.
50. Couderc C, Jolivet S, Thiebaut AC, et al. Fluoroquinolone use is a risk factor for methicillin-resistant Staphylococcus aureus acquisition in long-term care facilities: a nested case-case-control study. Clin Infect Dis 2014;59:206–15.
51. Lawes T, Lopez-Lozano JM, Nebot CA, et al. Effects of national antibiotic stewardship and infection control strategies on hospital-associated and community-associated meticillin-resistant Staphylococcus aureus infections across a region of Scotland: a non-linear time-series study. Lancet Infect Dis 2015;15:1438–49.
52. Centers for Disease Control and Prevention. Guideline for hand hygiene in health-care settings: Recommendations of the Healthcare Infection Control Practices Advisory Committee and the HICPAC/SHEA/APIC/IDSA Hand Hygiene Task Force. MMWR Recomm Rep 2002;51(RR-16):1–48.
53. Mortimer EA Jr, Lipsitz PJ, Wolinsky E, et al. Transmission of staphylococci between newborns. Importance of the hands to personnel. Am J Dis Child 1962;104:289–95.
54. Gagne D, Bedard G, Maziade PJ. Systematic patients’ hand disinfection: impact on meticillin-resistant Staphylococcus aureus infection rates in a community hospital. J Hosp Infect 2010;75:269–72.
55. Knelson LP, Williams DA, Gergen MF, et al. A comparison of environmental contamination by patients infected or colonized with methicillin-resistant Staphylococcus aureus or vancomycin-resistant enterococci: a multicenter study. Infect Control Hosp Epidemiol 2014;35:872–5.
56. Murphy CR, Eells SJ, Quan V, et al. Methicillin-resistant Staphylococcus aureus burden in nursing homes associated with environmental contamination of common areas. J Am Geriatr Soc 2012;60:1012–8.
57. Datta R, Platt R, Yokoe DS, Huang SS. Environmental cleaning intervention and risk of acquiring multidrug-resistant organisms from prior room occupants. Arch Intern Med 2011;171:491–4.
58. Dancer SJ. The role of environmental cleaning in the control of hospital-acquired infection. J Hosp Infect 2009;73:378–85.
59. Boyce JM, Potter-Bynoe G, Chenevert C, King T. Environmental contamination due to methicillin-resistant Staphylococcus aureus: possible infection control implications. Infect Control Hosp Epidemiol 1997;18:622–7.
60. Mollema FP, Richardus JH, Behrendt M, et al. Transmission of methicillin-resistant Staphylococcus aureus to household contacts. J Clin Microbiol 2010;48:202–7.
61. Calfee DP, Durbin LJ, Germanson TP, et al. Spread of methicillin-resistant Staphylococcus aureus (MRSA) among household contacts of individuals with nosocomially acquired MRSA. Infect Control Hosp Epidemiol 2003;24:422–6.
Promoting Quality Asthma Care in Hospital Emergency Departments: Past, Present, and Future Efforts in Florida
From the Florida State University College of Medicine, Tallahassee, FL.
Abstract
- Objective: To describe efforts to assess, improve, and reinforce asthma management protocols and practices at hospital emergency departments (EDs) in Florida.
- Methods: Description of 4 stages of an evaluation and outreach effort including assessment of current ED asthma care protocols and quality improvement plans; interactive education about asthma management best practices for hospital ED professionals; home visiting asthma management pilot programs for community members; and collaborative learning opportunities for clinicians and health care administrators.
- Results: We describe the evidence basis for each component of the Florida Asthma Program’s strategy, review key lessons learned, and discuss next steps.
- Conclusion: Promoting comprehensive, integrative asthma care within and beyond EDs will remain a top priority for the Florida Asthma Program. Our interdisciplinary team continues to explore additional strategies for creating transformational change in the quality and utilization of emergency care for Floridians of all ages who live with asthma.
Approximately 10% of children and 8% of adults in Florida live with asthma, a costly disease whose care expenses total over $56 billion in the United States each year [1]. Asthma prevalence and care costs continue to rise in Florida and other states [1], and 1.8 million asthma-related emergency department visits occur each year [2]. In 2010, a total of 90,770 emergency department visits occurred in Florida with asthma listed as the primary diagnosis, an increase of 12.7% from 2005 [1]. National standards for asthma care in the emergency department have been developed [3] and improving the quality of emergency department asthma care is a focus for many health care organizations.
In 2012, the Florida Asthma Program partnered with the Florida Hospital Association to review current asthma care activities and policies in emergency departments statewide. Evaluators from Florida State University developed and implemented a survey to assess gaps in emergency department asthma management at Florida hospitals. The survey illuminated strengths and weaknesses in the processes and resources used by hospital emergency departments in responding to asthma symptoms, and 3 follow-up interventions emerged from this assessment effort. In this paper, I discuss our survey findings and follow-up activities.
Assessment of ED Management Practices
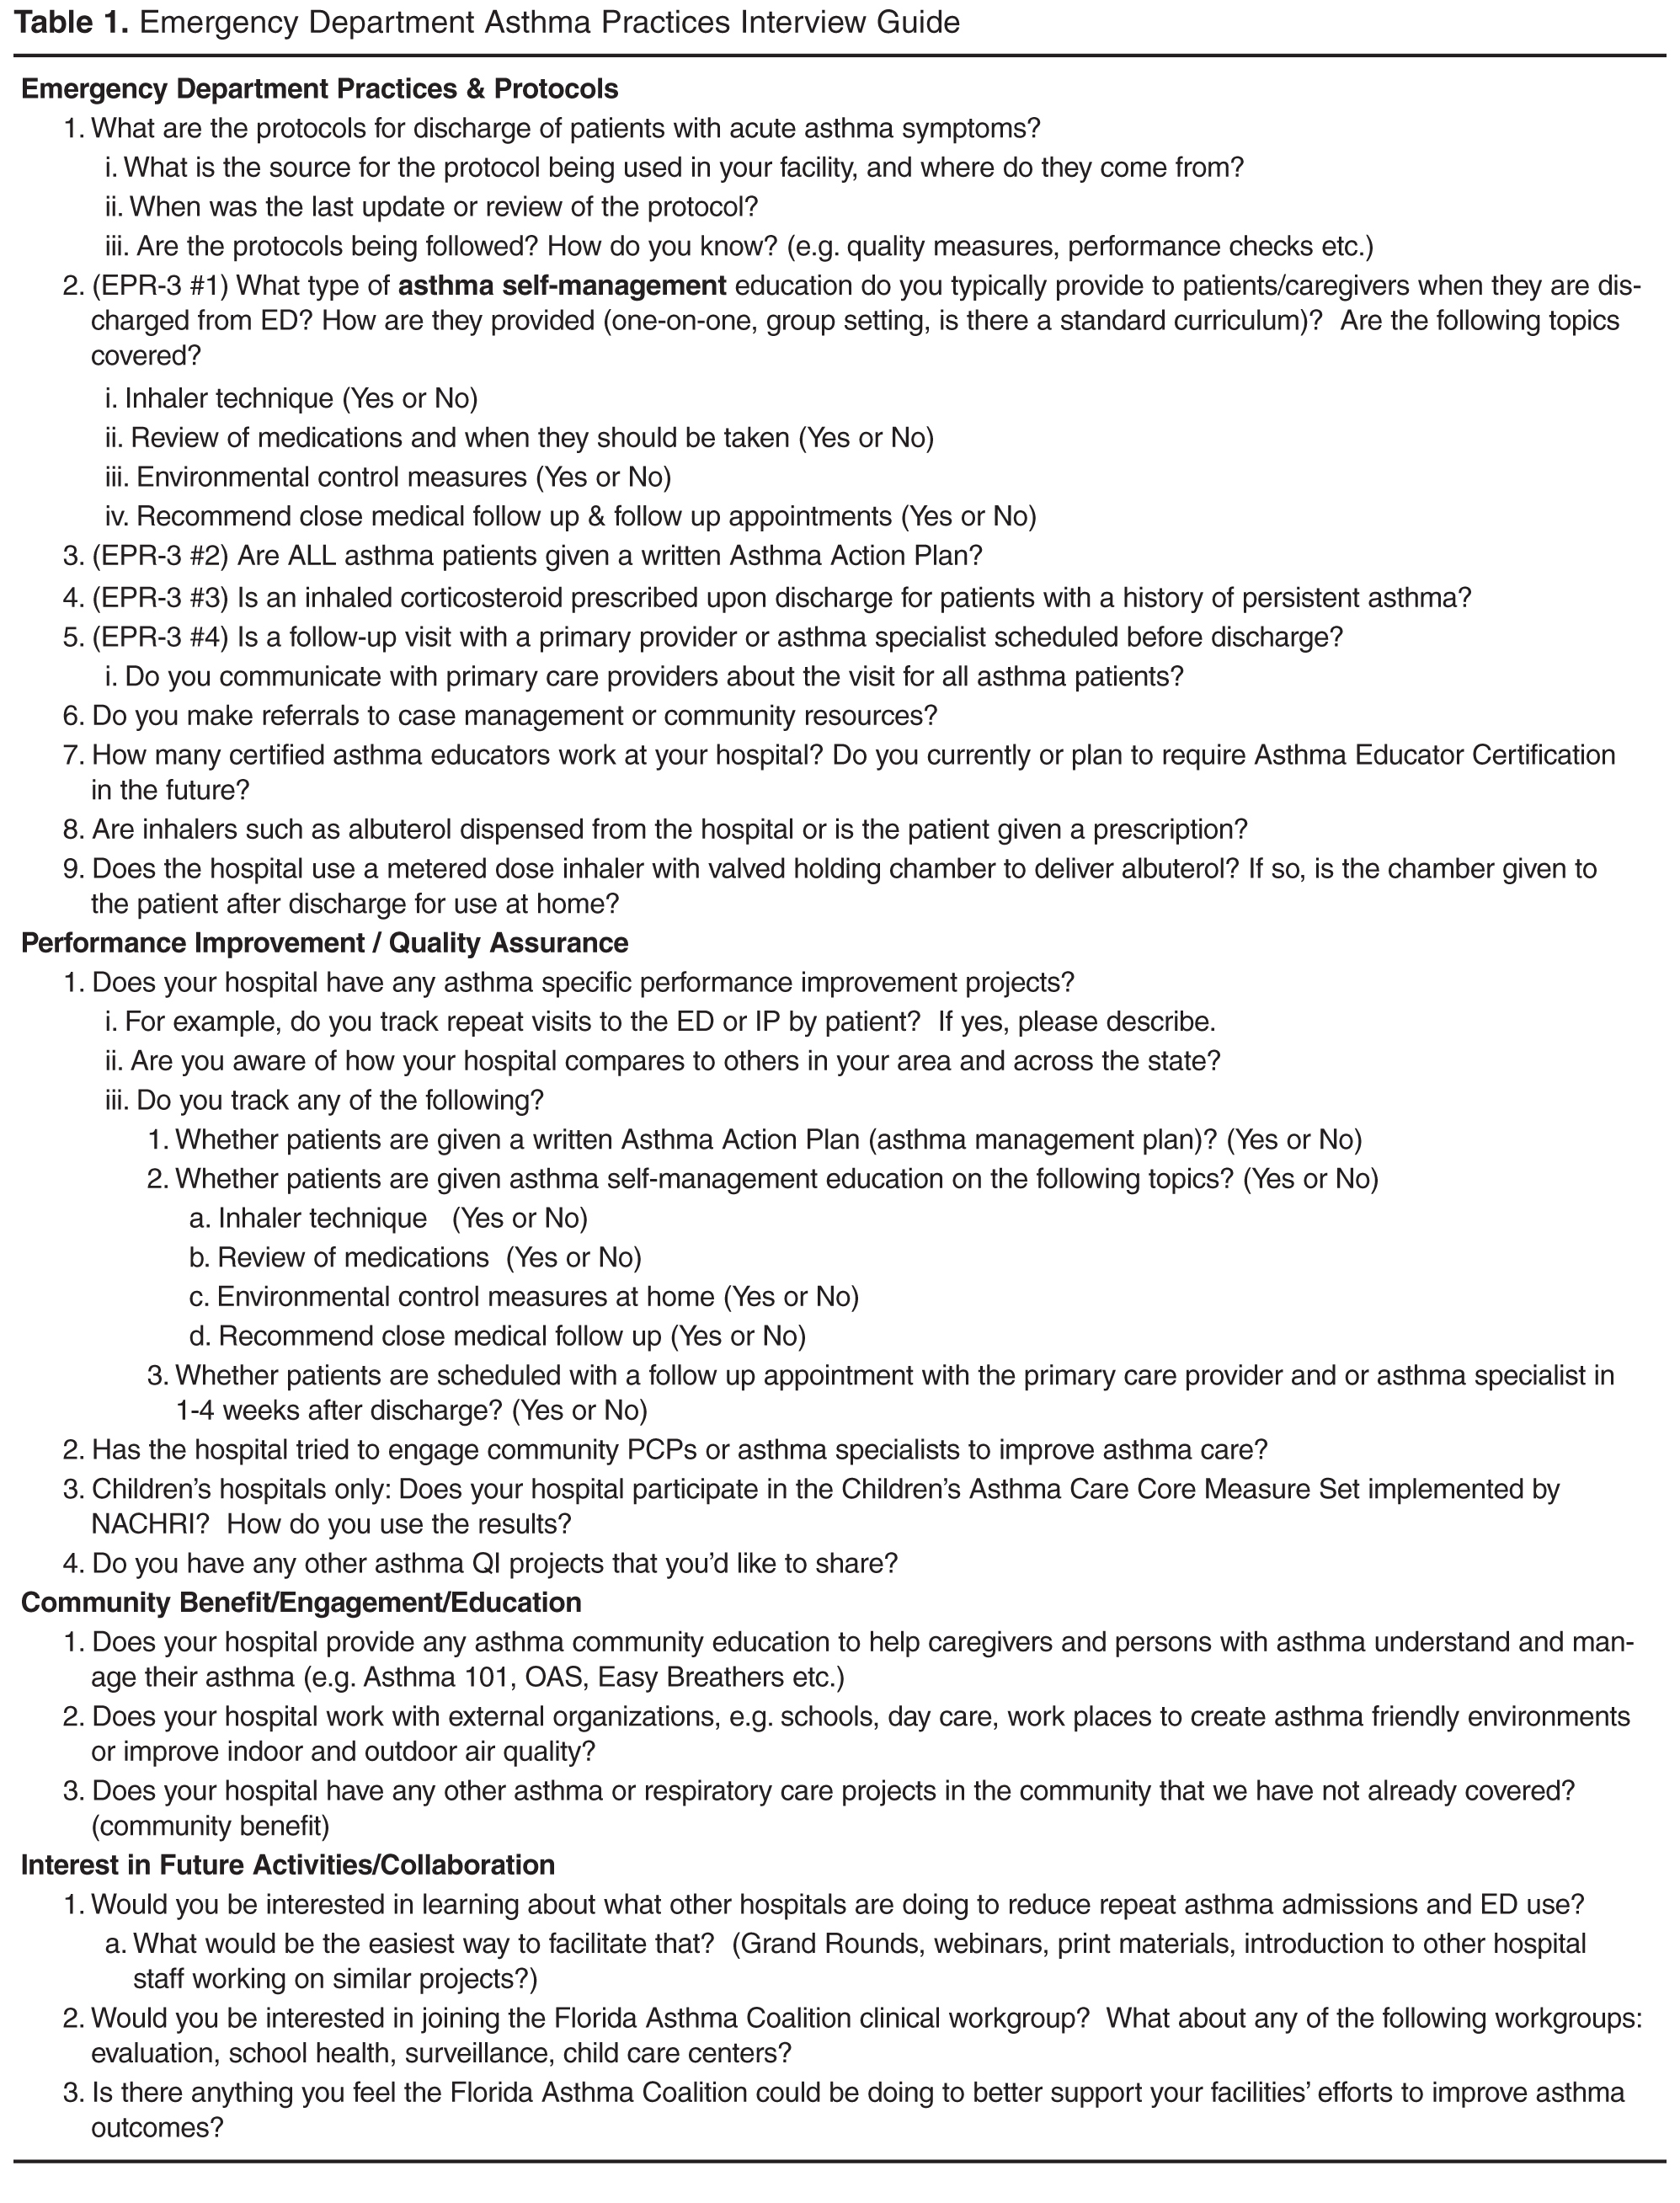
The survey instrument had both open- and closed-ended questions and took about 15 minutes to complete. Participants were advised that publicly available document would not identify individuals or hospitals by name and they would receive the final summary report.
Our results suggest inconsistency among sampled Florida hospitals’ adherence to national standards for treatment of asthma in emergency departments. Several hospitals were refining their emergency care protocols to incorporate guideline recommendations. Despite a lack of formal emergency department protocols in some hospitals, adherence to national guidelines for emergency care was robust for patient education and medication prescribing, but weaker for formal care planning and medical follow-up.
Each of our participating hospitals reported using an evidence-based approach that incorporated national asthma care guidelines. However, operationalization and documentation of guidelines-based care varied dramatically across participating hospitals. Some hospitals already had well-developed protocols for emergency department asthma care, including both detailed clinical pathways and more holistic approaches incorporating foundational elements of guidelines-based care. By contrast, others had no formal documentation of their asthma management practices for patients seen in the emergency department.
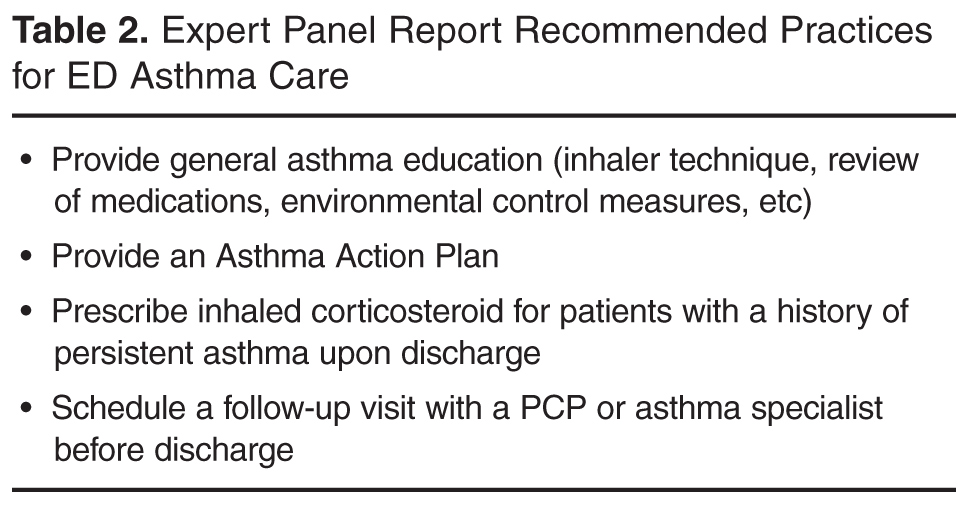
By contrast, we found that utilization of evidence-based supportive services was uniformly high. Specific emergency department asthma care services that appeared to be well developed in Florida were case management, community engagement, and asthma education by certified professionals. We also found that many of the hospitals were in the process of reviewing and documenting their emergency department asthma care practices at the time of our study. Participants noted particular challenges with creating written care plans and dispensing inhaled medications for home use. Following up on the latter issue revealed that Florida state policy on medication use and dispensation in emergency department setting were the main barrier to sending patients with asthma home from the emergency department with needed medications. Consequently, the Florida Asthma Program worked with the state board of pharmacy to implement reforms, which became effective February 2014 [6].
Educational Webinars
Research indicates that quality improvement interventions can improve the outcomes and processes of care for children with asthma [7]. We noted that respondents were often unaware of how other hospitals in the state compared to their own on both national quality measures and strategies for continuous quality improvement. Therefore, promoting dialogue and collaboration became a priority. We developed 2 webinars to allow hospital personnel to learn directly from each other about ways to improve emergency department asthma care. The webinars were open to personnel from any hospital in Florida that wished to attend, not just the hospitals that participated in the initial study.
Florida Asthma Coalition members with clinical expertise partnered with Florida Hospital Association employees and asthma program staff from the Department of Health to design the webinars. Presentations were invited from hospitals that had successfully incorporated EPR-3 guidance into all aspects of their emergency department asthma care and any associated follow-up services. We asked presenters to focus on how their hospitals overcame challenges to successful guideline implementation. During each interactive session, participants had the opportunity to ask questions and receive guidance from presenters and presenters also encouraged hospitals to develop their own internal training webinars and supportive resources for learning, and to share the interventions and materials they created with one another as well as relevant professional organizations.
The webinars were two complementary 90-minute sessions and were delivered in summer 2013. The first webinar, “Optimal Asthma Treatment in the Emergency Department,” focused specifically on best practices for care in emergency departments themselves. It covered EPR-3 recommended activities such as helping families create Asthma Action Plans and demonstrating proper inhaler technique. The second webinar, “Transitioning Asthma Care from the Emergency Department to Prevent Repeat Visits,” focused on strategies for preventing repeat visits with people who have been seen in the emergency department for asthma. It covered activities like creating linkages with primary and specialty care providers skilled in asthma care, and partnering with case management professionals to follow discharged patients over time. Both webinars emphasized strategies for consistently implementing and sustaining adherence to EPR-3 guidelines in emergency departments. Participants attended sessions from their offices or meeting rooms by logging onto the webinar in a browser window and dialing into the conference line. Full recordings of both sessions remain available online at http://floridaasthmacoalition.com/healthcare-providers/recorded-webinars/.
We evaluated the reach and effectiveness of the webinars [8]. Attendance was high, with 137 pre-registrants and many more participating. Over 90% of participants in each session rated the content and discussion as either very good or excellent, and at least 90% indicated that they would recommend the learning modules to their colleagues. Participants expressed strong interest in continuing the activities initiated with the web sessions on a year-round basis, with particular emphasis on partnership building, continuing education, and cooperative action.
Asthma-Friendly Homes Program
Data from our preliminary assessment of asthma management practices in Florida hospitals suggested that an important priority for improving emergency department asthma care is reducing repeat visits. Rates of repeated emergency department utilization for asthma management correlate inversely with both household income and quality of available resources for home self-management. Our team considered developing a home visiting program to bring asthma education programming and self-management tools to children and their families. Rather than trying to build a new program ourselves, we extended our focus on strategic partnership to the Florida department of health’s regional affiliate in Miami-Dade County, who were developing a home visiting intervention to reduce emergency department visits and improve continuity of care for children with asthma [9].
Early planning for the Miami-Dade program included a focus on low-income communities and households, including the homes of children with Latino and/or Haitian heritage. The Asthma-Friendly Homes Program was developed in partnership with Nicklaus Children’s Hospital, with the hospital and the local Department of Health affiliate sharing responsibility for program implementation and management as well as data collection [10]. Small adjustments were made to the overall program strategy as partner agencies began working with Florida Asthma Program managers and evaluators. Now in its second year of implementation, the Asthma-Friendly Homes Program continues to evolve and grow.
Preventing repeat visits to the emergency room in favor of daily self-management at home remains the central emphasis of the program. Its curriculum focuses on empowering children with asthma and their families to self-manage effectively and consistently. By consequence, the Asthma-Friendly Homes Program encourages patients to use emergency department care services only when indicated by signs and symptoms rather than as a primary source of care. To achieve these objectives, the program uses a combination of activities including home visits and regular follow-up by case management.
Delivery of the Asthma-Friendly Homes Program begins with determination of eligibility via medical records review. Data analysts from the regional Miami-Dade branch of department of health collaborate with case managers from Nicklaus Children’s Hospital to identify children who are eligible for participation. Eligibility criteria include 3 or more visits to the emergency room for asthma within the past year, related care costs totaling at least $50,000 in the past year, and residency in 1 of 7 target zip codes that represent low-income communities. When a child is deemed eligible, case managers contact their family to facilitate scheduling of a home environmental assessment by trained specialists from the department of health. During this visit, families receive information about common asthma triggers within their homes, and talk with environmental assessors about possible mitigation strategies that are appropriate for their specific economic and instrumental resources. At the conclusion of this visit, families are asked if they would like to receive an educational intervention to help their child build self-management skills in a supportive environment.
Families that wish to participate in the educational component of Asthma-Friendly Homes are then put in touch with a certified asthma educator employed by Nicklaus Children’s Hospital. Participants can schedule a preliminary visit with their asthma educator themselves, or work with case management at Nicklaus to coordinate intake for the educational program. Visiting asthma educators begin by completing a preliminary demographics, symptoms, and skills assessment with family members. They deliver 3 sessions of education for participating children, each time assessing progress using a standardized questionnaire. Although the evaluation instruments for these sessions are standard, the curriculum used by asthma educators is tailored to the needs of each individual child and their family. The demographics, symptoms, and skills assessment is repeated with family members at the end of the third visit from asthma educators. Finally, case managers follow up with families after 6 months to assess retention of benefits from the program.
Participating children are also tracked in the hospital’s emergency department records to contextualize success with home-based self-management. Like data from the questionnaires, this information gets shared with Florida Asthma Program evaluators. Our team uses these data to understand the effectiveness of the Asthma-Friendly Homes Program itself, as well as its utility for preventing repeated utilization of hospital emergency department services. The program currently has 9 families participating, which is on target for the early stages of our pilot program with Miami. As we evaluate Asthma-Friendly Homes, we hope that this program will become a new standard in evidence-based best practices for keeping children out of the emergency room and healthy at home, both in Florida and across the nation. To disseminate results from this intervention in ways that promote adoption of effective self-management curricula by organizations working with vulnerable populations, we are thus focusing intensively on building networks that facilitate this sharing.
Learning and Action Networks
Building on lessons learned from our evaluation of emergency department asthma care and delivery of interactive webinars, our team proposed a systems-focused approach for implementing and sharing knowledge gained from these activities. As such, the department of health is developing Learning and Action Networks. LANs are mechanisms by which large-scale improvement around a given aim is fostered, studied, adapted, and rapidly spread. LANs are similar to “communities of practice” in that they promote learning among peer practitioners, but differ in that they focus on a specific improvement initiative, in this case delivery of and reimbursement for comprehensive asthma management.
The department of health has so far implemented 2 LANs, one for managed care organizations including those working under Medicaid and Florida KidCare, and one for providers, including federally qualified health centers, community health centers, and rural health centers. In future funding years, LANs will be established for pharmacists, hospitals, and public housing groups to promote coverage for and utilization of comprehensive asthma control services.
LANs are carried out in partnership with the professional organizations and related umbrella organizations serving each sector. A minimum of 3 webinars will be offered each year for each LAN. They will promote active engagement and communication between partners as well as offer opportunities to share successes and troubleshooting tips. Online forums or other means of communication will also be established based on the needs of participants. Topics will be driven by participant interests and will include performance and quality improvement, public health/health care system linkages, use of decision support tools, use of electronic health records for care coordination, and other issues related to the provision and reimbursement for evidence-based, comprehensive asthma control services.
LAN facilitators and members will learn continuously from one another. Members can implement best practices for strategic collaboration learned from facilitators, while facilitators will become familiar with best practices for asthma care that can be disseminated within and beyond Florida.
The LAN for hospitals will cover improving emergency department asthma care. This may include performance and quality improvement strategies, systems-level linkages between public health and clinical care, provider decision support tools, use of electronic health records for care coordination, case management resources for continuous follow-up after discharge, and evidence-based approaches to medication dispensing and monitoring.
Conclusion
Promoting comprehensive, integrative asthma care within and beyond emergency departments will remain a top priority for the Florida Asthma Program. Our interdisciplinary team of program managers and external evaluators continues to explore additional strategies for creating transformational change in the quality and utilization of emergency care for Floridians of all ages who live with asthma.
Acknowledgements: I thank Ms. Kim Streit and other members of the Florida Hospital Association for their outstanding assistance in conceptualizing and implementing this evaluation project. I thank Ms. Julie Dudley for developing content for the collaborative learning webinars described herein, as well as proposing and operationalizing Florida’s Learning and Action Networks for asthma care. I thank Ms. Jamie Forrest for facilitating delivery and evaluation of the hospital learning webinars. I thank Dr. Brittny Wells for helping to develop the Learning and Action Networks initiative in conjunction with other programs, and facilitating continued collaboration with hospitals. I thank Dr. Asit Sarkar for coordinating the Asthma Friendly Homes Program in Miami-Dade, and for helping to bring this program to other Florida communities. I thank Dr. Henry Carretta for his partnership in conducting the preliminary evaluation survey, and for his assistance with planning evaluation of hospital care quality improvement activities for the current project cycle.
Corresponding author: Alexandra C.H. Nowakowski, PhD, MPH, FSU College of Medicine, Regional Campus – Orlando,50 E. Colonial Drive, Suite 200, Orlando, FL 32801.
Funding/support: Evaluation of the Florida Asthma Program’s preliminary work with hospitals was supported by Cooperative Agreement Number 5U59EH000523-03 from the Centers for Disease Control and Prevention (CDC). Current program development and evaluation efforts in this domain are supported by CDC Cooperative Agreement Number 2U59EH000523. Contents of this manuscript are solely the responsibility of the author and do not necessarily represent the official views of the CDC.
Financial disclosures: None.
1. Forrest J, Dudley J. Burden of Asthma in Florida. Florida Department of Health, Division of Community Health Promotion, Bureau of Chronic Disease Prevention, Florida Asthma Program. Accessed 22 Oct 2015 at www.floridaasthmacoalition.org.
2. National Hospital Ambulatory Medical Care Survey: 2011 Emergency department summary tables. Accessed 22 Oct 2015 at www.cdc.gov/nchs/data/ahcd/nhamcs_emergency/2011ed_web_tables.pdf.
3. National Heart, Lung, and Blood Institute. Expert Panel Report 3: Guidelines for the Diagnosis and Management of Asthma. NHLBI website. 2007. Accessed 22 Oct 2015 at www.nhlbi.nih.gov/files/docs/guidelines/asthgdln.pdf.
4. Florida Hospital Association. Facts & Stats. FHA website. 2012. Accessed 22 Oct 2015 at www.fha.org/reports-and-resources/facts-and-stats.aspx.
5. Nowakowski AC, Carretta HJ, Dudley JK, et al. Evaluating emergency department asthma management practices in Florida hospitals. J Public Health Manag Pract 2016;22:E8–E13.
6. State of Florida. The 2015 Florida Statutes, Chapter 465 – Pharmacy. Accessed 22 Oct 2015 at www.leg.state.fl.us/Statutes/index.cfm?App_mode=Display_Statute&URL=0400-0499/
0465/0465.html.
7. Bravata DM, Gienger AL, Holty JE, et al. Quality improvement strategies for children with asthma: a systematic review. Arch Pediatr Adolesc Med 2009;163:572–81.
8. Nowakowski ACH, Carretta HJ, Smith TR, et al. Improving asthma management in hospital emergency departments with interactive webinars. Florida Public Health Rev 2015;12:31–3.
9. Moore E. Introduction to the asthma home-visit collaborative project. Florida Department of Health in Miami-Dade County EPI monthly report 2015;16(8).
10. Florida Asthma Coalition. Asthma-Friendly Homes Project. Accessed 22 Oct 2015 at www.floridaasthmacoalition.com/healthcare-providers/asthma-friendly-home-project/.
From the Florida State University College of Medicine, Tallahassee, FL.
Abstract
- Objective: To describe efforts to assess, improve, and reinforce asthma management protocols and practices at hospital emergency departments (EDs) in Florida.
- Methods: Description of 4 stages of an evaluation and outreach effort including assessment of current ED asthma care protocols and quality improvement plans; interactive education about asthma management best practices for hospital ED professionals; home visiting asthma management pilot programs for community members; and collaborative learning opportunities for clinicians and health care administrators.
- Results: We describe the evidence basis for each component of the Florida Asthma Program’s strategy, review key lessons learned, and discuss next steps.
- Conclusion: Promoting comprehensive, integrative asthma care within and beyond EDs will remain a top priority for the Florida Asthma Program. Our interdisciplinary team continues to explore additional strategies for creating transformational change in the quality and utilization of emergency care for Floridians of all ages who live with asthma.
Approximately 10% of children and 8% of adults in Florida live with asthma, a costly disease whose care expenses total over $56 billion in the United States each year [1]. Asthma prevalence and care costs continue to rise in Florida and other states [1], and 1.8 million asthma-related emergency department visits occur each year [2]. In 2010, a total of 90,770 emergency department visits occurred in Florida with asthma listed as the primary diagnosis, an increase of 12.7% from 2005 [1]. National standards for asthma care in the emergency department have been developed [3] and improving the quality of emergency department asthma care is a focus for many health care organizations.
In 2012, the Florida Asthma Program partnered with the Florida Hospital Association to review current asthma care activities and policies in emergency departments statewide. Evaluators from Florida State University developed and implemented a survey to assess gaps in emergency department asthma management at Florida hospitals. The survey illuminated strengths and weaknesses in the processes and resources used by hospital emergency departments in responding to asthma symptoms, and 3 follow-up interventions emerged from this assessment effort. In this paper, I discuss our survey findings and follow-up activities.
Assessment of ED Management Practices
The survey instrument had both open- and closed-ended questions and took about 15 minutes to complete. Participants were advised that publicly available document would not identify individuals or hospitals by name and they would receive the final summary report.
Our results suggest inconsistency among sampled Florida hospitals’ adherence to national standards for treatment of asthma in emergency departments. Several hospitals were refining their emergency care protocols to incorporate guideline recommendations. Despite a lack of formal emergency department protocols in some hospitals, adherence to national guidelines for emergency care was robust for patient education and medication prescribing, but weaker for formal care planning and medical follow-up.
Each of our participating hospitals reported using an evidence-based approach that incorporated national asthma care guidelines. However, operationalization and documentation of guidelines-based care varied dramatically across participating hospitals. Some hospitals already had well-developed protocols for emergency department asthma care, including both detailed clinical pathways and more holistic approaches incorporating foundational elements of guidelines-based care. By contrast, others had no formal documentation of their asthma management practices for patients seen in the emergency department.
By contrast, we found that utilization of evidence-based supportive services was uniformly high. Specific emergency department asthma care services that appeared to be well developed in Florida were case management, community engagement, and asthma education by certified professionals. We also found that many of the hospitals were in the process of reviewing and documenting their emergency department asthma care practices at the time of our study. Participants noted particular challenges with creating written care plans and dispensing inhaled medications for home use. Following up on the latter issue revealed that Florida state policy on medication use and dispensation in emergency department setting were the main barrier to sending patients with asthma home from the emergency department with needed medications. Consequently, the Florida Asthma Program worked with the state board of pharmacy to implement reforms, which became effective February 2014 [6].
Educational Webinars
Research indicates that quality improvement interventions can improve the outcomes and processes of care for children with asthma [7]. We noted that respondents were often unaware of how other hospitals in the state compared to their own on both national quality measures and strategies for continuous quality improvement. Therefore, promoting dialogue and collaboration became a priority. We developed 2 webinars to allow hospital personnel to learn directly from each other about ways to improve emergency department asthma care. The webinars were open to personnel from any hospital in Florida that wished to attend, not just the hospitals that participated in the initial study.
Florida Asthma Coalition members with clinical expertise partnered with Florida Hospital Association employees and asthma program staff from the Department of Health to design the webinars. Presentations were invited from hospitals that had successfully incorporated EPR-3 guidance into all aspects of their emergency department asthma care and any associated follow-up services. We asked presenters to focus on how their hospitals overcame challenges to successful guideline implementation. During each interactive session, participants had the opportunity to ask questions and receive guidance from presenters and presenters also encouraged hospitals to develop their own internal training webinars and supportive resources for learning, and to share the interventions and materials they created with one another as well as relevant professional organizations.
The webinars were two complementary 90-minute sessions and were delivered in summer 2013. The first webinar, “Optimal Asthma Treatment in the Emergency Department,” focused specifically on best practices for care in emergency departments themselves. It covered EPR-3 recommended activities such as helping families create Asthma Action Plans and demonstrating proper inhaler technique. The second webinar, “Transitioning Asthma Care from the Emergency Department to Prevent Repeat Visits,” focused on strategies for preventing repeat visits with people who have been seen in the emergency department for asthma. It covered activities like creating linkages with primary and specialty care providers skilled in asthma care, and partnering with case management professionals to follow discharged patients over time. Both webinars emphasized strategies for consistently implementing and sustaining adherence to EPR-3 guidelines in emergency departments. Participants attended sessions from their offices or meeting rooms by logging onto the webinar in a browser window and dialing into the conference line. Full recordings of both sessions remain available online at http://floridaasthmacoalition.com/healthcare-providers/recorded-webinars/.
We evaluated the reach and effectiveness of the webinars [8]. Attendance was high, with 137 pre-registrants and many more participating. Over 90% of participants in each session rated the content and discussion as either very good or excellent, and at least 90% indicated that they would recommend the learning modules to their colleagues. Participants expressed strong interest in continuing the activities initiated with the web sessions on a year-round basis, with particular emphasis on partnership building, continuing education, and cooperative action.
Asthma-Friendly Homes Program
Data from our preliminary assessment of asthma management practices in Florida hospitals suggested that an important priority for improving emergency department asthma care is reducing repeat visits. Rates of repeated emergency department utilization for asthma management correlate inversely with both household income and quality of available resources for home self-management. Our team considered developing a home visiting program to bring asthma education programming and self-management tools to children and their families. Rather than trying to build a new program ourselves, we extended our focus on strategic partnership to the Florida department of health’s regional affiliate in Miami-Dade County, who were developing a home visiting intervention to reduce emergency department visits and improve continuity of care for children with asthma [9].
Early planning for the Miami-Dade program included a focus on low-income communities and households, including the homes of children with Latino and/or Haitian heritage. The Asthma-Friendly Homes Program was developed in partnership with Nicklaus Children’s Hospital, with the hospital and the local Department of Health affiliate sharing responsibility for program implementation and management as well as data collection [10]. Small adjustments were made to the overall program strategy as partner agencies began working with Florida Asthma Program managers and evaluators. Now in its second year of implementation, the Asthma-Friendly Homes Program continues to evolve and grow.
Preventing repeat visits to the emergency room in favor of daily self-management at home remains the central emphasis of the program. Its curriculum focuses on empowering children with asthma and their families to self-manage effectively and consistently. By consequence, the Asthma-Friendly Homes Program encourages patients to use emergency department care services only when indicated by signs and symptoms rather than as a primary source of care. To achieve these objectives, the program uses a combination of activities including home visits and regular follow-up by case management.
Delivery of the Asthma-Friendly Homes Program begins with determination of eligibility via medical records review. Data analysts from the regional Miami-Dade branch of department of health collaborate with case managers from Nicklaus Children’s Hospital to identify children who are eligible for participation. Eligibility criteria include 3 or more visits to the emergency room for asthma within the past year, related care costs totaling at least $50,000 in the past year, and residency in 1 of 7 target zip codes that represent low-income communities. When a child is deemed eligible, case managers contact their family to facilitate scheduling of a home environmental assessment by trained specialists from the department of health. During this visit, families receive information about common asthma triggers within their homes, and talk with environmental assessors about possible mitigation strategies that are appropriate for their specific economic and instrumental resources. At the conclusion of this visit, families are asked if they would like to receive an educational intervention to help their child build self-management skills in a supportive environment.
Families that wish to participate in the educational component of Asthma-Friendly Homes are then put in touch with a certified asthma educator employed by Nicklaus Children’s Hospital. Participants can schedule a preliminary visit with their asthma educator themselves, or work with case management at Nicklaus to coordinate intake for the educational program. Visiting asthma educators begin by completing a preliminary demographics, symptoms, and skills assessment with family members. They deliver 3 sessions of education for participating children, each time assessing progress using a standardized questionnaire. Although the evaluation instruments for these sessions are standard, the curriculum used by asthma educators is tailored to the needs of each individual child and their family. The demographics, symptoms, and skills assessment is repeated with family members at the end of the third visit from asthma educators. Finally, case managers follow up with families after 6 months to assess retention of benefits from the program.
Participating children are also tracked in the hospital’s emergency department records to contextualize success with home-based self-management. Like data from the questionnaires, this information gets shared with Florida Asthma Program evaluators. Our team uses these data to understand the effectiveness of the Asthma-Friendly Homes Program itself, as well as its utility for preventing repeated utilization of hospital emergency department services. The program currently has 9 families participating, which is on target for the early stages of our pilot program with Miami. As we evaluate Asthma-Friendly Homes, we hope that this program will become a new standard in evidence-based best practices for keeping children out of the emergency room and healthy at home, both in Florida and across the nation. To disseminate results from this intervention in ways that promote adoption of effective self-management curricula by organizations working with vulnerable populations, we are thus focusing intensively on building networks that facilitate this sharing.
Learning and Action Networks
Building on lessons learned from our evaluation of emergency department asthma care and delivery of interactive webinars, our team proposed a systems-focused approach for implementing and sharing knowledge gained from these activities. As such, the department of health is developing Learning and Action Networks. LANs are mechanisms by which large-scale improvement around a given aim is fostered, studied, adapted, and rapidly spread. LANs are similar to “communities of practice” in that they promote learning among peer practitioners, but differ in that they focus on a specific improvement initiative, in this case delivery of and reimbursement for comprehensive asthma management.
The department of health has so far implemented 2 LANs, one for managed care organizations including those working under Medicaid and Florida KidCare, and one for providers, including federally qualified health centers, community health centers, and rural health centers. In future funding years, LANs will be established for pharmacists, hospitals, and public housing groups to promote coverage for and utilization of comprehensive asthma control services.
LANs are carried out in partnership with the professional organizations and related umbrella organizations serving each sector. A minimum of 3 webinars will be offered each year for each LAN. They will promote active engagement and communication between partners as well as offer opportunities to share successes and troubleshooting tips. Online forums or other means of communication will also be established based on the needs of participants. Topics will be driven by participant interests and will include performance and quality improvement, public health/health care system linkages, use of decision support tools, use of electronic health records for care coordination, and other issues related to the provision and reimbursement for evidence-based, comprehensive asthma control services.
LAN facilitators and members will learn continuously from one another. Members can implement best practices for strategic collaboration learned from facilitators, while facilitators will become familiar with best practices for asthma care that can be disseminated within and beyond Florida.
The LAN for hospitals will cover improving emergency department asthma care. This may include performance and quality improvement strategies, systems-level linkages between public health and clinical care, provider decision support tools, use of electronic health records for care coordination, case management resources for continuous follow-up after discharge, and evidence-based approaches to medication dispensing and monitoring.
Conclusion
Promoting comprehensive, integrative asthma care within and beyond emergency departments will remain a top priority for the Florida Asthma Program. Our interdisciplinary team of program managers and external evaluators continues to explore additional strategies for creating transformational change in the quality and utilization of emergency care for Floridians of all ages who live with asthma.
Acknowledgements: I thank Ms. Kim Streit and other members of the Florida Hospital Association for their outstanding assistance in conceptualizing and implementing this evaluation project. I thank Ms. Julie Dudley for developing content for the collaborative learning webinars described herein, as well as proposing and operationalizing Florida’s Learning and Action Networks for asthma care. I thank Ms. Jamie Forrest for facilitating delivery and evaluation of the hospital learning webinars. I thank Dr. Brittny Wells for helping to develop the Learning and Action Networks initiative in conjunction with other programs, and facilitating continued collaboration with hospitals. I thank Dr. Asit Sarkar for coordinating the Asthma Friendly Homes Program in Miami-Dade, and for helping to bring this program to other Florida communities. I thank Dr. Henry Carretta for his partnership in conducting the preliminary evaluation survey, and for his assistance with planning evaluation of hospital care quality improvement activities for the current project cycle.
Corresponding author: Alexandra C.H. Nowakowski, PhD, MPH, FSU College of Medicine, Regional Campus – Orlando,50 E. Colonial Drive, Suite 200, Orlando, FL 32801.
Funding/support: Evaluation of the Florida Asthma Program’s preliminary work with hospitals was supported by Cooperative Agreement Number 5U59EH000523-03 from the Centers for Disease Control and Prevention (CDC). Current program development and evaluation efforts in this domain are supported by CDC Cooperative Agreement Number 2U59EH000523. Contents of this manuscript are solely the responsibility of the author and do not necessarily represent the official views of the CDC.
Financial disclosures: None.
1. Forrest J, Dudley J. Burden of Asthma in Florida. Florida Department of Health, Division of Community Health Promotion, Bureau of Chronic Disease Prevention, Florida Asthma Program. Accessed 22 Oct 2015 at www.floridaasthmacoalition.org.
2. National Hospital Ambulatory Medical Care Survey: 2011 Emergency department summary tables. Accessed 22 Oct 2015 at www.cdc.gov/nchs/data/ahcd/nhamcs_emergency/2011ed_web_tables.pdf.
3. National Heart, Lung, and Blood Institute. Expert Panel Report 3: Guidelines for the Diagnosis and Management of Asthma. NHLBI website. 2007. Accessed 22 Oct 2015 at www.nhlbi.nih.gov/files/docs/guidelines/asthgdln.pdf.
4. Florida Hospital Association. Facts & Stats. FHA website. 2012. Accessed 22 Oct 2015 at www.fha.org/reports-and-resources/facts-and-stats.aspx.
5. Nowakowski AC, Carretta HJ, Dudley JK, et al. Evaluating emergency department asthma management practices in Florida hospitals. J Public Health Manag Pract 2016;22:E8–E13.
6. State of Florida. The 2015 Florida Statutes, Chapter 465 – Pharmacy. Accessed 22 Oct 2015 at www.leg.state.fl.us/Statutes/index.cfm?App_mode=Display_Statute&URL=0400-0499/
0465/0465.html.
7. Bravata DM, Gienger AL, Holty JE, et al. Quality improvement strategies for children with asthma: a systematic review. Arch Pediatr Adolesc Med 2009;163:572–81.
8. Nowakowski ACH, Carretta HJ, Smith TR, et al. Improving asthma management in hospital emergency departments with interactive webinars. Florida Public Health Rev 2015;12:31–3.
9. Moore E. Introduction to the asthma home-visit collaborative project. Florida Department of Health in Miami-Dade County EPI monthly report 2015;16(8).
10. Florida Asthma Coalition. Asthma-Friendly Homes Project. Accessed 22 Oct 2015 at www.floridaasthmacoalition.com/healthcare-providers/asthma-friendly-home-project/.
Nonadherence and Visit-to-Visit Variability of Blood Pressure
Study Overview
Objective. To determine the association between antihypertensive medication adherence and visit-to-visit variability of blood pressure (BP).
Design. Post hoc analysis of ALLHAT, a randomized, double-blind, multicenter trial to determine whether treatment with calcium-channel blockers, angiotensin-converting enzyme inhibitors, or α-adrenergic blockers, all newer antihypertensive classes at the time of the study, was superior to treatment with a thiazide diuretic for lowering risk for fatal coronary heart disease (CHD) or nonfatal myocardial infarction (MI) (primary outcomes), with secondary outcomes including all-cause mortality, stroke, and combined cardiovascular disease (CHD death, nonfatal MI, stroke, angina, coronary revascularization, congestive heart failure, and peripheral arterial disease).
Setting and participants. Participants who had BP and medication adherence data from at least 5 of the 7 study visits conducted 6 to 28 months after randomization. Only patients who had no outcome events within the 28 months were included in the analysis (ie, no fatal CHD or nonfatal MI, stroke, all-cause mortality, or heart failure). In a secondary analysis, participants who had data from 5 of the 7 study visits between 32 to 56 months after randomization were included.
Measures. Adherence to medication was assessed at each visit by a study clinician using the Adherence Survival Kit developed for ALLHAT. Participants were asked whether they had taken at least 80% of their assigned study drug since the last follow-up visit. For primary analyses, participants were categorized as nonadherent if they reported having taken < 80% of their assigned antihypertensive medication at ≥ 1 visits during the 6- to 28-month time period after randomization. For secondary analyses, participants were categorized as nonadherent if they reported having taken < 80% of their assigned medication at ≥ 1 visits during the 32 to 56 months after randomization. In a sensitivity analysis, participants were categorized as nonadherent if they reported taking < 80% of the prescribed antihypertensive medication at ≥ 2 visits during the 6 to 28 months post-randomization time period. Visit-to-visit variability of BP was calculated using 3 metrics based on each ALLHAT participants’ BP measurements: standard deviation independent of mean (SDIM), SD, and average real variability. The BP used for these calculations was the mean of 2 measurements taken during each follow-up study visit according to a standardized BP measurement protocol. Participants were followed from the end of the visit-to-visit variability of BP assessment period to the date of each outcome, their date of death, or end of active ALLHAT follow-up.
Results. Of 33,357 participants randomized, 19,970 participants met eligibility criteria for primary analyses. Of these, 2912 participants (15%) were considered nonadherent. Compared with adherent participants, nonadherent participants were slightly older and more likely to be Hispanic or black. Nonadherent participants were more likely to have evidence of end-organ damage as signified by major ST segment depression or T wave inversion or left ventricular hypertrophy on electrocardiogram but were less likely to have a history of MI, stroke, or coronary revascularization. Nonadherent participants were also less likely to have used BP medications before randomization and less likely to use statins during follow-up. Nonadherent participants were more likely to have changes in BP medication classes during follow-up, were more likely to have uncontrolled BP between 6 and 28 months after randomization, and had higher mean systolic blood pressure (SBP) and diastolic blood pressure (DBP) at the visits. The association between nonadherence and higher BP remained statistically significant in adjusted analyses.
SDIM of SBP was higher among those who were nonadherent (11.4 ± 4.9 versus 10.5 ± 4.5; P < 0.001). After full adjustment, nonadherent participants had 0.8 (95% CI, 0.7–1.0; P < 0.001) higher SDIM of SBP than adherent participants. In addition, compared with adherent participants, nonadherent participants had higher SD and average real variability of SBP. Researcher found the same pattern when the sample was restricted to 11,290 participants without antihypertensive medication changes. The association between adherence status and visit-to-visit variability of SBP was consistent across antihypertensive drug randomization assignment for interaction term for all definitions of visit-to-visit variability of SBP (P > 0.8). Nonadherent participants also had higher visit-to-visit variability of DBP.
Overall, 4.6% of participants had ≥ 2 visits with < 80% adherence. SDIM of SBP was higher among nonadherent participants versus adherent participants according to this more stringent categorization of nonadherence (11.0 ± 4.6 vs. 10.6 ± 4.6; P = 0.01). After full multivariable adjustment, SDIM of SBP was 0.5 (95% CI, 0.2–0.9; P = 0.001) higher among nonadherent than among adherent participants. Participants who were nonadherent in both the early and late study periods had higher SDIMs of SBP than those who were adherent in both study periods. Minimal changes were found in the SDIM of SBP between the early and late study periods for participants who were adherent in both study periods and nonadherent in both study periods. However, a significant number of participants, had a change in adherence between the early and late study period, with 6.5% switching from adherent to nonadherent and 10.0% switching from nonadherent to adherent. Compared with participants who were adherent in both time periods, participants who changed from adherent to non-adherent had an increase in SDIM of SBP (0.9; 95% CI, 0.5–1.3; P < 0.001), whereas participants who changed from nonadherent to adherent had a decrease in SDIM of SBP (−0.7; 95% CI, −1.0 to −0.3; P < 0.001). Among participants in the primary analysis without a cardiovascular event before the 28-month visit (n = 18 442), being in the highest versus lowest quintile of SDIM of SBP was associated with increased risk of fatal CHD or nonfatal MI, stroke, heart failure, and all-cause mortality after multivariable adjustment. In a mediation analysis, further adjustment for adherence status did not explain the association between SDIM of SBP and any of our cardiovascular or mortality outcomes.
Conclusion. The study provided significant evidence that medication adherence reduces visit-to-visit variability of BP. However, visit-to-visit variability of BP is associated with cardiovascular outcomes independent of medication adherence. Further work is needed to examine both the mechanisms underlying the association between visit-to-visit variability of BP and cardiovascular outcomes and whether decreasing visit-to-visit variability of BP can improve health outcomes.
Commentary
Hypertension remains one of the most important preventable contributors to disease and death [1]. Health care providers continue to reinforce the importance of adherence to medication treatment in conjunction with the adoption of healthy lifestyle habits, which have been shown to be effective interventions [2]. Low adherence to antihypertensive medication has been hypothesized to increase visit-to-visit variability of BP. Literature has shown that visit-to-visit variability of BP is associated with increased risk for stroke, CHD, and mortality [3]. In this post hoc analysis of ALLHAT, the researchers found that nonadherence was associated with increased visit-to-visit variability of BP. The study extended the findings of only a few studies that have tested this association.
Efforts to improve adherence could impact the occurrence of visit-to-visit variability of BP. Current methods of improving medication adherence for chronic health problems are mostly complex and not very effective. Awareness and commitment are essential to promote and ensure adherence in the treatment of disease [4]. Advances in this field of research are needed, including improved design of feasible long-term interventions, objective adherence measures, and sufficient study power to detect improvements outcomes that patients care about [4].
However, in this study, medication nonadherence did not explain the association between visit-to-visit variability of BP levels and cardiovascular risk. The researchers posit that in light of this, improving adherence is unlikely to offset the increased risk associated with visit-to-visit variability of BP found in treated patients with hypertension.
Limitations of this study include the use of self-report for adherence measurement, use of a summary measure for adherence, and the exclusion of a substantial number of participants who had < 5 visits in which adherence was assessed.
Applications for Clinical Practice
Although nonadherence to medication treatment contributed to visit-to-visit variability of BP, nonadherence did not explain why individuals with higher visit-to-visit of BP were at increased cardiovascular risk. Additional research is suggested in order to better understand how visit-to-visit variability of BP levels influences prognosis of hypertension.
—Paloma Cesar de Sales, BS, RN, MS
1. James PA, Oparil S, Carter BL, et al. 2014 evidence-based guideline for the management of high blood pressure in adults: report from the panel members appointed to the Eighth Joint National Committee (JNC 8). JAMA 2014;311:
507–20.
2. Brook RD, Appel LJ, Rubenfire M, et al; American Heart Association Professional Education Committee of the Council for High Blood Pressure Research, Council on Cardiovascular and Stroke Nursing, Council on Epidemiology and Prevention, and Council on Nutrition, Physical Activity. Beyond medications and diet: alternative approaches to lowering blood pressure: a scientific statement from the American Heart Association. Hypertension 2013;61:1360–83.
3. Muntner P, Whittle J, Lynch AI, et al. Visit-to-visit variability of blood pressure and coronary heart disease, stroke, heart failure, and mortality: a cohort study. Ann Intern Med 2015;163:329–38.
4. Nieuwlaat R, Wilczynski N, Navarro T, et al. Interventions for enhancing medication adherence. Cochrane Database Syst Rev 2014;(11):CD000011.
Study Overview
Objective. To determine the association between antihypertensive medication adherence and visit-to-visit variability of blood pressure (BP).
Design. Post hoc analysis of ALLHAT, a randomized, double-blind, multicenter trial to determine whether treatment with calcium-channel blockers, angiotensin-converting enzyme inhibitors, or α-adrenergic blockers, all newer antihypertensive classes at the time of the study, was superior to treatment with a thiazide diuretic for lowering risk for fatal coronary heart disease (CHD) or nonfatal myocardial infarction (MI) (primary outcomes), with secondary outcomes including all-cause mortality, stroke, and combined cardiovascular disease (CHD death, nonfatal MI, stroke, angina, coronary revascularization, congestive heart failure, and peripheral arterial disease).
Setting and participants. Participants who had BP and medication adherence data from at least 5 of the 7 study visits conducted 6 to 28 months after randomization. Only patients who had no outcome events within the 28 months were included in the analysis (ie, no fatal CHD or nonfatal MI, stroke, all-cause mortality, or heart failure). In a secondary analysis, participants who had data from 5 of the 7 study visits between 32 to 56 months after randomization were included.
Measures. Adherence to medication was assessed at each visit by a study clinician using the Adherence Survival Kit developed for ALLHAT. Participants were asked whether they had taken at least 80% of their assigned study drug since the last follow-up visit. For primary analyses, participants were categorized as nonadherent if they reported having taken < 80% of their assigned antihypertensive medication at ≥ 1 visits during the 6- to 28-month time period after randomization. For secondary analyses, participants were categorized as nonadherent if they reported having taken < 80% of their assigned medication at ≥ 1 visits during the 32 to 56 months after randomization. In a sensitivity analysis, participants were categorized as nonadherent if they reported taking < 80% of the prescribed antihypertensive medication at ≥ 2 visits during the 6 to 28 months post-randomization time period. Visit-to-visit variability of BP was calculated using 3 metrics based on each ALLHAT participants’ BP measurements: standard deviation independent of mean (SDIM), SD, and average real variability. The BP used for these calculations was the mean of 2 measurements taken during each follow-up study visit according to a standardized BP measurement protocol. Participants were followed from the end of the visit-to-visit variability of BP assessment period to the date of each outcome, their date of death, or end of active ALLHAT follow-up.
Results. Of 33,357 participants randomized, 19,970 participants met eligibility criteria for primary analyses. Of these, 2912 participants (15%) were considered nonadherent. Compared with adherent participants, nonadherent participants were slightly older and more likely to be Hispanic or black. Nonadherent participants were more likely to have evidence of end-organ damage as signified by major ST segment depression or T wave inversion or left ventricular hypertrophy on electrocardiogram but were less likely to have a history of MI, stroke, or coronary revascularization. Nonadherent participants were also less likely to have used BP medications before randomization and less likely to use statins during follow-up. Nonadherent participants were more likely to have changes in BP medication classes during follow-up, were more likely to have uncontrolled BP between 6 and 28 months after randomization, and had higher mean systolic blood pressure (SBP) and diastolic blood pressure (DBP) at the visits. The association between nonadherence and higher BP remained statistically significant in adjusted analyses.
SDIM of SBP was higher among those who were nonadherent (11.4 ± 4.9 versus 10.5 ± 4.5; P < 0.001). After full adjustment, nonadherent participants had 0.8 (95% CI, 0.7–1.0; P < 0.001) higher SDIM of SBP than adherent participants. In addition, compared with adherent participants, nonadherent participants had higher SD and average real variability of SBP. Researcher found the same pattern when the sample was restricted to 11,290 participants without antihypertensive medication changes. The association between adherence status and visit-to-visit variability of SBP was consistent across antihypertensive drug randomization assignment for interaction term for all definitions of visit-to-visit variability of SBP (P > 0.8). Nonadherent participants also had higher visit-to-visit variability of DBP.
Overall, 4.6% of participants had ≥ 2 visits with < 80% adherence. SDIM of SBP was higher among nonadherent participants versus adherent participants according to this more stringent categorization of nonadherence (11.0 ± 4.6 vs. 10.6 ± 4.6; P = 0.01). After full multivariable adjustment, SDIM of SBP was 0.5 (95% CI, 0.2–0.9; P = 0.001) higher among nonadherent than among adherent participants. Participants who were nonadherent in both the early and late study periods had higher SDIMs of SBP than those who were adherent in both study periods. Minimal changes were found in the SDIM of SBP between the early and late study periods for participants who were adherent in both study periods and nonadherent in both study periods. However, a significant number of participants, had a change in adherence between the early and late study period, with 6.5% switching from adherent to nonadherent and 10.0% switching from nonadherent to adherent. Compared with participants who were adherent in both time periods, participants who changed from adherent to non-adherent had an increase in SDIM of SBP (0.9; 95% CI, 0.5–1.3; P < 0.001), whereas participants who changed from nonadherent to adherent had a decrease in SDIM of SBP (−0.7; 95% CI, −1.0 to −0.3; P < 0.001). Among participants in the primary analysis without a cardiovascular event before the 28-month visit (n = 18 442), being in the highest versus lowest quintile of SDIM of SBP was associated with increased risk of fatal CHD or nonfatal MI, stroke, heart failure, and all-cause mortality after multivariable adjustment. In a mediation analysis, further adjustment for adherence status did not explain the association between SDIM of SBP and any of our cardiovascular or mortality outcomes.
Conclusion. The study provided significant evidence that medication adherence reduces visit-to-visit variability of BP. However, visit-to-visit variability of BP is associated with cardiovascular outcomes independent of medication adherence. Further work is needed to examine both the mechanisms underlying the association between visit-to-visit variability of BP and cardiovascular outcomes and whether decreasing visit-to-visit variability of BP can improve health outcomes.
Commentary
Hypertension remains one of the most important preventable contributors to disease and death [1]. Health care providers continue to reinforce the importance of adherence to medication treatment in conjunction with the adoption of healthy lifestyle habits, which have been shown to be effective interventions [2]. Low adherence to antihypertensive medication has been hypothesized to increase visit-to-visit variability of BP. Literature has shown that visit-to-visit variability of BP is associated with increased risk for stroke, CHD, and mortality [3]. In this post hoc analysis of ALLHAT, the researchers found that nonadherence was associated with increased visit-to-visit variability of BP. The study extended the findings of only a few studies that have tested this association.
Efforts to improve adherence could impact the occurrence of visit-to-visit variability of BP. Current methods of improving medication adherence for chronic health problems are mostly complex and not very effective. Awareness and commitment are essential to promote and ensure adherence in the treatment of disease [4]. Advances in this field of research are needed, including improved design of feasible long-term interventions, objective adherence measures, and sufficient study power to detect improvements outcomes that patients care about [4].
However, in this study, medication nonadherence did not explain the association between visit-to-visit variability of BP levels and cardiovascular risk. The researchers posit that in light of this, improving adherence is unlikely to offset the increased risk associated with visit-to-visit variability of BP found in treated patients with hypertension.
Limitations of this study include the use of self-report for adherence measurement, use of a summary measure for adherence, and the exclusion of a substantial number of participants who had < 5 visits in which adherence was assessed.
Applications for Clinical Practice
Although nonadherence to medication treatment contributed to visit-to-visit variability of BP, nonadherence did not explain why individuals with higher visit-to-visit of BP were at increased cardiovascular risk. Additional research is suggested in order to better understand how visit-to-visit variability of BP levels influences prognosis of hypertension.
—Paloma Cesar de Sales, BS, RN, MS
1. James PA, Oparil S, Carter BL, et al. 2014 evidence-based guideline for the management of high blood pressure in adults: report from the panel members appointed to the Eighth Joint National Committee (JNC 8). JAMA 2014;311:
507–20.
2. Brook RD, Appel LJ, Rubenfire M, et al; American Heart Association Professional Education Committee of the Council for High Blood Pressure Research, Council on Cardiovascular and Stroke Nursing, Council on Epidemiology and Prevention, and Council on Nutrition, Physical Activity. Beyond medications and diet: alternative approaches to lowering blood pressure: a scientific statement from the American Heart Association. Hypertension 2013;61:1360–83.
3. Muntner P, Whittle J, Lynch AI, et al. Visit-to-visit variability of blood pressure and coronary heart disease, stroke, heart failure, and mortality: a cohort study. Ann Intern Med 2015;163:329–38.
4. Nieuwlaat R, Wilczynski N, Navarro T, et al. Interventions for enhancing medication adherence. Cochrane Database Syst Rev 2014;(11):CD000011.
Quality Measure Attainment After Add-on Therapy of Both Saxagliptin and Dapagliflozin to Metformin Versus Single Add-On of Saxagliptin or Dapagliflozin
From the Ochsner Diabetes Clinical Research Unit, Frank Riddick Diabetes Institute, Department of Endocrinology, Ochsner Medical Center, New Orleans, LA (Dr. Blonde), and AstraZeneca, Gaithersburg, MD (Drs. Sheehan, Barrett, and Garcia-Sanchez).
Abstract
- Objective: To evaluate diabetes care quality measure attainment, specifically, blood glucose and blood pressure (BP) control, with saxagliptin, a dipeptidyl peptidase-4 inhibitor, and dapagliflozin, a sodium-glucose cotransporter-2 inhibitor, added singly or as dual add-on therapy in patients with type 2 diabetes inadequately controlled with metformin alone.
- Methods: Analysis of a phase 3, randomized, double-blind, active-controlled, parallel-group trial was conducted. Patients were randomized 1:1:1 to receive saxagliptin 5 mg/d plus dapagliflozin 10 mg/d, saxagliptin 5 mg/d, or dapagliflozin 10 mg/d as add-on to metformin 1500 to 2000 mg/d. Assessments included attainment of individual and composite glycated hemoglobin (A1C) and BP measures at 24 weeks of treatment.
- Results: Compared with single add-on saxagliptin or dapagliflozin, dual add-on saxagliptin plus dapagliflozin to metformin was associated with significantly more patients attaining the individual quality measures of A1C < 7% and A1C < 8%. Similarly, dual add-on saxagliptin plus dapagliflozin was associated with significantly more patients attaining the composite quality measures A1C < 7% and BP < 140/90 mm Hg and A1C < 8% and BP < 140/90 mmHg (vs saxagliptin plus metformin).
- Conclusion: Dual add-on saxagliptin plus dapagliflozin to metformin was associated with a higher proportion of patients achieving glycemic and BP quality measures compared with single add-on saxagliptin or dapagliflozin.
Assessment of performance is a focus of many health care organizations as a means to evaluate and improve the quality of health care. Standardized performance measures have been developed to improve quality of care as well as to allow for comparative assessment of health plans and to support pay for performance models [1]. A widely used set of performance measures is the Healthcare Effectiveness Data and Information Set or HEDIS [2,3], measures that are maintained by the National Committee for Quality Assurance [4,5] and used by most US health plans [6].
Type 2 diabetes (T2D) is a focus of quality measure assessment and performance improvement because of its high prevalence, substantial personal and economic impact on society, high morbidity and mortality, and because it is a condition that requires coordinated care. Important outcome measures for diabetes include blood glucose control and blood pressure (BP) control. HEDIS measures for T2D include a glycated hemoglobin (A1C) > 9%, indicating poor glucose control, < 8%, indicating good control, and < 7%, a more stringent measure of good glycemic control. The HEDIS measure for BP in T2D is < 140/90 mm Hg, which is considered good BP control. All of these HEDIS measures are currently or were previously (A1C < 7%) endorsed by the National Quality Forum [1,7–10]. Endorsement of a quality measure by the NQF indicates that the measure has been thoroughly evaluated, meets specific criteria, and is based on recognized standards of care grounded in evidence-based medicine [1].
A number of oral agents are utilized in the treatment of diabetes. Saxagliptin, an oral dipeptidyl peptidase-4 (DPP-4) inhibitor, and dapagliflozin, an oral sodium-glucose cotransporter-2 (SGLT-2) inhibitor, are indicated as adjuncts to diet and exercise in adults with T2D [11,12]. Saxagliptin inhibits DPP-4, and thereby reduces fasting and postprandial glucose concentrations by preventing degradation of the incretin hormones, glucagon-like peptide-1 and glucose-dependent insulinotropic polypeptide [13]. Dapagliflozin reduces blood glucose concentrations by inhibiting glucose reabsorption in the proximal tubule of the kidney, which results in enhanced urinary glucose excretion [14]. Because their mechanisms of action are glucose-dependent, both saxagliptin and dapagliflozin have a low intrinsic potential to cause hypoglycemia [13,14]. In a randomized, double-blind study of patients with T2D inadequately controlled with metformin, Rosenstock et al assessed the efficacy and safety of dual add-on of saxagliptin plus dapagliflozin versus saxagliptin and dapagliflozin added on alone (ClinicalTrials.gov identifier, NCT01606007) [15]. The dual add-on therapy resulted in a greater adjusted mean reduction from baseline in A1C at week 24 (–1.47%) compared with either saxagliptin (–0.88%) or dapagliflozin (–1.20%) alone added to metformin; the difference for dual add-on saxagliptin plus dapagliflozin to metformin vs. single add-on saxagliptin and single add-on dapagliflozin was –0.59% (P < 0.001) and –0.27% (P = 0.0166), respectively. The incidence of adverse events was similar across the 3 treatment groups, and hypo-glycemia was infrequent (1%), with no reports of severe hypoglycemia events (symptomatic events with glucose ≤ 54 mg/dL requiring assistance).
In this paper, we assess the attainment of diabetes quality measures among patients in this study, specifically, measures of glycemic and BP control.
Methods
Study Design and Patients
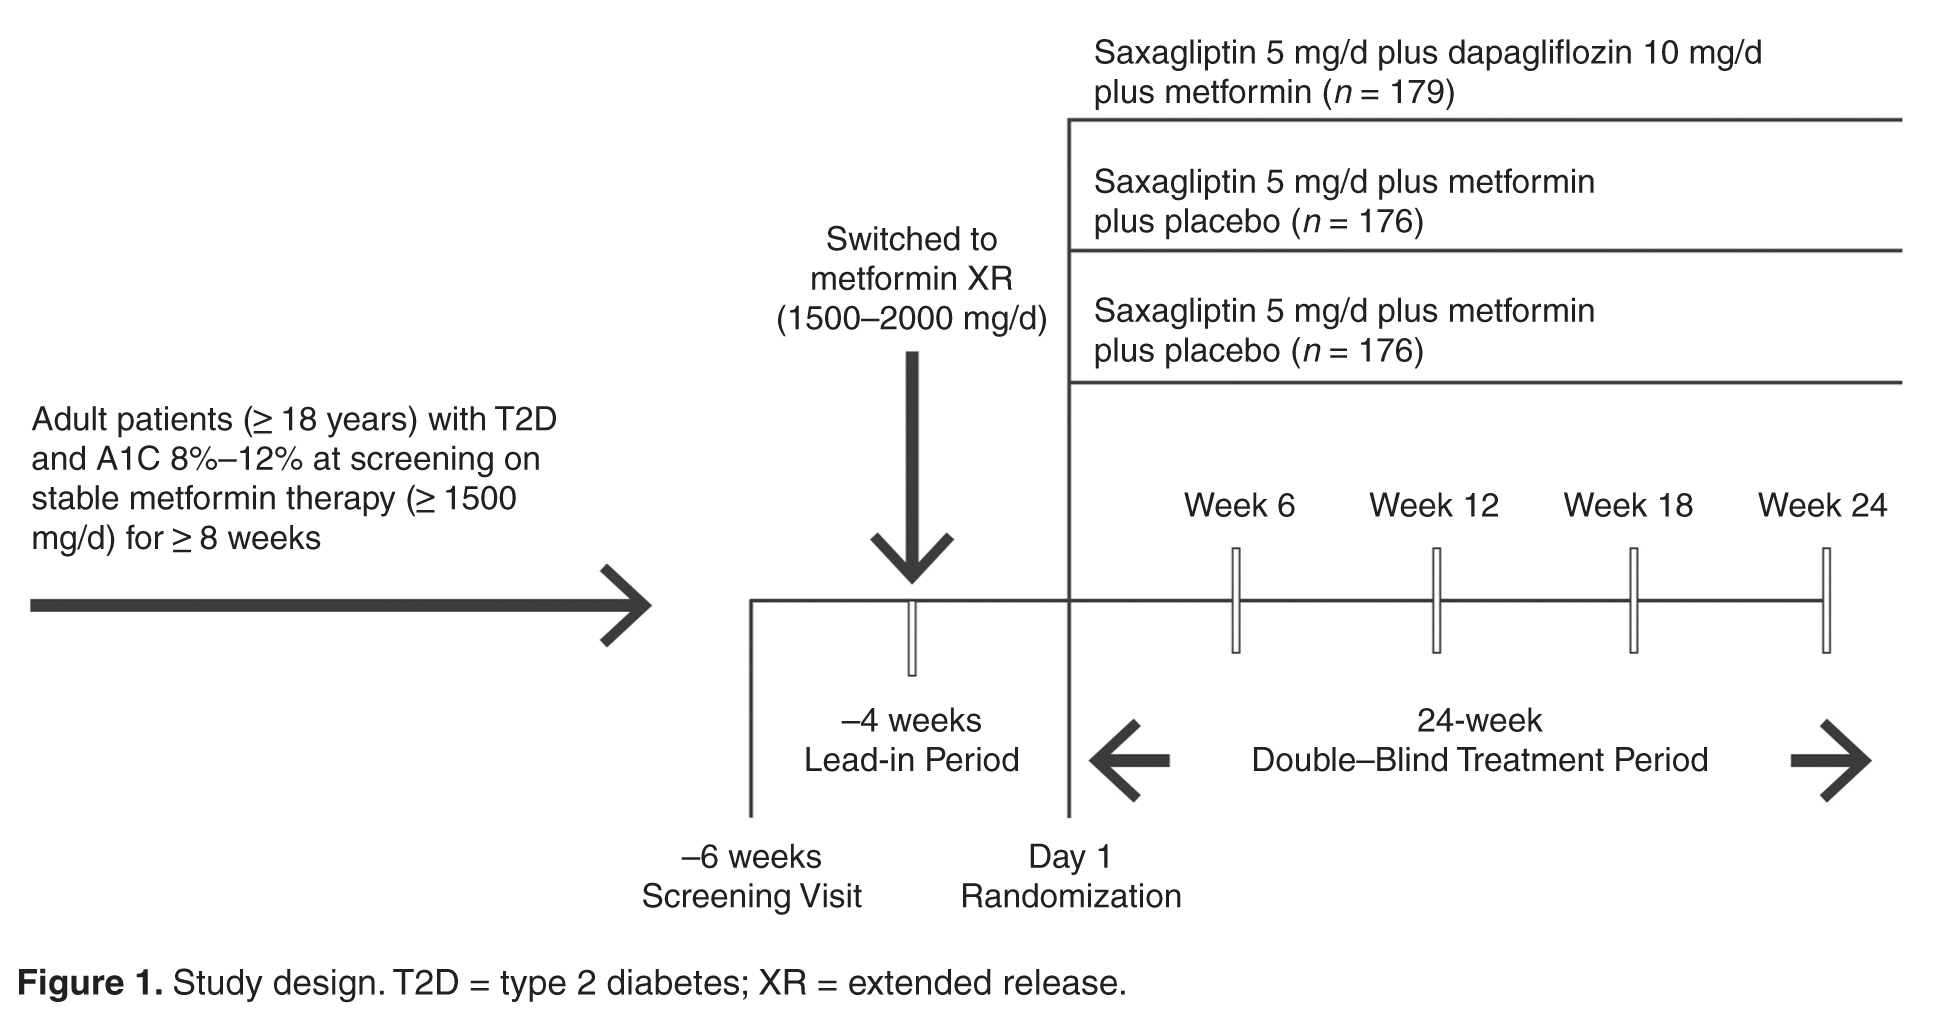
Quality Measure Assessment
Individual measures assessed included the proportion of patients with A1C < 7%, A1C < 8%, A1C > 9%, and BP < 140/90 mm Hg. Composite measures assessed includedthe proportion of patients with A1C < 7% and BP < 140/90 mm Hg and the proportion of patients with A1C < 8% and BP < 140/90 mm Hg.
Antihypertensive or cholesterol-lowering medication use was not controlled for in this study. Patients were maintained on their prescribed dosing regimen for antihypertensive and cholesterol-lowering medications, with adjustments as needed per the standard of care for their diagnosis. Treatment outcomes for A1C < 7%, < 8%, or > 9% were prespecified. The BP treatment outcome was also prespecified per the statistical analysis plan; however, a change to the HEDIS quality measure treatment outcome for BP during the clinical study resulted in this analysis being no longer relevant. Therefore, analyses of the currently endorsed quality measures for BP were conducted post hoc. Quality measure assessments for A1C and BP treatment outcomes were conducted using data from the 24-week, double-blind treatment period.
Statistical Analysis
P values for the differences in proportion of patients with individual treatment outcomes and composite treatment outcomes with saxagliptin plus dapagliflozin plus metformin versus saxagliptin plus metformin or dapagliflozin plus metformin were calculated using Fisher’s exact test. The numerator and denominator for each percentage are the number of responders and the number of patients with non-missing values in the treatment group at the corresponding baseline category, respectively, and are not corrected for baseline A1C. Because some patients experienced improvement in A1C during the lead-in period and could have already been at treatment goal at baseline, a sensitivity analysis excluding these patients was completed. Results are presented for the total number of patients with non-missing values in the treatment group, as well as patients with non-missing values in the treatment group who did not meet quality measure criteria at baseline. The number needed to treat (NNT) was calculated for all comparisons reaching statistical significance.
Results
Patients
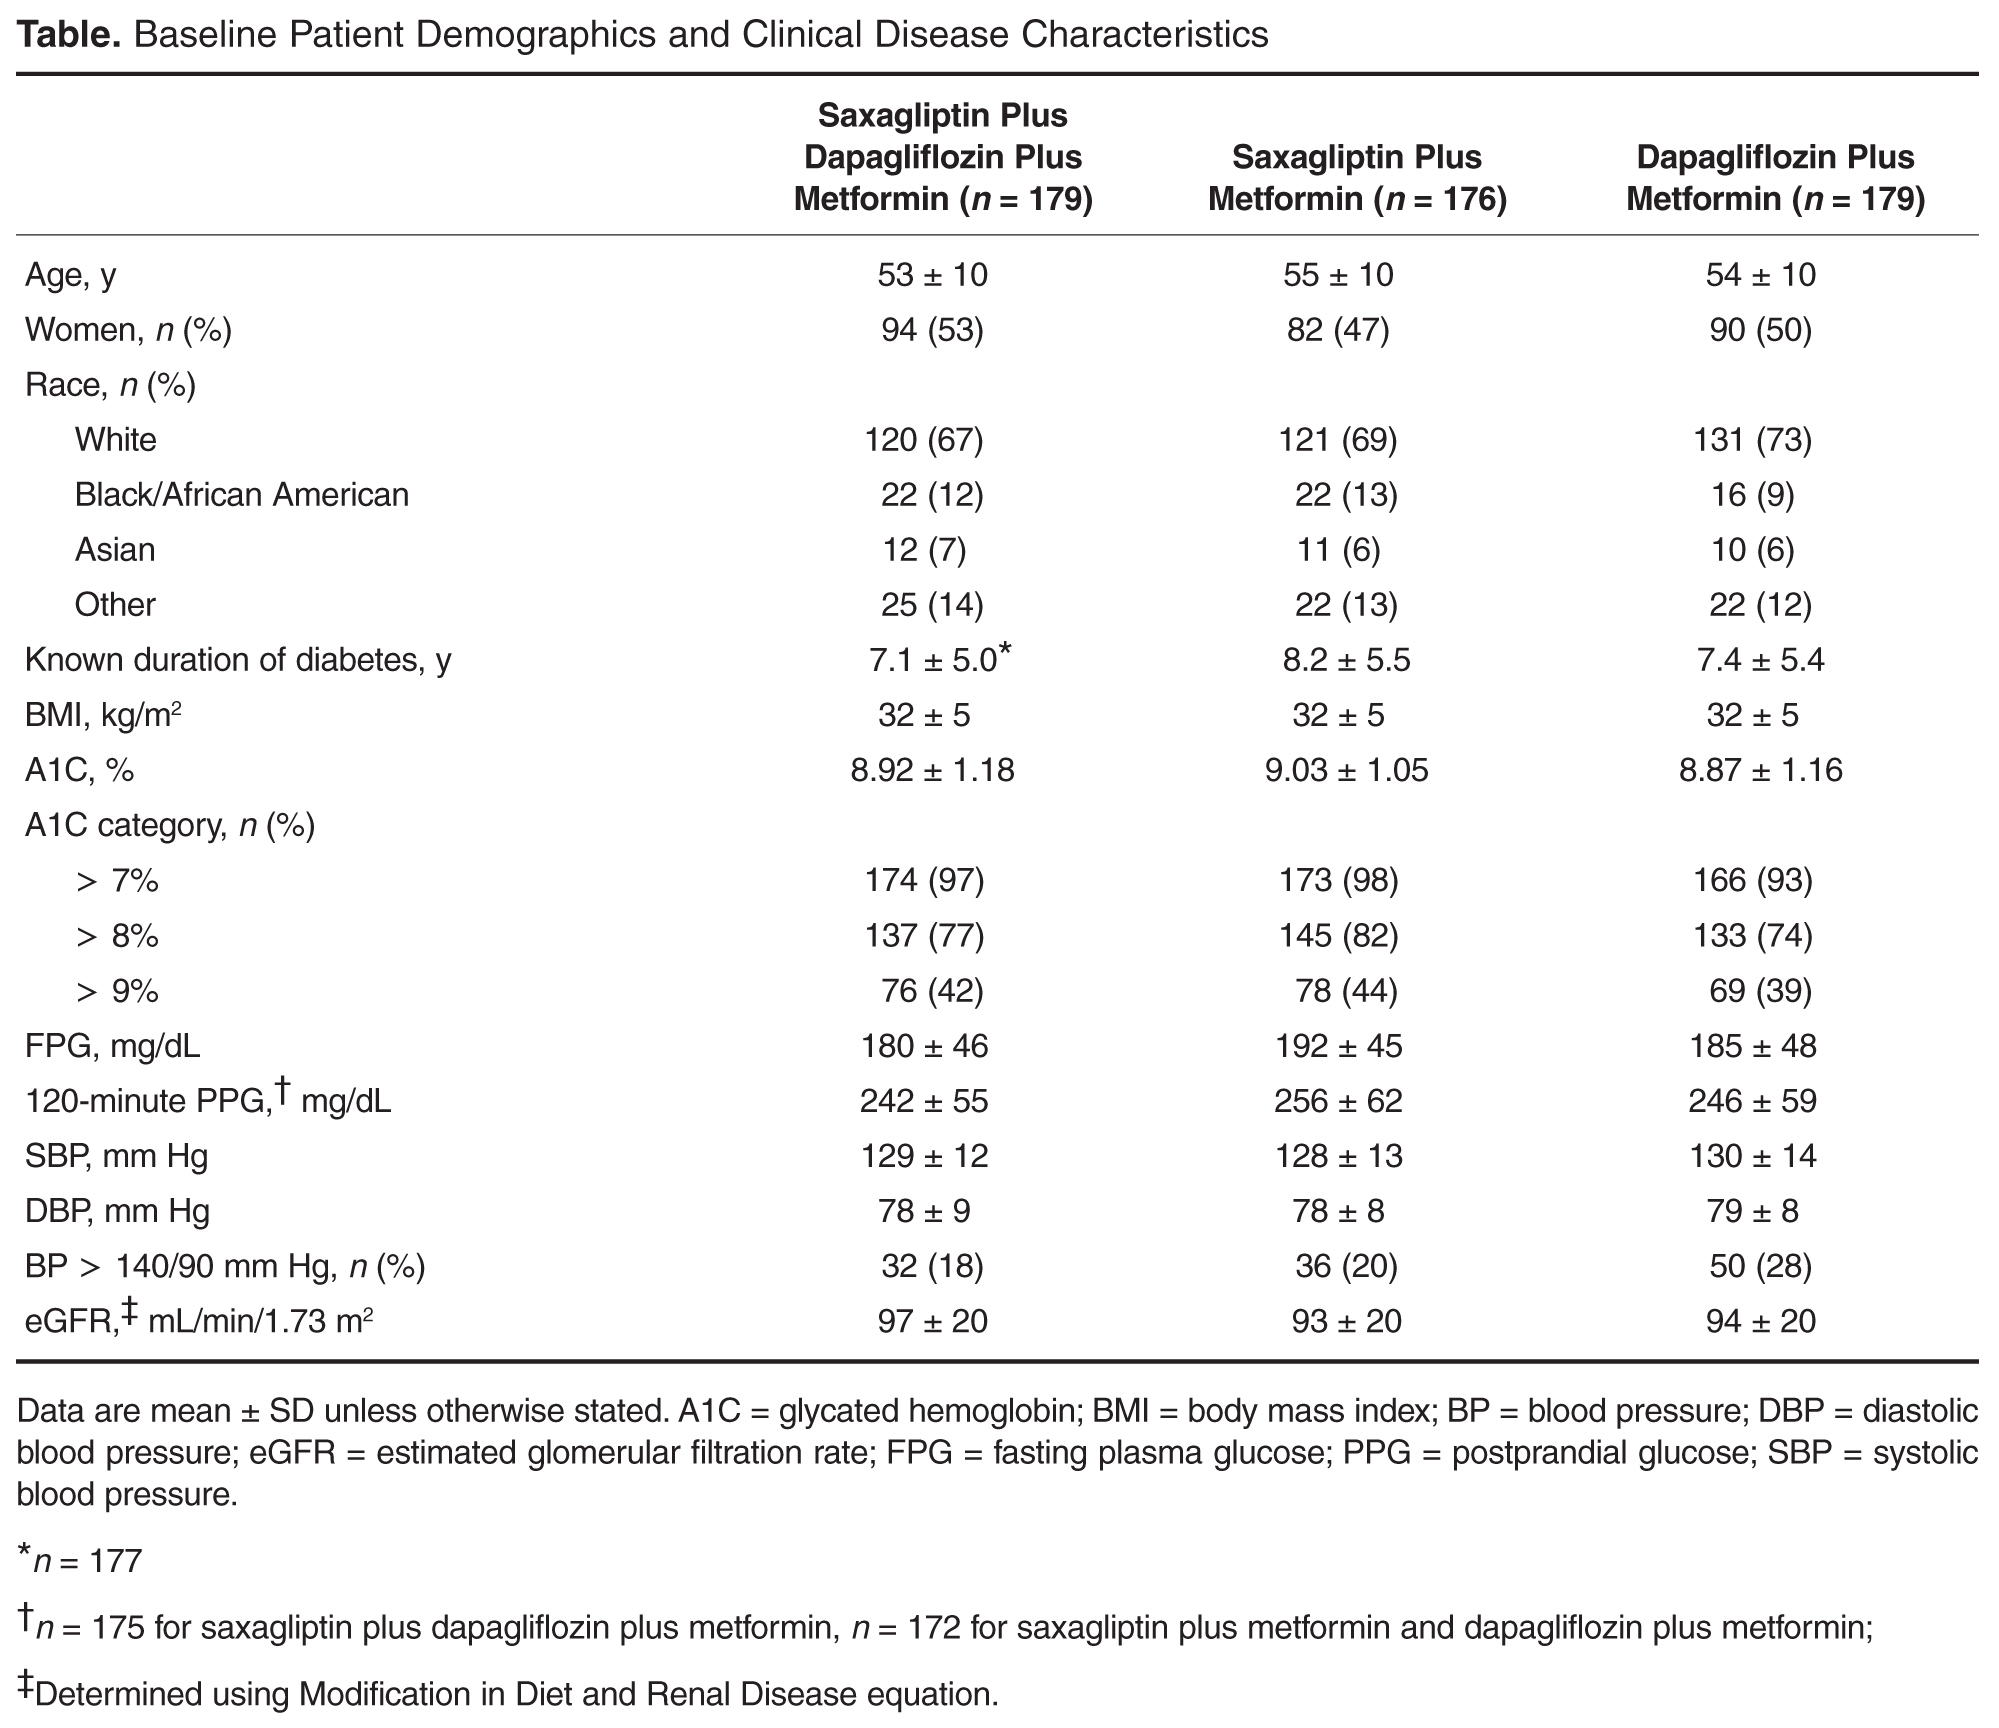
Individual Quality Measures
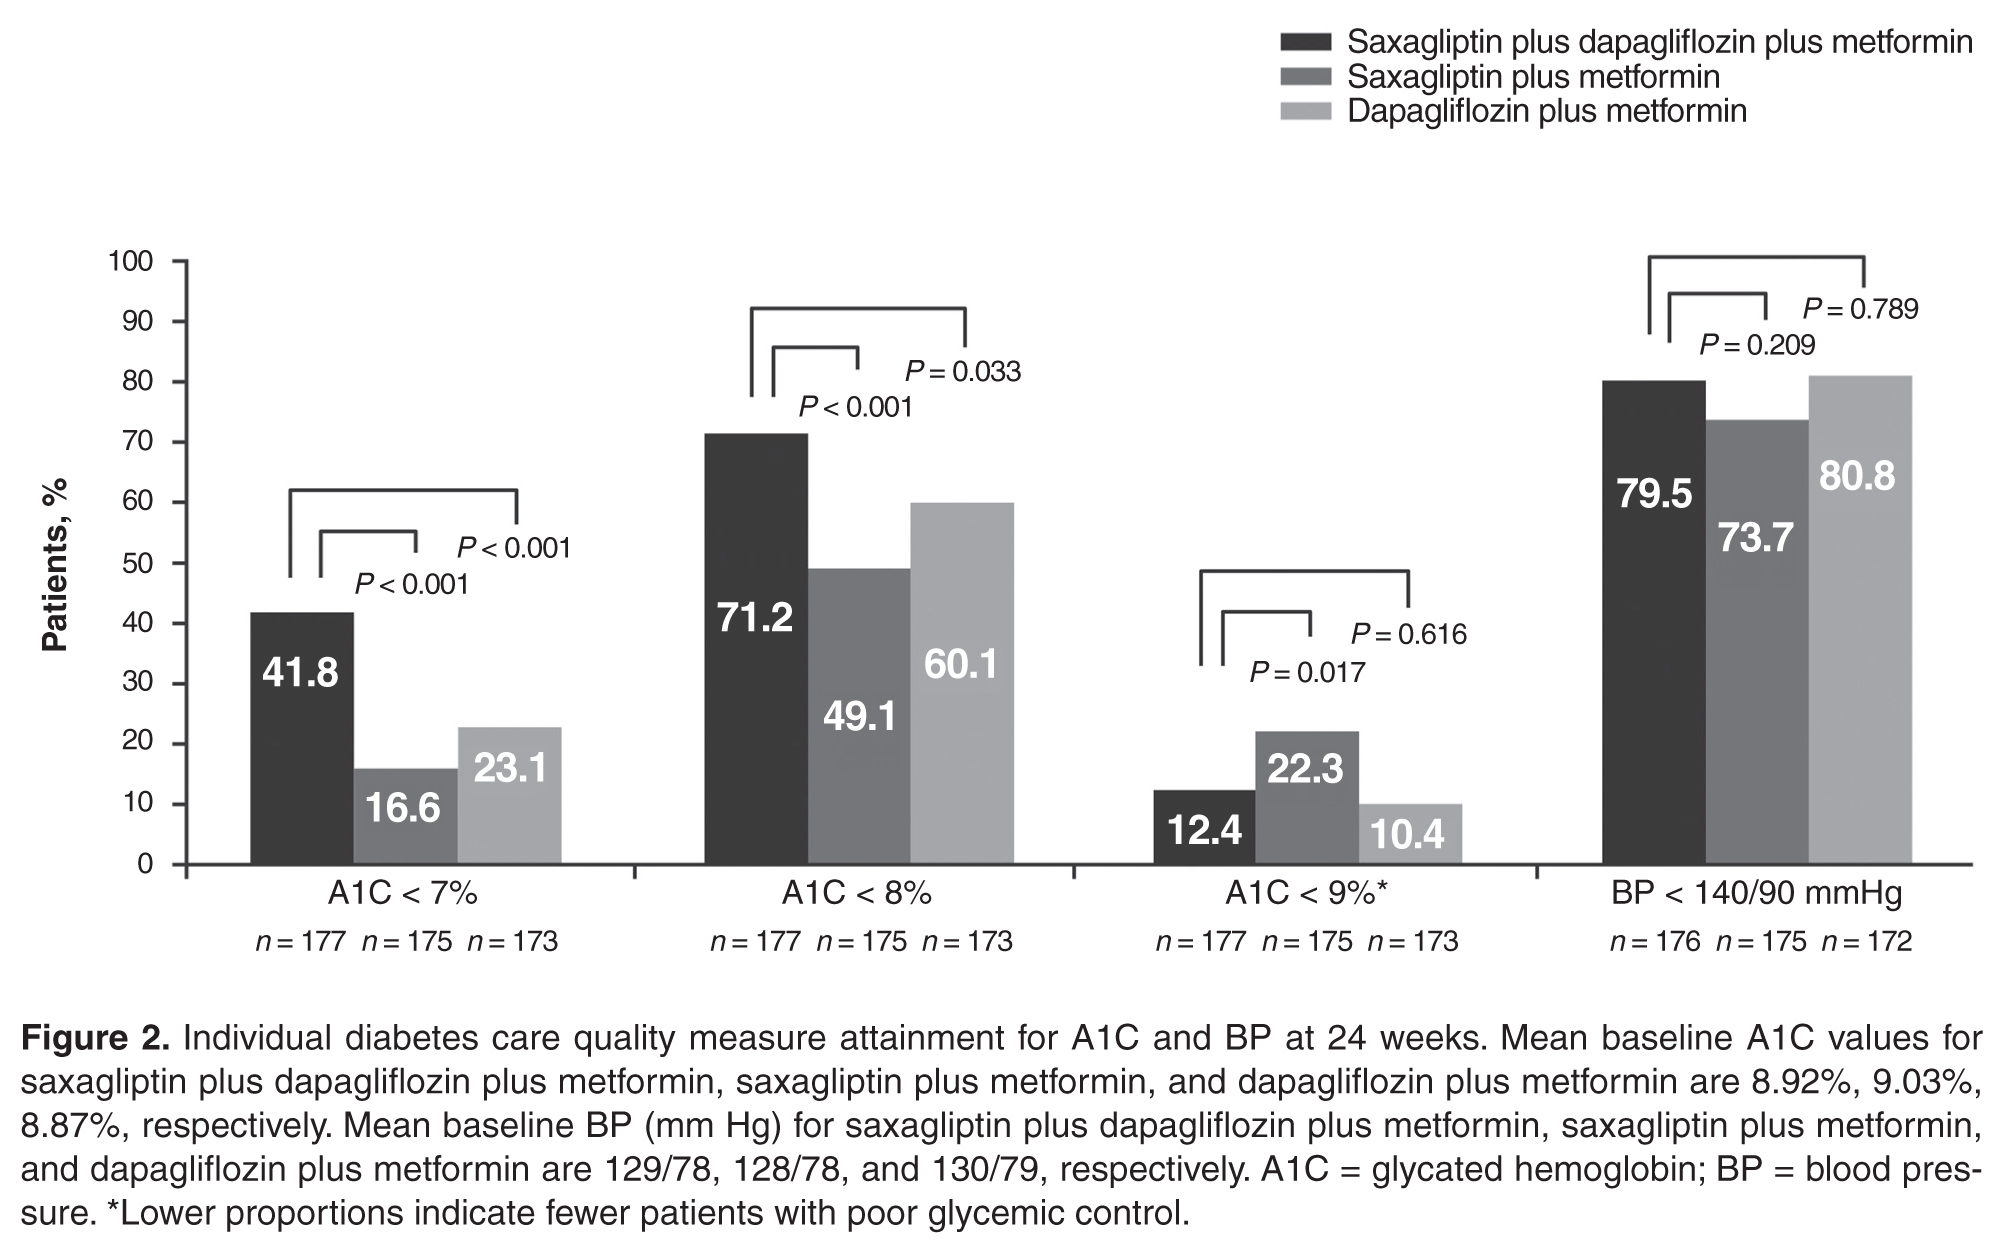
The dual addition of saxagliptin plus dapagliflozin to metformin resulted in a significantly greater proportion of patients achieving A1C < 8.0% compared with saxagliptin plus metformin (71.2% vs 49.1%; P < 0.001; NNT 5 [95% CI 3–8]) or dapagliflozin plus metformin (60.1%; P = 0.033; NNT 9 [95% CI 5–85]; Figure 2). Similar results (proportions of patients: 66.4% vs 40.0% vs 51.9%; P ≤ 0.02; NNTs 4 [95% CI 3–7]) and 7 [95% CI 4–34]) were attained when the analysis excluded patients with baseline A1C < 8.0%.
Significantly fewer patients had A1C > 9% (a measure of poor glycemic control) with saxagliptin plus dapagliflozin plus metformin (12.4%) compared with saxagliptin plus metformin (22.3%; P = 0.017; NNT –10 [95% CI –50 to –6]; Figure 2). The proportion of patients with A1C > 9% was similar for both regimens that included dapagliflozin (12.4% vs 10.4%; P = 0.616).
No significant difference was observed among treatment groups in the proportion of patients with BP < 140/90 mm Hg (Figure 2). However, most patients had BP < 140/90 mm Hg (72%–82%) at baseline, which was generally maintained at week 24.
Composite Quality Measures
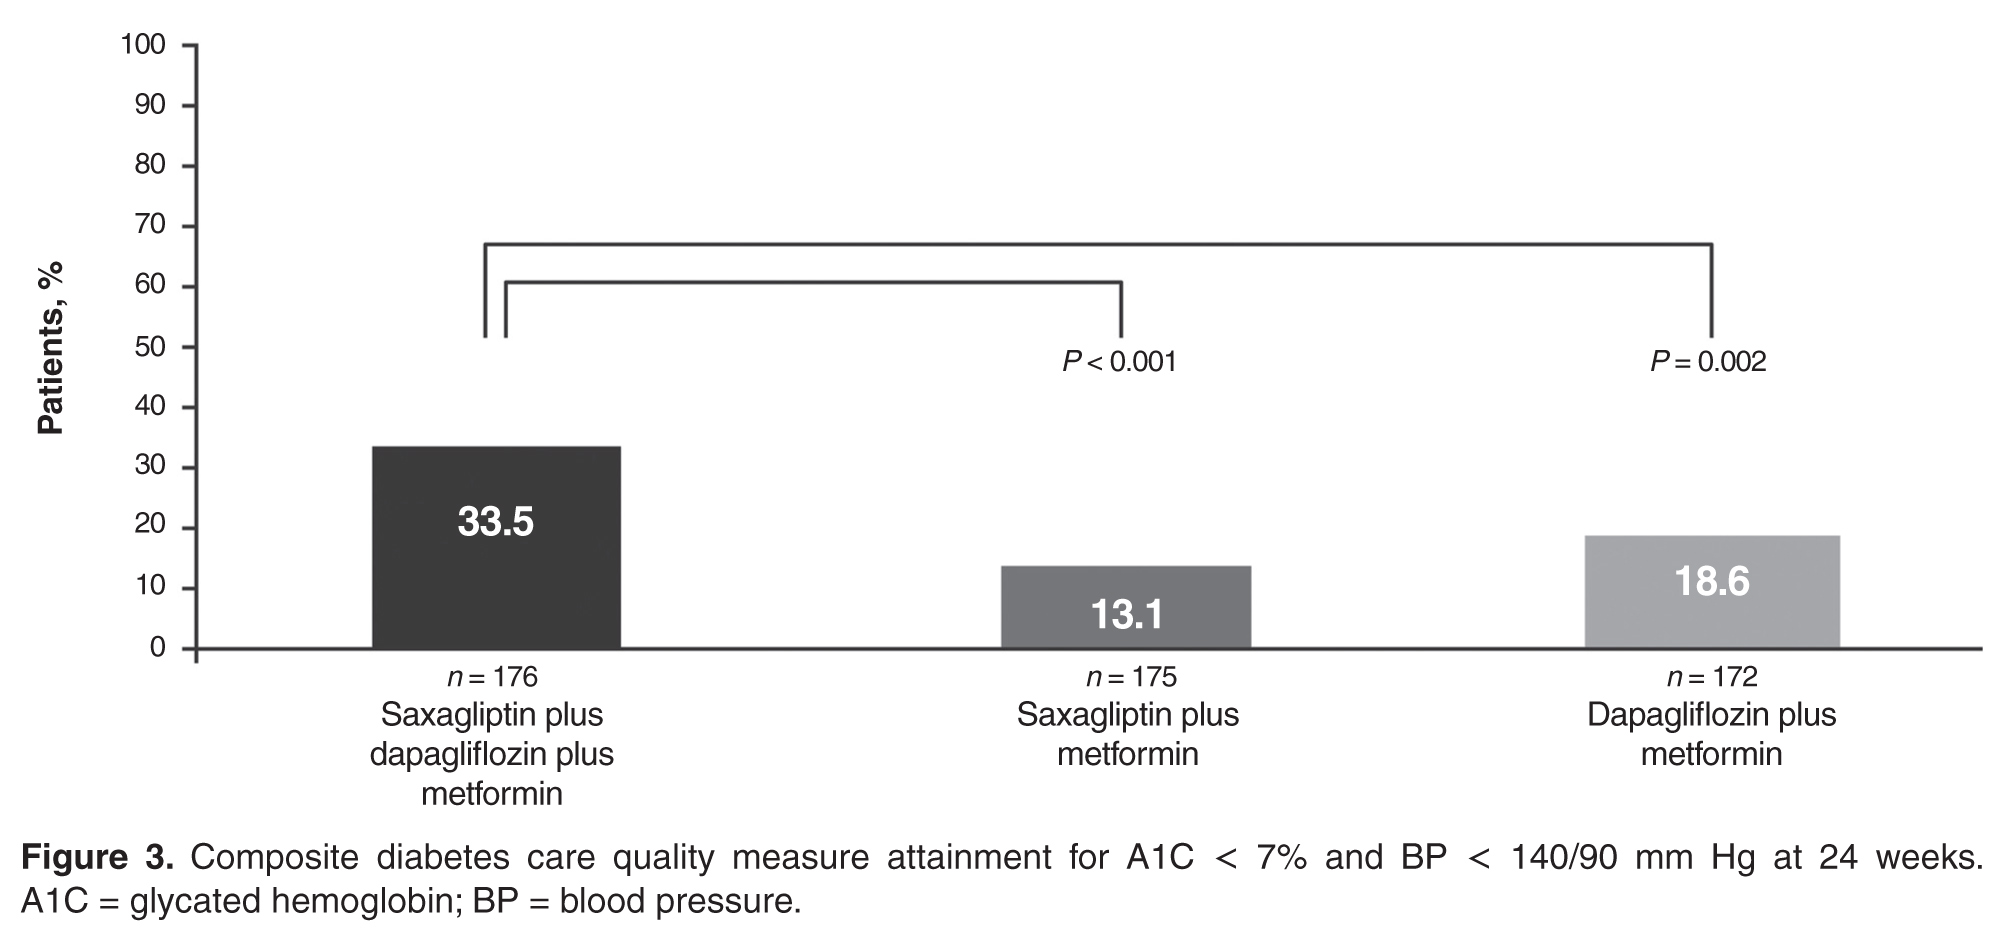
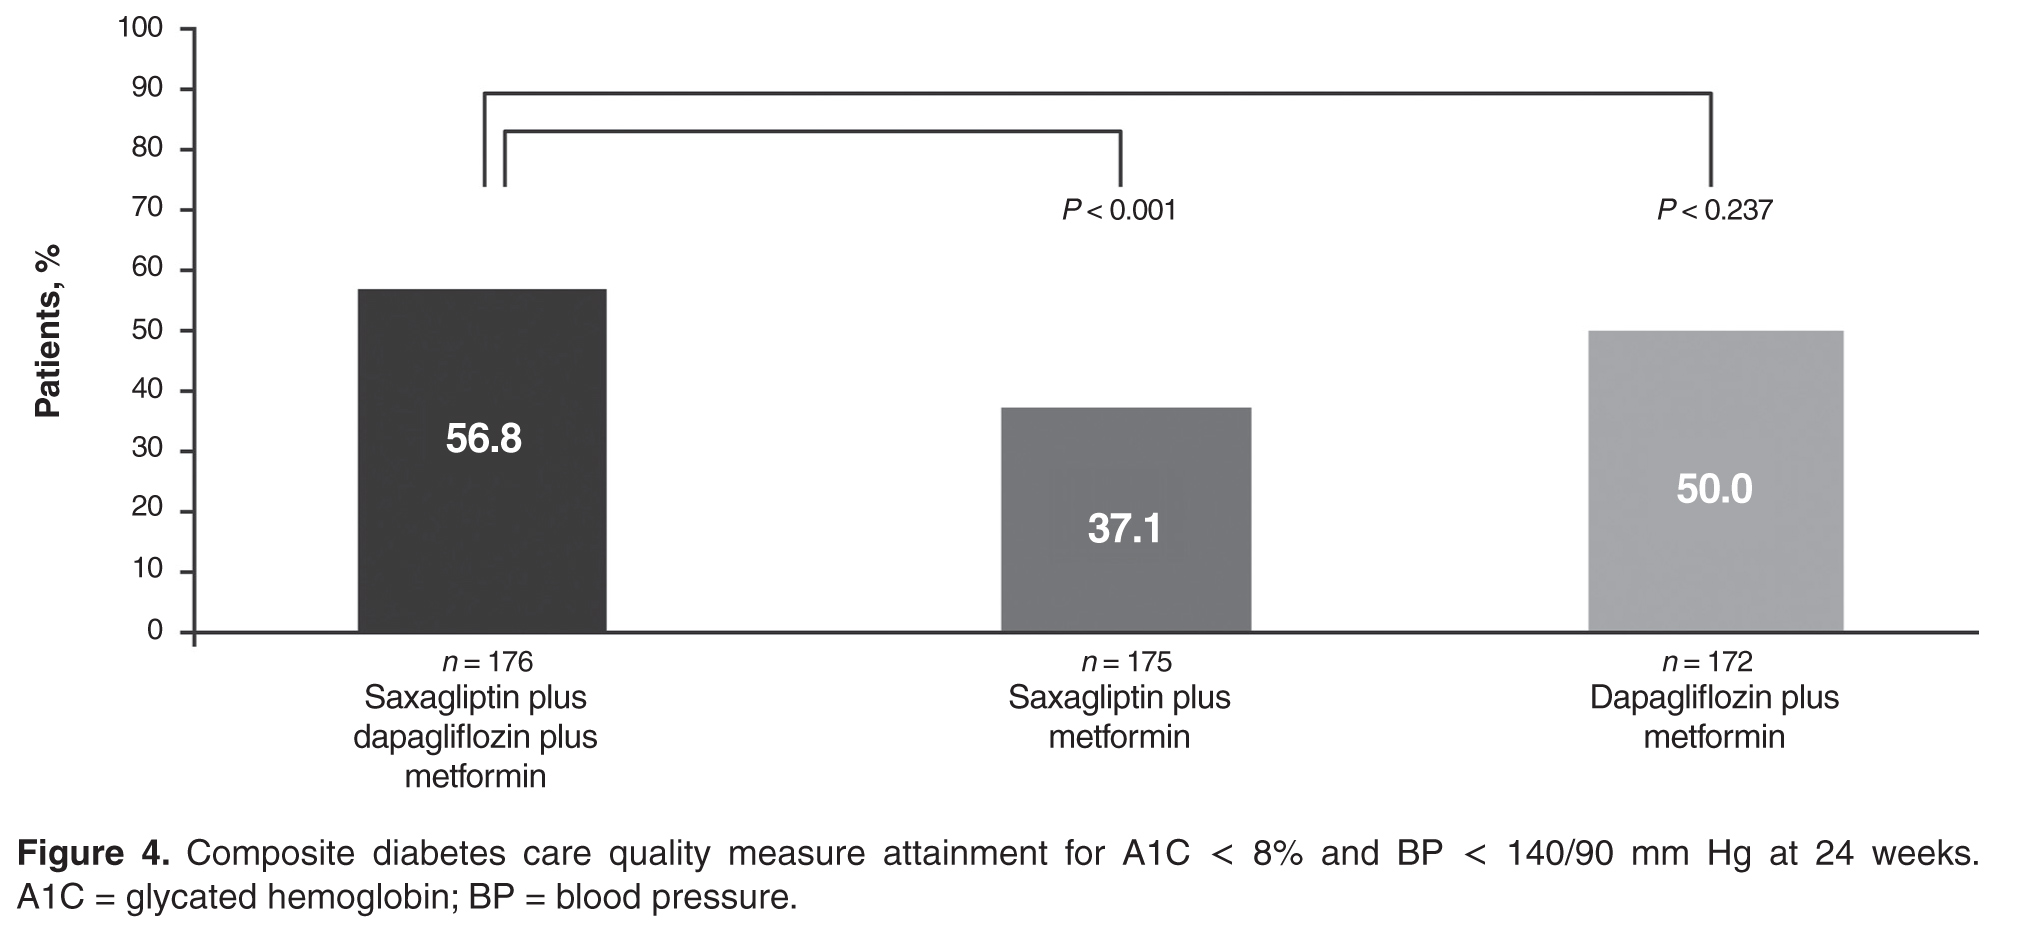
Discussion
This post hoc analysis evaluated attainment of glycemic and BP quality measures for diabetes. A significantly greater proportion of patients achieved the individual quality measures of A1C < 7% and A1C < 8% with dual add-on saxagliptin plus dapagliflozin to metformin compared with single add-on saxagliptin or dapagliflozin to metformin after 24 weeks. Similar results were seen when the analysis excluded patients with A1C < 7% and < 8% at baseline. All measures of good glycemic control had clinically relevant NNTs ≤ 10 after 24 weeks with saxagliptin plus dapagliflozin plus metformin compared with saxagliptin or dapagliflozin plus metformin, regardless of baseline status. Very few patients experienced lackof improvement in glycemic control, evidenced by small proportions of patients with A1C > 9%.
There was little difference in BP between dual add-on saxagliptin plus dapagliflozin or single add-on saxagliptin or dapagliflozin to metformin. The proportion of patients who attained the BP quality measure of BP < 140/90 mm Hg was similar across the 3 treatments, as might be expected because most patients already met this target at baseline. However, as might be expected based on the mild diuretic effect and weight loss associated with SGLT-2 inhibitors [16,17], trends in BP favored groups treated with dapagliflozin.
Attainment of multiple treatment targets is desirable in reducing complications of diabetes. A significantly greater proportion of patients achieved both A1C < 7% and BP < 140/90 mm Hg when both saxagliptin and dapagliflozin were added to metformin compared with single-agent addition of either saxagliptin or dapagliflozin plus metformin. Similarly, a significantly greater proportion of patients achieved both A1C < 8% and BP < 140/90 mm Hg with dual addition of saxagliptin and dapagliflozin plus metformin compared with saxagliptin plus metformin. There was also a numerically greater number of patients who achieved both of these goals with triple therapy compared with dapagliflozin plus metformin, but this finding did not reach statistical significance. Clinically relevant NNT values ≤ 10 were observed for both composite outcomes for saxagliptin plus dapagliflozin plus metformin compared with saxagliptin plus metformin or dapagliflozin plus metformin after 24 weeks.
Despite advances in the medical management of T2D, a report published in 2013 showed that between 2007 and 2010, only 53% of patients achieved an A1C < 7.0% and only 19% simultaneously achieved all 3 American Diabetes Association (ADA) goals recommended for most patients at that time: A1C < 7.0%, BP < 130/80 mm Hg, and low-density lipoprotein cholesterol LDL-C < 100 mg/dL [18]. These data highlight a need for new approaches to help patients attain glycemic, BP, and cholesterol goals. Our results demonstrated that a higher proportion of patients attained glycemic and BP quality measures with dual add-on saxagliptin plus dapagliflozin compared with single add-on saxagliptin or dapagliflozin to metformin. As a result of recent updates for cholesterol management from the American College of Cardiology and the American Heart Association [19], attainment of a cholesterol level was retired as a diabetes quality measure and replaced with a recommendation for statin therapy use [20,21]. Although the current analysis did not include assessment of LDL, DPP-4 inhibitors have demonstrated neutral effects on lipids [22,23], and SGLT-2 inhibitors have demonstrated generally modest increases in LDL-C (placebo-adjusted change from baseline: 4.5%–8.0% for canagliflozin 100 and 300 mg/d, 3.9% for dapagliflozin 10 mg, and 2.3%–4.2% for empagliflozin 10 and 25 mg/d) [12,24,25], as well as increases in high-density lipoprotein cholesterol and reductions in triglycerides [26].
Current ADA guidelines recommend an individualized, stepwise approach to treatment with sequential addition of single oral antihyperglycemic agents for patients who do not achieve their glycemic goal in 3 months [27]. Although T2D may progress at different rates in different patients, T2D does generally progress over time [28], and the ADA and American Association of Clinical Endocrinologists treatment guidelines recommend initial dual add-on therapy for individuals with higher A1C, which is suggestive of more advanced disease [27,29]. For individuals requiring initial combination therapy, guidelines note that antihyperglycemic agents that have a low risk of hypoglycemia and low potential for weight gain should be preferentially selected [29]. Attainment of A1C ≤ 7%, the guideline recommendation considered appropriate for many patients, is associated with reductions in microvascular disease and, if attained soon after diagnosis of diabetes, studies have shown reductions in macrovascular disease with long-term follow-up [27,30,31]. However, it may be challenging to achieve A1C < 7% with the addition of single oral antihyperglycemic agents, especially in patients with higher A1C [32]. Less stringent A1C goals (eg, A1C < 8%) may be appropriate in individuals with a long duration of diabetes that is difficult to control, history of severe hypoglycemia, limited life expectancy, numerous comorbidities, and extensive complications or comorbidities, especially cardiovascular disease [27]. Given the shift toward individualized treatment plans with patient-specific treatment goals, it is valuable to understand how different treatment strategies effect attainment of guideline-recommended less stringent and more stringent glycemic targets that may be appropriate for certain patients.
In addition to quality measures that assess glucose lowering with pharmacotherapy, it is important to consider measures that assess other aspects of diabetes care. For example, quality measures related to hypoglycemia and hyperglycemia may help avoid potentially adverse glucose levels, and quality measures related to weight may provide insight on treatment and lifestyle efforts directed at weight loss and management. NQF-endorsed measures of hypoglycemia and hyperglycemia are currently moving through annual review and are paired measures, intended to be interpreted with respect to one another to ensure balanced outcomes [33,34]. This underscores the value of efficacious antihyperglycemic agents with low intrinsic potential for hypoglycemia. Although this analysis did not include quality measures related to hypoglycemia or weight, future studies evaluating these aspects of diabetes care will likely further contribute to a more comprehensive and holistic treatment approach.
In addition to assessing a broad range of quality measures, an important aspect of care to consider is patient affordability. Affordability for an individual patient will depend on access in the patient’s individual plan, the financial resources of the patient, and the potential for medical cost offsets from improved control of the patient’s disease. For example, fixed-dose combination products are associated with increased patient adherence and may increase pharmacy costs but decrease medical costs [35].
Limitations of this study include the post hoc design and that quality measure attainment was assessed over a shorter duration of time (24 weeks) than is commonly assessed in the real-world/community setting (~12 months).
Dual add-on therapy with oral antihyperglycemic agents that have complementary mechanisms of action should lead to enhanced reductions in A1C. The results reported here and from the primary study, in which saxagliptin and dapagliflozin added to metformin significantly reduced mean A1C from baseline to week 24 compared with single add-on saxagliptin or dapagliflozin [15], showed that greater reductions in A1C were attained with the coadministration of saxagliptin and dapagliflozin. The glucuretic effect of SGLT-2 inhibitors has been associated with increased plasma glucagon concentrations and increased endogenous glucose production, which may impair the full glucose-lowering potential of SGLT-2 inhibitors [36,37]. Administering saxagliptin with dapagliflozin as dual therapy was shown to blunt the rise in plasma glucagon caused by dapagliflozin [38], and this may have contributed to the greater glucose control achieved with dual add-on of these 2 antihyperglycemic drugs [15].
By targeting multiple aspects of the underlying pathophysiology in T2D, greater improvements in A1C can be achieved. Dual add-on saxagliptin plus dapagliflozin to metformin resulted in a greater proportion of patients achieving NQF-endorsed HEDIS quality measures, as well as A1C < 7% (no longer an NQF-endorsed measure). As health care shifts to a more value-based payment structure, measuring quality outcomes will assume a greater role in guiding decision making and influence the care that patients receive. Understanding how antihyperglycemic medication regimens affect quality measures can help clinicians make informed decisions.
Corresponding author: Lawrence Blonde, MD, Ochsner Diabetes Clinical Research Unit, Frank Riddick Diabetes Institute, Department of Endocrinology, Ochsner Medical Center, New Orleans, LA.
Funding/support: This study was supported by AstraZeneca. Medical writing support for the preparation of this manuscript was provided by Lauren D’Angelo, PhD, and Janet Matsuura, PhD, from Complete Healthcare Communications, LLC (Chadds Ford, PA), with funding from AstraZeneca.
Financial disclosures: Dr. Blonde has received grant and research support from AstraZeneca, Jansen Pharmaceuticals, Lexicon Pharmaceuticals, Merck, Novo Nordisk, and Sanofi-Aventis and has received honoraria for participating as a speaker from AstraZeneca, Janssen Pharmaceuticals, Merck, Novo Nordisk, and Sanofi-Aventis as well as honoraria for consultant work from AstraZeneca, GlaxoSmithKline, Intarcia Therapeutics, Janssen Pharmaceuticals, Merck, Novo Nordisk, and Sanofi-Aventis. R. Garcia-Sanchez is an employee of AstraZeneca. J. Sheehan and Y. C. Barrett were employees of AstraZeneca at the time of this research.
1. National Quality Forum. ABCs of measurement. Accessed 11 Mar 2016 at www.qualityforum.org/Measuring_Performance/ABCs_of_Measurement.aspx.
2. National Committee for Quality Assurance. HEDIS measure development process. Accessed 14 Mar 2016 at www.ncqa.org/tabid/414/Default.aspx.
3. National Committee for Quality Assurance. HEDIS measures. Accessed 11 Mar 2016 at www.ncqa.org/HEDISQualityMeasurement/HEDISMeasures.aspx.
4. National Committee for Quality Assurance. About NCQA: overview. Accessed 14 Mar 2016 at www.ncqa.org/AboutNCQA.aspx.
5. National Committee for Quality Assurance. Health care program evaluations. Accessed 11 Mar 2016 at www.ncqa.org/Programs.aspx.
6. National Committee for Quality Assurance. HEDIS and Performance Measurement. Accessed 14 Mar 2016 at www.ncqa.org/HEDISQualityMeasurement.aspx.
7. National Committee for Quality Assurance. HEDIS 2015 technical specifications for ACO measurement. Washington, DC: National Committee for Quality Assurance; 2014.
8. National Quality Forum. Comprehensive diabetes care: hemoglobin A1c (HbA1c) poor control (> 9.0%). NQF identifier: 0059. Accessed 14 Mar 2016 at www.qualityforum.org/ProjectMeasures.aspx?projectID=73652.
9. National Quality Forum. Comprehensive diabetes care: hemoglobin A1c (HbA1c) control (< 8.0%). NQF identifier: 0575. Accessed 14 Mar 2016 at www.qualityforum.org/ProjectMeasures.aspx?projectID=73652.
10. National Quality Forum. Comprehensive diabetes care: blood pressure control (< 140/90 mm Hg). NQF identifier: 0061. Accessed 14 Mar 2016 at www.qualityforum.org/ProjectMeasures.aspx?projectID=73652.
11. Onglyza(saxagliptin). Full prescribing information. AstraZeneca, Wilmington, DE; 2014.
12. Farxiga (dapagliflozin). Full prescribing information. AstraZeneca, Wilmington, DE; March 2015.
13. Deacon CF, Holst JJ. Saxagliptin: a new dipeptidyl peptidase-4 inhibitor for the treatment of type 2 diabetes. Adv Ther 2009;26:488–99.
14. Kasichayanula S, Liu X, Lacreta F, et al. Clinical pharmacokinetics and pharmacodynamics of dapagliflozin, a selective inhibitor of sodium-glucose co-transporter type 2. Clin Pharmacokinet 2014;53:17–27.
15. Rosenstock J, Hansen L, Zee P, et al. Dual add-on therapy in type 2 diabetes poorly controlled with metformin monotherapy: a randomized double-blind trial of saxagliptin plus dapagliflozin addition versus single addition of saxagliptin or dapagliflozin to metformin. Diabetes Care 2014;38:376–83.
16. Bailey CJ. SGLT2 inhibitors: glucuretic treatment for type 2 diabetes. British Journal of Diabetes & Vascular Disease 2010;10:193-9.
17. Maliha G, Townsend RR. SGLT2 inhibitors: their potential reduction in blood pressure. J Am Soc Hypertens 2015;9:48–53.
18. Stark Casagrande S, Fradkin JE, Saydah SH, et al. The prevalence of meeting A1C, blood pressure, and LDL goals among people with diabetes, 1988-2010. Diabetes Care 2013;36:2271–9.
19. Stone NJ, Robinson JG, Lichtenstein AH, et al. 2013 ACC/AHA guideline on the treatment of blood cholesterol to reduce atherosclerotic cardiovascular risk in adults: a report of the American College of Cardiology/American Heart Association Task Force on Practice Guidelines. Circulation 2014;129:S1–45.
20. National Quality Forum. Comprehensive diabetes care (composite). NQF identifier: #0731. Accessed 11 Mar 2016 at www.qualityforum.org/QPS/QPSTool.aspx.
21. National Quality Forum. Optimal diabetes care (composite measure). NQF identifier: 0729. Accessed 14 Mar 2016 at www.qualityforum.org/ProjectMeasures.aspx?projectID=73652.
22. Amori RE, Lau J, Pittas AG. Efficacy and safety of incretin therapy in type 2 diabetes: systematic review and meta-analysis. JAMA 2007;298:194–206.
23. Monami M, Lamanna C, Desideri CM, Mannucci E. DPP-4 inhibitors and lipids: systematic review and meta-analysis. Adv Ther 2012;29:14–25.
24. Invokana(canagliflzoin). Full prescribing information. Janssen Pharmaceuticals, Titusville, NJ; 2013.
25. Jardiance(empagliflozin). Full prescribing information. Boehringer Ingelheim Pharmaceuticals and Eli Lilly, Ingelheim, Germany and Indianapolis, IN; 2014.
26. Inzucchi SE, Zinman B, Wanner C, et al. SGLT-2 inhibitors and cardiovascular risk: Proposed pathways and review of ongoing outcome trials. Diab Vasc Dis Res 2015;12:90–100.
27. American Diabetes Association. Standards of medical care in diabetes-2016. Diabetes Care 2016;39:S1–S119.
28. Fonseca VA. Defining and characterizing the progression of type 2 diabetes. Diabetes Care 2009;32:S151–S6.
29. Garber AJ, Abrahamson MJ, Barzilay JI, et al. Consensus statement by the American Association of Clinical Endocrinologists and American College of Endocrinology on the comprehensive type 2 diabetes management algorithm -- 2016 executive summary. Endocr Pract 2016;22:84–113.
30. Holman RR, Paul SK, Bethel MA, et al. 10-year follow-up of intensive glucose control in type 2 diabetes. N Engl J Med 2008;359:1577–89.
31. Nathan DM, Cleary PA, Backlund JY, et al. Intensive diabetes treatment and cardiovascular disease in patients with type 1 diabetes. N Engl J Med 2005;353:2643–53.
32. Bosi E, Camisasca RP, Collober C, et al. Effects of vildagliptin on glucose control over 24 weeks in patients with type 2 diabetes inadequately controlled with metformin. Diabetes Care 2007;30:890–5.
33. National Quality Forum. Glycemic control: hypoglycemia. NQF identifier: 2363. Accessed 29 Oct 2015 at www.qualityforum.org/QPS/QPSTool.aspx.
34. National Quality Forum. Glycemic control: hyperglycemia. NQF identifier: 2362. Accessed 11 Mar 2016 at www.qualityforum.org/QPS/QPSTool.aspx.
35. Bailey CJ, Day C. Fixed-dose single tablet antidiabetic combinations. Diabetes Obes Metab 2009;11:527–33.
36. Ferrannini E, Muscelli E, Frascerra S, et al. Metabolic response to sodium-glucose cotransporter 2 inhibition in type 2 diabetic patients. J Clin Invest 2014;124:499–508.
37. Merovci A, Solis-Herrera C, Daniele G, et al. Dapagliflozin improves muscle insulin sensitivity but enhances endogenous glucose production. J Clin Invest 2014;124:509–14.
38. Hansen L, Iqbal N, Ekholm E, et al. Postprandial dynamics of plasma glucose, insulin, and glucagon in patients with type 2 diabetes treated with saxagliptin plus dapagliflozin add-on to metformin therapy. Endocr Pract 2014;20:1187–97.
From the Ochsner Diabetes Clinical Research Unit, Frank Riddick Diabetes Institute, Department of Endocrinology, Ochsner Medical Center, New Orleans, LA (Dr. Blonde), and AstraZeneca, Gaithersburg, MD (Drs. Sheehan, Barrett, and Garcia-Sanchez).
Abstract
- Objective: To evaluate diabetes care quality measure attainment, specifically, blood glucose and blood pressure (BP) control, with saxagliptin, a dipeptidyl peptidase-4 inhibitor, and dapagliflozin, a sodium-glucose cotransporter-2 inhibitor, added singly or as dual add-on therapy in patients with type 2 diabetes inadequately controlled with metformin alone.
- Methods: Analysis of a phase 3, randomized, double-blind, active-controlled, parallel-group trial was conducted. Patients were randomized 1:1:1 to receive saxagliptin 5 mg/d plus dapagliflozin 10 mg/d, saxagliptin 5 mg/d, or dapagliflozin 10 mg/d as add-on to metformin 1500 to 2000 mg/d. Assessments included attainment of individual and composite glycated hemoglobin (A1C) and BP measures at 24 weeks of treatment.
- Results: Compared with single add-on saxagliptin or dapagliflozin, dual add-on saxagliptin plus dapagliflozin to metformin was associated with significantly more patients attaining the individual quality measures of A1C < 7% and A1C < 8%. Similarly, dual add-on saxagliptin plus dapagliflozin was associated with significantly more patients attaining the composite quality measures A1C < 7% and BP < 140/90 mm Hg and A1C < 8% and BP < 140/90 mmHg (vs saxagliptin plus metformin).
- Conclusion: Dual add-on saxagliptin plus dapagliflozin to metformin was associated with a higher proportion of patients achieving glycemic and BP quality measures compared with single add-on saxagliptin or dapagliflozin.
Assessment of performance is a focus of many health care organizations as a means to evaluate and improve the quality of health care. Standardized performance measures have been developed to improve quality of care as well as to allow for comparative assessment of health plans and to support pay for performance models [1]. A widely used set of performance measures is the Healthcare Effectiveness Data and Information Set or HEDIS [2,3], measures that are maintained by the National Committee for Quality Assurance [4,5] and used by most US health plans [6].
Type 2 diabetes (T2D) is a focus of quality measure assessment and performance improvement because of its high prevalence, substantial personal and economic impact on society, high morbidity and mortality, and because it is a condition that requires coordinated care. Important outcome measures for diabetes include blood glucose control and blood pressure (BP) control. HEDIS measures for T2D include a glycated hemoglobin (A1C) > 9%, indicating poor glucose control, < 8%, indicating good control, and < 7%, a more stringent measure of good glycemic control. The HEDIS measure for BP in T2D is < 140/90 mm Hg, which is considered good BP control. All of these HEDIS measures are currently or were previously (A1C < 7%) endorsed by the National Quality Forum [1,7–10]. Endorsement of a quality measure by the NQF indicates that the measure has been thoroughly evaluated, meets specific criteria, and is based on recognized standards of care grounded in evidence-based medicine [1].
A number of oral agents are utilized in the treatment of diabetes. Saxagliptin, an oral dipeptidyl peptidase-4 (DPP-4) inhibitor, and dapagliflozin, an oral sodium-glucose cotransporter-2 (SGLT-2) inhibitor, are indicated as adjuncts to diet and exercise in adults with T2D [11,12]. Saxagliptin inhibits DPP-4, and thereby reduces fasting and postprandial glucose concentrations by preventing degradation of the incretin hormones, glucagon-like peptide-1 and glucose-dependent insulinotropic polypeptide [13]. Dapagliflozin reduces blood glucose concentrations by inhibiting glucose reabsorption in the proximal tubule of the kidney, which results in enhanced urinary glucose excretion [14]. Because their mechanisms of action are glucose-dependent, both saxagliptin and dapagliflozin have a low intrinsic potential to cause hypoglycemia [13,14]. In a randomized, double-blind study of patients with T2D inadequately controlled with metformin, Rosenstock et al assessed the efficacy and safety of dual add-on of saxagliptin plus dapagliflozin versus saxagliptin and dapagliflozin added on alone (ClinicalTrials.gov identifier, NCT01606007) [15]. The dual add-on therapy resulted in a greater adjusted mean reduction from baseline in A1C at week 24 (–1.47%) compared with either saxagliptin (–0.88%) or dapagliflozin (–1.20%) alone added to metformin; the difference for dual add-on saxagliptin plus dapagliflozin to metformin vs. single add-on saxagliptin and single add-on dapagliflozin was –0.59% (P < 0.001) and –0.27% (P = 0.0166), respectively. The incidence of adverse events was similar across the 3 treatment groups, and hypo-glycemia was infrequent (1%), with no reports of severe hypoglycemia events (symptomatic events with glucose ≤ 54 mg/dL requiring assistance).
In this paper, we assess the attainment of diabetes quality measures among patients in this study, specifically, measures of glycemic and BP control.
Methods
Study Design and Patients
Quality Measure Assessment
Individual measures assessed included the proportion of patients with A1C < 7%, A1C < 8%, A1C > 9%, and BP < 140/90 mm Hg. Composite measures assessed includedthe proportion of patients with A1C < 7% and BP < 140/90 mm Hg and the proportion of patients with A1C < 8% and BP < 140/90 mm Hg.
Antihypertensive or cholesterol-lowering medication use was not controlled for in this study. Patients were maintained on their prescribed dosing regimen for antihypertensive and cholesterol-lowering medications, with adjustments as needed per the standard of care for their diagnosis. Treatment outcomes for A1C < 7%, < 8%, or > 9% were prespecified. The BP treatment outcome was also prespecified per the statistical analysis plan; however, a change to the HEDIS quality measure treatment outcome for BP during the clinical study resulted in this analysis being no longer relevant. Therefore, analyses of the currently endorsed quality measures for BP were conducted post hoc. Quality measure assessments for A1C and BP treatment outcomes were conducted using data from the 24-week, double-blind treatment period.
Statistical Analysis
P values for the differences in proportion of patients with individual treatment outcomes and composite treatment outcomes with saxagliptin plus dapagliflozin plus metformin versus saxagliptin plus metformin or dapagliflozin plus metformin were calculated using Fisher’s exact test. The numerator and denominator for each percentage are the number of responders and the number of patients with non-missing values in the treatment group at the corresponding baseline category, respectively, and are not corrected for baseline A1C. Because some patients experienced improvement in A1C during the lead-in period and could have already been at treatment goal at baseline, a sensitivity analysis excluding these patients was completed. Results are presented for the total number of patients with non-missing values in the treatment group, as well as patients with non-missing values in the treatment group who did not meet quality measure criteria at baseline. The number needed to treat (NNT) was calculated for all comparisons reaching statistical significance.
Results
Patients
Individual Quality Measures
The dual addition of saxagliptin plus dapagliflozin to metformin resulted in a significantly greater proportion of patients achieving A1C < 8.0% compared with saxagliptin plus metformin (71.2% vs 49.1%; P < 0.001; NNT 5 [95% CI 3–8]) or dapagliflozin plus metformin (60.1%; P = 0.033; NNT 9 [95% CI 5–85]; Figure 2). Similar results (proportions of patients: 66.4% vs 40.0% vs 51.9%; P ≤ 0.02; NNTs 4 [95% CI 3–7]) and 7 [95% CI 4–34]) were attained when the analysis excluded patients with baseline A1C < 8.0%.
Significantly fewer patients had A1C > 9% (a measure of poor glycemic control) with saxagliptin plus dapagliflozin plus metformin (12.4%) compared with saxagliptin plus metformin (22.3%; P = 0.017; NNT –10 [95% CI –50 to –6]; Figure 2). The proportion of patients with A1C > 9% was similar for both regimens that included dapagliflozin (12.4% vs 10.4%; P = 0.616).
No significant difference was observed among treatment groups in the proportion of patients with BP < 140/90 mm Hg (Figure 2). However, most patients had BP < 140/90 mm Hg (72%–82%) at baseline, which was generally maintained at week 24.
Composite Quality Measures
Discussion
This post hoc analysis evaluated attainment of glycemic and BP quality measures for diabetes. A significantly greater proportion of patients achieved the individual quality measures of A1C < 7% and A1C < 8% with dual add-on saxagliptin plus dapagliflozin to metformin compared with single add-on saxagliptin or dapagliflozin to metformin after 24 weeks. Similar results were seen when the analysis excluded patients with A1C < 7% and < 8% at baseline. All measures of good glycemic control had clinically relevant NNTs ≤ 10 after 24 weeks with saxagliptin plus dapagliflozin plus metformin compared with saxagliptin or dapagliflozin plus metformin, regardless of baseline status. Very few patients experienced lackof improvement in glycemic control, evidenced by small proportions of patients with A1C > 9%.
There was little difference in BP between dual add-on saxagliptin plus dapagliflozin or single add-on saxagliptin or dapagliflozin to metformin. The proportion of patients who attained the BP quality measure of BP < 140/90 mm Hg was similar across the 3 treatments, as might be expected because most patients already met this target at baseline. However, as might be expected based on the mild diuretic effect and weight loss associated with SGLT-2 inhibitors [16,17], trends in BP favored groups treated with dapagliflozin.
Attainment of multiple treatment targets is desirable in reducing complications of diabetes. A significantly greater proportion of patients achieved both A1C < 7% and BP < 140/90 mm Hg when both saxagliptin and dapagliflozin were added to metformin compared with single-agent addition of either saxagliptin or dapagliflozin plus metformin. Similarly, a significantly greater proportion of patients achieved both A1C < 8% and BP < 140/90 mm Hg with dual addition of saxagliptin and dapagliflozin plus metformin compared with saxagliptin plus metformin. There was also a numerically greater number of patients who achieved both of these goals with triple therapy compared with dapagliflozin plus metformin, but this finding did not reach statistical significance. Clinically relevant NNT values ≤ 10 were observed for both composite outcomes for saxagliptin plus dapagliflozin plus metformin compared with saxagliptin plus metformin or dapagliflozin plus metformin after 24 weeks.
Despite advances in the medical management of T2D, a report published in 2013 showed that between 2007 and 2010, only 53% of patients achieved an A1C < 7.0% and only 19% simultaneously achieved all 3 American Diabetes Association (ADA) goals recommended for most patients at that time: A1C < 7.0%, BP < 130/80 mm Hg, and low-density lipoprotein cholesterol LDL-C < 100 mg/dL [18]. These data highlight a need for new approaches to help patients attain glycemic, BP, and cholesterol goals. Our results demonstrated that a higher proportion of patients attained glycemic and BP quality measures with dual add-on saxagliptin plus dapagliflozin compared with single add-on saxagliptin or dapagliflozin to metformin. As a result of recent updates for cholesterol management from the American College of Cardiology and the American Heart Association [19], attainment of a cholesterol level was retired as a diabetes quality measure and replaced with a recommendation for statin therapy use [20,21]. Although the current analysis did not include assessment of LDL, DPP-4 inhibitors have demonstrated neutral effects on lipids [22,23], and SGLT-2 inhibitors have demonstrated generally modest increases in LDL-C (placebo-adjusted change from baseline: 4.5%–8.0% for canagliflozin 100 and 300 mg/d, 3.9% for dapagliflozin 10 mg, and 2.3%–4.2% for empagliflozin 10 and 25 mg/d) [12,24,25], as well as increases in high-density lipoprotein cholesterol and reductions in triglycerides [26].
Current ADA guidelines recommend an individualized, stepwise approach to treatment with sequential addition of single oral antihyperglycemic agents for patients who do not achieve their glycemic goal in 3 months [27]. Although T2D may progress at different rates in different patients, T2D does generally progress over time [28], and the ADA and American Association of Clinical Endocrinologists treatment guidelines recommend initial dual add-on therapy for individuals with higher A1C, which is suggestive of more advanced disease [27,29]. For individuals requiring initial combination therapy, guidelines note that antihyperglycemic agents that have a low risk of hypoglycemia and low potential for weight gain should be preferentially selected [29]. Attainment of A1C ≤ 7%, the guideline recommendation considered appropriate for many patients, is associated with reductions in microvascular disease and, if attained soon after diagnosis of diabetes, studies have shown reductions in macrovascular disease with long-term follow-up [27,30,31]. However, it may be challenging to achieve A1C < 7% with the addition of single oral antihyperglycemic agents, especially in patients with higher A1C [32]. Less stringent A1C goals (eg, A1C < 8%) may be appropriate in individuals with a long duration of diabetes that is difficult to control, history of severe hypoglycemia, limited life expectancy, numerous comorbidities, and extensive complications or comorbidities, especially cardiovascular disease [27]. Given the shift toward individualized treatment plans with patient-specific treatment goals, it is valuable to understand how different treatment strategies effect attainment of guideline-recommended less stringent and more stringent glycemic targets that may be appropriate for certain patients.
In addition to quality measures that assess glucose lowering with pharmacotherapy, it is important to consider measures that assess other aspects of diabetes care. For example, quality measures related to hypoglycemia and hyperglycemia may help avoid potentially adverse glucose levels, and quality measures related to weight may provide insight on treatment and lifestyle efforts directed at weight loss and management. NQF-endorsed measures of hypoglycemia and hyperglycemia are currently moving through annual review and are paired measures, intended to be interpreted with respect to one another to ensure balanced outcomes [33,34]. This underscores the value of efficacious antihyperglycemic agents with low intrinsic potential for hypoglycemia. Although this analysis did not include quality measures related to hypoglycemia or weight, future studies evaluating these aspects of diabetes care will likely further contribute to a more comprehensive and holistic treatment approach.
In addition to assessing a broad range of quality measures, an important aspect of care to consider is patient affordability. Affordability for an individual patient will depend on access in the patient’s individual plan, the financial resources of the patient, and the potential for medical cost offsets from improved control of the patient’s disease. For example, fixed-dose combination products are associated with increased patient adherence and may increase pharmacy costs but decrease medical costs [35].
Limitations of this study include the post hoc design and that quality measure attainment was assessed over a shorter duration of time (24 weeks) than is commonly assessed in the real-world/community setting (~12 months).
Dual add-on therapy with oral antihyperglycemic agents that have complementary mechanisms of action should lead to enhanced reductions in A1C. The results reported here and from the primary study, in which saxagliptin and dapagliflozin added to metformin significantly reduced mean A1C from baseline to week 24 compared with single add-on saxagliptin or dapagliflozin [15], showed that greater reductions in A1C were attained with the coadministration of saxagliptin and dapagliflozin. The glucuretic effect of SGLT-2 inhibitors has been associated with increased plasma glucagon concentrations and increased endogenous glucose production, which may impair the full glucose-lowering potential of SGLT-2 inhibitors [36,37]. Administering saxagliptin with dapagliflozin as dual therapy was shown to blunt the rise in plasma glucagon caused by dapagliflozin [38], and this may have contributed to the greater glucose control achieved with dual add-on of these 2 antihyperglycemic drugs [15].
By targeting multiple aspects of the underlying pathophysiology in T2D, greater improvements in A1C can be achieved. Dual add-on saxagliptin plus dapagliflozin to metformin resulted in a greater proportion of patients achieving NQF-endorsed HEDIS quality measures, as well as A1C < 7% (no longer an NQF-endorsed measure). As health care shifts to a more value-based payment structure, measuring quality outcomes will assume a greater role in guiding decision making and influence the care that patients receive. Understanding how antihyperglycemic medication regimens affect quality measures can help clinicians make informed decisions.
Corresponding author: Lawrence Blonde, MD, Ochsner Diabetes Clinical Research Unit, Frank Riddick Diabetes Institute, Department of Endocrinology, Ochsner Medical Center, New Orleans, LA.
Funding/support: This study was supported by AstraZeneca. Medical writing support for the preparation of this manuscript was provided by Lauren D’Angelo, PhD, and Janet Matsuura, PhD, from Complete Healthcare Communications, LLC (Chadds Ford, PA), with funding from AstraZeneca.
Financial disclosures: Dr. Blonde has received grant and research support from AstraZeneca, Jansen Pharmaceuticals, Lexicon Pharmaceuticals, Merck, Novo Nordisk, and Sanofi-Aventis and has received honoraria for participating as a speaker from AstraZeneca, Janssen Pharmaceuticals, Merck, Novo Nordisk, and Sanofi-Aventis as well as honoraria for consultant work from AstraZeneca, GlaxoSmithKline, Intarcia Therapeutics, Janssen Pharmaceuticals, Merck, Novo Nordisk, and Sanofi-Aventis. R. Garcia-Sanchez is an employee of AstraZeneca. J. Sheehan and Y. C. Barrett were employees of AstraZeneca at the time of this research.
1. National Quality Forum. ABCs of measurement. Accessed 11 Mar 2016 at www.qualityforum.org/Measuring_Performance/ABCs_of_Measurement.aspx.
2. National Committee for Quality Assurance. HEDIS measure development process. Accessed 14 Mar 2016 at www.ncqa.org/tabid/414/Default.aspx.
3. National Committee for Quality Assurance. HEDIS measures. Accessed 11 Mar 2016 at www.ncqa.org/HEDISQualityMeasurement/HEDISMeasures.aspx.
4. National Committee for Quality Assurance. About NCQA: overview. Accessed 14 Mar 2016 at www.ncqa.org/AboutNCQA.aspx.
5. National Committee for Quality Assurance. Health care program evaluations. Accessed 11 Mar 2016 at www.ncqa.org/Programs.aspx.
6. National Committee for Quality Assurance. HEDIS and Performance Measurement. Accessed 14 Mar 2016 at www.ncqa.org/HEDISQualityMeasurement.aspx.
7. National Committee for Quality Assurance. HEDIS 2015 technical specifications for ACO measurement. Washington, DC: National Committee for Quality Assurance; 2014.
8. National Quality Forum. Comprehensive diabetes care: hemoglobin A1c (HbA1c) poor control (> 9.0%). NQF identifier: 0059. Accessed 14 Mar 2016 at www.qualityforum.org/ProjectMeasures.aspx?projectID=73652.
9. National Quality Forum. Comprehensive diabetes care: hemoglobin A1c (HbA1c) control (< 8.0%). NQF identifier: 0575. Accessed 14 Mar 2016 at www.qualityforum.org/ProjectMeasures.aspx?projectID=73652.
10. National Quality Forum. Comprehensive diabetes care: blood pressure control (< 140/90 mm Hg). NQF identifier: 0061. Accessed 14 Mar 2016 at www.qualityforum.org/ProjectMeasures.aspx?projectID=73652.
11. Onglyza(saxagliptin). Full prescribing information. AstraZeneca, Wilmington, DE; 2014.
12. Farxiga (dapagliflozin). Full prescribing information. AstraZeneca, Wilmington, DE; March 2015.
13. Deacon CF, Holst JJ. Saxagliptin: a new dipeptidyl peptidase-4 inhibitor for the treatment of type 2 diabetes. Adv Ther 2009;26:488–99.
14. Kasichayanula S, Liu X, Lacreta F, et al. Clinical pharmacokinetics and pharmacodynamics of dapagliflozin, a selective inhibitor of sodium-glucose co-transporter type 2. Clin Pharmacokinet 2014;53:17–27.
15. Rosenstock J, Hansen L, Zee P, et al. Dual add-on therapy in type 2 diabetes poorly controlled with metformin monotherapy: a randomized double-blind trial of saxagliptin plus dapagliflozin addition versus single addition of saxagliptin or dapagliflozin to metformin. Diabetes Care 2014;38:376–83.
16. Bailey CJ. SGLT2 inhibitors: glucuretic treatment for type 2 diabetes. British Journal of Diabetes & Vascular Disease 2010;10:193-9.
17. Maliha G, Townsend RR. SGLT2 inhibitors: their potential reduction in blood pressure. J Am Soc Hypertens 2015;9:48–53.
18. Stark Casagrande S, Fradkin JE, Saydah SH, et al. The prevalence of meeting A1C, blood pressure, and LDL goals among people with diabetes, 1988-2010. Diabetes Care 2013;36:2271–9.
19. Stone NJ, Robinson JG, Lichtenstein AH, et al. 2013 ACC/AHA guideline on the treatment of blood cholesterol to reduce atherosclerotic cardiovascular risk in adults: a report of the American College of Cardiology/American Heart Association Task Force on Practice Guidelines. Circulation 2014;129:S1–45.
20. National Quality Forum. Comprehensive diabetes care (composite). NQF identifier: #0731. Accessed 11 Mar 2016 at www.qualityforum.org/QPS/QPSTool.aspx.
21. National Quality Forum. Optimal diabetes care (composite measure). NQF identifier: 0729. Accessed 14 Mar 2016 at www.qualityforum.org/ProjectMeasures.aspx?projectID=73652.
22. Amori RE, Lau J, Pittas AG. Efficacy and safety of incretin therapy in type 2 diabetes: systematic review and meta-analysis. JAMA 2007;298:194–206.
23. Monami M, Lamanna C, Desideri CM, Mannucci E. DPP-4 inhibitors and lipids: systematic review and meta-analysis. Adv Ther 2012;29:14–25.
24. Invokana(canagliflzoin). Full prescribing information. Janssen Pharmaceuticals, Titusville, NJ; 2013.
25. Jardiance(empagliflozin). Full prescribing information. Boehringer Ingelheim Pharmaceuticals and Eli Lilly, Ingelheim, Germany and Indianapolis, IN; 2014.
26. Inzucchi SE, Zinman B, Wanner C, et al. SGLT-2 inhibitors and cardiovascular risk: Proposed pathways and review of ongoing outcome trials. Diab Vasc Dis Res 2015;12:90–100.
27. American Diabetes Association. Standards of medical care in diabetes-2016. Diabetes Care 2016;39:S1–S119.
28. Fonseca VA. Defining and characterizing the progression of type 2 diabetes. Diabetes Care 2009;32:S151–S6.
29. Garber AJ, Abrahamson MJ, Barzilay JI, et al. Consensus statement by the American Association of Clinical Endocrinologists and American College of Endocrinology on the comprehensive type 2 diabetes management algorithm -- 2016 executive summary. Endocr Pract 2016;22:84–113.
30. Holman RR, Paul SK, Bethel MA, et al. 10-year follow-up of intensive glucose control in type 2 diabetes. N Engl J Med 2008;359:1577–89.
31. Nathan DM, Cleary PA, Backlund JY, et al. Intensive diabetes treatment and cardiovascular disease in patients with type 1 diabetes. N Engl J Med 2005;353:2643–53.
32. Bosi E, Camisasca RP, Collober C, et al. Effects of vildagliptin on glucose control over 24 weeks in patients with type 2 diabetes inadequately controlled with metformin. Diabetes Care 2007;30:890–5.
33. National Quality Forum. Glycemic control: hypoglycemia. NQF identifier: 2363. Accessed 29 Oct 2015 at www.qualityforum.org/QPS/QPSTool.aspx.
34. National Quality Forum. Glycemic control: hyperglycemia. NQF identifier: 2362. Accessed 11 Mar 2016 at www.qualityforum.org/QPS/QPSTool.aspx.
35. Bailey CJ, Day C. Fixed-dose single tablet antidiabetic combinations. Diabetes Obes Metab 2009;11:527–33.
36. Ferrannini E, Muscelli E, Frascerra S, et al. Metabolic response to sodium-glucose cotransporter 2 inhibition in type 2 diabetic patients. J Clin Invest 2014;124:499–508.
37. Merovci A, Solis-Herrera C, Daniele G, et al. Dapagliflozin improves muscle insulin sensitivity but enhances endogenous glucose production. J Clin Invest 2014;124:509–14.
38. Hansen L, Iqbal N, Ekholm E, et al. Postprandial dynamics of plasma glucose, insulin, and glucagon in patients with type 2 diabetes treated with saxagliptin plus dapagliflozin add-on to metformin therapy. Endocr Pract 2014;20:1187–97.