User login
An 85-year-old woman with respiratory failure and positional hypoxemia
An 85-year-old woman was brought to our intensive care unit because of worsening hypoxemia over the past day. About 3 weeks earlier she had been diagnosed with acute bilateral pulmonary emboli in the distal branches of the left and right lower lobes and right middle lobe, for which she was receiving anticoagulation therapy.
At presentation she had generalized fatigue and dyspnea at rest that was worse with exertion, but she denied having fever, chest pain, or cough. Her medical history included hypertension, hyperlipidemia, hypothyroidism, stage 1 breast cancer in remission, thromboembolic stroke, and myasthenia gravis. Before her hospital admission, she had been taking rosuvastatin, metoprolol tartrate, pyridostigmine, prednisone, furosemide, levothyroxine, and rivaroxaban. She did not smoke, she was retired, and she had not traveled recently.
Her blood pressure was 135/66 mm Hg, pulse 73 beats per minute, respiratory rate 16, temperature 35.4ºC (95.7ºF), and oxygen saturation 88% while receiving oxygen at 6 L/min via nasal cannula. Physical examination revealed mild edema in the lower extremities and basilar decreased breath sounds. She had no finger clubbing or cyanosis and was not using accessory muscles to breathe. Of note, her oxygen saturation remained more than 93% when she was recumbent but sharply dropped to less than 85% when she was upright.
Laboratory values
Results of initial laboratory testing were as follows:
- Sodium 138 mmol/L (reference range 132–148)
- Potassium 4.2 mmol/L (3.5–5.0)
- Chloride 99 mmol/L (98–111)
- Bicarbonate 29 mmol/L (23–32)
- Creatinine 0.52 mg/dL (0.7–1.4).
- White blood cell count 11.06 × 10⁹/L (3.7–11.0)
- Hemoglobin 12.6 g/dL (12–16)
- Platelet count 211 × 109/L (150–400).
- International normalized ratio 1.4.
Electrocardiography and imaging studies
Standard 12-lead electrocardiography showed normal sinus rhythm with left axis deviation and left ventricular hypertrophy.
Chest radiography showed bilateral interstitial opacities and small pleural effusions.
Computed tomography (CT) of the chest with contrast, compared with a CT scan done 20 days earlier, showed that the pulmonary emboli had resolved.
Arterial blood gases
In view of her positional hypoxemia, blood for arterial blood gas measurements was drawn in the supine and upright positions.
Supine, with a fraction of inspired oxygen (Fio2) via high-flow nasal cannula of 45%, her values were:
- pH 7.45 (reference range 7.35–7.45)
- Pco2 34 mm Hg (36–46)
- Po2 81 mm Hg (85–95)
- Bicarbonate 23 mmol/L (22–26).
Upright, her hypoxemia was significantly worse:
- pH 7.46
- Pco2 33 mm Hg
- Po2 57 mm Hg
- Bicarbonate 23 mmol/L.
The methemoglobin level was normal on both measurements.
During her stay in the intensive care unit, she required up to 100% Fio2 because of persistent hypoxemia.
CAUSES OF HYPOXEMIA
1. So far, the patient’s laboratory tests and imaging studies point to which of the following as the most likely cause of her severe hypoxemia?
- Ventilation-perfusion (V/Q) mismatch
- Diffusion abnormality
- Hypoventilation
- Shunting
- None of the above
The arterial blood gas measurements suggested the possibility of shunting as the cause, although further imaging would be needed to confirm that.
V/Q mismatch can occur in respiratory failure due to pulmonary embolism, pulmonary edema, or shunting. If ventilation is preserved but perfusion is impaired, the V/Q ratio approaches infinity (dead-space ventilation), a situation that can be seen in pulmonary embolism. If perfusion is preserved and ventilation is impaired, the V/Q ratio approaches zero, which is consistent with a physiologic shunt.
Hypoxemia may improve in less severe forms of V/Q mismatch. In our patient, the repeat CT with contrast showed that her pulmonary embolism had resolved, so this is probably not the cause of her severe hypoxemia.
Diffusion abnormalities are due to defects in the lung parenchyma, such as in chronic obstructive pulmonary disease, interstitial lung disease, and lung fibrosis.
Hypoxemia from diffusion defects is usually aggravated by a precipitating factor that increases oxygen demand, and it usually improves with oxygen supplementation. This is unlikely in our patient, as she did not have a history of chronic interstitial lung disease and CT showed no evidence of severe lung parenchymal disease.
Hypoventilation is usually due to drugs that cause respiratory depression, to stroke, or to neuromuscular diseases such as myasthenia gravis that can cause respiratory muscle weakness. It results in elevation of Pco2 and, if not corrected, respiratory acidosis.
Our patient had a diagnosis of myasthenia gravis, though hypoventilation is unlikely in her case because she had a normal respiratory rate and low Pco2 values.
Shunting can be physiologic or anatomic and can occur in the heart or the lungs. In physiologic shunting, severe V/Q mismatch can occur when ventilation is affected, as in severe pulmonary edema and pneumonia. In anatomic shunting, a defect such as an atrial septal defect or a pulmonary arteriovenous malformation allows blood to bypass areas of ventilation from the venous to the arterial circulation, preventing it from being oxygenated. In true anatomic shunting, supplemental oxygen with 100% Fio2 has little effect, whereas in V/Q mismatch it can raise the arterial oxygen saturation.
Our patient’s radiograph did not suggest severe pneumonia or pulmonary edema, which makes these unlikely causes of her hypoxemia. At this point, because of her positional hypoxemia, further evaluation with contrast-enhanced echocardiography was needed to evaluate for anatomic shunting in the heart or lungs.
FURTHER TESTING
Transthoracic echocardiography (TTE) with agitated saline with a Valsalva maneuver was performed. Normally, no bubbles are seen in the left-sided chambers after intravenous injection of agitated saline contrast, whereas bubbles on the left side suggest an intracardiac or intrapulmonary shunt. In our patient, this test was negative, and her right ventricular systolic pressure was normal.
2. What further testing should be considered to evaluate our patient’s hypoxemia?
- High-resolution chest CT
- Transesophageal echocardiography (TEE)
- Pulmonary function testing
- Repeated arterial blood gas measurement
- Edrophonium testing
Repeat imaging with high-resolution CT would likely not provide additional information and would expose the patient to additional radiation without adding much clinical benefit.
TEE could help further evaluate the intracardiac anatomy and look for shunting, which may be missed on TTE because of suboptimal positioning or image quality.
Pulmonary function testing is useful in establishing the baseline function and impairment in respiratory volumes. If an acute myasthenic crisis is suspected, measuring the negative inspiratory force and the forced vital capacity can be useful in monitoring worsening respiratory muscle weakness and assessing the need for mechanical ventilation.
In our patient, it is unlikely that pulmonary function testing would help, since her acute respiratory failure was probably not caused by neuromuscular weakness.
Repeated arterial blood gas measurement would likely only confirm that the patient still has positional hypoxemia but would not help sort through the differential diagnosis.
Edrophonium testing is useful in diagnosing myasthenia gravis and differentiating it from other neuromuscular diseases, such as Lambert-Eaton syndrome. Edrophonium, a reversible acetylcholinesterase inhibitor, prevents degradation of acetylcholine and prolongs its effect at the synaptic cleft, thus improving muscle weakness.
Our patient has already been diagnosed with myasthenia gravis, so this test is not likely to uncover the cause of her hypoxemia.
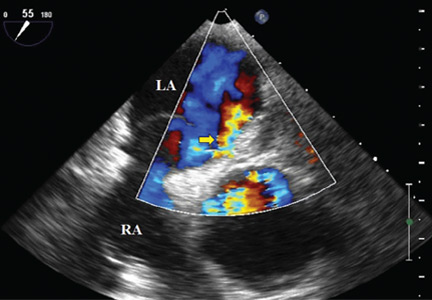
Because we still strongly suspected a shunt, TEE was performed with intravenous injection of agitated saline. TEE with the patient upright revealed intracardiac right-to-left shunting through a patent foramen ovale. The midesophageal view after saline injection showed a large interatrial septal aneurysm with total excursion of 2 cm, and right-to-left shunting within the first beat, consistent with an intracardiac shunt (Figure 1). Color Doppler imaging (Figure 2) demonstrated turbulent flow through the patent foramen ovale, consistent with right-to-left shunting, and also showed the patent foramen ovale in a closed position (Figure 3).

3. Which is now most likely the cause of our patient’s hypoxemia?
- Chronic thromboembolic pulmonary hypertension
- Myasthenic crisis
- Platypnea-orthodeoxia syndrome due to the patent foramen ovale
- Methemoglobinemia
Chronic thromboembolic pulmonary hypertension is usually a long-term result of untreated or inadequately treated thromboembolic disease (eg, pulmonary emboli), which causes vascular remodeling and pulmonary arteriopathy, which in turn leads to increased pulmonary vascular resistance and pulmonary hypertension.
This is unlikely the cause of our patient’s acute hypoxemia, as her symptoms did not suggest it. Moreover, an elevated right ventricular systolic pressure on TTE would suggest pulmonary hypertension, but TTE did not show this, and repeat chest CT indicated that her pulmonary embolism had been adequately treated and had resolved. A V/Q scan and right heart catheterization would help rule out chronic thromboembolic pulmonary hypertension, although these were not done in our patient.
Myasthenic crisis is the progressive fatiguing and paralysis of respiratory muscles ultimately requiring mechanical ventilation to sustain life. It is often brought on by infection or drug therapy.
Our patient did not require intubation and she had no signs or symptoms of myasthenic crisis such as ptosis, dysphagia, or dysarthria. She had a negative inspiratory force of −21 cm H2O, and pulmonary function testing 4 days before her hospital admission had shown a forced vital capacity of 1.84 L, making myasthenic crisis an unlikely cause of her respiratory failure.
Platypnea-orthodeoxia syndrome is a syndrome of dyspnea (platypnea) and hypoxemia (orthodeoxia) that is induced by sitting upright or standing and resolves when lying down. It is a result of right-to-left intracardiac or intrapulmonary shunting in the presence of an anatomic defect and a functional element causing redirection of shunt flow through the anatomic defect in an upright position.1 It is associated with specific cardiac, pulmonary, and hepatic diseases, such as atrial septal defect, pulmonary arteriovenous malformation, and hepatopulmonary syndrome.2 It can occur even if right-sided chamber pressures are normal, and several mechanisms of the underlying pathophysiology have been described.3
Platypnea-orthodeoxia syndrome can be triggered by an event that causes a spontaneous transient elevation of right atrial pressure and pulmonary hypertension, such as our patient’s acute pulmonary embolism. Increased right-to-left shunting occurs in an upright position, causing preferential redirection of flow from the inferior vena cava through the interatrial septum and the patent foramen ovale.4
Our patient was elderly and, like one in every four people in the world, she had had a patent foramen ovale since the day she was born. Never causing a problem, it had remained undiagnosed until complicated by platypnea-orthodeoxia syndrome after her recent pulmonary embolism.
Methemoglobinemia. Methemoglobin has a lower affinity for oxygen than normal hemoglobin. Elevations usually occur with medications such as anesthetics and nitrates and can be diagnosed through an elevated level on arterial blood gas testing.
Our patient did not have elevated methemoglobin on her blood gas measurements on admission; therefore, this is unlikely to be the diagnosis.
CASE CONCLUDED
Percutaneous closure of the patent foramen ovale with a 30-mm Amplatzer Cribriform Occluder brought significant improvement in our patient’s functional status and arterial oxygenation saturation, and 2 weeks later at follow-up she no longer needed supplemental oxygen. TEE 6 months later showed an intact closure device and no interatrial shunting.
WHEN HYPOXEMIA DOES NOT RESPOND TO OXYGEN
In the intensive care unit, time is critical, and when hypoxia is refractory to high Fio2, shunting should be considered.
In the acute-care setting, platypnea-orthodeoxia syndrome can be identified quickly by pulse oximetry and serial blood gas measurements in the upright and supine positions. A drop in arterial oxygenation in the upright position vs the supine position helps confirm the diagnosis.
Other conditions in the differential diagnosis of this syndrome include recurrent pulmonary embolism, acute respiratory distress syndrome, interstitial pulmonary fibrosis, intrapulmonary shunting due to arteriovenous malformation, and diaphragm paralysis due to neuromuscular disease.
In our patient, positional blood gas measurements demonstrated a significant drop in arterial oxygen saturation from the supine to the upright position, raising our suspicion of shunting. It helped narrow the differential diagnosis and guided our selection of additional diagnostic tests.
The initial chest radiograph in our patient was normal. TTE did not reveal shunting and showed a normal right ventricular systolic pressure. TTE with agitated saline also failed to reveal shunting. Because of suboptimal positioning and image quality, TTE may miss the shunting physiology, and that is why we proceeded to positional TEE, which can better evaluate the hemodynamic effects of positional changes on patent foramen ovale and shunting.
MORE ABOUT PATENT FORAMEN OVALE
The prevalence of patent foramen ovale is estimated at 27% in the general population, but it is usually not symptomatic. It can be associated with atrial septal aneurysm and Chiari network malformations. When associated with atrial septal aneurysm, it carries a higher risk of stroke.5
Our patient had a large atrial septal aneurysm with a septal excursion of 2 cm as well as a history of thromboembolic stroke, which was likely associated with the patent foramen ovale and the atrial septal aneurysm.
Atrial septal aneurysm is rare, with a prevalence of 1% at autopsy and 1.9% by TTE. It is defined by a septal excursion of at least 10 mm and a base diameter of at least 15 mm and is more frequently detected on TEE than on TTE.6
Studies have shown that contrast and color Doppler TEE are superior to TTE for detecting patent foramen ovale.7 Tilt-table TEE with contrast enhancement has also been used to better demonstrate the morphology of the interatrial septum and the degree of shunting due to the separation between the septum primum and septum secundum causing the patent foramen ovale.8 Contrast-enhanced transcranial Doppler has also been shown comparable to contrast TEE to detect interatrial shunting. However, TEE provides additional anatomic information.9
In our patient, atrial septal aneurysm and patent foramen ovale were exaggerated by upright positioning, which opened the aneurysm and increased the shunting through the patent foramen ovale.
The treatment of choice in symptomatic patients with platypnea-orthodeoxia syndrome is directed at the underlying cause, in this case closure of the foramen ovale. This treatment has been shown to be safe and effective in these patients,10 but caution should be used when considering foramen ovale closure in patients with pulmonary hypertension.11
In patients with irreversible or severe pulmonary hypertension, closure of the patent foramen ovale can exacerbate right heart dysfunction and lead to right heart failure. There are situations when closure of a patent foramen ovale can be considered in pulmonary hypertension; however, each decision is individualized, and caution must be used. A detailed discussion is beyond the scope of this paper.
A thorough history and physical examination are important in differentiating the various causes of hypoxemia. Appropriate diagnostic testing is needed along with prompt treatment of the underlying cause of platypnea-orthodeoxia syndrome.
- Cheng TO. Mechanisms of platypnea-orthodeoxia: what causes water to flow uphill? Circulation 2002; 105:e47.
- Natalie AA, Nichols L, Bump GM. Platypnea-orthodeoxia, an uncommon presentation of patent foramen ovale. Am J Med Sci 2010; 339:78–80.
- Acharya SS, Kartan R. A case of orthodeoxia caused by an atrial septal aneurysm. Chest 2000; 118:871–874.
- Irwin B, Ray S. Patent foramen ovale—assessment and treatment. Cardiovasc Ther 2012; 30:e128–e135.
- Mas JL, Zuber M. Recurrent cerebrovascular events in patients with patent foramen ovale, atrial septal aneurysm, or both and cryptogenic stroke or transient ischemic attack. French Study Group on Patent Foramen Ovale and Atrial Septal Aneurysm. Am Heart J 1995; 130:1083–1088.
- Kerut EK, Norfleet WT, Plotnick GD, Giles TD. Patent foramen ovale: a review of associated conditions and the impact of physiological size. J Am Coll Cardiol 2001; 38:613–623.
- Hausmann D, Mügge A, Becht I, Daniel WG. Diagnosis of patent foramen ovale by transesophageal echocardiography and association with cerebral and peripheral embolic events. Am J Cardiol 1992; 70:668–672.
- Roxas-Timonera M, Larracas C, Gersony D, Di Tullio M, Keller A, Homma S. Patent foramen ovale presenting as platypnea-orthodeoxia: diagnosis by transesophageal echocardiography. J Am Soc Echocardiogr 2001; 14:1039–1041.
- Sloan MA, Alexandrov AV, Tegeler CH, et al; Therapeutics and Technology Assessment Subcommittee of the American Academy of Neurology. Assessment: transcranial Doppler ultrasonography: report of the Therapeutics and Technology Assessment Subcommittee of the American Academy of Neurology. Neurology 2004; 62:1468–1481.
- Blanche C, Noble S, Roffi M, et al. Platypnea-orthodeoxia syndrome in the elderly treated by percutaneous patent foramen ovale closure: a case series and literature review. Eur J Intern Med 2013; 24:813–817.
- Tobis J, Shenoda M. Percutaneous treatment of patent foramen ovale and atrial septal defects. J Am Coll Cardiol 2012; 60:1722–1732.
An 85-year-old woman was brought to our intensive care unit because of worsening hypoxemia over the past day. About 3 weeks earlier she had been diagnosed with acute bilateral pulmonary emboli in the distal branches of the left and right lower lobes and right middle lobe, for which she was receiving anticoagulation therapy.
At presentation she had generalized fatigue and dyspnea at rest that was worse with exertion, but she denied having fever, chest pain, or cough. Her medical history included hypertension, hyperlipidemia, hypothyroidism, stage 1 breast cancer in remission, thromboembolic stroke, and myasthenia gravis. Before her hospital admission, she had been taking rosuvastatin, metoprolol tartrate, pyridostigmine, prednisone, furosemide, levothyroxine, and rivaroxaban. She did not smoke, she was retired, and she had not traveled recently.
Her blood pressure was 135/66 mm Hg, pulse 73 beats per minute, respiratory rate 16, temperature 35.4ºC (95.7ºF), and oxygen saturation 88% while receiving oxygen at 6 L/min via nasal cannula. Physical examination revealed mild edema in the lower extremities and basilar decreased breath sounds. She had no finger clubbing or cyanosis and was not using accessory muscles to breathe. Of note, her oxygen saturation remained more than 93% when she was recumbent but sharply dropped to less than 85% when she was upright.
Laboratory values
Results of initial laboratory testing were as follows:
- Sodium 138 mmol/L (reference range 132–148)
- Potassium 4.2 mmol/L (3.5–5.0)
- Chloride 99 mmol/L (98–111)
- Bicarbonate 29 mmol/L (23–32)
- Creatinine 0.52 mg/dL (0.7–1.4).
- White blood cell count 11.06 × 10⁹/L (3.7–11.0)
- Hemoglobin 12.6 g/dL (12–16)
- Platelet count 211 × 109/L (150–400).
- International normalized ratio 1.4.
Electrocardiography and imaging studies
Standard 12-lead electrocardiography showed normal sinus rhythm with left axis deviation and left ventricular hypertrophy.
Chest radiography showed bilateral interstitial opacities and small pleural effusions.
Computed tomography (CT) of the chest with contrast, compared with a CT scan done 20 days earlier, showed that the pulmonary emboli had resolved.
Arterial blood gases
In view of her positional hypoxemia, blood for arterial blood gas measurements was drawn in the supine and upright positions.
Supine, with a fraction of inspired oxygen (Fio2) via high-flow nasal cannula of 45%, her values were:
- pH 7.45 (reference range 7.35–7.45)
- Pco2 34 mm Hg (36–46)
- Po2 81 mm Hg (85–95)
- Bicarbonate 23 mmol/L (22–26).
Upright, her hypoxemia was significantly worse:
- pH 7.46
- Pco2 33 mm Hg
- Po2 57 mm Hg
- Bicarbonate 23 mmol/L.
The methemoglobin level was normal on both measurements.
During her stay in the intensive care unit, she required up to 100% Fio2 because of persistent hypoxemia.
CAUSES OF HYPOXEMIA
1. So far, the patient’s laboratory tests and imaging studies point to which of the following as the most likely cause of her severe hypoxemia?
- Ventilation-perfusion (V/Q) mismatch
- Diffusion abnormality
- Hypoventilation
- Shunting
- None of the above
The arterial blood gas measurements suggested the possibility of shunting as the cause, although further imaging would be needed to confirm that.
V/Q mismatch can occur in respiratory failure due to pulmonary embolism, pulmonary edema, or shunting. If ventilation is preserved but perfusion is impaired, the V/Q ratio approaches infinity (dead-space ventilation), a situation that can be seen in pulmonary embolism. If perfusion is preserved and ventilation is impaired, the V/Q ratio approaches zero, which is consistent with a physiologic shunt.
Hypoxemia may improve in less severe forms of V/Q mismatch. In our patient, the repeat CT with contrast showed that her pulmonary embolism had resolved, so this is probably not the cause of her severe hypoxemia.
Diffusion abnormalities are due to defects in the lung parenchyma, such as in chronic obstructive pulmonary disease, interstitial lung disease, and lung fibrosis.
Hypoxemia from diffusion defects is usually aggravated by a precipitating factor that increases oxygen demand, and it usually improves with oxygen supplementation. This is unlikely in our patient, as she did not have a history of chronic interstitial lung disease and CT showed no evidence of severe lung parenchymal disease.
Hypoventilation is usually due to drugs that cause respiratory depression, to stroke, or to neuromuscular diseases such as myasthenia gravis that can cause respiratory muscle weakness. It results in elevation of Pco2 and, if not corrected, respiratory acidosis.
Our patient had a diagnosis of myasthenia gravis, though hypoventilation is unlikely in her case because she had a normal respiratory rate and low Pco2 values.
Shunting can be physiologic or anatomic and can occur in the heart or the lungs. In physiologic shunting, severe V/Q mismatch can occur when ventilation is affected, as in severe pulmonary edema and pneumonia. In anatomic shunting, a defect such as an atrial septal defect or a pulmonary arteriovenous malformation allows blood to bypass areas of ventilation from the venous to the arterial circulation, preventing it from being oxygenated. In true anatomic shunting, supplemental oxygen with 100% Fio2 has little effect, whereas in V/Q mismatch it can raise the arterial oxygen saturation.
Our patient’s radiograph did not suggest severe pneumonia or pulmonary edema, which makes these unlikely causes of her hypoxemia. At this point, because of her positional hypoxemia, further evaluation with contrast-enhanced echocardiography was needed to evaluate for anatomic shunting in the heart or lungs.
FURTHER TESTING
Transthoracic echocardiography (TTE) with agitated saline with a Valsalva maneuver was performed. Normally, no bubbles are seen in the left-sided chambers after intravenous injection of agitated saline contrast, whereas bubbles on the left side suggest an intracardiac or intrapulmonary shunt. In our patient, this test was negative, and her right ventricular systolic pressure was normal.
2. What further testing should be considered to evaluate our patient’s hypoxemia?
- High-resolution chest CT
- Transesophageal echocardiography (TEE)
- Pulmonary function testing
- Repeated arterial blood gas measurement
- Edrophonium testing
Repeat imaging with high-resolution CT would likely not provide additional information and would expose the patient to additional radiation without adding much clinical benefit.
TEE could help further evaluate the intracardiac anatomy and look for shunting, which may be missed on TTE because of suboptimal positioning or image quality.
Pulmonary function testing is useful in establishing the baseline function and impairment in respiratory volumes. If an acute myasthenic crisis is suspected, measuring the negative inspiratory force and the forced vital capacity can be useful in monitoring worsening respiratory muscle weakness and assessing the need for mechanical ventilation.
In our patient, it is unlikely that pulmonary function testing would help, since her acute respiratory failure was probably not caused by neuromuscular weakness.
Repeated arterial blood gas measurement would likely only confirm that the patient still has positional hypoxemia but would not help sort through the differential diagnosis.
Edrophonium testing is useful in diagnosing myasthenia gravis and differentiating it from other neuromuscular diseases, such as Lambert-Eaton syndrome. Edrophonium, a reversible acetylcholinesterase inhibitor, prevents degradation of acetylcholine and prolongs its effect at the synaptic cleft, thus improving muscle weakness.
Our patient has already been diagnosed with myasthenia gravis, so this test is not likely to uncover the cause of her hypoxemia.
Because we still strongly suspected a shunt, TEE was performed with intravenous injection of agitated saline. TEE with the patient upright revealed intracardiac right-to-left shunting through a patent foramen ovale. The midesophageal view after saline injection showed a large interatrial septal aneurysm with total excursion of 2 cm, and right-to-left shunting within the first beat, consistent with an intracardiac shunt (Figure 1). Color Doppler imaging (Figure 2) demonstrated turbulent flow through the patent foramen ovale, consistent with right-to-left shunting, and also showed the patent foramen ovale in a closed position (Figure 3).
3. Which is now most likely the cause of our patient’s hypoxemia?
- Chronic thromboembolic pulmonary hypertension
- Myasthenic crisis
- Platypnea-orthodeoxia syndrome due to the patent foramen ovale
- Methemoglobinemia
Chronic thromboembolic pulmonary hypertension is usually a long-term result of untreated or inadequately treated thromboembolic disease (eg, pulmonary emboli), which causes vascular remodeling and pulmonary arteriopathy, which in turn leads to increased pulmonary vascular resistance and pulmonary hypertension.
This is unlikely the cause of our patient’s acute hypoxemia, as her symptoms did not suggest it. Moreover, an elevated right ventricular systolic pressure on TTE would suggest pulmonary hypertension, but TTE did not show this, and repeat chest CT indicated that her pulmonary embolism had been adequately treated and had resolved. A V/Q scan and right heart catheterization would help rule out chronic thromboembolic pulmonary hypertension, although these were not done in our patient.
Myasthenic crisis is the progressive fatiguing and paralysis of respiratory muscles ultimately requiring mechanical ventilation to sustain life. It is often brought on by infection or drug therapy.
Our patient did not require intubation and she had no signs or symptoms of myasthenic crisis such as ptosis, dysphagia, or dysarthria. She had a negative inspiratory force of −21 cm H2O, and pulmonary function testing 4 days before her hospital admission had shown a forced vital capacity of 1.84 L, making myasthenic crisis an unlikely cause of her respiratory failure.
Platypnea-orthodeoxia syndrome is a syndrome of dyspnea (platypnea) and hypoxemia (orthodeoxia) that is induced by sitting upright or standing and resolves when lying down. It is a result of right-to-left intracardiac or intrapulmonary shunting in the presence of an anatomic defect and a functional element causing redirection of shunt flow through the anatomic defect in an upright position.1 It is associated with specific cardiac, pulmonary, and hepatic diseases, such as atrial septal defect, pulmonary arteriovenous malformation, and hepatopulmonary syndrome.2 It can occur even if right-sided chamber pressures are normal, and several mechanisms of the underlying pathophysiology have been described.3
Platypnea-orthodeoxia syndrome can be triggered by an event that causes a spontaneous transient elevation of right atrial pressure and pulmonary hypertension, such as our patient’s acute pulmonary embolism. Increased right-to-left shunting occurs in an upright position, causing preferential redirection of flow from the inferior vena cava through the interatrial septum and the patent foramen ovale.4
Our patient was elderly and, like one in every four people in the world, she had had a patent foramen ovale since the day she was born. Never causing a problem, it had remained undiagnosed until complicated by platypnea-orthodeoxia syndrome after her recent pulmonary embolism.
Methemoglobinemia. Methemoglobin has a lower affinity for oxygen than normal hemoglobin. Elevations usually occur with medications such as anesthetics and nitrates and can be diagnosed through an elevated level on arterial blood gas testing.
Our patient did not have elevated methemoglobin on her blood gas measurements on admission; therefore, this is unlikely to be the diagnosis.
CASE CONCLUDED
Percutaneous closure of the patent foramen ovale with a 30-mm Amplatzer Cribriform Occluder brought significant improvement in our patient’s functional status and arterial oxygenation saturation, and 2 weeks later at follow-up she no longer needed supplemental oxygen. TEE 6 months later showed an intact closure device and no interatrial shunting.
WHEN HYPOXEMIA DOES NOT RESPOND TO OXYGEN
In the intensive care unit, time is critical, and when hypoxia is refractory to high Fio2, shunting should be considered.
In the acute-care setting, platypnea-orthodeoxia syndrome can be identified quickly by pulse oximetry and serial blood gas measurements in the upright and supine positions. A drop in arterial oxygenation in the upright position vs the supine position helps confirm the diagnosis.
Other conditions in the differential diagnosis of this syndrome include recurrent pulmonary embolism, acute respiratory distress syndrome, interstitial pulmonary fibrosis, intrapulmonary shunting due to arteriovenous malformation, and diaphragm paralysis due to neuromuscular disease.
In our patient, positional blood gas measurements demonstrated a significant drop in arterial oxygen saturation from the supine to the upright position, raising our suspicion of shunting. It helped narrow the differential diagnosis and guided our selection of additional diagnostic tests.
The initial chest radiograph in our patient was normal. TTE did not reveal shunting and showed a normal right ventricular systolic pressure. TTE with agitated saline also failed to reveal shunting. Because of suboptimal positioning and image quality, TTE may miss the shunting physiology, and that is why we proceeded to positional TEE, which can better evaluate the hemodynamic effects of positional changes on patent foramen ovale and shunting.
MORE ABOUT PATENT FORAMEN OVALE
The prevalence of patent foramen ovale is estimated at 27% in the general population, but it is usually not symptomatic. It can be associated with atrial septal aneurysm and Chiari network malformations. When associated with atrial septal aneurysm, it carries a higher risk of stroke.5
Our patient had a large atrial septal aneurysm with a septal excursion of 2 cm as well as a history of thromboembolic stroke, which was likely associated with the patent foramen ovale and the atrial septal aneurysm.
Atrial septal aneurysm is rare, with a prevalence of 1% at autopsy and 1.9% by TTE. It is defined by a septal excursion of at least 10 mm and a base diameter of at least 15 mm and is more frequently detected on TEE than on TTE.6
Studies have shown that contrast and color Doppler TEE are superior to TTE for detecting patent foramen ovale.7 Tilt-table TEE with contrast enhancement has also been used to better demonstrate the morphology of the interatrial septum and the degree of shunting due to the separation between the septum primum and septum secundum causing the patent foramen ovale.8 Contrast-enhanced transcranial Doppler has also been shown comparable to contrast TEE to detect interatrial shunting. However, TEE provides additional anatomic information.9
In our patient, atrial septal aneurysm and patent foramen ovale were exaggerated by upright positioning, which opened the aneurysm and increased the shunting through the patent foramen ovale.
The treatment of choice in symptomatic patients with platypnea-orthodeoxia syndrome is directed at the underlying cause, in this case closure of the foramen ovale. This treatment has been shown to be safe and effective in these patients,10 but caution should be used when considering foramen ovale closure in patients with pulmonary hypertension.11
In patients with irreversible or severe pulmonary hypertension, closure of the patent foramen ovale can exacerbate right heart dysfunction and lead to right heart failure. There are situations when closure of a patent foramen ovale can be considered in pulmonary hypertension; however, each decision is individualized, and caution must be used. A detailed discussion is beyond the scope of this paper.
A thorough history and physical examination are important in differentiating the various causes of hypoxemia. Appropriate diagnostic testing is needed along with prompt treatment of the underlying cause of platypnea-orthodeoxia syndrome.
- Cheng TO. Mechanisms of platypnea-orthodeoxia: what causes water to flow uphill? Circulation 2002; 105:e47.
- Natalie AA, Nichols L, Bump GM. Platypnea-orthodeoxia, an uncommon presentation of patent foramen ovale. Am J Med Sci 2010; 339:78–80.
- Acharya SS, Kartan R. A case of orthodeoxia caused by an atrial septal aneurysm. Chest 2000; 118:871–874.
- Irwin B, Ray S. Patent foramen ovale—assessment and treatment. Cardiovasc Ther 2012; 30:e128–e135.
- Mas JL, Zuber M. Recurrent cerebrovascular events in patients with patent foramen ovale, atrial septal aneurysm, or both and cryptogenic stroke or transient ischemic attack. French Study Group on Patent Foramen Ovale and Atrial Septal Aneurysm. Am Heart J 1995; 130:1083–1088.
- Kerut EK, Norfleet WT, Plotnick GD, Giles TD. Patent foramen ovale: a review of associated conditions and the impact of physiological size. J Am Coll Cardiol 2001; 38:613–623.
- Hausmann D, Mügge A, Becht I, Daniel WG. Diagnosis of patent foramen ovale by transesophageal echocardiography and association with cerebral and peripheral embolic events. Am J Cardiol 1992; 70:668–672.
- Roxas-Timonera M, Larracas C, Gersony D, Di Tullio M, Keller A, Homma S. Patent foramen ovale presenting as platypnea-orthodeoxia: diagnosis by transesophageal echocardiography. J Am Soc Echocardiogr 2001; 14:1039–1041.
- Sloan MA, Alexandrov AV, Tegeler CH, et al; Therapeutics and Technology Assessment Subcommittee of the American Academy of Neurology. Assessment: transcranial Doppler ultrasonography: report of the Therapeutics and Technology Assessment Subcommittee of the American Academy of Neurology. Neurology 2004; 62:1468–1481.
- Blanche C, Noble S, Roffi M, et al. Platypnea-orthodeoxia syndrome in the elderly treated by percutaneous patent foramen ovale closure: a case series and literature review. Eur J Intern Med 2013; 24:813–817.
- Tobis J, Shenoda M. Percutaneous treatment of patent foramen ovale and atrial septal defects. J Am Coll Cardiol 2012; 60:1722–1732.
Hordeolum: Acute abscess within an eyelid sebaceous gland
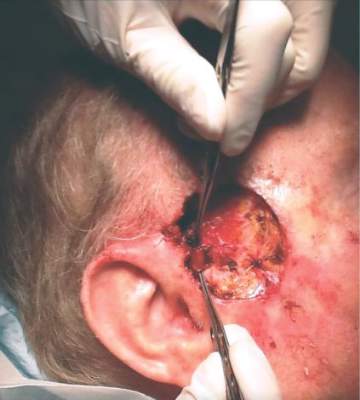
An 89-year-old man presented complaining of a tender, painful lump in the right lower eyelid that spontaneously appeared 3 days previously. There was no discharge, bleeding, or reduced vision. He had a history of hypertension and macular degeneration. There was no history of a pre-existing eyelid lesion, ocular malignancy, rosacea, or seborrheic dermatitis. Examination of the right lower lid revealed a roundish raised abscess with surrounding erythema (Figure 1). The raised area was tender on palpation; there was no discharge. The palpebral conjunctiva was normal. A diagnosis of a hordeolum was made, and conservative treatment was prescribed, ie, warm compresses and massage for 10 minutes four times a day. The lesion improved gradually and resolved over 3 weeks.

A hordeolum is an acute abscess within an eyelid gland, usually staphylococcal in origin. When it involves a meibomian gland it is termed an internal hordeolum, and when it involves the gland of Zeis or Moll it is termed an external hordeolum (Figure 2).1 Hordeola may be associated with diabetes, blepharitis, seborrheic dermatitis, rosacea, and high levels of serum lipids. Treatment is with warm compresses and massage. A hordeolum with preseptal cellulitis, signs of bacteremia, or tender preauricular lymph nodes requires systemic antibiotics (eg, flucloxacillin 250–500 mg four times a day for 1 week).
Preseptal cellulitis is an infection of the subcutaneous tissues anterior to the orbital septum. The orbital septum is a sheet of fibrous tissue that originates in the orbital periosteum and inserts in the palpebral tissues along the tarsal plates of the eyelid. The orbital septum provides a barrier against the spread of periorbital infection into the orbit (orbital cellulitis). The causes of preseptal cellulitis include skin trauma (eg, lacerations, insect bites), spread from local infections (eg, hordeolum, dacryocystitis), or systemic infections (eg, upper respiratory tract, middle ear). Clinical features include malaise, fever, and painful eyelid with periorbital edema. Any sign of proptosis, chemosis, painful restricted eye movements, diplopia, lagophthalmos, or optic nerve dysfunction warrants further investigation. Chronic or large hordeola may require incision and curettage.
A recent Cochrane review concluded that there was no evidence of the effectiveness of nonsurgical interventions (including hot or warm compresses, lid scrubs, antibiotics, and steroids) for hordeolum, and controlled clinical trials would be useful.2
Chalazion and hordeolum are similar in appearance and often confused (Table 1). A chalazion is a chronic lipogranuloma due to leakage of sebum from an obstructed meibomian gland. It may develop from an internal hordeolum. Small chalazia usually resolve with time without any intervention, and hot compresses can be effective at encouraging drainage. Persistent lesions may be surgically removed by incision and curettage. Recurrence warrants biopsy and histologic study to rule out sebaceous gland carcinoma.3
- Mueller JB, McStay CM. Ocular infection and inflammation. Emerg Med Clin North Am 2008; 26:57–72.
- Lindsley K, Nichols JJ, Dickersin K. Interventions for acute internal hordeolum. Cochrane Database Syst Rev 2013; 4:CD007742.
- Denniston AKO, Murray PI: Oxford handbook of ophthalmology. 2nd ed. United Kingdom: Oxford University Press; 2009.
An 89-year-old man presented complaining of a tender, painful lump in the right lower eyelid that spontaneously appeared 3 days previously. There was no discharge, bleeding, or reduced vision. He had a history of hypertension and macular degeneration. There was no history of a pre-existing eyelid lesion, ocular malignancy, rosacea, or seborrheic dermatitis. Examination of the right lower lid revealed a roundish raised abscess with surrounding erythema (Figure 1). The raised area was tender on palpation; there was no discharge. The palpebral conjunctiva was normal. A diagnosis of a hordeolum was made, and conservative treatment was prescribed, ie, warm compresses and massage for 10 minutes four times a day. The lesion improved gradually and resolved over 3 weeks.
A hordeolum is an acute abscess within an eyelid gland, usually staphylococcal in origin. When it involves a meibomian gland it is termed an internal hordeolum, and when it involves the gland of Zeis or Moll it is termed an external hordeolum (Figure 2).1 Hordeola may be associated with diabetes, blepharitis, seborrheic dermatitis, rosacea, and high levels of serum lipids. Treatment is with warm compresses and massage. A hordeolum with preseptal cellulitis, signs of bacteremia, or tender preauricular lymph nodes requires systemic antibiotics (eg, flucloxacillin 250–500 mg four times a day for 1 week).
Preseptal cellulitis is an infection of the subcutaneous tissues anterior to the orbital septum. The orbital septum is a sheet of fibrous tissue that originates in the orbital periosteum and inserts in the palpebral tissues along the tarsal plates of the eyelid. The orbital septum provides a barrier against the spread of periorbital infection into the orbit (orbital cellulitis). The causes of preseptal cellulitis include skin trauma (eg, lacerations, insect bites), spread from local infections (eg, hordeolum, dacryocystitis), or systemic infections (eg, upper respiratory tract, middle ear). Clinical features include malaise, fever, and painful eyelid with periorbital edema. Any sign of proptosis, chemosis, painful restricted eye movements, diplopia, lagophthalmos, or optic nerve dysfunction warrants further investigation. Chronic or large hordeola may require incision and curettage.
A recent Cochrane review concluded that there was no evidence of the effectiveness of nonsurgical interventions (including hot or warm compresses, lid scrubs, antibiotics, and steroids) for hordeolum, and controlled clinical trials would be useful.2
Chalazion and hordeolum are similar in appearance and often confused (Table 1). A chalazion is a chronic lipogranuloma due to leakage of sebum from an obstructed meibomian gland. It may develop from an internal hordeolum. Small chalazia usually resolve with time without any intervention, and hot compresses can be effective at encouraging drainage. Persistent lesions may be surgically removed by incision and curettage. Recurrence warrants biopsy and histologic study to rule out sebaceous gland carcinoma.3
- Mueller JB, McStay CM. Ocular infection and inflammation. Emerg Med Clin North Am 2008; 26:57–72.
- Lindsley K, Nichols JJ, Dickersin K. Interventions for acute internal hordeolum. Cochrane Database Syst Rev 2013; 4:CD007742.
- Denniston AKO, Murray PI: Oxford handbook of ophthalmology. 2nd ed. United Kingdom: Oxford University Press; 2009.

How can I predict bleeding in my elderly patient taking anticoagulants?
We have tools to predict bleeding risk, but their predictive value is modest, and the estimated risk of bleeding is often outweighed by the benefits of anticoagulant therapy.
Anticoagulant therapy is commonly prescribed for conditions that disproportionately affect the elderly, including atrial fibrillation, venous thromboembolism, and valvular heart disease. Though anticoagulants are highly effective in preventing clots, they also significantly increase the risk of bleeding. Since older age is a risk factor for bleeding as well as thrombosis, it is essential to weigh the risks and benefits of anticoagulants for each patient.
WHAT KINDS OF BLEEDING DEVELOP IN PATIENTS ON ANTICOAGULANTS?
Patients taking anticoagulants have roughly double the risk of bleeding compared with patients not on anticoagulants.1 Bleeding rates tend to be slightly higher in patients taking anticoagulants for venous thromboembolism than in those taking them for atrial fibrillation. The average yearly risk of a “major” anticoagulant-associated bleeding event (eg, requiring transfusion or intervention or occurring in a critical anatomic site) is about 2% to 3%, with most of the bleeding being gastrointestinal.2
Intracranial hemorrhage is by far the most deadly complication of anticoagulant therapy: it causes 90% of deaths and disability from warfarin-associated hemorrhage and is associated with a death rate over 50%; however, it is much less common than gastrointestinal bleeding.3 Anticoagulant therapy increases the risk of intracranial hemorrhage by only 0.2% per year.1
RISK-PREDICTION TOOLS HAVE LIMITATIONS
Not all patients have the same risk of bleeding when taking anticoagulants. Many factors in addition to advanced age have been associated with increased bleeding risk, including coexisting medical conditions (such as malignancy, prior stroke or bleeding event, and renal insufficiency), medications (particularly aspirin, nonsteroidal anti-inflammatory drugs, and other antiplatelet drugs), and the timing and intensity of anticoagulation therapy.4
Scoring tools have been developed to identify patients at higher risk of bleeding (Table 1).4–9 The various schemes incorporate many of the same variables, such as older age, renal impairment, and history of bleeding, but some include additional risk factors while others are more parsimonious. They also differ in how individual risk factors are weighted to generate a final risk score.
In terms of predictive ability, none of the available risk schemes appears to be vastly superior, and their ability to predict hemorrhage is modest at best. There is also no universal or well-established threshold at which the risk of bleeding is so high that one would not consider anticoagulants. In fact, a “high-risk” patient may have an aggregate bleeding rate of only 4% to 6% per year. Using risk schemes such as ATRIA,5 HEMORR2HAGES,6 and HAS-BLED7 may be more useful because they provide an estimate of bleeding risk for each point on the scale.
Moreover, the current tools to predict bleeding risk have several other limitations. They were developed in patients already taking anticoagulants and so probably underestimate the actual risk of hemorrhage, as people who could not take anticoagulants were excluded, most likely because they were at high risk of bleeding. Therefore, bleeding risk tools probably apply best to a patient for whom anticoagulation can be considered.
Some clinical variables are necessarily broad. For example, “prior bleeding” is a risk factor included in several risk scores, but does not distinguish between massive variceal bleeding and minor hemorrhoidal bleeding.
Risk scores do not effectively predict intracranial hemorrhage.
Finally, these risk tools were developed in patients taking vitamin K antagonists, and it is not yet established that they can effectively predict hemorrhage related to other, newer anticoagulants.
WHEN DOES BLEEDING RISK OUTWEIGH ANTICOAGULATION BENEFIT?
For patients with atrial fibrillation, the net clinical benefit of anticoagulation (strokes prevented minus bleeding events induced) increases as the risk of stroke rises. Updated guidelines for managing atrial fibrillation now recommend anticoagulation for most patients.10
For most older patients with atrial fibrillation, the decision to anticoagulate may not change even if a bleeding risk tool indicates a high bleeding risk.11 For example, a patient with a history of ischemic stroke will generally derive more benefit than harm from anticoagulants. The primary exception is in patients with prior lobar intracranial hemorrhage, because of the high risk of rebleeding and the worse outcomes associated with intracranial hemorrhage.12 As a general rule, most patients with atrial fibrillation and an additional risk factor for stroke should be considered for anticoagulant therapy unless they have a history of lobar intracranial hemorrhage.
Anticoagulation may be deferred if the patient is at the lower end of the stroke risk spectrum and if the bleeding risk is calculated to be high. However, as noted before, current bleeding risk tools probably do not capture the experiences of patients at the extremes of high bleeding risk, so clinical judgment continues to be important. In addition, forgoing anticoagulation could be reasonable even in patients at high risk for recurrent stroke if their life expectancy is limited, if anticoagulation is unacceptably burdensome, or if it is not within their goals and preferences.
WHAT ABOUT FALL RISK?
Fall risk commonly deters clinicians from prescribing anticoagulants because of the fear of causing intracranial hemorrhage. In particular, falls increase the risk for subdural hematoma, which has a death rate comparable to that of ischemic stroke.13
Studies have had difficulty quantifying the exact risk associated with falls because these patients are less likely to be prescribed anticoagulants. One decision analysis estimated that a person would have to fall about 300 times per year before the risk of intracranial hemorrhage outweighed the benefits from stroke reduction.14 Studies have found that patients at high risk of falls have a higher risk of intracranial hemorrhage, but that this risk is counterbalanced by an even greater risk of ischemic stroke.15
Therefore, if the baseline risk of ischemic stroke is high, anticoagulation is still favored.
WHEN SHOULD I USE A BLEEDING RISK TOOL?
Despite their limitations, bleeding risk tools are useful in clinical practice when estimates of bleeding risk affect clinical behavior. They are most helpful for patients at the lower end of the stroke or thromboembolism risk spectrum, where the decision to anticoagulate is strongly influenced by bleeding risk. Risk tools may also be helpful when counseling patients about their bleeding risk off and on anticoagulants.
Finally, recognizing that a patient is at high bleeding risk may lead the clinician to consider closer monitoring of anticoagulants or to implement strategies to reduce the risk.
- Hart RG, Pearce LA, Aguilar MI. Meta-analysis: antithrombotic therapy to prevent stroke in patients who have nonvalvular atrial fibrillation. Ann Intern Med 2007; 146:857–867.
- Lopes LC, Spencer FA, Neumann I, et al. Bleeding risk in atrial fibrillation patients taking vitamin K antagonists: systematic review and meta-analysis. Clin Pharmacol Ther 2013; 94:367–375.
- Fang MC, Go AS, Chang Y, et al. Death and disability from warfarin-associated intracranial and extracranial hemorrhages. Am J Med 2007; 120:700–705.
- Lopes RD, Crowley MJ, Shah BR, et al. Stroke prevention in atrial fibrillation. Rockville (MD): Agency for Healthcare Research and Quality (US); 2013 Aug. Report No.: 13-EHC113-EF.
- Fang MC, Go AS, Chang Y, et al. A new risk scheme to predict warfarin-associated hemorrhage: the ATRIA (Anticoagulation and Risk Factors in Atrial Fibrillation) Study. J Am Coll Cardiol 2011; 58:395–401.
- Gage BF, Yan Y, Milligan PE, et al. Clinical classification schemes for predicting hemorrhage: results from the National Registry of Atrial Fibrillation (NRAF) Am Heart J 2006; 151:713–719.
- Pisters R, Lane DA, Nieuwlaat R, de Vos CB, Crijns HJ, Lip GY. A novel user-friendly score (HAS-BLED) to assess 1-year risk of major bleeding in patients with atrial fibrillation: the Euro Heart Survey. Chest 2010; 138:1093–1100.
- Beyth RJ, Quinn LM, Landefeld CS. Prospective evaluation of an index for predicting the risk of major bleeding in outpatients treated with warfarin. Am J Med 1998; 105:91–99.
- Nieto JA, Solano R, Iglesias NT, et al, for the RIETE Investigators. Validation of a score for predicting fatal bleeding in patients receiving anticoagulation for venous thromboembolism. Thrombosis Res 2013; 132:175–179.
- January CT, Wann LS, Alpert JS, et al; ACC/AHA Task Force Members. 2014 AHA/ACC/HRS guideline for the management of patients with atrial fibrillation: executive summary: a report of the American College of Cardiology/American Heart Association Task Force on practice guidelines and the Heart Rhythm Society. Circulation 2014; 130:2071–2104.
- Singer DE, Chang Y, Fang MC, et al. The net clinical benefit of warfarin anticoagulation in atrial fibrillation. Ann Intern Med 2009; 151:297–305.
- Eckman MH, Rosand J, Knudsen KA, Singer DE, Greenberg SM. Can patients be anticoagulated after intracerebral hemorrhage? A decision analysis. Stroke 2003; 34:1710–1716.
- Fang MC, Go AS, Chang Y, et al. Thirty-day mortality after ischemic stroke and intracranial hemorrhage in patients with atrial fibrillation on and off anticoagulants. Stroke 2012; 43:1795–1799.
- Man-Son-Hing M, Laupacis A. Anticoagulant-related bleeding in older persons with atrial fibrillation: physicians' fears often unfounded. Arch Intern Med 2003; 163:1580–1586.
- Gage BF, Birman-Deych E, Kerzner R, Radford MJ, Nilasena DS, Rich MW. Incidence of intracranial hemorrhage in patients with atrial fibrillation who are prone to fall. Am J Med 2005; 118:612–617.
We have tools to predict bleeding risk, but their predictive value is modest, and the estimated risk of bleeding is often outweighed by the benefits of anticoagulant therapy.
Anticoagulant therapy is commonly prescribed for conditions that disproportionately affect the elderly, including atrial fibrillation, venous thromboembolism, and valvular heart disease. Though anticoagulants are highly effective in preventing clots, they also significantly increase the risk of bleeding. Since older age is a risk factor for bleeding as well as thrombosis, it is essential to weigh the risks and benefits of anticoagulants for each patient.
WHAT KINDS OF BLEEDING DEVELOP IN PATIENTS ON ANTICOAGULANTS?
Patients taking anticoagulants have roughly double the risk of bleeding compared with patients not on anticoagulants.1 Bleeding rates tend to be slightly higher in patients taking anticoagulants for venous thromboembolism than in those taking them for atrial fibrillation. The average yearly risk of a “major” anticoagulant-associated bleeding event (eg, requiring transfusion or intervention or occurring in a critical anatomic site) is about 2% to 3%, with most of the bleeding being gastrointestinal.2
Intracranial hemorrhage is by far the most deadly complication of anticoagulant therapy: it causes 90% of deaths and disability from warfarin-associated hemorrhage and is associated with a death rate over 50%; however, it is much less common than gastrointestinal bleeding.3 Anticoagulant therapy increases the risk of intracranial hemorrhage by only 0.2% per year.1
RISK-PREDICTION TOOLS HAVE LIMITATIONS
Not all patients have the same risk of bleeding when taking anticoagulants. Many factors in addition to advanced age have been associated with increased bleeding risk, including coexisting medical conditions (such as malignancy, prior stroke or bleeding event, and renal insufficiency), medications (particularly aspirin, nonsteroidal anti-inflammatory drugs, and other antiplatelet drugs), and the timing and intensity of anticoagulation therapy.4
Scoring tools have been developed to identify patients at higher risk of bleeding (Table 1).4–9 The various schemes incorporate many of the same variables, such as older age, renal impairment, and history of bleeding, but some include additional risk factors while others are more parsimonious. They also differ in how individual risk factors are weighted to generate a final risk score.
In terms of predictive ability, none of the available risk schemes appears to be vastly superior, and their ability to predict hemorrhage is modest at best. There is also no universal or well-established threshold at which the risk of bleeding is so high that one would not consider anticoagulants. In fact, a “high-risk” patient may have an aggregate bleeding rate of only 4% to 6% per year. Using risk schemes such as ATRIA,5 HEMORR2HAGES,6 and HAS-BLED7 may be more useful because they provide an estimate of bleeding risk for each point on the scale.
Moreover, the current tools to predict bleeding risk have several other limitations. They were developed in patients already taking anticoagulants and so probably underestimate the actual risk of hemorrhage, as people who could not take anticoagulants were excluded, most likely because they were at high risk of bleeding. Therefore, bleeding risk tools probably apply best to a patient for whom anticoagulation can be considered.
Some clinical variables are necessarily broad. For example, “prior bleeding” is a risk factor included in several risk scores, but does not distinguish between massive variceal bleeding and minor hemorrhoidal bleeding.
Risk scores do not effectively predict intracranial hemorrhage.
Finally, these risk tools were developed in patients taking vitamin K antagonists, and it is not yet established that they can effectively predict hemorrhage related to other, newer anticoagulants.
WHEN DOES BLEEDING RISK OUTWEIGH ANTICOAGULATION BENEFIT?
For patients with atrial fibrillation, the net clinical benefit of anticoagulation (strokes prevented minus bleeding events induced) increases as the risk of stroke rises. Updated guidelines for managing atrial fibrillation now recommend anticoagulation for most patients.10
For most older patients with atrial fibrillation, the decision to anticoagulate may not change even if a bleeding risk tool indicates a high bleeding risk.11 For example, a patient with a history of ischemic stroke will generally derive more benefit than harm from anticoagulants. The primary exception is in patients with prior lobar intracranial hemorrhage, because of the high risk of rebleeding and the worse outcomes associated with intracranial hemorrhage.12 As a general rule, most patients with atrial fibrillation and an additional risk factor for stroke should be considered for anticoagulant therapy unless they have a history of lobar intracranial hemorrhage.
Anticoagulation may be deferred if the patient is at the lower end of the stroke risk spectrum and if the bleeding risk is calculated to be high. However, as noted before, current bleeding risk tools probably do not capture the experiences of patients at the extremes of high bleeding risk, so clinical judgment continues to be important. In addition, forgoing anticoagulation could be reasonable even in patients at high risk for recurrent stroke if their life expectancy is limited, if anticoagulation is unacceptably burdensome, or if it is not within their goals and preferences.
WHAT ABOUT FALL RISK?
Fall risk commonly deters clinicians from prescribing anticoagulants because of the fear of causing intracranial hemorrhage. In particular, falls increase the risk for subdural hematoma, which has a death rate comparable to that of ischemic stroke.13
Studies have had difficulty quantifying the exact risk associated with falls because these patients are less likely to be prescribed anticoagulants. One decision analysis estimated that a person would have to fall about 300 times per year before the risk of intracranial hemorrhage outweighed the benefits from stroke reduction.14 Studies have found that patients at high risk of falls have a higher risk of intracranial hemorrhage, but that this risk is counterbalanced by an even greater risk of ischemic stroke.15
Therefore, if the baseline risk of ischemic stroke is high, anticoagulation is still favored.
WHEN SHOULD I USE A BLEEDING RISK TOOL?
Despite their limitations, bleeding risk tools are useful in clinical practice when estimates of bleeding risk affect clinical behavior. They are most helpful for patients at the lower end of the stroke or thromboembolism risk spectrum, where the decision to anticoagulate is strongly influenced by bleeding risk. Risk tools may also be helpful when counseling patients about their bleeding risk off and on anticoagulants.
Finally, recognizing that a patient is at high bleeding risk may lead the clinician to consider closer monitoring of anticoagulants or to implement strategies to reduce the risk.
- Hart RG, Pearce LA, Aguilar MI. Meta-analysis: antithrombotic therapy to prevent stroke in patients who have nonvalvular atrial fibrillation. Ann Intern Med 2007; 146:857–867.
- Lopes LC, Spencer FA, Neumann I, et al. Bleeding risk in atrial fibrillation patients taking vitamin K antagonists: systematic review and meta-analysis. Clin Pharmacol Ther 2013; 94:367–375.
- Fang MC, Go AS, Chang Y, et al. Death and disability from warfarin-associated intracranial and extracranial hemorrhages. Am J Med 2007; 120:700–705.
- Lopes RD, Crowley MJ, Shah BR, et al. Stroke prevention in atrial fibrillation. Rockville (MD): Agency for Healthcare Research and Quality (US); 2013 Aug. Report No.: 13-EHC113-EF.
- Fang MC, Go AS, Chang Y, et al. A new risk scheme to predict warfarin-associated hemorrhage: the ATRIA (Anticoagulation and Risk Factors in Atrial Fibrillation) Study. J Am Coll Cardiol 2011; 58:395–401.
- Gage BF, Yan Y, Milligan PE, et al. Clinical classification schemes for predicting hemorrhage: results from the National Registry of Atrial Fibrillation (NRAF) Am Heart J 2006; 151:713–719.
- Pisters R, Lane DA, Nieuwlaat R, de Vos CB, Crijns HJ, Lip GY. A novel user-friendly score (HAS-BLED) to assess 1-year risk of major bleeding in patients with atrial fibrillation: the Euro Heart Survey. Chest 2010; 138:1093–1100.
- Beyth RJ, Quinn LM, Landefeld CS. Prospective evaluation of an index for predicting the risk of major bleeding in outpatients treated with warfarin. Am J Med 1998; 105:91–99.
- Nieto JA, Solano R, Iglesias NT, et al, for the RIETE Investigators. Validation of a score for predicting fatal bleeding in patients receiving anticoagulation for venous thromboembolism. Thrombosis Res 2013; 132:175–179.
- January CT, Wann LS, Alpert JS, et al; ACC/AHA Task Force Members. 2014 AHA/ACC/HRS guideline for the management of patients with atrial fibrillation: executive summary: a report of the American College of Cardiology/American Heart Association Task Force on practice guidelines and the Heart Rhythm Society. Circulation 2014; 130:2071–2104.
- Singer DE, Chang Y, Fang MC, et al. The net clinical benefit of warfarin anticoagulation in atrial fibrillation. Ann Intern Med 2009; 151:297–305.
- Eckman MH, Rosand J, Knudsen KA, Singer DE, Greenberg SM. Can patients be anticoagulated after intracerebral hemorrhage? A decision analysis. Stroke 2003; 34:1710–1716.
- Fang MC, Go AS, Chang Y, et al. Thirty-day mortality after ischemic stroke and intracranial hemorrhage in patients with atrial fibrillation on and off anticoagulants. Stroke 2012; 43:1795–1799.
- Man-Son-Hing M, Laupacis A. Anticoagulant-related bleeding in older persons with atrial fibrillation: physicians' fears often unfounded. Arch Intern Med 2003; 163:1580–1586.
- Gage BF, Birman-Deych E, Kerzner R, Radford MJ, Nilasena DS, Rich MW. Incidence of intracranial hemorrhage in patients with atrial fibrillation who are prone to fall. Am J Med 2005; 118:612–617.
Predicting is tough, especially about the future

Quinn and Fang, in this issue of the Journal discuss efforts to predict bleeding complications associated with anticoagulant therapy in elderly patients. They note, as others have suggested, that we may fear the risk of severe anticoagulant-associated bleeding more than is warranted based on the data. The level of that fear and the risk of bleeding depend on the specific need for anticoagulant therapy in a given patient and on the risk of serious adverse outcomes from thrombosis that the anticoagulation is supposed to prevent. All prediction models are based on an “average” patient with certain characteristics. But of course none of our patients are average.
The studies Quinn and Fang discuss focus on vitamin K antagonist therapy. There is probably not enough practice-based or trial-based evidence yet to evaluate the risks associated with the new generation of anticoagulants.
All prediction models have limitations. The recent discussion on establishing a risk-based strategy to guide institution of lipid-lowering therapy highlights the challenges inherent in trying to base therapeutic decisions on predictive models. But however imperfect, models are still widely used to predict fracture risk in patients being considered for bone antiresorptive therapy and to predict the need for anticoagulation therapy or further diagnostic testing in patients with potential deep vein thrombosis or atrial fibrillation.
The decision to start anticoagulation in an elderly patient is often informed by the possibility of an easily recognized and feared risk factor for bleeding complications—falling. Falls are certainly important and are a major contributor to subdural hematoma and complicated hip fracture. But there are more common causes of severe bleeding complications that are less easily predicted by functional assessment of the patient. Nonetheless, fall risk can be lessened by prescribing exercise programs such as tai chi to improve balance, limiting the use of drugs associated with falls in the elderly, perhaps correcting hyponatremia, and testing for orthostatic hypotension as part of the physical examination. (Mild compression stockings and medication adjustment may reduce orthostasis.) Some of these interventions are easily accomplished, and probably should be done with all of our elderly and frail patients.
As we build more risk calculators into our electronic medical records, we must continue to consider their limitations as well as their specific utility. To paraphrase Yogi Berra, making predictions is tough, especially about the future.

Self-monitoring of blood glucose: Advice for providers and patients
Self-monitoring of blood glucose is a critical part of diabetes management, with many benefits. It promotes personal responsibility and provides opportunities for better control. It allows for detection of blood glucose extremes, thus helping to reduce blood glucose fluctuations. It also helps both the patient and the provider make informed decisions and can help reduce microvascular and macrovascular complications.
Studies have shown that hemoglobin A1c levels are lower if glucose is tested more frequently.1 Most people with type 1 diabetes and many with type 2 diabetes self-monitor their blood glucose levels.
This article discusses who should monitor their blood glucose and how often, types of meters and supplies available, advances in technology, and limitations of current blood glucose meters.
WHETHER AND HOW OFTEN TO MONITOR
In clinical practice, advice about whether patients should monitor their blood glucose levels and how often to do it depends on the type of diabetes therapy, the need to titrate the dose or change the regimen, and the patient’s preferences, dexterity, and visual acuity. The frequency of testing also often depends on financial considerations and insurance coverage.
In patients with type 1 diabetes and insulin-treated type 2 diabetes, the role of glucose self-monitoring is clear. The American Diabetes Association (ADA) recommends that patients receiving multiple insulin injections daily or on an insulin pump measure their blood glucose at least before meals and snacks, occasionally after meals, at bedtime, before exercise, when they suspect their blood glucose level is low, after treating low blood glucose until they are normoglycemic, and before critical tasks such as driving.2
The Diabetes Control and Complications Trial (DCCT)3 and the DCCT/Epidemiology of Diabetes Interventions and Complications (DCCT/EDIC) study4 showed that intensive insulin therapy effectively delays the onset and slows the progression of microvascular and macrovacscular disease. Self-monitoring of blood glucose is an integral part of intensive insulin therapy, allowing for dose adjustments based on immediate blood glucose readings, thereby reducing the risks of hyperglycemia and hypoglycemia.
For patients taking a single daily dose of basal insulin, fasting blood glucose values are often used to titrate the basal insulin dose.3
Patients with type 2 diabetes on oral hypoglycemic agents such as sulfonylureas and meglitinides are at risk of hypoglycemia. Although a review of the literature could find no studies to support recommendations for specific testing frequency for patients taking these medications, it stands to reason that the potential for hypoglycemia would indicate a clear need for regular self-monitoring. Checking the blood glucose once or twice daily, typically fasting, 2 hours after the largest meal or at bedtime, provides useful data points for the patient and the provider. As with patients on insulin, testing before driving also reduces the risk of a motor vehicle accident caused by hypoglycemia.
In any patient who is testing one or two times per day, staggering the testing time on different days can give valuable insight into glucose control at different times of day, including after meals and at night.
In patients on nonintensive regimens and at low risk of hypoglycemia, glucose self-monitoring may be less critical. Nonintensive regimens with a low risk of hypoglycemia include diet and exercise alone and diet and exercise with a medication that is not insulin or an insulin secretagogue. In these cases, self-monitoring is often not seen as clinically useful or cost-effective, and hemoglobin A1c is used as a marker.
Admittedly, few randomized controlled trials have been done in which patients were treated according to identical protocols except for glucose self-monitoring, but outcomes from the published studies support the use of structured self-monitoring of blood glucose for improvement in clinical outcomes and quality of life when self-monitoring is incorporated into a comprehensive management plan.5–9 By providing feedback, self-monitoring encourages patients to actively participate in controlling and treating their disease. It helps them to recognize the impact of blood glucose on their own self-management decisions in the areas of diet, exercise, stress management, and medications. Therefore, the ADA recommends that healthcare providers encourage their patients to perform self-monitoring even if on nonintensive regimens. For these patients, checking even two or three times per week can help them to learn about the factors that affect their blood glucose.2
BLOOD GLUCOSE TARGETS
The ADA2 recommends the following glycemic goals for most nonpregnant adults:
- Fasting and premeal—80–130 mg/dL
- 2-hour postprandial—less than 180 mg/dL
- Bedtime—100–150 mg/dL.
However, diabetes management should be individualized on the basis of age and other comorbidities. For example, geriatric patients who have frequent episodes of hypoglycemia are prone to more harm than benefit from intensifying therapy to achieve these targets. Consequently, they may be candidates for more relaxed goals to avoid episodes of dangerous hypoglycemia.
When discussing blood glucose targets, an important but often overlooked concern is how the patient perceives the results. Providers and patients alike often describe readings as “good” or “bad.” This interpretation can lead to feelings of disappointment and failure in the patient and frustration in the provider. Instead, high blood glucose readings should be viewed as a way to identify opportunities for change. Patients may be more willing to check and even log their blood glucose levels if they see this information as an instrument to be used in the collaborative relationship with their provider.
CHOOSING A BLOOD GLUCOSE METER
Barring any special needs of the patient, meters are often selected on the basis of the patients’ insurance coverage for self-monitoring supplies (test strips and lancets), because of the high cost of test strips when purchased out-of-pocket. Meters themselves are usually relatively inexpensive, since the manufacturers commonly give them away as free samples to providers, who pass them along to patients. They also can often be purchased using coupons at a significant discount.
Without insurance coverage, test strips can cost $0.83 to $1.76 per strip for the most popular brands of meters. For patients without insurance coverage for supplies, the lowest-cost test strips currently available are for the ReliOn Prime Blood Glucose Monitoring System (ie, meter) sold at Walmart. Although ReliOn meters are not given out as samples in providers’ offices, the manufacturer’s suggested retail price is $16.24. More importantly, the suggested retail price for ReliOn Prime test strips is $9.00 for a bottle of 50 strips, or $0.18 per strip.10
For patients with special needs
For patients with special needs, there are meters that can make self-monitoring more convenient. For a patient who has problems with dexterity, grasping small test strips may be difficult. Two options are:
- Accu-Chek Compact Plus, which uses a 17-strip drum loaded into the meter
- Bayer Breeze2, which uses a 10-strip disk.
Both of the above dispense one strip at a time and eliminate the need to handle individual test strips.
Patients with poor visual acuity also face challenges with self-monitoring. Meters with options such as a backlight, a color screen, or a large display can help. Other meters talk, allowing patients to hear settings and blood glucose results. Examples are:
- Prodigy Autocode
- Prodigy Voice
- Embrace.
Other meter options depend on patient preference. Features that can affect patient choice include the ability to flag readings (eg, premeal, postmeal, exercise) and transfer data to other devices, blood sample size, meter size, touchscreen, meter memory and storage, rechargeable vs replaceable batteries, and the time it takes the meter to display the glucose reading.
Meters with advanced functions
For patients who want or need more advanced options, meters are now offering more feedback.
The OneTouch Verio family of meters helps patients spot patterns in their blood glucose levels. In addition, the Verio Flex and Verio Sync meters can sync with the OneTouch Reveal mobile app, which provides reports for the patient to view and send to the healthcare provider.
The Accu-Chek Aviva Expert has a bolus calculation function. Settings such as carbohydrate ratios, insulin sensitivity, targets, and active insulin can be programmed into the meter, which uses this information to give the patient dosing suggestions for rapid-acting insulin when carbohydrate intake is entered or blood glucose levels are checked. Another Accu-Chek meter, the Aviva Connect, can wirelessly transmit blood glucose results to the Accu-Chek Connect mobile app.
For a complete and regularly updated list of meters and their features, we encourage patients and healthcare providers to refer to the ADA’s Diabetes Forecast magazine. The magazine publishes a consumer guide every January that includes a comprehensive list of blood glucose meters. Past issues of the guide are available at www.diabetesforecast.org/past-issues-archive.html.
METER ACCURACY
Even though patients and providers use glucose self-monitoring results to make important decisions about diabetes management, the meters have limitations in accuracy. Accuracy comparisons from third-party sources are rare due to the cost of accuracy testing. However, the US Food and Drug Administration (FDA) requires all home glucose meters to meet accuracy standards set by the International Organization for Standardization (ISO). Currently, the FDA uses ISO standard 15197:2003, but ISO has published a revision, ISO standard 15197:2013, with stricter guidelines that have yet to be adopted by the FDA.10,11 Current and future guidelines are shown in Table 1.10
In addition to variations in accuracy that are deemed acceptable by the FDA, there are other more controllable factors that can further affect the accuracy of glucose meter results. Expired test strips, unwashed hands, poor sampling technique, storage of test strips in extreme temperatures or humidity, and a low hematocrit level all can cause inaccurate readings.
If the patient has a low hematocrit, consider recommending a meter proven to have stable performance in the setting of low hematocrit. These meters are highlighted in a 2013 study by Ramljak et al.12
LANCETS, LANCING DEVICES, AND TECHNIQUES
Along with a variety of meters, patients also have an array of lancets and lancing devices from which to choose. Many patients use the brand of lancet device and lancets that come in their meter starter kit, but they can use other brands if desired. For cost-conscious patients, lancets are significantly more affordable than test strips, even for those without insurance coverage. Prices can be as low as $0.03 per lancet for some store-brand 33-gauge lancets. Name-brand lancets are more expensive than store-brand, but at $0.06 to $0.16 per lancet, many patients will even find these to be affordable if they must pay out of pocket.
Special needs may also prompt patients to choose a different lancet device than the one that came with their meter. For patients who have poor dexterity or are afraid to look at needles, the Accu-Chek FastClix lancing device uses drums with six preloaded lancets, eliminating the need to see and handle individual lancets. The FastClix device is included in the starter kits for the Accu-Chek Nano and Accu-Chek Connect meters and can also be ordered separately at pharmacies.
Reducing pain when testing
A common complaint about glucose self-monitoring is that it hurts. Below are some tips for reducing pain when testing:
- Use a new lancet for each blood glucose check.
- Choose a lancet device with a depth gauge and select the lowest setting that allows for a sufficient sample size.
- Lancets come in a variety of sizes, typically from 28 gauge to 33 gauge, so choose a lancet with a smaller gauge (ie, a higher gauge number).
- Poke the side of the fingertip instead of the end or the middle.
- Alternate the fingers instead of repeatedly using the same finger.
- To minimize pain from forceful squeezing of the fingertip to get a sufficient blood sample, start squeezing the palm and push the blood progressively into the fingertip.
- Consider alternate-site testing, especially if you have painful upper-extremity neuropathy.
LOGGING BLOOD GLUCOSE READINGS
Although many meters can automatically transfer their data to mobile devices or computers, patients are still encouraged to log their glucose readings manually. Not only does this give feedback to the provider in the event that the downloading software is not available in that provider’s office, it also allows patients to learn how to identify patterns in their readings and make changes in their diabetes self-management.
In the past, all logging was done on paper forms or in log books, but today’s technology offers other options. Several meters offer downloading software for home use that displays the data in a usable format. Some smartphone apps allow patients to enter glucose readings and other useful diabetes information such as food intake and exercise. Below are examples of smartphone apps that can help patients track glucose levels and much more:
- mySugr (iPhone and Android)
- Glucose Buddy (iPhone and Android)
- OnTrack Diabetes (Android)
- Glucool Diabetes (Android) (also available in a premium version).
- Glooko (iPhone and Android). This app requires purchase of a compatible cable to connect the patient’s phone to the meter, which then allows readings to be transferred directly to the app.
THE ROLE OF THE CERTIFIED DIABETES EDUCATOR
One of the most useful resources available to providers is the assistance of a certified diabetes educator, who can teach a patient the basic operation of a blood glucose meter and educate the patient on all topics discussed in this article and more.
Certified diabetes educators are instrumental in helping patients understand blood glucose targets, the rationale for glucose self-monitoring, logging, pattern management, special features in meters, control testing, and alternate-site testing, and using the results of testing to make meaningful changes in how they self-manage their diabetes. Education should include discussions about topics such as meal planning, exercise, and medications to help patients fully grasp the impact of their daily decisions on their blood glucose control.
- Polonsky WH, Fisher L, Schikman CH, et al. Structured self-monitoring of blood glucose significantly reduces A1C levels in poorly controlled, noninsulin-treated type 2 diabetes: results from the Structured Testing Program study. Diabetes Care 2011; 34:262–267.
- American Diabetes Association (ADA). Standards of medical care in diabetes—2016. Glycemic targets. Diabetes Care 2016; 39(suppl):S39–S46.
- The Diabetes Control and Complications Trial Research Group. The effect of intensive treatment of diabetes on the development and progression of long-term complications in insulin-dependent diabetes mellitus. N Engl J Med 1993; 329:977–986.
- Nathan DM, Cleary PA, Backlund JY, et al; Diabetes Control and Complications Trial/Epidemiology of Diabetes Interventions and Complications (DCCT/EDIC) Study Research Group. Intensive diabetes treatment and cardiovascular disease in patients with type 1 diabetes. N Engl J Med 2005; 353:2643–2653.
- International Diabetes Federation (IDF). IDF guideline on self-monitoring of blood glucose in non-insulin treated type 2 diabetes. www.idf.org/guidelines/self-monitoring. Accessed April 8, 2016.
- Bosi E, Scavini M, Ceriello A, et al; PRISMA Study Group. Intensive structured self-monitoring of blood glucose and glycemic control in noninsulin-treated type 2 diabetes: the PRISMA randomized trial. Diabetes Care 2013; 36:2887–2894.
- Franciosi M, Lucisano G, Pellegrini F, et al; ROSES Study Group. ROSES: role of self-monitoring of blood glucose and intensive education in patients with type 2 diabetes not receiving insulin. A pilot randomized clinical trial. Diabet Med 2011; 28:789–796.
- Durán A, Martín P, Runkle I, et al. Benefits of self-monitoring blood glucose in the management of new-onset type 2 diabetes mellitus: the St Carlos Study, a prospective randomized clinic-based interventional study with parallel groups. J Diabetes 2010; 2:203–211.
- Kempf K, Kruse J, Martin S. ROSSO-in-praxi: a self-monitoring of blood glucose-structured 12-week lifestyle intervention significantly improves glucometabolic control of patients with type 2 diabetes mellitus. Diabetes Technol Ther 2010; 12:547–553.
- Wahowiak L; American Diabetes Association (ADA). Blood glucose meters 2014. www.diabetesforecast.org/2014/Jan/blood-glucose-meters-2014.html. Accessed April 10, 2016.
- International Organization for Standardization (ISO). ISO 15197:2013. In vitro diagnostic test systems—requirements for blood-glucose monitoring systems for self-testing in managing diabetes mellitus. www.iso.org/obp/ui/#iso:std:iso:15197:ed-2:v1:en. Accessed April 8, 2016.
- Ramljak S, Lock JP, Schipper C, et al. Hematocrit interference of blood glucose meters for patient self-measurement. J Diabetes Sci Technol 2013; 7:179–189.
Self-monitoring of blood glucose is a critical part of diabetes management, with many benefits. It promotes personal responsibility and provides opportunities for better control. It allows for detection of blood glucose extremes, thus helping to reduce blood glucose fluctuations. It also helps both the patient and the provider make informed decisions and can help reduce microvascular and macrovascular complications.
Studies have shown that hemoglobin A1c levels are lower if glucose is tested more frequently.1 Most people with type 1 diabetes and many with type 2 diabetes self-monitor their blood glucose levels.
This article discusses who should monitor their blood glucose and how often, types of meters and supplies available, advances in technology, and limitations of current blood glucose meters.
WHETHER AND HOW OFTEN TO MONITOR
In clinical practice, advice about whether patients should monitor their blood glucose levels and how often to do it depends on the type of diabetes therapy, the need to titrate the dose or change the regimen, and the patient’s preferences, dexterity, and visual acuity. The frequency of testing also often depends on financial considerations and insurance coverage.
In patients with type 1 diabetes and insulin-treated type 2 diabetes, the role of glucose self-monitoring is clear. The American Diabetes Association (ADA) recommends that patients receiving multiple insulin injections daily or on an insulin pump measure their blood glucose at least before meals and snacks, occasionally after meals, at bedtime, before exercise, when they suspect their blood glucose level is low, after treating low blood glucose until they are normoglycemic, and before critical tasks such as driving.2
The Diabetes Control and Complications Trial (DCCT)3 and the DCCT/Epidemiology of Diabetes Interventions and Complications (DCCT/EDIC) study4 showed that intensive insulin therapy effectively delays the onset and slows the progression of microvascular and macrovacscular disease. Self-monitoring of blood glucose is an integral part of intensive insulin therapy, allowing for dose adjustments based on immediate blood glucose readings, thereby reducing the risks of hyperglycemia and hypoglycemia.
For patients taking a single daily dose of basal insulin, fasting blood glucose values are often used to titrate the basal insulin dose.3
Patients with type 2 diabetes on oral hypoglycemic agents such as sulfonylureas and meglitinides are at risk of hypoglycemia. Although a review of the literature could find no studies to support recommendations for specific testing frequency for patients taking these medications, it stands to reason that the potential for hypoglycemia would indicate a clear need for regular self-monitoring. Checking the blood glucose once or twice daily, typically fasting, 2 hours after the largest meal or at bedtime, provides useful data points for the patient and the provider. As with patients on insulin, testing before driving also reduces the risk of a motor vehicle accident caused by hypoglycemia.
In any patient who is testing one or two times per day, staggering the testing time on different days can give valuable insight into glucose control at different times of day, including after meals and at night.
In patients on nonintensive regimens and at low risk of hypoglycemia, glucose self-monitoring may be less critical. Nonintensive regimens with a low risk of hypoglycemia include diet and exercise alone and diet and exercise with a medication that is not insulin or an insulin secretagogue. In these cases, self-monitoring is often not seen as clinically useful or cost-effective, and hemoglobin A1c is used as a marker.
Admittedly, few randomized controlled trials have been done in which patients were treated according to identical protocols except for glucose self-monitoring, but outcomes from the published studies support the use of structured self-monitoring of blood glucose for improvement in clinical outcomes and quality of life when self-monitoring is incorporated into a comprehensive management plan.5–9 By providing feedback, self-monitoring encourages patients to actively participate in controlling and treating their disease. It helps them to recognize the impact of blood glucose on their own self-management decisions in the areas of diet, exercise, stress management, and medications. Therefore, the ADA recommends that healthcare providers encourage their patients to perform self-monitoring even if on nonintensive regimens. For these patients, checking even two or three times per week can help them to learn about the factors that affect their blood glucose.2
BLOOD GLUCOSE TARGETS
The ADA2 recommends the following glycemic goals for most nonpregnant adults:
- Fasting and premeal—80–130 mg/dL
- 2-hour postprandial—less than 180 mg/dL
- Bedtime—100–150 mg/dL.
However, diabetes management should be individualized on the basis of age and other comorbidities. For example, geriatric patients who have frequent episodes of hypoglycemia are prone to more harm than benefit from intensifying therapy to achieve these targets. Consequently, they may be candidates for more relaxed goals to avoid episodes of dangerous hypoglycemia.
When discussing blood glucose targets, an important but often overlooked concern is how the patient perceives the results. Providers and patients alike often describe readings as “good” or “bad.” This interpretation can lead to feelings of disappointment and failure in the patient and frustration in the provider. Instead, high blood glucose readings should be viewed as a way to identify opportunities for change. Patients may be more willing to check and even log their blood glucose levels if they see this information as an instrument to be used in the collaborative relationship with their provider.
CHOOSING A BLOOD GLUCOSE METER
Barring any special needs of the patient, meters are often selected on the basis of the patients’ insurance coverage for self-monitoring supplies (test strips and lancets), because of the high cost of test strips when purchased out-of-pocket. Meters themselves are usually relatively inexpensive, since the manufacturers commonly give them away as free samples to providers, who pass them along to patients. They also can often be purchased using coupons at a significant discount.
Without insurance coverage, test strips can cost $0.83 to $1.76 per strip for the most popular brands of meters. For patients without insurance coverage for supplies, the lowest-cost test strips currently available are for the ReliOn Prime Blood Glucose Monitoring System (ie, meter) sold at Walmart. Although ReliOn meters are not given out as samples in providers’ offices, the manufacturer’s suggested retail price is $16.24. More importantly, the suggested retail price for ReliOn Prime test strips is $9.00 for a bottle of 50 strips, or $0.18 per strip.10
For patients with special needs
For patients with special needs, there are meters that can make self-monitoring more convenient. For a patient who has problems with dexterity, grasping small test strips may be difficult. Two options are:
- Accu-Chek Compact Plus, which uses a 17-strip drum loaded into the meter
- Bayer Breeze2, which uses a 10-strip disk.
Both of the above dispense one strip at a time and eliminate the need to handle individual test strips.
Patients with poor visual acuity also face challenges with self-monitoring. Meters with options such as a backlight, a color screen, or a large display can help. Other meters talk, allowing patients to hear settings and blood glucose results. Examples are:
- Prodigy Autocode
- Prodigy Voice
- Embrace.
Other meter options depend on patient preference. Features that can affect patient choice include the ability to flag readings (eg, premeal, postmeal, exercise) and transfer data to other devices, blood sample size, meter size, touchscreen, meter memory and storage, rechargeable vs replaceable batteries, and the time it takes the meter to display the glucose reading.
Meters with advanced functions
For patients who want or need more advanced options, meters are now offering more feedback.
The OneTouch Verio family of meters helps patients spot patterns in their blood glucose levels. In addition, the Verio Flex and Verio Sync meters can sync with the OneTouch Reveal mobile app, which provides reports for the patient to view and send to the healthcare provider.
The Accu-Chek Aviva Expert has a bolus calculation function. Settings such as carbohydrate ratios, insulin sensitivity, targets, and active insulin can be programmed into the meter, which uses this information to give the patient dosing suggestions for rapid-acting insulin when carbohydrate intake is entered or blood glucose levels are checked. Another Accu-Chek meter, the Aviva Connect, can wirelessly transmit blood glucose results to the Accu-Chek Connect mobile app.
For a complete and regularly updated list of meters and their features, we encourage patients and healthcare providers to refer to the ADA’s Diabetes Forecast magazine. The magazine publishes a consumer guide every January that includes a comprehensive list of blood glucose meters. Past issues of the guide are available at www.diabetesforecast.org/past-issues-archive.html.
METER ACCURACY
Even though patients and providers use glucose self-monitoring results to make important decisions about diabetes management, the meters have limitations in accuracy. Accuracy comparisons from third-party sources are rare due to the cost of accuracy testing. However, the US Food and Drug Administration (FDA) requires all home glucose meters to meet accuracy standards set by the International Organization for Standardization (ISO). Currently, the FDA uses ISO standard 15197:2003, but ISO has published a revision, ISO standard 15197:2013, with stricter guidelines that have yet to be adopted by the FDA.10,11 Current and future guidelines are shown in Table 1.10
In addition to variations in accuracy that are deemed acceptable by the FDA, there are other more controllable factors that can further affect the accuracy of glucose meter results. Expired test strips, unwashed hands, poor sampling technique, storage of test strips in extreme temperatures or humidity, and a low hematocrit level all can cause inaccurate readings.
If the patient has a low hematocrit, consider recommending a meter proven to have stable performance in the setting of low hematocrit. These meters are highlighted in a 2013 study by Ramljak et al.12
LANCETS, LANCING DEVICES, AND TECHNIQUES
Along with a variety of meters, patients also have an array of lancets and lancing devices from which to choose. Many patients use the brand of lancet device and lancets that come in their meter starter kit, but they can use other brands if desired. For cost-conscious patients, lancets are significantly more affordable than test strips, even for those without insurance coverage. Prices can be as low as $0.03 per lancet for some store-brand 33-gauge lancets. Name-brand lancets are more expensive than store-brand, but at $0.06 to $0.16 per lancet, many patients will even find these to be affordable if they must pay out of pocket.
Special needs may also prompt patients to choose a different lancet device than the one that came with their meter. For patients who have poor dexterity or are afraid to look at needles, the Accu-Chek FastClix lancing device uses drums with six preloaded lancets, eliminating the need to see and handle individual lancets. The FastClix device is included in the starter kits for the Accu-Chek Nano and Accu-Chek Connect meters and can also be ordered separately at pharmacies.
Reducing pain when testing
A common complaint about glucose self-monitoring is that it hurts. Below are some tips for reducing pain when testing:
- Use a new lancet for each blood glucose check.
- Choose a lancet device with a depth gauge and select the lowest setting that allows for a sufficient sample size.
- Lancets come in a variety of sizes, typically from 28 gauge to 33 gauge, so choose a lancet with a smaller gauge (ie, a higher gauge number).
- Poke the side of the fingertip instead of the end or the middle.
- Alternate the fingers instead of repeatedly using the same finger.
- To minimize pain from forceful squeezing of the fingertip to get a sufficient blood sample, start squeezing the palm and push the blood progressively into the fingertip.
- Consider alternate-site testing, especially if you have painful upper-extremity neuropathy.
LOGGING BLOOD GLUCOSE READINGS
Although many meters can automatically transfer their data to mobile devices or computers, patients are still encouraged to log their glucose readings manually. Not only does this give feedback to the provider in the event that the downloading software is not available in that provider’s office, it also allows patients to learn how to identify patterns in their readings and make changes in their diabetes self-management.
In the past, all logging was done on paper forms or in log books, but today’s technology offers other options. Several meters offer downloading software for home use that displays the data in a usable format. Some smartphone apps allow patients to enter glucose readings and other useful diabetes information such as food intake and exercise. Below are examples of smartphone apps that can help patients track glucose levels and much more:
- mySugr (iPhone and Android)
- Glucose Buddy (iPhone and Android)
- OnTrack Diabetes (Android)
- Glucool Diabetes (Android) (also available in a premium version).
- Glooko (iPhone and Android). This app requires purchase of a compatible cable to connect the patient’s phone to the meter, which then allows readings to be transferred directly to the app.
THE ROLE OF THE CERTIFIED DIABETES EDUCATOR
One of the most useful resources available to providers is the assistance of a certified diabetes educator, who can teach a patient the basic operation of a blood glucose meter and educate the patient on all topics discussed in this article and more.
Certified diabetes educators are instrumental in helping patients understand blood glucose targets, the rationale for glucose self-monitoring, logging, pattern management, special features in meters, control testing, and alternate-site testing, and using the results of testing to make meaningful changes in how they self-manage their diabetes. Education should include discussions about topics such as meal planning, exercise, and medications to help patients fully grasp the impact of their daily decisions on their blood glucose control.
- Polonsky WH, Fisher L, Schikman CH, et al. Structured self-monitoring of blood glucose significantly reduces A1C levels in poorly controlled, noninsulin-treated type 2 diabetes: results from the Structured Testing Program study. Diabetes Care 2011; 34:262–267.
- American Diabetes Association (ADA). Standards of medical care in diabetes—2016. Glycemic targets. Diabetes Care 2016; 39(suppl):S39–S46.
- The Diabetes Control and Complications Trial Research Group. The effect of intensive treatment of diabetes on the development and progression of long-term complications in insulin-dependent diabetes mellitus. N Engl J Med 1993; 329:977–986.
- Nathan DM, Cleary PA, Backlund JY, et al; Diabetes Control and Complications Trial/Epidemiology of Diabetes Interventions and Complications (DCCT/EDIC) Study Research Group. Intensive diabetes treatment and cardiovascular disease in patients with type 1 diabetes. N Engl J Med 2005; 353:2643–2653.
- International Diabetes Federation (IDF). IDF guideline on self-monitoring of blood glucose in non-insulin treated type 2 diabetes. www.idf.org/guidelines/self-monitoring. Accessed April 8, 2016.
- Bosi E, Scavini M, Ceriello A, et al; PRISMA Study Group. Intensive structured self-monitoring of blood glucose and glycemic control in noninsulin-treated type 2 diabetes: the PRISMA randomized trial. Diabetes Care 2013; 36:2887–2894.
- Franciosi M, Lucisano G, Pellegrini F, et al; ROSES Study Group. ROSES: role of self-monitoring of blood glucose and intensive education in patients with type 2 diabetes not receiving insulin. A pilot randomized clinical trial. Diabet Med 2011; 28:789–796.
- Durán A, Martín P, Runkle I, et al. Benefits of self-monitoring blood glucose in the management of new-onset type 2 diabetes mellitus: the St Carlos Study, a prospective randomized clinic-based interventional study with parallel groups. J Diabetes 2010; 2:203–211.
- Kempf K, Kruse J, Martin S. ROSSO-in-praxi: a self-monitoring of blood glucose-structured 12-week lifestyle intervention significantly improves glucometabolic control of patients with type 2 diabetes mellitus. Diabetes Technol Ther 2010; 12:547–553.
- Wahowiak L; American Diabetes Association (ADA). Blood glucose meters 2014. www.diabetesforecast.org/2014/Jan/blood-glucose-meters-2014.html. Accessed April 10, 2016.
- International Organization for Standardization (ISO). ISO 15197:2013. In vitro diagnostic test systems—requirements for blood-glucose monitoring systems for self-testing in managing diabetes mellitus. www.iso.org/obp/ui/#iso:std:iso:15197:ed-2:v1:en. Accessed April 8, 2016.
- Ramljak S, Lock JP, Schipper C, et al. Hematocrit interference of blood glucose meters for patient self-measurement. J Diabetes Sci Technol 2013; 7:179–189.
KEY POINTS
- Glucose self-monitoring not only yields valuable information on which to base diabetes treatment, it also helps motivate patients and keep them engaged in and adherent to their care.
- The cost of test strips varies widely and can be a burden for some patients.
- Meters come with many different features, which patients may or may not need.
- One of the most useful resources at the disposal of providers is the assistance of a certified diabetes educator.
Infections kill many waiting for liver transplant, force others off list
AMSTERDAM – Infection is a major cause of death among patients waiting for a liver transplant, killing more than half of those who contracted one.
Infection also was the biggest reason that patients with end-stage liver disease withdrew from the transplant waiting list, a 9-year-long study has shown. Patients who developed an infection were six times more likely to withdraw than were those who did not, Dr. Loes Alferink wrote in a poster presented at the European Society of Clinical Microbiology and Infectious Diseases annual congress.
“We need to focus on better prophylactic antibiotic strategies to save lives in patients with end-stage liver disease who are on the waiting list,” said Dr. Alferink of Erasmus Medical Center, Rotterdam, the Netherlands.
She and her colleagues examined the effect of infections on 312 patients who were waiting for a transplant at Erasmus Medical Center from the period of 2006-2013. During that time, a total of 317 infections developed in 144 patients. The infections were fatal in 58% of these patients.
These included spontaneous primary cholangitis (75); spontaneous bacterial peritonitis (61); urogenital (38), respiratory (30), and skin (25) infections; as well as primary bacteremia (22). Also, there were 18 cases of gastroenteritis and 12 cases of Candida esophagitis. The remainder were unspecified infections.
The death rate was highest in primary bacteremia, which killed about 40% of those who developed it. The rate was about 25% in respiratory infections, 20% in spontaneous primary bacteremia, 15% in esophagitis, 10% in gastroenteritis and urinary tract infections, and 10% in patients with multiple site infections.
The pathogens were gram negative (70) and gram positive (37) bacteria; Enterococcus faecium (15) and faecalis (3); yeasts (13); viruses (7); and mold (2). The remainder of the infections yielded a negative culture.
In 24 patients, multiple pathogens were identified. These patients had the highest rate of mortality, with almost half of them dying from their infection; one of the two patients with a mold infection also died. The death rate was 20% in patients with yeast infections, 18% in those with E. faecium, 15% in gram-positive infections, and 10% in gram-negative infections.
A multivariate analysis found several factors that increased the risk of dying from an infection. For every 10 years of increasing age, the risk of infection-related mortality doubled (odds ratio, 2); worse MELD (Model for End-Stage Liver Disease) scores increased the risk by 12%.
Patients with hepatic encephalopathy were 76% more likely to die from an infection, and those with refractory ascites faced a 2.5-fold increased risk. Mechanical ventilation was associated with more than a fivefold increased risk (OR, 5.72).
Patients who developed an infection were almost six times more likely to be withdrawn from the transplant waiting list (hazard ratio, 5.87). The regression analysis for withdrawal identified several factors that significantly increased the risk, including age, MELD score, and serum albumin. The biggest risk factor for withdrawal related to infection was refractory ascites, which more than doubled the risk (HR, 2.2).
Dr. Alferink had no financial disclosures.
On Twitter @Alz_Gal
AT ECCMID 2016
Key clinical point: Infections are a major cause of transplant wait-list withdrawal and death in patients with end-stage liver disease.
Major finding: Infections increased the risk of withdrawal by sixfold, and killed 58% of those who developed one.
Data source: A retrospective study of 144 patients who developed a total of 317 infections.
Disclosures: Dr. Alferink had no financial disclosures.
Hospital intervention slashes heparin-induced thrombocytopenia
A simple, hospital-wide “avoid heparin” intervention dramatically cut the rate of suspected heparin-induced thrombocytopenia by 42%, that of positive ELISA screens for HIT by 63%, that of adjudicated HIT by 79%, and that of HIT with thrombosis by 91%, while also reducing the costs of HIT-related care by 83% at one large university hospital.
The medical literature has focused on early recognition and treatment of heparin-induced thrombocytopenia, “but its prevention has been largely overlooked,” noted Dr. Kelly E. McGowan of Sunnybrook Health Sciences Centre and the University of Toronto and her associates.
Sunnybrook introduced an “avoid heparin” program in 2006 in which most intravenous and subcutaneous unfractionated heparin was replaced with low-molecular-weight heparin (LMWH) in prophylactic or therapeutic doses; heparinized saline in arterial and central venous lines was replaced with saline flushes; order sets were modified to exclude unfractionated heparin options; and unfractionated heparin stores were removed from most nursing units.
Unfractionated heparin remained available for use in hemodialysis, cardiovascular surgery, and certain cases of acute coronary syndrome. Most hospital clinicians were unaware that LMWH was being substituted for unfractionated heparin, and none were aware that the effects of this change were being studied.
The investigators assessed all 1,118 cases of suspected heparin-induced thrombocytopenia that occurred during a 10-year period before and after this intervention was implemented. The use of LMWH rose fourfold after the program was initiated, but the annual rate of HIT associated with LMWH remained constant at 0.9 cases per 10,000 admissions over the course of the study.
The annual incidence of suspected HIT decreased from 85.5 per 10,000 admissions per year before the intervention to 49.0 afterward (relative risk reduction, 41.7%). The rate of positive ELISA screens for the disorder dropped from 16.5 to 6.1 per 10,000 (RRR, 62.9%), the rate of adjudicated HIT decreased from 10.7 to 2.2 per 10,000, and the rate of HIT with thrombosis declined from 4.6 to 0.4 per 10,000.
The program’s greatest impact was on cardiac surgery, but the burden of HIT also markedly decreased in other surgical and medical patients. HIT decreased by 77% in cardiovascular surgeries, 77% in other surgeries, 75% in cardiology patients, and 62% in medical patients, Dr. McGowan and her associates said (Blood 2016 Apr 21;127[16]:1954-9).
Patients with HIT during the preintervention years more often developed thrombosis (43%), usually venous thromboembolism, compared with those who had HIT in the postintervention years (19%), and median length of stay declined accordingly. The average estimated costs of HIT care per year dropped by about $267,000 dollars per year, from $322,000 before the program was implemented to $55,000 afterward.
The investigators added that this is the first study ever to show the success of an HIT prevention strategy. Their findings indicate that a hospital-wide “avoid heparin” program can substantially reduce morbidity, mortality, and costs associated with HIT. “The heparin avoidance strategy that we used was not complex or costly and would be feasible in other centers,” they noted.
This study is the first to show the substantial impact of large-scale removal of heparin from clinical practice in the real world. But implementing such a program at a system-wide level wouldn’t be simple.
The cost of a unit of low-molecular-weight heparin is six- to eightfold higher than that of unfractionated heparin. Hospitals may need to be convinced that unfractionated heparin is not the bargain it appears to be once the costs of heparin-induced thrombocytopenia are factored in.
In addition, unfractionated heparin remains the best option for patients undergoing cardiovascular surgery, those with renal failure, and those at high risk for bleeding that requires a rapid reversal agent.
Lori-Ann Linkins, M.D., of McMaster University, Hamilton (Ont.), made these remarks in a commentary accompanying Dr. McGowan’s report (Blood 2016 Apr 21;127[16]:1945-6). She reported receiving lecture honoraria from Pfizer and research funding from Bayer.
A simple, hospital-wide “avoid heparin” intervention dramatically cut the rate of suspected heparin-induced thrombocytopenia by 42%, that of positive ELISA screens for HIT by 63%, that of adjudicated HIT by 79%, and that of HIT with thrombosis by 91%, while also reducing the costs of HIT-related care by 83% at one large university hospital.
The medical literature has focused on early recognition and treatment of heparin-induced thrombocytopenia, “but its prevention has been largely overlooked,” noted Dr. Kelly E. McGowan of Sunnybrook Health Sciences Centre and the University of Toronto and her associates.
Sunnybrook introduced an “avoid heparin” program in 2006 in which most intravenous and subcutaneous unfractionated heparin was replaced with low-molecular-weight heparin (LMWH) in prophylactic or therapeutic doses; heparinized saline in arterial and central venous lines was replaced with saline flushes; order sets were modified to exclude unfractionated heparin options; and unfractionated heparin stores were removed from most nursing units.
Unfractionated heparin remained available for use in hemodialysis, cardiovascular surgery, and certain cases of acute coronary syndrome. Most hospital clinicians were unaware that LMWH was being substituted for unfractionated heparin, and none were aware that the effects of this change were being studied.
The investigators assessed all 1,118 cases of suspected heparin-induced thrombocytopenia that occurred during a 10-year period before and after this intervention was implemented. The use of LMWH rose fourfold after the program was initiated, but the annual rate of HIT associated with LMWH remained constant at 0.9 cases per 10,000 admissions over the course of the study.
The annual incidence of suspected HIT decreased from 85.5 per 10,000 admissions per year before the intervention to 49.0 afterward (relative risk reduction, 41.7%). The rate of positive ELISA screens for the disorder dropped from 16.5 to 6.1 per 10,000 (RRR, 62.9%), the rate of adjudicated HIT decreased from 10.7 to 2.2 per 10,000, and the rate of HIT with thrombosis declined from 4.6 to 0.4 per 10,000.
The program’s greatest impact was on cardiac surgery, but the burden of HIT also markedly decreased in other surgical and medical patients. HIT decreased by 77% in cardiovascular surgeries, 77% in other surgeries, 75% in cardiology patients, and 62% in medical patients, Dr. McGowan and her associates said (Blood 2016 Apr 21;127[16]:1954-9).
Patients with HIT during the preintervention years more often developed thrombosis (43%), usually venous thromboembolism, compared with those who had HIT in the postintervention years (19%), and median length of stay declined accordingly. The average estimated costs of HIT care per year dropped by about $267,000 dollars per year, from $322,000 before the program was implemented to $55,000 afterward.
The investigators added that this is the first study ever to show the success of an HIT prevention strategy. Their findings indicate that a hospital-wide “avoid heparin” program can substantially reduce morbidity, mortality, and costs associated with HIT. “The heparin avoidance strategy that we used was not complex or costly and would be feasible in other centers,” they noted.
FROM BLOOD
Key clinical point: A simple, hospital-wide “avoid heparin” intervention dramatically cut the burden of heparin-induced thrombocytopenia at one hospital.
Major finding: The annual incidence of suspected HIT decreased from 85.5 per 10,000 admissions per year before the intervention to 49.0 afterward (relative risk reduction, 41.7%).
Data source: A retrospective comparison of 1,118 heparin-induced disorders at a large university hospital before and after the implementation of a preventive intervention.
Disclosures: No sponsors/supporters were identified for this study. Dr. McGowan reported having no relevant financial disclosures; her associates reported ties to numerous industry sources.
Many ‘nonurgent’ ED cases actually are urgent
Many emergency department cases deemed “nonurgent” by triage personnel actually are indistinguishable from those deemed “urgent,” according to a Research Letter to the Editor published in JAMA Internal Medicine.
To examine whether a triage determination of nonurgent status really rules out the possibility of serious pathology, researchers analyzed data from the National Hospital Ambulatory Medical Care Survey, a representative annual probability sample survey of ED visits categorized by level of urgency. They focused on 59,293 ED visits by patients aged 18-64 years during a 3-year period, which were representative of 240 million ED visits across the country. An estimated total of 218.5 million of these visits (92.5%) were categorized as urgent and 17.8 million (7.5%) as nonurgent by triage personnel, said Dr. Renee Y. Hsia of the department of emergency medicine and the Philip R. Lee Institute for Health Policy Studies, University of California San Francisco, and her associates.
Patients required diagnostic services such as blood tests, electrocardiograms, or imaging in 8.45 million “nonurgent” visits (48%), and patients required procedures such as intravenous fluids, casting, or splinting in 5.76 million “nonurgent” visits (32%). More than 775,000 “nonurgent” visits (4%) resulted in hospital admission, including 126,000 admissions to critical care units. And in 1.19 million “nonurgent” visits (7%), patients arrived by ambulance.
In addition, half of the top 10 diagnoses from “nonurgent” visits were identical to those from urgent visits, the investigators said (JAMA Int Med. 2016 April 18. doi: 10.1001/jamainternmed.2016.0878).
“Certainly, not all of these data necessarily indicate that these services were required, and they could signal overuse or a lack of availability of primary care physicians. However, to some degree, our findings indicate that either patients or health care professionals do entertain a degree of uncertainty that requires further evaluation before diagnosis,” Dr. Hsia and her associates said.
Triage was never intended to completely rule out the possibility of severe illness in patients considered nonurgent, but was meant to predict the amount of time a patient could safely wait to be seen in the ED. However, over time, “the term ‘nonurgent’ has been often politicized to mean ‘inappropriate,’ ” they noted.
“Our findings highlight the lack of certainty of nonurgent status even when it is determined prospectively by a provider at triage, and suggest that caution must be taken when using triage scores beyond their intended purpose,” the investigators said.
FROM JAMA INTERNAL MEDICINE
Key clinical point: Many emergency department cases deemed “nonurgent” by triage personnel actually are indistinguishable from those deemed “urgent.”
Major finding: Patients required diagnostic services such as blood tests, ECGs, or imaging in 8.45 million “nonurgent” ED visits (48%), and procedures such as intravenous fluids, casting, or splinting in 5.76 million (32%).
Data source: An analysis of 59,293 adult ED visits representing 240 million such visits across the United States during a 3-year period.
Disclosures: No sponsor was identified for this study. Dr. Hsia and her associates reported having no relevant financial disclosures.
Risk of arthritis in children with Down syndrome higher than previously reported
GLASGOW – Children with Down syndrome are at increased risk for arthritis that often goes unrecognized and leads to treatment delays and potential chronic disability.
Research presented at the British Society for Rheumatology annual conference highlighted how Down arthropathy is not only more prevalent than idiopathic juvenile arthritis (JIA), but also has distinct clinical and radiographic features.
“Our research to date has shown that there is a significant increased risk of arthritis in children with trisomy 21, and higher than that previously reported,” said Dr. Charlene Foley, a research fellow at Our Lady’s Children’s Hospital in Dublin.

“There is a significant delay in diagnosis, which may be a cause of the x-ray changes at diagnosis, or it may be in fact that Down arthropathy is more aggressive,” than other childhood forms of arthritis, she observed.
Dr. Foley noted that Down arthropathy was first reported in the medical literature about 30 years ago and crude estimates suggested a prevalence of around 8.7 cases per 1,000 children versus 1 per 1,000 for JIA. However, the research she presented put the crude point prevalence at 18-21 per 1,000 children.
Dr. Foley presented the findings of an observational study conducted in the Republic of Ireland in which children with trisomy 21 and their families were identified from a variety of sources and invited to participate. After completion of a screening questionnaire and an appointment local to the participants, children who were suspected of having arthritis were invited to attend a consultant appointment. They underwent a clinical management pathway developed for JIA because no specific pathway had been developed for the children at that time, with follow-up appointments held every 3-6 months depending on the child’s needs.
Over an 18-month period, 503 children with trisomy 21 and a mean age of 8 years were screened. They had a range of musculoskeletal anomalies, the most common of which were flat feet in almost all the children (91.1%), inflammatory arthritis in 7.1%, and scoliosis in 4.8%. Many other problems occurred, with an incidence of 1.5% or less for each.
A total of 22 new cases of Down arthropathy have been identified to date, in addition to 11 at the clinic who predated the start of the study. About 75% have come through the screening clinics and the rest through pediatricians’ referral.
“It is a challenging disease both in terms of diagnosis and management,” Dr. Foley said. Of all the identified children, 91% had poor language skills or nonverbal communication and 15% had autism spectrum disorder.
On average, the time to diagnosis of the arthropathy was 1.7 years versus 0.74 years for a control group of 33 children with JIA. This is likely an underestimation, however, as 42% of the children or parents in the Down arthropathy cohort were unable to give a date on which symptoms had started.
Dr. Foley reported that the majority of trisomy 21 children had presented with polyarticular arthritis, mostly involving the proximal interphalangeal joints of the hands (78.6% of cases), or the wrists (53.6% of cases). There was significant small joint involvement (88% vs. 43% of the JIA cohort), and higher restricted joint counts (4.5 vs. 2.0). There were also differences in erythrocyte sedimentation rate and C-reactive protein at diagnosis, with these being “barely raised” in children with Down arthropathy versus children with JIA, so unlikely to aid a diagnosis. Children were also found to be rheumatoid factor negative.
Two-thirds of Down arthropathy cases had x-ray changes at presentation versus 24% of the JIA group, of which 29% versus 9.5% were erosive.
Treatment is complicated by drug-related side effects, with many children unable to tolerate methotrexate, Dr. Foley said. In the Irish cohort, treatment with methotrexate led to nausea in 75%, compared with 7.1% of the JIA children. Although reports are limited, methotrexate intolerance has been shown in children with trisomy 21, so there could be a genetic or metabolic reason behind this. Dr. Foley noted that they manage this problem by starting methotrexate on the lowest possible doses (10 mg/m2) and co-administering the antiemetic ondansetron. They have a low threshold for switching to an anti-TNF drug if needed, and have also started giving biologic drugs to some newly diagnosed children.
“The take-home message is to think outside of the Down syndrome box and don’t just blame everything on Down syndrome,” Dr. Foley said. As it may be challenging to examine a child, she suggested looking at the hands first because they are the most likely to be affected.
“We feel that a musculoskeletal assessment should be part of the annual surveillance for all children with Down syndrome,” she concluded.
As for who should conduct such an assessment, Dr. Foley suggested that general pediatricians who are regularly seeing these children for other health checks should perform it. However, as one delegate observed, nonrheumatology professionals may need a little training and guidance, as musculoskeletal assessments can be difficult. Looking only at the hands, and potentially the feet, may be one solution.
The study has raised a number of questions and future research will be needed to further characterize the arthritis and to determine how best to diagnose and treat it, noted Dr. Foley, who indicated that she had no conflicts of interest.
GLASGOW – Children with Down syndrome are at increased risk for arthritis that often goes unrecognized and leads to treatment delays and potential chronic disability.
Research presented at the British Society for Rheumatology annual conference highlighted how Down arthropathy is not only more prevalent than idiopathic juvenile arthritis (JIA), but also has distinct clinical and radiographic features.
“Our research to date has shown that there is a significant increased risk of arthritis in children with trisomy 21, and higher than that previously reported,” said Dr. Charlene Foley, a research fellow at Our Lady’s Children’s Hospital in Dublin.
“There is a significant delay in diagnosis, which may be a cause of the x-ray changes at diagnosis, or it may be in fact that Down arthropathy is more aggressive,” than other childhood forms of arthritis, she observed.
Dr. Foley noted that Down arthropathy was first reported in the medical literature about 30 years ago and crude estimates suggested a prevalence of around 8.7 cases per 1,000 children versus 1 per 1,000 for JIA. However, the research she presented put the crude point prevalence at 18-21 per 1,000 children.
Dr. Foley presented the findings of an observational study conducted in the Republic of Ireland in which children with trisomy 21 and their families were identified from a variety of sources and invited to participate. After completion of a screening questionnaire and an appointment local to the participants, children who were suspected of having arthritis were invited to attend a consultant appointment. They underwent a clinical management pathway developed for JIA because no specific pathway had been developed for the children at that time, with follow-up appointments held every 3-6 months depending on the child’s needs.
Over an 18-month period, 503 children with trisomy 21 and a mean age of 8 years were screened. They had a range of musculoskeletal anomalies, the most common of which were flat feet in almost all the children (91.1%), inflammatory arthritis in 7.1%, and scoliosis in 4.8%. Many other problems occurred, with an incidence of 1.5% or less for each.
A total of 22 new cases of Down arthropathy have been identified to date, in addition to 11 at the clinic who predated the start of the study. About 75% have come through the screening clinics and the rest through pediatricians’ referral.
“It is a challenging disease both in terms of diagnosis and management,” Dr. Foley said. Of all the identified children, 91% had poor language skills or nonverbal communication and 15% had autism spectrum disorder.
On average, the time to diagnosis of the arthropathy was 1.7 years versus 0.74 years for a control group of 33 children with JIA. This is likely an underestimation, however, as 42% of the children or parents in the Down arthropathy cohort were unable to give a date on which symptoms had started.
Dr. Foley reported that the majority of trisomy 21 children had presented with polyarticular arthritis, mostly involving the proximal interphalangeal joints of the hands (78.6% of cases), or the wrists (53.6% of cases). There was significant small joint involvement (88% vs. 43% of the JIA cohort), and higher restricted joint counts (4.5 vs. 2.0). There were also differences in erythrocyte sedimentation rate and C-reactive protein at diagnosis, with these being “barely raised” in children with Down arthropathy versus children with JIA, so unlikely to aid a diagnosis. Children were also found to be rheumatoid factor negative.
Two-thirds of Down arthropathy cases had x-ray changes at presentation versus 24% of the JIA group, of which 29% versus 9.5% were erosive.
Treatment is complicated by drug-related side effects, with many children unable to tolerate methotrexate, Dr. Foley said. In the Irish cohort, treatment with methotrexate led to nausea in 75%, compared with 7.1% of the JIA children. Although reports are limited, methotrexate intolerance has been shown in children with trisomy 21, so there could be a genetic or metabolic reason behind this. Dr. Foley noted that they manage this problem by starting methotrexate on the lowest possible doses (10 mg/m2) and co-administering the antiemetic ondansetron. They have a low threshold for switching to an anti-TNF drug if needed, and have also started giving biologic drugs to some newly diagnosed children.
“The take-home message is to think outside of the Down syndrome box and don’t just blame everything on Down syndrome,” Dr. Foley said. As it may be challenging to examine a child, she suggested looking at the hands first because they are the most likely to be affected.
“We feel that a musculoskeletal assessment should be part of the annual surveillance for all children with Down syndrome,” she concluded.
As for who should conduct such an assessment, Dr. Foley suggested that general pediatricians who are regularly seeing these children for other health checks should perform it. However, as one delegate observed, nonrheumatology professionals may need a little training and guidance, as musculoskeletal assessments can be difficult. Looking only at the hands, and potentially the feet, may be one solution.
The study has raised a number of questions and future research will be needed to further characterize the arthritis and to determine how best to diagnose and treat it, noted Dr. Foley, who indicated that she had no conflicts of interest.
AT RHEUMATOLOGY 2016
Key clinical point:A musculoskeletal assessment should be part of the annual surveillance for all children with Down syndrome to look for arthritis.
Major finding: Arthritis in children with Down syndrome typically presents as polyarticular inflammation in the hands and wrists.
Data source: Observational study of 33 children with Down arthropathy and 33 with juvenile idiopathic arthritis living in Ireland.
Disclosures: Dr. Foley had no conflicts of interest.

Search is on for cases of aggressive, ruxolitinib-associated skin cancers
ORLANDO – The hematologic cancer drug ruxolitinib seems to be associated with cases of aggressive nonmelanoma skin cancer.
After treating a very aggressive squamous cell carcinoma in a 55-year-old man treated with ruxolitinib for polycythemia vera, and hearing firsthand of three other similar cases, Dr. Fiona Zwald is collecting additional data on the association. She intends to publish these cases in a monograph as a warning to dermatologists, hematologists, oncologists, and other physicians who manage patients with hematologic malignancies, she said at the annual meeting of the American College of Mohs Surgery.
The prescribing information for ruxolitinib (Jakafi, Incyte Pharmaceuticals; Jakavi, Novartis) was updated in 2014 to warn that patients taking the drug face an increased risk of nonmelanoma skin cancers. The label also recommends that physicians inspect the skin regularly and urge patients to be alert for and report any new or changing lesions.
Despite the warnings and recommendations, cases are occurring – and some are quite serious, said Dr. Zwald, a Mohs surgeon in Atlanta.
“People should know this is actually happening. If you have experience with this medication, please let us know so we can compile this report. We are trying to assess the number of skin cancers before and after initiating this medication,” she said.

Ruxolitinib is an inhibitor of Janus kinase with a special affinity for the JAK1 and JAK2 subtypes. Like other cytokine-signaling molecules, their function depends on cell context; it may inhibit cell growth in one setting, and, in another, stimulate it. Ruxolitinib was initially approved in 2011 for the treatment of intermediate- and high-risk myelofibrosis, including primary myelofibrosis, post–polycythemia vera myelofibrosis, and post–essential thrombocythemia myelofibrosis.
In 2014, indications for ruxolitinib were expanded to include treatment of patients with polycythemia vera who have had an inadequate response to or are intolerant of hydroxyurea.
Dr. Zwald’s patient had a 10-year history of polycythemia vera. He was initially well controlled on the standard hydroxyurea treatment. In the meantime, he began working as a caddy at a major U.S. golf club. He developed many facial squamous cell carcinomas that were treated with excision and radiation. A year before he presented to Dr. Zwald, he stopped responding to hydroxyurea and was placed on ruxolitinib.
The patient presented with a 4-cm ulcerated lesion over part of his right temple and to the right helical crus; the lesion had developed over 3 months. Dr. Zwald consulted with the patient’s medical oncologist; treatment with ruxolitinib continued, albeit at a reduced dosage in light of recent events.
She performed Mohs surgery on the patient. It was a challenging case, she said, not the least because adequate anesthesia could not be achieved with local anesthetic. Preoperative staging showed no nodal spread.
“He did, unfortunately demonstrate a large, indurated mass located over one branch of the superficial temporal artery. At the helical crus there was an area of bound-down, fixed tumor. Knowing that I would not be able to fully resect this, I passed him on to the operating room,” Dr. Zwald said. “This tumor was found to extend down to the parotid capsule, but margins were clear.” The surgical defect was successfully repaired with a split-thickness skin graft.
The tumor recurred about 3 months later, and the patient underwent another surgery.
“This time we could not get clear surgical margins, and the tumor was approaching the external auditory meatus. Surgery was abandoned due to fears of complications to that area,” she said.
She presented the case at tumor board, during which she and her colleagues discussed adjuvant radiation. They initially abandoned this idea because he had already had so much radiation to his face. After the second surgery, they decide to proceed with radiation. “The next conversation we have will be whether to add another adjuvant therapy to treatment.”
She sent out the case and requests for feedback to the International Transplant Skin Cancer Collaborative, an 800-member consortium of dermatologists and Mohs surgeons who take care of transplant patients. She received information on three additional cases of aggressive squamous cell carcinoma (SCC) associated with ruxolitinib treatment:
• A patient with myelodysplastic syndrome with aggressive scalp SCC with cutaneous metastases.
• A patient with undifferentiated pleomorphic sarcoma of the scalp, several cutaneous SCCs.
• A patient with a myelodysplastic syndrome with in-transit metastases and explosive cutaneous SCCs. The patient has had the ruxolitinib dose reduced and may be switched to capecitabine.
Dr. Zwald noted that her patient was at risk for aggressive skin cancers for reasons in addition to ruxolitinib treatment.
“He was already immunosuppressed from his malignancy. He was on hydroxyurea, a drug that’s a cumulative phototoxin, and he’s out in the sun playing golf every day, and then was put on ruxolitinib. But the question we face now is how to try and stop this medication so we can get better treatment for him which will, of course, be very difficult.”
To contribute to Dr. Zwald’s case series, please email her at Fiona.Zwald@gmail.com.
She had no relevant financial disclosures.
On Twitter @Alz_Gal
ORLANDO – The hematologic cancer drug ruxolitinib seems to be associated with cases of aggressive nonmelanoma skin cancer.
After treating a very aggressive squamous cell carcinoma in a 55-year-old man treated with ruxolitinib for polycythemia vera, and hearing firsthand of three other similar cases, Dr. Fiona Zwald is collecting additional data on the association. She intends to publish these cases in a monograph as a warning to dermatologists, hematologists, oncologists, and other physicians who manage patients with hematologic malignancies, she said at the annual meeting of the American College of Mohs Surgery.
The prescribing information for ruxolitinib (Jakafi, Incyte Pharmaceuticals; Jakavi, Novartis) was updated in 2014 to warn that patients taking the drug face an increased risk of nonmelanoma skin cancers. The label also recommends that physicians inspect the skin regularly and urge patients to be alert for and report any new or changing lesions.
Despite the warnings and recommendations, cases are occurring – and some are quite serious, said Dr. Zwald, a Mohs surgeon in Atlanta.
“People should know this is actually happening. If you have experience with this medication, please let us know so we can compile this report. We are trying to assess the number of skin cancers before and after initiating this medication,” she said.
Ruxolitinib is an inhibitor of Janus kinase with a special affinity for the JAK1 and JAK2 subtypes. Like other cytokine-signaling molecules, their function depends on cell context; it may inhibit cell growth in one setting, and, in another, stimulate it. Ruxolitinib was initially approved in 2011 for the treatment of intermediate- and high-risk myelofibrosis, including primary myelofibrosis, post–polycythemia vera myelofibrosis, and post–essential thrombocythemia myelofibrosis.
In 2014, indications for ruxolitinib were expanded to include treatment of patients with polycythemia vera who have had an inadequate response to or are intolerant of hydroxyurea.
Dr. Zwald’s patient had a 10-year history of polycythemia vera. He was initially well controlled on the standard hydroxyurea treatment. In the meantime, he began working as a caddy at a major U.S. golf club. He developed many facial squamous cell carcinomas that were treated with excision and radiation. A year before he presented to Dr. Zwald, he stopped responding to hydroxyurea and was placed on ruxolitinib.
The patient presented with a 4-cm ulcerated lesion over part of his right temple and to the right helical crus; the lesion had developed over 3 months. Dr. Zwald consulted with the patient’s medical oncologist; treatment with ruxolitinib continued, albeit at a reduced dosage in light of recent events.
She performed Mohs surgery on the patient. It was a challenging case, she said, not the least because adequate anesthesia could not be achieved with local anesthetic. Preoperative staging showed no nodal spread.
“He did, unfortunately demonstrate a large, indurated mass located over one branch of the superficial temporal artery. At the helical crus there was an area of bound-down, fixed tumor. Knowing that I would not be able to fully resect this, I passed him on to the operating room,” Dr. Zwald said. “This tumor was found to extend down to the parotid capsule, but margins were clear.” The surgical defect was successfully repaired with a split-thickness skin graft.
The tumor recurred about 3 months later, and the patient underwent another surgery.
“This time we could not get clear surgical margins, and the tumor was approaching the external auditory meatus. Surgery was abandoned due to fears of complications to that area,” she said.
She presented the case at tumor board, during which she and her colleagues discussed adjuvant radiation. They initially abandoned this idea because he had already had so much radiation to his face. After the second surgery, they decide to proceed with radiation. “The next conversation we have will be whether to add another adjuvant therapy to treatment.”
She sent out the case and requests for feedback to the International Transplant Skin Cancer Collaborative, an 800-member consortium of dermatologists and Mohs surgeons who take care of transplant patients. She received information on three additional cases of aggressive squamous cell carcinoma (SCC) associated with ruxolitinib treatment:
• A patient with myelodysplastic syndrome with aggressive scalp SCC with cutaneous metastases.
• A patient with undifferentiated pleomorphic sarcoma of the scalp, several cutaneous SCCs.
• A patient with a myelodysplastic syndrome with in-transit metastases and explosive cutaneous SCCs. The patient has had the ruxolitinib dose reduced and may be switched to capecitabine.
Dr. Zwald noted that her patient was at risk for aggressive skin cancers for reasons in addition to ruxolitinib treatment.
“He was already immunosuppressed from his malignancy. He was on hydroxyurea, a drug that’s a cumulative phototoxin, and he’s out in the sun playing golf every day, and then was put on ruxolitinib. But the question we face now is how to try and stop this medication so we can get better treatment for him which will, of course, be very difficult.”
To contribute to Dr. Zwald’s case series, please email her at Fiona.Zwald@gmail.com.
She had no relevant financial disclosures.
On Twitter @Alz_Gal
AT THE ACMS ANNUAL MEETING