User login
Changes in Hospital Glycemic Control
The prevalence of diabetes mellitus continues to increase, now affecting almost 26 million people in the United States alone.[1] Hospitalizations associated with diabetes also continue to rise,[2] and nearly 50% of the $174 billion annual costs related to diabetes care in the United States are for inpatient hospital stays.[3] In recent years, inpatient glucose control has received considerable attention, and consensus statements for glucose targets have been published.[4, 5, 6]
A number of developments support the rationale for tracking and reporting inpatient glucose control. For instance, there are clinical scenarios where treatment of hyperglycemia has been shown to lead to better patient outcomes.[6, 7, 8, 9] Second, several organizations have recognized the value of better inpatient glucose management and have developed educational resources to assist practitioners and their institutions toward achieving that goal.[10, 11, 12, 13, 14] Finally, pay‐for‐performance requirements are emerging that are relevant to inpatient diabetes management.[15, 16]
Reports on the status of inpatient glucose control in large samples of US hospitals are now becoming available, and their findings suggest differences on the basis of hospital size, hospital type, and geographic location.[17, 18] However, these reports represent cross‐sectional studies, and little is known about trends in hospital glucose control over time. To determine whether changes were occurring, we obtained inpatient point‐of‐care blood glucose (POC‐BG) data from 126 hospitals for January to December 2009 and compared these with glycemic control data collected from the same hospitals for January to December 2007,[19] separately analyzing measurements from the intensive care unit (ICU) and the non‐intensive care unit (non‐ICU).
METHODS
Data Collection
The methods we used for data collection have been described previously.[18, 19, 20] Hospitals in the study used standard bedside glucose meters downloaded to the Remote Automated Laboratory System‐Plus (RALS‐Plus) (Medical Automation Systems, Charlottesville, VA). We originally evaluated data for adult inpatients for the period from January to December 2007[19]; for this study, we extracted POC‐BG from the same hospitals for the period from January to December 2009. Data excluded measurements obtained in emergency departments. Patient‐specific data (age, sex, race, and diagnoses) were not provided by hospitals, but individual patients could be distinguished by a unique identifier and also by location (ICU vs non‐ICU).
Hospital Selection
The characteristics of the 126 hospitals have been published previously.[19] However, hospital characteristics for 2009 were reevaluated for this analysis using the same methods already described for 2007[19] to determine whether any changes had occurred. Briefly, hospital characteristics during 2009 were determined via a combination of accessing the hospital Web site, consulting the Hospital Blue Book (Billian's HealthDATA; Billian Publishing Inc., Atlanta, Georgia), and determining membership in the Council of Teaching Hospitals and Health Systems of the Association of American Medical Colleges. The characteristics of the hospitals were size (number of beds), type (academic, urban community, or rural), and geographic region (Northeast, Midwest, South, or West). Per the Hospital Blue Book, a rural hospital is a hospital that operates outside of a metropolitan statistical area, typically with fewer than 100 beds, whereas an urban hospital is located within a metropolitan statistical area, typically with more than 100 beds. Institutions provided written permission to remotely access their glucose data and combine it with other hospitals into a single database for analysis. Patient data were deidentified, and consent to retrospective analysis and reporting was waived. The analysis was considered exempt by the Mayo Clinic Institutional Review Board. Participating hospitals were guaranteed confidentiality regarding their data.
Statistical Analysis
ICU and non‐ICU glucose datasets were differentiated on the basis of the download location designated by the RALS‐Plus database. As previously described, patient‐day‐weighted mean POC‐BG values were calculated as means of daily POC‐BG averaged per patient across all days during the hospital stay.[18, 19] We determined the overall patient‐day‐weighted mean values, and also the proportion of patient‐day‐weighted mean values greater than 180, 200, 250, 300, 350, and 400 mg/dL.[18, 19] We also examined the data to determine if there were any changes in the proportion of patient hospital days when there was at least 1 value <70 mg/dL or <40 mg/dL.
Differences in patient‐day‐weighted mean POC‐BG values between the years 2007 and 2009 were assessed in a mixed‐effects model with the term of year as the fixed effect and hospital characteristics as the random effect. The glucose trends between years 2007 and 2009 were examined to identify any differentiation by hospital characteristics by conducting mixed‐effects models using the terms of year, hospital characteristics (hospital size by bed capacity, hospital type, or geographic region), and interaction between year as the fixed effects and hospital characteristics as the random effect. These analyses were performed separately for ICU patients and non‐ICU patients. Values were compared between data obtained in 2009 and that obtained previously in 2007 using the Pearson [2] test. The means within the same category of hospital characteristics were compared for the years 2007 and 2009.
RESULTS
Characteristics of Participating Hospitals
Fewer than half of the 126 hospitals had changes in characteristics from 2007 to 2009 (size and type [Table 1]). There were 71 hospitals whose characteristics did not change compared to when the previous analysis was performed. The rest (n = 55) had changes in their characteristics that resulted in a net redistribution in the number of beds in the <200 and 200 to 299 categories, and a change in the rural/urban categories. These changes slightly altered the distributions by hospital size and hospital type compared to those in the previous analysis (Table 1). The regional distribution of the 126 hospitals was 41 (32.5%) in the South, 37 (29.4%) in the Midwest, 28 (22.2%) in the West, and 20 (15.9%) in the Northeast.[19]
| Characteristic | 2007, No. (%) [N = 126] | 2009, No. (%) [N = 126] |
|---|---|---|
| Hospital size, no. of beds | ||
| <200 | 48 (38.1) | 45 (35.7) |
| 200299 | 25 (19.8) | 28 (22.2) |
| 300399 | 17 (13.5) | 17 (13.5) |
| 400 | 36 (28.6) | 36 (28.6) |
| Hospital type | ||
| Academic | 11 (8.7) | 11 (8.7) |
| Urban | 69 (54.8) | 79 (62.7) |
| Rural | 46 (36.5) | 36 (28.6) |
Changes in Glycemic Control
For 2007, we analyzed a total of 12,541,929 POC‐BG measurements for 1,010,705 patients, and for 2009, we analyzed a total of 10,659,418 measurements for 656,206 patients. For ICU patients, a mean of 4.6 POC‐BG measurements per day was obtained in 2009 compared to a mean of 4.7 POC‐BG measurements per day in 2007. For non‐ICU patients, the POC‐BG mean was 3.1 per day in 2009 vs 2.9 per day in 2007.
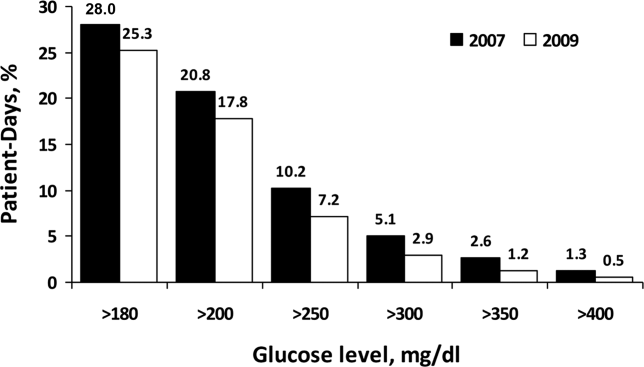
For non‐ICU data, the patient‐day‐weighted mean POC‐BG values decreased in 2009 by 5 mg/dL compared with the 2007 values (154 mg/dL vs 159 mg/dL, respectively; P < 0.001), and were clinically unchanged in the ICU data (167 mg/dL vs 166 mg/dL, respectively; P < 0.001). For non‐ICU data, the proportion of patient‐day‐weighted mean POC‐BG values in any hyperglycemia category decreased in 2009 compared with those in 2007 among all patients (all P < 0.001) (Figure 1). For the ICU data, there was no significant difference (all P > 0.20; not shown) from 2007 to 2009.

In the ICU data, 2.9% of patient days on average had at least 1 POC‐BG value <70 mg/dL in both 2007 and 2009 (P = 0.67). There were fewer patient days with values <40 mg/dL in 2009 (1.1%) compared to 2007 (1.4%) in the ICU (P < 0.001). In the non‐ICU data, the mean percentage of patient days with a value <70 mg/dL was higher in 2009 (5.1%) than in 2007 (4.7%) (P < 0.001); however, there were actually fewer patient days in 2009 on average with a value <40 mg/dL (0.84% vs 1.1% for 2009 vs 2007; P < 0.001).
Changes in Glycemic Control by Hospital Characteristics
Next, changes in glucose levels between the 2 analytic periods were evaluated according to hospital characteristics. Significant interactions were found between the year and each of the hospital characteristics both for the ICU group (Table 2) and for the non‐ICU group (Table 3) (all P < 0.001 for interaction terms). In the ICU data, changes were generally small but significant on the basis of hospital size, hospital type, and geographic region, and these changes were not necessarily in the same direction, because there were increases in patient‐day‐weighted mean glucose values in some categories, whereas there were decreases in others. For instance, hospitals with <200 inpatient beds experienced no significant change in ICU glycemic control, whereas those with 200 to 299 beds or >400 beds had an increase in patient‐day‐weighted mean values, and ones with 300 to 399 beds had a decrease. In regard to hospital type, only ICUs in academic medical institutions had a significant change over time in patient‐day‐weighted mean glucose levels, and these changes were toward higher values. ICUs in institutions in the Northeast and West had significantly higher glucose levels between the 2 periods, whereas those in the Midwest and South demonstrated lower glucose levels. In contrast to the different trends in ICU data by hospital characteristics, non‐ICU glucose control improved for hospitals of all sizes and types, and in all regions, over time.
| Characteristic | Year 2007, mg/dL | Year 2009, mg/dL | P Value |
|---|---|---|---|
| |||
| Overall | 166 (1) | 167 (1) | <0.001 |
| Hospital size, no. of beds | |||
| <200 | 175 (2) | 174 (2) | 0.19 |
| 200299 | 164 (2) | 165 (2) | 0.009 |
| 300399 | 166 (3) | 164 (3) | <0.002 |
| 400 | 157 (2) | 160 (2) | <0.001 |
| Hospital type | |||
| Academic | 150 (3) | 156 (4) | <0.001 |
| Rural | 172 (2) | 172 (2) | 0.94 |
| Urban | 166 (1) | 166 (1) | 0.61 |
| Region | |||
| Northeast | 165 (3) | 167 (3) | 0.003 |
| Midwest | 169 (2) | 168 (2) | 0.007 |
| South | 168 (2) | 167 (2) | <0.001 |
| West | 160 (2) | 165 (2) | <0.001 |
| Characteristic | Year 2007, mg/dL | Year 2009, mg/dL | P Value |
|---|---|---|---|
| |||
| Overall | 159 (1) | 154 (1) | <0.001 |
| Hospital size, no. of beds | |||
| <200 | 162 (2) | 158 (2) | <0.001 |
| 200299 | 156 (2) | 152 (2) | <0.001 |
| 300399 | 158 (3) | 151 (3) | <0.001 |
| 400 | 156 (2) | 151 (2) | < 0.001 |
| Hospital type | |||
| Academic | 162 (3) | 159 (3) | <0.001 |
| Rural | 161 (2) | 156 (2) | <0.001 |
| Urban | 157 (1) | 152 (1) | <0.001 |
| Region | |||
| Northeast | 162 (3) | 158 (3) | <0.001 |
| Midwest | 157 (2) | 149 (2) | <0.001 |
| South | 160 (2) | 157 (2) | <0.001 |
| West | 156 (2) | 151 (2) | <0.001 |
DISCUSSION
Optimal management of hospital hyperglycemia is now advocated by a number of professional societies and organizations.[10, 11, 12, 13] One of the next major tasks in the area of inpatient diabetes management will be how to identify and evaluate changes in glycemic control among US hospitals over time. Respondents to a recent survey of hospitals indicated that most institutions are now attempting to initiate quality improvement programs for the management of inpatients with diabetes.[21] These initiatives may translate into objective changes that could be monitored on a national level. However, few data exist on trends in glucose control in US hospitals. In our analysis, POC‐BG data from 126 hospitals collected in 2009 were compared to data obtained from the same hospitals in 2007. Our findings, and the methods of data collection and analysis described previously,[18, 19] demonstrate how such data can be used as a national benchmarking process for inpatient glucose control.
At all levels of hyperglycemia, significant decreases in patient‐day‐weighted mean values were found in non‐ICU data but not in ICU data. During the time these data were collected, recommendations about glucose targets in the critically ill were in a state of flux.[22, 23, 24, 25, 26, 27] Thus, the lack of hyperglycemia improvement in the ICU data between 2007 and 2009 may reflect the reluctance of providers to aggressively manage hyperglycemia because of recent reports linking increased mortality to tight glucose control.[25, 28, 29, 30] The differences in patient‐day‐weighted mean glucose values detected in the non‐ICU data between the 2 analytic periods were statistically significant, but were otherwise small and may not have clinical implications as far as an association with improved patient outcomes. Ongoing longitudinal analysis is required to establish whether these improvements in non‐ICU glucose control will persist over time.
Changes in glycemic control between the 2 periods were also noted when data were stratified according to hospital characteristics. Differences in glucose control in ICU data were not consistently better or worse, but varied by category of hospital characteristics (hospital size, hospital type, and geographic region). Other than academic hospitals and hospitals in the West, changes in the ICU data were small and likely do not have clinical importance. Analysis of non‐ICU data, however, showed consistent improvement within all 3 categories. Some hospital characteristics did change between the 2 study periods: there were fewer hospitals with <200 beds, more hospitals with 200 to 299 beds, a decrease in hospitals identified as rural, and an increase in hospitals designated as urban. Our previous analyses have indicated that hospital characteristics should be considered when examining national inpatient glucose data.[18, 19] In this analysis there was a statistically significant interaction between the year for which data were analyzed and each category of hospital characteristics. It is unclear how these evolving characteristics could have impacted inpatient glucose control. A change in hospital characteristics may in fact represent a change in resources to manage inpatient hyperglycemia. Future studies with nationally aggregated inpatient glucose data that assess longitudinal changes in glucose data may also have to account for variations in hospital characteristics over time in addition to the characteristics of the hospitals themselves.
Differences in hypoglycemia frequency, as calculated as the proportion of patient hospital days, were also detected. In the ICU data, the percentage of days with at least 1 value <70 mg/dL was similar between 2007 and 2009, but the proportion of days with at least 1 value <40 mg/dL was less in 2009, suggesting that institutions as a whole in this analysis may have been more focused on reducing the frequency of severe hypoglycemia. However, in the non‐ICU, there were more days in 2009 with a value <70 mg/dL, but fewer with a value <40 mg/dL. In noncritically ill patients, institutions likely continue to attempt to find the best balance between optimizing glycemic control while minimizing the risk of hypoglycemia. It should be pointed out, however, that overall, the frequency of hypoglycemia, particularly severe hypoglycemia, was quite low in this analysis, as it has been in our previous reports.[18, 19] An examination of hypoglycemia frequency by hospital characteristic to evaluate differences in this metric would be of interest in a future analysis.
The limitations of these data have been previously outlined,[18, 19] and they include the lack of patient‐level data such as demographics and the lack of information on diagnoses that allow adjustment of comparisons by the severity of illness. Moreover, without detailed treatment‐specific information (such as type of insulin protocol), one cannot establish the basis for longitudinal differences in glucose control. Volunteer‐dependent hospital involvement that creates selection bias may skew data toward those who are aware that they are witnessing a successful reduction in hyperglycemia. Finally, POC‐BG may not be the optimal method for assessing glycemic control. The limitations of current methods of evaluating inpatient glycemic control were recently reviewed.[31] Nonetheless, POC‐BG measurements remain the richest source of data on hospital hyperglycemia because of their widespread use and large sample size. A data warehouse of nearly 600 hospitals now exists,[18] which will permit future longitudinal analyses of glucose control in even larger samples.
Despite such limitations, our findings do represent the first analysis of trends in glucose control in a large cross‐section of US hospitals. Over 2 years, non‐ICU hyperglycemia improved among hospitals of all sizes and types and in all regions, whereas similar improvement did not occur in ICU hyperglycemia. Continued analysis will determine whether these trends continue. For those hospitals that are achieving better glucose control in non‐ICU patients, more information is needed on how they are accomplishing this so that protocols can be standardized and disseminated.
Acknowledgments
Disclosures: This project was supported entirely by The Epsilon Group Virginia, LLC, Charlottesville, Virginia, and a contractual arrangement is in place between the Mayo Clinic, Scottsdale, Arizona, and The Epsilon Group. The Mayo Clinic does not endorse the products mentioned in this article. The authors report no conflicts of interest.
- 2011 National Diabetes Fact Sheet.Diagnosed and undiagnosed diabetes in the United States, all ages, 2010.Atlanta, GA:Centers for Disease Control and Prevention;2011 [updated 2011]. Available at: http://www.cdc.gov/diabetes/pubs/estimates11.htm#2. Accessed November 23, 2012.
- Diabetes Data and Trends.Atlanta, GA:Centers for Disease Control and Prevention;2009 [updated 2009]. Available at: http://www.cdc.gov/diabetes/statistics/dmany/fig1.htm. Accessed November 23, 2012.
- American Diabetes Association. Economic costs of diabetes in the U.S. In 2007 [published correction appears in Diabetes Care. 2008;31(6):1271.]. Diabetes Care. 2008;31(3):596–615.
- , , , et al.;American College of Endocrinology Task Force on Inpatient Diabetes Metabolic Control. American College of Endocrinology position statement on inpatient diabetes and metabolic control. Endocr Pract. 2004;10(1):77–82.
- ACE/ADA Task Force on Inpatient Diabetes. American College of Endocrinology and American Diabetes Association consensus statement on inpatient diabetes and glycemic control. Endocr Pract. 2006;12(4):458–468.
- , , , et al.;American Association of Clinical Endocrinologists; American Diabetes Association. American Association of Clinical Endocrinologists and American Diabetes Association consensus statement on inpatient glycemic control. Diabetes Care. 2009;32(6):1119–1131.
- ;DIGAMI (Diabetes Mellitus, Insulin Glucose Infusion in Acute Myocardial Infarction) Study Group. Prospective randomised study of intensive insulin treatment on long term survival after acute myocardial infarction in patients with diabetes mellitus. BMJ. 1997;314(7093):1512–1515.
- , , , et al.;American Diabetes Association Diabetes in Hospitals Writing Committee. Management of diabetes and hyperglycemia in hospitals [published correction appears in Diabetes Care. 2004;27(5):1255; Diabetes Care. 2004;27(3):856]. Diabetes Care. 2004;27(2):553–591.
- , , , , . Inpatient management of diabetes and hyperglycemia among general medicine patients at a large teaching hospital. J Hosp Med. 2006;1(3):145–150.
- , , , , ;Society of Hospital Medicine Glycemic Control Task Force. Society of Hospital Medicine Glycemic Control Task Force summary: practical recommendations for assessing the impact of glycemic control efforts. J Hosp Med. 2008;3(5 suppl):66–75.
- , , , , , . Adherence to surgical care improvement project measures and the association with postoperative infections. JAMA. 2010;303(24):2479–2485.
- Glycemic Control Resource Room.Philadelphia, PA:Society of Hospital Medicine;2008. Available at: http://www.hospitalmedicine.org/ResourceRoomRedesign/GlycemicControl.cfm. Accessed November 23, 2012.
- Inpatient Glycemic Control Resource Center.Jacksonville, FL:American Association of Clinical Endocrinologists;2011. Available at: http://resources.aace.com. Accessed November 23, 2012.
- , , , et al.;Endocrine Society. Management of hyperglycemia in hospitalized patients in non‐critical care setting: an endocrine society clinical practice guideline. J Clin Endocrinol Metab. 2012;97(1):16–38.
- Hospital Quality Initiative.Baltimore, MD:Centers for Medicare and Medicaid Services;2012 [updated 2012]. Available at: http://www.cms.gov/HospitalQualityInits/08_HospitalRHQDAPU.asp. Accessed November 23, 2012.
- Hospital‐Acquired Conditions (Present on Admission Indicator).Baltimore, MD:Centers for Medicare and Medicaid Services;2012 [updated 2012]. Available at: http://www.cms.gov/hospitalacqcond/06_hospital‐acquired_conditions.asp. Accessed November 23, 2012.
- , , , et al. Evaluation of hospital glycemic control at US academic medical centers. J Hosp Med. 2009;4(1):35–44.
- , , , . Update on inpatient glycemic control in hospitals in the United States. Endocr Pract. 2011;17(6):853–861.
- , , , , , . Inpatient glucose control: a glycemic survey of 126 U.S. hospitals. J Hosp Med. 2009;4(9):E7–E14.
- , , , , . Inpatient point‐of‐care bedside glucose testing: preliminary data on use of connectivity informatics to measure hospital glycemic control. Diabetes Technol Ther. 2007;9(6):493–500.
- , , , , , . Diabetes and hyperglycemia quality improvement efforts in hospitals in the United States: current status, practice variation, and barriers to implementation. Endocr Pract. 2010;16(2):219–230.
- , , , et al. Intensive insulin therapy in critically ill patients. N Engl J Med. 2001;345(19):1359–1367.
- , , , et al. Intensive insulin therapy in the medical ICU. N Engl J Med. 2006;354(5):449–461.
- , , , et al.;German Competence Network Sepsis (SepNet). Intensive insulin therapy and pentastarch resuscitation in severe sepsis. N Engl J Med. 2008;358(2):125–139.
- , , , et al.;NICE‐SUGAR Study Investigators. Intensive versus conventional glucose control in critically ill patients. N Engl J Med. 2009;360(13):1283–1297.
- , , , et al. A prospective randomised multi‐centre controlled trial on tight glucose control by intensive insulin therapy in adult intensive care units: the Glucontrol study. Intensive Care Med. 2009;35(10):1738–1748.
- , , . Benefits and risks of tight glucose control in critically ill adults: a meta‐analysis [published correction appears in JAMA. 2009;301(9):936]. JAMA. 2008;300(8):933–944.
- , . Severe hypoglycemia in critically ill patients: risk factors and outcomes. Crit Care Med. 2007;35(10):2262–2267.
- , , , et al. Relationship between spontaneous and iatrogenic hypoglycemia and mortality in patients hospitalized with acute myocardial infarction. JAMA. 2009;301(15):1556–1564.
- , , , et al. Hypoglycemia and outcome in critically ill patients. Mayo Clin Proc. 2010;85(3):217–224.
- , , , . Assessing inpatient glycemic control: what are the next steps?J Diabetes Sci Technol. 2012;6(2):421–427.
The prevalence of diabetes mellitus continues to increase, now affecting almost 26 million people in the United States alone.[1] Hospitalizations associated with diabetes also continue to rise,[2] and nearly 50% of the $174 billion annual costs related to diabetes care in the United States are for inpatient hospital stays.[3] In recent years, inpatient glucose control has received considerable attention, and consensus statements for glucose targets have been published.[4, 5, 6]
A number of developments support the rationale for tracking and reporting inpatient glucose control. For instance, there are clinical scenarios where treatment of hyperglycemia has been shown to lead to better patient outcomes.[6, 7, 8, 9] Second, several organizations have recognized the value of better inpatient glucose management and have developed educational resources to assist practitioners and their institutions toward achieving that goal.[10, 11, 12, 13, 14] Finally, pay‐for‐performance requirements are emerging that are relevant to inpatient diabetes management.[15, 16]
Reports on the status of inpatient glucose control in large samples of US hospitals are now becoming available, and their findings suggest differences on the basis of hospital size, hospital type, and geographic location.[17, 18] However, these reports represent cross‐sectional studies, and little is known about trends in hospital glucose control over time. To determine whether changes were occurring, we obtained inpatient point‐of‐care blood glucose (POC‐BG) data from 126 hospitals for January to December 2009 and compared these with glycemic control data collected from the same hospitals for January to December 2007,[19] separately analyzing measurements from the intensive care unit (ICU) and the non‐intensive care unit (non‐ICU).
METHODS
Data Collection
The methods we used for data collection have been described previously.[18, 19, 20] Hospitals in the study used standard bedside glucose meters downloaded to the Remote Automated Laboratory System‐Plus (RALS‐Plus) (Medical Automation Systems, Charlottesville, VA). We originally evaluated data for adult inpatients for the period from January to December 2007[19]; for this study, we extracted POC‐BG from the same hospitals for the period from January to December 2009. Data excluded measurements obtained in emergency departments. Patient‐specific data (age, sex, race, and diagnoses) were not provided by hospitals, but individual patients could be distinguished by a unique identifier and also by location (ICU vs non‐ICU).
Hospital Selection
The characteristics of the 126 hospitals have been published previously.[19] However, hospital characteristics for 2009 were reevaluated for this analysis using the same methods already described for 2007[19] to determine whether any changes had occurred. Briefly, hospital characteristics during 2009 were determined via a combination of accessing the hospital Web site, consulting the Hospital Blue Book (Billian's HealthDATA; Billian Publishing Inc., Atlanta, Georgia), and determining membership in the Council of Teaching Hospitals and Health Systems of the Association of American Medical Colleges. The characteristics of the hospitals were size (number of beds), type (academic, urban community, or rural), and geographic region (Northeast, Midwest, South, or West). Per the Hospital Blue Book, a rural hospital is a hospital that operates outside of a metropolitan statistical area, typically with fewer than 100 beds, whereas an urban hospital is located within a metropolitan statistical area, typically with more than 100 beds. Institutions provided written permission to remotely access their glucose data and combine it with other hospitals into a single database for analysis. Patient data were deidentified, and consent to retrospective analysis and reporting was waived. The analysis was considered exempt by the Mayo Clinic Institutional Review Board. Participating hospitals were guaranteed confidentiality regarding their data.
Statistical Analysis
ICU and non‐ICU glucose datasets were differentiated on the basis of the download location designated by the RALS‐Plus database. As previously described, patient‐day‐weighted mean POC‐BG values were calculated as means of daily POC‐BG averaged per patient across all days during the hospital stay.[18, 19] We determined the overall patient‐day‐weighted mean values, and also the proportion of patient‐day‐weighted mean values greater than 180, 200, 250, 300, 350, and 400 mg/dL.[18, 19] We also examined the data to determine if there were any changes in the proportion of patient hospital days when there was at least 1 value <70 mg/dL or <40 mg/dL.
Differences in patient‐day‐weighted mean POC‐BG values between the years 2007 and 2009 were assessed in a mixed‐effects model with the term of year as the fixed effect and hospital characteristics as the random effect. The glucose trends between years 2007 and 2009 were examined to identify any differentiation by hospital characteristics by conducting mixed‐effects models using the terms of year, hospital characteristics (hospital size by bed capacity, hospital type, or geographic region), and interaction between year as the fixed effects and hospital characteristics as the random effect. These analyses were performed separately for ICU patients and non‐ICU patients. Values were compared between data obtained in 2009 and that obtained previously in 2007 using the Pearson [2] test. The means within the same category of hospital characteristics were compared for the years 2007 and 2009.
RESULTS
Characteristics of Participating Hospitals
Fewer than half of the 126 hospitals had changes in characteristics from 2007 to 2009 (size and type [Table 1]). There were 71 hospitals whose characteristics did not change compared to when the previous analysis was performed. The rest (n = 55) had changes in their characteristics that resulted in a net redistribution in the number of beds in the <200 and 200 to 299 categories, and a change in the rural/urban categories. These changes slightly altered the distributions by hospital size and hospital type compared to those in the previous analysis (Table 1). The regional distribution of the 126 hospitals was 41 (32.5%) in the South, 37 (29.4%) in the Midwest, 28 (22.2%) in the West, and 20 (15.9%) in the Northeast.[19]
| Characteristic | 2007, No. (%) [N = 126] | 2009, No. (%) [N = 126] |
|---|---|---|
| Hospital size, no. of beds | ||
| <200 | 48 (38.1) | 45 (35.7) |
| 200299 | 25 (19.8) | 28 (22.2) |
| 300399 | 17 (13.5) | 17 (13.5) |
| 400 | 36 (28.6) | 36 (28.6) |
| Hospital type | ||
| Academic | 11 (8.7) | 11 (8.7) |
| Urban | 69 (54.8) | 79 (62.7) |
| Rural | 46 (36.5) | 36 (28.6) |
Changes in Glycemic Control
For 2007, we analyzed a total of 12,541,929 POC‐BG measurements for 1,010,705 patients, and for 2009, we analyzed a total of 10,659,418 measurements for 656,206 patients. For ICU patients, a mean of 4.6 POC‐BG measurements per day was obtained in 2009 compared to a mean of 4.7 POC‐BG measurements per day in 2007. For non‐ICU patients, the POC‐BG mean was 3.1 per day in 2009 vs 2.9 per day in 2007.
For non‐ICU data, the patient‐day‐weighted mean POC‐BG values decreased in 2009 by 5 mg/dL compared with the 2007 values (154 mg/dL vs 159 mg/dL, respectively; P < 0.001), and were clinically unchanged in the ICU data (167 mg/dL vs 166 mg/dL, respectively; P < 0.001). For non‐ICU data, the proportion of patient‐day‐weighted mean POC‐BG values in any hyperglycemia category decreased in 2009 compared with those in 2007 among all patients (all P < 0.001) (Figure 1). For the ICU data, there was no significant difference (all P > 0.20; not shown) from 2007 to 2009.
In the ICU data, 2.9% of patient days on average had at least 1 POC‐BG value <70 mg/dL in both 2007 and 2009 (P = 0.67). There were fewer patient days with values <40 mg/dL in 2009 (1.1%) compared to 2007 (1.4%) in the ICU (P < 0.001). In the non‐ICU data, the mean percentage of patient days with a value <70 mg/dL was higher in 2009 (5.1%) than in 2007 (4.7%) (P < 0.001); however, there were actually fewer patient days in 2009 on average with a value <40 mg/dL (0.84% vs 1.1% for 2009 vs 2007; P < 0.001).
Changes in Glycemic Control by Hospital Characteristics
Next, changes in glucose levels between the 2 analytic periods were evaluated according to hospital characteristics. Significant interactions were found between the year and each of the hospital characteristics both for the ICU group (Table 2) and for the non‐ICU group (Table 3) (all P < 0.001 for interaction terms). In the ICU data, changes were generally small but significant on the basis of hospital size, hospital type, and geographic region, and these changes were not necessarily in the same direction, because there were increases in patient‐day‐weighted mean glucose values in some categories, whereas there were decreases in others. For instance, hospitals with <200 inpatient beds experienced no significant change in ICU glycemic control, whereas those with 200 to 299 beds or >400 beds had an increase in patient‐day‐weighted mean values, and ones with 300 to 399 beds had a decrease. In regard to hospital type, only ICUs in academic medical institutions had a significant change over time in patient‐day‐weighted mean glucose levels, and these changes were toward higher values. ICUs in institutions in the Northeast and West had significantly higher glucose levels between the 2 periods, whereas those in the Midwest and South demonstrated lower glucose levels. In contrast to the different trends in ICU data by hospital characteristics, non‐ICU glucose control improved for hospitals of all sizes and types, and in all regions, over time.
| Characteristic | Year 2007, mg/dL | Year 2009, mg/dL | P Value |
|---|---|---|---|
| |||
| Overall | 166 (1) | 167 (1) | <0.001 |
| Hospital size, no. of beds | |||
| <200 | 175 (2) | 174 (2) | 0.19 |
| 200299 | 164 (2) | 165 (2) | 0.009 |
| 300399 | 166 (3) | 164 (3) | <0.002 |
| 400 | 157 (2) | 160 (2) | <0.001 |
| Hospital type | |||
| Academic | 150 (3) | 156 (4) | <0.001 |
| Rural | 172 (2) | 172 (2) | 0.94 |
| Urban | 166 (1) | 166 (1) | 0.61 |
| Region | |||
| Northeast | 165 (3) | 167 (3) | 0.003 |
| Midwest | 169 (2) | 168 (2) | 0.007 |
| South | 168 (2) | 167 (2) | <0.001 |
| West | 160 (2) | 165 (2) | <0.001 |
| Characteristic | Year 2007, mg/dL | Year 2009, mg/dL | P Value |
|---|---|---|---|
| |||
| Overall | 159 (1) | 154 (1) | <0.001 |
| Hospital size, no. of beds | |||
| <200 | 162 (2) | 158 (2) | <0.001 |
| 200299 | 156 (2) | 152 (2) | <0.001 |
| 300399 | 158 (3) | 151 (3) | <0.001 |
| 400 | 156 (2) | 151 (2) | < 0.001 |
| Hospital type | |||
| Academic | 162 (3) | 159 (3) | <0.001 |
| Rural | 161 (2) | 156 (2) | <0.001 |
| Urban | 157 (1) | 152 (1) | <0.001 |
| Region | |||
| Northeast | 162 (3) | 158 (3) | <0.001 |
| Midwest | 157 (2) | 149 (2) | <0.001 |
| South | 160 (2) | 157 (2) | <0.001 |
| West | 156 (2) | 151 (2) | <0.001 |
DISCUSSION
Optimal management of hospital hyperglycemia is now advocated by a number of professional societies and organizations.[10, 11, 12, 13] One of the next major tasks in the area of inpatient diabetes management will be how to identify and evaluate changes in glycemic control among US hospitals over time. Respondents to a recent survey of hospitals indicated that most institutions are now attempting to initiate quality improvement programs for the management of inpatients with diabetes.[21] These initiatives may translate into objective changes that could be monitored on a national level. However, few data exist on trends in glucose control in US hospitals. In our analysis, POC‐BG data from 126 hospitals collected in 2009 were compared to data obtained from the same hospitals in 2007. Our findings, and the methods of data collection and analysis described previously,[18, 19] demonstrate how such data can be used as a national benchmarking process for inpatient glucose control.
At all levels of hyperglycemia, significant decreases in patient‐day‐weighted mean values were found in non‐ICU data but not in ICU data. During the time these data were collected, recommendations about glucose targets in the critically ill were in a state of flux.[22, 23, 24, 25, 26, 27] Thus, the lack of hyperglycemia improvement in the ICU data between 2007 and 2009 may reflect the reluctance of providers to aggressively manage hyperglycemia because of recent reports linking increased mortality to tight glucose control.[25, 28, 29, 30] The differences in patient‐day‐weighted mean glucose values detected in the non‐ICU data between the 2 analytic periods were statistically significant, but were otherwise small and may not have clinical implications as far as an association with improved patient outcomes. Ongoing longitudinal analysis is required to establish whether these improvements in non‐ICU glucose control will persist over time.
Changes in glycemic control between the 2 periods were also noted when data were stratified according to hospital characteristics. Differences in glucose control in ICU data were not consistently better or worse, but varied by category of hospital characteristics (hospital size, hospital type, and geographic region). Other than academic hospitals and hospitals in the West, changes in the ICU data were small and likely do not have clinical importance. Analysis of non‐ICU data, however, showed consistent improvement within all 3 categories. Some hospital characteristics did change between the 2 study periods: there were fewer hospitals with <200 beds, more hospitals with 200 to 299 beds, a decrease in hospitals identified as rural, and an increase in hospitals designated as urban. Our previous analyses have indicated that hospital characteristics should be considered when examining national inpatient glucose data.[18, 19] In this analysis there was a statistically significant interaction between the year for which data were analyzed and each category of hospital characteristics. It is unclear how these evolving characteristics could have impacted inpatient glucose control. A change in hospital characteristics may in fact represent a change in resources to manage inpatient hyperglycemia. Future studies with nationally aggregated inpatient glucose data that assess longitudinal changes in glucose data may also have to account for variations in hospital characteristics over time in addition to the characteristics of the hospitals themselves.
Differences in hypoglycemia frequency, as calculated as the proportion of patient hospital days, were also detected. In the ICU data, the percentage of days with at least 1 value <70 mg/dL was similar between 2007 and 2009, but the proportion of days with at least 1 value <40 mg/dL was less in 2009, suggesting that institutions as a whole in this analysis may have been more focused on reducing the frequency of severe hypoglycemia. However, in the non‐ICU, there were more days in 2009 with a value <70 mg/dL, but fewer with a value <40 mg/dL. In noncritically ill patients, institutions likely continue to attempt to find the best balance between optimizing glycemic control while minimizing the risk of hypoglycemia. It should be pointed out, however, that overall, the frequency of hypoglycemia, particularly severe hypoglycemia, was quite low in this analysis, as it has been in our previous reports.[18, 19] An examination of hypoglycemia frequency by hospital characteristic to evaluate differences in this metric would be of interest in a future analysis.
The limitations of these data have been previously outlined,[18, 19] and they include the lack of patient‐level data such as demographics and the lack of information on diagnoses that allow adjustment of comparisons by the severity of illness. Moreover, without detailed treatment‐specific information (such as type of insulin protocol), one cannot establish the basis for longitudinal differences in glucose control. Volunteer‐dependent hospital involvement that creates selection bias may skew data toward those who are aware that they are witnessing a successful reduction in hyperglycemia. Finally, POC‐BG may not be the optimal method for assessing glycemic control. The limitations of current methods of evaluating inpatient glycemic control were recently reviewed.[31] Nonetheless, POC‐BG measurements remain the richest source of data on hospital hyperglycemia because of their widespread use and large sample size. A data warehouse of nearly 600 hospitals now exists,[18] which will permit future longitudinal analyses of glucose control in even larger samples.
Despite such limitations, our findings do represent the first analysis of trends in glucose control in a large cross‐section of US hospitals. Over 2 years, non‐ICU hyperglycemia improved among hospitals of all sizes and types and in all regions, whereas similar improvement did not occur in ICU hyperglycemia. Continued analysis will determine whether these trends continue. For those hospitals that are achieving better glucose control in non‐ICU patients, more information is needed on how they are accomplishing this so that protocols can be standardized and disseminated.
Acknowledgments
Disclosures: This project was supported entirely by The Epsilon Group Virginia, LLC, Charlottesville, Virginia, and a contractual arrangement is in place between the Mayo Clinic, Scottsdale, Arizona, and The Epsilon Group. The Mayo Clinic does not endorse the products mentioned in this article. The authors report no conflicts of interest.
- 2011 National Diabetes Fact Sheet.Diagnosed and undiagnosed diabetes in the United States, all ages, 2010.Atlanta, GA:Centers for Disease Control and Prevention;2011 [updated 2011]. Available at: http://www.cdc.gov/diabetes/pubs/estimates11.htm#2. Accessed November 23, 2012.
- Diabetes Data and Trends.Atlanta, GA:Centers for Disease Control and Prevention;2009 [updated 2009]. Available at: http://www.cdc.gov/diabetes/statistics/dmany/fig1.htm. Accessed November 23, 2012.
- American Diabetes Association. Economic costs of diabetes in the U.S. In 2007 [published correction appears in Diabetes Care. 2008;31(6):1271.]. Diabetes Care. 2008;31(3):596–615.
- , , , et al.;American College of Endocrinology Task Force on Inpatient Diabetes Metabolic Control. American College of Endocrinology position statement on inpatient diabetes and metabolic control. Endocr Pract. 2004;10(1):77–82.
- ACE/ADA Task Force on Inpatient Diabetes. American College of Endocrinology and American Diabetes Association consensus statement on inpatient diabetes and glycemic control. Endocr Pract. 2006;12(4):458–468.
- , , , et al.;American Association of Clinical Endocrinologists; American Diabetes Association. American Association of Clinical Endocrinologists and American Diabetes Association consensus statement on inpatient glycemic control. Diabetes Care. 2009;32(6):1119–1131.
- ;DIGAMI (Diabetes Mellitus, Insulin Glucose Infusion in Acute Myocardial Infarction) Study Group. Prospective randomised study of intensive insulin treatment on long term survival after acute myocardial infarction in patients with diabetes mellitus. BMJ. 1997;314(7093):1512–1515.
- , , , et al.;American Diabetes Association Diabetes in Hospitals Writing Committee. Management of diabetes and hyperglycemia in hospitals [published correction appears in Diabetes Care. 2004;27(5):1255; Diabetes Care. 2004;27(3):856]. Diabetes Care. 2004;27(2):553–591.
- , , , , . Inpatient management of diabetes and hyperglycemia among general medicine patients at a large teaching hospital. J Hosp Med. 2006;1(3):145–150.
- , , , , ;Society of Hospital Medicine Glycemic Control Task Force. Society of Hospital Medicine Glycemic Control Task Force summary: practical recommendations for assessing the impact of glycemic control efforts. J Hosp Med. 2008;3(5 suppl):66–75.
- , , , , , . Adherence to surgical care improvement project measures and the association with postoperative infections. JAMA. 2010;303(24):2479–2485.
- Glycemic Control Resource Room.Philadelphia, PA:Society of Hospital Medicine;2008. Available at: http://www.hospitalmedicine.org/ResourceRoomRedesign/GlycemicControl.cfm. Accessed November 23, 2012.
- Inpatient Glycemic Control Resource Center.Jacksonville, FL:American Association of Clinical Endocrinologists;2011. Available at: http://resources.aace.com. Accessed November 23, 2012.
- , , , et al.;Endocrine Society. Management of hyperglycemia in hospitalized patients in non‐critical care setting: an endocrine society clinical practice guideline. J Clin Endocrinol Metab. 2012;97(1):16–38.
- Hospital Quality Initiative.Baltimore, MD:Centers for Medicare and Medicaid Services;2012 [updated 2012]. Available at: http://www.cms.gov/HospitalQualityInits/08_HospitalRHQDAPU.asp. Accessed November 23, 2012.
- Hospital‐Acquired Conditions (Present on Admission Indicator).Baltimore, MD:Centers for Medicare and Medicaid Services;2012 [updated 2012]. Available at: http://www.cms.gov/hospitalacqcond/06_hospital‐acquired_conditions.asp. Accessed November 23, 2012.
- , , , et al. Evaluation of hospital glycemic control at US academic medical centers. J Hosp Med. 2009;4(1):35–44.
- , , , . Update on inpatient glycemic control in hospitals in the United States. Endocr Pract. 2011;17(6):853–861.
- , , , , , . Inpatient glucose control: a glycemic survey of 126 U.S. hospitals. J Hosp Med. 2009;4(9):E7–E14.
- , , , , . Inpatient point‐of‐care bedside glucose testing: preliminary data on use of connectivity informatics to measure hospital glycemic control. Diabetes Technol Ther. 2007;9(6):493–500.
- , , , , , . Diabetes and hyperglycemia quality improvement efforts in hospitals in the United States: current status, practice variation, and barriers to implementation. Endocr Pract. 2010;16(2):219–230.
- , , , et al. Intensive insulin therapy in critically ill patients. N Engl J Med. 2001;345(19):1359–1367.
- , , , et al. Intensive insulin therapy in the medical ICU. N Engl J Med. 2006;354(5):449–461.
- , , , et al.;German Competence Network Sepsis (SepNet). Intensive insulin therapy and pentastarch resuscitation in severe sepsis. N Engl J Med. 2008;358(2):125–139.
- , , , et al.;NICE‐SUGAR Study Investigators. Intensive versus conventional glucose control in critically ill patients. N Engl J Med. 2009;360(13):1283–1297.
- , , , et al. A prospective randomised multi‐centre controlled trial on tight glucose control by intensive insulin therapy in adult intensive care units: the Glucontrol study. Intensive Care Med. 2009;35(10):1738–1748.
- , , . Benefits and risks of tight glucose control in critically ill adults: a meta‐analysis [published correction appears in JAMA. 2009;301(9):936]. JAMA. 2008;300(8):933–944.
- , . Severe hypoglycemia in critically ill patients: risk factors and outcomes. Crit Care Med. 2007;35(10):2262–2267.
- , , , et al. Relationship between spontaneous and iatrogenic hypoglycemia and mortality in patients hospitalized with acute myocardial infarction. JAMA. 2009;301(15):1556–1564.
- , , , et al. Hypoglycemia and outcome in critically ill patients. Mayo Clin Proc. 2010;85(3):217–224.
- , , , . Assessing inpatient glycemic control: what are the next steps?J Diabetes Sci Technol. 2012;6(2):421–427.
Copyright © 2012 Society of Hospital Medicine
Prediction Mortality and Adverse Events
Favorable health outcomes are more likely to occur when the healthcare team quickly identifies and responds to patients at risk.[1, 2, 3] However, the treatment process can break down during handoffs if the clinical condition and active issues are not well communicated.[4] Patients whose decline cannot be reversed also challenge the health team. Many are referred to hospice late,[5] and some do not receive the type of end‐of‐life care matching their preferences.[6]
Progress toward the elusive goal of more effective and efficient care might be made via an industrial engineering approach, mass customization, in which bundles of services are delivered based on the anticipated needs of subsets of patients.[7, 8] An underlying rationale is the frequent finding that a small proportion of individuals experiences the majority of the events of interest, commonly referenced as the Pareto principle.[7] Clinical prediction rules can help identify these high‐risk subsets.[9] However, as more condition‐specific rules become available, the clinical team faces logistical challenges when attempting to incorporate these into practice. For example, which team member will be responsible for generating the prediction and communicating the level of risk? What actions should follow for a given level of risk? What should be done for patients with conditions not addressed by an existing rule?
In this study, we present our rationale for health systems to implement a process for generating mortality predictions at the time of admission on most, if not all, adult patients as a context for the activities of the various clinical team members. Recent studies demonstrate that in‐hospital or 30‐day mortality can be predicted with substantial accuracy using information available at the time of admission.[10, 11, 12, 13, 14, 15, 16, 17, 18, 19] Relationships are beginning to be explored among the risk factors for mortality and other outcomes such as length of stay, unplanned transfers to intensive care units, 30‐day readmissions, and extended care facility placement.[10, 20, 21, 22] We extend this work by examining how a number of adverse events can be understood through their relationship with the risk of dying. We begin by deriving and validating a new mortality prediction rule using information feasible for our institution to use in its implementation.
METHODS
The prediction rule was derived from data on all inpatients (n = 56,003) 18 to 99 years old from St. Joseph Mercy Hospital, Ann Arbor from 2008 to 2009. This is a community‐based, tertiary‐care center. We reference derivation cases as D1, validation cases from the same hospital in the following year (2010) as V1, and data from a second hospital in 2010 as V2. The V2 hospital belonged to the same parent health corporation and shared some physician specialists with D1 and V1 but had separate medical and nursing staff.
The primary outcome predicted is 30‐day mortality from the time of admission. We chose 30‐day rather than in‐hospital mortality to address concerns of potential confounding of duration of hospital stay and likelihood of dying in the hospital.[23] Risk factors were considered for inclusion into the prediction rule based on their prevalence, conceptual, and univariable association with death (details provided in the Supporting information, Appendix I and II, in the online version of this article). The types of risk factors considered were patient diagnoses as of the time of admission obtained from hospital administrative data and grouped by the 2011 Clinical Classification Software (
Prediction Rule Derivation Using D1 Dataset
Random forest procedures with a variety of variable importance measures were used with D1 data to reduce the number of potential predictor variables.[24] Model‐based recursive partitioning, a technique that combines features of multivariable logistic regression and classification and regression trees, was then used to develop the multivariable prediction model.[25, 26] Model building was done in R, employing functions provided as part of the randomForest and party packages. The final prediction rule consisted of 4 multivariable logistic regression models, each being specific to 1 of 4 possible population subgroups: females with/females without previous hospitalizations, and males with/males without previous hospitalizations. Each logistic regression model contains exactly the same predictor variables; however, the regression coefficients are subgroup specific. Therefore, the predicted probability of 30‐day mortality for a patient having a given set of predictor variables depends on the subgroup to which the patient is a member.
Validation, Discrimination, Calibration
The prediction rule was validated by generating a predicted probability of 30‐day mortality for each patient in V1 and V2, using their observed risk factor information combined with the scoring weights (ie, regression coefficients) derived from D1, then comparing predicted vs actual outcomes. Discriminatory accuracy is reported as the area under the receiver operating characteristic (ROC) curve that can range from 0.5 indicating pure chance, to 1.0 or perfect prediction.[27] Values above 0.8 are often interpreted as indicating strong predictive relationships, values between 0.7 and 0.79 as modest, and values between 0.6 and 0.69 as weak.[28] Model calibration was tested in all datasets across 20 intervals representing the spectrum of mortality risk, by assessing whether or not the 95% confidence limits for the actual proportion of patients dying encompassed the mean predicted mortality for the interval. These 20 intervals were defined using 5 percentile increments of the probability of dying for D1. The use of intervals based on percentiles ensures similarity in the level of predicted risk within an interval for V1 and V2, while allowing the proportion of patients contained within that interval to vary across hospitals.
Relationships With Other Adverse Events
We then used each patient's calculated probability of 30‐day mortality to predict the occurrence of other adverse events. We first derived scoring weights (ie, regression parameter estimates) from logistic regression models designed to relate each secondary outcome to the predicted 30‐day mortality using D1 data. These scoring weights were then respectively applied to the V1 and V2 patients' predicted 30‐day mortality rate to generate their predicted probabilities for: in‐hospital death, a stay in an intensive care unit at some point during the hospitalization, the occurrence of a condition not present on admission (a complication, see the Supporting information, Appendix I, in the online version of this article), palliative care status at the time of discharge (International Classification of Diseases, 9th Revision code V66.7), 30‐day readmission, and death within 180 days (determined for the first hospitalization of the patient in the calendar year, using hospital administrative data and the Social Security Death Index). Additionally, for V1 patients but not V2 due to unavailability of data, we predicted the occurrence of an unplanned transfer to an intensive care unit within the first 24 hours for those not admitted to the intensive care unit (ICU), and resuscitative efforts for cardiopulmonary arrests (code blue, as determined from hospital paging records and resuscitation documentation, with the realization that some resuscitations within the intensive care units might be undercaptured by this approach). Predicted vs actual outcomes were assessed using SAS version 9.2 by examining the areas under the receiver operating curves generated by the PROC LOGISTIC ROC.
Implications for Care Redesign
To illustrate how the mortality prediction provides a context for organizing the work of multiple health professionals, we created 5 risk strata[10] based on quintiles of D1 mortality risk. To display the time frame in which the peak risk of death occurs, we plotted the unadjusted hazard function per strata using SAS PROC LIFETEST.
RESULTS
Table 1 displays the risk factors used in the 30‐day mortality prediction rule, their distribution in the populations of interest, and the frequency of the outcomes of interest. The derivation (D1) and validation (V1) populations were clinically similar; the patients of hospital V2 differed in the proportion of risk factors and outcomes. The scoring weights or parameter estimates for the risk factors are given in the Appendix (see Supporting Information, Appendix I, in the online version of this article).
| Hospital A | Hospital V2 | ||
|---|---|---|---|
| D1 Derivation, N = 56,003 | V1 Validation, N = 28,441 | V2 Validation, N = 14,867 | |
| |||
| The 24 risk factors used in the prediction rule | |||
| Age in years, mean (standard deviation) | 59.8 (19.8) | 60.2 (19.8) | 66.4 (20.2) |
| Female | 33,185 (59.3%) | 16,992 (59.7%) | 8,935 (60.1%) |
| Respiratory failure on admission | 2,235 (4.0%) | 1,198 (4.2%) | 948 (6.4%) |
| Previous hospitalization | 19,560 (34.9%) | 10,155 (35.7%) | 5,925 (39.9%) |
| Hospitalization billed as an emergency admission[38] | 30,116 (53.8%) | 15,445 (54.3%) | 11,272 (75.8%) |
| Admitted to medicine service | 29,472 (52.6%) | 16,260 (57.2%) | 11,870 (79.8%) |
| Heart failure at the time of admission | 7,558 (13.5%) | 4,046 (14.2%) | 2,492 (16.8%) |
| Injury such as fractures or trauma at the time of admission | 7,007 (12.5%) | 3,612 (12.7%) | 2,205 (14.8%) |
| Sepsis at the time of admission | 2,278 (4.1%) | 1,025 (3.6%) | 850 (5.7%) |
| Current or past atrial fibrillation | 8,329 (14.9%) | 4,657 (16.4%) | 2,533 (17.0%) |
| Current or past metastatic cancer | 2,216 (4.0%) | 1,109 (3.9%) | 428 (2.9%) |
| Current or past cancer without metastases | 5,260 (9.34%) | 2,668 (9.4%) | 1,248 (8.4%) |
| Current or past history of leukemia or lymphoma | 1,025 (1.8%) | 526 (1.9%) | 278 (1.9%) |
| Current or past cognitive deficiency | 3,708 (6.6%) | 1,973 (6.9%) | 2,728 (18.4%) |
| Current or past history of other neurological conditions (such as Parkinson's disease, multiple sclerosis, epilepsy, coma, stupor, brain damage) | 4,671 (8.3%) | 2,537 (8.9%) | 1,606 (10.8%) |
| Maximum serum blood urea nitrogen (mg/dL), continuous | 21.9 (15.1) | 21.8 (15.1) | 25.9 (18.2) |
| Maximum white blood count (1,000/UL), continuous | 2.99 (4.00) | 3.10 (4.12) | 3.15 (3.81) |
| Minimum platelet count (1,000/UL), continuous | 240.5 (85.5) | 228.0 (79.6) | 220.0 (78.6) |
| Minimum hemoglobin (g/dL), continuous | 12.3 (1.83) | 12.3 (1.9) | 12.1 (1.9) |
| Minimum serum albumin (g/dL) <3.14, binary indicator | 11,032 (19.7%) | 3,848 (13.53%) | 2,235 (15.0%) |
| Minimum arterial pH <7.3, binary indicator | 1,095 (2.0%) | 473 (1.7%) | 308 (2.1%) |
| Minimum arterial pO2 (mm Hg) <85, binary indicator | 1,827 (3.3%) | 747 (2.6%) | 471 (3.2%) |
| Maximum serum troponin (ng/mL) >0.4, binary indicator | 6,268 (11.2%) | 1,154 (4.1%) | 2,312 (15.6%) |
| Maximum serum lactate (mEq/L) >4.0, binary indicator | 533 (1.0%) | 372 (1.3%) | 106 (0.7%) |
| Outcomes of interest | |||
| 30‐day mortalityprimary outcome of interest | 2,775 (5.0%) | 1,412 (5.0%) | 1,193 (8.0%) |
| In‐hospital mortality | 1,392 (2.5%) | 636 (2.2%) | 467 (3.1%) |
| 180‐day mortality (deaths/first hospitalization for patient that year) | 2,928/38,995 (7.5%) | 1,657/21,377 (7.8%) | 1,180/10,447 (11.3%) |
| Unplanned transfer to ICU within first 24 hours/number of patients with data not admitted to ICU | 434/46,647 (0.9%) | 276/25,920 (1.1%) | NA |
| Ever in ICU during hospitalization/those with ICU information available | 5,906/55,998 (10.6%) | 3,191/28,429 (11.2%) | 642/14,848 (4.32%) |
| Any complication | 6,768 (12.1%) | 2,447 (8.6%) | 868 (5.8%) |
| Cardiopulmonary arrest | 228 (0.4%) | 151 (0.5%) | NA |
| Patients discharged with palliative care V code | 1,151 (2.1%) | 962 (3.4%) | 340 (2.3%) |
| 30‐day rehospitalization/patients discharged alive | 6,616/54,606 (12.1%) | 3,602/27,793 (13.0%) | 2,002/14,381 (13.9%) |
Predicting 30‐Day Mortality
The areas under the ROC (95% confidence interval [CI]) for the D1, V1, and V2 populations were 0.876 (95% CI, 0.870‐0.882), 0.885 (95% CI, 0.877‐0.893), and 0.883 (95% CI, 0.875‐0.892), respectively. The calibration curves for all 3 populations are shown in Figure 1. The overlap of symbols indicates that the level of predicted risk matched actual mortality for most intervals, with slight underprediction for those in the highest risk percentiles.

Example of Risk Strata
Figure 2 displays the relationship between the predicted probability of dying within 30 days and the outcomes of interest for V1, and illustrates the Pareto principle for defining high‐ and low‐risk subgroups. Most of the 30‐day deaths (74.7% of D1, 74.2% of V1, and 85.3% of V2) occurred in the small subset of patients with a predicted probability of death exceeding 0.067 (the top quintile of risk of D1, the top 18 % of V1, and the top 29.8% of V2). In contrast, the mortality rate for those with a predicted risk of 0.0033 was 0.02% for the lowest quintile of risk in D1, 0.07% for the 19.3% having the lowest risk in V1, and 0% for the 9.7% of patients with the lowest risk in V2. Figure 3 indicates that the risk for dying peaks within the first few days of the hospitalization. Moreover, those in the high‐risk group remained at elevated risk relative to the lower risk strata for at least 100 days.
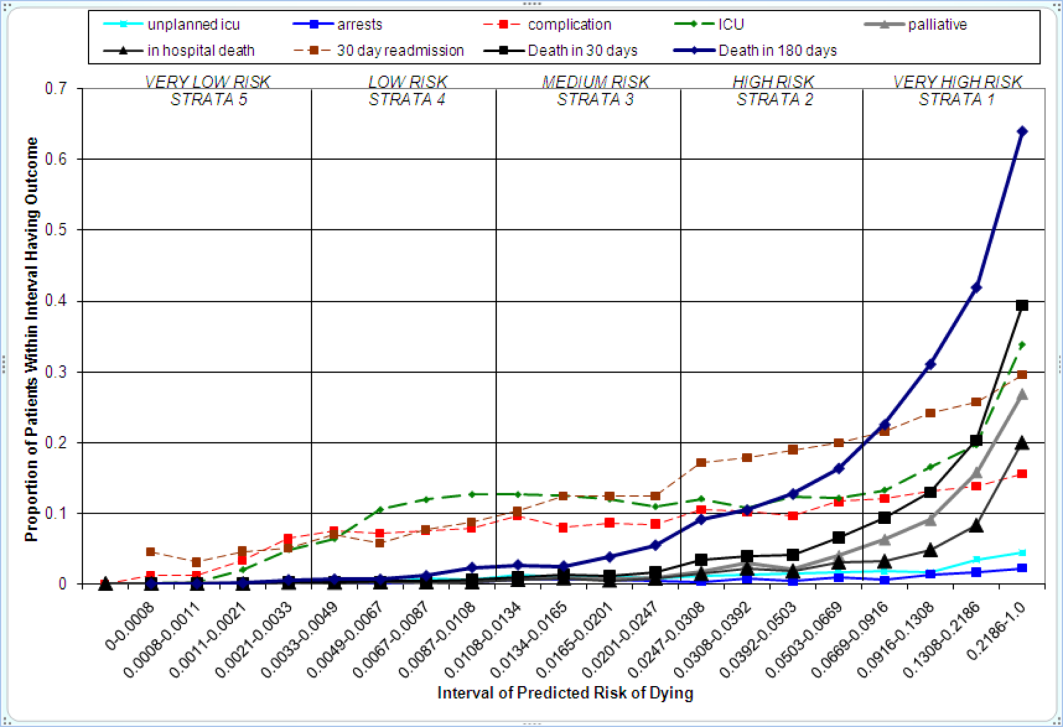
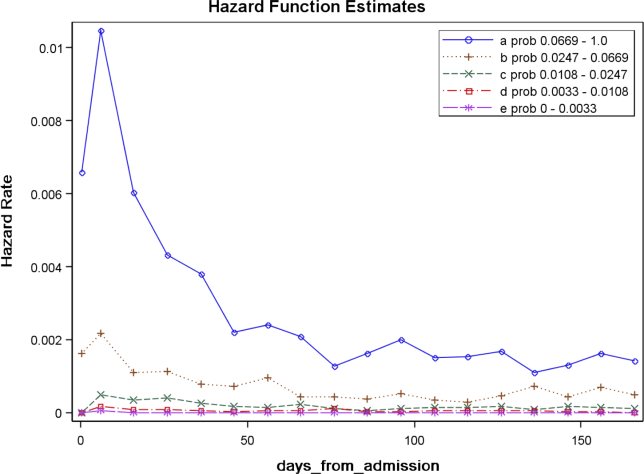
Relationships With Other Outcomes of Interest
The graphical curves of Figure 2 represent the occurrence of adverse events. The rising slopes indicate the risk for other events increases with the risk of dying within 30 days (for details and data for D1 and V2, see the Supporting Information, Appendix II, in the online version of this article). The strength of these relationships is quantified by the areas under the ROC curve (Table 2). The probability of 30‐day mortality strongly predicted the occurrence of in‐hospital death, palliative care status, and death within 180 days; modestly predicted having an unplanned transfer to an ICU within the first 24 hours of the hospitalization and undergoing resuscitative efforts for cardiopulmonary arrest; and weakly predicted intensive care unit use at some point in the hospitalization, occurrence of a condition not present on admission (complication), and being rehospitalized within 30 days
| Outcome | Hospital A | Hospital V2 | |
|---|---|---|---|
| D1Derivation | V1Validation | V2Validation | |
| |||
| Unplanned transfer to an ICU within the first 24 hours (for those not admitted to an ICU) | 0.712 (0.690‐0.734) | 0.735 (0.709‐0.761) | NA |
| Resuscitation efforts for cardiopulmonary arrest | 0.709 (0.678‐0.739) | 0.737 (0.700‐0.775) | NA |
| ICU stay at some point during the hospitalization | 0.659 (0.652‐0.666) | 0.663 (0.654‐0.672) | 0.702 (0.682‐0.722) |
| Intrahospital complication (condition not present on admission) | 0.682 (0.676‐0.689) | 0.624 (0.613‐0.635) | 0.646 (0.628‐0.664) |
| Palliative care status | 0.883 (0.875‐0.891) | 0.887 (0.878‐0.896) | 0.900 (0.888‐0.912) |
| Death within hospitalization | 0.861 (0.852‐0.870) | 0.875 (0.862‐0.887) | 0.880 (0.866‐0.893) |
| 30‐day readmission | 0.685 (0.679‐0.692) | 0.685 (0.676‐0.694) | 0.677 (0.665‐0.689) |
| Death within 180 days | 0.890 (0.885‐0.896) | 0.889 (0.882‐0.896) | 0.873 (0.864‐0.883) |
DISCUSSION
The primary contribution of our work concerns the number and strength of associations between the probability of dying within 30 days and other events, and the implications for organizing the healthcare delivery model. We also add to the growing evidence that death within 30 days can be accurately predicted at the time of admission from demographic information, modest levels of diagnostic information, and clinical laboratory values. We developed a new prediction rule with excellent accuracy that compares well to a rule recently developed by the Kaiser Permanente system.[13, 14] Feasibility considerations are likely to be the ultimate determinant of which prediction rule a health system chooses.[13, 14, 29] An independent evaluation of the candidate rules applied to the same data is required to compare their accuracy.
These results suggest a context for the coordination of clinical care processes, although mortality risk is not the only domain health systems must address. For illustrative purposes, we will refer to the risk strata shown in Figure 2. After the decisions to admit the patient to the hospital and whether or not surgical intervention is needed, the next decision concerns the level and type of nursing care needed.[10] Recent studies continue to show challenges both with unplanned transfers to intensive care units[21] and care delivered that is consistently concordant with patient wishes.[6, 30] The level of risk for multiple adverse outcomes suggests stratum 1 patients would be the priority group for perfecting the placement and preference assessment process. Our institution is currently piloting an internal placement guideline recommending that nonpalliative patients in the top 2.5 percentile of mortality risk be placed initially in either an intensive or intermediate care unit to receive the potential benefit of higher nursing staffing levels.[31] However, mortality risk cannot be the only criterion used for placement, as demonstrated by its relatively weak association with overall ICU utilization. Our findings may reflect the role of unmeasured factors such as the need for mechanical ventilation, patient preference for comfort care, bed availability, change in patient condition after admission, and inconsistent application of admission criteria.[17, 21, 32, 33, 34]
After the placement decision, the team could decide if the usual level of monitoring, physician rounding, and care coordination would be adequate for the level of risk or whether an additional anticipatory approach is needed. The weak relationship between the risk of death and incidence of complications, although not a new finding,[35, 36] suggests routine surveillance activities need to be conducted on all patients regardless of risk to detect a complication, but that a rescue plan be developed in advance for high mortality risk patients, for example strata 1 and 2, in the event they should develop a complication.[36] Inclusion of the patient's risk strata as part of the routine hand‐off communication among hospitalists, nurses, and other team members could provide a succinct common alert for the likelihood of adverse events.
The 30‐day mortality risk also informs the transition care plan following hospitalization, given the strong association with death in 180 days and the persistent level of this risk (Figure 3). Again, communication of the risk status (stratum 1) to the team caring for the patient after the hospitalization provides a common reference for prognosis and level of attention needed. However, the prediction accuracy is not sufficient to refer high‐risk patients into hospice, but rather, to identify the high‐risk subset having the most urgent need to have their preferences for future end‐of‐life care understood and addressed. The weak relationship of mortality risk with 30‐day readmissions indicates that our rule would have a limited role in identifying readmission risk per se. Others have noted the difficulty in accurately predicting readmissions, most likely because the underlying causes are multifactorial.[37] Our results suggest that 1 dynamic for readmission is the risk of dying, and so the underlying causes of this risk should be addressed in the transition plan.
There are a number of limitations with our study. First, this rule was developed and validated on data from only 2 institutions, assembled retrospectively, with diagnostic information determined from administrative data. One cannot assume the accuracy will carry over to other institutions[29] or when there is diagnostic uncertainty at the time of admission. Second, the 30‐day mortality risk should not be used as the sole criterion for determining the service intensity for individual patients because of issues with calibration, interpretation of risk, and confounding. The calibration curves (Figure 2) show the slight underprediction of the risk of dying for high‐risk groups. Other studies have also noted problems with precise calibration in validation datasets.[13, 14] Caution is also needed in the interpretation of what it means to be at high risk. Most patients in stratum 1 were alive at 30 days; therefore, being at high risk is not a death sentence. Furthermore, the relative weights of the risk factors reflect (ie, are confounded by) the level of treatment rendered. Some deaths within the higher‐risk percentiles undoubtedly occurred in patients choosing a palliative rather than a curative approach, perhaps partially explaining the slight underprediction of deaths. Conversely, the low mortality experienced by patients within the lower‐risk strata may indicate the treatment provided was effective. Low mortality risk does not imply less care is needed.
A third limitation is that we have not defined the thresholds of risk that should trigger placement and care intensity, although we provide examples on how this could be done. Each institution will need to calibrate the thresholds and associated decision‐making processes according to its own environment.[14] Interested readers can explore the sensitivity and specificity of various thresholds\ by using the tables in the Appendix (see the Supporting information, Appendix II, in the online version of this article). Finally, we do not know if identifying the mortality risk on admission will lead to better outcomes[19, 29]
CONCLUSIONS
Death within 30 days can be predicted with information known at the time of admission, and is associated with the risk of having other adverse events. We believe the probability of death can be used to define strata of risk that provide a succinct common reference point for the multidisciplinary team to anticipate the clinical course of subsets of patients and intervene with proportional intensity.
Acknowledgments
This work benefited from multiple conversations with Patricia Posa, RN, MSA, Elizabeth Van Hoek, MHSA, and the Redesigning Care Task Force of St. Joseph Mercy Hospital, Ann Arbor, Michigan.
Disclosure: Nothing to report.
- , , , et al. Importance of time to reperfusion for 30‐day and late survival and recovery of left ventricular function after primary angioplasty for acute myocardial infarction. J Am Coll Cardiol. 1998;32:1312–1319.
- , , , et al. Early goal‐directed therapy in the treatment of severe sepsis and septic shock. N Engl J Med. 2001;345:1368–1377.
- ATLANTIS, ECASS, NINDS rt‐PA Study Group Investigators. Association of outcome with early stroke treatment: pooled analysis of ATLANTIS, ECASS, and NINDS rt‐PA stroke trials. Lancet. 2004;363:768–774.
- , , , et al. Handoffs causing patient harm: a survey of medical and surgical house staff. Jt Comm J Qual Patient Saf. 2008;34:563–570.
- National Hospice and Palliative Care Organization. NHPCO facts and figures: hospice care in America 2010 Edition. Available at: http://www.nhpco.org. Accessed October 3,2011.
- , , , , . End‐of‐life discussions, goal attainment, and distress at the end of life: predictors and outcomes of receipt of care consistent with preferences. J Clin Oncol. 2010;28:1203–1208.
- Committee on Quality of Health Care in America, Institute of Medicine (IOM).Crossing the Quality Chasm: A New Health System for the 21st Century.Washington, DC:National Academies Press;2001.
- , , , et al. The surviving sepsis campaign: results of an international guideline‐based performance improvement program targeting severe sepsis. Intensive Care Med. 2010;36:222–231.
- , , , et al. A prediction rule to identify low‐risk patients with community‐acquired pneumonia. N Engl J Med. 1997;336:243–250.
- , . The simple clinical score predicts mortality for 30 days after admission to an acute medical unit. Q J Med. 2006;99:771–781.
- , , , et al. Enhancement of claims data to improve risk adjustment of hospital mortality. JAMA. 2007;297:71–76.
- , , . Using automated clinical data for risk adjustment. Med Care. 2007;45:789–805.
- , , , , , . Risk‐adjusting hospital inpatient mortality using automated inpatient, outpatient, and laboratory databases. Med Care. 2008;46:232–239.
- , , , . The Kaiser Permanente inpatient risk adjustment methodology was valid in an external patient population. J Clin Epidemiol. 2010;63:798–803.
- , , , , . An improved medical admissions risk system using multivariable fractional polynomial logistic regression modeling. Q J Med. 2010;103:23–32.
- , , , , . Risk scoring systems for adults admitted to the emergency department: a systematic review. Scand J Trauma Resusc Emerg Med. 2010;18:8.
- , , , , . Derivation and validation of a model to predict daily risk of death in hospital. Med Care. 2011;49:734–743.
- , , , . Prediction of hospital mortality from admission laboratory data and patient age: a simple model. Emerg Med Australas. 2011;23:354–363.
- , , . Predicting death: an empirical evaluation of predictive tools for mortality. Arch Intern Med. 2011;171:1721–1726.
- , , , . Length of stay predictions: improvements through the use of automated laboratory and comorbidity variables. Med Care. 2010;48:739–744.
- , , , , , . Intra‐hospital transfers to a higher level of care: contribution to total hospital and intensive care unit (ICU) mortality and length of stay (LOS). J Hosp Med. 2011;6:74–80.
- , , , et al. An automated model to identify heart failure patients at risk for 30‐day readmission or death using electronic medical record data. Med Care. 2010;48:981–988.
- , , , , , . Mortality trends during a program that publicly reported hospital performance. Med Care. 2002;40:879–890.
- , . Classification and regression by randomForest. R News. 2002;2:18–22.
- , , . Model‐based recursive partitioning. J Comput Graph Stat. 2008;17:492–514.
- , , , .Classification and Regression Trees.Belmont, CA:Wadsworth Inc.,1984.
- , , , , . Evaluating the yield of medical tests. JAMA. 1982;247:2543–2546.
- , , , . Risk stratification and therapeutic decision making in acute coronary syndromes. JAMA. 2000;284:876–878.
- , . Why is a good clinical prediction rule so hard to find?Arch Intern Med. 2011;171:1701–1702.
- , , . Advance directives and outcomes of surrogate decision making before death. N Engl J Med. 2010;362:1211–1218.
- , , , , , . Nurse staffing and inpatient hospital mortality. N Engl J Med. 2011;364:1037–1045.
- , , , et al. Survival of critically ill patients hospitalized in and out of intensive care. Crit Care Med. 2007;35:449–457.
- , , . How decisions are made to admit patients to medical intensive care units (MICUs): a survey of MICU directors at academic medical centers across the United States. Crit Care Med. 2008;36:414–420.
- , . Rethinking rapid response teams. JAMA. 2010;204:1375–1376.
- , , , . Hospital and patient characteristics associated with death after surgery: a study of adverse occurrence and failure to rescue. Med Care. 1992;30:615–629.
- , , . Variation in hospital mortality associated with inpatient surgery. N Engl J Med. 2009;361:1368–1375.
- , , , et al. Risk prediction models for hospital readmission: a systematic review. JAMA. 2011;306:1688–1698.
- Department of Health and Human Services, Centers for Medicare and Medicaid Services, CMS Manual System, Pub 100–04 Medicare Claims Processing, November 3, 2006. Available at: http://www. cms.gov/Regulations‐and‐Guidance/Guidance/Transmittals/Downloads/R1104CP.pdf. Accessed September 5,2012.
Favorable health outcomes are more likely to occur when the healthcare team quickly identifies and responds to patients at risk.[1, 2, 3] However, the treatment process can break down during handoffs if the clinical condition and active issues are not well communicated.[4] Patients whose decline cannot be reversed also challenge the health team. Many are referred to hospice late,[5] and some do not receive the type of end‐of‐life care matching their preferences.[6]
Progress toward the elusive goal of more effective and efficient care might be made via an industrial engineering approach, mass customization, in which bundles of services are delivered based on the anticipated needs of subsets of patients.[7, 8] An underlying rationale is the frequent finding that a small proportion of individuals experiences the majority of the events of interest, commonly referenced as the Pareto principle.[7] Clinical prediction rules can help identify these high‐risk subsets.[9] However, as more condition‐specific rules become available, the clinical team faces logistical challenges when attempting to incorporate these into practice. For example, which team member will be responsible for generating the prediction and communicating the level of risk? What actions should follow for a given level of risk? What should be done for patients with conditions not addressed by an existing rule?
In this study, we present our rationale for health systems to implement a process for generating mortality predictions at the time of admission on most, if not all, adult patients as a context for the activities of the various clinical team members. Recent studies demonstrate that in‐hospital or 30‐day mortality can be predicted with substantial accuracy using information available at the time of admission.[10, 11, 12, 13, 14, 15, 16, 17, 18, 19] Relationships are beginning to be explored among the risk factors for mortality and other outcomes such as length of stay, unplanned transfers to intensive care units, 30‐day readmissions, and extended care facility placement.[10, 20, 21, 22] We extend this work by examining how a number of adverse events can be understood through their relationship with the risk of dying. We begin by deriving and validating a new mortality prediction rule using information feasible for our institution to use in its implementation.
METHODS
The prediction rule was derived from data on all inpatients (n = 56,003) 18 to 99 years old from St. Joseph Mercy Hospital, Ann Arbor from 2008 to 2009. This is a community‐based, tertiary‐care center. We reference derivation cases as D1, validation cases from the same hospital in the following year (2010) as V1, and data from a second hospital in 2010 as V2. The V2 hospital belonged to the same parent health corporation and shared some physician specialists with D1 and V1 but had separate medical and nursing staff.
The primary outcome predicted is 30‐day mortality from the time of admission. We chose 30‐day rather than in‐hospital mortality to address concerns of potential confounding of duration of hospital stay and likelihood of dying in the hospital.[23] Risk factors were considered for inclusion into the prediction rule based on their prevalence, conceptual, and univariable association with death (details provided in the Supporting information, Appendix I and II, in the online version of this article). The types of risk factors considered were patient diagnoses as of the time of admission obtained from hospital administrative data and grouped by the 2011 Clinical Classification Software (
Prediction Rule Derivation Using D1 Dataset
Random forest procedures with a variety of variable importance measures were used with D1 data to reduce the number of potential predictor variables.[24] Model‐based recursive partitioning, a technique that combines features of multivariable logistic regression and classification and regression trees, was then used to develop the multivariable prediction model.[25, 26] Model building was done in R, employing functions provided as part of the randomForest and party packages. The final prediction rule consisted of 4 multivariable logistic regression models, each being specific to 1 of 4 possible population subgroups: females with/females without previous hospitalizations, and males with/males without previous hospitalizations. Each logistic regression model contains exactly the same predictor variables; however, the regression coefficients are subgroup specific. Therefore, the predicted probability of 30‐day mortality for a patient having a given set of predictor variables depends on the subgroup to which the patient is a member.
Validation, Discrimination, Calibration
The prediction rule was validated by generating a predicted probability of 30‐day mortality for each patient in V1 and V2, using their observed risk factor information combined with the scoring weights (ie, regression coefficients) derived from D1, then comparing predicted vs actual outcomes. Discriminatory accuracy is reported as the area under the receiver operating characteristic (ROC) curve that can range from 0.5 indicating pure chance, to 1.0 or perfect prediction.[27] Values above 0.8 are often interpreted as indicating strong predictive relationships, values between 0.7 and 0.79 as modest, and values between 0.6 and 0.69 as weak.[28] Model calibration was tested in all datasets across 20 intervals representing the spectrum of mortality risk, by assessing whether or not the 95% confidence limits for the actual proportion of patients dying encompassed the mean predicted mortality for the interval. These 20 intervals were defined using 5 percentile increments of the probability of dying for D1. The use of intervals based on percentiles ensures similarity in the level of predicted risk within an interval for V1 and V2, while allowing the proportion of patients contained within that interval to vary across hospitals.
Relationships With Other Adverse Events
We then used each patient's calculated probability of 30‐day mortality to predict the occurrence of other adverse events. We first derived scoring weights (ie, regression parameter estimates) from logistic regression models designed to relate each secondary outcome to the predicted 30‐day mortality using D1 data. These scoring weights were then respectively applied to the V1 and V2 patients' predicted 30‐day mortality rate to generate their predicted probabilities for: in‐hospital death, a stay in an intensive care unit at some point during the hospitalization, the occurrence of a condition not present on admission (a complication, see the Supporting information, Appendix I, in the online version of this article), palliative care status at the time of discharge (International Classification of Diseases, 9th Revision code V66.7), 30‐day readmission, and death within 180 days (determined for the first hospitalization of the patient in the calendar year, using hospital administrative data and the Social Security Death Index). Additionally, for V1 patients but not V2 due to unavailability of data, we predicted the occurrence of an unplanned transfer to an intensive care unit within the first 24 hours for those not admitted to the intensive care unit (ICU), and resuscitative efforts for cardiopulmonary arrests (code blue, as determined from hospital paging records and resuscitation documentation, with the realization that some resuscitations within the intensive care units might be undercaptured by this approach). Predicted vs actual outcomes were assessed using SAS version 9.2 by examining the areas under the receiver operating curves generated by the PROC LOGISTIC ROC.
Implications for Care Redesign
To illustrate how the mortality prediction provides a context for organizing the work of multiple health professionals, we created 5 risk strata[10] based on quintiles of D1 mortality risk. To display the time frame in which the peak risk of death occurs, we plotted the unadjusted hazard function per strata using SAS PROC LIFETEST.
RESULTS
Table 1 displays the risk factors used in the 30‐day mortality prediction rule, their distribution in the populations of interest, and the frequency of the outcomes of interest. The derivation (D1) and validation (V1) populations were clinically similar; the patients of hospital V2 differed in the proportion of risk factors and outcomes. The scoring weights or parameter estimates for the risk factors are given in the Appendix (see Supporting Information, Appendix I, in the online version of this article).
| Hospital A | Hospital V2 | ||
|---|---|---|---|
| D1 Derivation, N = 56,003 | V1 Validation, N = 28,441 | V2 Validation, N = 14,867 | |
| |||
| The 24 risk factors used in the prediction rule | |||
| Age in years, mean (standard deviation) | 59.8 (19.8) | 60.2 (19.8) | 66.4 (20.2) |
| Female | 33,185 (59.3%) | 16,992 (59.7%) | 8,935 (60.1%) |
| Respiratory failure on admission | 2,235 (4.0%) | 1,198 (4.2%) | 948 (6.4%) |
| Previous hospitalization | 19,560 (34.9%) | 10,155 (35.7%) | 5,925 (39.9%) |
| Hospitalization billed as an emergency admission[38] | 30,116 (53.8%) | 15,445 (54.3%) | 11,272 (75.8%) |
| Admitted to medicine service | 29,472 (52.6%) | 16,260 (57.2%) | 11,870 (79.8%) |
| Heart failure at the time of admission | 7,558 (13.5%) | 4,046 (14.2%) | 2,492 (16.8%) |
| Injury such as fractures or trauma at the time of admission | 7,007 (12.5%) | 3,612 (12.7%) | 2,205 (14.8%) |
| Sepsis at the time of admission | 2,278 (4.1%) | 1,025 (3.6%) | 850 (5.7%) |
| Current or past atrial fibrillation | 8,329 (14.9%) | 4,657 (16.4%) | 2,533 (17.0%) |
| Current or past metastatic cancer | 2,216 (4.0%) | 1,109 (3.9%) | 428 (2.9%) |
| Current or past cancer without metastases | 5,260 (9.34%) | 2,668 (9.4%) | 1,248 (8.4%) |
| Current or past history of leukemia or lymphoma | 1,025 (1.8%) | 526 (1.9%) | 278 (1.9%) |
| Current or past cognitive deficiency | 3,708 (6.6%) | 1,973 (6.9%) | 2,728 (18.4%) |
| Current or past history of other neurological conditions (such as Parkinson's disease, multiple sclerosis, epilepsy, coma, stupor, brain damage) | 4,671 (8.3%) | 2,537 (8.9%) | 1,606 (10.8%) |
| Maximum serum blood urea nitrogen (mg/dL), continuous | 21.9 (15.1) | 21.8 (15.1) | 25.9 (18.2) |
| Maximum white blood count (1,000/UL), continuous | 2.99 (4.00) | 3.10 (4.12) | 3.15 (3.81) |
| Minimum platelet count (1,000/UL), continuous | 240.5 (85.5) | 228.0 (79.6) | 220.0 (78.6) |
| Minimum hemoglobin (g/dL), continuous | 12.3 (1.83) | 12.3 (1.9) | 12.1 (1.9) |
| Minimum serum albumin (g/dL) <3.14, binary indicator | 11,032 (19.7%) | 3,848 (13.53%) | 2,235 (15.0%) |
| Minimum arterial pH <7.3, binary indicator | 1,095 (2.0%) | 473 (1.7%) | 308 (2.1%) |
| Minimum arterial pO2 (mm Hg) <85, binary indicator | 1,827 (3.3%) | 747 (2.6%) | 471 (3.2%) |
| Maximum serum troponin (ng/mL) >0.4, binary indicator | 6,268 (11.2%) | 1,154 (4.1%) | 2,312 (15.6%) |
| Maximum serum lactate (mEq/L) >4.0, binary indicator | 533 (1.0%) | 372 (1.3%) | 106 (0.7%) |
| Outcomes of interest | |||
| 30‐day mortalityprimary outcome of interest | 2,775 (5.0%) | 1,412 (5.0%) | 1,193 (8.0%) |
| In‐hospital mortality | 1,392 (2.5%) | 636 (2.2%) | 467 (3.1%) |
| 180‐day mortality (deaths/first hospitalization for patient that year) | 2,928/38,995 (7.5%) | 1,657/21,377 (7.8%) | 1,180/10,447 (11.3%) |
| Unplanned transfer to ICU within first 24 hours/number of patients with data not admitted to ICU | 434/46,647 (0.9%) | 276/25,920 (1.1%) | NA |
| Ever in ICU during hospitalization/those with ICU information available | 5,906/55,998 (10.6%) | 3,191/28,429 (11.2%) | 642/14,848 (4.32%) |
| Any complication | 6,768 (12.1%) | 2,447 (8.6%) | 868 (5.8%) |
| Cardiopulmonary arrest | 228 (0.4%) | 151 (0.5%) | NA |
| Patients discharged with palliative care V code | 1,151 (2.1%) | 962 (3.4%) | 340 (2.3%) |
| 30‐day rehospitalization/patients discharged alive | 6,616/54,606 (12.1%) | 3,602/27,793 (13.0%) | 2,002/14,381 (13.9%) |
Predicting 30‐Day Mortality
The areas under the ROC (95% confidence interval [CI]) for the D1, V1, and V2 populations were 0.876 (95% CI, 0.870‐0.882), 0.885 (95% CI, 0.877‐0.893), and 0.883 (95% CI, 0.875‐0.892), respectively. The calibration curves for all 3 populations are shown in Figure 1. The overlap of symbols indicates that the level of predicted risk matched actual mortality for most intervals, with slight underprediction for those in the highest risk percentiles.
Example of Risk Strata
Figure 2 displays the relationship between the predicted probability of dying within 30 days and the outcomes of interest for V1, and illustrates the Pareto principle for defining high‐ and low‐risk subgroups. Most of the 30‐day deaths (74.7% of D1, 74.2% of V1, and 85.3% of V2) occurred in the small subset of patients with a predicted probability of death exceeding 0.067 (the top quintile of risk of D1, the top 18 % of V1, and the top 29.8% of V2). In contrast, the mortality rate for those with a predicted risk of 0.0033 was 0.02% for the lowest quintile of risk in D1, 0.07% for the 19.3% having the lowest risk in V1, and 0% for the 9.7% of patients with the lowest risk in V2. Figure 3 indicates that the risk for dying peaks within the first few days of the hospitalization. Moreover, those in the high‐risk group remained at elevated risk relative to the lower risk strata for at least 100 days.
Relationships With Other Outcomes of Interest
The graphical curves of Figure 2 represent the occurrence of adverse events. The rising slopes indicate the risk for other events increases with the risk of dying within 30 days (for details and data for D1 and V2, see the Supporting Information, Appendix II, in the online version of this article). The strength of these relationships is quantified by the areas under the ROC curve (Table 2). The probability of 30‐day mortality strongly predicted the occurrence of in‐hospital death, palliative care status, and death within 180 days; modestly predicted having an unplanned transfer to an ICU within the first 24 hours of the hospitalization and undergoing resuscitative efforts for cardiopulmonary arrest; and weakly predicted intensive care unit use at some point in the hospitalization, occurrence of a condition not present on admission (complication), and being rehospitalized within 30 days
| Outcome | Hospital A | Hospital V2 | |
|---|---|---|---|
| D1Derivation | V1Validation | V2Validation | |
| |||
| Unplanned transfer to an ICU within the first 24 hours (for those not admitted to an ICU) | 0.712 (0.690‐0.734) | 0.735 (0.709‐0.761) | NA |
| Resuscitation efforts for cardiopulmonary arrest | 0.709 (0.678‐0.739) | 0.737 (0.700‐0.775) | NA |
| ICU stay at some point during the hospitalization | 0.659 (0.652‐0.666) | 0.663 (0.654‐0.672) | 0.702 (0.682‐0.722) |
| Intrahospital complication (condition not present on admission) | 0.682 (0.676‐0.689) | 0.624 (0.613‐0.635) | 0.646 (0.628‐0.664) |
| Palliative care status | 0.883 (0.875‐0.891) | 0.887 (0.878‐0.896) | 0.900 (0.888‐0.912) |
| Death within hospitalization | 0.861 (0.852‐0.870) | 0.875 (0.862‐0.887) | 0.880 (0.866‐0.893) |
| 30‐day readmission | 0.685 (0.679‐0.692) | 0.685 (0.676‐0.694) | 0.677 (0.665‐0.689) |
| Death within 180 days | 0.890 (0.885‐0.896) | 0.889 (0.882‐0.896) | 0.873 (0.864‐0.883) |
DISCUSSION
The primary contribution of our work concerns the number and strength of associations between the probability of dying within 30 days and other events, and the implications for organizing the healthcare delivery model. We also add to the growing evidence that death within 30 days can be accurately predicted at the time of admission from demographic information, modest levels of diagnostic information, and clinical laboratory values. We developed a new prediction rule with excellent accuracy that compares well to a rule recently developed by the Kaiser Permanente system.[13, 14] Feasibility considerations are likely to be the ultimate determinant of which prediction rule a health system chooses.[13, 14, 29] An independent evaluation of the candidate rules applied to the same data is required to compare their accuracy.
These results suggest a context for the coordination of clinical care processes, although mortality risk is not the only domain health systems must address. For illustrative purposes, we will refer to the risk strata shown in Figure 2. After the decisions to admit the patient to the hospital and whether or not surgical intervention is needed, the next decision concerns the level and type of nursing care needed.[10] Recent studies continue to show challenges both with unplanned transfers to intensive care units[21] and care delivered that is consistently concordant with patient wishes.[6, 30] The level of risk for multiple adverse outcomes suggests stratum 1 patients would be the priority group for perfecting the placement and preference assessment process. Our institution is currently piloting an internal placement guideline recommending that nonpalliative patients in the top 2.5 percentile of mortality risk be placed initially in either an intensive or intermediate care unit to receive the potential benefit of higher nursing staffing levels.[31] However, mortality risk cannot be the only criterion used for placement, as demonstrated by its relatively weak association with overall ICU utilization. Our findings may reflect the role of unmeasured factors such as the need for mechanical ventilation, patient preference for comfort care, bed availability, change in patient condition after admission, and inconsistent application of admission criteria.[17, 21, 32, 33, 34]
After the placement decision, the team could decide if the usual level of monitoring, physician rounding, and care coordination would be adequate for the level of risk or whether an additional anticipatory approach is needed. The weak relationship between the risk of death and incidence of complications, although not a new finding,[35, 36] suggests routine surveillance activities need to be conducted on all patients regardless of risk to detect a complication, but that a rescue plan be developed in advance for high mortality risk patients, for example strata 1 and 2, in the event they should develop a complication.[36] Inclusion of the patient's risk strata as part of the routine hand‐off communication among hospitalists, nurses, and other team members could provide a succinct common alert for the likelihood of adverse events.
The 30‐day mortality risk also informs the transition care plan following hospitalization, given the strong association with death in 180 days and the persistent level of this risk (Figure 3). Again, communication of the risk status (stratum 1) to the team caring for the patient after the hospitalization provides a common reference for prognosis and level of attention needed. However, the prediction accuracy is not sufficient to refer high‐risk patients into hospice, but rather, to identify the high‐risk subset having the most urgent need to have their preferences for future end‐of‐life care understood and addressed. The weak relationship of mortality risk with 30‐day readmissions indicates that our rule would have a limited role in identifying readmission risk per se. Others have noted the difficulty in accurately predicting readmissions, most likely because the underlying causes are multifactorial.[37] Our results suggest that 1 dynamic for readmission is the risk of dying, and so the underlying causes of this risk should be addressed in the transition plan.
There are a number of limitations with our study. First, this rule was developed and validated on data from only 2 institutions, assembled retrospectively, with diagnostic information determined from administrative data. One cannot assume the accuracy will carry over to other institutions[29] or when there is diagnostic uncertainty at the time of admission. Second, the 30‐day mortality risk should not be used as the sole criterion for determining the service intensity for individual patients because of issues with calibration, interpretation of risk, and confounding. The calibration curves (Figure 2) show the slight underprediction of the risk of dying for high‐risk groups. Other studies have also noted problems with precise calibration in validation datasets.[13, 14] Caution is also needed in the interpretation of what it means to be at high risk. Most patients in stratum 1 were alive at 30 days; therefore, being at high risk is not a death sentence. Furthermore, the relative weights of the risk factors reflect (ie, are confounded by) the level of treatment rendered. Some deaths within the higher‐risk percentiles undoubtedly occurred in patients choosing a palliative rather than a curative approach, perhaps partially explaining the slight underprediction of deaths. Conversely, the low mortality experienced by patients within the lower‐risk strata may indicate the treatment provided was effective. Low mortality risk does not imply less care is needed.
A third limitation is that we have not defined the thresholds of risk that should trigger placement and care intensity, although we provide examples on how this could be done. Each institution will need to calibrate the thresholds and associated decision‐making processes according to its own environment.[14] Interested readers can explore the sensitivity and specificity of various thresholds\ by using the tables in the Appendix (see the Supporting information, Appendix II, in the online version of this article). Finally, we do not know if identifying the mortality risk on admission will lead to better outcomes[19, 29]
CONCLUSIONS
Death within 30 days can be predicted with information known at the time of admission, and is associated with the risk of having other adverse events. We believe the probability of death can be used to define strata of risk that provide a succinct common reference point for the multidisciplinary team to anticipate the clinical course of subsets of patients and intervene with proportional intensity.
Acknowledgments
This work benefited from multiple conversations with Patricia Posa, RN, MSA, Elizabeth Van Hoek, MHSA, and the Redesigning Care Task Force of St. Joseph Mercy Hospital, Ann Arbor, Michigan.
Disclosure: Nothing to report.
- , , , et al. Importance of time to reperfusion for 30‐day and late survival and recovery of left ventricular function after primary angioplasty for acute myocardial infarction. J Am Coll Cardiol. 1998;32:1312–1319.
- , , , et al. Early goal‐directed therapy in the treatment of severe sepsis and septic shock. N Engl J Med. 2001;345:1368–1377.
- ATLANTIS, ECASS, NINDS rt‐PA Study Group Investigators. Association of outcome with early stroke treatment: pooled analysis of ATLANTIS, ECASS, and NINDS rt‐PA stroke trials. Lancet. 2004;363:768–774.
- , , , et al. Handoffs causing patient harm: a survey of medical and surgical house staff. Jt Comm J Qual Patient Saf. 2008;34:563–570.
- National Hospice and Palliative Care Organization. NHPCO facts and figures: hospice care in America 2010 Edition. Available at: http://www.nhpco.org. Accessed October 3,2011.
- , , , , . End‐of‐life discussions, goal attainment, and distress at the end of life: predictors and outcomes of receipt of care consistent with preferences. J Clin Oncol. 2010;28:1203–1208.
- Committee on Quality of Health Care in America, Institute of Medicine (IOM).Crossing the Quality Chasm: A New Health System for the 21st Century.Washington, DC:National Academies Press;2001.
- , , , et al. The surviving sepsis campaign: results of an international guideline‐based performance improvement program targeting severe sepsis. Intensive Care Med. 2010;36:222–231.
- , , , et al. A prediction rule to identify low‐risk patients with community‐acquired pneumonia. N Engl J Med. 1997;336:243–250.
- , . The simple clinical score predicts mortality for 30 days after admission to an acute medical unit. Q J Med. 2006;99:771–781.
- , , , et al. Enhancement of claims data to improve risk adjustment of hospital mortality. JAMA. 2007;297:71–76.
- , , . Using automated clinical data for risk adjustment. Med Care. 2007;45:789–805.
- , , , , , . Risk‐adjusting hospital inpatient mortality using automated inpatient, outpatient, and laboratory databases. Med Care. 2008;46:232–239.
- , , , . The Kaiser Permanente inpatient risk adjustment methodology was valid in an external patient population. J Clin Epidemiol. 2010;63:798–803.
- , , , , . An improved medical admissions risk system using multivariable fractional polynomial logistic regression modeling. Q J Med. 2010;103:23–32.
- , , , , . Risk scoring systems for adults admitted to the emergency department: a systematic review. Scand J Trauma Resusc Emerg Med. 2010;18:8.
- , , , , . Derivation and validation of a model to predict daily risk of death in hospital. Med Care. 2011;49:734–743.
- , , , . Prediction of hospital mortality from admission laboratory data and patient age: a simple model. Emerg Med Australas. 2011;23:354–363.
- , , . Predicting death: an empirical evaluation of predictive tools for mortality. Arch Intern Med. 2011;171:1721–1726.
- , , , . Length of stay predictions: improvements through the use of automated laboratory and comorbidity variables. Med Care. 2010;48:739–744.
- , , , , , . Intra‐hospital transfers to a higher level of care: contribution to total hospital and intensive care unit (ICU) mortality and length of stay (LOS). J Hosp Med. 2011;6:74–80.
- , , , et al. An automated model to identify heart failure patients at risk for 30‐day readmission or death using electronic medical record data. Med Care. 2010;48:981–988.
- , , , , , . Mortality trends during a program that publicly reported hospital performance. Med Care. 2002;40:879–890.
- , . Classification and regression by randomForest. R News. 2002;2:18–22.
- , , . Model‐based recursive partitioning. J Comput Graph Stat. 2008;17:492–514.
- , , , .Classification and Regression Trees.Belmont, CA:Wadsworth Inc.,1984.
- , , , , . Evaluating the yield of medical tests. JAMA. 1982;247:2543–2546.
- , , , . Risk stratification and therapeutic decision making in acute coronary syndromes. JAMA. 2000;284:876–878.
- , . Why is a good clinical prediction rule so hard to find?Arch Intern Med. 2011;171:1701–1702.
- , , . Advance directives and outcomes of surrogate decision making before death. N Engl J Med. 2010;362:1211–1218.
- , , , , , . Nurse staffing and inpatient hospital mortality. N Engl J Med. 2011;364:1037–1045.
- , , , et al. Survival of critically ill patients hospitalized in and out of intensive care. Crit Care Med. 2007;35:449–457.
- , , . How decisions are made to admit patients to medical intensive care units (MICUs): a survey of MICU directors at academic medical centers across the United States. Crit Care Med. 2008;36:414–420.
- , . Rethinking rapid response teams. JAMA. 2010;204:1375–1376.
- , , , . Hospital and patient characteristics associated with death after surgery: a study of adverse occurrence and failure to rescue. Med Care. 1992;30:615–629.
- , , . Variation in hospital mortality associated with inpatient surgery. N Engl J Med. 2009;361:1368–1375.
- , , , et al. Risk prediction models for hospital readmission: a systematic review. JAMA. 2011;306:1688–1698.
- Department of Health and Human Services, Centers for Medicare and Medicaid Services, CMS Manual System, Pub 100–04 Medicare Claims Processing, November 3, 2006. Available at: http://www. cms.gov/Regulations‐and‐Guidance/Guidance/Transmittals/Downloads/R1104CP.pdf. Accessed September 5,2012.
Copyright © 2012 Society of Hospital Medicine
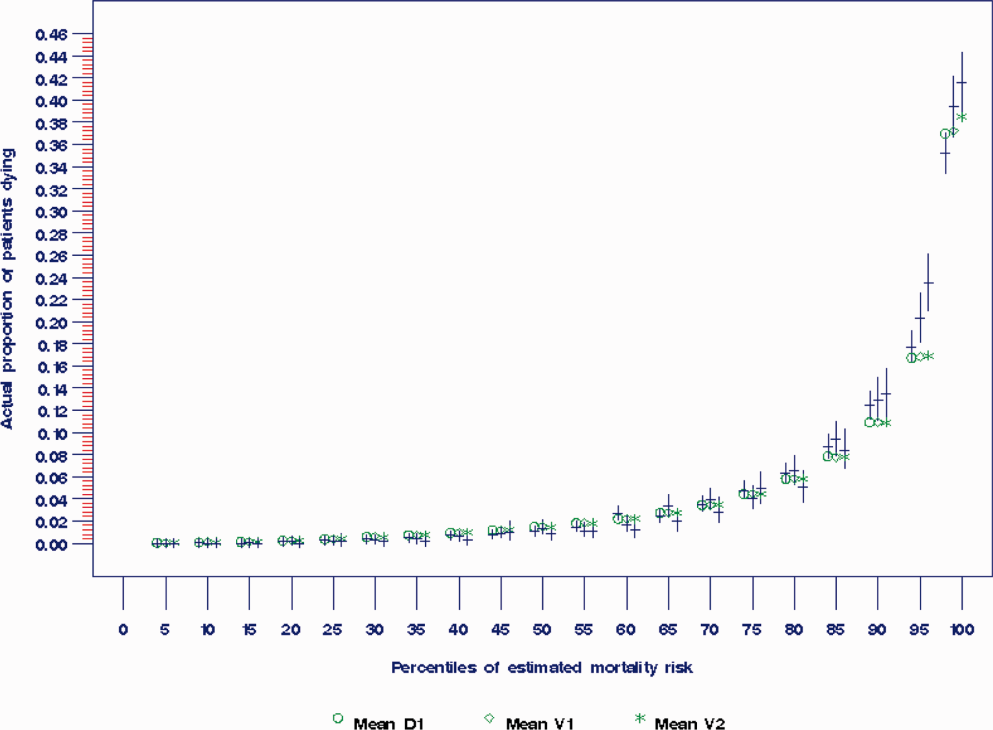
Dr. Raul Ruiz goes to Washington
Dr. Raul Ruiz has traded in his white coat for an office on Capitol Hill. An emergency physician from California’s Coachella Valley, Dr. Ruiz is the newest physician, and one of three democrat physicians, serving in Congress. When the 113th Congress begins on Jan. 3, Dr. Ruiz said he will focus on physician payment reform as well as addressing disparities in income, healthcare, and education.
Unlike many congressional physicians – the majority of whom are Republicans – Dr. Ruiz said he wants to keep some Affordable Care Act provisions in place, while ensuring the health care workforce can support them. To find out more about Dr. Ruiz, check out our video.
Docs to Congress: SGR fix can't wait
The American Medical Association, the American College of Family Physicians, the American College of Physicians, the American College of Surgeons, and the American Osteopathic Association together met with more than a dozen lawmakers.
The American Medical Association, the American College of Family Physicians, the American College of Physicians, the American College of Surgeons, and the American Osteopathic Association together met with more than a dozen lawmakers.
The American Medical Association, the American College of Family Physicians, the American College of Physicians, the American College of Surgeons, and the American Osteopathic Association together met with more than a dozen lawmakers.

Rate This Column!
Our local Board of Registration in Medicine has a new requirement. To update a medical license, you have to take 3 hours of CME credit in opioid pain management, and another 2 hours in end-of-life issues. Fair enough. I prescribe OxyContin for my acne patients as often as the next dermatologist. As for end-of-life matters, a friend I told about the new regulation asked if I had many patients who wanted to end their lives. I said no, but I could think of a few patients who make me think about ending mine.
Anyhow, I took the courses as online webinars, featuring lecturers by academics from local medical institutions. Some of the information was likely to be helpful, at least for physicians in a position to use it often enough to remember it. Some was boilerplate, delivered in a monotone:
"As Sarkissian et al. found in a 2006 article published in the Journal of Annoying Interactions, 63% of patients seeking drugs may exhibit manipulative behavior." OK, thanks.
So you finish the webinar and take the post-module test. There are six questions, and you need to get four right. You pass. (Hooray!) Now you want to print out the CME certificate. But wait – first you have to take the Post Test Evaluation. So you click on the hyperlink, and there it is. The questions are in red, followed by open red circles. The first question is: How would you rate this presentation? 5 is Excellent, followed by Good, Fair, Poor, No Opinion, Not Applicable, and Nolo Contendere.
But here is the amazing part: 5 is already filled in! There’s a bright red circle staring you in the face. If you want to rate the presentation any way but Excellent, you have to change it by unclicking 5 and clicking a different circle.
In other words, they are not asking you to rate them Excellent. They are not telling you to rate them Excellent. They are doing it for you!
Surely, they must be kidding.
But they are not.
The other Evaluation questions range from irritating to inane:
• Did you find the presentation professional? (If you mark "No," you have to explain why. "I dunno, the shrink’s sport coat was kinda wrinkled.")
• Will it change your practice? (If you mark "Yes," you have to explain how. "I will not let patients manipulate me any more. Instead, I will hold my breath.")
• Did you find the presentation influenced by commercial considerations? ("Not really, except for the pop-up ads for methadone clinics.")
• Do you have any suggestions to improve future webinars? ("Maybe free opioid samples, so we can test out their half-lives for ourselves?")
So my by-default 5-ratings will be duly tabulated by little cyber-elves who live in statistical cyber-caverns, where they compile the data showing that the Massachusetts CME Consortium is indeed doing the Excellent Job that will entitle it to continue providing Continuing Education Courses of Excellence.
I don’t know how much any of this matters. Am I any smarter than I was before? Well, maybe in one way. Now I know what to do for myself:
Since you are reading this column, you have to rate it. The scale is from 1 to 5, with 5 being "Transcendent."
Please e-mail the editor of Skin & Allergy News. Tell her you want to give me a 6. Insist that she open a new category, so you can do it.
Never mind, I already told her, so we’re good.
You’re welcome, don’t mention it.
Dr. Rockoff practices dermatology in Brookline, Mass.

'Chemobrain' starts before chemotherapy in breast cancer study
SAN ANTONIO – The muddled thinking that sometimes affects breast cancer patients is manifested by decreased activity in a brain region that plays a key role in working memory, according to results of a functional imaging study.
"Chemobrain," as it’s sometimes known, appears even before chemotherapy starts, suggesting that more may be at play than a cognitive reaction to the medications, Bernadine Cimprich, Ph.D., reported at the annual San Antonio Breast Cancer Symposium.
The findings of her functional imaging study show a strong correlation between fatigue and decreased activation in the left inferior frontal gyrus.
There’s no question that chemotherapy agents can have cognitive effects, said Dr. Cimprich, an associate professor emeritus of nursing at the University of Michigan, Ann Arbor. "But even before treatment, we saw reduced function in the regions needed to perform this task."
Her prospective comparative study comprised 69 women with localized (stage 0-III) breast cancer, and 32 age-matched healthy controls. The patients were 24-34 days post surgery, but had not yet received either chemotherapy (29) or radiotherapy (37). All of the women reported their levels of fatigue.
Before and after treatment, the patients performed a verbal test of working memory while undergoing functional magnetic resonance brain imaging both before and after treatments. Each test had several difficulty levels. Patients also self-reported fatigue at both time points.
The patients were an average of 51 years old. Half of the chemotherapy group and 95% of the radiotherapy group had undergone a breast-conserving surgical procedure. The other half of the chemotherapy group had mastectomies.
The subjects performed the Verbal Working Memory Task during scanning. Following the scan, they completed the Attentional Function Index and the Functional Assessment of Cancer Therapy-Fatigue. The memory test involved three levels of difficulty, from low to high demand.
Compared with the radiotherapy and control groups, the chemotherapy group reported more fatigue at both time points, and performed significantly more poorly on the cognitive test at both time points (P less than .05). Greater fatigue in the chemotherapy group was positively associated with and correlated with poorer cognitive performance; the difference was significant in the post-treatment period (P = .03).
The radiotherapy group performed significantly better than the chemotherapy group, and significantly worse than the control group. Fatigue scores also fell between those of the chemotherapy group and the control group.
Imaging showed a positive correlation between poor cognitive performance and decreased activity in the left anterior frontal inferior gyrus. The score differences in the chemotherapy group "were mainly due to lower pretreatment activation in an area of the prefrontal cortex supporting working memory, the anatomical left inferior frontal gyrus, at the higher task demand," Dr. Cimprich said at a press briefing.
The level of inactivation in the region also significantly predicted the severity of fatigue in both treatment groups (P less than .01). The post-treatment imaging, conducted about 5 months after the baseline assessment, showed no differences in brain activation. However, those who had the lowest activation also had the highest post-treatment fatigue, she added.
"Women who were not able to activate this region suffered significantly greater fatigue after treatment, regardless of whether they received chemotherapy or radiotherapy," Dr. Cimprich said.
Dr. Cimprich had no financial disclosures. The study was supported by the National Institutes of Health and the National Institute of Nursing Research.
AT THE ANNUAL SAN ANTONIO BREAST CANCER SYMPOSIUM
Major Finding: Women scheduled to undergo chemotherapy after surgery for breast cancer were significantly more likely to show low brain activation in a task of working memory than other groups studied (P less than .05).
Data Source: A prospective, comparative study of 69 patients and 32 matched controls.
Disclosures: Dr. Cimprich had no financial disclosures. The study was supported by the National Institutes of Health and the National Institute of Nursing Research.

Hospital readmissions under attack
Readmissions after hospital discharge for acute myocardial infarction, heart failure, and pneumonia have now become major targets for proposed Medicare savings as part of the current budget tightening in Washington. Hospitals in the past have viewed readmissions either with disdain and disinterest or as a "cash cow."
Readmissions have been good business, as long as Medicare reimbursed hospitals for individual admissions no matter how long or short or how frequent. Readmissions are estimated to cost $17 billion annually. As Medicare costs continue to increase, the control of readmissions appears to be a good target for saving some money. As a result, Medicare levied a maximum reduction of 1% on payments last year on 307 of the nation’s hospitals that were deemed to have too many readmissions (New York Times, Nov. 26, 2012).
Readmissions for AMI and heart failure are among the most frequent hospital admissions and readmissions. Readmissions in cardiology have been an important outcome measure in clinical trials for the last half century. As mortality rates decreased over the years, rehospitalization became more important as clinicians realized its importance in the composite outcome measure of cost and benefit of new therapies. Two of the potential causes of readmission have been early discharge and the lack of postdischarge medical support. The urgency for early discharge for both heart failure and AMI has been driven largely by the misplaced emphasis on shorter hospital stays.
A recent international trial examined readmission rates as an outcome measure in patients who were treated with a percutaneous coronary intervention after an ST-elevation MI. According to that study, the readmission rate in the United States is almost twice that of European centers. Much of this increase was related to a shorter hospital stay in the United States that was half that of the European centers: 8 vs. 3 days (JAMA 2012;307:66-74).
In the last few years there has actually been a speed contest in some cardiology quarters to see how quickly patients can be discharged after a STEMI. As a result, a "drive through" mentality for percutaneous coronary intervention and AMI treatment has developed. Some of this has been generated by hospital administration, but with full participation by cardiologists. There appears to be little or no benefit to the short stay other than on the hospital bottom line. It now appears that, in the future, the financial benefit of this expedited care will be challenged.
Heart failure admissions suffer from similar expedited care. The duration of a hospital stay for heart failure decreased from 8.8 to 6.3 days between 1996 and 2006. Similar international disparity exists as observed with AMI. The rate of readmission in 30 days after discharge is estimated to be roughly 20%. The occurrence of readmission within 30 days is not just an abstract statistic and an inconvenience to patients but is associated with a mortality in the same period of 6.4%, which exceeded inpatient mortality (JAMA 2010;303;2141-7).
Many patients admitted with fluid overload leave the hospital on the same medication that they were taking prior to admission and at the same weight as at admission. Some of this is the result of undertreatment with diuretics, driven by misconceptions about serum creatinine levels, but in many situations patients may not even be weighed. Heart failure patients are often elderly who have significant concomitant disease and require careful in-hospital modification of heart failure therapy. Many of these elderly patients also require the institution of medical and social support prior to discharge.
Inner-city and referral hospitals indicate that they are being unfairly penalized by the nature of the demographic and severity of their patient mix. Some of this pushback is warranted. The "one size fits all" approach by Medicare may well require some modification in view of the variation in both the medical and social complexity. Some form of staging of severity and the need for outpatient nurse support needs to be considered.
Hospitals, nevertheless, are scrambling to respond to the Medicare threat and have begun to apply resources and innovation to solve this pressing issue. Cardiologists themselves also can have an important impact on the problem. We all need to slow down and spend some time dealing with the long-term solutions to short-term problems like acute heart failure and AMI.
Dr. Goldstein writes the column, "Heart of the Matter," which appears regularly in Cardiology News, a Frontline Medical Communications publication. He is professor of medicine at Wayne State University and division head emeritus of cardiovascular medicine at Henry Ford Hospital, both in Detroit. He is on data safety monitoring committees for the National Institutes of Health and several pharmaceutical companies.

Rate of pediatric caustic ingestion injuries quite low
The prevalence of caustic ingestion injuries among children and adolescents in the United States is quite low, estimated to be only 1.08 per 100,000 population, according to a report in the December issue of Archives of Otolaryngology and Head & Neck Surgery.
This represents a substantial decrease from figures widely stated in the literature, which are based on data from the 1970s and 1980s, when public health measures were first taken to reduce children’s exposure to lye and other caustics, said Dr. Christopher M. Johnson and Dr. Matthew T. Brigger of the department of otolaryngology, Naval Medical Center, San Diego.
"The burden of caustic ingestion injuries in children appears to have decreased over time, and past public health interventions appear to have been successful," Dr. Johnson and Dr. Brigger wrote.
They examined this issue in part because of the paucity of epidemiologic data regarding caustic ingestions. To assess the current public health burden of these pediatric injuries, they analyzed information in the Kids’ Inpatient Database (KID), a national resource maintained by the Agency for Healthcare Research and Quality, which collects nationally representative samples of all pediatric hospital discharges each year.
The researchers assessed KID data for 2009, when 3,407,146 pediatric hospitalizations were sampled.
Extrapolating the data to the entire U.S. population, the investigators estimated that there were 807 hospitalizations nationwide for caustic ingestion injuries among patients aged 0-18 years in 2009, for a prevalence of 1.08 per 100,000.
Previously published estimates ranged from 5,000 to 15,000 cases each year but were based on outdated data, the investigators noted (Arch. Otolaryngol. Head Neck Surg. 2012;138:1111-5).
Even though the actual prevalence of these injuries has dropped so precipitously, children with caustic ingestion injuries still accounted for more than $22 million in hospital charges and more than 3,300 inpatient days in 2009, they reported.
Approximately 60% of these ingestions occurred in children aged 4 years and younger. A second peak in prevalence occurred in the adolescent age group, presumably because of intentional ingestions in suicide attempts.
Only about half of all pediatric patients hospitalized for caustic ingestion underwent esophagoscopy in 2009. Since this procedure is recommended for all children with a "strongly suggestive" history as well as for those who are symptomatic, "a logical conclusion is that a large proportion of children are admitted to the hospital for observation, even if suspicion of significant injury is low," Dr. Johnson and Dr. Brigger said.
"We found a higher burden of injury in urban hospitals and in patients who lived in zip codes in the bottom quartile of median annual income in the United States. This finding is consistent with available pediatric poisoning data that indicate that low-income urban households are more likely to store dangerous household products improperly," they added.
No financial conflicts of interest were reported.
FROM ARCHIVES OF OTOLARYNGOLOGY AND HEAD & NECK SURGERY
Major Finding: There were an estimated 807 children and adolescents hospitalized nationwide for caustic ingestion injuries in 2009, for a prevalence of 1.08 per 100,000.
Data Source: An analysis of pediatric hospitalizations for caustic ingestion injuries using data from the Agency for Healthcare Research and Quality's Kids’ Inpatient Database.
Disclosures: No financial conflicts of interest were reported.
Laparoscopic diverticulitis surgery linked to fewer complications
PALM BEACH, FLA.– Using laparoscopic surgery for colectomy with primary anastomosis in patients with complicated diverticulitis linked with significantly fewer major complications compared with open surgical management in a review of more than 10,000 patients from a nationwide database.
However, the inherent biases at play when surgeons decide whether to manage a diverticulitis patient by a laparoscopic or open approach make it difficult to draw definitive conclusions from the findings, Dr. Edward E. Cornwell III said at the annual meeting of the Southern Surgical Association.

"If a surgeon did an operation laparoscopically, that by itself is an indicator of how sick the patient was. The surgeon selects an open operation for sicker patients, and laparoscopy for the less sick patients," he said in an interview. "Have we accounted for that difference [in the analysis]? That’s an open question," said Dr. Cornwell, professor and chairman of surgery at Howard University in Washington.
"Patients whom the surgeon deem well enough physiologically to sustain colectomy with primary anastomosis deserve strong consideration for the laparoscopic approach because those patients had the greatest difference in complications" compared with open surgery, he said.
The data Dr. Cornwell and his associates reviewed also showed a marked skewing in how surgeons used laparoscopy. Among the 10,085 patients included in the analysis, 7,562 (75%) underwent colectomy with primary anastomosis, and in this subgroup, 5,105 patients (68%) had their surgery done laparoscopically, while the remaining 2,457 (32%) were done with open surgery. In contrast, the 2,523 other patients in the series underwent a colectomy with colostomy, and within this subgroup, 2,286 patients (91%) had open surgery, with only 237 (9%) having laparoscopic surgery.
The overwhelming use of open surgery for the colostomy patients makes sense as it is a more complex operation, Dr. Cornwell said.
He and his associates used data collected during 2005-2009 at 237 U.S. hospitals by the National Surgical Quality Improvement Program of the American College of Surgeons on patients who underwent surgical management of complicated diverticulitis. The average age of the patients was 58 years, and overall 30-day mortality was 2%, while the overall postoperative complication rate during the 30 days following surgery was 23%.
Among the patients who underwent a primary anastomosis, the incidence of major complications during 30 days of follow-up was 13% in the open surgery patients and 6% in the laparoscopy patients, a statistically significant difference. Major complications included surgical site infections, dehiscence, transfusion, respiratory failure, sepsis, myocardial infarction, pulmonary embolism, stroke, renal failure or need for rehospitalization.
In a multivariate analysis that controlled for demographic parameters, body mass index, comorbidities, and functional status, patients who underwent laparoscopy had about half the number of total complications and major complications compared with patients who underwent open surgery – statistically significant differences. The laparoscopically-treated patients also had roughly half the rate of several individual major complications – wound infections, respiratory complications, and sepsis – compared with the open surgery patients, all statistically significant differences.
Thirty-day mortality was about 50% lower with laparoscopy compared with open surgery among patients who underwent a primary anastomosis, but this difference fell short of statistical significance.
The advantage of laparoscopy over open surgery was not nearly so clear among patients who underwent colectomy with colostomy. The data showed no significant difference between laparoscopy and open surgery in the rate of all major complications, although the number of major complications with laparoscopy was about 20% lower. The only individual complications significantly reduced in the laparoscopy group were wound infections, reduced by about 40% in the adjusted analysis, and respiratory complications, cut by about 50% by laparoscopy. The two surgical subgroups showed virtually no difference in 30-day mortality among patients who underwent a colectomy.
The results suggest that because of the broad reduction of major complications with laparoscopy, this approach "should be considered when primary anastomosis is deemed appropriate," Dr. Cornwell concluded.
Dr. Cornwell said that he had no disclosures.
This work falls somewhat short of actually comparing the efficacy of the laparoscopic approach and open surgery in patients with complicated diverticulitis. Without an adequate standardized description of the disease process itself, the patients’ comorbidities, and their physiologic perturbation at the time of presentation, it is exceedingly difficult to measure outcomes and the efficacy of therapeutic interventions.
I’m afraid the authors have not satisfactorily controlled for or analyzed the confounding factors so that plausible conclusions can be reached. The results are striking that mortality and complications were higher for patients treated with open surgery. I have watched the evolution of laparoscopic surgery over the past 25 years, and I am convinced that patients greatly benefit from this technology.
While the laparoscopic approach for treating diverticulitis resonates with my sensibility, the data do not support a clear recommendation. I urge surgeons to focus on this emergency, general-surgery population so that we can do important comparative effectiveness research and address some of these questions.
Dr. Michael F. Rotondo is professor and chairman of surgery at East Carolina University in Greenville, N.C. He had no disclosures. He made these comments as a designated discussant of the report.
PALM BEACH, FLA.– Using laparoscopic surgery for colectomy with primary anastomosis in patients with complicated diverticulitis linked with significantly fewer major complications compared with open surgical management in a review of more than 10,000 patients from a nationwide database.
However, the inherent biases at play when surgeons decide whether to manage a diverticulitis patient by a laparoscopic or open approach make it difficult to draw definitive conclusions from the findings, Dr. Edward E. Cornwell III said at the annual meeting of the Southern Surgical Association.
"If a surgeon did an operation laparoscopically, that by itself is an indicator of how sick the patient was. The surgeon selects an open operation for sicker patients, and laparoscopy for the less sick patients," he said in an interview. "Have we accounted for that difference [in the analysis]? That’s an open question," said Dr. Cornwell, professor and chairman of surgery at Howard University in Washington.
"Patients whom the surgeon deem well enough physiologically to sustain colectomy with primary anastomosis deserve strong consideration for the laparoscopic approach because those patients had the greatest difference in complications" compared with open surgery, he said.
The data Dr. Cornwell and his associates reviewed also showed a marked skewing in how surgeons used laparoscopy. Among the 10,085 patients included in the analysis, 7,562 (75%) underwent colectomy with primary anastomosis, and in this subgroup, 5,105 patients (68%) had their surgery done laparoscopically, while the remaining 2,457 (32%) were done with open surgery. In contrast, the 2,523 other patients in the series underwent a colectomy with colostomy, and within this subgroup, 2,286 patients (91%) had open surgery, with only 237 (9%) having laparoscopic surgery.
The overwhelming use of open surgery for the colostomy patients makes sense as it is a more complex operation, Dr. Cornwell said.
He and his associates used data collected during 2005-2009 at 237 U.S. hospitals by the National Surgical Quality Improvement Program of the American College of Surgeons on patients who underwent surgical management of complicated diverticulitis. The average age of the patients was 58 years, and overall 30-day mortality was 2%, while the overall postoperative complication rate during the 30 days following surgery was 23%.
Among the patients who underwent a primary anastomosis, the incidence of major complications during 30 days of follow-up was 13% in the open surgery patients and 6% in the laparoscopy patients, a statistically significant difference. Major complications included surgical site infections, dehiscence, transfusion, respiratory failure, sepsis, myocardial infarction, pulmonary embolism, stroke, renal failure or need for rehospitalization.
In a multivariate analysis that controlled for demographic parameters, body mass index, comorbidities, and functional status, patients who underwent laparoscopy had about half the number of total complications and major complications compared with patients who underwent open surgery – statistically significant differences. The laparoscopically-treated patients also had roughly half the rate of several individual major complications – wound infections, respiratory complications, and sepsis – compared with the open surgery patients, all statistically significant differences.
Thirty-day mortality was about 50% lower with laparoscopy compared with open surgery among patients who underwent a primary anastomosis, but this difference fell short of statistical significance.
The advantage of laparoscopy over open surgery was not nearly so clear among patients who underwent colectomy with colostomy. The data showed no significant difference between laparoscopy and open surgery in the rate of all major complications, although the number of major complications with laparoscopy was about 20% lower. The only individual complications significantly reduced in the laparoscopy group were wound infections, reduced by about 40% in the adjusted analysis, and respiratory complications, cut by about 50% by laparoscopy. The two surgical subgroups showed virtually no difference in 30-day mortality among patients who underwent a colectomy.
The results suggest that because of the broad reduction of major complications with laparoscopy, this approach "should be considered when primary anastomosis is deemed appropriate," Dr. Cornwell concluded.
Dr. Cornwell said that he had no disclosures.
AT THE ANNUAL MEETING OF THE SOUTHERN SURGICAL ASSOCIATION
Major Finding: Among patients who underwent a primary anastomosis, the incidence of major complications during 30 days of follow-up was 13% in the open surgery patients and 6% in the laparoscopy patients.
Data Source: From 10,085 U.S. patients who had surgery for acute management of complicated diverticulitis during 2005-2009.
Disclosures: Dr. Cornwell said he had no disclosures.
Chronic constipation may increase colorectal cancer risk
Chronic constipation may predispose affected patients to developing colorectal cancer and benign neoplasms, according to an analysis of data from a large retrospective U.S. claims database.
The risk of developing colorectal cancer was 1.78 times higher among 28,854 adults with chronic constipation than among 86,562 controls without chronic constipation, and the risk of developing benign neoplasms was 2.7 times higher in those with chronic constipation, Dr. Nicholas Talley reported in a poster at the annual meeting of the American College of Gastroenterology.
The risk of colorectal cancer and benign neoplasms among those with chronic constipation remained "consistently high" after researchers controlled for potential confounding factors, including age, gender, family history of malignancies, and other nongastrointestinal morbidities, said Dr. Talley of the University of Newcastle, Callaghan, New South Wales, Australia.
Patients included adults aged older than 18 years who received at least two diagnoses of chronic constipation 60-365 days apart between January 1999 and September 2011. Those with irritable bowel syndrome or diarrhea were excluded, as were those who did not remain enrolled in their health plans for at least 12 months from the date of their first eligible diagnosis of constipation.
The investigators matched control subjects, who had never been diagnosed with constipation and never had a prescription filled for a laxative during the observation period, with case patients in a 1:3 ratio based on year of birth, sex, and region of residence.
Patients and controls had a mean age of 61.9 years, and one-third were men. The mean observation period was nearly 4 years.
The prevalence of colorectal cancer in this study was 2.7% in the patients and 1.7% in the controls; the prevalence of benign neoplasms was 24.8% in the patients and 11.9% in the controls, Dr. Talley said.
Although the findings do not prove a causal link between chronic constipation and colorectal cancer or benign neoplasms, they do suggest a strong association, he said in a press statement.
"The postulated causal link is that longer transit times increase the duration of contact between the colonic mucosa and concentrated carcinogens such as bile acids in the lumen," he said.
This association deserves further investigation to more thoroughly explore and to better understand possible causal elements, he added.
This is particularly important because prospective cohort studies have failed to identify a similar association to that seen in this retrospective review, suggesting that those findings are affected by recall bias, he said.
While further study is needed, practitioners should be aware of the potential relationship between chronic constipation and development of colorectal cancer and benign neoplasms, and should monitor and treat patients accordingly, he concluded.
Dr. Talley received research support from Takeda Pharmaceuticals International, which supported the study. Coauthors were employed by Takeda or by Analysis Group Inc., which has received consulting fees from Takeda.
FROM THE ANNUAL MEETING OF THE AMERICAN COLLEGE OF GASTROENTEROLOGY
Major Finding: The risk of developing colorectal cancer was 1.78 times higher in 28,854 adults with chronic constipation than in 86,562 controls without chronic constipation, and the risk of developing benign neoplasms was 2.7 times higher in those with chronic constipation.
Data Source: A large retrospective U.S. claims database.
Disclosures: Dr. Talley received research support from Takeda Pharmaceuticals International, which supported the study. Coauthors were employed by Takeda or by Analysis Group Inc., which has received consulting fees from Takeda.