User login
COVID-19 and masks: Doctor, may I be excused?

In the last 2 months, at least 10 patients have asked Constantine George, MD, for a written medical exemption so they won’t have to wear a mask in public. Dr. George, the chief medical officer of Vedius, an app for a travelers’ concierge medical service in Las Vegas, turned them all down.
Elena Christofides, MD, an endocrinologist in Columbus, Ohio, has also refused patients’ requests for exemptions.
“It’s very rare for someone to need an exemption,” says Albert Rizzo, MD, chief medical officer for the American Lung Association and a lung specialist at ChristianaCare Health System in Newark, Del.
The opposition is sometimes strong. Recently, a video of Lenka Koloma of Laguna Niguel, Calif., who founded the antimask Freedom to Breathe Agency, went viral. She was in a California supermarket, maskless, telling an employee she was breaking the law by requiring patrons to wear masks.
“People need oxygen,” she said. “That alone is a medical condition.” Her webpage has a “Face Mask Exempt Card” that cites the Americans with Disabilities Act and posts a Department of Justice ADA violation reporting number. The DOJ issued a statement calling the cards fraudulent.
Figuring out if a patient’s request to opt out of wearing a mask is legitimate is a ‘’new frontier” for doctors, says Mical Raz, MD, a professor in public policy and health at the University of Rochester (N.Y.), and a hospitalist at the university medical center.
Should some people skip masks?
Experts say there are very few medical reasons for people to skip masks. “If you look at the research, patients with COPD [chronic obstructive pulmonary disorder], those with reactive airway, even those can breathe through a mask,” Dr. George said. Requests for exemptions due to medical reasons are usually without basis. “Obviously, if someone is incapacitated, for example, with mental health issues, that’s case by case.”
Dr. Christofides said one of her patients cited anxiety and the other cited headaches as reasons not to wear a mask. “I told the one who asked for anxiety [reasons] that she could wear ones that were less tight.” The patient with headaches told Dr. Christofides that she had a buildup of carbon dioxide in the mask because of industrial exposure. Baloney, Dr. Christofides told her.
Dr. Rizzo says one rare example of someone who can’t wear a mask might be a patient with an advanced lung condition so severe, they need extra oxygen. “These are the extreme patients where any change in oxygen and carbon dioxide could make a difference,” he said. But “that’s also the population that shouldn’t be going out in the first place.”
Dr. Raz cowrote a commentary about mask exemptions, saying doctors are faced with difficult decisions and must keep a delicate balance between public health and individual disability needs. “Inappropriate medical exemptions may inadvertently hasten viral spread and threaten public health,” she wrote.
In an interview, she says that some people do have a hard time tolerating a mask. “Probably the most common reasons are mental health issues, such as anxiety, panic and PTSD, and children with sensory processing disorders (making them oversensitive to their environment). I think there are very few pulmonary reasons.”
CDC, professional organization guidelines
The CDC says people should wear masks in public and when around people who don’t live in the same household. Beyond that, it simply says masks should not be worn by children under age 2, “or anyone who has trouble breathing, is unconscious, incapacitated, or otherwise unable to remove the mask without assistance.”
In mid-July, four professional organizations released a statement in response to the CDC recommendation for facial coverings. Jointly issued by the American College of Chest Physicians, the American Lung Association, the American Thoracic Society and the COPD Foundation, it states in part that people with normal lungs and “even many individuals with underlying chronic lung disease should be able to wear a non-N95 facial covering without affecting their oxygen or carbon dioxide levels.”
It acknowledges that some people will seek an exemption and doctors must weigh the patient’s concerns against the need to stop the spread of the virus. “In some instances, physician reassurance regarding the safety of the facial coverings may be all that is needed,” it states.
Addressing the excuses
Here are some of the common medical reasons people give for not being able to tolerate a mask:
Claustrophobia or anxiety. Dr. Raz and others suggests a “desensitizing” period, wearing the mask for longer and longer periods of time to get used to it. Parents could suggest kids wear a mask when doing something they like, such as watching television, so they equate it with something pleasant. Switching to a different kind of mask or one that fits better could also help.
Masks cause Legionnaires’ disease. Not true, experts say. Legionnaires’ is a severe form of pneumonia, the result of inhaling tiny water droplets with legionella bacteria.
It’s difficult to read lips. People can buy masks with a clear window that makes their mouth and lips visible.
Trouble breathing. Brief periods of mask use won’t have a bad effect on oxygen levels for most people.
“There is not an inherent right to be out in a pandemic with an unmasked face,” Dr. Raz says. But “you are entitled to an accommodation.” That might be using curbside pickup for food and medication. That requires much less time wearing a mask than entering a store would.
There are no “boilerplate” cards or letters to excuse people provided by the four organizations that addressed the issue, Dr. Rizzo said. If he were to write a letter asking for an exemption, he would personalize it for an individual patient’s medical condition. As to whether a state would honor it, he cannot say. The states have a patchwork of recommendations, making it difficult to say.
Dr. Rizzo tells lung disease patients who are able to go out that wearing a mask for 15-20 minutes to do an errand won’t harm their oxygen levels. And he reminds them that having an exemption, in the form of a doctor’s letter, may bring more problems. “Even with an exemption, someone may confront them” for their lack of a face covering. People with COPD have a higher risk of getting a severe illness from COVID-19, according to the CDC.
This article first appeared on WebMD.com.
NAFLD may predict arrhythmia recurrence post-AFib ablation
Increasingly recognized as an independent risk factor for new-onset atrial fibrillation (AFib), new research suggests for the first time that nonalcoholic fatty liver disease (NAFLD) also confers a higher risk for arrhythmia recurrence after AFib ablation.
Over 29 months of postablation follow-up, 56% of patients with NAFLD suffered bouts of arrhythmia, compared with 31% of patients without NAFLD, matched on the basis of age, sex, body mass index (BMI), ejection fraction within 5%, and AFib type (P < .0001).
The presence of NAFLD was an independent predictor of arrhythmia recurrence in multivariable analyses adjusted for several confounders, including hemoglobin A1c, BMI, and AFib type (hazard ratio, 3.0; 95% confidence interval, 1.94-4.68).
The association is concerning given that one in four adults in the United States has NAFLD, and up to 6.1 million Americans are estimated to have Afib. Previous studies, such as ARREST-AF and LEGACY, however, have demonstrated the benefits of aggressive preablation cardiometabolic risk factor modification on long-term AFib ablation success.
Indeed, none of the NAFLD patients in the present study who lost at least 10% of their body weight had recurrent arrhythmia, compared with 31% who lost less than 10%, and 91% who gained weight prior to ablation (P < .0001).
All 22 patients whose A1c increased during the 12 months prior to ablation had recurrent arrhythmia, compared with 36% of patients whose A1c improved (P < .0001).
“I don’t think the findings of the study were particularly surprising, given what we know. It’s just further reinforcement of the essential role of risk-factor modification,” lead author Eoin Donnellan, MD, Cleveland Clinic, said in an interview.
The results were published Augus 12 in JACC Clinical Electrophysiology.
For the study, the researchers examined data from 267 consecutive patients with a mean BMI of 32.7 kg/m2 who underwent radiofrequency ablation (98%) or cryoablation (2%) at the Cleveland Clinic between January 2013 and December 2017.
All patients were followed for at least 12 months after ablation and had scheduled clinic visits at 3, 6, and 12 months after pulmonary vein isolation, and annually thereafter.
NAFLD was diagnosed in 89 patients prior to ablation on the basis of CT imaging and abdominal ultrasound or MRI. On the basis of NAFLD-Fibrosis Score (NAFLD-FS), 13 patients had a low probability of liver fibrosis (F0-F2), 54 had an indeterminate probability, and 22 a high probability of fibrosis (F3-F4).
Compared with patients with no or early fibrosis (F0-F2), patients with advanced liver fibrosis (F3-F4) had almost a threefold increase in AFib recurrence (82% vs. 31%; P = .003).
“Cardiologists should make an effort to risk-stratify NAFLD patients either by NAFLD-FS or [an] alternative option, such as transient elastography or MR elastography, given these observations, rather than viewing it as either present or absence [sic] and involve expert multidisciplinary team care early in the clinical course of NAFLD patients with evidence of advanced fibrosis,” Dr. Donnellan and colleagues wrote.
Coauthor Thomas G. Cotter, MD, department of gastroenterology and hepatology, University of Chicago, said in an interview that cardiologists could use just the NAFLD-FS as part of an algorithm for an AFib.
“Because if it shows low risk, then it’s very, very likely the patient will be fine,” he said. “To use more advanced noninvasive testing, there are subtleties in the interpretation that would require referral to a liver doctor or a gastroenterologist and the cost of referring might bulk up the costs. But the NAFLD-FS is freely available and is a validated tool.”
Although it hasn’t specifically been validated in patients with AFib, the NAFLD-FS has been shown to correlate with the development of coronary artery disease (CAD) and was recommended for clinical use in U.S. multisociety guidelines for NAFLD.
The score is calculated using six readily available clinical variables (age, BMI, hyperglycemia or diabetes, AST/ALT, platelets, and albumin). It does not include family history or alcohol consumption, which should be carefully detailed given the large overlap between NAFLD and alcohol-related liver disease, Dr. Cotter observed.
Of note, the study excluded patients with alcohol consumption of more than 30 g/day in men and more than 20 g/day in women, chronic viral hepatitis, Wilson’s disease, and hereditary hemochromatosis.
Finally, CT imaging revealed that epicardial fat volume (EFV) was greater in patients with NAFLD than in those without NAFLD (248 vs. 223 mL; P = .01).
Although increased amounts of epicardial fat have been associated with CAD, there was no significant difference in EFV between patients who did and did not develop recurrent arrhythmia (238 vs. 229 mL; P = .5). Nor was EFV associated with arrhythmia recurrence on Cox proportional hazards analysis (HR, 1.001; P = .17).
“We hypothesized that the increased risk of arrhythmia recurrence may be mediated in part by an increased epicardial fat volume,” Dr. Donnellan said. “The existing literature exploring the link between epicardial fat volume and A[Fib] burden and recurrence is conflicting. But in both this study and our bariatric surgery study, epicardial fat volume was not a significant predictor of arrhythmia recurrence on multivariable analysis.”
It’s likely that the increased recurrence risk is caused by several mechanisms, including NAFLD’s deleterious impact on cardiac structure and function, the bidirectional relationship between NAFLD and sleep apnea, and transcription of proinflammatory cytokines and low-grade systemic inflammation, he suggested.
“Patients with NAFLD represent a particularly high-risk population for arrhythmia recurrence. NAFLD is a reversible disease, and a multidisciplinary approach incorporating dietary and lifestyle interventions should by instituted prior to ablation,” Dr. Donnellan and colleagues concluded.
They noted that serial abdominal imaging to assess for preablation changes in NAFLD was limited in patients and that only 56% of control subjects underwent dedicated abdominal imaging to rule out hepatic steatosis. Also, the heterogeneity of imaging modalities used to diagnose NAFLD may have influenced the results and the study’s single-center, retrospective design limits their generalizability.
The authors reported having no relevant financial relationships.
A version of this article originally appeared on Medscape.com.
Risk stratification key in acute pulmonary embolism
All intermediate-risk pulmonary embolism is not the same, Victor F. Tapson, MD, declared at HM20 Virtual, hosted by the Society of Hospital Medicine.
This additional classification is worthwhile because it has important treatment implications.
Patients with intermediate- to low-risk PE, along with those who have truly low-risk PE, require anticoagulation only. In contrast, patients with intermediate- to high-risk PE are at increased risk of decompensation. They have a much higher in-hospital mortality than those with intermediate- to low-risk PE. So hospitalists may want to consult their hospitals’ PE response team (PERT), if there is one, or whoever on staff is involved in helping make decisions about the appropriateness of more aggressive interventions, such as catheter-directed thrombolysis or catheter-directed clot extraction, said Dr. Tapson, director of the venous thromboembolism and pulmonary vascular disease research program at Cedars-Sinai Medical Center in Los Angeles.
“We don’t have evidence of any real proven mortality difference yet in the intermediate-high risk PE group by being more aggressive. I think if the right patients were studied we could see a mortality difference. But one thing I’ve noted is that by being more aggressive – in a cautious manner, in selected patients – we clearly shorten the hospital stay by doing catheter-directed therapy in some of these folks. It saves money,” he observed.
Once the diagnosis of PE is confirmed, the first priority is to get anticoagulation started in all patients with an acceptable bleeding risk, since there is convincing evidence that anticoagulation reduces mortality in PE. The 2019 European Society of Cardiology guidelines recommend a direct-acting oral anticoagulant over warfarin on the basis of persuasive evidence of lower risk of major bleeding coupled with equal or better effectiveness in preventing recurrent PE.
Dr. Tapson said it’s worthwhile for hospitalists to take a close look at these European guidelines (Eur Respir J. 2019 Oct 9. doi: 10.1183/13993003.01647-2019).
“I think our Europeans friends did a really nice job with those guidelines. They’re great guidelines, better than many of the others out there. I think they’re very, very usable,” he said. “I took part in the ACCP [American College of Chest Physicians] guidelines for years. I think they’re very rigorous in terms of the evidence base, but because they’re so rigorous there’s just tons of 2C recommendations, which are basically suggestions. The ESC guidelines are more robust.”
Risk stratification
Once anticoagulation is on board, the next task is risk stratification to determine the need for more aggressive therapy. A high-risk PE is best defined hemodynamically as one causing a systolic blood pressure below 90 mm Hg for at least 15 minutes. The term “high risk” is increasingly replacing “massive” PE, because the size of the clot doesn’t necessarily correlate with its hemodynamic impact.
An intermediate-risk PE is marked by a simplified Pulmonary Embolism Severity Index (sPESI) score of 1 or more, right ventricular dysfunction on echocardiography or CT angiography, or an elevated cardiac troponin level.
The sPESI is a validated, user-friendly tool that grants 1 point each for age over 80, background cardiopulmonary disease, a systolic blood pressure below 100 mm Hg, cancer, a heart rate of 110 bpm or more, and an oxygen saturation level below 90%.
“All you really need to know about a patient’s sPESI score is: Is it more than zero?” he explained.
Indeed, patients with an sPESI score of 0 have a 30-day mortality of 1%. With a score of 1 or more, however, that risk jumps to 10.9%.
No scoring system is 100% accurate, though, and Dr. Tapson emphasized that clinician gestalt plays an important role in PE risk stratification. In terms of clinical indicators of risk, he pays special attention to heart rate.
“I think if I had to pick the one thing that drives my decision the most about whether someone needs more aggressive therapy than anticoagulation, it’s probably heart rate,” he said. “If the heart rate is 70, the patient is probably very stable. Of course, that might not hold up in a patient with conduction problems or who is on a beta blocker, but in general if I see someone who looks good, has a relatively small PE, and a low heart rate, it makes me feel much better. If the heart rate is 130 or 120, I’m much more concerned.”
Both the European guidelines and the PERT Consortium guidelines on the diagnosis, treatment, and follow-up of acute PE (Clin Appl Thromb Hemost. 2019 Jun 17. doi: 10.1177/1076029619853037), which Dr. Tapson coauthored, recommend substratifying intermediate-risk PE into intermediate to low or intermediate to high risk. It’s a straightforward matter: If a patient has either right ventricular dysfunction on imaging or an elevated cardiac troponin, that’s an intermediate- to low-risk PE warranting anticoagulation only. On the other hand, if both right ventricular dysfunction and an elevated troponin are present, the patient has an intermediate- to high-risk PE. Since this distinction translates to a difference in outcome, a consultation with PERT or an experienced PE interventionalist is in order for the intermediate- to high-risk PE, he said.
Dr. Tapson reported receiving research funding from Bayer, Bristol-Myers Squibb, Janssen, BiO2, EKOS/BTG, and Daiichi. He is also a consultant to Janssen and BiO2, and on speakers’ bureaus for EKOS/BTG and Janssen.
FROM HM20 VIRTUAL
PHM20 Virtual: Common incidental findings seen on pediatric imaging
PHM20 session title
The Incidentaloma: Common Incidental Findings Seen on Pediatric Imaging
Presenters
Jill Azok, MD; Amanda Lansell, MD; Allayne Stephans, MD; and Erin Frank, MD
Session summary
Dr. Azok, Dr. Lansell, and Dr. Frank of University Hospitals Rainbow Babies & Children’s Hospital, Cleveland, described one to three common, incidentally noted findings in central nervous system, thoracic, abdominopelvic, and musculoskeletal imaging. The presenters explained the indications for further work-up and/or intervention of these findings, and the importance of judicious use of imaging in pediatric patients.

Dr. Frank discussed incidental findings seen on imaging of the central nervous system, using cases to focus on benign enlargement of the subarachnoid space, lipomas of the filum terminale, and pituitary abnormalities. Dr. Lansell continued by discussing possible clinical models for management of incidentally found pulmonary nodules and renal cysts. Dr. Azok completed the session with a discussion of the appearance and management of nonossifying fibromas and cortical fibrous defects. Common threads shared by all presenters were how frequent incidental findings are and the need for providers to be comfortable with a level of uncertainty.
Key takeaways
- Incidental findings are very common in pediatric imaging, occurring on up to one-third of CT scans, 25% of brain MRIs, and 21% of knee radiographs.
- An infant with personal and family history of macrocephaly, normal development, and increased extra-axial CSF on MRI likely has benign enlargement of the arachnoid space and does not need further evaluation.
- A hyperintensity of filum terminale on MRI is consistent with lipoma of the filum terminale and does not require follow-up unless symptoms of tethered cord are present.
- Pituitary abnormalities are common and call for dedicated history, physical exam, and an endocrine screening with imaging surveillance if screening is normal.
- Patient history and appearance of pulmonary nodules are important in determining appropriate follow-up.
- No single feature of renal lesions predicts future behavior, but larger lesions deserve more work-up.
- Nonossifying fibromas are well-demarcated intracortical radiolucencies of long bone metaphyses that do not require treatment or further evaluation unless they are large, painful, or occur in the proximal femur.
Dr. Miller is a second-year pediatric hospital medicine fellow at Cleveland Clinic Children’s. His academic interests include medical education, quality improvement, and high value care.
PHM20 session title
The Incidentaloma: Common Incidental Findings Seen on Pediatric Imaging
Presenters
Jill Azok, MD; Amanda Lansell, MD; Allayne Stephans, MD; and Erin Frank, MD
Session summary
Dr. Azok, Dr. Lansell, and Dr. Frank of University Hospitals Rainbow Babies & Children’s Hospital, Cleveland, described one to three common, incidentally noted findings in central nervous system, thoracic, abdominopelvic, and musculoskeletal imaging. The presenters explained the indications for further work-up and/or intervention of these findings, and the importance of judicious use of imaging in pediatric patients.
Dr. Frank discussed incidental findings seen on imaging of the central nervous system, using cases to focus on benign enlargement of the subarachnoid space, lipomas of the filum terminale, and pituitary abnormalities. Dr. Lansell continued by discussing possible clinical models for management of incidentally found pulmonary nodules and renal cysts. Dr. Azok completed the session with a discussion of the appearance and management of nonossifying fibromas and cortical fibrous defects. Common threads shared by all presenters were how frequent incidental findings are and the need for providers to be comfortable with a level of uncertainty.
Key takeaways
- Incidental findings are very common in pediatric imaging, occurring on up to one-third of CT scans, 25% of brain MRIs, and 21% of knee radiographs.
- An infant with personal and family history of macrocephaly, normal development, and increased extra-axial CSF on MRI likely has benign enlargement of the arachnoid space and does not need further evaluation.
- A hyperintensity of filum terminale on MRI is consistent with lipoma of the filum terminale and does not require follow-up unless symptoms of tethered cord are present.
- Pituitary abnormalities are common and call for dedicated history, physical exam, and an endocrine screening with imaging surveillance if screening is normal.
- Patient history and appearance of pulmonary nodules are important in determining appropriate follow-up.
- No single feature of renal lesions predicts future behavior, but larger lesions deserve more work-up.
- Nonossifying fibromas are well-demarcated intracortical radiolucencies of long bone metaphyses that do not require treatment or further evaluation unless they are large, painful, or occur in the proximal femur.
Dr. Miller is a second-year pediatric hospital medicine fellow at Cleveland Clinic Children’s. His academic interests include medical education, quality improvement, and high value care.
A ‘foolproof’ way to diagnose narrow complex tachycardias on EKGs
A hospitalist looking at an EKG showing a narrow complex tachycardia needs to be able to come up with an accurate diagnosis of the rhythm pronto. And hospitalist Meghan Mary Walsh, MD, MPH, has developed a simple and efficient method for doing so within a minute or two that she’s used with great success on the wards and in teaching medical students and residents for nearly a decade.
she promised at HM20 Virtual, hosted by the Society of Hospital Medicine.
Her method involves asking three questions about the 12-lead EKG:
1) What’s the rate?
A narrow complex tachycardia by definition needs to be both narrow and fast, with a QRS complex of less than 0.12 seconds and a heart rate above 100 bpm. Knowing how far above 100 bpm the rate is will help with the differential diagnosis.
2) Is the rhythm regular or irregular?
“If I put the EKG 10 feet away from you, you should still be able to look at it and say the QRS is either systematically marching out – boom, boom, boom – or there is an irregular sea of QRS complexes where the RR intervals are variable and inconsistent,” said Dr. Walsh, a hospitalist at the University of Minnesota, Minneapolis, and chief academic officer at Hennepin Healthcare, where she oversees all medical students and residents training in the health system.
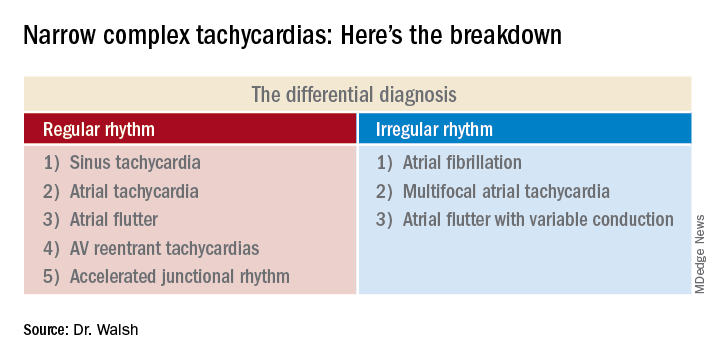
This distinction between a regular and irregular rhythm immediately narrows the differential by dividing the diagnostic possibilities into two columns (See chart). She urged her audience to commit the list to memory or keep it handy on their cell phone or in a notebook.
“If it’s irregular I’m going down the right column; if it’s regular I’m going down the left. And then I’m systematically running the drill,” she explained.
3) Are upright p waves present before each QRS complex in leads II and V1?
This information rules out some of the eight items in the differential diagnosis and rules in others.
Narrow complex tachycardias with an irregular rhythm
There are only three:
Atrial fibrillation: The heart rate is typically 110-160 bpm, although it can occasionally go higher. The rhythm is irregularly irregular: No two RR intervals on the EKG are exactly the same. And there are no p waves.
“If it’s faster than 100 bpm, irregularly irregular, and no p waves, the conclusion is very simple: It’s AFib,” Dr. Walsh said.
Multifocal atrial tachycardia (MAT): The heart rate is generally 100-150 bpm but can sometimes climb to about 180 bpm. The PP, PR, and RR intervals are varied, inconsistent, and don’t repeat. Most importantly, there are three or more different p wave morphologies in the same lead. One p wave might look like a tall mountain peak, another could be short and flat, and perhaps the next is big and broad.
MAT often occurs in patients with a structurally abnormal atrium – for example, in the setting of pulmonary hypertension leading to right atrial enlargement, with resultant depolarization occurring all over the atrium.
“Don’t confuse MAT with AFib: One has p waves, one does not. Otherwise they can look very similar,” she said.
Atrial flutter with variable conduction: A hallmark of this reentrant tachycardia is the atrial flutter waves occurring at about 300 bpm between each QRS complex.
“On board renewal exams, the question is often asked, ‘Which leads are the best identifiers of atrial flutter?’ And the answer is the inferior leads II, III, and aVF,” she said.
Another classic feature of atrial flutter with variable conduction is cluster beating attributable to a varied ventricular response. This results in a repeated pattern of irregular RR intervals: There might be a 2:1 block in AV conduction for several beats, then maybe a 4:1 block for several more, with resultant lengthening of the RR interval, then 3:1, with shortening of RR. This regularly irregular sequence is repeated throughout the EKG.
“Look for a pattern amidst the chaos,” the hospitalist advised.
The heart rate might be roughly 150 bpm with a 2:1 block, or 100 bpm with a 3:1 block. The p waves in atrial flutter with variable conduction can be either negatively or positively deflected.
Narrow complex tachycardias with a regular rhythm*
Sinus tachycardia: The heart rate is typically less than 160 bpm, the QRS complexes show a regular pattern, and upright p waves are clearly visible in leads II and V1.
The distinguishing feature of this arrhythmia is the ramping up and ramping down of the heart rate. The tachycardia is typically less than 160 bpm. But the rate doesn’t suddenly jump from, say, 70 to140 bpm in a flash while the patient is lying in the hospital bed. A trip to the telemetry room for a look at the telemetry strip will tell the tale: The heart rate will have progressively ramped up from 70, to 80, then 90, then 100, 110, 120, 130, to perhaps 140 bpm. And then it will similarly ramp back down in stages, with the up/down pattern being repeated.
Sinus tachycardia is generally a reflection of underlying significant systemic illness, such as sepsis, hypotension, or anemia.
Atrial tachycardia: The heart rate is generally 100-140 bpm, and p waves are present. But unlike in sinus tachycardia, the patient with atrial tachycardia lying in bed with a heart rate of 140 bpm is not in a state of profound neurohormonal activation and is not all that sick.
Another diagnostic clue is provided by a look at the telemonitoring strip. Unlike in sinus tachycardia, where the heart rate ramps up and then back down repeatedly, in atrial tachycardia the heart rate very quickly ramps up in stages to, say, 140 bpm, and then hangs there.
Atrial flutter: This is the only narrow complex tachycardia that appears in both the regular and irregular rhythm columns. It belongs in the irregular rhythm column when there is variable conduction and cluster beating, with a regularly irregular pattern of RR intervals. In contrast, when atrial flutter is in the regular rhythm column, it’s because the atrioventricular node is steadily conducting the atrial depolarizations at a rate of about 300 bpm. So there’s no cluster beating. As in atrial flutter with variable conduction, the flutter waves are visible most often in leads II, III, and aVF, where they can be either positively or negatively deflected.
AV reentrant tachycardias: These reentrant tachycardias can take two forms. In atrioventricular nodal reentrant tachycardia (AVnRT), the aberrant pathway is found entirely within the AV node, whereas in atrioventricular reentrant tachycardia (AVRT) the aberrant pathway is found outside the AV node. AVnRT is more common than AVRT. As in atrial flutter, there is no ramp up in heart rate. Patients will be lying in their hospital bed with a heart rate of, say, 80 bpm, and then suddenly it jumps to 180, 200, or even as high as 240 bpm “almost in a split second,” Dr. Walsh said.
No other narrow complex tachycardia reaches so high a heart rate. In both of these reentrant tachycardias the p waves are often buried in the QRS complex and can be tough to see. It’s very difficult to differentiate AVnRT from AVRT except by an electrophysiologic study.
Accelerated junctional tachycardia: This is most commonly the slowest of the narrow complex tachycardias, with a heart rate of less than 120 bpm.
“In the case of accelerated junctional tachycardia, think slow, think ‘regular,’ think of a rate often just over 100, usually with p waves after the QRS that are inverted because there’s retrograde conduction,” she advised.
She reported having no financial conflicts of interest regarding her presentation.
Correction, 8/19/20: An earlier version of this article mischaracterized the type of rhythm noted in this subhead.
A hospitalist looking at an EKG showing a narrow complex tachycardia needs to be able to come up with an accurate diagnosis of the rhythm pronto. And hospitalist Meghan Mary Walsh, MD, MPH, has developed a simple and efficient method for doing so within a minute or two that she’s used with great success on the wards and in teaching medical students and residents for nearly a decade.
she promised at HM20 Virtual, hosted by the Society of Hospital Medicine.
Her method involves asking three questions about the 12-lead EKG:
1) What’s the rate?
A narrow complex tachycardia by definition needs to be both narrow and fast, with a QRS complex of less than 0.12 seconds and a heart rate above 100 bpm. Knowing how far above 100 bpm the rate is will help with the differential diagnosis.
2) Is the rhythm regular or irregular?
“If I put the EKG 10 feet away from you, you should still be able to look at it and say the QRS is either systematically marching out – boom, boom, boom – or there is an irregular sea of QRS complexes where the RR intervals are variable and inconsistent,” said Dr. Walsh, a hospitalist at the University of Minnesota, Minneapolis, and chief academic officer at Hennepin Healthcare, where she oversees all medical students and residents training in the health system.
This distinction between a regular and irregular rhythm immediately narrows the differential by dividing the diagnostic possibilities into two columns (See chart). She urged her audience to commit the list to memory or keep it handy on their cell phone or in a notebook.
“If it’s irregular I’m going down the right column; if it’s regular I’m going down the left. And then I’m systematically running the drill,” she explained.
3) Are upright p waves present before each QRS complex in leads II and V1?
This information rules out some of the eight items in the differential diagnosis and rules in others.
Narrow complex tachycardias with an irregular rhythm
There are only three:
Atrial fibrillation: The heart rate is typically 110-160 bpm, although it can occasionally go higher. The rhythm is irregularly irregular: No two RR intervals on the EKG are exactly the same. And there are no p waves.
“If it’s faster than 100 bpm, irregularly irregular, and no p waves, the conclusion is very simple: It’s AFib,” Dr. Walsh said.
Multifocal atrial tachycardia (MAT): The heart rate is generally 100-150 bpm but can sometimes climb to about 180 bpm. The PP, PR, and RR intervals are varied, inconsistent, and don’t repeat. Most importantly, there are three or more different p wave morphologies in the same lead. One p wave might look like a tall mountain peak, another could be short and flat, and perhaps the next is big and broad.
MAT often occurs in patients with a structurally abnormal atrium – for example, in the setting of pulmonary hypertension leading to right atrial enlargement, with resultant depolarization occurring all over the atrium.
“Don’t confuse MAT with AFib: One has p waves, one does not. Otherwise they can look very similar,” she said.
Atrial flutter with variable conduction: A hallmark of this reentrant tachycardia is the atrial flutter waves occurring at about 300 bpm between each QRS complex.
“On board renewal exams, the question is often asked, ‘Which leads are the best identifiers of atrial flutter?’ And the answer is the inferior leads II, III, and aVF,” she said.
Another classic feature of atrial flutter with variable conduction is cluster beating attributable to a varied ventricular response. This results in a repeated pattern of irregular RR intervals: There might be a 2:1 block in AV conduction for several beats, then maybe a 4:1 block for several more, with resultant lengthening of the RR interval, then 3:1, with shortening of RR. This regularly irregular sequence is repeated throughout the EKG.
“Look for a pattern amidst the chaos,” the hospitalist advised.
The heart rate might be roughly 150 bpm with a 2:1 block, or 100 bpm with a 3:1 block. The p waves in atrial flutter with variable conduction can be either negatively or positively deflected.
Narrow complex tachycardias with a regular rhythm*
Sinus tachycardia: The heart rate is typically less than 160 bpm, the QRS complexes show a regular pattern, and upright p waves are clearly visible in leads II and V1.
The distinguishing feature of this arrhythmia is the ramping up and ramping down of the heart rate. The tachycardia is typically less than 160 bpm. But the rate doesn’t suddenly jump from, say, 70 to140 bpm in a flash while the patient is lying in the hospital bed. A trip to the telemetry room for a look at the telemetry strip will tell the tale: The heart rate will have progressively ramped up from 70, to 80, then 90, then 100, 110, 120, 130, to perhaps 140 bpm. And then it will similarly ramp back down in stages, with the up/down pattern being repeated.
Sinus tachycardia is generally a reflection of underlying significant systemic illness, such as sepsis, hypotension, or anemia.
Atrial tachycardia: The heart rate is generally 100-140 bpm, and p waves are present. But unlike in sinus tachycardia, the patient with atrial tachycardia lying in bed with a heart rate of 140 bpm is not in a state of profound neurohormonal activation and is not all that sick.
Another diagnostic clue is provided by a look at the telemonitoring strip. Unlike in sinus tachycardia, where the heart rate ramps up and then back down repeatedly, in atrial tachycardia the heart rate very quickly ramps up in stages to, say, 140 bpm, and then hangs there.
Atrial flutter: This is the only narrow complex tachycardia that appears in both the regular and irregular rhythm columns. It belongs in the irregular rhythm column when there is variable conduction and cluster beating, with a regularly irregular pattern of RR intervals. In contrast, when atrial flutter is in the regular rhythm column, it’s because the atrioventricular node is steadily conducting the atrial depolarizations at a rate of about 300 bpm. So there’s no cluster beating. As in atrial flutter with variable conduction, the flutter waves are visible most often in leads II, III, and aVF, where they can be either positively or negatively deflected.
AV reentrant tachycardias: These reentrant tachycardias can take two forms. In atrioventricular nodal reentrant tachycardia (AVnRT), the aberrant pathway is found entirely within the AV node, whereas in atrioventricular reentrant tachycardia (AVRT) the aberrant pathway is found outside the AV node. AVnRT is more common than AVRT. As in atrial flutter, there is no ramp up in heart rate. Patients will be lying in their hospital bed with a heart rate of, say, 80 bpm, and then suddenly it jumps to 180, 200, or even as high as 240 bpm “almost in a split second,” Dr. Walsh said.
No other narrow complex tachycardia reaches so high a heart rate. In both of these reentrant tachycardias the p waves are often buried in the QRS complex and can be tough to see. It’s very difficult to differentiate AVnRT from AVRT except by an electrophysiologic study.
Accelerated junctional tachycardia: This is most commonly the slowest of the narrow complex tachycardias, with a heart rate of less than 120 bpm.
“In the case of accelerated junctional tachycardia, think slow, think ‘regular,’ think of a rate often just over 100, usually with p waves after the QRS that are inverted because there’s retrograde conduction,” she advised.
She reported having no financial conflicts of interest regarding her presentation.
Correction, 8/19/20: An earlier version of this article mischaracterized the type of rhythm noted in this subhead.
FROM HM20 VIRTUAL
Determining cause of skin lesions in COVID-19 patients remains challenging
published in the Journal of the American Academy of Dermatology.
SARS-CoV-2 infection has been associated with a range of skin conditions, wrote Antonio Martinez-Lopez, MD, of Virgen de las Nieves University Hospital, Granada, Spain, and colleagues, who provided an overview of the cutaneous side effects associated with drugs used to treat COVID-19 infection.
“Cutaneous manifestations have recently been described in patients with the new coronavirus infection, similar to cutaneous involvement occurring in common viral infections,” they said. Infected individuals have experienced maculopapular eruption, pseudo-chilblain lesions, urticaria, monomorphic disseminated vesicular lesions, acral vesicular-pustulous lesions, and livedo or necrosis, they noted.
Diagnosing skin manifestations in patients with COVID-19 remains a challenge, because it is unclear whether the skin lesions are related to the virus, the authors said. “Skin diseases not related to coronavirus, other seasonal viral infections, and drug reactions should be considered in the differential diagnosis, especially in those patients suffering from nonspecific manifestations such as urticaria or maculopapular eruptions,” they wrote.
However, “urticarial lesions and maculopapular eruptions in SARS-CoV-2 infections usually appear at the same time as the systemic symptoms, while drug adverse reactions are likely to arise hours to days after the start of the treatment,” they said.
The reviewers noted several cutaneous side effects associated with several of the often-prescribed drugs for COVID-19 infection. The antimalarials hydroxychloroquine and chloroquine had been authorized for COVID-19 treatment by the Food and Drug Administration, but this emergency authorization was rescinded in June. They noted that up to 11.5% of patients on these drugs may experience cutaneous adverse effects, including some that “can be mistaken for skin manifestations of SARS-CoV-2, especially those with maculopapular rash or exanthematous reactions.” Another side effect is exacerbation of psoriasis, which has been described in patients with COVID-19, the authors said.
The oral antiretroviral combination lopinavir/ritonavir, under investigation in clinical trials for COVID-19, has been associated with skin rashes in as many as 5% of adults in HIV studies. Usually appearing after treatment is started, the maculopapular pruritic rash is “usually well tolerated,” they said, although there have been reports of Stevens-Johnson syndrome. Alopecia areata is among the other side effects reported.
Remdesivir also has been authorized for emergency treatment of COVID-19, and the small amount of data available suggest that cutaneous manifestations may be infrequent, the reviewers said. In a recent study of 53 patients treated with remdesivir for 10 days, approximately 8% developed a rash, but the study did not include any information “about rash morphology, distribution, or timeline in relation to remdesivir that may help clinicians differentiate from cutaneous manifestations of COVID-19,” they said.
Other potential treatments for complications of COVID-19 include imatinib, tocilizumab, anakinra, immunoglobulins, corticosteroids, colchicine, and low molecular weight heparins; all have the potential for association with skin reactions, but data on skin manifestations associated with COVID-19 are limited, the authors wrote.
Notably, data on the use of systemic corticosteroids for COVID-19 patients are controversial, although preliminary data showed some reduced mortality in COVID-19 patients who were on respiratory support, they noted. “With regard to differential diagnosis of cutaneous manifestations of COVID-19, the vascular fragility associated with corticosteroid use, especially in elderly patients, may be similar to the thrombotic complications of COVID-19 infection.”
Knowledge about the virology of COVID-19 continues to evolve rapidly, and the number of drugs being studied as treatments continues to expand, the authors pointed out.
“By considering adverse drug reactions in the differential diagnosis, dermatologists can be useful in assisting in the care of these patients,” they wrote. Drugs, rather than the infection, may be the cause of skin reactions in some COVID-19 patients, and “management is often symptomatic, but it is sometimes necessary to modify or discontinue the treatment, and some conditions can even be life-threatening,” they concluded.
The study received no outside funding. The researchers had no financial conflicts to disclose.
SOURCE: Martinez-Lopez A et al. J Am Acad Dermatol. 2020 doi: 10.1016/j.jaad.2020.08.006.
FROM THE JOURNAL OF THE AMERICAN ACADEMY OF DERMATOLOGY
Since COVID-19 onset, admissions for MI are down, mortality rates are up
A substantial decrease in hospital admissions for acute MI was accompanied by a rise in mortality, particularly for ST-segment elevation MI (STEMI), following the onset of the COVID-19 pandemic, according to a cross-sectional retrospective study.

Although it can’t be confirmed from these results that the observed increase in in-hospital acute MI (AMI) mortality are related to delays in seeking treatment, this is a reasonable working hypothesis until more is known, commented Harlan Krumholz, MD, who was not involved in the study.
The analysis, derived from data collected at 49 centers in a hospital system spread across six states, supports previous reports that patients with AMI were avoiding hospitalization, according to the investigators, who were led by Tyler J. Gluckman, MD, medical director of the Center for Cardiovascular Analytics, Providence Heart Institute, Portland, Ore.
When compared with a nearly 14-month period that preceded the COVID-19 pandemic, the rate of AMI-associated hospitalization fell by 19 cases per week (95% confidence interval, –29.0 to –9.0 cases) in the early COVID-19 period, which was defined by the investigators as spanning from Feb. 23, 2020 to March 28, 2020.
The case rate per week then increased by 10.5 (95% CI, 4.6-16.5 cases) in a subsequent 8-week period spanning between March 29, 2020, and May 16, 2020. Although a substantial increase from the early COVID-19 period, the case rate remained below the baseline established before COVID-19.
The analysis looked at 15,244 AMI hospitalizations among 14,724 patients treated in the Providence St. Joseph Hospital System, which has facilities in Alaska, California, Montana, Oregon, Texas, and Washington. The 1,915 AMI cases captured from Feb. 23, 2020, represented 13% of the total.
Differences in mortality, patients, treatment
In the early period, the ratio of observed-to-expected (O/E) mortality relative to the pre–COVID-19 baseline increased by 27% (odds ratio, 1.27; 95% CI, 1.07-1.48). When STEMI was analyzed separately, the O/E mortality was nearly double that of the baseline period (OR, 1.96; 95% CI, 1.22-2.70). In the latter post–COVID-19 period of observation, the overall increase in AMI-associated mortality on the basis of an O/E ratio was no longer significant relative to the baseline period (OR, 1.23; 95% CI, 0.98-1.47). However, the relative increase in STEMI-associated mortality on an O/E basis was even greater (OR, 2.40; 95% CI, 1.65-3.16) in the second COVID-19 period analyzed. Even after risk adjustment, the OR for STEMI mortality remained significantly elevated relative to baseline (1.52; 95% CI, 1.02-2.26).
The differences in AMI patients treated before the onset of the COVID-19 pandemic and those treated afterwards might be relevant, according to the investigators. Specifically, patients hospitalized after Feb. 23, 2020 were 1-3 years younger (P < .001) depending on type of AMI, and more likely to be Asian (P = .01).
The length of stay was 6 hours shorter in the early COVID-19 period and 7 hours shorter in the latter period relative to baseline, but an analysis of treatment approaches to non-STEMI and STEMI during the COVID-19 pandemic were not found to be significantly different from baseline.
Prior to the COVID-19 pandemic, 79% of STEMI patients and 77% of non-STEMI patients were discharged home, which was significantly lower than in the early COVID-19 period, when 83% (P = .02) of STEMI and 81% (P = .006) of non-STEMI patients were discharged home. In the latter period, discharge to home care was also significantly higher than in the baseline period.
More than fear of COVID-19?
One theory to account for the reduction in AMI hospitalizations and the increase in AMI-related mortality is the possibility that patients were slow to seek care at acute care hospitals because of concern about COVID-19 infection, according to Dr. Gluckman and coinvestigators.
“Given the time-sensitive nature of STEMI, any delay by patients, emergency medical services, the emergency department, or cardiac catheterization laboratory may have played a role,” they suggested.
In an interview, Dr. Gluckman said that further effort to identify the reasons for the increased AMI-related mortality is planned. Pulling data from the electronic medical records of the patients included in this retrospective analysis might be a “challenge,” but Dr. Gluckman reported that he and his coinvestigators plan to look at a different set of registry data that might provide information on sources of delay, particularly in the STEMI population.
“This includes looking at a number of time factors, such as symptom onset to first medical contact, first medical contact to device, and door-in-door-out times,” Dr. Gluckman said. The goal is to “better understand if delays [in treatment] occurred during the pandemic and, if so, how they may have contributed to increases in risk adjusted mortality.”
Dr. Krumholz, director of the Yale Center for Outcomes Research and Evaluation, New Haven, Conn., called this study a “useful” confirmation of changes in AMI-related care with the onset of the COVID-19 pandemic. As reported anecdotally, the study “indicates marked decreases in hospitalizations of patients with AMI even in areas that were not experiencing big outbreaks but did have some restrictions to limit spread,” he noted.
More data gathered by other centers might provide information about what it all means.
“There remain so many questions about what happened and what consequences accrued,” Dr. Krumholz observed. “In the meantime, we need to continue to send the message that people with symptoms that suggest a heart attack need to rapidly seek care.”
The investigators reported having no financial conflicts of interest.
SOURCE: Gluckman TJ et al. JAMA Cardiol. 2020 Aug 7. doi: 10.1001/jamacardio.2020.3629.
A substantial decrease in hospital admissions for acute MI was accompanied by a rise in mortality, particularly for ST-segment elevation MI (STEMI), following the onset of the COVID-19 pandemic, according to a cross-sectional retrospective study.
Although it can’t be confirmed from these results that the observed increase in in-hospital acute MI (AMI) mortality are related to delays in seeking treatment, this is a reasonable working hypothesis until more is known, commented Harlan Krumholz, MD, who was not involved in the study.
The analysis, derived from data collected at 49 centers in a hospital system spread across six states, supports previous reports that patients with AMI were avoiding hospitalization, according to the investigators, who were led by Tyler J. Gluckman, MD, medical director of the Center for Cardiovascular Analytics, Providence Heart Institute, Portland, Ore.
When compared with a nearly 14-month period that preceded the COVID-19 pandemic, the rate of AMI-associated hospitalization fell by 19 cases per week (95% confidence interval, –29.0 to –9.0 cases) in the early COVID-19 period, which was defined by the investigators as spanning from Feb. 23, 2020 to March 28, 2020.
The case rate per week then increased by 10.5 (95% CI, 4.6-16.5 cases) in a subsequent 8-week period spanning between March 29, 2020, and May 16, 2020. Although a substantial increase from the early COVID-19 period, the case rate remained below the baseline established before COVID-19.
The analysis looked at 15,244 AMI hospitalizations among 14,724 patients treated in the Providence St. Joseph Hospital System, which has facilities in Alaska, California, Montana, Oregon, Texas, and Washington. The 1,915 AMI cases captured from Feb. 23, 2020, represented 13% of the total.
Differences in mortality, patients, treatment
In the early period, the ratio of observed-to-expected (O/E) mortality relative to the pre–COVID-19 baseline increased by 27% (odds ratio, 1.27; 95% CI, 1.07-1.48). When STEMI was analyzed separately, the O/E mortality was nearly double that of the baseline period (OR, 1.96; 95% CI, 1.22-2.70). In the latter post–COVID-19 period of observation, the overall increase in AMI-associated mortality on the basis of an O/E ratio was no longer significant relative to the baseline period (OR, 1.23; 95% CI, 0.98-1.47). However, the relative increase in STEMI-associated mortality on an O/E basis was even greater (OR, 2.40; 95% CI, 1.65-3.16) in the second COVID-19 period analyzed. Even after risk adjustment, the OR for STEMI mortality remained significantly elevated relative to baseline (1.52; 95% CI, 1.02-2.26).
The differences in AMI patients treated before the onset of the COVID-19 pandemic and those treated afterwards might be relevant, according to the investigators. Specifically, patients hospitalized after Feb. 23, 2020 were 1-3 years younger (P < .001) depending on type of AMI, and more likely to be Asian (P = .01).
The length of stay was 6 hours shorter in the early COVID-19 period and 7 hours shorter in the latter period relative to baseline, but an analysis of treatment approaches to non-STEMI and STEMI during the COVID-19 pandemic were not found to be significantly different from baseline.
Prior to the COVID-19 pandemic, 79% of STEMI patients and 77% of non-STEMI patients were discharged home, which was significantly lower than in the early COVID-19 period, when 83% (P = .02) of STEMI and 81% (P = .006) of non-STEMI patients were discharged home. In the latter period, discharge to home care was also significantly higher than in the baseline period.
More than fear of COVID-19?
One theory to account for the reduction in AMI hospitalizations and the increase in AMI-related mortality is the possibility that patients were slow to seek care at acute care hospitals because of concern about COVID-19 infection, according to Dr. Gluckman and coinvestigators.
“Given the time-sensitive nature of STEMI, any delay by patients, emergency medical services, the emergency department, or cardiac catheterization laboratory may have played a role,” they suggested.
In an interview, Dr. Gluckman said that further effort to identify the reasons for the increased AMI-related mortality is planned. Pulling data from the electronic medical records of the patients included in this retrospective analysis might be a “challenge,” but Dr. Gluckman reported that he and his coinvestigators plan to look at a different set of registry data that might provide information on sources of delay, particularly in the STEMI population.
“This includes looking at a number of time factors, such as symptom onset to first medical contact, first medical contact to device, and door-in-door-out times,” Dr. Gluckman said. The goal is to “better understand if delays [in treatment] occurred during the pandemic and, if so, how they may have contributed to increases in risk adjusted mortality.”
Dr. Krumholz, director of the Yale Center for Outcomes Research and Evaluation, New Haven, Conn., called this study a “useful” confirmation of changes in AMI-related care with the onset of the COVID-19 pandemic. As reported anecdotally, the study “indicates marked decreases in hospitalizations of patients with AMI even in areas that were not experiencing big outbreaks but did have some restrictions to limit spread,” he noted.
More data gathered by other centers might provide information about what it all means.
“There remain so many questions about what happened and what consequences accrued,” Dr. Krumholz observed. “In the meantime, we need to continue to send the message that people with symptoms that suggest a heart attack need to rapidly seek care.”
The investigators reported having no financial conflicts of interest.
SOURCE: Gluckman TJ et al. JAMA Cardiol. 2020 Aug 7. doi: 10.1001/jamacardio.2020.3629.
FROM JAMA CARDIOLOGY
Cancer treatments bring concerns for hospitalists
Advances in cancer treatment have brought a range of potential issues hospitalists are likely to see in admitted patients – many of which can escalate quickly into life-threatening emergencies if they’re not handled properly, an oncologist said in a presentation at HM20 Virtual, hosted by the Society of Hospital Medicine.

Checkpoint inhibitors and CAR T-cell therapy – revolutions in fighting cancer but potential instigators of serious side effects because of the way they set the immune system in motion – can have consequences throughout the body, said Megan Kruse, MD, an oncologist at the Cleveland Clinic.
Checkpoint inhibitors, which cause the body to essentially take its foot off the break of the immune system, in particular have diverse effects, Dr. Kruse said.
“Suffice it to say that any odd symptom in any organ system in a patient on immunotherapy, or with a history of immunotherapy, can be cause for concern,” she said. Most common are skin, gut, endocrine, lung, and musculoskeletal involvement. Cardiovascular, hematologic, renal, neurologic, and ophthalmological effects are less common, but when they happen, they’re often dramatic and need urgent management.
With these medications –which include anti–programmed death-1 agents pembrolizumab and nivolumab and anti–PD-ligand 1 agents atezolizumab and avelumab, among others – rash is often seen first, followed by diarrhea and colitis. Hypophysitis, which requires intervention, and liver toxicity, which usually tapers off on its own, often occur about 6-8 weeks into treatment. There are no rigid rules for the arrival of these symptoms, however, Dr. Kruse said.
“We must have a high index of suspicion. ... They really can occur at any point after a patient has had even one dose of an immunologic agent,” she said.
In more serious cases, steroids are typically the go-to treatment, she added, because they will quickly tamp down the immune activation brought on by the medications.
“When these drugs first came out, we were all very concerned about adding steroids,” she said. “In follow-up studies, it actually looks like we don’t attenuate the anticancer response very much by instituting steroids when clinically appropriate. And so you all should feel very comfortable adding steroids while waiting to talk to oncology.”
In these cases, the steroid taper is done very slowly, over weeks or even months.
With CAR T-cell therapy – in which patients receive T cells to target liquid tumors – cytokine release syndrome (CRS) can occur, often within 14 days after treatment. Dr. Kruse cautioned that it can present with symptoms similar to tumor lysis syndrome or sepsis.
“Patients are at a high risk of bacterial infection, so antibiotics are advised,” she said.
In these cases, fever is often a harbinger, often arriving at least a day before the rest of the symptoms of CRS.
Early treatment with the interleukin-6 inhibitor tocilizumab is recommended for these patients, she said. This agent has been shown to have a 69% response rate in severe CRS and has no known effect on the efficacy of the CAR T-cell treatment.
Dr. Kruse also touched on several other conditions that can rise to the level of emergencies in cancer treatment:
- In cases of neutropenic fever, patients should be treated as soon as possible with antibiotics, and some solid-tumor patients at lower risk can be treated as outpatients, she said. Those with hematologic cancer, however, will need inpatient care.
- For tumor lysis syndrome with renal failure, fluids should be started quickly. Rasburicase, a recombinant urate oxidase enzyme, can be considered in some cases, but requires caution.
- In cases of spinal cord compression, a full spine MRI should be completed because about a third of patients have multilevel involvement. Steroids should be started as soon as possible.
In a question-and-answer session, much of the discussion focused on when outpatient care for neutropenic fever was possible. Dr. Kruse said those who need to be admitted for neutropenic fever treatment tend to be those with hematologic malignancies because their treatment is so myelosuppressive.
“Their window of complications is longer,” she said. Solid tumor patients, on the other hand, will usually improve “fairly rapidly” in about 3-4 days.
Many session viewers expressed surprise at the possibility of outpatient neutropenic fever treatment. Dr. Kruse said that the Cleveland Clinic’s incorporation of this approach has included the input of neutropenic fever risk index scoring into their electronic medical record and a good deal of in-service training.
Asked about appropriate swabbing of patients for COVID-19 before chemotherapy, Dr. Kruse said that her center screens only patients who need to be hospitalized for the treatment – those with a high incidence of prolonged neutropenia.
“For our typical outpatients who are receiving chemotherapy,” she said, “we are not swabbing them.” But they have intense fever screening and distance measures in place.
Dr. Kruse reported advisory board involvement for Novartis Oncology and consulting for Puma Biotechnology.
Advances in cancer treatment have brought a range of potential issues hospitalists are likely to see in admitted patients – many of which can escalate quickly into life-threatening emergencies if they’re not handled properly, an oncologist said in a presentation at HM20 Virtual, hosted by the Society of Hospital Medicine.
Checkpoint inhibitors and CAR T-cell therapy – revolutions in fighting cancer but potential instigators of serious side effects because of the way they set the immune system in motion – can have consequences throughout the body, said Megan Kruse, MD, an oncologist at the Cleveland Clinic.
Checkpoint inhibitors, which cause the body to essentially take its foot off the break of the immune system, in particular have diverse effects, Dr. Kruse said.
“Suffice it to say that any odd symptom in any organ system in a patient on immunotherapy, or with a history of immunotherapy, can be cause for concern,” she said. Most common are skin, gut, endocrine, lung, and musculoskeletal involvement. Cardiovascular, hematologic, renal, neurologic, and ophthalmological effects are less common, but when they happen, they’re often dramatic and need urgent management.
With these medications –which include anti–programmed death-1 agents pembrolizumab and nivolumab and anti–PD-ligand 1 agents atezolizumab and avelumab, among others – rash is often seen first, followed by diarrhea and colitis. Hypophysitis, which requires intervention, and liver toxicity, which usually tapers off on its own, often occur about 6-8 weeks into treatment. There are no rigid rules for the arrival of these symptoms, however, Dr. Kruse said.
“We must have a high index of suspicion. ... They really can occur at any point after a patient has had even one dose of an immunologic agent,” she said.
In more serious cases, steroids are typically the go-to treatment, she added, because they will quickly tamp down the immune activation brought on by the medications.
“When these drugs first came out, we were all very concerned about adding steroids,” she said. “In follow-up studies, it actually looks like we don’t attenuate the anticancer response very much by instituting steroids when clinically appropriate. And so you all should feel very comfortable adding steroids while waiting to talk to oncology.”
In these cases, the steroid taper is done very slowly, over weeks or even months.
With CAR T-cell therapy – in which patients receive T cells to target liquid tumors – cytokine release syndrome (CRS) can occur, often within 14 days after treatment. Dr. Kruse cautioned that it can present with symptoms similar to tumor lysis syndrome or sepsis.
“Patients are at a high risk of bacterial infection, so antibiotics are advised,” she said.
In these cases, fever is often a harbinger, often arriving at least a day before the rest of the symptoms of CRS.
Early treatment with the interleukin-6 inhibitor tocilizumab is recommended for these patients, she said. This agent has been shown to have a 69% response rate in severe CRS and has no known effect on the efficacy of the CAR T-cell treatment.
Dr. Kruse also touched on several other conditions that can rise to the level of emergencies in cancer treatment:
- In cases of neutropenic fever, patients should be treated as soon as possible with antibiotics, and some solid-tumor patients at lower risk can be treated as outpatients, she said. Those with hematologic cancer, however, will need inpatient care.
- For tumor lysis syndrome with renal failure, fluids should be started quickly. Rasburicase, a recombinant urate oxidase enzyme, can be considered in some cases, but requires caution.
- In cases of spinal cord compression, a full spine MRI should be completed because about a third of patients have multilevel involvement. Steroids should be started as soon as possible.
In a question-and-answer session, much of the discussion focused on when outpatient care for neutropenic fever was possible. Dr. Kruse said those who need to be admitted for neutropenic fever treatment tend to be those with hematologic malignancies because their treatment is so myelosuppressive.
“Their window of complications is longer,” she said. Solid tumor patients, on the other hand, will usually improve “fairly rapidly” in about 3-4 days.
Many session viewers expressed surprise at the possibility of outpatient neutropenic fever treatment. Dr. Kruse said that the Cleveland Clinic’s incorporation of this approach has included the input of neutropenic fever risk index scoring into their electronic medical record and a good deal of in-service training.
Asked about appropriate swabbing of patients for COVID-19 before chemotherapy, Dr. Kruse said that her center screens only patients who need to be hospitalized for the treatment – those with a high incidence of prolonged neutropenia.
“For our typical outpatients who are receiving chemotherapy,” she said, “we are not swabbing them.” But they have intense fever screening and distance measures in place.
Dr. Kruse reported advisory board involvement for Novartis Oncology and consulting for Puma Biotechnology.
FROM HM20 VIRTUAL
COVID-19/heart connection: What hospitalists need to know
The heart-related manifestations of COVID-19 are a serious matter, but no one should make the mistake of thinking of COVID-19 as primarily a cardiac disease, according to Jeffrey C. Trost, MD, a cardiologist at Johns Hopkins University, Baltimore.
he said in offering a preview of his upcoming clinical update at HM20 Virtual, hosted by the Society of Hospital Medicine.
For this reason, in his clinical update talk, titled “COVID-19 and the Heart: What Every Hospitalist Should Know,” he’ll urge hospitalists to be conservative in ordering cardiac biomarker tests such troponin and natriuretic peptide levels. The focus should appropriately be on the subset of COVID-19 patients having the same symptoms suggestive of acute coronary syndrome, heart failure, or new-onset cardiomyopathy that would trigger laboratory testing in non–COVID-19 patients.
“Be more selective. Definitely do not routinely monitor troponin or [N-terminal of the prohormone brain natriuretic peptide] in patients just because they have COVID-19. A lot of patients with COVID-19 have these labs drawn, especially in the emergency department. We see a high signal-to-noise ratio: not infrequently the values are abnormal, and yet we don’t really know what that means,” said Dr. Trost, who is also director of the cardiac catheterization laboratory at Johns Hopkins Bayview Medical Center.
COVID-19 patients with preexisting heart disease are clearly at increased risk of severe forms of the infectious illness. In his talk, Dr. Trost will review the epidemiology of this association. He’ll also discuss the varied cardiac manifestations of COVID-19, consisting of myocarditis or other forms of new-onset cardiomyopathy, acute coronary syndrome, heart failure, and arrhythmias.
Many questions regarding COVID-19 and the heart remain unanswered for now, such as the mechanism and long-term implications of the phenomenon of ST-elevation acute coronary syndrome with chest pain in the presence of unobstructed coronary arteries, which Dr. Trost and others have encountered. Or the extent to which COVID-19–associated myocarditis is directly virus mediated as opposed to an autoimmune process.
“We’re relying completely on case reports at this point,” according to the cardiologist.
But one major issue has, thankfully, been put to rest on the basis of persuasive evidence which Dr. Trost plans to highlight: Millions of patients on ACE inhibitors or angiotensin receptor blockers can now rest assured that taking those medications doesn’t place them at increased risk of becoming infected with the novel coronavirus or, if infected, developing severe complications of COVID-19. Earlier in the pandemic that had been a legitimate theoretic concern based upon a plausible mechanism.
“I think we as physicians can now confidently say that we don’t need to stop these medicines in folks,” Dr. Trost said.
COVID-19 and the Heart: What Every Hospitalist Should Know
Live Q&A: Wednesday, Aug. 19, 3:30 p.m. to 4:30 p.m. ET
‘Doubling down’ on hydroxychloroquine QT prolongation in COVID-19
A new analysis from Michigan’s largest health system provides sobering verification of the risks for QT interval prolongation in COVID-19 patients treated with hydroxychloroquine and azithromycin (HCQ/AZM).
One in five patients (21%) had a corrected QT (QTc) interval of at least 500 msec, a value that increases the risk for torsade de pointes in the general population and at which cardiovascular leaders have suggested withholding HCQ/AZM in COVID-19 patients.
“One of the most striking findings was when we looked at the other drugs being administered to these patients; 61% were being administered drugs that had QT-prolonging effects concomitantly with the HCQ and AZM therapy. So they were inadvertently doubling down on the QT-prolonging effects of these drugs,” senior author David E. Haines, MD, director of the Heart Rhythm Center at William Beaumont Hospital, Royal Oak, Mich., said in an interview.
A total of 34 medications overlapped with HCQ/AZM therapy are known or suspected to increase the risk for torsade de pointes, a potentially life-threatening ventricular tachycardia. The most common of these were propofol coadministered in 123 patients, ondansetron in 114, dexmedetomidine in 54, haloperidol in 44, amiodarone in 43, and tramadol in 26.
“This speaks to the medical complexity of this patient population, but also suggests inadequate awareness of the QT-prolonging effects of many common medications,” the researchers say.
The study was published Aug. 5 in JACC Clinical Electrophysiology.
Both hydroxychloroquine and azithromycin increase the risk for QTc-interval prolongation by blocking the KCHN2-encoded hERG potassium channel. Several reports have linked the drugs to a triggering of QT prolongation in patients with COVID-19.
For the present study, Dr. Haines and colleagues examined data from 586 consecutive patients admitted with COVID-19 to the Beaumont Hospitals in Royal Oak and Troy, Mich., between March 13 and April 6. A baseline QTc interval was measured with 12-lead ECG prior to treatment initiation with hydroxychloroquine 400 mg twice daily for two doses, then 200 mg twice daily for 4 days, and azithromycin 500 mg once followed by 250 mg daily for 4 days.
Because of limited availability at the time, lead II ECG telemetry monitoring over the 5-day course of HCQ/AZM was recommended only in patients with baseline QTc intervals of at least 440 msec.
Patients without an interpretable baseline ECG or available telemetry/ECG monitoring for at least 1 day were also excluded, leaving 415 patients (mean age, 64 years; 45% female) in the study population. More than half (52%) were Black, 52% had hypertension, 30% had diabetes, and 14% had cancer.
As seen in previous studies, the QTc interval increased progressively and significantly after the administration of HCQ/AZM, from 443 msec to 473 msec.
The average time to maximum QTc was 2.9 days in a subset of 135 patients with QTc measurements prior to starting therapy and on days 1 through 5.
In multivariate analysis, independent predictors of a potentially hazardous QTc interval of at least 500 msec were:
- Age older than 65 years (odds ratio, 3.0; 95% confidence interval, 1.62-5.54).
- History of (OR, 4.65; 95% CI, 2.01-10.74).
- Admission of at least 1.5 mg/dL (OR, 2.22; 95% CI, 1.28-3.84).
- Peak troponin I level above 0.04 mg/mL (OR, 3.89; 95% CI, 2.22-6.83).
- Body mass index below 30 kg/m2 (OR for a BMI of 30 kg/m2 or higher, 0.45; 95% CI, 0.26-0.78).
Concomitant use of drugs with known risk for torsade de pointes was a significant risk factor in univariate analysis (OR, 1.73; P = .036), but fell out in the multivariate model.
No patients experienced high-grade arrhythmias during the study. In all, 112 of the 586 patients died during hospitalization, including 85 (21%) of the 415 study patients.
The change in QTc interval from baseline was greater in patients who died. Despite this, the only independent predictor of mortality was older age. One possible explanation is that the decision to monitor patients with baseline QTc intervals of at least 440 msec may have skewed the study population toward people with moderate or slightly long QTc intervals prior to the initiation of HCQ/AZM, Dr. Haines suggested. Monitoring and treatment duration were short, and clinicians also likely adjusted medications when excess QTc prolongation was observed.
Although it’s been months since data collection was completed in April, and the paper was written in record-breaking time, the study “is still very relevant because the drug is still out there,” observed Dr. Haines. “Even though it may not be used in as widespread a fashion as it had been when we first submitted the paper, it is still being used routinely by many hospitals and many practitioners.”
The use of hydroxychloroquine is “going through the roof” because of COVID-19, commented Dhanunjaya Lakkireddy, MD, medical director for the Kansas City Heart Rhythm Institute, HCA Midwest Health, Overland Park, Kan., who was not involved in the study.
“This study is very relevant, and I’m glad they shared their experience, and it’s pretty consistent with the data presented by other people. The question of whether hydroxychloroquine helps people with COVID is up for debate, but there is more evidence today that it is not as helpful as it was 3 months ago,” said Dr. Lakkireddy, who is also chair of the American College of Cardiology Electrophysiology Council.
He expressed concern for patients who may be taking HCQ with other medications that have QT-prolonging effects, and for the lack of long-term protocols in place for the drug.
In the coming weeks, however, the ACC and rheumatology leaders will be publishing an expert consensus statement that addresses key issues, such as how to best to use HCQ, maintenance HCQ, electrolyte monitoring, the optimal timing of electrocardiography and cardiac magnetic imaging, and symptoms to look for if cardiac involvement is suspected, Dr. Lakkireddy said.
Asked whether HCQ and AZM should be used in COVID-19 patients, Dr. Haines said in an interview that the “QT-prolonging effects are real, the arrhythmogenic potential is real, and the benefit to patients is nil or marginal. So I think that use of these drugs is appropriate and reasonable if it is done in a setting of a controlled trial, and I support that. But the routine use of these drugs probably is not warranted based on the data that we have available.”
Still, hydroxychloroquine continues to be dragged into the spotlight in recent days as an effective treatment for COVID-19, despite discredited research and the U.S. Food and Drug Administration’s June 15 revocation of its emergency-use authorization to allow use of HCQ and chloroquine to treat certain hospitalized COVID-19 patients.
“The unfortunate politicization of this issue has really muddied the waters because the general public doesn’t know what to believe or who to believe. The fact that treatment for a disease as serious as COVID should be modulated by political affiliation is just crazy to me,” said Dr. Haines. “We should be using the best science and taking careful observations, and whatever the recommendations derived from that should be uniformly adopted by everybody, irrespective of your political affiliation.”
Dr. Haines has received honoraria from Biosense Webster, Farapulse, and Sagentia, and is a consultant for Affera, Boston Scientific, Integer, Medtronic, Philips Healthcare, and Zoll. Dr. Lakkireddy has served as a consultant to Abbott, Biosense Webster, Biotronik, Boston Scientific, and Medtronic.
A version of this article originally appeared on Medscape.com.