User login
Time-restricted eating may reduce CVD risk after breast cancer
, a single-group feasibility study suggests.
The results show a 15% relative decline in cardiovascular risk, measured using the Framingham Risk Score, among at-risk breast cancer survivors (BCS) after only 8 weeks of following a time-restricted eating regimen, reported Amy A. Kirkham, PhD, assistant professor of kinesiology and physical education, University of Toronto, and colleagues.
“Time-restricted eating also significantly decreased visceral adipose tissue (VAT), which our team has previously found to accumulate rapidly with cardiotoxic treatment and predict later cardiac events among BCS,” the researchers add.
The findings were published online in the Journal of the American College of Cardiology: Cardiac Onco.
Physical activity is one of the main modalities for lowering cardiovascular risk, but it is not feasible for everyone because of physical limitations and other factors, noted Dr. Kirkham.
“I became interested in time-restricted eating when I came across the literature, which has really exploded in the last 5 years, showing that it can reduce the number of cardiovascular risk factors,” she said in an interview.
“However, most of these populations studied have had cardiometabolic conditions, like obesity, type 2 diabetes, prediabetes, and metabolic syndrome, and no one has looked at this” in either the population specifically at high risk for cardiovascular disease or in patients with overt cardiovascular disease, she said.
This approach is easy for patients to follow and is much simpler than many of the other dietary patterns, noted Dr. Kirkham. “It simply consists of having a start time or end time to your eating, so it is easy to prescribe,” she said. “You can see how that is much easier for a doctor to explain to a patient than trying to explain how to meet the physical activity guidelines each week.”
“This particular study definitely shows that time-restricted eating can decrease the calorie intake, and I think by decreasing the calorie intake you definitely would improve the body weight, which has numerous benefits irrespective of how we arrive at the end goal which is including the cardiovascular risk factors,” said Ajay Vallakati, MBBS, physician and clinical assistant professor of internal medicine, the Ohio State University, Columbus, commenting on the study.
“I think time-restricted eating is a tool we should look at, and a bigger study would help us to recommend this for our patients,” Dr. Vallakati told this news organization.
The study involved 22 participants. Mean age was 66 years. Mean body mass index was 31 ± 5 kg/m². In the cohort, 91% of participants were taking aromatase inhibitors and tamoxifen at the time of the study, and 50% underwent left-sided radiation.
The study group included breast cancer survivors who had risk factors for cardiovascular disease mortality, including completion of cardiotoxic therapy, like anthracyclines, within 1-6 years, obesity/overweight, and older age, defined as 60 years of age or older.
Participants were allowed to eat freely between 12 PM and 8 PM on weekdays and any time during weekends. Outside of the allotted hours, they could only drink black coffee, water, or black tea for the 8-week study period. They were not under any other physical activity or dietary restrictions.
All were provided with behavioral support, such as check-in phone calls with the research team at 1-, 3-, and 6-week follow-up and pre-interventional calls from a registered dietitian. During weekdays, they also received automated text messages twice a day asking what time they started and stopped eating.
Irritability and headaches were among the transient, minor symptoms reported, the researchers say. The study group responded to nearly all of the text messages that they received from the researchers. The participants also followed through with the fast for a median 98% of the prescribed days by fasting for 16 or more hours.
The results showed that after 8 weeks, median Framingham cardiovascular risk declined from 10.9% to 8.6%, a 15% relative reduction (P = .037). Modifiable aspects of Framingham, such as systolic blood pressure, total cholesterol, and high-density lipoprotein, remained relatively consistent overall, however, suggesting variation between individuals in the etiology of the risk decline.
Caloric intake fell by a median of 450 kcal, representing a relative reduction of about 22% (P < .001), they note.
The findings also showed a decline in median derived whole-body fat mass (–0.9 kg; P = .046), body mass (–1.0 kg; P = .025), and mean MRI-derived VAT (–5%; P = .009).
Other data showed that the average BMI remained the same (P = .10).
At the beginning of the study, 68% of the cohort was considered cardiometabolically unhealthy, given the benchmarks for pharmacologic preventive therapy of cardiovascular risk or metabolic syndrome based on Canadian Cardiovascular Society recommendations.
Notably, 53% of the cohort was no longer classified as meeting the criteria for metabolic syndrome or for the therapeutic treatment of cardiovascular risk after the intervention.
The study’s limitations include its short duration, selection bias, and that it did not involve a control group, the researchers acknowledge.
“Randomized controlled trials are needed to confirm these findings and to evaluate the health benefits, including potential health care cost savings and safety of longer-term time-restricted eating,” the researchers conclude.
Dr. Vallakati and Dr. Kirkham report no relevant conflicts of interest.
A version of this article first appeared on Medscape.com.
FROM THE JOURNAL OF THE AMERICAN COLLEGE OF CARDIOLOGY: CARDIAC ONCO
A Quantification Method to Compare the Value of Surgery and Palliative Care in Patients With Complex Cardiac Disease: A Concept
From the Department of Cardiothoracic Surgery, Stanford University, Stanford, CA.
Abstract
Complex cardiac patients are often referred for surgery or palliative care based on the risk of perioperative mortality. This decision ignores factors such as quality of life or duration of life in either surgery or the palliative path. Here, we propose a model to numerically assess and compare the value of surgery vs palliation. This model includes quality and duration of life, as well as risk of perioperative mortality, and involves a patient’s preferences in the decision-making process.
For each pathway, surgery or palliative care, a value is calculated and compared to a normal life value (no disease symptoms and normal life expectancy). The formula is adjusted for the risk of operative mortality. The model produces a ratio of the value of surgery to the value of palliative care that signifies the superiority of one or another. This model calculation presents an objective estimated numerical value to compare the value of surgery and palliative care. It can be applied to every decision-making process before surgery. In general, if a procedure has the potential to significantly extend life in a patient who otherwise has a very short life expectancy with palliation only, performing high-risk surgery would be a reasonable option. A model that provides a numerical value for surgery vs palliative care and includes quality and duration of life in each pathway could be a useful tool for cardiac surgeons in decision making regarding high-risk surgery.
Keywords: high-risk surgery, palliative care, quality of life, life expectancy.
Patients with complex cardiovascular disease are occasionally considered inoperable due to the high risk of surgical mortality. When the risk of perioperative mortality (POM) is predicted to be too high, surgical intervention is denied, and patients are often referred to palliative care. The risk of POM in cardiac surgery is often calculated using large-scale databases, such as the Society of Thoracic Surgeons (STS) records. The STS risk models, which are regularly updated, are based on large data sets and incorporate precise statistical methods for risk adjustment.1 In general, these calculators provide a percentage value that defines the magnitude of the risk of death, and then an arbitrary range is selected to categorize the procedure as low, medium, or high risk or inoperable status. The STS database does not set a cutoff point or range to define “operability.” Assigning inoperable status to a certain risk rate is problematic, with many ethical, legal, and moral implications, and for this reason, it has mostly remained undefined. In contrast, the low- and medium-risk ranges are easier to define. Another limitation encountered in the STS database is the lack of risk data for less common but very high-risk procedures, such as a triple valve replacement.
A common example where risk classification has been defined is in patients who are candidates for surgical vs transcatheter aortic valve replacement. Some groups have described a risk of <4% as low risk, 4% to 8% as intermediate risk, >8% as high risk, and >15% as inoperable2; for some other groups, a risk of POM >50% is considered extreme risk or inoperable.3,4 This procedure-specific classification is a useful decision-making tool and helps the surgeon perform an initial risk assessment to allocate a specific patient to a group—operable or nonoperable—only by calculating the risk of surgical death. However, this allocation method does not provide any information on how and when death occurs in either group. These 2 parameters of how and when death occurs define the quality of life (QOL) and the duration of life (DOL), respectively, and together could be considered as the value of life in each pathway. A survivor of a high-risk surgery may benefit from good quality and extended life (a high value), or, on the other end of the spectrum, a high-risk patient who does not undergo surgery is spared the mortality risk of the surgery but dies sooner (low value) with symptoms due to the natural course of the untreated disease.
The central question is, if a surgery is high risk but has the potential of providing a good value (for those who survive it), what QOL and DOL values are acceptable to risk or to justify accepting and proceeding with a risky surgery? Or how high a POM risk is justified to proceed with surgery rather than the alternative palliative care with a certain quality and duration? It is obvious that a decision-making process that is based on POM cannot compare the value of surgery (Vs) and the value of palliation (Vp). Furthermore, it ignores patient preferences and their input, as these are excluded from this decision-making process.
To be able to include QOL and DOL in any decision making, one must precisely describe these parameters. Both QOL and DOL are used for estimation of disease burden by health care administrators, public health experts, insurance agencies, and others. Multiple models have been proposed and used to estimate the overall burden of the disease. Most of the models for this purpose are created for large-scale economic purposes and not for decision making in individual cases.
An important measure is the quality-adjusted life year (QALY). This is an important parameter since it includes both measures of quality and quantity of life.5,6 QALY is a simplified measure to assess the value of health outcomes, and it has been used in economic calculations to assess mainly the cost-effectiveness of various interventions. We sought to evaluate the utility of a similar method in adding further insight into the surgical decision-making process. In this article, we propose a simple model to compare the value of surgery vs palliative care, similar to QALY. This model includes and adjusts for the quality and the quantity of life, in addition to the risk of POM, in the decision-making process for high-risk patients.
The Model
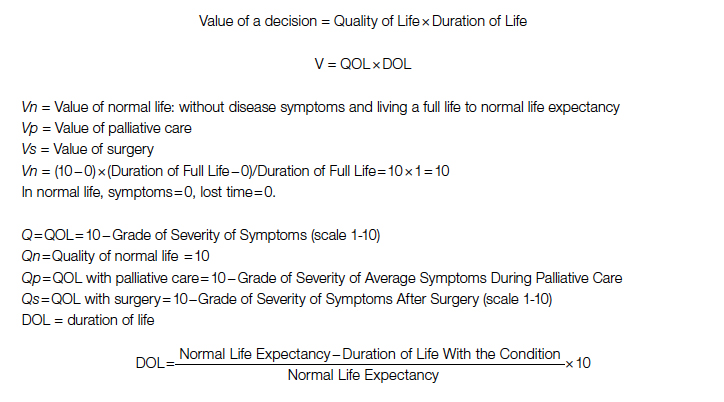
The 2 decision pathways, surgery and palliative care, are compared for their value. We define the value as the product of QOL and DOL in each pathway and use the severity of the symptoms as a surrogate for QOL. If duration and quality were depicted on the x and y axes of a graph (Figure 1), then the area under the curve would represent the collective value in each situation. Figure 2 shows the timeline and the different pathways with each decision. The value in each situation is calculated in relation to the full value, which is represented as the value of normal life (Vn), that is, life without disease and with normal life expectancy. The values of each decision pathway, the value of surgery (Vs) and the value of palliation (Vp), are then compared to define the benefit for each decision as follows:
If Vs/Vp > 1, the benefit is toward surgery;
If Vs/Vp < 1, the benefit is for palliative care.
 and in different disease pathways taken from a single sample")

Definitions
Both quality and duration of life are presented on a 1-10 scale, 1 being the lowest and 10 the highest value, to yield a product with a value of 100 in normal, disease-free life. Any lower value is presented as a percentage to represent the comparison to the full value. QOL is determined by degradation of full quality with the average level of symptoms. DOL is calculated as a lost time (
For the DOL under any condition, a 10-year survival rate could be used as a surrogate in this formula. Compared to life expectancy value, using the 10-year survival rate simplifies the calculation since cardiac diseases are more prevalent in older age, close to or beyond the average life expectancy value.
Using the time intervals from the timeline in Figure 2:
dh = time interval from diagnosis to death at life expectancy
dg = time interval from diagnosis to death after successful surgery
df = time interval from diagnosis to death after palliative care
Duration for palliative care:
Duration for surgery:
Adjustment: This value is calculated for those who survive the surgery. To adjust for the POM, it is multiplied by the 100 − POM risk.
Since value is the base for comparison in this model, and it is the product of 2 equally important factors in the formula (
After elimination of normal life expectancy, form the numerator and denominator:
To adjust for surgical outcomes in special circumstances where less than optimal or standard surgical results are expected (eg, in very rare surgeries, limited resource institutions, or suboptimal postoperative surgical care), an optional coefficient R can be added to the numerator (surgical value). This optional coefficient, with values such as 0.8, 0.9 (to degrade the value of surgery) or 1 (standard surgical outcome), adjusts for variability in interinstitutional surgical results or surgeon variability. No coefficient is added to the denominator since palliative care provides minimal differences between clinicians and hospitals. Thus, the final adjusted formula would be as follows:
Example
A 60-year-old patient with a 10% POM risk needs to be allocated to surgical or palliative care. With palliative care, if this patient lived 6 years with average symptoms grade 4, the Vp would be 20; that is, 20% of the normal life value (if he lived 18 years instead without the disease).
Using the formula for calculation of value in each pathway:
If the same patient undergoes a surgery with a 10% risk of POM, with an average grade 2 related to surgical recovery symptoms for 1 year and then is symptom-free and lives 12 years (instead of 18 years [life expectancy]), his Vs would be 53, or 53% out of the normal life value that is saved if the surgery is 100% successful; adjusted Vs with (chance of survival of 90%) would be 53 × 90% = 48%.
With adjustment of 90% survival chance in surgery, 53 × 90% = 48%. In this example, Vs/Vp = 48/20 = 2.4, showing a significant benefit for surgical care. Notably, the unknown value of normal life expectancy is not needed for the calculation of Vs/Vp, since it is the same in both pathways and it is eliminated by calculation in fraction.
Based on this formula, since the duration of surgical symptoms is short, no matter how severe these are, if the potential duration of life after surgery is high (represented by smaller area under the curve in Figure 1), the numerator becomes larger and the value of the surgery grows. For example, if a patient with a 15% risk of POM, which is generally considered inoperable, lives 5 years, as opposed to 2 years with palliative care with mild symptoms (eg 3/10), Vs/Vp would be 2.7, still showing a significant benefit for surgical care.
Discussion
Any surgical intervention is offered with 2 goals in mind, improving QOL and extending DOL. In a high-risk patient, surgery might be declined due to a high risk of POM, and the patient is offered palliative care, which other than providing symptom relief does not change the course of disease and eventually the patient will die due to the untreated disease. In this decision-making method, mostly completed by a care team only, a potential risk of death due to surgery which possibly could cure the patient is traded for immediate survival; however, the symptomatic course ensues until death. This mostly unilateral decision-making process by a care team, which incorporates minimal input from the patient or ignores patient preferences altogether, is based only on POM risk, and roughly includes a single parameter: years of potential life lost (YPLL). YPLL is a measure of premature mortality, and in the setting of surgical intervention, YPLL is the number of years a patient would lose unless a successful surgery were undertaken. Obviously, patients would live longer if a surgery that was intended to save them failed.
In this article, we proposed a simple method to quantify each decision to decide whether to operate or choose surgical care vs palliative care. Since quality and duration of life are both end factors clinicians and patients aspire to in each decision, they can be considered together as the value of each decision. We believe a numerical framework would provide an objective way to assist both the patient at high risk and the care team in the decision-making process.
The 2 parameters we consider are DOL and QOL. DOL, or survival, can be extracted from large-scale data using statistical methods that have been developed to predict survival under various conditions, such as Kaplan-Meier curves. These methods present the chance of survival in percentages in a defined time frame, such as a 5- or 10-year period.
While the DOL is a numerical parameter and quantifiable, the QOL is a more complex entity. This subjective parameter bears multiple definitions, aspects, and categories, and therefore multiple scales for quantification of QOL have been proposed. These scales have been used extensively for the purpose of health determination in health care policy and economic planning. Most scales acknowledge that QOL is multifactorial and includes interrelated aspects such as mental and socioeconomic factors. We have also noticed that QOL is better determined by the palliative care team than surgeons, so including these care providers in the decision-making process might reduce surgeon bias.
Since our purpose here is only to assist with the decision on medical intervention, we focus on physical QOL. Multiple scales are used to assess health-related QOL, such as the Assessment of Quality of Life (AQoL)-8D,7 EuroQol-5 Dimension (EQ-5D),8 15D,9 and the 36-Item Short Form Survey (SF-36).10 These complex scales are built for systematic reviews, and they are not practical for a clinical user. To simplify and keep this practical, we define QOL by using the severity or grade of symptoms related to the disease the patient has on a scale of 0 to 10. The severity of symptoms can be easily determined using available scales. An applicable scale for this purpose is the Edmonton Symptom Assessment Scale (ESAS), which has been in use for years and has evolved as a useful tool in the medical field.11
Once DOL and QOL are determined on a 1-10 scale, the multiplied value then provides a product that we consider a value. The highest value hoped for in each decision is the achievement of the best QOL and DOL, a value of 100. In Figure 1, a graphic presentation of value in each decision is best seen as the area under the curve. As shown, a successful surgery, even when accompanied by significant symptoms during initial recovery, has a chance (100 – risk of POM%) to gain a larger area under curve (value) by achieving a longer life with no or fewer symptoms. However, in palliative care, progressing disease and even palliated symptoms with a shorter life expectancy impose a large burden on the patient and a much lower value. Note that in this calculation, life expectancy, which is an important but unpredictable factor, is initially included; however, by ratio comparison, it is eliminated, simplifying the calculation further.
Using this formula in different settings reveals that high-risk surgery has a greater potential to reduce YPLL in the general population. Based on this formula, compared to a surgery with potential to significantly extend DOL, a definite shorter and symptomatic life course with palliative care makes it a significantly less favorable option. In fact, in the cardiovascular field, palliative care has minimal or no effect on natural history, as the mechanism of illness is mechanical, such as occlusion of coronary arteries or valve dysfunction, leading eventually to heart failure and death. In a study by Xu et al, although palliative care reduced readmission rates and improved symptoms on a variety of scales, there was no effect on mortality and QOL in patients with heart failure.12
No model in this field has proven to be ideal, and this model bears multiple limitations as well. We have used severity of symptoms as a surrogate for QOL based on the fact that cardiac patients with different pathologies who are untreated will have a common final pathway with development of heart failure symptoms that dictate their QOL. Also, grading QOL is a difficult task at times. Even a model such as QALY, which is one of the most used, is not a perfect model and is not free of problems.6 The difference in surgical results and life expectancy between sexes and ethnic groups might be a source of bias in this formula. Also, multiple factors directly and indirectly affect QOL and DOL and create inaccuracies; therefore, making an exact science from an inexact one naturally relies on multiple assumptions. Although it has previously been shown that most POM occurs in a short period of time after cardiac surgery,13 long-term complications that potentially degrade QOL are not included in this model. By applying this model, one must assume indefinite economic resources. Moreover, applying a single mathematical model in a biologic system and in the general population has intrinsic shortcomings, and it must overlook many other factors (eg, ethical, legal). For example, it will be hard to justify a failed surgery with 15% risk of POM undertaken to eliminate the severe long-lasting symptoms of a disease, while the outcome of a successful surgery with a 20% risk of POM that adds life and quality would be ignored in the current health care system. Thus, regardless of the significant potential, most surgeons would waive a surgery based solely on the percentage rate of POM, perhaps using other terms such as ”peri-nonoperative mortality.”
Conclusion
We have proposed a simple and practical formula for decision making regarding surgical vs palliative care in high-risk patients. By assigning a value that is composed of QOL and DOL in each pathway and including the risk of POM, a ratio of values provides a numerical estimation that can be used to show preference over a specific decision. An advantage of this formula, in addition to presenting an arithmetic value that is easier to understand, is that it can be used in shared decision making with patients. We emphasize that this model is only a preliminary concept at this time and has not been tested or validated for clinical use. Validation of such a model will require extensive work and testing within a large-scale population. We hope that this article will serve as a starting point for the development of other models, and that this formula will become more sophisticated with fewer limitations through larger multidisciplinary efforts in the future.
Corresponding author: Rabin Gerrah, MD, Good Samaritan Regional Medical Center, 3640 NW Samaritan Drive, Suite 100B, Corvallis, OR 97330; rgerrah@stanford.edu.
Disclosures: None reported.
1. O’Brien SM, Feng L, He X, et al. The Society of Thoracic Surgeons 2018 Adult Cardiac Surgery Risk Models: Part 2-statistical methods and results. Ann Thorac Surg. 2018;105(5):1419-1428. doi: 10.1016/j.athoracsur.2018.03.003
2. Hurtado Rendón IS, Bittenbender P, Dunn JM, Firstenberg MS. Chapter 8: Diagnostic workup and evaluation: eligibility, risk assessment, FDA guidelines. In: Transcatheter Heart Valve Handbook: A Surgeons’ and Interventional Council Review. Akron City Hospital, Summa Health System, Akron, OH.
3. Herrmann HC, Thourani VH, Kodali SK, et al; PARTNER Investigators. One-year clinical outcomes with SAPIEN 3 transcatheter aortic valve replacement in high-risk and inoperable patients with severe aortic stenosis. Circulation. 2016;134:130-140. doi:10.1161/CIRCULATIONAHA
4. Ho C, Argáez C. Transcatheter Aortic Valve Implantation for Patients with Severe Aortic Stenosis at Various Levels of Surgical Risk: A Review of Clinical Effectiveness. Ottawa (ON): Canadian Agency for Drugs and Technologies in Health; March 19, 2018.
5. Rios-Diaz AJ, Lam J, Ramos MS, et al. Global patterns of QALY and DALY use in surgical cost-utility analyses: a systematic review. PLoS One. 2016:10;11:e0148304. doi:10.1371/journal.pone.0148304
6. Prieto L, Sacristán JA. Health, Problems and solutions in calculating quality-adjusted life years (QALYs). Qual Life Outcomes. 2003:19;1:80.
7. Centre for Health Economics. Assessment of Quality of Life. 2014. Accessed May 13, 2022. http://www.aqol.com.au/
8. EuroQol Research Foundation. EQ-5D. Accessed May 13, 2022. https://euroqol.org/
9. 15D Instrument. Accessed May 13, 2022. http://www.15d-instrument.net/15d/
10. Rand Corporation. 36-Item Short Form Survey (SF-36).Accessed May 12, 2022. https://www.rand.org/health-care/surveys_tools/mos/36-item-short-form.html
11. Hui D, Bruera E. The Edmonton Symptom Assessment System 25 years later: past, present, and future developments. J Pain Symptom Manage. 2017:53:630-643. doi:10.1016/j.jpainsymman.2016
12. Xu Z, Chen L, Jin S, Yang B, Chen X, Wu Z. Effect of palliative care for patients with heart failure. Int Heart J. 2018:30;59:503-509. doi:10.1536/ihj.17-289
13. Mazzeffi M, Zivot J, Buchman T, Halkos M. In-hospital mortality after cardiac surgery: patient characteristics, timing, and association with postoperative length of intensive care unit and hospital stay. Ann Thorac Surg. 2014;97:1220-1225. doi:10.1016/j.athoracsur.2013.10.040
From the Department of Cardiothoracic Surgery, Stanford University, Stanford, CA.
Abstract
Complex cardiac patients are often referred for surgery or palliative care based on the risk of perioperative mortality. This decision ignores factors such as quality of life or duration of life in either surgery or the palliative path. Here, we propose a model to numerically assess and compare the value of surgery vs palliation. This model includes quality and duration of life, as well as risk of perioperative mortality, and involves a patient’s preferences in the decision-making process.
For each pathway, surgery or palliative care, a value is calculated and compared to a normal life value (no disease symptoms and normal life expectancy). The formula is adjusted for the risk of operative mortality. The model produces a ratio of the value of surgery to the value of palliative care that signifies the superiority of one or another. This model calculation presents an objective estimated numerical value to compare the value of surgery and palliative care. It can be applied to every decision-making process before surgery. In general, if a procedure has the potential to significantly extend life in a patient who otherwise has a very short life expectancy with palliation only, performing high-risk surgery would be a reasonable option. A model that provides a numerical value for surgery vs palliative care and includes quality and duration of life in each pathway could be a useful tool for cardiac surgeons in decision making regarding high-risk surgery.
Keywords: high-risk surgery, palliative care, quality of life, life expectancy.
Patients with complex cardiovascular disease are occasionally considered inoperable due to the high risk of surgical mortality. When the risk of perioperative mortality (POM) is predicted to be too high, surgical intervention is denied, and patients are often referred to palliative care. The risk of POM in cardiac surgery is often calculated using large-scale databases, such as the Society of Thoracic Surgeons (STS) records. The STS risk models, which are regularly updated, are based on large data sets and incorporate precise statistical methods for risk adjustment.1 In general, these calculators provide a percentage value that defines the magnitude of the risk of death, and then an arbitrary range is selected to categorize the procedure as low, medium, or high risk or inoperable status. The STS database does not set a cutoff point or range to define “operability.” Assigning inoperable status to a certain risk rate is problematic, with many ethical, legal, and moral implications, and for this reason, it has mostly remained undefined. In contrast, the low- and medium-risk ranges are easier to define. Another limitation encountered in the STS database is the lack of risk data for less common but very high-risk procedures, such as a triple valve replacement.
A common example where risk classification has been defined is in patients who are candidates for surgical vs transcatheter aortic valve replacement. Some groups have described a risk of <4% as low risk, 4% to 8% as intermediate risk, >8% as high risk, and >15% as inoperable2; for some other groups, a risk of POM >50% is considered extreme risk or inoperable.3,4 This procedure-specific classification is a useful decision-making tool and helps the surgeon perform an initial risk assessment to allocate a specific patient to a group—operable or nonoperable—only by calculating the risk of surgical death. However, this allocation method does not provide any information on how and when death occurs in either group. These 2 parameters of how and when death occurs define the quality of life (QOL) and the duration of life (DOL), respectively, and together could be considered as the value of life in each pathway. A survivor of a high-risk surgery may benefit from good quality and extended life (a high value), or, on the other end of the spectrum, a high-risk patient who does not undergo surgery is spared the mortality risk of the surgery but dies sooner (low value) with symptoms due to the natural course of the untreated disease.
The central question is, if a surgery is high risk but has the potential of providing a good value (for those who survive it), what QOL and DOL values are acceptable to risk or to justify accepting and proceeding with a risky surgery? Or how high a POM risk is justified to proceed with surgery rather than the alternative palliative care with a certain quality and duration? It is obvious that a decision-making process that is based on POM cannot compare the value of surgery (Vs) and the value of palliation (Vp). Furthermore, it ignores patient preferences and their input, as these are excluded from this decision-making process.
To be able to include QOL and DOL in any decision making, one must precisely describe these parameters. Both QOL and DOL are used for estimation of disease burden by health care administrators, public health experts, insurance agencies, and others. Multiple models have been proposed and used to estimate the overall burden of the disease. Most of the models for this purpose are created for large-scale economic purposes and not for decision making in individual cases.
An important measure is the quality-adjusted life year (QALY). This is an important parameter since it includes both measures of quality and quantity of life.5,6 QALY is a simplified measure to assess the value of health outcomes, and it has been used in economic calculations to assess mainly the cost-effectiveness of various interventions. We sought to evaluate the utility of a similar method in adding further insight into the surgical decision-making process. In this article, we propose a simple model to compare the value of surgery vs palliative care, similar to QALY. This model includes and adjusts for the quality and the quantity of life, in addition to the risk of POM, in the decision-making process for high-risk patients.
The Model
The 2 decision pathways, surgery and palliative care, are compared for their value. We define the value as the product of QOL and DOL in each pathway and use the severity of the symptoms as a surrogate for QOL. If duration and quality were depicted on the x and y axes of a graph (Figure 1), then the area under the curve would represent the collective value in each situation. Figure 2 shows the timeline and the different pathways with each decision. The value in each situation is calculated in relation to the full value, which is represented as the value of normal life (Vn), that is, life without disease and with normal life expectancy. The values of each decision pathway, the value of surgery (Vs) and the value of palliation (Vp), are then compared to define the benefit for each decision as follows:
If Vs/Vp > 1, the benefit is toward surgery;
If Vs/Vp < 1, the benefit is for palliative care.
Definitions
Both quality and duration of life are presented on a 1-10 scale, 1 being the lowest and 10 the highest value, to yield a product with a value of 100 in normal, disease-free life. Any lower value is presented as a percentage to represent the comparison to the full value. QOL is determined by degradation of full quality with the average level of symptoms. DOL is calculated as a lost time (
For the DOL under any condition, a 10-year survival rate could be used as a surrogate in this formula. Compared to life expectancy value, using the 10-year survival rate simplifies the calculation since cardiac diseases are more prevalent in older age, close to or beyond the average life expectancy value.
Using the time intervals from the timeline in Figure 2:
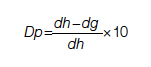
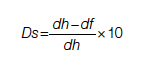
dh = time interval from diagnosis to death at life expectancy
dg = time interval from diagnosis to death after successful surgery
df = time interval from diagnosis to death after palliative care
Duration for palliative care:
Duration for surgery:
Adjustment: This value is calculated for those who survive the surgery. To adjust for the POM, it is multiplied by the 100 − POM risk.
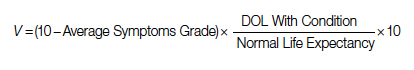
Since value is the base for comparison in this model, and it is the product of 2 equally important factors in the formula (
After elimination of normal life expectancy, form the numerator and denominator:
To adjust for surgical outcomes in special circumstances where less than optimal or standard surgical results are expected (eg, in very rare surgeries, limited resource institutions, or suboptimal postoperative surgical care), an optional coefficient R can be added to the numerator (surgical value). This optional coefficient, with values such as 0.8, 0.9 (to degrade the value of surgery) or 1 (standard surgical outcome), adjusts for variability in interinstitutional surgical results or surgeon variability. No coefficient is added to the denominator since palliative care provides minimal differences between clinicians and hospitals. Thus, the final adjusted formula would be as follows:
Example
A 60-year-old patient with a 10% POM risk needs to be allocated to surgical or palliative care. With palliative care, if this patient lived 6 years with average symptoms grade 4, the Vp would be 20; that is, 20% of the normal life value (if he lived 18 years instead without the disease).
Using the formula for calculation of value in each pathway:
If the same patient undergoes a surgery with a 10% risk of POM, with an average grade 2 related to surgical recovery symptoms for 1 year and then is symptom-free and lives 12 years (instead of 18 years [life expectancy]), his Vs would be 53, or 53% out of the normal life value that is saved if the surgery is 100% successful; adjusted Vs with (chance of survival of 90%) would be 53 × 90% = 48%.
With adjustment of 90% survival chance in surgery, 53 × 90% = 48%. In this example, Vs/Vp = 48/20 = 2.4, showing a significant benefit for surgical care. Notably, the unknown value of normal life expectancy is not needed for the calculation of Vs/Vp, since it is the same in both pathways and it is eliminated by calculation in fraction.
Based on this formula, since the duration of surgical symptoms is short, no matter how severe these are, if the potential duration of life after surgery is high (represented by smaller area under the curve in Figure 1), the numerator becomes larger and the value of the surgery grows. For example, if a patient with a 15% risk of POM, which is generally considered inoperable, lives 5 years, as opposed to 2 years with palliative care with mild symptoms (eg 3/10), Vs/Vp would be 2.7, still showing a significant benefit for surgical care.
Discussion
Any surgical intervention is offered with 2 goals in mind, improving QOL and extending DOL. In a high-risk patient, surgery might be declined due to a high risk of POM, and the patient is offered palliative care, which other than providing symptom relief does not change the course of disease and eventually the patient will die due to the untreated disease. In this decision-making method, mostly completed by a care team only, a potential risk of death due to surgery which possibly could cure the patient is traded for immediate survival; however, the symptomatic course ensues until death. This mostly unilateral decision-making process by a care team, which incorporates minimal input from the patient or ignores patient preferences altogether, is based only on POM risk, and roughly includes a single parameter: years of potential life lost (YPLL). YPLL is a measure of premature mortality, and in the setting of surgical intervention, YPLL is the number of years a patient would lose unless a successful surgery were undertaken. Obviously, patients would live longer if a surgery that was intended to save them failed.
In this article, we proposed a simple method to quantify each decision to decide whether to operate or choose surgical care vs palliative care. Since quality and duration of life are both end factors clinicians and patients aspire to in each decision, they can be considered together as the value of each decision. We believe a numerical framework would provide an objective way to assist both the patient at high risk and the care team in the decision-making process.
The 2 parameters we consider are DOL and QOL. DOL, or survival, can be extracted from large-scale data using statistical methods that have been developed to predict survival under various conditions, such as Kaplan-Meier curves. These methods present the chance of survival in percentages in a defined time frame, such as a 5- or 10-year period.
While the DOL is a numerical parameter and quantifiable, the QOL is a more complex entity. This subjective parameter bears multiple definitions, aspects, and categories, and therefore multiple scales for quantification of QOL have been proposed. These scales have been used extensively for the purpose of health determination in health care policy and economic planning. Most scales acknowledge that QOL is multifactorial and includes interrelated aspects such as mental and socioeconomic factors. We have also noticed that QOL is better determined by the palliative care team than surgeons, so including these care providers in the decision-making process might reduce surgeon bias.
Since our purpose here is only to assist with the decision on medical intervention, we focus on physical QOL. Multiple scales are used to assess health-related QOL, such as the Assessment of Quality of Life (AQoL)-8D,7 EuroQol-5 Dimension (EQ-5D),8 15D,9 and the 36-Item Short Form Survey (SF-36).10 These complex scales are built for systematic reviews, and they are not practical for a clinical user. To simplify and keep this practical, we define QOL by using the severity or grade of symptoms related to the disease the patient has on a scale of 0 to 10. The severity of symptoms can be easily determined using available scales. An applicable scale for this purpose is the Edmonton Symptom Assessment Scale (ESAS), which has been in use for years and has evolved as a useful tool in the medical field.11
Once DOL and QOL are determined on a 1-10 scale, the multiplied value then provides a product that we consider a value. The highest value hoped for in each decision is the achievement of the best QOL and DOL, a value of 100. In Figure 1, a graphic presentation of value in each decision is best seen as the area under the curve. As shown, a successful surgery, even when accompanied by significant symptoms during initial recovery, has a chance (100 – risk of POM%) to gain a larger area under curve (value) by achieving a longer life with no or fewer symptoms. However, in palliative care, progressing disease and even palliated symptoms with a shorter life expectancy impose a large burden on the patient and a much lower value. Note that in this calculation, life expectancy, which is an important but unpredictable factor, is initially included; however, by ratio comparison, it is eliminated, simplifying the calculation further.
Using this formula in different settings reveals that high-risk surgery has a greater potential to reduce YPLL in the general population. Based on this formula, compared to a surgery with potential to significantly extend DOL, a definite shorter and symptomatic life course with palliative care makes it a significantly less favorable option. In fact, in the cardiovascular field, palliative care has minimal or no effect on natural history, as the mechanism of illness is mechanical, such as occlusion of coronary arteries or valve dysfunction, leading eventually to heart failure and death. In a study by Xu et al, although palliative care reduced readmission rates and improved symptoms on a variety of scales, there was no effect on mortality and QOL in patients with heart failure.12
No model in this field has proven to be ideal, and this model bears multiple limitations as well. We have used severity of symptoms as a surrogate for QOL based on the fact that cardiac patients with different pathologies who are untreated will have a common final pathway with development of heart failure symptoms that dictate their QOL. Also, grading QOL is a difficult task at times. Even a model such as QALY, which is one of the most used, is not a perfect model and is not free of problems.6 The difference in surgical results and life expectancy between sexes and ethnic groups might be a source of bias in this formula. Also, multiple factors directly and indirectly affect QOL and DOL and create inaccuracies; therefore, making an exact science from an inexact one naturally relies on multiple assumptions. Although it has previously been shown that most POM occurs in a short period of time after cardiac surgery,13 long-term complications that potentially degrade QOL are not included in this model. By applying this model, one must assume indefinite economic resources. Moreover, applying a single mathematical model in a biologic system and in the general population has intrinsic shortcomings, and it must overlook many other factors (eg, ethical, legal). For example, it will be hard to justify a failed surgery with 15% risk of POM undertaken to eliminate the severe long-lasting symptoms of a disease, while the outcome of a successful surgery with a 20% risk of POM that adds life and quality would be ignored in the current health care system. Thus, regardless of the significant potential, most surgeons would waive a surgery based solely on the percentage rate of POM, perhaps using other terms such as ”peri-nonoperative mortality.”
Conclusion
We have proposed a simple and practical formula for decision making regarding surgical vs palliative care in high-risk patients. By assigning a value that is composed of QOL and DOL in each pathway and including the risk of POM, a ratio of values provides a numerical estimation that can be used to show preference over a specific decision. An advantage of this formula, in addition to presenting an arithmetic value that is easier to understand, is that it can be used in shared decision making with patients. We emphasize that this model is only a preliminary concept at this time and has not been tested or validated for clinical use. Validation of such a model will require extensive work and testing within a large-scale population. We hope that this article will serve as a starting point for the development of other models, and that this formula will become more sophisticated with fewer limitations through larger multidisciplinary efforts in the future.
Corresponding author: Rabin Gerrah, MD, Good Samaritan Regional Medical Center, 3640 NW Samaritan Drive, Suite 100B, Corvallis, OR 97330; rgerrah@stanford.edu.
Disclosures: None reported.
From the Department of Cardiothoracic Surgery, Stanford University, Stanford, CA.
Abstract
Complex cardiac patients are often referred for surgery or palliative care based on the risk of perioperative mortality. This decision ignores factors such as quality of life or duration of life in either surgery or the palliative path. Here, we propose a model to numerically assess and compare the value of surgery vs palliation. This model includes quality and duration of life, as well as risk of perioperative mortality, and involves a patient’s preferences in the decision-making process.
For each pathway, surgery or palliative care, a value is calculated and compared to a normal life value (no disease symptoms and normal life expectancy). The formula is adjusted for the risk of operative mortality. The model produces a ratio of the value of surgery to the value of palliative care that signifies the superiority of one or another. This model calculation presents an objective estimated numerical value to compare the value of surgery and palliative care. It can be applied to every decision-making process before surgery. In general, if a procedure has the potential to significantly extend life in a patient who otherwise has a very short life expectancy with palliation only, performing high-risk surgery would be a reasonable option. A model that provides a numerical value for surgery vs palliative care and includes quality and duration of life in each pathway could be a useful tool for cardiac surgeons in decision making regarding high-risk surgery.
Keywords: high-risk surgery, palliative care, quality of life, life expectancy.
Patients with complex cardiovascular disease are occasionally considered inoperable due to the high risk of surgical mortality. When the risk of perioperative mortality (POM) is predicted to be too high, surgical intervention is denied, and patients are often referred to palliative care. The risk of POM in cardiac surgery is often calculated using large-scale databases, such as the Society of Thoracic Surgeons (STS) records. The STS risk models, which are regularly updated, are based on large data sets and incorporate precise statistical methods for risk adjustment.1 In general, these calculators provide a percentage value that defines the magnitude of the risk of death, and then an arbitrary range is selected to categorize the procedure as low, medium, or high risk or inoperable status. The STS database does not set a cutoff point or range to define “operability.” Assigning inoperable status to a certain risk rate is problematic, with many ethical, legal, and moral implications, and for this reason, it has mostly remained undefined. In contrast, the low- and medium-risk ranges are easier to define. Another limitation encountered in the STS database is the lack of risk data for less common but very high-risk procedures, such as a triple valve replacement.
A common example where risk classification has been defined is in patients who are candidates for surgical vs transcatheter aortic valve replacement. Some groups have described a risk of <4% as low risk, 4% to 8% as intermediate risk, >8% as high risk, and >15% as inoperable2; for some other groups, a risk of POM >50% is considered extreme risk or inoperable.3,4 This procedure-specific classification is a useful decision-making tool and helps the surgeon perform an initial risk assessment to allocate a specific patient to a group—operable or nonoperable—only by calculating the risk of surgical death. However, this allocation method does not provide any information on how and when death occurs in either group. These 2 parameters of how and when death occurs define the quality of life (QOL) and the duration of life (DOL), respectively, and together could be considered as the value of life in each pathway. A survivor of a high-risk surgery may benefit from good quality and extended life (a high value), or, on the other end of the spectrum, a high-risk patient who does not undergo surgery is spared the mortality risk of the surgery but dies sooner (low value) with symptoms due to the natural course of the untreated disease.
The central question is, if a surgery is high risk but has the potential of providing a good value (for those who survive it), what QOL and DOL values are acceptable to risk or to justify accepting and proceeding with a risky surgery? Or how high a POM risk is justified to proceed with surgery rather than the alternative palliative care with a certain quality and duration? It is obvious that a decision-making process that is based on POM cannot compare the value of surgery (Vs) and the value of palliation (Vp). Furthermore, it ignores patient preferences and their input, as these are excluded from this decision-making process.
To be able to include QOL and DOL in any decision making, one must precisely describe these parameters. Both QOL and DOL are used for estimation of disease burden by health care administrators, public health experts, insurance agencies, and others. Multiple models have been proposed and used to estimate the overall burden of the disease. Most of the models for this purpose are created for large-scale economic purposes and not for decision making in individual cases.
An important measure is the quality-adjusted life year (QALY). This is an important parameter since it includes both measures of quality and quantity of life.5,6 QALY is a simplified measure to assess the value of health outcomes, and it has been used in economic calculations to assess mainly the cost-effectiveness of various interventions. We sought to evaluate the utility of a similar method in adding further insight into the surgical decision-making process. In this article, we propose a simple model to compare the value of surgery vs palliative care, similar to QALY. This model includes and adjusts for the quality and the quantity of life, in addition to the risk of POM, in the decision-making process for high-risk patients.
The Model
The 2 decision pathways, surgery and palliative care, are compared for their value. We define the value as the product of QOL and DOL in each pathway and use the severity of the symptoms as a surrogate for QOL. If duration and quality were depicted on the x and y axes of a graph (Figure 1), then the area under the curve would represent the collective value in each situation. Figure 2 shows the timeline and the different pathways with each decision. The value in each situation is calculated in relation to the full value, which is represented as the value of normal life (Vn), that is, life without disease and with normal life expectancy. The values of each decision pathway, the value of surgery (Vs) and the value of palliation (Vp), are then compared to define the benefit for each decision as follows:
If Vs/Vp > 1, the benefit is toward surgery;
If Vs/Vp < 1, the benefit is for palliative care.
Definitions
Both quality and duration of life are presented on a 1-10 scale, 1 being the lowest and 10 the highest value, to yield a product with a value of 100 in normal, disease-free life. Any lower value is presented as a percentage to represent the comparison to the full value. QOL is determined by degradation of full quality with the average level of symptoms. DOL is calculated as a lost time (
For the DOL under any condition, a 10-year survival rate could be used as a surrogate in this formula. Compared to life expectancy value, using the 10-year survival rate simplifies the calculation since cardiac diseases are more prevalent in older age, close to or beyond the average life expectancy value.
Using the time intervals from the timeline in Figure 2:
dh = time interval from diagnosis to death at life expectancy
dg = time interval from diagnosis to death after successful surgery
df = time interval from diagnosis to death after palliative care
Duration for palliative care:
Duration for surgery:
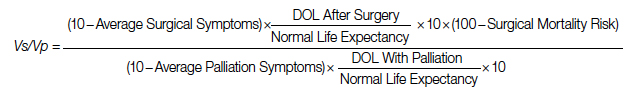
Adjustment: This value is calculated for those who survive the surgery. To adjust for the POM, it is multiplied by the 100 − POM risk.
Since value is the base for comparison in this model, and it is the product of 2 equally important factors in the formula (
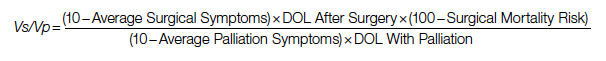
After elimination of normal life expectancy, form the numerator and denominator:
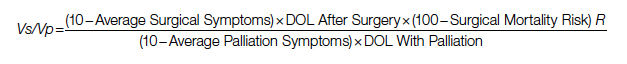
To adjust for surgical outcomes in special circumstances where less than optimal or standard surgical results are expected (eg, in very rare surgeries, limited resource institutions, or suboptimal postoperative surgical care), an optional coefficient R can be added to the numerator (surgical value). This optional coefficient, with values such as 0.8, 0.9 (to degrade the value of surgery) or 1 (standard surgical outcome), adjusts for variability in interinstitutional surgical results or surgeon variability. No coefficient is added to the denominator since palliative care provides minimal differences between clinicians and hospitals. Thus, the final adjusted formula would be as follows:
Example
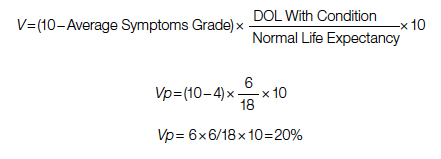
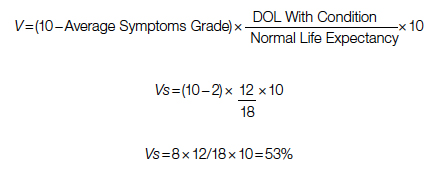
A 60-year-old patient with a 10% POM risk needs to be allocated to surgical or palliative care. With palliative care, if this patient lived 6 years with average symptoms grade 4, the Vp would be 20; that is, 20% of the normal life value (if he lived 18 years instead without the disease).
Using the formula for calculation of value in each pathway:
If the same patient undergoes a surgery with a 10% risk of POM, with an average grade 2 related to surgical recovery symptoms for 1 year and then is symptom-free and lives 12 years (instead of 18 years [life expectancy]), his Vs would be 53, or 53% out of the normal life value that is saved if the surgery is 100% successful; adjusted Vs with (chance of survival of 90%) would be 53 × 90% = 48%.
With adjustment of 90% survival chance in surgery, 53 × 90% = 48%. In this example, Vs/Vp = 48/20 = 2.4, showing a significant benefit for surgical care. Notably, the unknown value of normal life expectancy is not needed for the calculation of Vs/Vp, since it is the same in both pathways and it is eliminated by calculation in fraction.
Based on this formula, since the duration of surgical symptoms is short, no matter how severe these are, if the potential duration of life after surgery is high (represented by smaller area under the curve in Figure 1), the numerator becomes larger and the value of the surgery grows. For example, if a patient with a 15% risk of POM, which is generally considered inoperable, lives 5 years, as opposed to 2 years with palliative care with mild symptoms (eg 3/10), Vs/Vp would be 2.7, still showing a significant benefit for surgical care.
Discussion
Any surgical intervention is offered with 2 goals in mind, improving QOL and extending DOL. In a high-risk patient, surgery might be declined due to a high risk of POM, and the patient is offered palliative care, which other than providing symptom relief does not change the course of disease and eventually the patient will die due to the untreated disease. In this decision-making method, mostly completed by a care team only, a potential risk of death due to surgery which possibly could cure the patient is traded for immediate survival; however, the symptomatic course ensues until death. This mostly unilateral decision-making process by a care team, which incorporates minimal input from the patient or ignores patient preferences altogether, is based only on POM risk, and roughly includes a single parameter: years of potential life lost (YPLL). YPLL is a measure of premature mortality, and in the setting of surgical intervention, YPLL is the number of years a patient would lose unless a successful surgery were undertaken. Obviously, patients would live longer if a surgery that was intended to save them failed.
In this article, we proposed a simple method to quantify each decision to decide whether to operate or choose surgical care vs palliative care. Since quality and duration of life are both end factors clinicians and patients aspire to in each decision, they can be considered together as the value of each decision. We believe a numerical framework would provide an objective way to assist both the patient at high risk and the care team in the decision-making process.
The 2 parameters we consider are DOL and QOL. DOL, or survival, can be extracted from large-scale data using statistical methods that have been developed to predict survival under various conditions, such as Kaplan-Meier curves. These methods present the chance of survival in percentages in a defined time frame, such as a 5- or 10-year period.
While the DOL is a numerical parameter and quantifiable, the QOL is a more complex entity. This subjective parameter bears multiple definitions, aspects, and categories, and therefore multiple scales for quantification of QOL have been proposed. These scales have been used extensively for the purpose of health determination in health care policy and economic planning. Most scales acknowledge that QOL is multifactorial and includes interrelated aspects such as mental and socioeconomic factors. We have also noticed that QOL is better determined by the palliative care team than surgeons, so including these care providers in the decision-making process might reduce surgeon bias.
Since our purpose here is only to assist with the decision on medical intervention, we focus on physical QOL. Multiple scales are used to assess health-related QOL, such as the Assessment of Quality of Life (AQoL)-8D,7 EuroQol-5 Dimension (EQ-5D),8 15D,9 and the 36-Item Short Form Survey (SF-36).10 These complex scales are built for systematic reviews, and they are not practical for a clinical user. To simplify and keep this practical, we define QOL by using the severity or grade of symptoms related to the disease the patient has on a scale of 0 to 10. The severity of symptoms can be easily determined using available scales. An applicable scale for this purpose is the Edmonton Symptom Assessment Scale (ESAS), which has been in use for years and has evolved as a useful tool in the medical field.11
Once DOL and QOL are determined on a 1-10 scale, the multiplied value then provides a product that we consider a value. The highest value hoped for in each decision is the achievement of the best QOL and DOL, a value of 100. In Figure 1, a graphic presentation of value in each decision is best seen as the area under the curve. As shown, a successful surgery, even when accompanied by significant symptoms during initial recovery, has a chance (100 – risk of POM%) to gain a larger area under curve (value) by achieving a longer life with no or fewer symptoms. However, in palliative care, progressing disease and even palliated symptoms with a shorter life expectancy impose a large burden on the patient and a much lower value. Note that in this calculation, life expectancy, which is an important but unpredictable factor, is initially included; however, by ratio comparison, it is eliminated, simplifying the calculation further.
Using this formula in different settings reveals that high-risk surgery has a greater potential to reduce YPLL in the general population. Based on this formula, compared to a surgery with potential to significantly extend DOL, a definite shorter and symptomatic life course with palliative care makes it a significantly less favorable option. In fact, in the cardiovascular field, palliative care has minimal or no effect on natural history, as the mechanism of illness is mechanical, such as occlusion of coronary arteries or valve dysfunction, leading eventually to heart failure and death. In a study by Xu et al, although palliative care reduced readmission rates and improved symptoms on a variety of scales, there was no effect on mortality and QOL in patients with heart failure.12
No model in this field has proven to be ideal, and this model bears multiple limitations as well. We have used severity of symptoms as a surrogate for QOL based on the fact that cardiac patients with different pathologies who are untreated will have a common final pathway with development of heart failure symptoms that dictate their QOL. Also, grading QOL is a difficult task at times. Even a model such as QALY, which is one of the most used, is not a perfect model and is not free of problems.6 The difference in surgical results and life expectancy between sexes and ethnic groups might be a source of bias in this formula. Also, multiple factors directly and indirectly affect QOL and DOL and create inaccuracies; therefore, making an exact science from an inexact one naturally relies on multiple assumptions. Although it has previously been shown that most POM occurs in a short period of time after cardiac surgery,13 long-term complications that potentially degrade QOL are not included in this model. By applying this model, one must assume indefinite economic resources. Moreover, applying a single mathematical model in a biologic system and in the general population has intrinsic shortcomings, and it must overlook many other factors (eg, ethical, legal). For example, it will be hard to justify a failed surgery with 15% risk of POM undertaken to eliminate the severe long-lasting symptoms of a disease, while the outcome of a successful surgery with a 20% risk of POM that adds life and quality would be ignored in the current health care system. Thus, regardless of the significant potential, most surgeons would waive a surgery based solely on the percentage rate of POM, perhaps using other terms such as ”peri-nonoperative mortality.”
Conclusion
We have proposed a simple and practical formula for decision making regarding surgical vs palliative care in high-risk patients. By assigning a value that is composed of QOL and DOL in each pathway and including the risk of POM, a ratio of values provides a numerical estimation that can be used to show preference over a specific decision. An advantage of this formula, in addition to presenting an arithmetic value that is easier to understand, is that it can be used in shared decision making with patients. We emphasize that this model is only a preliminary concept at this time and has not been tested or validated for clinical use. Validation of such a model will require extensive work and testing within a large-scale population. We hope that this article will serve as a starting point for the development of other models, and that this formula will become more sophisticated with fewer limitations through larger multidisciplinary efforts in the future.
Corresponding author: Rabin Gerrah, MD, Good Samaritan Regional Medical Center, 3640 NW Samaritan Drive, Suite 100B, Corvallis, OR 97330; rgerrah@stanford.edu.
Disclosures: None reported.
1. O’Brien SM, Feng L, He X, et al. The Society of Thoracic Surgeons 2018 Adult Cardiac Surgery Risk Models: Part 2-statistical methods and results. Ann Thorac Surg. 2018;105(5):1419-1428. doi: 10.1016/j.athoracsur.2018.03.003
2. Hurtado Rendón IS, Bittenbender P, Dunn JM, Firstenberg MS. Chapter 8: Diagnostic workup and evaluation: eligibility, risk assessment, FDA guidelines. In: Transcatheter Heart Valve Handbook: A Surgeons’ and Interventional Council Review. Akron City Hospital, Summa Health System, Akron, OH.
3. Herrmann HC, Thourani VH, Kodali SK, et al; PARTNER Investigators. One-year clinical outcomes with SAPIEN 3 transcatheter aortic valve replacement in high-risk and inoperable patients with severe aortic stenosis. Circulation. 2016;134:130-140. doi:10.1161/CIRCULATIONAHA
4. Ho C, Argáez C. Transcatheter Aortic Valve Implantation for Patients with Severe Aortic Stenosis at Various Levels of Surgical Risk: A Review of Clinical Effectiveness. Ottawa (ON): Canadian Agency for Drugs and Technologies in Health; March 19, 2018.
5. Rios-Diaz AJ, Lam J, Ramos MS, et al. Global patterns of QALY and DALY use in surgical cost-utility analyses: a systematic review. PLoS One. 2016:10;11:e0148304. doi:10.1371/journal.pone.0148304
6. Prieto L, Sacristán JA. Health, Problems and solutions in calculating quality-adjusted life years (QALYs). Qual Life Outcomes. 2003:19;1:80.
7. Centre for Health Economics. Assessment of Quality of Life. 2014. Accessed May 13, 2022. http://www.aqol.com.au/
8. EuroQol Research Foundation. EQ-5D. Accessed May 13, 2022. https://euroqol.org/
9. 15D Instrument. Accessed May 13, 2022. http://www.15d-instrument.net/15d/
10. Rand Corporation. 36-Item Short Form Survey (SF-36).Accessed May 12, 2022. https://www.rand.org/health-care/surveys_tools/mos/36-item-short-form.html
11. Hui D, Bruera E. The Edmonton Symptom Assessment System 25 years later: past, present, and future developments. J Pain Symptom Manage. 2017:53:630-643. doi:10.1016/j.jpainsymman.2016
12. Xu Z, Chen L, Jin S, Yang B, Chen X, Wu Z. Effect of palliative care for patients with heart failure. Int Heart J. 2018:30;59:503-509. doi:10.1536/ihj.17-289
13. Mazzeffi M, Zivot J, Buchman T, Halkos M. In-hospital mortality after cardiac surgery: patient characteristics, timing, and association with postoperative length of intensive care unit and hospital stay. Ann Thorac Surg. 2014;97:1220-1225. doi:10.1016/j.athoracsur.2013.10.040
Very high HDL-C: Too much of a good thing?
A new study suggests that .
Investigators studied close to 10,000 patients with CAD in two separate cohorts. After adjusting for an array of covariates, they found that individuals with HDL-C levels greater than 80 mg/dL had a 96% higher risk for all-cause mortality and a 71% higher risk for cardiovascular mortality than those with HDL-C levels between 40 and 60 mg/dL.
A U-shaped association was found, with higher risk for all-cause and cardiovascular mortality in patients with both very low and very high, compared with midrange, HDL-C values.
“Very high HDL levels are associated with increased risk of adverse outcomes, not lower risk, as previously thought. This is true not only in the general population, but also in people with known coronary artery disease,” senior author Arshed A. Quyyumi, MD, professor of medicine, division of cardiology, Emory University, Atlanta, told this news organization.
“Physicians have to be cognizant of the fact that, at levels of HDL-C above 80 mg/dL, they [should be] more aggressive with risk reduction and not believe that the patient is at ‘low risk’ because of high levels of ‘good’ cholesterol,” said Dr. Quyyumi, director of the Emory Clinical Cardiovascular Research Institute.
The study was published online in JAMA Cardiology.
Inverse association?
HDL-C levels have “historically been inversely associated with increased cardiovascular disease (CVD) risk; however, recent studies have questioned the efficacy of therapies designed to increase HDL-C levels,” the authors wrote. Moreover, genetic variants associated with HDL-C have not been found to be linked to CVD risk.
Whether “very high HDL-C levels in patients with coronary artery disease (CAD) are associated with mortality risk remains unknown,” they wrote. In this study, the researchers investigated not only the potential risk of elevated HDL-C levels in these patients, but also the association of known HDL-C genetic variants with this risk.
To do so, they analyzed data from a subset of patients with CAD in two independent study groups: the UK Biobank (UKB; n = 14,478; mean [standard deviation] age, 61.2 [5.8] years; 76.2% male; 93.8% White) and the Emory Cardiovascular Biobank (EmCAB; n = 5,467; mean age, 63.8 [12.3] years; 66.4% male; 73.2% White). Participants were followed prospectively for a median of 8.9 (interquartile range, 8.0-9.7) years and 6.7 (IQR, 4.0-10.8) years, respectively.
Additional data collected included medical and medication history and demographic characteristics, which were used as covariates, as well as genomic information.
Of the UKB cohort, 12.4% and 7.9% sustained all-cause or cardiovascular death, respectively, during the follow-up period, and 1.8% of participants had an HDL-C level above 80 mg/dL.
Among these participants with very high HDL-C levels, 16.9% and 8.6% had all-cause or cardiovascular death, respectively. Compared with the reference category (HDL-C level of 40-60 mg/dL), those with low HDL-C levels (≤ 30 mg/dL) had an expected higher risk for both all-cause and cardiovascular mortality, even after adjustment for covariates (hazard ratio, 1.33; 95% confidence interval, 1.07-1.64 and HR, 1.42; 95% CI, 1.09-1.85, respectively; P = .009).
“Importantly,” the authors stated, “compared with the reference category, individuals with very high HDL-C levels (>80 mg/dL) also had a higher risk of all-cause death (HR, 1.58 [1.16-2.14], P = .004).”
Although cardiovascular death rates were not significantly greater in unadjusted analyses, after adjustment, the highest HDL-C group had an increased risk for all-cause and cardiovascular death (HR, 1.96; 95% CI, 1.42-2.71; P < .001 and HR, 1.71; 95% CI, 1.09-2.68, respectively; P = .02).
Compared with females, males with HDL-C levels above 80 mg/dL had a higher risk for all-cause and cardiovascular death.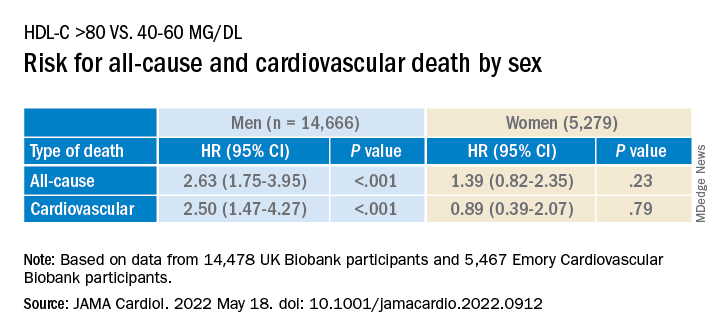
Similar findings were obtained in the EmCAB patients, 1.6% of whom had HDL-C levels above 80 mg/dL. During the follow-up period, 26.9% and 13.8% of participants sustained all-cause and cardiovascular death, respectively. Of those with HDL-C levels above 80 mg/dL, 30.0% and 16.7% experienced all-cause and cardiovascular death, respectively.
Compared with those with HDL-C levels of 40-60 mg/dL, those in the lowest (≤30 mg/dL) and highest (>80 mg/dL) groups had a “significant or near-significant greater risk for all-cause death in both unadjusted and fully adjusted models.
“Using adjusted HR curves, a U-shaped association between HDL-C and adverse events was evident with higher mortality at both very high and low HDL-C levels,” the authors noted.
Compared with patients without diabetes, those with diabetes and an HDL-C level above 80 mg/dL had a higher risk for all-cause and cardiovascular death, and patients younger than 65 years had a higher risk for cardiovascular death than patients 65 years and older.
The researchers found a “positive linear association” between the HDL-C genetic risk score (GRS) and HDL levels, wherein a 1-SD higher HDL-C GRS was associated with a 3.03 mg/dL higher HDL-C level (2.83-3.22; P < .001; R 2 = 0.06).
The HDL-C GRS was not associated with the risk for all-cause or cardiovascular death in unadjusted models, and after the HDL-C GRS was added to the fully adjusted models, the association with HDL-C level above 80 mg/dL was not attenuated, “indicating that HDL-C genetic variations in the GRS do not contribute substantially to the risk.”
“Potential mechanisms through which very high HDL-C might cause adverse cardiovascular outcomes in patients with CAD need to be studied,” Dr. Quyyumi said. “Whether the functional capacity of the HDL particle is altered when the level is very high remains unknown. Whether it is more able to oxidize and thus shift from being protective to harmful also needs to be investigated.”
Red flag
Commenting for this news organization, Sadiya Sana Khan, MD, MSc, assistant professor of medicine (cardiology) and preventive medicine (epidemiology), Northwestern University, Chicago, said: “I think the most important point [of the study] is to identify people with very high HDL-C. This can serve as a reminder to discuss heart-healthy lifestyles and discussion of statin therapy if needed, based on LDL-C.”
In an accompanying editorial coauthored with Gregg Fonarow, MD, Ahmanson-UCLA Cardiomyopathy Center, University of California, Los Angeles, the pair wrote: “Although the present findings may be related to residual confounding, high HDL-C levels should not automatically be assumed to be protective.”
They advised clinicians to “use HDL-C levels as a surrogate marker, with very low and very high levels as a red flag to target for more intensive primary and secondary prevention, as the maxim for HDL-C as ‘good’ cholesterol only holds for HDL-C levels of 80 mg/dL or less.”
This study was supported in part by grants from the National Institutes of Health, the American Heart Association, and the Abraham J. & Phyllis Katz Foundation. Dr. Quyyumi and coauthors report no relevant financial relationships. Dr. Khan reports receiving grants from the American Heart Association and the National Institutes of Health outside the submitted work. Dr. Fonarow reports receiving personal fees from Abbott, Amgen, AstraZeneca, Bayer, Cytokinetics, Edwards, Janssen, Medtronic, Merck, and Novartis outside the submitted work. No other disclosures were reported.
A version of this article first appeared on Medscape.com.
FROM JAMA CARDIOLOGY
Coronary CT Angiography Compared to Coronary Angiography or Standard of Care in Patients With Intermediate-Risk Stable Chest Pain
Study 1 Overview (SCOT-HEART Investigators)
Objective: To assess cardiovascular mortality and nonfatal myocardial infarction at 5 years in patients with stable chest pain referred to cardiology clinic for management with either standard care plus computed tomography angiography (CTA) or standard care alone.
Design: Multicenter, randomized, open-label prospective study.
Setting and participants: A total of 4146 patients with stable chest pain were randomized to standard care or standard care plus CTA at 12 centers across Scotland and were followed for 5 years.
Main outcome measures: The primary end point was a composite of death from coronary heart disease or nonfatal myocardial infarction. Main secondary end points were nonfatal myocardial infarction, nonfatal stroke, and frequency of invasive coronary angiography (ICA) and coronary revascularization with percutaneous coronary intervention or coronary artery bypass grafting.
Main results: The primary outcome including the composite of cardiovascular death or nonfatal myocardial infarction was lower in the CTA group than in the standard-care group at 2.3% (48 of 2073 patients) vs 3.9% (81 of 2073 patients), respectively (hazard ratio, 0.59; 95% CI, 0.41-0.84; P = .004). Although there was a higher rate of ICA and coronary revascularization in the CTA group than in the standard-care group in the first few months of follow-up, the overall rates were similar at 5 years, with ICA performed in 491 patients and 502 patients in the CTA vs standard-care groups, respectively (hazard ratio, 1.00; 95% CI, 0.88-1.13). Similarly, coronary revascularization was performed in 279 patients in the CTA group and in 267 patients in the standard-care group (hazard ratio, 1.07; 95% CI, 0.91-1.27). There were, however, more preventive therapies initiated in patients in the CTA group than in the standard-care group (odds ratio, 1.40; 95% CI, 1.19-1.65).
Conclusion: In patients with stable chest pain, the use of CTA in addition to standard care resulted in a significantly lower rate of death from coronary heart disease or nonfatal myocardial infarction at 5 years; the main contributor to this outcome was a reduced nonfatal myocardial infarction rate. There was no difference in the rate of coronary angiography or coronary revascularization between the 2 groups at 5 years.
Study 2 Overview (DISCHARGE Trial Group)
Objective: To compare the effectiveness of computed tomography (CT) with ICA as a diagnostic tool in patients with stable chest pain and intermediate pretest probability of coronary artery disease (CAD).
Design: Multicenter, randomized, assessor-blinded pragmatic prospective study.
Setting and participants: A total of 3667 patients with stable chest pain and intermediate pretest probability of CAD were enrolled at 26 centers and randomized into CT or ICA groups. Only 3561 patients were included in the modified intention-to-treat analysis, with 1808 patients and 1753 patients in the CT and ICA groups, respectively.
Main outcome measures: The primary outcome was a composite of cardiovascular death, nonfatal myocardial infarction, and nonfatal stroke over 3.5 years. The main secondary outcomes were major procedure-related complications and patient-reported angina pectoris during the last 4 weeks of follow up.
Main results: The primary outcome occurred in 38 of 1808 patients (2.1%) in the CT group and in 52 of 1753 patients (3.0%) in the ICA group (hazard ratio, 0.70; 95% CI, 0.46-1.07; P = .10). The secondary outcomes showed that major procedure-related complications occurred in 9 patients (0.5%) in the CT group and in 33 patients (1.9%) in the ICA group (hazard ratio, 0.26; 95% CI, 0.13-0.55). Rates of patient-reported angina in the final 4 weeks of follow-up were 8.8% in the CT group and 7.5% in the ICA group (odds ratio, 1.17; 95% CI, 0.92-1.48).
Conclusion: Risk of major adverse cardiovascular events from the primary outcome were similar in both the CT and ICA groups among patients with stable chest pain and intermediate pretest probability of CAD. Patients referred for CT had a lower rate of coronary angiography leading to fewer major procedure-related complications in these patients than in those referred for ICA.
Commentary
Evaluation and treatment of obstructive atherosclerosis is an important part of clinical care in patients presenting with angina symptoms.1 Thus, the initial investigation for patients with suspected obstructive CAD includes ruling out acute coronary syndrome and assessing quality of life.1 The diagnostic test should be tailored to the pretest probability for the diagnosis of obstructive CAD.2
In the United States, stress testing traditionally has been used for the initial assessment in patients with suspected CAD,3 but recently CTA has been utilized more frequently for this purpose. Compared to a stress test, which often helps identify and assess ischemia, CTA can provide anatomical assessment, with higher sensitivity to identify CAD.4 Furthermore, it can distinguish nonobstructive plaques that can be challenging to identify with stress test alone.
Whether CTA is superior to stress testing as the initial assessment for CAD has been debated. The randomized PROMISE trial compared patients with stable angina who underwent functional stress testing or CTA as an initial strategy.5 They reported a similar outcome between the 2 groups at a median follow-up of 2 years. However, in the original SCOT-HEART trial (CT coronary angiography in patients with suspected angina due to coronary heart disease), which was published in the same year as the PROMISE trial, the patients who underwent initial assessment with CTA had a numerically lower composite end point of cardiac death and myocardial infarction at a median follow-up of 1.7 years (1.3% vs 2.0%, P = .053).6
Given this result, the SCOT-HEART investigators extended the follow-up to evaluate the composite end point of death from coronary heart disease or nonfatal myocardial infarction at 5 years.7 This trial enrolled patients who were initially referred to a cardiology clinic for evaluation of chest pain, and they were randomized to standard care plus CTA or standard care alone. At a median duration of 4.8 years, the primary outcome was lower in the CTA group (2.3%, 48 patients) than in the standard-care group (3.9%, 81 patients) (hazard ratio, 0.58; 95% CI, 0.41-0.84; P = .004). Both groups had similar rates of invasive coronary angiography and had similar coronary revascularization rates.
It is hypothesized that this lower rate of nonfatal myocardial infarction in patients with CTA plus standard care is associated with a higher rate of preventive therapies initiated in patients in the CTA-plus-standard-care group compared to standard care alone. However, the difference in the standard-care group should be noted when compared to the PROMISE trial. In the PROMISE trial, the comparator group had predominantly stress imaging (either nuclear stress test or echocardiography), while in the SCOT-HEART trial, the group had predominantly stress electrocardiogram (ECG), and only 10% of the patients underwent stress imaging. It is possible the difference seen in the rate of nonfatal myocardial infarction was due to suboptimal diagnosis of CAD with stress ECG, which has lower sensitivity compared to stress imaging.
The DISCHARGE trial investigated the effectiveness of CTA vs ICA as the initial diagnostic test in the management of patients with stable chest pain and an intermediate pretest probability of obstructive CAD.8 At 3.5 years of follow-up, the primary composite of cardiovascular death, myocardial infarction, or stroke was similar in both groups (2.1% vs 3.0; hazard ratio, 0.70; 95% CI, 0.46-1.07; P = .10). Importantly, as fewer patients underwent ICA, the risk of procedure-related complication was lower in the CTA group than in the ICA group. However, it is important to note that only 25% of the patients diagnosed with obstructive CAD had greater than 50% vessel stenosis, which raises the question of whether an initial invasive strategy is appropriate for this population.
The strengths of these 2 studies include the large number of patients enrolled along with adequate follow-up, 5 years in the SCOT-HEART trial and 3.5 years in the DISCHARGE trial. The 2 studies overall suggest the usefulness of CTA for assessment of CAD. However, the control groups were very different in these 2 trials. In the SCOT-HEART study, the comparator group was primarily assessed by stress ECG, while in the DISCHARGE study, the comparator group was primary assessed by ICA. In the PROMISE trial, the composite end point of death, myocardial infarction, hospitalization for unstable angina, or major procedural complication was similar when the strategy of initial CTA was compared to functional testing with imaging (exercise ECG, nuclear stress testing, or echocardiography).5 Thus, clinical assessment is still needed when clinicians are selecting the appropriate diagnostic test for patients with suspected CAD. The most recent guidelines give similar recommendations for CTA compared to stress imaging.9 Whether further improvement in CTA acquisition or the addition of CT fractional flow reserve can further improve outcomes requires additional study.
Applications for Clinical Practice and System Implementation
In patients with stable chest pain and intermediate pretest probability of CAD, CTA is useful in diagnosis compared to stress ECG and in reducing utilization of low-yield ICA. Whether CTA is more useful compared to the other noninvasive stress imaging modalities in this population requires further study.
Practice Points
- In patients with stable chest pain and intermediate pretest probability of CAD, CTA is useful compared to stress ECG.
- Use of CTA can potentially reduce the use of low-yield coronary angiography.
–Thai Nguyen, MD, Albert Chan, MD, Taishi Hirai, MD
University of Missouri, Columbia, MO
1. Knuuti J, Wijns W, Saraste A, et al. 2019 ESC Guidelines for the diagnosis and management of chronic coronary syndromes. Eur Heart J. 2020;41(3):407-477. doi:10.1093/eurheartj/ehz425
2. Nakano S, Kohsaka S, Chikamori T et al. JCS 2022 guideline focused update on diagnosis and treatment in patients with stable coronary artery disease. Circ J. 2022;86(5):882-915. doi:10.1253/circj.CJ-21-1041.
3. Fihn SD, Gardin JM, Abrams J, et al. 2012 ACCF/AHA/ACP/AATS/PCNA/SCAI/STS Guideline for the diagnosis and management of patients with stable ischemic heart disease: a report of the American College of Cardiology Foundation/American Heart Association Task Force on Practice Guidelines, and the American College of Physicians, American Association for Thoracic Surgery, Preventive Cardiovascular Nurses Association, Society for Cardiovascular Angiography and Interventions, and Society of Thoracic Surgeons. J Am Coll Cardiol. 2012;60(24):e44-e164. doi:10.1016/j.jacc.2012.07.013
4. Arbab-Zadeh A, Di Carli MF, Cerci R, et al. Accuracy of computed tomographic angiography and single-photon emission computed tomography-acquired myocardial perfusion imaging for the diagnosis of coronary artery disease. Circ Cardiovasc Imaging. 2015;8(10):e003533. doi:10.1161/CIRCIMAGING
5. Douglas PS, Hoffmann U, Patel MR, et al. Outcomes of anatomical versus functional testing for coronary artery disease. N Engl J Med. 2015;372(14):1291-300. doi:10.1056/NEJMoa1415516
6. SCOT-HEART investigators. CT coronary angiography in patients with suspected angina due to coronary heart disease (SCOT-HEART): an open-label, parallel-group, multicentre trial. Lancet. 2015;385:2383-2391. doi:10.1016/S0140-6736(15)60291-4
7. SCOT-HEART Investigators, Newby DE, Adamson PD, et al. Coronary CT angiography and 5-year risk of myocardial infarction. N Engl J Med. 2018;379(10):924-933. doi:10.1056/NEJMoa1805971
8. DISCHARGE Trial Group, Maurovich-Horvat P, Bosserdt M, et al. CT or invasive coronary angiography in stable chest pain. N Engl J Med. 2022;386(17):1591-1602. doi:10.1056/NEJMoa2200963
9. Writing Committee Members, Lawton JS, Tamis-Holland JE, et al. 2021 ACC/AHA/SCAI guideline for coronary artery revascularization: a report of the American College of Cardiology/American Heart Association Joint Committee on Clinical Practice Guidelines. J Am Coll Cardiol. 2022;79(2):e21-e129. doi:10.1016/j.jacc.2021.09.006
Study 1 Overview (SCOT-HEART Investigators)
Objective: To assess cardiovascular mortality and nonfatal myocardial infarction at 5 years in patients with stable chest pain referred to cardiology clinic for management with either standard care plus computed tomography angiography (CTA) or standard care alone.
Design: Multicenter, randomized, open-label prospective study.
Setting and participants: A total of 4146 patients with stable chest pain were randomized to standard care or standard care plus CTA at 12 centers across Scotland and were followed for 5 years.
Main outcome measures: The primary end point was a composite of death from coronary heart disease or nonfatal myocardial infarction. Main secondary end points were nonfatal myocardial infarction, nonfatal stroke, and frequency of invasive coronary angiography (ICA) and coronary revascularization with percutaneous coronary intervention or coronary artery bypass grafting.
Main results: The primary outcome including the composite of cardiovascular death or nonfatal myocardial infarction was lower in the CTA group than in the standard-care group at 2.3% (48 of 2073 patients) vs 3.9% (81 of 2073 patients), respectively (hazard ratio, 0.59; 95% CI, 0.41-0.84; P = .004). Although there was a higher rate of ICA and coronary revascularization in the CTA group than in the standard-care group in the first few months of follow-up, the overall rates were similar at 5 years, with ICA performed in 491 patients and 502 patients in the CTA vs standard-care groups, respectively (hazard ratio, 1.00; 95% CI, 0.88-1.13). Similarly, coronary revascularization was performed in 279 patients in the CTA group and in 267 patients in the standard-care group (hazard ratio, 1.07; 95% CI, 0.91-1.27). There were, however, more preventive therapies initiated in patients in the CTA group than in the standard-care group (odds ratio, 1.40; 95% CI, 1.19-1.65).
Conclusion: In patients with stable chest pain, the use of CTA in addition to standard care resulted in a significantly lower rate of death from coronary heart disease or nonfatal myocardial infarction at 5 years; the main contributor to this outcome was a reduced nonfatal myocardial infarction rate. There was no difference in the rate of coronary angiography or coronary revascularization between the 2 groups at 5 years.
Study 2 Overview (DISCHARGE Trial Group)
Objective: To compare the effectiveness of computed tomography (CT) with ICA as a diagnostic tool in patients with stable chest pain and intermediate pretest probability of coronary artery disease (CAD).
Design: Multicenter, randomized, assessor-blinded pragmatic prospective study.
Setting and participants: A total of 3667 patients with stable chest pain and intermediate pretest probability of CAD were enrolled at 26 centers and randomized into CT or ICA groups. Only 3561 patients were included in the modified intention-to-treat analysis, with 1808 patients and 1753 patients in the CT and ICA groups, respectively.
Main outcome measures: The primary outcome was a composite of cardiovascular death, nonfatal myocardial infarction, and nonfatal stroke over 3.5 years. The main secondary outcomes were major procedure-related complications and patient-reported angina pectoris during the last 4 weeks of follow up.
Main results: The primary outcome occurred in 38 of 1808 patients (2.1%) in the CT group and in 52 of 1753 patients (3.0%) in the ICA group (hazard ratio, 0.70; 95% CI, 0.46-1.07; P = .10). The secondary outcomes showed that major procedure-related complications occurred in 9 patients (0.5%) in the CT group and in 33 patients (1.9%) in the ICA group (hazard ratio, 0.26; 95% CI, 0.13-0.55). Rates of patient-reported angina in the final 4 weeks of follow-up were 8.8% in the CT group and 7.5% in the ICA group (odds ratio, 1.17; 95% CI, 0.92-1.48).
Conclusion: Risk of major adverse cardiovascular events from the primary outcome were similar in both the CT and ICA groups among patients with stable chest pain and intermediate pretest probability of CAD. Patients referred for CT had a lower rate of coronary angiography leading to fewer major procedure-related complications in these patients than in those referred for ICA.
Commentary
Evaluation and treatment of obstructive atherosclerosis is an important part of clinical care in patients presenting with angina symptoms.1 Thus, the initial investigation for patients with suspected obstructive CAD includes ruling out acute coronary syndrome and assessing quality of life.1 The diagnostic test should be tailored to the pretest probability for the diagnosis of obstructive CAD.2
In the United States, stress testing traditionally has been used for the initial assessment in patients with suspected CAD,3 but recently CTA has been utilized more frequently for this purpose. Compared to a stress test, which often helps identify and assess ischemia, CTA can provide anatomical assessment, with higher sensitivity to identify CAD.4 Furthermore, it can distinguish nonobstructive plaques that can be challenging to identify with stress test alone.
Whether CTA is superior to stress testing as the initial assessment for CAD has been debated. The randomized PROMISE trial compared patients with stable angina who underwent functional stress testing or CTA as an initial strategy.5 They reported a similar outcome between the 2 groups at a median follow-up of 2 years. However, in the original SCOT-HEART trial (CT coronary angiography in patients with suspected angina due to coronary heart disease), which was published in the same year as the PROMISE trial, the patients who underwent initial assessment with CTA had a numerically lower composite end point of cardiac death and myocardial infarction at a median follow-up of 1.7 years (1.3% vs 2.0%, P = .053).6
Given this result, the SCOT-HEART investigators extended the follow-up to evaluate the composite end point of death from coronary heart disease or nonfatal myocardial infarction at 5 years.7 This trial enrolled patients who were initially referred to a cardiology clinic for evaluation of chest pain, and they were randomized to standard care plus CTA or standard care alone. At a median duration of 4.8 years, the primary outcome was lower in the CTA group (2.3%, 48 patients) than in the standard-care group (3.9%, 81 patients) (hazard ratio, 0.58; 95% CI, 0.41-0.84; P = .004). Both groups had similar rates of invasive coronary angiography and had similar coronary revascularization rates.
It is hypothesized that this lower rate of nonfatal myocardial infarction in patients with CTA plus standard care is associated with a higher rate of preventive therapies initiated in patients in the CTA-plus-standard-care group compared to standard care alone. However, the difference in the standard-care group should be noted when compared to the PROMISE trial. In the PROMISE trial, the comparator group had predominantly stress imaging (either nuclear stress test or echocardiography), while in the SCOT-HEART trial, the group had predominantly stress electrocardiogram (ECG), and only 10% of the patients underwent stress imaging. It is possible the difference seen in the rate of nonfatal myocardial infarction was due to suboptimal diagnosis of CAD with stress ECG, which has lower sensitivity compared to stress imaging.
The DISCHARGE trial investigated the effectiveness of CTA vs ICA as the initial diagnostic test in the management of patients with stable chest pain and an intermediate pretest probability of obstructive CAD.8 At 3.5 years of follow-up, the primary composite of cardiovascular death, myocardial infarction, or stroke was similar in both groups (2.1% vs 3.0; hazard ratio, 0.70; 95% CI, 0.46-1.07; P = .10). Importantly, as fewer patients underwent ICA, the risk of procedure-related complication was lower in the CTA group than in the ICA group. However, it is important to note that only 25% of the patients diagnosed with obstructive CAD had greater than 50% vessel stenosis, which raises the question of whether an initial invasive strategy is appropriate for this population.
The strengths of these 2 studies include the large number of patients enrolled along with adequate follow-up, 5 years in the SCOT-HEART trial and 3.5 years in the DISCHARGE trial. The 2 studies overall suggest the usefulness of CTA for assessment of CAD. However, the control groups were very different in these 2 trials. In the SCOT-HEART study, the comparator group was primarily assessed by stress ECG, while in the DISCHARGE study, the comparator group was primary assessed by ICA. In the PROMISE trial, the composite end point of death, myocardial infarction, hospitalization for unstable angina, or major procedural complication was similar when the strategy of initial CTA was compared to functional testing with imaging (exercise ECG, nuclear stress testing, or echocardiography).5 Thus, clinical assessment is still needed when clinicians are selecting the appropriate diagnostic test for patients with suspected CAD. The most recent guidelines give similar recommendations for CTA compared to stress imaging.9 Whether further improvement in CTA acquisition or the addition of CT fractional flow reserve can further improve outcomes requires additional study.
Applications for Clinical Practice and System Implementation
In patients with stable chest pain and intermediate pretest probability of CAD, CTA is useful in diagnosis compared to stress ECG and in reducing utilization of low-yield ICA. Whether CTA is more useful compared to the other noninvasive stress imaging modalities in this population requires further study.
Practice Points
- In patients with stable chest pain and intermediate pretest probability of CAD, CTA is useful compared to stress ECG.
- Use of CTA can potentially reduce the use of low-yield coronary angiography.
–Thai Nguyen, MD, Albert Chan, MD, Taishi Hirai, MD
University of Missouri, Columbia, MO
1. Knuuti J, Wijns W, Saraste A, et al. 2019 ESC Guidelines for the diagnosis and management of chronic coronary syndromes. Eur Heart J. 2020;41(3):407-477. doi:10.1093/eurheartj/ehz425
2. Nakano S, Kohsaka S, Chikamori T et al. JCS 2022 guideline focused update on diagnosis and treatment in patients with stable coronary artery disease. Circ J. 2022;86(5):882-915. doi:10.1253/circj.CJ-21-1041.
3. Fihn SD, Gardin JM, Abrams J, et al. 2012 ACCF/AHA/ACP/AATS/PCNA/SCAI/STS Guideline for the diagnosis and management of patients with stable ischemic heart disease: a report of the American College of Cardiology Foundation/American Heart Association Task Force on Practice Guidelines, and the American College of Physicians, American Association for Thoracic Surgery, Preventive Cardiovascular Nurses Association, Society for Cardiovascular Angiography and Interventions, and Society of Thoracic Surgeons. J Am Coll Cardiol. 2012;60(24):e44-e164. doi:10.1016/j.jacc.2012.07.013
4. Arbab-Zadeh A, Di Carli MF, Cerci R, et al. Accuracy of computed tomographic angiography and single-photon emission computed tomography-acquired myocardial perfusion imaging for the diagnosis of coronary artery disease. Circ Cardiovasc Imaging. 2015;8(10):e003533. doi:10.1161/CIRCIMAGING
5. Douglas PS, Hoffmann U, Patel MR, et al. Outcomes of anatomical versus functional testing for coronary artery disease. N Engl J Med. 2015;372(14):1291-300. doi:10.1056/NEJMoa1415516
6. SCOT-HEART investigators. CT coronary angiography in patients with suspected angina due to coronary heart disease (SCOT-HEART): an open-label, parallel-group, multicentre trial. Lancet. 2015;385:2383-2391. doi:10.1016/S0140-6736(15)60291-4
7. SCOT-HEART Investigators, Newby DE, Adamson PD, et al. Coronary CT angiography and 5-year risk of myocardial infarction. N Engl J Med. 2018;379(10):924-933. doi:10.1056/NEJMoa1805971
8. DISCHARGE Trial Group, Maurovich-Horvat P, Bosserdt M, et al. CT or invasive coronary angiography in stable chest pain. N Engl J Med. 2022;386(17):1591-1602. doi:10.1056/NEJMoa2200963
9. Writing Committee Members, Lawton JS, Tamis-Holland JE, et al. 2021 ACC/AHA/SCAI guideline for coronary artery revascularization: a report of the American College of Cardiology/American Heart Association Joint Committee on Clinical Practice Guidelines. J Am Coll Cardiol. 2022;79(2):e21-e129. doi:10.1016/j.jacc.2021.09.006
Path to parenthood in cardiology training fraught with obstacles
The first international survey of parental benefits and policies among cardiovascular training programs shows wide variability among institutions.
Although a majority of cardiology fellows became parents during training, the survey found that family benefits and policies were not uniformly available and that knowledge about the existence of such policies was low across all institutions.
The findings are published in the Journal of the American College of Cardiology.
Such variability highlights disparities in real-world experiences, say Estefania Oliveros, MD, Temple University Hospital, Philadelphia, and colleagues.
“There are no policies to protect cardiology trainees when they become parents that are uniform across the United States or even internationally, even though, according to our survey, 61.7% become parents during training,” Dr. Oliveros told this news organization.
Dr. Oliveros said she wanted to learn more about the status of institutional practices surrounding pregnant trainees during cardiovascular fellowship, not only in the U.S., but internationally: “I wanted to study this because of my own experience.”
“I was probably the first pregnant trainee at my institution, and there were no specific policies in place, so I had to find out on my own what to do about radiation safety, where I would breastfeed, schedule changes, how that would impact my graduation time, things like that,” Dr. Oliveros said. “It would be nice if you had the resources and your institution could accommodate your needs, instead of every time you have a pregnant person on your staff, you have to reinvent the wheel.”
Dr. Oliveros and colleagues conducted an online survey during August 2020-October 2020 that was distributed via social media. Responses were made anonymous to encourage unbiased feedback.
Among the 417 completed responses, 47 (11.3%) were from training program directors, 146 (35%) from current or former pregnant trainees, and 224 (53.7%) from current or former trainees who were not pregnant during cardiology training. Two-thirds of the respondents (67.1%) were parents.
Most survey respondents said they became pregnant during the third year of general cardiology (29.1%), followed by the first year of general cardiology (26.3%), and the second year of general cardiology (23.5%).
Only 13 of the 47 training program directors (27.7%) received guidance or training on how to accommodate pregnant trainees during fellowship.
Additionally, 26% of the trainees reported their institution had readily available breastfeeding and pumping policies, 39% responded that their institution had no such policies, and 34.9% said they did not know.
Nearly one-half of the programs offered rearrangement of schedules because of radiation concerns, 27.5% did not.
The amount of parental leave varied greatly worldwide. For Europe, Central and South America, Africa, and Australia, the average parental leave was more than 4 months; for Canada, it was more than 3 months; for the United States, it was 1 to 2 months; and for Asia, it was 3 to 4 weeks.
“There is no uniformity, no policies for things like breastfeeding or places where you can pump. None of that is installed, even though by law we’re supposed to have these things,” Dr. Oliveros said.
In all countries, paternity leave was uncommon (2.6% of respondents), even though 48.5% of the programs had paternity leave.
“I would like to see associations, program directors, even trainees helping each other in finding ways to accommodate parents to promote wellness and assure that trainees can have both good training and life balance,” she added.
In an accompanying editorial, Ileana L. Piña, MD, MPH, Thomas Jefferson Institute, Philadelphia, writes: “Enough has been said about our need for a greater percentage of women cardiologists. There is no need to further debate that fact. However, it is puzzling that despite > 50% of medical students being women, the cardiology specialty is fraught with recent survey reports of hostility in the workplace, concerns of long hours, exposure to radiation, and poor work-life balance that can compel trainees to choose delaying pregnancy or taking unpaid leave, which will, in turn, delay training. Therefore, it is not surprising that only 14.9% of cardiologist specialists and 21.9% of cardiology fellows are women.”
Dr. Piña notes that while the authors understand that it’s difficult to change national policies, they issue a “call to action” for organizations and program directors to demonstrate leadership by developing fair and balanced decisions regarding parental policies.
“Those decisions are so impactful that they can change career trajectories for the better or worse ... the current status is unacceptable and must change for the benefit of all trainees, their families, and the program directors. The problem is too important and pervasive,” she adds.
Dr. Piña concludes: “Perhaps if the women who are the subjects of, and often the unwitting party to, administrative decisions about their lives, choices, and welfare were invited to contribute to the changes, we would finally see an increase in the number of women in cardiology careers. After all, aren’t we about diversity and belonging?”
“We need to normalize pregnancy and parental leave across the globe,” Laxmi S. Mehta, MD, Ohio State University Weiner Medical Center, Columbus, said in an interview.
As previously reported, Dr. Mehta recently led a study that surveyed 323 women cardiologists who were working while they were pregnant. Her study found that 75% of these women experienced discriminatory maternity leave practices, some of which were likely violations of the federal Family and Medical Leave Act.
“If we want more women to pursue a career in cardiology, then employers and health systems need to adequately support parenthood, including allowing people to spend uninterrupted time with their newborns without the fear of discrimination, retaliation, or financial burden,” Dr. Mehta said.
Limitations of the study are the small sample size, potential for bias associated with social media distribution, and the fact that 75% of respondents were women, Dr. Oliveros and colleagues write.
Dr. Oliveros, Dr. Piña, and Dr. Mehta report no relevant financial relationships.
A version of this article first appeared on Medscape.com.
Paradigm-challenging heart failure treatment strategy hopeful in early trial
A small group of patients with heart failure (HF) who underwent a novel transcatheter nerve-ablation procedure seemed to benefit with improved hemodynamics, symptoms, and quality of life in an admittedly limited observational series.
All had HF with preserved ejection fraction (HFpEF) and remained on guideline-directed medical therapy during the study.
The open-label experience has launched a randomized trial, featuring a sham control group, that could ultimately challenge dogma about volume overload in patients with chronic and acute HF and the perceived essential role of diuretics.
Researchers see transvenous ablation of the right greater splanchnic nerve (GSN) as potentially appropriate for patients with HF, regardless of ventricular function or acuity. But the ongoing REBALANCE-HF trial aims to enroll up to 80 patients with chronic HFpEF.
Meanwhile, the current 18 patients with elevated resting or exertional pulmonary capillary wedge pressure (PCWP), given the procedure as part of the main trial’s “roll-in” phase, showed declines in exercise PCWP after 1 month (P = .007) and improved quality-of-life scores at both 1 and 3 months (P < .01). Also at 1 month, a third of the patients improved by at least one step in NYHA functional class.
The procedure, called splanchnic ablation for volume management (SAVM), could potentially be used “across the spectrum of acute and chronic heart failure, maybe even with reduced ejection fraction (HFrEF) and preserved ejection fraction,” Marat Fudim, MD, MHS, Duke University Medical Center, Durham, N.C., told this news organization.
However, “for outcomes, we’ve really only looked in the ambulatory setting,” and only at symptomatic and functional responses. To that extent, based on the current experience and a few small previous studies, Dr. Fudim said, SAVM seems to benefit patients with HF in general who have dyspnea at exercise. Beyond that, the kind of patient who may be most suitable for it “is something I hope we will be able answer once the randomized dataset is in.”
Dr. Fudim reported the REBALANCE-HF roll-in results at the Heart Failure Association of the European Society of Cardiology (HFA-ESC) 2022 sessions, held virtually and live in Madrid. He is also lead author on the same-day publication in the European Journal of Heart Failure.
A different treatment paradigm
Splanchnic-nerve blockade as a possible HF treatment is based on growing evidence that volume overload in patients with HF is not always the cause, at least not a main cause, of congestion and dyspnea. Rather, those classic HF signs and symptoms may often be triggered by adverse redistribution of stable fluid volume from primarily the splanchnic vascular compartment to the intrathoracic space.
In other words, what might seem like classic volume overload calling for diuresis often might actually be euvolemic redistribution of fluid from the abdomen to the chest, raising intracardiac pressures and causing dyspnea.
In that scenario, loop diuretics might only dehydrate the patient and potentially put the kidneys at risk, Dr. Fudim proposed. His recent experience with HF patients implanted with a pulmonary-artery pressure monitor, he said, suggests many who received standard volume-overload therapy had actually been normo- or hypovolemic.
More then half the patients “did not have high volume, they just had high pressures,” he said. “So there is a significant portion of the population that has pathological processes leading to high pressures, but it’s not volume overload. Diuresing those patients would probably not be the right decision.”
The unilateral SAVM procedure appears to attenuate sympathetically mediated splanchnic volume redistribution to the heart and lungs, but as it doesn’t affect the left GSN, preserves some normal sympathetic response.
Sometimes in studies of surgical or catheter-based SAVM, Dr. Fudim said, “we have observationally seen that people discontinued diuretics or decreased doses in the treatment arm.”
‘Beyond our classical thinking’
It’s “impressive” that such right-GSN ablation seemed to reduce exercise-filling pressures, but one should be circumspect because “it’s way beyond our classical thinking,” Wilfried Mullens, MD, PhD, Hospital Oost-Limburg, Genk, Belgium, said as a panelist after Dr. Fudim’s presentation.
“These are invasive procedures,” he noted, “and our physiological understanding does not always match up with what we’re doing in real life, if you look at other interventional procedures, like renal denervation, which showed neutral effects, or if you look at even interatrial shunt devices, which might even be dangerous.”
The field should be “very prudent” before using SAVM in practice, which shouldn’t be “before we have sufficient data to support the efficacy and safety,” Dr. Mullens said. “It remains to be seen how treatment success will be defined. Is it during exercise? How long does the treatment last? What is the effect of the treatment over time; is it not harmful? These are things that we don’t know yet.”
The procedure was considered successful in all 18 patients, 14 of whom were women and 16 of whom were in NYHA class 3. Their average age was 75, and their mean left ventricular ejection fraction (LVEF) at baseline was 61%. The primary efficacy endpoints were a reduction in PCWP at rest, with legs raised, and at 20W exercise at 1 month. Their baseline invasively measured peak exercise PCWP was at least 25 mm Hg.
At 1 month, mean PCWP at 20W exercise fell from 36.4 mm Hg to 28.9 mm Hg (P = .007) and peak PCWP declined from 39.5 mm Hg to 31.9 mm Hg (P = .013); resting PCWP wasn’t significantly affected. Twelve patients improved by at least one NYHA functional class (P = .02).
Scores on the Kansas City Cardiomyopathy Questionnaire (KCCQ), which assesses quality of life, improved by 22 points at 1 month and 18.3 points at 3 months (P < .01 for both differences).
No significant effects on 6-minute walk distance or natriuretic peptide levels were observed, nor were any observed on LVEF or echocardiographic measures of diastolic function, left ventricular (LV) atrial volume, or LV mass at 3 months.
Three “nonserious” device-related adverse events were observed, including one case of acute decompensation early in the experience, ostensibly due to excessive saline administration, Dr. Fudim reported. There was also one case of transient periprocedural hypertension and one instance of postprocedure back pain.
The SAVM procedure is performed transvenously and in general is technically “really not that challenging,” Dr. Fudim said. In most cases, the necessary skills would be accessible not only to interventional cardiologists but also heart failure specialists. “I have performed this procedure myself, and I’m a heart failure guy.”
The REBALANCE-HF roll-in phase and main trial are supported by Axon Therapies. Dr. Fudim discloses receiving support from Bayer, Bodyport, and BTG Specialty Pharmaceuticals; and consulting fees from Abbott, Audicor, Axon Therapies, Bodyguide, Bodyport, Boston Scientific, CVRx, Daxor, Edwards LifeSciences, Feldschuh Foundation, Fire1, Gradient, Intershunt, NXT Biomedical, Pharmacosmos, PreHealth, Splendo, Vironix, Viscardia, and Zoll. Dr. Mullens discloses receiving fees for speaking from Medtronic, Abbott, Novartis, Boston Scientific, AstraZeneca, and Boehringer Ingelheim.
A version of this article first appeared on Medscape.com.
FROM ESC HEART FAILURE 2022
SGLT2 inhibitors as first-line therapy in type 2 diabetes?
Use of sodium–glucose cotransporter-2 (SGLT-2) inhibitors rather than metformin as first-line treatment for type 2 diabetes appears to cut the risk for heart failure hospitalization but not myocardial infarction, stroke, or all-cause mortality, a new analysis of real-world data suggests.
Safety findings were similar, except for the fact that genital infections were more common with SGLT-2 inhibitors.
The study was conducted using claims data from two large U.S. insurance databases and Medicare. Propensity score matching was used to account for baseline differences.
The study was conducted by HoJin Shin, BPharm, PhD, a postdoctoral research fellow at Brigham and Women’s Hospital and Harvard Medical School, both in Boston, and colleagues. The findings were published online in Annals of Internal Medicine.
“Those who start SGLT-2 inhibitors as first line show similar risks, compared with metformin in MI, stroke, and all-cause mortality outcomes. Strikingly and consistently, SGLT-2 inhibitors show lower risk for hospitalization for heart failure, which is consistent with the findings from cardiovascular outcomes trials,” Dr. Shin said in an interview.
Just a beginning step, although trial probably wasn’t long enough
However, she added, “I don’t want to overstate anything. ... We aren’t powered enough to investigate who would benefit the most. ... As a pharmacoepidemiologist, I think it’s my duty to provide high-quality evidence so we can actually help physicians and patients make better decisions on their medication. Our current research is just a beginning step.”
Asked to comment, Simeon I. Taylor, MD, PhD, professor of medicine at the University of Maryland, Baltimore, told this news organization, “This study generally confirmed conclusions from published RCTs [randomized clinical trials]. No real surprises, albeit the conclusions may not fully support some of the most enthusiastic claims for SGLT-2 inhibitors with respect to MI, stroke, and cardiovascular death.”
Indeed, Dr. Taylor noted that only two SGLT-2 inhibitors, canagliflozin and empagliflozin, were shown to have a statistically significant association with decreased major adverse cardiovascular events.
In contrast, neither dapagliflozin nor ertugliflozin showed significant benefit regarding those outcomes.
He also pointed out that those four major SLGT-2 inhibitor cardiovascular outcomes trials were placebo-controlled rather than head-to-head trials in which they were compared to an active comparator such as metformin.
“Viewed in this light, it’s probably not surprising that the present study did not demonstrate a robust benefit for SGLT-2 inhibitors to decrease [major adverse CV events].”
The duration of follow-up in the current study is also a limitation, he added.
“The majority of patients were followed for a year or less. This is probably sufficient to assess the impact of some pharmacological mechanisms, for example, the beneficial impact to decrease risk of heart failure by promoting urinary sodium excretion. However, it’s probably insufficient time to observe a beneficial impact on atherosclerosis. For example, there is typically a lag of several years before statins demonstrate efficacy with respect to adverse cardiovascular events.”
Nevertheless, he said, “it provides strong support for benefit with respect to decreasing risk of hospitalization for heart failure.”
He noted that while metformin is currently significantly cheaper than any SGLT-2 inhibitors, once the latter become available as generics, they will be cheaper, and this will likely have a bearing on prescribing decisions.
“Availability of generic SGLT-2 inhibitors offers potential to transform prescribing patterns for type 2 diabetes,” he noted.
First-line SGLT2 inhibitors versus metformin: Most outcomes similar
The study data came from two commercial U.S. health insurance databases, Optum Clinfomatics Data Mart and IBM Marketscan, and from Medicare fee-for-service enrollees.
From April 2013 through March 2020, a total of 9,334 patients began treatment with first-line SGLT-2 inhibitors; 819,973 patients began taking metformin. After 1:2 propensity score matching for confounders, there were 8,613 participants in the SGLT-2 inhibitor group and 17,226 in the group that began treatment with metformin.
The mean follow-up times were 10.7 months for patients taking SGLT-2 inhibitors and 12.2 months for patients taking metformin.
Incidence rates per 1,000 person-years for the composite of hospitalization for MI, hospitalization for ischemic or hemorrhagic stroke, or all-cause mortality (MI/stroke/mortality) were 15.0 versus 16.2 for SLGT-2 inhibitors versus metformin, not a significant difference (hazard ratio, 0.96).
However, for the composite of heart failure hospitalization or all-cause mortality, the rates were 18.3 versus 23.5, a significant difference, with an HR of 0.80. The benefit was seen beginning at about 6 months.
Compared with metformin, SGLT-2 inhibitors showed a significantly lower risk for heart failure hospitalization (HR, 0.78), a numerically (but not significantly) lower risk for MI (HR, 0.70), and similar risks for stroke, mortality, and MI/stroke/HHF/mortality.
Genital infections were significantly more common with SGLT-2 inhibitors (54.1 vs. 23.7 per 1,000 person-years; HR, 2.19). Other safety measures were similar, including acute kidney injury, bone fractures, severe hypoglycemia, diabetic ketoacidosis, and lower-limb amputations.
How does cost factor in?
A sensitivity analysis aimed at examining the possible effect of unmeasured socioeconomic status showed no difference in cardiovascular benefit for first-line SGLT-2 inhibitors and metformin, compared with first-line dipeptidyl peptidase–4 (DPP-4) inhibitors, which cost more than metformin; it is not known what effect DPP-4 inhibitors have on the cardiovascular outcomes of interest.
Cost and insurance coverage factor into the benefit/risk calculation. Metformin is far less costly than any of the SGLT-2 inhibitors – roughly $10 to $20 per month, compared with more than $500 a month.
However, “for some fortunate patients with the most generous pharmacy benefit insurance coverage, the out-of-pocket cost of brand name drugs like SGLT-2 inhibitors is substantially lower,” Dr. Taylor noted.
He said that the current study “raises questions about whether the clinical benefits of SGLT-2 inhibitors as initial monotherapy justify the higher price relative to metformin. The data in this paper suggest that the value case for SGLT-2 inhibitors is strongest for patients with the greatest risk to be hospitalized for heart failure.”
Indeed, Dr. Shin said, “Once we get more information, it may just help in extending the coverage from insurance companies and Medicare/Medicaid, to lower the barrier to access.”
Dr. Taylor reiterated that patents on some of the early SGLT-2 inhibitors are expected to expire in the next few years, which would make it possible for generic versions to be approved. “At that point, prices would likely fall, possibly to levels similar to metformin.”
The study was funded by grant support from the Division of Pharmacoepidemiology and Pharmacoeconomics, department of medicine, Brigham and Women’s Hospital, and Harvard Medical School, the National Institute on Aging, and the Patient-Centered Outcomes Research Institute. Dr. Shin has disclosed no relevant financial relationships. Dr. Taylor is a consultant for Ionis Pharmaceuticals.
A version of this article first appeared on Medscape.com.
FROM ANNALS OF INTERNAL MEDICINE
ESG’s cardiometabolic benefits last 5 years
SAN DIEGO – Endoscopic sleeve gastroplasty (ESG) led to sustained weight loss and a reduction of cardiometabolic syndrome comorbidities at 5 years, according to a new retrospective analysis of prospectively collected data.
Improved cardiometabolic outcomes following bariatric surgery have been well documented, but ESG is relatively new, so its outcomes haven’t been as well described. The outcomes are encouraging, though not as good as those of bariatric surgery. “It’s still better, but only one percent of the patients undergo the surgery, even though they’re candidates,” said Donevan Westerveld, MD, who presented the study at the annual Digestive Disease Week® (DDW).
Improvements included weight, HbA1c percentage, hypertension, and low-density lipoprotein. “I was surprised that the LDL decreased numerically, not so much HbA1c and hypertension. I knew [those] would come down with weight loss,” said Dr. Westerveld, a second-year fellow at Weill Cornell Medicine, New York.
He also called for guidelines for ESG. “Given the fact there’s an improvement of comorbid conditions, it’s something we should look at,” said Dr. Westerveld.
“It’s fascinating because it tells us two important things about endoscopic sleeve gastroplasty. One, [the benefit] in the majority of cases lasts at least 5 years. The weight loss is durable. And then it tells us that there’s improvement in all the cardiometabolic factors that matter, and those effects are seen all the way up to 5 years. So very important findings that support the benefits of the endoscopic gastroplasty in obesity and cardiometabolic risks and metabolic syndrome,” said Andres Acosta, MD, PhD, a comoderator of the session where the study was presented. He is assistant professor of medicine and a consultant in gastroenterology and hepatology at Mayo Clinic in Rochester, Minn.
The findings should also encourage more innovation. “Doing these endoscopic procedures, having successful results that hold for 5 years, opens the path for new and better procedures, so we have better weight loss,” said Dr. Acosta.
Previous work by Dr. Westerveld’s group found benefits of ESG at 12 months, including improvements in mean HbA1c levels in all patients (6.1%-5.5%; P = .05) and those with diabetes or prediabetes (6.6%-5.6%; P = .02), reduction in mean waist circumference (119.66-92.75 cm; P < .001), reduction in systolic blood pressure (129.02-122.23 mg/dL; P = .023), triglycerides (131.84-92.36 mg/dL; P = .017), and alanine aminotransferase (ALT, 32.26-20.68 mg/dL; P < .001).
In the new study, the group followed 255 patients at 1, 3, and 5 years post procedure who were treated consecutively at Weill Cornell Medicine from 2013 to 2021. Among the patients were those who had failed weight loss measures and were either not candidates for surgery or had refused surgery.
The mean age was 45.5 years, 69% were female, and the mean body mass index was 38.6. Overall, 40.3% had prediabetes or diabetes, 26.7% had hypertension, 60.8% had low-density lipoprotein (LDL) above 100 mg/dL, and 29.3% had elevated ALT. Sixty-six percent had been followed up at 1 year, 78% at 3 years, and 87% at 5 years.
Weight loss averaged 15.7% at 1 year and 15.3% at year 5, and the values were statistically significant. Among patients with diabetes and prediabetes, HbA1c percentage dropped from a baseline value of 6.4% to 5.7% at year 1, 6.1% at year 3, and 5.8% at year 5 (P < .05 for all). For all patients, the value dropped from 5.8% at baseline to 5.6% at year 1, 5.7% at year 3, and 5.4% at year 5. These changes were not statistically significant.
Systolic blood pressure went down among patients with stage 1 hypertension, from 135 mm Hg at baseline to 122 at year 1 and 121 at year 3 (P < .05 or both), but the mean value increased to 129 at year 5 and was not statistically significant. LDL among all patients declined from 136 mg/dL at baseline to 125 at year 1 (nonsignificant), 115 at year 3 (P < .05), and 109 at year 5 (P < .05). Alanine transaminase values declined from about 29 at baseline to 25 at year 1, 26 at year 3, and 24 at year 5 (P < .05 for all).
Serious adverse events were rare, occurring in just two cases (< 1%).
The study was limited by lack of a sham control, and its retrospective data may have included bias because many of the procedures were not paid for by insurance, leading to high rates of self-pay.
Dr. Westerveld has no relevant financial disclosures. Dr. Acosta is a founder of Gila Therapeutics and Phenomix Sciences. Dr. Acosta consults for Amgen, Gila Therapeutics, Rhythm Pharmaceuticals, and General Mills. He has received funding from Rhythm, Novo Nordisk, Apollo Endosurgery, and USGI Medical.
At DDW 2022
Takotsubo syndrome more deadly in men
Takotsubo syndrome occurs much more frequently in women than it does in men, but men are much more likely to die from it, according to the results of a new study.
In an analysis of almost 2,500 patients with Takotsubo syndrome (TSS) who were enrolled in an international registry, men, who made up just 11% of the sample, had significantly higher rates of cardiogenic shock and were more than twice as likely to die in the hospital than their female counterparts.
The authors concluded that TSS in males requires close in-hospital monitoring and long-term follow-up. Their study was published in the Journal of the American College of Cardiology.
Takotsubo syndrome is a condition characterized by acute heart failure and transient ventricular contractile dysfunction that can be precipitated by acute emotional or physical stress. It affects mostly women, particularly postmenopausal women, although the reasons for this are still not fully clear, Luca Arcari, MD, from the Institute of Cardiology, Madre Giuseppina Vannini Hospital, Rome, and colleagues wrote.
The syndrome also affects men, and recent data have identified that male sex is associated with worse outcomes. But, because it occurs relatively uncommonly in men, information about outcomes in men is limited.
To shed more light on the influence of gender on TTS, the investigators looked at 2,492 TTS patients (286 men, 2,206 women) who were participants in the GEIST (German Italian Spanish Takotsubo) registry and compared the clinical features and short- and long-term outcomes between the two.
Male patients were significantly younger (69 years) than women (71 years; P = .005) and had a higher prevalence of comorbid conditions, including diabetes (25% vs. 19%; P = .01); pulmonary diseases (21% vs. 15%; P = .006); malignancies (25% vs. 13%; P < .001).
In addition, TTS in men was more likely to be caused by physical triggers (55% vs. 32%; P < .01), whereas emotional triggers were more common in females (39% vs. 19%; P < 0.001).
The investigators then performed a propensity score analysis by matching men and women 1:1; this yielded 207 patients from each group.
After propensity matching, male patients had higher rates of cardiogenic shock (16% vs 6%), and in-hospital mortality (8% vs. 3%; both P < .05).
Men also had a higher mortality rate during the acute and long-term follow up. Male sex remained independently associated with both in-hospital mortality (odds ratio, 2.26; 95% confidence interval, 1.16-4.40) and long-term mortality (hazard ratio, 1.83; 95% CI, 1.32-2.52).
The study by Dr. Arcari and colleagues “shows convincingly that although men are far less likely to develop TTS than women, they have more serious complications and are more likely to die than women presenting with the syndrome, Ilan S. Wittstein, MD, of Johns Hopkins University, Baltimore, wrote in an accompanying editorial.
In an interview, Dr. Wittstein said one of the strengths of the study was its size.
“Over the years, there have been a lot of smaller, single center studies. This large registry had over 2,000 patients. So when the researchers say the rate of TTS is 10% in men and 90% in women, this is not necessarily surprising because that’s about the breakdown we’ve had since the very beginning, but it certainly validates that in a cohort that is large,” he said.
“I think what was novel about the paper is that the size of the cohort allowed the researchers to do propensity matching, so they were able not only to compare men versus women, they could do a 1:1 comparison. And they found even when you match men and women for various comorbidities, the men were much sicker
“What makes this a fascinating syndrome and different from most types of heart muscle problems is that, in the majority of patients, the condition is precipitated by an acute stressor,” said Dr. Wittstein.
“It can either be an emotional trigger, so for instance, getting some bad news that a loved one just died. That’s why we nicknamed the syndrome ‘broken heart syndrome’ many years ago. Or it can be a physical trigger, which can be a wide variety of things, such infection, a stroke, bad pneumonia, anything that stresses the body and causes a stress response. Regular heart attacks are not triggered in this way,” he said.
Dr. Arcari and Dr. Wittstein reported no relevant financial relationships.
FROM THE JOURNAL OF THE AMERICAN COLLEGE OF CARDIOLOGY
No-implant interatrial shunt remains patent at a year
The first in-human trials of a no-implant approach to interatrial shunting to alleviate heart failure symptoms have shown a signal that the procedure reduces peak exercise wedge pressure in recipients a month afterward, according to early trial results.
Colin M. Barker, MD, reported 30-day results of 31 patients who had no-implant interatrial shunting for heart failure across three studies, at the Society for Cardiovascular Angiography & Interventions scientific sessions. The studies included patients with HF with preserved and reduced ejection fraction (HFpEF and HFrEF).
“At 30 days, there was a response with a decrease in the wedge pressures both at rest and at peak exercise, and that was consistent through all three of these initial trials,” Dr. Barker said. In all 33 patients who have been treated to date, there were no major adverse cardiac and cerebrovascular or thromboembolic events through 1 month. (Two of the patients weren’t included in the results Dr. Barker presented.)
The three studies he reported on were the Alleviate-HF-1 (n = 15), Alleviate-HF-2 (n = 11) for patients with HFpEF, and Alleviate-HFrEF (n = 5). The average patient age was 67 years, and all were New York Heart Association class II, III, or IV with elevated peak pulmonary capillary wedge pressure (PCWP).
The device that creates the no-implant shunt as “not very exotic, but it is very effective, and what it does is create a very predictable, reproducible atrial septostomy” between the left and right atria. The device obtains “almost a biopsy” that’s 7 mm in diameter. “There’s no hardware or foreign bodies left inside the patient,” said Dr. Barker, director of interventional cardiology at Vanderbilt University in Nashville, Tenn. “There’s a natural healing process at the rims after the radiofrequency ablation has been done.” Femoral access was used.
Study participants were also asked to complete the Kansas City Cardiomyopathy Questionnaire (KCCQ) at baseline and at 1 and 3 months across all three studies, and at 6 months in the Alleviate-HF-1 study. “Just as important is how patients feel,” Dr. Barker said. KCCQ overall summary scores increased at each time interval across all three studies.
“Durability has been proven with multiple different imaging modalities,” Dr. Barker added, explaining that CT scans in 10 of 10 shunts demonstrated patency through 12 months, and 15 of 15 at 6 months. He noted that none of the created shunts have closed yet. At 6 months, the average shunt measured 7.5 mm (± 1.1 mm, n = 22), left atrial diameter decreased 2.4 mm (P = .031) in HFpEF patients, and no significant changes were observed in right ventricular fractional area change or right atrial volume index.
None of the septostomies have had to be closed or enlarged to date, Dr. Barker said. “We are creating an atrial septal defect that we have a lot of comfort and experience with closing with other devices if need be, but that hasn’t been an issue,” he said. “As of now, it’s one size, but as you can imagine, one-size-fits-all is not the way this will go, and this does allow for variations in size ultimately.”
Kirk N. Garratt, MD, director of the Center for Heart and Vascular Health at Christiana Care in Newark, Del., noted that the approach to unload the left atrium “is novel, but I think is becoming well accepted in the advanced HF population. There remain questions about long-term consequences of an intentional interatrial shunt – what happens to pulmonary flow dynamics and the like – but to date the impact of this approach has been favorable.
“The liabilities that come with an implanted device in the septal space, both in terms of the durability of the shunt and the impact that it would have on the ability to perform other transseptal procedures, is overcome with this approach,” he added.
Dr. Barker disclosed he is an advisory board member and consultant to Alleviant Medical. Dr. Garratt is an advisory board member for Abbott.
FROM SCAI 2022