User login
Oleander extract for COVID-19? That’s a hard ‘no’ experts say

“Though renowned for its beauty and use in landscaping, this Mediterranean shrub is responsible for cases of accidental poisoning across the globe. All parts of the plant are poisonous,” Cassandra Quave, PhD, ethnobotanist and herbarium curator at Emory University, Atlanta, cautioned in an article in The Conversation, an independent, not-for-profit publication.
Oleandrin has properties similar to digoxin; the onset of toxicity occurs several hours after consumption.
The first symptoms of oleandrin poisoning may be gastrointestinal, such as nausea, vomiting, abdominal pain, diarrhea (which may contain blood), and loss of appetite.
After these first symptoms, the heart may be affected by tachyarrhythmia, bradyarrhythmia, premature ventricular contractions, or atrioventricular blockage. Xanthopsia (yellow vision), a burning sensation in the eyes, paralysis of the gastrointestinal tract, and respiratory symptoms may also occur.
Oleandrin poisoning may affect the central nervous system, as evidenced by drowsiness, tremors, seizures, collapse, and coma leading to death. When applied to the skin, oleander sap can cause skin irritations and allergic reactions characterized by dermatitis.
Diagnosis of oleandrin poisoning is mainly made on the basis of a description of the plant, how much of it was ingested, how much time has elapsed since ingestion, and symptoms. Confirmation of oleandrin in blood involves fluorescence polarization immunoassay, digoxin immunoassay, or liquid chromatography-electrospray tandem mass spectrometry.
Neither oleander nor oleandrin is approved by regulatory agencies as a prescription drug or dietary supplement.
In vitro study
Oleandrin for COVID-19 made headlines after President Trump met in the Oval Office with Andrew Whitney, vice chairman and director of Phoenix Biotechnology, along with Housing and Urban Development Secretary Ben Carson, MD, and MyPillow founder/CEO Mike Lindell, a strong supporter of Trump and an investor in the biotech company, to learn about oleandrin, which Whitney called a “cure” for COVID-19, Axios reported.
In an in vitro study, researchers from Phoenix Biotechnology and the University of Texas Medical Branch, Galveston, tested oleandrin against SARS-CoV-2 in cultured Vero cells.
“When administered both before and after virus infection, nanogram doses of oleandrin significantly inhibited replication by 45 to 3000-fold,” the researchers said in an article posted on bioRxiv, a free online archive and distribution service for unpublished preprints in the life sciences. The study has not been peer reviewed.
On the basis of these in vitro findings, the researchers said the plant extract has “potential to prevent disease and virus spread in persons recently exposed to SARS-CoV-2, as well as to prevent severe disease in persons at high risk.”
But it’s a far cry from test tube to human, one expert cautioned.
“This is an understatement: Care must be taken when inferring potential therapeutic benefits from in vitro antiviral effects,” Harlan Krumholz, MD, cardiologist and director, Yale New Haven Hospital Center for Outcomes Research and Evaluation, New Haven, Connecticut, told Medscape Medical News.
“There is a chasm between a single in vitro study and any use in humans outside of a protocol. People should be cautioned about that distance and the need [to] avoid such remedies unless part of a credible research project,” said Krumholz.
Yet Lindell told Axios that, in the Oval Office meeting, Trump expressed enthusiasm for the Food and Drug Administration to allow oleandrin to be marketed as a dietary supplement or approved for COVID-19.
“This is really just nonsense and a distraction,” Jonathan Reiner, MD, of George Washington University Medical Center, Washington, DC, said on CNN.
This article first appeared on Medscape.com.
Pulmonary artery denervation eases PAH after endarterectomy
Pulmonary artery denervation (PADN) provides persistent and clinically significant hemodynamic improvements in patients with persistent chronic thromboembolic hypertension (CTEPH) after pulmonary endarterectomy (PEA), according to a randomized, sham-controlled trial.
“PADN in patients with CTEPH after PEA was safe and effective,” according to an investigating team led by Alexander Romanov, MD, PhD.
The mean reduction in pulmonary vascular resistance (PVR) was 258 dyn/sec per cm–5 for those randomized to PADN versus 149 dyn/sec per cm–5 (P = .001) for those randomized to the sham procedure, according to the newly published findings.
For the 6-minute walk test (6MWT), the mean distance was 470 m for the experimental group versus 399 m (P = .03) for the controls.
Several secondary endpoints measuring hemodynamics also favored PADN relative to the sham procedure at 12 months. This included the relative increase in tricuspid annular systolic excursion (P = .03) and the increase in the right ventricular fraction area (P < .001).
A total of 50 patients with residual CTEPH for at least 6 months after PEA despite medical therapy were enrolled and randomized. Entry criteria included a mean pulmonary artery pressure (PAP) of 25 mm Hg or greater or PVR greater than 400 dyn/sec per cm–5 on right heart catheterization. Patients with comorbidities associated with a life expectancy of less than 1 year were excluded.
Those randomized to the sham group were treated with riociguat over the course of follow-up. This therapy was not offered to patients in the PADN group, but all patients were blinded to the procedure and told that riociguat might or might not be administered.
Following the procedure, participating clinicians, who were also blinded to the procedure, were instructed to provide standard therapies for heart failure, such beta-blockers, diuretics, or digoxin, as needed. All patients were placed on an oral anticoagulant.
At 12 months the mean PAP (26 vs. 35 mm Hg; P < .001) and the mean systolic PAP (46 vs. 54 mm Hg; P = .01) were significantly lower in the PADN group versus those who underwent a sham procedure.
About 52% of the PADN group versus 12% of the sham group were classified as responders by the definition of a PVR reduction of at least 150 dyn/sec per cm–5 and 6MWT improvement of at least 20%, compared with baseline, reported Dr. Romanov, of the E. Meshalkin National Medical Research Center, ministry of health, Novosibirsk, Russia, and coinvestigators.
Of the three deaths caused by heart failure over the course of follow-up, two occurred in the sham group. Of the eight hospitalizations for heart failure, seven (29% of the sham group) occurred among controls versus one in those treated with PADN (4% of this group; P = .049).
There was one groin hematoma at the puncture site in each group. Both resolved without any consequences prior to hospital discharge. There were no other significant procedure-related complications in either group.
Larger multicenter trials are needed to confirm these findings, according to both the trial investigators and Marius M. Hoeper, MD, who is charge of the pulmonary hypertension program at the Hannover (Germany) Medical School.
In an editorial that accompanied publication of these findings, Dr. Hoeper identified the small sample size of this study as one of its limitations, but he said the results are consistent with several other small studies associating pulmonary artery denervation with benefit in pulmonary hypertension.
“It appears as if we are currently witnessing the emergence of a new treatment option for various forms of pulmonary hypertension,” Dr. Hoeper wrote. In his critique of the study, he suggested that it would have been “more informative” if both groups were on background riociguat, but the data from this and other studies so far indicates that ablation to achieve denervation “is safe and feasible.”
The PADN technique used in this study might be relevant to the results. Dr. Hoeper noted that the investigators employed catheter tip–based electroanatomic mapping with a novel remote navigation system with three-dimensional imaging of the right ventricle and central pulmonary arteries.
“Apparently, this approach minimizes radiation exposure and provides precise location of ablation sites,” Dr. Hoeper observed. However, he called for direct comparisons of this tool to the guidance systems used in other studies.
In an interview, Dr. Hoeper acknowledged that it is not yet clear that a large-scale trial of pulmonary artery denervation for the indication evaluated in this study is coming. He noted several strategies in CTEPH are widely used without trials confirming a reduction in clinical events.
“Balloon pulmonary angioplasty for CTEPH has become an established treatment around the world without any randomized, controlled trial and without demonstration of improved outcomes. A couple of well-conducted observational trials might be sufficient to convince physicians to introduce PADN as well,” he said. If such studies associated PADN with “improvements in hemodynamics, exercise capacity, and patient-reported outcomes, it might be sufficient.”
Currently, Dr. Hoeper is most concerned about obtaining further evidence of safety, which he characterized as a “major issue.”
If a multicenter trial is conducted “the primary endpoint should be focused on clinical events,” according to Dr. Romanov, who was asked to comment on the next steps in validating PADN for the treatment of CTEPH-associated pulmonary hypertension persisting after endarterectomy.
“The mortality rate during 1-year long-term follow-up is not so high, but heart failure progression is a problem. So in my view, the primary endpoint should be a composite of death and heart failure hospitalization,” he said. He called for follow-up duration of 2-3 years.
Jonathan Steinberg, MD, director of cardiac clinical trials and education, Summit Medical Group, Montclair, N.J., also called a trial with hard endpoints, such as death, the ideal.
In the meantime, hemodynamic and functional measures “are still quite valuable and move the ball forward for this intervention,” he said in an interview. Senior author of this trial and principle investigator of the recent ERADICATE-AF trial, which evaluated renal denervation in preventing recurrence of atrial fibrillation (JAMA. 2020;323:248-55), Dr. Steinberg predicted, “I do indeed suspect we will see trials that are more accomplishable [than a large-scale, randomized, controlled trial] in the not too distant future.”
Dr. Romanov received funding from Biosense Webster. Dr. Hoeper has received fees for lectures and/or consultations from Acceleron, Actelion, Bayer, Janssen, Merck Sharp & Dohme, and Pfizer.
SOURCE: Romanov A et al. J Am Coll Cardiol. 2020 Aug 17;76:916-26.
FROM THE JOURNAL OF THE AMERICAN COLLEGE OF CARDIOLOGY
Machine learning shows ability to predict diastolic dysfunction with ECG
A machine-learning model that uses readily available clinical and electrocardiography data may have the potential to identify left ventricular (LV) diastolic dysfunction, a key biomarker in predicting heart failure, without echocardiography, but a workable clinical platform is still far off, a team of North American researchers reported.
“This cost-effective strategy may be a valuable first clinical step for assessing the presence of LV dysfunction and may potentially aid in the early diagnosis and management of heart failure patients,” Nobuyuki Kagiyama, MD, PhD, of West Virginia University, Morgantown, and colleagues, wrote in the Journal of the American Academy of Cardiology.
The researchers reported on a multicenter, prospective study that evaluated 1,202 patients from three centers in the United States and one in Canada. To develop machine-learning models, the study pooled 814 patients from the U.S. institutions as an internal cohort. They were then randomly divided into a training set and an internal test set on an 80:20 basis (651 and 163). The 388 Canadian patients were reserved as an external set to test the model.
All patients had 12-lead ECG and simultaneous body surface signal-processed ECG (spECG) along with comprehensive two-dimensional Doppler ECG on the same day.
How the model works
The machine-learning model estimated echocardiographic LV relaxation velocities (e’) values using traditional ECG and spECG features. The model also took into account 10 basic clinical features: age; sex; systolic and diastolic blood pressure; and comorbid conditions such as cerebrovascular and cardiovascular disease, diabetes, hypertension, dyslipidemia, and chronic kidney disease.
Patient characteristics were starkly different between the internal (United States) and external (Canadian) cohorts, with the latter being 10 years older on average (65 vs. 44; P < .001), predominantly male (58.2% vs. 47.3%; P < .001) and with significantly lower rates of coronary artery disease (1.8% vs. 21.1%; P < .001), although average blood pressure was similar between the two groups.
The study used area under the curve (AUC) to calculate the predictability of the machine-learning estimated e’ values versus the guideline-based reduced e’, finding close correlation between the internal (AUC, 0.83; sensitivity, 78%; specificity, 77%; negative predictive value, 73%; and positive predictive value, 82%) and external test sets (AUC, 0.84; sensitivity, 90%; specificity, 61%; NPV, 81%; and PPV, 77%).
Similar variations between the two cohorts were reported for global LV diastolic dysfunction and reduced LV ejection fraction.
The final model used 18 features in all, including 3 clinical features (age, dyslipidemia, and hypertension), 7 scores from spECG features, and 8 from traditional ECG features.
Interpreting the results
Dr. Kagiyama and colleagues noted that, because impaired myocardial relaxation is an early sign of cardiac tissue deterioration, screening for it can aid in early detection of subclinical LVDD and earlier treatment for hypertension and diabetes. But they acknowledged that further studies are needed.
In an invited editorial, Khurram Nasir, MD, MPH, MSc, of Houston Methodist DeBakey Heart and Vascular Center and Rohan Khera, MD, MS, of Yale University, New Haven, Conn., wrote that the machine-learning model has a way to go.
They noted that the 73%-77% accuracy of the model in identifying diastolic dysfunction impedes its imminent use. “Although we are excited about the prospects of such developments, we hold out for better evidence for their actual use,” they wrote, adding that the algorithms have limited use in the clinic because most patients already get “definitive testing” if they need it.
Developing a machine-learning model that obviates the need for ECG for evaluating LV diastolic dysfunction seems dubious at this time, said Luigi Di Biase, MD, PhD, section head of electrophysiology and director of arrhythmia services at Montefiore Medical Center and professor at Albert Einstein College of Medicine, both in New York. “The echo is not a difficult test. It’s the most proven usable tool that we have in cardiology because it’s easy to reproduce, low cost, and noninvasive – so we have all that we want in medicine.”
But machine learning does have potential, added Dr. Di Biase, who’s also a member of the American College of Cardiology’s Electrophysiology Section Leadership Council. “If this application could predict the people that would develop diastolic dysfunction that leads to heart failure – because an echo at that time may be negative but there may be other features that tell me this patient will develop disease – then it would have a much different clinical impact.”
The National Science Foundation provided funding for the study. Heart Test Laboratories, doing business as Heart Sciences, provided funding and spECG devices. Dr. Kagiyama reported receiving a research grant from Hitachi Healthcare. A coauthor disclosed financial relationships with Heart Sciences, Ultronics, and Kencor Health.
Dr. Nasir, Dr. Khera, and Dr. Di Biase have no relevant financial relationships to disclose.
SOURCE: Kagiyama N et al. J Am Coll Cardiol. 2020;76:930-41.
FROM THE JOURNAL OF THE AMERICAN COLLEGE OF CARDIOLOGY
PHM20 Virtual: Can’t miss heart disease for hospitalists
PHM20 Virtual session title
Can’t Miss Heart Disease for Hospitalists
Presenter
Erich Maul, DO, MPH, FAAP, SFHM
Session summary
Dr. Erich Maul, professor of pediatrics, medical director for progressive care and acute care, and chief of hospital pediatrics at Kentucky Children’s Hospital, Lexington, presented an engaging, case-based approach to evaluate heart disease when “on call.” He iterated the importance of recognizing congenital heart disease, especially since 25% of these patients usually need surgical intervention within the first month of diagnosis and about 50% of congenital heart disease patients do not have a murmur.
Presenting cases seen during a busy hospitalist call night, Dr. Maul highlighted that patients can present with signs of heart failure, cyanosis, sepsis or hypoperfusion, failure to thrive, and respiratory distress or failure. He discussed the presentation, epidemiology, diagnosis, treatment, and prognosis. He also provided examples of common arrhythmias and provided refreshers on management using basic life support (BLS) and pediatric advanced life support.
Key takeaways
- Always start with the nine steps to resuscitation: ABC (airway, breathing, circulation), ABC, oxygen, access, monitoring.
- Early BLS is important.
- Congenital heart disease often presents with either cyanosis, hypoperfusion, failure to thrive, or respiratory distress.

Dr. Tantoco is an academic med-peds hospitalist practicing at Northwestern Memorial Hospital and Ann & Robert H. Lurie Children’s Hospital of Chicago. She is an instructor of medicine (hospital medicine) and pediatrics at Northwestern University, Chicago.
PHM20 Virtual session title
Can’t Miss Heart Disease for Hospitalists
Presenter
Erich Maul, DO, MPH, FAAP, SFHM
Session summary
Dr. Erich Maul, professor of pediatrics, medical director for progressive care and acute care, and chief of hospital pediatrics at Kentucky Children’s Hospital, Lexington, presented an engaging, case-based approach to evaluate heart disease when “on call.” He iterated the importance of recognizing congenital heart disease, especially since 25% of these patients usually need surgical intervention within the first month of diagnosis and about 50% of congenital heart disease patients do not have a murmur.
Presenting cases seen during a busy hospitalist call night, Dr. Maul highlighted that patients can present with signs of heart failure, cyanosis, sepsis or hypoperfusion, failure to thrive, and respiratory distress or failure. He discussed the presentation, epidemiology, diagnosis, treatment, and prognosis. He also provided examples of common arrhythmias and provided refreshers on management using basic life support (BLS) and pediatric advanced life support.
Key takeaways
- Always start with the nine steps to resuscitation: ABC (airway, breathing, circulation), ABC, oxygen, access, monitoring.
- Early BLS is important.
- Congenital heart disease often presents with either cyanosis, hypoperfusion, failure to thrive, or respiratory distress.
Dr. Tantoco is an academic med-peds hospitalist practicing at Northwestern Memorial Hospital and Ann & Robert H. Lurie Children’s Hospital of Chicago. She is an instructor of medicine (hospital medicine) and pediatrics at Northwestern University, Chicago.
Non-COVID-19 clinical trials grind to a halt during pandemic
The COVID-19 pandemic has created unique and unprecedented challenges for the clinical research world, with potentially long-lasting consequences.
A new analysis of the extent of disruption shows that the average rate of stopped trials nearly doubled during the first 5 months of 2020, compared with the 2 previous years.
“Typically, clinical research precedes clinical practice by several years, so this disruption we’re seeing now will be felt for many years to come,” said Mario Guadino, MD, of Weill Cornell Medicine, New York.
The analysis was published online July 31 in the Journal of the American College of Cardiology.
The researchers used Python software to query meta-data from all trials reported on ClinicalTrials.gov. Of 321,218 non-COVID-19 trials queried, 28,672 (8.9%) were reported as stopped, defined as a switch in trial status from “recruiting” to “active and not recruiting,” “completed,” “suspended,” “terminated,” or “withdrawn.”
The average rate of discontinuation was 638 trials/month from January 2017 to December 2019, rising to 1,147 trials/month between January 2020 and May 2020 (P < .001 for trend).
Once stopped (as opposed to paused), restarting a trial is a tricky prospect, said Dr. Guadino. “You can’t stop and restart a trial because it creates a lot of issues, so we should expect many of these stopped trials to never be completed.”
He said these figures likely represent an underestimate of the true impact of the pandemic because there is typically a delay in the updating of the status of a trial on ClinicalTrials.gov.
“We are likely looking only at the tip of the iceberg,” he added. “My impression is that the number of trials that will be affected and even canceled will be very high.”
As for cardiology trials, one of the report’s authors, Deepak Bhatt, MD, Brigham and Women’s Hospital, Boston, without naming specific trials, had this to say: “Several cardiovascular trials were paused, and some were permanently discontinued. It may be a while before we fully appreciate just how much information was lost and how much might be salvaged.”
He’s not worried, however, that upcoming cardiology meetings, which have moved online for the foreseeable future, might get a bit boring. “Fortunately, there is enough good work going on in the cardiovascular and cardiometabolic space that I believe there will still be ample randomized and observational data of high quality to present at the major meetings,” Dr. Bhatt said in an email.
The researchers found a weak correlation between the national population-adjusted numbers of COVID-19 cases and the proportion of non-COVID-19 trials stopped by country.
Even for trials that stopped recruiting for a period of time but are continuing, there are myriad issues involving compliance, data integrity, statistical interpretability, etc.
“Even if there is just a temporary disruption, that will most likely lead to reduced enrollment, missing follow-up visits, and protocol deviations, all things that would be red flags during normal times and impact the quality of the clinical trial,” said Dr. Guadino.
“And if your outcome of interest is mortality, well, how exactly do you measure that during a pandemic?” he added.
Stopped for lack of funding
Besides the logistical issues, another reason trials may be in jeopardy is funding. A warning early in the pandemic from the research community in Canada that funding was quickly drying up, leaving both jobs and data at risk, led to an aid package from the government to keep the lights on.
The National Institutes of Health (NIH), the Canadian Institutes of Health Research, and similar groups “have devoted large sums of money to research in COVID, which is of course very appropriate, but that clearly reduces the amount of funding that is available for other researchers,” said Dr. Guadino.
Some funding agencies around the world have canceled or put on hold all non-COVID-19 clinical trials still at the design state, Dr. Guadino said in an interview.
The NIH, he stressed, has not canceled funding and has been “extremely open and cooperative” in trying to help trialists navigate the many COVID-generated issues. They’ve even issued guidance on how to manage trials during COVID-19.
Of note, in the survey, the majority of the trials stopped (95.4%) had nongovernmental funding.
“The data are not very granular, so we’re only able to make some very simple, descriptive comments, but it does seem like the more fragile trials – those that are smaller and industry-funded – are the ones more likely to be disrupted,” said Dr. Guadino.
In some cases, he said, priorities have shifted to COVID-19. “If a small company is sponsoring a trial and they decide they want to sponsor something related to COVID, or they realize that because of the slow enrollment, the trial becomes too expensive to complete, they may opt to just abandon it,” said Dr. Guadino.
At what cost? It will take years to sort that out, he said.
This study received no funding. Dr. Guadino and Dr. Bhatt are both active trialists, participating in both industry- and government-sponsored clinical research.
A version of this article originally appeared on Medscape.com.
Severe obesity ups risk for death in younger men with COVID-19
In a large California health care plan, among patients with COVID-19, men aged 60 years and younger had a much higher risk of dying within 3 weeks of diagnosis if they had severe obesity as opposed to being of normal weight, independently of other risk factors.
reported Sara Y. Tartof, PhD, MPH, Kaiser Permanente Southern California, Pasadena, Calif., and coauthors.
The data “highlight the leading role of severe obesity over correlated risk factors, providing a target for early intervention,” they concluded in an article published online Aug. 12 in Annals of Internal Medicine.
This work adds to nearly 300 articles that have shown that severe obesity is associated with an increased risk for morbidity and mortality from COVID-19.
In an accompanying editorial, David A. Kass, MD, said: “Consistency of this new study and prior research should put to rest the contention that obesity is common in severe COVID-19 because it is common in the population.”
Rather, these findings show that “obesity is an important independent risk factor for serious COVID-19 disease,” he pointed out.
On the basis of this evidence, “arguably the hardest question to answer is: What is to be done?” wondered Kass, of Johns Hopkins University, Baltimore.
Although data consistently show that a body mass index >35 kg/m2 is predictive of major health risks, “weight reduction at that level of obesity is difficult and certainly is not achieved rapidly,” Dr. Kass stressed.
“Therefore ... social distancing; altering behaviors to reduce viral exposure and transmission, such as wearing masks; and instituting policies and health care approaches that recognize the potential effects of obesity should be implemented,” he emphasized. “These actions should help and are certainly doable.”
Similarly, Dr. Tartof and colleagues said their “findings also reveal the distressing collision of two pandemics: COVID-19 and obesity.
“As COVID-19 continues to spread unabated, we must focus our immediate efforts on containing the crisis at hand,” they urged.
However, the findings also “underscore the need for future collective efforts to combat the equally devastating, and potentially synergistic, force of the obesity epidemic.”
COVID-19 pandemic collides with obesity epidemic
Previous studies of obesity and COVID-19 were small, did not adjust for multiple confounders, or did not include nonhospitalized patients, Dr. Tartof and coauthors wrote.
Their study included 6,916 members of the Kaiser Permanente Southern California health care plan who were diagnosed with COVID-19 from Feb. 13 to May 2, 2020.
The researchers calculated the risk for death at 21 days after a COVID-19 diagnosis; findings were corrected for age, sex, race/ethnicity, smoking, myocardial infarction, heart failure, peripheral vascular disease, cerebrovascular disease, chronic pulmonary disease, renal disease, metastatic tumor or malignancy, other immune disease, hyperlipidemia, hypertension, asthma, organ transplant, and diabetes status.
On the basis of BMI, the patients were classified as being underweight, of normal weight, overweight, or as having class 1, 2, or 3 obesity. BMI of 18.5 to 24 kg/m2 is defined as normal weight.
Class 3 obesity, also called severe obesity, included moderately severe obesity (BMI, 40-44 kg/m2) and extremely severe obesity (≥45 kg/m2).
A little more than half of the patients were women (55%), and more than 50% were Hispanic (54%).
A total of 206 patients (3%) died within 21 days of being diagnosed with COVID-19; of these, 67% had been hospitalized, and 43% had been intubated.
Overall, the COVID-19 patients with moderately severe or extremely severe obesity had a 2.7-fold and 4.2-fold increased risk for death, respectively, within 3 weeks compared with patients of normal weight.
Patients in the other BMI categories did not have a significantly higher risk of dying during follow-up.
However, each decade of increasing age after age 40 was associated with a stepwise increased risk for death within 3 weeks of the COVID-19 diagnosis.
Risk stratified by age and sex
Further analysis showed that, “most strikingly,” among patients aged 60 and younger, those with moderately severe obesity and extremely severe obesity had significant 17-fold and 12-fold higher risks of dying during follow-up, respectively, compared with patients of normal weight, the researchers reported.
In patients older than 60, moderately severe obesity did not confer a significant increased risk for imminent death from COVID-19; extremely severe obesity conferred a smaller, threefold increased risk for this.
“Our finding that severe obesity, particularly among younger patients, eclipses the mortality risk posed by other obesity-related conditions, such as history of myocardial infarction (MI), diabetes, hypertension, or hyperlipidemia, suggests a significant pathophysiologic link between excess adiposity and severe COVID-19 illness,” the researchers noted.
This independent increased risk for death with severe obesity was seen in men but not in women.
Men with moderately severe and extremely severe obesity had significant 4.8-fold and 10-fold higher risks of dying within 3 weeks, respectively, compared with men of normal weight.
“That the risks are higher in younger patients is probably not because obesity is particularly damaging in this age group; it is more likely that other serious comorbidities that evolve later in life take over as dominant risk factors,” Dr. Kass suggested in his editorial.
“That males are particularly affected may reflect their greater visceral adiposity over females, given that this fat is notably proinflammatory and contributes to metabolic and vascular disease,” he added.
“As a cardiologist who studies heart failure,” Dr. Kass wrote, “I am struck by how many of the mechanisms that are mentioned in reviews of obesity risk and heart disease are also mentioned in reviews of obesity and COVID-19.”
The study was funded by Roche-Genentech. Kass has disclosed no relevant financial relationships. Disclosures of the authors are listed in the article.
A version of this article originally appeared on Medscape.com.
NAFLD may predict arrhythmia recurrence post-AFib ablation
Increasingly recognized as an independent risk factor for new-onset atrial fibrillation (AFib), new research suggests for the first time that nonalcoholic fatty liver disease (NAFLD) also confers a higher risk for arrhythmia recurrence after AFib ablation.
Over 29 months of postablation follow-up, 56% of patients with NAFLD suffered bouts of arrhythmia, compared with 31% of patients without NAFLD, matched on the basis of age, sex, body mass index (BMI), ejection fraction within 5%, and AFib type (P < .0001).
The presence of NAFLD was an independent predictor of arrhythmia recurrence in multivariable analyses adjusted for several confounders, including hemoglobin A1c, BMI, and AFib type (hazard ratio, 3.0; 95% confidence interval, 1.94-4.68).
The association is concerning given that one in four adults in the United States has NAFLD, and up to 6.1 million Americans are estimated to have Afib. Previous studies, such as ARREST-AF and LEGACY, however, have demonstrated the benefits of aggressive preablation cardiometabolic risk factor modification on long-term AFib ablation success.
Indeed, none of the NAFLD patients in the present study who lost at least 10% of their body weight had recurrent arrhythmia, compared with 31% who lost less than 10%, and 91% who gained weight prior to ablation (P < .0001).
All 22 patients whose A1c increased during the 12 months prior to ablation had recurrent arrhythmia, compared with 36% of patients whose A1c improved (P < .0001).
“I don’t think the findings of the study were particularly surprising, given what we know. It’s just further reinforcement of the essential role of risk-factor modification,” lead author Eoin Donnellan, MD, Cleveland Clinic, said in an interview.
The results were published Augus 12 in JACC Clinical Electrophysiology.
For the study, the researchers examined data from 267 consecutive patients with a mean BMI of 32.7 kg/m2 who underwent radiofrequency ablation (98%) or cryoablation (2%) at the Cleveland Clinic between January 2013 and December 2017.
All patients were followed for at least 12 months after ablation and had scheduled clinic visits at 3, 6, and 12 months after pulmonary vein isolation, and annually thereafter.
NAFLD was diagnosed in 89 patients prior to ablation on the basis of CT imaging and abdominal ultrasound or MRI. On the basis of NAFLD-Fibrosis Score (NAFLD-FS), 13 patients had a low probability of liver fibrosis (F0-F2), 54 had an indeterminate probability, and 22 a high probability of fibrosis (F3-F4).
Compared with patients with no or early fibrosis (F0-F2), patients with advanced liver fibrosis (F3-F4) had almost a threefold increase in AFib recurrence (82% vs. 31%; P = .003).
“Cardiologists should make an effort to risk-stratify NAFLD patients either by NAFLD-FS or [an] alternative option, such as transient elastography or MR elastography, given these observations, rather than viewing it as either present or absence [sic] and involve expert multidisciplinary team care early in the clinical course of NAFLD patients with evidence of advanced fibrosis,” Dr. Donnellan and colleagues wrote.
Coauthor Thomas G. Cotter, MD, department of gastroenterology and hepatology, University of Chicago, said in an interview that cardiologists could use just the NAFLD-FS as part of an algorithm for an AFib.
“Because if it shows low risk, then it’s very, very likely the patient will be fine,” he said. “To use more advanced noninvasive testing, there are subtleties in the interpretation that would require referral to a liver doctor or a gastroenterologist and the cost of referring might bulk up the costs. But the NAFLD-FS is freely available and is a validated tool.”
Although it hasn’t specifically been validated in patients with AFib, the NAFLD-FS has been shown to correlate with the development of coronary artery disease (CAD) and was recommended for clinical use in U.S. multisociety guidelines for NAFLD.
The score is calculated using six readily available clinical variables (age, BMI, hyperglycemia or diabetes, AST/ALT, platelets, and albumin). It does not include family history or alcohol consumption, which should be carefully detailed given the large overlap between NAFLD and alcohol-related liver disease, Dr. Cotter observed.
Of note, the study excluded patients with alcohol consumption of more than 30 g/day in men and more than 20 g/day in women, chronic viral hepatitis, Wilson’s disease, and hereditary hemochromatosis.
Finally, CT imaging revealed that epicardial fat volume (EFV) was greater in patients with NAFLD than in those without NAFLD (248 vs. 223 mL; P = .01).
Although increased amounts of epicardial fat have been associated with CAD, there was no significant difference in EFV between patients who did and did not develop recurrent arrhythmia (238 vs. 229 mL; P = .5). Nor was EFV associated with arrhythmia recurrence on Cox proportional hazards analysis (HR, 1.001; P = .17).
“We hypothesized that the increased risk of arrhythmia recurrence may be mediated in part by an increased epicardial fat volume,” Dr. Donnellan said. “The existing literature exploring the link between epicardial fat volume and A[Fib] burden and recurrence is conflicting. But in both this study and our bariatric surgery study, epicardial fat volume was not a significant predictor of arrhythmia recurrence on multivariable analysis.”
It’s likely that the increased recurrence risk is caused by several mechanisms, including NAFLD’s deleterious impact on cardiac structure and function, the bidirectional relationship between NAFLD and sleep apnea, and transcription of proinflammatory cytokines and low-grade systemic inflammation, he suggested.
“Patients with NAFLD represent a particularly high-risk population for arrhythmia recurrence. NAFLD is a reversible disease, and a multidisciplinary approach incorporating dietary and lifestyle interventions should by instituted prior to ablation,” Dr. Donnellan and colleagues concluded.
They noted that serial abdominal imaging to assess for preablation changes in NAFLD was limited in patients and that only 56% of control subjects underwent dedicated abdominal imaging to rule out hepatic steatosis. Also, the heterogeneity of imaging modalities used to diagnose NAFLD may have influenced the results and the study’s single-center, retrospective design limits their generalizability.
The authors reported having no relevant financial relationships.
A version of this article originally appeared on Medscape.com.
A ‘foolproof’ way to diagnose narrow complex tachycardias on EKGs
A hospitalist looking at an EKG showing a narrow complex tachycardia needs to be able to come up with an accurate diagnosis of the rhythm pronto. And hospitalist Meghan Mary Walsh, MD, MPH, has developed a simple and efficient method for doing so within a minute or two that she’s used with great success on the wards and in teaching medical students and residents for nearly a decade.
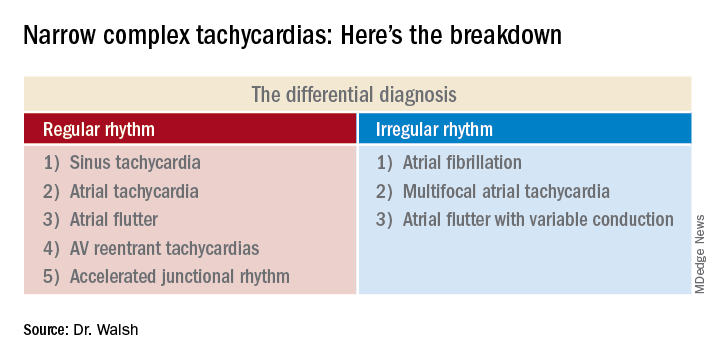
she promised at HM20 Virtual, hosted by the Society of Hospital Medicine.
Her method involves asking three questions about the 12-lead EKG:
1) What’s the rate?
A narrow complex tachycardia by definition needs to be both narrow and fast, with a QRS complex of less than 0.12 seconds and a heart rate above 100 bpm. Knowing how far above 100 bpm the rate is will help with the differential diagnosis.
2) Is the rhythm regular or irregular?
“If I put the EKG 10 feet away from you, you should still be able to look at it and say the QRS is either systematically marching out – boom, boom, boom – or there is an irregular sea of QRS complexes where the RR intervals are variable and inconsistent,” said Dr. Walsh, a hospitalist at the University of Minnesota, Minneapolis, and chief academic officer at Hennepin Healthcare, where she oversees all medical students and residents training in the health system.
This distinction between a regular and irregular rhythm immediately narrows the differential by dividing the diagnostic possibilities into two columns (See chart). She urged her audience to commit the list to memory or keep it handy on their cell phone or in a notebook.
“If it’s irregular I’m going down the right column; if it’s regular I’m going down the left. And then I’m systematically running the drill,” she explained.
3) Are upright p waves present before each QRS complex in leads II and V1?
This information rules out some of the eight items in the differential diagnosis and rules in others.
Narrow complex tachycardias with an irregular rhythm
There are only three:
Atrial fibrillation: The heart rate is typically 110-160 bpm, although it can occasionally go higher. The rhythm is irregularly irregular: No two RR intervals on the EKG are exactly the same. And there are no p waves.
“If it’s faster than 100 bpm, irregularly irregular, and no p waves, the conclusion is very simple: It’s AFib,” Dr. Walsh said.
Multifocal atrial tachycardia (MAT): The heart rate is generally 100-150 bpm but can sometimes climb to about 180 bpm. The PP, PR, and RR intervals are varied, inconsistent, and don’t repeat. Most importantly, there are three or more different p wave morphologies in the same lead. One p wave might look like a tall mountain peak, another could be short and flat, and perhaps the next is big and broad.
MAT often occurs in patients with a structurally abnormal atrium – for example, in the setting of pulmonary hypertension leading to right atrial enlargement, with resultant depolarization occurring all over the atrium.
“Don’t confuse MAT with AFib: One has p waves, one does not. Otherwise they can look very similar,” she said.
Atrial flutter with variable conduction: A hallmark of this reentrant tachycardia is the atrial flutter waves occurring at about 300 bpm between each QRS complex.
“On board renewal exams, the question is often asked, ‘Which leads are the best identifiers of atrial flutter?’ And the answer is the inferior leads II, III, and aVF,” she said.
Another classic feature of atrial flutter with variable conduction is cluster beating attributable to a varied ventricular response. This results in a repeated pattern of irregular RR intervals: There might be a 2:1 block in AV conduction for several beats, then maybe a 4:1 block for several more, with resultant lengthening of the RR interval, then 3:1, with shortening of RR. This regularly irregular sequence is repeated throughout the EKG.
“Look for a pattern amidst the chaos,” the hospitalist advised.
The heart rate might be roughly 150 bpm with a 2:1 block, or 100 bpm with a 3:1 block. The p waves in atrial flutter with variable conduction can be either negatively or positively deflected.
Narrow complex tachycardias with a regular rhythm*
Sinus tachycardia: The heart rate is typically less than 160 bpm, the QRS complexes show a regular pattern, and upright p waves are clearly visible in leads II and V1.
The distinguishing feature of this arrhythmia is the ramping up and ramping down of the heart rate. The tachycardia is typically less than 160 bpm. But the rate doesn’t suddenly jump from, say, 70 to140 bpm in a flash while the patient is lying in the hospital bed. A trip to the telemetry room for a look at the telemetry strip will tell the tale: The heart rate will have progressively ramped up from 70, to 80, then 90, then 100, 110, 120, 130, to perhaps 140 bpm. And then it will similarly ramp back down in stages, with the up/down pattern being repeated.
Sinus tachycardia is generally a reflection of underlying significant systemic illness, such as sepsis, hypotension, or anemia.
Atrial tachycardia: The heart rate is generally 100-140 bpm, and p waves are present. But unlike in sinus tachycardia, the patient with atrial tachycardia lying in bed with a heart rate of 140 bpm is not in a state of profound neurohormonal activation and is not all that sick.
Another diagnostic clue is provided by a look at the telemonitoring strip. Unlike in sinus tachycardia, where the heart rate ramps up and then back down repeatedly, in atrial tachycardia the heart rate very quickly ramps up in stages to, say, 140 bpm, and then hangs there.
Atrial flutter: This is the only narrow complex tachycardia that appears in both the regular and irregular rhythm columns. It belongs in the irregular rhythm column when there is variable conduction and cluster beating, with a regularly irregular pattern of RR intervals. In contrast, when atrial flutter is in the regular rhythm column, it’s because the atrioventricular node is steadily conducting the atrial depolarizations at a rate of about 300 bpm. So there’s no cluster beating. As in atrial flutter with variable conduction, the flutter waves are visible most often in leads II, III, and aVF, where they can be either positively or negatively deflected.
AV reentrant tachycardias: These reentrant tachycardias can take two forms. In atrioventricular nodal reentrant tachycardia (AVnRT), the aberrant pathway is found entirely within the AV node, whereas in atrioventricular reentrant tachycardia (AVRT) the aberrant pathway is found outside the AV node. AVnRT is more common than AVRT. As in atrial flutter, there is no ramp up in heart rate. Patients will be lying in their hospital bed with a heart rate of, say, 80 bpm, and then suddenly it jumps to 180, 200, or even as high as 240 bpm “almost in a split second,” Dr. Walsh said.
No other narrow complex tachycardia reaches so high a heart rate. In both of these reentrant tachycardias the p waves are often buried in the QRS complex and can be tough to see. It’s very difficult to differentiate AVnRT from AVRT except by an electrophysiologic study.
Accelerated junctional tachycardia: This is most commonly the slowest of the narrow complex tachycardias, with a heart rate of less than 120 bpm.
“In the case of accelerated junctional tachycardia, think slow, think ‘regular,’ think of a rate often just over 100, usually with p waves after the QRS that are inverted because there’s retrograde conduction,” she advised.
She reported having no financial conflicts of interest regarding her presentation.
Correction, 8/19/20: An earlier version of this article mischaracterized the type of rhythm noted in this subhead.
A hospitalist looking at an EKG showing a narrow complex tachycardia needs to be able to come up with an accurate diagnosis of the rhythm pronto. And hospitalist Meghan Mary Walsh, MD, MPH, has developed a simple and efficient method for doing so within a minute or two that she’s used with great success on the wards and in teaching medical students and residents for nearly a decade.
she promised at HM20 Virtual, hosted by the Society of Hospital Medicine.
Her method involves asking three questions about the 12-lead EKG:
1) What’s the rate?
A narrow complex tachycardia by definition needs to be both narrow and fast, with a QRS complex of less than 0.12 seconds and a heart rate above 100 bpm. Knowing how far above 100 bpm the rate is will help with the differential diagnosis.
2) Is the rhythm regular or irregular?
“If I put the EKG 10 feet away from you, you should still be able to look at it and say the QRS is either systematically marching out – boom, boom, boom – or there is an irregular sea of QRS complexes where the RR intervals are variable and inconsistent,” said Dr. Walsh, a hospitalist at the University of Minnesota, Minneapolis, and chief academic officer at Hennepin Healthcare, where she oversees all medical students and residents training in the health system.
This distinction between a regular and irregular rhythm immediately narrows the differential by dividing the diagnostic possibilities into two columns (See chart). She urged her audience to commit the list to memory or keep it handy on their cell phone or in a notebook.
“If it’s irregular I’m going down the right column; if it’s regular I’m going down the left. And then I’m systematically running the drill,” she explained.
3) Are upright p waves present before each QRS complex in leads II and V1?
This information rules out some of the eight items in the differential diagnosis and rules in others.
Narrow complex tachycardias with an irregular rhythm
There are only three:
Atrial fibrillation: The heart rate is typically 110-160 bpm, although it can occasionally go higher. The rhythm is irregularly irregular: No two RR intervals on the EKG are exactly the same. And there are no p waves.
“If it’s faster than 100 bpm, irregularly irregular, and no p waves, the conclusion is very simple: It’s AFib,” Dr. Walsh said.
Multifocal atrial tachycardia (MAT): The heart rate is generally 100-150 bpm but can sometimes climb to about 180 bpm. The PP, PR, and RR intervals are varied, inconsistent, and don’t repeat. Most importantly, there are three or more different p wave morphologies in the same lead. One p wave might look like a tall mountain peak, another could be short and flat, and perhaps the next is big and broad.
MAT often occurs in patients with a structurally abnormal atrium – for example, in the setting of pulmonary hypertension leading to right atrial enlargement, with resultant depolarization occurring all over the atrium.
“Don’t confuse MAT with AFib: One has p waves, one does not. Otherwise they can look very similar,” she said.
Atrial flutter with variable conduction: A hallmark of this reentrant tachycardia is the atrial flutter waves occurring at about 300 bpm between each QRS complex.
“On board renewal exams, the question is often asked, ‘Which leads are the best identifiers of atrial flutter?’ And the answer is the inferior leads II, III, and aVF,” she said.
Another classic feature of atrial flutter with variable conduction is cluster beating attributable to a varied ventricular response. This results in a repeated pattern of irregular RR intervals: There might be a 2:1 block in AV conduction for several beats, then maybe a 4:1 block for several more, with resultant lengthening of the RR interval, then 3:1, with shortening of RR. This regularly irregular sequence is repeated throughout the EKG.
“Look for a pattern amidst the chaos,” the hospitalist advised.
The heart rate might be roughly 150 bpm with a 2:1 block, or 100 bpm with a 3:1 block. The p waves in atrial flutter with variable conduction can be either negatively or positively deflected.
Narrow complex tachycardias with a regular rhythm*
Sinus tachycardia: The heart rate is typically less than 160 bpm, the QRS complexes show a regular pattern, and upright p waves are clearly visible in leads II and V1.
The distinguishing feature of this arrhythmia is the ramping up and ramping down of the heart rate. The tachycardia is typically less than 160 bpm. But the rate doesn’t suddenly jump from, say, 70 to140 bpm in a flash while the patient is lying in the hospital bed. A trip to the telemetry room for a look at the telemetry strip will tell the tale: The heart rate will have progressively ramped up from 70, to 80, then 90, then 100, 110, 120, 130, to perhaps 140 bpm. And then it will similarly ramp back down in stages, with the up/down pattern being repeated.
Sinus tachycardia is generally a reflection of underlying significant systemic illness, such as sepsis, hypotension, or anemia.
Atrial tachycardia: The heart rate is generally 100-140 bpm, and p waves are present. But unlike in sinus tachycardia, the patient with atrial tachycardia lying in bed with a heart rate of 140 bpm is not in a state of profound neurohormonal activation and is not all that sick.
Another diagnostic clue is provided by a look at the telemonitoring strip. Unlike in sinus tachycardia, where the heart rate ramps up and then back down repeatedly, in atrial tachycardia the heart rate very quickly ramps up in stages to, say, 140 bpm, and then hangs there.
Atrial flutter: This is the only narrow complex tachycardia that appears in both the regular and irregular rhythm columns. It belongs in the irregular rhythm column when there is variable conduction and cluster beating, with a regularly irregular pattern of RR intervals. In contrast, when atrial flutter is in the regular rhythm column, it’s because the atrioventricular node is steadily conducting the atrial depolarizations at a rate of about 300 bpm. So there’s no cluster beating. As in atrial flutter with variable conduction, the flutter waves are visible most often in leads II, III, and aVF, where they can be either positively or negatively deflected.
AV reentrant tachycardias: These reentrant tachycardias can take two forms. In atrioventricular nodal reentrant tachycardia (AVnRT), the aberrant pathway is found entirely within the AV node, whereas in atrioventricular reentrant tachycardia (AVRT) the aberrant pathway is found outside the AV node. AVnRT is more common than AVRT. As in atrial flutter, there is no ramp up in heart rate. Patients will be lying in their hospital bed with a heart rate of, say, 80 bpm, and then suddenly it jumps to 180, 200, or even as high as 240 bpm “almost in a split second,” Dr. Walsh said.
No other narrow complex tachycardia reaches so high a heart rate. In both of these reentrant tachycardias the p waves are often buried in the QRS complex and can be tough to see. It’s very difficult to differentiate AVnRT from AVRT except by an electrophysiologic study.
Accelerated junctional tachycardia: This is most commonly the slowest of the narrow complex tachycardias, with a heart rate of less than 120 bpm.
“In the case of accelerated junctional tachycardia, think slow, think ‘regular,’ think of a rate often just over 100, usually with p waves after the QRS that are inverted because there’s retrograde conduction,” she advised.
She reported having no financial conflicts of interest regarding her presentation.
Correction, 8/19/20: An earlier version of this article mischaracterized the type of rhythm noted in this subhead.
FROM HM20 VIRTUAL
Pan-Pseudothrombocytopenia in COVID-19: A Harbinger for Lethal Arterial Thrombosis?
In late 2019 a new pandemic started in Wuhan, China, caused by the severe acute respiratory syndrome coronavirus 2 (SARS-CoV-2) due to its similarities with the virus responsible for the SARS outbreak of 2003. The disease manifestations are named coronavirus disease 2019 (COVID-19).1
Pseudothrombocytopenia, or platelet clumping, visualized on the peripheral blood smear, is a common cause for artificial thrombocytopenia laboratory reporting and is frequently attributed to laboratory artifact. In this case presentation, a critically ill patient with COVID-19 developed pan-pseudothrombocytopenia (ethylenediaminetetraacetic acid [EDTA], sodium citrate, and heparin tubes) just prior to his death from a ST-segment elevation myocardial infarction (STEMI) in the setting of therapeutic anticoagulation during a prolonged hospitalization. This case raises the possibility that pseudothrombocytopenia in the setting of COVID-19 critical illness may represent an ominous feature of COVID-19-associated coagulopathy (CAC). Furthermore, it prompts the question whether pseudothrombocytopenia in this setting is representative of increased platelet aggregation activity in vivo.
Case Presentation
A 50-year-old African American man who was diagnosed with COVID-19 3 days prior to admission presented to the emergency department of the W.G. (Bill) Hefner VA Medical Center in Salisbury, North Carolina, with worsening dyspnea and fever. His primary chronic medical problems included obesity (body mass index, 33), type 2 diabetes mellitus (hemoglobin A1c 2 months prior of 6.6%), migraine headaches, and obstructive sleep apnea. Shortly after presentation, his respiratory status declined, requiring intubation. He was admitted to the medical intensive care unit for further management.
Notable findings at admission included > 20 mcg/mL FEU D-dimer (normal range, 0-0.56 mcg/mL FEU), 20.4 mg/dL C-reactive protein (normal range, < 1 mg/dL), 30 mm/h erythrocyte sedimentation rate (normal range, 0-25 mm/h), and 3.56 ng/mL procalcitonin (normal range, 0.05-1.99 ng/mL). Patient’s hemoglobin and platelet counts were normal. Empiric antimicrobial therapy was initiated with ceftriaxone (2 g IV daily) and doxycycline (100 mg IV twice daily) due to concern of superimposed infection in the setting of an elevated procalcitonin.
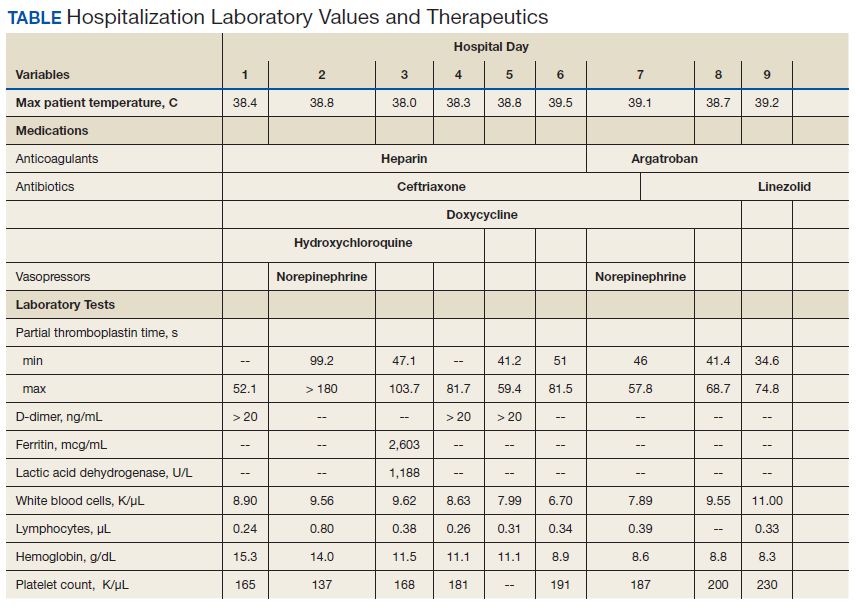
A heparin infusion was initiated (5,000 U IV bolus followed by continuous infusion with goal partial thromboplastin time [PTT] of 1.5x the upper limit of normal) on admission to treat CAC. Renal function worsened requiring intermittent renal replacement therapy on day 3. His lactate dehydrogenase was elevated to 1,188 U/L (normal range: 100-240 U/L) and ferritin was elevated to 2,603 ng/mL (normal range: 25-350 ng/mL) (Table). Initial neuromuscular blockade and prone positioning maneuvers were instituted to optimize oxygenation based on the latest literature for respiratory distress in the COVID-19 management.2
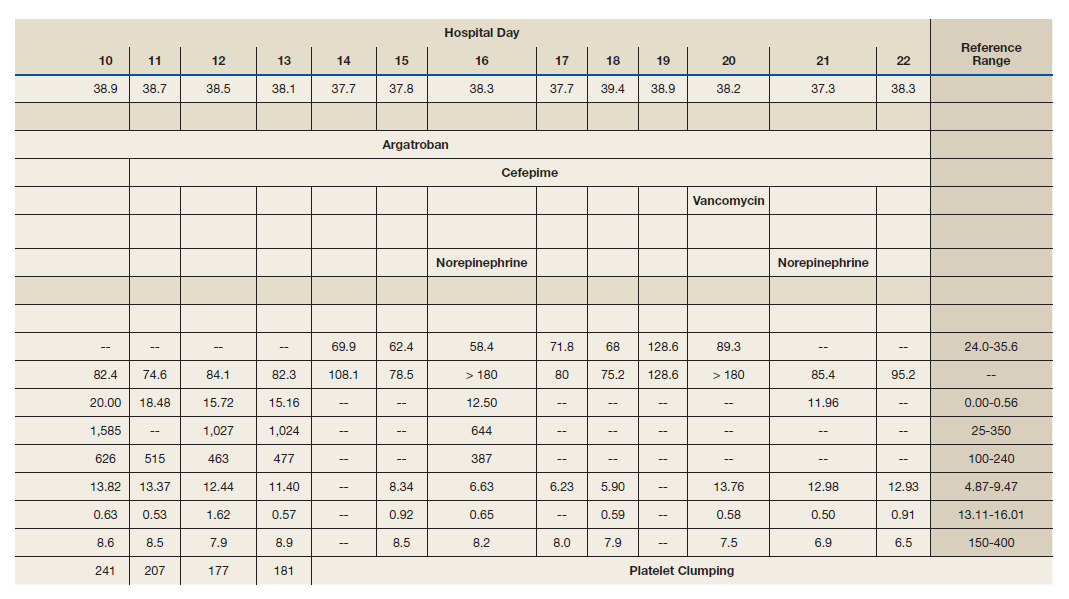
Intermittent norepinephrine infusion (5 mcg/min with a 2 mcg/min titration every 5 minutes as needed to maintain mean arterial pressure of > 65 mm Hg) was required for hemodynamic support throughout the patient’s course. Several therapies for COVID-19 were considered and were a reflection of the rapidly evolving literature during the care of patients with this disease. The patient originally received hydroxychloroquine (200 mg by mouth twice daily) in accordance with the US Department of Veterans Affairs (VA) institutional protocol between day 2 and day 4; however, hydroxychloroquine was stopped due to concerns of QTc prolongation. The patient also received 1 unit of convalescent plasma on day 6 after being enrolled in the expanded access program.3 The patient was not a candidate for remdesivir due to his unstable renal function and need for vasopressors. Finally, interleukin-6 inhibitors also were considered; however, the risk of superimposed infection precluded its use.
On day 7 antimicrobial therapy was transitioned to linezolid (600 mg IV twice daily) due to the persistence of fever and a portable chest radiograph revealing diffuse infiltrates throughout the bilateral lungs, worse compared with prior radiograph on day 5, suggesting a worsening of pneumonia. On day 12, the patient was transitioned to cefepime (1 gram IV daily) to broaden antimicrobial coverage and was continued thereafter. Blood cultures were negative throughout his hospitalization.
Given his worsening clinical scenario there was a question about whether or not the patient was still shedding virus for prognostic and therapeutic implications. Therefore, his SARS-CoV-2 test by polymerase chain reaction nasopharyngeal was positive again on day 18. On day 20, the patient developed leukocytosis, his fever persisted, and a portable chest radiograph revealed extensive bilateral pulmonary opacities with focal worsening in left lower base. Due to this constellation of findings, a vancomycin IV (1,500 mg once) was started for empirical treatment of hospital-acquired pneumonia. Sputum samples obtained on day 20 revealed Staphylococcus aureus on subsequent days.
From a hematologic perspective, on day 9 due to challenges to maintain a therapeutic level of anticoagulation with heparin infusion thought to be related to antithrombin deficiency, anticoagulation was changed to argatroban infusion (0.5 mcg/kg/min targeting a PTT of 70-105 seconds) for ongoing management of CAC. Although D-dimer was > 20 mcg/mL FEU on admission and on days 4 and 5, D-dimer trended down to 12.5 mcg/mL FEU on day 16.
Throughout the patient’s hospital stay, no significant bleeding was seen. Hemoglobin was 15.2 g/dL on admission, but anemia developed with a nadir of 6.5 g/dL, warranting transfusion of red blood cells on day 22. Platelet count was 165,000 per microliter on admission and remained within normal limits until platelet clumping was noted on day 15 laboratory collection.
Hematology was consulted on day 20 to obtain an accurate platelet count. A peripheral blood smear from a sodium citrate containing tube was remarkable for prominent platelet clumping, particularly at the periphery of the slide (Figure 1). Platelet clumping was reproduced in samples containing EDTA and heparin. Other features of the peripheral blood smear included the presence of echinocytes with rare schistocytes. To investigate for presence of disseminated intravascular coagulation on day 22, fibrinogen was found to be mildly elevated at 538 mg/dL (normal range: 243-517 mg/dL) and a D-dimer value of 11.96 mcg/mL FEU.
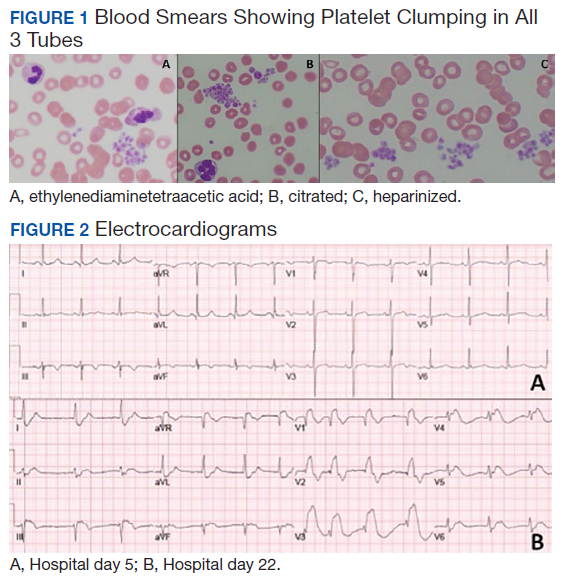
On day 22, the patient’s ventilator requirements escalated to requiring 100% FiO2 and 10 cm H20 of positive end-expiratory pressure with mean arterial pressures in the 50 to 60 mm Hg range. Within 30 minutes an electrocardiogram (EKG) obtained revealed a STEMI (Figure 2). Troponin was measured at 0.65 ng/mL (normal range: 0.02-0.06 ng/mL). Just after an EKG was performed, the patient developed a ventricular fibrillation arrest and was unable to obtain return of spontaneous circulation. The patient was pronounced dead. The family declined an autopsy.
Discussion
Pseudothrombocytopenia, or platelet clumping (agglutination), is estimated to be present in up to 2% of hospitalized patients.4 Pseudothrombocytopenia was found to be the root cause of thrombocytopenia hematology consultations in up to 4% of hospitalized patients.5 The etiology is commonly ascribed to EDTA inducing a conformational change in the GpIIb-IIIa platelet complex, rendering it susceptible to binding of autoantibodies, which cause subsequent platelet agglutination.6 In most cases (83%), the use of a non-EDTA anticoagulant, such as sodium citrate, resolves the platelet agglutination and allows for accurate platelet count reporting.4 Pseudothrombocytopenia in most cases is considered an in vitro finding without clinical relevance.7 However, in this patient’s case, his pan-pseudothrombocytopenia was temporally associated with an arterial occlusive event (STEMI) leading to his demise despite therapeutic anticoagulation in the setting of CAC. This temporal association raises the possibility that pseudothrombocytopenia seen on the peripheral blood smear is an accurate representation of in vivo activity.
Pseudothrombocytopenia has been associated with sepsis from bacterial and viral causes as well as autoimmune and medication effect.4,8-10 Li and colleagues reported transient EDTA-dependent pseudothrombocytopenia in a patient with COVID-19 infection; however, platelet clumping resolved with use of a citrate tube, and the EDTA-dependent pseudothrombocytopenia phenomenon resolved with patient recovery.11 The frequency of COVID-19-related pseudothrombocytopenia is currently unknown.
Although the understanding of COVID-19-associated CAC continues to evolve, it seems that initial reports support the idea that hemostatic dysfunction tends to more thrombosis than to bleeding.12 Rather than overt disseminated intravascular coagulation with reduced fibrinogen and bleeding, CAC is more closely associated with blood clotting, as demonstrated by autopsy studies revealing microvascular thrombosis in the lungs.13 The D-dimer test has been identified as the most useful biomarker by the International Society of Thrombosis and Hemostasis to screen for CAC and stratify patients who warrant admission or closer monitoring.12 Other identified features of CAC include prolonged prothrombin time and thrombocytopenia.12
There have been varying clinical approaches to CAC management. A retrospective review found that prophylactic heparin doses were associated with improved mortality in those with elevated D-dimer > 3.0 mg/L.14 There continues to be a diversity of varying clinical approaches with many medical centers advocating for an intensified prophylactic twice daily low molecular-weight heparin compared with others advocating for full therapeutic dose anticoagulation for patients with elevated D-dimer.15 This patient was treated aggressively with full-dose anticoagulation, and despite his having a down-trend in D-dimer, he suffered a lethal arterial thrombosis in the form of a STEMI.
Varatharajah and Rajah
Conclusions
This patient’s case highlights the presence of pan-pseudothrombocytopenia despite the use of a sodium citrate and heparin containing tube in a COVID-19 infection with multiorgan dysfunction. This developed 1 week prior to the patient suffering a STEMI despite therapeutic anticoagulation. Although the exact nature of CAC remains to be worked out, it is possible that platelet agglutination/clumping seen on the peripheral blood smear is representative of in vivo activity and serves as a harbinger for worsening thrombosis. The frequency of such phenomenon and efficacy of further interventions has yet to be explored.
1. World Health Organization. Naming the coronavirus disease (COVID-19) and the virus that causes it. https://www.who.int/emergencies/diseases/novel-coronavirus-2019/technical-guidance/naming-the-coronavirus-disease-(COVID-2019)-and-the-virus-that-causes-it. Accessed July 15, 2020.
2. Ghelichkhani P, Esmaeili M. Prone position in management of COVID-19 patients; a commentary. Arch Acad Emerg Med. 2020;8(1):e48. Published 2020 April 11.
3. National Library of Medicine, Clinicaltrials.gov. Expanded access to convalescent plasma for the treatment of patients with COVID-19. NCT04338360. https://clinicaltrials.gov/ct2/show/nct04338360. Update April 20, 2020. Accessed July 15, 2020.
4. Tan GC, Stalling M, Dennis G, Nunez M, Kahwash SB. Pseudothrombocytopenia due to platelet clumping: a case report and brief review of the literature. Case Rep Hematol. 2016;2016:3036476. doi:10.1155/2016/3036476
5. Boxer M, Biuso TJ. Etiologies of thrombocytopenia in the community hospital: the experience of 1 hematologist. Am J Med. 2020;133(5):e183-e186. doi:10.1016/j.amjmed.2019.10.027
6. Fiorin F, Steffan A, Pradella P, Bizzaro N, Potenza R, De Angelis V. IgG platelet antibodies in EDTA-dependent pseudothrombocytopenia bind to platelet membrane glycoprotein IIb. Am J Clin Pathol. 1998;110(2):178-183. doi:10.1093/ajcp/110.2.178
7. Nagler M, Keller P, Siegrist S, Alberio L. A case of EDTA-Dependent pseudothrombocytopenia: simple recognition of an underdiagnosed and misleading phenomenon. BMC Clin Pathol. 2014;14:19. doi:10.1186/1472-6890-14-19
8. Mori M, Kudo H, Yoshitake S, Ito K, Shinguu C, Noguchi T. Transient EDTA-dependent pseudothrombocytopenia in a patient with sepsis. Intensive Care Med. 2000;26(2):218-220. doi:10.1007/s001340050050.
9. Choe W-H, Cho Y-U, Chae J-D, Kim S-H. 2013. Pseudothrombocytopenia or platelet clumping as a possible cause of low platelet count in patients with viral infection: a case series from single institution focusing on hepatitis A virus infection. Int J Lab Hematol. 2013;35(1):70-76. doi:10.1111/j.1751-553x.2012.01466.
10. Hsieh AT, Chao TY, Chen YC. Pseudothrombocytopenia associated with infectious mononucleosis. Arch Pathol Lab Med. 2003;127(1):e17-e18. doi:10.1043/0003-9985(2003)1272.0.CO;2
11. Li H, Wang B, Ning L, Luo Y, Xiang S. Transient appearance of EDTA dependent pseudothrombocytopenia in a patient with 2019 novel coronavirus pneumonia [published online ahead of print, 2020 May 5]. Platelets. 2020;1-2. doi:10.1080/09537104.2020.1760231
12. Thachil J, Tang N, Gando S, et al. ISTH interim guidance on recognition and management of coagulopathy in COVID-19. J Thromb Haemost. 2020;18(5):1023-1026. doi:10.1111/jth.14810
13. Magro C, Mulvey JJ, Berlin D, et al. Complement associated microvascular injury and thrombosis in the pathogenesis of severe COVID-19 infection: a report of five cases. Transl Res. 2020;220:1-13. doi:10.1016/j.trsl.2020.04.007
14. Tang N, Bai H, Chen X, Gong J, Li D, Sun Z. Anticoagulant treatment is associated with decreased mortality in severe coronavirus disease 2019 patients with coagulopathy. J Thromb Haemost. 2020;18(5):1094-1099. doi:10.1111/jth.14817
15. Connors JM, Levy JH. COVID-19 and its implications for thrombosis and anticoagulation. Blood. 2020;125(23):2033-2040. doi.org/10.1182/blood.2020006000.
16. Varatharajah N, Rajah S. Microthrombotic complications of COVID-19 are likely due to embolism of circulating endothelial derived ultralarge von Willebrand factor (eULVWF) Decorated-Platelet Strings. Fed Pract. 2020;37(6):258-259. doi:10.12788/fp.0001
17. Bernardo A, Ball C, Nolasco L, Choi H, Moake JL, Dong JF. Platelets adhered to endothelial cell-bound ultra-large von Willebrand factor strings support leukocyte tethering and rolling under high shear stress. J Thromb Haemost. 2005;3(3):562-570. doi:10.1111/j.1538-7836.2005.01122.x
In late 2019 a new pandemic started in Wuhan, China, caused by the severe acute respiratory syndrome coronavirus 2 (SARS-CoV-2) due to its similarities with the virus responsible for the SARS outbreak of 2003. The disease manifestations are named coronavirus disease 2019 (COVID-19).1
Pseudothrombocytopenia, or platelet clumping, visualized on the peripheral blood smear, is a common cause for artificial thrombocytopenia laboratory reporting and is frequently attributed to laboratory artifact. In this case presentation, a critically ill patient with COVID-19 developed pan-pseudothrombocytopenia (ethylenediaminetetraacetic acid [EDTA], sodium citrate, and heparin tubes) just prior to his death from a ST-segment elevation myocardial infarction (STEMI) in the setting of therapeutic anticoagulation during a prolonged hospitalization. This case raises the possibility that pseudothrombocytopenia in the setting of COVID-19 critical illness may represent an ominous feature of COVID-19-associated coagulopathy (CAC). Furthermore, it prompts the question whether pseudothrombocytopenia in this setting is representative of increased platelet aggregation activity in vivo.
Case Presentation
A 50-year-old African American man who was diagnosed with COVID-19 3 days prior to admission presented to the emergency department of the W.G. (Bill) Hefner VA Medical Center in Salisbury, North Carolina, with worsening dyspnea and fever. His primary chronic medical problems included obesity (body mass index, 33), type 2 diabetes mellitus (hemoglobin A1c 2 months prior of 6.6%), migraine headaches, and obstructive sleep apnea. Shortly after presentation, his respiratory status declined, requiring intubation. He was admitted to the medical intensive care unit for further management.
Notable findings at admission included > 20 mcg/mL FEU D-dimer (normal range, 0-0.56 mcg/mL FEU), 20.4 mg/dL C-reactive protein (normal range, < 1 mg/dL), 30 mm/h erythrocyte sedimentation rate (normal range, 0-25 mm/h), and 3.56 ng/mL procalcitonin (normal range, 0.05-1.99 ng/mL). Patient’s hemoglobin and platelet counts were normal. Empiric antimicrobial therapy was initiated with ceftriaxone (2 g IV daily) and doxycycline (100 mg IV twice daily) due to concern of superimposed infection in the setting of an elevated procalcitonin.
A heparin infusion was initiated (5,000 U IV bolus followed by continuous infusion with goal partial thromboplastin time [PTT] of 1.5x the upper limit of normal) on admission to treat CAC. Renal function worsened requiring intermittent renal replacement therapy on day 3. His lactate dehydrogenase was elevated to 1,188 U/L (normal range: 100-240 U/L) and ferritin was elevated to 2,603 ng/mL (normal range: 25-350 ng/mL) (Table). Initial neuromuscular blockade and prone positioning maneuvers were instituted to optimize oxygenation based on the latest literature for respiratory distress in the COVID-19 management.2
Intermittent norepinephrine infusion (5 mcg/min with a 2 mcg/min titration every 5 minutes as needed to maintain mean arterial pressure of > 65 mm Hg) was required for hemodynamic support throughout the patient’s course. Several therapies for COVID-19 were considered and were a reflection of the rapidly evolving literature during the care of patients with this disease. The patient originally received hydroxychloroquine (200 mg by mouth twice daily) in accordance with the US Department of Veterans Affairs (VA) institutional protocol between day 2 and day 4; however, hydroxychloroquine was stopped due to concerns of QTc prolongation. The patient also received 1 unit of convalescent plasma on day 6 after being enrolled in the expanded access program.3 The patient was not a candidate for remdesivir due to his unstable renal function and need for vasopressors. Finally, interleukin-6 inhibitors also were considered; however, the risk of superimposed infection precluded its use.
On day 7 antimicrobial therapy was transitioned to linezolid (600 mg IV twice daily) due to the persistence of fever and a portable chest radiograph revealing diffuse infiltrates throughout the bilateral lungs, worse compared with prior radiograph on day 5, suggesting a worsening of pneumonia. On day 12, the patient was transitioned to cefepime (1 gram IV daily) to broaden antimicrobial coverage and was continued thereafter. Blood cultures were negative throughout his hospitalization.
Given his worsening clinical scenario there was a question about whether or not the patient was still shedding virus for prognostic and therapeutic implications. Therefore, his SARS-CoV-2 test by polymerase chain reaction nasopharyngeal was positive again on day 18. On day 20, the patient developed leukocytosis, his fever persisted, and a portable chest radiograph revealed extensive bilateral pulmonary opacities with focal worsening in left lower base. Due to this constellation of findings, a vancomycin IV (1,500 mg once) was started for empirical treatment of hospital-acquired pneumonia. Sputum samples obtained on day 20 revealed Staphylococcus aureus on subsequent days.
From a hematologic perspective, on day 9 due to challenges to maintain a therapeutic level of anticoagulation with heparin infusion thought to be related to antithrombin deficiency, anticoagulation was changed to argatroban infusion (0.5 mcg/kg/min targeting a PTT of 70-105 seconds) for ongoing management of CAC. Although D-dimer was > 20 mcg/mL FEU on admission and on days 4 and 5, D-dimer trended down to 12.5 mcg/mL FEU on day 16.
Throughout the patient’s hospital stay, no significant bleeding was seen. Hemoglobin was 15.2 g/dL on admission, but anemia developed with a nadir of 6.5 g/dL, warranting transfusion of red blood cells on day 22. Platelet count was 165,000 per microliter on admission and remained within normal limits until platelet clumping was noted on day 15 laboratory collection.
Hematology was consulted on day 20 to obtain an accurate platelet count. A peripheral blood smear from a sodium citrate containing tube was remarkable for prominent platelet clumping, particularly at the periphery of the slide (Figure 1). Platelet clumping was reproduced in samples containing EDTA and heparin. Other features of the peripheral blood smear included the presence of echinocytes with rare schistocytes. To investigate for presence of disseminated intravascular coagulation on day 22, fibrinogen was found to be mildly elevated at 538 mg/dL (normal range: 243-517 mg/dL) and a D-dimer value of 11.96 mcg/mL FEU.
On day 22, the patient’s ventilator requirements escalated to requiring 100% FiO2 and 10 cm H20 of positive end-expiratory pressure with mean arterial pressures in the 50 to 60 mm Hg range. Within 30 minutes an electrocardiogram (EKG) obtained revealed a STEMI (Figure 2). Troponin was measured at 0.65 ng/mL (normal range: 0.02-0.06 ng/mL). Just after an EKG was performed, the patient developed a ventricular fibrillation arrest and was unable to obtain return of spontaneous circulation. The patient was pronounced dead. The family declined an autopsy.
Discussion
Pseudothrombocytopenia, or platelet clumping (agglutination), is estimated to be present in up to 2% of hospitalized patients.4 Pseudothrombocytopenia was found to be the root cause of thrombocytopenia hematology consultations in up to 4% of hospitalized patients.5 The etiology is commonly ascribed to EDTA inducing a conformational change in the GpIIb-IIIa platelet complex, rendering it susceptible to binding of autoantibodies, which cause subsequent platelet agglutination.6 In most cases (83%), the use of a non-EDTA anticoagulant, such as sodium citrate, resolves the platelet agglutination and allows for accurate platelet count reporting.4 Pseudothrombocytopenia in most cases is considered an in vitro finding without clinical relevance.7 However, in this patient’s case, his pan-pseudothrombocytopenia was temporally associated with an arterial occlusive event (STEMI) leading to his demise despite therapeutic anticoagulation in the setting of CAC. This temporal association raises the possibility that pseudothrombocytopenia seen on the peripheral blood smear is an accurate representation of in vivo activity.
Pseudothrombocytopenia has been associated with sepsis from bacterial and viral causes as well as autoimmune and medication effect.4,8-10 Li and colleagues reported transient EDTA-dependent pseudothrombocytopenia in a patient with COVID-19 infection; however, platelet clumping resolved with use of a citrate tube, and the EDTA-dependent pseudothrombocytopenia phenomenon resolved with patient recovery.11 The frequency of COVID-19-related pseudothrombocytopenia is currently unknown.
Although the understanding of COVID-19-associated CAC continues to evolve, it seems that initial reports support the idea that hemostatic dysfunction tends to more thrombosis than to bleeding.12 Rather than overt disseminated intravascular coagulation with reduced fibrinogen and bleeding, CAC is more closely associated with blood clotting, as demonstrated by autopsy studies revealing microvascular thrombosis in the lungs.13 The D-dimer test has been identified as the most useful biomarker by the International Society of Thrombosis and Hemostasis to screen for CAC and stratify patients who warrant admission or closer monitoring.12 Other identified features of CAC include prolonged prothrombin time and thrombocytopenia.12
There have been varying clinical approaches to CAC management. A retrospective review found that prophylactic heparin doses were associated with improved mortality in those with elevated D-dimer > 3.0 mg/L.14 There continues to be a diversity of varying clinical approaches with many medical centers advocating for an intensified prophylactic twice daily low molecular-weight heparin compared with others advocating for full therapeutic dose anticoagulation for patients with elevated D-dimer.15 This patient was treated aggressively with full-dose anticoagulation, and despite his having a down-trend in D-dimer, he suffered a lethal arterial thrombosis in the form of a STEMI.
Varatharajah and Rajah
Conclusions
This patient’s case highlights the presence of pan-pseudothrombocytopenia despite the use of a sodium citrate and heparin containing tube in a COVID-19 infection with multiorgan dysfunction. This developed 1 week prior to the patient suffering a STEMI despite therapeutic anticoagulation. Although the exact nature of CAC remains to be worked out, it is possible that platelet agglutination/clumping seen on the peripheral blood smear is representative of in vivo activity and serves as a harbinger for worsening thrombosis. The frequency of such phenomenon and efficacy of further interventions has yet to be explored.
1. World Health Organization. Naming the coronavirus disease (COVID-19) and the virus that causes it. https://www.who.int/emergencies/diseases/novel-coronavirus-2019/technical-guidance/naming-the-coronavirus-disease-(COVID-2019)-and-the-virus-that-causes-it. Accessed July 15, 2020.
2. Ghelichkhani P, Esmaeili M. Prone position in management of COVID-19 patients; a commentary. Arch Acad Emerg Med. 2020;8(1):e48. Published 2020 April 11.
3. National Library of Medicine, Clinicaltrials.gov. Expanded access to convalescent plasma for the treatment of patients with COVID-19. NCT04338360. https://clinicaltrials.gov/ct2/show/nct04338360. Update April 20, 2020. Accessed July 15, 2020.
4. Tan GC, Stalling M, Dennis G, Nunez M, Kahwash SB. Pseudothrombocytopenia due to platelet clumping: a case report and brief review of the literature. Case Rep Hematol. 2016;2016:3036476. doi:10.1155/2016/3036476
5. Boxer M, Biuso TJ. Etiologies of thrombocytopenia in the community hospital: the experience of 1 hematologist. Am J Med. 2020;133(5):e183-e186. doi:10.1016/j.amjmed.2019.10.027
6. Fiorin F, Steffan A, Pradella P, Bizzaro N, Potenza R, De Angelis V. IgG platelet antibodies in EDTA-dependent pseudothrombocytopenia bind to platelet membrane glycoprotein IIb. Am J Clin Pathol. 1998;110(2):178-183. doi:10.1093/ajcp/110.2.178
7. Nagler M, Keller P, Siegrist S, Alberio L. A case of EDTA-Dependent pseudothrombocytopenia: simple recognition of an underdiagnosed and misleading phenomenon. BMC Clin Pathol. 2014;14:19. doi:10.1186/1472-6890-14-19
8. Mori M, Kudo H, Yoshitake S, Ito K, Shinguu C, Noguchi T. Transient EDTA-dependent pseudothrombocytopenia in a patient with sepsis. Intensive Care Med. 2000;26(2):218-220. doi:10.1007/s001340050050.
9. Choe W-H, Cho Y-U, Chae J-D, Kim S-H. 2013. Pseudothrombocytopenia or platelet clumping as a possible cause of low platelet count in patients with viral infection: a case series from single institution focusing on hepatitis A virus infection. Int J Lab Hematol. 2013;35(1):70-76. doi:10.1111/j.1751-553x.2012.01466.
10. Hsieh AT, Chao TY, Chen YC. Pseudothrombocytopenia associated with infectious mononucleosis. Arch Pathol Lab Med. 2003;127(1):e17-e18. doi:10.1043/0003-9985(2003)1272.0.CO;2
11. Li H, Wang B, Ning L, Luo Y, Xiang S. Transient appearance of EDTA dependent pseudothrombocytopenia in a patient with 2019 novel coronavirus pneumonia [published online ahead of print, 2020 May 5]. Platelets. 2020;1-2. doi:10.1080/09537104.2020.1760231
12. Thachil J, Tang N, Gando S, et al. ISTH interim guidance on recognition and management of coagulopathy in COVID-19. J Thromb Haemost. 2020;18(5):1023-1026. doi:10.1111/jth.14810
13. Magro C, Mulvey JJ, Berlin D, et al. Complement associated microvascular injury and thrombosis in the pathogenesis of severe COVID-19 infection: a report of five cases. Transl Res. 2020;220:1-13. doi:10.1016/j.trsl.2020.04.007
14. Tang N, Bai H, Chen X, Gong J, Li D, Sun Z. Anticoagulant treatment is associated with decreased mortality in severe coronavirus disease 2019 patients with coagulopathy. J Thromb Haemost. 2020;18(5):1094-1099. doi:10.1111/jth.14817
15. Connors JM, Levy JH. COVID-19 and its implications for thrombosis and anticoagulation. Blood. 2020;125(23):2033-2040. doi.org/10.1182/blood.2020006000.
16. Varatharajah N, Rajah S. Microthrombotic complications of COVID-19 are likely due to embolism of circulating endothelial derived ultralarge von Willebrand factor (eULVWF) Decorated-Platelet Strings. Fed Pract. 2020;37(6):258-259. doi:10.12788/fp.0001
17. Bernardo A, Ball C, Nolasco L, Choi H, Moake JL, Dong JF. Platelets adhered to endothelial cell-bound ultra-large von Willebrand factor strings support leukocyte tethering and rolling under high shear stress. J Thromb Haemost. 2005;3(3):562-570. doi:10.1111/j.1538-7836.2005.01122.x
Since COVID-19 onset, admissions for MI are down, mortality rates are up
A substantial decrease in hospital admissions for acute MI was accompanied by a rise in mortality, particularly for ST-segment elevation MI (STEMI), following the onset of the COVID-19 pandemic, according to a cross-sectional retrospective study.

Although it can’t be confirmed from these results that the observed increase in in-hospital acute MI (AMI) mortality are related to delays in seeking treatment, this is a reasonable working hypothesis until more is known, commented Harlan Krumholz, MD, who was not involved in the study.
The analysis, derived from data collected at 49 centers in a hospital system spread across six states, supports previous reports that patients with AMI were avoiding hospitalization, according to the investigators, who were led by Tyler J. Gluckman, MD, medical director of the Center for Cardiovascular Analytics, Providence Heart Institute, Portland, Ore.
When compared with a nearly 14-month period that preceded the COVID-19 pandemic, the rate of AMI-associated hospitalization fell by 19 cases per week (95% confidence interval, –29.0 to –9.0 cases) in the early COVID-19 period, which was defined by the investigators as spanning from Feb. 23, 2020 to March 28, 2020.
The case rate per week then increased by 10.5 (95% CI, 4.6-16.5 cases) in a subsequent 8-week period spanning between March 29, 2020, and May 16, 2020. Although a substantial increase from the early COVID-19 period, the case rate remained below the baseline established before COVID-19.
The analysis looked at 15,244 AMI hospitalizations among 14,724 patients treated in the Providence St. Joseph Hospital System, which has facilities in Alaska, California, Montana, Oregon, Texas, and Washington. The 1,915 AMI cases captured from Feb. 23, 2020, represented 13% of the total.
Differences in mortality, patients, treatment
In the early period, the ratio of observed-to-expected (O/E) mortality relative to the pre–COVID-19 baseline increased by 27% (odds ratio, 1.27; 95% CI, 1.07-1.48). When STEMI was analyzed separately, the O/E mortality was nearly double that of the baseline period (OR, 1.96; 95% CI, 1.22-2.70). In the latter post–COVID-19 period of observation, the overall increase in AMI-associated mortality on the basis of an O/E ratio was no longer significant relative to the baseline period (OR, 1.23; 95% CI, 0.98-1.47). However, the relative increase in STEMI-associated mortality on an O/E basis was even greater (OR, 2.40; 95% CI, 1.65-3.16) in the second COVID-19 period analyzed. Even after risk adjustment, the OR for STEMI mortality remained significantly elevated relative to baseline (1.52; 95% CI, 1.02-2.26).
The differences in AMI patients treated before the onset of the COVID-19 pandemic and those treated afterwards might be relevant, according to the investigators. Specifically, patients hospitalized after Feb. 23, 2020 were 1-3 years younger (P < .001) depending on type of AMI, and more likely to be Asian (P = .01).
The length of stay was 6 hours shorter in the early COVID-19 period and 7 hours shorter in the latter period relative to baseline, but an analysis of treatment approaches to non-STEMI and STEMI during the COVID-19 pandemic were not found to be significantly different from baseline.
Prior to the COVID-19 pandemic, 79% of STEMI patients and 77% of non-STEMI patients were discharged home, which was significantly lower than in the early COVID-19 period, when 83% (P = .02) of STEMI and 81% (P = .006) of non-STEMI patients were discharged home. In the latter period, discharge to home care was also significantly higher than in the baseline period.
More than fear of COVID-19?
One theory to account for the reduction in AMI hospitalizations and the increase in AMI-related mortality is the possibility that patients were slow to seek care at acute care hospitals because of concern about COVID-19 infection, according to Dr. Gluckman and coinvestigators.
“Given the time-sensitive nature of STEMI, any delay by patients, emergency medical services, the emergency department, or cardiac catheterization laboratory may have played a role,” they suggested.
In an interview, Dr. Gluckman said that further effort to identify the reasons for the increased AMI-related mortality is planned. Pulling data from the electronic medical records of the patients included in this retrospective analysis might be a “challenge,” but Dr. Gluckman reported that he and his coinvestigators plan to look at a different set of registry data that might provide information on sources of delay, particularly in the STEMI population.
“This includes looking at a number of time factors, such as symptom onset to first medical contact, first medical contact to device, and door-in-door-out times,” Dr. Gluckman said. The goal is to “better understand if delays [in treatment] occurred during the pandemic and, if so, how they may have contributed to increases in risk adjusted mortality.”
Dr. Krumholz, director of the Yale Center for Outcomes Research and Evaluation, New Haven, Conn., called this study a “useful” confirmation of changes in AMI-related care with the onset of the COVID-19 pandemic. As reported anecdotally, the study “indicates marked decreases in hospitalizations of patients with AMI even in areas that were not experiencing big outbreaks but did have some restrictions to limit spread,” he noted.
More data gathered by other centers might provide information about what it all means.
“There remain so many questions about what happened and what consequences accrued,” Dr. Krumholz observed. “In the meantime, we need to continue to send the message that people with symptoms that suggest a heart attack need to rapidly seek care.”
The investigators reported having no financial conflicts of interest.
SOURCE: Gluckman TJ et al. JAMA Cardiol. 2020 Aug 7. doi: 10.1001/jamacardio.2020.3629.
A substantial decrease in hospital admissions for acute MI was accompanied by a rise in mortality, particularly for ST-segment elevation MI (STEMI), following the onset of the COVID-19 pandemic, according to a cross-sectional retrospective study.
Although it can’t be confirmed from these results that the observed increase in in-hospital acute MI (AMI) mortality are related to delays in seeking treatment, this is a reasonable working hypothesis until more is known, commented Harlan Krumholz, MD, who was not involved in the study.
The analysis, derived from data collected at 49 centers in a hospital system spread across six states, supports previous reports that patients with AMI were avoiding hospitalization, according to the investigators, who were led by Tyler J. Gluckman, MD, medical director of the Center for Cardiovascular Analytics, Providence Heart Institute, Portland, Ore.
When compared with a nearly 14-month period that preceded the COVID-19 pandemic, the rate of AMI-associated hospitalization fell by 19 cases per week (95% confidence interval, –29.0 to –9.0 cases) in the early COVID-19 period, which was defined by the investigators as spanning from Feb. 23, 2020 to March 28, 2020.
The case rate per week then increased by 10.5 (95% CI, 4.6-16.5 cases) in a subsequent 8-week period spanning between March 29, 2020, and May 16, 2020. Although a substantial increase from the early COVID-19 period, the case rate remained below the baseline established before COVID-19.
The analysis looked at 15,244 AMI hospitalizations among 14,724 patients treated in the Providence St. Joseph Hospital System, which has facilities in Alaska, California, Montana, Oregon, Texas, and Washington. The 1,915 AMI cases captured from Feb. 23, 2020, represented 13% of the total.
Differences in mortality, patients, treatment
In the early period, the ratio of observed-to-expected (O/E) mortality relative to the pre–COVID-19 baseline increased by 27% (odds ratio, 1.27; 95% CI, 1.07-1.48). When STEMI was analyzed separately, the O/E mortality was nearly double that of the baseline period (OR, 1.96; 95% CI, 1.22-2.70). In the latter post–COVID-19 period of observation, the overall increase in AMI-associated mortality on the basis of an O/E ratio was no longer significant relative to the baseline period (OR, 1.23; 95% CI, 0.98-1.47). However, the relative increase in STEMI-associated mortality on an O/E basis was even greater (OR, 2.40; 95% CI, 1.65-3.16) in the second COVID-19 period analyzed. Even after risk adjustment, the OR for STEMI mortality remained significantly elevated relative to baseline (1.52; 95% CI, 1.02-2.26).
The differences in AMI patients treated before the onset of the COVID-19 pandemic and those treated afterwards might be relevant, according to the investigators. Specifically, patients hospitalized after Feb. 23, 2020 were 1-3 years younger (P < .001) depending on type of AMI, and more likely to be Asian (P = .01).
The length of stay was 6 hours shorter in the early COVID-19 period and 7 hours shorter in the latter period relative to baseline, but an analysis of treatment approaches to non-STEMI and STEMI during the COVID-19 pandemic were not found to be significantly different from baseline.
Prior to the COVID-19 pandemic, 79% of STEMI patients and 77% of non-STEMI patients were discharged home, which was significantly lower than in the early COVID-19 period, when 83% (P = .02) of STEMI and 81% (P = .006) of non-STEMI patients were discharged home. In the latter period, discharge to home care was also significantly higher than in the baseline period.
More than fear of COVID-19?
One theory to account for the reduction in AMI hospitalizations and the increase in AMI-related mortality is the possibility that patients were slow to seek care at acute care hospitals because of concern about COVID-19 infection, according to Dr. Gluckman and coinvestigators.
“Given the time-sensitive nature of STEMI, any delay by patients, emergency medical services, the emergency department, or cardiac catheterization laboratory may have played a role,” they suggested.
In an interview, Dr. Gluckman said that further effort to identify the reasons for the increased AMI-related mortality is planned. Pulling data from the electronic medical records of the patients included in this retrospective analysis might be a “challenge,” but Dr. Gluckman reported that he and his coinvestigators plan to look at a different set of registry data that might provide information on sources of delay, particularly in the STEMI population.
“This includes looking at a number of time factors, such as symptom onset to first medical contact, first medical contact to device, and door-in-door-out times,” Dr. Gluckman said. The goal is to “better understand if delays [in treatment] occurred during the pandemic and, if so, how they may have contributed to increases in risk adjusted mortality.”
Dr. Krumholz, director of the Yale Center for Outcomes Research and Evaluation, New Haven, Conn., called this study a “useful” confirmation of changes in AMI-related care with the onset of the COVID-19 pandemic. As reported anecdotally, the study “indicates marked decreases in hospitalizations of patients with AMI even in areas that were not experiencing big outbreaks but did have some restrictions to limit spread,” he noted.
More data gathered by other centers might provide information about what it all means.
“There remain so many questions about what happened and what consequences accrued,” Dr. Krumholz observed. “In the meantime, we need to continue to send the message that people with symptoms that suggest a heart attack need to rapidly seek care.”
The investigators reported having no financial conflicts of interest.
SOURCE: Gluckman TJ et al. JAMA Cardiol. 2020 Aug 7. doi: 10.1001/jamacardio.2020.3629.
FROM JAMA CARDIOLOGY